

Abstract
Facioscapulohumeral muscular dystrophy (FSHD) is characterized by sporadic de-repression of the transcription factor DUX4 in skeletal muscle. DUX4 activates a cascade of muscle disrupting events, eventually leading to muscle atrophy and apoptosis. Yet, how sporadic DUX4 expression leads to the generalized muscle wasting remains unclear. Transcriptome analyses have systematically been challenged by the majority of nuclei being DUX4neg, weakening the DUX4 transcriptome signature. Moreover, DUX4 has been shown to be expressed in a highly dynamic burst-like manner, likely resulting in the detection of the downstream cascade of events long after DUX4 expression itself has faded. Identifying the FSHD transcriptome in individual cells and unraveling the cascade of events leading to FSHD development may therefore provide important insights in the disease process. We employed single-cell RNA sequencing, combined with pseudotime trajectory modeling, to study FSHD disease etiology and cellular progression in human primary myocytes. We identified a small FSHD-specific cell population in all tested patient-derived cultures and detected new genes associated with DUX4 de-repression. We furthermore generated an FSHD cellular progression model, reflecting both the early burst-like DUX4 expression as well as the downstream activation of various FSHD-associated pathways, which allowed us to correlate DUX4 expression signature dynamics with that of regulatory complexes, thereby facilitating the prioritization of epigenetic targets for DUX4 silencing. Single-cell transcriptomics combined with pseudotime modeling thus holds valuable information on FSHD disease etiology and progression that can potentially guide biomarker and target selection for therapy.
Introduction
Facioscapulohumeral muscular dystrophy (FSHD) (OMIM: 158900), one of the more common genetic muscle diseases worldwide, is hallmarked by the sporadic de-repression of the germline and cleavage-stage transcription factor (TF) DUX4 (OMIM: 606009) in myonuclei of the affected muscle. DUX4 is located in the D4Z4 macrosatellite repeat array, which normally varies between 8–100 units and which is epigenetically silenced in somatic tissue. This silencing is impaired in FSHD muscle; in 95% of the FSHD cases as a result of a contraction of the D4Z4 repeat array to a size of 1–10 units (FSHD type 1, FSHD1) (1), whereas in most of the remaining FSHD cases (FSHD2), it is caused by mutations in the structural maintenance of chromosomes hinge domain 1 (SMCHD1) gene, encoding a D4Z4 chromatin repressor (2).
Despite the sporadic nature of DUX4 de-repression, its presence in muscle has been shown to activate a cascade of muscle disrupting events, including the reactivation of cleavage-stage genes (3–5), inhibition of terminal differentiation (6–9), activation of stress response pathways (10–13) and activation of the innate immune system (3), eventually leading to muscle atrophy and apoptosis of affected cells. Yet, with an estimated ratio of 1:100–1:1000 nuclei expressing DUX4 (DUX4pos) in primary myotube cultures, transcriptome analyses have systematically suffered from the majority of DUX4neg nuclei dampening the transcriptional effects of DUX4 expression, thereby creating unwanted heterogeneity in the transcriptome signal. Detailed analysis of the (DUX4-associated) FSHD transcriptome has thus far been facilitated by artificial DUX4 expression (3,14,15) or DUX4 reporter (16) systems that allow DUX4pos cell selection prior to bulk RNA sequencing. Identifying the pure FSHD transcriptome, i.e. separating cell-autonomous and non-cell-autonomous effects in a heterogeneous DUX4pos cell system and identifying the initial events (apart from DUX4 reactivation) leading to FSHD development, has so far been challenging.
In recent years, single-cell transcriptomics has delivered unprecedented insight into cellular dynamics as it overcomes many of the aforementioned limitations (17). Recent single-cell omics analyses are not only starting to unravel a significantly higher level of cellular heterogeneity in cell populations than previously could have been appreciated (18–22), it also enables identifying even the most spurious cellular aberrations that may be involved in disease etiology and development (23–26).
In this study, we performed single-cell RNA sequencing (scRNA-seq) on tissue-cultured human primary myocytes from FSHD patients and healthy control donors to study the FSHD transcriptome dynamics. We identify a small FSHD-specific cell population in all four FSHD patient-derived primary cultures. Transcriptome analysis of this population allowed us to identify affected pathways that have previously only been identified in artificial DUX4 overexpression and DUX4 reporter systems, validating the strength of scRNA-seq in identifying a purified FSHD transcriptome in primary cell systems. We furthermore identified a novel set of FSHD-affected genes, possibly reflecting the advantages of single-cell analysis in a heterogeneous system. Finally, using the cellular heterogeneity in FSHD-affected cell cultures to our advantage, we used pseudotime trajectory modeling to generate more insights into the transcriptome dynamics during FSHD cellular development and progression—insights that would not have been accessible from bulk RNA sequencing technology.
Results
scRNA-seq quality validation
To study the pure DUX4-dependent FSHD transcriptome, we performed scRNA-seq in primary myogenic cultures from two FSHD1 patient-derived, two FSHD2 patient-derived and two healthy control donor-derived muscle biopsies [see Supplementary Material, Table S1 for information on the (epi)genetic background of all samples]. By immunofluorescent (IF) confocal microscopy imaging, only the FSHD cultures showed the characteristic sporadic DUX4 expression upon terminal myoblast differentiation into myotubes (Fig. 1A). Since multinuclear myotubes are limiting the use of single-cell transcriptomics systems, and in order to be able to discriminate cell-autonomous effects of DUX4 expression from non-autonomous effects because of DUX4 nuclear protein spreading (27), we inhibited myocyte fusion by calcium chelation with ethylene glycol tetraacetic acid (EGTA) (28,29). This generated mononuclear myocytes, which again showed the characteristic sporadic DUX4 de-repression (Fig. 1A).
Figure 1.
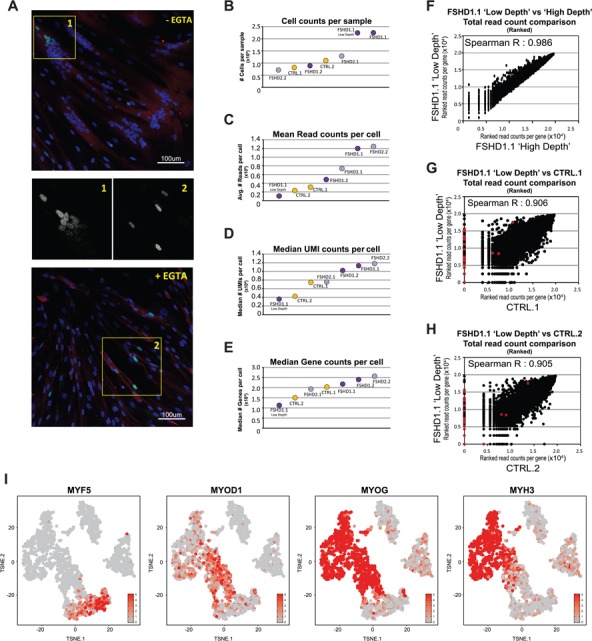
scRNA-seq quality validation per sample. (A) Representative image of IF confocal microscopy of differentiated primary myotubes (top) or differentiated late myocytes fusion inhibited by EGTA treatment (bottom). Cells were stained for DUX4 (green), nuclei were stained with Hoechst33258 (blue) and differentiated myocytes and myotubes were identified by staining for MYH1E in red. 20× magnification. From the highlighted areas, the middle panels depict DUX4 staining only. (B–E) Summary metrics per sample, with (B) the total number of cells analyzed per sample, (C) the mean total read count per cell, (D) the median UMI count per cell and (E) the median number of detected genes per cell. Both control samples are depicted in yellow, both FSHD1 samples (and the FSHD1.1 ‘Low Depth’) are depicted in dark purple and both FSHD2 samples are depicted in light purple. For detailed scRNA-seq quality validation per sample see Supplementary Material, Figure S2. (F) Scatterplot depicting the correlation between the FSHD1.1 ‘Low Depth’ and ‘High Depth’ samples. Data show the rank score of the total UMI count per gene. (G and H) Scatterplots depicting the correlation between the FSHD1.1 ‘Low Depth’ sample and (G) the CTRL.1 data set or (H) the CTRL.2 data set. Data show the rank score of the total UMI count per gene. DUX4 biomarker genes (DUX4–67 gene set) are depicted in red, showing a strong bias toward the FSHD sample versus both control samples. A detailed overview of sequence summary metrics is provided in Supplementary Material, Table S2. (I) A t-SNE projection (Cell Ranger) of sample FSHD1.1, colored based on the expression levels of four myogenic markers: MYF5, early marker; MYOD1, intermediate marker; MYOG, intermediate/late marker; MYH3, late marker. Color scales depict the normalized expression levels for each specified gene. For similar t-SNE plots of all other samples, see Supplementary Material, Figure S3.
We performed scRNA-seq on all samples, generating sequencing data for 712–2245 cells per sample, with a mean read count of 23 082–124 562 reads [4217–11 797 unique molecular identifiers (UMIs)] distributed over a median gene count of 1504–2567 genes per cell (Fig. 1B–E; for a detailed overview of the sequencing summary metrics see Supplementary Material, Table S2 and Fig. S2). We sequenced sample FSHD1.1 at both low (10 480 reads; 3581 UMIs; 1128 detected genes per cell) and high sequencing depth (119 887 reads; 11 297 UMIs; 2175 detected genes per cell) to assess the effect of sequencing depth on our scRNA-seq results. This showed a strong correlation between the two data sets (Spearman R = 0.986), indicating that sequence depth within this range is not affecting gene expression analysis (Fig. 1F). Furthermore, cell, read, UMI and gene counts of the control samples were all within the range of the FSHD samples, indicating that results in gene expression analysis should not be biased by sequencing variation (Fig. 1B–E). Finally, comparing the data of the FSHD1.1 ‘Low Depth’ with both healthy donor control samples again showed a strong correlation between the overall expression pattern of all genes [Spearman R: 0.906 (Ctrl.1) and 0.905 (Ctrl.2)] (Fig. 1G and H), highlighting the reproducibility of our scRNA-seq strategy. Notably, when analyzing the expression of a panel of 67 known DUX4 biomarkers (14) (in this study referred to as the DUX4–67 gene set; Supplementary Material, Table S3) we noticed a strong bias toward the FSHD sample, indicating that sequencing depth is not biasing the detection of an FSHD characteristic transcriptome in FSHD versus control samples (Fig. 1G and H).
We next analyzed cellular heterogeneity within each sample. Using t-Distributed Stochastic Neighbor Embedding (t-SNE) to reduce the dimensionality of the high complexity scRNA-seq data, we projected the single-cell information in two-dimensional plots (Fig. 1I; Supplementary Material, Fig. S3 and Supplementary Material, Supplementary Information). As we used an unsupervised t-SNE analysis of each cell’s individual transcriptome, cells cluster based on their transcriptome similarity, allowing for the unbiased identification of cellular subpopulations and cellular heterogeneity (see Supplementary Material, Supplementary Materials and Methods). In this study, we used an in vitro differentiation system, and we therefore expected the main cause of heterogeneity in the sample to be due to variation in myogenic differentiation. We therefore analyzed the expression pattern of myogenic differentiation markers (Fig. 1I; Supplementary Material, Fig. S3). Cells at all stages of myogenic differentiation could be identified, ranging from early proliferating myoblasts (high in MYF5 expression) to late-stage differentiated myocytes (high in MYH3 expression), and cells mainly cluster according to their myogenic differentiation stage, confirming the quality of our scRNA-seq data. In all samples, we also identified cells that did not show a myogenic transcriptional phenotype and analysis for expression of three fibroblast markers (ANPEP, COL1A2 and Vimentin) suggests that some of these cells may express a more fibroblast-like phenotype (Supplementary Material, Fig. S3), cells that are known to be often present in primary cultures generated from muscle biopsies.
scRNA-seq identifies FSHD-specific cell populations in all FSHD cultures
Knowing that DUX4 expression is often difficult to detect, we analyzed the expression of four DUX4 targets previously recognized as informative biomarkers of DUX4 activity and FSHD clinical severity: LEUTX, TRIM43, KHDC1L and PRAMEF2 (3,14,15). These genes are generally repressed in healthy muscle and become expressed upon DUX4 de-repression. In all four FSHD samples we detected this FSHD characteristic molecular phenotype, with three samples expressing all four biomarkers and sample FSHD1.2 expressing three of the four markers (Supplementary Material, Fig. S4). None of these biomarkers was detected in the healthy control donor samples. Furthermore, when analyzing the expression of the panel of 67 known DUX4 biomarkers (DUX4–67 gene set) (14), we could identify a small DUX4-affected cell population in all FSHD samples, whereas no cells that met these criteria were identified in the control samples (Fig. 2A, B and E; Supplementary Material, Fig. S4B and Table S4). The absence of a DUX4-affected cell population in healthy control samples becomes even more apparent when aggregating all six samples into one data set, referred to as the ‘Agg’ data set (see Supplementary Material, Table S2 and Fig. S5 for sample summary metrics). In this Agg data set we identified 23 cells as the DUX4-affected cell population based on the presence of members of the DUX4–67 gene set (Fig. 2C–E), of which, despite the apparent donor bias marked by the clustering of cells by sample identity (Supplementary Material, Fig. S5E), 20 cells clustered together as a distinct cell cluster in the t-SNE plot. Whereas this cluster was comprised of cells from all four FSHD samples, no cells from the control samples were present (Fig. 2D and E; Supplementary Material, Fig. S4B).
Figure 2.
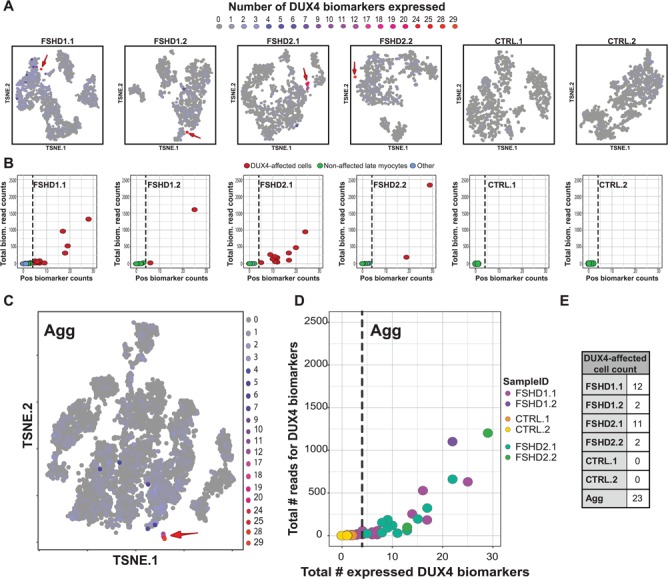
scRNA-seq identifies an FSHD-specific cell population in all four FSHD samples. (A) t-SNE projections (Cell Ranger) of the six tested samples, colored for the number of DUX4 biomarkers (DUX4–67 gene set) being expressed per cell. The DUX4-affected population is highlighted with a red arrow. t-SNE plots colored by cell classification are provided in Supplementary Material, Figure S4B. (B) Scatterplot depicting the number of expressed DUX4 biomarkers and their cumulative read counts per cell for the six tested samples. DUX4-affected cells are selected based on the threshold of expressing ≥5 DUX4 biomarkers per cell (dashed line). (C) t-SNE projection (Cell Ranger) of the aggregated data set composed of all six samples, colored for the number of DUX4 biomarkers being expressed in each cell. The DUX4-affected population is highlighted with a red arrow. (D) Scatterplot as in (B) for the aggregated data set. Individual cells are colored based on their corresponding sample identity (Sample ID). Dashed line depicts the DUX4 biomarker count threshold used for selecting DUX4-affected cells (≥5 DUX4 biomarkers per cell). (E) The number of DUX4-affected cells identified per sample.
Our data thus suggested the DUX4-affected population to be a strong discriminating feature between FSHD-affected samples and non-affected controls. We continued by validating this assumption using principal component analysis (PCA). We hypothesized that if FSHD patient-derived cultures were indeed significantly different from those of healthy control individuals, there should be a layer of complexity in the FSHD samples (i.e. the one that causes the DUX4-affected cells to cluster separately from the rest in the t-SNE plot) that is not present in the healthy control samples. We therefore conducted a PCA-based analysis to identify the top genes responsible for cellular heterogeneity within each sample (see Materials and Methods). As expected, the first principal component (PC1) strongly overlapped between all six samples and included many genes involved in muscle-related processes and general cellular functions (Supplementary Material, Fig. S6B–D). We next analyzed the DUX4 target contribution to the first 16 components in each sample. Interestingly, in all four FSHD samples we could identify PCs that included a number of genes of the DUX4–67 gene set, whereas none of the DUX4–67 genes was identified in either of the two control samples (Supplementary Material, Fig. S6E), validating the DUX4 population as a strong discriminator for FSHD-affected samples from non-affected controls.
Next, in search for additional factors that play a role in discriminating the DUX4-affected population, we overlapped the top 100 gene sets of those PCs that included at least 5 DUX4–67 genes and identified 49 genes, referred to as the PC-FSHD49 gene set, that were detected in at least 3 out of the 4 FSHD samples (Supplementary Material, Fig. S6H). Of these 49 genes, 46 were not detected in any of the PC gene sets of the two control samples. As this gene set included 28 of the 34 known DUX4 biomarkers detected in our Agg data set, this supports a strong discriminating role for the known biomarkers in identifying the DUX4-affected population. Moreover, the additional 21 identified genes may serve as potential novel biomarkers for DUX4 activity and disease severity. To validate the potential of the PC-FSHD49 gene set to discriminate the DUX4-affected from the non-affected cells in each sample, we re-clustered the cells into a three-dimensional plot, using supervised t-SNE clustering based on the PC-FSHD49 gene set. Indeed, we found the DUX4-affected cells largely clustering together, with cells expressing the most DUX4 biomarkers being separated most from the non-affected cells in the population (Supplementary Material, Fig. S7).
Finally, although DUX4 de-repression is considered a major feature of FSHD, additional non-DUX4-associated signatures in FSHD material may exist (14). Yao et al. (14) identified 86 differentially expressed genes in FSHD patient-derived myogenic cultures when compared with that of healthy control individuals, which were insensitive to DUX4 overexpression. These genes were therefore labeled as non-DUX4-associated genes. Interestingly, similar to the DUX4 targets, in all four FSHD samples we identified a small cluster of cells expressing several of the non-DUX4-associated genes, whereas no such cluster was present in the control samples (Supplementary Material, Fig. S8). Differential expression analysis in the Agg data set showed that 30 of the 54 detected non-DUX4-associated genes were differentially expressed in an FSHD-specific cluster. This suggests that our scRNA-seq data identify both DUX4-associated and non-DUX4-associated effects in primary FSHD patient-derived myogenic cultures.
Primary FSHD cultures express an FSHD transcriptome highly similar to DUX4 overexpression or reporter systems
We next performed differential expression analysis between the purified DUX4-affected population and the non-affected cells within the same sample. As DUX4 de-repression increases upon myogenic differentiation, we compared expression with non-affected stage-matched late myocytes only (‘lateMyos’; ≥5 reads for MYH3) (Supplementary Material, Fig. S4B).
When analyzing each sample separately, we identified a core set of 113 genes that was differentially expressed in at least 3 out of the 4 FSHD samples (DiffExpr-CoreSet113 gene set, see Supplementary Material, Table S4, Wilcoxon rank sum test, FDR-corrected P < 0.05) (Fig. 3A; Supplementary Material, Fig. S9A and Table S6). With the small number of DUX4-affected cells within each sample, being able to robustly detect these 113 genes highlights them as strong markers for DUX4 activity. Interestingly, we also identified a set of genes being specifically differentially expressed in the FSHD1 or FSHD2 samples, respectively (FSHD-Specific27 and FSHD2-Specific45 gene sets; Fig. 3A; Supplementary Material, Fig. S9A, Tables S3 and S6).
Figure 3.
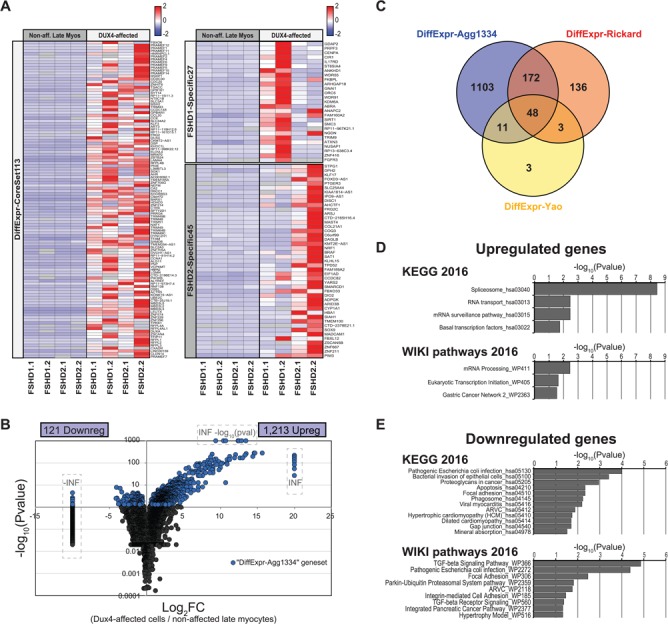
Differential expression analysis identifies a large set of known and novel DUX4-affected genes. (A) Expression heatmaps of the DiffExpr-CoreSet113 gene set (left) and the FSHD1-Specific27 and FSHD2-Specific45 gene sets (right) in the DUX4-affected cells and non-affected late myocytes. The heatmap depicts the mean expression level per gene (row-normalized read counts per gene) in the respective population per sample. See Supplementary Material, Table S4 for details on the depicted gene sets. (B) Vulcanoplot depicting the differential expression results of the Agg data set. The vulcanoplot depicts the expression level Log2FC between the DUX4-affected cells and the non-affected late myocytes versus the –log10 (adjusted P-value) for each gene. Significantly differentially expressed genes (FDR-corrected P < 0.05) are highlighted in blue. Infinite increased (INF) or decreased (−INF) expression levels and infinite –log (adjusted P-values) (i.e. P ~0) are manually set to the outer limits of the plot and are indicated by the dashed boxes. Genes with a P-value of 1 [i.e. –log (P-value) = 0)] not shown. (C) Venn diagram depicting the overlap between the 1334 differentially expressed genes in our Agg data set (DiffExpr-Agg1334 gene set) and 2 previously published DUX4 and/or FSHD-associated gene sets. Venn diagram includes only genes that could be detected as expressed in the DUX4-affected cells and/or non-affected late myocytes in the Agg data set. (D and E) Gene set enrichment analysis results of the (D) upregulated genes and (E) downregulated genes. Bar graphs depict the –log10 (adjusted P-value) of all KEGG and WikiPathway pathways significantly affected in the DUX4-affected population (adjusted P < 0.05).
Within the Agg data set, when comparing the 23 DUX4-affected cells with 2934 non-affected late myocytes, we identified 1334 differentially expressed genes (DiffExpr-Agg1334 gene set, Wilcoxon rank sum test, FDR corrected P < 0.05), of which 121 genes were downregulated and 1213 genes were upregulated in the DUX4-affected population (Fig. 3B; Supplementary Material, Tables S3 and S7). These 1334 genes included 112 of the 113 core set genes identified above.
To test whether the FSHD transcriptome of primary cultures correlates with DUX4 artificial expression (3,14,15) or DUX4 reporter (16) systems, we compared our differential expression data with published data. Rickard et al. (16) previously used a DUX4 reporter system allowing for DUX4pos cell selection prior to bulk RNA-sequencing and identified 570 genes being differentially expressed in DUX4pos-sorted cells. In addition, Yao et al. (14) previously identified a set of top 213 genes being differentially expressed in DUX4-overexpressing cells. Overlapping both data sets with our DiffExpr-Agg1334 (focusing on genes detected in the DUX4-affected cells and/or non-affected late myocytes in our Agg data set) showed a strong overlap between all three data sets (Fig. 3C; Supplementary Material, Fig. S9C and D and Table S3). This suggests that the knowledge acquired from FSHD cellular model systems also applies for primary cultures. Of note, the low number of detected genes of the Yao et al. (14) gene set may be explained by this gene set containing many genes located in repetitive regions and including poorly annotated genes limiting their detection in our scRNA-seq data set.
We next performed gene set enrichment analysis to identify the pathways or processes that are affected in our primary cultures and found (among others) the spliceosome, RNA transport, mRNA surveillance and basal transcription pathways to be significantly upregulated (Fig. 3D), whereas other pathways were downregulated, (e.g. apoptosis, gap junctions, TGF-beta signaling, focal adhesion, integrin-mediated cell adhesion and the Parkin-Ubiquitin proteasome; Fig. 3E). These pathways have been previously shown to be affected in the artificial DUX4 expression and reporter systems (14,16), further validating the correlation between our data and published data acquired from artificial model systems.
Interestingly, we also identified a novel set of 1103 differentially expressed genes (Fig. 3C; Supplementary Material, Table S7). After selecting for genes being represented with >20 reads, thereby reducing false discovery rates due to stochastic random read detection, 887 novel genes (compared with Yao et al. 14 and Rickard et al. 16) were found to be differentially expressed in the DUX4-affected population of our primary cultures.
Transcriptome dynamics during FSHD disease development and cellular progression
DUX4 has been shown to be expressed in a highly dynamic burst-like manner, which may result in the detection of DUX4 target genes long after DUX4 expression has faded (16). Indeed, DUX4 and DUX4 targets (DUX4–67 gene set) showed a wide variety of combined expression patterns in our scRNA-seq data. We hypothesized that this reflects the dynamic nature of DUX4 expression and DUX4 target activation. Using this heterogeneity in our data to our advantage, we used the scRNA-seq data analysis tool Monocle (30,31) to further unravel the cascade of events involved in FSHD cellular progression.
We identified the PC-FSHD49 gene set as a good discriminator set for the DUX4-affected cells. We therefore re-ordered the cells based on the expression dynamics of these 49 genes (see Supplementary Material, Table S3) to generate an FSHD-specific pseudotime developmental trajectory (Fig. 4; Supplementary Material, Fig. S10). This created a two-branch trajectory, in which cells are mainly ordered according to their myogenic differentiation stage (Supplementary Material, Fig. S10B), but in which a subset of cells branched off into a second branch. With this second branch including all previously identified DUX4-affected cells (Fig. 4A), we defined this branch as the FSHD branch. As expected, we found the FSHD branch to split from the main trajectory at a point late in myogenic differentiation, correlating with the increase in DUX4 de-repression upon myogenic differentiation. Furthermore, strengthening the model of a burst-like DUX4 expression, we found DUX4-expressing cells to be positioned early in pseudotime, with most cells locating close to the branch point. This is in contrast to many of the DUX4 targets, which are being increasingly expressed during pseudotime progression, with some targets being activated earlier in the FSHD branch than others. This dynamic pattern in DUX4 and DUX4 target expression suggests that our FSHD pseudotime model reflects the gene expression dynamics during FSHD cellular progression. To further validate this hypothesis, we analyzed the expression patterns of the four main DUX4-affected pathways, i.e. RNA splicing, RNA transport, mRNA surveillance and basal transcription. Indeed, we found all four pathways to be increasingly differentially expressed in our FSHD trajectory branch (Supplementary Material, Fig. S10C). Altogether our data suggest that our FSHD pseudotime trajectory holds valuable information for studying FSHD etiology and cellular progression.
Figure 4.
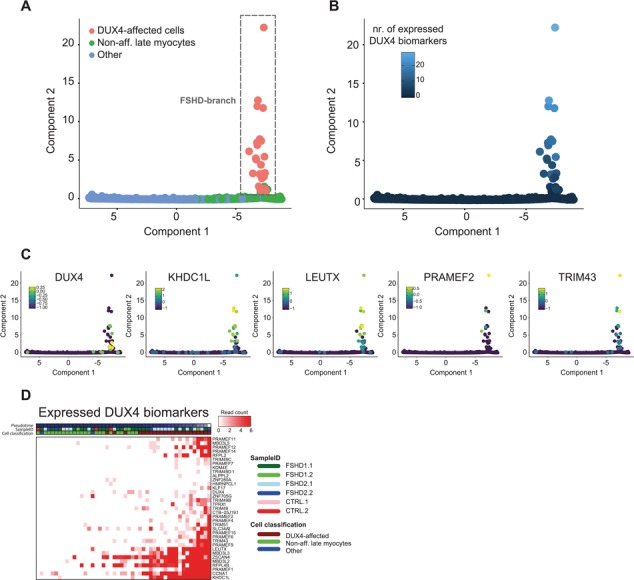
The FSHD-specific pseudotime trajectory models FSHD cellular progression. (A) Generated FSHD-specific pseudotime trajectory model in which cells are re-ordered based on their relative progression in FSHD disease development, based on the expression dynamics of the PC-FSHD49 gene set (see Materials and Methods for details). Cells are colored based on their cell population classification. The identified FSHD branch is highlighted by the gray dash-lined box. (B) FSHD-specific pseudotime trajectory model as in (A), in which cells are colored based on the number of DUX4 biomarkers (DUX4–67 gene set) expressed. (C) FSHD-specific pseudotime trajectory model as in (A), in which cells are colored based on the expression level of DUX4 and four strong DUX4 biomarkers KHDC1L, LEUTX, PRAMEF2 and TRIM43. Color scale depicts log-transformed expression values [log10 (expression + 0.1)]. (D) Pseudotime expression heatmap for the DUX4 biomarkers (DUX4–67 gene set) in the FSHD branch. Cells are ordered based on pseudotime progression. Color scale depicts UMI read counts.
Expression dynamics of transcription regulatory complexes during FSHD pseudotime progression
We next studied the expression dynamics of known DUX4 regulatory complexes during FSHD pseudotime progression. One chromatin regulator that plays a major role in FSHD is SMCHD1 (OMIM: 614982) (32–34). Yet, overall read counts were too low in the small population of DUX4-affected cells to draw firm conclusions on SMCHD1 dynamics during FSHD development. We thus focused our analysis on the expression dynamics of those complexes for which we had sufficient sequence coverage (Supplementary Material, Table S8). One example is MYC (OMIM: 190080). MYC transcripts have been shown to be stabilized by DUX4, resulting in increased MYC protein levels and increased levels of MYC target genes, ultimately leading to the activation of apoptotic pathways (35). Although MYC was only trending toward being upregulated, its target genes were significantly affected in the DUX4-affected population (DiffExpr-Agg1334), most of which showed a strong increase during FSHD progression (Fig. 5A and B).
Figure 5.
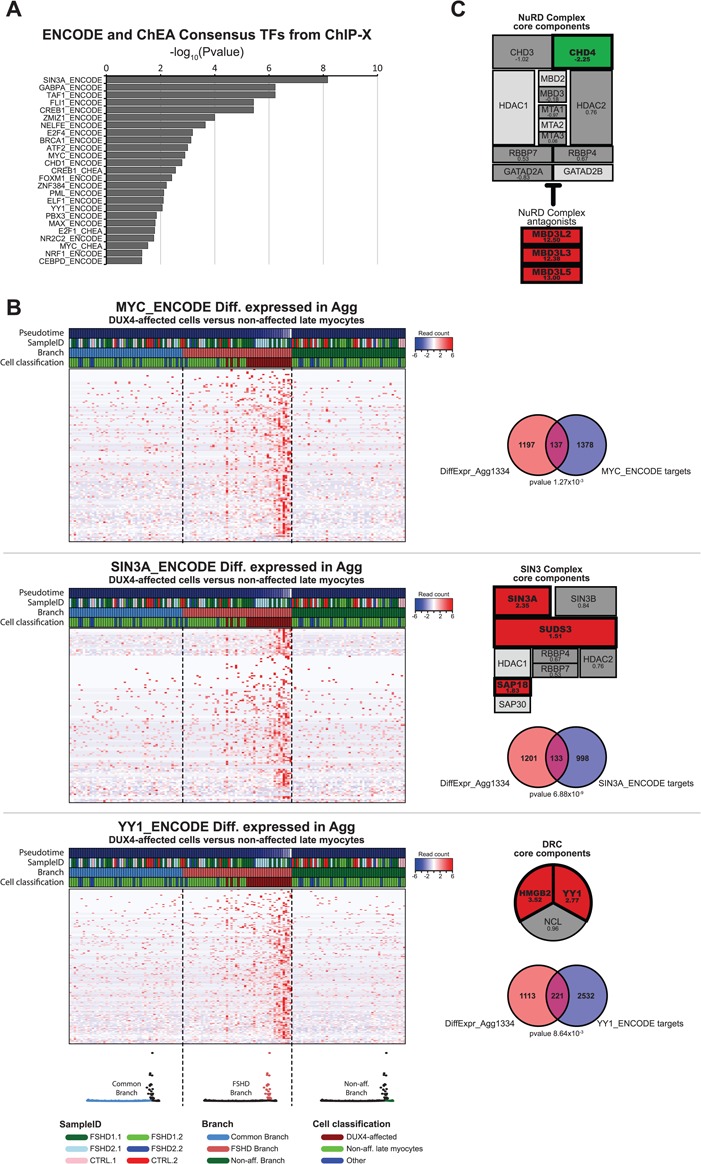
Expression dynamics of transcription regulatory complexes during FSHD pseudotime progression. (A) Gene set enrichment analysis result of the DUX4-affected genes (DiffExpr-Agg1334 gene set). Bar graph depicts the –log10 (adjusted P-value) of all significantly affected TF target gene lists from the ENCODE and ChEA consensus TFs target lists based on crosslinked ChIP-sequencing data (adjusted P < 0.05) (see Materials and Methods for details). (B) Pseudotime expression heatmaps for (top) the MYC targets, (middle) the SIN3A targets and (bottom) the YY1 targets affected in the DUX4-affected population versus the non-affected late myocytes. The cells are re-ordered by trajectory-branch, followed by pseudotime progression. The heatmap depicts the 50 cells per branch surrounding the branch point. The 50 cells per branch are separated by a dashed line and the corresponding branch is depicted in color in the trajectory model below the heatmaps. The Venn diagrams depict the overlap between the known TF targets and the DUX4-affected gene set (DiffExpr-Agg1334), with the P-value indicating the FDR-corrected P-value (Benjamini Hochberg) for the gene set enrichment analysis in Enrichr. The schematic overviews of the SIN3 complex and DRC depict the log2FC in the DUX4-affected versus non-affected late myocytes. Significantly affected genes (FDR-corrected P < 0.05) are highlighted in bold and color. Red indicates a significant increased expression; green indicates a significant decreased expression. Light gray components indicate genes excluded from analysis due to limited sequencing depth (see Materials and Methods for details.) (C) Schematic overview of the NuRD complex depicting log2FC as in (B).
CHD4 (OMIM: 603277), one of the core components of the Nucleosome Remodeling Deacetylase (NuRD) complex, was significantly reduced in the DUX4-affected cells (Fig. 5C, log2 fold change (Log2FC) of −2.25). This is in contrast to three MBD3L protein variants known to be able to replace MBD2/MBD3 in the NuRD complex, thereby antagonizing NuRD’s repressive capacities, which were strongly increased in the DUX4-affected population [MBD3L2 (OMIM: 607964) log2FC 12.5; MBD3L3 Log2FC 12.5; MBD3L5 Log2FC 13.0]. These data correlate with a recently described role for the NuRD complex in DUX4 silencing (36) and suggest a negative correlation between the repressor activity of the NuRD complex and DUX4 levels in primary myocyte cultures.
Conversely, we found three of the SIN3 core components to be significantly increased in the DUX4-affected population (Fig. 5B). Like the NuRD complex, the SIN3 complex has recently been implicated in DUX4 transcriptional repression (36), and finding SIN3 complex increasing in the DUX4-affected population was therefore counterintuitive. Yet, gene set analysis identified SIN3A target genes as the strongest affected target gene set in the DUX4-affected population, of which the majority increased during FSHD pseudotime progression (Fig. 5B), suggesting a positive role for SIN3A (OMIM: 607776) in FSHD progression. Similarly, the first regulatory complex identified to play a role in D4Z4 repeat array silencing is the D4Z4 repressor complex (DRC), composed of YY1, HMGB2 and NCL (37). We found both YY1 (OMIM: 600013) and HMGB2 (OMIM: 163906) to be significantly upregulated in the DUX4-affected population (log2FC of 2.77 and 3.52, respectively; Fig. 5B). In addition, gene set analysis identified a significant upregulation of YY1 target genes in the DUX4-affected population, again suggesting a regulatory role for YY1 during FSHD pseudotime progression.
Apart from these previously described regulatory complexes, gene set analysis identified a number of additional TFs to be significantly affected in the DUX4-affected population (Fig. 5A). In addition, at least 155 of the 1334 genes (DiffExpr-Agg1334) were predicted as having transcription regulatory activity (UniProt Knowledgebase Gene Ontology analysis; see Materials and Methods). The potential role for these factors in FSHD remains to be elucidated.
Discussion
We used scRNA-seq technology to study the FSHD transcriptome in patient-derived primary myogenic cultures. Until now, differential expression analyses in primary FSHD cultures have remained a challenge, due to the sporadic nature of DUX4 expression (14). Using previously identified FSHD-associated gene sets we identified FSHD-specific populations in all FSHD samples tested. By identifying as few as 23 out of a total of 4976 cells (ratio of 1:217) as expressing the FSHD characteristic DUX4 de-repression signature, our data highlight the power of scRNA-seq in studying FSHD disease etiology and development.
As DUX4 de-repression is an important hallmark of FSHD, our study focused on DUX4-associated effects in FSHD. Although several other 4q35 genes located within the FSHD locus have been studied in the context of FSHD pathology (e.g. ANT1, FAT1, FRG1, FRG2, DBE-T and TUBB4Q), we did not detect these genes within the top 100 gene lists of all first 16 PCs (DBE-T and TUBB4Q were absent from our complete data set, and FRG2 was only detected with one read in one cell). This indicates that if these factors play a role in FSHD, their effect is less discriminating for FSHD samples versus healthy control individuals than the DUX4 signature. In fact, there were only 97 genes within our PC gene lists that were specific to FSHD samples (present in at least 3 out of 4 FSHD samples and not in control samples), of which 46 were within the PC-FSHD49 gene set discriminating the DUX4-affected cells from non-affected controls, indicating the DUX4 signature to be a major hallmark for FSHD in cultured myocytes.
We identified 1334 genes being differentially expressed in the DUX4-affected population compared with differentiation stage-matched late myocytes. This gene set was enriched for a number of known affected genes and pathways, validating the identity of our selected DUX4-affected population and indicating that DUX4-associated effects in FSHD primary cultures correlate well with earlier studies using DUX4 reporter and artificial DUX4 expression systems. We also identified a novel set of 1103 differentially expressed genes, of which 887 genes were detected with >20 reads. The detection of this large number of novel genes is possibly the result of the unique options provided by scRNA-seq, as it allows for the selection of a highly purified DUX4-affected population and enables a comparison with differentiation stage-matched cells within a sample, thereby reducing detection noise. As our data are generated from muscle biopsy-derived primary cultures, these newly identified genes may also reflect the differences between primary cultures and the previously used ectopic expression systems. Finally, according to Jagannathan et al. (15) limited overlap in RNA sequencing data from different studies may also arise from technical differences.
While recent studies have been increasingly successful in identifying upregulated DUX4 target genes (of which many are unique to FSHD), identifying genes that are significantly downregulated in the rare DUX4-affected population has remained a challenge. The stringent selection criteria for both the DUX4-affected cells and the stage-matched non-affected cells enabled us to identify a unique set of 121 downregulated genes (of which 92 genes with a Log2FC <−1). These did not overlap with the top 18 downregulated genes previously identified by Rickard et al (16). Unfortunately, in our system, the read counts of these 18 genes were too low to validate them as being significantly downregulated in the DUX4-affected population (one gene, SYT7, showed a significant increase in DUX4-affected cells in our data).
De-repression of DUX4 in muscle has been shown to activate a cascade of muscle disrupting events (3–13). However, identifying the FSHD transcriptome dynamics, describing the sequence and magnitude of the downstream cascade of events, has so far been challenging. Our FSHD pseudotime trajectory seems to faithfully reflect FSHD cellular progression, including the early burst-like DUX4 expression and the timed downstream activation of various FSHD-associated pathways.
We identified a number of cells at the root of the FSHD trajectory that we had not identified using our stringent selection criteria for the DUX4-affected population and that did not express detectable levels of DUX4. Although we cannot fully exclude that these cells may express DUX4 or DUX4 targets below detection level, one might speculate that the branching off of cells prior to DUX4 de-repression might reflect the earliest stages of FSHD cellular development, possibly priming cells for DUX4 de-repression.
Our scRNA-seq data provide novel insights into the differential expression dynamics of transcription regulatory complexes involved in the silencing of DUX4. Although the DRC, the NuRD and SIN3 complexes have all been shown to be involved in DUX4 silencing in somatic cells (36,37), our data reveal different expression dynamics during downstream FSHD cellular progression. While recognizing that differences in transcriptome levels are not always reflected in protein levels, it is tempting to speculate that this dynamics reflects different functions in DUX4 silencing. For example, whereas the trend of downregulation of NuRD-specific core components correlates with the negative correlation between the NuRD complex and DUX4 expression (36), we find evidence suggesting an upregulation of both the DRC and SIN3 repressor complexes, as well as targets genes of two of their core components. This suggests that although the latter complexes were shown to be important for maintaining the D4Z4 in a repressed state (36), they are not sufficient to do so during myogenic differentiation in FSHD patient-derived myogenic cultures. Thus single-cell transcriptomics in this respect may contribute to the selection of targets when pursuing epigenetic silencing of DUX4 as therapy. Finally, gene set analysis identifies a potential role for several TFs and regulatory complexes not previously associated with FSHD. Single-cell transcriptomics may in this way contribute to further unravelling the order and magnitude of events that together are responsible for the significant FSHD-associated muscle wasting phenotype.
Altogether, we employed scRNA-seq, combined with pseudotime trajectory modeling, to study disease etiology and progression of FSHD, a disease characterized by extreme heterogeneity and sporadic, but toxic, expression of DUX4 in affected cells. Our data show that pseudotime trajectories like our FSHD pseudotime model may hold valuable information on disease etiology, development and progression—information that would not have been accessible from traditional bulk RNA sequencing technologies and that may prove valuable for guiding biomarker and target selection for therapy.
Materials and Methods
Cell line information
Human primary myoblast cell lines originated from the University of Rochester biorepository (http://www.urmc.rochester.edu/fields-center/). Muscle samples were obtained after informed consent under a protocol approved by the Institutional Review Board at the University of Rochester. We used primary myogenic cell cultures derived from muscle biopsies from two FSHD1-patients, two FSHD2-patients and two healthy control donors. Detailed information is provided in Supplementary Material, Table S1.
Cell culture
Myoblasts were cultured in DMEM/F-10 medium (# 41550–021, Life Technologies, Waltham, Massachusetts, USA), supplemented with 20% heat-inactivated fetal bovine serum (#10270, Gibco/Life Technologies, Waltham, Massachusetts, USA), 1% penicillin/streptomycin (#15140122, Gibco/Life Technologies, Waltham, Massachusetts, USA), 10 ng/ml rhFGF (#C-60240, Bio-Connect, Huissen, Gelderland, The Netherlands) and 1 μm dexamethasone (#D2915, Sigma-Aldrich, St. Louis, Missouri, USA).
For terminal myogenic differentiation, myoblast were cultured for 3 days in DMEM (# 41966–029, Life Technologies, Waltham, Massachusetts, USA) supplemented with 15% knockout serum replacer (#10828–028, Life Technologies, Waltham, Massachusetts, USA). Myocyte fusion was inhibited by adding EGTA to the medium to a final concentration of 1.4 mm.
scRNA-seq: sample preparation and RNA sequencing
Differentiated cell cultures were trypsinized and resuspended in a 10 ml differentiation medium. Samples were centrifuged for 5 min at 1000 rpm (128 rcf) at room temperature. Cell pellets were washed once in 10 ml phosphate-buffered saline (PBS) supplemented with 0.04% (w/v) bovine serum albumin (BSA #A7906, Sigma Aldrich, St. Louis, Missouri, USA), transferred through a 50 um cell strainer (#04–004-2327, Sysmex, Norderstedt, Schleswig-Holstein, Germany) and resuspended in PBS/0.04% BSA (w/v) to a final concentration of 2000 cells/μl. Next, samples were prepped for scRNA-seq according to the Chromium™ Single Cell 3′ v1 RNA sequencing specification. For all samples, targeted cell count was 1000 cells per sample. The generated cDNA was used for Illumina next-generation sequencing using a NextSeq500-v2 150 cycle kit.
Data analysis and pseudotime trajectory modeling
Sequenced data were analyzed using the 10x Genomics software, Cell Ranger version 1.2.0 (https://www.10xgenomics.com/) (default settings), and reads were aligned to the Genome Reference Consortium Human Build 38. Pseudotime trajectory modeling was performed using the Monocle R package version 2.6.1 (30,31). Detailed descriptions of data processing, quality control and downstream data analysis are provided in the Supplementary Material, Supplementary Materials and Methods. A schematic overview of all analyses performed in this study, highlighting the gene sets used and/or identified in that step, the analysis pipelines used and the figure that depicts the results of each analysis, can be found in Supplementary Material, Figure S1.
Data availability
The authors declare that all data supporting the findings of this study are available within the article and its Supplementary Material, Supplementary Information. Additional data can be provided by the corresponding author upon reasonable request. All scRNA-seq data described in this study, along with their associated metadata, have been deposited in NCBI's Gene Expression Omnibus (GEO) and are accessible through GEO accession number GSE122873.
Supplementary Material
Acknowledgements
We thank all FSHD families for participating in our studies. The authors also would like to thank Dr C. Trapnell and co-workers for helpful discussions and advice on the scRNA-seq data analyses.
Conflict of Interest statement. None declared.
Funding
US National Institutes of Health; National Institute of Neurological Disorders and Stroke (P01NS069539); Prinses Beatrix Spierfonds (W.OP14-01 and W.OB17-01); Stichting Spieren voor Spieren
References
- 1. Lemmers R.J.L.F., Vliet P.J., Klooster R., Sacconi S., Camano P., Dauwerse J.G., Snider L., Straasheijm K.R., Jan van Ommen G., Padberg G.W. et al. (2010) A unifying genetic model for facioscapulohumeral muscular dystrophy. Science, 329, 1650–1653. [DOI] [PMC free article] [PubMed] [Google Scholar]
- 2. Lemmers R.J.L.F., Tawil R., Petek L.M., Balog J., Block G.J., Santen G.W.E., Amell A.M., Vliet P.J., Almomani R., Straasheijm K.R. et al. (2012) Digenic inheritance of an SMCHD1 mutation and an FSHD-permissive D4Z4 allele causes facioscapulohumeral muscular dystrophy type 2. Nat. Genet., 44, 1370–1374. [DOI] [PMC free article] [PubMed] [Google Scholar]
- 3. Geng L.N., Yao Z., Snider L., Fong A.P., Cech J.N., Young J.M., Maarel S.M., Ruzzo W.L., Gentleman R.C., Tawil R. et al. (2012) DUX4 activates germline genes, retroelements, and immune mediators: implications for facioscapulohumeral dystrophy. Dev. Cell, 22, 38–51. [DOI] [PMC free article] [PubMed] [Google Scholar]
- 4. Hendrickson P.G., Doráis J.A., Grow E.J., Whiddon J.L., Lim J.-W., Wike C.L., Weaver B.D., Pflueger C., Emery B.R., Wilcox A.L. et al. (2017) Conserved roles of mouse DUX and human DUX4 in activating cleavage-stage genes and MERVL/HERVL retrotransposons. Nat. Genet., 49, 925–934. [DOI] [PMC free article] [PubMed] [Google Scholar]
- 5. De Iaco A., Planet E., Coluccio A., Verp S., Duc J. and Trono D. (2017) DUX-family transcription factors regulate zygotic genome activation in placental mammals. Nat. Genet., 49, 941–945. [DOI] [PMC free article] [PubMed] [Google Scholar]
- 6. Knopp P., Krom Y.D., Banerji C.R.S., Panamarova M., Moyle L.A., Hamer B., Maarel S.M. and Zammit P.S. (2016) DUX4 induces a transcriptome more characteristic of a less-differentiated cell state and inhibits myogenesis. J. Cell Sci., 129, 3816–3831. [DOI] [PMC free article] [PubMed] [Google Scholar]
- 7. Bosnakovski D., Choi S.H., Strasser J.M., Toso E.A., Walters M.A. and Kyba M. (2014) High-throughput screening identifies inhibitors of DUX4-induced myoblast toxicity. Skelet. Muscle, 4, 1–11. [DOI] [PMC free article] [PubMed] [Google Scholar]
- 8. Bosnakovski D., Lamb S., Simsek T., Xu Z., Belayew A., Perlingeiro R. and Kyba M. (2008) DUX4c, an FSHD candidate gene, interferes with myogenic regulators and abolishes myoblast differentiation. Exp. Neurol., 214, 87–96. [DOI] [PubMed] [Google Scholar]
- 9. Winokur S.T., Chen Y.W., Masny P.S., Martin J.H., Ehmsen J.T., Tapscott S.J., Maarel S.M., Hayashi Y. and Flanigan K.M. (2003) Expression profiling of FSHD muscle supports a defect in specific stages of myogenic differentiation. Hum. Mol. Genet., 12, 2895–2907. [DOI] [PubMed] [Google Scholar]
- 10. Bosnakovski D., Xu Z., Gang E.J., Galindo C.L., Liu M., Simsek T., Garner H.R., Agha-Mohammadi S., Tassin A., Dé Rique Coppé F. et al. (2008) An isogenetic myoblast expression screen identifies DUX4-mediated FSHD-associated molecular pathologies. EMBO J., 27, 2766–2779. [DOI] [PMC free article] [PubMed] [Google Scholar]
- 11. Bosnakovski D., Gearhart M.D., Toso E.A., Recht O.O., Cucak A., Jain A.K., Barton M.C. and Kyba M. (2017) p53-Independent DUX4 pathology in cell and animal models of facioscapulohumeral muscular dystrophy. Dis. Model. Mech., 10, 1211–1216. [DOI] [PMC free article] [PubMed] [Google Scholar]
- 12. Feng Q., Snider L., Jagannathan S., Tawil R., Maarel S.M., Tapscott S.J. and Bradley R.K. (2015) A feedback loop between nonsense-mediated decay and the retrogene DUX4 in facioscapulohumeral muscular dystrophy. Elife, 4, e04996. [DOI] [PMC free article] [PubMed] [Google Scholar]
- 13. Dmitriev P., Bou Saada Y., Dib C., Ansseau E., Barat A., Hamade A., Dessen P., Robert T., Lazar V., Louzada R.A.N. et al. (2016) DUX4-induced constitutive DNA damage and oxidative stress contribute to aberrant differentiation of myoblasts from FSHD patients. Free Radic. Biol. Med., 99, 244–258. [DOI] [PubMed] [Google Scholar]
- 14. Yao Z., Snider L., Balog J., Lemmers R.J.L.F., van der Maarel S.M., Tawil R. and Tapscott S.J. (2014) DUX4-induced gene expression is the major molecular signature in FSHD skeletal muscle. Hum. Mol. Genet., 23, 5342–5352. [DOI] [PMC free article] [PubMed] [Google Scholar]
- 15. Jagannathan S., Shadle S.C., Resnick R., Snider L., Tawil R.N., Maarel S.M., Bradley R.K. and Tapscott S.J. (2016) Model systems of DUX4 expression recapitulate the transcriptional profile of FSHD cells. Hum. Mol. Genet., 25, 4419–4431. [DOI] [PMC free article] [PubMed] [Google Scholar]
- 16. Rickard A.M., Petek L.M. and Miller D.G. (2015) Endogenous DUX4 expression in FSHD myotubes is sufficient to cause cell death and disrupts RNA splicing and cell migration pathways. Hum. Mol. Genet., 24, 5901–5914. [DOI] [PMC free article] [PubMed] [Google Scholar]
- 17. Yuan G.-C., Cai L., Elowitz M., Enver T., Fan G., Guo G., Irizarry R., Kharchenko P., Kim J., Orkin S. et al. (2017) Challenges and emerging directions in single-cell analysis. Genome Biol., 18, 1–8. [DOI] [PMC free article] [PubMed] [Google Scholar]
- 18. Sun H., Miao Z., Zhang X., Chan U.I., Su S.M., Guo S., Wong C.K.H., Xu X. and Deng C.-X. (2018) Single-cell RNA-seq reveals cell heterogeneity and hierarchy within mouse mammary epithelia. J. Biol. Chem., 293, 8315–8329. [DOI] [PMC free article] [PubMed] [Google Scholar]
- 19. Shekhar K., Lapan S.W., Whitney I.E., Tran N.M., Macosko E.Z., Kowalczyk M., Adiconis X., Levin J.Z., Nemesh J., Goldman M. et al. (2016) Comprehensive classification of retinal bipolar neurons by single-cell transcriptomics. Cell, 166, 1308–1323. [DOI] [PMC free article] [PubMed] [Google Scholar]
- 20. Paul F., Arkin Y., Giladi A., Jaitin D.A., Kenigsberg E., Keren-Shaul H., Winter D., Lara-Astiaso D., Gury M., Weiner A. et al. (2015) Transcriptional heterogeneity and lineage commitment in myeloid progenitors. Cell, 163, 1663–1677. [DOI] [PubMed] [Google Scholar]
- 21. Cho D.S. and Doles J.D. (2017) Single cell transcriptome analysis of muscle satellite cells reveals widespread transcriptional heterogeneity. Gene, 636, 54–63. [DOI] [PMC free article] [PubMed] [Google Scholar]
- 22. Hook P.W., McClymont S.A., Cannon G.H., Law W.D., Morton A.J., Goff L.A. and McCallion A.S. (2018) Single-cell RNA-seq of mouse dopaminergic neurons informs candidate gene selection for sporadic Parkinson disease. Am. J. Hum. Genet., 102, 427–446. [DOI] [PMC free article] [PubMed] [Google Scholar]
- 23. Park J., Shrestha R., Qiu C., Kondo A., Huang S., Werth M., Li M., Barasch J. and Suszták K. (2018) Single-cell transcriptomics of the mouse kidney reveals potential cellular targets of kidney disease. Science, 360, 758–763. [DOI] [PMC free article] [PubMed] [Google Scholar]
- 24. Mizoguchi F., Slowikowski K., Wei K., Marshall J.L., Rao D.A., Chang S.K., Nguyen H.N., Noss E.H., Turner J.D., Earp B.E. et al. (2018) Functionally distinct disease-associated fibroblast subsets in rheumatoid arthritis. Nat. Commun., 9, 1–11. [DOI] [PMC free article] [PubMed] [Google Scholar]
- 25. Tirosh I., Izar B., Prakadan S.M., Wadsworth M.H., Treacy D.,x Trombetta J.J., Rotem A., Rodman C., Lian C., Murphy G. et al. (2016) Dissecting the multicellular ecosystem of metastatic melanoma by single-cell RNA-seq. Science, 352, 189–196. [DOI] [PMC free article] [PubMed] [Google Scholar]
- 26. Xu Y., Mizuno T., Sridharan A., Du Y., Guo M., Tang J., Wikenheiser-Brokamp K.A., Perl A.-K.T., Funari V.A., Gokey J.J. et al. (2016) Single-cell RNA sequencing identifies diverse roles of epithelial cells in idiopathic pulmonary fibrosis. JCI Insight, 1, e90558. [DOI] [PMC free article] [PubMed] [Google Scholar]
- 27. Ferreboeuf M., Mariot V., Furling D., Butler-Browne G., Mouly V. and Dumonceaux J. (2014) Nuclear protein spreading: implication for pathophysiology of neuromuscular diseases. Hum. Mol. Genet., 23, 4125–4133. [DOI] [PubMed] [Google Scholar]
- 28. Shainberg A., Yagil G. and Yaffe D. (1969) Control of myogenesis in vitro by Ca2+ concentration in nutritional medium. Exp. Cell Res., 58, 163–167. [DOI] [PubMed] [Google Scholar]
- 29. Paterson B. and Strohman R.C. (1972) Myosin synthesis in cultures of differentiating chicken embryo skeletal muscle. Dev. Biol., 29, 113–138. [DOI] [PubMed] [Google Scholar]
- 30. Trapnell C., Cacchiarelli D., Grimsby J., Pokharel P., Li S., Morse M., Lennon N.J., Livak K.J., Mikkelsen T.S. and Rinn J.L. (2014) The dynamics and regulators of cell fate decisions are revealed by pseudotemporal ordering of single cells. Nat. Biotechnol., 32, 381–386. [DOI] [PMC free article] [PubMed] [Google Scholar]
- 31. Qiu X., Hill A., Packer J., Lin D., Ma Y.-A. and Trapnell C. (2017) Single-cell mRNA quantification and differential analysis with census. Nat. Methods, 14, 309–315. [DOI] [PMC free article] [PubMed] [Google Scholar]
- 32. Lemmers R.J.L.F., Tawil R., Petek L.M., Balog J., Block G.J., Santen G.W.E., Amell A.M., Vliet P.J., Almomani R., Straasheijm K.R. et al. (2012) Digenic inheritance of an SMCHD1 mutation and an FSHD-permissive D4Z4 allele causes facioscapulohumeral muscular dystrophy type 2. Nat. Genet., 44, 1370–1374. [DOI] [PMC free article] [PubMed] [Google Scholar]
- 33. Sacconi S., Lemmers R.J.L.F., Balog J., Vliet P.J., Lahaut P., Nieuwenhuizen M.P., Straasheijm K.R., Debipersad R.D., Vos-Versteeg M., Salviati L. et al. (2013) The FSHD2 gene SMCHD1 Is a modifier of disease severity in families affected by FSHD1. Am. J. Hum. Genet., 93, 744–751. [DOI] [PMC free article] [PubMed] [Google Scholar]
- 34. Balog J., Thijssen P.E., Shadle S., Straasheijm K.R., Vliet P.J., Krom Y.D., Boogaard M.L., Jong A.F., Lemmers R.J.L., Tawil R. et al. (2015) Increased DUX4 expression during muscle differentiation correlates with decreased SMCHD1 protein levels at D4Z4. Epigenetics, 10, 1133–1142. [DOI] [PMC free article] [PubMed] [Google Scholar]
- 35. Shadle S.C., Zhong J.W., Campbell A.E., Conerly M.L., Jagannathan S., Wong C.-J., Morello T.D., Maarel S.M. and Tapscott S.J. (2017) DUX4-induced dsRNA and MYC mRNA stabilization activate apoptotic pathways in human cell models of facioscapulohumeral dystrophy. PLOS Genet., 13, e1006658. [DOI] [PMC free article] [PubMed] [Google Scholar]
- 36. Campbell A.E., Shadle S.C., Jagannathan S., Lim J.-W., Resnick R., Tawil R., Maarel S.M. and Tapscott S.J. (2018) NuRD and CAF-1-mediated silencing of the D4Z4 array is modulated by DUX4-induced MBD3L proteins. Elife, 7, e31023. [DOI] [PMC free article] [PubMed] [Google Scholar]
- 37. Gabellini D., Green M.R. and Tupler R. (2002) Inappropriate gene activation in FSHD: a repressor complex binds a chromosomal repeat deleted in dystrophic muscle. Cell, 110, 339–348. [DOI] [PubMed] [Google Scholar]
Associated Data
This section collects any data citations, data availability statements, or supplementary materials included in this article.
Supplementary Materials
Data Availability Statement
The authors declare that all data supporting the findings of this study are available within the article and its Supplementary Material, Supplementary Information. Additional data can be provided by the corresponding author upon reasonable request. All scRNA-seq data described in this study, along with their associated metadata, have been deposited in NCBI's Gene Expression Omnibus (GEO) and are accessible through GEO accession number GSE122873.