

SUMMARY
Ionizing radiation (IR) and chemotherapy are standard of care treatments for glioblastoma (GBM) patients and both result in DNA damage, however, the clinical efficacy is limited due to therapeutic resistance. We identified a mechanism of such resistance mediated by phosphorylation of PTEN on tyrosine 240 (pY240-PTEN) by FGFR2. pY240-PTEN is rapidly elevated and bound to chromatin through interaction with Ki-67 in response to IR treatment and facilitates the recruitment of RAD51 to promote DNA repair. Blocking Y240 phosphorylation confers radiation sensitivity to tumors and extends survival in GBM preclinical models. Y240F-Pten knock-in mice showed radiation sensitivity. These results suggest that FGFR-mediated pY240-PTEN is a key mechanism of radiation resistance and is an actionable target for improving radiotherapy efficacy.
Keywords: PTEN, tyrosine phosphorylation, FGFR2, GBM, ionizing radiation (IR), DNA damage
Graphical Abstract
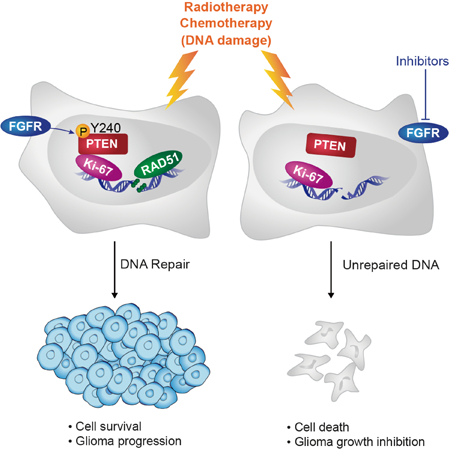
Ma et al. show that ionizing irradiation (IR) induces PTEN Y240 phosphorylation (pY240-PTEN) by FGFR2 in glioblastoma (GBM) cells. pY240-PTEN binds to chromatin and recruits RAD51 to promote DNA repair. Inhibition of Y240 phosphorylation sensitizes GBM to IR and prolong the survival of GBM preclinical models.
INTRODUCTION
The phosphatase and tensin homolog gene (PTEN) encodes a protein that antagonizes the Phosphatidylinositol-3-kinase (PI3K) pathway as a lipid phosphatase. PTEN is the most frequently altered tumor suppressor gene in GBM (Cancer Genome Atlas Research, 2008; Furnari et al., 2007) and its loss or mutation has been implicated as a cause of resistance to therapies such as tyrosine kinase inhibitors (TKIs) due to permissive activation of the AKT pathway. However, depletion of PTEN has also been shown to sensitize tumor cells to therapies that rely on DNA damage, such as ionizing radiation (Mansour et al., 2018; McCabe et al., 2015). While investigations of PTEN have largely focused on its canonical role as a lipid phosphatase, recent studies suggest that PTEN has functions independent of its cytoplasmic phosphatase activity, including poorly characterized nuclear functions (Milella et al., 2015).
Glioblastoma (GBM) is the most lethal brain tumor occurring in adults and its treatment has been largely unsuccessful. Ionizing radiation (IR) is one of the few therapies with demonstrated clinical efficacy for patients with GBM (Bao et al., 2006) and about 50% of all cancer patients will receive radiotherapy during their course of treatment (Begg et al., 2011). Unfortunately, the efficacy of IR for GBM patients is modest, at best, due to radio-resistance of the tumor, the underlying mechanisms of which remain poorly characterized. The principal biological effect of radiotherapy is to kill rapidly proliferating cancer cells by inducing DNA damage beyond cellular capacity for repair, including DNA single strand breaks (SSBs), double strand breaks (DSBs), DNA termini modifications, and cross-linked DNA (Gulston et al., 2002). DSBs are considered to be the most harmful form of DNA damage in most cases, failure to repair DSBs can trigger cell death. The repair of DSBs is an orchestrated process that requires the prompt response of many factors that assemble the proper repair machinery at the sites of damage. Any alterations in tumor cells that favor DNA repair efficiency would be predicted to cause resistance to therapies that rely on DNA damage.
Accumulating evidence has shown that PTEN can also be found in the nucleus where it is involved in the regulation of DNA damage repair, chromosome stability, and cell cycle progression mediated by phosphatase-independent activity (Milella et al., 2015; Shen et al., 2007). PTEN function can be affected not only by genetic mutations but also by posttranslational modifications, such as SUMOylation, phosphorylation, ubiquitination oxidation, and acetylation (Leslie et al., 2016; Wang and Jiang, 2008). We have previously demonstrated that phosphorylation of PTEN on tyrosine 240 (pY240-PTEN) is commonly found in GBM samples obtained from patients treated with standard of care therapy, temozolomide and IR, and detection of this posttranslational modification is associated with shortened survival (Fenton et al., 2012). Because DNA damage is the principal objective of standard of care therapy, in this study, we examined if pY240-PTEN functionally mediates therapeutic resistance by regulating DNA repair.
Results
FGFR2-mediated phosphorylation of PTEN tyrosine 240 protects cells from DNA damage by facilitating DNA repair
To study the potential involvement of PTEN in DNA damage repair in GBM, we first examined nineteen clinical GBM samples (Table S1) for the presence of pY240-PTEN and phospho-Histone 2A.X (pH2AX), a marker of DNA double strand breaks (DSBs). An inverse correlation was found between the two (Figure 1A), suggesting that pY240-PTEN may affect the DNA repair process. Based on previous data, PTEN Y240 phosphorylation is promoted by FGFRs and Src family kinases (Fenton et al., 2012). We conducted in vitro kinase reactions using wild type PTEN and a tyrosine to phenylalanine non-phosphorylatable control (Y240F-PTEN) and examined PTEN phosphorylation using typical and modified SDS PAGE (Phos-Tag) protein gels. Compared with Src, FGFR2 preferentially phosphorylates PTEN at Y240 over other sites since Y240F-PTEN showed limited phosphorylation detected by pan-anti-phosphotyrosine antibodies (Figure 1B, S1A). Given the reduction of two phosphorylated bands by Y240F mutation (Figure 1B, 4G10), this result suggests pY240 might be required for the phosphorylation of the other site. Furthermore, rather than working indirectly via downstream effectors, FGFR2 directly phosphorylated Y240, as shown by FGFR2 mutants defective for downstream signaling (Mohammadi et al., 1996) retaining the ability to induce pY240-PTEN, whereas a kinase dead FGFR2 mutant failed to do so (Figure 1C). To determine whether these results are clinically pertinent, we tested 43 patient-derived glioma stem cell lines (GSCs) for PTEN and FGFR2 expression and their radiosensitivity. GSCs with low PTEN expression were found to be more radiosensitive, and in concordance with our data, those with high PTEN and FGFR2 expression also exhibited more PTEN nuclear localization (Figure S1B) and were relatively radioresistant (Figure 1D and Table S2).
Figure 1. FGFR2-mediated phosphorylation of PTEN tyrosine 240 protects cells from DNA damage by facilitating DNA repair.

(A) Tumor samples from 19 GBM patients were stained with pY240-PTEN and pH2AX antibodies. Representative images for different staining intensity and quantification of the staining results are shown (Fisher’s exact test) between pY240-PTEN and pH2AX. Scale bar, 100 μm. (B) In vitro kinase assay was performed by incubating recombinant FGFR2 and Src with recombinant GST-PTEN (WT and Y240F (YF)). A phos-tag gel was used to separate the phosphorylated and un-phosphorylated protein followed by probing with anti-pY240-PTEN antibody and a pan-tyrosine phosphorylation antibody, 4G10. (C) 293T cells were transfected with FGFR2 [1. Y486F; 2. Y586F; 3. Y733F; 4. Y769F; 5. Y586/588F; 6. Y656/657F (kinase dead); 7. WT] together with Flag-tagged PTEN. Cell lysates were prepared for immunoprecipitation followed by immunoblotting with anti-pY240-PTEN. (D) 43 patient-derived glioma stem cell lines were evaluated for PTEN and FGFRs expression by RNAseq and for radiation sensitivity by clonogenic assay. Distribution of radiation sensitive and radiation resistant samples in PTEN high versus PTEN low group are shown. Orange rectangle indicates all radiation sensitive samples in PTEN low group showed low level of FGFR2 expression. PTEN high/PTEN low, PTEN expression is higher/lower than the median value (RNAseq); FGFR2 low, FGFR2 expression is lower than median value (RNAseq) (E) U87-WT/YF-PTEN cells in the presence of FGFR2 were treated with or without IR (0–10 Gy) and seeded in 10 cm dishes. Colonies were counted after 14 days and surviving fraction was calculated as the ratio of the plating efficiency of the treated cells to that of control cells. Data represents mean ± SEM from six independent experiments, *p<0.05. (F) U87-empty vector (V), WT/YF-PTEN cells, together with FGFR2 were irradiated with 10 Gy and then subjected to the comet assay at indicated time points. Tail moment was quantified and graphed for each group. Scale bar, 500 μm. (G) U87-WT/YFPTEN cells were irradiated with 10 Gy and DNA damage response pathway was examined by western blot at indicated times. Numbers at bottom showed a ratio of pH2AX levels relative to time 0 after normalization to actin, *p<0.05 was generated by comparing WT- and YF-PTEN samples at the same times. (H and I) Cells were treated with 10 Gy IR and then were stained at the indicated times with antibodies to γH2AX (H) and RAD51 (I). Cells containing more than 8 foci (γH2AX) or 5 foci (RAD51) were scored as positive. Scale bar, 25 μm. (F, H and I) Error bars are SD of at least three replicates and represent at least three independent experiments., *p<0.05. (J) Schematic representative of DNA damage pathway and pY240-PTEN is involved in regulating RAD51 recruitment to damaged DNA. See also Table S1–3 and Figure S1.
To investigate if pY240-PTEN was responsible for enhancing DNA repair, as suggested by the above findings, different cell systems were utilized in this study (Table S3). FGFR2 was expressed in the U87 (PTEN null) glioma cell line that had been reconstituted with WT- or Y240F-PTEN (Figure S1C), followed by IR treatment. When compared with Y240F-PTEN expressing cells (Figure 1E), vector control cells or cells lacking FGFR2 (Figure S1D–E), the presence of FGFR2 in cells expressing WT-PTEN resulted in phosphorylation at Y240 and resistance to IR, as indicated by clonogenic survival (Figure 1E, S1D–E). Furthermore, using neutral comet assays, we found less DNA damage in WT-PTEN cells compared with Y240FPTEN cells at 24 hr after IR (Figure 1F). Similarly, this effect was dependent on FGFR2-mediated phosphorylation of PTEN at Y240 as no significant difference was detected between the two cells in the absence of the receptor (Figure S1F).
We next investigated whether pY240-PTEN affected DNA damage response. In the presence of FGFR2, while pH2AX downstream of ATM activation (pATM) was transiently induced in WTPTEN cells, sustained pH2AX occurred up to 24 hr after IR in Y240F-PTEN cells, suggesting cells lacking pY240-PTEN harbor defects in DNA repair. The initiation of DNA damage response was unaltered since ATR and ATM were similarly activated in WT- and Y240-PTEN cells (Figure 1G). Expressing a kinase dead FGFR2 along with WT- or Y240F-PTEN did not induce a difference in pH2AX after IR (Figure S1G). These results were recapitulated by assessment of γH2AX in situ showing foci were induced in both cells and were largely resolved in WT-PTEN cells by 24 hr but not in Y240F-PTEN, suggesting the persistence of unrepaired DSBs (Figure 1H). We next assessed whether pY240-PTEN interfaced with homologous recombination (HR) or non-homologous end joining (NHEJ), the two major mechanisms of DNA repair. While no difference in total RAD51 protein levels between the two cells was detected (Figure 1G), Y240FPTEN cells showed a reduction in RAD51 recruitment to DNA damage sites post-IR compared to WT-PTEN cells (Figure 1I). Supporting a key role for pY240-PTEN in HR, more efficient HR-mediated repair occurred in WT-PTEN cells compared to Y240F-PTEN cells in a Traffic Light Reporter (TRL) assay (Figure S1H), while NHEJ-mediated repair was equivalent for both cells. To determine if the formation of single strand DNA at DSBs, which serves as a platform for RAD51 loading, was differently affected, we monitored RPA32 foci formation (Figure S1I) and bromodeoxyuridine (BrdU) incorporation (Figure S1J) and found no difference between WT- and Y240F-PTEN cells. Taken together, these results suggest that pY240-PTEN promotes HR-mediated DSB repair by facilitating RAD51 filament formation or stabilization (Figure 1J).
pY240-PTEN confers resistance to DNA damage in GBM stem-like cells
We next examined GBM patient-derived stem-like cells (GSCs) (Table S4), which recapitulate GBM biology when orthotopically engrafted in mice, and are known to be highly resistant to IR (Bao et al., 2006; Dahan et al., 2014). GSC line TS528, which expresses endogenous FGFR2 and PTEN (Figure 2A), contained a detectable pY240 signal that was eliminated by omitting FGF from the culture medium or by treatment with the FGFR inhibitor PD173074 (Figure 2B). This in turn resulted in significantly greater IR sensitivity as shown by a sustained pH2AX signal (Figure 2C) and fewer colonies formed in an extreme limiting dilution assay (ELDA) after IR exposure. In sharp contrast, non-irradiated cells in all conditions formed the same number of colonies (Figure 2D), indicating FGFR signaling is critical in facilitating DNA repair. To determine whether these effects mediated by FGFR signaling were through PTEN Y240 phosphorylation, GSC line HK281, which expresses endogenous FGFR2 but is PTEN deficient (Figure 2A), was reconstituted with WT- or Y240F-PTEN followed by assessment of DSB repair after IR treatment (Figure 2E). WT-PTEN reconstituted cells showed decreased levels of pH2AX (Figure 2F) and increased colony forming efficiency after treatment with IR compared to Y240FPTEN cells, while control cells showed no difference in survival (Figure 2G). These results suggest that FGFR2 mediated phosphorylation of Y240 PTEN is critical for cells to survive IR induced DNA damage. Of note, both WT- and Y240F-PTEN reconstituted cells showed increased IR resistance compared to cells without PTEN expression, indicating that in addition to phosphorylation of Y240, other properties of PTEN might be involved in the DNA repair process, such as other types of protein modifications (Bassi et al., 2013).
Figure 2. pY240-PTEN confers resistance to DNA damage in GBM stem-like cells.

(A) 10 GBM stem cell lines were examined for PTEN and FGFR2 protein expression. (B) TS528 cells were treated with or without 1 μM FGFR inhibitor (PD173074, +PD) or grown in absence of bFGF (-FGF) for 16 hr. Immunoprecipitation of PTEN was performed followed by immunoblotting to examine for pY240 PTEN. (C) TS528 cells from (B) were treated with or without 5 Gy IR and analyzed for pH2AX by western blot. (D) Cells from (B) were analyzed for survival by limiting dilution assay. (E) HK281 cells reconstituted with empty vector (V), WT- or YF-PTEN were examined for pY240-PTEN by immunoprecipitation-western blot. (F and G) HK281 cells treated with 5 Gy IR were examined for pH2AX (F) and survival (G). Data are reported as mean ± SD from three independent experiments. **p<0.01. See also Table S4.
Nuclear localization and chromatin association of pY240-PTEN is elevated in response to IR treatment
We next investigated the subcellular localization of pY240-PTEN. As shown in Figure 3A, although there was a greater total amount of PTEN in the cytosol, the proportion of the pY240-PTEN was greater in the nucleus, indicating that the majority of nuclear PTEN was phosphorylated at tyrosine 240. In agreement with this, we detected a greater level of nuclear localized WT-PTEN than Y240F-PTEN in U87 cells especially after IR treatment, while total PTEN level and other subcellular distribution remained the same (Figure 3B, S2A). In addition, when preparing chromatin-bound protein fractions, we found that WT-PTEN could bind to chromatin and this binding was enhanced upon IR treatment (Figure 3C). Interestingly, this marked increase in WT-PTEN binding paralleled an increase of pY240 signal, which could be induced by IR as early as 1 hr after treatment (Figure 3D–E), suggesting pY240 was involved in a relatively early cellular response to IR. In contrast, Y240F-PTEN was clearly compromised for association with chromatin (Figure 3C–D), indicating that phosphorylation of Y240 was critical in this process. While no further activation of FGFR2 was found after IR treatment as indicated by phosphorylation of the receptor at Try653/654 and downstream effector phosphor-ERK (Figure S2B), we found an increase in nuclear localization of FGFR2 in parallel with the rapid increase of pY240-PTEN after IR treatment (Figure S2C and Figure 3E). Moreover, loading of RAD51 onto chromatin after IR treatment was noticeably enhanced in WT-PTEN cells (Figure 3C–D). The difference of Rad51 loading between WT- and Y240F-PTEN cells was not associated with cell cycle distribution, as no significant difference was found in cell cycle profiles up to 8 hr after IR. However, in agreement with our data, this treatment did induce cell cycle arrest 24 hr after IR in Y240F-PTEN and vector control cells (Figure S2D), indicating the cells are less efficient in repairing damaged DNA.
Figure 3. Nuclear localization and chromatin association of pY240 PTEN was elevated in response to IR treatment.

(A) 293T cells were co-transfected with FGFR2 or empty vector along with WT- or YF-PTEN. Cytoplasm (C) and nuclear fractions (N) were prepared for detection of pY240-PTEN. Bar graph on the right represents the ratio of cytoplasmic or nuclear pY240-PTEN to total cytoplasmic or nuclear PTEN respectively (bands inside the boxes). left panel represents the expression level of the indicated proteins in whole cell lysates. (B) U87-WT/YF-PTEN cells along with FGFR2 were irradiated at 10 Gy and whole cell lysates (left top) and cell fractionations (left bottom and right) were collected at indicated times followed by immunoblotting with anti-PTEN and anti-FGFR2 antibodies. Results represent equal cell equivalents of nuclear and cytosolic fractions. WCL, whole cell lysates; C, cytoplasm; N, nuclear. Long expo, longer exposure time. (C) U87-WT/YF-PTEN cells were treated with 10 Gy IR and chromatin fractions were prepared at the indicated times. PTEN and RAD51 from chromatin fraction (Chr) and WCL were examined by western blot. NCL, nucleolin, used as loading control for chromatin fraction. (D) Chromatin bound total PTEN and pY240 PTEN from WT or YF PTEN overexpressing 293T cells was compared by western blot over time after treatment with 10 Gy IR. (E) pY240-PTEN was monitored over time up to 24 hr after IR treatment in 293T cells. (F) Chromatin bound total PTEN, RAD51 and trimethylation lysine 9 of histone 3 (H3K9m3) were compared by western blot over time after treatment of WT-, YF- or GR-PTEN reconstituted cells with 10 Gy IR. Numbers in C, D, F indicate ratio of RAD51 levels relative to time 0 after normalization to NCL, *p<0.05 was generated by comparing WT- and YFPTEN samples at the same time point. (G) Chromatin bound PTEN was assessed in U87-WT PTEN with and without 1 μM PD173074 treatment and normalized to NCL (bar graph). Error bars in this figure represent SD of three independent experiments, *p<0.05. See also Figure S2
In conjunction with these findings, WT-PTEN cells showed decreased chromatin-associated trimethylation of lysine 9 of histone 3 (H3K9m3), a marker for condensed chromatin, around 6 hr after IR (Figure 3F), suggesting that PTEN binding might promote relaxation of chromatin, which is known to facilitate entry of the DNA repair complex to sites of damage (Price and D’Andrea, 2013; Soria et al., 2012; Wang et al., 2013). In agreement with this, micrococcal nuclease treatment of chromatin revealed greater DNA accessibility in WT-PTEN cells than in Y240FPTEN cells after IR treatment, as indicated by nucleosome laddering (Figure S2E). Further investigation is needed to reveal how pY240-PTEN regulates chromatin state. Blocking PTEN phosphorylation with the FGFR inhibitor PD173074 led to decrease in PTEN and RAD51 chromatin binding after IR along with a corresponding increase in pH2AX signal (Figure 3G). SUMOylation modification, shown to regulate PTEN nuclear localization and DNA damage response (DDR) (Bassi et al., 2013), was found to be similar between WT- and Y240F-PTEN cells (Figure S2F) and SUMOylation-deficient PTEN (K245R mutation) still can be phosphorylated at Y240 (Figure S2G). Thus, SUMOylation and Y240 phosphorylation are independent of each other and may regulate PTEN function separately.
Regulation of DNA damage response by phosphorylation of PTEN tyrosine 240 is independent of its lipid phosphatase activity
We next investigated whether the role of pY240-PTEN in DNA repair is dependent on its phosphatase activity. We introduced the G129R-PTEN mutant, known to be defective for phosphatase activity (Furnari et al., 1997; Myers et al., 1997), into U87 cells and found it to be competent for Y240 phosphorylation (Figure 4A), and behaved similarly to WT-PTEN in its ability to mediate DSB repair, as illustrated by pH2AX immunoblotting (Figure 4B), γH2AX and RAD51 foci formation dynamics (Figure 4C–D), and colony formation assay after treatment with IR (Figure 4E). Another phosphatase defective PTEN mutant, C124S, was also examined and similarly, this mutant was competent for Y240 phosphorylation and displayed DNA damage repair function identical to WT-PTEN (Figure S3A–B). These results indicate PTEN phosphatase activity was dispensable for the DNA repair process. Of note, however, colonies from G129R PTEN cells were approximately two-fold larger than those from WT- or Y240F-PTEN cells (Figure S3C–D). We suggest that this difference in colony size might result from permissive, growth-promoting AKT signaling in G129R-PTEN cells that is absent from WT- and Y240FPTEN cells (Figure 4F). These results point to a separation in PTEN functions between its canonical role in blocking PI3K/AKT pathway activation, which is dependent on its lipid phosphatase activity in the cytosol, and a non-canonical role in regulating DSB repair in a phosphatase independent manner in the nucleus. Thus, our findings demonstrate that effective therapeutic strategies for GBM patients might be tailored based on PTEN mutation and Y240 phosphorylation status (Figure 4G). To further demonstrate the PTEN phosphatase-independent activity in DSB repair, we generated Y240 phosphorylation-resistant, phosphatase activity defective Y240F-G129R double mutant PTEN, and found cells expressing this construct were sensitive to IR (Figure 4H). In agreement with the above results, PTEN phosphatase activity was not required for chromatin association (Figure 3F, 4I), however, the Y240F-G129R double mutant negated the chromatin binding of G129R-PTEN (Figure 4I), indicating the critical role of this phosphorylation site in DNA repair. In our assays, we noticed that G129R-PTEN bound to chromatin more efficiently than WT-PTEN in all conditions, which might be due to a higher pY240 level in G129R-PTEN (Figure S3E).
Figure 4. Regulation of DNA damage response by phosphorylation of PTEN tyrosine 240 is independent of its lipid phosphatase activity.

(A) U87-WT/YF/GR-PTEN cells were examined for pY240 by western blot. (B) Cells from (A) were treated with 10 Gy IR and analyzed for pH2AX at indicated times. (C and D) Cells from (A) were treated with 10 Gy IR and analyzed by immunofluorescence at the indicated times for the presence DSBs. Quantification of γH2AX (C) and RAD51 (D) foci positive cells is shown. (E) Cells treated as (C) were analyzed for colony formation. (F) U87-WT/YF/GR-PTEN cells were examined for AKT phosphorylation at Ser473 by western blot. (G) Proposed therapeutic strategies for GBM patients according to PTEN genetic status and phosphorylation of Y240. (H) HK281 cells reconstituted with WT-, YF-, or GR/YF-PTEN were treated with or without 3 Gy IR and analyzed for survival by limiting dilution assay. (I) U87-WT/YF/GR- or G129R/Y240F (GR/YF)-PTEN cells along with FGFR2 were treated with 10 Gy IR and chromatin-bound protein isolated at indicated times post-IR was immunoblotted for PTEN and RAD51. Error bars in this figure are SD of three independent experiments. *p<0.05. See also Figure S3.
pY240-PTEN binds to chromatin through interaction with Ki-67
Since PTEN lacks a DNA binding domain, we postulated that its association with chromatin is mediated by other factors. To determine which protein(s) recruit pY240-PTEN to chromatin, we performed mass spectrometric analysis for PTEN binding proteins (Figure 5A). Of the possible PTEN binding partners found, the most robustly enriched protein was Ki-67 (Figure 5B), which was confirmed by co-immunoprecipitation of endogenous Ki-67 with Flag-tagged PTEN (Figure 5C). Ki-67 is a well-known marker of cell proliferation but its exact function remains unclear. Moreover, although Ki-67 levels were similar in cell expressing WT-, Y240F- or G129R-PTEN, the level of chromatin-bound Y240F-PTEN observed was greatly reduced (Figure 5D), in agreement with disrupted interaction with Ki-67 (Figure 5E), indicating pY240-PTEN is critical for the association of PTEN with Ki-67. Furthermore, knockdown of Ki-67 deceased the level of chromatin bound PTEN without affecting total PTEN levels (Figure 5F).
Figure 5. pY240-PTEN binds to chromatin through interaction with Ki-67.

(A) Schematic for the identification of PTEN binding proteins. U87 cells expressing empty vector or Flag-GR-PTEN were labeled in SILAC media containing either light or heavy lysine and arginine. Chromatin fractionation followed by anti-Flag immunoprecipitation (IP) was performed for each sample, and immunoprecipitated proteins were combined and analyzed by mass spectrometry (MS). (B) Scatter plot of the median ratio of PTEN/mock for every protein identified with at least 3 unique peptides from two biological samples were plotted on a log3 scale. Each data point represents a single protein that was identified in this experiment. Data represent two biological repeats by labeling cells with different isotope (heavy or light). (C) Immunoprecipitation of Ki-67 or Flag (PTEN) from chromatin fractions of U87-V or GR-PTEN cells followed by blotting with Ki-67- or PTEN- specific antibody. (D) Chromatin bound Ki-67 in U87-WT/YF/GR-PTEN cells was determined by western blot. (E) Chromatin fractions from indicated cells were prepared for immunoprecipitation with anti-Ki-67 antibody followed by western blotting with PTEN antibody. (F) U87-GR-PTEN cells were transfected with two siRNAs targeting Ki-67 (si-1 and si-2) and a non-specific control (NC). Chromatin fractions were isolated to examine Ki-67 and PTEN levels by western blot. (G) 293T cells were co-transfected with PTEN and Ki-67 truncations (mNeoGreen-tagged). Whole cell lysates were prepared for co-IP with mNeoGreen (mG) antibody followed by western blotting with PTEN antibody; lane 1, Full length Ki-67; lane 2, LR domain lacking (deletion of 2929–3256 aa); lane 3, FHA domain lacking (deletion of 1–134 aa); lane 4, FHA and PP1-BD (deletion of 1–1002 aa); FHA, lane 5, PP1-BD and 8 repeats (deletion of 1–1970 aa). #6, 16 repeats deletion; #7, disrupted FHA and PP1-BD from #6; #8, PP1-BD only. (H) Left: snapshots of Ki-67 trajectory color-coded by the simulation, with the aligned binding pockets of PTEN (blue) and PP1γ (red) highlighted in a square; Center: zoom in at the alignment of the structurally conserved region containing the RVxF and KiR-SLiM binding pockets in pY240-PTEN (blue) and PP1γ (red); Right: comparison between the Ki-67/pY240-PTEN complex formed in simulation (above) and the Ki-67/PP1γ crystallographic complex (below). (I) Close-up to the Ki-67 interaction (orange) with pY240-PTEN, showing the conserved phosphatase fold in blue. The main RVxF motif and KiR-SLiM Ki-67 residues appear in licorice, with the closest interactions labeled. See also Figure S4, Table S5 and movie S1.
Ki-67 contains a Forkhead-associated (FHA) domain, a protein phosphatase 1 (PP1)-binding domain (PP1-BD), 16 tandem repeats of a conserved “Ki-67 motif” and a C-terminal LR domain. Through co-immunoprecipitation experiments using Ki-67 truncations, we found the PP1-BD of Ki-67 was essential for the interaction of Ki-67 with PTEN (Figure 5G). Ki-67 has been previously shown to be a PP1γ interacting protein (Booth et al., 2014) through RVxF, ΦΦ and KiR-SLiM binding pockets present at its phosphatase domain. Although the sequence identity between PP1γ and PTEN is not very high, according to different structural alignment methods, they share significant 3D structure similarity in a hydrophobic pocket located near their phosphatase domains, which PP1γ uses to bind to the Ki-67 KiR-SLiM motif (Figure S4A–D). Thus, we performed in silico binding studies using sub-microsecond Molecular Dynamics (MD) simulations (Table S5). We observed that phosphorylation of PTEN at Y240 favored significant closing of the cleft between its PD and C2 domains and increased the accessibility of the PD binding pocket (Figure S4E–F). In blind simulations, Ki-67 spontaneously docked to the hydrophobic pocket of PTEN homologous with PPIg (Figure 5H and Movie S1), forming a stable complex. The anchoring of Ki-67 to pY240-PTEN was mainly mediated by the KiR-SLiM motif (Figure 5I) and stable complexes were also formed when this motif was placed near its binding pocket of PTEN in the crystallographic orientation (Figure S4G–H). In addition, while a disrupted Ki-67 PP1-BD ablated interaction with PTEN, this domain alone was sufficient for interaction but with compromised affinity (Figure S4I). This might be related to the distinct subcellular distribution of this small protein, as it displayed a diffuse pattern due to lack of chromatin binding domain (LR), while other truncations had a punctate pattern (Figure S4I, right). In agreement with this, PTEN chromatin loading was rescued by construct 6 but not 7 in Ki-67 knock down cells (Figure S4J). The importance of the PP1-BD for PTEN interaction was further demonstrated by transfection of a Ki-67 peptide containing the KiR-SLiM motif, which disrupted the interaction (Figure S4K–L) and led to less efficient DNA repair, as indicated by persistent DNA damage at 4 hr after IR treatment (Figure S4M), when compared to a mutant peptide control. Furthermore, PP1γ was able to compete with PTEN for interaction with Ki-67 leading to a decrease in PTEN chromatin loading (Figure S4N). Together, these data suggest that pY240-PTEN is recruited to chromatin through interaction with the PP1-BD of Ki-67.
Y240F-Pten knock-in mice are more sensitive to IR treatment
To determine the effect of blocking PTEN Y240 phosphorylation within the context of an entire organism, we generated Y240F-Pten knock-in mice (Figures S5A–C). These Y240F mice developed normally and were indistinguishable from their wild type littermates. Embryonic fibroblasts (MEFs) isolated from these mice showed that the Y240F mutation did not affect primary pathways related to cell survival and proliferation, such as EGFR/ERK and AKT signaling (Figure S5D).
In adults, neural stem cells (NSCs) are predominantly found in the subgranular zone of the dentate gyrus of the hippocampus (SGZ) and the subventricular zone (SVZ) (Revishchin et al., 2008), both of which are a source for glioma cell of origin as well as a cell reservoir to repopulate the brain after radiation treatment (Chen et al., 2015). We isolated NSCs from the SGV from E16.5 WT- and Y240F-Pten knock-in mice. While neurospheres from Y240F-Pten knock-in mice possessed identical AKT activation as WT-Pten neurospheres (Figure S5E), WT-Pten cells were found to be more resistant to IR than Y240F-Pten cells (Figures 6A–C), indicating that preventing PTEN Y240 phosphorylation in an isogenic system with endogenous levels of PTEN expression confers sensitivity to DNA damage. More importantly, to test the systemic protective effect of PTEN Y240 phosphorylation against IR induced DNA damage in an immune proficient background, we treated Pten knock-in mice with whole body IR followed by examination of damaged intestinal crypts, which have been shown to express FGFRs and be highly sensitive to IR due to their rapid turnover rate (Brodrick et al., 2011; Matsuda et al., 2012). We found a similar extent of crypt loss at 24 hr after treatment for both mice, however, while Pten WT mice completely recovered crypt morphology after 4 day, Y240F-Pten mice still had significant crypt destruction and shortened villus length at this time point (Figure 6D) and Ki-67 staining for proliferating cells within crypts (Figure 6E), which co-registered with pY240-PTEN positivity (Figure 6E, right). In addition, we generated a glioma model, in which we transduced astrocytes from Y240F knock-in mice with the EGFRvIII oncogene to generate tumorigenic cell lines (Figure 6F). Upon orthotopic engraftment the mice were irradiated, compared with mice harboring EGFRvIII/WT-Pten astrocytes, mice engrafted with EGFRvIII/Y240F-Pten astrocytes had extended overall survival, and a decreased tumor burden (Figure 6G–H). These results confirm that pY240-PTEN mediates radioresistance and suggest an actionable mechanism that can be targeted for therapy.
Figure 6. Y240F-Pten knock-in mice are more sensitive to IR treatment.

(A) Primary neurospheres were prepared from E16.5 WT and Y240F-Pten mice embryos and cell lysates from two representative Y240F Pten neurospheres (YF-1 ad YF-2) and one WT Pten neurosphere were prepared, immunoprecipitated with anti-PTEN antibody and examined for pY240-PTEN. (B) Neurospheres were treated with or without 3 Gy IR. Cell lysates were collected at indicated times and pH2AX was examined. (C) Survival of neurospheres treated as in (B) were evaluated by limiting dilution assay. (D) WT- and YF-Pten mice were treated with 8Gy whole body IR. Representative images show H&E staining of sections from proximal small intestine at indicated times post IR. Scale bar, 100 μM. Bar graph on the right indicates villus height measured from H&E staining images. (E) Representative images of Ki-67 staining indicating proliferating cells in intestinal crypts and pY240-PTEN staining from mice in (D). Scale bar, 200 μM. Inset scale bar, 50 μM. Bar graph on the right indicates quantification of Ki-67-positive cells per crypt. 30 crypts were assessed from each mouse. (F) Astrocytes from Cdkn2a null; WT and YF Pten mice were transduced with EGFRvIII to generate tumorigenic cell lines. Western blot illustrates expression of EGFRvIII, with U87 cells stably reconstituted with EGFRvIII as control. (G) Cells from panel (F) were used for intra-cranial engraftment (0.5×10⁶ per mouse) followed by IR treatment after tumor establishment. Representative images at day 72 were shown. (H) Kaplan-Meier analysis of survival. Quantification data represent mean ± SD from three independent experiments. *p<0.05. See also Figure S5.
Inhibiting PTEN Y240 phosphorylation sensitizes to therapies
Motivated by the above results, we sought to develop a preclinical model to determine if inhibiting PTEN Y240 phosphorylation would sensitize tumors to IR. Mice orthotopically engrafted with TS528 glioma neurospheres expressing endogenous PTEN and FGFR2 (Figure 2A) were orally administered with the FGFR inhibitor AZD4547, which penetrates the blood brain barrier (BBB), and tumors were taken over the course of eight hours to determine a therapeutic window at which maximum inhibition of PTEN Y240 phosphorylation was achieved. As shown in Figure 7A, phosphorylation of Y240 was reduced to the lowest level at 4 hr and returned to the untreated level at 8 hr post-treatment. Based on this pharmacodynamic behavior, we designed an experiment to assess tumor growth and animal survival (Figure 7B). Mice with engrafted tumors treated with IR 4 hr after AZD4547 administration (when pY240 was at the lowest level) had significant tumor growth inhibition (Figures 7C–E) and a corresponding increase in survival (Figure 7F). We tested two additional GBM patient-derived GSCs, GSC2 and GS 10–6, which yielded similar responses both in vitro (Figures S6A–C) and in vivo (Figure S6D–E) to IR after FGFR inhibition.
Figure 7. Inhibiting PTEN Y240 phosphorylation sensitizes to therapies.

(A) TS528 cells were intracranially injected into immunodeficient mice to establish tumors. Mice were administrated FGFR inhibitor AZD4547 (50 mg/Kg) by gavage at day 12 after injection. Tumor tissues were collected at indicated times after treatment and lysates were prepared for immunoprecipitation with PTEN. Presence of pY240-PTEN was determined by western blot. (B) Schematic representation of preclinical study design and experimental workflow. Tumor burden was evaluated by three-dimensional (3D) fluorescence molecular tomographic (FMT) imaging system starting at day 12. (C) Representative images of tumor FMT signal taken at day 14 are shown. Ctrl, vehicle; AZD, 50 mg/Kg AZD4547; IR, 2.5 Gy; AZD (2 hr)-IR or AZD (4 hr)-IR, treated with 2.5 Gy IR after 2 or 4 hr of AZD treatment. (D) Quantification of FMT signal intensity from (C). Colored horizontal bars indicate mean value of each group. ns, not significant between ctrl group and AZD, IR or AZD (2 hr)-IR group. (E) FMT signal monitored starting from day 12 (before treatment) to day 19. Signal intensity recorded from each point was quantified relative to day 12. Error bars are SD of at least three replicates. (F) Kaplan-Meier analysis of mice survival due to treatments in (B). *p<0.05. See also Figure S6 and S7.
To determine if this combination treatment caused systematic toxicity, we examined both nude mice and Y240-Pten knock in mice and found the treatment was well tolerated as no damage of major organs (Figure S6F and S6G) or body weight loss (Figure S6H) were detected. We also examined brains from tumor-bearing mice after treatment for cell death and detected an increased TUNEL signal in tumor tissue but not in surrounding normal brain, thus further confirming our treatment regimen had no adverse effect on normal tissues (Figure S6I). These results suggest that pharmacological blockade of PTEN Y240 phosphorylation, by FGFR inhibitor, could serve as an adjuvant approach for radiotherapy.
To expand upon the clinical significance of pY240-PTEN, we examined the effect of two DNA damage inducing agents, doxorubicin and temozolomide (TMZ), that have been widely used for cancer treatment. Both agents induced greater DNA damage in Y240F-PTEN cells compared to WT-PTEN cells (Figure S7A). Furthermore, it has been shown that EGFR inhibitors, such as erlotinib, can cause DNA damage (Li et al., 2008) and indeed we found an increase in pH2AX in an EGFRvIII-expressing neurosphere line treated with erlotinib (Figure S7B) and detected less DNA damage in WT-PTEN cells compared with Y240F-PTEN cells (Figure S7C). These results indicate a broad function of pY240-PTEN in protecting cells from different DNA damage stimuli.
Finally, in an assay that mimics heterogeneous tumor growth, a hallmark of GBM, HK281 cells expressing RFP720-WT-, BFP-Y240F-, GFP-G129R-PTEN, or GFP-G129R/Y240F-PTEN were mixed in equal amounts. IR treatment reduced the percentage of Y240F-PTEN cells in the mixed population as well as the double mutant G129R/Y240F cells, while both WT- and G129RPTEN cells displayed a survival advantage (Figure S7D). In these cultures, approximating a tumor heterogeneous scenario and in agreement with our previous clinical findings that WTPTEN expression confers resistance to radiotherapy.
DISCUSSION
Our data demonstrate a critical role of PTEN, when phosphorylated at tyrosine 240, in mediating resistance to radiotherapy and suggest that inhibiting this phosphorylation event, through FGFR inhibition, may be an important adjuvant therapy to increase radiosensitization in cancers utilizing this signaling pathway, such as in gastric cancer and GBM.
Nuclear PTEN has been linked to chromatin condensation or heterochromatin structure (Chen et al., 2014). However, we found chromatin decondensation after IR in WT and G129RPTEN cells but not in Y240F-PTEN cells. Of note, while chromatin relaxation happens starting 4 hr after IR, phosphorylation of PTEN Y240 and its chromatin association was induced as early as 1 hr after IR treatment. The delayed chromatin status change after PTEN association may indicate PTEN-mediated regulation of chromatin condensation is indirect, the underlying mechanism, potentially involving regulation of lysine demethylases targeting H3K9me3 or alterations in chromosome condensation proteins, such as associated with condesin I and II complexes (Floyd et al., 2013), needs to be investigated further.
Our data demonstrated that Ki-67 recruits PTEN in a Y240 phosphorylation-dependent manner through its PP1-BD, previously shown to bind to PP1γ. We also observed competition between PTEN and PP1γ for Ki-67 association, suggesting a mechanism that regulates affinity of Ki-67 binding partners. Using a Ki-67 peptide containing the KiR-SLiM motif of the PP1-BD, we were able to reduce PTEN and Ki-67 interaction and promote persistent DNA damage after IR treatment. Although such an approach proved to be an effective way to disrupt PTEN-Ki-67 interaction, its utility is likely limited as it may also affect the binding of PP1γ to Ki-67. To this point, recent studies have shown that Ki-67 may be involved in regulating chromatin structure and promoting dispersal of mitotic chromosomes (Cuylen et al., 2016; Sobecki et al., 2016). Our data perhaps suggest an interpaly between pY240-PTEN and PP1γ, through their interactions with Ki-67, contribute to chromatin structure modulation.
PTEN phosphatase activity was not required for regulating DNA repair as indicated in our study. G129R-PTEN, a phosphatase inactive mutant, showed even stronger chromatin loading than WT-PTEN but did not show greater DNA repair ability, which possibly indicate that the DDR function of chromatin-associated PTEN has plateaued in these cells under our experimental conditions. While G129R-PTEN behaved similar to WT-PTEN in protecting cells from DNA damage, it lost the ability to control cell proliferation mediated by the AKT pathway. Thus, tumors harboring PTEN mutant G129R, or similar phosphatase deficient mutants such as C124S, may represent a clinical situation that is worse than PTEN deficiency, as the phosphatase inactivating mutation lacks cell proliferation control but retains the ability to enhance DDR through the nuclear function defined here. These data point the way to future development of therapeutic strategies to improve clinical outcomes based on PTEN mutation and pY240 status. Specifically, patients whose tumors are PTEN deficient might benefit from PI3K/AKT inhibition in combination with IR; tumors with WT-PTEN could be treated with FGFR inhibitors plus IR; while tumors with a catalytically inactive PTEN mutation would be best targeted with FGFR and AKT pathway inhibitors and IR treatment. Given that tumors can be heterogeneous for PTEN mutation and Y240 phosphorylation, we would also anticipate regional tumor responses to radiotherapy, which we have mimicked experimentally with mixed cultures of WT- and Y240F-PTEN neurospheres.
FGFR pathway signaling has been shown to be associated with developmental defects, angiogenesis and wound repair abnormalities, cancers, and metabolic disorders. For this study, we focused on FGFR2 although other FGFR family members demonstrate specificity for PTEN Y240 in a tyrosine kinase screen (data not shown), which raises the possibility that tumors derived from different tissues might utilize alternative tyrosine kinases to phosphorylate Y240, a prospect that we are currently investigating. The FGFR-TACC fusion protein caused by chromosomal translocation has constitutive kinase activity and induces mitotic and chromosomal segregation defects and triggers aneuploidy, was recently reported to exist in a subset of GBMs (Singh et al., 2012). Whether this fusion protein also phosphorylates PTEN Y240 to promote DDR, is yet to be determined.
Nuclear translocation of tyrosine kinases, such as c-Abl and EGFR, have been found to be increased by DNA damage agents (Dittmann et al., 2010; Yoshida and Miki, 2005). Numerous studies have reported that FGFRs can translocate to the nucleus and are associated with cancer development. In our study, we found IR treatment slightly enhanced FGFR2 nuclear translocation and simultaneously, phosphorylation of Y240 PTEN. We thus speculate that under DNA damage conditions, tumor cells have an inherent ability to survive through activation of this nuclear PTEN function mediated partly by increased FGFR2 nuclear translocation. Together with other studies, our data provide a rationale for clinical development of FGFR inhibitors for treating GBM resistant to therapies that rely on DNA damage generation. We identify pY240-PTEN as a predictor for FGFR inhibitor application and thus illustrates an approach for precision medicine.
In summary, our data shows that pY240-PTEN mediates resistance to DNA damage through enhancement of the DNA repair process. This particular phosphorylation-related function of PTEN is separate from its canonical function of opposing AKT pathway activation. Pharmacological blocking of Y240 phosphorylation by FGFR inhibitors sensitized cells to DNA damage and extended survival in a preclinical GBM model treated with IR. Therefore, understanding the genetic status of PTEN in tumors, such as deletion, wild type, enzyme- inactivating mutation, or posttranslational modifications, may help to determine more effective treatments for GBM patients. The mechanisms documented here likely also have implications for other cancer types that depend on the FGFR signaling pathway.
STAR ★ Methods
Contact for Reagent and Resource Sharing
Further information and requests for resources and reagents should be directed to and will be fulfilled by the Lead Contact, Frank B. Furnari (ffurnari@ucsd.edu)
Experimental Model and Subject Details
Mice
All animal experiments were conducted according to protocols approved by University of California, San Diego’s Institutional Animal Care and Use Committee (IACUC). For Pten knock-in mice: C57BL/6J mice and E2a-cre mice were obtained from Jackson Lab (Bar Harbor). FVB.129-Cdkn2atm1Rdp (Cdkn2a-null) mice were from NCI repository (#01XB2). For Brain tumor intracranial models, NU/NU Nude mice were obtained from Charles River Laboratories. All mice used were female, aged 4–6 weeks and weight >20 g before experiments started. Mice were randomly assigned to experimental groups. All mice were kept up to 4 mice per cage and maintained in the vivarium room of Cellular and Molecular Medicine West at University of California, San Diego.
Human GBM tissue sections
Human GBM specimens were obtained according to a protocol approved by the institutional review board of the University of São Paulo and written informed consent was obtained from all patients for the use of their samples. Patient characteristics are showed in Table S1.
Cell Lines and primary cultures
293T (source: female), human glioma cell line U87 cells (source: male) were cultured in DMEM (Hyclone) with 10% heat-inactivated FBS (Hyclone), 100 U/ml Penicillin and 100 μg/ml Streptomycin (Gibico/Life Technologies). GBM stem cell lines TS528, TS543, TS576 and TS600 were kindly provided by Dr. Cameron Brennan, MSKCC; HK281 was from Dr. Harley Kornblum, UCLA; GSC11 (source: male) and GSC23 (source: male) were acquired from Dr. Frederick Lang, MD Anderson; GBM6 (source: male) and GBM39 (source: male) were obtained from Dr. David James, Northwestern University; GBM1600 (source: male) was kindly provided by Dr. Paul Mischel, Ludwig Institute. GBM stem cell (Neurosphere) lines were cultured in DMEM/F12 medium supplemented with B27 (GIBCO/Life Technologies) and human recombinant EGF (20 ng/ml), bFGF (20 ng/ml) and 2 mg/mL heparin (StemCell Technologies). Neurospheres were dissociated with Accutase (Stemcell Technologies). Primary neural stem cells were isolated from the brain of E16.5 littermates of WT and Y240F PTEN mice. Cells were cultured in the same medium as GBM stem cell lines. All cells were kept in a humidified 5% CO2 incubator at 37°C.
Method Details
Reagents
Wild type PTEN cDNA was subcloned into the pLV-EF1a-MCS-puro lentiviral plasmid (Biosettia) and all the mutant PTEN (Y240F, G129R, C124S, K254R) were acquired by site-directed mutagenesis PCR using Phusion high fidelity polymerase and DpnI (New England Bio labs). FGFR2 cDNA was subcloned from pCMV vector to lentiviral plasmid pBobi (Life Technology) and the mutants (Y486F, Y586F, Y733F, Y769F, Y586/588F and Y656/657F) were generated from WT FGFR2 by site-directed mutagenesis PCR. Ki-67 expressing constructs 1–7 (Figure 5G) were kindly provided by Dr. Daniel W. Gerlich; Ki-67 truncation 8 was generated by overlap extension PCR from construct 6, and only contains PP1-binding domain 81 aa (485–565) fused to mNeonGreen at the C-terminus. Traffic light 1.1 and SFFV (expressing I-SceI and donor GFP) lentiviral plasmids were gifts from Dr. Petra Hamerlik.
Lentivirus Production and Infection
pLV-puromycin lentivirus expressing PTEN or FGFR2, was generated by co-transfection with VSVg and Δ8.9 packaging plasmids in 293T cells using Lipofectamine 2000 (Life Technologies). Supernatants were collected at 48 and 72 hr after transfection and virus was concentrated by ultra-centrifugation. The virus pellets were resuspended in HBSS and kept in −80 °C until use. Lentiviral titer was determined using p24 ELISA kit according to the manufacturer’s protocol (Clontech). Cells were infected with high titer lentivirus and were subjected to 1 μg/mL puromycin selection.
In vitro kinase assay and Phos-tag gel
Kinase assays were performed as described (Kang et al., 2007) with the following modifications: 500 ng of GST-PTEN (WT or Y240F) was used as substrate and reacted with 100ng purified recombinant FGFR2 or Src kinase (Millipore) per reaction. Kinase efficiency was analyzed by protein gel where Phos-tag™ Acrylamide AAL-107 (Wako Pure Chemical Industries) was incorporated into the gel to differentiate phosphorylated and un-phosphorylated proteins. Electrophoresis and gel transfer were performed according to the manufacturer instructions.
Western Blotting and immunoprecipitation
Cultured cells were lysed with RIPA lysis buffer (50mM Tris-HCl, 150mM NaCl, 0.5% Sodium deoxycholate, 0.1% SDS) supplemented with protease and phosphatase inhibitor cocktail (Bimake.com). Protein concentration of each sample was determined by BCA assay using the BCA kit (ThermoFisher Scientific) according to manufacturer’s instructions. Cell lysates were analyzed by electrophoresis on SDS-PAGE gel. NuPage 4–12% Bis-Tris and 3–8% Tris-Ace mini gels (Novex) were used for Ki-67 electrophoresis. PVDF membrane (Millipore) was used for gel transfer and the membrane was probed with primary antibodies as indicated, followed by secondary antibodies conjugated with HRP. The signal was detected with Super Signal West Pico/Femto Chemiluminescent Substrate (Thermo Scientific).
For immunoprecipitations, cells were lysed with NP40 buffer (50 mM Tris pH 8.0, 150 mM NaCl, 0.5% NP40, supplemented with protease and phosphatase inhibitor) for 10 min on ice followed by sonication at 10% amplitude for 6 seconds (1s on, 1s off). Supernatant was collected after centrifuge at 14,000 × g for 15 min at 4 °C. Immuno precipitations were performed by gentle rotation overnight at 4 °C, and then immune complex es were washed three times in cold NP40 buffer and resuspended in Laemmli sample buffer. For immunoprecipitation from nuclear or chromatin extracts, lysates were diluted 5-fold in NP40 buffer. Immunoprecipitation of endogenous SUMO-PTEN was performed as described (Bassi et al., 2013). Briefly, cells were lysed in Laemmli sample buffer (without bromophenol blue), followed by sonication and centrifugation at 15,000 × g for 15 min at 4 °C. Su pernatant was diluted 10-fold with PBS containing fresh 20 mM N-ethylmaleimide (NEM) (Sigma), 1% Triton X-100, 1 mM dithiothreitol (DTT), and protease and phosphatase inhibitor cocktail. Anti-Flag affinity gel (Sigma) was added and rotated at 4 °C overnight. Immune complex es were washed 4 times with PBS containing 1% Triton x-100 and resuspended in Laemmli sample buffer. Co-immunoprecipitation of Ki-67 (full length and truncations) and PTEN was performed using mNeoGreen (nAb) agarose (Allele Biotechnology) according to manufacturer instructions.
Analysis of patient derived GSC lines
The expression levels of FGFR2 and PTEN in in 43 patient-derived glioma stem cell lines (Figure 1D) were determined by RNAseq where the median expression value of FGFR2 for all lines in this RNAseq experiment was 2.5, based on RPKM values from normalized transcriptome sequencing. The lines were dichotomized as either high or low expressing based on the median value, which is a well-accepted way to define expression level. This unsupervised approach was chosen as opposed to a supervised approach, which would have selected the FGFR2 expression cutoff point leading to the greatest difference in radiation sensitivity and thus bias our conclusions. Similarly, PTEN expression level is defined as high or low based on the median value of all GSC lines in this certain experiment. Note 2.5 is only applied in Figure 2D where the RNAseq assay was used for analyzing patient derived GSCs and this median value differs between experiments.
Radiation response was determined as below. Briefly, cells were radiated at 0, 2, 4, or 6 Gy and seeded at 1 viable cell per well in 96 well plates. Sufficient plates were used so that at the endpoint of the experiment a minimum of 10 positive spheres per experiment could be scored. Clonogenicity was determined by normalizing the fraction of wells with spheres to the sphere forming rate of the unirradiated cells, which represented the plating efficiency. All experiments were conducted in triplicate. Cells were dichotomized as either radiotherapy (RT) sensitive vs. RT resistance based on a survival fraction after 4 Gy of radiation of <0.3 or >0.3. This value was chosen based on examination of the linear quadratic survival functions for each line and a significant separation of the lines at this dose and survival fraction. Intermediate means the cells behaved similarly to RT as defined above when treated with higher doses of irradiation (such as 6 Gy in this assay) treatment. We excluded these samples from Figure 1D and only compare the most significantly different ones (RT sensitive and RT resistant).
Clonogenic assay
Briefly, cells were treated with different doses (0–10 Gy) of irradiation and seeded in 100-mm dishes at appropriate densities in triplicate 2 hr after irradiation. Cells were incubated for 14 day to allow the formation of colonies and then colonies were fixed with 4% formaldehyde for 20 min at room temperature, washed with PBS, stained for 30 min with 0.5% Crystal Violet, washed with water several times and then dried. Colony numbers were counted and the surviving fraction was calculated as the ratio of the plating efficiency of the treated cells to that of control cells.
Single cell electrophoresis assay (comet assay)
Single cell gel electrophoresis (Neutral) was performed according to manufacturer’s instructions. Briefly, U87 cells expressing empty vector, WT- or YF-PTEN were irradiated at 10 Gy and were collected at 0, 1 and 24 hr after IR, followed by washing and resuspension in ice cold PBS. 1–2 × 10⁴ cells were prepared for each assay using Comet Assay Electrophoresis system (Trevigen). The samples were then analyzed by fluorescence confocal microscopy using an Olympus FV1000. Tail moment was analyzed using software provided by Trevigen.
Immunofluorescent staining of γH2AX, RAD51, RPA, and BrdU foci
U87 cells expressing PTEN constructs seeded on coverslips to ~70–80% confluency were allowed to attach for 12 hr followed by irradiation at 10 Gy using a gamma-irradiator. For BrdU assay, cells were incubated with 20 μM Brdu for 36 hr prior by IR treatment. At indicated time points, cells were washed with cold PBS. Cells were incubated in cold 500 μL of Extraction Buffer 1 (10 mM PIPES, pH 7.0; 100 mM NaCl; 300 mM Sucrose; 3 mM MgCl2; 1 mM EGTA, 0.5% Triton X-100) on ice for 10 min, washed with PBS and then incubated in cold 500 L of Extraction Buffer 2 (10 mM Tris-HCl, pH 7.5; 10 mM NaCl; 3 mM MgCl2, 1% Tween 40, 0.5% sodium deoxycholate) on ice for 10 min. Cells were then washed in cold PBS and fixed in 4% PFA for 20 min on ice followed by permeabilization with 0.5% Triton X-100 for 10 min on ice. Coverslips were then blocked by incubation in 500 L of 5% BSA in PBS on ice for 20 min followed by 5% donor bovine serum (ThermoFisher Scientific) for 20 min. Blocked coverslips were then probed with antibodies detecting γH2AX (Millipore), RPA and RAD51 (Santa Cruz Technology), and BrdU (BD Bioscience) followed by Alexa Fluor 488–conjugated secondary antibody (Life Technology). Coverslips were mounted with Fluoro-Gel II with DAPI (Electron Microscopy Sciences). Fluorescent γH2AX, RPA, BrdU and RAD51 foci were captured by confocal microscopy. For quantification, cells containing more than 5 foci were determined as positive.
Traffic Light Reporter (TLR) Assay
TLR assay was conducted as described (Certo et al., 2011) using U2OS cells with PTEN deleted by CRISPR/Cas9 editing. Briefly, U2OS PTEN−/− cells were infected with TLR 1.1 lenti-virus containing a I-SceI restriction site at MOI=1 followed by puromycin selection to generate stable cell lines. The reporter cells were then reconstituted with WT- or Y240F-PTEN together with FGFR2. I-SceI and a donor GFP was introduced into the above cells to induce DSB. Cells were then allowed to grow for another two days and subjected to FACS analysis to determine the proportion of GFP and mCherry positive cells.
Micrococcal nuclease (MNase) assay
MNase was performed in WT- or YF-PTEN U87 cells after IR. Briefly, WT- or YF-PTEN U87 cells were collected after IR (10 Gy) treatment at various time points, washed twice with PBS and resuspend in 500 μl buffer A (10 nM Tris-HCl pH 7.5, 10 mM NaCl, 3 mM MgCl2, 0.3 M sucrose, proteinase inhibitors). Suspensions were mixed gently and left on for 5 min followed by addition of 25 μl 10% NP40 on ice for 10 min. Following centrifugation at 1200rpm for 10 min at 4 °C, pelleted nuclei were resuspended in 200 μL bu ffer A with 10 mM CaCl2 and 100 U MNase was added at room temperature for 3 min. Reactions were terminated by adding 50 mM EDTA. DNA was purified using Qiagene DNA isolation Kit and separated on 1.2% agarose gel.
Subcellular Fractionation
Cells were washed with ice-cold PBS and then incubated on ice for 5 min in buffer A (10 mM Tris-Cl, pH 7.5, 3 mM MgCl2, 10 mM KCl, 0.1 mM EDTA, 0.5% NP40 and protease inhibitor cocktail). The cells were centrifuged at 2,500 rpm at 4°C for 5 min. Supernatant was collected and used as the cytosolic fraction. The pellet was washed once with buffer A without NP40, then resuspended in buffer C (20 mM HEPES, pH 8.0, 0.4 M NaCl, 7.5 mM MgCl2, 0.2 mM EDTA, 0.21 mM EGTA, 1 mM DTT, and protease inhibitor cocktail), vigorously vortexed for 30 min at 4 °C, and resulting homogenates were centrifuged for 10 min at 13,000 rpm at 4°C. Collected supernatants from this fraction were then used as nuclear fractions. Nuclear and cytosolic fractions were resolved by SDS-PAGE. For Figure S2A, subcellular fraction was prepared using Subcellular Protein Fractionation Kit from Thermo Fisher Scientific and Na/K ATPase, MEK1/2 or GAPDH, HDAC2 or Lamin A/C and Vimentin served as loading controls for plasma membrane, cytoplasma, nuclear and cytoskeleton, respectively.
Chromatin Fraction preparation
Briefly, cytoplasmic protein was first isolated by incubation of cells in buffer A (10 mM HEPES at pH 7.9, 10 mM KCl, 1.5 mM MgCl2, 0.34 M sucrose and 10% glycerol) supplemented with protease inhibitors and 0.1% Triton X-100, followed by centrifugation at 4 °C. The resulting pellet was resuspended in buffer B (3mM EDTA, 0.2 mM EGTA supplemented with protease and phosphatase inhibitors) and vortexed for 30min at 4 °C followed by centrifugation. The supernatant was collected as the nuclear-soluble fraction, and the pellets were solubilized in ice cold RIPA buffer with 500mM NaCl on ice for 30 min followed by centrifugation at 14,000 rpm at 4 °C for 10 min. The resulting chromatin fraction supernatant was stored at −80 °C. For SILACMS analysis, chromatin fractions were digested with Benzonase (Sigma) overnight at 4 °C in Benzonase buffer (2 mM MgCl2, 100 mM NaCl, 50mM HEPES, pH 7.5) and then subjected to co-immunoprecipitation using anti-Flag affinity gel (Sigma).
Immunohistochemistry and H&E staining/TUNEL staining
Tissue sections were prepared from formalin-fixed paraffin-embedded glioblastoma patient tumors or mice intestines and staining were performed as below: 0.01 M citrate buffer, pH 6.0 was used for antigen retrieval for 3 min at 122°C i n a pressure cooker. 3% hydrogen peroxide was used for peroxidase activity quenching. Primary antibodies for phospho-H2AX (Millipore) and phospho-PTEN Y240 were diluted at 1:250 and 1:50 respectively in 10% normal goat serum in TBS- 0.1%Tween. Primary antibodies were incubated overnight at 4°C, followed by biotinylated secondary antibodies (Vector) at 1:500 dilution for 1 hr at room temperature. Slides were counterstained with hematoxylin. Immunostaining was analyzed and scored independently by two observers: 0 as negative, 1 as ~ 25% of positive structures were present, 2 for 26–50%, 3 for 51–75% and 4 for >76% of positive structures. For mice Ki-67 staining, antigen retrieval was done by heating slides at 95°C in citrate buffe r for 20 min followed by incubating in 3% Hydrogen peroxide for 30 min for peroxidase activity quenching. Slides were then blocked with Avidin D for 15 min and Biotin for 15 min. Primary antibodies for Ki-67 (Abcam) was used at 1:100 dilution in 5% normal goat serum in TBS- 0.1%Tween followed by secondary antibody and developed according to the instruction of Vectastain Elite ABC Kit and DAB Substrate Kit.
H&E and TUNEL staining: Tissues from mice were prepared and fixed in Formalin for 24 hr and transferred to 70% ethanol. H&E and TUNEL staining were performed and analyzed at the UCSD Tissue Technology Core, a shared resource supported by an NCI Cancer Center Support Grant (CCSG Grant P30CA23100).
Extreme Limiting dilution assay (ELDA)
Extreme limiting dilution assay was performed as described (Hu and Smyth, 2009). In particular, TS528 cells were incubated with 1 μM PD173074 or medium without bFGF for 16 hr before irradiation. Different dilutions (0, 10, 25, 50, 100 cells/well) for HK281 and TS528 cells and (0, 25, 50, 100, 200, 400 cells/well) for primary neurosphere cells with or without IR treatment (5 Gy) were seeded in 96-well plates. After 14–18 days, the number of spheres formed was counted and analyzed using an online software application (http://bioinf.wehi.edu.au/software/elda/).
SILAC Labeling and mass spectrum
SILAC labeling was described previously(Ong et al., 2002). U87 cells expressing empty vector or Flag-GR-PTEN were grown in SILAC DMEM supplemented with 10% dialyzed fetal bovine serum and with either light (12C6-L-arginine and 12C6-L-lysine) or heavy (13C6,15N4-L-arginine and 13C6, 15N2-L-lysine (Cambridge Isotope Laboratories)) for 10 days. Chromatin fractions from both cells were prepared as previously described. Samples were eluted in 6 M Urea with 100mM carbonate and 1M Hydrochloric acid was used to neutralize the carbonate to pH8. The IP products from “light” and “heavy” labeled cells were combined together for mass spectrum analysis. The IP products were first reduced with 10 mM DTT and alkylated with 30 mM iodoacetamide. 50 mM phosphate pH 8.0 was used to dilute the 6M Urea to 1M, and then 1ug of trypsin was used to digest the sample. Peptides generated from the digestion were desalted using a 50mg Sep-Pak C18 cartridge, and fractionated using HILIC (Hydrophilic Interaction Liquid Chromatography) with a linear gradient from 19%–32% H2O with 0.01% TFA over 24 min on a TSKgel Amide-80 1 mm inner diameter column (TOSOH BioSci). The HILIC fractions were analyzed by LC-MS/MS on an LTQ XL-Orbitrap Discovery mass spectrometer (MS) with one full scan followed by 10 MS2 dependent scans. A Dionex UltiMate 3000 RSLC nano pump was used with a 70 min gradient from 12–33 % acetonitrile with 0.1% formic acid and a flow rate of 300 nl/min. MS data were searched on Sorcerer2-SEQUEST using the reviewed Swiss-Prot human database with the following static and variable modifications for the two IPs. The modifications for the SILAC IP were K 8.0142 (variable, heavy lysine), R 10.00827(variable, heavy arginine), M 15.994920 (static, oxidation), C 57.021465 (static, carbamidomethyl), and STY 79.963311(variable, phosphorylation). The Trans-Proteomic Pipeline V4.3 JETSTREAM rev1 was used to analyze the search result. A PeptideProphet of 0.8 was applied and the common contaminants were removed; the identified peptides were quantified using XPRESS and a minimal ion intensity of 1.0E3 was used to calculate the abundance ratio. At least three unique peptides were required for a protein or a protein complex to be identified as an PTEN binding protein, and the median abundance ratio for each identified protein was calculated and plotted.
Brain tumor intracranial models and IR treatment
All animal experiments were conducted according to protocols approved by University of California, San Diego’s Institutional Animal Care and Use Committee (IACUC). iRFP720-labelled HK281, GSC2 or TS528 cells were injected intracranially into immunodeficient mice, at coordinates 1 mm anterior and 2 mm lateral of the right hemisphere relative to the bregma, at a depth of 4 mm followed by 7–10 days of tumor establishment. Tumor burden was monitored using a three-dimensional (3D) fluorescence molecular tomographic imaging (FMT 2500, PerkinElmer). HK281 cells were first treated with or without 1 μM FGFR inhibitor PD173074 (Selleck Chemicals) prior to 5 Gy IR and were then engrafted into immunodeficient mice at 2.0×10⁵/3 μl PBS per mice. Tumor signal intensity was detected at day 12 for control group and day 20 for treatment group. Survival was monitored until all mice died. TS528 cells were injected at 2.5 ×10⁴/1μl PBS per mouse and GSC2 cells were injected at 5.0×10⁵/3 μl PBS per mice. At day 12 (TS528 cells) or day 18 (GSC2 cells), mice were administrated FGFR inhibitor AZD4547 (Selleck Chemicals) (50 mg/kg by gavage) or vehicle (DMSO) 2 hr or 4 hr before 2.5 Gy irradiation. This whole treatment process was repeated for 3 consecutive days (day 12–14). FMT signal was monitored starting at day 12 until the end of the experiment and percent of surviving mice over time was recorded.
Generation of Y240F-Pten knock-in mice
A BAC construct containing the mouse Pten was used as a genomic source to create a targeting vector. Briefly, a 5’ homology arm of exon 6 followed by exon 7 containing tyrosine 240 to phenylalanine mutation and a right homology arm containing exons 8 and 9 were inserted into targeting vector pKO scrambler V915 (Lexicon Genetics Inc., Woodland, TX) flanking a LoxP-pGK-Neo-LoxP selection cassette. The linearized targeting vector was electroporated into 129svEv ES cells and clones were screened by southern blot analysis for correct targeting into the Pten locus. Two correctly targeted ES cell clones were injected into blastocysts to generate chimeric mice in C57BL/6J. Mice with greater than 80% chimerism, as determined by agouti coat color, were bred with C57BL/6 mice and progeny were screened by southern blot to ascertain germline transmission. Heterozygous mice were bred with E2a-cre mice (Jackson Lab, #003314) to excise the pGK-Neo selection cassette and progeny were screened by PCR to confirm successful cre-mediated excision. Heterozygous mice lacking pGK-Neo were bred with FVB.129-Cdkn2atm1Rdp (Cdkn2a-null) mice (NCI repository, #01XB2) to generate Y240F-Pten KI/KI; Cdkn2a−/− mice.
Preparation of primary neurospheres from wild type or Y240F Pten knock-in mice
The isolation of neural stem cell cultures (neurospheres) were conducted using an established protocol (Ahlenius and Kokaia, 2010) with some modifications. E16.5 embryos from wild type and Y240F Pten knock-in mouse were collected in Ca2+-Mg2+-free Hanks’ balanced salt solution (Sigma). Tissue pieces were dissected from the subventricular zone (SVZ) of the brain and were dissociated by incubation with 0.15% trypsin/EDTA (Gibco). Dissociated cells were resuspended and maintained in stem cell culture medium. Visible neurospheres formed in approximately 4 days and were allowed to expand for an additional 7 days before being used in experiments.
In silico modeling and binding of pY240-PTEN to Ki-67
The computational studies of pY240-PTEN were based on the reference PDB entry 1D5R(Lee et al., 1999), which contains the phosphatase domain (PD) and the C2 domain, with a large missing loop (residues 281 to 313). In recent structures of PTEN, a larger fragment of this missing region is present (PDB entry: 5BZX), which allowed us to perform a partial reconstruction of PTEN286–309 with the modeller suite. The Ki-67 phosphatase-binding fragment was obtained from the PDB entry 5J28, which reports the complex formed between Ki-67496–536 and the phosphatase PP1γ. For Molecular Dynamics (MD) Simulations, the proteins were titrated, neutralized, hydrated, minimized, heated and equilibrated using standard protocols. The phosphorylation at tyrosine 240 was prepared with the Vienna-PTM server and modeled using the GROMOS force field for post-translational modifications. Water molecules and ions were added to achieve an ionic strength of 0.1 M. All bonds were constrained using the LINCS algorithm, and production runs were carried out with no restraints under the NPT ensemble with the GROMACS 5.0.6 simulation software. Analyses were performed with VMD and GROMACS utilities and in-house tools and scripts in python, C++ and FORTRAN. We performed short runs of native and pY240-PTEN to prepare the structures for blind and directed docking. The latest frame of the pY240-PTEN trajectory (Figure S4E), with an accessible phosphatase pocket, was used as a starting point for simulations with the Ki-67 peptide, which was placed randomly around the PTEN surface in three different orientations. In one of the trajectories Ki-67 docked spontaneously in the conserved binding pockets shared by PTEN and PP1γ, forming a stable complex. Ki-67 was also docked upon alignment of the structurally conserved pocket using the X-ray PP1γ complex as reference. The resulting pY240-PTEN-Ki-67 complex was also subject to simulations to evaluate its stability. The energies of the Ki-67 complexes with pY240-PTEN and PP1γ were evaluated with the webserver PRODIGY (PROtein binDIng enerGY prediction). Total simulated time was 5 microseconds (Table S5).
Quantification and Statistical Analysis
All statistical analyses, unless specified elsewhere, were performed using GraphPad Prism 6 software. The specific test used for each experiment to determine significance (* p<0.05) is indicated in the text of the results and/or figure legends. Data are representative of results obtained in at least 3 independent experiments.
For mass spectrum analysis, the MS raw files were processed by Sorcerer-SEQUEST using the reviewed Swiss-prot human database. The identified peptides were quantified using XPRESS and a minimal ion intensity of 1×10³ was used to calculate the abundance ratio.
Supplementary Material
Movie S1. Blind simulation of the interaction of Ki-67 and PTEN. Related to Figure 5. The latest frame of the pY240 PTEN trajectory was used as a starting point for blind docking simulations with the Ki-67 peptide (containing RVxF, ΦΦ and KiR-SLiM motifs), which was placed randomly around the PTEN surface in three different orientations. Ki-67 peptide (the smaller moving object above) spontaneously tumbled and docked with the hydrophobic pockets of PTEN (the bigger object below) forming a complex that remained stable in subsequent simulations
Key Resources Table
| REAGENT or RESOURCE | SOURCE | IDENTIFIER |
|---|---|---|
| Antibodies | ||
| pY240-PTEN mouse monoclonal antibody | This paper, by GeneScript | N/A |
| pY240-PTEN rabbit monoclonal antibody | This paper, by ABclonal | N/A |
| PTEN (N19) antibody | Santa Cruz Biotechnology | RRID: AB_654895 |
| PTEN (A2B1) antibody, | Santa Cruz Biotechnology | RRID: AB_628187 |
| Rabbit Anti-Human Ki-67 (H-300) Polyclonal | Santa Cruz Biotechnology | RRID: AB_2250495 |
| RAD51 (H-92) antibody | Santa Cruz Biotechnology | RRID: AB_2253533 |
| Bek (C-17) (FGFR2) antibody | Santa Cruz Biotechnology | RRID: AB_631509 |
| Ki-67 antibody (H300) | Santa Cruz Biotechnology | RRID: AB_2250495 |
| RPA 32 kDa subunit Antibody (H-100) | Santa Cruz Biotechnology | RRID: AB_2238546 |
| Histone H3 (D2B12) XP Rabbit mAb (ChIP Formulated) | Cell Signaling Technology | RRID: AB_1904005 |
| Tri-Methyl-Histone H3 (Lys9) Antibody | Cell Signaling Technology | RRID: AB_2561049 |
| Rabbit Anti-ATM Monoclonal Antibody, Clone D2E2 | Cell Signaling Technology | RRID: AB_2062659 |
| Lamin A/C Antibody | Cell Signaling Technology | RRID: AB_2136278 |
| Phospho-ATM (Ser1981) (D6H9) Rabbit mAb antibody | Cell Signaling Technology | RRID: AB_10835213 |
| Rabbit Anti-GAPDH Monoclonal Antibody | Cell Signaling Technology | RRID: AB_561053 |
| Phospho-ATR (Ser428) Antibody | Cell Signaling Technology | RRID: AB_10120986 |
| Anti-ATR Antibody | Cell Signaling Technology | RRID: AB_2227860 |
| Phospho-Chk2 (Thr68) (C13C1) Rabbit mAb antibody | Cell Signaling Technology | RRID: AB_2244927 |
| Chk2 (D9C6) XP Rabbit mAb antibody | Cell Signaling Technology | RRID: AB_11178526 |
| Rabbit Anti-pTubulin Monoclonal Antibody, Clone 9F3 | Cell Signaling Technology | RRID: AB_823664 |
| Nucleolin Antibody | Cell Signaling Technology | Cat # 12247 |
| Phospho-EGF Receptor (Tyr1068) | Cell Signaling Technology | RRID: AB_2096270 |
| EGF Receptor (D38B1) XP Rabbit mAb | Cell Signaling Technology | RRID: AB_2246311 |
| AKT Antibody | Cell Signaling Technology | RRID: AB_329827 |
| Phospho-AKT (Ser473) (193H12) Rabbit mAb | Cell Signaling Technology | RRID: AB_331168 |
| Phospho-p44/42 MAPK (Erk1/2) (Thr202/Tyr204) | Cell Signaling Technology | RRID: AB_331772 |
| Phospho-S6 Ribosomal Protein (Ser235/236) | Cell Signaling Technology | RRID: AB_916156 |
| SUMO-2/3 (18H8) Rabbit mAb antibody | Cell Signaling Technology | RRID: AB_2198425 |
| HDAC2 | Cell Signaling Technology | RRID: AB_2116822 |
| MEK1/2 | Cell Signaling Technology | RRID: AB_10829473 |
| Na/K ATPase antibody EP1845Y | Abcam | RRID: AB_1310695 |
| Monoclonal Anti-β-Actin-Peroxidase antibody | Sigma-Aldrich | RRID: AB_262011 |
| Vimentin | Sigma-Aldrich | RRID: AB_609914 |
| Anti-phospho-Histone H2A.X (Ser139), clone JBW301 | Millipore | RRID: AB_309864 |
| Anti-Phosphotyrosine, clone 4G10 | Millipore | RRID: AB_310776 |
| Monoclonal Anti-Human PTEN (clone 6H2.1) | Cascade Bioscience | Cat # ABM-2052 |
| mNeonGreen antibody (32F6) | ChromoTek GmbH | Cat # 32f6–100 |
| Bacterial and Virus Strains | ||
| Biological Samples | ||
| GBM patients sample sections | University of California, LA | |
| Chemicals, Peptides, and Recombinant Proteins | ||
| AZD4547 | Selleck Chemicals | Cat # S2801 |
| PD173074 | Selleck Chemicals | Cat # S1204 |
| Erlotinib | Selleck Chemicals | Cat# S1023 |
| Doxorubicin | Sigma-Aldrich | Cat# D1515 |
| Active, N-terminal, His6-tagged, recombinant, human FGFR2, amino acids 456–770 | Millipore | Cat # 14–617 |
| Active, N-Terminal His6-tagged, recombinant, full-length, human Src | Millipore | Cat # 14–326M |
| pGEX-4T3 GST-PTEN WT recombinant protein | By Dr. Tim R. Fenton | N/A |
| pGEX-4T3 GST-PTEN Y240 recombinant protein | By Dr. Tim R. Fenton | N/A |
| Peptide for pY240-PTEN mouse monoclonal antibody: CTRREDKFMpYFEFPQ | This paper | Custom synthesis by GenScript |
| Ki-67 WT peptide around KiR-SLIM: ELFDENLPPNTPLKRGEAPTK | This paper | Custom synthesis by ThermoFisherScientific |
| Ki-67 mutant peptide around KiR-SLIM: ELFRKNLPPNTPLDEGKAPTE | This paper | Custom synthesis by ThermoFisherScientific |
| Pulsin kit for peptide transfection | Polyplus-transfection | Cat # 501 −04 |
| Critical Commercial Assays | ||
| CometAssay Reagent kit | Trevigen | Cat # 4250–050-K |
| Subcellular Protein Fractionation Kit for Cultured Cells | ThermoFisher Scientific | Cat# 78840 |
| Deposited Data | ||
| Mass spectrum raw data | This paper | |
| Experimental Models: Cell Lines | ||
| U87 | ATCC | RRID: CVCL_0022 |
| HEK293T cell line | ATCC | RRID: CVCL_0063 |
| TS528 | Cameron Brennan | N/A |
| TS543 | Cameron Brennan | N/A |
| TS576 | Cameron Brennan | N/A |
| TS600 | Cameron Brennan | N/A |
| HK281 | University of California, LA | N/A |
| GSC11 | MD Anderson | N/A |
| GSC23 | MD Anderson | N/A |
| GBM6 | Northwestern University | N/A |
| GBM39 | Northwestern University | N/A |
| GBM1600 | Ludwig Institute | N/A |
| Experimental Models: Organisms/Strains | ||
| C57BL/6J mice | Jackson Laboratory | Cat # 000664 |
| E2a-cre mice | Jackson Laboratory | Cat # 003314 |
| FVB.129-Cdkn2atm1Rdp (Ink4aArf-null) mice | NCI repository | Cat # 01XB2 |
| NU/NU Nude Mouse | Charles River | Strain code: 088 |
| Biological Samples | ||
| Human GBM IHC slides | University of São Paulo | |
| Oligonucleotides | ||
| Silencer® Select Negative Control No. 1 siRNA | ThermoFisher Scientific | Cat # 4390843 |
| Silencer® Select siRNA MKI67 s54543 | ThermoFisher Scientific | Cat # 4392420 |
| Silencer® Select siRNA MKI67 s8797 | ThermoFisher Scientific | Cat # 4392420 |
| Genotyping primer 5’ CAGATCCTCAGTTTGTGGTCT | This paper | Custom synthesis by IDT |
| Genotyping primer 3’ CAGGTGAGTCTGCTTACATG | This paper | Custom synthesis by IDT |
| Recombinant DNA | ||
| pLV-EF1a-MCS-IRES-Puro plasmid | BioSettia | cDNA-pLV01 |
| Ki-67-mNeonGreen constructs (1–7) | Dr. Daniel W. Gerlich | N/A |
| Ki-67-mNeonGreen truncation 8 | This paper 485–565: 81aa | N/A |
| pLV-Flag-PTEN constructs | This paper | N/A |
| pLV-FGFR2 constructs | This paper | N/A |
| Software and Algorithms | ||
| ELDA analysis software | http://bioinf.wehi.edu.au/software/elda | |
| CometAssay software | Trevigen | |
| Swiss-prot human database | http://www.uniprot.org/ | |
| GraphPad Prism 6 | www.graphpad.com | |
| Other | ||
SIGNIFICANCE.
Although Ionizing radiation (IR) has been applied as standard of care treatment for GBM, therapeutic resistance remains a significant barrier for successful outcome. Understanding the underlying mechanisms of this resistance will aid in the development of improved therapeutic strategies. Here we show phosphorylation of PTEN at tyrosine 240 (pY240) promotes efficient DNA repair and tumor cells with detectable pY240-PTEN survive therapies that rely on generation of DNA damage. Blocking Y240 phosphorylation confers radiation sensitivity to tumors and extends survival in GBM preclinical models. We propose that pY240-PTEN status in tumors could predict IR response and strategies blocking this specific PTEN modification could sensitize tumors to IR and improve survival of patients with GBM and potentially other cancers.
HIGHLIGHTS.
Phosphorylation of PTEN at tyrosine 240 (pY240) by FGFR2 mediates IR resistance
pY240-PTEN plays a critical role in DNA damage repair
pY240-PTEN associates with chromatin DNA through interaction with Ki-67
Blocking pY240-PTEN using FGFR inhibitors sensitizes tumors to ionizing radiation
ACKNOWLEDGMENTS
We thank David James, Frederick Lang, Cameron Brennan, Paul Mischel and Harley Kornblum for GBM-PDX neurospheres. We thank Daniel Gerlich for providing Ki-67 constructs, David Shcherbakova and Vladislav Verkhusha for providing iRFP720 plasmid, Kevin Corbett, Andrew Shiau, Arshad Desai, Tomoyuki Koga, Amy Haseley Thorne, Nathan Jameson, Alison Parisian, and Afsheen Banisadr for helpful discussions and advice on figure layout, Beata Mierzwa for illustration of the graphical abstract.
Funding:
This work was supported by the Defeat GBM Research Collaborative, a subsidiary of the National Brain Tumor Society (F.F. J.D.), the James S. McDonnell Foundation (F.F), the National Institutes of Health (R01-NS080939 (F.F), R01-GM26017 (R.D.K.), 5R01-GM116897 (H.Z.), P50-CA127001 (E.P.S.), RO1-NS097649 (C.C.C)), PO1-HL107150 (N.V.), the Ludwig Institute for Cancer Research (F.F, H. Z., R.D.K, T.G., A.S.), the Doris Duke Charitable Foundation Clinical Scientist Development Award, The Sontag Foundation Distinguished Scientist Award, the Kimmel Scholar Award, and BWF 1006774.01 (C.C.C). L.O. was supported by the Lawski Foundation. The authors acknowledge the computational resources from Swedish National Infrastructure for Computing (SNIC 2016/34–40). Tissue Technology Shared Resource is supported by National Cancer Institute Cancer Center Support Grant (CCSG Grant P30CA23100)
Footnotes
Publisher's Disclaimer: This is a PDF file of an unedited manuscript that has been accepted for publication. As a service to our customers we are providing this early version of the manuscript. The manuscript will undergo copyediting, typesetting, and review of the resulting proof before it is published in its final citable form. Please note that during the production process errors may be discovered which could affect the content, and all legal disclaimers that apply to the journal pertain.
Data and Software Availability
Mass Spectrometry data have been deposited to UCSD MassIVE Repository, accessible through the link http://massive.ucsd.edu/ProteoSAFe with ID # PXD007212
DECLARATION OF INTERESTS
The authors declare no competing interests.
REFERENCES
- Ahlenius H, and Kokaia Z (2010). Isolation and generation of neurosphere cultures from embryonic and adult mouse brain. Methods Mol Biol 633, 241–252. [DOI] [PubMed] [Google Scholar]
- Bao S, Wu Q, McLendon RE, Hao Y, Shi Q, Hjelmeland AB, Dewhirst MW, Bigner DD, and Rich JN (2006). Glioma stem cells promote radioresistance by preferential activation of the DNA damage response. Nature 444, 756–760. [DOI] [PubMed] [Google Scholar]
- Bassi C, Ho J, Srikumar T, Dowling RJ, Gorrini C, Miller SJ, Mak TW, Neel BG, Raught B, and Stambolic V (2013). Nuclear PTEN controls DNA repair and sensitivity to genotoxic stress. Science 341, 395–399. [DOI] [PMC free article] [PubMed] [Google Scholar]
- Begg AC, Stewart FA, and Vens C (2011). Strategies to improve radiotherapy with targeted drugs. Nat Rev Cancer 11, 239–253. [DOI] [PubMed] [Google Scholar]
- Booth DG, Takagi M, Sanchez-Pulido L, Petfalski E, Vargiu G, Samejima K, Imamoto N, Ponting CP, Tollervey D, Earnshaw WC, and Vagnarelli P (2014). Ki-67 is a PP1-interacting protein that organises the mitotic chromosome periphery. Elife 3, e01641. [DOI] [PMC free article] [PubMed] [Google Scholar]
- Brodrick B, Vidrich A, Porter E, Bradley L, Buzan JM, and Cohn SM (2011). Fibroblast growth factor receptor-3 (FGFR-3) regulates expression of paneth cell lineage-specific genes in intestinal epithelial cells through both TCF4/beta-catenin-dependent and -independent signaling pathways. J Biol Chem 286, 18515–18525. [DOI] [PMC free article] [PubMed] [Google Scholar]
- Cancer Genome Atlas Research, N. (2008). Comprehensive genomic characterization defines human glioblastoma genes and core pathways. Nature 455, 1061–1068. [DOI] [PMC free article] [PubMed] [Google Scholar]
- Brown P, Pullan W, Yang Y, and Zhou Y (2016). Fast and accurate non-sequential protein structure alignment using a new asymmetric linear sum assignment heuristic. Bioinformatics 32, 370–377. [DOI] [PubMed] [Google Scholar]
- Certo MT, Ryu BY, Annis JE, Garibov M, Jarjour J, Rawlings DJ, and Scharenberg AM (2011). Tracking genome engineering outcome at individual DNA breakpoints. Nat Methods 8, 671–676. [DOI] [PMC free article] [PubMed] [Google Scholar]
- Chen H, Goodus MT, de Toledo SM, Azzam EI, Levison SW, and Souayah N (2015). Ionizing Radiation Perturbs Cell Cycle Progression of Neural Precursors in the Subventricular Zone Without Affecting Their Long-Term Self-Renewal. ASN Neuro 7. [DOI] [PMC free article] [PubMed] [Google Scholar]
- Chen ZH, Zhu M, Yang J, Liang H, He J, He S, Wang P, Kang X, McNutt MA, Yin Y, and Shen WH (2014). PTEN interacts with histone H1 and controls chromatin condensation. Cell Rep 8, 2003–2014. [DOI] [PMC free article] [PubMed] [Google Scholar]
- Cuylen S, Blaukopf C, Politi AZ, Muller-Reichert T, Neumann B, Poser I, Ellenberg J, Hyman AA, and Gerlich DW (2016). Ki-67 acts as a biological surfactant to disperse mitotic chromosomes. Nature 535, 308–312. [DOI] [PMC free article] [PubMed] [Google Scholar]
- Dahan P, Martinez Gala J, Delmas C, Monferran S, Malric L, Zentkowski D, Lubrano V, Toulas C, Cohen-Jonathan Moyal E, and Lemarie A (2014). Ionizing radiations sustain glioblastoma cell dedifferentiation to a stem-like phenotype through survivin: possible involvement in radioresistance. Cell Death Dis 5, e1543. [DOI] [PMC free article] [PubMed] [Google Scholar]
- Dittmann K, Mayer C, Fehrenbacher B, Schaller M, Kehlbach R, and Rodemann HP (2010). Nuclear EGFR shuttling induced by ionizing radiation is regulated by phosphorylation at residue Thr654. FEBS Lett 584, 3878–3884. [DOI] [PubMed] [Google Scholar]
- Dong R, Pan S, Peng Z, Zhang Y, and Yang J (2018). mTM-align: a server for fast protein structure database search and multiple protein structure alignment. Nucleic Acids Res 46, W380–W386. [DOI] [PMC free article] [PubMed] [Google Scholar]
- Durkin ME, Qian X, Popescu NC, and Lowy DR (2013). Isolation of Mouse Embryo Fibroblasts. Bio Protoc 3. [DOI] [PMC free article] [PubMed] [Google Scholar]
- Fenton TR, Nathanson D, Ponte de Albuquerque C, Kuga D, Iwanami A, Dang J, Yang H, Tanaka K, Oba-Shinjo SM, Uno M, et al. (2012). Resistance to EGF receptor inhibitors in glioblastoma mediated by phosphorylation of the PTEN tumor suppressor at tyrosine 240. Proc Natl Acad Sci USA 109, 14164–14169. [DOI] [PMC free article] [PubMed] [Google Scholar]
- Floyd SR, Pacold ME, Huang Q, Clarke SM, Lam FC, Cannell IG, Bryson BD, Rameseder J, Lee MJ, Blake EJ, et al. (2013). The bromodomain protein Brd4 insulates chromatin from DNA damage signalling. Nature 498, 246–250. [DOI] [PMC free article] [PubMed] [Google Scholar]
- Furnari FB, Fenton T, Bachoo RM, Mukasa A, Stommel JM, Stegh A, Hahn WC, Ligon KL, Louis DN, Brennan C, et al. (2007). Malignant astrocytic glioma: genetics, biology, and paths to treatment. Genes Dev 21, 2683–2710. [DOI] [PubMed] [Google Scholar]
- Furnari FB, Lin H, Huang HS, and Cavenee WK (1997). Growth suppression of glioma cells by PTEN requires a functional phosphatase catalytic domain. Proc Natl Acad Sci USA 94, 12479–12484. [DOI] [PMC free article] [PubMed] [Google Scholar]
- Gulston M, Fulford J, Jenner T, de Lara C, and O’Neill P (2002). Clustered DNA damage induced by gamma radiation in human fibroblasts (HF19), hamster (V79–4) cells and plasmid DNA is revealed as Fpg and Nth sensitive sites. Nucleic Acids Res 30, 3464–3472. [DOI] [PMC free article] [PubMed] [Google Scholar]
- Hu Y, and Smyth GK (2009). ELDA: extreme limiting dilution analysis for comparing depleted and enriched populations in stem cell and other assays. J Immunol Methods 347, 70–78. [DOI] [PubMed] [Google Scholar]
- Kang S, Dong S, Gu TL, Guo A, Cohen MS, Lonial S, Khoury HJ, Fabbro D, Gilliland DG, Bergsagel PL, et al. (2007). FGFR3 activates RSK2 to mediate hematopoietic transformation through tyrosine phosphorylation of RSK2 and activation of the MEK/ERK pathway. Cancer Cell 12, 201–214. [DOI] [PMC free article] [PubMed] [Google Scholar]
- Lee JO, Yang H, Georgescu MM, Di Cristofano A, Maehama T, Shi Y, Dixon JE, Pandolfi P, and Pavletich NP (1999). Crystal structure of the PTEN tumor suppressor: implications for its phosphoinositide phosphatase activity and membrane association. Cell 99, 323–334. [DOI] [PubMed] [Google Scholar]
- Leslie NR, Kriplani N, Hermida MA, Alvarez-Garcia V, and Wise HM (2016). The PTEN protein: cellular localization and post-translational regulation. Biochem Soc Trans 44, 273–278. [DOI] [PubMed] [Google Scholar]
- Li L, Wang H, Yang ES, Arteaga CL, and Xia F (2008). Erlotinib attenuates homologous recombinational repair of chromosomal breaks in human breast cancer cells. Cancer Res 68, 9141–9146. [DOI] [PMC free article] [PubMed] [Google Scholar]
- Mansour WY, Tennstedt P, Volquardsen J, Oing C, Kluth M, Hube-Magg C, Borgmann K, Simon R, Petersen C, Dikomey E, and Rothkamm K (2018). Loss of PTEN-assisted G2/M checkpoint impedes homologous recombination repair and enhances radio-curability and PARP inhibitor treatment response in prostate cancer. Sci Rep 8, 3947. [DOI] [PMC free article] [PubMed] [Google Scholar]
- Matsuda Y, Ueda J, and Ishiwata T (2012). Fibroblast growth factor receptor 2: expression, roles, and potential as a novel molecular target for colorectal cancer. Patholog Res Int 2012, 574768. [DOI] [PMC free article] [PubMed] [Google Scholar]
- McCabe N, Hanna C, Walker SM, Gonda D, Li J, Wikstrom K, Savage KI, Butterworth KT, Chen C, Harkin DP, et al. (2015). Mechanistic Rationale to Target PTEN-Deficient Tumor Cells with Inhibitors of the DNA Damage Response Kinase ATM. Cancer Res 75, 2159–2165. [DOI] [PubMed] [Google Scholar]
- Milella M, Falcone I, Conciatori F, Cesta Incani U, Del Curatolo A, Inzerilli N, Nuzzo CM, Vaccaro V, Vari S, Cognetti F, and Ciuffreda L (2015). PTEN: Multiple Functions in Human Malignant Tumors. Front Oncol 5, 24. [DOI] [PMC free article] [PubMed] [Google Scholar]
- Mohammadi M, Dikic I, Sorokin A, Burgess WH, Jaye M, and Schlessinger J (1996). Identification of six novel autophosphorylation sites on fibroblast growth factor receptor 1 and elucidation of their importance in receptor activation and signal transduction. Mol Cell Biol 16, 977–989. [DOI] [PMC free article] [PubMed] [Google Scholar]
- Myers MP, Stolarov JP, Eng C, Li J, Wang SI, Wigler MH, Parsons R, and Tonks NK (1997). PTEN, the tumor suppressor from human chromosome 10q23, is a dual-specificity phosphatase. Proc Natl Acad Sci USA 94, 9052–9057. [DOI] [PMC free article] [PubMed] [Google Scholar]
- Nguyen MN, Tan KP, and Madhusudhan MS (2011). CLICK--topology-independent comparison of biomolecular 3D structures. Nucleic Acids Res 39, W24–28. [DOI] [PMC free article] [PubMed] [Google Scholar]
- Ong SE, Blagoev B, Kratchmarova I, Kristensen DB, Steen H, Pandey A, and Mann M (2002). Stable isotope labeling by amino acids in cell culture, SILAC, as a simple and accurate approach to expression proteomics. Mol Cell Proteomics 1, 376–386. [DOI] [PubMed] [Google Scholar]
- Price BD, and D’Andrea AD (2013). Chromatin remodeling at DNA double-strand breaks. Cell 152, 1344–1354. [DOI] [PMC free article] [PubMed] [Google Scholar]
- Revishchin AV, Korochkin LI, Okhotin VE, and Pavlova GV (2008). Neural stem cells in the mammalian brain. Int Rev Cytol 265, 55–109. [DOI] [PubMed] [Google Scholar]
- Shen WH, Balajee AS, Wang J, Wu H, Eng C, Pandolfi PP, and Yin Y (2007). Essential role for nuclear PTEN in maintaining chromosomal integrity. Cell 128, 157–170. [DOI] [PubMed] [Google Scholar]
- Singh D, Chan JM, Zoppoli P, Niola F, Sullivan R, Castano A, Liu EM, Reichel J, Porrati P, Pellegatta S, et al. (2012). Transforming fusions of FGFR and TACC genes in human glioblastoma. Science 337, 1231–1235. [DOI] [PMC free article] [PubMed] [Google Scholar]
- Sobecki M, Mrouj K, Camasses A, Parisis N, Nicolas E, Lleres D, Gerbe F, Prieto S, Krasinska L, David A, et al. (2016). The cell proliferation antigen Ki-67 organises heterochromatin. Elife 5, e13722. [DOI] [PMC free article] [PubMed] [Google Scholar]
- Soria G, Polo SE, and Almouzni G (2012). Prime, repair, restore: the active role of chromatin in the DNA damage response. Mol Cell 46, 722–734. [DOI] [PubMed] [Google Scholar]
- Wang S, Ma J, Peng J, and Xu J (2013). Protein structure alignment beyond spatial proximity. Sci Rep 3, 1448. [DOI] [PMC free article] [PubMed] [Google Scholar]
- Wang X, and Jiang X (2008). Post-translational regulation of PTEN. Oncogene 27, 5454–5463. [DOI] [PubMed] [Google Scholar]
- Yoshida K, and Miki Y (2005). Enabling death by the Abl tyrosine kinase: mechanisms for nuclear shuttling of c-Abl in response to DNA damage. Cell Cycle 4, 777–779. [DOI] [PubMed] [Google Scholar]
Associated Data
This section collects any data citations, data availability statements, or supplementary materials included in this article.
Supplementary Materials
Movie S1. Blind simulation of the interaction of Ki-67 and PTEN. Related to Figure 5. The latest frame of the pY240 PTEN trajectory was used as a starting point for blind docking simulations with the Ki-67 peptide (containing RVxF, ΦΦ and KiR-SLiM motifs), which was placed randomly around the PTEN surface in three different orientations. Ki-67 peptide (the smaller moving object above) spontaneously tumbled and docked with the hydrophobic pockets of PTEN (the bigger object below) forming a complex that remained stable in subsequent simulations