

Abstract
The adoptive transfer of chimeric antigen receptor (CAR)-modified T cells has produced tumor responses even in patients with refractory diseases. However, the paucity of antigens that are tumor selective has resulted, on occasion, in “on-target, off-tumor” toxicities. To address this issue, we developed an approach to render T cells responsive to an expression pattern present exclusively at the tumor by using a trio of novel chimeric receptors. Using pancreatic cancer as a model, we demonstrate how T cells engineered with receptors that recognize PSCA, TGFβ, and IL4, and whose endodomains recapitulate physiologic T cell signaling by providing signals for activation, co-stimulation and cytokine support, produce potent anti-tumor effects selectively at the tumor site. In addition, this strategy has the benefit of rendering our cells resistant to otherwise immunosuppressive cytokines (TGFβ and IL4) and can be readily extended to other inhibitory molecules present at the tumor site (e.g. PD-L1, IL10, IL13).
Keywords: Chimeric antigen receptor, custom inverted receptors, T cell therapy, genetic engineering, pancreatic cancer
Introduction
Recent advances in T cell engineering, particularly with chimeric antigen receptors (CARs), have demonstrated the therapeutic potential of adoptively transferred T cells, which are able to recognize and kill tumor targets. However, few antigens are absolutely tumor specific, resulting in “on-target, off-tumor” toxicities. This phenomenon is particularly problematic when using later generation CARs whose co-stimulatory endodomains induce local T cell proliferation and persistence. These undesirable effects may be tolerable, for example when targeting a restricted antigen such as CD19, which is expressed on malignant and normal B cells and results in B cell aplasia (1, 2). However, with other targets [e.g. carbonic anhydrase IX (CAIX) (3) and human epidermal growth factor receptor 2 (HER2) (4)], the side effects can be life-threatening. Hence, CAR T cell therapy would be more broadly applicable if the infused cells could more reliably discriminate between normal and malignant tissue.
A number of strategies have been explored to enhance the tumor selectivity of transgenic T cells. For example, Sadelain and colleagues developed a cooperative model whereby signals for T cell activation and co-stimulation were split between two different CARs co-expressed on the same cell to promote anti-tumor effects only upon dual target engagement (5). Roybal and colleagues developed an inducible system based on a synthetic Notch (synNotch) receptor circuit, whereby engagement with one tumor antigen induced expression of a second CAR resulting in potent T cell activation only in the presence of both targets (6). While both of these strategies seek to regulate when transgenic T cells get switched “on” Fedorov et al have explored an approach to turn T cells “off” at sites other than the tumor by pairing a stimulatory (tumor-directed) CAR with an inhibitory CAR (iCAR) directed to normal tissue in order to limit T cell activation outside of the tumor (7).
We have extended the concept of pattern recognition by conferring engineered T cells with the ability to recognize not just tumor-expressed antigen(s) but rather an expression pattern that is unique to the tumor site. We have used Boolean “AND” operator logic and modified our cells with 3 individual receptors capable of recognizing independent signals [prostate stem cell antigen (PSCA), transforming growth factor β (TGFβ) and interleukin 4 (IL4)] present at the pancreatic tumor site and transmitting signals for activation (signal 1), co-stimulation (signal 2) and cytokine support (signal 3). We now show the enhanced potency and increased tumor selectivity and safety of these tumor-specific molecular-pattern activated and regulated T-cells (SmarT-cells) in vitro and in vivo.
Results
Targeting a tumor-specific molecular signature using genetically engineered T cells
To selectively target pancreatic cancer we first identified a genetic pattern exclusive to the tumor site. This included the tumor-associated antigen (TAA) PSCA (8), and the immunoinhibitory cytokines TGFβ (9) and IL4 (10) (Supplementary Fig. S1), all of which have been independently correlated with disease progression (11–13). To harness these ligands in a manner that would maximize tumor selectivity we generated 3 retroviral vectors, each specific for one of the targets, and whose endodomains delivered independent intracellular signals [signal 1 - activation (TCR ζ chain); signal 2 - co-stimulation (41BB); signal 3 - cytokine (IL7)] to transgenic T cells (Figure 1A-C, top panel).
Figure 1. Synthetic T cell receptors to recognize the pancreatic tumor environment and deliver signals recreating a native T cell response.
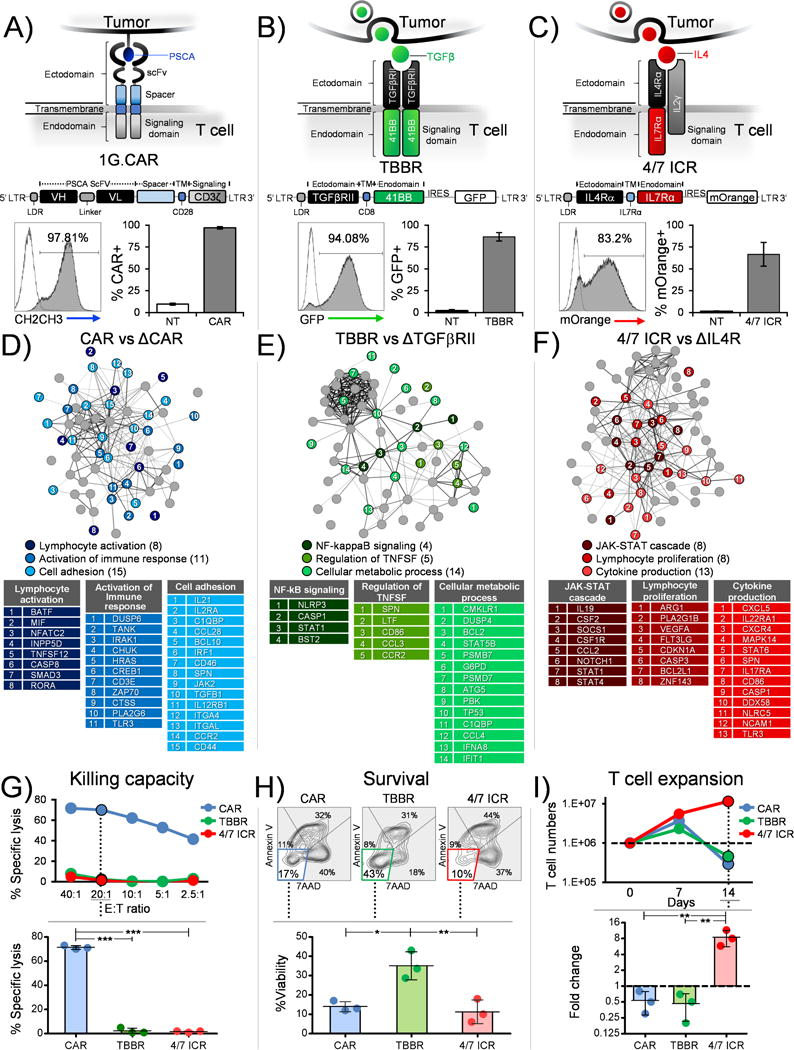
Schematic representation (top panel), retroviral vector map (middle panel) and transduction efficiency (bottom panel) (representative donor and mean±SEM, n=4) of (a) First generation CAR designed to recognize PSCA (1G.CAR), (b) TBBR to utilize TGFβ cytokine and (c) 4/7 ICR to harness IL4 cytokine. Function associated signaling networks (n=3 independent donors) derived from (d) CAR vs ΔCAR T cells stimulated with PSCA (e) TBBR vs ΔTGFβRII modified T cells stimulated with OKT3 and TGFβ (f) 4/7 ICR vs ΔIL4R stimulated with OKT3 and IL4. All tables in panels d-f list genes that are significantly different (p<0.05). The genes have been grouped and assigned colors based on their associated functions determined using the string db analysis tool. The genes within a group (or table) have been further ordered and assigned a rank based on magnitude of fold change from highest to lowest (listed in Supplementary Table 1, 2 and 3). (g) Representative donor showing % specific lysis of CAR, TBBR or 4/7 ICR modified T cells in a chromium release assay against CAPAN-1 (PSCA+ target cell line) (top panel). Summary data for 3 donors comparing killing capacity between CAR, TBBR or 4/7 ICR modified T cells at 20:1 (Effector:Target ratio) (bottom panel, mean±SD, n=3). (h) Representative FACs plots for Annexin V/7AAD staining of CAR, TBBR or 4/7 ICR modified T cells assessed 5 days after exposure to OKT3 and TGFβ in the absence of any other cytokine added exogenously to the culture conditions (top panel). %Viability (Annexin V-/7AAD-) summarized from three independent donors (bottom panel, mean±SD, n=3). (i) Representative T cell expansion profile of transgenic cells expressing CAR, TBBR or 4/7 ICR stimulated with OKT3 and IL4 (top panel). Fold change assessed from three independent donors on day 14 (bottom panel, mean±SD, n=3). Statistical significance in panel g, h and i was determined using one-way ANOVA (*p < 0.05; **p < 0.01; ***p < 0.001; ****p < 0.0001).
To deliver signal 1 to T cells we utilized a humanized, codon-optimized, first generation CAR (1G.CAR) targeting PSCA that could be stably expressed on the surface of activated T cells (Figure 1A, bottom panel – representative donor; mean 97±1%). Interaction of CAR T cells with their cognate antigen, PSCA, induced a gene expression profile consistent with TCR-ζ chain signaling in transgenic T cells with upregulation of genes (IRAK1, DUSP6, TANK, CHUK/IKKα, IL2Rα and IL21) synonymous with pathways associated with lymphocyte and immune response activation as well as cell adhesion [CAR vs control (ΔCAR) T cells] (Figure 1D and Supplementary Table S1) (14–17). Next, to provide signal 2 (co-stimulation) we designed a hybrid cytokine receptor, “TBBR”, by fusing the TGFβ receptor II (TGFβRII) exodomain with the endodomain of 41BB, a member of the tumor necrosis factor (TNF) receptor superfamily whose signaling in T cells prevents apoptosis, ameliorates exhaustion and enhances persistence. Consistent with this profile, transgenic expression of TBBR on T cells (Figure 1B, bottom panel – representative donor; mean 87±5%) and exposure to TGFβ resulted in upregulation of prototypic genes associated with 41BB signaling including BCL2, NLRP3, DUSP4, which regulate the NF-kB and TNF superfamilies, and downregulation of pro-apoptotic and glycolytic pathway-associated genes including TP53, CCL4 and G6PD (TBBR vs ΔTBBR), (Figure 1E, Supplementary Table S2) (18–21). Finally, to deliver signal 3 to T cells we generated an inverted cytokine receptor (ICR) containing the IL4R exodomain fused to the IL7R endodomain (4/7 ICR) (Figure 1C, bottom panel – representative donor; mean 67±14%). As expected, exposure to IL4 increased expression of STAT5a/b target genes, including SOCS1, BCL2L1, CXCR4, CCL2 and CDKN1A, which are characteristic of the IL7 receptor signaling pathway and downregulation of STAT1, STAT6 and NOTCH1 in 4/7 ICR transgenic T cells (Figure 1F, Supplementary Table S3) (22–28).
Next, to determine whether independent T cell inputs could stimulate their cognate receptors and deliver unique benefits based on their signaling endodomains, we evaluated the cytolytic function (chromium release assay), viability (Annexin/7AAD staining) and expansion (cell counting by trypan blue exclusion) of CAR-, TBBR- and 4/7 ICR-modified T cells (Figure 1G-I). As expected, only T cells expressing the CAR could kill CAPAN-1, a PSCA-expressing pancreatic tumor cell line (71±2% specific lysis - CAR vs 2±2% - TBBR vs 2±0.5% - 4/7ICR, 20:1 E:T ratio) (Figure 1G). Similarly, the transgenic TBBR switch receptor was able to harness TGFβ to provide a co-stimulatory signal, resulting in increased cell viability (14±3% annexin-/7AAD- cells - CAR, 35±7% - TBBR and 11±6% - 4/7ICR, day 5, Figure 1H) while forced expression of 4/7 ICR improved the proliferative capacity of transgenic cells exposed to IL4 (0.5±0.3 fold change in cell numbers - CAR, 0.5±0.3 - TBBR and 9±3 - 4/7ICR, day 14 vs day 0) (Figure 1I) (Figure 1G-I contains representative donor and summary data - top and bottom panels, respectively). In summary, therefore, independent expression of CAR, TBBR and 4/7 ICR allows T cells to engage with a tumor molecular pattern (PSCA, TGFβ, IL4) and activate signals for tumor recognition (signal 1), T cell survival (signal 2) and T cell proliferation (signal 3).
Co-expression of CAR, TBBR and 4/7 ICR results in T cell expansion, persistence and tumor lysis
To discover whether co-expressing the 3 transgenic receptors could be additive and result in superior performance at the tumor site (Figure 2A) we transduced T cells with CAR, TBBR and 4/7 ICR to generate SmarT-cells (Figure 2B - 72% triple positive cells, representative donor; mean 61±5%). To confirm that each of the receptors signaled appropriately we evaluated the genetic profile of SmarT-cells in conditions that recapitulated the tumor microenvironment (PSCA, TGFβ, and IL4). As shown in Figure 2C, prototypic signatures associated with CAR (IL2Rα, TANK, CHUK/IKKα, and IL21), TBBR (BCL2, DUSP4, G6PD) and 4/7 ICR (CCL2, SOCS1, CDKN1A, BCL2L1) signaling were conserved in the SmarT-cells when compared to control T cells modified to express delta constructs (Supplementary Table S4). In addition, the functionality of the individual receptors was retained enabling SmarT-cells to recognize and kill PSCA+ targets (68±2% specific lysis, 20:1 E:T ratio), as well as survive and expand in a TGFβ- and IL4-rich milieu, respectively (29±1% annexin-/7AAD- cells, day 5, and 55±5 fold change in cell numbers between days 0 and 14, respectively) (representative donors – left panel and summary data – right panel, Figure 2D).
Figure 2. SmarT-cells function and expand robustly in conditions mimicking the pancreatic tumor milieu.
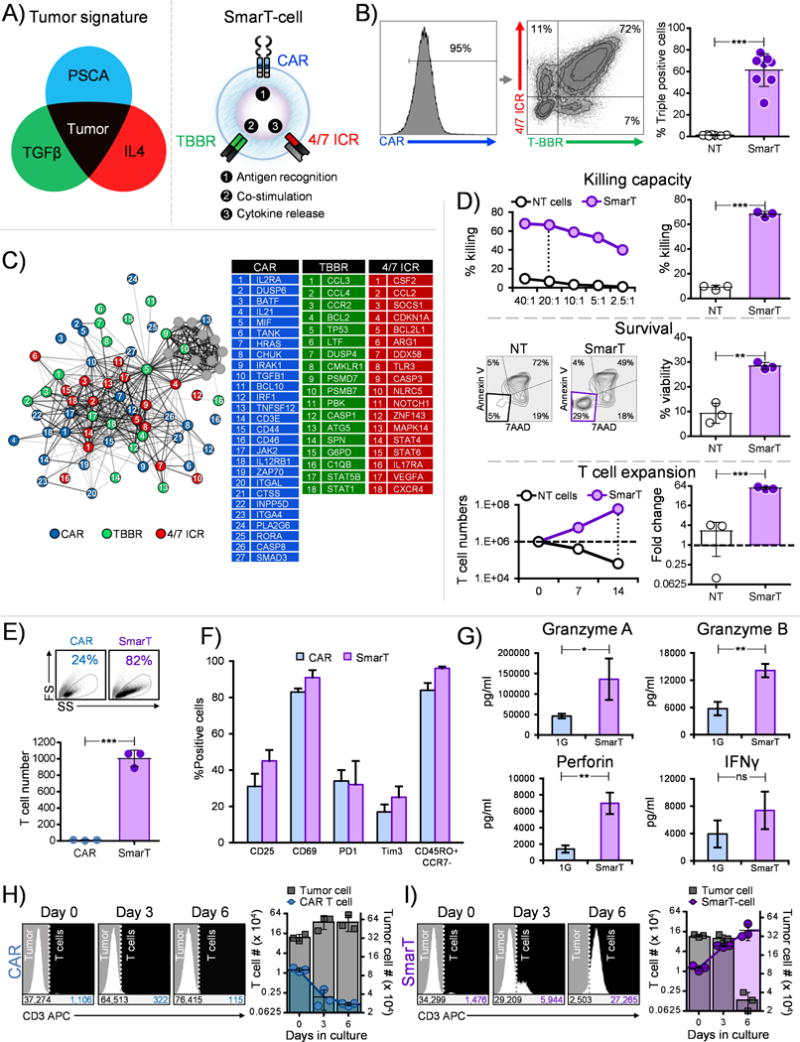
(a) Graphical depiction of SmarT-cells engineered to respond to a pancreatic tumor-specific signature (b) Representative donor and mean transduction efficiency of T cells modified to express CAR, TBBR and 4/7 ICR (mean±SEM, n=8). (c) Genetic networks derived from SmarT-cells compared to T cells modified to express ΔCAR, ΔTGFβRII and ΔIL4R stimulated with PSCA, TGFβ and IL4 (p<0.05, n=3). (d) Cytolytic function (top panel), viability (middle panel) and proliferative capacity (bottom panel) of SmarT-cells compared to non-transduced T cells (NT) stimulated with PSCA or TGFβ or IL4, respectively (representative donors – left panels and summary data - right panels) (mean±SD, n=3). (e) Representative donor depicting forward scatter (FS) vs side scatter (SS) (top panel) and summary data for fold change in T cell number from three independent donors (bottom panel, mean±SD, n=3) and (f) Phenotype profile of 1G.CAR (expressing CD3β endodomain) and SmarT-cells assessed on day 28 after exposure to weekly stimulation with antigen, IL4 and TGFβ (mean±SD, n=3). (g) Cytokine profile of 1G.CAR vs SmarT-cells evaluated on day 21 from supernatant collected 24 hours after stimulation with antigen, IL4 and TGFβ (mean±SD, n=3). (h,i) Co-culture of T cells with tumor cells (1:25 - E:T ratio) distinguished by CD3 staining on day 0, 3 and 6. T cell and tumor numbers were determined using counting beads. Panel (h) shows co-culture results for 1G.CAR T cells and panel (i) for SmarT-cells (n=3, mean±SD). Statistical significance in panel b, d, e and g was determined by performing a student’s two-tailed t-test (*p < 0.05; **p < 0.01; ***p < 0.001; ****p < 0.0001).
To assess the consequences of exposing traditional CAR (expressing CD3ζ endodomain) and SmarT-cells to tumor mimicking conditions we next compared the RNA expression profile of transgenic cells following exposure to antigen, TGFβ, and IL4 (Supplementary Fig. S2). CAR T cells exposed to the suppressive tumor milieu upregulated genes associated with the native TGFβ (SMAD2, RUNX1, EGR2, PLAU) and IL4R pathways (BCL6, CCR4, PRKCD, CCL1) (26, 29–33). In contrast, SmarT-cells displayed a reciprocal gene expression pattern with decreased expression of the same native TGFβ and IL4R target genes, and upregulation of genes that are characteristic of 41BB and IL7R signaling pathways including BCL2, CCL2 and CDKN1A (Supplementary Fig. S2 and Supplementary Table S5) (18, 25, 26). Consistent with this profile, CAR T cells failed to expand in presence of PSCA, TGFβ, and IL4 unlike SmarT-cells that thrive in tumor mimicking conditions (fold change 9±4 vs 1005±101 - CAR vs SmarT-cells, day 28, respectively, Figure 2E), and although no differences were observed in the activation, exhaustion and memory profile between CAR T cells vs SmarT-cells (representative forward scatter (FS) vs side scatter (SS) plot, top panel, Figure 2E) [CD25 (31±7% vs 45±6%), CD69 (83±2% vs 91±4%), PD1 (34±6% vs 32±13%), Tim3 (17±4% vs 25±6%), CD45RO+/CCR7- (84±4% vs 96±1%); CAR vs SmarT-cells, day 28, Figure 2F], the triple-modified T cells secreted higher levels of effector cytokines as shown in Figure 2G (Granzyme A- 46,224±5,619 vs 136,075±50,492 pg/mL, Granzyme B- 5,732±1,489 vs 14,121±1,450 pg/mL, Perforin- 1,399±440 vs 6,968±1,297 pg/mL, IFNγ- 3,945±1,984 vs 7,393±2,738 pg/mL, CAR vs SmarT-cells, day 21). Subsequently, when co-cultured with target cells producing TGFβ and IL4 (79±4 ng/mL and 32±3 ng/mL, respectively, Supplementary Fig. S6) at a 1:25 ratio (E:T), SmarT-cells expanded significantly (17±4×10⁴ on day 6) when compared to CAR T cells alone (0.1±0.004×10⁴ − day 6). This improved SmarT-cell expansion resulted in an enhanced anti-tumor effect (57±7×10⁴ vs 3±0.4×10⁴ tumor cells in the CAR vs SmarT-cell condition, respectively on day 6) (Figure 2H, I – representative donor and summary results).
Safety profile of SmarT-cells
Having confirmed the short-term (6 day) effector activity of SmarT-cells, we next evaluated the behavior of each transgenic sub-population [single (CAR only), dual (CAR.TBBR and CAR.4/7 ICR) and triple transgenic T cells – Figure 3A] after long-term (35 days) exposure to tumor milieu conditions. As shown for a representative donor in Figure 3B and detailed for 3 donors in Figure 3C, exposure to the tumor expression pattern positively selected for triple-transgenic SmarT-cells while cells that lacked expression of any one of the transgenes did not persist. This positive selection occurred rapidly, with a substantial enrichment of SmarT-cells by day 14 [CAR only - 2±2% transgenic cells, 0.1±0.01×10⁶ absolute cell numbers; CAR.TBBR - 4±1%, 0.4±0.1×10⁶; CAR.4/7 ICR - 6±2%, 0.5±0.2×10⁶; SmarT-cells - 88±4%, 8±3×10⁶] (Figure 3D). Next, to assess whether this enrichment produced a T cell population capable of antigen- or cytokine-independent growth we next exposed the selected SmarT-cells to each of the independent input signals (signal 1 - PSCA antigen; signal 2 - TGFβ; signal 3 - IL4). As shown in Figure 3E, the presence of antigen alone or either cytokine alone was insufficient to promote the growth of these selected transgenic T cells, highlighting their dependence on all 3 input signals [fold change during week 4 of T cell expansion - 0±0 (PSCA), 0±0 (TGFβ), 0.7±0.2 (IL4) and 7.3±0.4 (PSCA+TGFβ+IL4)]. Of note, transgenic subsets expressing (i) TBBR only (ii) 4/7 ICR only (iii) TBBR.4/7 ICR that lack CAR expression (i.e. absence of signal 1) were also unable to expand as shown in Supplementary Fig. S3.
Figure 3. Selective enrichment and safety profile of SmarT-cells.
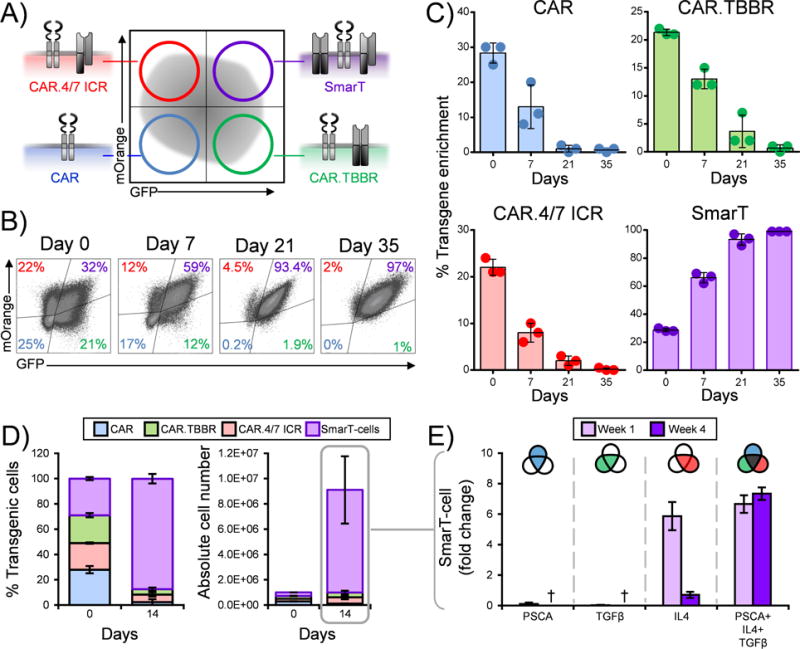
Panel (a) shows a schematic of the transgenic sub-populations present after SmarT-cell transduction on day 0. (b) Representative donor for the selective enrichment process assessed from day 0 to day 35 of triple-modified T cells stimulated weekly with PSCA, TGFβ and IL4. (c) Average percent of each transgenic sub-population after exposure to tumor milieu conditions (mean±SD, n=3). (d) Percent enrichment and absolute numbers of transgenic subsets on day 0 vs day 14 (mean±SD, n=3). (e) Proliferative capacity of SmarT-cells (week1 vs week 4) in presence of antigen and/or cytokine assessed by trypan blue exclusion (mean±SD, n=3). † denotes absence of T cells during week 4 for the conditions indicated.
SmarT-cell mechanism of action
Having evaluated the pattern recognition, function and safety profile of SmarT-cells we next analyzed the basis for the cells’ superior antitumor activity. We compared the expansion profile of SmarT-cells maintained under standard Th1 culture conditions (weekly antigen + IL2) to those in which all 3 transgenic receptors were activated (weekly antigen + TGFβ + IL4). As shown in Figure 4A, B, activation of all 3 transgenic receptors resulted in a growth pattern and activation/memory profile that was similar to the cells maintained in standard IL2 culture conditions (238±32 vs 363±95 fold change, day 35 vs day 0) [CD25 (33±12% vs 38±11%), CD69 (73±2% vs 86±2%), PD1 (20±2% vs 27±11%), Tim3 (32±17% vs 56±16%), CD45RO+/CCR7- (94±1% vs 95±2%); tumor milieu vs IL2 conditions]. However, transgenic receptor signaling in SmarT-cells did produce an increase in CD4+ T cell content (40±14% vs 1±1%, PSCA+TGFβ+IL4 vs PSCA+IL2, respectively, p<0.05), which were negative for regulatory T cell markers, assessed by CD4/CD25/FoxP3 staining (Figure 4C-F).
Figure 4. SmarT-cells maintain CD4+ and CD8+ T cell content in presence of pancreatic tumor signature.
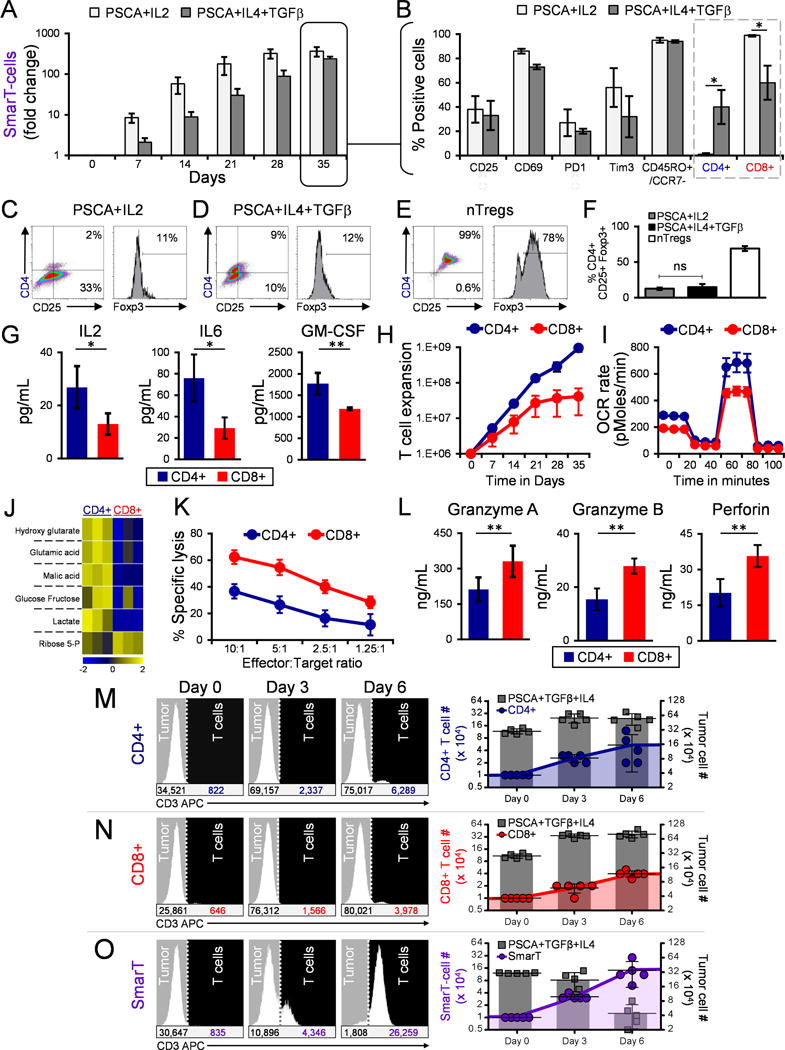
(a) Expansion and (b) phenotype profile (on day 35) of SmarT-cells cultured in PSCA, TGFβ and IL4 compared to standard IL2 condition (mean±SEM, n=3-4). (c,d) CD4/CD25/Foxp3 staining of SmarT-cells cultured in PSCA, TGFβ and IL4 compared to IL2 on day 25. (e) CD4/CD25/Foxp3 staining of freshly isolated naturally occurring Tregs (nTregs) expanded ex vivo to serve as a control. (f) Graph representing %CD4+/CD25+/Foxp3+ SmarT-cells cultured PSCA/TGFβ\IL4 vs IL2 (mean±SEM, n=5), and nTregs (mean±SD, n=2). (g) Cytokine production (h) Proliferative capacity, (i) Mitochondrial function, (j) Metabolomic profile (k) Killing capacity and (l) Effector molecule secretion from sorted CD4+ and CD8+ SmarT-cells assessed on day 10 after culture in tumor milieu conditions (mean±SD, n=3-4). (m-o) Representative histogram plots of sorted CD4+, CD8+ or bulk SmarT-cells co-cultured with PSCA, TGFβ and IL4 expressing targets and analyzed following CD3 staining (left panel). Graphs representing total T cell and tumor numbers calculated using counting beads, and assessed from five independent co-culture experiments (mean±SEM) (right panel). Statistical analysis for panels b, f, g and l was performed using a student’s two-tailed t-test (*p < 0.05; **p < 0.01; ***p < 0.001; ****p < 0.0001, ns = not significant).
To understand the contribution of both CD4+ and CD8+ SmarT-cells in mediating tumor control, we positively selected each subpopulation using magnetic selection and separately evaluated their cytokine profile using luminex array. Figure 4G shows that both cell subsets produced effector cytokines including IL2, IL6 and GM-CSF but CD4+ cells produced >50% more than their CD8 counterparts, resulting in superior T cell expansion when cultured in tumor milieu conditions (day 0 – 1×10⁶ cells; day 35 – 9.5±2×10⁸ vs 4.1±3×10⁷, CD4+ vs CD8+ T cells) (Figure 4H). However, we did not observe any difference in IFN-γ and TNF-α levels as shown in Supplementary Fig. S4. In addition, CD4+ SmarT-cells also exhibited increased mitochondrial function (Figure 4I) with elevated levels of Krebs cycle and glycolytic pathway metabolites compared to their CD8 counterparts (Figure 4J). In contrast, CD8+ SmarT-cells produced higher levels of effector molecules associated with cell killing (Granzyme A, Granzyme B, Perforin) and exhibited superior cytotoxic activity in vitro (Figure 4K and 4L). However, the combination of both cell subsets was required for optimal anti-tumor effects, as either alone was insufficient to mediate tumor control [CD4+ (5±2×10⁴), CD8+ (4±0.4×10⁴) and SmarT-cells (14±4×10⁴), T cell numbers on day 6, 1:40 E:T ratio] (Figure 4M-O).
SmarT-cells exhibit selective and superior anti-tumor activity in vivo
To assess the in vivo potential and tumor selectivity of SmarT-cells, we generated a dual tumor animal model. On the left flank NSG mice were engrafted sub-cutaneously (s.c.) with cells that just expressed PSCA to mimic normal tissue (5×10⁶ CAPAN-1 PSCA) while on the right flank the same animals were engrafted with tumor cells expressing PSCA, TGFβ and IL4 to recapitulate the signature present at the pancreatic tumor (5×10⁶ CAPAN-1 PSCA/TGFβ/IL4) (Figure 5A). Upon tumor engraftment, mice were injected with 5×10⁶ SmarT-cells labeled with firefly luciferase (FFluc+). By day 18, we observed a significant expansion (1.5±0.4E+09 photons/sec, T cell bioluminescence signal on day 18) of SmarT-cells (both CD4+ and CD8+ - Supplementary Fig. S5) on the right flank where the cells expressed PSCA, TGFβ and IL4. In contrast, on the left side where only PSCA was expressed, SmarT-cells failed to expand (0.04±0.01E+09 photons/sec, day 18) (p=0.0002) (Figures 5B-D). Consequently, the preferential expansion of SmarT-cells resulted in selective elimination of PSCA+TGFβ+IL4 expressing tumors (tumor volume 0±0 vs 616±34 mm3, PSCA+TGFβ+IL4 vs PSCA only by day 33) (Figure 5E and 5F). Importantly, upon tumor elimination the T cell numbers rapidly contracted demonstrating the requirement for antigen and both cytokines to sustain T cell expansion – an important safety feature of this approach (Figure 5G-H).
Figure 5. Superior and specific anti-tumor responses exhibited by SmarT-cells.
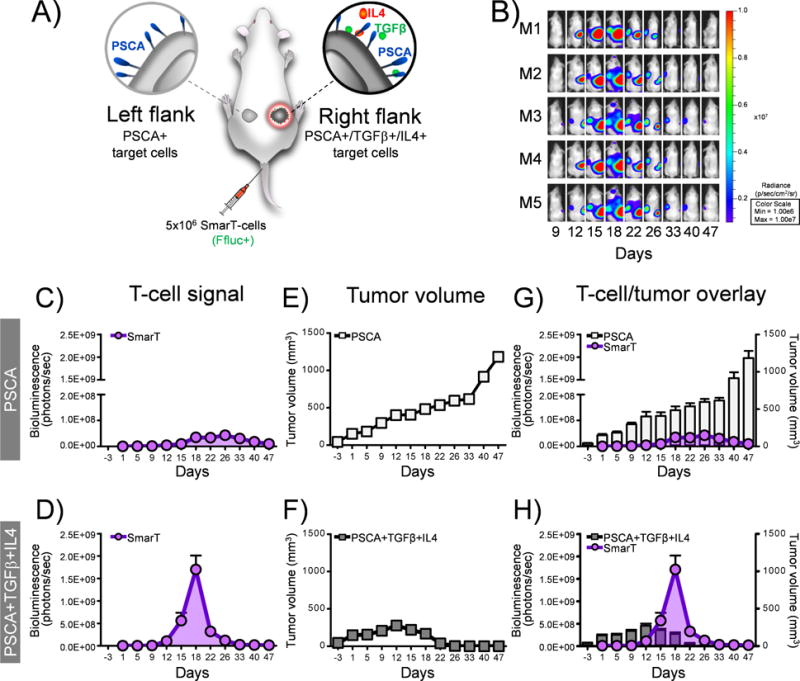
(a) Schematic of animal model where NSG mice were engrafted with dual tumors – CAPAN-1 PSCA only (left flank) and CAPAN-1 PSCA+TGFβ+IL4+ (right flank), and treated with SmarT-cells labeled with firefly luciferase (FFluc+). (b) Representative mice images and (c,d) quantification of SmarT-cell signal detected by bioluminescence imaging (n=5-6 replicates per experiment with a maximum SEM of 0.01E+09 and 0.4E+09 photons/sec in the PSCA and PSCA+IL4+TGFβ groups on day 18, respectively. However, the error bars cannot be appreciated in panel c). (e,f) Anti-tumor responses determined by calipers to assess tumor volume (Although the maximum error bars for the PSCA and PSCA+IL4+TGFβ groups are 96 and 29 mm3 on day 47 and day 12, respectively, they cannot be appreciated in panel e,f). (g,h) Superimposition of SmarT-cell signal against tumor volume. Data represents mean±SEM (n=5-6 mice per group).
To evaluate the in vivo recall response of SmarT-cells we established a tumor rechallenge model in which NSG mice were first engrafted s.c. with 5×10⁶ tumor cells expressing PSCA, TGFβ and IL4, and treated intravenously with 2×10⁶ SmarT-cells (FFLuc+). As expected, by day 30 all animals treated with SmarT-cells had experienced a complete response, coinciding with the expansion and subsequent contraction of transgenic T cells (Figure 6A). To next determine if we could recall this T cell expansion in a tumor selective manner we took these tumor-free animals and re-engrafted them with 5×10⁶ PSCA only (left shoulder) or tumor milieu cells (PSCA+IL4+TGFβ – right shoulder). Rechallenge induced SmarT-cell re-expansion but only at the site engrafted with tumor cells expressing PSCA, IL4, TGFβ, thereby effectively controlling tumor growth (Figure 6B). Taken together these data demonstrate the persistence, proliferative capacity, potency and selectivity of SmarT-cells.
Figure 6. SmarT-cells remain selective even upon secondary tumor rechallenge.
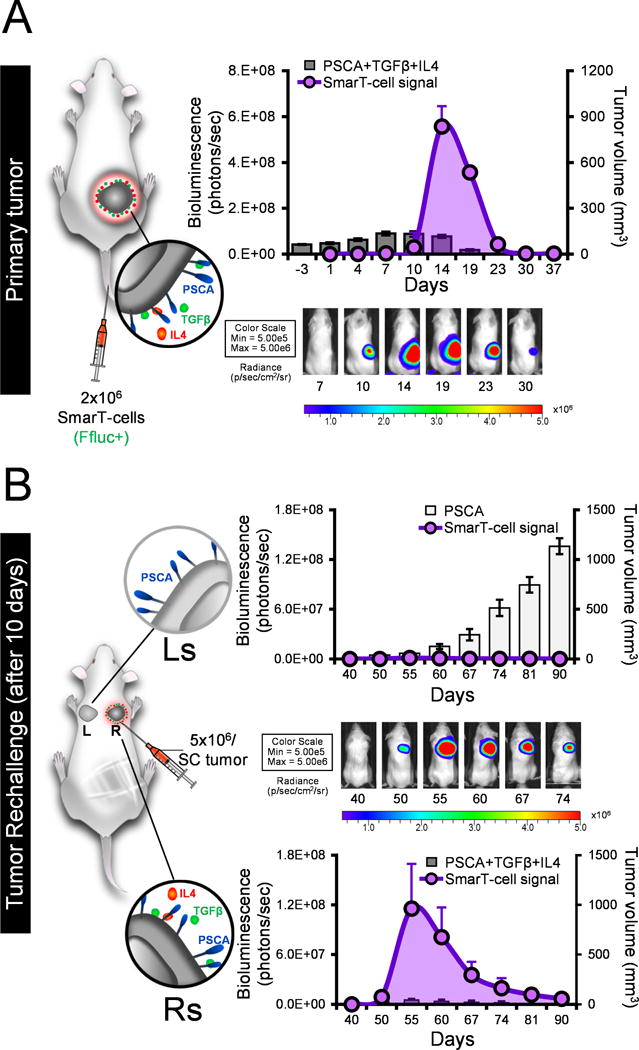
Panel (a) shows a schematic and representative image of NSG mice engrafted with 5×10⁶ CAPAN1 PSCA+TGFβ+IL4 (right flank) and treated with FFluc+ SmarT-cells. Overlay of SmarT-cell signal detected by bioluminescence imaging and tumor volume using calipers (mean±SEM, n=7) (b) Schematic and representative image of tumor rechallenge model – mice engrafted with targets expressing antigen only (left shoulder, Ls) and pancreatic tumor signature (right shoulder, Rs). Superimposition of SmarT-cell signal against tumor volume for targets expressing PSCA only (top panel) or PSCA/TGFβ/IL4 (bottom panel).
Discussion
In the current study we demonstrate how T cells can be engineered to recognize a pattern present exclusively at the tumor using independent chimeric molecules that coalesce to be fully functional in the tumor microenvironment. Using pancreatic cancer as a model system we successfully engineered T cells with receptors that (i) recognized three tumor-derived input signals (PSCA, TGFβ, IL4) present in combination at the pancreatic tumor site and (ii) were equipped with intracellular signaling domains responsible for T cell activation (signal 1), co-stimulation (signal 2) and cytokine support (signal 3). This proof of concept study demonstrates how receptor engineering can not only enhance the function but also the safety of transgenic T cells at the immunosuppressive tumor microenvironment by limiting their maximal activity exclusively to the tumor site, thereby reducing concerns related to on-target off-tumor effects.
The adoptive transfer of CAR-modified T cells has effectively treated CD19+ hematological malignancies including multiple subtypes of B-cell lymphoma, B cell chronic lymphocytic leukemia (B-CLL) and acute lymphoblastic leukemia (ALL) (2, 34, 35), resulting in the recent FDA approval of CAR-CD19 therapy - Kymriah™ (tisagenlecleucel) and Yescarta™ (axicabtagene ciloleucel) for the treatment of pediatric ALL and adult relapsed/refractory large B-cell lymphoma, respectively. However, successful extension of CAR therapy to solid tumors has proven challenging, mainly due to the immunosuppressive tumor microenvironment that impairs the effector function, proliferative capacity and in vivo persistence of the infused T cells. To overcome this barrier, several strategies have been employed to allow transgenic T cells to better withstand the inhibitory milieu. These include the incorporation of co-stimulatory endodomains within CARs (e.g. CD28, 4-1BB and OX40) (1, 2, 34–36) or by the combination of CARs with transgenic immune stimulatory cytokines (e.g. IL7, IL15, and IL12) (37–39) or novel transgenic molecules designed to blunt (e.g. dominant negative TGFβ receptors) (40) or invert immunosuppressive tumor-derived signals (e.g. PD-L1 or IL4) (41–43). Our approach extends beyond this latter strategy by programming T cells to recognize a pattern exclusive to the tumor using a trio of receptors that bind to an antigen on the tumor but also invert the effects of immunologically suppressive molecules into signals that are immunostimulatory and recapitulate physiological T cell signaling.
One of the major challenges in the field of engineered T cells has been balancing potency with safety, given that most tumor-expressed antigens are not exclusively present on malignant cells. Thus, the interaction of transgenic T cells with normal tissue expressing the target antigen has led to “on-target, off-tumor” toxicities ranging from tolerable [e.g. lifelong B cell aplasia in patients treated with T cells expressing anti-CD19 CAR (1, 2)] to severe [e.g. fatalities following the infusion of Her2 CAR T cells attributed to cytokine release syndrome (4)]. These toxicities are currently managed either by non-specific strategies that suppress all T cells (e.g. administration of high-dose corticosteroids), with side-effects including enhanced susceptibility to infections, to the activation of suicide genes (e.g. HSV-Tk, iCaspase-9, CD20 monoclonal antibody, EGFR antibody), which selectively target and kill transgenic T cells (44). However, in both cases the therapeutic potential of the infused cells is lost, which has prompted the development of next generation engineering approaches designed to promote T cell activation selectively at the tumor site while sparing normal tissues.
To achieve this goal T cells have been programmed to become active only after two independent receptors, whose signaling is complementary, have interacted with distinct antigens expressed by tumor cells. Roybal and colleagues demonstrated the feasibility of this approach by harnessing the notch signaling pathway using either mesothelin and CD19 or GFP and CD19 antigens as model targets (6), while other groups have split CD3 and CD28/41BB signals between tumor-directed CARs to target breast (Muc1 and Her2 CARs (45)) or prostate cancer (PSMA and PSCA (5)). Finally, Fedorov et al sought to restrict the activity of transgenic cells to the tumor site using healthy tissue antigen-specific inhibitory CARs (iCAR) expressing PD1- or CTLA-4 endodomains in order to render transgenic T cells inactive outside of the tumor site (7). In general, though, the risk of tumor immune escape due to antigen loss when using a dual antigen targeted approach limits the potential effectiveness of this strategy. Thus, rather than incorporate additional antigenic targeting, we have chosen to render our T cells responsive to nominally immunosuppressive soluble factors produced by both the tumor and stroma (IL4 and TGFβ) that contribute to tumor growth and survival, thereby minimizing the risk of a mutational event leading to immune evasion. In addition, our inverted cytokine and co-stimulatory receptors not only restrict transgenic T cell activity to the tumor site, but also render our cells resistant to immunosuppressive molecules that would otherwise adversely affect transgenic T cell effector function and persistence. Although in this work we have focused our efforts on cytokines that are present at elevated levels in pancreatic cancer, this strategy can be customized to harness other components of the tumor milieu including PD-L1, LAG-3, IL10, IL13 and VEGF depending on the immunosuppressive profile of the target tumor (46). Furthermore, these customized inverted cytokine receptors can be coupled with other CARs to prevent tumor escape by negative antigen selection.
T cell activation, proliferation, and persistence requires the presence of a synchronized combination of 3 signals [antigen recognition (signal 1), co-stimulation (signal 2), and cytokine (signal 3)] delivered upon engagement with independent ligands, which results in target recognition, expansion of both CD4+ and CD8+ T cell subsets, and the establishment of long-term memory. However, absence of any one of these signals substantially impairs long-term native T cell function – a phenomenon that was recapitulated in the initial clinical trials of first generation CAR T cells (containing only the CD3z endodomain), which displayed limited expansion and persistence (35, 47, 48). A number of groups subsequently explored the incorporation of additional costimulatory moieties in tandem with the CAR to produce later generation iterations. Although effective, this approach has produced variable therapeutic efficacy in patients – a feature some have attributed to the inconsistent nature of the product infused, which is often dominated by CD8+ T cells that display limited persistence (absent CD4+ “help”), resulting in diminished long-term potency (39, 49, 50). Indeed, to standardize product composition, Turtle et al established a protocol to separately propagate both CD4+ and CD8+ subsets in vitro, which were subsequently mixed at a 1:1 ratio prior to clinical use and reported superior outcomes in patients with non-Hodgkin’s lymphoma and B-ALL (49, 50). Consistent with this clinical finding we also demonstrate that a mix of both CD4+ and CD8+ SmarT-cells is required for tumor elimination in vitro and in vivo. However, in our studies we “naturally” achieve the optimal cell balance by recapitulating physiologic T cell signaling in our transgenic cells using a trio of receptors, whose engagement with their respective ligands results in an orchestrated signaling cascade producing immediate T cell activation and long-term persistence.
In the current study, we have used genetic reprogramming to enable T cells to discriminate tumor from healthy tissue, thereby increasing both the specificity and potency of these transgenic cells. Furthermore, expression of the inverted cytokine and co-stimulatory receptors both protected the T cells from the immunosuppressive tumor milieu and ensured that they received all 3 signals (activation, co-stimulation, cytokine support) required for in vivo amplification, anti-tumor activity and long term persistence of polyclonal effector T cells. Importantly, transgenic cells remained dependent on the presence of tumor antigen, and rapidly contracted upon tumor elimination, confirming the safety of this approach. While this proof-of-concept study will require refinements prior to clinical application, this strategy can be readily extended to other immunotherapeutic modalities, such as αβ TCRs and tumor-specific T cells with native receptor specificity.
Methods
Donors and cell lines
Peripheral blood mononuclear cells (PBMCs) were derived from healthy donors and patients after informed and written consent on protocols approved by the Institutional Review Board (IRB) at Baylor College of Medicine (H-15152 and H-28601, respectively) conducted in accordance with the Declaration of Helsinki, the Belmont Report, and U.S. Common Rule. All cell lines (obtained between 2012-2013) - K562 (chronic erythroid leukemia cell line), 293T (human embryonic kidney cell line) and CAPAN-1 (pancreatic cancer cell line), were obtained from the American Type Culture Collection (Rockville, MD) and cultured at 37°C in a humidified incubator containing 5% carbon dioxide (CO2). K562 cells were maintained in RPMI-1640 media (Hyclone Laboratories, Logan, UT), whereas 293T and CAPAN-1 were cultured in Iscove’s modified Dulbecco’s medium (IMDM) media (Gibco by Life Technologies Corporation, Grand Island, NY). Media for maintaining the cell lines were supplemented with 10% heat-inactivated fetal bovine serum (FBS) (Hyclone Laboratories) and 2 mmol/L-glutaMAX (Gibco by Life Technologies Corporation). All cell lines were authenticated by the University of Arizona Genetics Core using Short Tandem Repeat (STR) profiling (last tested and confirmed in November 2017). The cell lines were also routinely tested for mycoplasma every 6 months using the MycoAlert Mycoplasma Detection kit (Lonza, Walkersville, ME) and all results were negative.
Generation of γ-retroviral constructs and retrovirus production
The first generation CAR was generated by synthesizing cDNA of a codon-optimized single chain variable fragment (scFv) of PSCA followed by a spacer (IgG2-derived hinge and CH3 domain), transmembrane (CD28 TM) and CD3ζ chain of the T cell receptor (TCR) complex (42). The TBBR construct was generated by synthesizing a DNA construct containing the signal peptide and extracellular domain of TGFβRII linked to the 41BB endodomain (sequence obtained from Uniprot, Q07011). The TBBR construct was cloned into a vector expressing IRES-GFP to serve as a surrogate marker. The 4/7 ICR construct was synthesized by fusing the signal peptide and extracellular domain of the IL4R with the transmembrane and intracellular component of the IL7R followed by an IRES-mOrange tag as described previously (26, 42). All constructs were cloned into SFG retroviral vectors and transfected using 293T cells to generate retroviral supernatant as previously described (26, 42).
T cell transduction
To generate genetically modified T cells, 1×10⁶ PBMCs isolated from donor blood using Lymphoprep (Axis-Shield PoC AS, Oslo, Norway) were plated in 24-well non-tissue culture-treated plates coated with OKT3 (1 mg/mL) (Ortho Biotech, Bridgewater, NJ) and CD28 antibodies (1 mg/mL) (Becton Dickinson, Mountain View, CA). Cells were cultured in complete media - RPMI containing 45% Clicks medium (Irvine Scientific, Santa Ana, CA), 10% FBS, and 2 mmol/L-glutaMAX supplemented with 50 U/mL of recombinant human interleukin 2 (IL2) (National Institutes of Health, Bethesda MD) on day 1. For transduction, 1 mL of retroviral supernatant was plated in a 24-well non-tissue culture-treated plate pre-coated with recombinant fibronectin fragment (FN CH-296; Retronectin; Takara Bio Inc., Otsu, Japan). The plates were centrifuged at 2000g for 90 minutes. Next, OKT3/CD28 activated T cells (0.2×10⁶/mL) resuspended in 2 mL of complete media supplemented with IL2 (100 U/mL) were added to the wells and centrifuged at 400g for 5 minutes. The transduced cells were transferred to a 37°C, 5% CO2 incubator and were subsequently split and fed with fresh media containing IL2 (50 U/mL) every 2-3 days. To generate SmarT-cells, T cells were transduced with 1 mL of CAR, TBBR and 4/7 ICR supernatant combined on day 3. Transduction efficiency was measured on day 3 by flow cytometry and all functional experiments were set up within 7-10 days post-transduction.
Oncomine data analysis
The analysis and visualization of the gene expression pattern of PSCA (8), TGFβ (9) and IL4 (10) was confirmed using the Oncomine microarray database (http://www.oncomine.org).
Gene expression analysis
T cells were sorted 5 days post transduction using a SH800S cell sorter (SONY Biotechnology) to normalize for the mean fluorescence intensity (MFI) between transgenic T cells and respective controls. RNA was isolated at 24 hours post-stimulation from (i) 1G.CAR cells exposed to PSCA antigen (0.5 μg/mL) (ii) TBBR and 4/7 ICR T cells first stimulated with OKT3 (0.5 μg/mL) and then exposed to TGFβ (5 ng/mL) and IL4 (400 U/mL) respectively after 3 days and (iii) SmarT-cells stimulated with PSCA (0.5 μg/mL), TGFβ (5 ng/mL) and IL4 (400 U/mL). As controls, we generated T cells modified to express ΔCAR, ΔTGFβRII and ΔIL4R - truncated versions of the transgenic modifications that lack endodomains. RNA isolation was performed using the RNeasy mini plus kit (QIAGEN) and hybridized to the nCounter PanCancer immune profiling panel (human codeset). RCC files containing raw counts for 770 genes provided from nanostring were loaded into nSolver Analysis Software 3.0 and normalized for housekeeping genes and positive controls. Normalized data was exported and read into Java code (run in Eclipse IDE) to extract lists of differentially expressed genes (DEGs) that were significant (p<0.05) which was determined by performing a heteroscedastic two-tailed t-test that assumes unequal variance on the log transformed normalized data. The top 50 DEGs were mapped onto STRING v.10.5 Homo sapiens, which clusters genes into networks based on scored interactions, associations, and pathway knowledge drawn from databases such as KEGG, Gene Ontology and text-mined from literature. Three enriched GO functions were selected and uploaded to STRING to produce the functional association networks where the network edges were based on a minimum interaction confidence of 0.4, a maximum of 10 interactors shown first shell, and the selected interaction sources were: textmining, experiments, databases, co-expression, neighborhood, gene fusion, and co-occurrence. The genes within each functional group were assigned a specific color and further ranked based on the magnitude of fold change from highest to lowest (fold change and p-value listed in Supplementary Table 1, 2, 3 and 4). Established structured repositories for the nanostring data are available through Gene Expression Omnibus (GEO). The accession numbers for the datasets are GSE113387, GSE113388, GSE113389, GSE113390 and GSE113391.
Generation of CAPAN-1 cell line expressing PSCA, TGFβ and IL4
PSCA-GFP retroviral supernatant (1 mL) was plated in 24-well non-tissue culture-treated plates pre-coated with retronectin and centrifuged at 2000g for 90 minutes. CAPAN-1 cells (0.2×10⁶/mL in IMDM) were added to each well and transferred to a 37°C, 5% CO2 incubator. Transduction efficiency was measured by flow cytometry within one week and the cells were sorted after two weeks. The sorted CAPAN-1 PSCA cells were further transduced with IL4 cytokine-IRES-mOrange and TGFβ-IRES-ΔCD19 retroviral constructs and sorted to generate CAPAN-1 PSCA/TGFβ/IL4 producing cell line.
T cell expansion assay
One million transgenic T cells were stimulated weekly with 1×10⁶ irradiated CAPAN-1 PSCA supplemented with IL4 (400 U/mL, 3x weekly) and TGFβ (5 ng/mL, 1x weekly), or IL2 (50 U/mL, 3x weekly). T cell expansion was quantified weekly by trypan blue exclusion using a hemocytometer.
Chromium release assay
As described previously, the specificity and killing capacity of the modified T cells was assessed using CAPAN-1, a PSCA positive cell line in a standard 4-6 hr 51Cr-release assay (42).
Co-culture experiments
T cells were co-cultured with 0.5×10⁶ CAPAN-1 PSCA/TGFβ/IL4 producing cell line at the specified effector:target ratio in 4 mL complete media in a 6-well plate. The cells were harvested every 3 days, labeled with CD3 APC, CD4 Krome Orange and CD8 Pacific blue antibodies (Beckman Coulter) and quantified by flow cytometer using CountBrightTM Absolute Counting Beads (approximately 0.2×10⁵ beads/20 μL added to each condition) (Invitrogen, Eugene, OR) and 5 μL of 7-AAD (BD Biosciences) to exclude dead cells. Total tumor and T cell numbers were back calculated from the viable cell numbers obtained by terminating acquisition at 2,000 beads.
Flow cytometry
For flow cytometry analysis, cells were collected, washed and stained with antibodies for 30 mins at 4°C in the dark. The cells were incubated with monoclonal antibodies against CD4 Krome Orange (Beckman Coulter), CD8 Pacific Blue (Beckman Coulter), CD25 PE Cy5 (BD Biosciences), CD69 ECD (Beckman Coulter), CD27 PE Cy7 (BD Biosciences), CD28 PE Cy5 (BD Biosciences), CD45RO PE Cy7 (BD Biosciences), CCR7 Alexa Flour 700 (BD Biosciences), PD1 PE Cy7 (BD Biosciences), Tim3 PerCP Cy 5.5 (Biolegend), and LAG3 APC (R&D Systems). To detect CAR expression, cells were labeled with F(ab’)2 fragment Goat anti-human IgG (H+L) antibody conjugated with AlexaFluor647 (Jackson ImmunoResearch Laboratories, Inc., West Grove, PA). TBBR transgene expression was detected using anti-human TGFβRII antibody (Abcam) further labeled with rat anti-mouse APC (BD Biosciences), and was corroborated with the GFP surrogate marker. Similarly, 4/7 ICR expression was confirmed by labeling cells with anti-human IL4Rα-APC antibody (R&D systems) to detect IL4R expression and correlated with the mOrange surrogate marker. Routine analysis of TBBR and 4/7 ICR-modified T cells, however, was performed by monitoring expression levels of the GFP and mOrange markers, respectively. All cells were washed prior to data acquisition on a Gallios flow cytometer and analyzed using Kaluza software (Beckman Coulter, Brea, CA). To assess cell viability, the transgenic cells were stained as per manufacturer’s protocol using the Annexin V Apoptosis Detection Kit (BD Biosciences). For measuring Foxp3 expression, cells were first stained with cell surface markers (CD4+/CD25+) followed by intracellular cytokine staining using the anti-human Foxp3 staining set (eBioscience).
CD4-CD8 isolation
The CD4+ T cell fraction was isolated by labeling cells with CD4 microbeads that were passed through an LD column as per manufacturer’s instructions (Miltenyi Biotech). CD4+ fraction was further selected using an LS column to increase the purity. To obtain pure CD8+ T cells, the negative fraction collected from the previous step was labeled with CD8 microbeads and passed through an LS column.
Metabolism assays
To measure mitochondrial function using the sea horse assay, sorted CD4+ and CD8+ SmarT-cells stimulated with irradiated CAPAN-1 target cells (1:1 ratio) in the presence of TGFβ and IL4 for 10 days were plated on XF24 cell culture microplates (XF24 FluxPak mini) pre-coated with Cell Tak (Corning) and calibrated as per manufacturer’s instructions. During instrument calibration, 5×10⁵ T cells resuspended in 100 μL of XF assay medium containing 5.5 mM glucose, 2 mM L-glutamine and 1 mM sodium pyruvate were added to each well and centrifuged at 200 ×g for 1 minute. After 20 min incubation in a 37°C non-CO2 incubator, 400uL supplemented media was added to each well. Oxygen consumption rate (OCR) was measured using an extracellular flux analyzer (Seahorse Bioscience) at basal levels and following treatment with 1 μM oligomycin, 1 μM FCCP, and 1 μM rotenone/antimycin A (XF Cell Mito Stress kit). The metabolomic profile of sorted CD4+ and CD8+ SmarT-cells was assessed by submitting pelleted samples (5×10⁶cells) to the Metabolomics core at the Baylor College of Medicine for analysis of 16 Fatty acid and 12 TCA cycle metabolites.
Cytokine measurement
Cytokine levels were measured from sorted CD4+ and CD8+ SmarT-cells cultured with irradiated CAPAN-1 target cells (1:1 ratio) in the presence of TGFβ and IL4 for 10 days. Luminex assay was performed on supernatant collected 24 hours post-stimulation PSCA, TGFβ and IL4 using the human CD8+ T-cell magnetic bead panel as per manufacturer’s instruction (HCD8MAG15K17PMX, EMD Millipore).
In vivo study
Four-to-five-week-old female NSG mice (NOD.Cg-Prkdcscid Il2rgtm1Wjl/ SzJ, stock number: 005557, Jackson Laboratory) were engrafted sub-cutaneously with 5×10⁶ CAPAN-1 PSCA (left flank) or CAPAN-1 PSCA/IL4/TGFβ (right flank) cells for the dual tumor animal model. When the tumor volume reached approximately 80 mm3, the mice were administered with 5×10⁶ SmarT-cells labeled with GFP-firefly luciferase (FFluc) intravenously. Tumor volume was measured using calipers (Tumor volume (mm3) = length × width × width/2), while T cell bioluminescence signal was monitored by injecting mice intraperitoneally with 100 μL of luciferin (15 mg/mL) followed by imaging using the IVIS Lumina In Vivo Imaging system (Caliper Life Sciences). For tumor rechallenge, mice were first engrafted subcutaneously with 5×10⁶ CAPAN-1 PSCA/TGFβ/IL4 cells and injected with 2×10⁶ SmarT-cells (FFluc+). Upon tumor elimination, the mice were rechallenged with 5×10⁶ CAPAN-1 PSCA cells on the left shoulder and CAPAN-1 PSCA/IL4/TGFβ cells on the right shoulder. Data analysis was performed using Living Image software. All in vivo experiments were performed according to Baylor College of Medicine Animal Husbandry guidelines.
Statistics
Statistical analysis was performed using GraphPad Prism 5 software (GraphPad Software, Inc., La Jolla, CA). For comparison between two groups, significance was determined using a Student’s two-tailed t-test. Data comparing three or more groups were analyzed using one-way ANOVA with Bonferroni’s multiple comparisons test. For microarray data, nSolver analysis software was used to obtain differentially expressed genes that were statistically significant (p<0.05) by performing a two-tailed t-test that assumes unequal variance (heteroscedastic test) on the log-transformed normalized data.
Supplementary Material
Statement of Significance.
This proof of concept study demonstrates how sophisticated engineering approaches can be utilized to enhance both the anti-tumor efficacy and increase the safety profile of transgenic T cells by incorporating a combination of receptors that ensure that cells are active exclusively at the tumor site.
Acknowledgments
This work was supported by grants from the NIH-NCI (P01 CA094237, P50 CA126752, P50 CA186784), Pancreatic Cancer Action Network Translational Research Grant (16-65-LEEN), the V Foundation for Cancer Research (T2016-006), the Elsa U. Pardee Foundation, the National Pancreas Foundation as well as the Adrienne Helis Malvin Medical Research Foundation in collaboration with Baylor College of Medicine. J.F.V. is supported by a Mentored Research Scholars Grants in Applied and Clinical Research (MRSG-14-197-01–LIB) from the American Cancer Society. The authors acknowledge the editorial assistance provided by Catherine Gillespie as well as Walter Mejia for helping with the artwork and formatting of figures and tables for the manuscript. The authors would also like to thank Texas Children’s Hospital for the use of the Small Animal Imaging Facility, the Mouse Metabolism and Phenotyping core (NIH UM1HG006348 and NIH 1R01DK114356), the Metabolomics core supported by the CPRIT Core Facility Award (RP120092) and P30 Cancer Center Support Grant (NCI-CA125123), and the support of the Flow Cytometry and Cell and Vector Production shared resources in the Dan L Duncan Comprehensive Cancer Center.
Financial Support: M.K.B., A.M.L., and J.F.V. are supported by P50 CA126752 and P50 CA186784. W.E.F., M.K.B., A.M.L., and J.F.V. are supported by P01 CA094237. W.E.F. and A.M.L’s research is supported by the 2016 Pancreatic Cancer Action Network Translational Research Grant (16-65-LEEN) and The V Foundation for Cancer Research (T2016-006). J.F.V. is supported by a Mentored Research Scholars Grants in Applied and Clinical Research (MRSG-14-197-01–LIB) from the American Cancer Society. N.W. J.F.V were supported by the Elsa U. Pardee Foundation. The National Pancreas Foundation provided support to S.S., N.W., and A.M.L.
Footnotes
Conflicts of Interest: S.S., A.M.L., and J.F.V have filed a related patent application (US20170246278A1).
References
- 1.Kalos M, Levine BL, Porter DL, Katz S, Grupp SA, Bagg A, et al. T cells with chimeric antigen receptors have potent antitumor effects and can establish memory in patients with advanced leukemia. Science translational medicine. 2011 Aug 10;3(95):95ra73. doi: 10.1126/scitranslmed.3002842. [DOI] [PMC free article] [PubMed] [Google Scholar]
- 2.Porter DL, Levine BL, Kalos M, Bagg A, June CH. Chimeric antigen receptor-modified T cells in chronic lymphoid leukemia. The New England journal of medicine. 2011 Aug 25;365(8):725–33. doi: 10.1056/NEJMoa1103849. [DOI] [PMC free article] [PubMed] [Google Scholar]
- 3.Lamers CH, Sleijfer S, van Steenbergen S, van Elzakker P, van Krimpen B, Groot C, et al. Treatment of metastatic renal cell carcinoma with CAIX CAR-engineered T cells: clinical evaluation and management of on-target toxicity. Molecular therapy : the journal of the American Society of Gene Therapy. 2013 Apr;21(4):904–12. doi: 10.1038/mt.2013.17. [DOI] [PMC free article] [PubMed] [Google Scholar]
- 4.Morgan RA, Yang JC, Kitano M, Dudley ME, Laurencot CM, Rosenberg SA. Case report of a serious adverse event following the administration of T cells transduced with a chimeric antigen receptor recognizing ERBB2. Molecular therapy : the journal of the American Society of Gene Therapy. 2010 Apr;18(4):843–51. doi: 10.1038/mt.2010.24. [DOI] [PMC free article] [PubMed] [Google Scholar]
- 5.Kloss CC, Condomines M, Cartellieri M, Bachmann M, Sadelain M. Combinatorial antigen recognition with balanced signaling promotes selective tumor eradication by engineered T cells. Nature biotechnology. 2013 Jan;31(1):71–5. doi: 10.1038/nbt.2459. [DOI] [PMC free article] [PubMed] [Google Scholar]
- 6.Roybal KT, Rupp LJ, Morsut L, Walker WJ, McNally KA, Park JS, et al. Precision Tumor Recognition by T Cells With Combinatorial Antigen-Sensing Circuits. Cell. 2016 Feb 11;164(4):770–9. doi: 10.1016/j.cell.2016.01.011. [DOI] [PMC free article] [PubMed] [Google Scholar]
- 7.Fedorov VD, Themeli M, Sadelain M. PD-1- and CTLA-4-based inhibitory chimeric antigen receptors (iCARs) divert off-target immunotherapy responses. Science translational medicine. 2013 Dec 11;5(215):215ra172. doi: 10.1126/scitranslmed.3006597. [DOI] [PMC free article] [PubMed] [Google Scholar]
- 8.Maitra A, Adsay NV, Argani P, Iacobuzio-Donahue C, De Marzo A, Cameron JL, et al. Multicomponent analysis of the pancreatic adenocarcinoma progression model using a pancreatic intraepithelial neoplasia tissue microarray. Modern pathology : an official journal of the United States and Canadian Academy of Pathology, Inc. 2003 Sep;16(9):902–12. doi: 10.1097/01.MP.0000086072.56290.FB. [DOI] [PubMed] [Google Scholar]
- 9.Badea L, Herlea V, Dima SO, Dumitrascu T, Popescu I. Combined gene expression analysis of whole-tissue and microdissected pancreatic ductal adenocarcinoma identifies genes specifically overexpressed in tumor epithelia. Hepato-gastroenterology. 2008 Nov-Dec;55(88):2016–27. [PubMed] [Google Scholar]
- 10.Logsdon CD, Simeone DM, Binkley C, Arumugam T, Greenson JK, Giordano TJ, et al. Molecular profiling of pancreatic adenocarcinoma and chronic pancreatitis identifies multiple genes differentially regulated in pancreatic cancer. Cancer research. 2003 May 15;63(10):2649–57. [PubMed] [Google Scholar]
- 11.Argani P, Rosty C, Reiter RE, Wilentz RE, Murugesan SR, Leach SD, et al. Discovery of new markers of cancer through serial analysis of gene expression: prostate stem cell antigen is overexpressed in pancreatic adenocarcinoma. Cancer research. 2001 Jun 01;61(11):4320–4. [PubMed] [Google Scholar]
- 12.Gocheva V, Wang HW, Gadea BB, Shree T, Hunter KE, Garfall AL, et al. IL-4 induces cathepsin protease activity in tumor-associated macrophages to promote cancer growth and invasion. Genes & development. 2010 Feb 01;24(3):241–55. doi: 10.1101/gad.1874010. [DOI] [PMC free article] [PubMed] [Google Scholar]
- 13.Principe DR, DeCant B, Mascarinas E, Wayne EA, Diaz AM, Akagi N, et al. TGFbeta Signaling in the Pancreatic Tumor Microenvironment Promotes Fibrosis and Immune Evasion to Facilitate Tumorigenesis. Cancer research. 2016 May 01;76(9):2525–39. doi: 10.1158/0008-5472.CAN-15-1293. [DOI] [PMC free article] [PubMed] [Google Scholar]
- 14.Jacob CO, Zhu J, Armstrong DL, Yan M, Han J, Zhou XJ, et al. Identification of IRAK1 as a risk gene with critical role in the pathogenesis of systemic lupus erythematosus. Proceedings of the National Academy of Sciences of the United States of America. 2009 Apr 14;106(15):6256–61. doi: 10.1073/pnas.0901181106. [DOI] [PMC free article] [PubMed] [Google Scholar]
- 15.Li G, Yu M, Lee WW, Tsang M, Krishnan E, Weyand CM, et al. Decline in miR-181a expression with age impairs T cell receptor sensitivity by increasing DUSP6 activity. Nature medicine. 2012 Oct;18(10):1518–24. doi: 10.1038/nm.2963. [DOI] [PMC free article] [PubMed] [Google Scholar]
- 16.Zapata JM, Krajewska M, Krajewski S, Kitada S, Welsh K, Monks A, et al. TNFR-associated factor family protein expression in normal tissues and lymphoid malignancies. Journal of immunology. 2000 Nov 01;165(9):5084–96. doi: 10.4049/jimmunol.165.9.5084. [DOI] [PubMed] [Google Scholar]
- 17.Kim HP, Korn LL, Gamero AM, Leonard WJ. Calcium-dependent activation of interleukin-21 gene expression in T cells. The Journal of biological chemistry. 2005 Jul 01;280(26):25291–7. doi: 10.1074/jbc.M501459200. [DOI] [PubMed] [Google Scholar]
- 18.Lee HW, Nam KO, Seo SK, Kim YH, Kang H, Kwon BS. 4-1BB cross-linking enhances the survival and cell cycle progression of CD4 T lymphocytes. Cellular immunology. 2003 Jun;223(2):143–50. doi: 10.1016/s0008-8749(03)00169-2. [DOI] [PubMed] [Google Scholar]
- 19.Boaru SG, Borkham-Kamphorst E, Van de Leur E, Lehnen E, Liedtke C, Weiskirchen R. NLRP3 inflammasome expression is driven by NF-kappaB in cultured hepatocytes. Biochemical and biophysical research communications. 2015 Mar 13;458(3):700–6. doi: 10.1016/j.bbrc.2015.02.029. [DOI] [PubMed] [Google Scholar]
- 20.Dong S, Chen QL, Song YN, Sun Y, Wei B, Li XY, et al. Mechanisms of CCl4-induced liver fibrosis with combined transcriptomic and proteomic analysis. The Journal of toxicological sciences. 2016;41(4):561–72. doi: 10.2131/jts.41.561. [DOI] [PubMed] [Google Scholar]
- 21.Kawalekar OU, O’Connor RS, Fraietta JA, Guo L, McGettigan SE, Posey AD, Jr, et al. Distinct Signaling of Coreceptors Regulates Specific Metabolism Pathways and Impacts Memory Development in CAR T Cells. Immunity. 2016 Feb 16;44(2):380–90. doi: 10.1016/j.immuni.2016.01.021. [DOI] [PubMed] [Google Scholar]
- 22.Cornish AL, Chong MM, Davey GM, Darwiche R, Nicola NA, Hilton DJ, et al. Suppressor of cytokine signaling-1 regulates signaling in response to interleukin-2 and other gamma c-dependent cytokines in peripheral T cells. The Journal of biological chemistry. 2003 Jun 20;278(25):22755–61. doi: 10.1074/jbc.M303021200. [DOI] [PubMed] [Google Scholar]
- 23.Kanai T, Seki S, Jenks JA, Kohli A, Kawli T, Martin DP, et al. Identification of STAT5A and STAT5B target genes in human T cells. PloS one. 2014;9(1):e86790. doi: 10.1371/journal.pone.0086790. [DOI] [PMC free article] [PubMed] [Google Scholar]
- 24.Schmitt N, Chene L, Boutolleau D, Nugeyre MT, Guillemard E, Versmisse P, et al. Positive regulation of CXCR4 expression and signaling by interleukin-7 in CD4+ mature thymocytes correlates with their capacity to favor human immunodeficiency X4 virus replication. Journal of virology. 2003 May;77(10):5784–93. doi: 10.1128/JVI.77.10.5784-5793.2003. [DOI] [PMC free article] [PubMed] [Google Scholar]
- 25.Yu JH, Zhu BM, Wickre M, Riedlinger G, Chen W, Hosui A, et al. The transcription factors signal transducer and activator of transcription 5A (STAT5A) and STAT5B negatively regulate cell proliferation through the activation of cyclin-dependent kinase inhibitor 2b (Cdkn2b) and Cdkn1a expression. Hepatology. 2010 Nov;52(5):1808–18. doi: 10.1002/hep.23882. [DOI] [PMC free article] [PubMed] [Google Scholar]
- 26.Leen AM, Sukumaran S, Watanabe N, Mohammed S, Keirnan J, Yanagisawa R, et al. Reversal of tumor immune inhibition using a chimeric cytokine receptor. Molecular therapy : the journal of the American Society of Gene Therapy. 2014 Jun;22(6):1211–20. doi: 10.1038/mt.2014.47. [DOI] [PMC free article] [PubMed] [Google Scholar]
- 27.Wang IM, Lin H, Goldman SJ, Kobayashi M. STAT-1 is activated by IL-4 and IL-13 in multiple cell types. Molecular immunology. 2004 Jul;41(9):873–84. doi: 10.1016/j.molimm.2004.04.027. [DOI] [PubMed] [Google Scholar]
- 28.Takeda K, Tanaka T, Shi W, Matsumoto M, Minami M, Kashiwamura S, et al. Essential role of Stat6 in IL-4 signalling. Nature. 1996 Apr 18;380(6575):627–30. doi: 10.1038/380627a0. [DOI] [PubMed] [Google Scholar]
- 29.Takimoto T, Wakabayashi Y, Sekiya T, Inoue N, Morita R, Ichiyama K, et al. Smad2 and Smad3 are redundantly essential for the TGF-beta-mediated regulation of regulatory T plasticity and Th1 development. Journal of immunology. 2010 Jul 15;185(2):842–55. doi: 10.4049/jimmunol.0904100. [DOI] [PubMed] [Google Scholar]
- 30.Ito Y, Miyazono K. RUNX transcription factors as key targets of TGF-beta superfamily signaling. Current opinion in genetics & development. 2003 Feb;13(1):43–7. doi: 10.1016/s0959-437x(03)00007-8. [DOI] [PubMed] [Google Scholar]
- 31.Renzoni EA, Abraham DJ, Howat S, Shi-Wen X, Sestini P, Bou-Gharios G, et al. Gene expression profiling reveals novel TGFbeta targets in adult lung fibroblasts. Respiratory research. 2004 Nov 30;5:24. doi: 10.1186/1465-9921-5-24. [DOI] [PMC free article] [PubMed] [Google Scholar]
- 32.Chevrier S, Kratina T, Emslie D, Tarlinton DM, Corcoran LM. IL4 and IL21 cooperate to induce the high Bcl6 protein level required for germinal center formation. Immunology and cell biology. 2017 Oct 03; doi: 10.1038/icb.2017.71. [DOI] [PubMed] [Google Scholar]
- 33.Butti E, Bergami A, Recchia A, Brambilla E, Del Carro U, Amadio S, et al. IL4 gene delivery to the CNS recruits regulatory T cells and induces clinical recovery in mouse models of multiple sclerosis. Gene therapy. 2008 Apr;15(7):504–15. doi: 10.1038/gt.2008.10. [DOI] [PubMed] [Google Scholar]
- 34.Brentjens RJ, Davila ML, Riviere I, Park J, Wang X, Cowell LG, et al. CD19-targeted T cells rapidly induce molecular remissions in adults with chemotherapy-refractory acute lymphoblastic leukemia. Science translational medicine. 2013 Mar 20;5(177):177ra38. doi: 10.1126/scitranslmed.3005930. [DOI] [PMC free article] [PubMed] [Google Scholar]
- 35.Savoldo B, Ramos CA, Liu E, Mims MP, Keating MJ, Carrum G, et al. CD28 costimulation improves expansion and persistence of chimeric antigen receptor-modified T cells in lymphoma patients. The Journal of clinical investigation. 2011 May;121(5):1822–6. doi: 10.1172/JCI46110. [DOI] [PMC free article] [PubMed] [Google Scholar]
- 36.Finney HM, Akbar AN, Lawson AD. Activation of resting human primary T cells with chimeric receptors: costimulation from CD28, inducible costimulator, CD134, and CD137 in series with signals from the TCR zeta chain. Journal of immunology. 2004 Jan 01;172(1):104–13. doi: 10.4049/jimmunol.172.1.104. [DOI] [PubMed] [Google Scholar]
- 37.Nishio N, Diaconu I, Liu H, Cerullo V, Caruana I, Hoyos V, et al. Armed oncolytic virus enhances immune functions of chimeric antigen receptor-modified T cells in solid tumors. Cancer research. 2014 Sep 15;74(18):5195–205. doi: 10.1158/0008-5472.CAN-14-0697. [DOI] [PMC free article] [PubMed] [Google Scholar]
- 38.Vera JF, Hoyos V, Savoldo B, Quintarelli C, Giordano Attianese GM, Leen AM, et al. Genetic manipulation of tumor-specific cytotoxic T lymphocytes to restore responsiveness to IL-7. Molecular therapy : the journal of the American Society of Gene Therapy. 2009 May;17(5):880–8. doi: 10.1038/mt.2009.34. [DOI] [PMC free article] [PubMed] [Google Scholar]
- 39.Pegram HJ, Lee JC, Hayman EG, Imperato GH, Tedder TF, Sadelain M, et al. Tumor-targeted T cells modified to secrete IL-12 eradicate systemic tumors without need for prior conditioning. Blood. 2012 May 03;119(18):4133–41. doi: 10.1182/blood-2011-12-400044. [DOI] [PMC free article] [PubMed] [Google Scholar]
- 40.Bollard CM, Rossig C, Calonge MJ, Huls MH, Wagner HJ, Massague J, et al. Adapting a transforming growth factor beta-related tumor protection strategy to enhance antitumor immunity. Blood. 2002 May 01;99(9):3179–87. doi: 10.1182/blood.v99.9.3179. [DOI] [PubMed] [Google Scholar]
- 41.Prosser ME, Brown CE, Shami AF, Forman SJ, Jensen MC. Tumor PD-L1 co-stimulates primary human CD8(+) cytotoxic T cells modified to express a PD1:CD28 chimeric receptor. Molecular immunology. 2012 Jul;51(3-4):263–72. doi: 10.1016/j.molimm.2012.03.023. [DOI] [PubMed] [Google Scholar]
- 42.Mohammed S, Sukumaran S, Bajgain P, Watanabe N, Heslop HE, Rooney CM, et al. Improving Chimeric Antigen Receptor-Modified T Cell Function by Reversing the Immunosuppressive Tumor Microenvironment of Pancreatic Cancer. Molecular therapy : the journal of the American Society of Gene Therapy. 2017 Jan 04;25(1):249–58. doi: 10.1016/j.ymthe.2016.10.016. [DOI] [PMC free article] [PubMed] [Google Scholar]
- 43.Wilkie S, Burbridge SE, Chiapero-Stanke L, Pereira AC, Cleary S, van der Stegen SJ, et al. Selective expansion of chimeric antigen receptor-targeted T-cells with potent effector function using interleukin-4. The Journal of biological chemistry. 2010 Aug 13;285(33):25538–44. doi: 10.1074/jbc.M110.127951. [DOI] [PMC free article] [PubMed] [Google Scholar]
- 44.Bonifant CL, Jackson HJ, Brentjens RJ, Curran KJ. Toxicity and management in CAR T-cell therapy. Molecular therapy oncolytics. 2016;3:16011. doi: 10.1038/mto.2016.11. [DOI] [PMC free article] [PubMed] [Google Scholar]
- 45.Wilkie S, van Schalkwyk MC, Hobbs S, Davies DM, van der Stegen SJ, Pereira AC, et al. Dual targeting of ErbB2 and MUC1 in breast cancer using chimeric antigen receptors engineered to provide complementary signaling. Journal of clinical immunology. 2012 Oct;32(5):1059–70. doi: 10.1007/s10875-012-9689-9. [DOI] [PubMed] [Google Scholar]
- 46.Smyth MJ, Ngiow SF, Ribas A, Teng MW. Combination cancer immunotherapies tailored to the tumour microenvironment. Nature reviews Clinical oncology. 2016 Mar;13(3):143–58. doi: 10.1038/nrclinonc.2015.209. [DOI] [PubMed] [Google Scholar]
- 47.Kershaw MH, Westwood JA, Parker LL, Wang G, Eshhar Z, Mavroukakis SA, et al. A phase I study on adoptive immunotherapy using gene-modified T cells for ovarian cancer. Clinical cancer research : an official journal of the American Association for Cancer Research. 2006 Oct 15;12(20 Pt 1):6106–15. doi: 10.1158/1078-0432.CCR-06-1183. [DOI] [PMC free article] [PubMed] [Google Scholar]
- 48.Till BG, Jensen MC, Wang J, Chen EY, Wood BL, Greisman HA, et al. Adoptive immunotherapy for indolent non-Hodgkin lymphoma and mantle cell lymphoma using genetically modified autologous CD20-specific T cells. Blood. 2008 Sep 15;112(6):2261–71. doi: 10.1182/blood-2007-12-128843. [DOI] [PMC free article] [PubMed] [Google Scholar]
- 49.Sommermeyer D, Hudecek M, Kosasih PL, Gogishvili T, Maloney DG, Turtle CJ, et al. Chimeric antigen receptor-modified T cells derived from defined CD8+ and CD4+ subsets confer superior antitumor reactivity in vivo. Leukemia. 2016 Feb;30(2):492–500. doi: 10.1038/leu.2015.247. [DOI] [PMC free article] [PubMed] [Google Scholar]
- 50.Turtle CJ, Hanafi LA, Berger C, Gooley TA, Cherian S, Hudecek M, et al. CD19 CAR-T cells of defined CD4+:CD8+ composition in adult B cell ALL patients. The Journal of clinical investigation. 2016 Jun 01;126(6):2123–38. doi: 10.1172/JCI85309. [DOI] [PMC free article] [PubMed] [Google Scholar]
Associated Data
This section collects any data citations, data availability statements, or supplementary materials included in this article.