

Abstract
Hydrogen-deuterium exchange (HDX) experiments are widely used in studies of protein dynamics. To predict the propensity of amide-hydrogens for exchange with deuterium, several models have been reported in which computations of amide-hydrogen protection factors are carried out using molecular dynamics (MD) simulations. Given significant variation in the criteria used in different models, the robustness and broader applicability of these models to other proteins, especially homologous proteins showing distinct amide-exchange patterns, remains unknown. The sensitivity of the predictions when MD simulations are conducted with different force-fields is yet to tested and quantified. Using MD simulations and experimental HDX data on three homologous signaling proteins, we report detailed studies quantifying the performance of seven previously reported models of two general types: empirical and fractional-population models. We find that empirical models show inconsistent predictions but predictions of the fractional population models are robust. Contrary to previously reported work, we find that solvent accessible surface area of amide-hydrogens is a useful metric when combined with a new metric defining the distances of amide-hydrogens from the first polar atoms in proteins. Based on this, we report two new models, one empirical (M8) and one population-based (M9). We find strong protection of amide-hydrogens from solvent exchange both within the stable helical motifs and also in the interhelical loops. We further observe that the exchange-competent states of amide-hydrogens occur on the sub 100 ps time-scale via localized fluctuations, and such states among amides of a given protein do not appear to show any cooperativity or allosteric coupling.
Graphical abstract
Introduction
Hydrogen-deuterium exchange (HDX) is a widely used protein labeling reaction in which an amide hydrogen in the backbone of amino-acids in proteins is exchanged with a deuterium atom. To probe the locations of exchanged hydrogens in the protein backbone, HDX is often accompanied by other techniques including nuclear magnetic resonance (NMR) spectroscopy and mass-spectrometry (MS).1 HDX methodologies have been successfully applied to understand protein-protein interactions,2–4 conformational changes in proteins,5–9 protein folding,7 and ligand binding.10,11 Early applications of HDX on the A-chain of hormone insulin showed that intra-molecular hydrogen-bonds were a hindrance for hydrogen exchange because of their role in stabilization of the helical structure. 12 Since then many investigations have been conducted to characterize the mechanism of exchange events. These include studies of: deuterium exchange of poly-DL-alanine in aqueous solution at different temperatures and pH,13,14 the influence of residue side-chains on the HDX rate of peptide groups,15 modeling amides and peptides in a chemical exchange step,16–18 development of empirical rules for acid and base catalytic rate-constants, 19,20 development of general models for recognizing hydrogen exchange process between the folded states and the unfolded states using temperature variation, 21–25 the negative effect of static solvent accessibility on exchanging protons, 26 and the correlation between apparent adiabatic compressibility and hydrogen exchange rates.27 Bai et al.28 carried out experiments to formulate inductive and steric blocking effects of neighboring amino-acids on the amide group hydrogen exchange. Their comprehensive dipeptide models included all 20 amino-acids and have informed values of intrinsic kinetic rates used in many previous studies. 29–31
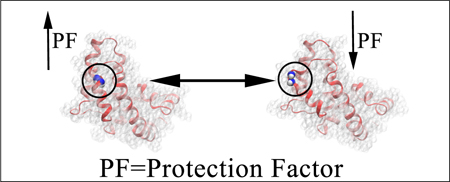
The qualitative and quantitative interpretation of HDX events is becoming an increasingly important tool for studying dynamics in proteins which are challenging to study using other experimental methods.29,32–34 These investigations, over the past half-century, have resulted in various interpretations of the HDX mechanism34–37 primarily via different models used to rationalize exchange events.28–30,38–42 The general mechanism of HDX is described by a dynamic equilibrium between closed and open states (Figure 1) of amide hydrogens with rate constants kc and ko, respectively, and a first order reaction in the exchange competent or open state29 (denoted as an intrinsic rate constant, kint, in Figure 1). The normal exchange mode for proteins that do not undergo global unfolding events is the EX2 exchange limit, in which .18 This mechanism suggests that steric hindrance protects amide hydrogens from exchanging with deuterium. In addition to the physical protection, amide hydrogens that are involved in hydrogen-bonded (H-bonded) structures are protected and show decreased exchange rates.35,37,43,44 Therefore, HDX rates implicitly involve structural changes and dynamics in proteins.29 A variety of models have been used to determine protein conformational states using Monte Carlo (MC)38,45 or molecular dynamics (MD)29–31,39,40,42,46–54 approaches.
Figure 1: Kinetic scheme for HDX is highlighted.
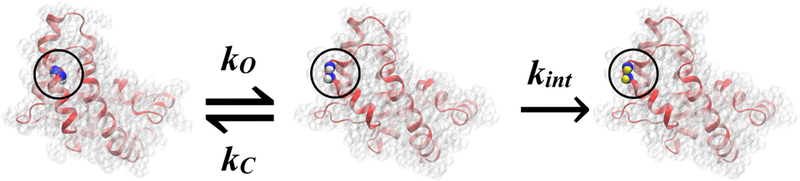
A conformational fluctuation in the protein exposes buried amide groups (blue) (closed state) to solvent (open state) where amide hydrogens (white) are exchanged by deuterium (yellow) with an intrinsic rate constant kint.
In these models, the protection factor (PF) (ranging between 0 and 1010) is a key parameter that correlates conformational dynamics in proteins with the overall HDX rate (khdx).55 In Table 1, we summarize various PF-correlations for seven different models (M1 through M7) that have been proposed previously; detailed descriptions of these models are provided in the supplemental introduction. The parameters and criteria in PF-correlations can be tuned either using MD simulations40 or using structures refined from experiments (e.g. the NMR method). There are two general approaches to obtain the PFs for amide-hydrogens by sampling conformations using simulation methods. In the first approach, PFs empirically correlate to metrics of the protein structure (e.g. models Ml to M6 in Table 1). In the second approach,30 the PF is defined as a fractional population of the closed state to the open state for each amide-hydrogen (e.g. model M7 Table 1). As a complement to HDX experiments, MD simulations not only provide details on exchanging amide hydrogens, but also capture frequencies of open states which may occur on a much shorter time-scale than the hydrogen-exchange itself.30,40 As it remains challenging to conduct long time-scale atomistic MD simulations, the modeling of hydrogen exchange using MD simulations has generally been limited to coarse-grained and/or empirical models with implicit solvent.38,47,56 Several studies have employed short time-scale MD simulations to predict HDX rates.29–31,57 To date, only Persson et al.30 used a millisecond long MD simulation58 for HDX analysis of a 58-residue protein, bovine pancreatic trypsin inhibitor (BPTI). They suggest that the mean residence times for the open states of all amides in BPTI are on the sub 100 ps time-scale.
Table 1:
Model definitions and corresponding metrics. Among models reported in the literature are models Ml through M6 (empirical models) and the model M7 (a fractional population model). For models reported in this work, M8 is an empirical model and M9 is a fractional population model. Additional details on models M8 and M9 are provided in supporting information.
| criteria |
|||||||||
|---|---|---|---|---|---|---|---|---|---|
| Model | 1 | 2 | 3 | 4 | 5 | 6 | 7 | 8 | Protection Factor Definitions |
| M1ref.55 | ✔ | ✔ | log u * (SAi)+ v/(HBi) | ||||||
| M2ref.38 | ✔ | ✔ | ln | ||||||
| M3ref.39 | ✔ | ✔ | ln | ||||||
| M4ref.40 | ✔ | ✔ | ln | ||||||
| M5ref.42 | ✔ | ||||||||
| M6ref.29 | ✔ | ||||||||
| M7ref.30 | ✔ | ✔ | |||||||
| M8† | ✔ | ✔ | ln | ||||||
| M9† | ✔ | ✔ | PFi | ||||||
Hydrogen bond;
Distance from the surface;
# of residues in the vicinity;
# of heavy atoms in the vicinity;
RMSF;
# of waters in the vicinity;
polar atoms in the vicinity;
SASA;
new model proposed in this work.
However, the ability of existing models of PF-correlations (Table 1) to predict HDX trends, when applied to identical experimental dataset(s), is yet to be systematically analyzed. Furthermore, it would be useful to determine whether any of the existing models (based upon their default or re-optimized parameters) can faithfully distinguish differences in HDX patterns of homologous proteins. Finally, comparing the predictive performance of various models for widely-used interatomic potentials (force-fields) for proteins (e.g. CHARMM and AMBER) will likely provide further guidance for future studies combining MD simulations and HDX experiments. In this work, we have investigated these issues by conducting a series of atomistic MD simulations of three homologous regulators of G-protein signaling (RGS) proteins (RGS4, RGS8, and RGS19) (Figure 2) using CHARMM and AMBER force-fields (CHARMM-FF and AMBER-FF). We compared the predictive performance of seven existing models (Table 1) with our recently reported HDX-MS data for all three proteins,59 and re-optimized parameters of these existing models for improved predictions. We also found solvent accessible surface area (SASA) as a useful metric to better predict protection factors in combination with the open-state definition of Persson et al.30 This was surprising because some existing models have reported SASA as a poor predictor. Based upon this latter observation, we derived two new models (M8 and M9; see supplemental methods and Table S2, S3) for better reproducing our experimentally observed HDX trends in three RGS proteins.
Figure 2: Sequence and structural views of RGS proteins.
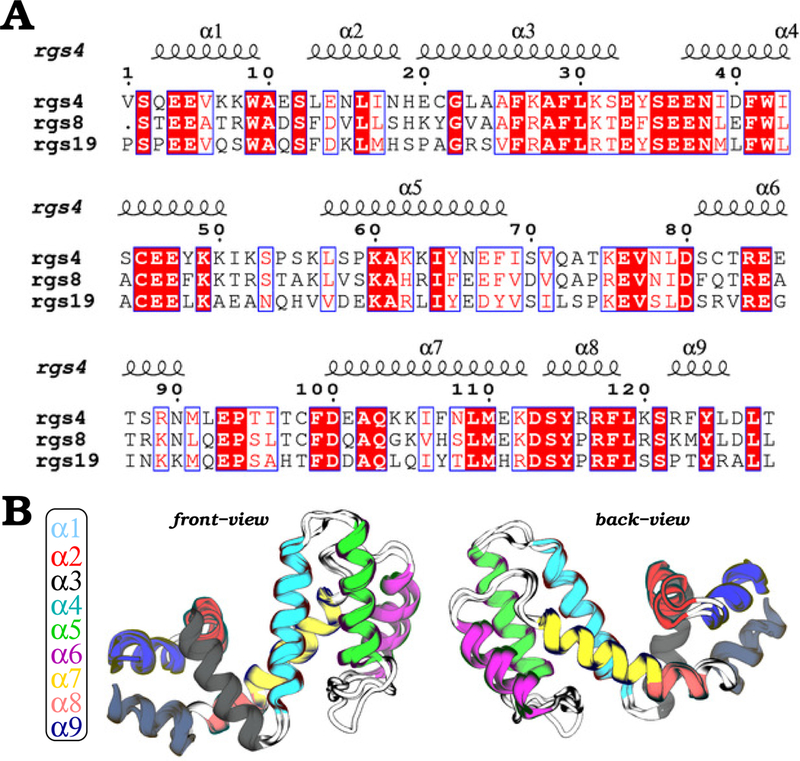
(A) Sequence alignment of RGS4, RGS8, and RGS19 is shown with conserved residues highlighted in red; blue boxes indicate residues that are conserved between at least two among three RGS proteins. (B) Shown are front and back views of the overlay of RGS4 (PDB code 1AGR), RGS8 (PDB code 2ODE), and RGS19 (PDB code 1CMZ) structures with each of the nine helices uniquely colored. Regions rendered as white cartoons are interhelical loops.
Materials and Methods
We carried out all MD simulation trajectories and their analyses using NAMD and VMD software suite60,61 as well as python,62 and used both the CHARMM36 force-field with the CMAP correction63,64 and the AMBER force-field (ff14SB).65 For all MD trajectories, 50000 frames were generated for each μs of dynamics. For RGS4 and RGS8, simulations were conducted with two different initial coordinates, while for RGS19 only one experimental structure is currently known, the coordinates of which were used in simulations. In particular, the initial coordinates for RGS4, RGS8, and RGS19, respectively, were taken from the following protein data bank entries (RGS4: 1AGR and 1EZT; RGS8: 2IHD, 2ODE; RGS19: 1CMZ). Each protein was initially modeled using the psfgen tool in VMD, and then further solvated in a simulation box of TIP3P water molecules and charge-neutralized with NaCl. All system-sizes are provided in Table S1. The volume of simulation domains was then optimized in the NPT ensemble by initially applying 500 cycles of a conjugate-gradient minimization scheme followed by a short 40-ps MD run with a 2-fs time step in which the temperature was controlled at 310K using the Langevin thermostat and the pressure was controlled by the Nose-Hoover barostat. We carried out all simulations using periodic boundary conditions. These briefly equilibrated systems of all RGS proteins were further subjected to long time-scale (2 μs for each protein) MD simulations in the NVT ensemble. For all proteins and both force-fields, we generated 10 total MD simulations with 20 μs of MD simulation data (Table S1). All details on protein expression, purification, and data collection using HDX-MS are provided in our previous work.59 Briefly, deuterium incorporation (DI) for RGS4, RGS8 and RGS19 was measured at a fragment resolution using HDX-MS experiments at t = 1, 3, 10, 30, 100, 300, and 1000 minutes (Figure S1 and Figure S2).59 We note that incubations were carried out in a 90% D2O solution containing 5 mM HEPES and 100 mM NaCl. We provide further description of protocols for HDX modeling in supplemental methods.
Results and Discussion
Comparison of predicted and experimentally-observed deuterium incorporation trends for RGS4, RGS8, and RGS19:
To evaluate the predictive performance of various existing models for PF-correlations (see Table 1 and supplemental introduction), we conducted 10 independent all-atom, explicit-solvent, and μs-timescale MD simulations for all RGS proteins (see Table S1 and supplemental methods). For each 2 μs timescale simulation, we analyzed 100,000 conformations of each protein by applying criteria reported previously for each model (Table S3) and combined calculations on those metrics to obtain protection factors (PFs) for each residue. These PFs, when combined with the intrinsic exchange rates,28 were then used to predict and compare the percentage of deuterium in corporation (%DI) at t = 0, 3, 10, 30, 100, 300, and 1000 minutes for each experimentally observed fragment of each protein (Figure S1, S2).59 Then, we re-optimized parameters of models M1 through M7 (the re-optimized models hereafter are referred to as M1* through M7*) by minimizing a fragment-based objective function that compares the predicted and measured values of DI (see supplemental methods). The re-optimization procedure was carried out for simulations conducted with both force-fields (CHARMM-FF and AMBER-FF). The default as well as re-optimized parameters of all 9 models are listed in Table S3.
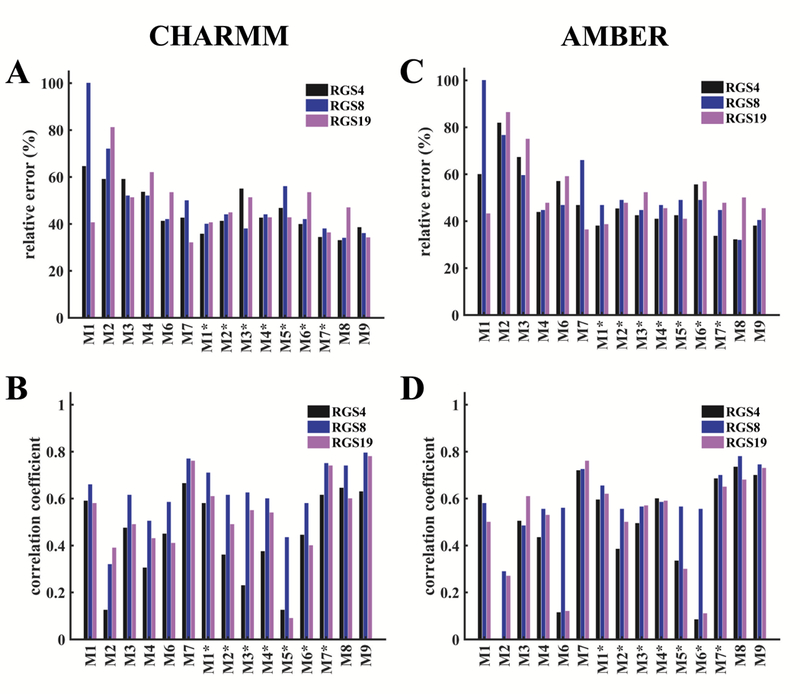
We quantified the comparisons between the predicted and experimentally-measured deuterium incorporation (%DI) using the relative error (E) and correlation-coefficient (CC) analyses. E measures the discrepancy between the exact values of DI that were measured via HDX-MS experiments and the values that were calculated from MD simulations. However, CC measures the linear relationship between the measured DI and the modeled DI. It is a measurement of the inter-dependence or association of two variables and ranges between −1 (negative correlation) and 1 (positive correlation). Therefore, both E and CC are taken into account for the evaluation of each model. In Figure 3 and Figure 4, we present the statistics of performance of each model via calculations on E and CC for the CHARMM-FF and the AMBER-FF. Specifically, Figure 3 shows the performance metrics computed by averaging over data from all MD simulations of all RGS proteins (RGS4, RGS8, and RGS19), while Figure 4 shows the same metrics computed by averaging over all MD simulations of each RGS protein. For additional details, we show the traces of the predicted vs. measured %DI for all fragments of each RGS protein for both force-fields (Figure S3 to Figure S32).
Figure 3: Comparisons of model predictions of HDX-MS data across all three RGS proteins.
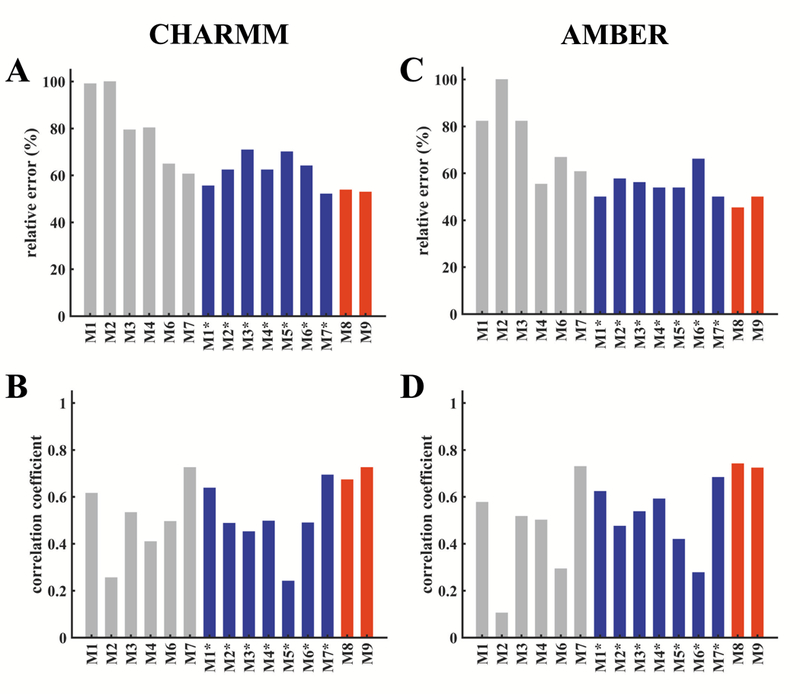
Performance metrics (relative error, E, and correlation coefficient, CC) for different models are shown based upon data averaged from all trajectories of RGS4, RGS8, and RGS19 conducted with the CHARMM-FF (data in panels A and B) and the AMBER-FF (data in panels C and D). (A, C) The relative error between the predicted and observed %DI []. (B, D) Correlation coefficient between the predicted and observed %DI []. Gray bars are for models with the default parameters reported in the literature, blue bars are their re-optimized versions based upon our experimental data, and red bars are for new models proposed in this work. No performance data for the original model M5 are reported because the parameter values were not available from the original work,42 but the performance data are reported for the optimized version of this model (M5*) based upon our experimental data.
Figure 4: Comparisons of model predictions of HDX-MS data for each RGS protein.
The definitions of E and CC, and other details are the same as in Figure 3. Colored bars distinguish data for each RGS protein: black bars, RGS4; blue bars, RGS8; and magenta bars, RGS19.
For discussion in the following, we refer to models M1 through M6 as empirical models, and the model M7 as a fractional population model (see supplemental introduction). Overall, we observe that the models M1 through M6 show larger errors and lower correlations in comparison to the model M7 for simulations with both force-fields (gray bars in Figure 3). Among empirical models, the model M6 has the smallest error for simulations with the CHARMM-FF (Figure 3A), while the model M4 has the smallest error for simulations with the AMBER-FF (Figure 3B). The CC values are comparable for the model M6 in the CHARMM-FF and for the model M4 in the AMBER-FF. After re-optimizing the parameters for these models (see supplemental methods and Table S3), the models Ml* and M2* showed significant improvement (lower E and higher CC) for both force-fields in comparison to other models (M3* to M6*), that only moderately improved (blue bars in Figure 3). After the re-optimization, even though the E values for the model M7* marginally decreased in comparison to the model M7 (with default parameters), the CC values are similar in both force-fields. The E and CC values for our proposed models (M8 and M9), both of which are based on the SASA of each amide hydrogen and its distance from the first polar atom (see supplemental methods), show results comparable to the fractional population model M7 and its re-optimized version M7*. Both of our proposed models consistently predict DI trends with lower E values and higher CC values for both force-fields. Taken together, these data suggest that the proposed models M8 and M9 as well as the models M7 and M7* predict experimentally observed HDX trends better than the other models (Ml/Ml* through M6/M6*).
On comparing the performance of all empirical models for each RGS protein (Figure 4), we observe that the DI trends in RGS4 and RGS8 for the CHARMM-FF are best described (lower E and higher CC values) by the model M6, and for the AMBER-FF are best described by the model M4 (for RGS4) and equally well described by the models 4 and 6 (for RGS8). For RGS19, the model Ml captures DI trends better than other empirical models (M2 through M6) for both force-fields, but this model is a poor predictor for RGS4 and RGS8. We also observe that the model M2 poorly predicts DI trends (higher E and lower CC values) for all three proteins, and the model M7, a fractional population model, consistently shows better predictions (lower E and higher CC values) for both force-fields. On re-optimizing, all empirical models (Ml* through M6*) show improvement (lower E and higher CC values) over their default parameter versions (Ml through M6), but both versions of the fractional population model (M7 and M7*) provide consistently better predictions than the empirical models. The performance of our proposed models M8 and M9 is comparable to the model M7*, but for all three models (M7*, M8, and M9) the performance is marginally poorer (i.e. E values are marginally higher and CC values marginally lower) for RGS19 in comparison to RGS4 and RGS8.
The time-dependence of model predictions contributes significantly to differences in the ability of each model to predict HDX-DI results for each experimentally-observed fragment (24 fragments for RGS4, 38 fragments for RGS8, and 26 fragments for RGS19; Figure S2).59 The models show significant variation between shorter time-points (t = 0, 3, 10, 30, and 100 minutes) and longer time-points (t = 300 and 1000 minutes) when comparing predicted DI trends at the level of individual fragments for both force-fields (Figure S3 to Figure S32).For example, models M3, M4, and M6 under-predicted experimentally observed DI trends at shorter time-points, but the trends at longer time-points are predicted reasonably well (Figures S18 and S19). Similarly, the re-optimized models including M2* through M6* underpredicted DI trends at shorter time-points for RGS4 simulations (Figures S24 and S29). Unlike these models, our proposed models M8 and M9 overall show better agreement with the HDX data across all time-points and fragments for RGS4 and RGS8 with both force-fields (Figures S13 to S16 and S28 to S31). However, for RGS19, except fragments 18 to 26, each model under-predicts DI trends for both force-fields (Figures S17 and S32).
Our HDX-MS data showed that the amide hydrogens exchanged rapidly in RGS19 in comparison to RGS4 and RGS8 (Figure S1), especially in helices α4, α5, and α6 (fragments 10 to 23; Figure S2).59 At t = 1000 minutes and for models M7, M8, and M9, the mapping of the predicted vs. measured DI on protein structures (Figure S33) shows that these models under-predicted DI trends in the α4 helix of RGS19, but predicted well in the α6 helix as well as in the α5-α6/α6-α7 interhelical loops. Importantly, the structural motifs in RGS proteins that showed poor agreement between the predicted and measured DI trends also showed significantly lower residue fluctuations in MD simulations (Figure S34) in comparison to those motifs that showed higher fluctuations and as a result better agreement with the experiments.
In summary, each model has unique metrics for estimating the PFs and some of these metrics are shared among different models. For example, the number of polar atoms or residues in the vicinity of an amide-hydrogen indirectly assess the likelihood of existence of hydrogen bonds between amide-hydrogens and other atoms in proteins. Therefore, different models are directly or indirectly correlated to hydrogen bonds. Our analyses show that the fractional population modeling (e.g. models M7/M7* and M9) is more robust than empirical approaches. In particular, the fractional-population models are broadly applicable to newer systems without reoptimization of parameters (e.g. the model M7 makes reasonably accurate predictions both before or after optimization). In our new models (M8 and M9), combining two metrics, SASA and the number of polar protein atoms in the vicinity of a given amidehydrogen, shows better predictions both for the empirical model (M8) and the fractional population model (M9). We also suggest that our new models are potentially applicable to other protein systems for efficient interpretation of HDX data because these models only require coordinates of the protein-atoms. These can be readily extracted from the solvated simulation trajectories for rapid analysis.
Comparison of predicted and measured HDX-data at a single-residue resolution:
Our HDX-MS data was collected at a fragment resolution for each protein (Figures S1 and S2),59 but atomistic MD simulations complement these data by providing additional details on the protections of amide hydrogens at a single-residue resolution. At t = 1000 minutes for models M7, M7*, M8, and M9, we show in Figures S35 to S40 a color-coded mapping of DI trends for each residue of RGS4, RGS8, and RGS19 for both force-fields. These data show that the amide-hydrogens in the N-terminus of the α3-helix (containing 12 residues; see Figure 2) are fully exchanged and some residues are partially exchanged. MD simulations show that the unexchanged or partially-exchanged amide-hydrogens are participating in hydrogen-bonds and are therefore largely protected. Consistent with HDX experiments, these protection effects are observed in fragments 2 and 3 in RGS4 (Figure S23), fragments 8, 10, 11 in RGS8 (Figure S25), and the fragment 6 in RGS19 (Figure S27). In HDX-MS experiments, we observed that the residues in the N-terminus of the a4-helix show high exchange propensity in all RGS systems which is accurately predicted by models M7, M7*, and M8. However, all models under-predicted amide-hydrogen exchanges in other parts of the α4-helix (e.g. fragment 6 in RGS4, fragments 14, 15, 16 in RGS8, and fragments 11 and 12 in RGS19) (Figures S24, S25, S27, S28, S30, and S32). Analyses of our MD simulations showed that the amide-hydrogens in these fragments are strongly protected via hydrogen-bonds, and therefore local unfolding of the helical structure, even if very transiently, is perhaps required to facilitate any exchange event. Through MD simulations, similar protection effects were identified in the α5-helix of RGS8 (fragments 24 and 25) (Figures S25, S26, S30, and S31) and RGS19 (fragment 18) (Figures S27 and S32).
The models accurately predicted experimentally-observed exchanges in amide-hydrogens in the connecting loops between helices, particularly for the α5-α6 loop (e.g. fragments 12 and 13 for RGS4 in Figures S24, S25, S28, and S29; fragment 27 for RGS8 in Figures S25, S26, S30, and S31; and fragments 20, 21, and 22 for RGS19 in Figures S27 and S32) which is the longest unstructured region in RGS proteins (Figure 2). However, our models showed partial protection for the amide-hydrogen of Q122, a residue located in the α5-α6 interhelical loop of RGS4, even though the side-chain of this residue is solvent-exposed. The amide-hydrogen in Q122 forms a long-lasting hydrogen-bond with S120 leading to a significant protection of this amide-hydrogen (Figure S41A and S41C). We also observed complete protection of the amide-hydrogen in the residue R119 of RGS8, which is located in the α5-α6 interhelical loop (Figure S36). We attribute this to strong salt-bridging interactions between the residue R119 and residues E84/E111 (Figure S41B and S41D). For residues located near the protein surface as well as in flexible loops, the ability to remain protected is consistent with the earlier observations on Staphylococcal nuclease66 showing that the proximity to the surface of the protein does not usually produce fast exchange and therefore a detailed hydrogen by hydrogen analysis is needed, as we have carried out here via MD simulations. These results also provide testable predictions for future HDX-NMR studies aimed at resolving residue-level exchanges since HDX-MS results only provide fragment-level resolution.
Solvent accessible surface area as a metric
In our proposed models M8 and M9, SASA is a key metric in determination of the exposure of amide-hydrogens to solvent that consequently contributes to the calculation of protection factors. Since the hydrogen atoms are resolved in the NMR structures of RGS4 (PDB code 1EZT containing only 1 conformer) and RGS19 (PDB code 1CMZ containing 20 conformers), we computed the maximum and average SASA of all amide-hydrogens from the NMR structures (Figure 5). Given that all missing hydrogens are included in our MD simulations, we also calculated similar SASA measures of all amide hydrogens of RGS4, RGS8, and RGS19 from all MD trajectories conducted using both force-fields (Figure S42). The NMR structures show that only a few amide-hydrogens are exposed to solvent and those are located in the connection loops between helices. The maximum values of SASA among all amide-hydrogens are ~8 Å2 and ~14 Å2 for RGS4 (PDB code 1EZT) and RGS19 (PDB code 1CMZ), respectively.
Figure 5: The exposure of amide-hydrogens in the NMR structures of RGS proteins.
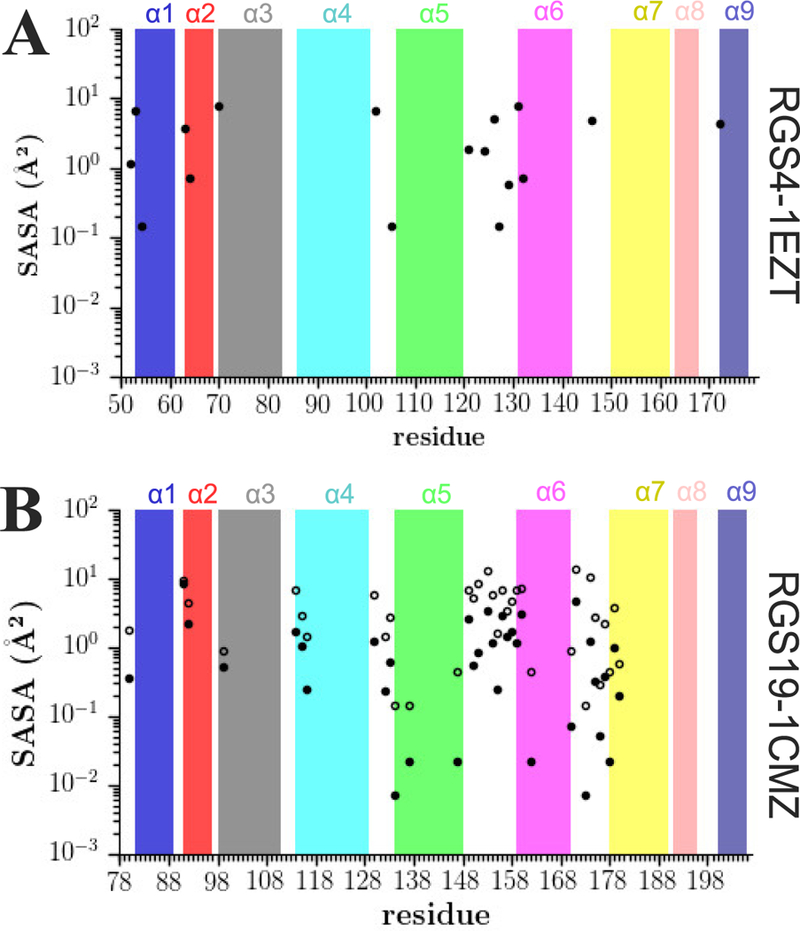
Shown are the maximum (open circles) and the average (solid circles) values of the solvent accessible surface area for all amide hydrogens in the NMR structures of RGS4 (panel A) and RGS19 (panel B). In both panels, the absence of filled circles for certain amides as well as the absence of open circles in panel B, is due to the approximately nil SASA values for those amides. The absence of open circles for RGS4 in panel A is due to the lack of availability of more than 1 conformer in the NMR structure of RGS4 as opposed to 20 conformers in the NMR structure of RGS19.
Our model M9 showed that the SASA threshold beyond which the experimental HDX trends are well predicted are 8.02 Å2 and 9.15 Å2 for CHARMM and AMBER force-fields, respectively. Given these values, none of the residues in the NMR structure of RGS4, and only 4 residues in the NMR structure of RGS19 have enough exposure for competent exchange. However, amide-hydrogens show larger exposure to solvent in MD simulations (Figure S42) with maximum values up to ~20 Å2. For interhelical loops, the average SASA of amide-hydrogens in simulations is about two times that of helical motifs in RGS proteins. The residues within well-folded and stable helices never adopt SASA values beyond the threshold SASA values (vide supra), thereby suggesting strong protection effects for these amide-hydrogens. Given that the SASA values of amide-hydrogens in the initial structures of RGS proteins (Figure 5) and in MD simulations (Figure S42) are different as well as given the consistent performance of our SASA-based proposed models (M8 and M9; Figure 3 and Figure 4), we find SASA computed from MD simulations as a useful metric in modeling of HDX-MS data.
Mean residence times and cooperativity of amide hydrogens in the open and closed states
the fractional-population models (M7/M7* and M9), the kinetics of fluctuations between the open and closed states are characterized by the mean residence time (MRT) which is defined, in an MD simulation, as the average number of consecutive frames in each state multiplied by the time-step.30 Therefore, computing the MRT at residue-resolution provides information on the tendency of each amide-hydrogen to be in the open and the closed state. Two specific criteria (see Table S3) were evaluated to classify amides as being in the open or closed states for each frame in MD trajectories. Then, the MRT values of the closed state and the open state are used to calculate the protection factors . To calculate the PF for model M9, we divided the number of frames in which an amide-hydrogen is in a closed state (NFC) by the number of frames in which an amide-hydrogen is in an open state (NFO). If NO and NC are the number of visits to the open state and the closed state during the MD trajectory, respectively, and TO and TC are the total time that each amide is in the open or the closed state, respectively, it can be written that and , where is the time-step (which is 2-fs in our MD simulations). This results in the protection factor, PF=TC/TO by assuming that NO = NC – 1.30 In Figure 6, we show the MRT values of the open and the closed states of all residues from MD trajectories of all proteins conducted using the CHARMM-FF and the AMBER-FF. These values were calculated using equations and .
Figure 6: Mean residence times for the open and closed states of amide-hydrogens.
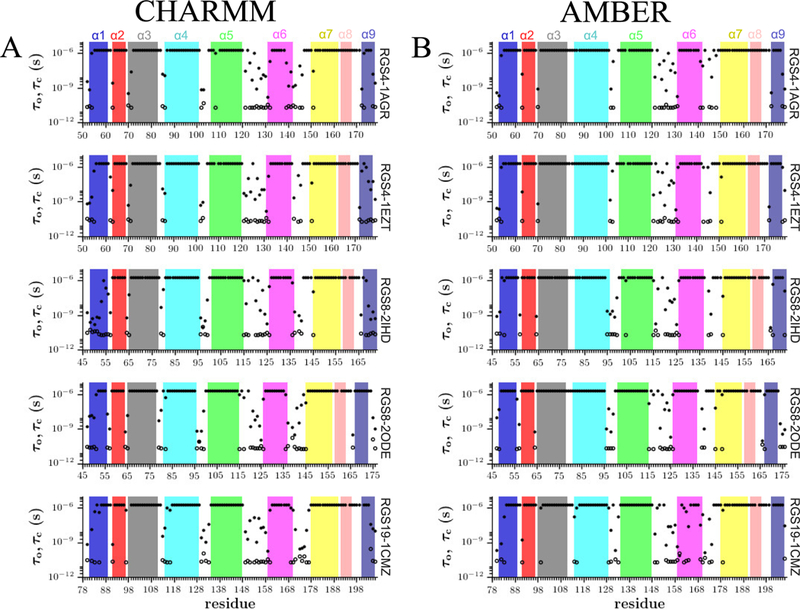
Data are shown from all simulations of RGS4, RGS8, and RGS19 conducted with the CHARMM-FF (panel A) and the AMBER-FF (panel B). The MRT calculations were carried out using our proposed fractional population model M9 that showed consistent predictions with the HDX-MS data.
Since the open-states of amide-hydrogens may occur at time-scales shorter than the timestep used in MD simulations, it was previously shown that the MRT values can be quantitatively corrected to account for the sampling-resolution systematic binning error. The corrected values are given by and .30 We show the corrected MRT values in Figure S43. These data show that ranges between 20 to 50 ps while ranges between 5 to 50 ps and ranges between l70 ps to 2 μs while ranges between ll0 ps to 2 μs. The observation that the open states of amides occur on a sub l00 ps time-scale is consistent with similar earlier observations on the protein BPTI.30 As suggested previously,30 these time-scales are orders-of-magnitude shorter than the MRT values of globally unfolded proteins and therefore highlight the concept that amides can exchange by highly localized and short-lived fluctuations without the need for global unfolding. We further examined whether the open states of amide-hydrogens are truly localized or if they are allosterically coupled and cooperative. Specifically, we computed the open-state residue-residue correlation matrix for two simulations that have shown significant per-residue fluctuations in RGS4 (PDB:lAGR) and RGS8 (PDB:2ODE) using the CHARMM-FF. We observed that the correlation matrix varies in a short-range for both systems (see Figures S44 and S45) indicating that the open-states for amides are largely uncorrelated between residue pairs, as also has been previously observed for BPTI. 30 These observations are consistent with the amide-hydrogen exchanges occurring in the EX2 exchange limit.18 Furthermore, the probability of observing open states of amides for a trajectory of given length can be analyzed using Poisson statistics. 30 We present this analysis in Figure S46 for the PF-values of 102, 104, 106, and 1011 with ps and l00 ps. The analysis shows that the open states of amides with the PFs ranging between l02 and l06 can be observed in MD trajectories of simulation lengths ranging between l0–3 μs and l0 s. This is consistent with the results on the DI observed in experiments and predicted by simulations for RGS proteins. However, the amides that are highly protected and are not observed to exchange in experiments likely have protection factors of 1011 or higher (as predicted by our simulations) and would require trajectories on time-scales of millisecond or higher for observing open states. We suggest that the probability of observing sufficient opening events for amides can be further enhanced by conducting simulations with multiple force-fields and different initial structures of proteins, as we have carried out in this work for RGS proteins.
Conclusion
We used MD simulations to study hydrogen-deuterium exchange events in three isoforms of RGS proteins. Specifically, we analyzed various existing models from the literature to assess their ability in accurately predicting experimentally-observed exchange patterns in these homologous RGS proteins. These analyses revealed significant variation among models in accuracy of predictions and showed that empirical models (termed models M1 through M6 in Table 1) with their previously reported criteria made inconsistent predictions, while a fractional population model (Model M7) predicted experimentally-observed trends with good accuracy. Even though we found that reoptimizing previous empirical models using our data on RGS proteins improves their prediction accuracy, the performance of the fractional population model is less sensitive to parameters. We further assessed the usefulness of a previously ignored metric, SASA of amide-hydrogens determined from MD simulations, and combined it with the distance of a given amide-hydrogen from the first polar atoms in proteins to propose two new models (models M8 and M9) that show good predictions for observed HDX patterns. Importantly, the proposed models only require the coordinates of protein atoms from solvated trajectories providing improved computational efficiency. We also find that the amide-hydrogens often transiently visit open-states on sub 100 ps time-scales, which is significantly shorter than time-scales for global unfolding. This therefore suggests that there is localized exposure of the amide-hydrogens, especially given that open-states among amide-hydrogens of a given protein are uncorrelated.
Supplementary Material
Acknowledgement
This work was supported by NSF Grants 1507588 (RRN) and 1508595 (HV) and NIH Training Grant T32 GM092715 (RRN for VSS). We are grateful for computational support from Trillian, a Cray XE6m-200 supercomputer supported by the NSF MRI program under Grant PHY-1229408, and the NSF-supported (ACI-1548562) Extreme Science and Engineering Discovery Environment (XSEDE)67 under Grant TG-MCB160183 (HV).
Footnotes
Supporting Information Available
Simulation set-up details and additional analyses with 3 tables and 46 figures appear in the supporting information. This material is available free of charge via the Internet at http://pubs.acs.org/.
References
- (1).Konermann L; Vahidi S; Sowole MA Mass spectrometry methods for studying structure and dynamics of biological macromolecules. Anal. Chem. 2013, 86, 213–232. [DOI] [PubMed] [Google Scholar]
- (2).Mandell JG; Baerga-Ortiz A; Falick AM; Komives EA Measurement of solvent accessibility at protein-protein interfaces. Methods Mol. Biol. 2005, 305, 65–80.15939994 [Google Scholar]
- (3).Mandell JG; Falick AM; Komives EA Identification of protein-protein interfaces by decreased amide proton solvent accessibility. Proc. Natl. Sci. Acad. USA 1998, 95, 14705–14710. [DOI] [PMC free article] [PubMed] [Google Scholar]
- (4).Lee T; Hoofnagle AN; Kabuyama Y; Stroud J; Min X; Goldsmith EJ; Chen L; Resing KA; Ahn NG Docking motif interactions in map kinases revealed by hydrogen exchange mass spectrometry. Mol. Cell 2004, 14, 43–55. [DOI] [PubMed] [Google Scholar]
- (5).Bonnington L; Lindner I; Gilles U; Kailich T; Reusch D; Bulau P Application of hydrogen/deuterium exchange-mass spectrometry to biopharmaceutical development requirements: improved sensitivity to detection of conformational changes. Anal. Chem. 2017, 89, 8233–8237. [DOI] [PubMed] [Google Scholar]
- (6).Houde D; Berkowitz SA; Engen JR The utility of hydrogen/deuterium exchange mass spectrometry in biopharmaceutical comparability studies. J. Pharm. Sci. 2011, 100, 2071–2086. [DOI] [PMC free article] [PubMed] [Google Scholar]
- (7).Pirrone GF; Iacob RE; Engen JR Applications of hydrogen/deuterium exchange MS from 2012 to 2014. Anal. Chem. 2014, 87, 99–118. [DOI] [PMC free article] [PubMed] [Google Scholar]
- (8).Bobst CE; Abzalimov RR; Houde D; Kloczewiak M; Mhatre R; Berkowitz SA; Kaltashov IA Detection and characterization of altered conformations of protein pharmaceuticals using complementary mass spectrometry-based approaches. Anal. Chem. 2008, 80, 7473–7481. [DOI] [PMC free article] [PubMed] [Google Scholar]
- (9).Huang RY-C; Chen G Higher order structure characterization of protein therapeutics by hydrogen/deuterium exchange mass spectrometry. Anal. Bioanal.Chem. 2014, 406, 6541–6558. [DOI] [PubMed] [Google Scholar]
- (10).Barksdale AD; Rosenberg A Acquisition and interpretation of hydrogen exchange data from peptides, polymers, and proteins. Methods Biochem. Anal. 1982, 28, 1–113. [DOI] [PubMed] [Google Scholar]
- (11).Abaturov LV; Jinoria KS; Varshavsky YM; Yakobashvily N Effect of ligand and heme on conformational stability (intramolecular conformational motility) of hemoglobin as revealed by hydrogen exchange. FEBS Lett. 1977, 77, 103–106. [DOI] [PubMed] [Google Scholar]
- (12).Hvidt A; Linderstrøm-Lang K The kinetics of the deuterium exchange of insulin with D2O; an amendment. Biochim. Biophys. Acta 1955, 16, 168–169. [DOI] [PubMed] [Google Scholar]
- (13).Berger A; Linderstrøm-Lang K Deuterium exchange of poly-DL-alanine in aqueous solution. Arch. Biochem. Biophys. 1957, 69, 106–118. [DOI] [PubMed] [Google Scholar]
- (14).Bryan WP; Nielsen SO Hydrogen-deuterium exchange of poly-DL-alanine in aqueous solution. Biochim. Biophys. Acta 1960, 42, 552–553. [DOI] [PubMed] [Google Scholar]
- (15).Molday R; Englander S; Kallen R Primary structure effects on peptide group hydrogen exchange. Biochemistry 1972, 11, 150–158. [DOI] [PubMed] [Google Scholar]
- (16).Woodward CK; Hilton BD Hydrogen exchange kinetics and internal motions in proteins and nucleic acids. Annu. Rev. Biophys. Bioeng. 1979, 8, 99–127. [DOI] [PubMed] [Google Scholar]
- (17).Englander S; Downer N; Teitelbaum H Hydrogen exchange. Annu. Rev. Biochem. 1972, 41, 903–924. [DOI] [PubMed] [Google Scholar]
- (18).Hvidt A; Nielsen SO Hydrogen exchange in proteins. Adv. Protein Chem. 1966, 21, 287–386. [DOI] [PubMed] [Google Scholar]
- (19).Takahashi T; Nakanishi M; Tsuboi M Hydrogen-deuterium exchange study of amino acids and proteins by 200-to 230-nm spectroscopy. Anal. Biochem. 1981, 110, 242–249. [DOI] [PubMed] [Google Scholar]
- (20).Molday R; Englander S; Kallen R Primary structure effects on peptide group hydrogen exchange. Biochemistry 1972, 11, 150–158. [DOI] [PubMed] [Google Scholar]
- (21).Hilton BD; Woodward CK Mechanism of isotope exchange kinetics of single protons in bovine pancreatic trypsin inhibitor. Biochemistry 1979, 18, 5834–5841. [DOI] [PubMed] [Google Scholar]
- (22).Ellis LM; Bloomfield Victor A; Woodward CK Hydrogen-tritium exchange kinetics of soybean trypsin inhibitor (Kunitz). Solvent acessibility in the folded conformation. Biochemistry 1975, 14, 3413–3419. [DOI] [PubMed] [Google Scholar]
- (23).Woodward C; Ellis L; Rosenberg A Solvent accessibility in folded proteins. Studies of hydrogen exchange in trypsin. J. Biol. Chem. 1975, 250, 432–439. [PubMed] [Google Scholar]
- (24).Woodward CK; Rosenberg A Studies of hydrogen exchange in proteins. VI. Urea effects on ribonuclease exchange kinetics leading to a general model for hydrogen exchange from folded proteins. J. Biol. Chem. 1971, 246, 4114–4121. [PubMed] [Google Scholar]
- (25).Rosenberg A; Chakravarti K Studies of hydrogen exchange in proteins. J. Biol. Chem. 1968, 243, 5193–5201. [PubMed] [Google Scholar]
- (26).Levitt M Hydrogen bond and internal solvent dynamics of BPTI protein. Ann. N. Y. Acad. Sci. 1981, 367, 162–181. [Google Scholar]
- (27).Eden D; Matthew JB; Rosa JJ; Richards FM Increase in apparent compressibility of cytochrome c upon oxidation. Proc. Natl. Sci. Acad. USA 1982, 79, 815–819. [DOI] [PMC free article] [PubMed] [Google Scholar]
- (28).Bai Y; Milne JS; Mayne L; Englander SW Primary structure effects on peptide group hydrogen exchange. Proteins 1993, 17, 75–86. [DOI] [PMC free article] [PubMed] [Google Scholar]
- (29).Park I-H; Venable JD; Steckler C; Cellitti SE; Lesley SA; Spraggon G; Brock A Estimation of hydrogen-exchange protection factors from MD simulation based on amide hydrogen bonding analysis. J. Chem. Inf. Model. 2015, 55, 1914–1925. [DOI] [PMC free article] [PubMed] [Google Scholar]
- (30).Persson F; Halle B How amide hydrogens exchange in native proteins. Proc. Natl. Sci. Acad. USA 2015, 112, 10383–10388. [DOI] [PMC free article] [PubMed] [Google Scholar]
- (31).Adhikary S; Deredge DJ; Nagarajan A; Forrest LR; Wintrode PL; Singh SK Conformational dynamics of a neurotransmitter: sodium symporter in a lipid bilayer. Proc. Natl. Sci. Acad. USA 2017, 114, E1786–E1795. [DOI] [PMC free article] [PubMed] [Google Scholar]
- (32).Brock A Fragmentation hydrogen exchange mass spectrometry: a review of methodology and applications. Protein Expr. Purif. 2012, 84, 19–37. [DOI] [PubMed] [Google Scholar]
- (33).Zhang Q; Willison LN; Tripathi P; Sathe SK; Roux KH; Emmett MR; Blakney GT; Zhang HM; Marshall AG Epitope mapping of a 95 kda antigen in complex with antibody by solution-phase amide backbone hydrogen/deuterium exchange monitored by Fourier transform ion cyclotron resonance mass spectrometry. Anal. Chem. 2011, 83, 7129–7136. [DOI] [PMC free article] [PubMed] [Google Scholar]
- (34).Englander SW; Sosnick TR; Englander JJ; Mayne L Mechanisms and uses of hydrogen exchange. Curr. Opin. Struct. Biol. 1996, 6, 18–23. [DOI] [PMC free article] [PubMed] [Google Scholar]
- (35).Maity H; Lim WK; Rumbley JN; Englander SW Protein hydrogen exchange mechanism: local fluctuations. Protein Sci. 2003, 12, 153–160. [DOI] [PMC free article] [PubMed] [Google Scholar]
- (36).Wyttenbach T; Bowers MT Gas phase conformations of biological molecules: the hydrogen/deuterium exchange mechanism. J. Am. Soc. Mass. Spectrom. 1999, 10, 9–14. [Google Scholar]
- (37).Miller DW; Dill KA A statistical mechanical model for hydrogen exchange in globular proteins. Protein Sci. 1995, 4, 1860–1873. [DOI] [PMC free article] [PubMed] [Google Scholar]
- (38).Vendruscolo M; Paci E; Dobson CM; Karplus M Rare fluctuations of native proteins sampled by equilibrium hydrogen exchange. J. Am. Chem. Soc. 2003, 125, 15686–15687. [DOI] [PubMed] [Google Scholar]
- (39).Best RB; Vendruscolo M Structural interpretation of hydrogen exchange protection factors in proteins: characterization of the native state fluctuations of CI2. Structure 2006, 14, 97–106. [DOI] [PubMed] [Google Scholar]
- (40).Kieseritzky G; Morra G; Knapp E-W Stability and fluctuations of amide hydrogen bonds in a bacterial cytochrome c: a molecular dynamics study. J. Biol. Inorg. Chem. 2006, 11, 26–40. [DOI] [PubMed] [Google Scholar]
- (41).Skinner JJ; Lim WK; Bedard S; Black BE; Englander SW Protein hydrogen exchange: Testing current models. Protein Sci. 2012, 21, 987–995. [DOI] [PMC free article] [PubMed] [Google Scholar]
- (42).Ma B; Nussinov R Polymorphic triple β-sheet structures contribute to amide hydrogen/deuterium (H/D) exchange protection in the Alzheimer amyloid β42 peptide. J. Biol. Chem. 2011, 286, 34244–34253. [DOI] [PMC free article] [PubMed] [Google Scholar]
- (43).Bentley G; Delepierre M; Dobson C; Wedin R; Mason S; Poulsen F Exchange of individual hydrogens for a protein in a crystal and in solution. J. Mol. Biol. 1983, 170, 243–247. [DOI] [PubMed] [Google Scholar]
- (44).Clarke J; Itzhaki LS; Fersht AR Hydrogen exchange at equilibrium: a short cut for analysing protein-folding pathways? Trends Biochem. Sci. 1997, 22, 284–287. [DOI] [PubMed] [Google Scholar]
- (45).Liu T; Pantazatos D; Li S; Hamuro Y; Hilser VJ; Woods VL Quantitative assessment of protein structural models by comparison of H/D exchange MS data with exchange behavior accurately predicted by DXCOREX. J. Am. Soc. Mass. Spectrom. 2012, 23, 43–56. [DOI] [PMC free article] [PubMed] [Google Scholar]
- (46).Kuwata K; Matumoto T; Cheng H; Nagayama K; James TL; Roder H NMR-detected hydrogen exchange and molecular dynamics simulations provide structural insight into fibril formation of prion protein fragment 106–126. Proc. Natl. Sci. Acad. USA 2003, 100, 14790–14795. [DOI] [PMC free article] [PubMed] [Google Scholar]
- (47).Craig PO; Latzer J; Weinkam P; Hoffman RM; Ferreiro DU; Komives EA; Wolynes PG Prediction of native-state hydrogen exchange from perfectly funneled energy landscapes. J. Am. Chem. Soc. 2011, 133, 17463–17472. [DOI] [PMC free article] [PubMed] [Google Scholar]
- (48).Petruk AA; Defelipe LA; Rodriguez Limardo RG; Bucci H; Marti MA; Turjanski AG Molecular dynamics simulations provide atomistic insight into hydrogen exchange mass spectrometry experiments. J. Chem. Theory Comput. 2012, 9, 658–669. [DOI] [PubMed] [Google Scholar]
- (49).Hsu Y-H; Bucher D; Cao J; Li S; Yang S-W; Kokotos G; Woods VL Jr; Mc-Cammon JA; Dennis EA Fluoroketone inhibition of Ca2+-independent phospholipase A2 through binding pocket association defined by hydrogen/deuterium exchange and molecular dynamics. J. Am. Chem. Soc. 2013, 135, 1330–1337. [DOI] [PMC free article] [PubMed] [Google Scholar]
- (50).Radou G; Dreyer FN; Tuma R; Paci E Functional dynamics of hexameric helicase probed by hydrogen exchange and simulation. Biophys. J. 2014, 107, 983–990. [DOI] [PMC free article] [PubMed] [Google Scholar]
- (51).McAllister RG; Konermann L Challenges in the interpretation of protein H/D exchange data: a molecular dynamics simulation perspective. Biochemistry 2015, 54, 2683–2692. [DOI] [PubMed] [Google Scholar]
- (52).McAllister RG From solution into the gas phase: studying protein hydrogen exchange and electrospray ionization using molecular dynamics simulation. M.Sc. thesis, The University of Western Ontario, London, 2015. [Google Scholar]
- (53).Mao Y; Zlatic CO; Griffin MD; Howlett GJ; Todorova N; Yarovsky I; Gooley PR Hydrogen/deuterium exchange and molecular dynamics analysis of amyloid fibrils formed by a D69K charge-pair mutant of human apolipoprotein C-II. Biochemistry 2015, 54, 4805–4814. [DOI] [PubMed] [Google Scholar]
- (54).Khakinejad M; Kondalaji SG; Donohoe GC; Valentine SJ Ion mobility spectrometry-hydrogen deuterium exchange mass spectrometry of anions: Part 3. estimating surface area exposure by deuterium uptake. J. Am. Soc. Mass. Spectrom. 2016, 27, 462–473. [DOI] [PMC free article] [PubMed] [Google Scholar]
- (55).Resing KA; Hoofnagle AN; Ahn NG Modeling deuterium exchange behavior of ERK2 using pepsin mapping to probe secondary structure. J. Am. Soc. Mass. Spectrom. 1999, 10, 685–702. [DOI] [PubMed] [Google Scholar]
- (56).Hilser VJ; Freire E Structure-based calculation of the equilibrium folding pathway of proteins. Correlation with hydrogen exchange protection factors. J. Mol. Biol. 1996, 262, 756–772. [DOI] [PubMed] [Google Scholar]
- (57).García AE; Hummer G Conformational dynamics of cytochrome c: correlation to hydrogen exchange. Proteins 1999, 36, 175–191. [PubMed] [Google Scholar]
- (58).Shaw DE; Maragakis P; Lindorff-Larsen K; Piana S; Dror RO; Eastwood MP; Bank JA; Jumper JM; Salmon JK; Shan Y et al. Atomic-level characterization of the structural dynamics of proteins. Science 2010, 330, 341–346. [DOI] [PubMed] [Google Scholar]
- (59).Shaw VS; Mohammadiarani H; Vashisth H; Neubig RR Differential protein dynamics of regulators of G-protein signaling: role in specificity of small-molecule inhibitors. J. Am. Chem. Soc. 2018, 140, 3454–3460. [DOI] [PMC free article] [PubMed] [Google Scholar]
- (60).Phillips JC; Braun R; Wang W; Gumbart J; Tajkhorshid E; Villa E; Chipot C; Skeel RD; Kale L; Schulten K Scalable molecular dynamics with NAMD. J. Comput. Chem. 2005, 26, 1781–1802. [DOI] [PMC free article] [PubMed] [Google Scholar]
- (61).Humphrey W; Dalke A; Schulten K VMD: visual molecular dynamics. J. Mol. Graph. 1996, 14, 33–38. [DOI] [PubMed] [Google Scholar]
- (62).Van der Walt S; Colbert SC; Varoquaux G The numpy array: a structure for efficient numerical computation. Comput. Sci. Eng. 2011, 13, 22–30. [Google Scholar]
- (63).MacKerell AD Jr; Bashford D; Bellott M; Dunbrack RL Jr; Evanseck JD; Field MJ; Fischer S; Gao J; Guo H; Ha S et al. All-atom empirical potential for molecular modeling and dynamics studies of proteins. J. Phys. Chem. B 1998, 102, 3586–3616. [DOI] [PubMed] [Google Scholar]
- (64).Mackerell AD; Feig M; Brooks III CL Extending the treatment of backbone energetics in protein force fields: Limitations of gas-phase quantum mechanics in reproducing protein conformational distributions in molecular dynamics simulations. J. Comput. Chem. 2004, 25, 1400–1415. [DOI] [PubMed] [Google Scholar]
- (65).Maier JA; Martinez C; Kasavajhala K; Wickstrom L; Hauser KE; Simmerling C ff14SB: improving the accuracy of protein side chain and backbone parameters from ff99SB. J. Chem. Theory Comput. 2015, 11, 3696–3713. [DOI] [PMC free article] [PubMed] [Google Scholar]
- (66).Skinner JJ; Lim WK; Bédard S; Black BE; Englander SW Protein dynamics viewed by hydrogen exchange. Protein Sci. 2012, 21, 996–1005. [DOI] [PMC free article] [PubMed] [Google Scholar]
- (67).Towns J; Cockerill T; Dahan M; Foster I; Gaither K; Grimshaw A; Hazle-wood V; Lathrop S; Lifka D; Peterson GD et al. XSEDE: accelerating scientific discovery. Comput. Sci. Eng. 2014, 16, 62–74. [Google Scholar]
Associated Data
This section collects any data citations, data availability statements, or supplementary materials included in this article.