Abstract
Idiopathic pulmonary fibrosis (IPF) is a chronic lung disease characterized by progressive decline of lung function. Here, we tested the importance of differential proportions of blood immune cells to IPF clinical outcomes. We used Cibersort to deconvolute immune cell components based on PBMCs or whole blood IPF genomics datasets. We found that a higher proportion of resting memory (RM) T cells was associated with a better survival and a higher DLco (diffusing capacity for carbon monoxide) in IPF patients. The association was also found in opposite direction for monocytes. Additionally, in IPF patients as compared to healthy controls, proportions of monocytes were observed to be higher, yet RM T cells were observed to be lower. Taken together, our result suggests a beneficial effect of RM T cells and a detrimental effect of monocytes for IPF. Future genomics studies of IPF should be more focused on these two types of cells.
Keywords: pulmonary fibrosis, memory T cells, monocytes, Cibersort
Introduction:
Idiopathic pulmonary fibrosis (IPF) is a progressive and fatal lung disease with increasing incidence, prevalence, and mortality. It was reported that IPF prevalence in 65 year or older subjects has doubled in the past decade, from 202.2 cases per 100,000 people in 2001 to 494.5 cases per 100,000 people in 2011 (1). The pathological feature of IPF is characterized by temporally heterogeneous interstitial fibrosis. A variety of risk factors have been identified, including older age, male sex and cigarette smoking (2) as well as genetic mutations in a number of genes, such as surfactant proteins (e.g., surfactant protein C (3)), those involved in telomere maintenance (e.g., TERT (4)) and MUC5B (5). Genetic mutations for IPF were comprehensively reviewed by Steele et al. (6).
Transcriptomic analyses of peripheral blood mononuclear cells (PBMCs) or whole blood have been performed to identify important genes/pathways as biomarkers or functional modules for IPF. For example, a study of 120 IPF patients identified CD28, ICOS, LCK and ITK genes and “The costimulatory signal during T cell activation” Biocarta pathway for association with transplant-free survival (7). Additionally, network analyses of the gene expression data from whole blood identified gene modules associated with IPF, highlighting important roles for genes such as NLRC4, PGLYRP1, MMP9, and DEFA4 (8).
These genomics studies, together with others using peripheral blood or PBMCs, have made important contributions to the understanding of genomics and pathogenesis of IPF. However, since PBMCs or whole blood contain heterogeneous populations of different types of immune cells, e.g., T cells, B cells, monocytes, NK cells, etc., and each cell type has their own unique expression signature and function, the overall expression profiles of PBMCs or whole blood represent a “mosaic” of these mixed expression patterns from different cells. Differential expression at the gene level using PBMCs or whole blood may hence be caused by differential “abundance” or “proportions” of one or several cell types. Moreover, a specific type of immune cell may be uniquely important to the IPF disease process and using PBMCs or whole blood that pools different immune cells together may “cloud the signals” of contributions to IPF pathogenesis from a specific cell type.
Motivated by the above reasons we initiated a study of the abundance of immune cells from PBMCs or whole blood in IPF subjects so as to correlate the proportion of a specific immune cell type to the IPF disease outcome. We took advantage of a powerful software, Cibersort (9), which enumerates cell composition of a complex specimen based on deconvolution of the genomic profile of the specimen using signature profiles of different cell types. Using the LM22 signature file (provided by Cibersort (9)) that contains 22 distinct types of immune cells (derived from microarray data of human immune cells), our deconvolution of immune cell types from PBMCs or whole blood has been successful as shown by the extreme low p values (0.000) for each specimen (Appendix 1).
We selected several large (sample size) datasets for genomic analyses of PBMCs or whole blood in IPF with GEO accession numbers of GSE28042 (7), GSE27957 (7), GSE93606 (8) and GSE38958 (10). The total sample size involved is ~300 subjects. After inferring the 22 immune cell proportions from each specimen, we correlated a cell’s proportion to IPF clinical outcomes,4 including the survival time (in two studies (7, 8)), DLco (diffusing capacity for carbon monoxide) (in the third study (10)) or IPF disease status (by comparing with the healthy control subjects) (in the third study (10)).
Our study has identified that the proportions of resting memory (RM) T cells and monocytes are associated with IPF outcomes. Specifically, a higher proportion of RM T cells was associated with a longer survival time in IPF patients, and these cells were at higher proportions in healthy vs. IPF subjects. In contrast, a higher proportion of monocytes was associated with a shorter survival time in IPF patients, and monocytes were at lower proportions in healthy vs. IPF subjects. In addition, a higher proportion of RM T cells was associated with a higher DLco, while a higher proportion of monocytes was associated with a lower DLco. Overall, our studies suggested a protective role for RM T cells and a detrimental role for monocytes in IPF.
Our study provides evidence of the importance of two specific immune cell subsets in the peripheral circulation, i.e., RM T cells and monocytes, for IPF pathogenesis. These data may form the basis for IPF diagnosis/prognosis based on counting specific immune cells from blood. It also provides justification for more focused analyses (e.g., RNA-seq or epigenomics analyses) of these two specific cells in terms of their mechanistic functions in IPF pathogenesis.
Results:
Dataset 1:
GEO accession number: GSE28042 (7). This dataset contains gene expression data of PBMCs from 75 IPF and 19 healthy control subjects, with an average age of 65.8 years and an age range of 39–85 years. The gender makeup is 30 females (23 IPF vs. 7 controls) vs. 64 males (52 IPF vs. 12 controls).
Among the 75 IPF subjects, 43 had clinical outcome defined as either lung transplant or death. Hence, transplant-free survival (TFS) was used to define survival. 32 subjects were censored at the end of the study. These 75 subjects are part of the study (7) that contains 120 IPF patients. The other 45 IPF subjects come from the Dataset 2 (as follows), GSE27957.
The survival time was in years, which is years to outcome (YTO, i.e., lung transplant or death) which has a mean of 1.76 (0.013 – 4.186) years, with a standard deviation of 1.17 years.
Using Cibersort (9), we performed analyses on the total 94 subjects using the genome-wide gene expression data based on the LM22 signature file. LM22 is a 547×22 gene signature matrix that contains signature profiles for 22 distinct immune cell types (along the columns) and the profile is made up of expression measures for 547 genes (along the rows).
The resultant cell proportion file for these 94 subjects/specimens is shown in Appendix 1.1 All 94 samples achieved a p value of 0.000, indicating statistical significance of the deconvolution result across the 22 immune cell subsets.
Shown in Appendix 2 (Table 1) is the summary of the proportions of each cell type across the 94 subjects. Note the numbers shown in the table are in percent. The cell types are ranked ascendingly for the mean proportions across the 94 subjects.
Dataset 2:
GEO accession number: GSE27957 (7). This dataset was generated on PBMCs from 45 IPF patients. These 45 subjects are part of the study (7) that contains 120 IPF patients. The other 75 subjects come from the above dataset, GSE28042.
These 45 subjects contain 5 females and 40 males. The age range is from 43 to 84 years. The survival-related outcome was defined as in Dataset 1, which is years to lung transplant or death. 15 subjects were observed to have the outcome and 30 subjects were censored.
The average YTO is 1.85 years (0.01–3.17 years), with a standard deviation of 0.98 years.
Using gene expression data of these 45 subjects, we performed Cibersort analyses (9) based on the LM22 signature file. All 45 samples achieved a p value of 0.000. The result is shown in Appendix 1.2.
Appendix 2 (Table 2) shows the summary statistics for the proportions (in percent) of the 22 immune cell components in these 45 subjects. Note in these subjects’ PBMCs, there appears to be a higher proportion of neutrophils than expected (mean 7.25%). This might be due to the excessive extraction of the plasma/Ficoll interface for some samples during the PBMC isolation procedure, leading to granulocyte contamination (especially neutrophils).
To remove the effects of neutrophil contamination, we re-calculated (re-scaled) the cell proportions in each subject by re-scaling each cell’s proportion with 1-neutrophil proportion. Appendix 2, Table 3 shows the re-scaled cell proportions excluding neutrophils.
Datasets 1 and 2 combined:
We then combined the data (the re-scaled cell proportion data and patient characteristics data) from these 45 IPF subjects (Dataset 2) with those from the 75 IPF subjects in Dataset GSE28042 (Dataset 1), forming a combined dataset with 120 IPF patients.
These 120 subjects have a mean age of 68.3 years (43–85 years, sd (standard deviation) = 8.2 years) and a gender make-up of 28 females vs. 92 males. Among them, 58 subjects had observed survival-related outcome (death or lung transplantation) and 62 were censored at the end of the study. The YTO has a mean of 1.79 years (from 0.008 to 4.19 years, sd = 1.10 years).
The summary statistics of cell proportions (in percent) for these 120 subjects are shown in Appendix2, Table 4.
As shown in the table, 7 cell types (e.g., Dendritic.cells.resting) have a low variation (standard deviation < 1 percent) across all the subjects. This low variation is due to 0 or near 0 percent of proportion for the cell type for a large number of subjects. We therefore removed the 7 cell types and kept the remaining 14 cell types for downstream analyses.
Using the combined data, we performed survival analysis (via survival regression model, assuming exponential distribution of survival time) to correlate the YTO with a cell’s proportion, adjusting for age and gender. Adjusting for multiple testing using FDR, several cell types have significant association with IPF survival at FDR<0.05, which include monocytes, activated NK cells, RM T cells, M2 macrophages, and naïve T cells.
Table 1 shows survival regression coefficient for each cell type that achieved an FDR <0.05 in the survival model as well as the p value for the coefficient and the FDR for multiple testing correction.
Table 1:
Cells whose proportions are significantly associated with survival of IPF patients
| Cell type | Regression Coefficient |
P value | FDR |
|---|---|---|---|
| Monocytes | -0.04 | 3.51E-04 | 7.72E-03 |
| NK.cells.activated | -0.37 | 7.42E-04 | 8.03E-03 |
| T.cells.CD4.memory.resting | 0.08 | 1.10E-03 | 8.03E-03 |
| Macrophages.M2 | 0.51 | 3.99E-03 | 2.20E-02 |
| T.cells.CD4.naive | 0.09 | 8.35E-03 | 3.68E-02 |
As shown in the table, proportions of monocytes and activated NK cells appear to have negative associations with IPF survival, i.e., the higher the proportions, the shorter the survival time. On the other hand, RM T cells, M2 macrophages and naïve T cells appear to have positive association with IPF survival, i.e., the higher the proportions, the longer the survival time.
According to the table, on average, a 10 percentage increase of monocyte proportion may accelerate the time to event by a factor of [exp(−0.04)]^10, which is 0.67, i.e., 0.67 times shorter survival time compared to the baseline.
Also, on average, a 10 percentage increase of RM T cell proportion may delay the time to event by a factor of [(exp(0.08)]^10, which is 2.23, i.e., 2.23 times longer survival time compared to the baseline.
We plotted Kaplan-Meier curves (Figure 1) to compare the survival times among IPF subjects whose monocyte proportions are located at 1st, 2nd, 3rd and 4th quartiles. We plotted the Kaplan-Meier curves (Figure 2) also for RM T cells. As shown in the two plots, there is a clear separation of survival curves between 1st quartile and 4th quartile subjects (i.e., whose monocytes or RM T cells belong to 1st or 4th quartile in terms of cell proportions).
Figure 1:
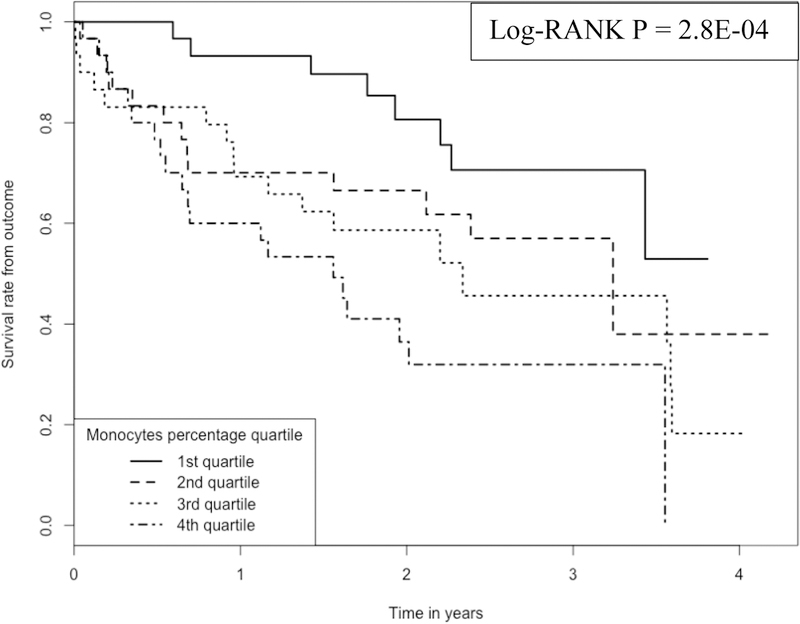
Kaplan-Meier curve comparing 120 IPF patients with different monocyte proportions Note:1.Data come from dataset 1(GSE28042) and dataset 2 (GSE27957). 2. Log-RANK p value is for comparison between subjects with cell proportions at the 1st or the 4th quartiles, respectively.
Figure 2:
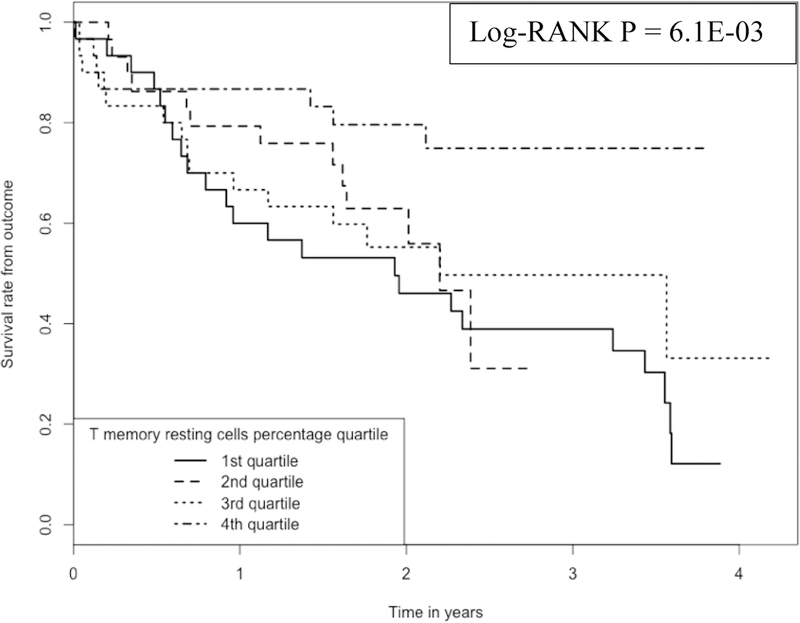
Kaplan-Meier curve comparing 120 IPF patients with different RM T cell proportions Note: 1.Data come from dataset 1(GSE28042) and dataset 2 (GSE27957). 2. Log-RANK p value is for comparison between subjects with cell proportions at the 1st or the 4th quartiles, respectively.
The Log-Rank test to compare the survival times between subjects whose monocyte proportions are at the 1st vs. those whose monocyte proportions are at the 4th quartile achieved a p value of 2.8E-04.
The Log-Rank test to compare the survival times between subjects whose RM T cell proportions are at the 1st vs. those whose monocyte proportions are at the 4th quartile achieved a p value of 6.1E-03.
According to Figure 1, the survival rate for subjects at ~2 years was >80% for subjects having the lowest monocyte proportion (1st quartile of monocyte proportion, with a mean proportion of 33.4% and a range of 18.7% - 39.9%) whereas the survival was <40% for those subjects having the highest monocyte proportion (4th quartile of monocyte proportion, with a mean proportion of 64.1% and a range of 58.3% - 77.1%).
Similarly (Figure 2), the survival rate at ~2 years was ~80% for those subjects having the highest RM T cell proportions (the 4th quartile of RM T cell proportion, with a mean proportion of 17.0% and a range of 12.6% - 26.1%), while the survival was only ~50% for those subjects having the lowest RM T cell proportions (1st quartile of RM T cell proportion, with a proportion of 0%).
Dataset 3:
GEO accession number: GSE93606 (8).
This is a transcriptomic study of whole blood from IPF subjects. The dataset contains 57 IPF (38 male and 19 female) subjects and 20 control (12 male and 8 female) subjects. The IPF subjects had a mean age of 67.4 years (50–84 years, sd = 8 years). The control subjects had a mean age of 66.0 years (48–83 years, sd = 10.6 years).
Time to outcome for those patients with observed outcome (i.e., death or decline in predicted Percent of Forced Vital Capacity (FVC) >10% over a six-month period) ranged from 2 to 32 months, with a mean of 16.15 months and a standard deviation of 9.40 months.
Cibersort analyses were performed on each subject using the LM22 signature file. Again, each sample achieved a p value of 0.000 in the Cibersort analyses. The results are shown in Appendix 1.3.
From some IPF subjects, whole blood samples were collected at multiple time points (i.e., months 0, 1, 3, 6 and 12). Among them, 13 subjects were collected at all 5 time points, 6 subjects were collected at 4 time points, 10 subjects were collected at 3 time points, 7 subjects at 2 time points. The remaining 21 subjects were collected at only one time at baseline (month 0). We therefore used the mean proportion across multiple time points for those IPF subjects whose blood samples were collected at multiple times.
Shown in Appendix 2, Table 5 are the summary statistics for the proportions (in percent) of different immune cell types.
As shown in the table, 3 cell types (follicular helper T cells, M1 macrophages and resting dendritic cells) are absent (0%) in all subjects and ten cell types (e.g., memory B cells) have a low variation (standard deviation < 1 percent) across all the subjects. This low variation is due to 0 or near 0 percent of proportion for the cell type for a large number of subjects. We therefore remove the above cell types (a total of 13) and keep the remaining nine cell types for downstream analyses.
The subjects also have DLco and FVC (Percent predicted Forced Vital Capacity) information, with a mean DLco of 39.2% and standard deviation of 14.1% and a mean FVC of 72.2% and a standard deviation of 20.3%.
Survival analyses were performed on these 57 IPF subjects using the survival data from each subject. At nominal significance level (alpha = 0.05) RM T cells (p = 3.26e-2) and neutrophils (p=3.92e-2) achieved statistical significance for association with IPF survival.
Kaplan-Meier analyses were performed to compare subjects belonging to the 4 quartiles of a RM T cell proportion (Figure 3). Again, RM T cell proportions in the blood have a positive association with IPF survival; the higher the proportion the longer the survival. For example, at ~15 months, the survival rate is ~85% for those subjects with the highest (4th quartile, with a range of cell proportions of 4–11%) proportion of RM T cells in the blood, which is in contrast to the survival rate of ~45% for those subjects with the lowest (1st quartile, with a range of cell proportions of 0–0.3%) proportion of the cells.
Figure 3:
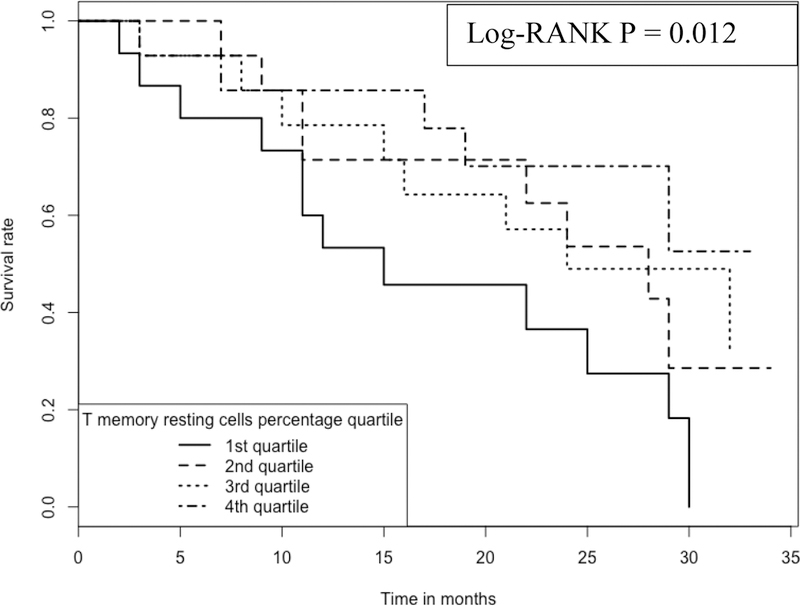
Kaplan-Meier curve comparing 57 IPF patients with different RM T cell proportions Note: 1.Data come from dataset 3 (GSE93606). 2. Log-RANK p value is for comparison between subjects with cell proportions at the 1st or the 4th quartiles, respectively.
In contrast, the proportion of neutrophils in the blood has a negative association with IPF survival; the higher the proportion the worse the survival (Figure 4). For example, at ~15 months, the survival rate is ~80% for those subjects with the lowest (1st quartile, with a range of cell proportions of 24–45%) proportion of neutrophils in blood, which compares to the survival rate of ~40% for those subjects with the highest (4th quartile, with a range of cell proportions of 58–71%) proportion of the cells.
Figure 4:
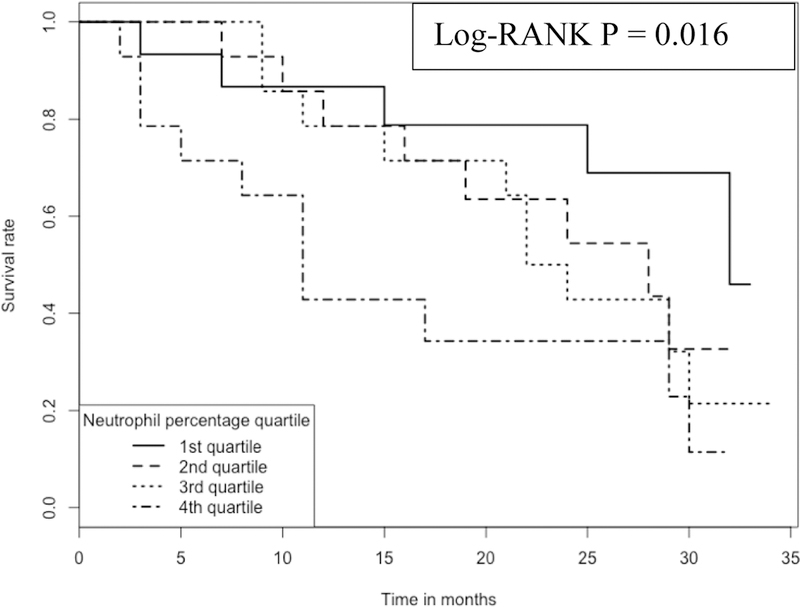
Kaplan-Meier curve comparing 57 IPF patients with different neutrophil proportions Note: 1.Data come from dataset 3 (GSE93606). 2. Log-RANK p value is for comparison between subjects with cell proportions at the 1st or the 4th quartiles, respectively.
Note the above proportion for RM T cells is within whole blood, not within the PBMC compartment, as in the first two datasets. However, if we re-scaled the RM T cells’ proportion to that for the PBMCs compartment by dividing its proportion in blood with (1-neutrophil’s proportion), we still achieved a significant result for the survival analysis (p = 0.047).
Datasets 1, 2 and 3 combined:
To maximize the statistical power, we combined the Dataset 3 with the combined 120 subjects (Datasets 1 and 2).
Note Datasets 1 and 2 are from PBMCs yet Dataset 3 is from whole blood. The major difference between the PBMCs datasets (Datasets 1 and 2) and the whole blood dataset (Dataset 3) is neutrophils that on average makes up ~50% of cell proportion in whole blood (see Appendix 2, Table 5). Therefore, in the combined dataset, we did not include neutrophils.
Also, the cell proportions in Datasets 1 and 2 are in the scale of PBMCs, i.e., relative to all the cells in PBMCs. Yet the cell proportions in Dataset 3 is in the scale of whole blood, i.e., relative to all the leukocytes in the whole blood. To make the cell proportions comparable in terms of scale, we re-scaled the cell proportions in Dataset 3 (so that they will be in the scale of PBMCs) by dividing each cell’s proportion with (1-neutrophil’s proportion) for a sample.
As mentioned above, in Dataset 3 we removed those cells (13 in total) whose proportion’s standard deviation is <1%. Also, in the Datasets 1 and 2 combined, we removed 7 cell types whose proportion’s standard deviation is <1%. Therefore, in the Datasets 1, 2 and 3 combined, we only have 8 common cell types for analysis, which are naïve B cells, CD8 T cells, CD4 naïve T cells, CD4 resting memory T cells, CD4 activated memory T cells, resting NK cells and monocytes.
Lastly, we transformed the survival time in the scale of YTO in Datasets 1 and 2 to survival months (by multiplying 12) in order to make the time to outcome in the same scale of months across the three datasets.
The combined dataset has 177 subjects, among whom, 130 are males and 47 are females.
Among the 177 subjects, 92 (74 males and 18 females) have the observed IPF outcome (death, lung transplantation or a >10% decline of FVC over a six-month period) and 85 (56 males and 29 females) are censored.
The subjects have a mean age of 68 years, with a standard deviation of 8.1 years. The time to IPF outcome has a mean of 15.1 months and a standard deviation of 11.5 months. The time of observation for censored subjects has a mean of 27.3 months and a standard deviation of 9.4 months.
Using the combined data, we performed survival analysis (via a survival regression model, assuming exponential distribution of survival time) to correlate the survival months with a cell’s proportion, adjusting for age and gender.
RM T cell is the only cell type that achieved significant relationship (p = 2.65e-4, FDR = 2.12e-with the IPF survival time, with a survival regression coefficient of 0.0733. Under the exponential survival model, this coefficient may translate into a prediction that a 10 percent increase of RM T cell proportion may delay the time to IPF outcome by a factor of 2.08, i.e., (exp(0.0733))^10.
Cox proportional hazards regression analysis was also performed for the relationship between survival time with RM T cell proportions, adjusting age and gender. A p value of 3.67e-4 was achieved for the RM T cell proportions, with a coefficient of −0.072, which suggests that a 1 percent increase of RM T cell proportion may be associated with a hazard ratio of 0.9305 (exp(−0.072)), i.e., a decrease of hazard of ~7% for IPF. Correspondingly, a 10 percent increase of RM T cell proportion may be associated with a decrease of IPF hazard of >50% (= 1-(exp(−0.072))^10) for IPF.
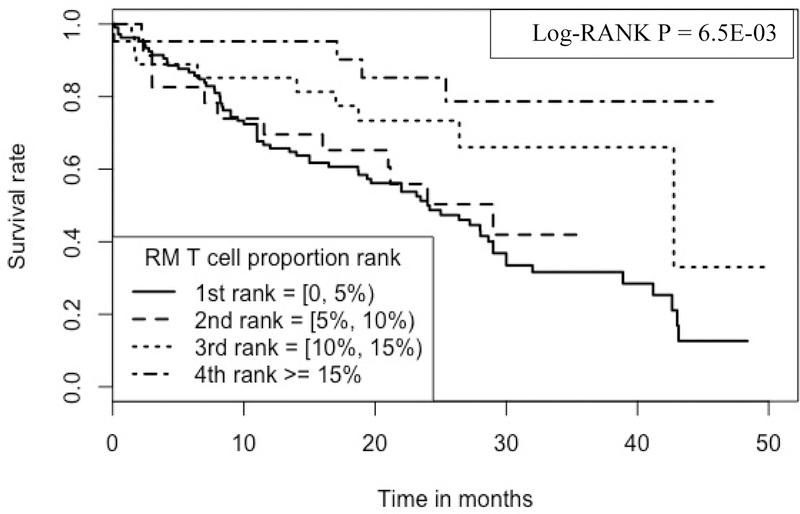
Kaplan-Meier analyses were performed to compare survival rates for subjects belonging to the 4 ranks of a RM T cell proportions (Figure 5), where 1st rank subjects have RM T cell proportions >/=0 and < 5%, 2nd rank: >/= 5% and < 10%, 3rd rank: >/= 10% and <15% and 4th rank: >/= 15%.
Figure 5:
Kaplan-Meier curve comparing 177 IPF patients with different RM T cell proportions Note: 1.Data come from dataset 1(GSE28042), dataset 2 (GSE27957) and dataset 3 (GSE93606). 2. Log-RANK p value is for comparison of subjects with cell proportions at the 1st vs. the 4th ranks, respectively.
As shown in the figure, RM T cell proportions have a positive association with IPF survival; the higher the proportion the longer the survival. For example, at 30 months, the survival rate is ~78.7% for those subjects with the highest proportion of RM T cells (i.e., 4th rank, RM T cell proportions ranging from 15.03% to 26.11%), which is in contrast to the survival rate of ~33.5% for those subjects with the lowest proportion of the cells (i.e., 1st rank, RM T cell proportions ranging from 0 to 4.56%).
Dataset 4:
GEO accession number: GSE38958 (10)
This dataset contains gene expression analyses of PBMCs from 70 IPF patients (58 males vs. 12 females) vs. 45 healthy controls (27 males vs. 18 females).
Among these subjects, 60 IPF patients had age information and their mean age is 68.2 years. Thirty-five healthy controls had age information and their mean age is 69.3 years. The remaining subjects do not have age information.
The majority of the subjects are Caucasians (n =85). In addition, 17 subjects are African Americans, 6 subjects Hispanic Americans, 1 subject Asian American and 6 subjects with ethnicity unknown.
60 IPF patients had DLco information, with a mean of 43.3% (range: 30.8%−97%) and a standard deviation of 18.3%. 60 IPF patients also had FVC information, with a mean of 62.4% (range: 30%−92%) and standard deviation of 15.0%.
The results of our Cibersort analyses results of these 115 subjects are shown in Appendix 1.4. Again, for each of these 115 PBMC samples, the p values achieved in the Cibersort analysis (9) is 0.000. The summary statistics (in percent) for cell proportions inferred from Cibersort analysis (9)using LM22 signature file for the total 115 PBMCs samples are listed in Appendix 2, Table 6.
As shown in the table, the mean neutrophil percentage is 2.03, suggesting a minor granulocyte (neutrophil) contamination in the specimens during the PBMC isolation process. Histogram and stem-leaf plot analyses (not shown here) indicated that the majority (n>90) of samples have a neutrophil percentage value of 0, suggesting that the contamination is limited to only a few samples.
To adjust for the effects from the neutrophil contamination for some samples, we used the same method (as above) by re-calculating (re-scaling) each cell type’s proportion in each sample using the original proportion divided by (1-neutrophil’s proportion). Appendix 2 (Table 7) shows the summary statistics for the revised (re-scaled) cell proportions. Note three cell types, M1 macrophages, resting dendritic cells and activated mast cells, with 0 percent across all the samples were removed from further analyses and hence are not shown here. Also excluded is the neutrophil itself. As shown in the re-scaled table (Appendix 2, Table 7), there is little difference in the cell proportions from the original summary statistics table (Appendix 2, Table 6).
Using the above re-scaled cell proportions, we performed logistic regression analyses, modeling IPF status as the dependent variable and the cell proportions as independent variables, while adjusting for age, gender and ethnicity as covariates. Only monocytes (p= 0.0034) and naïve B cells (p = 0.0039) achieved significance, while RM T cells achieved a p value (p = 0.13) that is close to marginal significance (p = 0.10) and is the most significant after monocytes and naïve B cells.
Here, monocytes have a higher proportion in IPF (mean = 43.9%) vs. control subjects (mean = 37.3%) (Figure 6) and RM T cells have a lower proportion in IPF (mean = 14.2%) vs. control subjects (mean = 17.5%) (Figure 7). This direction of association of monocytes and RM T cells with IPF status is consistent with the survival analyses, where a higher proportion of monocytes was associated with a worse outcome (lower survival) yet a higher proportion of RM T cells associated with a better outcome (higher survival). As shown in Figures 6 and 7, the p values are 1.2E-4 and 6.1E-3 for comparing monocytes and RM T cells, respectively, using Wilcoxon rank test.
Figure 6:
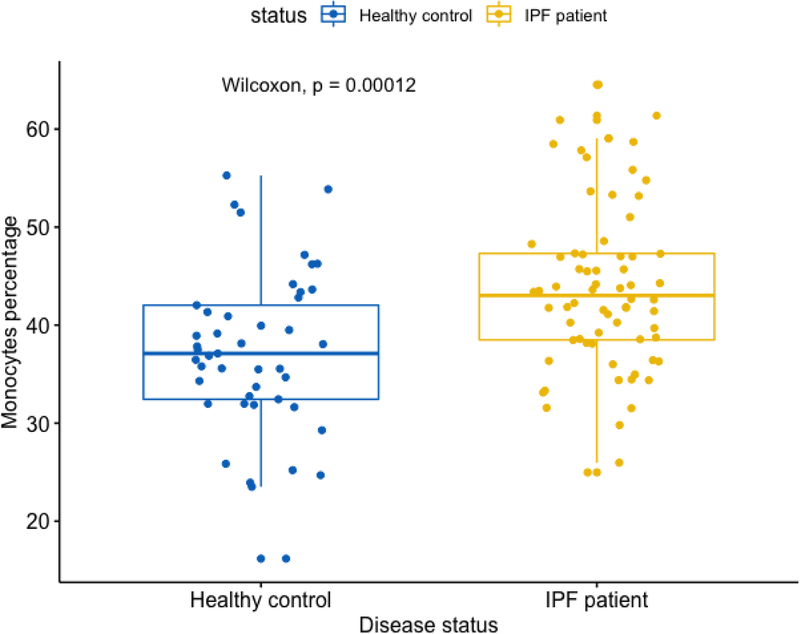
Boxplot comparing monocyte proportions in IPF vs. control subjects Note: Data come from dataset 4 (GSE38958).
Figure 7:
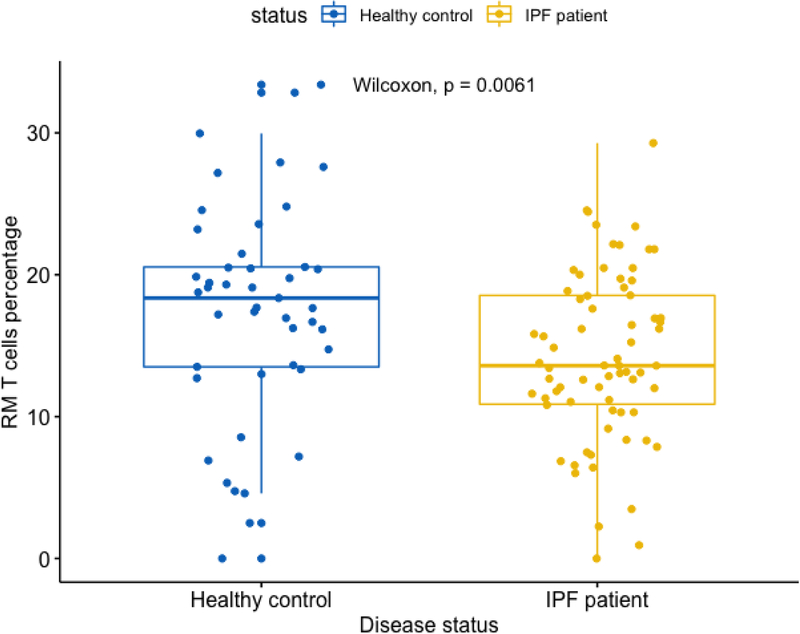
Boxplot comparing RM T cell proportions in IPF vs. control subjects Note: Data come from dataset 4 (GSE38958).
We also examined the association of cell proportions with DLco, adjusting for age, gender and ethnicity. Again, RM T cells and monocytes achieved significant p values (p <0.05) for association with DLco. While the RM T cell proportion has a positive association with DLco (p = 0.023) (Figure 8), the proportion of monocytes has a negative association with DLco (p = 0.044) (Figure 9). Again, these data are consistent with the previous findings suggesting a better outcome for subjects with a higher proportion of RM T cells and a worse outcome for subjects with a higher proportion of monocytes.
Figure 8:
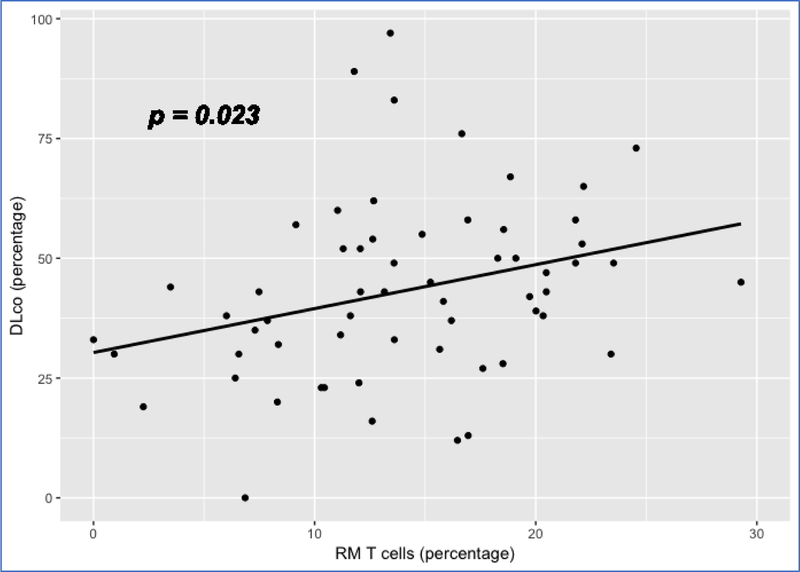
Scatterplot showing the linear relation between RM T cell proportion and DLco Note: 1. Data come from dataset 4 (GSE38958). 2. P value is based on a full regression model adjusted for age, gender and ethnicity
Figure 9:
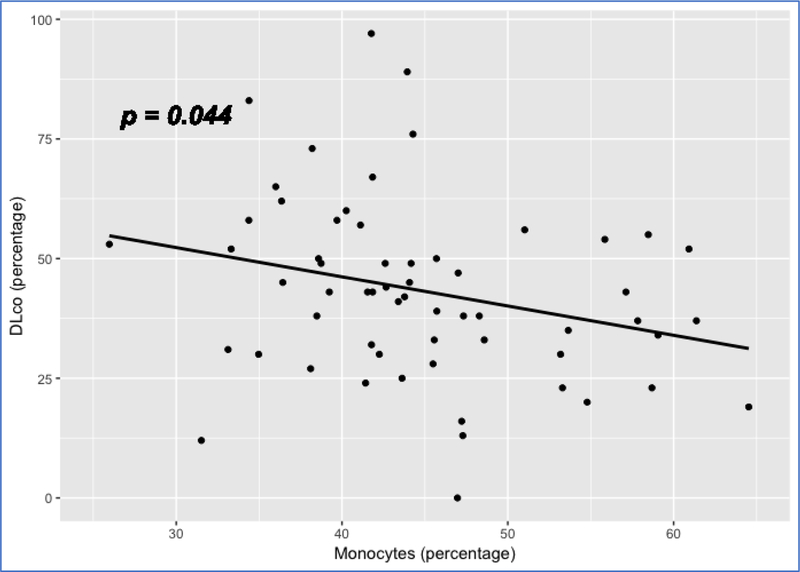
Scatterplot showing the linear relation between monocyte proportion and DLco Note: 1. Data come from dataset 4 (GSE38958). 2. P value is based on a full regression model adjusted for age, gender and ethnicity
Discussion:
In this study, we took advantage of the genomics data of PBMCs or whole blood of IPF patients to enumerate proportions of 22 immune cell types in their blood. Through correlating the immune cell components with IPF outcomes, including survival time, IPF status and DLco, we found a consistent pattern of differential proportion of RM T cells and monocytes, which are associated with IPF survival, IPF status and DLco. In general, a higher proportion of RM T cells was observed in healthy controls than in IPF patients (Figure 6) and was associated with a better survival (Figures 2, 3 and 5) and a higher level of DLco in IPF patients (Figure 8). In contrast, a higher proportion of monocytes was observed in IPF than in control subjects (Figure 6) and was associated with a worse survival (Figure 1) and a lower level of DLco in IPF patients (Figure 9). Our data suggested a protective role for RM T cells and a detrimental role for monocytes in IPF.
Our findings are supported by studies using mouse models. For example, a recent study demonstrated the protective role of tissue-resident memory T cells (Trm) for IPF (11), where vaccine-induced lung Trm was found to reverse lung collagen, fibrocytes, and histologic injury and improve physiologic function in a mouse model of bleomycin-induced lung fibrosis. The study proposed a mechanism, where Trm in the lung may promote an immune microenvironment that can arrest and reverse the chronic processes in IPF.
For monocytes, their detrimental role to IPF has been suggested by a study, where CCR2+ infiltrating monocyte-derived macrophages may play a critical role in the development of radiation-induced pulmonary fibrosis (12). In another study, it was found that monocyte-derived alveolar macrophages may drive lung fibrosis by expressing profibrotic genes, while tissue-resident alveolar macrophages did not contribute to fibrosis (13). Both of the studies pointed to the potential importance of circulating monocytes as a source for the local macrophages that mediate the pathological process of IPF, which are again consistent with our findings of the unfavorable outcome (e.g., worse survival) for subjects with a higher proportion of circulating monocytes.
Our study also suggested neutrophils as another detrimental cell type for IPF as a higher proportion of neutrophils in the blood was associated with a lower survival rate (Figure 4). The detrimental role of neutrophils in IPF was suggested by a study, where high levels of neutrophil elastase were detected in the lung parenchyma and also in both the BALF (bronchoalveolar lavage fluid) and sera (14). Considerable numbers of neutrophils were also shown to infiltrate the lung parenchyma according to immunohistochemistry (14). A more recent study also demonstrated that neutrophil elastase may promote myofibroblast differentiation in lung fibrosis (15). Also, accumulation of neutrophils in the lungs of IPF patients was mediated by chemotactic factors released by alveolar macrophages (16).
Taken together, the findings from our study are supported by earlier evidence. As a potential usage to the field, RM T cells’ protective role should be considered in IPF treatment so that patients’ survival can be improved. For example, strategies that expand the population of memory T cells may be explored. In addition, cell and fraction counts of these key immune cell types, especially RM T cells and monocytes within the PBMC compartment and neutrophils within whole blood, may also represent useful tools for IPF prognosis and hence should be
closely monitored during the disease process. Future genomics studies of IPF may be focused more on these important cells, especially RM T cells and monocytes, so that the mechanistic roles of these specific cells in the disease process can be further elucidated.
Cibersort (9) is a software for cell proportion enumeration based on gene expression data. According to the study (9), the performance of the software has been validated by flow cytometry analysis. In particular, there was a significant correlation (p</=0.02) between Cibersort analysis and flow cytometry for RM T cells and monocytes as well as other immune cells, as discovered using blood samples from 27 adult subjects (9). Therefore, the cell proportions imputed using Cibersort in our study should be reliable, which is further supported by the extreme low p values (p = 0.000) for the cell proportions inferred for each sample (see Appendix 1). Moreover, our main purpose is to correlate the imputed cell proportions with survival outcomes, not to use the inferred cell proportions as a measure for disease diagnosis. Since the imputed cell proportions have a significant correlation with flow cytometry results, it is reasonable to project that our findings may not be significantly different from those achieved using “real” flow cytometry data.
Nevertheless, as a key limitation, our findings were based on in silico genomics data mainly of cross-sectional designs. It is necessary to further validate our findings using a longitudinal study design (ideally with flow cytometry data) or with mechanistic experiments on model animals.
Methods:
All of the analyses were performed using basic R functions and specific R packages for statistical analysis.
Specifically, we downloaded the four microarray datasets (i.e., the Series Matrix Files) from GEO (Gene Expression Omnibus) website (https://www.ncbi.nlm.nih.gov/geo/). The GEO accession numbers of the datasets are provided in the Results section. The gene expression count matrix was annotated for gene symbols using the platform files provided in GEO. For example, for the GSE28042 dataset, the platform file used for annotation is GPL6480.
LM22 is the signature genes file we used for Cibersort analyses (9). The file contains expression counts for 547 signature genes (547 rows) for 22 distinct human immune cells (22 columns). The annotated gene expression count matrix file (as the gene expression mixture file), together with the LM22 signature file, were the input files for Cibersort analyses (9).
The technical details of Cibersort analyses are provided in its website https://cibersort.stanford.edu/index.php as well as the published paper (9). In principle, the method involves a deconvolution model m=f x B, where m is the gene expression mixture file, B a gene expression profile (GEP) signature matrix and f a vector consisting of the unknown fractions of each cell type in the mixture. The process is essentially solving f through this system of linear equations based on information in m and B. The signature matrix, B, is built by expression data of purified or enriched cell populations. Specifically, for the LM22 signature matrix, GEP data was obtained from the public domain for 22 leukocyte subsets profiled on the HGU133A platform (9).
The resultant file from Cibersort analysis (9) is a matrix with rows corresponding to input samples and columns corresponding to the 22 specific cell types. Please see Appendix 1 for details. Inside the matrix are the proportions of a specific cell type in a specific sample. The resultant file also contains a p value for each sample, which is statistical significance of the deconvolution result across all cells for a sample.
We exported each resultant file from Cibersort analysis (9) as a .csv file and then merged the file by the sample name with the design matrix of a study. The design matrix was extracted from the top section of a Series Matrix File downloaded from GEO. The merged file has rows corresponding to specific samples from human patients and columns corresponding to the variables, including patients’ characteristics, e.g., age, gender, race, IPF status, DLco, etc., as well as cell proportions for the 22 specific immune cells. This merged file was used in survival and other downstream analyses.
For survival analyses, we used R package, Survival (17, 18), and implemented the “survreg” function, assuming exponential distribution for the survival time. The Cox proportional hazard regression analysis was also performed using the Survival package with the “coxph” function. The survival time was modeled as a function that is determined by a cell’s proportion as well as other key covariates, such as age and gender.
For the Kaplan-Meier curve analyses (Figures 1–5) to compare subjects with different quartiles (or ranks) of a cell’s proportion, the Survfit function in the Survival package (17, 18) was used.
We also used “pairwise_survdiff” function of the “survminer” package to compare subjects in terms of survival whose cell proportions belong to the 1st or the 4th quartile (or rank) (Figures 1–5) in order to infer the Log-RANK p values.
To compare a cell’s proportion between IPF and normal control subjects while controlling for other key covariates, such as age, gender and race, we used R’s glm function that modeled IPF status as the dependent variable (using logit link function in binomial family) and a cell’s proportion and the covariates as independent variables. We also used R’s lm function to model relationship between DLco and a cell’s proportion, controlling for covariates, such as age, gender and ethnicity.
Box plots in Figures 6 and 7 were drawn using R package ggpubr. Scatterplots in Figures 8 and 9 were drawn using R package ggplots (19).
Supplementary Material
Immune cells’ proportions are key to idiopathic pulmonary fibrosis (IPF) outcomes.
Resting memory (RM) T cells appear to be protective and monocytes detrimental.
The higher the proportions of RM T cells, the longer the patients’ survival time.
The higher the proportions of monocytes, the shorter the patients’ survival time.
The two cells’ proportions are also associated with diffusing capacity of lung.
Acknowledgement
Investigators (YZL, SS, GFM, CAM) are partially supported by Gulf of Mexico Research Initiative Grant GoMRI2017-VI-B370.
YZL is also partially supported by NIH R01 MH116844–01, NIH/Fogarty 1U2RTW010673–01 and NSF 1604129.
Footnotes
Publisher's Disclaimer: This is a PDF file of an unedited manuscript that has been accepted for publication. As a service to our customers we are providing this early version of the manuscript. The manuscript will undergo copyediting, typesetting, and review of the resulting proof before it is published in its final citable form. Please note that during the production process errors may be discovered which could affect the content, and all legal disclaimers that apply to the journal pertain.
The investigators have nothing to disclose for conflicts of interest.
Literature Cited
- 1.Raghu G, Chen SY, Yeh WS, Maroni B, Li Q, Lee YC, Collard HR. Idiopathic pulmonary fibrosis in US Medicare beneficiaries aged 65 years and older: incidence, prevalence, and survival, 2001–11. Lancet Respir Med 2014;2(7):566–72. Epub 2014/05/31. doi: 10.1016/S2213-2600(14)70101-8. PubMed PMID: 24875841. [DOI] [PubMed] [Google Scholar]
- 2.Baumgartner KB, Samet JM, Coultas DB, Stidley CA, Hunt WC, Colby TV, Waldron JA. Occupational and environmental risk factors for idiopathic pulmonary fibrosis: a multicenter case-control study. Collaborating Centers. Am J Epidemiol 2000;152(4):307–15. Epub 2000/09/01. PubMed PMID: 10968375. [DOI] [PubMed] [Google Scholar]
- 3.Chibbar R, Shih F, Baga M, Torlakovic E, Ramlall K, Skomro R, Cockcroft DW, Lemire EG. Nonspecific interstitial pneumonia and usual interstitial pneumonia with mutation in surfactant protein C in familial pulmonary fibrosis. Mod Pathol 2004;17(8):973–80. Epub 2004/05/11. doi: 10.1038/modpathol.3800149. PubMed PMID: 15133475. [DOI] [PubMed] [Google Scholar]
- 4.Mushiroda T, Wattanapokayakit S, Takahashi A, Nukiwa T, Kudoh S, Ogura T, Taniguchi H, Kubo M, Kamatani N, Nakamura Y, Pirfenidone Clinical Study G. A genome-wide association study identifies an association of a common variant in TERT with susceptibility to idiopathic pulmonary fibrosis. J Med Genet 2008;45(10):654–6. Epub 2008/10/07. doi: 10.1136/jmg.2008.057356. PubMed PMID: 18835860. [DOI] [PubMed] [Google Scholar]
- 5.Seibold MA, Wise AL, Speer MC, Steele MP, Brown KK, Loyd JE, Fingerlin TE, Zhang W, Gudmundsson G, Groshong SD, Evans CM, Garantziotis S, Adler KB, Dickey BF, du Bois RM, Yang IV, Herron A, Kervitsky D, Talbert JL, Markin C, Park J, Crews AL, Slifer SH, Auerbach S, Roy MG, Lin J, Hennessy CE, Schwarz MI, Schwartz DA. A common MUC5B promoter polymorphism and pulmonary fibrosis. N Engl J Med 2011;364(16):1503–12. Epub 2011/04/22. doi: 10.1056/NEJMoa1013660. PubMed PMID: 21506741; PMCID: PMC3379886. [DOI] [PMC free article] [PubMed] [Google Scholar]
- 6.Steele MP, Schwartz DA. Molecular mechanisms in progressive idiopathic pulmonary fibrosis. Annu Rev Med 2013;64:265–76. Epub 2012/10/02. doi: 10.1146/annurev-med-042711-142004. PubMed PMID: 23020878. [DOI] [PubMed] [Google Scholar]
- 7.Herazo-Maya JD, Noth I, Duncan SR, Kim S, Ma SF, Tseng GC, Feingold E, Juan-Guardela BM, Richards TJ, Lussier Y, Huang Y, Vij R, Lindell KO, Xue J, Gibson KF, Shapiro SD, Garcia JG, Kaminski N. Peripheral blood mononuclear cell gene expression profiles predict poor outcome in idiopathic pulmonary fibrosis. Sci Transl Med 2013;5(205):205ra136. Epub 2013/10/04. doi: 10.1126/scitranslmed.3005964. PubMed PMID: 24089408; PMCID: PMC4175518. [DOI] [PMC free article] [PubMed] [Google Scholar]
- 8.Molyneaux PL, Willis-Owen SAG, Cox MJ, James P, Cowman S, Loebinger M, Blanchard A, Edwards LM, Stock C, Daccord C, Renzoni EA, Wells AU, Moffatt MF, Cookson WOC, Maher TM. Host-Microbial Interactions in Idiopathic Pulmonary Fibrosis. Am J Respir Crit Care Med 2017;195(12):1640–50. Epub 2017/01/14. doi: 10.1164/rccm.201607-1408OC. PubMed PMID: 28085486; PMCID: PMC5476909. [DOI] [PMC free article] [PubMed] [Google Scholar]
- 9.Newman AM, Liu CL, Green MR, Gentles AJ, Feng W, Xu Y, Hoang CD, Diehn M, Alizadeh AA. Robust enumeration of cell subsets from tissue expression profiles. Nat Methods 2015;12(5):453–7. Epub 2015/03/31. doi: 10.1038/nmeth.3337. PubMed PMID: 25822800; PMCID: PMC4739640. [DOI] [PMC free article] [PubMed] [Google Scholar]
- 10.Huang LS, Berdyshev EV, Tran JT, Xie L, Chen J, Ebenezer DL, Mathew B, Gorshkova I, Zhang W, Reddy SP, Harijith A, Wang G, Feghali-Bostwick C, Noth I, Ma SF, Zhou T, Ma W, Garcia JG, Natarajan V. Sphingosine-1-phosphate lyase is an endogenous suppressor of pulmonary fibrosis: role of S1P signalling and autophagy. Thorax 2015;70(12):1138–48. Epub 2015/08/20. doi: 10.1136/thoraxjnl-2014-206684. PubMed PMID: 26286721. [DOI] [PubMed] [Google Scholar]
- 11.Collins SL, Chan-Li Y, Oh M, Vigeland CL, Limjunyawong N, Mitzner W, Powell JD, Horton MR. Vaccinia vaccine-based immunotherapy arrests and reverses established pulmonary fibrosis. JCI Insight 2016;1(4):e83116 Epub 2016/05/10. doi: 10.1172/jci.insight.83116. PubMed PMID: 27158671; PMCID: PMC4855513. [DOI] [PMC free article] [PubMed] [Google Scholar]
- 12.Groves AM, Johnston CJ, Williams JP, Finkelstein JN. Role of Infiltrating Monocytes in the Development of Radiation-Induced Pulmonary Fibrosis. Radiat Res 2018;189(3):300–11. Epub 2018/01/16. doi: 10.1667/RR14874.1. PubMed PMID: 29332538; PMCID: PMC5862390. [DOI] [PMC free article] [PubMed] [Google Scholar]
- 13. Misharin AV, Morales-Nebreda L, Reyfman PA, Cuda CM, Walter JM, McQuattie-Pimentel AC, Chen CI, Anekalla KR, Joshi N, Williams KJN, Abdala-Valencia H, Yacoub TJ, Chi M, Chiu S, Gonzalez-Gonzalez FJ, Gates K, Lam AP, Nicholson TT, Homan PJ, Soberanes S, Dominguez S, Morgan VK, Saber R, Shaffer A, Hinchcliff M, Marshall SA, Bharat A, Berdnikovs S, Bhorade SM, Bartom ET, Morimoto RI, Balch WE, Sznajder JI, Chandel NS, Mutlu GM, Jain M, Gottardi CJ, Singer BD, Ridge KM, Bagheri N, Shilatifard A, Budinger GRS, Perlman H. Monocyte-derived alveolar macrophages drive lung fibrosis and persist in the lung over the life span. J Exp Med 2017;214(8):2387–404. Epub 2017/07/12. doi: 10.1084/jem.20162152. PubMed PMID: 28694385; PMCID: PMC5551573. [DOI] [PMC free article] [PubMed] [Google Scholar]
- 14.Obayashi Y, Yamadori I, Fujita J, Yoshinouchi T, Ueda N, Takahara J. The role of neutrophils in the pathogenesis of idiopathic pulmonary fibrosis. Chest 1997;112(5):1338–43. Epub 1997/11/21. PubMed PMID: 9367478. [DOI] [PubMed] [Google Scholar]
- 15.Gregory AD, Kliment CR, Metz HE, Kim KH, Kargl J, Agostini BA, Crum LT, Oczypok EA, Oury TA, Houghton AM. Neutrophil elastase promotes myofibroblast differentiation in lung fibrosis. J Leukoc Biol 2015;98(2):143–52. Epub 2015/03/07. doi: 10.1189/jlb.3HI1014-493R. PubMed PMID: 25743626; PMCID: PMC4763951. [DOI] [PMC free article] [PubMed] [Google Scholar]
- 16.Hunninghake GW, Gadek JE, Lawley TJ, Crystal RG. Mechanisms of neutrophil accumulation in the lungs of patients with idiopathic pulmonary fibrosis. J Clin Invest 1981;68(1):259–69. Epub 1981/07/01. PubMed PMID: 7251862; PMCID: PMC370793. [DOI] [PMC free article] [PubMed] [Google Scholar]
- 17.Therneau TM, Grambsch PM. Modeling Survival Data: Extending the Cox Model New York: Springer; 2000. [Google Scholar]
- 18.Therneau TM. A Package for Survival Analysis in S 2015. Available from: https://CRAN.R-project.org/package=survival.
- 19.Wickham H ggplot2: Elegant Graphics for Data Analysis New York: Springer-Verlag; 2016. [Google Scholar]
Associated Data
This section collects any data citations, data availability statements, or supplementary materials included in this article.


