Abstract
RAF family kinases play prominent roles in cancer1. Their activation is dependent on dimerization of their kinase domains, which has emerged as a roadblock for drug development2,3. In mammals, RAF family kinases include three catalytically competent enzymes (A, B, and CRAF) and two pseudokinases (KSR1/2) that have been described as scaffolds owing to their apparent ability to bridge RAF isoforms and their substrate MEK4. KSR pseudokinases were also shown to dimerize with kinase-competent RAFs to allosterically stimulate catalysis5. While GTP-bound RAS can modulate the dimerization of RAF isoforms by engaging their RAS-binding domains (RBD), KSR1/2 lack an RBD and therefore the regulatory principles underlying their dimerization with other RAF family members remain unknown. Here, we show that the selective heterodimerization of BRAF with KSR1 is specified by direct contacts between the N-terminal regulatory regions (NTRs) of each protein comprised in part by a novel domain called BRS in BRAF and the CC-SAM domain in KSR1. We also discovered that MEK binding to the kinase domain of KSR1 asymmetrically drives BRAF-KSR1 heterodimerization, resulting in the concomitant stimulation of BRAF catalytic activity towards free MEK molecules. These findings demonstrate that KSR-MEK complexes allosterically activate BRAF through the action of NTR and kinase domain contacts and challenge the accepted role of KSR as a scaffold for MEK recruitment to RAF.
We previously developed Bioluminescence Resonance Energy Transfer (BRET) biosensors to detect interaction between RAF family kinase domains6. In a screen interrogating a human kinome library, we identified MEK1/2 as specific inducers of BRAF-KSR1 kinase domain dimerization (Fig. 1a, Extended Data Fig. 1a, and Supplementary Table 1). We confirmed these findings by BRET and co-immunoprecipitation (co-IP) (Extended Data Fig. 1b-d). Conversely, depletion of endogenous MEK1/2 reduced BRAF-KSR1 interaction (Extended Data Fig. 1e,f). Intriguingly, MEK promoted BRAF-KSR1 dimerization independent of its catalytic function (Fig. 1b, Extended Data Fig. 1g,h). These findings led us to assess the impact of MEK on other RAF biosensor pairs. Strikingly, BRAF-KSR1/2 heterodimers were by far the most responsive, which cannot be explained by the strict conservation of the dimer interface across RAF family members (Extended Data Figs. 1i-k)5.
Figure 1. MEK1 asymmetrically stimulates BRAF-KSR1 dimerization by interacting with KSR1.
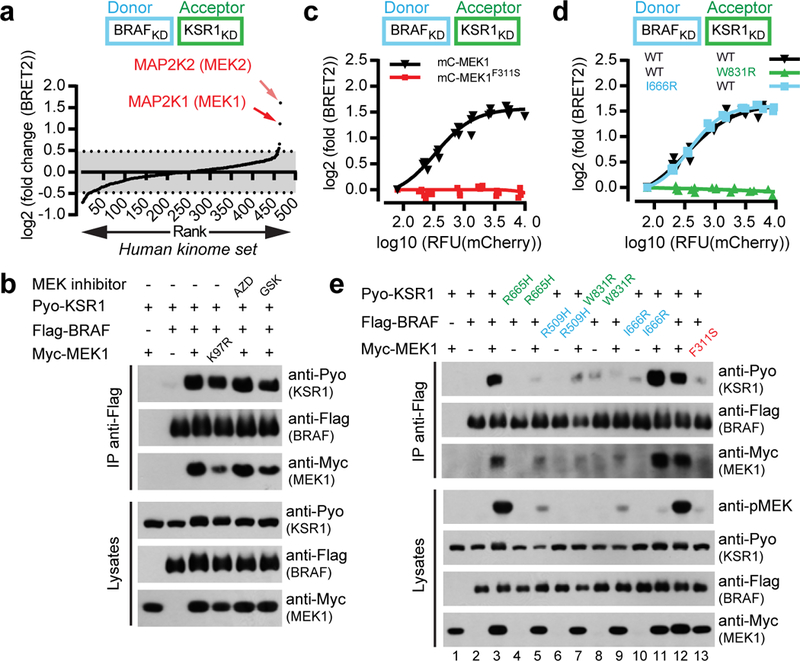
a, Whole-kinome screen identifies MEK1/2 as specific inducers of BRAF-KSR1 dimerization. BRET biosensors comprising RlucII-BRAFKD-CAAX and GFP10-KSR1KD-CAAX6 were used to screen 558 human kinase-related ORFs expressed from lentiviral vectors. b, Kinase-dead MEK1K97R or MEK inhibitors (AZD8330 and GSK1120212) (10 μM) did not alter MEK1-induced BRAF-KSR1 dimerization in co-IPs. c, mCherry-tagged MEK1F311S did not promote BRAF-KSR1 dimerization by BRET. d, Heterodimerization of BRAFI666R but not KSR1W831R was responsive to MEK1 expression by BRET. e, MEK1 promotes BRAF-KSR1 dimerization and BRAF transactivation by binding KSR1 in co-IP. Experiments in b-e were repeated three times. For gel source data, see Supplementary Fig. 1.
We hypothesized that MEK modulates dimer formation by interacting directly with KSR1 and/or BRAF kinase domains. Previous work showed that MEK1 binds KSR2 and BRAF in a similar “face-to-face” manner involving their αG helices and activation segments (Extended Data Fig. 2a)7,8. Using yeast two-hybrid (Y2H) screening, we identified the F311S mutation in MEK1 that abrogated KSR1, BRAF and CRAF binding (Extended Data Fig. 2b,c). In KSR1, we isolated the W831R mutation that impeded MEK1 binding (Extended Data Fig. 2d). Both mutations mapped to the contacting αG helices7 and neither adversely affected protein fold (Extended Data Figs. 2a, 3a-f). Consistent with available structures7,8, the I666R mutation in BRAF (analogous to KSR1W831R) also abolished binding to MEK1 (Extended Data Fig. 2d). We next tested the mutations for effects on BRAF-KSR1 heterodimerization. MEK1F311S did not induce BRAF-KSR dimerization (Fig. 1c and Extended Data Fig. 1l), and KSR1W831R could not be induced to dimerize with BRAF by MEK1 (Fig. 1d). In contrast, BRAFI666R could be induced to dimerize with KSR1 by MEK1 (Fig. 1d). Similar results were obtained by co-IP using full-length proteins (Fig. 1e, compare lanes 3, 9, 11, and 13). The near stoichiometric interaction between BRAF, KSR1 and MEK1, supported the notion that the examined interactions were strong and direct (Extended Data Fig. 3g,h). Perturbation of the side-to-side dimerization surface on KSR and BRAF kinase domains (BRAF_R509H or KSR1_R665H mutations) also abolished MEK-induced KSR1-BRAF dimerization (Fig. 1e, compare lanes 3, 5, and 7). Thus, the ability of MEK1 to promote BRAF-KSR1 association was dependent on KSR-MEK interaction and on the side-to-side dimerization surface of BRAF and KSR kinase domains5.
We next investigated the effect of MEK1 on the catalytic output of BRAF-KSR1 dimers. MEK1 promoted the ability of KSR1 to transactivate BRAF in a kinase domain dimerization-dependent manner (Fig. 1e, pMEK panel, compare lanes 3, 5 and 7; Extended Data Fig. 4a). This held true also for KSR2 (Extended Data Fig. 4b). In contrast, when binding of MEK1 to KSR was disabled as in KSR1W831R, MEK1 no longer promoted KSR1-mediated BRAF transactivation (Fig. 1e, compare lanes 3 and 9; Extended Data Fig. 4c). Analogous findings were obtained with Drosophila RAF and KSR (Extended Data Fig. 4d,e). Likewise, the BRAF I666R mutation that disabled MEK1 binding also prevented MEK phosphorylation (Fig. 1e, compare lanes 3 and 11; Extended Data Fig. 4c). Notably, MEK phosphorylation required a catalytically competent BRAF, while mutations to the active site region of KSR1 had no effect (Extended Data Fig. 4f). Finally, two KSR1 gain-of-function mutations (KSR1AF and KSR1AFDDEE)9 also required MEK-binding for endogenous BRAF transactivation (Extended Data Fig. 4g). Thus, BRAF transactivation by KSR1 also depended on KSR-MEK interaction and on the ability of BRAF and KSR kinase domains to engage in side-to-side dimers.
We envisioned two models for how MEK1 binding to KSR1 potentiates the ability of KSR1 to promote BRAF phosphorylation of MEK1. In the first model, KSR1 functions as a scaffold to present an αG-bound MEK1 to the active site of BRAF while the kinase domains of KSR1 and BRAF engage each other as a side-to-side dimer. This would require considerable structural rearrangement because the configuration of a BRAF-KSR dimer would orient the KSR-bound MEK away from the BRAF catalytic site. A solution to this conundrum would be the involvement in trans of an active BRAF dimer as previously suggested7 and exemplified in Fig. 2a (Model 1). However, as the KSR-MEK binding mode secludes the activation segment of MEK in an antiparallel beta-sheet, this too would require substantial conformational change to free the MEK phospho-acceptor sites. In a second more likely model, MEK1 binding to the KSR1 kinase domain through helix αG would support the ability of KSR1 to allosterically transactivate BRAF by side-to-side dimerization, allowing BRAF to phosphorylate a second MEK1 molecule engaged by helix αG of BRAF. This model presupposes the existence of two functionally distinct MEK molecules, namely, an “activator” MEK that binds to KSR1 and stimulates dimerization with BRAF, and a “substrate” MEK that is engaged and phosphorylated by activated BRAF (Fig. 2a, Model 2).
Figure 2. KSR1-activated BRAF phosphorylates KSR1-free MEK1.
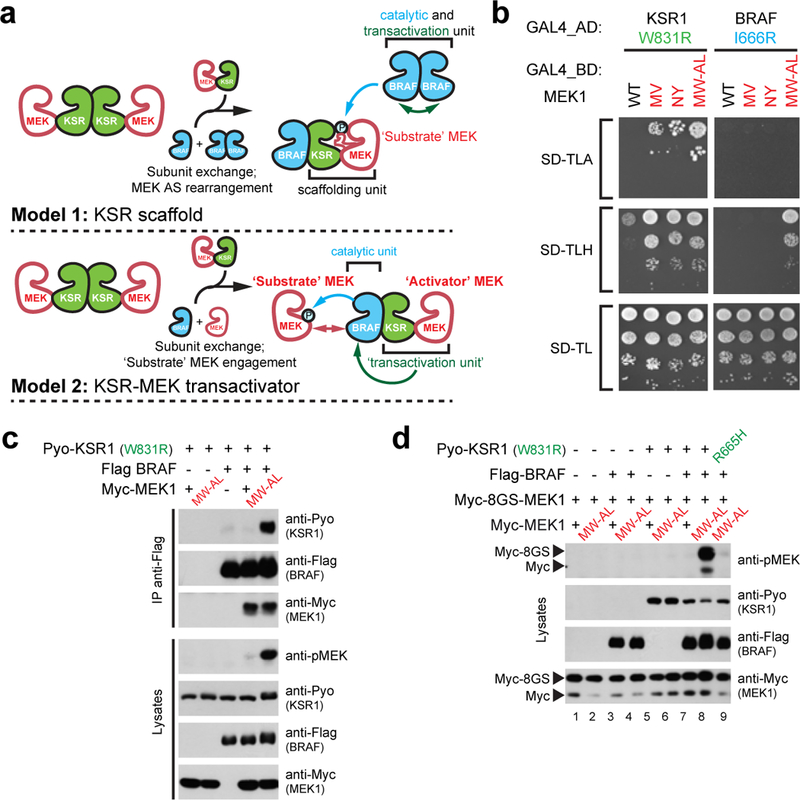
a, Putative roles of KSR in RAF-mediated MEK phosphorylation. Model 1 was adapted from reference #7. AS stands for activation segment. b, Y2H binding analysis of WT MEK1 and activation segment mutants MEK1M219V (MV), MEK1N221Y (NY), and MEK1M219W/A220L (MW-AL) to KSR1W831R or BRAFI666R. c, MEK1M219W/A220L (MW-AL), but not WT MEK1, induces KSR1W831R-BRAF dimerization and transactivation as determined by co-IP and pMEK levels. d, MEK1M219W/A220L bound to KSR1W831R induces BRAF activity towards MEK1 free of KSR1. Experiments in b-d were repeated at least 3 times. For gel source data, see Supplementary Fig. 1.
To test the second model, we identified MEK1 mutants that bind KSR1W831R, and thus would be functionally distinguishable from WT MEK1 that binds only wild type KSR1 and BRAF. We reasoned that if we restored binding of MEK1 to KSR1W831R, such MEK1 mutants might regain the ability to induce KSR1W831R dimerization with BRAF and thus promote BRAF catalytic function. Using Y2H screening, we retrieved MEK1 variants harboring M219V, N221Y, or M219W-A220L substitutions that restored interaction with KSR1W831R, with the M219W-A220L variant to nearly WT levels (Fig. 2b, Extended Data Fig. 5a,b and Supplementary Table 2). These mutations also increased binding to endogenous KSR1, BRAF, and CRAF (Extended Data Fig. 5c). As expected and in contrast to WT MEK1, MEK1M219W-A220L promoted BRAF-KSR1W831R dimerization (Fig. 2c and Extended Data Fig. 5d) and induced BRAF activation (Fig. 2c). Thus, restoration of binding of MEK1 to an αG-defective KSR1 mutant was sufficient to rescue its ability to transactivate BRAF.
We took advantage of the MEK1M219W-A220L mutant to determine if BRAF can phosphorylate WT MEK1 molecules not engaged directly by KSR1. We introduced a longer Myc epitope (called 8GS) at the N-terminus of WT MEK1 to distinguish it by size from MEK1M219W-A220L (Extended Data Fig. 5e). Since WT MEK1 cannot associate with KSR1W831R, it did not promote BRAF transactivation (Fig. 1e). We next co-expressed 8GS-MEK1WT and MEK1M219W-A220L in the presence of BRAF and KSR1W831R. Strikingly, in contrast to WT MEK1 alone, the presence of MEK1M219W-A220L led to the phosphorylation of 8GS-MEK1WT (Fig. 2d, compare lanes 7 and 8). This required both BRAF and KSR1W831R because no phosphorylation was detected in the absence of each (Fig. 2d, compare lane 8 with lanes 2, 4, and 6). Moreover, the effect was abrogated when the R665H mutation was introduced in KSR1W831R (Fig. 2d, compare lanes 8 and 9). Given that 8GS-MEK1WT cannot associate with KSR1W831R, this result provided compelling evidence for two functional forms of MEK1; namely one molecule of MEK1 (exemplified by MEK1M219W-A220L) that bound to KSR to enable transactivation of BRAF and a second molecule of MEK1 that functioned as a substrate of BRAF. These results supported Model 2 (Fig. 2a).
We next investigated if the ability of MEK1 to selectively induce BRAF transactivation by KSR held true for the full-length proteins. We conducted bi-directional titration experiments in the presence of MEK1 using full-length BRAF, CRAF, and KSR1. Markedly, BRAF and KSR1 co-expression led to robust phospho-MEK levels, whereas BRAF-CRAF or CRAF-KSR1 co-expression had marginal effect (Fig. 3a). Furthermore, MEK1 only weakly promoted full-length CRAF-KSR1 dimerization (Extended Data Fig. 6a). Despite that the effect of MEK1 on dimerization was readily selective for BRAF-KSR kinase domain pairs (Extended Data Figs 1i-k), we nonetheless questioned whether other domains participated in the context of full-length proteins as suggested previously10. Using co-IP, we tested the interactions between the N-terminal regulatory regions (NTRs) of BRAF, CRAF, and KSR1. Interestingly, KSR1NTR interacted with BRAFNTR as well as with itself, but barely with CRAFNTR (Fig. 3b). The same trend was observed in BRET and Y2H analyses (Extended Data Fig. 6b,c). Thus, we concluded that the NTRs of BRAF and KSR1 also have the potential to support selective heterodimer formation. Incidentally, the NTR of KSR1 also appeared to enable KSR1 homodimerization.
Figure 3. The NTRs of KSR1 and BRAF selectively interact.
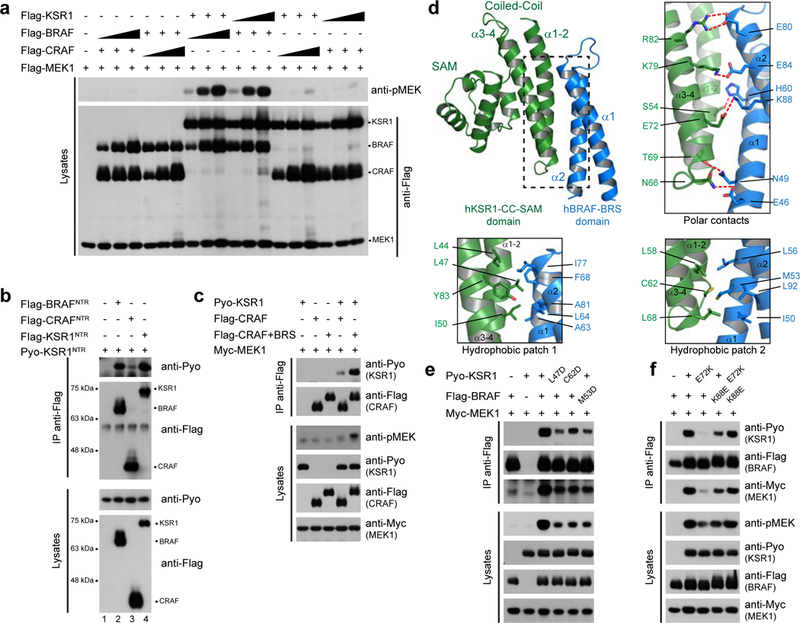
a, Full-length KSR1 selectively transactivates BRAF. b, The KSR1 NTR associates by co-IP with itself or with the BRAF NTR, but not with the CRAF NTR. c, KSR1 interacts with and transactivates CRAF43−648+BRS to a greater extent than WT CRAF. d, Ribbon representation of the BRS:CC-SAM complex. e, BRS M53D mutation and CC-SAM L47D and C62D mutations disrupt BRAF-KSR1 association and impede KSR1-induced MEK phosphorylation by BRAF. f, Mutational analysis of the K88BRS-E72CC-SAM salt bridge. Experiments in a-c, e and f were repeated at least 3 times. For gel source data, see Supplementary Fig. 1.
We next tested NTR truncation mutants by co-IP to narrow down the domains/motifs involved. In BRAF, sequences encompassing a conserved region called the BRAF-Specific (BRS) domain3, and the cysteine-rich domain (CRD) were both required (Extended Data Figs. 6d,e, 7a,b). Likewise, two areas within the KSR1 NTR encompassing the conserved CC-SAM and CRD domains were required for optimal binding (Extended Data Figs. 6d,f, 7a,c). Using Y2H and BRET, we detected a specific interaction between the BRS and CC-SAM domains (Extended Data Fig. 7d,e) while the BRS did not self-associate (Extended Data Fig. 7e). Moreover, fusion of the cognate CRDs to the BRS and CC-SAM domains enhanced this interaction, whereas the isolated CRDs did not associate (Extended Data Fig. 7d). Interestingly, swapping the BRS and the CC-SAM domains between BRAF and KSR1 led to productive BRAF-KSR1 interaction and transactivation (Extended Data Fig. 7f). Conspicuously, the BRS is absent from the NTRs of ARAF and CRAF and its insertion into CRAF considerably augmented CRAF-KSR1 dimerization and CRAF transactivation (Fig. 3c and Extended Data Figs. 7a,g,h). These results identified the BRS as a novel modular element in the NTR of BRAF orthologues that confers binding selectivity towards KSR proteins via its CC-SAM domain.
Using 1H-15N heteronuclear single quantum coherence (HSQC) NMR experiments, we found that the human BRS and CC-SAM domains interacted directly (Extended Data Fig. 8a-d). By exploiting HSQC peak assignments for the mouse CC-SAM domain10, we mapped the interaction surface for the BRS to the coiled-coil motif (Extended Data Fig. 8e-g). The ~ 60 amino acid BRS domain (Extended Data Fig. 7a,b) has no known structure. Thus, we solved its X-ray crystal structure to 2.1Å resolution (see Extended Data Fig. 9a). The structure consisted of two anti-parallel alpha helices connected by a short turn in the form of an α-hairpin (Extended Data Fig. 9b). To determine how the BRS and CC-SAM domains interact, we expressed and crystallized a BRS – CC-SAM fusion protein. The structure, solved to 1.75 Å resolution (see Extended Data Fig. 9a), revealed two BRS – CC-SAM fusion proteins in the asymmetric unit engaged in a head to tail manner (Extended Data Fig. 9c,d). This generated two BRS – CC-SAM complexes in trans with each mediated by extensive contact (buried surface area = 905.4 Å2) between the coiled-coil regions in the form of a four-helix bundle (Fig. 3d and Extended Data Fig. 9c). Satisfyingly, the contact surface employed by the CC-SAM domain in the crystal structure was identical to that mapped by NMR (Fig. 3d and Extended Data Fig. 8g).
The binding between the BRS and CC-SAM domains was mediated by a mixture of hydrogen bonds and salt interactions (Fig. 3d). In addition, each end of the elongated contact surface was anchored by a cluster of hydrophobic interactions (Fig. 3d). We note that binding of the BRS and CC-SAM domains correlated with major changes to the CC-SAM domain (RMSD = 2.59 Å) and minor changes to the BRS domain (RMSD = 0.79 Å) (Supplementary Video 1). Next, we validated the BRS – CC-SAM binding mode by mutagenesis. Point mutations targeting hydrophobic interactions in the mCC-SAM domain (L45D and C60D, corresponding to L47D and C62D in hKSR1) or in the BRS domain (M53D) significantly impaired BRS – CC-SAM domain interaction as assessed by HSQC and by BRET (Extended Data Fig. 10a,b). The mutations also reduced the ability of full-length BRAF to associate with KSR1 and compromised MEK phosphorylation (Fig. 3e). Furthermore, single site charge reversal mutations disrupting the E72CC-SAM – K88BRS ionic pair also abrogated interaction and activity (Fig. 3d,f and Extended Data Fig. 10c). Importantly, combination of KSR1E72K with BRAFK88E rescued the interaction and drove MEK phosphorylation to WT levels (Fig. 3f and Extended Data Fig. 10c). These results confirmed the relevance of the BRS – CC-SAM crystal structure for protein function in vitro and in cells.
We were intrigued that full-length BRAF and KSR1/2 required MEK for heterodimerization (Fig. 1), whereas the isolated NTRs interacted independent of MEK (Extended Data Fig. 10d). Previous work showed that, in quiescent cells, the NTRs of BRAF and CRAF associate with their kinase domains to enforce a repressed state, and this was released upon RAS-GTP binding to their RBDs11–13. This self interaction might restrain the NTRs from interacting in trans with other NTRs. We recently found that the NTRs and kinase domains of KSR proteins also interact14 but the absence of an RBD would preclude a direct response of this interaction to RAS-GTP. We reasoned that the ability of KSR1/2 kinase domains to stably associate with MEK might serve as a release mechanism. Consistent with this hypothesis, we observed by co-IP that the KSR1 NTR – kinase domain interaction was progressively disrupted by MEK1 dosage (Fig. 4a). This effect was not observed with the MEK1F311S mutant disabled for KSR1 binding and was also independent of ERK-dependent feedback15 as ERK inhibition had no effect (Fig. 4a). Consistent with the absence of an RBD in KSR proteins, KRASG12V expression had no effect (Fig. 4a). In sharp contrast, for BRAF the NTR – kinase domain interaction was only marginally perturbed by MEK1 expression, but potently disrupted by KRASG12V (Fig. 4b). These results supported the notion that unlike BRAF, the NTR-kinase domain interaction in KSR1 was not directly responsive to RAS-GTP, but was responsive to the binding of MEK1 (Fig. 4a). Thus, binding of MEK1 to KSR1 may free its NTR for subsequent interaction with BRAF or with a second KSR1 molecule (Extended Data Fig. 10e,f).
Figure 4. MEK releases the intramolecular interaction between the NTR and kinase domain of KSR1.
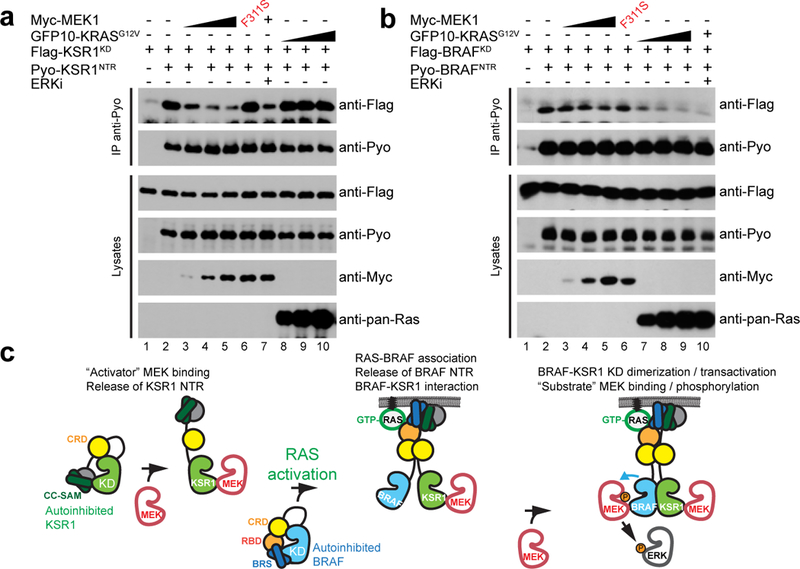
a, The NTR of KSR1 associates with its cognate kinase domain (KSR1KD). MEK1 but not KRASG12V expression disrupts this interaction. The ERK inhibitor SCH772984 (10 μM) was used to exclude a potential ERK negative feedback mechanism. b, The NTR of BRAF associates with its cognate kinase domain (BRAFKD). KRASG12V but not MEK1 expression disrupts this interaction. c, Model of BRAF-KSR1-mediated signal transmission to MEK and ERK. Experiments in a and b were repeated at least 3 times. For gel source data, see Supplementary Fig. 1.
Collectively, these findings challenge the common view that KSR proteins are scaffolds that enable MEK phosphorylation by bridging MEK and RAF and instead support a model whereby KSRs function as MEK-dependent allosteric activators of BRAF (Fig. 4c). These findings also identify the RAF family NTRs as potential targets for therapeutic intervention that may afford a more favourable route than the kinase domains to selectively modulate RAS-ERK signaling in cancers.
Methods
Plasmids and RNAi reagents
Mammalian expression plasmids were all made in the pCDNA3.1-Hygro backbone (Invitrogen). Pyo- and Myc-encoding sequences were added by PCR and the corresponding fusions were cloned between KpnI and XbaI. GFP10-, RlucII-, mCherry- and Flag-encoding sequences were inserted at the 5’- or 3’-end of ORFs by cloning them between KpnI and XbaI sites in plasmids containing the relevant cassette. RAF family kinase domain BRET fusion constructs were generated by inserting the RlucII or GFP10 moieties at the N-terminus of the kinase domain (ARAF295−606, BRAF442−766, CRAF334−648, KSR1602−921 and KSR2657−950) and followed by a C-terminal KRAS CAAX-box as previously reported6. N-terminal regulatory regions (NTRs; BRAF1−434 and CRAF1−326, KSR11−558) BRET constructs have the RlucII or GFP10 moieties fused at their C-terminus. Yeast-two-hybrid bait plasmids were based on pGBKT7 while prey plasmids were generated in pGADT7 (Clontech). Y2H constructs corresponding to KSR1602−921, MEK1, BRAF1−434, and CRAF1−326 were cloned between NdeI and BamHI sites, while BRAF442−766, CRAF334−648, and KSR11−558 were cloned between NdeI and EcoRI sites. Plasmids used to express Drosophila RAF and KSR protein fusions were described previously5. For bacterial expression, the human BRAF-specific sequence (BRS; BRAF36−114) was cloned in a pGEX-2T-based expression vector with an N-terminal TVMV (TEV) protease-cleavable GST tag (pGEX-TEV-BRS). Human and mouse KSR1 CC-SAM domains were cloned in pPROEX-HTa with an N-terminal TVMV (TEV) protease-cleavable 6X His tag. All mutations were inserted using the QuickChange II site-directed mutagenesis kit (Agilent). All constructs were fully verified by Sanger sequencing.
The Broad institute kinase ORF library was obtained from Addgene in pDONR-223 entry vectors (http://www.addgene.org/human_kinases)16. pDONR-223 plasmids were purified with Qiaprep® miniprep kit (Qiagen). cDNAs were then transferred in the Gateway™-compatible pLX301 lentiviral vector (Addgene) by using LR Clonase enzymatic recombination according to the manufacturer’s protocol (Invitrogen). pLX301 allows for expression of untagged kinase ORFs from a CMV promoter. The kinase ORF library in pLX301 was then purified with Qiaprep® miniprep kit (Qiagen) and arrayed in eight 96-well plates at a concentration of 10 ng/μl. Control lentiviruses (empty pLX301 and pLKO.1-CMV-TurboGFP) were included in each plate.
shRNA expression constructs were in the pLKO.1-puro backbone17. Sequence of the shRNA reagents used in this study are listed below:
shControl (SHC002; 5′-CAACAAGATGAAGAGCACCAA-3′);
shMEK1 (TRCN0000002329; 5′-GCTTCTATGGTGCGTTCTACA-3′);
shMEK2 (TRCN0000007006; 5′-GACTATATTGTGAACGAGCCA-3′);
Cell culture, transfection and lentiviral infections
HEK293T and HeLa cells were obtained from the IRIC high-throughput screening platform (University of Montreal, Montreal, Canada), which were originally purchased from Sigma-Aldrich (cat. number 12022001–1VL and 93021013–1VL, respectively). They were routinely tested for mycoplasma contamination. Cells were maintained in DMEM supplemented with 10% FBS at 37°C and under 5% CO2. For BRET experiments, 1.5×10⁵ cells/well were plated overnight in 12-well plates and transfected the next day with the appropriate constructs using PEI (25 μg/ml)18. For co-IP experiments, 2×10⁶ cells were seeded overnight in 100 mm tissue culture plates and transfected the next day with the appropriate constructs using PEI. Transduction of lentiviral particles was facilitated by polybrene addition (4 μg/ml). Cells were transduced at a multiplicity of infection (MOI) of 5 for 24 h after which puromycin selection (2 μg/ml) was applied for 72 h.
Lentiviral production for shRNA expression was done as follows. 2×10⁶ HEK293T cells were plated in T75 flasks. The next day, cells were transfected with 5 μg of pLKO.1-shRNA, 6 μg of pΔ8.9 (gag, pol) and 700 ng of pCMV-VSVG using PEI (25 μg/ml)18. Viral supernatants were collected 72 h post transfection and filtered through 0.2 μm PES filters. Titers were then established on HeLa cells after puromycin selection (2 μg/ml) and crystal violet staining using standard procedures.
For the production of kinase ORF library lentiviral particles, HEK293T cells were seeded in 96-well plates. The next day, cells were transfected using a Biomek FX instrument with 100 ng of pLX301-KinaseX, 100 ng of psPAX2 (gag, pol), and 10 ng of pMD2G using TransIT®-LT1 transfection reagent (Mirus). Viral supernatants were harvested 72 h post-transfection. Lentiviral production was confirmed by robotically establishing semi-quantitative titers on HeLa cells after puromycin selection (2 μg/ml) followed by crystal violet staining using standard procedures.
BRET experiments
BRET titration and dose-response experiments were conducted as previously described6. Briefly, 48 h post-transfection using appropriate BRET constructs, cells were washed once and resuspended in Hank’s balanced salt solution (HBSS; Wisent). Cells were next transferred to white opaque microtiter plates (Greiner). Total GFP10 levels were measured using an EnVision plate reader with a 400 nm excitation filter and a 510 nm emission filter. Total mCherry levels were detected on a FlexStation II (Molecular Devices) with excitation and emission peaks set at 580 and 635 nm, respectively. A final concentration of 2.5 μM of Coelenterazine 400a (Biotium) was then added to the plates and, following 15 minutes of incubation, BRET signals were acquired using a VICTOR™ Light plate reader (Perkin Elmer) equipped with BRET2 emission filter set (donor: 410 nm ± 70 nm; acceptor: 515 nm ± 20 nm). At least three independent biological replicates of each BRET experiment were performed. For all BRET experiments, individual technical replicates corresponding to three independent transfections (n=3) from one representative experiment are presented.
BRET lentiviral ORF kinase library screening
HEK293T cells were robotically seeded into 96-well tissue culture plates (Corning) in DMEM without phenol red (Wisent) supplemented with 10% FBS and 1% penicillin/streptomycin supplemented with polybrene (4 μg/ml), followed immediately by robotically arraying individual kinase-encoding lentiviruses of the CCSB-Broad Institute kinome library (20 μl per well). Following a 24 h incubation, media and virus suspension were aspirated and replaced with complete growth media containing puromycin (2 μg/ml) to select for kinase ORF-expressing cells. Forty-eight hours after puromycin selection, cells were passed 1:5 in 96-well white opaque plates (Greiner) in DMEM without phenol red (Wisent) supplemented with 10% FBS and 1% penicillin/streptomycin (Invitrogen). The next day, cells were transfected with appropriate BRET constructs using TransIT®-LT1 transfection reagent (Mirus). Two days following transfection, BRET measurements were performed. Total GFP10 levels were measured using an EnVision plate reader (PerkinElmer) with a 400 nm excitation filter and a 510 nm emission filter. BRET signals and luciferase activity were acquired 15 minutes after addition of 2.5 μM Coelenterazine 400a (Biotium) using a Synergy™ NEO plate reader (BioTek) equipped with BRET2 filters. After BRET readings, cell viability was assessed by addition of WST-1 reagent (1:20 dilution) followed by 30 min incubation and subsequent quantification on an EnVision plate reader (PerkinElmer).
BRET calculations
BRET signals correspond to the light emitted by the GFP10 acceptor construct (515 nm ± 20 nm) upon addition of Coelenterazine 400a divided by the light emitted by the RlucII donor construct (410 nm ± 70 nm). Signals referred to as BRET2 in the text and figures correspond to total BRET2 signals measured from donor (RlucII fusion) + acceptor (GFP10 fusion) expressing samples minus the background BRET2 signal emitted by donor alone expressing samples. Total intrinsic GFP10 (expressed as Relative Fluorescence Unit; RFU) and RlucII (Relative Luminescence Unit; RLU) signals were used as proxy to ensure that similar protein levels were compared between analogous probes. In titration experiments where the amount of GFP10 acceptor construct varied, BRET2 (Y-axis) was plotted in function of the ratio of total GFP10 signal in relative fluorescence units (RFU; [Acceptor]) / total luciferase signal in relative luminescence units (RLU; [Donor]) (X-axis: [Acceptor]/[Donor]). BRET-based dose-response experiments were presented as BRET2 fold-change, which was calculated by dividing the BRET2 signal emitted by cells transfected with a given construct by the BRET2 signal of control cells. For mCherry fusion dose-response experiments, BRET log2-transformed fold-changes were reported as a function of log10-transformed mCherry relative fluorescence units (RFU).
Co-immunoprecipitations and western immunoblotting
Co-immunoprecipitation and western immunoblotting procedures were essentially conducted as follows. To prepare cell lysates, cells were washed once in cold 1X PBS and then directly lysed on plates by adding 1 ml of Triton lysis buffer (50 mM Tris at pH 7.5, 150 mM NaC1, 10% glycerol, 0.2% Triton X-100, 1 mM EDTA, 1X phosphatase inhibitor cocktail (Sigma-Aldrich), 1 mM sodium vanadate, 20 μM leupeptin, aprotinin (0.15 U/ml), 1 mM phenylmethylsulfonyl fluoride (PMSF)). Lysing cells were incubated for 20 min at 4oC with gentle rocking, collected and spun at 14,000g, 4°C for 10 min. For co-immunoprecipitations, 1 μl of anti-Flag M2 (Sigma-Aldrich) or 50 μl of anti-Pyo primary antibody (hybridoma supernatant) was added to fresh cell lysates along with 12.5 μl of Protein A/G agarose beads (Calbiochem) and gently rocked at 4°C for 4 h or overnight. Immunoprecipitates were washed three times with cold lysis buffer. IPs and cell lysates were then boiled in gel loading buffer for 5 minutes and resolved on 7%, 10% or 12% SDS-PAGE depending on the molecular weight of the target proteins. Gels comprising IP samples were transferred to PVDF membranes (GE Healthcare), whereas gels comprising cell lysates were transferred to nitrocellulose membranes (Pall Corporation). Membranes were then blocked with 2% BSA (Sigma-Aldrich) diluted in Tris-buffered saline (TBS). Blocked membranes were then probed using appropriate primary antibodies. All antibodies were diluted in TBS supplemented with 0.2% Tween 20 (TBS-0.2%T). Anti-phospho MEK (Cell Signaling Technology; cat. number 9121), anti-MEK1/2 (Cell Signaling Technology; cat. number 9122), anti-BRAF (Santa Cruz; cat. number sc-9002), anti-CRAF (BD-Millipore; cat. number 610152), anti-KSR1 (Abcam; cat. number ab68483), anti-MEK1 (BD-Millipore; cat. number 610121), anti-MEK2 (BD-Millipore; cat. number 610235), anti-GFP (Santa Cruz; cat. number sc-8334), anti-Ras (Abcam; cat. number ab108602), anti-HSP90 (New England Biolabs; cat. number 4877), anti-CDC37 (Santa Cruz; cat. Number; sc-13129) and anti-pan-14–3-3 (Cell Signaling Technology; cat. number 8312) were used at a 1:2,000 dilution. Anti-V5 (Invitrogen; cat. number 46–0705) was used at a 1:5,000 dilution. Anti-Flag M2 (Sigma-Aldrich; cat. number F1804) was used at a 1:20,000 dilution. Anti-Myc (9G10) and anti-Pyo19 supernatants from hybridomas were used at a 1:10 dilution. Anti-HA (12CA5) supernatant from hybridoma was used at a 1:5,000 dilution. Secondary anti-mouse and anti-rabbit-HRP (Jackson Immunoresearch Labs; cat. number 115–035-146 and 111–035-144, respectively) were respectively used at 1:10,000 and 1:20,000 dilutions in TBS-0.2%T. At least three independent biological replicates of each co-IP experiment were performed. One representative example is presented in the figures and gel source data is available in Supplementary Fig. 1.
Proteins loaded on SDS-PAGE for silver staining were immunoprecipitated using anti-Flag M2 affinity gel (Sigma). Proteins of interest were isolated from the gels and identified by mass spectrometry.
Desthiobiotin-ATP binding experiments
ATP-binding protein enrichment was performed using the ActivX™ ATP probe (desthiobiotin-ATP) following Pierce’s Kinase Enrichment Kit (Thermo-Fisher Scientific) instructions with the exception that cell lysis was conducted using Triton lysis buffer (50 mM Tris at pH 7.5, 150 mM NaC1, 10% glycerol, 0.2% Triton X-100, 1 mM EDTA, 1X phosphatase inhibitor cocktail (Sigma-Aldrich), 1 mM sodium vanadate, 20 μM leupeptin, aprotinin (0.15 U/ml), 1 mM phenylmethylsulfonyl fluoride (PMSF)) and biotinylated proteins were captured on Streptavidin-sepharose high performance resin (GE healthcare).
Yeast two-hybrid methods
Yeast cell growth, transformation and DNA extraction were carried out using standard procedures. Strains used for Y2H experiments were systematically PJ69–4a or PJ69–4α20. Yeast cells were grown at 30oC. Synthetic dextrose (SD) medium was either SD-Trp, SD-Leu, SD-Trp-Leu (SD-TL), SD-Trp-Leu-Ade (-TLA) or SD-Trp-Leu-His (SD-TLH) (0.67% Yeast Nitrogen Base, 2% glucose, indicated amino acids drop-out). Rich medium was YPD (1% Yeast Extract, 2% peptone, 2% dextrose). For Y2H interaction screening, bait (pGBKT7) and prey (pGADT7) plasmids were transformed in the haploid PJ69–4a and PJ69–4α, respectively (transformants were selected on SD-Trp for pGBKT7 and SD-Leu for pGADT7)21. Diploids carrying both plasmids were created by mating on YPD followed by replica plating on SD-TL, SD-TLH or SD-TLA.
Identification of KSR1 and MEK1 binding-defective mutants was carried out by reverse two-hybrid screening in haploid PJ69–4a cells containing either pGADT7-KSR1 or pGBKT7-MEK1 plasmids. By mapping individual mutations to previously solved crystal structures, we identified one substitution in each kinase domain that targeted surface-exposed residues on the αG helix. (Extended Data Fig. 2b). Briefly, random mutations were initially introduced in KSR1602−921 or in MEK1 cDNAs using error-prone PCR with Taq DNA polymerase in the presence of dITP22. Linearized pGBKT7 or pGADT7 empty plasmids were digested with NdeI and BamHI prior to in vivo homologous recombination with mutagenized PCR products in PJ69–4a containing the bait plasmid of interest (either pGADT7- KSR1602−921 or pGBKT7-MEK1). For library generation, PCR:plasmid molar ratio was set at 3:1. Yeast transformants were plated on SD-TL media at ~1,000 colony forming units per plate. Plates were incubated for 3 days at 30°C and then replica-plated onto SD-TLH and SD-TLA media to screen for desired mutants. Mutant colonies were selected for auxotrophy on SD-TLH and/or SD-TLA media picked and streaked for single colonies on SD-TL. Confirmation of the mutant phenotype was performed by spotting assay on SD-TL, SD-TLH and SD-TLA after growth to saturation in liquid SD-TL. Tenfold serial dilutions of yeast cells harbouring the indicated constructs were spotted on synthetic dextrose (SD) medium selective for Y2H plasmids (TL) or on media selective for Y2H plasmids and a physical interaction between encoded proteins (TLH) or (TLA). Prior to spotting, cells were rinsed twice in sterile water to avoid carry over of nutrients from SD-TL medium. Mutant plasmids were recovered with a modified Qiagen miniprep protocol with glass beads and then shuffled in chemocompetent bacteria. A single bacterial transformant was then picked and grown to saturation in LB medium containing the appropriate selection (kanamycin for pGBKT7 and ampicillin for pGADT7). Plasmid DNA was subsequently isolated and sequence-verified. Expression of mutant Y2H pGBKT7 fusions and pGADT7 fusions was determined by Western immunoblotting of yeast extracts with anti-Myc and anti-HA antibodies, respectively.
The identification of MEK1 rescue variants that interact with KSR1W831R was also performed using the error-prone PCR mutagenesis approach coupled to the Y2H screening assay with the exception that the pGAD-KSR1W831R was used as the bait and the rescue mutants were selected for autotrophy on either of –TLH or –TLA medium. This approach repeatedly identified two independent point mutations (M219V and N221Y) situated between the RAF phospho-acceptor sites (S218 and S222) in the activation segment (Extended Data Fig. 5a,b) that enabled binding to KSR1W831R (Fig. 2b).
A saturation mutagenesis Y2H screen targeting residues 219 to 221 was then conducted to find tighter binders. Saturation mutagenesis of the human MEK1 activation segment was performed with a degenerated oligonucleotide with NNK-NNK-NNK sequence (N and K stand, respectively, for any base and for G/C) replacing the coding sequence of residues 219–221. This design allows spanning all amino acid possibilities, while excluding two stop codons. It also diminishes by 8-fold the number of sequence combinations, preventing to screen wobble base mutants different in base content but identical in amino acid sequence. The degenerated sequence was incorporated by a two-step PCR to create a product corresponding to MEK1 cDNA flanked with pGBK homology arms. This library was screened against the pGAD-KSR1W831R bait for rescue mutants.
Protein expression and purification
WT and mutants of the BRS domain of human BRAF (residues 36 to 114) were expressed as TEV protease cleavable GST fusions using a modified pGEX-2T vector. WT and mutants of the CC-SAM domain of human KSR1 (residues 132–178, denoted hCC-SAM) or murine KSR1 (residues 25 to 170, denoted mCC-SAM) were expressed as TEV protease cleavable 6XHis tag fusions using a pPROEX vector. The human BRS domain – human CC-SAM domain chimeras (KSR1127−172-BRAF36−110) connected by a (GS)4, (GS)3 or (GS)2 linker were expressed as TEV-cleavable 6XHis tag fusions using a pPROEX vector. The chimeras allowed us to surmount the recurrent problem of crystallizing the isolated individual domains when using non-fused proteins in co-crystallization experiments. WT and mutant forms of the kinase domain of human MEK1 (residues 61 to 393, denoted MEK1-KD) were expressed as non-cleavable C-terminal 6XHis tag fusions using a pET28a vector. Expression constructs were transformed into BL21-CodonPlus DE3-RIL bacteria (Agilent Technologies) for protein production. Bacterial expression was induced overnight at 18°C with 1 mM IPTG and was performed in LB or TB or M9 minimal media supplemented with 15N-NH4Cl (Cambridge Isotopes) or M9 minimal media supplemented with L-selenomethionine for biochemical experimentation, NMR spectroscopy or crystallography purposes, respectively.
BRS bacterial pellets were resuspended in 10 mM Tris-HCl pH7.5, 150 mM NaCl, 1 mM PMSF, 5 mM 2-mercaptoethanol and lysed by homogenization. Lysates were clarified by centrifugation at 4°C for 40 minutes at 18,000g. Proteins were bound to glutathione affinity resin (GE Healthcare), eluted by cleavage of the GST tag with TEV, concentrated and then buffer exchanged by size exclusion chromatography (SEC) using a Superdex75 24 ml column (GE healthcare) equilibrated in running buffer for NMR experiment (20 mM Phosphate buffer, 100 mM NaCl, 0.5 mM TCEP, pH 6.5) or running buffer for crystallography (20 mM HEPES pH 7.5, 50 mM NaCl, 1 mM TCEP).
hCC-SAM and mCC-SAM bacterial pellets were resuspended in 50 mM HEPES pH7.5, 500 mM NaCl, 1 mM PMSF, 20 mM Imidazole, 5 mM 2-mercaptoethanol and lysed by homogenization. Lysates were clarified by centrifugation at 4°C for 40 minutes at 18,000g. Proteins were purified by a 2-step chromatography procedure using nickel affinity chromatography (GE Healthcare) in 50 mM HEPES pH7.5, 500 mM NaCl, 5 mM 2-mercaptoethanol (with an elution gradient up to 500 mM imidazole), followed by TEV protease treatment and then SEC on a Superdex75 24 ml column (GE healthcare) equilibrated with 20 mM Phosphate buffer, 100 mM NaCl, 0.5 mM TCEP, pH 6.5 running buffer.
Bacterial pellets of BRS - CC-SAM domain chimeric constructs were resuspended in 50 mM HEPES pH7.5, 500 mM NaCl, 1 mM PMSF, 1 mM TCEP, 5% glycerol and lysed by homogenization. Lysates were clarified by centrifugation at 4°C for 40 minutes at 18,000g. Proteins were purified by the 2-step procedure described for BRS GST fusion proteins with a final SEC buffer consisting of 20 mM HEPES pH7.5, 100 mM NaCl, 1mM TCEP.
hMEK1 WT and F311S bacterial pellets were resuspended in 100 mM HEPES pH7, 250 mM NaCl, 1 mM PMSF, 2.5% glycerol, 1 mM TCEP and lysed by homogenization. The lysate was clarified by centrifugation at 4°C for 40 minutes at 18,000g. Proteins were purified by a 2-step chromatography procedure using nickel affinity chromatography (GE Healthcare). Proteins were eluted from the nickel affinity column with lysis buffer supplemented with 500 mM imidazole, followed by SEC on a Superdex75 24 ml column (GE healthcare) equilibrated with 20 mM HEPES pH 7.5, 250 mM NaCl, 1 mM TCEP running buffer.
Following SEC, all protein fractions corresponding to greater than 95% purity were pooled, concentrated and flash frozen in liquid nitrogen. Protein concentration was determined by UV-Vis absorption spectroscopy at 280 nm wavelength using a NanoDrop spectrophotometer (Thermo-Fisher Scientific) and theoretical extinction coefficients.
ATP Fluorescence Polarization binding assay
Binding reactions were performed with 25 nM fluorophore-conjugated ATP (BODIPY-ATP) and the indicated protein concentrations in fluorescence polarization (FP) buffer consisting of 20 mM HEPES pH 7.5, 250 mM NaCl, 1 mM TCEP, 10 mM MgCl2, 0.01% Brij-35, and 0.1 mg/ml BSA. Binding reactions were equilibrated for 30 min in 25 μL reactions in 384-well black flat-bottom low flange plates (Corning, 3573). Fluorescence intensities were measured using a Synergy™ NEO plate reader (BioTek) and FP was calculated with the Gen5 data analysis software. The instrument G factor and detection gains were auto scaled to a well containing tracer alone to correspond to a reading of 20 mP. Kd values were calculated by non-linear regression analysis of FP values performed in GraphPad Prism 5.04 using a one-site total binding model.
Protein crystallography, data collection and structural analysis.
BRS domain was crystallized at 20˚C in sitting-drops by mixing 1 μL of protein (362.5 μM, 3.5 mg/mL) with 1μL of mother liquor of 0.1 M Bis-Tris pH 6.5, 2.0 M ammonium sulphate. X-ray diffraction was measured on a flash-frozen crystal cryo-protected in mother liquor containing 20% glycerol at 100 K on station 24-ID-C, NE CAT beamline at the Advanced Photon Source (APS) using 1.5418 Å X-Ray wavelength. Data reduction was performed using HKL2000 (HKL Research Inc.). The BRS domain structure was solved using CCP423 and ARCIMBOLDO Lite24. Model building and refinement was performed using COOT25 and PHENIX26, respectively (see Extended Data Fig. 9a for data collection and refinement statistics).
Unlabelled and L-selenomethionine labelled CC-SAM-(GS)4-BRS fusion proteins were crystallized at 20˚C in sitting drops by mixing 0.4 μL of protein (1 mM, 20 g.L-1) with 0.4μL of mother liquor of 0.1 M Tris pH 7.5, 3.0 M sodium formate. X-ray diffraction was measured on a flash-frozen crystal cryo-protected in mother liquor containing 25% glycerol at 100 K on station 24-ID-C, NE CAT beamline at the APS using 0.9791 Å X-Ray wavelength. Data reduction was performed using the XDS package27. Phasing was performed by Selenomethionine SAD using HKL2MAP28 and the SHELX pipeline29. The atomic model obtained by Se-Met SAD was then used as a search model for molecular replacement with a higher resolution native dataset using PHASER30. Phases were improved by density modification using ARP/wARP31. Model building and refinement was performed using COOT and PHENIX26, respectively. All models were validated using molprobity32. The data statistics and refinement details are reported in Extended Data Table 1. Ramachandran statistics for all models are as follows: hBRS: 94.64% favoured, 5.36% allowed, 0% outliers; hCC-SAM-hBRS: 99.5% favoured, 0.5% allowed, 0% outliers. (GS)2, (GS)3 and (GS)4 fusions adopted the same oligomeric state in solution (Extended Data Fig. 9e).
NMR experiments
NMR experiments were performed at the University Health Network High Field NMR facility. NMR-heteronuclear single quantum coherence spectroscopy (HSQC) spectra were recorded at 20˚C on a 800-MHz spectrometer or a 600-MHz Bruker AVANCE III spectrometer (supported by the Canada Foundation for Innovation). The 800-MHz and 600-MHz spectrometers were equipped with 5-mm TCI and 1.7-mm TCI CryoProbes, respectively. All NMR samples contained 200 μM or 100 μM of 15N-BRS (using a 800MHz or 600MHz, respectively) or 200 μM or 150 μM 15N-CC-SAM (using a 800MHz or 600MHz, respectively) in 50 mM sodium phosphate pH 6.5, 100 mM NaCl, 0.5 mM TCEP and 5% D2O. Data processing was conducted using NMRviewJ and NMRpipe33. NMR spectra were analyzed using Analysis34. Backbone resonance assignments for mouse CC-SAM were reported previously10 (BMRB: 17045). In all peak intensity analyses, HSQC peak heights were used. Binding affinity between BRS and CC-SAM domains was determined on the basis of chemical shift changes. (1H, 15N) Chemical shift perturbations (CSPs) were calculated as a weighted average Δδav = [(ΔδH)2 + (ΔδN x 0.15)2]1/2. Affinities were obtained by fitting CSPs of the HSQC titration spectra using Analysis34,35.
SEC–MALS analysis
CC-SAM-BRS chimeric fusion and MEK1-KD WT and mutant proteins were analyzed using a SEC-MALS apparatus equipped with MiniDawn Treos and Optilab T-rEX detectors (Wyatt technologies, USA). CC-SAM-BRS chimeric fusion samples were run at a concentration of 9 mg/ml in a buffer containing 20 mM HEPES pH7.5, 100 mM NaCl, 1 mM TCEP. MEK1-KD samples were run at a concentration of 4 mg/ml in a buffer containing 20 mM HEPES pH7.5, 250 mM NaCl, 1 mM TCEP. Proteins were run on a WTC030S5 (Wyatt technologies, USA) column at a flow rate of 0.5 ml/min. Data was processed using Astra 6.0.3.16 software (Wyatt technologies, USA).
Data analysis and structure rendering
BRET titration curves were analysed using the Prism 5.04 software (GraphPad Software) using one-site binding hyperbolic fitting of the data. BRET dose-response experiments with mCherry-MEK1 constructs were fitted using a log10(agonist) versus response function. Structure rendering was done using PyMol (Schrödinger)36 and CHIMERA37. Coiled-coil predictions were done using the online COILS server. Sequence alignments were performed using the MUSCLE online server (http://www.drive5.com/muscle/). Alignments were edited using Jalview38 or ALINE39.
Extended Data
Extended Data Figure 1. MEK levels modulate the formation of BRAF-KSR1 dimers.
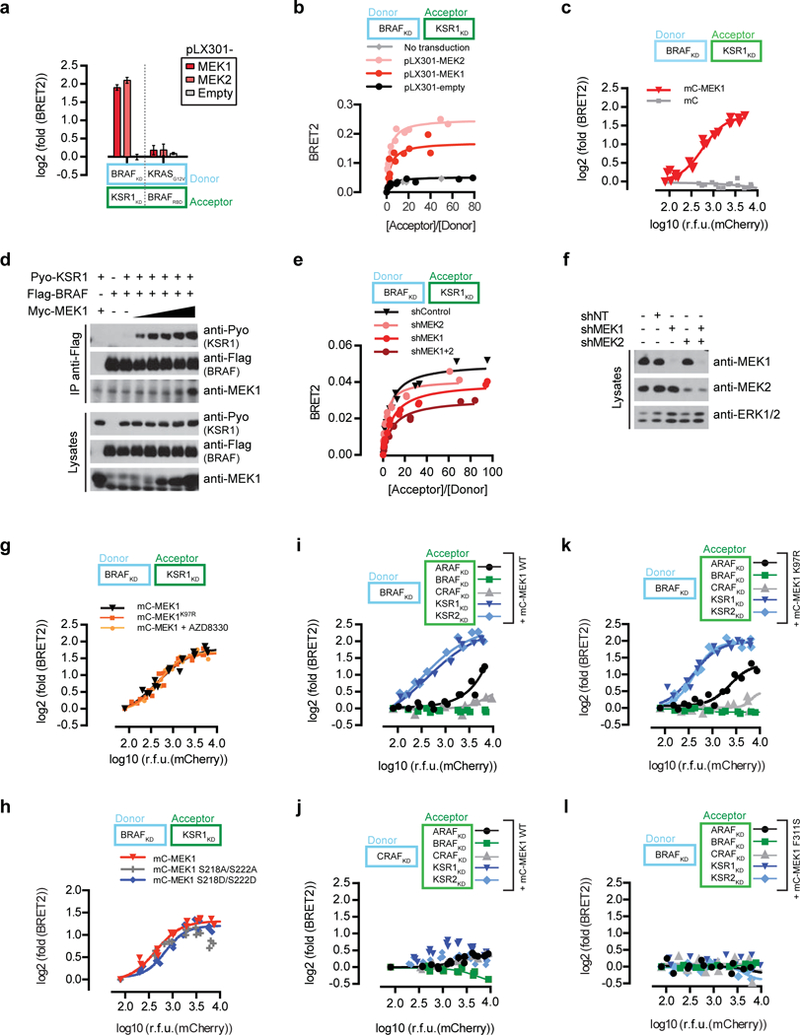
a, MEK1/2 expression selectively modulates BRAF-KSR1 interaction but not the KRASG12VBRAFRBD counter screen interaction by BRET. MEK1 and MEK2 expression was driven by the lentiviral vector pLX301. Error bars correspond to mean values ± s.d. of biological triplicates. b, MEK1 and MEK2 modulate BRAF-KSR1 interaction by BRET. c, MEK1 stimulates BRAFKSR1 interaction in a dose-dependent manner. mCherry-tagged MEK1 was titrated in cells expressing the BRAF-KSR1 BRET biosensors. d, MEK1 promotes full-length BRAF-KSR1 interaction by co-immunoprecipitation. e, Reducing endogenous MEK1 and/or MEK2 levels by RNA interference (shMEK1 and/or shMEK2) decreases BRAF-KSR1 interaction by BRET. f, Efficiency of MEK1 and MEK2 shRNA knockdowns in panel d. g, MEK1 stimulates BRAFKSR1 dimerization independently of its kinase activity. mCherry-tagged MEK1 or MEK1K97R similarly stimulate BRAF-KSR1 interaction by BRET. Cells expressing the BRAF-KSR1 BRET biosensor and increasing amounts of WT MEK1 were treated with the MEK inhibitor AZD8330 (10 μM). h, MEK1 stimulates BRAF-KSR1 interaction independently of the phosphorylation status of Serine 218 and 222. mCherry-tagged MEK1, MEK1S218A-S222A or MEK1S218D-S222D similarly stimulate BRAF-KSR1 interaction by BRET. i, and j, mCherry-tagged MEK1 selectively modulates KSR-containing dimers. The impact of MEK was measured on a series of ten biosensors comprising BRAF (h) or CRAF (i) as donor probes expressed with either of ARAF, BRAF, CRAF, KSR1, or KSR2 as acceptor probes. k, mCherry-tagged kinase-dead MEK1K97R selectively modulates KSR-containing dimers. The impact of MEK1K97R was measured on a series of five biosensors comprising BRAF as the donor probe expressed with either of ARAF, BRAF, CRAF, KSR1 or KSR2 as acceptor probes. l, mCherry-tagged interaction-defective MEK1F311S does not modulate dimerization of five biosensors comprising BRAF as the donor probe expressed with either of ARAF, BRAF, CRAF, KSR1 or KSR2 as acceptor probes. In panels c and g-l, BRET log2-transformed fold-changes were reported as a function of log10-transformed mCherry relative fluorescence units (RFU). Experiments were repeated at least 3 times. For gel source data, see Supplementary Fig. 1.
Extended Data Figure 2. Identification of mutations disrupting KSR-MEK and RAF-MEK interactions.
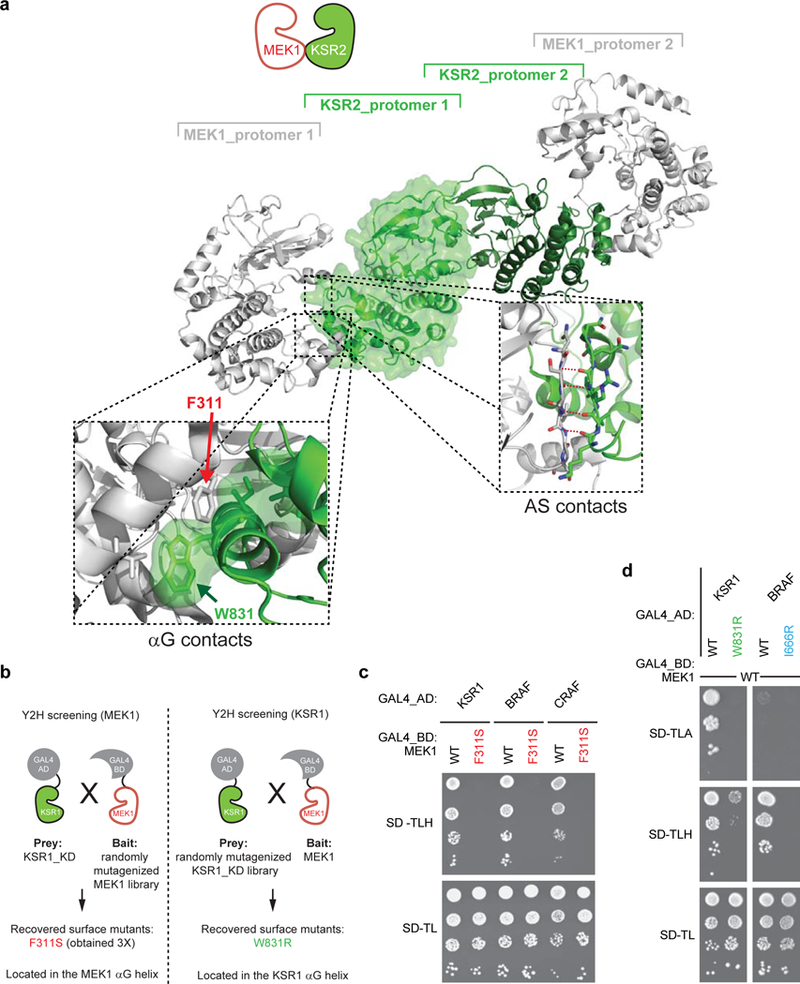
a, Crystal structure of KSR2 bound to MEK1. The structure shows a heterotetrameric arrangement with two KSR2 protomers assembling as a side-to-side dimer. Each KSR2 protomer in turn interacts in a face-to-face manner with one molecule of MEK1. Zoom in views (dashed boxes) highlight the involvement of the αG helices and the activation segments (AS) of both kinase domains in the face-to-face contact (PDB entry 2Y4I). b, Screening scheme used to identify MEK1 and KSR1 binding defective mutants by error-prone-PCR random mutagenesis using the yeasttwo hybrid system. c, Yeast spotting assay showing that the F311S mutation in MEK1 helix αG abrogates interaction with KSR1, BRAF and CRAF. d, Yeast spotting assay showing that KSR1 and BRAF helix αG mutations (W831R and I666R, respectively) disrupt their interaction with MEK1. Experiments in c-d were repeated at least 3 times. For gel source data, see Supplementary Fig. 1.
Extended Data Figure 3. Mutations in helix αG of MEK1 and KSR1 (F311S and W831R, respectively) do not perturb protein fold but abrogate stoichiometric assembly of the BRAFKSR1- MEK1 complex.
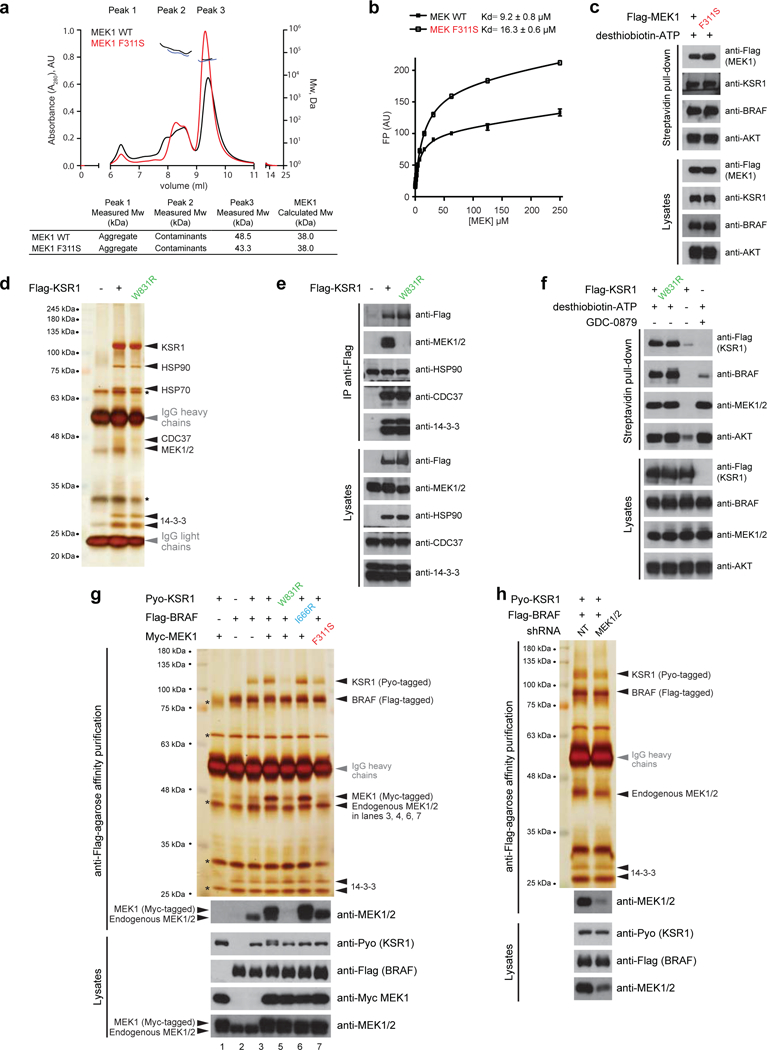
a, Size exclusion chromatography followed by multi-angle light scattering (SEC-MALS) analysis of MEK1 WT and F311S mutant. The horizontal black and blue lines correspond to SEC-MALS calculated masses for the indicated proteins. A summary table of measured and calculated molecular weights for each protein is shown below. The experiment was performed in triplicate. b, Fluorescence polarization (FP) binding analysis of MEK1 WT and F311S mutant to a 25 nM fluorophore-conjugated ATP tracer (BODIPY-ATP). Error bars correspond to mean values ± s.d. of technical triplicates. Indicated Kd values ± s.d. are representative of two independent experiments. c, MEK1 and MEK1 F311S expressed in HEK293T cells show equal ability to bind the ATP analog desthiobiotin-ATP as assessed using the Pierce kinase enrichment kit (Thermo- Fisher Scientific). d, and e, WT KSR1 and the W831R mutant assemble to the same extent with the known interaction partners HSP90, CDC37, and 14–3-3, indicating that the protein fold of KSR1 is not overtly perturbed by the W831R mutation. Interaction partners were confirmed by ass spectrometry and by western immunoblotting. f, WT KSR1 and the W831R variant expressed in HEK293T cells show equal binding to the ATP analog desthiobiotin-ATP as assessed using the Pierce kinase enrichment kit (Thermo-Fisher Scientific). g, BRAF-KSR1-MEK1 complexes were purified to near homogeneity by immunoaffinity purification on anti-Flag-agarose resin following treatment of the transfected cells with GDC-0879 (10 μM). BRAF and KSR1 form near stoichiometric complexes in the presence of MEK1 overexpression (compare lanes 3 and 4). The KSR1 W831R mutant (lane 5) and the MEK1 F311S mutant (lane 7) but not the BRAF I666R mutant (lane 6) perturbed this near stoichiometric interaction. Note that the BRAF-KSR1-MEK1 complex also associates at near stoichiometric levels with endogenous 14–3-3 isoforms. In addition, in the absence of MEK1 over expression, appreciable but sub-stoichiometric levels of endogenous MEK are detected by immunoblotting. Protein identity was determined by mass spectrometry. Asterisks indicate the position of non-specific proteins associating with the anti- Flag-agarose resin. h, The basal association of BRAF-KSR1 dimers (panel a, lane 3 and panel b,lane 1) depends on endogenous MEK. Reducing MEK1 and MEK2 levels by short hairpin RNA (shRNA) interference (combination of shMEK1 and shMEK2) decreases the amount of Pyo-KSR1 co-purifying with Flag-BRAF. NT stands for non-target control shRNA. Experiments were repeated at least 3 times. For gel source data, see Supplementary Fig. 1.
Extended Data Figure 4. MEK1 binding to KSR1 is required for the transactivation of BRAF by side-to-side dimerization.
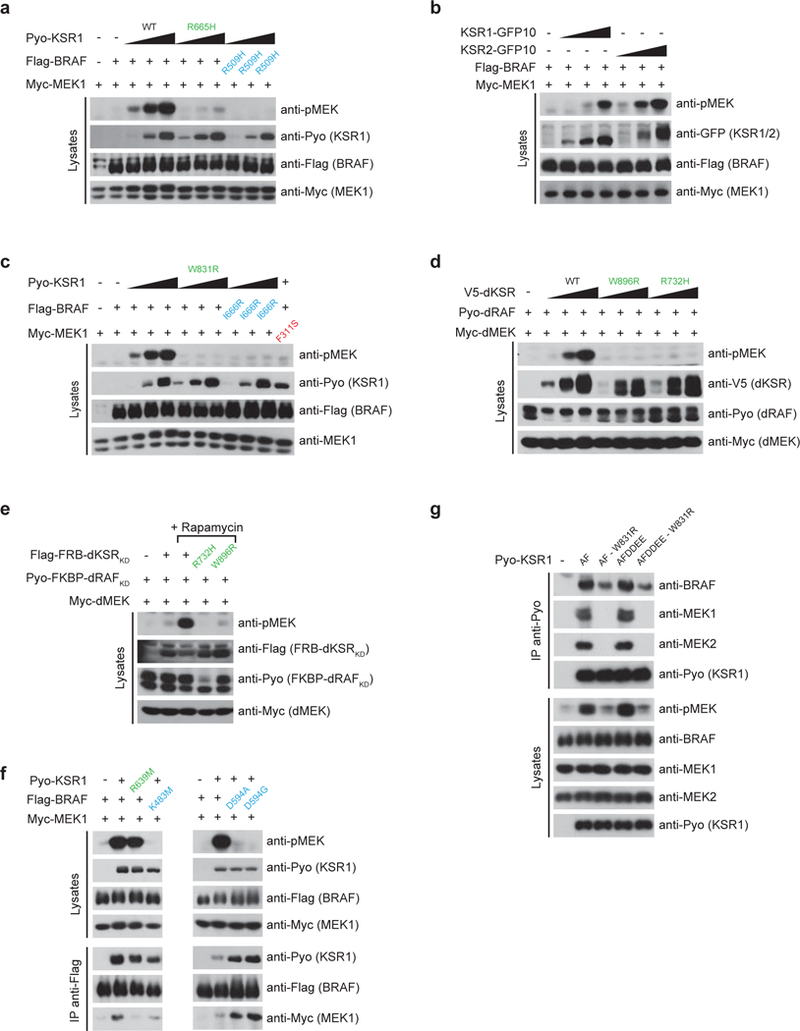
a, BRAF activation by KSR1 depends on an intact side-to-side dimerization surface in each protomer. Co-transfection of WT BRAF and KSR1 induces a strong phospho-MEK signal while KSR1R665H or BRAFR509H mutants do not. b, Human KSR1 and KSR2 can both transactivate BRAF. C-terminal GFP10 fusions of KSR1 and KSR2 were co-transfected with BRAF and the resulting phospho-MEK signal was monitored by western immunoblotting. c, Disruption of KSR1- MEK1 interaction with the W831R mutation perturbs BRAF transactivation by KSR1. The BRAF I666R mutation also prevents MEK phosphorylation. Similarly, MEK1F311S is not phosphorylated when co-transfected with WT BRAF and KSR1. d, Transactivation of Drosophila RAF (dRAF) by Drosophila KSR (dKSR) requires MEK binding (W896R mutation is homologous to W831R in human KSR1) and dRAF-dKSR dimerization (R732H mutation is homologous to R665H in human KSR1). e, The transactivation potential of FRB-dKSRKD towards FKBP-dRAFKD was assessed by monitoring the levels of phosphorylated MEK in the presence or absence of rapamycin in S2 cells (1 μM). Blocking MEK binding to dKSR (W896R mutation) and dRAF-dKSR dimerization (R732H mutation) abrogated RAF transactivation and MEK phosphorylation as judged by western immunoblotting. f, MEK phosphorylation induced by co-transfection of BRAF and KSR1 depends on the catalytic activity of BRAF and not on the integrity of the active site region of KSR1. g, KSR1 A637F (AF) and A637F/YLQE602–604>DDEE602–604 (AFDDEE) gain-offunction mutants are dependent on binding to endogenous MEK1/2 in order to dimerize with endogenous BRAF and to activate the cellular pool of RAF as judged by phospho-MEK1/2 signal. The W831R substitution in KSR1 was employed to abrogate KSR1AF and KSR1AFDDEE mutant binding to MEK. Experiments were repeated at least 3 times. For gel source data, see Supplementary Fig. 1.
Extended Data Figure 5. Identification of MEK1 mutants rescuing the interaction with KSR1W831R.
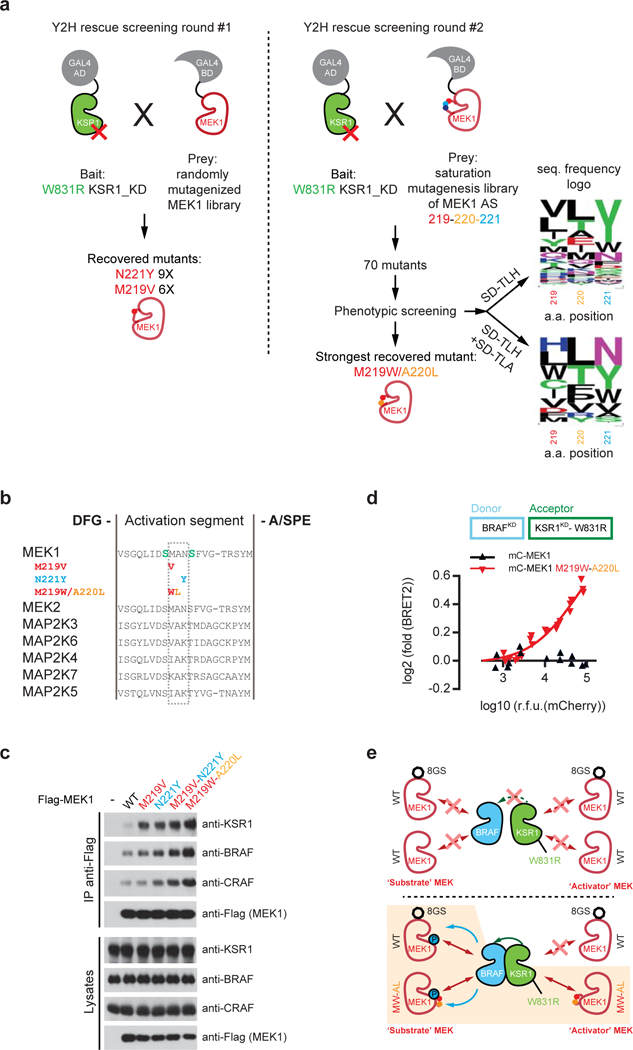
a, Screening scheme used to identify MEK1 mutants rescuing the interaction with KSR1W831R. Screening was conducted in two rounds. In round #1, MEK1 was randomly mutagenized by errorprone- PCR, which identified 16 mutants corresponding exclusively to M219V and N221Y substitutions. In round #2, saturation mutagenesis was used to test all possible residue combinations in the region encoding amino acids 219–221. This identified 70 mutants that either complemented the Y2H interaction on SD –TLH or on both SD –TLH and SD –TLA. Sequence diversity of the recovered mutants is summarized by sequence logos shown on the right (see Supplementary Table 2 for details regarding mutant sequences). After further phenotypic screening, the fittest mutant on SD-TLA corresponded to MEK1M219W-A220L. b, Position of MEK1 mutations that rescue the interaction with KSR1W831R. Mutations systematically mapped to the MEK1 activation segment between Ser218 and Ser222, which are target phosphorylation sites for RAF proteins. Multiple sequence alignments of MAP2K1–7 activation segments illustrate that residues 219–221 vary within the MAP2K family, suggesting that substitutions of this sequence do not drastically affect enzyme function. The M219V substitution recovered in our screen is also found at the homologous position in MAP2K3 and MAP2K6. c, MEK1 activation segment mutations MEK1M219V, MEK1N221Y, MEK1M219V/N221Y, and MEK1M219W/A220L stimulate MEK1 binding to endogenous KSR1, BRAF, and CRAF. Co-immunoprecipitation of Flag-tagged MEK1 variants was performed in HEK293T cells. d, MEK1M219W-A220L but not WT MEK1 stimulates KSR1W831R-BRAF dimerization in BRET assays. mCherry-tagged MEK1 WT or MEK1M219WA220L were titrated in cells expressing the BRAF-KSR1W831R BRET biosensors. BRET log2 foldchanges were reported as a function of log10 transformed mCherry relative fluorescence units (RFU). e, Strategy to distinguish activator and substrate MEK in BRAF transactivation assays. Eight repeats of a G4S flexible linker (symbolized by an octagon) was added onto WT MEK1 to separate it by size from co-transfected MEK variants lacking the linker. Experimental conditions corresponding to lanes 7 and 8 of Fig. 2d, respectively, are depicted at the top and bottom of the diagram. Experiment in e was repeated at least 3 times. For gel source data, see Supplementary Fig. 1.
Extended Data Figure 6. BRAF and KSR1 N-terminal regulatory regions (NTRs) selectively interact.
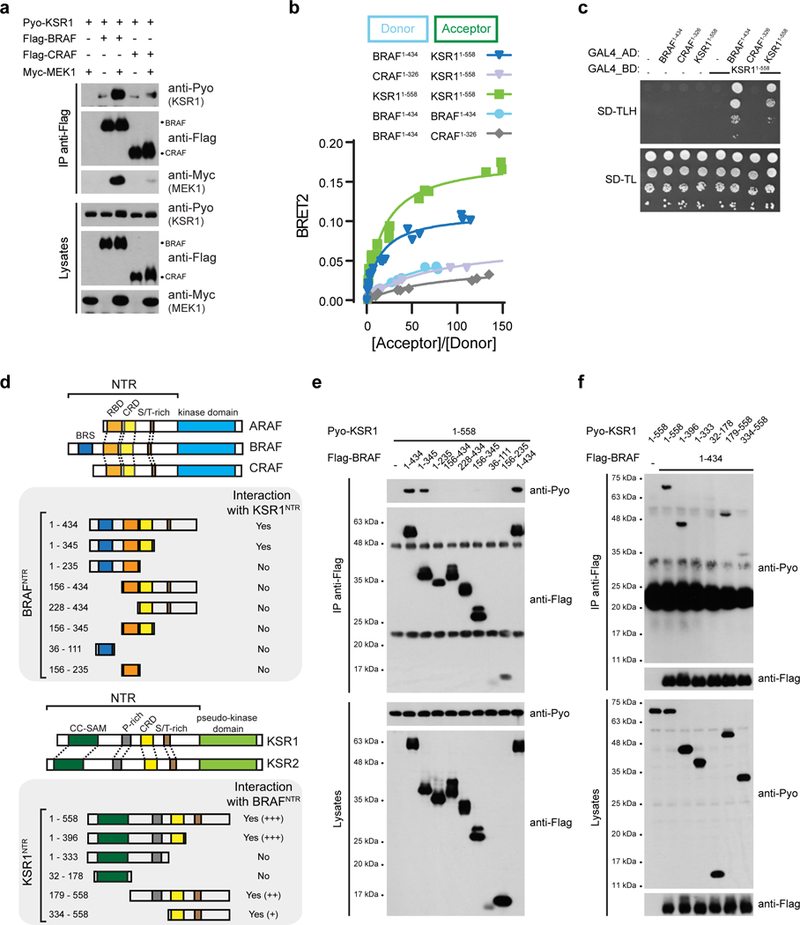
a, MEK expression promotes BRAF-KSR1 interaction but not CRAF-KSR1 interaction. b, BRET titration experiments were used to monitor the interaction between BRAFNTR, CRAFNTR and KSR1NTR. The indicated donor and acceptor pairs were tested for interaction in titration experiments. c, Yeast-two hybrid assays confirm interaction between BRAFNTR and KSR1NTR, and KSR1NTR self-association. d, Domain architecture of full-length mammalian RAF and KSR isoforms and schematic of truncations used to map the molecular determinants of BRAFNTRKSR1NTR interaction. Within the NTRs are highlighted the Ras-binding domain (RBD; orange), Cysteine-rich domain (CRD; yellow), Serine/Threonine-rich (S/T-rich; brown) region, Prolinerich (P-rich; gray) region, BRAF specific (BRS; blue) domain and the Coiled coil - Sterile alpha motif (CC-SAM; green) domain. Co-IP results derived from multiple experiments are indicated (Yes/No) with representative examples shown in panels e and f. e, Co-immunoprecipitation of Pyo-KSR1NTR with the indicated fragments of Flag-tagged BRAF. f, Co-immunoprecipitation of the indicated fragments of Pyo-KSR1 with Flag-tagged BRAFNTR. Experiments were repeated at least 3 times. For gel source data, see Supplementary Fig. 1.
Extended Data Figure 7. The contact surfaces between BRS and CC-SAM domains are required for the physical and functional interactions between BRAF and KSR1.
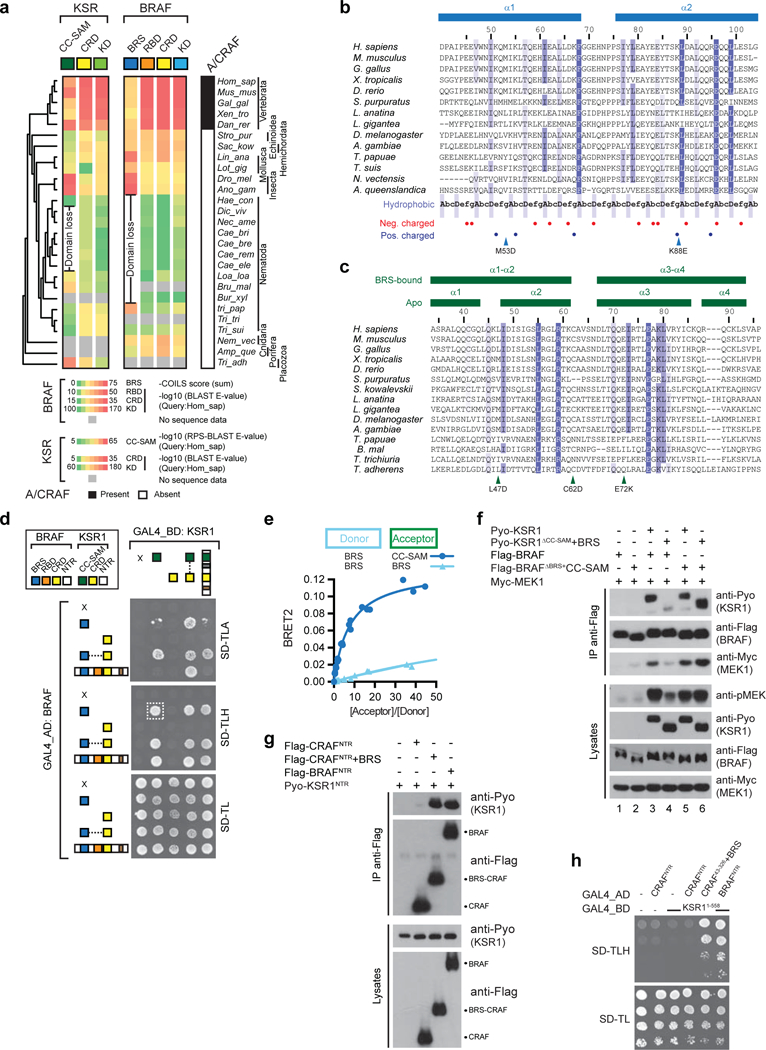
a, Phylogenetic profiling of BRAF and KSR1 domains demonstrates conservation of the BRS and CC-SAM domains throughout metazoan evolution. A concomitant loss of both domains is observed in the nematode lineage (indicated by “Domain loss”). The conservation of each of BRAF and KSR1 domains with its human ortholog was color-coded by BLAST E-value. RPSBLAST was used to assess conservation of the CC-SAM domain. Conservation of the BRS was established by calculating the sum of the COILS score of amino acids located upstream of the RBD in each BRAF ortholog. b, Sequence alignment of the BRAF-specific (BRS) sequence from 14 metazoan species shows a conserved pattern of hydrophobic residues consistent with a coiledcoil region. Secondary structure elements identified in the BRS crystallographic structure are delineated above the sequence alignment. The heptad repeat (AbcDefg) typical in coiled-coil domains is shown below the alignment: positions A and D usually comprise hydrophobic amino acids while positions b, c, e, f and g usually comprise polar or charged residues. BRS mutations used in this study are indicated by arrowheads. c, Sequence alignment of the coiled-coil-SAM (CC-SAM) sequence from 15 metazoan species. Secondary structure elements identified in the apo and BRS-bound CC-SAM structures are delineated above the sequence alignment. CC-SAM mutations used in this study are indicated by arrowheads below the alignment. Species in the phylogenetic tree and the sequence alignments are: Homo sapiens, Mus musculus, Gallus gallus, Xenopus tropicalis, Danio rerio, Strongylocentrotus purpuratus, Saccoglossus kowalevskii, Lingula anatina, Lottia gigantea, Drosophila melanogaster, Anopheles gambiae, Haemonchus contortus, Dictyocaulus viviparus, Necator americanus, Caenorhabditis briggsae, Caenorhabditis brenneri, Caenorhabditis remanei, Caenorhabditis elegans, Loa loa, Brugia malayi, Bursaphelenchus xylophilus, Trichinella papuae, Trichuris trichiura, Trichuris suis, Nematostella vectensis, Amphimedon queenslandica and Trichoplax adherens. d, Y2H mating matrix of BRAF and KSR1 NTR domains and chimeric fusions (the dashed box indicates the interaction between isolated BRS and CC-SAM domains). e, The BRS and CC-SAM domains specifically interact as determined by BRET titration experiments. In contrast, the BRS-BRS BRET pair did not generate a significant BRET signal. f, Swapping of the BRS and CC-SAM domains supports the BRAFKSR1 interaction and transactivation of BRAF by KSR1. Fusing the BRS domain to CRAF NTR stimulates its interaction with KSR1NTR by co-IP (g) and by yeast-two-hybrid (h). Experiments in d-h were repeated at least 3 times. For gel source data, see Supplementary Fig. 1.
Extended Data Figure 8. NMR characterization of the physical interaction between the BRS and CC-SAM domains.
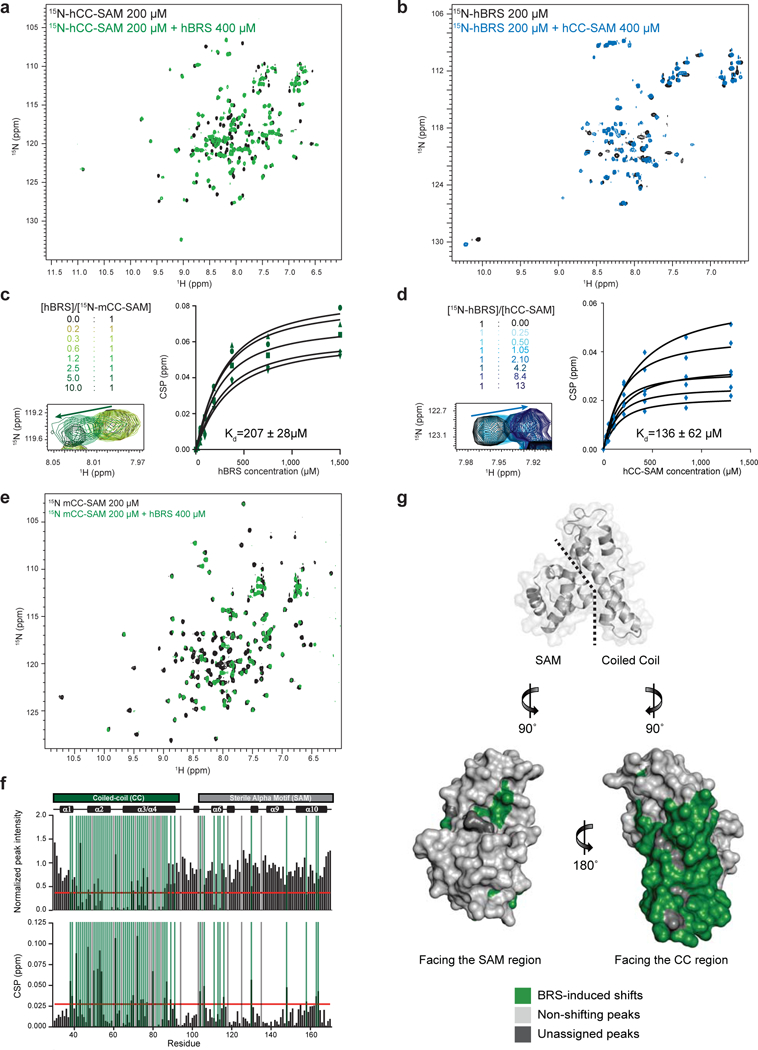
a, Superposition of the 1H, 15N-HSQC spectra of the [15N]-CC-SAM domain of human KSR1 (hCC-SAM) alone (black) and [15N]-hCC-SAM in the presence of the BRS domain of human BRAF (hBRS) (green) at a 1:2 molar ratio. Binding of BRS to CC-SAM induced both chemical shift perturbations and peak broadening. b, Superposition of the 1H, 15N-HSQC spectra of [15N]- hBRS (black) and [15N]-hBRS in the presence of hCC-SAM (blue) at the indicated molar concentrations. In the [15N]-hBRS HSQC spectra (black) numerous peaks are in intermediate (peak broadening) timescale conformational exchange giving rise to only 50 visible peaks out of 84 expected peaks. In the [15N]-hBRS:hCC-SAM HSQC spectra (blue) the binding of CC-SAM to BRS increases conformational exchange to a faster time regime giving rise to 65 visible peaks. c, Chemical shift perturbation (CSP) of the mouse KSR1 [15N]-CC-SAM (mCC-SAM) domain as a function of titrated hBRS. Superposition of the 1H, 15N-HSQC spectra of [15N]-mCC-SAM alone (black) and [15N]-mCC-SAM in the presence of hBRS (green) at the indicated molar concentrations (top left panel). The Kd value was calculated as the mean ± s.d. of 5 independent peak profiles (right panel) for which one representative chemical shift perturbation profile is shown (bottom left panel). d, CSP of the [15N]-hBRS domain as a function of titrated hCC-SAM. Superposition of the 1H, 15N-HSQC spectra of [15N]-hBRS alone (black) and [15N]-hBRS in the presence of hBRS (blue) at the indicated molar concentrations (top left panel). The Kd value was calculated as the mean ± s.d. of 6 independent peak profiles (right panel) for which one representative chemical shift perturbation profile is shown (bottom left panel). e, Superposition of the 1H, 15N-HSQC spectra of the [15N]-CC-SAM domain of murine KSR1 ([15N]-mCC-SAM) alone (black) and in the presence of the BRS domain of human BRAF (green) at a 1:2 molar ratio. Binding of BRS to mCC-SAM induced both chemical shift perturbations and peak broadening. f, Peak intensity change and CSPs versus residue number for the 1H,15N-HSQC spectra of [15N]- mCC-SAM alone versus [15N]-mCC-SAM with hBRS at a 1:2 molar ratio. Cut-off values indicated by the red line were calculated using the corrected standard deviation method40. Vertical green and gray bars indicate residues identified as being part of the interacting surface and unassigned residues, respectively. g, Significant CSPs and peak intensity changes are highlighted in green on the surface of the murine KSR1 CC-SAM domain (PDB code 2LPE). Most CSPs and peak intensity changes map to the coiled-coil region of mCC-SAM. Non shifting peaks are indicated in pale gray while unassigned peaks in the HSQC are colored in dark gray.
Extended Data Figure 9. Crystal structures of the BRS domain and the BRS:CC-SAM complex.
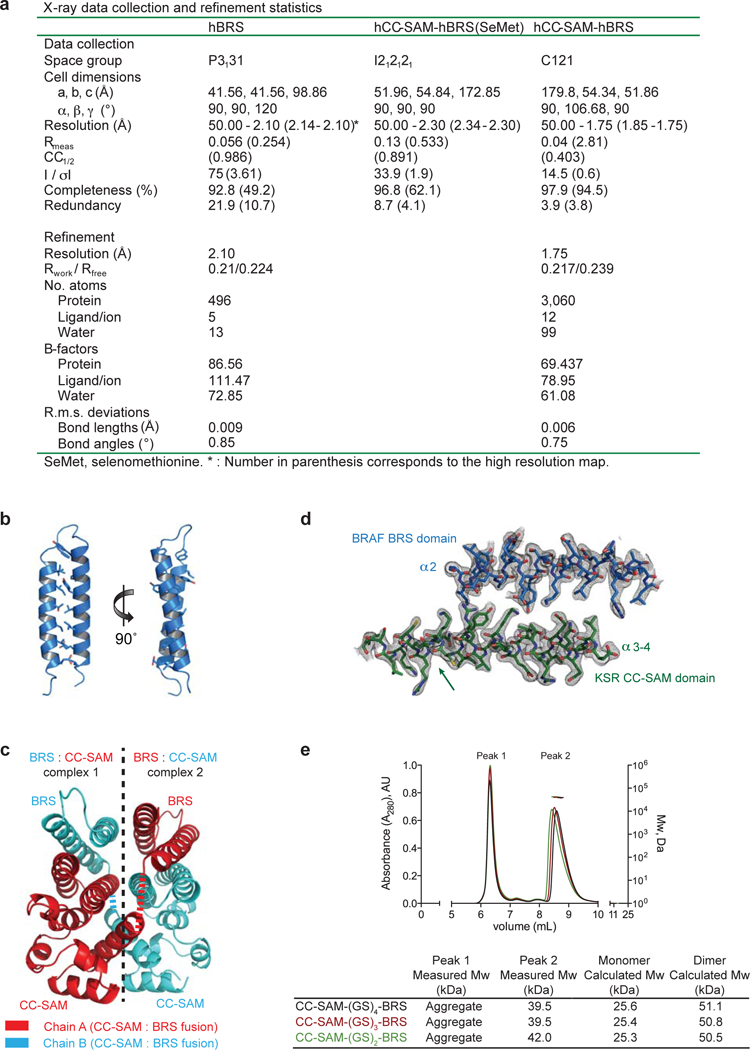
a, X-Ray data collection and refinement statistics table for the crystal structures of the hBRS domain and the hCC-SAM-hBRS complex. b, Ribbon representation of the crystal structure of the BRS domain of human BRAF. Residues comprising the hydrophobic core of the coiled-coil interactions are shown as sticks. c, Structure of the BRAF BRS: KSR1 CC-SAM domain complex. Contents of the asymmetric unit revealed two CC-SAM:BRS complexes interacting in trans. Disordered (GS)4 linker between CC-SAM and BRS domains is represented by dashed lines. The connectivity between the BRS and the CC-SAM domains was deduced as trans because in this configuration, but not the cis configuration, the carboxyl terminus of the CC-SAM domain is sufficiently close to the amino terminus of the BRS domain (15Å) to be physically spanned by the disordered linker comprised of 15 amino acid residues. For comparison, the connection in cis would need to minimally span 80Å. d, Representative final 2Fo-Fc electron density map contoured at 1.0 σ for the BRS:CC-SAM complex at a region of drastic conformational rearrangement in CC-SAM relative to the isolated CC-SAM structure (indicated by the arrow). e, Size exclusion chromatography followed by multi-angle light scattering (SEC-MALS) analysis of the indicated crystallization fusion proteins (top panel). The horizontal black, red and green lines correspond to SEC-MALS calculated masses for the indicated fusion proteins. Summary table (bottom panel) of measured and theoretical calculated molecular weights for each protein complex analysed. Experiments were performed in triplicate.
Extended Data Figure 10. Mutational and functional characterization of molecular interactions involving the NTRs and kinase domains of BRAF and KSR1.
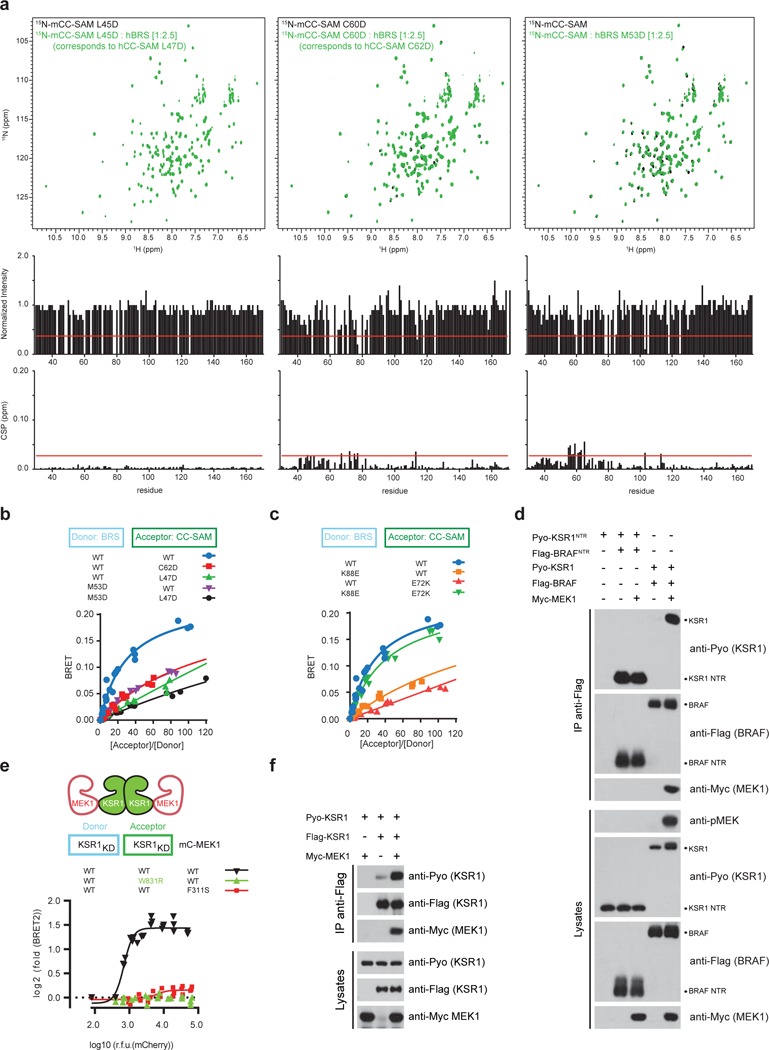
a, Peak intensity change and chemical shift perturbation (CSP) versus residue number for the 1H, 15N-HSQC spectra of the [15N]-mCC-SAM L45D mutant (black) and the [15N]-mCC-SAM L45D mutant in the presence of hBRS (green) (left panel), the 1H,15N-HSQC spectra of the [15N]-mCCSAM C60D (black) versus [15N]-mCC-SAM C60D in the presence of hBRS (green) (middle panel) and the 1H, 15N-HSQC spectra of [15N]-mCC-SAM (black) and [15N]-mCC-SAM in the presence of the hBRS M53D mutant (green) (right panel) at the indicated molar ratio. Cut-off values indicated by the red line were calculated using the corrected standard deviation method40. Residue coordinates of the CC-SAM correspond to murine KSR1; the corresponding human CC-SAM mutations are L47D and C62D. b, The BRS and CC-SAM domains specifically interact as determined by BRET. The CC-SAM L47D and C62D mutations reduce the BRS - CC-SAM BRET binding signal. Similarly, the BRS M53D mutation disrupts the BRS - CC-SAM BRET binding signal. c, Disruption of the K88-E72 salt interaction disrupts BRS - CC-SAM BRET interaction. Restoring the salt-bridge with reverse polarity as in the K88E-E72K mutant pair rescues complex formation. d, MEK1 expression induces the formation of full-length BRAF-KSR1 heterodimers, but does not induce the formation of heterodimers between the isolated NTRs of BRAF and KSR1 as detected by co-IP. e, BRET analysis demonstrating that MEK expression promotes KSR1 kinase domain homodimerization. Helix αG mutations in either KSR1 (W831R) or MEK1 (F311S) abolish MEK-induced homodimerization of the KSR1 kinase domain. BRET log2-transformed fold-changes were reported as a function of log10-transformed mCherry relative fluorescence units (RFU). f, Co-IP analysis of Pyo-KSR1 with Flag-KSR1 reveals that MEK1 promotes full-length KSR1 homodimerization. Experiments in b-f were repeated at least 3 times. For gel source data, see Supplementary Fig. 1.
Supplementary Material
Acknowledgements
We thank L. Volpon, M. Osborne, G. Seabrook and IRIC HTS and Proteomics facilities for experimental assistance. H.L. was supported by a Canadian Institutes for Health Research (CIHR) Banting fellowship. N.T. was supported by a CIHR scholarship. Research was supported by Impact Grants from the Canadian Cancer Society (702319 to M.T. and 704116 to F.S.) and by CIHR operating grants (MOP119443 and PJT152873 to M.T. and FDN143277 to F.S.). M.T. and F.S. hold Canada Research Chairs in Intracellular Signaling and in Structural Biology of Signaling. Synchrotron work at the Northeastern Collaborative Access Team beamlines was supported by National Institutes of Health grants (P41 GM103403 and S10 RR029205).
Footnotes
Data Availability
All data supporting the findings of the current study are available within the article and its Supplementary Information files or from the corresponding authors upon request. Coordinates and structure factors for the BRS domain and the CC-SAM-BRS fusion protein have been deposited in the Protein Data Bank (PDB) under accession code 5VR3 and 5VYK, respectively.
References
- 1.Desideri E, Cavallo AL & Baccarini M Alike but Different: RAF Paralogs and Their Signaling Outputs. Cell 161, 967–970, doi: 10.1016/j.cell.2015.04.045 (2015). [DOI] [PubMed] [Google Scholar]
- 2.Karoulia Z, Gavathiotis E & Poulikakos PI New perspectives for targeting RAF kinase in human cancer. Nat Rev Cancer 17, 676–691, doi: 10.1038/nrc.2017.79 (2017). [DOI] [PMC free article] [PubMed] [Google Scholar]
- 3.Lavoie H & Therrien M Regulation of RAF protein kinases in ERK signalling. Nat Rev Mol Cell Biol 16, 281–298, doi: 10.1038/nrm3979 (2015). [DOI] [PubMed] [Google Scholar]
- 4.Kolch W Coordinating ERK/MAPK signalling through scaffolds and inhibitors. Nat Rev Mol Cell Biol 6, 827–837, doi: 10.1038/nrm1743 (2005). [DOI] [PubMed] [Google Scholar]
- 5.Rajakulendran T, Sahmi M, Lefrancois M, Sicheri F & Therrien M A dimerization-dependent mechanism drives RAF catalytic activation. Nature 461, 542–545 (2009). [DOI] [PubMed] [Google Scholar]
- 6.Lavoie H et al. Inhibitors that stabilize a closed RAF kinase domain conformation induce dimerization. Nat Chem Biol 9, 428–436, doi: 10.1038/nchembio.1257 (2013). [DOI] [PMC free article] [PubMed] [Google Scholar]
- 7.Brennan DF et al. A Raf-induced allosteric transition of KSR stimulates phosphorylation of MEK. Nature 472, 366–369, doi:nature09860 [pii] 10.1038/nature09860 (2011). [DOI] [PubMed] [Google Scholar]
- 8.Haling JR et al. Structure of the BRAF-MEK complex reveals a kinase activity independent role for BRAF in MAPK signaling. Cancer Cell 26, 402–413, doi: 10.1016/j.ccr.2014.07.007 (2014). [DOI] [PubMed] [Google Scholar]
- 9.Hu J et al. Mutation that blocks ATP binding creates a pseudokinase stabilizing the scaffolding function of kinase suppressor of Ras, CRAF and BRAF. Proc Natl Acad Sci U S A 108, 6067–6072, doi:1102554108 [pii] 10.1073/pnas.1102554108 (2011). [DOI] [PMC free article] [PubMed] [Google Scholar]
- 10.Koveal D et al. A CC-SAM, for coiled coil-sterile alpha motif, domain targets the scaffold KSR-1 to specific sites in the plasma membrane. Sci Signal 5, ra94, doi: 10.1126/scisignal.2003289 (2012). [DOI] [PMC free article] [PubMed] [Google Scholar]
- 11.Van Aelst L, Barr M, Marcus S, Polverino A & Wigler M Complex formation between RAS and RAF and other protein kinases. Proc Natl Acad Sci U S A 90, 6213–6217 (1993). [DOI] [PMC free article] [PubMed] [Google Scholar]
- 12.Vojtek AB, Hollenberg SM & Cooper JA Mammalian Ras interacts directly with the serine/threonine kinase Raf. Cell 74, 205–214 (1993). [DOI] [PubMed] [Google Scholar]
- 13.Zhang XF et al. Normal and oncogenic p21ras proteins bind to the amino-terminal regulatory domain of c-Raf-1. Nature 364, 308–313, doi: 10.1038/364308a0 (1993). [DOI] [PubMed] [Google Scholar]
- 14.Jin T et al. RAF inhibitors promote RAS-RAF interaction by allosterically disrupting RAF autoinhibition. Nat Commun 8, 1211, doi: 10.1038/s41467-017-01274-0 (2017). [DOI] [PMC free article] [PubMed] [Google Scholar]
- 15.Ritt DA, Monson DM, Specht SI & Morrison DK Impact of feedback phosphorylation and Raf heterodimerization on normal and mutant B-Raf signaling. Mol Cell Biol 30, 806–819, doi: 10.1128/MCB.00569-09 (2010). [DOI] [PMC free article] [PubMed] [Google Scholar]
Methods References
- 16.Johannessen CM et al. COT drives resistance to RAF inhibition through MAP kinase pathway reactivation. Nature 468, 968–972, doi: 10.1038/nature09627 (2010). [DOI] [PMC free article] [PubMed] [Google Scholar]
- 17.Moffat J et al. A lentiviral RNAi library for human and mouse genes applied to an arrayed viral high-content screen. Cell 124, 1283–1298, doi: 10.1016/j.cell.2006.01.040 (2006). [DOI] [PubMed] [Google Scholar]
- 18.Boussif O et al. A versatile vector for gene and oligonucleotide transfer into cells in culture and in vivo: polyethylenimine. Proc Natl Acad Sci U S A 92, 7297–7301 (1995). [DOI] [PMC free article] [PubMed] [Google Scholar]
- 19.Thevakumaran N et al. Crystal structure of a BRAF kinase domain monomer explains basis for allosteric regulation. Nat Struct Mol Biol 22, 37–43, doi: 10.1038/nsmb.2924 (2015). [DOI] [PubMed] [Google Scholar]
- 20.James P, Halladay J & Craig EA Genomic libraries and a host strain designed for highly efficient two-hybrid selection in yeast. Genetics 144, 1425–1436 (1996). [DOI] [PMC free article] [PubMed] [Google Scholar]
- 21.James P Yeast two-hybrid vectors and strains. Methods Mol Biol 177, 41–84, doi: 10.1385/1-59259-210-4:041 (2001). [DOI] [PubMed] [Google Scholar]
- 22.Spee JH, de Vos WM & Kuipers OP Efficient random mutagenesis method with adjustable mutation frequency by use of PCR and dITP. Nucleic Acids Res 21, 777–778 (1993). [DOI] [PMC free article] [PubMed] [Google Scholar]
- 23.Winn MD et al. Overview of the CCP4 suite and current developments. Acta Crystallogr D Biol Crystallogr 67, 235–242, doi: 10.1107/S0907444910045749 (2011). [DOI] [PMC free article] [PubMed] [Google Scholar]
- 24.Sammito M et al. ARCIMBOLDO_LITE: single-workstation implementation and use. Acta Crystallogr D Biol Crystallogr 71, 1921–1930, doi: 10.1107/S1399004715010846 (2015). [DOI] [PubMed] [Google Scholar]
- 25.Emsley P & Cowtan K Coot: model-building tools for molecular graphics. Acta Crystallogr D Biol Crystallogr 60, 2126–2132, doi: 10.1107/S0907444904019158 (2004). [DOI] [PubMed] [Google Scholar]
- 26.Adams PD et al. PHENIX: a comprehensive Python-based system for macromolecular structure solution. Acta Crystallogr D Biol Crystallogr 66, 213–221, doi: 10.1107/S0907444909052925 (2010). [DOI] [PMC free article] [PubMed] [Google Scholar]
- 27.Kabsch W Xds. Acta Crystallogr D Biol Crystallogr 66, 125–132, doi: 10.1107/S0907444909047337 (2010). [DOI] [PMC free article] [PubMed] [Google Scholar]
- 28.Pape T & Schneider TR HKL2MAP: a graphical user interface for macromolecular phasing with SHELX programs. J Appl Cryst 37, 843–844, doi: 10.1107/S0021889804018047 (2004). [DOI] [Google Scholar]
- 29.Sheldrick GM Experimental phasing with SHELXC/D/E: combining chain tracing with density modification. Acta Crystallogr D Biol Crystallogr 66, 479–485, doi: 10.1107/S0907444909038360 (2010). [DOI] [PMC free article] [PubMed] [Google Scholar]
- 30.McCoy AJ et al. Phaser crystallographic software. J Appl Crystallogr 40, 658–674, doi: 10.1107/S0021889807021206 (2007). [DOI] [PMC free article] [PubMed] [Google Scholar]
- 31.Langer G, Cohen SX, Lamzin VS & Perrakis A Automated macromolecular model building for X-ray crystallography using ARP/wARP version 7. Nat Protoc 3, 1171–1179, doi: 10.1038/nprot.2008.91 (2008). [DOI] [PMC free article] [PubMed] [Google Scholar]
- 32.Chen VB et al. MolProbity: all-atom structure validation for macromolecular crystallography. Acta Crystallogr D Biol Crystallogr 66, 12–21, doi: 10.1107/S0907444909042073 (2010). [DOI] [PMC free article] [PubMed] [Google Scholar]
- 33.Delaglio F et al. NMRPipe: a multidimensional spectral processing system based on UNIX pipes. J Biomol NMR 6, 277–293 (1995). [DOI] [PubMed] [Google Scholar]
- 34.Vranken WF et al. The CCPN data model for NMR spectroscopy: development of a software pipeline. Proteins 59, 687–696, doi: 10.1002/prot.20449 (2005). [DOI] [PubMed] [Google Scholar]
- 35.Fielding L NMR methods for the determination of protein-ligand dissociation constants. Curr Top Med Chem 3, 39–53 (2003). [DOI] [PubMed] [Google Scholar]
- 36.Schrodinger LLC. The PyMOL Molecular Graphics System, Version 1.8 (2015). [Google Scholar]
- 37.Pettersen EF et al. UCSF Chimera--a visualization system for exploratory research and analysis. J Comput Chem 25, 1605–1612, doi: 10.1002/jcc.20084 (2004). [DOI] [PubMed] [Google Scholar]
- 38.Waterhouse AM, Procter JB, Martin DM, Clamp M & Barton GJ Jalview Version 2--a multiple sequence alignment editor and analysis workbench. Bioinformatics 25, 1189–1191, doi: 10.1093/bioinformatics/btp033 (2009). [DOI] [PMC free article] [PubMed] [Google Scholar]
- 39.Bond CS & Schuttelkopf AW ALINE: a WYSIWYG protein-sequence alignment editor for publication-quality alignments. Acta Crystallogr D Biol Crystallogr 65, 510–512, doi: 10.1107/S0907444909007835 (2009). [DOI] [PubMed] [Google Scholar]
- 40.Schumann FH et al. Combined chemical shift changes and amino acid specific chemical shift mapping of protein-protein interactions. J Biomol NMR 39, 275–289, doi: 10.1007/s10858-007-9197-z (2007). [DOI] [PubMed] [Google Scholar]
Associated Data
This section collects any data citations, data availability statements, or supplementary materials included in this article.


