

Abstract
Purpose
The measurement and estimation of diabetes in populations guides resource allocation, health priorities, and can influence practice and future research. To provide a critical reflection on current diabetes surveillance, we provide in-depth discussion about how upstream determinants, prevalence, incidence, and downstream impacts of diabetes are measured in the USA, and the challenges in obtaining valid, accurate, and precise estimates.
Findings
Current estimates of the burden of diabetes risk are obtained through national surveys, health systems data, registries, and administrative data. Several methodological nuances influence accurate estimates of the population-level burden of diabetes, including biases in selection and response rates, representation of population subgroups, accuracy of reporting of diabetes status, variation in biochemical testing, and definitions of diabetes used by investigators. Technological innovations and analytical approaches (e.g., data linkage to outcomes data like the National Death Index) may help address some, but not all, of these concerns, and additional methodological advances and validation are still needed.
Summary
Current surveillance efforts are imperfect, but measures consistently collected and analyzed over several decades enable useful comparisons over time. In addition, we proposed that focused subsampling, use of technology, data linkages, and innovative sensitivity analyses can substantially advance population-level estimation.
Keywords: Diabetes, Surveillance, Burden estimation, Nutrition, Quality of life
Introduction
Population-level measurement of chronic cardiometabolic conditions such as diabetes provide valuable data that can guide decision-makers in health systems, communities, workplaces, legislatures, and public and private payers. Epidemiology offers the tools to enumerate how burdensome these conditions are, and determine which characteristics make people most vulnerable to these diseases. Epidemiological research can be applied to prioritize populations at greatest risk and those most likely to benefit from interventions, and to monitor delivery and impacts of prevention and treatments. However, based on the data sources that are available and/or chosen, as well as the analytical approaches used, epidemiologic analyses can provide widely varying estimates of disease risk and burden.
Disease surveillance has its historical origins in studying infectious, communicable disease epidemics. However, when applied to chronic, non-communicable conditions, there are a number of nuances that influence estimation, interpretation, and subsequent action. For example, the asymptomatic nature and long latency of many chronic diseases influence the tools and approaches we use to measure burden. In this paper, we describe the case of diabetes in the USA to enumerate the challenges of measuring chronic disease prevalence, risk factors, and effects at the population-level and offer suggestions that may help advance this area in the future.
Current Diabetes Surveillance in the USA—How We Measure
Population monitoring of diabetes in the USA [1] relies on a diverse set of complementary population surveys, health system datasets, and registries (Figs. 1 and 2). These data are used to measure diabetes risk factors, prevalence and incidence, morbidity, care, and mortality. Although these datasets are most comprehensive for the national level, some may be used to quantify diabetes burdens at the state and local levels.
Fig. 1.
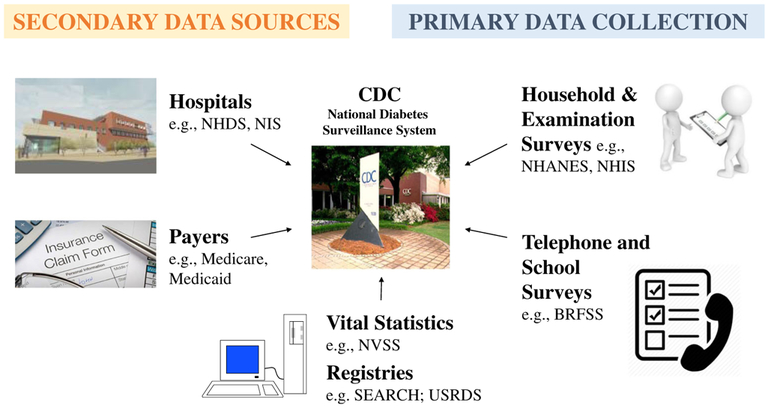
Data sources routinely used for national diabetes surveillance by the US Centers for Disease Control and Prevention. NHDS National Hospital Discharge Survey, NIS National Inpatient Sample, NVSS National Vital Statistics System, SEARCH Search for Diabetes in Youth Study, USRDS US Renal Data System, NHANES National Health and Nutrition Examinations Surveys, NHIS National Health Interview Survey, BRFSS Behavioral Risk Factor Surveillance System
Fig. 2.
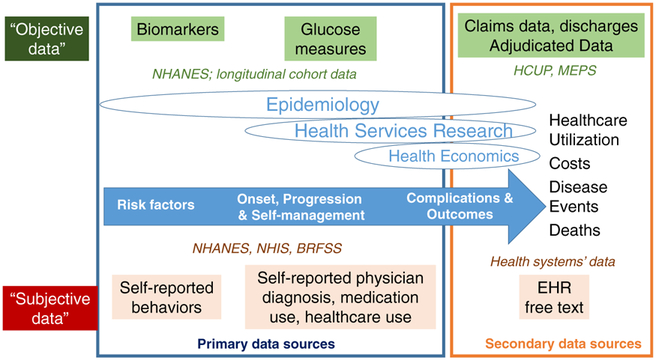
Data sources that are used to monitor different phases of diabetes risk and burdens, stratified by data collection and subjectivity. NHANES National Health and Nutrition Examinations Surveys, NHIS National Health Interview Survey, BRFSS Behavioral Risk Factor Surveillance System, EHR electronic health record, HCUP, Healthcare Utilization Project, MEPS Medical Expenditure Panel Surveys
Surveillance of risk factors for diabetes is conducted primarily via individual-level surveys conducted by the National Center for Health Statistics (NCHS) that sample the general population to assess health behaviors such as smoking, physical activity levels, and dietary intake. These individual-level surveys include the National Health and Nutrition Examination Survey (NHANES) [2], National Health Interview Survey (NHIS) [3], and Behavior Risk Factor Surveillance System (BRFSS) [4] which are also used to assess the awareness and treatment of common risk factors such as hyperlipidemia and hypertension, as well as the degree to which individuals have been advised to change behaviors. These surveys are used to assess prevalence of diagnosed diabetes by asking participants if they recall receiving a diagnosis from a physician or if they are currently taking glucose-lowering medications. By using physical exams and laboratory assessments, the NHANES surveys also include objective measures of blood pressure and glycemia that are used to identify risk status among those without prior knowledge of their risk. In addition, diabetes incidence is measured in the USA by asking individuals surveyed in the NHIS about the date of diagnosis, with prior year identification providing the numerator of cases newly diagnosed.
To monitor routine diabetes care, the aforementioned national datasets are often queried to examine what treatments people with diabetes are using and how well they are achieving control of their CVD risk factors [5, 6]. The medical expenditure panel survey (MEPS) [7] or telephone survey data such as the BRFSS can be used to assess whether people with diabetes are receiving medications or preventive screenings (e.g., annual eye, foot, and urine checks) for complications of diabetes. Health system datasets such as those derived from electronic health records can support monitoring how well people with diabetes are managing specific CVD risk factors.
Surveys are also used to estimate prevalence of selected health conditions associated with diabetes, such as self-reported history of myocardial infarction, stroke, peripheral arterial disease, cancer, and physical disability. In the NHANES, urine and blood sample collection and measurements are used to assess chronic kidney disease and related severity. Specific physical and laboratory measurements are also intermittently integrated into the NHANES surveys to assess the prevalence of specific problems, such as diabetic retinopathy and visual acuity, and limb diseases including peripheral neuropathy and peripheral vascular disease. Data on other morbidities are derived from non-survey or “secondary” data sources. For example, the National Inpatient Sample [8] is a nationally representative sample of hospital discharges used to assess rates of major diabetes-related complications [9]. Claims data from public or private payers for healthcare can be used for similar purposes and are often adjudicated—i.e., subsamples are reviewed for accuracy as reimbursement and payment are at stake. Emergency department data is also used to assess national and state levels of acute hyperglycemia, including diabetic ketoacidosis and non-ketotic hyperosmolar hyperglycemic coma, and hypoglycemia. Some forms of diabetes-related morbidity, such as end-stage renal disease, are assessed using registries, such as the US Renal Data System [10], which tracks cases of end-stage renal disease.
Finally, the US vital statistics data system is used to estimate all-cause and cause-specific death rates. However, for conditions like diabetes, in which reporting and attribution on death certificates can be subjective and variable [11], mortality data are often linked with other population-based data systems so that death rates can be compared between adults with and without diabetes.
Challenges in Estimating Prevalence, Incidence, Mortality
Several methodological nuances influence our estimation of diabetes prevalence, incidence, and mortality using population surveys. Sampling frames and response rate determine the representativeness of the population recruited. At the national level, response rates vary considerably. The BRFSS, for example, routinely achieves 30–40% response rates in its attempts to collect survey data telephonically. Similarly, response rates in NHANES vary according to component (household interview or exam), and response rates have declined over time. To produce estimates representative of the US non-institutionalized civilian population, to compensate for unequal probabilities of demographic or geographic selection into the surveys, and to adjust for participant non-response, the NCHS publishes survey weights. With regard to representativeness, because of their relative numbers in the population, there is the risk of underrepresentation of minority racial or ethnic groups such that estimates for these subgroups become imprecise. To address this problem, NCHS purposively oversamples certain geographic regions and minority racial and ethnic groups.
To determine diabetes status, surveys ask whether individuals have been diagnosed as having diabetes by a health professional and whether they are being treated for said condition. Only the NHANES survey collects biological samples for laboratory analysis to confirm diabetes status. The likelihood of an individual self-reporting his or her diabetes status accurately depends on several interrelated system-level, healthcare provider-level, and individual-level factors. For example, at the system level, individuals without financial or physical access to healthcare are less likely to be tested. At the provider level, there is substantial variation in practice patterns and how health professionals communicate a diagnosis of diabetes. For example, health professionals vary in their choice of which screening guideline to follow, how adherent they are to the guidelines, which biochemical test they choose to use (as there may be variations in which tests they are comfortable using), which test costs are reimbursed, and the accuracy of the laboratory estimation [12–14]. In addition, health professionals vary in how they interpret and choose to act on test results. Needless to say, there is also variation in how a diagnosis of diabetes is conveyed, and this influences how it is internalized and relayed by the individual concerned. At the patient level, personal characteristics and motivations affect how individuals access care, interact with providers, receive diagnostic and prognostic information, and act on and communicate these data to others. Recall bias and social desirability, in particular, are common in surveys where people are asked to remember their health behaviors, status, or treatments.
Collection and analysis of biospecimens can address some concerns of recall and accuracy of self-report. However, here too, there can be biases that affect interpretation of population diabetes estimates. If participants do not adhere to the recommended fasting period before certain blood tests, findings can be erroneous. Furthermore, the blood glucose measures we have at our disposal reflect different phenotypes of elevated glucose—impairment of fasting glucose, impairment of 1- or 2-h post-challenge glucose tolerance, or elevation of glycated hemoglobin indicating that blood sugar has been elevated persistently over the past 2 to 3 months. These tests have different sensitivities, specificities, and positive predictive values in terms of their ability to discriminate diabetes status and reflect different underlying pathophysiological impairments in glucose metabolism. Also, because people could have one phenotypic defect and not another, these tests can give discordant results. The calibration and validation of laboratory tests across multiple data collection sites is also important [15].
The main analyst-level factors that influences population estimates of diabetes is how researchers chooses to define diabetes—both in the indicator they use and the threshold used to classify diabetes. For example, studies using HbA1c may yield lower prevalence than those using fasting plasma glucose or an oral glucose tolerance test; similarly, studies using multiple indicators will have higher prevalence than those relying on just a single measure. There is less agreement around ideal thresholds for prediabetes, and as blood glucose levels are continuous measures, the chosen cutoff to define diabetes analytically can be very low (making it very sensitive) or very high (making it highly specific) which can inflate or deflate the prevalence, respectively. In addition, imposing thresholds without reporting the distributions can result in substantial clustering of individuals around the imposed thresholds.
Furthermore, since surveys collect data at single time-points from participants, and glucose measures are variable within individuals, the survey estimates only reflect the glucose on that date. Using measures that are more stable over time, such as glycated hemoglobin levels, or potentially doing a second confirmatory test, may address this concern. Confirmatory testing at the same visit can be effective [16, 17], while requiring a return visit could lower response rates in large population-based studies.
Estimates of diabetes burden are also often derived from studies of health system datasets which vary widely in how they define diabetes. For example, more optimal definitions of diabetes may come from integrated health system datasets where a composite of inpatient, outpatient, medication, and laboratory data can be used [18, 19•]. Therefore, systems that have ambulatory or hospitalization data provide generally more valid estimates, than systems that rely only on a single administrative data source (e.g., hospitalization alone; pharmacy alone; laboratory alone; outpatient alone) and subject to the biases described above (Table 1).
Table 1.
Characteristics that distinguish and influence the interpretation of primary and secondary sources of data for national diabetes surveillance
| Primary data (surveys, etc.) |
Secondary data (claims, etc.) |
|
|---|---|---|
| Representativeness | Representative of respondents who agree to be surveyed | Representative of those insured or having access to a certain system |
| Type of data | Self-reported (and perceived) diagnoses, behaviors, healthcare use, HRQoL, biomarkers | Generation of routine data for non-scientific purposes (patient diagnoses, processes, prescriptions) |
| Strengths | Combination of socio-demographic, behavioral, biomarker data, and patient reported outcomes | Detailed in- and outpatient diagnosis and process codes, large sample sizes, retrospective longitudinal data |
| Limitations/sources of bias | Data collection is expensive, sample size issues with rare complications, recall and/or social desirability bias | Limited information on socio-economic background and patient behavior, provider- or system-level incentives or errors in coding/classification |
| Interpretation | Reflect behaviors or levels at time of survey; not time prior to or after survey. No confirmation of diagnoses or events | Reflect what was billed or recorded; not (always) linked to actual biomarkers or behaviors. Cannot assess disease control/severity |
Challenges in Measuring Upstream Exposures
It is also important to measure population-level upstream exposures that play a role in the development of disease, such as nutritional intake and physical activity in the case of diabetes. This can help guide and establish public health priorities and goals.
Nutritional Intake
Suboptimal diet is a leading risk factor for death and disability in the USA [20] and modest dietary changes are associated with meaningful modification of type 2 diabetes risk [21, 22]. However, surveillance of dietary intake can be particularly challenging. Two often cited concerns regarding nutrition sciences are that assessment methods rely too heavily on self-reported dietary intake and, because of the observational nature of the majority of studies, the conclusions may be unreliable and seem to be ever-changing in terms of whether a given nutrient or food is harmful or healthy—and which nutrient or food is being studied [23].
Unlike tobacco, nutritional intake is not all harmful, and many foods have a combination of nutrients that may raise or lower risk. Moreover, the health impacts of dietary components can take decades to be manifest [24, 25]. As a result, for dietary exposures that happened long ago, accurate recall by the individual may be difficult. Furthermore, dietary intake measured today may or may not be reflective of an individual’s general intake across the life-course. Also, we know very little about if and how food preparation, processing, and early life habits influence pathophysiology.
The 24-h dietary recall (24HR) is the gold standard for collecting detailed individual-level dietary intake data in national surveys. Through open-ended interviewer (or online) prompts, participants are asked for information about foods and beverages consumed in the previous 24-h period. Information collected may include the types and quantities (portion sizes) of foods and beverages (including supplements) consumed, as well as cooking methods used. Together, these data are useful in estimating mean dietary intake levels for the population. To capture variation in dietary intake, NHANES invites participants to report on typical weekday and weekend intake [26]. Although 24HRs cannot provide the most precise and accurate portrayal of an individual’s long-term dietary intake pattern [27], methods exist to collect additional 24HR data from subsets of participants to estimate longer term patterns.
A food frequency questionnaire (FFQ), in contrast, is a prespecified checklist of foods and beverages where participants report how often each item was consumed during a specified period ranging from 1 week to 1 year. The FFQ tends to be used for capturing an individual’s (habitual) food intake patterns but suffers from a number of systematic biases that cannot be controlled for or accommodated with analytical methods after collection. The FFQ is a retrospective method that relies upon the participant’s ability and willingness to accurately remember and report dietary intake over up to a year.
Food diaries are typically completed by the participant over three consecutive days (two weekdays and one weekend day) or over seven consecutive days, and include a complete list of all foods and beverages, and portion sizes of each, consumed during the period. There is less recall bias because the recording is done at the time of consumption; however, inaccuracies and incomplete reporting, as well as the risk that data collection changes behavior all persist as challenges.
Each of these nutrition data collection tools relies on selfreport, which are subjective and prone to challenges in estimating portion size and can result in both random and systematic errors [28, 29]. To help address this, common household measures and food models (two-dimensional or three-dimensional) or food photographs are often provided to respondents. Another challenge is that food composition tables are needed to match food consumed to its nutrient contents.
In addition to individual dietary intake measurement, ecological population-wide data provide adjunct evidence regarding nutritional intake. Importantly, these data consider food availability (both calories and food groups) at the population level and take agricultural production, imports, exports, and food losses, into account in estimating overall and per capita availability of foods.
Physical Activity
Physical activity is a key protective factor for type 2 diabetes and other cardiometabolic diseases; however, it is challenging in terms of valid and precise measurement [30]. When measuring physical activity, four dimensions are ideally considered: frequency (sessions or days per week), intensity (amount of effort required for the activity), duration (length of session or accrued length of physical activity during a week), and type (other information about the nature of the activity or purpose, i.e., leisure-time versus household/gardening versus occupational/school versus active transportation). These domains of physical activity (and sedentary behavior) can be measured in several different subjective (self-reported questionnaire responses) and objective ways (accelerometers).
The advantages of questionnaires is that they are relatively easy to administer to large groups and have a low respondent burden, they can assess physical activity across multiple domains and at both qualitative and quantitative levels, and they are relatively cheap. Some disadvantages include inaccuracy because of social desirability biases or recall bias. One of the most commonly used questionnaires is the International Physical Activity Questionnaire (IPAQ), which can be administered by either telephone or self-administered methods in long form (five activity domains asked independently) or short form (four generic items). The IPAQ was developed at the World Health Organization following extensive reliability and validity testing across 12 countries and is suitable for use in many settings and different languages.
Pedometers are worn and assess the number of steps a person takes by responding to vertical forces. Pedometers are relatively inexpensive and non-invasive, and easy to use for large groups. The disadvantages of pedometers are that they only measure one domain of physical activity (i.e., they do not measure frequency, intensity, or duration), and they cannot be used for activities such as swimming. In addition, at least one study has shown that device data feeds can be manipulated [31]. Similarly, accelerometers are worn at the waist or on the wrist and record body motion over time, providing information about intensity, frequency, and duration of physical activity. They have very low subject burden and provide simple, quick data collection. However, estimation of physical activity units based on acceleration data is a complex science.
Direct observation involves watching people and recording specific behaviors. Such methods are commonly used for children, when the activity is restricted to a delineated space (e.g., a classroom). The method can result in accurate, contextual data, but disadvantages include the time burden, potential reactivity (having the observed individual change their behavior because of being observed), and challenges related to obtaining ethical approval.
Challenges in Measuring Outcomes
Measuring outcomes relevant to the individual and to society such as quality of life, healthcare resource utilization, and cost are all important for policy makers. Data from health and examination surveys or claims data are predominantly used to measure these.
Claims data comprise the billing codes that healthcare providers submit to payers for the purpose of reimbursement. The advantages of these data are their relatively consistent format with established codes for diagnoses, procedures, and drugs and related reimbursement values; the volume of data available; the longitudinal data structure; and the great level of detail offered. The shortcomings of claims data are the susceptibility of coding to incentives set by systems and payers, the unavailability of clinical information such as diabetes duration or glycemic control, and the fact that except for universal health systems, claims data only comprise data of certain subgroups of people that have access to care. In the USA, only data from Medicare and Medicaid beneficiaries are available openly for analysis [32].
Some health surveys collect data regarding participants’ healthcare utilization, i.e., the frequency of inpatient and outpatient contacts and the type and volume of utilized rehabilitation and medication. The great advantage of survey data for burden of disease analyses is that clinical information and health behavior can be linked with healthcare utilization. The problems related to survey data are representativeness and that information on healthcare utilization in some surveys is prone to recall bias and misclassification. Furthermore, since the estimation of healthcare costs requires the use of unit cost values, and sample size does often not allow studying less prevalent complications such as amputations or ESRD.
Healthcare Costs
Direct costs consist of healthcare costs, such as medical expenditures for diagnosis, treatment, and rehabilitation, and non-healthcare costs, such as expenditures for transportation, relocating or informal care. Indirect costs refer to productivity losses caused by morbidity and mortality. In general, the estimation of costs includes two parts: (1) quantification of healthcare utilization, absenteeism, and premature mortality, and (2) the monetary valuation of these components. Although valuation is mostly straightforward for healthcare costs, the valuation of direct non-medical costs and indirect costs is methodologically and philosophically challenging.
To analyze the burden or impacts of diabetes, researchers often apply bottom up studies using individual-level data, i.e., they apply econometric methods to compare utilization and costs between comparable individuals with and without the disease over a predefined time horizon, typically a year [33, 34]. Other cost of illness studies also often apply top-down approaches that use aggregated data along with population-attributable fractions to estimate attributable costs [35]. Some economic analyses, such as studies of the American Diabetes Association or the International Diabetes Federation, combine cost ratios and prevalence data to estimate the total US national ($176 billion) or global ($612–1099 billion) healthcare expenditures attributable to diabetes [36, 37]. Given the methodological problems in valuation of productivity losses, studies that assess indirect cost burdens are less frequent and often highly heterogeneous in their results.
One conceptual problem of many of these cost studies is that the resulting cost estimates represent associations more than causality. Data show that, compared to people who do not develop diabetes, people who develop diabetes have increased healthcare costs years before the onset of diabetes. This suggests that diabetes prevention may not result in cost savings at the magnitude of those estimated excess costs [38]. Estimated costs attributable to diabetes are also highly dependent on the chosen analytical method and underlying data source. Moreover, changes in excess cost or healthcare utilization for diabetes over time may actually reflect changes in the underlying population, changes in policy or reimbursement schemes that make certain procedures more attractive, or changes in the volume or price of utilized resources such as medications or emergency visits.
Quality of Life
Health-related quality of life (HRQoL) is a multi-dimensional concept representing a composite of physical functioning, psychological, and social well-being assessed through disease-specific or generic questionnaires [39]. There are various disease-specific quality of life questionnaires such as the Diabetes Quality of Life (DQOL) and the Diabetes-Specific Quality of Life Scale (DSQOLS), the Problem Areas in Diabetes scale (PAID), and many more, that measure diabetes-specific dimensions such as symptoms, worries, self-care, functional ability, social support, and sexual functioning [40–42]. In contrast, more generic instruments, such as the 12-item Short Form Health Survey (SF-12), 36-item Short Form Health Survey (SF-36), the 5-dimension EuroQol (EQ-5D), or the Health Utilities Index Mark 3 (HUI3), are less sensitive, but allow comparisons across different diseases and are therefore used for burden of disease estimations. The latter two are index-based generic instruments that consist of multi-attribute descriptive systems, which can be converted into a single preference-based utility value. These utility values can subsequently be used to weight life years to derive quality-adjusted life years (QALYs).
There are several challenges in measuring and interpreting HRQoL. First, people describe the influence of similar symptoms with wide-ranging impacts on their HRQoL. Further, studies with longitudinal follow-up show that the within-subject variation is much smaller than cross-sectional between-subject variation. This indicates that cross-sectional studies do not accurately depict the influence of diabetes on HRQoL [43•]. On the other hand, quality of life assessments are subjective judgments and subject to adaptation processes leading to a potential underestimation of quality of life deteriorations related to severe complications. HRQoL assessment is also sensitive to the mode of administration and to language and culture aspects. This means that a myocardial infarction of the same severity might be judged differently on HRQoL dimensions depending on the environmental and social context of a person, or the setting in which the questions are administered [44, 45].
As exemplified for costs, changes and differences in HRQoL decrements related to diabetes could have manifold reasons; therefore, analyses over time and space are difficult. To overcome these problems, the consistent use of generic and diabetes-specific quality of life measures in national representative samples and longitudinal cohort studies is desirable. Special attention to heterogeneity in assessment and underlying patient characteristics may enhance the validity and reliability of the findings.
What Can Improve Estimates?
Though imperfect, the quantity and quality of US surveillance data available are substantial and the envy of many countries. Innovative data collection, linkage, and analytical approaches can appreciably improve our estimation of diabetes in populations.
Focused Sampling and Analytics
Geographical information is important to identify areas for action and to be able to evaluate the effectiveness of interventions and policies on community level. Some national surveillance systems offer geographic information, often at the level of counties and states. Since there is wide variation within states and even within counties, the possibility for small area estimation, even within zip codes, is an area of major interest. Most of this work involves using existing data and applying innovative analytical methods.
There are also some populations that are underrepresented and require focused sampling to be able to estimate national-level findings. For example, there is ongoing survey and validation work underway related to differentiating type 1 from type 2 diabetes to be able to provide a more granular estimate of type 1 diabetes burdens. Furthermore, there are still some groups that are underrepresented in national surveys—for example, young adults, immigrants, and certain racial or ethnic groups. This may require focused oversampling of these populations in specific years.
Adding Longitudinal Perspectives
As stated previously, single time-point measures only represent what the participant was reporting or experienced biochemically at the time they were surveyed. Longitudinal data offer the opportunity to confirm the stability of self-reported, biochemical, and measured estimates. Furthermore, longitudinal data can help quantify the changing costs and utilization patterns associated with chronic diseases that evolve over time and to move from estimations of pure correlations to causal links. There is currently an ongoing pilot of a longitudinal follow-up of some NHANES participants [46], but the costs to do this repeatedly and on a scale where the sample is nationally representative may be cost-prohibitive. A more modest effort is an ongoing demonstration project of using routine electronic health record data for prospective epidemiological studies; results are awaited.
Use of Technology
To help address challenges in measurement of daily health behaviors, such as dietary intake and physical activity, incorporating technology may help to yield more accurate responses. For example, computerized data entry and Web-based questionnaires can help to minimize data recording errors and ease participant burden. Similarly, digital photography may be used to more accurately and efficiently determine portion sizes consumed, especially if artificial intelligence tools can be programmed to estimate portion size and can be linked to nutrient databases [47].
Data Linkages, Analytics, and Novel Data Sources
Much can be done with the extensive data we are already collecting routinely. Linking representative survey data to existing secondary administratively collected data (e.g., vital statistics registries or healthcare records) can help triangulate what was reported and observed in surveys [48, 49]. This has been achieved through linking NHANES and NHIS with claims data from the Centers for Medicaid and Medicare Services, with the National Death Index, and with Social Security. Beyond classical data sources such as surveys, EHR, and claims data, geographical or commercial data are increasingly being used to add another layer of surveillance that describes and maps upstream environmental determinants for cardiometabolic risk factors such as the walkability and the food environment of neighborhoods. New analytical approaches, such as machine learning algorithms will be helpful to make sense of these large datasets [50]. Furthermore, where there is concern that surveillance findings are subject to data collection or analysis nuances, sensitivity analyses should be used liberally. There are good examples supporting this approach. In a recent analysis using national data, a variety of definitions for prediabetes were used to characterize different risk groups in the population [6]. In other study, diabetes prevalence was estimated using a more specific definition of two different glucose tests (from the same set of standard biochemical measurements) [17].
Conclusions
No epidemiologic studies are perfect, and this is true of the application of epidemiology to surveillance of cardiometabolic diseases. As we have described, to improve surveillance efforts, authors, and editors should do more with what the data offer, by using triangulation, innovative methods, and sensitivity analyses to help produce valied and reliable estimates. Additional data collection such as subsampling or linkage to existing data sources can also offer efficient ways to answer specific questions. Harmonization and integration of various—so far—non-compatible IT formats of different health systems data will also improve the quality and representativeness of usable data. Lastly, one could envisage incorporating some repeated measures to existing surveys, longitudinal in nature, and include a vast array of responses and testing; this is expensive but if used selectively and intelligently will provide valuable added information. While we encourage discourse and thought into ways to improve surveillance, we want to continue to encourage the endeavor to collect survey data for population-level estimation of cardiometabolic diseases and recommend that improvements are possible where resources and needs emerge.
Acknowledgements
MKA is partially supported by the Georgia Center for Diabetes Translation Research funded by the National Institute of Diabetes and Digestive and Kidney Diseases (P30DK111024).
Footnotes
Conflict of Interest Mohammed K. Ali, Karen R. Siegel, Michael Laxy, and Edward W. Gregg declare that they have no conflict of interest.
Human and Animal Rights and Informed Consent This article does not contain any studies with human or animal subjects performed by any of the authors.
Disclaimer The findings and conclusions in this report are those of the authors and do not necessarily represent the official position of the US Centers for Disease Control and Prevention.
References
Papers of particular interest, published recently, have been highlighted as:
• Of importance
- 1.Centers for Disease Control and Prevention. National Diabetes Surveillance System Atlanta, GA [Available from: http://www.cdc.gov/diabetes/data/national.html.
- 2.Centers for Disease Control and Prevention. National Center for Health Statistics (NCHS). National Health and Nutrition Examination Survey [Available from: https://www.cdc.gov/nchs/nhanes/index.htm.
- 3.Centers for Disease Control and Prevention. National Center for Health Statistics (NCHS). National Health Interview Survey [Available from: https://www.cdc.gov/nchs/nhis/index.htm.
- 4.Centers for Disease Control and Prevention. Behavioral Risk Factor Surveillance System [Atlanta, Georgia]. Available from: https://www.cdc.gov/brfss/.
- 5.Ali MK, Bullard KM, Saaddine JB, Cowie CC, Imperatore G, Gregg EW. Achievement of goals in U.S. diabetes care, 1999-2010. N Engl J Med. 2013;368(17):1613–24. [DOI] [PubMed] [Google Scholar]
- 6.Ali MK, Bullard KM, Saydah S, Imperatore G, Gregg EW. Cardiovascular and renal burdens of prediabetes in the USA: analysis of data from serial cross-sectional surveys, 1988-2014. The lancet Diabetes & endocrinology. 2018;6(5):392–403. [DOI] [PMC free article] [PubMed] [Google Scholar]
- 7.Agency for Healthcare Research and Quality. Medical Expenditure Panel Survey [Atlanta, Georgia]. Available from: https://meps.ahrq.gov/mepsweb/. [PubMed]
- 8.Agency for Healthcare Research and Quality. Healthcare Cost and Utilization Project [Available from: https://www.hcup-us.ahrq.gov/databases.jsp.
- 9.Gregg EW, Li Y, Wang J, Burrows NR, Ali MK, Rolka D, et al. Changes in diabetes-related complications in the United States, 1990-2010. N Engl J Med. 2014;370(16):1514–23. [DOI] [PubMed] [Google Scholar]
- 10.Saran R, Robinson B, Abbott KC, Agodoa LYC, Bhave N, Bragg-Gresham J, et al. US renal data system 2017 annual data report: epidemiology of kidney disease in the United States. Am J Kidney Dis. 2018;71(3s1):A7. [DOI] [PMC free article] [PubMed] [Google Scholar]
- 11.Danaei G, Lawes CM, Vander Hoorn S, Murray CJ, Ezzati M. Global and regional mortality from ischaemic heart disease and stroke attributable to higher-than-optimum blood glucose concentration: comparative risk assessment. Lancet. 2006;368(9548):1651–9. [DOI] [PubMed] [Google Scholar]
- 12.Eddy DM. Clinical policies and the quality of clinical practice. N Engl J Med. 1982;307(6):343–7. [DOI] [PubMed] [Google Scholar]
- 13.Cochrane AL, Chapman PJ, Oldham PD. Observers’ errors in taking medical histories. Lancet. 1951;257(6662):1007–9. [DOI] [PubMed] [Google Scholar]
- 14.Davies LG. Observer variation in reports on electrocardiograms. Br Heart J 1958;20(2):153–161. [DOI] [PMC free article] [PubMed] [Google Scholar]
- 15.Centers for Disease Control and Prevention Web Site. National Center for Health Statistics (NCHS). National Health and Nutrition Examination Survey: Laboratory Data [Available from: https://wwwn.cdc.gov/Nchs/Nhanes/Search/DataPage.aspx?Component=Laboratory.
- 16.Selvin E, Wang D, Lee AK, Bergenstal RM, Coresh J. Identifying trends in undiagnosed diabetes in U.S. adults by using a confirmatory definition: a cross-sectional study. Ann Intern Med. 2017;167(11):769–76. [DOI] [PMC free article] [PubMed] [Google Scholar]
- 17.Selvin E, Wang D, Matsushita K, Grams ME, Coresh J. Prognostic implications of single-sample confirmatory testing for undiagnosed diabetes: a prospective cohort study. Ann Intern Med. 2018;169:156. [DOI] [PMC free article] [PubMed] [Google Scholar]
- 18.Desai JR, Wu P, Nichols GA, Lieu TA, O’ Connor PJ. Diabetes and asthma case identification, validation, and representativeness when using electronic health data to construct registries for comparative effectiveness and epidemiologic research. Med Care 2012;50(0):S30–SS5. [DOI] [PMC free article] [PubMed] [Google Scholar]
- 19.•.Nichols GA, Schroeder EB, Karter AJ, Gregg EW, Desai J, Lawrence JM, et al. Trends in diabetes incidence among 7 million insured adults, 2006–2011: the SUPREME-DM project. Am J Epidemiol. 2015;181(1):32–9.This study provides data from 11 integrated health systems across ten US states showing the distribution of new cases of diabetes have been diagnosed over the period 2006–2011.
- 20.Murray CJ, Atkinson C, Bhalla K, Birbeck G, Burstein R, Chou D, et al. The state of US health, 1990-2010: burden of diseases, injuries, and risk factors. JAMA. 2013;310(6):591–608. [DOI] [PMC free article] [PubMed] [Google Scholar]
- 21.American Diabetes A. 5. Prevention or delay of type 2 diabetes: standards of medical care in diabetes-2018. Diabetes Care. 2018;41(Suppl 1):S51–S4. [DOI] [PubMed] [Google Scholar]
- 22.Mozaffarian D, Appel LJ, Van Horn L. Components of a cardioprotective diet: new insights. Circulation. 2011;123(24):2870–91. [DOI] [PMC free article] [PubMed] [Google Scholar]
- 23.Mozaffarian D, Forouhi NG. Dietary guidelines and health-is nutrition science up to the task? BMJ. 2018;360:k822. [DOI] [PubMed] [Google Scholar]
- 24.Ben-Shlomo Y, Kuh D. A life course approach to chronic disease epidemiology: conceptual models, empirical challenges and interdisciplinary perspectives. Int J Epidemiol. 2002;31(2):285–93. [PubMed] [Google Scholar]
- 25.Kuh D, Ben-Shlomo Y, Lynch J, Hallqvist J, Power C. Life course epidemiology. J Epidemiol Community Health. 2003;57(10):778–83. [DOI] [PMC free article] [PubMed] [Google Scholar]
- 26.CDC. NHANES - Questionnaires, Datasets, and Related Documentation 2011. [Available from: http://www.cdc.gov/nchs/nhanes/nhanes_questionnaires.htm. [Google Scholar]
- 27.NCI. Usual Dietary Intakes: The NCI Method 2018. [Available from: https://epi.grants.cancer.gov/diet/usualintakes/method.html.
- 28.Frobisher C, Maxwell SM. The estimation of food portion sizes: a comparison between using descriptions of portion sizes and a photographic food atlas by children and adults. J Hum Nutr Diet. 2003;16(3):181–8. [DOI] [PubMed] [Google Scholar]
- 29.Cypel YS, Guenther PM, Petot GJ. Validity of portion-size measurement aids: a review. J Am Diet Assoc. 1997;97(3):289–92. [DOI] [PubMed] [Google Scholar]
- 30.Sylvia LG, Bernstein EE, Hubbard JL, Keating L, Anderson EJ. Practical guide to measuring physical activity. J Acad Nutr Diet. 2014;114(2):199–208. [DOI] [PMC free article] [PubMed] [Google Scholar]
- 31.Wang SS. Kids food obesity researchers, put pedometers on dogs. Wall Street J. 2009;10:2009. [Google Scholar]
- 32.Riley GF. Administrative and claims records as sources of health care cost data. Med Care. 2009;47(7 Suppl 1):S51–5. [DOI] [PubMed] [Google Scholar]
- 33.Koster I, von Ferber L, Ihle P, Schubert I, Hauner H. The cost burden of diabetes mellitus: the evidence from Germany—the CoDiM study. Diabetologia. 2006;49(7):1498–504. [DOI] [PubMed] [Google Scholar]
- 34.Ulrich S, Holle R, Wacker M, Stark R, Icks A, Thorand B, et al. Cost burden of type 2 diabetes in Germany: results from the population-based KORA studies. BMJ Open. 2016;6(11) [DOI] [PMC free article] [PubMed] [Google Scholar]
- 35.Hex N, Bartlett C, Wright D, Taylor M, Varley D. Estimating the current and future costs of type 1 and type 2 diabetes in the UK, including direct health costs and indirect societal and productivity costs. Diabet Med. 2012;29(7):855–62. [DOI] [PubMed] [Google Scholar]
- 36.Stark Casagrande S, Fradkin JE, Saydah SH, Rust KF, Cowie CC. The prevalence of meeting A1c, blood pressure, and LDL goals among people with diabetes, 1988–2010. Diabetes Care:2013. [DOI] [PMC free article] [PubMed] [Google Scholar]
- 37.da Rocha FJ, Ogurtsova K, Linnenkamp U, Guariguata L, Seuring T, Zhang P, et al. IDF Diabetes Atlas estimates of 2014 global health expenditures on diabetes. Diabetes Res Clin Pract. 2016;117:48–54. [DOI] [PubMed] [Google Scholar]
- 38.Kivimaki M, Hamer M, Batty GD, Geddes JR, Tabak AG, Pentti J, et al. Antidepressant medication use, weight gain, and risk of type 2 diabetes: a population-based study. Diabetes Care. 2010;33(12):2611–6. [DOI] [PMC free article] [PubMed] [Google Scholar]
- 39.Wood-Dauphinee S Assessing quality of life in clinical research: from where have we come and where are we going? J Clin Epidemiol. 1999;52(4):355–63. [DOI] [PubMed] [Google Scholar]
- 40.Watkins K, Connell CM. Measurement of health-related QOL in diabetes mellitus. Pharmaco Economics. 2004;22(17):1109–26. [DOI] [PubMed] [Google Scholar]
- 41.El Achhab Y, Nejjari C, Chikri M, Lyoussi B. Disease-specific health-related quality of life instruments among adults diabetic: a systematic review. Diabetes Res Clin Pract. 2008;80(2):171–84. [DOI] [PubMed] [Google Scholar]
- 42.Luscombe FA. Health-related quality of life measurement in type 2 diabetes. Value Health. 2000;3:S15–28. [DOI] [PubMed] [Google Scholar]
- 43.•.Alva M, Gray A, Mihaylova B, Clarke P. The effect of diabetes complications on health-related quality of life: the importance of longitudinal data to address patient heterogeneity. Health Econ. 2014;23(4):487–500.This study uses data from the UK Prospective Diabetes Study over the period 1997–2007 and shows that cross-sectional data regarding the impact of diabetes complications on quality of life can be biased and will likely be improved by collecting and analyzing longitudinal data.
- 44.Guillemin F, Bombardier C, Beaton D. Cross-cultural adaptation of health-related quality of life measures: literature review and proposed guidelines. J Clin Epidemiol. 1993;46(12):1417–32. [DOI] [PubMed] [Google Scholar]
- 45.Hanmer J, Hays RD, Fryback DG. Mode of administration is important in US national estimates of health-related quality of life. Med Care. 2007;45(12):1171–9. [DOI] [PubMed] [Google Scholar]
- 46.Centers for Disease Control and Prevention. National Center for Health Statistics (NCHS). National Health and Nutrition Examination Survey (NHANES) Longitudinal Study [Available from: https://www.cdc.gov/nchs/nhanes-ls/index.htm.
- 47.Martin CK, Nicklas T, Gunturk B, Correa JB, Allen HR, Champagne C. Measuring food intake with digital photography. J Hum Nutr Diet. 2014;27(Suppl 1):72–81. [DOI] [PMC free article] [PubMed] [Google Scholar]
- 48.Ford ES, Ajani UA, Croft JB, Critchley JA, Labarthe DR, Kottke TE, et al. Explaining the decrease in U.S. deaths from coronary disease, 1980-2000. N Engl J Med. 2007;356(23):2388–98. [DOI] [PubMed] [Google Scholar]
- 49.Bitzer EM. Linking claims data and beneficiary survey information to report on the quality of health care: potential, pitfalls, and perspectives. Gesundheitswesen (Bundesverband der Arzte des Offentlichen Gesundheitsdienstes (Germany)). 2015;77(2):e26–31. [DOI] [PubMed] [Google Scholar]
- 50.Kavakiotis I, Tsave O, Salifoglou A, Maglaveras N, Vlahavas I, Chouvarda I. Machine learning and data mining methods in diabetes research. Comput struct Biotechnol J. 2017;15:104–16. [DOI] [PMC free article] [PubMed] [Google Scholar]