Abstract
PURPOSE:
The primary goal of this study was to estimate the value of β, the exponent in the power law relating changes of the transverse relaxation rate and intra-extravascular local magnetic susceptibility differences as . The secondary objective was to evaluate any differences that might exist in the value of β obtained using a deoxyhemoglobin-weighted distribution versus a constant distribution assumed in earlier computations. The third objective was to estimate the value of β relevant for methods based on susceptibility contrast agents with a concentration of higher than that used for BOLD fMRI calculations.
METHODS:
Our recently developed model of real microvascular anatomical networks is utilized to extend the original simplified Monte-Carlo simulations to compute from first principles.
RESULTS:
Our results show that for most BOLD fMRI measurements of real vascular networks as opposed to earlier predictions of using uniform distributions. For perfusion or functional MRI methods based on contrast agents, which generate larger values for , for , while at 14 T can drop below 1 and the variation across subjects is large, which indicates that a lower concentration of contrast agent with a lower value of is desired for experiments at high .
CONCLUSION:
These results improve our understanding of the relationship between R2* and the underlying microvascular properties. The findings will help to infer the cerebral metabolic rate of oxygen (CMRO2) and cerebral blood volume (CBV) from BOLD and perfusion MRI respectively.
Keywords: microvascular network, modeling, BOLD fMRI, perfusion MRI, contrast agents
Introduction
The transverse relaxation rate, of the MR signal is related to the dephasing rate of protons within an imaging voxel, which is sensitive to magnetic susceptibility-induced changes in the local magnetic field, . One way to alter the magnetic susceptibility is to use exogenous agents such as gadolinium-based contrast agents (GBCAs), delivered as a bolus injection as in the dynamic susceptibility contrast (DSC) technique, or blood-pool contrast agents such as ultrasmall superparamagnetic iron oxide (USPIO) agents that have long plasma half-lives (1–4). The increase of the transverse relaxation rate in response to contrast agent injection is a measure of cerebral blood volume (CBV) since (5), where is the magnetic susceptibility difference between blood and tissue and is a parameter in the power law model of the susceptibility effect. In many cases, is assumed to be 1 and the relation is simplified as .
Deoxyhemoglobin is another agent that can alter local magnetic susceptibility, because it is paramagnetic and its presence decreases the MR signal (6,7). This endogenous agent provides a link between the MR signal and neuronal activity (8–11). The blood oxygenation level-dependent (BOLD) signal is a complicated function of several underlying physiological variables including cerebral blood flow (CBF), cerebral metabolic rate of oxygen (CMRO2) and CBV. The Davis model of calibrated fMRI describes the BOLD signal change during activation as , where rCBF and rCMRO2 are the relative changes in CBF and CMRO2 normalized by their baseline values (12). Here, M is a normalization factor that can be obtained from hypercapnia or hyperoxia calibration techniques, and α is the exponent in the flow-volume relation rCBV = rCBFα (12–15). The parameter in the original Davis model has the same physiological meaning as in the susceptibility effect, i.e., . With these parameters identified, the Davis model provides a method to obtain rCMRO2 during neuronal activation from a combination of BOLD measurements and CBF measurements, with the latter typically acquired using arterial spin labelling (16,17).
The value of the parameter was originally estimated using Monte-Carlo simulations of proton diffusion through random distributions of infinite cylinders, and the resulting value was found to be 1.5 at (5). The main source that gives rise to a non-linear susceptibility effect , is extra-vascular proton diffusion. For large vessels such as veins, proton diffusion can be ignored and the static dephasing calculations give , while for small vessels where diffusion is prominent, (11,18,19). It is important to note that the motional narrowing effect of diffusion around small vessels leads to the same amount of deoxyhemoglobin having a weaker effect on the BOLD signal compared to larger veins (20). In addition, the cylinders models (5) are simplified versions of a real vascular network where the more complicated structures, such as vessel curvature and bifurcations, found in anatomical vascular networks, are not considered and the size distribution of vessels are not necessarily modeled. More importantly, unlike exogenous contrast agents, the concentration of deoxyhemoglobin is not uniform throughout the vascular network, and instead there is a gradient of deoxyhemoglobin concentration from the arterial side to the venous side of the vascular network. Thus the value of , particularly in the Davis model for fMRI, needs a more comprehensive investigation.
In vivo experiments in humans have found that in calibrated BOLD experiments at 1.5, 3, and 7 T (21), consistent with recent multi-compartment vascular modeling studies that suggest at 3 T (22,23). These vascular modeling studies estimated β and α indirectly by treating them as free parameters of the Davis model in simulations of the BOLD signals. However, these studies have abandoned the physiological meanings of the parameters and did not explicitly determine β through relating ΔR2* directly to Δχ. In the present study, we obtain the value of β from first-principles by performing calculations using real microvascular networks, obtained using in vivo two-photon measurements in the cerebral cortex of mice, for both deoxyhemoglobin-weighted and uniform Δχ distributions with the concentration range relevant for BOLD fMRI. We find that the value of β decreases with magnetic field strength . At lower field strengths, β depends on the details of the vasculature and can vary across subjects and regions for a uniform distribution of Δχ. However, β=1 for most BOLD fMRI measurements at where Δχ is weighted by deoxyhemoglobin concentration, which is a more realistic assumption for the BOLD signals. Setting β=1 greatly simplifies macroscopic models such as the Davis model (12). In addition, the value of β has also been computed with a uniform distribution of Δχ at a higher concentration relevant for perfusion or functional imaging based on contrast agents. For imaging based on contrast agents, for , while at 14 T drops below 1 and the variation across subjects is large, which indicates that a lower concentration of is desired for experiments at high .
Methods
Microvascular network and Vascular Anatomical Network (VAN) modeling
The microvascular networks used here were obtained using in vivo 2-photon imaging of the cerebral cortex of C57BL/6 mice and published in previous studies (23,24). We used six unique microvascular networks obtained from six different mice. The VAN model was then applied to these vascular networks. The VAN model is a bottom-up model that computes blood flow and oxygenation distributions within microscopic vasculature and the resulting MR signal (23,24). The steady-state oxygen distribution is obtained by solving the advection-diffusion equation until it reaches equilibrium (25,26). After the deoxyhemoglobin distribution is computed from the oxygen distribution, the MR signal can be obtained from Monte-Carlo simulations of proton diffusion through inhomogeneous magnetic fields.
The magnetic field experienced by a proton is the sum of the magnetic field perturbations produced by all of the vessels in the VAN, each with a magnetic susceptibility . We model BOLD in which case is given by the deoxyhemoglobin content of each vessel, compared to a constant distrubution across vessels. The magnetic field inhomogeneity is computed by convolving with the magnetic field induced by a unit cube , where is the grid size (1 μm) and r and are polar coordinates. The phase accumulation of the nth proton is , with rad/T/ms= rad/T/s being the gyromagnetic ratio and is the local magnetic field perturbation experienced by the nth proton at time t. The initial positions of protons within the VAN voxel are random and drawn from a uniform distribution. The diffusion coefficient of protons is set to be cm2/s= m2/s (23,27), and protons are not allowed to diffuse across the vessel wall. The time step for Monte-Carlo simulations is dt=0.2 ms= and the echo time TE=30 ms = . A smaller time step of is used for large and as explained in Supporting Information S3. The MR signal at each time step is , where the intravascular contribution is and the extravascular contribution is The values of of the intrisic and depend on field strength and blood oxygenation and are obtained experimentally (28). See a more detailed explanation of the simulations in (23,24). In the present study, we only simulate the baseline state and gradient-echo signals to study the susceptibility effect on the reversible transverse relaxation rate . Spin-echo signals and changes driven by functional activation including dynamic vessel dilations and metabolic rate variations can also be modeled if needed using the same framework, which are not examined in this study (23).
The transverse relaxation rate and its relation to magnetic susceptibility change For gradient echo imaging, the MR signal at echo time TE is approximated as
| (1) |
The transverse relaxation rate is obtained via
| (2) |
Since ,
| (3) |
We obtain from fitting the versus curve with varying . To obtain β relevant for BOLD MRI, we compute for gradient-echo signals in two different ways. The first uses a constant across all vessels, with a value ranging from to , which is of the same order as the concentration induced by deoxyhemoglobin in BOLD measurement and is referred to as the uniform Δχ distribution. This is similar to how β has been previously computed using infinite cylinders (5,29). In the second method, to account for the influence of the non-uniform deoxyhemoglobin concentration across the vascular tree on the BOLD signal, the magnetic susceptibility inside vessels is weighted microscopically as
| (4) |
where is the oxygen saturation obtained from the oxygen advection-diffusion modeling and Hct is the hematocrit, which is assumed to be 0.3 in capillaries and 0.4 in arteries and veins (22). This β calculation is referred to as the deoxyhemoglobin-weighted Δχ distribution. In this case, is modulated from to and β is similarly obtained from the slope of the vs. curve. For reference, is typically , which is the susceptibility difference between fully oxygenated and fully deoxygenated red blood cells (30). An example of versus for the uniform Δχ distribution at 1.5 T for one vascular network, shown in Fig. 1a, is shown in Fig. 1b. Unless stated otherwise, is used to fix the length of proton diffusion during the simulated MR experiment. We are not exploring the non-exponential decay of at early times in the current study and we term the apparent transverse relaxation rate (30), the attenuation of the signal at TE relative to that at TE=0. If not stated otherwise, the orientation of the static magnetic field is in the direction, perpendicular to the surface of the cerebral cortex.
Figure 1.
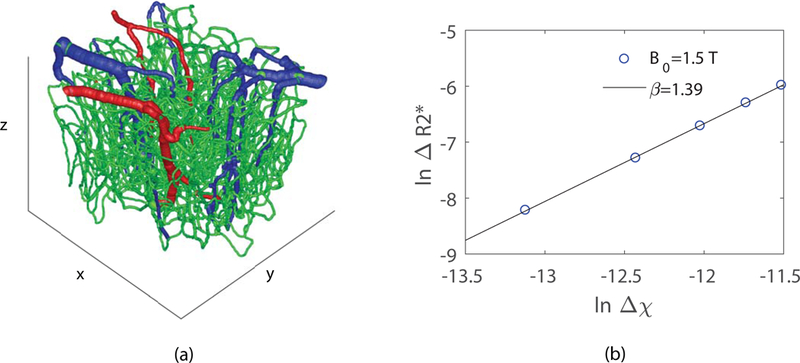
(a) Example of a graphed vascular network obtained from two-photon microscopy measurements (blue: veins; red: arteries; green: capillaries). (b) as a function of for the vascular network in (a) at . The value of is obtained from the slope of the linear fit, which is in this example. Here distribution is uniform within the BOLD range of to .
One final range is used to examine the influence of contrast agents on β. A higher concentration of ranging from to corresponding to vascular Gd-DTPA concentrations of 3.6 to 36 mM (5), which covers most of the range for contrast-enhanced perfusion imaging and is referred to as the contrast agent (CA) range, is also used to compute , where Δχ was again set to a constant value across all vessels. This computation is referred to as the contrast-enhanced Δχ distribution.
Monte-Carlo simulations with the random cylinders model
To explore the effect of different size vessels on β at different field strengths , we performed Monte-Carlo simulations of proton diffusion within and around randomly distributed magnetic cylinders similar to the original simulations by Boxerman and colleagues (5) but with the size of the cylinders fixed in one configuration instead of using a distribution of sizes. The static magnetic field is . The magnetic field at a point (a,b,c) in space induced by a single, infinitely long cylinder is (31)
| (5) |
Here is the angle between the cylinder and , is the distance of a spatial point from the cylinder axis, is the angle between projections in a plane orthogonal to the cylinder axis of and a line connecting the point and the cylinder axis. The radius of cylinders is fixed for a single simulation while the positions and orientations of the cylinders are random. A new configuration is generated for each cylinder size from 1 to 5 and each considered 5 different to obtain the size dependence of β at different field strengths. These cylinders and protons are contained in a box of size m in x, y and z dimensions in order to match the dimensions of the simulated voxel used in the VAN simulations. We continue to add cylinders to the box until is larger than 2%, where is the total number of cylinders. We have also computed the results for to see the effect of cylinder densities. distribution is uniform with the CA range from to . The BOLD range of from to is also used as a comparison. Proton diffusion was simulated to derive the MR signal following the same procedure as described above for the VAN modeling. and β are obtained from Eq. (2) and Eq. (3) respectively. SI units are used throughout this report.
Results
Results of the BOLD-relevant obtained from our six unique VANs for both uniform distribution, which was used in earlier simulations with random cylinder models (5), and deoxyhemoglobin-weighted distribution are shown in Fig. 2a and Fig. 2b, respectively.
Figure 2.
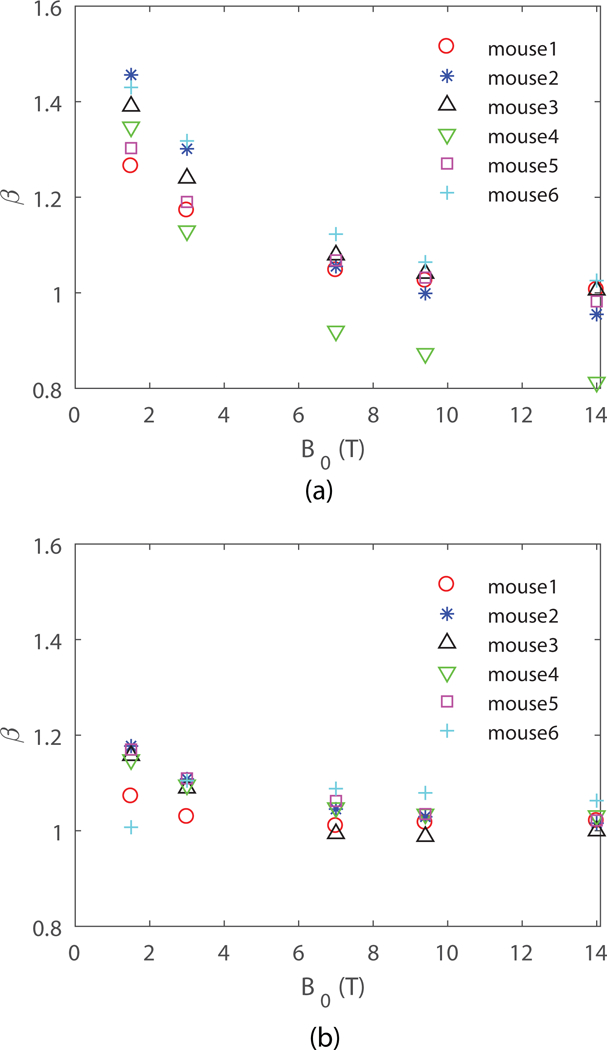
obtained from VAN modeling for (a) uniform distribution, and (b) deoxyhemoglobin-weighted distribution. is perpendicular to the surface of the cortex.
We see that the value of is generally between 1 and 2, because a real vascular network is a mixture of large (producing ) and small (producing ) vessels. We also see that can vary between the different vascular networks likely because of differences in the size distribution of the vessels. The value of obtained from the deoxyhemoglobin-weighted distribution is closer to the large vessel size limit of , since in this case the venules that are larger in size maintain higher deoxyhemoglobin concentrations, and thus exert more influence on the diffusing protons than the generally smaller arterioles and capillaries. In both cases, decreases with increasing , which shows that the diffusion effect on around small vessels is less important at higher fields. This indicates that is expected to be more uniform across subjects and regions at higher magnetic field strengths.
The impact of the orientation of relative to the cortical surface normal axis on BOLD signals has been shown in (24) to have up to a 40% effect on BOLD signal amplitude. This effect is due to the fact that the orientations of the vessels are not random and the spatial distribution is not uniform (32). Here we investigate whether the orientation of has an effect on the value of . Fig. 3a, b show the average from the six VANs for transverse and perpendicular to the surface of the cerebral cortex with both uniform and deoxyhomoglobin-weighted distribution. The difference between obtained at the two orientations is less than 5% at 1.5 T and decreases with increasing , which shows that the susceptibility effect depends less on the orientation at higher fields. This further suggests a more spatially uniform map at higher magnetic field strengths.
Figure 3.
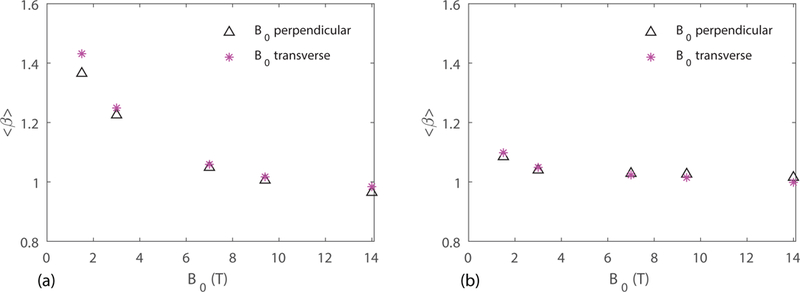
Mean value of obtained from six VANs for transverse and perpendicular to the surface of the cerebral cortex with (a) uniform distribution, and (b) deoxyhemoglobin-weighted distribution.
In all of the above results, we have fixed the value of to fix the proton diffusion length. In practice, TE is chosen to match tissue , which varies with . The question arises as to whether the value of changes with . In the ideal case, where decays truly exponentially, the apparent obtained from and will not change. Fig. 4 shows the mean value of obtained from our six VANs for TE = 15 and 30 ms with uniform and deoxyhomoglobin-weighted distribution. The values of are slightly different for different TEs due to the non-exponential decay of at small (30), exhibiting a small increase for shorter TE with uniform distribution and negligible dependence on TE for deoxyhemoglobin-weighted distribution.
Figure 4.
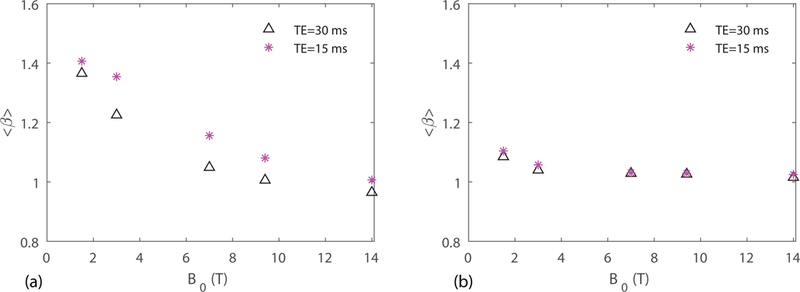
Mean value of obtained from six VANs for TE = 15 and 30 ms with (a) uniform distribution, and (b) deoxyhemoglobin-weighted distribution.
For perfusion or functional imaging based on intravascular contrast agents, the concentration of can be an order of magnitude higher than the range relevant for BOLD fMRI. Since the induced magnetic field inhomogeneity is proprotional to , increasing has a similar effect as increasing that acts to decrease . The values for computed for the CA range of from to with a uniform distribution is shown in Fig. 5a. We see that for T, which is smaller than the values computed in Fig. 2a with the BOLD fMRI range of , as expected. However, for , drops below 1 and the variations across subjects is large. This indicates that at , a few large vessels dominate and the value of is no longer between the theoretical predictions of 1 and 2 made under the assumption of a random distribution of vessels. This indicates that at , a lower concentration of is desired. In Fig. 5b, obtained from a lower concentration of from to , which is relevant for many DSC studies (33), is shown, where at all field strengths. The time step in the Monte-Carlo simulations for , is 0.01 ms instead of 0.2 ms as in other simulations.
Figure 5.
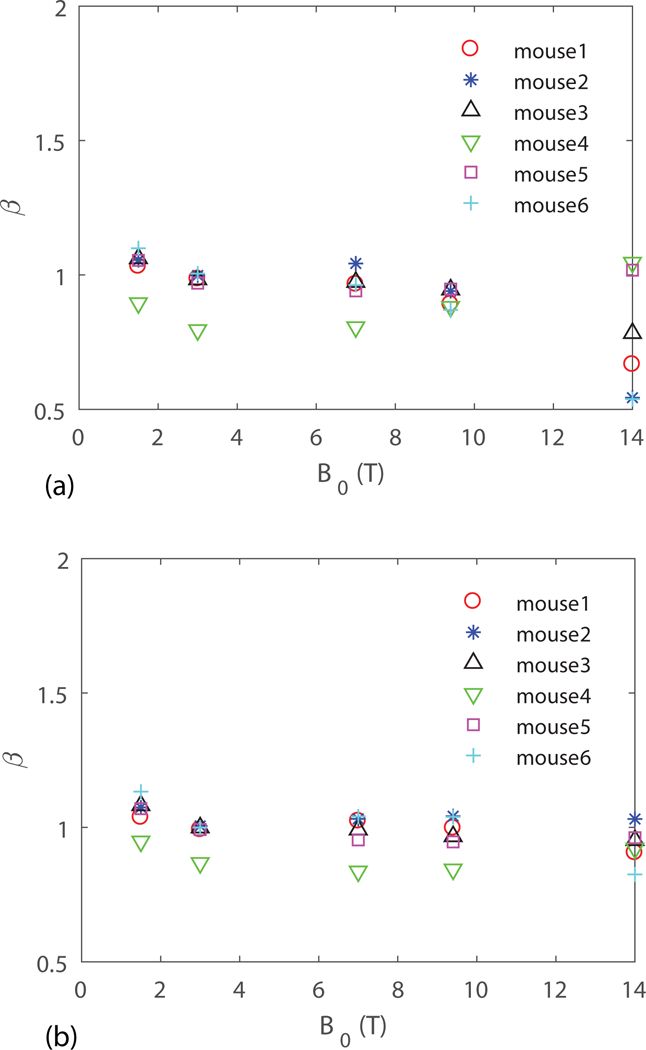
obtained from six VANs for uniform distribution within for perfusion or functional imaging based on susceptibility contrast agents (a) from to and (b) from to .
To help understand the behavior of decreasing with increasing , we explored the dependence of on vessel radius and magnetic field strength with Monte-Carlo simulations using a random cylinder model as described in the methods section. The value of is obtained for various radii of randomly distributed cylinders at different magnetic field strengths, with each value calculated by averaging over four random cylinder configurations. Fig. 6a and Fig. 6b are the results for protons freely moving across vessel walls and no proton exchange across vessels walls respectively. We see that vessel wall permeability has a negligible impact on . The critical value of where deviates from 1 is smaller at higher fields, which indicates that the small vessels act more like large vessel at higher fields, thus is closer to the large vessel limit of . Fig. 6c shows the results for a cylinder volume fraction of 4% (as opposed to 2% in the other simulations). These can be compared with simulations in the strict static dephasing regime as shown in Fig. 6d where protons are not moving and the value of is about 1, which further confirms that proton diffusion is the main cause of a non-linear susceptibility effect (). For a typical capillary radius of , for 7 T and above. This ensures that for imaging regions composed only of capillaries at 7 T and above for high-resolution fMRI. For a range of similar to that encountered in BOLD fMRI as shown in Fig. 6e, is significantly higher for capillaries compared to the results obtained for a range of mimicking that found when using a contrast agent as in Fig. 6a. Thus assuming a uniform distribution of overestimates for BOLD fMRI measurements since the small capillaries with large are weighted the same way as large veins.
Figure 6.
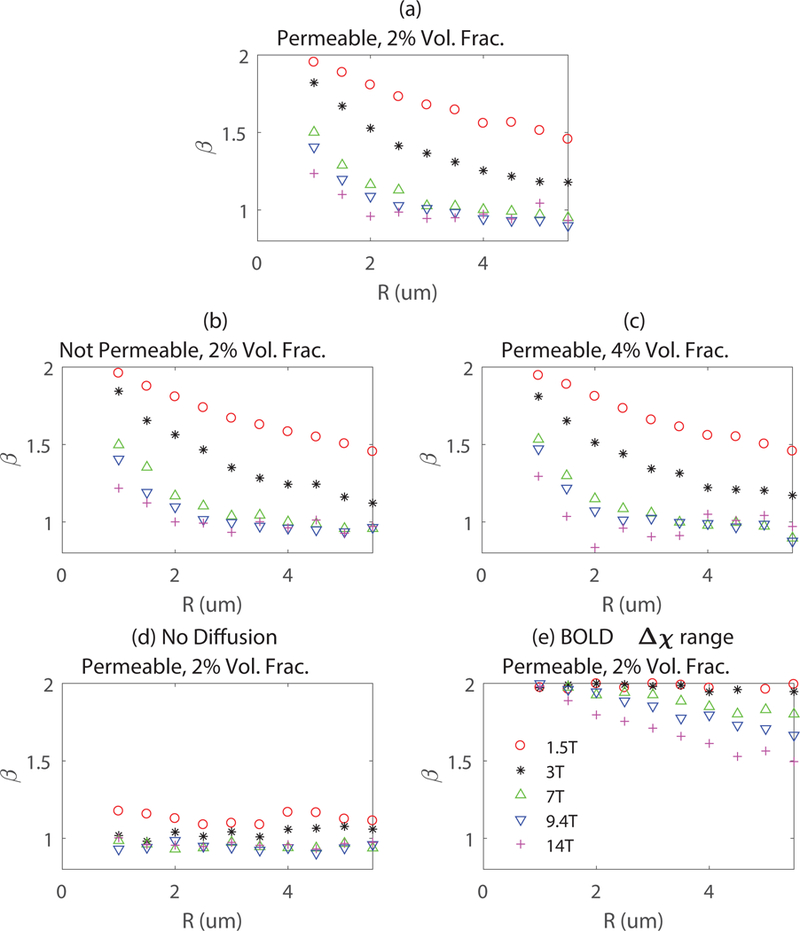
The susceptibility effect parameter obtained for various vessel diameters corresponding to capillaries at different field strengths for (a) Monte-Carlo simulations with freely diffusing protons (2% volume fraction); (b) Monte-Carlo simulations with no proton exchange between intra- and extravascular spaces (2% volume fraction); (c) Monte-Carlo simulations with a cylinder volume fraction of 4% instead of 2%; (d) Static dephasing with protons not moving (2% volume fraction). (e) for BOLD range.
Discussion
The parameter , the exponent in a power law relationship between the change in transverse relaxation rate and changes in the magnetic susceptibility of blood is important in two physiological imaging contexts: 1) Guiding quantitative physiological interpretation of BOLD to help estimate CMRO2; and 2) Quantifying CBV or perfusion by modeling the signal from an intravascular contrast agent. An important difference between these two applications is that for the BOLD effect the blood susceptibility is altered non-uniformly, weighted by deoxyhemoglobin with the largest changes in the venous vessels, while injected contrast agents change the susceptibility of blood uniformly and the concentration of is usually higher compared to the range relevant for BOLD fMRI. Here we report the first study of the behavior of at different magnetic field strengths and concentrations of based on numerical simulations using realistic vascular anatomical models derived from detailed imaging in mice.
Results from both VAN modeling using real micro-vascular networks and Monte-Carlo simulations using randomly orientated infinite cylinders show that proton diffusion effects are less relevant at higher fields for the susceptibility effect, reflected in our finding that decreases towards a value of 1.0 as the field increases. A value of greater than 1.0 occurs when there is some degree of motional narrowing due to diffusing protons sampling a range of the distorted fields around a vessel. In the limit of very fast diffusion, so that each proton samples all of the field offsets within the diffusion length, . Although the extent of proton diffusion is independent of the field strength, the volume of significantly distorted magnetic field around a vessel does increase with the field strength. The observed behavior is implied in the definition of the motional narrowing regime where diffusion is important, that is as given in earlier studies (5,18). Here D is the proton diffusion coefficient, is in units of angular frequencies and is the radius of cylinders. This relation can be recast as , thus increasing requires a smaller for the condition to be satisfied. At higher field strength, the critical vessel radius where deviates from 1 is smaller, which is consistent with the results shown in Fig. 2. The second effect of motional narrowing is that because each proton is sampling a range of field offsets, the net signal decay is reduced compared to what it would have been without diffusion. This is illustrated in Fig. 7, showing that the decay is faster around larger vessels and at higher fields because there is less motional narrowing. Note that both large and small vessels produce faster decay at higher fields, as expected, but the changes in the proportions between the larger and smaller vessels are different, reflecting the reduction of motional narrowing at higher fields.
Figure 7.
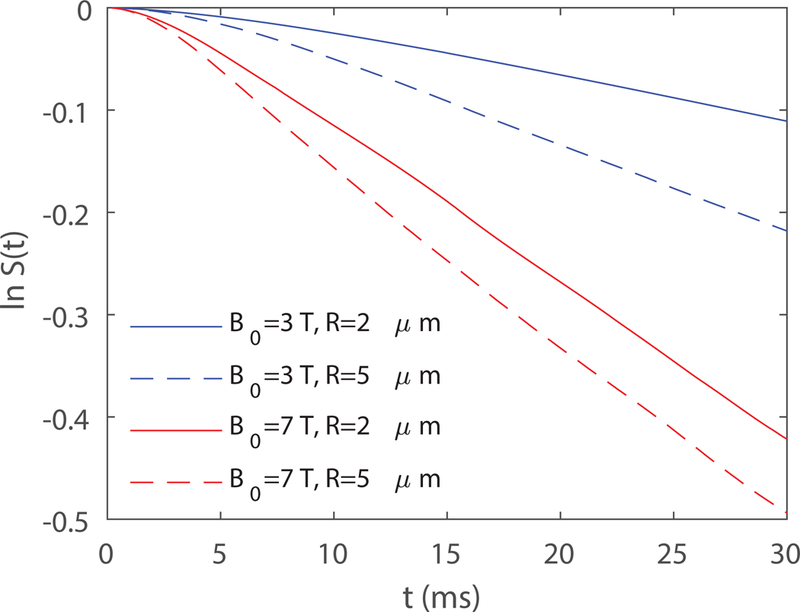
Example of ln S(t) obtained from Monte-Carlo simulations of random cylinders as in Fig. 3a for different and . Here is the same for the four curves.
Although the theoretically predicted value of is between 1 and 2, we see in Fig. 2a that there is one animal (mouse 4) where drops below 1. There are also several values in Fig. 5a. This is probably because the voxel size is limited and a single vessel dominates, where the random network predictions of varying between 1 for static dephasing and 2 for motional narrowing no longer holds. Recent experiments have also found to be 0.8 in rodent brain (34), which could also be related to ordered, as opposed to random, network structure. This behavior of may be more prominent for high-resolution fMRI studies in which the dominant effect of single vessels on the MRI signal becomes more likely.
For BOLD fMRI studies, the value of appears in the Davis model (12,35) and is used to compute CMRO2 changes, but the spatial non-uniformity of was not fully addressed in the original studies. This complexity makes the measurement of in the Davis model challenging. The value of was obtained from fitting the macroscopic Davis model in ref. (23). Treating as a free fitting parameter is simple to implement but it no longer maintain its physiological meaning as the parameter that governs the susceptibility effect and the three parameters M, and are correlated. In VAN modeling, we are able to compute the oxygen distribution within microvascular networks, which provides the microscopic distributions of deoxyhemoglobin concentrations. This enables us to compute the physiological parameter relevant for the Davis model from first-principles. Compared to the uniform results, deoxyhemoglobin-weighted results show that is closer to the large vessel limit, since the vessels that contain the most deoxyhemoglobin are large venules. As can be seen in Fig. 2b, for and at and above, , as opposed to the early calculations of at 1.5 T (12) and at 3 T (36).
The study of the field strength dependence on the susceptibility effect provides guidance for CBV measurements in imaging based on contrast agents. One assumption for these techniques is that , and thus the map of an increase after injection of a contrast agent provides a map of (1–4). However, a hidden assumption here is that is uniform since and this relation is not accurate if varies within regions. To obtain a more accurate measurement of CBV, a map of or a sense of how changes within different regions is desired to correct estimates of CBV. We have shown in Fig. 5a that for a uniform distribution of within the CA range, except at . This indicates that a lower concentration of is desired for as shown in Fig. 5b.
Conclusions
We have analyzed the susceptibility effect on the transverse relaxation rate using realistic micro-vascular anatomical networks and modeling of the oxygen advection and diffusion through the network. Both the uniform and the deoxyhemoglobin-weighted distribution of were studied. We show that the parameter , which governs the dependence of the transverse relaxation rate on the magnetic susceptibility shift, is closer to the large vessel limit of at higher magnetic field strength. For BOLD fMRI, with a realistic anatomy and distribution of hemoglobin saturation, our results indicate that for 3 T and above, greatly simplifying macroscopic models such as the Davis model (12). For perfusion and functional imaging techniques based on contrast agents, for 9.4 T and below in general. Our work provides insights on the fundamental question of the impact of proton diffusion on MR signals at different field strengths as well as practical applications for CBV measurements with contrast agents and rCMRO2 measurements with BOLD fMRI.
Supplementary Material
Supporting Information Figure S1. (a) The distribution of vessel sizes from the six networks of mouse vasculature measured in vivo. (b) β obtained from the random cylinder model with the vessel size distribution in (a) for both BOLD (2 × 10⁻⁷) to 12 × 10−7) and CA range (1 × 10⁻⁶) to 10 × 10−6) of Δχ concentration. (c) The value of β as a function of Δχ concentration in SI units.
Supporting Information Figure S2. (a) The vasculature (blue: veins; red: arteries; green:capillaries) with starting pial artery and vein (branching order = 0) indicated in the figure. (b) Distribution of SO2 computed in the model as a function of branching orders staring from the pial artery and vein. (c) Δχ concentration in different branching orders. (d) The corresponding vessel diameter in different branching orders.
Supporting Information Figure S3. The value of β obtained for a mouse vascular for different dt values in the Monte-Carlo simulations for (a) the BOLD range of Δχ range (2 × 10⁻⁷) to 12 × 10−7) and (b) contrast agent range of Δx (1 × 10⁻⁶) to 10 × 10−6).
Acknowledgements
This work is supported by the NIH NIBIB (grants P41-EB015896 and R01-EB019437), the NIH NINDS (grant R01-NS036722), the BRAIN Initiative (NIH NIMH grants R01-MH111419 and R01-MH111359), and by the MGH/HST Athinoula A. Martinos Center for Biomedical Imaging.
References
- 1.Mandeville JB, Jenkins BG, Chen Y-CI, et al. Exogenous contrast agent improves sensitivity of gradient-echo functional magnetic resonance imaging at 9.4 T. Magn. Reson. Med. 2004;52:1272–1281 doi: 10.1002/mrm.20278. [DOI] [PubMed] [Google Scholar]
- 2.Qiu D, Zaharchuk G, Christen T, Ni WW, Moseley ME. Contrast-enhanced functional blood volume imaging (CE-fBVI): enhanced sensitivity for brain activation in humans using the ultrasmall superparamagnetic iron oxide agent ferumoxytol. Neuroimage 2012;62:1726–1731. [DOI] [PMC free article] [PubMed] [Google Scholar]
- 3.Rosen B,W Belliveau J,M Vevea J Brady T Perfusion Imaging with NMR Contrast Agents.; 1990. doi: 10.1002/mrm.1910140211. [DOI] [PubMed] [Google Scholar]
- 4.Weinstein JS, Varallyay CG, Dosa E, et al. Superparamagnetic Iron Oxide Nanoparticles: Diagnostic Magnetic Resonance Imaging and Potential Therapeutic Applications in Neurooncology and Central Nervous System Inflammatory Pathologies, a Review. J. Cereb. Blood Flow Metab. 2010;30:15–35 doi: 10.1038/jcbfm.2009.192. [DOI] [PMC free article] [PubMed] [Google Scholar]
- 5.Boxerman JL, Hamberg LM, Rosen BR, Weisskoff RM. MR contrast due to intravascular magnetic susceptibility perturbations. Magn. Reson. Med. 1995;34:555–566. [DOI] [PubMed] [Google Scholar]
- 6.Ogawa S, Lee TM, Kay AR, Tank DW. Brain magnetic resonance imaging with contrast dependent on blood oxygenation. Proc. Natl. Acad. Sci. 1990;87:9868–9872. [DOI] [PMC free article] [PubMed] [Google Scholar]
- 7.Thulborn KR, Waterton JC, Matthews PM, Radda GK. Oxygenation dependence of the transverse relaxation time of water protons in whole blood at high field. Biochim. Biophys. Acta BBA-Gen. Subj. 1982;714:265–270. [DOI] [PubMed] [Google Scholar]
- 8.Kwong KK, Belliveau JW, Chesler DA, et al. Dynamic magnetic resonance imaging of human brain activity during primary sensory stimulation. Proc. Natl. Acad. Sci. 1992;89:5675–5679 doi: 10.1073/pnas.89.12.5675. [DOI] [PMC free article] [PubMed] [Google Scholar]
- 9.Lin A-L, Fox PT, Yang Y, Lu H, Tan L-H, Gao J-H. Evaluation of MRI models in the measurement of CMRO2 and its relationship with CBF. Magn. Reson. Med. 2008;60:380–389 doi: 10.1002/mrm.21655. [DOI] [PMC free article] [PubMed] [Google Scholar]
- 10.Logothetis NK, Pauls J, Augath M, Trinath T, Oeltermann A. Neurophysiological investigation of the basis of the fMRI signal. Nat. Lond. 2001;412:150–7 doi: 10.1038/35084005. [DOI] [PubMed] [Google Scholar]
- 11.Ogawa S, Menon RS, Tank DW, et al. Functional brain mapping by blood oxygenation level-dependent contrast magnetic resonance imaging. A comparison of signal characteristics with a biophysical model. Biophys. J. 1993;64:803–812 doi: 10.1016/S0006-3495(93)81441-3. [DOI] [PMC free article] [PubMed] [Google Scholar]
- 12.Davis TL, Kwong KK, Weisskoff RM, Rosen BR. Calibrated functional MRI: mapping the dynamics of oxidative metabolism. Proc. Natl. Acad. Sci. 1998;95:1834–1839. [DOI] [PMC free article] [PubMed] [Google Scholar]
- 13.Gauthier CJ, Hoge RD. A generalized procedure for calibrated MRI incorporating hyperoxia and hypercapnia. Hum. Brain Mapp. 2013;34:1053–1069. [DOI] [PMC free article] [PubMed] [Google Scholar]
- 14.Grubb RL, Raichle ME, Eichling JO, Ter-Pogossian MM. The effects of changes in PaCO2 on cerebral blood volume, blood flow, and vascular mean transit time. Stroke 1974;5:630–639. [DOI] [PubMed] [Google Scholar]
- 15.Mandeville JB, Marota JJ, Ayata C, et al. Evidence of a cerebrovascular postarteriole windkessel with delayed compliance. J. Cereb. Blood Flow Metab. 1999;19:679–689. [DOI] [PubMed] [Google Scholar]
- 16.Hoge RD. Calibrated fMRI. NeuroImage 2012;62:930–937 doi: 10.1016/j.neuroimage.2012.02.022. [DOI] [PubMed] [Google Scholar]
- 17.Pike GB. Quantitative functional MRI: Concepts, issues and future challenges. NeuroImage 2012;62:1234–1240 doi: 10.1016/j.neuroimage.2011.10.046. [DOI] [PubMed] [Google Scholar]
- 18.Kiselev VG, Posse S. Analytical theory of susceptibility induced NMR signal dephasing in a cerebrovascular network. Phys. Rev. Lett. 1998;81:5696. [Google Scholar]
- 19.Yablonskiy DA, Haacke EM. Theory of NMR signal behavior in magnetically inhomogeneous tissues: The static dephasing regime. Magn. Reson. Med. 1994;32:749–763 doi: 10.1002/mrm.1910320610. [DOI] [PubMed] [Google Scholar]
- 20.Stables LA, Kennan RP, Gore JC. Asymmetric spin-echo imaging of magnetically inhomogeneous systems: Theory, experiment, and numerical studies. Magn. Reson. Med. 1998;40:432–442 doi: 10.1002/mrm.1910400314. [DOI] [PubMed] [Google Scholar]
- 21.Croal PL, Driver ID, Francis ST, Gowland PA. Field strength dependence of grey matter R2* on venous oxygenation. NeuroImage 2017;146:327–332 doi: 10.1016/j.neuroimage.2016.10.004. [DOI] [PMC free article] [PubMed] [Google Scholar]
- 22.Griffeth VE, Buxton RB. A theoretical framework for estimating cerebral oxygen metabolism changes using the calibrated-BOLD method: modeling the effects of blood volume distribution, hematocrit, oxygen extraction fraction, and tissue signal properties on the BOLD signal. Neuroimage 2011;58:198–212. [DOI] [PMC free article] [PubMed] [Google Scholar]
- 23.Gagnon L, Sakadžić S, Lesage F, et al. Validation and optimization of hypercapnic-calibrated fMRI from oxygen-sensitive two-photon microscopy. Phil Trans R Soc B 2016;371:20150359 doi: 10.1098/rstb.2015.0359. [DOI] [PMC free article] [PubMed] [Google Scholar]
- 24.Gagnon L, Sakadžić S, Lesage F, et al. Quantifying the microvascular origin of BOLD-fMRI from first principles with two-photon microscopy and an oxygen-sensitive nanoprobe. J. Neurosci. Off. J. Soc. Neurosci. 2015;35:3663–3675 doi: 10.1523/JNEUROSCI.3555-14.2015. [DOI] [PMC free article] [PubMed] [Google Scholar]
- 25.Fang Q, Sakadžić S, Ruvinskaya L, Devor A, Dale AM, Boas DA. Oxygen advection and diffusion in a three dimensional vascular anatomical network. Opt. Express 2008;16:17530. [DOI] [PMC free article] [PubMed] [Google Scholar]
- 26.Fang Q, Boas DA. Tetrahedral mesh generation from volumetric binary and grayscale images. In: 2009 IEEE International Symposium on Biomedical Imaging: From Nano to Macro; 2009. pp. 1142–1145. doi: 10.1109/ISBI.2009.5193259. [DOI] [Google Scholar]
- 27.Pathak AP, Ward BD, Schmainda KM. A novel technique for modeling susceptibility-based contrast mechanisms for arbitrary microvascular geometries: the finite perturber method. Neuroimage 2008;40:1130–1143. [DOI] [PMC free article] [PubMed] [Google Scholar]
- 28.Uludağ K, Müller-Bierl B, Uğurbil K. An integrative model for neuronal activity-induced signal changes for gradient and spin echo functional imaging. NeuroImage 2009;48:150–165 doi: 10.1016/j.neuroimage.2009.05.051. [DOI] [PubMed] [Google Scholar]
- 29.Martindale J, Kennerley AJ, Johnston D, Zheng Y, Mayhew JE. Theory and generalization of monte carlo models of the BOLD signal source. Magn. Reson. Med. 2008;59:607–618 doi: 10.1002/mrm.21512. [DOI] [PubMed] [Google Scholar]
- 30.Spees WM, Yablonskiy DA, Oswood MC, Ackerman JJ. Water proton MR properties of human blood at 1.5 Tesla: magnetic susceptibility, T(1), T(2), T*(2), and non-Lorentzian signal behavior. Magn. Reson. Med. 2001;45:533–542. [DOI] [PubMed] [Google Scholar]
- 31.Chu K-C, Xu Y, Balschi JA, Springer CS. Bulk magnetic susceptibility shifts in nmr studies of compartmentalized samples: use of paramagnetic reagents. Magn. Reson. Med. 1990;13:239–262 doi: 10.1002/mrm.1910130207. [DOI] [PubMed] [Google Scholar]
- 32.Báez-Yánez MG, Ehses P, Mirkes C, Tsai PS, Kleinfeld D, Scheffler K . The impact of vessel size, orientation and intravascular contribution on the neurovascular fingerprint of BOLD bSSFP fMRI. NeuroImage 2017;163:13–23 doi: 10.1016/j.neuroimage.2017.09.015. [DOI] [PMC free article] [PubMed] [Google Scholar]
- 33.Parker GJM, Roberts C, Macdonald A, et al. Experimentally-derived functional form for a population-averaged high-temporal-resolution arterial input function for dynamic contrast-enhanced MRI. Magn. Reson. Med. 2006;56:993–1000 doi: 10.1002/mrm.21066. [DOI] [PubMed] [Google Scholar]
- 34.Shu CY, Sanganahalli BG, Coman D, Herman P, Rothman DL, Hyder F. Quantitative β mapping for calibrated fMRI. NeuroImage 2016;126:219–228 doi: 10.1016/j.neuroimage.2015.11.042. [DOI] [PMC free article] [PubMed] [Google Scholar]
- 35.Hoge RD, Atkinson J, Gill B, Crelier GR, Marrett S, Pike GB. Investigation of BOLD signal dependence on cerebral blood flow and oxygen consumption: the deoxyhemoglobin dilution model. Magn. Reson. Med. 1999;42:849–863. [DOI] [PubMed] [Google Scholar]
- 36.Bulte DP, Drescher K, Jezzard P Comparison of hypercapnia-based calibration techniques for measurement of cerebral oxygen metabolism with MRI. Magn. Reson. Med. 2009;61:391–398 doi: 10.1002/mrm.21862. [DOI] [PubMed] [Google Scholar]
Associated Data
This section collects any data citations, data availability statements, or supplementary materials included in this article.
Supplementary Materials
Supporting Information Figure S1. (a) The distribution of vessel sizes from the six networks of mouse vasculature measured in vivo. (b) β obtained from the random cylinder model with the vessel size distribution in (a) for both BOLD (2 × 10⁻⁷) to 12 × 10−7) and CA range (1 × 10⁻⁶) to 10 × 10−6) of Δχ concentration. (c) The value of β as a function of Δχ concentration in SI units.
Supporting Information Figure S2. (a) The vasculature (blue: veins; red: arteries; green:capillaries) with starting pial artery and vein (branching order = 0) indicated in the figure. (b) Distribution of SO2 computed in the model as a function of branching orders staring from the pial artery and vein. (c) Δχ concentration in different branching orders. (d) The corresponding vessel diameter in different branching orders.
Supporting Information Figure S3. The value of β obtained for a mouse vascular for different dt values in the Monte-Carlo simulations for (a) the BOLD range of Δχ range (2 × 10⁻⁷) to 12 × 10−7) and (b) contrast agent range of Δx (1 × 10⁻⁶) to 10 × 10−6).


