Abstract
River reaches downstream dams where a constant residual flow discharge is imposed, often lack sediment supply and periodic inundation due to the absence of natural flood events. In this study, a two-year return flood was released from an upstream reservoir and combined with sediment replenishment to enhance instream habitat conditions downstream of Rossens hydropower dam on the Sarine River in western Switzerland. Sediment replenishment consisted of four sediment deposits distributed as alternate bars along the river banks, a solution which was previously tested in laboratory. The morphological evolution of the replenishment and of the downstream riverbed were surveyed including pre- and post-flood topography. A hydro-morphological index to evaluate the quality of riverine habitats, based on the variability of flow depth and flow velocity in the analyzed reach, was investigated. The combination of the artificial flood with sediment replenishment proved to be a robust measure to supply a river with sediment and to enhance hydraulic habitat suitability.
Subject terms: Hydrology, Restoration ecology, Riparian ecology, Ecosystem ecology
Introduction
Sediment dynamics, referring to the transport and diversity in the size of sediment, are an often neglected but essential linkage in the nexus between water-food-energy and ecosystems. Flow and sediment dynamics are two interlinked key abiotic drivers in riverine ecosystems1,2 that host a large variety of habitats3. Water storage by river damming are vital infrastructures to guarantee food and energy production4, however these have a severe impact on both abiotic drivers since they regulate the flow and interrupt the longitudinal conveyance of sediment along the valley5,6, in particular in long reservoirs where the sediment continuum is often completely interrupted6,7. Upstream of a dam, deposited sediments cause the loss of storage capacity in the reservoir8. On the other hand, a lack of sediment causes river incision downstream of the dam, streambank erosion, reduction of morphology diversity and loss of habitats and fluvial connectivity9,10. In extreme cases, downstream sediment depletion leads to a new grain composition of the river bed with potential modification of the mass exchange between surface and sub-surface waters. Different measures to mitigate the downstream lack of sediments are applied in practice such as flushing, sediment bypassing and artificial replenishment of sediments, although with limited results and viability. Including the sediment dynamics in catchment management contributes to socially and environmentally sustainable water, food, and energy security, contributing directly to Agenda 203011–13 in several of its targets.
Flood pulses released intentionally by dam owners, typically through their bottom outlets, can be combined with sediment replenishment in downstream reaches to deal with the problem of sediment dynamics14,15. Such reservoir flushing events in the case of significant reservoir drawdown can have significant impact on water turbidity16 and fish in downstream reaches and in the reservoir itself; hence such operations need to be carefully planned and monitored17,18. An experimental two-year return flood, combined with sediment replenishment to the channel bed, was tested downstream of Rossens Dam on the river Sarine in Switzerland. Sediment replenishment, analogous with one tested in laboratory, consisted of four deposits alternately distributed along both banks of the river19. According to the laboratory study, this configuration provides, compared to a classical replenishment of one single deposit, periodic sediment clusters on the river bed, thereby enhancing habitat diversity in a reach. In the current study, this type of sediment replenishment was tested for the first time in prototype combined with the release of an artificial flood. The results were evaluated in terms of hydraulic habitat suitability enhancement quantified by the Hydro-Morphological Index of Diversity (HMID)20,21.
Case study: The Sarine floodplain
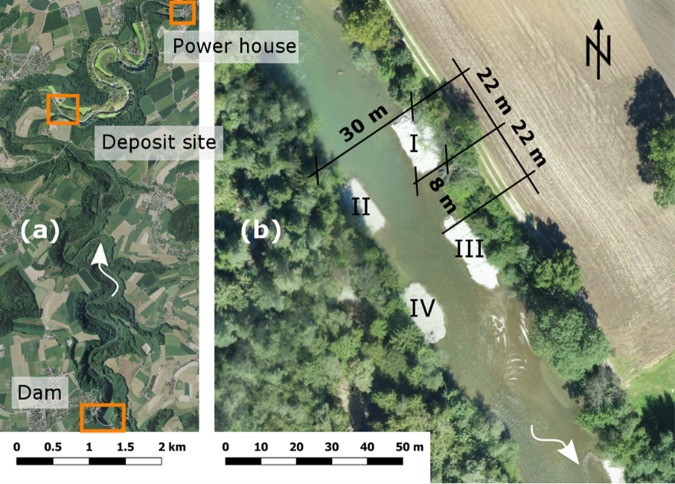
The study took place at the Sarine River in the Canton Fribourg in western Switzerland. The Sarine originates at Sanetsch at 2252 m a.s.l. After 125 km it drains into the Aare, a tributary of the Rhine. Multiple reservoirs for hydropower production were built along the Sarine (Lac de Sénin, Lac du Vernex, Lac de Montbovon and Lac de la Gruyère), resulting in a regulated flow regime. The 83 m high Rossens arch dam forms the over 13-km long Lac de la Gruyère, which has a volume of 200 million m3. Being located in a pre-alpine valley, the lake is relatively long and sediment continuum is completely interrupted by the dam. Since construction in 1948, a residual discharge of 2.5–3.5 m3/s has been released by the Rossens Dam. This is the only discharge in the 13.4 km long reach with an average slope of 0.3% between the dam and the powerhouse in Hauterive (Fig. 1a). In Hauterive, up to 76 m3/s re-enter the Sarine during electricity production causing downstream hydropeaking.
Figure 1.
(a) Replenishment site and the locations of the dam and power house, background Geodata © swisstopo. (b) Configuration of the four sediment deposits in the Sarine River, background © Research unit Ecohydrology, ZHAW. The distance between the deposits was about a deposit length, the shift between the deposits on the left and the right bank is half a deposit length. The height of the deposits was ca. 1.5 m above the initial river-bed. The numbering refers to the name of the deposits from upstream to downstream: deposit I, II, III and IV.
This river segment of the Sarine has a meandering morphology. The floodplain lies in an naturally 100-m incised, wide, canyon revealing the cut-in of the river over thousands of years in the exposed steep rock walls at the outer bank of the river bends. However, in average, this river segment has a 1 m thick sediment layer above the bed rock. The Floodplain is surrounded by agricultural terrain and villages. Therefore, human-built structures in the floodplain are limited to some gravel roads, a handful of buildings and hiking paths. However, the absence of flood events and the interruption of sediment supply since the construction of the dam caused channel incision and disconnection of the floodplain. Vegetation colonized the previously wide gravel bars on the floodplain, mainly populated willows and hardwood.
The experiment was a collaborative research effort led by the cantonal authorities in collaboration with the dam owners (Groupe e) and engineering offices (Hydrique, Pronat) and with the participation of different research institutions (Zurich University of Applied Sciences, Swiss Federal Institute of Aquatic Science and Technology, University of Zurich and the École Polytechnique Fédérale de Lausanne). During the flood the investigations along the valley downstream of Rossens Dam had several scientific focus. The present research focused on the question how, through artificial replenishment of sediment, an increase of the variety of the bed channel morphology can be achieved. These morphology-driven objectives are linked to the more general goal of improving habitat diversity which is herein evaluated in terms of the index HMID.
Results
Sediment erosion and deposition after the passage of the artificial flood
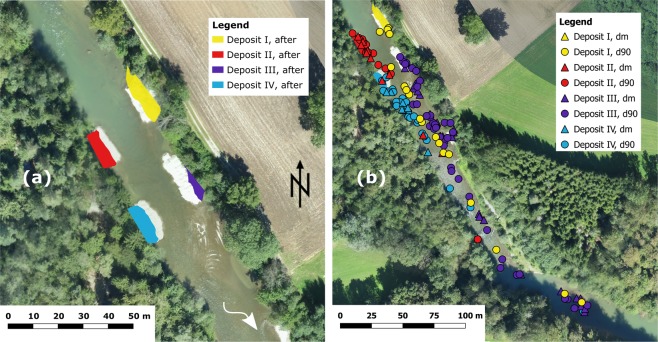
To follow the movement of the replenished material, 489 stones with a mean diameter of 5.7 cm (corresponding to dm) and 11.3 cm (corresponding to d90) were equipped with RFID PIT tags and added to each deposit (Fig. 2, see Methods for more details). The passage of the two-year flood was not strong enough to erode all the deposits (Fig. 3a). In deposits I, II and IV, sediment was mainly eroded laterally, whereas deposit III was fully eroded.
Figure 2.
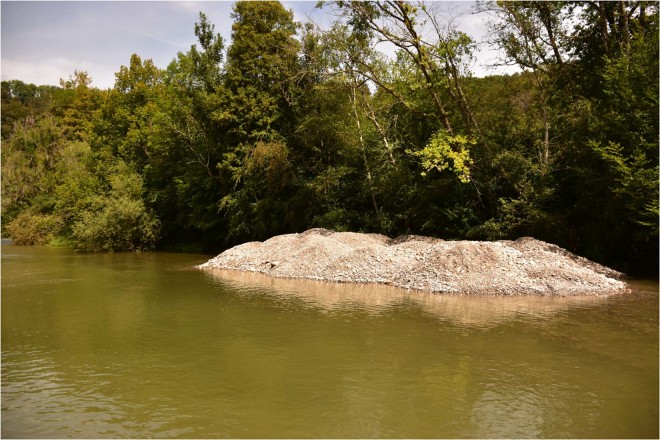
Deposit I in the river before the flood experiment. Its dimensions correspond to ca. 22 × 8 × 1.5m3 (length, width, height). The material was excavated from the adjacent riparian forest. Image © Elena Battisacco.
Figure 3.
(a) The exposed dry surface of the four deposits before (air-image background © Research unit Ecohydrology, ZHAW) and after (colored areas) the artificial flood event. The residual flow discharge was 3.5 m3/s when the air-image was taken before the flood event and 2.5 m3/s when the dry surface was measured after the flood event. (b) RFID PIT tag equipped sediments detected after the flood event (background © Research unit Ecohydrology, ZHAW).
During surveys made after the artificial flood, 277 (57%) RFID PIT tagged sediments were recovered (Fig. 3b, see Methods for details about the detection). A total of 111 tags were detected on the remaining part of the deposits which was not eroded and 166 tagged sediments were eroded and transported downstream. The travelled distance depended mainly on the deposit of origin of the sediment and was always <286 m. On average, sediments with the size corresponding to the dm travelled about 100 m and the sediments with the size corresponding to d90 about 65 m (Fig. 4a). However, their maximum transported distance is equivalent. Tagged stones from the deposit I and III were further transported than tags from deposit II and IV (Fig. 4b). Most of the detected tagged stones had deposit III as origin, followed by deposit I, IV and II. Tagged sediments from deposit I and III were all detected on the left side of the river, whereas the inverse was observed for sediments originating in deposits II and IV (Fig. 3b). The equipped tags settled in clusters, similar to the previous laboratory observations.
Figure 4.
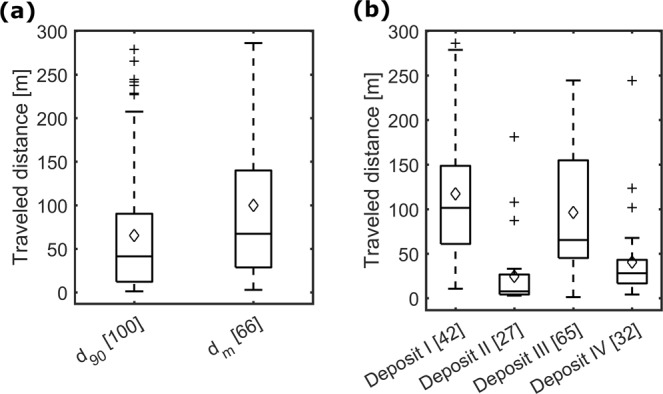
Traveled distances of the RFID PIT tagged sediments which were detected with the mobile antenna after the flood event sorted by (a) size and by (b) deposit of origin (see Methods for following sediment transport for details about the detection).
Changes in hydraulic habitat suitability
Table 1 provides the results of the analysis concerning the change in habitat diversity using HMID (see methods for details about HMID). 200 measurement points of flow depth and flow velocity were measured on nine cross-sections in a 850 m long reach (more details in Methods). These data were then divided in three different sub-reaches: all nine cross-sections (corresponding to the 200 surveyed positions); three cross-sections lying in the area where the tagged sediments were detected (thus impacted by the replenishment of sediment, corresponding to 65 surveyed positions); and the remaining six cross-sections (corresponding to 135 surveyed positions). The results are always shown for before and after the artificial flood. In the impact area, where the tagged sediments were found, the HMID increased by 36%, whereas the HMID computed with the values sampled outside this impact area increased by 18%. The HMID outside of the impact zone was higher than in the impact zone, both before and after the flood event. The value of HMID outside of the impact zone corresponded to the lower limit of the classification of fully developed spatial dynamics (see Methods). This is confirmed by the presence of several geomorphology features such as pools, riffles and paleochannels.
Table 1.
HMID values before and after the flood event and the sediment replenishment in the Sarine river.
| HMIDtotal (9 CS, 200 dps) | HMIDimpact zone (3 CS, 65 dps) | HMIDrest zone (6 CS, 135 dps) | ||||||
|---|---|---|---|---|---|---|---|---|
| Before Flood Q = 3.5 [m3/s] | After Flood Q = 2.5 [m3/s] | Before Flood Q = 3.5 [m3/s] | After Flood Q = 2.5 [m3/s] | Before Flood Q = 3.5 [m3/s] | After Flood Q = 2.5 [m3/s] | |||
| μh | [cm] | 49.7 | 45.9 | 40.2 | 38.3 | 54.7 | 49.1 | |
| σh | [cm] | 29.4 | 31.4 | 18.2 | 22.6 | 32.8 | 34.0 | |
| μv | [m/s] | 0.43 | 0.39 | 0.45 | 0.42 | 0.42 | 0.38 | |
| σv | [m/s] | 0.34 | 0.33 | 0.28 | 0.31 | 0.37 | 0.35 | |
| HMID | [−] | 8.1 | 9.8 | 5.6 | 7.7 | 9 | 10.6 | |
| HMID Variation | +21% | +36% | +18% | |||||
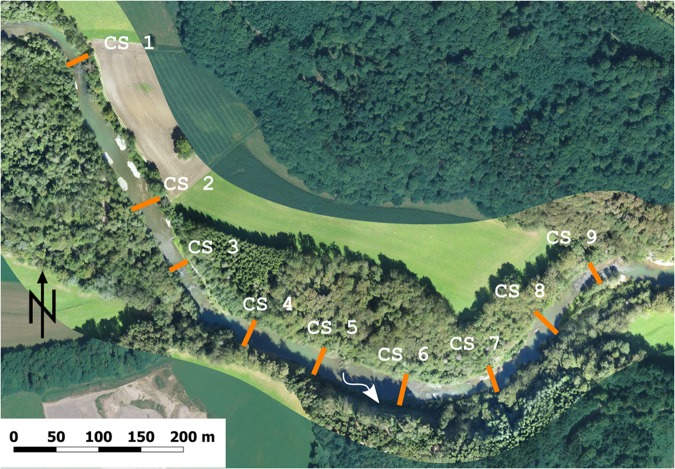
CS stands for cross-sections, to the impact zone belong the cross-sections where the tagged sediments were found (CS 2–4), the rest zone corresponds to the sections where no sediment was found (CS 1, and 5–9, see Fig. 6). dps stands for data points representing the amount of flow depths and velocities used to calculated the corresponding HMID value.
Discussion and Conclusion
The results clearly demonstrate that the release of an artificial flood combined with sediment replenishment of the riverbed significantly increased the morphological diversity of a river reach downstream of a storage dam, which in turn led to a significant amelioration in hydraulic habitat suitability. The results also point out that the sole release of the artificial flood in the valley downstream of Rossens Dam, to a certain extent, also enhanced conditions for hydraulic habitat suitability. Furthermore, a sole release of a flood pulse in the absence of sediment replenishment likely would lead to a wash-out of sediment in the bedrock-alluvial Sarine River and accelerate bed incision. A long-term field study is still missing as well as investigations with successive flood releases. However, all indicates that the HMID will be enhanced only in combination with a regularly supply of sediment during the artificial release of the flood. It is also important that sediment replenishment following this first positive restoration experience should be placed as close to the dam as possible to supply the entire river with sediment. The present results encourage further similar experiments and spark the discussion of further possibilities for the definition of environmental flows. This interdisciplinary approach, combining ecohydraulics, engineering and geomorphology, may be a crucial puzzle piece to define a proper sediment management in river reaches impacted by dams. The biological survey that was performed parallel to this study also revealed positive first effects of the flood in the Sarine22.
Methods
The artificial flood and the replenishment of sediments
A flood pulse with a peak discharge of 195 m3/s, corresponding to a return period of two years, was released from Rossens dam in September 2016. Due to the limitations of the hydrograph (polluted areas near the floodplain could not be flooded), a shape was chosen in which peak discharge was kept for two hours (Fig. 5).
Figure 5.
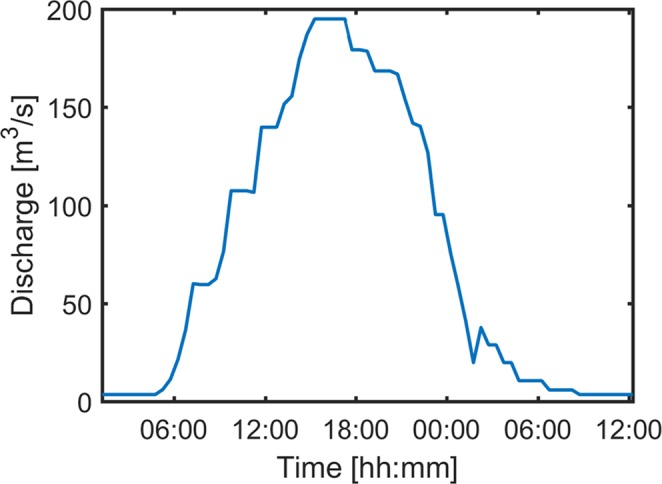
Hydrograph of the flood pulse. The peak discharge of this two year flood was limited by restrictions in the flooding perimeter. The whole flood lasted more than 24 hours starting from 14 September 2016 at 05h00 to 15 September 08h30.
In addition to the flood pulse, four sediment deposits were added to the river 9 km downstream of the dam (coordinates 46°45′29.21″N, 7°06′11.47″E; Fig. 1a) with a total volume of 1000 m3 (Fig. 2). The deposit lengths as well as the distance between deposits on the same river bank were slightly less than the river width (around 22 m, Fig. 1b). The mid-channel distance available for flow, in between deposits, was roughly half of the river width. The replenished material was excavated from the adjacent alluvial forest on the right bank of the river. The grain size distribution of the excavated material was determined analyzing 21 samples for pebble counts23 and photo sieving using BASEGRAIN24. The characteristic grain sizes were determined as d50 = 3.9 cm, d65 = 5.3 cm, dm = 5.7 cm, d84 = 8.7 cm and d90 = 11.3 cm.
Sediment tracking
Displacement of an individual sediment particle (stone) in a river can be tracked using radio-frequency identification technology (RFID)25,26. The passive integrated transponder (PIT) tags can be fixed in stones or artificial bodies with little effort and can be detected from a close distance. So far, RFID PIT tags proved to be a useful technology in wadable reaches with relatively low flow velocities (v < 1 m/s)27. Studies in different fluvial environments resulted in recovery rates above 85%28,29.
A total of 489 stones, divided into dm and d90, were collected in the field, drilled, and the hole filled with a radio frequency identification passive integrated transponder tags (RFID PIT tag) of 32 mm or 23 mm length and silicon30,31. With the software S2Util, the tags were programmed with a unique identification number. After measuring the three axes and the weight of the tagged stones, they were distributed equally on the top, middle and bottom of the four deposits.
A mobile antenna consisted of a 150-cm long pole and an 80-cm diameter ring attached at the end, both made of plastic, was used. Inside the ring, a double loop of 4-mm2 multiple strand cable formed the antenna. The electro-magnetic components are portable. When detecting a PIT tag, the antenna made a noise and the tag ID was shown on the screen. Both antenna systems worked with a 12 V 7.0 Ah battery. The electromagnetic components, such as the PIT tags, the Tuning Board, HDX Ready and Control board were all provided by www.oregonrfid.com. The PIT tags work at a low frequency of 134.2 kHz, allowing the detection in submerged conditions.
With the help of the self-developed mobile RFID antenna, the location of the tagged sediments could be detected after the flood event30,31 and their locations were registered with a differential GPS (TOPCON HiPer Pro) providing an accuracy of a few centimeters. The locations of origin and settling for the tagged sediments could therefore be captured with a precision of less than one meter due to the ring-size.
Hydro-Morphological Index of Diversity (HMID) to evaluate hydraulic habitat suitability
The changes in hydraulic habitat suitability after the combined artificial flood release and replenishment of sediments were quantified using the Hydro-Morphological Index of Diversity (HMID)20,21. The HMID is based on the following hypotheses: the structural diversity of a river reach can be characterized by the hydraulic measures of flow depth and velocity and their statistical parameters, which are in turn a surrogate for habitat suitability for the aquatic and semi-aquatic region of a river reach. The HMID takes into account the spatial distribution of flow depth and flow velocity, like other indexes to evaluate habitat and morphology heterogeneity32,33:
| 1 |
where CV = coefficient of variation of variable i; μh and μv = mean value of flow depth (h) and velocity (v), respectively; and σh and σv are the corresponding standard deviations. Generally, HMID-values between 1 and 15 are obtained depending on the river morphology. A river reach can be categorized as20,21:
1 < HMID < 5: Channelized/heavily altered
5 < HMID < 9: Limited variability
HMID > 9: Fully developed spatial dynamics
A 850 m reach was analysed. Measurements of flow depth and flow velocity were made at the exact same locations before and after the flood event, across the river at nine different equally-spaced cross-sections with a distance of about 95 m (Fig. 6). A total of 200 velocity and water depth measurements were taken in the reach, before and after the flood event. The measurement points were equally distributed over the cross sections with a 1 m spacing. Instantaneous flow velocities were measured with a Handheld-ADV (FlowTracker manufactured by SonTek) at 60% of the flow depth. Flow velocities were averaged over a period of 45 s, with a measurement frequency of 1 Hz, which proved to provide a robust mean value. Flow depths were measured with the scale on the vertical bars of the FlowTracker equipment. The location of the sampling points was recorded with a differential GPS. An analysis of statistical convergence revealed that the results obtained with 200 points surveyed in the 850 m in the Sarine river are sufficient. Detailed information concerning sampling and data sufficiency can be found in literature34.
Figure 6.
Nine cross-sections (CS) where flow depths and velocities were measured. CS 2–4 correspond to the HMIDimpact zone, CS 1 and 5–9 to the HMIDrest zone (see Table 1). Background © Research unit Ecohydrology, ZHAW.
Acknowledgements
We thank Jonas Durand-Gasselin, Anthony Maître, Elena Battisacco, Kevin Gianom, Matthias Thalmann and Diego Tonolla for their help during the flood event. This research is part of the National Research Programme 70 “Energy Turnaround” (NRP 70, www.nrp70.ch) of the Swiss National Science Foundation (SNSF, Project No. 153972). The first author additionally is supported by the Swiss Federal Office of Energy (SFOE, Project No. 501673-01).
Author Contributions
S.St., M.J.F. and A.J.S. conceived the experiment; S.St. analyzed the data in close collaboration with M.J.F.; S.St. wrote the manuscript and created the figures (unless Figure 2) with contributions from M.J.F., C.T.R. and A.J.S. All authors approved the final version of the manuscript and agree to be held accountable for the content therein.
Data Availability
The datasets analysed during the current study are available from the corresponding author on reasonable request.
Competing Interests
The authors declare no competing interests.
Footnotes
Publisher’s note: Springer Nature remains neutral with regard to jurisdictional claims in published maps and institutional affiliations.
Change history
8/19/2019
The PDF version of this Article previously published contained incorrectly sized Figures 1, 2, 5 and 6. This has now been corrected in the PDF version of the Article; the HTML version was correct at the time of publication.
References
- 1.Poff NL, et al. The Natural Flow Regime. Bioscience. 1997;47:769–784. doi: 10.2307/1313099. [DOI] [Google Scholar]
- 2.Wohl E, et al. The natural sediment regime in rivers: Broadening the foundation for ecosystem management. BioScience. 2015;65:358–371. doi: 10.1093/biosci/biv002. [DOI] [Google Scholar]
- 3.Allan, J. D. & Castillo, M. M. Stream ecology: Structure and function of running waters: Second edition. Stream Ecology: Structure and Function of Running Waters: Second Edition (Springer Netherlands) doi:10.1007-978-1-4020-5583-6 (2007)
- 4.Schleiss AJ. Better water infrastructures for a better world -the important role of water associations. Hydrolink. 2017;3:86–87. [Google Scholar]
- 5.Magilligan FJ, Nislow KH. Changes in hydrologic regime by dams. Geomorphology. 2005;71:61–78. doi: 10.1016/j.geomorph.2004.08.017. [DOI] [Google Scholar]
- 6.Moyle PB, Mount JF. Homogenous rivers, homogenous faunas. Proc. Natl. Acad. Sci. 2007;104:5711–5712. doi: 10.1073/pnas.0701457104. [DOI] [PMC free article] [PubMed] [Google Scholar]
- 7.Warner RF. Environmental impacts of hydroelectric power and other anthropogenic developments on the hydromorphology and ecology of the Durance channel and the Etang de Berre, southeast France. J. Environ. Manage. 2012;104:35–50. doi: 10.1016/j.jenvman.2012.03.011. [DOI] [PubMed] [Google Scholar]
- 8.Schleiss AJ, Franca MJ, Juez C, De Cesare G. Reservoir sedimentation. J. Hydraul. Res. 2016;54:595–614. doi: 10.1080/00221686.2016.1225320. [DOI] [Google Scholar]
- 9.Brandt SA. Classification of geomorphological effects downstream of dams. Catena. 2000;40(4):375–401. doi: 10.1016/S0341-8162(00)00093-X. [DOI] [Google Scholar]
- 10.Kondolf GM. HungryWater: Effects of Dams and Gravel Mining on River Channels. Environ. Manag. 1997;21(4):533–551. doi: 10.1007/s002679900048. [DOI] [PubMed] [Google Scholar]
- 11.United Nations General Assembly. Transforming our world: The 2030 agenda for sustainable development, https://sustainabledevelopment.un.org/content/documents/7891Transforming%20Our%20World.pdf; 10.1007/s13398-014-0173-7.2 (2015).
- 12.Nerini FF, et al. Mapping synergies and trade-offs between energy and the Sustainable Development Goals. Nat. Energy. 2018;3:10–15. doi: 10.1038/s41560-017-0036-5. [DOI] [Google Scholar]
- 13.Waage J, et al. Governing the UN sustainable development goals: Interactions, infrastructures, and institutions. The Lancet Global Health. 2015;3:e251–e252. doi: 10.1016/S2214-109X(15)70112-9. [DOI] [PubMed] [Google Scholar]
- 14.Kondolf GM, Wilcock PR. The flushing flow problem: Defining and evaluating objectives. Water Resour. Res. 1996;32:2589–2599. doi: 10.1029/96WR00898. [DOI] [Google Scholar]
- 15.Kantoush SA, Sumi T. River morphology and sediment management strategies for sustainable reservoir in Japan and European Alps. Ann Disas Prev Res Inst Kyoto Univ. 2010;53:821–839. [Google Scholar]
- 16.Espa P, Brignoli ML, Crosa G, Gentili G, Quadroni S. Controlled sediment flushing at the Cancano Reservoir (Italian Alps): Management of the operation and downstream environmental impact. J. Environ. Manage. 2016;182:1–12. doi: 10.1016/j.jenvman.2016.07.021. [DOI] [PubMed] [Google Scholar]
- 17.Wilcock PR, Kondolf GM, Matthews WVG, Barta AF. Specification of sediment maintenance flows for a large gravel-bed river. Water Resour. Res. 1996;32:2911–2921. doi: 10.1029/96WR01627. [DOI] [Google Scholar]
- 18.Grimardias D, Guillard J, Cattanéo F. Drawdown flushing of a hydroelectric reservoir on the Rhône River: Impacts on the fish community and implications for the sediment management. J. Environ. Manage. 2017;197:239–249. doi: 10.1016/j.jenvman.2017.03.096. [DOI] [PubMed] [Google Scholar]
- 19.Battisacco E, Franca MJ, Schleiss AJ. Sediment replenishment: Influence of the geometrical configuration on the morphological evolution of channel-bed. Water Resour. Res. 2016;52:8879–8894. doi: 10.1002/2016WR019157. [DOI] [Google Scholar]
- 20.Gostner W, Parasiewicz P, Schleiss AJ. A case study on spatial and temporal hydraulic variability in an alpine gravel-bed stream based on the hydromorphological index of diversity. Ecohydrology. 2013;6:652–667. doi: 10.1002/eco.1349. [DOI] [Google Scholar]
- 21.Gostner W, Alp M, Schleiss AJ, Robinson CT. The hydro-morphological index of diversity: A tool for describing habitat heterogeneity in river engineering projects. Hydrobiologia. 2013;712:43–60. doi: 10.1007/s10750-012-1288-5. [DOI] [Google Scholar]
- 22.Döring M, et al. Künstliches Hochwasser an der Saane – Eine Massnahme zum nachhaltigen Auenmanagement. Wasser Energ. Luft. 2018;2:119–127. [Google Scholar]
- 23.Fehr, R. Geschiebeanalysen in Gebirgsflüssen. Mitteilungen der Versuchsanstalt für Wasserbau, Hydrol. und Glaziologie 139 (1987).
- 24.Stähly S, Friedrich H, Detert M. Size Ratio of Fluvial Grains’ Intermediate Axes Assessed by Image Processing and Square-Hole Sieving. J. Hydraul. Eng. 2017;143:6017005. doi: 10.1061/(ASCE)HY.1943-7900.0001286. [DOI] [Google Scholar]
- 25.Olinde L, Johnson JPL. Using RFID and accelerometer-embedded tracers to measure probabilities of bed load transport, step lengths, and rest times in a mountain stream. Water Resour. Res. 2015;51:7572–7589. doi: 10.1002/2014WR016120. [DOI] [Google Scholar]
- 26.Slaven S, Slaven I, Anders AM. New Gripping and Binding Device Greatly Improves Preparation of Natural Clasts for RFID Tracking. J. Hydraul. Eng. 2014;140:6014017. doi: 10.1061/(ASCE)HY.1943-7900.0000943. [DOI] [Google Scholar]
- 27.Liébault F, Bellot H, Chapuis M, Klotz S, Deschâtres M. Bedload tracing in a high-sediment-load mountain stream. Earth Surf. Process. Landforms. 2012;37:385–399. doi: 10.1002/esp.2245. [DOI] [Google Scholar]
- 28.Nichols MH. A radio frequency identification system for monitoring coarse sediment particle displacement. Appl. Eng. Agric. 2004;20:783–787. doi: 10.13031/2013.17727. [DOI] [Google Scholar]
- 29.Lamarre H, MacVicar B, Roy AG. Using Passive Integrated Transponder (PIT) Tags to Investigate Sediment Transport in Gravel-Bed Rivers. J. Sediment. Res. 2005;75:736–741. doi: 10.2110/jsr.2005.059. [DOI] [Google Scholar]
- 30.Arnaud F, Piégay H, Vaudor L, Bultingaire L, Fantino G. Technical specifications of low-frequency radio identification bedload tracking from field experiments: Differences in antennas, tags and operators. Geomorphology. 2015;238:37–46. doi: 10.1016/j.geomorph.2015.02.029. [DOI] [Google Scholar]
- 31.Cassel M, Piégay H, Lavé J. Effects of transport and insertion of radio frequency identification (RFID) transponders on resistance and shape of natural and synthetic pebbles: applications for riverine and coastal bedload tracking. Earth Surf. Process. Landforms. 2017;42:399–413. doi: 10.1002/esp.3989. [DOI] [Google Scholar]
- 32.Rinaldi M, Surian N, Comiti F, Bussettini M. A method for the assessment and analysis of the hydromorphological condition of Italian streams: The Morphological Quality Index (MQI) Geomorphology. 2013;180–181:96–108. doi: 10.1016/j.geomorph.2012.09.009. [DOI] [Google Scholar]
- 33.Lamouroux N, Capra H, Pouilly M. Predicting habitat suitability for lotic fish: linking statistical hydraulic models with multivariate habitat use models. Regul. Rivers Res. Manag. 1998;14:1–11. doi: 10.1002/(SICI)1099-1646(199801/02)14:1<1::AID-RRR472>3.0.CO;2-D. [DOI] [Google Scholar]
- 34.Stähly S, Gostner W, Franca MJ, Christopher T, Schleiss AJ. Sampling sufficiency for determining hydraulic habitat diversity Sampling sufficiency for determining hydraulic habitat diversity. J. Ecohydraulics [accepted for publication] 2019 doi: 10.1080/24705357.2019.1576021. [DOI] [Google Scholar]
Associated Data
This section collects any data citations, data availability statements, or supplementary materials included in this article.
Data Availability Statement
The datasets analysed during the current study are available from the corresponding author on reasonable request.


