Summary
The genome is partitioned into topologically associated domains (TADs) and genomic compartments of shared chromatin valance. This architecture is constrained by the DNA polymer, which precludes genic interactions between chromosomes. Here, we report a dramatic divergence from this pattern of nuclear organization that occurs in mouse olfactory sensory neurons (OSNs). In situ HiC on FAC-sorted OSNs and their progenitors shows that olfactory receptor (OR) gene clusters from 18 chromosomes make specific and robust interchromosomal contacts that increase with differentiation. These contacts are orchestrated by intergenic OR enhancers, the Greek Islands, which first contribute to the formation of OR compartments and then form a multi-chromosomal super-enhancer that associates with the single active OR. Greek Island-bound transcription factor Lhx2 and adaptor protein Ldb1 regulate the assembly and maintenance of OR compartments, Greek Island hubs, and OR transcription, providing mechanistic insight and functional support for the role of trans interactions in gene expression.
Introduction
Mouse ORs are encoded by a family of >1000 genes1 that are organized in heterochromatic clusters2 distributed across chromosomes. Every mature OSN (mOSN) expresses only one OR gene in a monoallelic and stochastic fashion3,4. OR gene activation requires removal of heterochromatic marks5 and the concerted action of 63 intergenic enhancers, the “Greek Islands”, which are bound by transcription factors Lhx2 and Ebf6,7. Singular OR expression coincides with nuclear convergence of OR gene clusters8,9, which promotes interchromosomal interactions between Greek Islands and the chosen OR6. The specificity by which Greek Islands associate with the active OR allele, as well as the significance of their interchromosomal contacts in OR transcription are uncertain. In this note, although interchromosomal interactions occur in other systems10–14, unbiased approaches like in situ HiC15 fail to detect robust trans contacts between non-repetitive regions16,17, raising questions about the frequency and biological role of genomic interactions between chromosomes17,18. To obtain quantitative and functional insight into the regulation and function of multi-chromosomal interactions we performed in situ HiC in 10 distinct wild type and mutant cell types of the main olfactory epithelium (MOE) (Extended Data Fig. 1a–d).
Trans compartments form during OSN differentiation
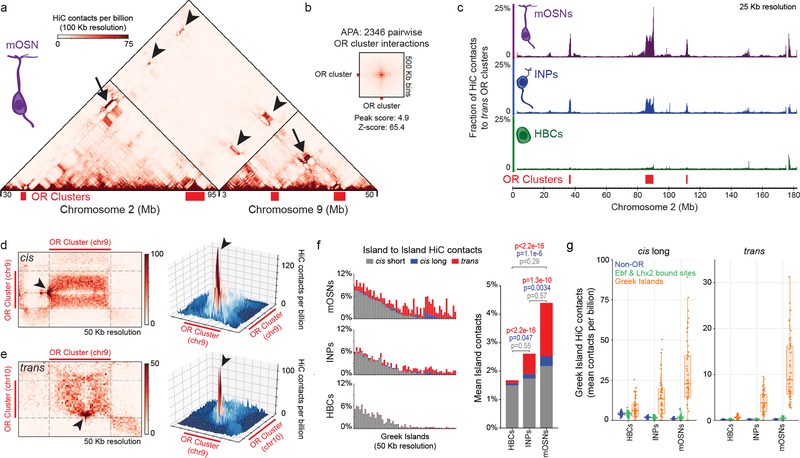
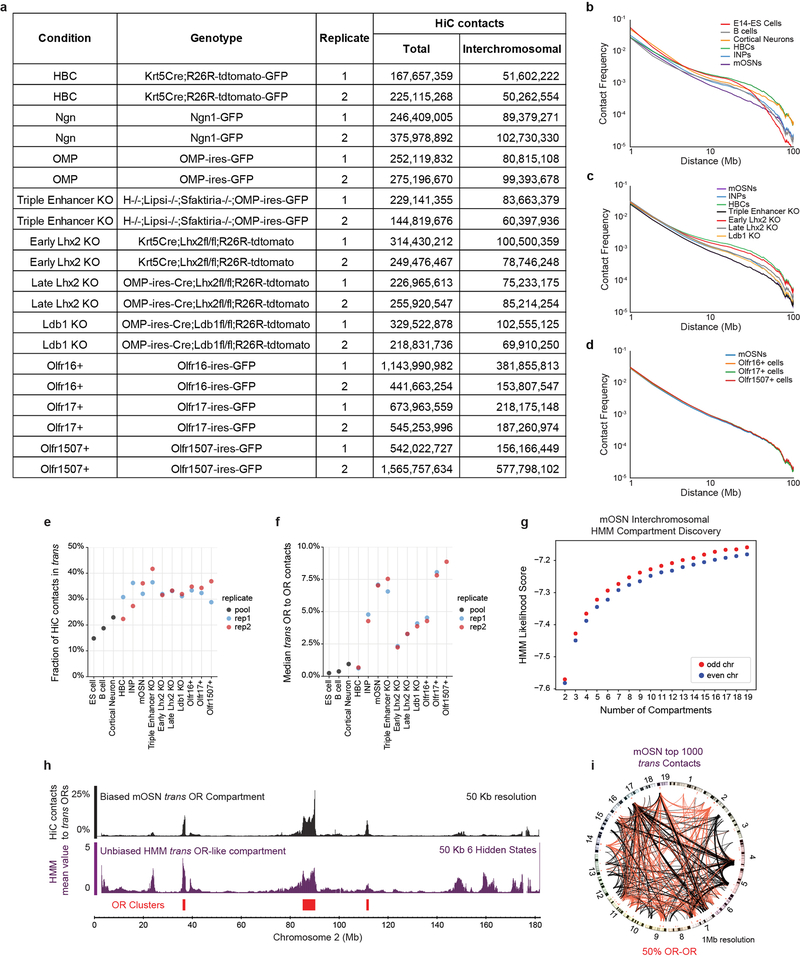
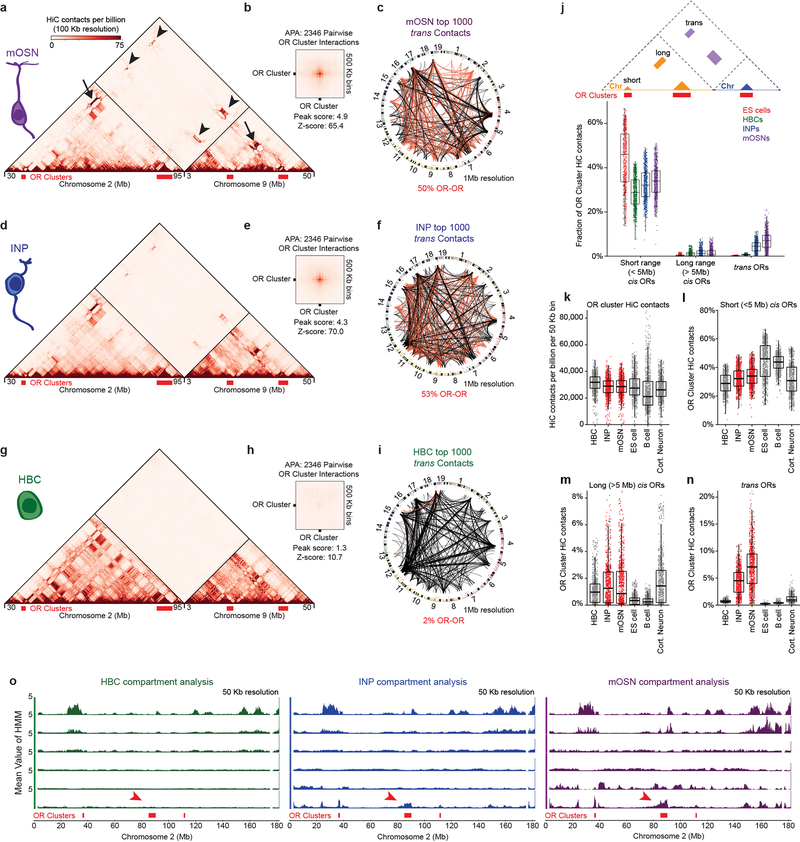
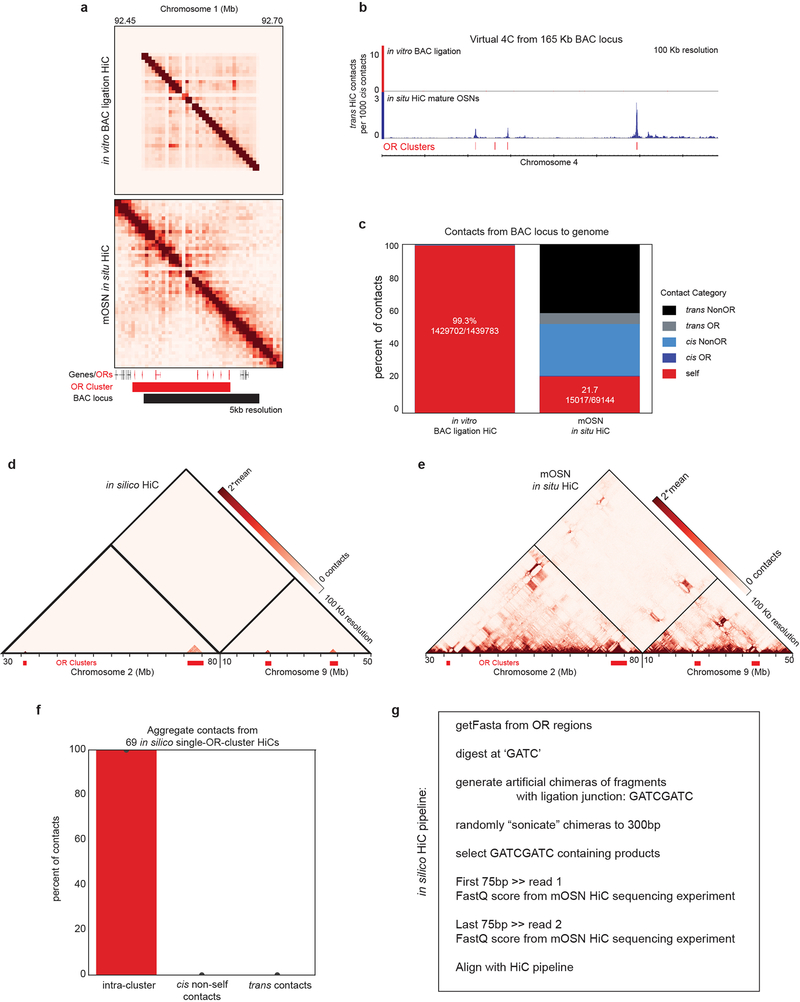
First, we analyzed FAC-sorted mOSNs, which represent terminally differentiated, post-mitotic neurons that are heterogeneous in regards to OR identity. In situ HiC in mOSNs revealed extensive interchromosomal interactions corresponding to 35.6% of total HiC contacts (Extended data Fig.1e) consistent with previous imaging results19. Zoomed in genomic views show strong, OSN-specific trans contacts between OR clusters (Fig. 1a, b) with the median OR cluster having ~7.5% of all its HiC contacts map to OR clusters from different chromosomes (Extended data Fig. 1f). Aggregate peak analysis (APA) and unbiased compartment prediction15 (Fig. 1b, Extended data Fig. 1g–h) confirm that most OR clusters participate in the assembly of OR-selective multi-chromosomal compartments. Notably, trans OR cluster contacts represent only 0.25% of all the interchromosomal contacts in mOSNs, but account for 50% of the 1000 strongest trans HiC contacts (Extended data Fig. 1i). In Horizontal Basal Cells (HBCs), the quiescent stem cells of the MOE, trans OR contacts are almost absent, representing only 2% of the strongest 1000 trans contacts genomewide, whereas inter-cluster cis OR contacts are strong, but less specific than in mOSNs (Extended data Fig. 2a–c,g–j). In the more differentiated immediate neuronal precursors (INPs)15 trans OR contacts are abundant but less frequent than in mOSNs, with cis OR cluster interactions occurring at mOSN levels (Extended data Fig. 2 d–f,j). Thus, OR compartments form in a hierarchical fashion, with cis contacts appearing first, and trans interactions strengthening with differentiation (Extended Data Fig. 2j–o). In vitro BAC HiC and in silico HiC assays, show that intra-cluster HiC fragments do not map in other OR clusters, excluding the possibility of homology-derived mapping artifacts (Extended Data Fig. 3).
Figure 1: Extensive interchromosomal contacts between OR gene clusters and focal interchromosomal contacts between Greek Islands form over OSN differentiation.
a, In situ HiC contact matrix of chromosomes 2 and 9 in mOSNs shows highly restricted and frequent contacts between OR gene clusters in cis (arrows) and trans (arrowheads). b. Aggregate Peak Analysis (APA) shows strong focal contacts between OR gene clusters in mOSNs. c, The fraction of HiC contacts made to OR clusters located on a different chromosome is shown for every 25 Kb bin along chromosome 2. For OR clusters these contacts increase over differentiation form HBCs (bottom) to INPs (middle) to mOSNs (top). d-e, Pairwise views of OR gene clusters reveals a local maximum of in situ HiC interactions between Greek Island loci (arrowheads) in cis (a) and trans (b). f, (left) For each Greek Island, the fraction of total HiC contacts that are made to other Greek Islands located in cis at short range (<5 Mb apart, grey), long range (>5Mb apart, blue), and in trans (red). Top panel represents mOSNs, middle panel INPs, and bottom panel HBCs. (right) Mean fraction of HiC contacts across all Greek Islands (two-sided, paired Wilcoxon signed-rank test, n=59). g, For each Greek Island bin (n=59), the mean number of cis long range (left) and trans (right) HiC contacts per billion made to every non-OR sequence (at 50 Kb resolution), intergenic Lhx2 & Ebf bound peak (outside of OR clusters), or Greek Island. Box indicates median, upper, and lower quartiles while whiskers indicate 1.5 * the interquartile range. All panels present pooled data from 2 independent biological replicates that yielded similar results when analyzed separately.
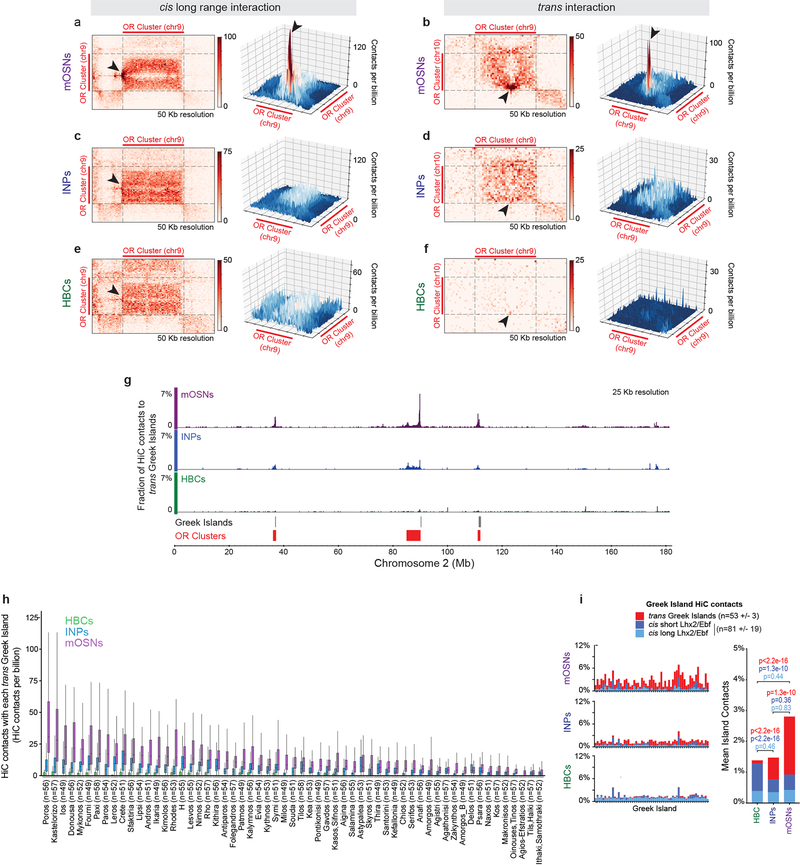
Within OR compartments the 63 euchromatic Greek Islands represent HiC “hotspots” of specific and frequent cis and trans contacts (Fig. 1d,e, Extended Data Fig. 4a,b). Similar to OR interactions, trans Greek Island contacts are not detected in HBCs (Extended Data Fig 4e,f), which do not express ORs. In contrast, in INPs, where OR transcription is weak2 and multigenic20–22, Greek Islands interact with each other but lack the focal contact distribution detected in mOSNs (Extended Data Fig. 4c,d). The differentiation-dependent enhancement and specification of trans interactions is a property of most Greek Islands (Fig. 1f–g, Extended Data Fig. 4g,h). In total, 4.5% of Greek Island HiC contacts in mOSNs are made with the other Greek Islands, with half of these contacts being trans (Fig. 1f). Strikingly, this exceeds the mean and cumulative frequency of contacts that Greek Islands make with Lhx2/Ebf-bound intergenic sequences present in cis (Fig. 1g, Extended Data Fig. 4i,j), consistent with the differentiation-dependent assembly of a multi-chromosomal enhancer hub composed exclusively of Greek Islands.
Greek Islands promote compartmentalization
For a mechanistic dissection of Greek Island interactions we explored the role of the core sequences of these enhancers. In situ HiC in mOSNs carrying homozygous deletions for Islands H18 (2 Kb), Lipsi6 (1 Kb), and Sfaktiria (0.6 Kb) shows strong reductions of trans interactions between genomic bins containing these deletions and the remaining Greek Islands, an effect that extends over large genomic distance (Fig. 2a–c, Extended Data Fig. 5a–b). Intriguingly, the reduction of cumulative trans Greek Island contacts correlates with the transcriptional OR downregulation observed in Greek Island deletions (Fig. 2c). If we exclude Greek Island bins from this analysis, we also observe reduction in trans OR contacts (Fig. 2c,d, Extended Data Fig. 5c). Thus, DNA elements as small as 0.6 Kb coordinate genomic contacts extending over hundreds of Kbs, similarly to “ZIP” elements affecting nuclear positioning in yeast23, or the Igκ enhancer affecting the positioning of immunoglobulin loci in pre-B cells24. The partial effects of the triple enhancer deletions on cluster-wide contacts suggest that additional sequences participate in OR cluster interactions.
Figure 2: Greek Island deletion disrupts local recruitment of trans Greek Islands and impairs OR compartmentalization.
a, In mOSNs in which 3 Greek Islands (H, Lipsi, and Sfaktiria) have been homozygously deleted, the 50 Kb regions containing the deleted Islands have reduced trans Greek Island contacts, expressed as fraction of total HiC contacts. Interactions among the remaining Islands are not significantly different (p=0.80, two-sided, paired Wilcoxon signed-rank test, n=56). b, Pairwise heatmap of Greek Island contacts reveals that the 50 Kb regions containing the deleted Greek Islands (arrowheads) exhibit reduced contacts, plotted as Log2 fold difference, across the full set of Greek Islands. Greek Islands are ordered by genomic position and color bar indicates chromosome. c, The OR gene cluster containing Lipsi makes fewer HiC contacts with trans Greek Islands and OR gene clusters in KO mOSNs than on control mOSNs. Count data for trans Greek Island contacts and trans OR cluster contacts from 2 biological replicates were analyzed to identify loci with a significant difference in contacts between conditions (see Extended Materials and Methods). Significantly changed regions, corrected for multiple comparisons, are indicated with an asterisk (padj < 0.05, Wald test). Lower panel shows RNA-seq analysis of the expression of OR genes in KO mOSNs relative to control mOSNs. Significantly changed ORs are red (p < 0.01, Wald test, 5 biological replicates for control mOSNs and 4 for KO mOSNs). d, OR gene clusters containing the deleted Greek Islands (red) make fewer contacts with trans OR gene clusters in KO mOSNs, plotted as fraction of the total HiC contacts. Contacts made by the non-targeted clusters are not significantly different (p=0.79, two-sided, paired Wilcoxon signed-rank test, n=64). Panels a and d present pooled data from 2 independent biological replicates that yielded similar results when analyzed separately.
Protein regulators of compartmentalization
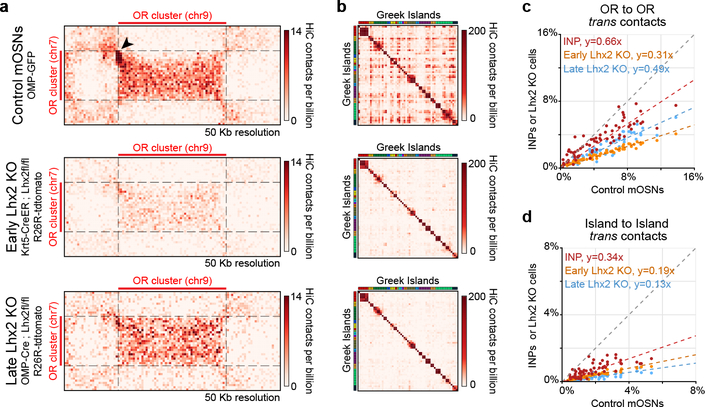
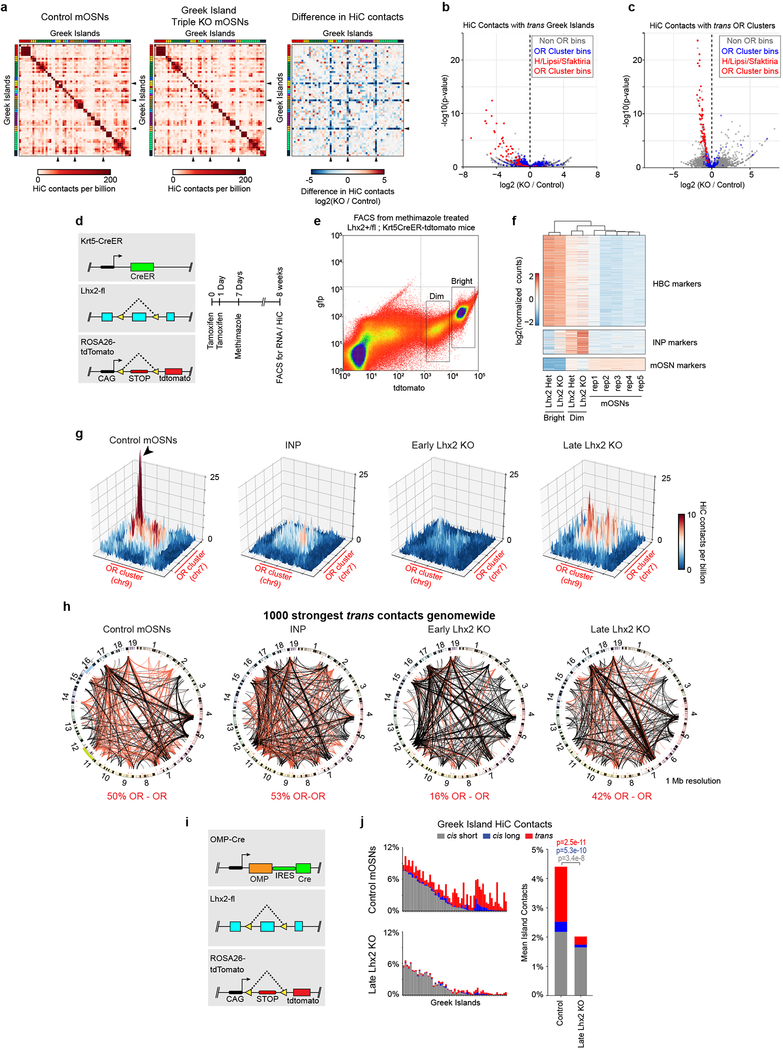
We then examined the role of Greek Island-bound transcription factors in OR compartmentalization. We deleted Lhx2 in HBCs, which were induced to differentiate with methimazole25,26. Using TdTomato intensity as a marker we identified two distinct cell populations, the dimmest of which is comprised of HBC-derived INPs and mOSNs (Extended Data Fig. 5d,e). RNA-seq of the FAC-sorted cells shows that early Lhx2 deletion caused a developmental delay in the OSN lineage and increase of INP-specific markers (Extended Data Fig.5f). With differentiation deficits and possible cell identity changes taken into account, trans OR and trans Greek Island contacts are strongly reduced in comparison to mOSNs and even INPs (Fig. 3a–d and Extended Data Fig. 5g). The frequency of interchromosomal interactions remains high in the early Lhx2 KO cells, yet OR-OR contacts represent only 16% of the 1000 strongest trans contacts (Extended Data Fig. 1e, 5h). Late Lhx2 deletion, in mOSNs7 (Extended Data Fig. 5i), also reduces trans OR contacts, but not as much as the early deletion (Fig. 3a,c). However, late Lhx2 deletion diminishes trans and long-range cis contacts between Greek Islands (Fig. 3b,d and Extended Data 5j), consistent with widespread OR downregulation7.
Figure 3: Lhx2 is essential for the formation of OR compartments and the assembly and stability of Greek Island hubs.
a, Pairwise views of HiC contacts between OR clusters located on different chromosomes in control (top), early Lhx2 KO (middle), and late Lhx2 KO (bottom) OSNs. A HiC hotspot between interacting Greek Islands in control mOSNs (arrowhead) is absent in both early and late Lhx2 KO cells. In addition, a strong reduction in the surrounding OR-OR contacts is observed in the early Lhx2 KO. b, Pairwise heatmap of Greek Island contacts reveals reduced HiC contacts across the full set of Greek Islands. c, Contacts made by each OR cluster (n=67) to OR clusters located in trans, expressed as fraction of the total HiC contacts, in mOSNs versus INPs, early, or late Lhx2 KO cells. Dashed line is a linear fit. d, same as c, but for trans contacts between Greek Islands (n=59). All panels present pooled data from 2 independent biological replicates that yielded similar results when analyzed separately.
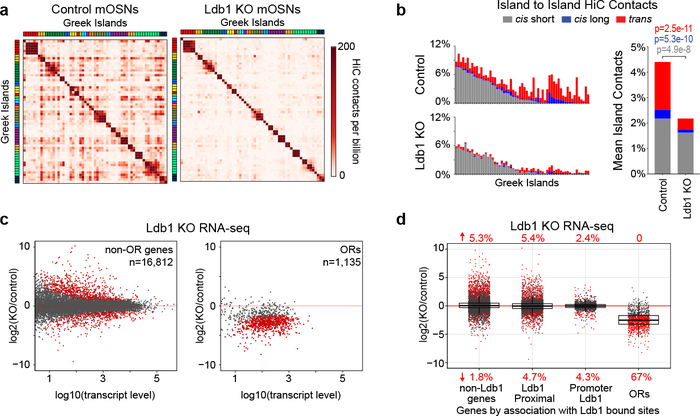
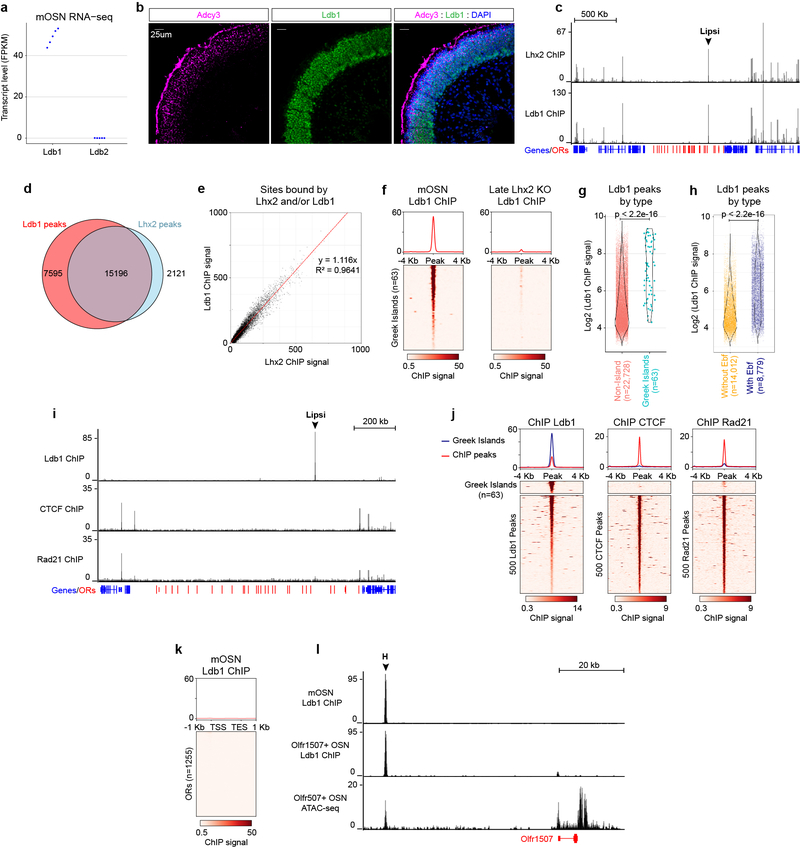
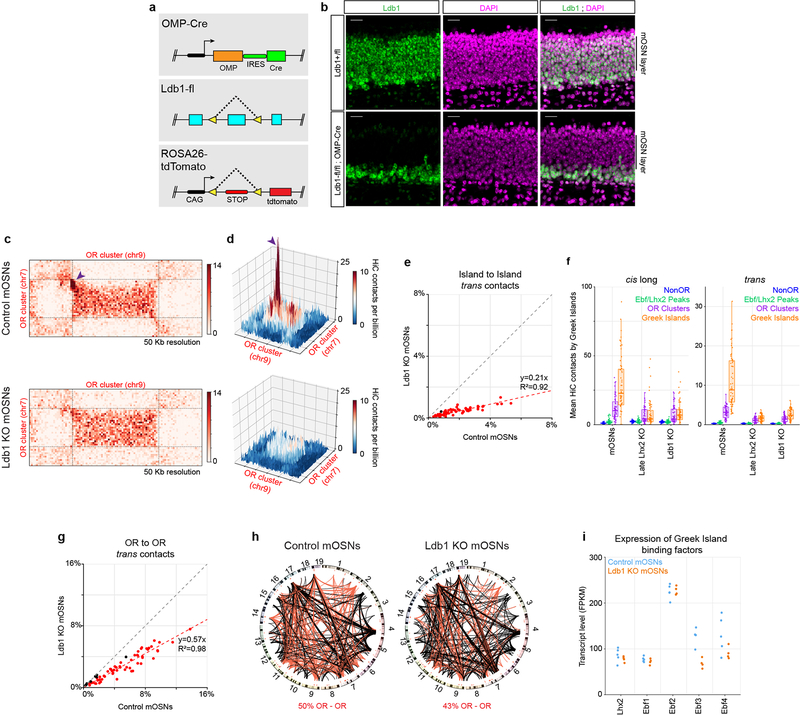
To decipher how Lhx2 stabilizes Greek Island contacts we asked if Lhx2, a LIM domain protein, recruits LIM domain binding proteins27,28 (Ldb1 and Ldb2), which are known mediators of long-range genomic interactions29–33. ChIP-seq for Ldb134, which is the only family member expressed in mOSNs (Extended data Fig. 6a,b), reveals close overlap with Lhx2 peaks in mOSNs (Extended data Fig. 6c–e). Consistent with this, every Greek Island is bound by Ldb1, in an Lhx2-dependent fashion (Extended data Fig. 6f). Greek Islands represent some of the strongest Ldb1 peaks in the genome, suggesting synergistic action of Lhx2 and Ebf in Ldb1 recruitment (Extended data Fig. 6g,h). Greek Islands and OR clusters are not bound by CTCF and Rad21 (Extended data Fig. 6i,j), which is not surprising given the inhibitory role of cohesin complexes in formation of genomic compartments35,36. Finally, there is very little Ldb1 signal on OR promoters (Extended data Fig. 6k), a result that holds true even for the active Olfr1507 promoter in Olfr1507+ OSNs (Extended data Fig. 6l). Ldb1 deletion in mOSNs (Extended data Fig. 7a,b) causes strong reduction in trans and long-range cis Greek Island interactions (Fig. 4a,b, Extended data 7c–f), a smaller decrease in the trans contracts between OR clusters (Extended data Fig. 7g,h), and even weaker genomewide effects in trans (Extended data Fig.1e). Importantly, RNA-seq shows that Ldb1 deletion causes widespread OR transcriptional downregulation (Fig. 4c) that appears highly restricted the OR gene family (Fig. 4d, Extended Data Fig. 7i).
Figure 4: Ldb1 is essential for the stability of Greek Island hubs and for OR transcription.
a, Pairwise heatmap of Greek Island contacts reveals broad reductions in HiC contacts in Ldb1 KO mOSNs. b, (left) For each Greek Island, the fraction of total HiC contacts made to other Greek Islands located in cis at short range (<5 Mb apart, grey), long range (>5Mb apart, blue), and in trans (red). Top panel represents control mOSNs and bottom panel Ldb1 KO cells. (right) The effect of Ldb1 KO on the mean fraction of HiC contacts across all Greek Islands (two-sided, paired Wilcoxon signed-rank test, n=59). c, RNA-seq analysis of gene expression in Ldb1 KO cells relative to control mOSNs. Significantly changed genes are colored red (padj < 0.05 for greater than 1.5-fold change, Wald test, n=5 for control mOSNs and n=4 Ldb1 KO). d, Effect of Ldb1 KO on genes not associated with Ldb1 ChIP peaks (n=9,548), genes located closest to a non-promoter Ldb1 ChIP-seq peak (n=5,624), genes with an Ldb1 ChIP-seq peak within the promoter region (n=1,640), and ORs (n=1,135). The percentage of significantly changed genes in each category is shown (padj < 0.05 for greater than 1.5-fold change, Wald test, n=5 for control mOSNs and n=4 Ldb1 KO). Box indicates median, upper, and lower quartiles while whiskers indicate 1.5 * the interquartile range. Panels a and b present pooled data from 2 independent biological replicates that yielded similar results when analyzed separately.
Greek Island hubs contact only the active OR
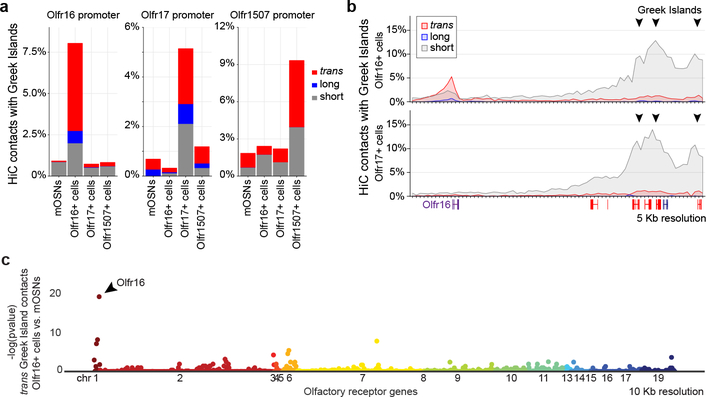
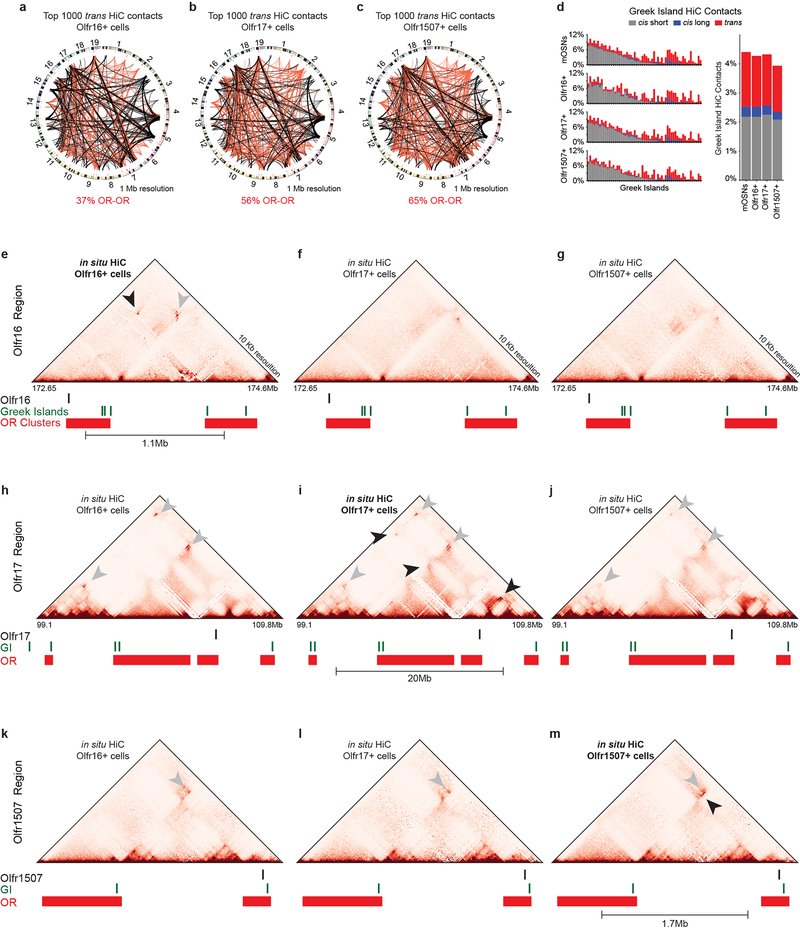
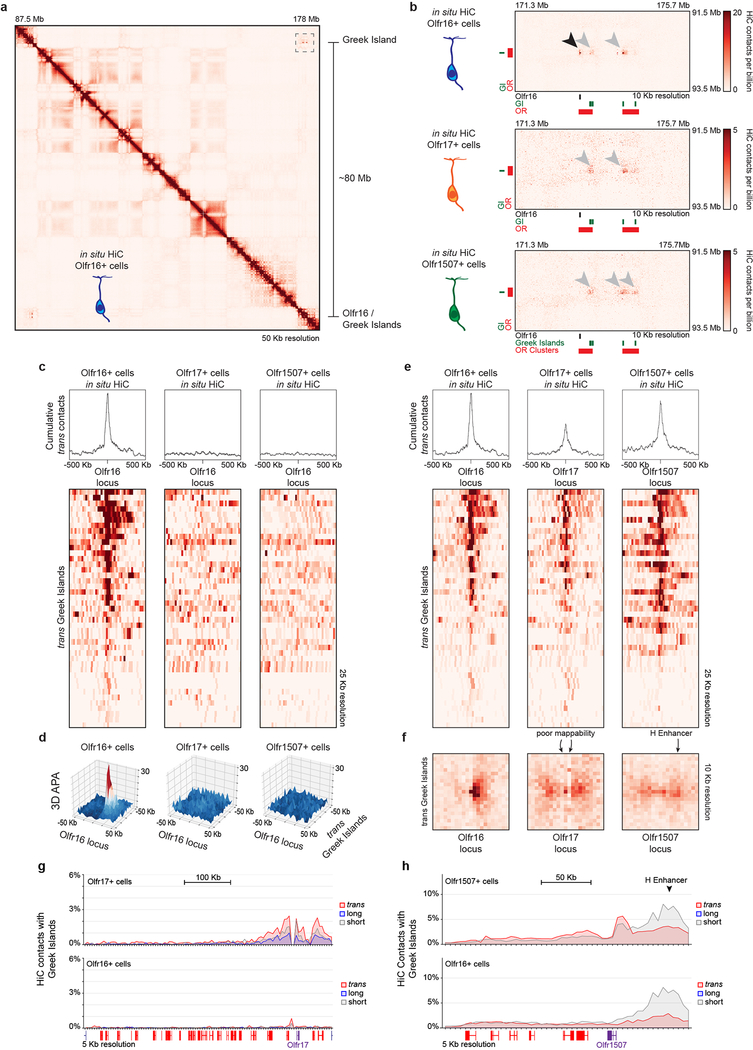
To test if Greek Island hubs regulate OR transcription by direct interaction with the chosen OR we performed in situ HiC in OSNs expressing ORs, Olfr16, 17 and 1507. In these OSN populations the overall network of OR cluster and Greek Island interactions is largely the same (Extended Data Fig. 8a–d), but OSN type-specific variability is also observed (Extended Data Fig. 8e–m, 9a,b). However, in each OSN type the transcriptionally active OR consistently forms frequent interactions with Greek Islands. For example, in Olfr16+ OSNs the Olfr16 locus interacts strongly (5% of the total HiC contacts mapped on Olfr16) with long-range cis and trans Greek Islands (Fig. 5a,b, Extended data Fig. 9c,d), whereas in Olfr17+ and Olfr1507+ OSNs it primarily interacts with nearby Greek Islands (Fig. 5a,b). Importantly, in Olfr16+ cells, Greek Island contacts are enriched specifically over the Olfr16 locus (Fig. 5b) relatively to the full OR repertoire (Fig. 5c). Thus, in situ HiC accurately identifies the transcriptionally active OR from a pool of >1000 genes through its cumulative interactions with Greek Islands (Fig. 5c and Extended data Fig. 9e–h).
Figure 5: Greek Island hubs interact specifically with the transcriptionally active OR locus.
a, Increased contacts between the active OR promoter and Greek Islands located in short range cis (<5Mb, grey), long range cis (>5Mb, blue) and trans (red). Greek Island interactions are expressed as the fraction of the total HiC contacts mapped to each promoter (5 Kb resolution). b, Profile of the OR cluster containing Olfr16 reveals increased contacts, expressed as fraction of the total HiC contacts mapped to each position (5 Kb resolution), between the Olfr16 locus and Greek Islands in Olfr16 expressing cells. c, Manhattan plot of Greek Island contacts with OR genes reveals that in Olfr16+ cells the Olfr16 locus is the OR gene most significantly enriched for Greek Island contacts relative to heterogeneous mOSNs (see Extended Materials and Methods). All panels present pooled data from 2 independent biological replicates that yielded similar results when analyzed separately.
Discussion
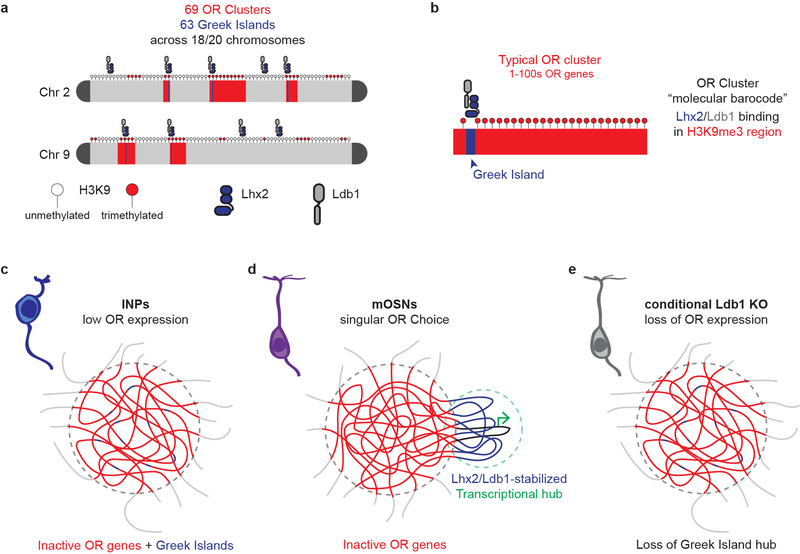
Our experiments reveal new types of genomic compartments with multi-chromosomal composition and extraordinary exclusivity. Genomic compartments represent more complex assemblies than segregation products of transcriptionally active and inactive chromatin15,37. However the demonstration that >1000 genes from 18 chromosomes form exclusive compartments, implies a precisely regulated process comparable with the assembly of the nucleolus38. Unlike the nucleolus, however, OR compartments and Greek Island hubs are regulated by proteins with widespread binding in the OSN genome. Absent of an OR-specific factor that would explain the specificity of OR contacts, we propose that Lhx2/Ebf/Ldb1-bound Greek Islands and OR heterochromatin create a unique molecular “barcode” that assembles OR-specific compartments. These heterochromatic compartments through phase separation properties of Hp139,40 may achieve efficient OR silencing, but they also confine in close proximity Greek Islands from different chromosomes6,8, forcing them to interact. As proposed for super-enhancers41,42, this confinement may promote an adjacent euchromatic phase consisted of locally concentrated activators. Where the two phases incompatible, the Greek Island hub would insulate the active OR allele from the surrounding repressive environment, resulting in stable OR choice (Extended data Fig. 10). Given that this multi-chromosomal super-enhancer interacts only with the single chosen OR and its disruption perturbs OR transcription, interchromosomal interactions emerge as essential regulators of OR transcription6,7,43. This concept of trans enhancement was initially challenged by the cis-only effects of enhancer deletions18,44,45. However, the demonstration that Greek Islands promote OR compartmentalization and recruit trans Greek Islands towards proximal ORs, explain why these elements are essential cis but redundant trans enhancers. With long-range genomic interactions been implicated in transcriptional stochasticity12,46,47, cell type specific interchromosomal contacts may serve as an additional generator of molecular diversity.
Methods
Mice
Mice were treated in compliance with the rules and regulations of IACUC under protocol number AC-AAAT2450. Mice were sacrificed using CO2 followed by cervical dislocation. Both male and female mice were used for experiments. All experiments were performed on dissected olfactory epithelium tissue or on dissociated cells prepared from whole olfactory epithelium tissue. Dissociated cells were prepared using papain (Worthington Biochemical) and FAC sorted as previously described7.
This study used several mouse lines to allow isolation of cells at specific stages of olfactory sensory neuron (OSN) development, OSNs that express one of three specific olfactory receptors, and cells with specific targeted mutations. Mature OSNs (mOSNs) were sorted from Omp-IRES-GFP mice48. Neural progenitors (INPs) were isolated by sorting the brightest of two GFP populations from Ngn1-GFP mice2. The dim population of Ngn1 cells represents a more mature population of OSNs, as determined by RNAseq (data not shown). Multipotent olfactory progenitors (horizontal basal cells) were isolated by injecting perinatal Krt5-CreER49;B6N.129S6-Gt(ROSA)26Sortm1(CAG-tdTomato*,-EGFP*)Ees/J mice50 with tamoxifen 24 and 48 hours before sorting GFP-positive, tdTomato-negative cells. Olfr17+ cells were sorted from Olfr17-IRES-GFP48 mice. Olfr1507+ cells were sorted from Olfr1507-IRES-GFP mice48. Olfr16+ cells were sorted from Olfr16-IRES-tauGFP (Olfr16tm2Mom)51. Triple enhancer knockout mice were generated by crossing mice bearing 3 individual Greek Island deletions (H38, Lipsi5, Sfaktiria) and Omp-IRES-GFP and sorting for GFP+ mature OSNs. The Sfaktiria deletion was generated by Biocytogen using TALENs to target the region chr6:42869802–42870400 (mm10).
Conditional deletion of Lhx2 early in mOSN differentiation was achieved by crossing Lhx2 conditional allele mice to mice bearing Krt5-CreER and Cre-inducible tdTomato (ROSA26-tdtomato, Gt(ROSA)26Sortm14(CAG-tdTomato)Hze/J). At 6-weeks of age, deletion of the conditional allele in horizontal basal cells was induced by two intraperitoneal injections of tamoxifen twenty-four hours apart. One week later, differentiation of horizontal basal cells into olfactory cell types was induced by intraperitoneal injection with methimazole, which triggers ablation of olfactory epithelium and regeneration of the tissue from horizontal basal cells. The olfactory epithelium was allowed to regenerate for 8-weeks, producing bright TdTomato+ cells that localized to the basal (HBCs) and apical (Sustentacular cells) layers of the MOE, and dim TdTomato+ cells that populate the neuronal cell layers of the MOE. FACS of the bright and dim populations separately, followed by RNA-seq confirms that the dim cell population is comprised mostly of mOSNs and INPs (Extended data Fig.6a–c)
Conditional alleles were deleted specifically in mOSNs using OMP-ires-Cre52 mice. Conditional deletion of Lhx2 in mOSNs was achieved by crossing Lhx2 conditional allele mice53 (Lhx2-fl: Lhx2tm1Monu) and Cre-inducible tdTomato to OMP-Cre. Similarly, conditional deletion of Ldb1 in mOSNs was achieved by crossing Ldb1 conditional allele mice54 (Ldb1-fl: Ldb1tm2Lmgd) with Cre-inducible tdTomato and OMP-Cre. Recombined cells were purified by selecting tdTomato positive cells by FACS.
Fluorescence activated cell sorting
Cells were dissociated into a single-cell suspension by incubating freshly dissected main olfactory epithelium with papain for 40min at 37°C according to the Worthington Papain Dissociation System. Following dissociation and filtering three times through a 35μm cell strainer, live cells were sorted by collecting fluorescent, DAPI-negative cells for RNA-seq and ATAC-seq. Alternatively, cells were fixed with 1% PFA in PBS for 5 minutes (ChIP) or 10 minutes (HiC) at room temperature. Fixed fluorescent cells were then sorted on a BD Aria II, BD Influx, or Beckman Coulter MoFlo Astrios EQ cell sorter.
Representative FACS plots for the cells used in this study are available at https://data.4dnucleome.org/search/?lab.display_title=Stavros%20Lomvardas%2C%20COLUMBIA&protocol_type=Cell%20sorting%20protocol&type=Protocol
in situ Hi-C
Depending on the genotype, between 20 thousand and 3 million cells were used for in situ Hi-C. Sorted cells were lysed and intact nuclei were processed through an in situ Hi-C protocol as previously described15 with a few modifications. Briefly, cells were lysed with 50mM Tris pH 7.5 0.5% Igepal, 0.25% Sodium-deoxychloate 0.1% SDS, 150mM NaCl, and protease inhibitors. Pelleted intact nuclei were then resuspended in 0.5% SDS and incubated 20min 65°C for nuclear permeabilization. After quenching with 1.1% Triton-X for 10min at 37°C, nuclei were digested with 6U/μl DpnII in 1x DpnII buffer overnight at 37°C. Following initial digestion, cells were pelleted (2500g 5min), buffers were replenished to original concentrations and fresh DpnII was added at 37°C for an additional 2 hours of digestion. Following digestion, the restriction enzyme was inactivated at 65°C for 20min. For the 1.5hr fill-in at 37°C, biotinylated dGTP was used instead of dATP to increase ligation efficiency. Ligation was performed at 25°C for 4 hours with rotation. Nuclei were then pelleted and sonicated in 10mM Tris pH 7.5, 1mM EDTA, 0.25% SDS on a Covaris S220 for 16min with 2% duty cycle, 105 intensity, 200 cycles per burst, 1.8–1.85 W, and max temperature of 6°C. DNA was reverse cross-linked overnight at 65°C with proteinase K and RNAse A. Each experiment was performed in biological replicates.
HiC Library preparation and sequencing
Reverse cross-linked DNA was purified with 2x Ampure beads following the standard protocol and eluting in 300μl water. Biotinylated fragments were enriched as previously described using Dynabeads MyOne Strepavidin T1 beads. The biotinylated DNA fragments were prepared for next-generation sequencing directly on the beads by using the Nugen Ovation Ultralow kit protocol with some modifications. Following end repair, magnetic beads were washed twice at 55°C with 0.05% Tween, 1M NaCl in Tris/EDTA pH 7.5, instead of heat-inactivating end-repair enzymes. Residual detergent was removed by washing beads twice in 10mM Tris pH 7.5. End repair buffers were replenished to original concentrations, but the enzyme and enhancer was omitted before adapter ligation. Following adaptor ligation, beads underwent 5 washes with 0.05% Tween, 1M NaCl in Tris/EDTA pH 7.5 at 55°C and two washes with 10mM Tris pH 7.5 to remove ligation enzymes and buffers. DNA was amplified by 10 cycles of PCR. Beads were reclaimed and amplified unbiotinylated DNA fragments were purified with 0.8x Ampure beads. Quality and concentration of libraries were assessed by Agilent Bioanalyzer and KAPA Library Quantification Kit. HiC libraries were sequenced paired-end on NextSeq 500 (2×75bp), or NovaSeq 6000 (2×150bp).
A full protocol and gel electrophoresis of a typical HiC experiment is available at https://data.4dnucleome.org/search/?lab.display_title=Stavros+Lomvardas%2C+COLUMBIA&protocol_type=Experimental+protocol&type=Protocol
Hi-C data processing pipeline
Raw fastq files were processed through use of the Juicer Tools Version 1.76 pipeline55 with one modification. Reads were aligned to mm10 using BWA 0.7.17 mem56 algorithm and specifying the −5 option implemented specifically for Hi-C data. The −5 option always takes the leftmost alignment (5’) on a read as the primary read. This alignment gets its own alignment score independent of subsequent alignments. Following alignment, independently mapped reads are merged to generate chimeric reads. After reads are aligned, merged, and sorted, chimeras are de-duplicated and finally HiC contact matrices are generated by binning at various resolutions and matrix balancing. Importantly, all reads mapping to multiple locations are discarded as “chimeric ambiguous reads”. To remove multi-mappers, we used a stringent cutoff of MAPQ > 30. All data used in this paper, including data generated by other groups, was aligned in this way.
Hi-C data analysis
HiC matrices used in this paper were matrix-balanced using Juicer’s built-in Knight-Ruiz (KR) algorithm. Where noted, values were instead normalized to target counts/total HiC contacts for that bin at a specified resolution (e.g. percent OR contacts/total HiC contacts per bin). This accounts for sequencing and alignment depth of a given bin. Matrices were graphed using pandas, seaborn and matplotlib57–59 packages for python, or R-Studio Server (R version 3.5.1).
Genome wide Hi-C maps were constructed from KR-normalized matrices at 1Mb resolution and normalized to library size. The maximum value of the color scale was set to 1000 reads per billion HiC contacts per 1Mb bin.
Cumulative interchromosomal contacts at the resolutions noted in the text were constructed by calling Juicer Tools dump to extract genome wide un-normalized data from a .hic file. Subsequently, single-ended bins for regions of interest were selected for genome wide interchromosomal counts. Counts pertaining to a particular bin were divided by the total HiC contacts sequenced for the respective bin. These normalized counts were then aggregated per genomic bin to construct a bedGraph and visualized using Integrated Genome Browser60. Alternatively, all bins contacted by a bin of interested were categorized by genomic location (e.g. Greek Islands overlapping, OR Cluster overlapping, intergenic Ebf/Lhx2 peak overlapping) and then counts were aggregated by category. For 50 Kb and 25 Kb analyses only the bin directly overlapping a feature (e.g. a Greek Island) was assigned to that category. For 5 Kb resolution analyses the bin containing a feature and the 2 bins directly upstream and downstream were assigned to that feature category. Aggregate counts were converted to fraction of HiC contacts by dividing by the total number of HiC contacts made by the bin of interest. Mean counts per interaction was determined by dividing the aggregate counts for each category (e.g. Greek Island overlapping, OR Cluster overlapping, etc.) by the number of bins matching that category present in cis or in trans.
Aggregate Peak Analysis (APA) was done through the use of Juicer Tools. Normalized APA matrices were graphed with the maximum scale set to 5 times the mean of the matrix.
OR gene cluster contact matrices were constructed by extracting pairwise contacts between OR gene cluster bins and dividing by the area (size of cluster 1 × size of cluster 2) of the respective pairwise OR gene cluster interaction. The logarithm of these values was then taken to account for the strength of cis interactions and plotted.
Specific OR gene cluster contacts were constructed through programmatic access to .hic files using straw for python. These matrix files can also be used to form 3-dimensional contour maps with the same software to better visualize the focal peaks in the contact matrix. KR-normalized matrix values were further normalized by dividing by HiC library size for directly comparing samples.
For box plots quantifying the strength of interchromosomal interactions, the box indicates median and upper and lower quartiles while whiskers indicate 1.5 * the interquartile range. Outliers are not shown.
DESeq2 was used to detect differences between conditions for individual sites61. A similar approach has previously been used to analyze count data from 4C-seq62. The raw, un-normalized number of HiC contacts mapping to OR clusters located in trans or to Greek Islands located in trans was determined for every region of the genome at a given resolution (25 Kb bins). For each condition, counts from two biological replicates were analyzed using DESeq2. Regions with zero counts in any condition were excluded. DESeq2 identifies regions where the observed change in counts between conditions is significantly greater than amount of change expected based upon an analysis of variance between replicates. For the analysis of Triple Enhancer Knockout mOSNs compared to control mOSNs (Figure 3, 25 Kb resolution) a total of 22 regions out of 84,592 were found to have significantly changed counts for trans Greek Island contacts (padj < 0.05). 21 of these 22 regions map to the OR clusters containing the deleted Greek Islands. Similarly, 117 regions show a significant change in trans OR cluster contacts, 62 of them map to OR clusters, and 60 out of those 62 correspond to the OR clusters containing the deleted Greek Islands.
Compartment analysis
A Hidden Markov Model was used to assess the presence of genomic compartments as previously described15,35 with some minor changes. Briefly, a square matrix of odd vs even chromosome contacts is made (i.e. interchromosomal). Using 2–19 components, HMMs are constructed for odd vs. even chromosomes and a score is calculated using hmmlearn63‘s built-in score to ascertain the likelihood of the given number of compartments. The same was done for even vs. odd after transposing the matrix. The mean value of a genomic region for a given component (or compartment) was used to construct a bedGraph and visualized with the genome browser. Notably, Rao et al discarded genomic regions with less than 70% of the column filled. We opted to keep all rows because we noticed that many of the specific compartments we are observing (e.g. OR compartment, Greek Island compartment) are inherently sparse in genomic regions not corresponding to their compartment of choice. Throwing out these regions would select for nonspecific (or noisy) compartments.
in vitro BAC HiC
We performed an in vitro HiC on BAC clone RP23–374F2, a 165kb clone containing mostly OR sequences but also non-OR sequences. The HiC protocol is analogous to our experimental HiC. Briefly, we digested the BAC clone with DpnII, filled-in overhangs with DNA Pol I Klenow Fragment, performed a blunt-end ligation with T4 ligase, and sonicated to 300 bp with a Covaris sonicator. In this scenario, we would generate artificial “cis” HiC contacts when run through our HiC pipeline without the presence of “trans” contacts generated by mismapping.
in silico HIC
To address potential mapping issues by an orthogonal computational approach, we performed in silico HiC. DNA sequences corresponding to 4 of the largest OR Clusters (chr2:36252272–37350072; chr2:85196700–90429754; chr9:18512886–20345134; chr9:37669223–40192314), totaling over 10.5Mb of DNA sequences were retrieved and separately processed through an in silico HiC pipeline. In order to emulate digestion by DpnII, DNA sequences were split at GATC stored along with their reverse complements. Each “digested” string was joined with another “digested” string in both the forward and reverse complement orientations with a joining “GATCGATC” in order to emulate the fill-in and ligation. These chimeras, ranging in size from 10s of basepairs to > 4000bp (mode: ~600) were randomly truncated to 300bp to emulate our average library size after shearing and library prep. Following shearing, only fragments with “GATCGATC” were stored, in accordance with experimental biotin pulldown. We then took the first and last 75bp of these strings and wrote them to separate files for each read of the paired end reads. Lastly, to best recapitulate sequencing errors and biases, we used fastq scores from the mOSN HiC experiment used in this manuscript. Following generation of in silico HiC fastqs, we aligned our data using same pipeline we used for all of our datasets.
Chromatin Immunoprecipitation
See ChIP-seq tab of Supplementary Information 1 for a summary of ChIP-seq sequencing data. Chromatin Immunoprecipitation (ChIP) experiments were carried out as previously described7. Briefly, 600,000 – 2 million FACS purified cells were used for each experiment. Sheared chromatin was prepared from FACS purified cells using a Covaris S220 Focused-ultrasonicator. ChIP was performed using antibodies for CTCF (Millipore Cat# 07–729, RRID:AB_441965), Rad21 (Abcam Cat# ab992, RRID:AB_2176601), or Ldb1 (Santa Cruz Biotechnology Cat# sc-11198, RRID:AB_2137017). ChIP-seq libraries were prepared using the Nugen Ovation Ultralow Library System v2 (Nugen Cat# 0344–32). All data sets were processed using 50bp of single end; 75bp reads were trimmed to 50bp and only read 1 was used from paired end data. Adapter sequences were removed from raw ChIP-seq data using CutAdapt v1.17 (RRID:SCR_011841) and filtered reads were aligned to the mouse genome (mm10) using Bowtie264 v2.3.2 (RRID:SCR_006646) with default settings. Picard (RRID:SCR_006525) was used to identify duplicate reads, which were then removed with Samtools65 v1.4.1 (RRID:SCR_002105). Samtools was used to select uniquely aligning reads by removing reads with alignment quality alignments below 30 (-q 30). Peaks of ChIP-seq signal were identified using HOMER66 v4.10.3 (RRID:SCR_010881) in “factor” mode with an input control. Consensus peak sets were generated by selecting peaks that overlapped in at least two biological replicates and extending them to their combined size. Bedtools267 v2.26.0 was used to compare peak sets.
For signal tracks, biological replicates were merged and HOMER was used to generate 1bp resolution signal tracks normalized to a library size of 10,000,000 reads. Values in all ChIP-seq signal plots are counts per 10 million reads. Plots of ChIP-seq signal over individual loci were generated using the UCSC Genome Browser. Deeptools268 v3.1.1 was used to generate ChIP-seq heatmaps and mean signal plots. For heatmaps, each row of the heatmap is an 8kb region centered on a Greek Island or ChIP-seq peak for the factor shown. For heatmap in Figure 5b, all Greek Islands are shown alongside 500 randomly selected ChIP-seq peaks for each factor. For Figure 5c, each row corresponds to an OR gene with showing 1 Kb upstream of the transcriptional start site, 1 Kb downstream of the transcriptional end site, and the gene body scaled to 2 Kb. Signal plots present average data for all regions each set. Heatmaps are sorted by mean signal
DiffBind69 v2.8.0 was used to calculate ChIP-seq signal in each peak. For this analysis, Diffbind was used to normalize ChIP-seq scores across biological replicate experiments using the “DBA_SCORE_TMM_READS_EFFECTIVE” scoring system, which normalizes using edgeR and the effective library size. The ChIP-seq signal for each peak was then calculated by averaging the normalized score across biological replicates.
ATACseq
ATAC-seq data were analyzed as previously described7.
RNA-seq
See RNA-seq tab of Supplementary Information 2 for a summary of RNA-seq sequencing data. RNA-seq experiments were conducted as previously described. Briefly, RNA was extracted from FACS purified cells using Trizol and libraries were prepared using Illumina TruSeq Stranded RNA-seq Gold kits. All data sets were processed using 50bp of single end; 75bp reads were trimmed to 50bp and only read 1 was used from paired end data. CutAdapt was used to remove adapter sequences from raw sequencing data and then filtered reads were aligned to the mouse genome (mm10) using STAR70 v2.5.3a. Samtools was used to select uniquely aligning reads by removing reads with mapping quality below 30 (-q 30). RSeQC71 v2.6.4 (RRID:SCR_005275) was used to generate RNA-seq signal tracks with signal normalized to a library size of 10,000,000 reads. RNA-seq data analysis was performed in R with the DESeq261 v1.20.0 package. Very low abundance transcripts (genes with fewer than 10 counts combined across all samples) were excluded. DESeq2 was used to calculate normalized counts (regularized log transformed), FPKM values, Log2 fold change values, p-values, and p-values adjusted for multiple comparisons.
Immunofluorescence
MOE was dissected from 6-week Ldb1 KO (Ldb1fl/fl;OMPcre) mice and littermate controls. MOE tissue was embedded in OCT and then coronal cryosections were collected at a thickness 12uM. Tissue sections were prepared and stained as previously described7. Tissue sections were stained with primary antibodies for Ldb1 (1:1000 dilution, Santa Cruz Biotechnology Cat# sc-11198, RRID:AB_2137017) and Adcy3 (1:200 dilution, Santa Cruz Biotechnology Cat# sc-588, RRID:AB_630839). DNA was labeled with DAPI (2.5ug/mL, Thermo Fisher Scientific Cat# D3571). Primary antibodies were labeled with the following secondary antibodies: for Ldb1, anti-goat IgG conjugated to Alexa-488 (2ug/mL, Thermo Fisher Scientific Cat# A-11055, RRID:AB_2534102), for Adcy3, anti-rabbit IgG conjugated to Alexa-555 (2ug/mL, Thermo Fisher Scientific Cat# A-31572, RRID:AB_162543). Confocal images were collected with a Zeiss LSM 700 and image processing was carried out with ImageJ (NIH).
Statistics
A sample size of two independent biological replicates was selected for high throughput sequencing experiments. This size was selected because the large number of genes/loci measured in high throughput sequencing data sets allows the analysis and modeling of dispersion and variance within and between replicates, thereby allowing the identification of genes/loci with significant differences between conditions using a limited number of replicates. When possible, additional biological replicates were included.
For ChIP-seq, statistically significant peaks were identified using HOMER on each replicate of each experiment. Candidate peaks were selected by setting a read count threshold based upon an input control false discovery rate of 0.001, and then peaks were filtered based upon the following criteria: Poisson p-value over input < 1.00e-04 and Poisson p-value over local region < 1.00e-04. Consensus peak sets were then generated by selecting peaks that overlapped in at least two biological replicates. A two-tailed Wilcoxon rank-sum test was used to determine whether there was a significant difference in the median ChIP-seq peak strength between sets of peaks. For RNA-seq, five biological replicates of Control mOSNs, four biological replicates of Triple Enhancer KO, and four biological replicates of Ldb1 KO mOSNs were analyzed with DESeq2, which generates two-tailed Wald test p-values, and generates adjusted p-values using the Benjamini-Hochberg method. For HiC data, two independent biological replicates were generated for each condition and analyzed separately. Individual biological replicates yielded similar results and were pooled for the analyses presented here. A paired, two-tailed Wilcoxon rank-sum test was used to determine whether the mean frequency of HiC contacts for the set of Greek Islands was different between conditions.
Extended Data
Extended Data Figure 1: HiC on FAC-sorted primary cells from the MOE reveals extensive interchromosomal interactions between OR clusters.
a, Table summarizing all HiC experiments in this manuscript separated by biological replicates. The total number of HiC contacts in each replicate and the total number of interchromosomal (trans) HiC contacts are shown. b-d, HiC contact curves for wild-type conditions (b), for wild-type and mutant MOE populations (c), and for cells sorted based upon the expression of specific OR genes (d). All panels present pooled data from 2 independent biological replicates that yielded similar results when analyzed separately. e, graphs showing the proportion of trans HiC contacts between replicates of each genotype and cell type. Pooled data from publicly available data sets is shown for ES cells72, B cells15, and cortical neurons73. f, same as e, but showing the median fraction of HiC contacts made to trans OR clusters for OR cluster regions divided into 50 Kb bins. g, Machine learning Hidden Markov Model (HMM) score for a given number of compartments (see Extended Materials and Methods). 9 compartments were used for further analysis. h, From the 9 HMM-derived compartments, one includes predominantly OR clusters (magenta, bottom panel) and overlaps with OR compartments defined by biased analysis of trans OR contacts (black top panel). OR gene clusters depicted in red. Scale on the biased analysis represents the percentage of HiC contacts mapped to trans OR clusters (pooled data from 2 biological replicates). Scale in the HMM-derived compartments represents the average value of a given locus in a given compartment. i, Circos plots depicting the strongest 1000 interchromosomal interactions genomewide at 1 Mb resolution in mOSNs. Red lines represent OR-to-OR contacts and black lines non-OR-to-non-OR contacts. Line thickness increases with contact frequency. Chromosome numbers depicted at the periphery of the circle.
Extended Data Figure 2: Extensive interchromosomal contacts form between OR gene clusters over OSN differentiation.
a-i, In situ HiC contact matrix of chromosomes 2 and 9, Aggregate Peak Analysis (APA), and Circos plot depicting the strongest 1000 interchromosomal interactions genomewide for mOSNs (a-c), INPs (d-f), and HBCs (g-i). All three sets of analyses reveal an increase in trans OR cluster interactions over the course of differentiation. j, For OR gene clusters (divided into 50 Kb bins, n=768 bins) the frequency of cis short (<5Mb distance, including self), cis long (>5 Mb), and trans contacts with OR clusters is shown, expressed as the fraction of total HiC contacts mapped to each bin. k, Number of HiC contacts, normalized to a library size of one billion HiC contacts genomewide, observed for each OR cluster region (divided into 50 Kb bins, n=768 bins) in HBCs, INPs, mOSNs, ES cells, B cells, and cortical neurons. l-n, For OR cluster regions (divided into 50 Kb bins, n=768 bins), the fraction of total HiC contacts that are made to ORs clusters located in short range cis (l), long range cis (m) and trans (n). o, The 6 most distinct HMM-derived compartments of chromosome 2 in HBCs (green, left), INPs (blue, middle) and mOSNs (magenta, right). OR clusters emerge as distinct compartment in INPs and strengthen in mOSNs. For all boxplots, box indicates median, upper, and lower quartiles while whiskers indicate 1.5 * the interquartile range. All panels present pooled data from 2 independent biological replicates that yielded similar results when analyzed separately.
Extended Data Figure 3: In vitro and in silico HiC experiments show that OR HiC contacts are generated by unique sequences that do not map to other OR clusters.
a, Contact matrix from in vitro HiC (top) using a 165Kb BAC plasmid containing 7 OR genes from an OR cluster from chromosome 1 and in situ HiC from mOSNs (bottom). HiC contacts in the BAC HiC are restricted to the coordinates of the BAC plasmid and do not extend to two OR genes from this cluster that are absent from the BAC. b, Virtual 4C from the 165 Kb BAC region to chromosome 2, which contains the highest number of OR genes. On top, virtual 4C from the BAC in vitro HiC shows that no reads mapped to ORs from chromosome 2, whereas the same 165 Kb regions makes abundant trans contacts with these ORs in mOSNs. c, 99.3% of all the BAC HiC contacts map within the BAC, whereas in mOSNs only 21.7% of the BAC region HiC contacts map within the BAC. d, In silico HiC analysis shows complete absence of mis-mapped reads corresponding to OR clusters under the mapping conditions used throughout the manuscript (removing mapq<30). Each OR cluster was subjected to intra-cluster in silico HiC (g) and then the HiC contacts of the 69 OR clusters were mapped in aggregate to the whole genome. As seen in the contact matrix from chromosomes 2 and 9(d), the in silico reads only map within clusters, with no mis-mapped reads that would erroneously be interpreted as inter-cluster cis or trans contacts. e, For reference, the corresponding in situ HiC from mOSNs. f, Aggregate analysis for all 69 OR gene clusters shows that our mapping protocol does not mis-map any HiC contacts to the wrong OR cluster. g, Brief description of the pipeline used for the in silico analysis.
Extended Data Figure 4: Greek Islands make differentiation-dependent contacts with other Greek Islands in trans that are stronger than cis contacts with Lhx2/Ebf peaks.
a-b, Heatmap and 3D projection of HiC contacts between a pair of OR gene clusters in cis (a) and trans (b) reveals a local maximum of in situ HiC interactions between Greek Island loci (arrowheads) in mOSNs. c-f, Same as a, b but for immediate neuronal precursors (INPs) and Horizontal Basal Cells (HBCs). g, For chromosome 2, fraction of all HiC contacts made to trans Greek Islands in mOSNs (top), INPs (middle) and HBCs (bottom). h, For each Greek Island, the distribution of HiC contacts, expressed as contacts per billion, made to individual Greek Islands located in trans for HBCs, INPs and mOSNs. Box indicates median, upper, and lower quartiles while whiskers indicate 1.5 * the interquartile range. For each Greek Island, the number of trans Greek Islands is listed. i, (left) Comparison of the total fraction of HiC contacts made by each Greek Islands to intergenic Lhx2/Ebf co-bound peaks present in cis versus Greek Islands present in trans for HBCs, INPs and mOSNs. For each category we compare roughly equal numbers of peaks (number of trans Greek Islands for each Island versus number of cis Lhx2/Ebf sites for each Island, mean+/− standard deviation). (right) Mean fraction of HiC contacts across all Greek islands (two-sided, paired Wilcoxon signed-rank test, n=59). Contacts with trans Greek Islands (red) constitute a higher fraction of HiC contacts than short-range cis (dark blue) or long-range cis (light blue) contacts with intergenic Lhx2/Ebf peaks. All panels present pooled data from 2 independent biological replicates that yielded similar results when analyzed separately.
Extended Data Figure 5: Greek Islands and Lhx2 are required for OR compartmentalization in developing OSNs.
a, Pairwise HiC contacts between all pairs of Greek Islands ordered by genomic position in Control (left) and Greek Island Triple KO (right) mOSNs. The 50 Kb regions containing the deleted Greek Islands are marked with arrowheads. Plotting the log2 fold difference in HiC contacts (right) reveals that consistent strong reductions are observed for the deleted Islands. Color bar depicts chromosome. b,c, The genomic regions exhibiting the most significant reductions in HiC contacts with trans OR Greek Islands (b) or trans OR clusters (c) in Triple KO mOSN relative to control mOSNs are mostly located within the 3 OR clusters containing the with Greek Island deletions (two biological replicates per condition, see Extended Materials and Methods). d, Genetic and experimental strategy for early Lhx2 deletion. Tamoxifen induction with Krt5CreER deletes Lhx2 in HBCs and then methimazole treatment ablates INPs/mOSNs, leading to regeneration from Lhx2-deleted HBCs. e, fluorescent labeling of the HBC-derived cells upon methimazole induction reveals two major populations, bright and dim. f, By RNA-seq the dim population expresses markers of INPs and mOSNs while the bright population expresses markers of HBCs. Counts are normalized by row. g, 3-D projection of HiC contacts between OR clusters located on different chromosomes in control mOSNs (left), INPs, early Lhx2 KO, and late Lhx2 KO (right) cells. A HiC hotspot between interacting Greek Islands is only observed in control mOSNs (arrowhead). In addition, a strong reduction in the surrounding OR-OR contacts relative to mOSNs or INPs is observed in the early Lhx2 KO. h, Circos plots depicting the strongest 1000 interchromosomal interactions genomewide at 1 Mb resolution in mOSNs (left), INPs, early Lhx2 KO cells, and late Lhx2 KO cells (right). Red lines represent OR-OR contacts and black lines non-OR-non-OR contacts. Line thickness increases with contact frequency. Chromosome numbers depicted at the periphery of the circle. i, Genetic strategy for late Lhx2 deletion and fluorescent marking of Lhx2 KO mOSNs. j, (left) For each Greek Island, the fraction of total HiC contacts made to other Greek Islands located in cis at short range (<5 Mb apart, grey), long range (>5Mb apart, blue), and in trans (red). Top panel represents control mOSNs and bottom panel late Lhx2 KO cells. (right) The effect of late Lhx2 KO on the mean fraction of HiC contacts across all Greek Islands (two-sided, paired Wilcoxon signed-rank test, n=59).
Extended Data Figure 6: Ldb1 expression and genomic distribution in mOSNs.
a, Transcript level, expressed as fragments per kilobase per million mapped reads (fpkm), of the two Ldb family members in mOSN RNA-seq data sets (n=5 biological replicates). b, Sections of olfactory epithelium stained for Ldb1 (green) and Adcy3 (magenta), a marker for mOSNs. Nuclei are labeled with DAPI (blue). Scale bar = 25um. Similar results were obtained from four independent experiments. c, Ldb1 and Lhx2 ChIP-seq signal in mOSNs across the OR gene cluster containing the Greek Island Lipsi. OR genes are red and all other genes are blue. Plot shows pooled data from 2 biological replicates for Lhx2 and 3 biological replicates for Ldb1, each of which yielded similar results when analyzed separately. Values are counts per 10 million reads. d, Extensive overlap between consensus Lhx2 and Ldb1 ChIP-seq peak sets. e, linear relationship between normalized Lhx2 ChIP signal and Ldb1 ChIP signal. Any peak observed in at least two of the 5 experiments (2 for Lhx2 and 3 for Ldb1) was included (n=26,667) and plotted together with a best fit line obtained by linear regression with y-intercept set to 0. f, Ldb1 ChIP signal over Greek Islands in mOSNs and Late Lhx2 KO mOSNs. Heatmap shows pooled data from 3 biological replicates for mOSNs and 2 biological replicates for Late Lhx2 KO cells, each of which yielded similar results when analyzed separately. Values are counts per 10 million reads. g, Normalized Ldb1 ChIP-seq signal is greater for Ldb1 peaks that overlap Greek Islands than for peaks that do not (p < 2.2e-16, two-sided Wilcoxon rank sum test, n=63 for Greek Islands, n=22,728 for non-Island peaks). Violin plots are scaled to the same area and show density for the full set of points over the full range. h, Normalized Ldb1 ChIP-seq signal is greater for Ldb1 peaks that overlap Ebf ChIP peaks than for peaks that do not (p < 2.2e-16, two-sided Wilcoxon rank sum test, n=8,779 for Ldb1 peaks that overlap Ebf peaks, n=14,012 for non-Ebf peaks). Violin plots are scaled to the same area and show density for the full set of points over the full range. i, mOSN ChIP-seq for Ldb1, CTCF, and the cohesin-subunit Rad21 across the OR gene cluster containing the Greek Island Lipsi. OR genes are red and all other genes are blue. Plot shows pooled data from 3 biological replicates for Ldb1 and 2 biological replicates CTCF and Rad21. Values are counts per 10 million reads. Analyzing each replicate separately yielded similar results. j, mOSN ChIP signal over Greek Islands and non-Geek Island ChIP-seq peaks. For ChIP-seq peaks, the heatmap shows 500 randomly selected peaks and the plot shows data from the full consensus set of peaks (n=22,791 for Ldb1, n=24,883 for CTCF, and n=9,882 for Rad21). Plots show pooled data, similar results were obtained with each replicate (n=3 for Ldb1 ChIP-seq and n=2 for CTCF and Rad21 ChIP-seq). Units are counts per 10 million reads. k, As in j, but showing Ldb1 ChIP signal over OR genes (n=1,255) in mOSNs. l, Ldb1 ChIP-seq from control mOSNs (top) and Olfr1507-expressing cells (middle). Strong signal is observed on the Greek Island, H, in both populations but only a very weak signal on the Olfr1507 promoter when it is transcriptionally engaged. Pooled data from 3 biological replicates is shown for the mOSNs. One of two biological replicates is shown for Olfr1507+ OSNs; the other replicate yielded similar results but with lower enrichment in peaks. ATAC-seq from the Olfr1507-expressing cells (bottom) shows that the promoter of Olfr1507 has similar accessibility to the H element. ATAC-seq plot shows pooled data from two biological replicates that yielded similar results.
Extended Data Figure 7: Effects of conditional Ldb1 deletion in Greek Island interactions and OR expression.
a, Schematic of the genetic strategy used to generate Ldb1 KO mOSNs that are fluorescently labeled b, In Ldb1fl/fl;OMP-Cre mice, Ldb1 (green) is lost from mOSNs but retained in basal immature cells. Nuclei are stained with DAPI (magenta). Scale bar = 20um. Similar results were obtained from three independent experiments. c, HiC contacts between a pair of OR clusters located on different chromosomes in control (top), and Ldb1 KO (bottom) OSNs. A HiC hotspot between interacting Greek Islands in control mOSNs (arrowheads) is absent in Ldb1 KO OSNs d, 3D projection of the same OR cluster pair in control and Ldb1 KO OSNs. e, trans interactions of each Greek Island (n=59) with the other Greek Islands as fraction of the total HiC contacts in mOSNs versus Ldb1 KO cells. Greek Islands changed more than 2-fold are red. f, For each Greek Island, the mean number of cis long range (left) and trans (right) HiC contacts per billion made to every non-OR sequence (at 50 Kb resolution), intergenic Lhx2 & Ebf bound peak (outside of OR clusters), or Greek Island. Box indicates median, upper, and lower quartiles while whiskers indicate 1.5 * the interquartile range. g, same as e but for trans contacts between OR gene clusters (n=67). Clusters changed more than 1.5-fold are red. h, Circos plots depicting the strongest 1000 interchromosomal interactions genomewide at 1Mb resolution in control mOSNs (left), Ldb1 KO mOSNs (right). Red lines represent OR-OR contacts and black lines non-OR-non-OR contacts. Line thickness increases with contact frequency. Chromosome numbers depicted at the periphery of the circle. i, Transcript levels of Greek Island-binding factors in RNA-seq data from control mOSNs and Ldb1 KO mOSNs. Transcript levels of Ebf3 are reduced approximately 2-fold (p = 0.031 for greater than 1.5-fold change, DESeq2 normalized Wald test with n=5 for control mOSNs and n=4 Ldb1 KO). The expression of other factors is not significantly different between conditions.
Extended Data Figure 8: Long range interactions in homogeneous OSN subpopulations.
a-c, Circos plots representing the 1000 strongest trans contacts in Olfr16- (a), Olfr17- (b) and Olfr1507- (c) expressing OSNs. d, (left) Comparison of the frequency of local cis (grey), long range cis (blue) and trans (red) Greek Island interactions in mixed mOSNs and OSNs expressing specific OR genes. (right) Mean values for Olfr16+, Olfr17+, and Olfr1507+ cells are not significantly different from those for mixed mOSNs (p > 0.05 for all comparisons, two-tailed paired Wilcoxon signed-rank test). e, in situ HiC contact matrices from Olfr16+, Olfr17+ and Olfr1507+ cells focused on the Olfr16 gene locus. Arrowhead points to specific long-range contacts between Olfr16 and the Greek Island Astypalea that occur only in Olfr16+ cells. Open pin marks Greek Island-Greek Island contacts that also differ between cell types. f-g, Similar analysis for the Olfr16 locus in Olfr17+ and Olfr1507+ cells. h-j, as in e-g, except for the Olfr17 locus. k-m, as in e-g, except for the Olfr1507 locus.
Extended Data Figure 9: Long-range cis and trans contacts between Greek Islands and the active OR gene.
a, HiC Contacts that span more than 80 Mb are observed between the Olfr16 locus and Greek Islands in Olfr16+ cells. b, Close examination of the contacts (dashed box from a) reveals that Greek Islands contact Olfr16+ only in Olfr16+ cells (top, black arrowhead). Extremely long-range contacts between Greek Islands (gray arrowheads), but not involving the Olfr16 locus, are observed also in Olfr17+ and Olfr1507+ cells (middle, bottom). c, Heatmap depicting interchromosomal contacts between Olfr16 (chromosome 1) and Greek Islands from different chromosomes in in situ HiC from Olfr16+, Olfr17+ and Olf1507+ cells. d, 3D projection of APA between the Olfr16 locus and trans Greek Islands in the three specific mOSN populations. e, Heatmaps for contacts between Olfr16, Olfr17, or Olfr1507 and trans Greek Islands reveals an accumulation of contacts centered around the active allele. f, APA for an OR vs trans Greek Islands shows the accumulation of contacts on the active allele at 10 Kb resolution. The poor mappability of the Olfr17 locus and the lower sequencing depth perturbs the expected focal peak. For the Olfr1507 locus, the presence of the Greek Island, H, 50 Kb from Olfr1507 results in HiC contacts spanning a broad area. g,h, Short, long, and trans contacts with Greek Islands across the OR gene clusters containing Olfr17 (g) and Olfr1507 (h) plotted as fraction of the total HiC contacts mapped to each position (5 Kb resolution). Top panel shows contact in cells in which Olfr17/Olfr1507 is active, and the bottom panel shows data from Olfr16+ cells in which Olfr17/Olfr1507 is silent.
Extended Data Figure 10. A model for specific OR compartmentalization and the generation of mutually exclusive phases regulating OR gene choice.
a,b, Coincidence of Lhx2/Ldb1 peaks with H3K9me3 enrichment may generate an OR-enriched molecular barcode that promotes specific interactions between OR gene clusters. c, In INPs, where OR compartments first form, Greek Islands do not make specific contacts with each other. d, In mOSNs however, Greek Islands through specifically interact with each other through homotypic Ldb1 interactions, forming a multi-enhancer hub that is segregated from the OR compartment. We hypothesize that OR compartments and Greek Island hubs form incompatible liquid phases driven by Hp1 proteins and the unstructured domains of Lhx2 and Ldb1, respectively. e, Upon deletion of Ldb1 (or Lhx2) the Greek Island phase falls apart and the Greek Islands become incorporated to the OR compartments, as in the INPs.
Supplementary Material
Acknowledgments
We thank Alice Mumbay-Wafula for assistance with mouse colony management, Ira Schieren for assistance with FACS, Dr. Paul Love for sharing the Ldb1fl/fl mice, Dr. Edwin Monuki for sharing the Lhx2fl/fl mice. AH was funded by F31 post-doctoral fellowship DC016785 (NIH) and KM was funded by F32 post-doctoral fellowship GM108474 (NIH). Stavros Lomvardas acknowledges support from the National Institutes of Health Common Fund 4D Nucleome Program (Grant 1U01DA040582). In addition, this project was funded by R01DC013560, R01DC015451 (NIH) and the HHMI Faculty Scholar Award. Research reported in this publication was also performed in the CCTI Flow Cytometry Core, supported in part by the Office of the Director, National Institutes of Health under awards S10OD020056. The content is solely the responsibility of the authors and does not necessarily represent the official views of the NIH.
Footnotes
Competing interests
The authors declare no competing interests.
Data Availability Statement
All figures include publicly available data. All ChIP-seq and RNA-seq data reported in this paper (see Supplementary Information 1 and 2) are available from GEO (GSE112153). Additional data (mOSN RNA-seq, mOSN Lhx2 ChIP-seq, mOSN Ebf ChIP-seq, and Olfr1507+ ATAC-seq) were previously described7 and are available from GEO (GSE93570). All HiC data generated in this study are publicly available at https://data.4dnucleome.org/ under the following accession numbers: 4DNESH4UTRNL, 4DNESNYBDSLY, 4DNES54YB6TQ, 4DNESRE7AK5U, 4DNES425UDGS, 4DNESEPDL6KY.
References
- 1.Buck L & Axel R A novel multigene family may encode odorant receptors: a molecular basis for odor recognition. Cell 65, 175–187 (1991). [DOI] [PubMed] [Google Scholar]
- 2.Magklara A et al. An epigenetic signature for monoallelic olfactory receptor expression. Cell 145, 555–570, doi:S0092–8674(11)00374–6 [pii] 10.1016/j.cell.2011.03.040 (2011). [DOI] [PMC free article] [PubMed] [Google Scholar]
- 3.Chess A, Simon I, Cedar H & Axel R Allelic inactivation regulates olfactory receptor gene expression. Cell 78, 823–834 (1994). [DOI] [PubMed] [Google Scholar]
- 4.Monahan K & Lomvardas S Monoallelic expression of olfactory receptors. Annu Rev Cell Dev Biol 31, 721–740, doi: 10.1146/annurev-cellbio-100814-125308 (2015). [DOI] [PMC free article] [PubMed] [Google Scholar]
- 5.Lyons DB et al. An epigenetic trap stabilizes singular olfactory receptor expression. Cell 154, 325–336, doi: 10.1016/j.cell.2013.06.039 (2013). [DOI] [PMC free article] [PubMed] [Google Scholar]
- 6.Markenscoff-Papadimitriou E et al. Enhancer interaction networks as a means for singular olfactory receptor expression. Cell 159, 543–557, doi: 10.1016/j.cell.2014.09.033 (2014). [DOI] [PMC free article] [PubMed] [Google Scholar]
- 7.Monahan K et al. Cooperative interactions enable singular olfactory receptor expression in mouse olfactory neurons. eLife 6, doi: 10.7554/eLife.28620 (2017). [DOI] [PMC free article] [PubMed] [Google Scholar]
- 8.Clowney EJ et al. Nuclear aggregation of olfactory receptor genes governs their monogenic expression. Cell 151, 724–737, doi: 10.1016/j.cell.2012.09.043 (2012). [DOI] [PMC free article] [PubMed] [Google Scholar]
- 9.Armelin-Correa LM, Gutiyama LM, Brandt DY & Malnic B Nuclear compartmentalization of odorant receptor genes. Proceedings of the National Academy of Sciences of the United States of America 111, 2782–2787, doi: 10.1073/pnas.1317036111 (2014). [DOI] [PMC free article] [PubMed] [Google Scholar]
- 10.Spilianakis CG & Flavell RA Molecular biology. Managing associations between different chromosomes. Science 312, 207–208, doi: 10.1126/science.1126689 (2006). [DOI] [PubMed] [Google Scholar]
- 11.Beagrie RA et al. Complex multi-enhancer contacts captured by genome architecture mapping. Nature 543, 519–524, doi: 10.1038/nature21411 (2017). [DOI] [PMC free article] [PubMed] [Google Scholar]
- 12.Apostolou E & Thanos D Virus Infection Induces NF-kappaB-dependent interchromosomal associations mediating monoallelic IFN-beta gene expression. Cell 134, 85–96 (2008). [DOI] [PubMed] [Google Scholar]
- 13.Maass PG, Barutcu AR, Weiner CL & Rinn JL Inter-chromosomal Contact Properties in Live-Cell Imaging and in Hi-C. Molecular cell 70, 188–189, doi: 10.1016/j.molcel.2018.03.021 (2018). [DOI] [PMC free article] [PubMed] [Google Scholar]
- 14.Maass PG, Barutcu AR & Rinn JL Interchromosomal interactions: A genomic love story of kissing chromosomes. The Journal of cell biology, doi: 10.1083/jcb.201806052 (2018). [DOI] [PMC free article] [PubMed] [Google Scholar]
- 15.Rao SS et al. A 3D map of the human genome at kilobase resolution reveals principles of chromatin looping. Cell 159, 1665–1680, doi: 10.1016/j.cell.2014.11.021 (2014). [DOI] [PMC free article] [PubMed] [Google Scholar]
- 16.Nagano T et al. Comparison of Hi-C results using in-solution versus in-nucleus ligation. Genome Biol 16, 175, doi: 10.1186/s13059-015-0753-7 (2015). [DOI] [PMC free article] [PubMed] [Google Scholar]
- 17.Johanson TM et al. Genome-wide analysis reveals no evidence of trans chromosomal regulation of mammalian immune development. PLoS genetics 14, e1007431, doi: 10.1371/journal.pgen.1007431 (2018). [DOI] [PMC free article] [PubMed] [Google Scholar]
- 18.Fuss SH, Omura M & Mombaerts P Local and cis effects of the H element on expression of odorant receptor genes in mouse. Cell 130, 373–384 (2007). [DOI] [PubMed] [Google Scholar]
- 19.Le Gros MA et al. Soft X-Ray Tomography Reveals Gradual Chromatin Compaction and Reorganization during Neurogenesis In Vivo. Cell reports 17, 2125–2136, doi: 10.1016/j.celrep.2016.10.060 (2016). [DOI] [PMC free article] [PubMed] [Google Scholar]
- 20.Hanchate NK et al. Single-cell transcriptomics reveals receptor transformations during olfactory neurogenesis. Science 350, 1251–1255, doi: 10.1126/science.aad2456 (2015). [DOI] [PMC free article] [PubMed] [Google Scholar]
- 21.Saraiva LR et al. Hierarchical deconstruction of mouse olfactory sensory neurons: from whole mucosa to single-cell RNA-seq. Scientific reports 5, 18178, doi: 10.1038/srep18178 (2015). [DOI] [PMC free article] [PubMed] [Google Scholar]
- 22.Tan L, Li Q & Xie XS Olfactory sensory neurons transiently express multiple olfactory receptors during development. Molecular systems biology 11, 844, doi: 10.15252/msb.20156639 (2015). [DOI] [PMC free article] [PubMed] [Google Scholar]
- 23.Ahmed S et al. DNA zip codes control an ancient mechanism for gene targeting to the nuclear periphery. Nat Cell Biol 12, 111–118, doi: 10.1038/ncb2011 (2010). [DOI] [PMC free article] [PubMed] [Google Scholar]
- 24.Hewitt SL et al. Association between the Igk and Igh immunoglobulin loci mediated by the 3’ Igk enhancer induces ‘decontraction’ of the Igh locus in pre-B cells. Nature immunology 9, 396–404, doi: 10.1038/ni1567 (2008). [DOI] [PMC free article] [PubMed] [Google Scholar]
- 25.Gadye L et al. Injury Activates Transient Olfactory Stem Cell States with Diverse Lineage Capacities. Cell Stem Cell 21, 775–790 e779, doi: 10.1016/j.stem.2017.10.014 (2017). [DOI] [PMC free article] [PubMed] [Google Scholar]
- 26.Lin B et al. Injury Induces Endogenous Reprogramming and Dedifferentiation of Neuronal Progenitors to Multipotency. Cell Stem Cell 21, 761–774 e765, doi: 10.1016/j.stem.2017.09.008 (2017). [DOI] [PMC free article] [PubMed] [Google Scholar]
- 27.Agulnick AD et al. Interactions of the LIM-domain-binding factor Ldb1 with LIM homeodomain proteins. Nature 384, 270–272, doi: 10.1038/384270a0 (1996). [DOI] [PubMed] [Google Scholar]
- 28.Bach I The LIM domain: regulation by association. Mechanisms of development 91, 5–17 (2000). [DOI] [PubMed] [Google Scholar]
- 29.Krivega I & Dean A LDB1-mediated enhancer looping can be established independent of mediator and cohesin. Nucleic acids research 45, 8255–8268, doi: 10.1093/nar/gkx433 (2017). [DOI] [PMC free article] [PubMed] [Google Scholar]
- 30.Lee J, Krivega I, Dale RK & Dean A The LDB1 Complex Co-opts CTCF for Erythroid Lineage-Specific Long-Range Enhancer Interactions. Cell reports 19, 2490–2502, doi: 10.1016/j.celrep.2017.05.072 (2017). [DOI] [PMC free article] [PubMed] [Google Scholar]
- 31.Deng W et al. Controlling long-range genomic interactions at a native locus by targeted tethering of a looping factor. Cell 149, 1233–1244, doi: 10.1016/j.cell.2012.03.051 (2012). [DOI] [PMC free article] [PubMed] [Google Scholar]
- 32.Caputo L et al. The Isl1/Ldb1 Complex Orchestrates Genome-wide Chromatin Organization to Instruct Differentiation of Multipotent Cardiac Progenitors. Cell Stem Cell 17, 287–299, doi: 10.1016/j.stem.2015.08.007 (2015). [DOI] [PMC free article] [PubMed] [Google Scholar]
- 33.Bronstein R et al. Transcriptional regulation by CHIP/LDB complexes. PLoS genetics 6, e1001063, doi: 10.1371/journal.pgen.1001063 (2010). [DOI] [PMC free article] [PubMed] [Google Scholar]
- 34.Matthews JM & Visvader JE LIM-domain-binding protein 1: a multifunctional cofactor that interacts with diverse proteins. EMBO Rep 4, 1132–1137, doi: 10.1038/sj.embor.7400030 (2003). [DOI] [PMC free article] [PubMed] [Google Scholar]
- 35.Rao SSP et al. Cohesin Loss Eliminates All Loop Domains. Cell 171, 305–320 e324, doi: 10.1016/j.cell.2017.09.026 (2017). [DOI] [PMC free article] [PubMed] [Google Scholar]
- 36.Schwarzer W et al. Two independent modes of chromatin organization revealed by cohesin removal. Nature 551, 51–56, doi: 10.1038/nature24281 (2017). [DOI] [PMC free article] [PubMed] [Google Scholar]
- 37.Lieberman-Aiden E et al. Comprehensive mapping of long-range interactions reveals folding principles of the human genome. Science 326, 289–293, doi: 10.1126/science.1181369 (2009). [DOI] [PMC free article] [PubMed] [Google Scholar]
- 38.Pederson T The nucleolus. Cold Spring Harb Perspect Biol 3, doi: 10.1101/cshperspect.a000638 (2011). [DOI] [PMC free article] [PubMed] [Google Scholar]
- 39.Larson AG et al. Liquid droplet formation by HP1alpha suggests a role for phase separation in heterochromatin. Nature 547, 236–240, doi: 10.1038/nature22822 (2017). [DOI] [PMC free article] [PubMed] [Google Scholar]
- 40.Strom AR et al. Phase separation drives heterochromatin domain formation. Nature 547, 241–245, doi: 10.1038/nature22989 (2017). [DOI] [PMC free article] [PubMed] [Google Scholar]
- 41.Hnisz D, Shrinivas K, Young RA, Chakraborty AK & Sharp PA A Phase Separation Model for Transcriptional Control. Cell 169, 13–23, doi: 10.1016/j.cell.2017.02.007 (2017). [DOI] [PMC free article] [PubMed] [Google Scholar]
- 42.Sabari BR et al. Coactivator condensation at super-enhancers links phase separation and gene control. Science 361, doi: 10.1126/science.aar3958 (2018). [DOI] [PMC free article] [PubMed] [Google Scholar]
- 43.Lomvardas S et al. Interchromosomal interactions and olfactory receptor choice. Cell 126, 403–413, doi: 10.1016/j.cell.2006.06.035 (2006). [DOI] [PubMed] [Google Scholar]
- 44.Khan M, Vaes E & Mombaerts P Regulation of the probability of mouse odorant receptor gene choice. Cell 147, 907–921, doi: 10.1016/j.cell.2011.09.049 (2011). [DOI] [PubMed] [Google Scholar]
- 45.Nishizumi H, Kumasaka K, Inoue N, Nakashima A & Sakano H Deletion of the core-H region in mice abolishes the expression of three proximal odorant receptor genes in cis. Proceedings of the National Academy of Sciences of the United States of America 104, 20067–20072, doi: 10.1073/pnas.0706544105 (2007). [DOI] [PMC free article] [PubMed] [Google Scholar]
- 46.Guo Y et al. CRISPR Inversion of CTCF Sites Alters Genome Topology and Enhancer/Promoter Function. Cell 162, 900–910, doi: 10.1016/j.cell.2015.07.038 (2015). [DOI] [PMC free article] [PubMed] [Google Scholar]
- 47.Noordermeer D et al. Variegated gene expression caused by cell-specific long-range DNA interactions. Nat Cell Biol 13, 944–951, doi: 10.1038/ncb2278 (2011). [DOI] [PMC free article] [PubMed] [Google Scholar]
- 48.Shykind BM et al. Gene switching and the stability of odorant receptor gene choice. Cell 117, 801–815 (2004). [DOI] [PubMed] [Google Scholar]
- 49.Rock JR et al. Basal cells as stem cells of the mouse trachea and human airway epithelium. Proceedings of the National Academy of Sciences of the United States of America 106, 12771–12775, doi: 10.1073/pnas.0906850106 (2009). [DOI] [PMC free article] [PubMed] [Google Scholar]
- 50.Madisen L et al. A robust and high-throughput Cre reporting and characterization system for the whole mouse brain. Nature neuroscience 13, 133–140, doi: 10.1038/nn.2467 (2010). [DOI] [PMC free article] [PubMed] [Google Scholar]
- 51.Vassalli A, Rothman A, Feinstein P, Zapotocky M & Mombaerts P Minigenes impart odorant receptor-specific axon guidance in the olfactory bulb. Neuron 35, 681–696, doi:S0896627302007936 [pii] (2002). [DOI] [PubMed] [Google Scholar]
- 52.Eggan K et al. Mice cloned from olfactory sensory neurons. Nature 428, 44–49, doi: 10.1038/nature02375 (2004). [DOI] [PubMed] [Google Scholar]
- 53.Mangale VS et al. Lhx2 selector activity specifies cortical identity and suppresses hippocampal organizer fate. Science 319, 304–309, doi: 10.1126/science.1151695 (2008). [DOI] [PMC free article] [PubMed] [Google Scholar]
- 54.Zhao Y et al. LIM-homeodomain proteins Lhx1 and Lhx5, and their cofactor Ldb1, control Purkinje cell differentiation in the developing cerebellum. Proceedings of the National Academy of Sciences of the United States of America 104, 13182–13186, doi: 10.1073/pnas.0705464104 (2007). [DOI] [PMC free article] [PubMed] [Google Scholar]
- 55.Durand NC et al. Juicer Provides a One-Click System for Analyzing Loop-Resolution Hi-C Experiments. Cell Syst 3, 95–98, doi: 10.1016/j.cels.2016.07.002 (2016). [DOI] [PMC free article] [PubMed] [Google Scholar]
- 56.Li H Aligning sequence reads, clone sequences and assembly contigs with BWA-MEM. arXiv.org>q-bio 1–3 (2013). [Google Scholar]
- 57.Droettboom M matplotlib/matplotlib v2.2.2. ZENODO 1202077, doi:doi:10.5281 (2018). [Google Scholar]
- 58.Waskom M mwaskom/seaborn: v0.8.1. ZENODO 883859, doi:doi:10.5281 (2017). [Google Scholar]
- 59.McKinney W Data Structures for Statistical Computing in Python. Proc. 9th Python Sci. Conf 1697900, 51–56 (2010). [Google Scholar]
- 60.Freese NH, Norris DC & Loraine AE Integrated genome browser: visual analytics platform for genomics. Bioinformatics 32, 2089–2095, doi: 10.1093/bioinformatics/btw069 (2016). [DOI] [PMC free article] [PubMed] [Google Scholar]
- 61.Love MI, Huber W & Anders S Moderated estimation of fold change and dispersion for RNA-seq data with DESeq2. Genome Biol 15, 550, doi: 10.1186/s13059-014-0550-8 (2014). [DOI] [PMC free article] [PubMed] [Google Scholar]
- 62.Klein FA et al. FourCSeq: analysis of 4C sequencing data. Bioinformatics 31, 3085–3091, doi: 10.1093/bioinformatics/btv335 (2015). [DOI] [PMC free article] [PubMed] [Google Scholar]
- 63.Pedregosa F Scikit-learn: Machine Learning in Python. . J. Mach. Learn. Res 12, 2825–2830 (2012). [Google Scholar]
- 64.Langmead B & Salzberg SL Fast gapped-read alignment with Bowtie 2. Nat Methods 9, 357–359, doi: 10.1038/nmeth.1923 (2012). [DOI] [PMC free article] [PubMed] [Google Scholar]
- 65.Li H et al. The Sequence Alignment/Map format and SAMtools. Bioinformatics 25, 2078–2079, doi: 10.1093/bioinformatics/btp352 (2009). [DOI] [PMC free article] [PubMed] [Google Scholar]
- 66.Heinz S et al. Simple combinations of lineage-determining transcription factors prime cis-regulatory elements required for macrophage and B cell identities. Molecular cell 38, 576–589, doi: 10.1016/j.molcel.2010.05.004 (2010). [DOI] [PMC free article] [PubMed] [Google Scholar]
- 67.Quinlan AR & Hall IM BEDTools: a flexible suite of utilities for comparing genomic features. Bioinformatics 26, 841–842, doi: 10.1093/bioinformatics/btq033 (2010). [DOI] [PMC free article] [PubMed] [Google Scholar]
- 68.Ramirez F et al. deepTools2: a next generation web server for deep-sequencing data analysis. Nucleic acids research 44, W160–165, doi: 10.1093/nar/gkw257 (2016). [DOI] [PMC free article] [PubMed] [Google Scholar]
- 69.Ross-Innes CS et al. Differential oestrogen receptor binding is associated with clinical outcome in breast cancer. Nature 481, 389–393, doi: 10.1038/nature10730 (2012). [DOI] [PMC free article] [PubMed] [Google Scholar]
- 70.Dobin A et al. STAR: ultrafast universal RNA-seq aligner. Bioinformatics 29, 15–21, doi: 10.1093/bioinformatics/bts635 (2013). [DOI] [PMC free article] [PubMed] [Google Scholar]
- 71.Benjamini Y & Speed TP Summarizing and correcting the GC content bias in high-throughput sequencing. Nucleic acids research 40, e72, doi: 10.1093/nar/gks001 (2012). [DOI] [PMC free article] [PubMed] [Google Scholar]
- 72.Yan J et al. Histone H3 lysine 4 monomethylation modulates long-range chromatin interactions at enhancers. Cell Res 28, 387, doi: 10.1038/cr.2018.18 (2018). [DOI] [PMC free article] [PubMed] [Google Scholar]
- 73.Bonev B et al. Multiscale 3D Genome Rewiring during Mouse Neural Development. Cell 171, 557–572 e524, doi: 10.1016/j.cell.2017.09.043 (2017). [DOI] [PMC free article] [PubMed] [Google Scholar]
Associated Data
This section collects any data citations, data availability statements, or supplementary materials included in this article.


