

A novel method for identifying genes with global importance leads to the discovery of transcriptional waves during embryogenesis.
Abstract
Transcriptional regulation is pivotal to the specification of distinct cell types during embryonic development. However, it still lacks a systematic way to identify key transcription factors (TFs) orchestrating the temporal and tissue specificity of gene expression. Here, we integrated epigenomic and transcriptomic data to reveal key regulators from two cells to postnatal day 0 in mouse embryogenesis. We predicted three-dimensional chromatin interactions in 12 tissues across eight developmental stages, which facilitates linking TFs to their target genes for constructing transcriptional regulatory networks. To identify driver TFs, we developed a new algorithm, dubbed Taiji, to assess the global influence of each TF and systematically uncovered TFs critical for lineage-specific and stage-dependent tissue specification. We have also identified TF combinations that function in spatiotemporal order to form transcriptional waves regulating developmental progress. Furthermore, lacking stage-specific TF combinations suggests a distributed timing strategy to orchestrate the coordination between tissues during embryonic development.
INTRODUCTION
Transcription factors (TFs) are essential regulators of cell fate and play pivotal roles in development (1). Identification of critical TFs that drive tissue differentiation can provide key mechanistic insights into the developmental process. However, a complete catalog of driver TFs at each developmental stage in each tissue has not been established. Tackling this challenge requires dissecting the transcriptional networks and characterizing the genome-wide influences of key TFs.
The global influence of a TF in the cell is conveyed through its regulatory effect on the target genes, which is propagated over the transcriptional network. The TF’s regulatory activity is affected by its own expression level and post-translational modification as well as other factors such as the presence of collaborative co-factors (2). Therefore, the expression level of a TF is not always correlated with its activity (3, 4). In light of this, many methods have been proposed to infer the activity of TFs using statistical or machine learning approaches. For instance, Schacht et al. (4) developed a statistical model to estimate the regulatory activity of TFs using their cumulative effects on their target genes. Arrieta-Ortiz et al. (5) used the linear model to infer the TF activity (TFA) by predicting target genes’ expression levels. Although these methods were able to predict the local activity of a TF, i.e., the expression level of their direct target genes, measuring the system-wide influence of a given TF is not their focus. As genes rarely function alone but usually cross-talk with each other to form complex regulatory logic, it is reasonable to believe that the global influence of a TF can, in principle, better predict the cell-state change upon perturbing the TF than its local influence (6, 7).
Previously, we have shown that the personalized PageRank can successfully infer the global impact of TFs (8, 9). It clearly outperformed the motif enrichment analysis and the TFA approach (9). In addition, several predicted TFs were later validated experimentally and demonstrated previously unappreciated roles (8, 9). Building upon our previous studies, we have made further improvements by incorporating spatial long-range interaction information into network construction, which helps assign distal regulatory elements to target genes. Furthermore, we have developed a software package, dubbed Taiji, to help biologist to perform integrated analysis and identify driver TFs using different genomic information, including chromatin state [from chromatin immunoprecipitation followed by high-throughput sequencing (ChIP-seq) or assay for transposase-accessible chromatin with high-throughput sequencing (ATAC-seq)], gene expression profile [from RNA sequencing (RNA-seq) or microarray], and chromatin long-range interactions (from Hi-C or computational prediction).
The Encyclopedia of DNA Elements (ENCODE) project has systematically mapped the epigenomic dynamics during mouse embryonic development in 12 tissues and eight developmental stages. While this dataset provides an unprecedented opportunity to dissect the complex transcriptional regulatory logic during development, it also poses great challenges for integrated computational analyses. Using our framework, we have identified TFs that are crucial in defining tissue differentiation. Furthermore, we applied Taiji to the existing data in earlier development, from two-cell stage to embryonic stem cell, which complements the data generated by the mouse ENCODE project. Our analyses thus provide the first comprehensive catalog of key regulators for a variety of tissues during mouse embryogenesis. While many of the identified regulators are well supported by the literature, the newly found key TFs in development provide a valuable resource for follow-up biological study. We also uncovered TF combinations that activate in a spatiotemporal manner, which behave like transcriptional waves to orchestrate the developmental progress and tissue specification.
RESULTS
An overview of the Taiji framework
To identify key regulators, Taiji integrates various genomic information to build transcriptional regulatory networks by predicting regulations between TFs and genes. The TFs in the network are then ranked by the personalized PageRank algorithm (Fig. 1A) (10). Briefly, Taiji starts by identifying active regulatory elements, including active promoters and active enhancers, defined by ATAC-seq or H3K27ac ChIP-seq peaks. Enhancers were then assigned to their interacting promoters using chromatin interactions predicted by EpiTensor (11). To construct transcriptional regulatory networks, Taiji scans each regulatory element to identify putative TF binding sites using motifs from the CIS-BP database (12). TFs with putative binding sites in promoters or enhancers are then linked to their target genes in the networks. Lastly, the PageRank algorithm was used to assess the genome-wide influences of TFs. Furthermore, we used the node and edge weights to personalize the ranking algorithm. The node weights were determined by the z scores of gene expression levels, which allow the ranking algorithm to assign higher ranks to TFs that regulate more differentially expressed genes. The edge weights were set to be proportional to TFs’ expression levels, which help filter out TFs that are not expressed or with low-expression levels (see Materials and Methods for details).
Fig. 1. The design of Taiji and EpiTensor algorithms.
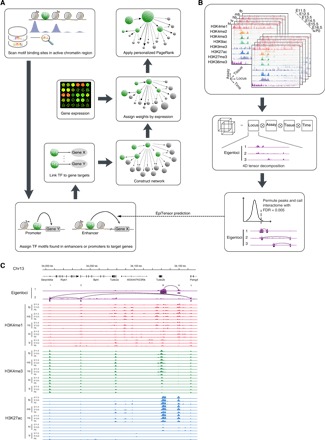
(A) The workflow of Taiji pipeline. (B) The workflow of EpiTensor algorithm. (C) An example of chromosome interactions predicted by EpiTensor. Predicted interacting loci are linked by lines. Locus i, ii, and v are three active promoters marked by H3K4me3 and H3K27ac in the tissue stages shown in the figure. Locus iv is a validated enhancer documented in the VISTA database. Locus iii is the promoter of Tubb2b, preferentially active in the brain. Eigenlocus 1 contains a strong peak representing the interaction between locus iii and iv; the covariation of histone modifications at the two loci can be exemplified by the coherent decrease of H3K4me1/H3K4me3 and H3K27ac signal levels across tissues/stages. Only H3K4me1, H3K4me3, and H3K27ac in E11.5, E13.5, and P0 are shown due to the limited space. ht, heart; lv, liver; hb, hindbrain; mb, midbrain; fb, forebrain.
Predicting long-range chromatin interactions in mouse embryonic development
Hi-C data were not available for the tissues studied by the mouse ENCODE project. Therefore, we resorted to EpiTensor (11), an unsupervised learning method, to predict the enhancer-promoter interactions from histone modification data. As we have demonstrated in our previous study, EpiTensor not only shows high concordance with the experimental data, including Hi-C, chromatin interaction analysis by paired-end tag sequencing, and expression quantitative trait locus results, but also significantly outperforms other correlation-based methods and nearest gene assignment (11). Besides, a unique advantage of EpiTensor is that it can predict chromosome interactions at a high resolution of 200 base pairs (bp) within topologically associating domains (TADs) (Fig. 1B); this is much higher than the highest resolution (1000 bp) of the Hi-C data available in the public domain. Using EpiTensor, we predicted the chromatin interactions in 12 tissues at eight developmental stages. All predictions are available in the Supplementary Materials. The predicted interactions cover 25,358 transcription start sites (TSSs), >38% of all annotated transcripts [from GENCODE version M14 (13)], and 334 experimentally validated enhancers in the VISTA database (14) account for 55% of confirmed active enhancers during mouse embryonic development. To further assess the accuracy of EpiTensor’s predictions, we compared the interactions predicted in mouse embryonic stem cells (mESCs) with Hi-C interactions from Dixon et al. (15). The result showed that EpiTensor’s predictions are in great concordance with the Hi-C experiment (area under the receiver operating characteristic curve = 0.87) (fig. S1A). In Fig. 1C, we show one example of the predicted interactions. Specifically, locus iii is the promoter of Tubb2b, a critical gene for the cortical formation and brain morphogenesis (16). Locus iv is an experimentally validated active enhancer in embryonic mouse midbrain, hindbrain, and facial mesenchyme from the VISTA database (peak ID: mm1605). These two loci show correlated histone modification profiles across tissues/stages and were identified as interacting loci by EpiTensor. No interaction was found between locus iv and v despite their closer distance. This result, together with the large distance (160 kilo–base pairs) between locus i and v, indicates the power of EpiTensor for identifying long-range chromatin interactions.
Computational validation of the Taiji framework
Network construction and PageRank procedure are the two critical components deciding the overall accuracy of Taiji’s results. To validate the network construction method, we trained a random forest model to predict the expression changes of target genes from the expression changes of their upstream regulators in the network. Using 10-fold cross-validation, we showed that the predicted changes is in good concordance with the actual values (ρ = 0.756) (fig. S1B). Next, to investigate whether the PageRank scores can be used to assess the TFs’ importance, we used the GeneNetWeaver (17) to generate benchmark networks and associated them with dynamic models. Using the dynamic models, we generated the expression profiles and performed in silico knockout experiments for each regulator. The Euclidean distance between wild-type and knockout expression profiles was computed to represent the magnitude of the perturbation (fig. S1C). Regulators were ranked by their perturbation magnitudes, reflecting their global influences on the cells. We used this rank list as the ground truth to assess the performance of different algorithms. Among the five methods we have benchmarked, PageRank performed the best, showing a strong Spearman’s correlation (ρ = 0.914) with the ground truth in the benchmark dataset of yeast (Fig. 2A). The gene expression of a TF is not a strong predictor of its importance, as indicated by the weak correlation (ρ = 0.393) with the perturbation magnitude (Fig. 2D). The regression-based TFA model (5) does not correlate with the ground truth (ρ = −0.134) (Fig. 2E). Another method, developed by Schacht and his colleagues (4), defines the TF activity as the weighted average of its target genes’ expression (WATG) and it shows a weak correlation with TFs’ overall importance (ρ = 0.225; Fig. 2C). We speculated that the averaging effect in WATG might contribute negatively to its performance on predicting global importance. Therefore, we developed a new metric called WSTG, which calculates the weighted sum of target genes’ expression levels of a TF (see Materials and Methods for details). Note that the formulation of WSTG is conceptually equivalent to the network degree centrality. As expected, it performs much better than WATG (ρ = 0.823; Fig. 2B) because it takes into account the accumulated effects of all regulatees. In summary, algorithms that focus on measuring the “local” TF activities, i.e., TFA and WATG performed much worse than the network centrality-based methods (PageRank and WSTG), and PageRank showed the best performance.
Fig. 2. Computational validation of the Taiji framework.

(A to E) The performance of various metrics, PageRank (A),WSTG (B), WATG (C), gene expression (D), and TFA (E) on predicting TFs’ importance, assessed by the Spearman’s correlation with TFs’ perturbation magnitudes resulted from simulated knockouts in yeast. The benchmark network contains 4441 genes and 12,873 edges. One hundred fifty-seven of the genes are regulators. (F) The performances of various metrics on predicting TFs’ importance in 20 subnetworks extracted from the yeast gene regulatory network. Each subnetwork contains 1000 genes and at least 50 regulators. (G) Noises introduced by random insertions, deletions, or substitutions do not have large impact on PageRank’s performance. Each box shows the results from 20 yeast subnetworks.
A major advantage of PageRank algorithm, compared to other simpler centrality metrics such as WSTG, is that it is defined recursively and, hence, depends not only on the number of connected nodes but also on those nodes’ PageRank values. Therefore, PageRank performed better than WSTG for the yeast network. To further confirm PageRank’s superior performance, we conducted additional benchmarks using the Escherichia coli network and another 20 random subnetworks extracted from the yeast network (fig. S1D and Fig. 2F). In all the tested cases, PageRank consistently outperformed WSTG and other methods.
Transcriptional regulatory networks constructed from TF binding site predictions can be quite noisy. Therefore, assessing the robustness of PageRank algorithm against noises is critical for ensuring our results are reliable. For this purpose, we randomly inserted, deleted, or substituted a fraction of edges in the 20 benchmark networks mentioned above. We investigated whether the PageRank results were affected after introducing these noises. The result showed that the PageRank algorithm is resistant to random insertions (Fig. 2G), suggesting that adding uniform noises to the network without modifying the existing edges is less likely to distort the real signal. Second, random deletion has only a minor effect on PageRank’s performance. Removing a large percentage of the edges only induced a small drop of the average correlation. For example, when deleting 80% of the edges, the average correlation of the PageRank scores with the ground truth drops to 0.691 from 0.839, which is still higher than that of gene expression (ρ = 0.616). When deleting all edges from the networks, the PageRank algorithm has the same performance as the gene expression ranking. The reason is that the gene expression levels are used to personalize the PageRank algorithm. After removing all edges, the ranking is then solely determined by the gene expression levels. Among the three types of mutations, random substitutions pose the largest impact on PageRank’s performance. However, as long as 20% of the edges are preserved, PageRank can still predict well (ρ = 0.663). Overall, we found that the PageRank algorithm is very robust against random noises. This feature is very important when applying this method to noisy biological networks.
The de novo construction of biological networks remains challenging. We indirectly assessed the accuracy of the constructed networks by predicting genes’ expression changes. The predicted values are correlated with the experimental results despite the absolute values deviate slightly (fig. S1B), which suggests some unknown noise in the data or the constructed network. However, the random noise does not have major impact on the performance of our method, as shown in Fig. 2G.
Taiji reveals driver TFs during embryogenesis
We constructed transcriptional regulatory networks in 12 tissues at eight developmental stages. The average number of nodes and edges in these networks is 16,187 and 320,227, respectively. Six hundred thirty-nine (3.95%) of the nodes are TFs. On average, each TF regulates 501 genes, and each gene is regulated by 19 TFs (fig. S2). To characterize the dynamics of TFs’ global influences across different tissues and stages, we removed TFs that do not present large variations [coefficients of variance (CVs) less than 1] in their PageRank scores, which gave us a list of 245 most variable TFs. We plotted the PageRank score matrix in Fig. 3A, ordering the samples (columns) by tissue types. We found that different tissues have quite distinct TF regulatory patterns (Fig. 3A, left). In contrast, when ordering the same data by developmental stages, no discernible patterns were observed (Fig. 3A, right), suggesting that transcriptional regulation largely takes place in a tissue-dependent fashion. To investigate the relationship between PageRank scores and expression levels, we calculated the Spearman’s correlation between PageRank scores and expression levels for the 245 TFs (Fig. 3B). While 60% of TFs’ expression levels strongly correlate with their PageRank scores (ρ > 0.75), a substantial portion (9.3%) of them show weak or no correlations (ρ > 0.25). The rest of the TFs’ expression levels have moderate correlations with PageRank scores (0.25 < ρ < 0.75). The fact that about half of the TFs’ expression levels are highly correlated with their PageRank scores may explain why gene expression achieves the third best in our in silico validation (Fig. 2F).
Fig. 3. TFA determined from Taiji accurately predicts tissue specification.
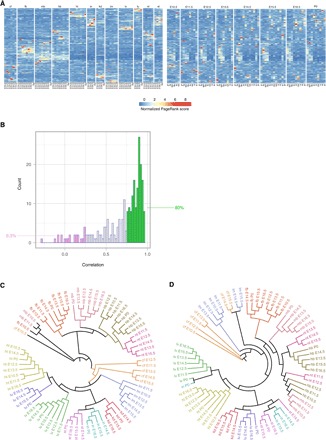
(A) Two different views, arranged by tissue types (left) and arranged by stages (right), of the 245 most variable TFs’ ranking scores during embryogenesis. (B) Histogram of the Spearman’s correlations between PageRank scores and expression levels of 245 TFs across tissues and stages. Sixty percent of the TFs show strong correlations (>0.75), and 9.3% of the TFs show weak or no correlation (<0.25). (C) A lineage tree constructed from the ranking scores of the 245 TFs. (D) A lineage tree constructed from the gene expression levels, determined by RNA-seq, of the same 245 TFs in (C). cf, craniofacial prominence; in, intestine; kd, kidney; lm, limb; lu, lung; nt, neural tube; st, stomach.
Using the FastME algorithm (18), we constructed a lineage tree based on the PageRank scores of 245 TFs (Fig. 3C). The result shows that the samples are mostly grouped by their tissue types. A mixture is only observed for four closely related samples (forebrain at E10.5, midbrain at E11.5, midbrain at E10.5, and craniofacial prominence at E10.5), which may be due to the difficulty of dissecting these tissues at their early stages. As a comparison, we found many unexpected clusters in the lineage tree constructed using the gene expression profile of the same 245 TFs (Fig. 3D). For instance, intestine at postnatal day 0 (P0) is grouped with liver samples; craniofacial prominence at E14.5 and E15.5 are clustered with limb samples. These results further demonstrate that PageRank is superior to gene expression as an indicator of TFs’ activities.
We then asked whether there exist constitutively active TFs that exhibit high-ranking scores across all tissues and stages. For this purpose, we first selected TFs with average ranking scores larger than 3 × 10⁻³, corresponding to the top 10% of all TFs. Next, we retained TFs of which the CVs are less than 0.5, giving us 35 constitutively active TFs in total (Fig. 4A). Similar to their transcriptional activities, the expression levels of these TFs remain relatively high across tissues and stages (fig. S3). Functional classification analysis revealed that these TFs are enriched in “metabolic process,” “cellular process,” and “developmental process,” suggesting their general roles in basic cellular functions and embryonic development.
Fig. 4. Identification of driver TFs during mouse embryogenesis.
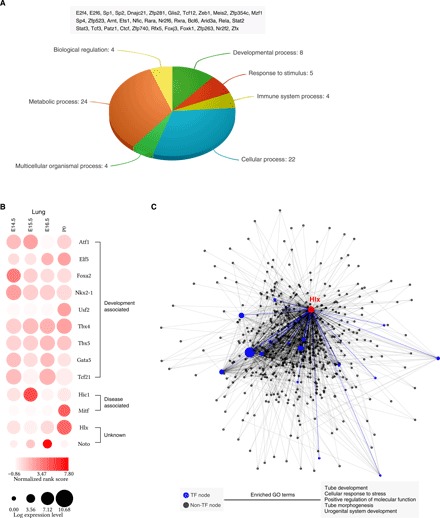
(A) Functional classification of 35 constitutively active TFs reveals their functions in essential biological processes. (B) Identified driver TFs in the lung, including nine TFs related with lung development, two TFs related with lung diseases, and two TFs with unknown functions. (C) The network for Hlx, a previously unknown driver TF for the lung, and its regulatees in the lung at P0. Larger nodes represent TFs with higher rank. The bottom shows the top five enriched Gene Ontology (GO) terms for Hlx’s regulatees.
The earliest developmental stage that mouse ENCODE project has surveyed starts from E10.5. To obtain a complete view of mouse embryogenesis, we incorporated another published dataset that profiled the transcriptome- and genome-wide chromatin accessibility in earlier mouse embryos (19), spanning stages from E1 (two-cell) to E5 (blastocyst stage). Together, we have identified potential driver TFs in 12 tissues from eight stages, as well as those in two-, four-, eight-cell embryos, inner cell masses (ICMs), and mESCs. For the first time, the complex transcriptional regulation during mouse embryonic development is systematically mapped (figs. S4 and S5). The identified driver TFs include many well-known key regulators. For example, we successfully identified Sox2, Nanog, and Pou5f1 (also known as Oct4) as crucial TFs in mESCs. To systematically validate our predictions, we performed literature search in five tissues that have been extensively studied, including the heart, lung, liver, kidney, and limb. Forty one of 56 (73.2%) TFs identified by our method are shown to be associated with either development or disease of these tissues (see the Supplementary Materials for details). For instance, 9 of 13 identified driver TFs in the lung have been previously reported to play a pivotal role during the bronchiole tree and terminal alveolar region formation of mouse lung (Fig. 4B) and another two TFs relate with lung cancer (20, 21). Apart from the spatial specificity (across tissues), the temporal pattern of TFs’ activity (across stages) can also be accurately captured by our approach. For instance, Nkx2-1 is initiated at the early stage of lung development, and Nkx2-1 mutant embryos are arrested at early pseudoglandular (E11 to E15) stage (22), which is consistent with our analysis. Similarly, another key regulator, Foxa2, is present in the epithelial cells from the beginning of lung bud formation, and transgenic mice with Foxa2 ectopically expressed in the lung epithelial cells exhibited defects in branching morphogenesis (23).
We have also found many previously unknown TFs. Hlx, identified as a key regulator for lung development, has not yet been studied in the lung. We showed that Hlx is regulating a number of high-rank TFs at P0, including several aforementioned constitutively active TFs, i.e., Sp1, Meis2, and Zfx (Fig. 4C). The functional enrichment analysis of all Hlx’s regulatees shows that they likely participate in epithelial tubes development in the lung. Besides, some of the predicted TFs have been studied in closely related tissues. For instance, Vsx1, predicted as an important regulator in the hindbrain, was related to retina development (24).
During development, ESCs differentiate into three germ layers—ectoderm, endoderm, and mesoderm. To identify TFs that are specific to each layer, we grouped and compared tissues originated from the same layer against tissues from other layers (Fig. 5). The student t tests with a P value cutoff of 0.001 were used to identify TFs whose ranks change significantly in one germ layer compared with other layers. The functional relevance of the found layer-specific TFs is supported by the literature. For example, we have identified Zic1, Zic4, and Zic5 as specific regulators for ectoderm, which is in agreement with the role of Zic family in neural development (25). In addition, many previously known layer-specific markers were also found from our analysis, e.g., Pax6 and Otx2 for ectoderm (26, 27) and Foxa2 for endoderm (28). To analyze the tissue specificity of the predicted driver TFs (listed in fig. S4), we further compared each tissue with other tissues originated from the same layer and used the student t tests with a P value cutoff of 0.001 to identify tissue-specific driver TFs. In total, 68 tissue-specific driver TFs were found, as shown in Fig. 5. Together, these results provide a comprehensive map for the future mechanistic study of embryonic development.
Fig. 5. Germ layer– and tissue-specific driver TFs in mouse embryonic development.
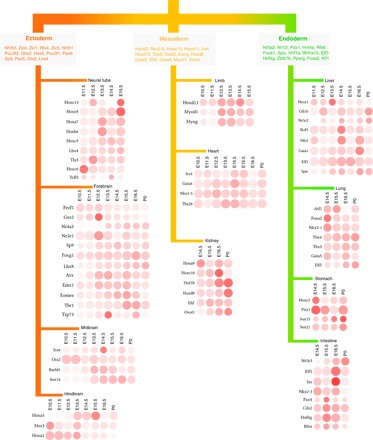
The legends for the color scheme and the shape of the bubble are the same as those in fig. S4. Because of the limited space, we do not show them in this figure.
Transcriptional waves during embryogenesis
In addition to the tissue specificity, we have analyzed the temporal activity of TFs during the mouse embryogenesis. To identify clusters of TFs that show similar spatial-temporal patterns, we first performed the principal component analysis to reduce the dimension of the TF ranking score matrix. We reserved the first 20 components for clustering analysis as adding more components did not gain much explained variance (fig. S6A). We used the silhouette analysis (29) to select the clustering method and the number of clusters. Among the five algorithms we have tested, the k-means algorithm performed best, identifying 25 distinct dynamic patterns during embryogenesis (fig. S6B). We further performed functional enrichment analysis to identify enriched Gene Ontology (GO) terms for these clusters (listed in fig. S7). In general, we found that the enriched GO terms are consistent with the dynamic patterns of these clusters. For example, the cluster C12, showing a heart-specific dynamic pattern, is enriched with heart-specific functions, such as “embryonic heart tube development,” “blood vessel development,” and “cardiac ventricle development.”
The 25 clusters represent transcriptional waves that orchestrate the tissue differentiation. The first wave starts from as early as the two-cell stage, represented by the cluster C7 (Fig. 6A). In C7, TFs show the highest activity at two-cell stage (or possibly earlier as we do not have data in zygote). Example TFs from C7 include germ cell–specific factors such as Obox1 and Nr6a1, both of which are essential for embryogenesis (30, 31), highlighting the roles of parental control in early development. As C7 wanes, C21 is turned on during four- and eight-cell stages, and C13 and C16 emerge in ICM and ESC, respectively. In C13 and C16, we found many well-known pluripotency regulators, such as Pou5f1, Nanog, and Sox2. These results provide valuable insights into the transcriptional program during early embryogenesis.
Fig. 6. Temporal transcriptional waves direct tissue differentiation during embryogenesis.
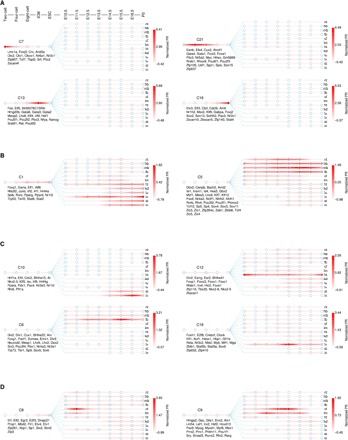
(A) Four waves in early embryonic development. (B) Layer-specific transcriptional waves. (C) Four examples of tissue-specific transcriptional waves. (D) Stage-specific waves in craniofacial development. Circles in each panel represent developmental stages. From left to right, they are two-, four-, eight-cell, ICM, ESC, E10.5, E11.5, E12.5, E13.5, E14.5, E15.5, E16.5, and P0. TF members are shown below the names of clusters. PR, PageRank score.
We also found clusters that are responsible for the differentiation of tissues from specific layers. For example, C5 is highly active in all four brain tissues from E10.5 to P0, suggesting its critical role in neural differentiation. Many TFs that are crucial for neural development were recovered in C5, such as Zic5 (25), Pax6 (27), and Gbx2 (32). In contrast to C5, C1 is more active in mesoderm- and endoderm-derived tissues. TFs in this cluster are associated with functions specific to the development of these two layers. For example, Hnf4a was reported to play pivotal roles in the liver, colon, and kidney development (33–35).
Besides germ layer–specific transcriptional waves, there are also tissue-specific transcriptional programs that drive the differentiation of individual tissue. In Fig. 6C, we highlighted four clusters, C10, C12, C6, and C18, which are responsible for the stomach/intestine, heart, forebrain, and liver development, respectively. Note that we have found such a program for nearly every tissue, including the craniofacial/limb (C9), lung (C3), kidney (C4), midbrain (C24), and neural tube/hindbrain (C19). See fig. S7 for details.
Most of the tissue-specific TFs are long lived, playing roles in almost every stage of development. However, a few TFs exhibit transient transcriptional spikes, probably related to their stage-specific functions. In Fig. 6D, we show two such examples which activate at different stages in craniofacial development (C8 for E11.5 and C9 for E13.5 and E14.5). As the mechanism of craniofacial development remains largely unknown, our discovery, therefore, provides an invaluable resource for the future studies.
The mouse embryonic data we analyzed here provide the first comprehensive temporal transcriptomic and epigenomic dynamics in a diverse set of tissues, revealing “transcriptional waves” in which TFs are active in specific tissues at a particular development stage. The observed transcriptional waves provide new insights into understanding how the development of different tissues is coordinated. During embryonic development, the growth of tissues must be tightly coordinated through the control of developmental timing. This can be achieved by a series of central instructive signals that activate at different stages to synchronize the development of tissues. However, in this study, we did not observe any TF that is active in all tissues at a particular developmental stage, and hence, we conclude that central instructive signals may not exist at the transcriptional regulation level. Instead, we propose a “distributed coordination” model in which the coordination of tissue development is achieved by tissue-to-tissue communications; the timing information is communicated in a tissue-to-tissue fashion and then propagated through the entire body. Evolutionarily, the model of distributed coordination removes the burden of developing a “central authority,” which is fragile and inefficient. The distributed coordination has been shown to play an important role in Drosophila tissue development (36). Our analyses show that the same principle may also apply to mouse embryonic development.
DISCUSSION
The embryonic development is controlled by TFs that relay environmental signals through control of gene expression. Efficient and precise regulation of this process requires cooperation of many TFs to form complex transcriptional circuits. As a result, the global influence of a TF cannot be readily inferred from its local activity, i.e., its regulatory effect on direct target genes. To identify driver TFs in different tissues and at different stages during mouse embryogenesis, we developed a novel framework to assess the global influence or activity of a TF. In silico simulations show that our method is able to predict genes’ influences with great accuracy, outperforming other methods for the similar purpose. Compared with metrics for defining TFs’ local activities (4, 5), gene expression performs reasonably well in our benchmark data, and the PageRank scores correlate well with gene expressions for many TFs in real data. However, there exists a large portion (~40%) of TFs showing only weak or moderate correlation between their PageRank scores and gene expression levels. In our previous work, we showed this type of TFs can indeed play a pivotal role in CD8+ T cell differentiation (9). Because the correlation between gene expression and the activity of a TF may vary in different cell states, our method is more robust in predicting TF importance regardless of its activity correlated or not with its expression.
Our method Taiji is capable of flexibly integrating diverse genomic and epigenomic data, including ChIP-seq, RNA-seq, ATAC-seq, and Hi-C. Considering the current limitation of Hi-C experiments, we provide a computational alternative when Hi-C experiment is infeasible or unavailable. In this work, we predicted three-dimensional (3D) chromatin interactions in 12 tissues and eight developmental stages of the mouse embryo, which provides the first 3D chromatin organization information. By leveraging the strength of various experiments, we have successfully mapped lineage-, tissue-, and stage-specific driver TFs throughout the mouse embryonic development from as early as the two-cell stage to P0. In addition to retrieving known key regulators, we have also identified previously unknown TFs responsible for tissue differentiation and development progress, which can guide the future experimental investigations to understand the regulatory mechanisms of development.
Particularly interesting is the observation of transcriptional waves represented by TF combinations that activate in a spatiotemporal fashion. We did not find stage-specific tissue-independent TFs, i.e., TFs that are active in all tissues at a specific stage (Fig. 3, A, C, and D). Therefore, we hypothesize that the coordination of tissue development is not achieved by global regulators, i.e., there lacks a “central timer,” but by sequential activations of regulators in individual tissues that function like a “distributed timer” and use tissue-to-tissue communication to ensure synchronization between tissues, i.e., tissues cross-talk and inform each other what is the current developmental stage. A distributed timer alleviates the burden of developing a central timer during evolution and also provides a more robust timing strategy relying on fewer pathways or loci.
MATERIALS AND METHODS
Prediction of chromatin interactions using EpiTensor
TADs were taken from the previous study (15). The input histone modification data were downloaded from the ENCODE data portal, including a common set of eight histone marks at seven time points in five tissues: H3K27ac, H3K27me3, H3K36me3, H3K4me1, H3K4me2, H3K4me3, H3K9ac, and H3K9me3 at developmental stages of E11.5, E12.5, E13.5, E14.5, E15.5, E16.5, and P0 in the heart, liver, forebrain, midbrain, and hindbrain. EpiTensor performed tensor analysis in the 4D space composed of tissue, time point, histone mark, and locus dimensions. The peaks in the eigenlocus vectors represent the covariation of histone modification signals that indicate 3D interactions of the corresponding loci. We considered the first 40 eigenlocus vectors, capturing, on average, 96.98% of total variance. The peaks in each eigenlocus vector were called by comparing to randomly shuffled background. The false discovery rate (FDR) and P value were calculated for each peak. In this study, we used 0.005 as the FDR cutoff. The EpiTensor predictions were validated in mESCs. First, we obtained the mESC-specific interactions by overlapping all predicted interactions in different tissues/stages with the H3K27ac peaks from mESC (ENCODE: ENCSR000CDE). We then compared the mESC-specific predictions with Hi-C interactions from Dixon et al. (15). We followed the same procedures of Zhu et al. (11) to draw the receiver operating characteristic curve.
Constructing TF regulatory networks
We used TF motifs, represented by position weight matrix, to predict TF binding sites at open chromatin regions within genes’ promoters or enhancers and then connected these TFs to downstream genes. We chose this strategy because it is one of the most scalable approaches for studying TF gene regulations in a reasonably accurate way. Our network construction method contains three major steps listed below:
1) Identifying active promoters and enhancers: We define a gene’s promoter as the 6-kb interval that covers the 5-kb upstream and the 1-kb downstream of the gene’s TSS. As active promoters are usually indicated by active histone marks, we used the H3K27ac ChIP-seq peaks to determine the activity of a given promoter. In particular, we called a promoter active if it is overlapped with at least one peak. Any gene of which the promoter is inactive was excluded from the network. To increase the sensitivity, i.e., preserving more active genes in the analysis, in this step, we used a relaxed cutoff (q value equals to 0.1) in MAC’s (model-based analysis of ChIP-Seq’s) (37) peak calling procedure. Distal peaks that are not overlapped with promoters were considered as enhancers.
2) Identifying genes’ regulatory domains: The definition of gene regulatory domain was borrowed from the GREAT (Genomic Regions Enrichment of Annotations Tool) software (38). Specifically, each gene was assigned a basal regulatory domain, which is the gene’s promoter. The gene regulatory domain was then extended in both directions to the nearest gene’s basal domain but no more than 1000 kb in one direction.
3) Scanning TF binding sites and linking TFs to target genes: We used the H3K27ac peaks called by ENCODE. For each peak, we identified its summit and scanned TF binding sites using FIMO’s (Find Individual Motif Occurrences’) algorithm (39) with the P value cutoff 1 × 10⁻⁵ in the 100-bp interval centered around the summit. In this study, we used the mouse TF motif database curated by the CIS-BP database (12) that contains the motifs of 639 TFs. To link enhancers to their target genes, we first used long-range chromosome interactions to identify the interacting promoters for each enhancer. TF binding sites in these enhancers were then linked to corresponding promoters/genes. For the rest of the predicted TF binding sites of which the assignments cannot be made using the 3D chromosome information, we assigned them to genes according to the regulatory domains defined in previous steps. Last, we formed a directed edge from a TF to a gene in the network if the TF has at least one binding site that is linked to the given gene.
Computing the ranking scores for TFs in the network
We used the personalized PageRank algorithm to calculate the ranking scores for TFs. We first assigned weights to the edges and nodes in TF regulatory networks. The weight of a node was calculated from the relative expression level of its representing gene. A gene’s relative expression levels among different cell types were computed by applying the.
z score transformation to its absolute expression levels. Suppose a gene’s relative expression level in cell type i is zi, the node weight for this gene in cell type i was then given by ezi. The weight of an edge in a network was given by the logarithm of the gene expression level of the source (TF). Let s be the vector containing node weights and W be the edge weight matrix. The personalized PageRank score vector v was calculated by solving a system of linear equations v = (1 − d)s + dWv, where d is the damping factor (default to 0.85). The above equation can be solved in an iterative fashion, i.e., setting vt + 1 = (1-d)s + dWvt.
Validation of the network construction method
Considering the computational feasibility, we only selected 24 of 72 samples to perform validation. They are the embryonic facial prominence at E10.5 and E15.5, forebrain at E10.5 and P0, midbrain at E10.5 and P0, hindbrain at E10.5 and P0, heart at E10.5 and P0, limb at E10.5 and E15.5, stomach at E14.5 and P0, liver at E11.5 and P0, neural tube at E11.5 and E15.5, kidney at E14.5 and P0, intestine at E14.5 and P0, and lung at E14.5 and P0. For every sample pair, we selected the top 500 most expressed genes from each sample. The log fold changes of these genes are the response variables of our prediction model. According to the constructed network, we identified the upstream regulators of those genes and computed their log fold changes. These were the predictors for the model. These procedures were repeated for all 276 sample pairs, and the results were combined. In total, we got 158,600 records for training a random forest model with 10-fold cross-validation.
Benchmarking different ranking algorithms
The gene expression profiles of wild-type and knockout experiments were simulated using the GeneNetWeaver (17). The yeast and E. coli networks were provided by GeneNetWeaver, and additional 20 subnetworks were sampled from the yeast network. Each contains at least 50 regulators of 1000 genes. The formula of WSTG is given by WSTG(t) = Siϵregulatees of t wigi, where t represents the TF, gi is the expression level of gene i, and wi represents the weight or confidence of the TF gene regulation between TF t and gene i.
Lineage tree construction
Lineage trees were constructed by running the FastME algorithm (18) on normalized ranking matrix, which was obtained from row-wise z score transformation of the original matrix.
Identification of driver TFs for tissues
The output of Taiji pipeline is a matrix, consisting of TFs’ ranking scores from different experiments. The rows and columns of the matrix represent TFs and experiments, respectively. To identify driver TFs, we first removed the rows (TFs) with CVs less than 1. We then grouped the columns (experiments) from various stages together whether they are from the same tissue and averaged the ranking scores in each group. Assuming that the average ranking scores are normally distributed, we calculated the deviation from the center for each score and computed the P value. A P value cutoff of 0.01 was used for calling driver TFs.
Supplementary Material
Acknowledgments
Funding: This project is partially supported by NIH (U54HG006997 and R01HG009626) and CIRM (RB5 07012). Author contributions: K.Z. and W.W. conceived the study and interpreted the results. K.Z. designed the Taiji software. K.Z. and M.W. performed the data analysis with contributions from Y.Z. K.Z. and W.W. wrote the manuscript with contributions from M.W. and Y.Z. W.W. supervised the project. Competing interests: The authors declare that they have no competing interests. Data and materials availability: All data needed to evaluate the conclusions in the paper are present in the paper and/or the Supplementary Materials. All data analyzed during this study can be found in ENCODE portal or GEO database. A full list of accession numbers is included in data file S1. The Taiji software is available at http://wanglab.ucsd.edu/star/taiji. Additional data related to this paper may be requested from the authors.
SUPPLEMENTARY MATERIALS
Supplementary material for this article is available at http://advances.sciencemag.org/cgi/content/full/5/3/eaav3262/DC1
Fig. S1. Validating the Taiji framework.
Fig. S2. The topological properties of genetic networks.
Fig. S3. PageRank scores (color shade) and expression levels (circle size) of 35 constitutively active TFs across 12 tissues and eight stages.
Fig. S4. Identification of driver TFs in 12 tissues.
Fig. S5. Identification of driver TFs in early mouse embryonic development, including two-, four-, and eight-cell stages, ICM, and ESC.
Fig. S6. Selecting algorithms and parameters for clustering analysis.
Fig. S7. Transcriptional waves direct tissue differentiation during mouse embryogenesis.
Table S1. Driver TFs in the heart.
Table S2. Driver TFs in the limb.
Table S3. Driver TFs in the liver.
Table S4. Driver TFs in the lung.
Table S5. Driver TFs in the kidney.
Data file S1. The accession numbers of datasets analyzed in this study.
Data file S2. Germ layer–specific TFs and their P values.
Data file S3. PageRank scores for all TFs across different stages and tissues.
Data file S4. Chromatin interaction predictions made by EpiTensor.
REFERENCES AND NOTES
- 1.Spitz F., Furlong E. E. M., Transcription factors: From enhancer binding to developmental control. Nat. Rev. Genet. 13, 613–626 (2012). [DOI] [PubMed] [Google Scholar]
- 2.Filtz T. M., Vogel W. K., Leid M., Regulation of transcription factor activity by interconnected post-translational modifications. Trends Pharmacol. Sci. 35, 76–85 (2014). [DOI] [PMC free article] [PubMed] [Google Scholar]
- 3.Bussemaker H. J., Li H., Siggia E. D., Regulatory element detection using correlation with expression. Nat. Genet. 27, 167–174 (2001). [DOI] [PubMed] [Google Scholar]
- 4.Schacht T., Oswald M., Eils R., Eichmüller S. B., König R., Estimating the activity of transcription factors by the effect on their target genes. Bioinformatics 30, i401–i407 (2014). [DOI] [PMC free article] [PubMed] [Google Scholar]
- 5.Arrieta-Ortiz M. L., Hafemeister C., Bate A. R., Chu T., Greenfield A., Shuster B., Barry S. N., Gallitto M., Liu B., Kacmarczyk T., Santoriello F., Chen J., Rodrigues C. D. A., Sato T., Rudner D. Z., Driks A., Bonneau R., Eichenberger P., An experimentally supported model of the Bacillus subtilis global transcriptional regulatory network. Mol. Syst. Biol. 11, 839 (2015). [DOI] [PMC free article] [PubMed] [Google Scholar]
- 6.Zotenko E., Mestre J., O'Leary D. P., Przytycka T. M., Why do hubs in the yeast protein interaction network tend to be essential: Reexamining the connection between the network topology and essentiality. PLOS Comput. Biol. 4, e1000140 (2008). [DOI] [PMC free article] [PubMed] [Google Scholar]
- 7.Boone C., Bussey H., Andrews B. J., Exploring genetic interactions and networks with yeast. Nat. Rev. Genet. 8, 437–449 (2007). [DOI] [PubMed] [Google Scholar]
- 8.Milner J. J., Toma C., Yu B., Zhang K., Omilusik K., Phan A. T., Wang D., Getzler A. J., Nguyen T., Crotty S., Wang W., Pipkin M. E., Goldrath A. W., Runx3 programs CD8+ T cell residency in non-lymphoid tissues and tumours. Nature 552, 253–257 (2017). [DOI] [PMC free article] [PubMed] [Google Scholar]
- 9.Yu B., Zhang K., Milner J. J., Toma C., Chen R., Scott-Browne J. P., Pereira R. M., Crotty S., Chang J. T., Pipkin M. E., Wang W., Goldrath A. W., Epigenetic landscapes reveal transcription factors that regulate CD8+ T cell differentiation. Nat. Immunol. 18, 573–582 (2017). [DOI] [PMC free article] [PubMed] [Google Scholar]
- 10.L. Page, S. Brin, R. Motwani, T. Winograd, The PageRank Citation Ranking: Bringing Order to the Web (Stanford InfoLab, 1999). [Google Scholar]
- 11.Zhu Y., Chen Z., Zhang K., Wang M., Medovoy D., Whitaker J. W., Ding B., Li N., Zheng L., Wang W., Constructing 3D interaction maps from 1D epigenomes. Nat. Commun. 7, 10812 (2016). [DOI] [PMC free article] [PubMed] [Google Scholar]
- 12.Weirauch M. T., Yang A., Albu M., Cote A. G., Montenegro-Montero A., Drewe P., Najafabadi H. S., Lambert S. A., Mann I., Cook K., Zheng H., Goity A., van Bakel H., Lozano J.-C., Galli M., Lewsey M. G., Huang E., Mukherjee T., Chen X., Reece-Hoyes J. S., Govindarajan S., Shaulsky G., Walhout A. J. M., Bouget F.-Y., Ratsch G., Larrondo L. F., Ecker J. R., Hughes T. R., Determination and inference of eukaryotic transcription factor sequence specificity. Cell 158, 1431–1443 (2014). [DOI] [PMC free article] [PubMed] [Google Scholar]
- 13.Mudge J. M., Harrow J., Creating reference gene annotation for the mouse C57BL6/J genome assembly. Mamm. Genome 26, 366–378 (2015). [DOI] [PMC free article] [PubMed] [Google Scholar]
- 14.Visel A., Minovitsky S., Dubchak I., Pennacchio L. A., VISTA Enhancer Browser—A database of tissue-specific human enhancers. Nucleic Acids Res. 35, D88–D92 (2007). [DOI] [PMC free article] [PubMed] [Google Scholar]
- 15.Dixon J. R., Selvaraj S., Yue F., Kim A., Li Y., Shen Y., Hu M., Liu J. S., Ren B., Topological domains in mammalian genomes identified by analysis of chromatin interactions. Nature 485, 376–380 (2012). [DOI] [PMC free article] [PubMed] [Google Scholar]
- 16.Cushion T. D., Dobyns W. B., Mullins J. G. L., Stoodley N., Chung S.-K., Fry A. E., Hehr U., Gunny R., Aylsworth A. S., Prabhakar P., Uyanik G., Rankin J., Rees M. I., Pilz D. T., Overlapping cortical malformations and mutations in TUBB2B and TUBA1A. Brain 136, 536–548 (2013). [DOI] [PubMed] [Google Scholar]
- 17.Schaffter T., Marbach D., Floreano D., GeneNetWeaver: In silico benchmark generation and performance profiling of network inference methods. Bioinformatics 27, 2263–2270 (2011). [DOI] [PubMed] [Google Scholar]
- 18.Desper R., Gascuel O., Fast and accurate phylogeny reconstruction algorithms based on the minimum-evolution principle. J. Comput. Biol. 9, 687–705 (2002). [DOI] [PubMed] [Google Scholar]
- 19.Wu J., Huang B., Chen H., Yin Q., Liu Y., Xiang Y., Zhang B., Liu B., Wang Q., Xia W., Li W., Li Y., Ma J., Peng X., Zheng H., Ming J., Zhang W., Zhang J., Tian G., Xu F., Chang Z., Na J., Yang X., Xie W., The landscape of accessible chromatin in mammalian preimplantation embryos. Nature 534, 652–657 (2016). [DOI] [PubMed] [Google Scholar]
- 20.Wang X., Wang Y., Xiao G., Wang J., Zu L., Hao M., Sun X., Fu Y., Hu G., Wang J., Hypermethylated in cancer 1(HIC1) suppresses non-small cell lung cancer progression by targeting interleukin-6/Stat3 pathway. Oncotarget 7, 30350–30364 (2016). [DOI] [PMC free article] [PubMed] [Google Scholar]
- 21.Simmons J. L., Pierce C. J., Al-Ejeh F., Boyle G. M., MITF and BRN2 contribute to metastatic growth after dissemination of melanoma. Sci. Rep. 7, 10909 (2017). [DOI] [PMC free article] [PubMed] [Google Scholar]
- 22.Minoo P., Su G., Drum H., Bringas P., Kimura S., Defects in tracheoesophageal and lung morphogenesis in Nkx2.1(−/−) mouse embryos. Dev. Biol. 209, 60–71 (1999). [DOI] [PubMed] [Google Scholar]
- 23.Wan H., Dingle S., Xu Y., Besnard V., Kaestner K. H., Ang S.-L., Wert S., Stahlman M. T., Whitsett J. A., Compensatory roles of Foxa1 and Foxa2 during lung morphogenesis. J. Biol. Chem. 280, 13809–13816 (2005). [DOI] [PubMed] [Google Scholar]
- 24.Shi Z., Jervis D., Nickerson P. E. B., Chow R. L., Requirement for the paired-like homeodomain transcription factor VSX1 in type 3a mouse retinal bipolar cell terminal differentiation. J. Comp. Neurol. 520, 117–129 (2012). [DOI] [PubMed] [Google Scholar]
- 25.Merzdorf C. S., Emerging roles for zic genes in early development. Dev. Dyn. 236, 922–940 (2007). [DOI] [PubMed] [Google Scholar]
- 26.Gammill L. S., Sive H., otx2 expression in the ectoderm activates anterior neural determination and is required for Xenopus cement gland formation. Dev. Biol. 240, 223–236 (2001). [DOI] [PubMed] [Google Scholar]
- 27.Zhang X., Huang C. T., Chen J., Pankratz M. T., Xi J., Li J., Yang Y., LaVaute T. M., Li X.-J., Ayala M., Bondarenko G. I., Du Z.-W., Jin Y., Golos T. G., Zhang S.-C., Pax6 is a human neuroectoderm cell fate determinant. Cell Stem Cell 7, 90–100 (2010). [DOI] [PMC free article] [PubMed] [Google Scholar]
- 28.Burtscher I., Lickert H., Foxa2 regulates polarity and epithelialization in the endoderm germ layer of the mouse embryo. Development 136, 1029–1038 (2009). [DOI] [PubMed] [Google Scholar]
- 29.Rousseeuw P. J., Silhouettes: A graphical aid to the interpretation and validation of cluster analysis. J. Comput. Appl. Math. 20, 53–65 (1987). [Google Scholar]
- 30.Lan Z.-J., Chung A. C.-K., Xu X., DeMayo F. J., Cooney A. J., The embryonic function of germ cell nuclear factor is dependent on the DNA binding domain. J. Biol. Chem. 277, 50660–50667 (2002). [DOI] [PubMed] [Google Scholar]
- 31.Stein P., Medvedev S., Schultz R. M., OBOX proteins are recruited during oocyte maturation and are essential for early development in mouse. Biol. Reprod. 87, 210 (2012). [Google Scholar]
- 32.Szabó N.-E., Zhao T., Zhou X., Alvarez-Bolado G., The role of Sonic hedgehog of neural origin in thalamic differentiation in the mouse. J. Neurosci. 29, 2453–2466 (2009). [DOI] [PMC free article] [PubMed] [Google Scholar]
- 33.Lucas B., Grigo K., Erdmann S., Lausen J., Klein-Hitpass L., Ryffel G. U., HNF4α reduces proliferation of kidney cells and affects genes deregulated in renal cell carcinoma. Oncogene 24, 6418–6431 (2005). [DOI] [PubMed] [Google Scholar]
- 34.Garrison W., Battle M. A., Yang C., Kaestner K. H., Sladek F. M., Duncan S. A., Hepatocyte nuclear factor 4α is essential for embryonic development of the mouse colon. Gastroenterology 130, 1207–1220 (2006). [DOI] [PMC free article] [PubMed] [Google Scholar]
- 35.DeLaForest A., Nagaoka M., Si-Tayeb K., Noto F. K., Konopka G., Battle M. A., Duncan S. A., HNF4A is essential for specification of hepatic progenitors from human pluripotent stem cells. Development 138, 4143–4153 (2011). [DOI] [PMC free article] [PubMed] [Google Scholar]
- 36.Andersen D. S., Colombani J., Léopold P., Coordination of organ growth: Principles and outstanding questions from the world of insects. Trends Cell Biol. 23, 336–344 (2013). [DOI] [PubMed] [Google Scholar]
- 37.Zhang Y., Liu T., Meyer C. A., Eeckhoute J., Johnson D. S., Bernstein B. E., Nussbaum C., Myers R. M., Brown M., Li W., Liu X. S., Model-based analysis of ChIP-Seq (MACS). Genome Biol. 9, R137 (2008). [DOI] [PMC free article] [PubMed] [Google Scholar]
- 38.McLean C. Y., Bristor D., Hiller M., Clarke S. L., Schaar B. T., Lowe C. B., Wenger A. M., Bejerano G., GREAT improves functional interpretation of cis-regulatory regions. Nat. Biotechnol. 28, 495–501 (2010). [DOI] [PMC free article] [PubMed] [Google Scholar]
- 39.Grant C. E., Bailey T. L., Noble W. S., FIMO: Scanning for occurrences of a given motif. Bioinformatics 27, 1017–1018 (2011). [DOI] [PMC free article] [PubMed] [Google Scholar]
- 40.Oh S.-Y., Kim J. Y., Park C., The ETS factor, ETV2: A master regulator for vascular endothelial cell development. Mol. Cells 38, 1029–1036 (2015). [DOI] [PMC free article] [PubMed] [Google Scholar]
- 41.Li T., Liu C., Xu Y., Guo Q., Chen S., Sun K., Xu R., Identification of candidate genes for congenital heart defects on proximal chromosome 8p. Sci. Rep. 6, 36133 (2016). [DOI] [PMC free article] [PubMed] [Google Scholar]
- 42.Connelly J. J., Wang T., Cox J. E., Haynes C., Wang L., Shah S. H., Crosslin D. R., Hale A. B., Nelson S., Crossman D. C., Granger C. B., Haines J. L., Jones C. J. H., Vance J. M., Goldschmidt-Clermont P. J., Kraus W. E., Hauser E. R., Gregory S. G., GATA2 is associated with familial early-onset coronary artery disease. PLOS Genet. 2, e139 (2006). [DOI] [PMC free article] [PubMed] [Google Scholar]
- 43.Kuo C. T., Morrisey E. E., Anandappa R., Sigrist K., Lu M. M., Parmacek M. S., Soudais C., Leiden J. M., GATA4 transcription factor is required for ventral morphogenesis and heart tube formation. Genes Dev. 11, 1048–1060 (1997). [DOI] [PubMed] [Google Scholar]
- 44.Schwartz R. J., Olson E. N., Building the heart piece by piece: Modularity of cis-elements regulating Nkx2-5 transcription. Development 126, 4187–4192 (1999). [DOI] [PubMed] [Google Scholar]
- 45.Cai X., Zhang W., Hu J., Zhang L., Sultana N., Wu B., Cai W., Zhou B., Cai C.-L., Tbx20 acts upstream of Wnt signaling to regulate endocardial cushion formation and valve remodeling during mouse cardiogenesis. Development 140, 3176–3187 (2013). [DOI] [PMC free article] [PubMed] [Google Scholar]
- 46.Kwon D.-H., Eom G. H., Kee H. J., Nam Y. S., Cho Y. K., Kim D.-K., Koo J. Y., Kim H.-S., Nam K.-I., Kim K. K., Lee I.-K., Park S. B., Choi H.-S., Kook H., Estrogen-related receptor gamma induces cardiac hypertrophy by activating GATA4. J. Mol. Cell. Cardiol. 65, 88–97 (2013). [DOI] [PubMed] [Google Scholar]
- 47.Bruneau B. G., Bao Z.-Z., Fatkin D., Xavier-Neto J., Georgakopoulos D., Maguire C. T., Berul C. I., Kass D. A., Kuroski-de Bold M. L., de Bold A. J., Conner D. A., Rosenthal N., Cepko C. L., Seidman C. E., Seidman J. G., Cardiomyopathy in Irx4-deficient mice is preceded by abnormal ventricular gene expression. Mol. Cell. Biol. 21, 1730–1736 (2001). [DOI] [PMC free article] [PubMed] [Google Scholar]
- 48.Ohgo S., Itoh A., Suzuki M., Satoh A., Yokoyama H., Tamura K., Analysis of hoxa11 and hoxa13 expression during patternless limb regeneration in Xenopus. Dev. Biol. 338, 148–157 (2009). [DOI] [PubMed] [Google Scholar]
- 49.Hérault Y., Hraba-Renevey S., van der Hoeven F., Duboule D., Function of the Evx-2 gene in the morphogenesis of vertebrate limbs. EMBO J. 15, 6727–6738 (1996). [PMC free article] [PubMed] [Google Scholar]
- 50.Bensoussan-Trigano V., Lallemand Y., Cloment C. S., Robert B., Msx1 and Msx2 in limb mesenchyme modulate digit number and identity. Dev Dyn. 240, 1190–1202 (2011). [DOI] [PubMed] [Google Scholar]
- 51.Koishi K., Zhang M., McLennan I. S., Harris A. J., MyoD protein accumulates in satellite cells and is neurally regulated in regenerating myotubes and skeletal muscle fibers. Dev. Dyn. 202, 244–254 (1995). [DOI] [PubMed] [Google Scholar]
- 52.Meadows E., Cho J.-H., Flynn J. M., Klein W. H., Myogenin regulates a distinct genetic program in adult muscle stem cells. Dev. Biol. 322, 406–414 (2008). [DOI] [PubMed] [Google Scholar]
- 53.Havis E., Coumailleau P., Bonnet A., Bismuth K., Bonnin M.-A., Johnson R., Fan C.-M., Relaix F., Shi D.-L., Duprez D., Sim2 prevents entry into the myogenic program by repressing MyoD transcription during limb embryonic myogenesis. Development 139, 1910–1920 (2012). [DOI] [PMC free article] [PubMed] [Google Scholar]
- 54.Tufan A. C., Daumer K. M., DeLise A. M., Tuan R. S., AP-1 transcription factor complex is a target of signals from both WNT-7a and N-cadherin-dependent cell–cell adhesion complex during the regulation of limb mesenchymal chondrogenesis. Exp. Cell Res. 273, 197–203 (2002). [DOI] [PubMed] [Google Scholar]
- 55.Vassen L., Beauchemin H., Lemsaddek W., Krongold J., Trudel M., Möröy T., Growth factor independence 1b (Gfi1b) is important for the maturation of erythroid cells and the regulation of embryonic globin expression. PLOS ONE 9, e96636 (2014). [DOI] [PMC free article] [PubMed] [Google Scholar]
- 56.Huo Q., Ge C., Tian H., Sun J., Cui M., Li H., Zhao F., Chen T., Xie H., Cui Y., Yao M., Li J., Dysfunction of IKZF1/MYC/MDIG axis contributes to liver cancer progression through regulating H3K9me3/p21 activity. Cell Death Dis. 8, e2766 (2017). [DOI] [PMC free article] [PubMed] [Google Scholar]
- 57.Hirotsu Y., Hataya N., Katsuoka F., Yamamoto M., NF-E2-related factor 1 (Nrf1) serves as a novel regulator of hepatic lipid metabolism through regulation of the Lipin1 and PGC-1β genes. Mol. Cell. Biol. 32, 2760–2770 (2012). [DOI] [PMC free article] [PubMed] [Google Scholar]
- 58.Pevny L., Lin C. S., D’Agati V., Simon M. C., Orkin S. H., Costantini F., Development of hematopoietic cells lacking transcription factor GATA-1. Dev. Camb. Engl. 121, 163–172 (1995). [DOI] [PubMed] [Google Scholar]
- 59.Yien Y. Y., Bieker J. J., EKLF/KLF1, a tissue-restricted integrator of transcriptional control, chromatin remodeling, and lineage determination. Mol. Cell. Biol. 33, 4–13 (2013). [DOI] [PMC free article] [PubMed] [Google Scholar]
- 60.Kohyama M., Ise W., Edelson B. T., Wilker P. R., Hildner K., Mejia C., Frazier W. A., Murphy T. L., Murphy K. M., Role for Spi-C in the development of red pulp macrophages and splenic iron homeostasis. Nature 457, 318–321 (2008). [DOI] [PMC free article] [PubMed] [Google Scholar]
- 61.Delgado I., Fresnedo O., Iglesias A., Rueda Y., Syn W.-K., Zubiaga A. M., Ochoa B., A role for transcription factor E2F2 in hepatocyte proliferation and timely liver regeneration. Am. J. Physiol. Gastrointest. Liver Physiol. 301, G20–G31 (2011). [DOI] [PubMed] [Google Scholar]
- 62.Xu Y., Wang Y., Besnard V., Ikegami M., Wert S. E., Heffner C., Murray S. A., Donahue L. R., Whitsett J. A., Transcriptional programs controlling perinatal lung maturation. PLOS ONE 7, e37046 (2012). [DOI] [PMC free article] [PubMed] [Google Scholar]
- 63.Gao E., Wang Y., Alcorn J. L., Mendelson C. R., Transcription factor USF2 is developmentally regulated in fetal lung and acts together with USF1 to induce SP-A gene expression. Am. J. Physiol. Lung Cell. Mol. Physiol. 284, L1027–L1036 (2003). [DOI] [PubMed] [Google Scholar]
- 64.Chen B., Moore T. V., Li Z., Sperling A. I., Zhang C., Andrade J., Rodriguez A., Bahroos N., Huang Y., Morrisey E. E., Gruber P. J., Solway J., Gata5 deficiency causes airway constrictor hyperresponsiveness in mice. Am. J. Respir. Cell Mol. Biol. 50, 787–795 (2014). [DOI] [PMC free article] [PubMed] [Google Scholar]
- 65.Chung C., Kim T., Kim M., Kim M., Song H., Kim T.-S., Seo E., Lee S.-H., Kim H., Kim S. K., Yoo G., Lee D.-H., Hwang D.-S., Kinashi T., Kim J.-M., Lim D.-S., Hippo-Foxa2 signaling pathway plays a role in peripheral lung maturation and surfactant homeostasis. Proc. Natl. Acad. Sci. U.S.A. 110, 7732–7737 (2013). [DOI] [PMC free article] [PubMed] [Google Scholar]
- 66.Yin Z., Gonzales L., Kolla V., Rath N., Zhang Y., Lu M. M., Kimura S., Ballard P. L., Beers M. F., Epstein J. A., Morrisey E. E., Hop functions downstream of Nkx2.1 and GATA6 to mediate HDAC-dependent negative regulation of pulmonary gene expression. Am. J. Physiol. Lung Cell. Mol. Physiol. 291, L191–L199 (2006). [DOI] [PubMed] [Google Scholar]
- 67.Herriges M., Morrisey E. E., Lung development: Orchestrating the generation and regeneration of a complex organ. Development 141, 502–513 (2014). [DOI] [PMC free article] [PubMed] [Google Scholar]
- 68.Metzger D. E., Stahlman M. T., Shannon J. M., Misexpression of ELF5 disrupts lung branching and inhibits epithelial differentiation. Dev. Biol. 320, 149–160 (2008). [DOI] [PMC free article] [PubMed] [Google Scholar]
- 69.Arora R., Metzger R. J., Papaioannou V. E., Multiple roles and interactions of Tbx4 and Tbx5 in development of the respiratory system. PLOS Genet. 8, e1002866 (2012). [DOI] [PMC free article] [PubMed] [Google Scholar]
- 70.Bird A. D., Flecknoe S. J., Tan K. H., Olsson P. F., Antony N., Mantamadiotis T., Mollard R., Hooper S. B., Cole T. J., cAMP response element binding protein is required for differentiation of respiratory epithelium during murine development. PLOS ONE 6, e17843 (2011). [DOI] [PMC free article] [PubMed] [Google Scholar]
- 71.Di-Poï N., Zákány J., Duboule D., Distinct roles and regulations for Hoxd genes in metanephric kidney development. PLOS Genet. 3, e232 (2007). [DOI] [PMC free article] [PubMed] [Google Scholar]
- 72.Lam P.-Y., Kamei C. N., Mangos S., Mudumana S., Liu Y., Drummond I. A., Odd-skipped related 2 is required for fin chondrogenesis in zebrafish. Dev. Dyn. 242, 1284–1292 (2013). [DOI] [PMC free article] [PubMed] [Google Scholar]
- 73.Teng A., Nair M., Wells J., Segre J. A., Dai X., Strain-dependent perinatal lethality of Ovol1-deficient mice and identification of Ovol2 as a downstream target of Ovol1 in skin epidermis. Biochim. Biophys. Acta 1772, 89–95 (2007). [DOI] [PMC free article] [PubMed] [Google Scholar]
- 74.Adalat S., Woolf A. S., Johnstone K. A., Wirsing A., Harries L. W., Long D. A., Hennekam R. C., Ledermann S. E., Rees L., van't Hoff W., Marks S. D., Trompeter R. S., Tullus K., Winyard P. J., Cansick J., Mushtaq I., Dhillon H. K., Bingham C., Edghill E. L., Shroff R., Stanescu H., Ryffel G. U., Ellard S., Bockenhauer D., HNF1B mutations associate with hypomagnesemia and renal magnesium wasting. J. Am. Soc. Nephrol. 20, 1123–1131 (2009). [DOI] [PMC free article] [PubMed] [Google Scholar]
- 75.Brunskill E. W., Lai H. L., Jamison D. C., Potter S. S., Patterson L. T., Microarrays and RNA-Seq identify molecular mechanisms driving the end of nephron production. BMC Dev. Biol. 11, 15 (2011). [DOI] [PMC free article] [PubMed] [Google Scholar]
- 76.Wellik D. M., Hox genes and kidney development. Pediatr. Nephrol. 26, 1559–1565 (2011). [DOI] [PubMed] [Google Scholar]
Associated Data
This section collects any data citations, data availability statements, or supplementary materials included in this article.
Supplementary Materials
Supplementary material for this article is available at http://advances.sciencemag.org/cgi/content/full/5/3/eaav3262/DC1
Fig. S1. Validating the Taiji framework.
Fig. S2. The topological properties of genetic networks.
Fig. S3. PageRank scores (color shade) and expression levels (circle size) of 35 constitutively active TFs across 12 tissues and eight stages.
Fig. S4. Identification of driver TFs in 12 tissues.
Fig. S5. Identification of driver TFs in early mouse embryonic development, including two-, four-, and eight-cell stages, ICM, and ESC.
Fig. S6. Selecting algorithms and parameters for clustering analysis.
Fig. S7. Transcriptional waves direct tissue differentiation during mouse embryogenesis.
Table S1. Driver TFs in the heart.
Table S2. Driver TFs in the limb.
Table S3. Driver TFs in the liver.
Table S4. Driver TFs in the lung.
Table S5. Driver TFs in the kidney.
Data file S1. The accession numbers of datasets analyzed in this study.
Data file S2. Germ layer–specific TFs and their P values.
Data file S3. PageRank scores for all TFs across different stages and tissues.
Data file S4. Chromatin interaction predictions made by EpiTensor.