

Summary:
GWAS have identified 108 schizophrenia risk loci, but risk mechanisms for individual loci are largely unknown. Using developmental, genetic, and illness-based RNA sequencing expression analysis in human brain, we characterized the human brain transcriptome around these loci and found enrichment for developmentally regulated genes with novel examples of shifting isoform usage across pre- and post-natal life. Across the genome, we found widespread expression quantitative trait loci (eQTLs), including many with transcript specificity and previously unannotated sequence that were independently replicated. We leveraged this general eQTL database to show that 48.1% of risk variants for schizophrenia associated with nearby expression. We lastly found 237 genes significantly differentially expressed between patients and controls which replicated in an independent dataset, implicated synaptic processes and were strongly regulated in early development. These findings together offer genetic- and diagnosis-related targets for better modeling schizophrenia risk. This publicly-available resource is available at: http://eqtl.brainseq.org/phase1
Keywords: schizophrenia, functional genomics, RNA sequencing, human postmortem brain, differential expression analysis, RNA degradation
Introduction:
Schizophrenia (SCZD) is a prevalent neuropsychiatric disorder with a combination of genetic and environmental risk factors. Research over the last several decades has suggested that SZCD is a neurodevelopmental disorder arising through altered connectivity and plasticity in relevant neural circuits. However, discovering the causative mechanisms of these putatively developmental deficits has been very challenging1. The most consistent evidence of etiologic mechanisms related to SCZD has come from a recent genome-wide association study (GWAS) in which over a hundred independent single nucleotide polymorphisms (SNPs) were identified having a significant allele frequency difference between patients with schizophrenia and unaffected controls2. While these findings have identified regions in the genome harboring genetic risk variants, almost all of the associated SNPs are non-coding, located in intronic or intergenic sequence, and hypothesized to have some role in regulating expression3. However, the exact gene(s) and transcript(s) potentially regulated by risk-associated genetic variation are uncertain, as most of these genomic regions contain multiple genes. In principle, the effects of non-coding genetic variation, by whatever mechanisms (e.g. promoter, enhancer, splicing, noncoding RNA, epigenetics, etc), should be observed in the transcriptome. Therefore, to better understand how these regions of genetic risk and their underlying genotypes may confer risk of schizophrenia and to better characterize the molecular biology of the disease state, we sequenced the polyA+ transcriptomes from the prefrontal cortex of 495 individuals with ages across the lifespan, ranging from the second trimester of fetal life to 85 years of age (see Table S1), including 175 patients with schizophrenia (Figure S1).
Here we identify novel expression associations with genetic risk and with illness state and explore developmentally regulated features, including a subset of genes with previously uncharacterized isoform shifts in expression patterns across the fetal-postnatal developmental transition. We further identify many more expression quantitative loci (eQTLs) in schizophrenia risk regions than previously observed by surveying the full spectrum of expression features to generate potential molecular mechanisms underlying genetic risk. We also explore differential gene expression associated with the state of illness in a comparison of the postmortem brains of patients with schizophrenia with non-psychiatric controls. By incorporating a recently described experiment-based algorithm to account for RNA quality differences which have not been adequately controlled in earlier studies, we report a high degree of replication across independent case-control gene expression datasets4,5. By combining genetic risk at the population-level with eQTLs and case-control differences, we identify putative human frontal cortex mechanisms underlying risk for schizophrenia and replicable molecular features of the illness state.
Results
We performed deep polyA+ RNA-sequencing of 495 individuals, ranging in age from the second trimester of fetal life to 85 years old (Table S1), including 175 patients with schizophrenia (see Figure S1). We quantified expression across multiple transcript features, including: annotated 1) genes and 2) exons, 3) annotation-guided transcripts4 as well as alignment-based 4) exon-exon splice junctions5 and 5) expressed regions (ERs)6. These last two expression features were selected to reduce reliance on the potentially incomplete annotation of the brain transcriptome7 (Info S1). We find a large number of moderately expressed and previously unannotated splice junctions that tag potential transcripts with alternative exonic boundaries or exon skipping (Figure S2), 95% of which are also found in other large RNA-seq datasets, including a subset that were brain-specific (Table S2). Similarly, we find that only 56.1% of ERs were annotated to strictly exonic sequence – while many ERs annotated to strictly intronic (22.3%) or intergenic (8.5%) sequence, or were transcribed beyond existing annotation (e.g. extended UTRs, extended exonic sequence).
Developmental regulation of transcription and shifting isoform usage
Characterizing expression changes in unaffected individuals, particularly across brain development beginning with prenatal life, has previously offered disease-relevant insights into particular genomic loci 8–12. Specifically, we and others 7,13,14 have shown that genomic risk loci associated with neurodevelopmental disorders including schizophrenia are enriched for transcript features showing differential expression between fetal and postnatal brains. Here too, among the 320 control samples, the strongest component of expression change corresponded to large changes in the contrast of pre-natal and early postnatal life. RNA-based cellular deconvolution confirmed the decrease in the proportion of prenatal cell types, in line with previous data related to the loss of neural precursor cells at the transition of pre- and post-natal life 7 (Figure 1A, Figure S3, S4). We further defined a developmental regulation statistic for each expressed feature using a generalized additive model for age (see Methods) and found widespread developmental regulation of these expressed features (Info S2, Table S3, Figure S5), including previously unannotated sequence (Table S4) that likely relates to the shifting cellular composition of the maturing brain15. We further demonstrated that these age-related changes in expression strongly related to cell type-specific changes (Figure S6). These developmental statistics and visualized expression trajectories from all features are available at http://eqtl.brainseq.org/phase1/devel.
Figure 1:
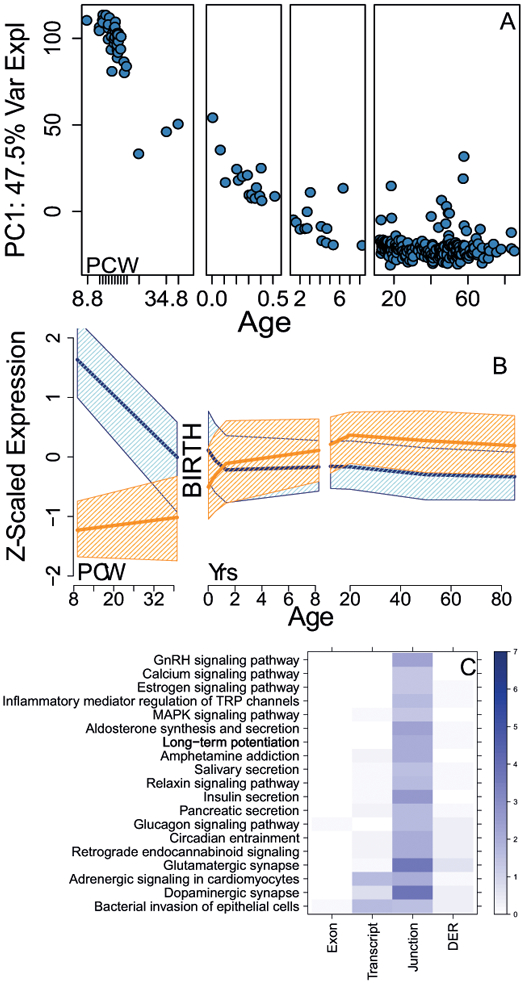
Developmental regulation of expression. (A) Principal component #1 of the gene-level expression data versus age (N=320 independent samples/subjects); PCW: post-conception weeks, remaining ages are in years. (B) Expression features fall into two main development regulation signatures, increasing in expression from fetal to postnatal life (orange) or decreasing from fetal to postnatal life (blue). Y-axis is Z-scaled expression (to standard normal), dark lines represent median expression levels, and confidence bands represent 25th-75th percentiles of expression levels for each class of features. (C) KEGG pathways enriched for genes with isoform shifts, stratified by which feature type identified the gene as having a switch. Coloring/scaling represents -log10(FDR) for gene set enrichment. Analogous data for GO gene sets (biological processes, BP, and molecular function, MF) are available in Table S6. DER: differentially expressed region. Enrichment analyses for isoform shift genes among PGC2 schizophrenia GWAS risk loci with exon and junction counts using both (D) parametric p-values) and (E) permutation-based p-values. OR: odds ratio.
We then formally identified the subset of genes showing alternative isoform expression patterns across fetal and postnatal life using those exons, junctions, transcripts, and ERs that meet the statistical criteria for developmental regulation (i.e. those genes with at least one developmentally changing feature, see Methods). Figure S4 highlights CRTC2, a transcription co-activator, as representative of a gene with isoform shifts. There were 6672 Ensembl genes (23.7% of the set of developmentally regulated genes) with both positive and negative expression features having genome-wide significant correlations with age (each with pbonf<0.05, Figure 1B, Table S5, Figure S5), representing alternate transcript isoforms of the same gene that show opposite patterns of expression across the prenatal-postnatal transition. In principle, this interaction would obscure developmental expression variation measured at the gene level and might better reflect how different cells in the human frontal cortex use the same gene differently across development.
We next performed gene set analyses of genes with shifting isoform usage compared to the larger set of genes with developmentally regulated features but without shifting isoform usage to identify more specific biological functions of this unique form of developmental regulation (Table S6). The former set was relatively enriched for localization, catalytic activity, signaling-related processes, including synaptic transmission and cell communication, and neuronal development. Interestingly, genes identified with shifting isoforms across development based exclusively on junction counts were enriched for both dopaminergic (FDR=1.67×10⁻⁴) and glutamatergic (FDR=2.04×10⁻⁴) synapse KEGG pathways (Figure 1C), the two neurotransmitter systems most prominently implicated in schizophrenia pathogenesis and treatment.
Schizophrenia risk is associated with novel shifting isoform usage across brain development
Interestingly, genes with developmental isoform shifts identified by exon, junction and expressed region counts were 75% (p=9.51×10⁻⁶), 84% (p=1.63×10⁻⁷) and 71% (p=2.0×10⁻⁴) more likely to lie within the PGC2 risk regions (with permutation-based p=0.02, p=0.01, and p=0.03 respectively, see Methods) than developmentally regulated genes without isoforms shifts (Table S7). These enrichments were robust to controlling for gene length (both coding length and number of exons, see Methods) and were specific to schizophrenia, as we found no association for Type 2 diabetes 16, Parkinson’s Disease 17, and Alzheimer’s Disease 18 GWAS regions (all p > 0.05). These results further underscore the role of changes in the regulation of transcription and splicing in the early brain developmental components in genomic regions implicated in schizophrenia risk.
Large-scale genetic regulation of transcript-specific and previously unannotated sequences
While genomic loci association with schizophrenia risk highlights potential enrichment of genes within those loci, we sought to more directly assess the specific role of individual risk variants on nearby expression. We therefore first performed a genome-wide cis (<500kb) expression quantitative trait loci (eQTL) analysis within the 412 post-adolescent subjects (see Methods) across the five convergent transcript features (Table 1, Info S3). Exon-level analysis showed widespread transcript-specificity of eQTL associations - almost all exons with eQTL signal mapped to genes with more than one annotated transcript (N=45,239, 94.2%), and the majority of these showed eQTL associations to exons belonging to a single transcript isoform (N=30,283, 66.9%). This transcript-specificity was also evident in the eQTL effect sizes, as the median additive effect size was approximately two-fold higher for exon- than gene-level analysis (15.6% versus 7.0% expression change per allele copy). Analyses focusing on annotation-agnostic expression levels further revealed extensive genetic regulation of previously unannotated transcript sequences, including novel exon-skipping and shifted exonic boundary splice junctions and both strictly intronic and intergenic sequence (Table 1, Info S3). These results demonstrate extensive transcript specificity of many eQTL signals that are missed by traditional analyses.
Table 1:
eQTL summary statistics at FDR and Bonferroni significance thresholds across five feature summarizations. “logFC” is the log2 fold change in expression per minor allele copy and “% Unann” is the percent of features that were not strictly annotated.
| Type | eQTLs | # SNPs | # Features | p-cutoff | Ensembl Genes | Symbol Genes | log2FC | % Unann | |
|---|---|---|---|---|---|---|---|---|---|
| FDR < 1% | Gene | 1815172 | 1055186 | 18416 | 1.84E-04 | 18416 | 12874 | 0.061 | NA |
| Exon | 13255860 | 1390362 | 157923 | 1.00E-04 | 20696 | 15697 | 0.13 | NA | |
| Transcript | 1465179 | 616346 | 26870 | 3.07E-05 | 11272 | 11219 | 0.094 | 50.7% | |
| Junction | 4813472 | 1092615 | 67358 | 6.39E-05 | 14792 | 13204 | 0.33 | 21.3% | |
| ER | 8115891 | 1367619 | 94200 | 1.25E-04 | 16379 | 12914 | 0.22 | 47.4% | |
| Bonf < 5% | Gene | 648597 | 431704 | 6748 | 8.41E-09 | 6748 | 4955 | 0.097 | NA |
| Exon | 4019197 | 529237 | 48031 | 7.64E-10 | 8386 | 6439 | 0.21 | NA | |
| Transcript | 514563 | 236633 | 6349 | 1.73E-09 | 3263 | 3249 | 0.15 | 46.9% | |
| Junction | 1557370 | 439920 | 18908 | 1.10E-09 | 5827 | 5205 | 0.55 | 21.6% | |
| ER | 2575655 | 533978 | 27643 | 1.28E-09 | 6822 | 5643 | 0.37 | 53.9% |
Given the large degree of genetic regulation of transcript-specificity and unannotated sequences, we sought to confirm the identified eQTLs (“LIBD”) in independent human brain RNA-seq data from the CommonMind Consortium (“CMC”) DLPFC project19. Among those significant eQTL SNP-feature pairs that were well-imputed, polymorphic and expressed in the replication dataset (~84% of pairs, ~95% of eFeatures, see Methods, Figure S6), >94% had consistent directionality in the two datasets, between 75.7% (eTxns) and 81.5% (eJxns) were directionally consistent and marginally significant (at p < 0.01), and just over half (52.1%−57.0%) were directionally consistent and FDR-corrected significant (published set, p<10−5). Meta-analysis between datasets demonstrated extensive significance and replication of the 9.3M SNP-feature Bonferroni-significant eQTL pairs including 97.6% at p < 1×10⁻⁵ and 82.0% at p < 10-9. We further reprocessed and quantified GTEx v6 RNA-seq brain data (“GTEx”) from raw reads using the same pipeline, and assessed replication and regional specificity in these data using meta-analysis across 13 brains regions compared to frontal cortex alone. Here we found that many of the DLPFC-identified eQTLs showed strong concordant signal across all brain regions, suggesting an overall lack of regional specificity for the majority of our identified eQTLs (Figure S7). All significant eQTLs are searchable on our publicly available database: http://eqtl.brainseq.org/phase1/eqtl/ which provides visualizations and eQTL statistics across three independent datasets.
Clinical enrichment of eQTL associations for schizophrenia and other traits
We interrogated the potential clinical relevance of our full catalog of significant eQTLs particularly in the context of transcript feature-level and previously unannotated sequence associations using published genome-wide association study (GWAS) risk variants. We first considered the common (MAF > 5%) and well-measured risk variants from the 128 index variants (N=106, see Methods) in the latest PGC2 GWAS for schizophrenia 2 and their highly correlated proxies (see Methods). We identified FDR-significant eQTL associations to 51 risk SNP signals (of 106 tested, 48.1%, Table S8), a substantially higher proportion of risk variants classified as brain eQTLs than previously reported19 (Table 2, supple results). In total, there were 1,244 unique SNP-feature pairs that were genome-wide FDR-significant eQTLs (83 genes, 553 exons, 49 transcripts, 192 junctions and 367 ERs) mapping to 194 unique Ensembl Gene IDs (of which 162 have HUGO gene symbols). Among these 51 risk SNPs, 17 were eQTLs only to exons, junctions or expressed regions, and 7 were eQTLs to only unannotated transcribed sequence. These unannotated sequences were enriched for transcriptional chromatin states in brain and other tissues in the Epigenome roadmap compared to the rest of the genome (Figure S8A). There were only 17 loci with annotated eQTLs to only a single gene and another 10 loci with eQTLs to two genes.
Table 2:
eQTL summary metrics for GWAS variants from the latest schizophrenia GWAS and the more general genome-wide suggestive loci from the NHGRI GWAS catalog. “# SNPs Tested” were those that were observed or imputed with high quality and that were relatively common in our samples (MAF > 5%). “Unann” = unannotated, “Tx” = transcript
| SCZD GWAS | NHGRI GWAS Catalog | |||||
|---|---|---|---|---|---|---|
| FDR<1% | FDR+Meta | Bonf<5% | FDR<1% | FDR+Meta | Bonf<5% | |
| # SNPs Tested | 106 | 106 | 106 | 23704 | 23704 | 23704 |
| # SNP eQTLs | 51 | 37 | 26 | 8988 | 5490 | 4255 |
| > # w/o Gene | 21 | 17 | 9 | 3763 | 2370 | 1891 |
| > # w/o Gene+Tx | 17 | 15 | 8 | 2982 | 1824 | 1445 |
| > # Unann | 47 | 28 | 17 | 5858 | 3470 | 2579 |
| > # Only unann | 7 | 6 | 3 | 995 | 671 | 589 |
| > # Single Tx | 11 | 10 | 5 | 1933 | 1156 | 976 |
We also assessed enrichment of 23,704 GWAS risk SNPs from the NHGRI GWAS catalog present and common in our genetic data (of 44,738 available) and found eQTL evidence for 8988 variants (37.9%) at FDR < 0.01. These GWAS variants that were identified as eQTLs were from GWAS for the majority of all tested traits in the literature (68.1%, 1415 of 2078 present) across all sites in the body, suggesting that many of the identified eQTLs in brain are likely shared with other tissue sites as previously described 20. Of the 8,988 GWAS eQTL variants, 2,982 were eQTLs only to exons, junctions or expressed regions, of which 995 were only to unannotated sequence (Table 2), which were also enriched for transcriptional chromatin states in human cell types and tissues (Figure S8B). These results highlight the ability to identify more eQTL signal for clinical risk variants by casting a wider net of RNA-seq feature summarization, including previously unannotated transcribed sequences.
Refining risk transcripts through conditional analyses
We used conditional analyses to partition the GWAS-associated eQTLs to better identify the downstream molecular features of genetic risk. For each of the 51 GWAS variants with eQTLs, we iteratively conditioned on the most significant eQTL feature for each variant and then performed eQTL reanalysis of all other features. These analyses resulted in 238 conditionally-independent SNP-feature eQTLs (35 genes, 73 exons, 9 transcripts, 55 junctions and 66 ERs) to the 51 schizophrenia GWAS variants (Table S8) which mapped to 130 unique Ensembl Gene IDs. Conditional analysis resulted in an additional locus with eQTLs to a single gene (totaling 18 loci) and an additional five loci with eQTLs to features in two genes (totaling 15 loci, Table 3). Interestingly, these conditional analyses further highlighted the potential importance of transcript-specific and previously-unannotated eQTLs, as more loci were associated only with exons, junctions and ERs (27 versus 17), more were strictly unannotated (11 versus 7), and more showed eQTL associations to a single annotated transcript isoform (18 versus 11).
Table 3:
GWAS-significant index variants and eQTL associations, for those GWAS loci associating with only one or two genes following conditional analysis. *Formerly C10orf32
| SZ GWAS Locus | SNP | Gene | SZ GWAS Locus | SNP | Gene |
|---|---|---|---|---|---|
| 1 | rs1233578 | Intergenic | 59 | rs10520163 | CLCN3 |
| 1 | rs1233578 | ZSCAN26 | 63 | rs9420 | Intergenic |
| 3 | rs11191419 | AS3MT | 73 | rs3849046 | CTNNA1 |
| 3 | rs11191419 | BORCS7* | 82 | rs6704641 | SATB2 |
| 5 | rs4129585 | TSNARE1 | 84 | rs1106568 | GPM6A |
| 7 | rs10650434 | MAD1L1 | 86 | rs10043984 | FAM53C |
| 7 | rs10650434 | FTSJ2 | 86 | rs10043984 | NME5 |
| 11 | rs4702 | FES | 88 | rs7819570 | AC090568.2 |
| 11 | rs4702 | AC068831.1 | 96 | rs8082590 | ATPAF2 |
| 12 | rs75968099 | LRRFIP2 | 96 | rs8082590 | DRG2 |
| 12 | rs75968099 | AC011816.1 | 98 | rs12325245 | GOT2 |
| 16 | rs13240464 | LRRN3 | 98 | rs12325245 | NDRG4 |
| 16 | rs13240464 | IMMP2L | 103 | rs324017 | STAT6 |
| 17 | rs10791097 | SNX19 | 105 | rs55833108 | AS3MT |
| 20 | rs7893279 | NSUN6 | 105 | rs55833108 | USMG5 |
| 23 | rs6704768 | C2orf82 | 106 | rs9841616 | SOX2-OT |
| 23 | rs6704768 | GIGYF2 | 109 | rs149009306 | DFNA5 |
| 24 | rs55661361 | NRGN | 114 | rs12421382 | AP003049.1 |
| 30 | rs11682175 | FANCL | 114 | rs12421382 | Intergenic |
| 42 | rs7432375 | AC117382.2 | 117 | rs75575209 | FANCL |
| 42 | rs7432375 | PCCB | 119 | rs14403 | AKT3 |
| 47 | rs4523957 | SRR | 119 | rs14403 | SDCCAG8 |
| 47 | rs4523957 | TSR1 | 120 | rs6670165 | BRINP2 |
| 52 | rs140505938 | Intergenic | 120 | rs6670165 | Intergenic |
| 57 | rs34269918 | RERE | 121 | rs7523273 | CD46 |
| 57 | rs34269918 | SNORA77 |
In figure 2, we highlight select eQTLs for different classes of associations. The top GWAS risk variant rs1233578 associated with strictly intergenic sequence downstream of ZSCAN23 (Figure 2A,2B, p=2.7×10⁻⁸) as confirmed in both CMC (p=0.01) and GTEx (T=3.1), suggesting potential novel transcribed sequence linked to schizophrenia risk. We also found significant eQTL signal to specific 5’ junction and exon sequences of CTNNA1 to rs3849046 (Figure 2C, 2D; discovery p=6.2×10⁻⁸, CMC replication p=1.4×10⁻⁸). Another example of eQTL associations of partially annotated sequence was rs9841616 exclusively associating with the 3’ sequence of the most proximal short transcript isoform of SOX2-OT (Figure 2E, 2F; discovery p=8.2×10⁻¹², replication p=2.9×10⁻⁸). We also found novel eQTL associations to annotated exons in CD46 (Figure 2G, p=9.2×10−38, replication p = 2.9×10⁻¹⁴), SRR (Figure 2H, p=2.0×10⁻¹², replication p=4.7×10⁻⁶) and GPM6A (Figure 2I, p=2.8×10⁻⁶, replication p=0.02).
Figure 2:
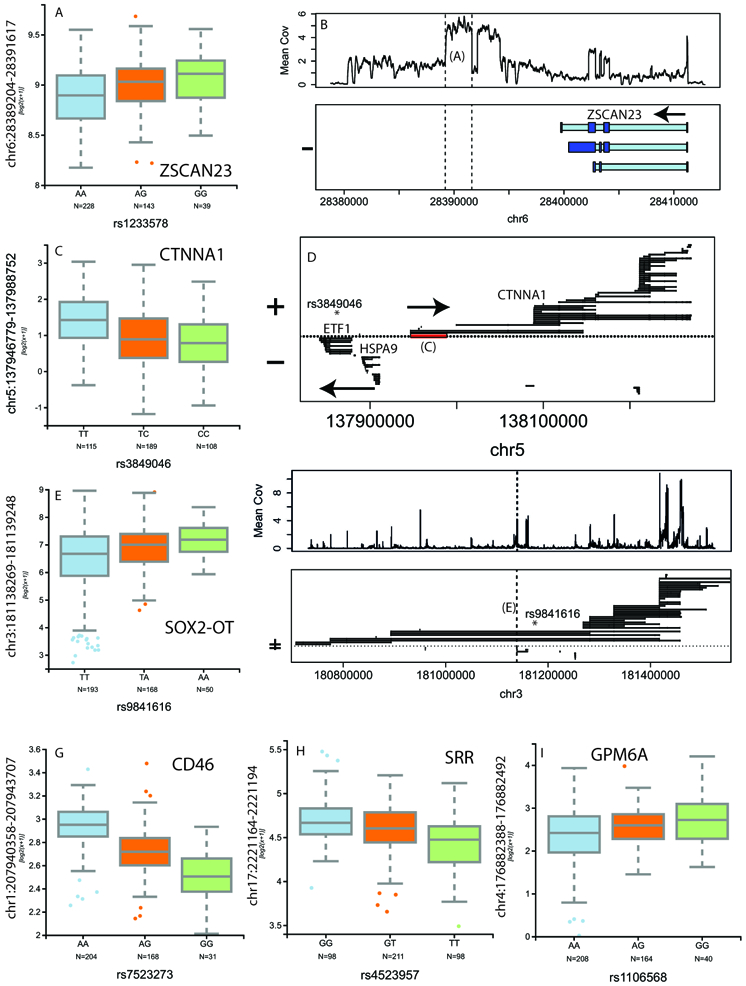
Clinical enrichment of schizophrenia risk using representative eQTLs. (A) Association between rs1233578 and intergenic sequence downstream (B) of ZSCAN23. (B) Association between rs3849046 and a splice junction (C) of a particular longer isoform (D) of CNNTA1. (E) Association between rs9841616 and very proximal extended UTR (F) of SOX2-OT. Associations between risk SNPs and annotated sequences are shown for (G) CD46, (H) SRR and (I) GPM6A. In panels B, D, and F: thicker/dark blue: exon, thinner/light blue: intron; coordinates relative to hg19; N=412 independent samples for all panels; box plots show median and interquartile range (IQR), with whiskers representing 2.5*IQR.
We did find significant enrichment of these conditionally independent schizophrenia risk-associated eQTLs among genes with developmental isoform shifts identified above – 44.0% of genes with eQTLs compared to 23.6% without eQTLs (OR=2.54, p=5.38×10⁻⁸). These conditional analyses could suggest potential regulatory roles of these unannotated transcribed sequences on annotated transcripts that play a putative role in the manifestation of schizophrenia risk in brain. More generally, these eQTL results highlight significant and independently-replicated risk-associated schizophrenia candidate genes and their specific transcripts that comprise links in the causative chain of schizophrenia in the human brain.
Expression associations with chronic schizophrenia illness
Genetic association with gene expression is an approach to understanding the molecular mechanisms of risk, but it does not directly address the molecular landscape of the illness state. We therefore explored the expression landscape of the prefrontal cortex of the schizophrenia illness state and its potential link with developmental regulation and genetic risk. We performed differential expression modeling using 351 high quality adult samples (age >16, 196 controls, 155 cases), and found extensive bias by RNA degradation within both univariate analysis (where 12,686 genes were differentially expressed at FDR<5%) and even after adjusting for standard measured levels of RNA quality typical of all prior studies. We therefore implemented a recently described statistical framework based on an independent molecular degradation experiment (see Methods, Info S4), called “quality surrogate variable analysis” (qSVA, see Methods)21. We further utilized potential replication RNA-seq data from the CommonMind Consortium (CMC) dataset, using a subset of age range-matched 159 schizophrenia patients and 172 controls. Interestingly, adjusting for observed factors related to RNA quality that characterize all earlier studies of gene expression in schizophrenic brain, including an earlier report using CMC data19, the proportion of genes with differentially expressed features at genome wide significant FDR < 5% that replicate (with directionality and marginal significance at p<0.05) in the CMC dataset was very small (11.0%). In contrast, using qSVA, 40.1% of differentially expressed genes at FDR < 5% (N=75/183) replicate in CMC data. At FDR<10% (see Methods), we identified 237 genes with 556 DE features that replicated in the CMC dataset (33.6% gene-level replication rate, Table S9, Table S10). Case-control statistics from both discovery and replication datasets, as well as boxplots from all expressed features, are available at http://eqtl.brainseq.org/phase1/sz.
The differences in expression levels between cases and controls of these DE features were generally small in both discovery and replication data (Figure 3A, Figure S9), in line with the clinical and molecular heterogeneity of this disorder 13,22. Gene ontology analysis implicated transporter- and channel-related signaling as significantly consistently downregulated in patients compared to controls across genes annotated in all three expression summarizations (Figure 3B, Table S11). These results suggested decreased signaling in patients with schizophrenia, but could raise the possibility that these replicated expression differences between patients and controls relate to epiphenomena of illness, such as drug treatment which affect signaling in the brain14, as the majority of patients were on anti-psychotics at the time of death (64%, Table S1). While only two genes located in the latest schizophrenia GWAS loci were significantly differentially expressed (KLC1 and PPP2R3A), we found significant associations comparing the genome-wide differential expression statistics within versus outside of the GWAS significant loci, although the absolute biological effects were small (Info S5, Figure S10, Table S12). We also investigated the relationships between transcription and genomic risk for schizophrenia using genome wide Polygene Risk Scores (PRS) from each subject calculated as previously described2 (see Methods), and found lack of association between PRS and expression of individual expression features, lack of enrichment of PRS on expression comparing the differentially expressed and replicated case-control features, and lack of directionally consistency between PRS- and diagnosis-associated statistics among expressed features (Table S13). These results further suggest that the significant case-control expression differences show little overlap with genetic risk for the disorder.
Figure 3:
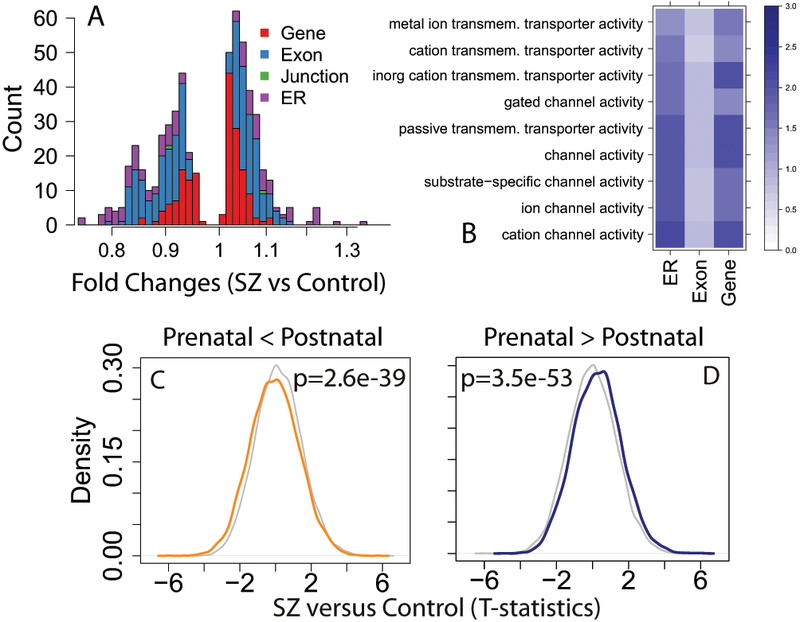
Differential expression comparing patients with schizophrenia to controls. (A) Histogram of fold changes of the diagnosis effect of those features that were significant and independently replicated, colored by feature type. (B) Gene set analyses of genes with decreased expression in patients compared to controls by feature type. Coloring/scaling represents -log10(FDR) for gene set enrichment. Significant directional effects of developmental regulation among diagnosis-associated genes for those that (C) increased and (D) decreased across development. P-values (two-sided) were calculated using linear regression Wald tests for those genes developmentally regulated among case-control differences to those not developmentally regulated across the 24,122 expressed genes.
In an earlier study of the epigenetic landscape of frontal cortex of patients with schizophrenia, we showed that DNA methylation levels in patients were closer to fetal methylation levels than to those of adult control samples15. Here we tested for analogous effects in the RNA-seq data related to the illness state. Every significant gene with differentially expressed features in the adult case-control analysis and replicated in the independent dataset showed evidence for developmental regulation across at least two expression feature types. We further found that expression features more highly expressed in postnatal life tended to be more lowly expressed in patients compared to controls (max: p=3.24×10⁻¹¹, min: p=1.05×10−70, Figure 3C) and features more highly expressed in fetal life tended to be more highly expressed in patients with schizophrenia compared to controls (max: p=6.86×10⁻³³, min: p < 10−100, Figure 3D). Analogous analyses for developmental regulation of schizophrenia-associated features without adjusting for the RNA quality qSVs were significant in the opposite directions, namely that schizophrenia-associated changes were further from, rather than closer to, fetal expression levels, as might be predicted as a confounding artifact of residual RNA quality differences (Table S1).These results further converge on a role for genes changing during brain development and maturation in the pathogenesis of schizophrenia, specifically that both DNA methylation and expression levels in adult patients appear to reflect levels in the developing brain more strongly than do those of unaffected individuals.
Discussion
We have explored the diverse landscape of expression correlates of schizophrenia risk and illness state in the postmortem human frontal cortex across the lifespan. Using deep RNA sequencing to define convergent measures of gene expression and early brain development, we identified widespread developmental regulation of transcription, including novel discoveries related to preferential isoform usage across brain development. These unexpected isoform “shifts” were associated with genetic risk for schizophrenia, and the directionality of dysregulation of developmentally regulated features suggest a more fetal-like expression profile in patients with schizophrenia compared with controls. Our approach to transcript characterization, which included extensive characterization of unannotated sequence, revealed that many more schizophrenia risk associated SNPs are brain eQTLs than previously reported - many risk SNPs only associate with a single gene, or even a single transcript, and many of these adult-identified eQTLs show overlap with genes with dynamic isoform regulation across human brain development. Lastly, we identified significant and replicated genes differentially expressed in patients with schizophrenia compared to unaffected controls using an experiment-based framework to better model RNA quality. It is important to note that while much of the signal relating to developmental regulation likely relates to changing cellular composition across brain development, the use of latent variable adjustment in the diagnosis and eQTL modeling likely controls for these effects23. These data, therefore, suggest a convergence of developmental regulation and genetic risk for schizophrenia that appears relatively stable in patients ascertained at death, following decades of illness after diagnosis. We previously observed analogous stability of epigenetic marks highlighting prenatal life in adult patients with schizophrenia15, suggesting that both genetic and environmental risk factors implicated in schizophrenia illness involve early developmental events that are still observable in the brain tissue of adult individuals despite many years of illness.
While our approach utilizing convergent expression features – genes, exons, transcripts, junctions, and expressed regions – results in more complicated data processing and analysis, it casts a wider net in the search for signals in RNA-seq data. Using all convergent features overcomes the limitations related to any given feature summarization, including the inability to measure and interrogate unannotated or novel transcribed sequences using gene and exon counts, and the difficulties in full transcript assembly from short sequencing reads 24. We note that both quantifying and analyzing splice junctions, and transcripts, rely on junction-spanning reads for statistical power which are approximately 3-fold depleted compared to those assigned to exons, likely explaining why gene counts discovered more differentially expressed genes in the schizophrenia diagnosis analyses. Two relatively new approaches utilized here – direct quantification and statistical analyses of splice junction counts and expressed regions – can identify differential expression signal when it is outside of the annotated transcriptome. The junction-level approach can also identify previously uncharacterized novel transcribed sequences, which we replicated in other large publicly available datasets, as well as delineate individual transcripts or classes of transcripts that share a particular splice junction. As read lengths increase, the proportion of reads containing splice junctions will increase, making junction- and transcript-based approaches even more powerful, including those recently developed to identify splicing QTLs 25.
Our analysis of RNA-seq data identified widespread shifts in preferential isoform use across brain development and its changing cellular landscape, which would have been impossible to identify using only gene-level data and incomplete with only exon-level data (Figure 2). The genes with these isoform shifts were significantly enriched for neurodevelopmental and cellular signaling processes, and as well as for genes in regions of genetic risk for schizophrenia. A prevalent hypothesis suggests that schizophrenia is a neurodevelopmental disorder that arises because of altered connectivity and plasticity in the early assembly of relevant neural circuits26 and the potential convergence of genetic risk with developing signaling processes across human brain development should point to specific candidate molecular disruptions occurring during the wiring of the fetal brain. Indeed, inefficient or disrupted signaling and tuning is thought to underlie the expression of illness in the adult brain 26, and the most successful therapeutics work through improving these processes14. Consistent with this hypothesis, we find evidence for differences in the expression of genes coding for subunits of ion channels in the cortices of patients with schizophrenia compared to controls. We observed significant differential expression of both voltage-gated (KCNA1, KCNC3, KCNK1, KCNN1, SCN9A) and ligand gated ion channels (GRIN3A, GABRA5, GABRB3), transporters (SLC16A2, SLC25A33, SLC26A11, SLC35F2, SLC7A3), and ion channel auxiliary subunits (KCNIP3, SCN1B), supporting other evidence that the clinical phenomenology of schizophrenia is associated with altered neuronal excitability 27. While these findings implicating basic mechanisms of cortical circuit dynamics may underlie fundamental aspects of the clinical disorder, the possibility that they are driven by the effects of pharmacological treatment and are thus state dependent epiphenomena cannot be excluded. Indeed, our failure to find association of genomic risk scores and differential gene expression in the illness state adds weight to the latter interpretation.
Our data also suggest more widespread regulation of specific transcript isoforms, which we were able to identify using exon- and junction-level analyses. This transcript-specific genetic regulation was particularly prevalent among schizophrenia risk variants, where 66.9% of loci containing multiple transcripts showed clinically- and molecularly-consistent eQTL signal to a single Ensembl transcript isoform. Overall, we have identified many more eQTLs to genome-wide significant schizophrenia risk variants – 48.1% - than previously reported, experimentally implicating far more potential “risk” genes within these loci than previously characterized. Our database of eQTLs is searchable for candidate genes or SNPs and provides publication-ready visualizations (e.g. boxplots in Figure 2) and a “one-stop-shop” for eQTL statistics across three independent studies (LIBD, CMC, and GTEx) for both annotated and unannotated transcribed sequence in the human cortex, and can export results to the UCSC Genome Browser 28 for additional interrogation.
We have highlighted GWAS loci that contain significant and statistically independent eQTLs, as they often point to individual “risk” genes or even more specific “risk” transcripts. These “risk” genes and transcripts are targetable entry points for more focused cellular assays and model organism work to better characterize schizophrenia risk mechanisms. Moreover, these eQTLs of specific transcript features identifies a compelling strategy and directionality for target rescue, specifically to increase or decrease the function of the target transcript(s) and downstream effectors. Focusing solely on increased or decreased expression in brains of patients compared to controls, without considering genetic risk variants and their regulation of local gene expression, will likely predominantly highlight molecular changes resulting from the schizophrenia illness state, as we suggest with consistent down-regulation of ion channels. We stress the priority of identifying the most relevant cellular consequences of genetic risk, which we view as production of particular isoforms with predicted directionality, rather than trying to identify “causal” mutations tagged by “marker” risk SNPs from the GWAS. We suggest that identifying convergence between genetic risk and potential molecular consequences of the disorder is likely to result in better - or at least more consistent support for - targets for drug discovery efforts.
Methods
Postmortem brain samples
Post-mortem human brain tissue was obtained by autopsy primarily from the Offices of the Chief Medical Examiner of the District of Columbia, and of the Commonwealth of Virginia, Northern District, all with informed consent from the legal next of kin (protocol 90-M-0142 approved by the NIMH/NIH Institutional Review Board). Additional post-mortem fetal, infant, child and adolescent brain tissue samples were provided by the National Institute of Child Health and Human Development Brain and Tissue Bank for Developmental Disorders (http://www.BTBank.org) under contracts NO1-HD-4–3368 and NO1-HD-4–3383. The Institutional Review Board of the University of Maryland at Baltimore and the State of Maryland approved the protocol, and the tissue was donated to the Lieber Institute for Brain Development under the terms of a Material Transfer Agreement. Clinical characterization, diagnoses, and macro- and microscopic neuropathological examinations were performed on all samples using a standardized paradigm, and subjects with evidence of macro- or microscopic neuropathology were excluded. Details of tissue acquisition, handling, processing, dissection, clinical characterization, diagnoses, neuropathological examinations, RNA extraction and quality control measures were described previously in Lipska, et al. 29. The Brain and Tissue Bank cases were handled in a similar fashion (http://medschool.umaryland.edu/BTBank/ProtocolMethods.html). Antipsychotic use was measured using toxicology at time of death. Given the retrospective nature of this project, data collection and analysis were not performed blind to the conditions of the experiments.
RNA extraction and sequencing
Post-mortem tissue homogenates of dorsolateral prefrontal cortex grey matter (DLPFC) approximating BA46/9 in postnatal samples and the corresponding region of PFC in fetal samples were obtained from all subjects. Total RNA was extracted from ~100 mg of tissue using the RNeasy kit (Qiagen) according to the manufacturer’s protocol. The poly-A containing RNA molecules were purified from 1 µg DNAse treated total RNA and sequencing libraries were constructed using the Illumina TruSeq© RNA Sample Preparation v2 kit. Sequencing indices/barcodes were inserted into Illumina adapters allowing samples to be multiplexed in across lanes in each flow cell. These products were then purified and enriched with PCR to create the final cDNA library for high throughput sequencing using an Illumina HiSeq 2000 with paired end 2×100bp reads. While polyA+ libraries tend to be biased towards the 3’ end of transcripts (which increases as RNA quality decreases), our higher starting RNA quality (for postmortem studies) allowed us to generate high quality sequencing data (see Table S1). No statistical methods were used to pre-determine sample sizes but our sample sizes are similar to those reported in previous publications {Fromer, 2016 #19}. Balancing samples by diagnoses and age across sequencing batches was attempted to reduce technical biases.
RNA sequencing data processing
The Illumina Real Time Analysis (RTA) module performed image analysis, base calling, and the BCL Converter (CASAVA v1.8.2), generating FASTQ files containing the sequencing reads. These reads were aligned to the human genome (UCSC hg19 build) using the spliced-read mapper TopHat (v2.0.4) using the reference transcriptome to initially guide alignment, based on known transcripts of the previous Ensembl build GRCh37.67 (the “–G” argument in the software) 30. We achieved a median of 85.3 million (IQR: 71.7M-111.2M) aligned reads per sample (see Table S1).
We characterized the transcriptomes of these 495 samples using five convergent measurements of expression (“feature summarizations”)– (1) gene and (2) exon counts, and (3) transcript-level quantifications that rely on existing gene annotation, and two annotation-agnostic approaches we have developed that are determined solely from the read alignments – (4) read coverage supporting exon-exon splice junctions (e.g. coordinates of potentially intronic sequence that are spliced out of mature transcripts captured by a single read) and (5) read coverage overlapping each base in each sample which we have summarized into contiguous “expressed regions” (ERs, see Methods, Figure S1). These last three measurements generate expression for features of interest that can “tag” elements of transcripts in the data that are not constrained by limitations or incompleteness of existing annotation, and the counts for these features can then be directly used for differential expression analysis.
Gene counts were generated using the featureCounts tool31 (v1.4.3-p1) based on the more recent Ensembl v75, which was the last stable release for the hg19 genome build, using single end read counting [featureCounts –a $GTF –o $OUT $BAM]. We converted counts to RPKM values using the total number of aligned reads across the autosomal and sex chromosomes (dropping reads mapping to the mitochondria chromosome). As our libraries were unstranded, reads that mapped to exons belonging to genes on different strands were excluded from counting (which is the default behavior of the tool.
Exon counts were also generated using the featureCounts tool31 (v1.4.3-p1) based on the more recent Ensembl v75, using single end read counting, and allowing reads to be assigned to multiple exons (e.g. those with splice junctions) [featureCounts –O –f –a $GTF –o $OUT $BAM]. We converted counts to RPKM values using the total number of aligned reads across the autosomal and sex chromosomes (dropping reads mapping to the mitochondria chromosome).
Junction counts were generated by first filtering the TopHat BAM file to primary alignments only [samtools view -bh -F 0×100 $BAM > $NEWBAM] and regtools 32 (v 0.1.0) was used to extract analogous junction information (coordinates and number of reads supporting) as the TopHat output. We found that native TopHat output (junctions.bed) was based on both primary and secondary alignments, which could influence the degree of potentially novel splice junctions. We used a modified version of TopHat’s “bed_to_juncs” program to retain the number of supporting reads (in addition to returning the coordinates of the spliced sequence, rather than the maximum fragment range), and used R code (see Supplementary Code) to combine and annotate these junctions across all samples. We identified splice junctions using Ensembl v75 – while the initial alignment was guided by Ensembl v67, novel junctions, by definition, are identified in the second genome alignment, rather than the initial guided transcriptome alignment step. We converted counts to “RP80M” values, or “reads per 80 million mapped” using the total number of aligned reads across the autosomal and sex chromosomes (dropping reads mapping to the mitochondria chromosome), which can be interpreted as the number of reads supporting the junction in an average library size (we were targeting 80M reads in the sequencing). Most junctions were lowly expressed in our homogenate tissue, with fewer than 1 average normalized supporting read (N=3,330,642; 92.98%) including approximately half unique to a single individual (N= 1,779,241, 49.67%).
Transcripts were assembled using StringTie4 (version 1.1.2) guided by Ensembl v75 annotation within each sample [stringtie $BAM –o $OUT –G $GTF]. We then used “CuffMerge” 33 (version 2.2.1) to merge all assembled transcriptomes across all samples, and then re-quantified the expression of each transcript isoform in each sample again using StringTie to this global set of transcripts [stringtie $BAM –B –e –o $OUT –G $GTF_ALL] to have expression measurements on the same transcripts across all samples. We then used the “ballgown” tool34 to merge all assembled and quantified transcripts across all samples (N= 733,339), and used liberal filtering to remove lowly or uniquely expressed transcripts (mean FPKM > 0.025), resulting in 188,578 transcripts across the 495 samples.
Expressed regions (ERs) were calculated using the “derfinder” R Bioconductor package6 using a cutoff of 5 normalized (to 80M reads) read coverage, which identified 389,797 ERs. We retained the 275,885 ERs that were at least 12 basepairs, and annotated the ERs to Ensembl v75.
Genotype data processing
SNP genotyping with HumanHap650Y_V3 (N=135), Human 1M-Duo_V3 (N=357), and Omni5 (N=3) BeadChips (Illumina, San Diego, CA) was carried out according to the manufacturer’s instructions with DNA extracted from cerebellar tissue. Genotype data were processed and normalized with the crlmm R/Bioconductor package35 separately by platform. Genotype imputation was performed on high-quality observed genotypes (removing low quality and rare variants) using the prephasing/imputation stepwise approach implemented in IMPUTE236 and Shape-IT37, with the imputation reference set from the full 1000 Human Genomes Project Phase 3 data set, separately by platform. We retained common SNPs (MAF > 5%) that were present in the majority of samples (missingness < 10%) that were in Hardy Weinberg equilibrium (at p > 1×10⁻⁶) using the Plink38 version 1.9 tool kit [`plink --bfile $BFILE --geno 0.1 --maf 0.05 --hwe 0.000001`]. We then identified linkage disequilibrium (LD)-independent SNPs to use in genome-wide clustering of samples and in the number of independent eQTL tests performed [`plink –bfile $BFILE --indep 100 10 1.25`]. Multidimensional scaling (MDS) was performed on the autosomal LD-independent construct genomic ancestry components on each sample, which can be interpreted as quantitative levels of ethnicity – the first component separated the Caucasian and African American samples. This processing and quality control steps resulted in 7,421,423 common variants in this dataset of 495 subjects.
Public data processing
GTEx:
Raw RNA-seq reads from all brain samples with corresponding genotype data were downloaded from SRA and aligned to the genome using TopHat2 30 (version 2.0.14) using the iGenomes transcriptome and genome annotations based on hg19. As above, featureCounts 31 was used to quantify expression of genes and exons relative to Ensembl v75, and junctions were quantified with regtools32 as above. We used StringTie with the assembled merged GTF from the LIBD DLPFC samples on the GTEx BAM files to quantify the same transcripts, and used bwtool41 to quantify the coverage of the same expressed regions from the GTEx brain samples. Genotype data from the two platforms (Illumina Omni 5M and 2.5M) were imputed separately as described above and merged into a single plink38 set.
GEUVADIS:
Raw RNA-seq reads from all LCL samples were downloaded from SRA and aligned to the genome using TopHat2 30 (version 2.0.9) using the iGenomes transcriptome and genome annotations based on hg19. As above, featureCounts31 was used to quantify expression of genes and exons relative to Ensembl v75, and junctions were quantified with regtools32 as above. We used StringTie with the assembled merged GTF from the LIBD DLPFC samples on the GEUVADIS BAM files to quantify the same transcripts, and used bwtool to quantify the coverage of the same expressed regions from the GEUVADIS LCL samples.
CommonMind Consortium (CMC):
547 BAM files were downloaded from Synapse, which were aligned with TopHat2 (version 2.0.9) using Ensembl v70 transcriptome annotation and the hg19 genome. As above, featureCounts 31 was used to quantify expression of genes and exons relative to Ensembl v75, and junctions were quantified with regtools 32 as above. We used StringTie with the assembled merged GTF from the LIBD DLPFC samples on the CMC BAM files to quantify the same transcripts, and used bwtool to quantify the coverage of the same expressed regions from the CMC brain samples. Genotypes were converted to plink file sets from GEN files obtained from Synapse using posterior probabilities > 90%, resulting in genotype data across 9,506,038 SNPs and 547 samples.
Differential expression across brain development
We modeled differential expression across age at each of the five feature summarizations (gene, exon, junction, transcript, and ER) in the 320 control subjects across the lifespan. We modeled expression, after transforming with log2 with an offset of 1 (to better fulfill the assumptions of linear regression), as a function of age after creating using linear splines with breakpoints at ages: birth (0), 1, 10, 20, and 50, further adjusting for sex and ancestry/ethnicity (first 3 MDS components). F-statistics were computed comparing the model containing age (including the linear splines), sex, and ethnicity, to a statistical model with just sex and ethnicity, with corresponding p-values calculated based on an F-distribution with 7 and 308 degrees of freedom, and Bonferroni adjustment within each feature type was performed using the number of features with non-zero expression (gene RPKM > 0.01, exon RPKM > 0.1, and junction RP80M > 0.2 with non-novel annotation) across all samples as the number of tests (which varied by feature type). We also computed post-hoc statistics on the data, including the Pearson correlation between “cleaned” expression (after regressing out the effects of sex and ethnicity, holding the age effects constant), and age to determine if the expression of the fetal rose or fell across the lifespan, and also measured the fetal versus postnatal log2 fold changes.
Preferential isoform usage across aging was determined by identifying the subset of genes (by Ensembl ID) that contained at least one Bonferroni-significant feature that had positive correlation with age and another Bonferroni-significant feature that had negative correlation with age. Specifically, the procedure that we performed was:
Fitting a (linear) spline model using all samples (N=320) with break points at birth/0, 1, 10, 20, and 50 years of age at all expressed features, further allowing an offset at birth (ie the slope in prenatal life does not connect to the slope between birth/0 and 1 (since we did not have 3rd trimester prenatal samples), further adjusting for sex and ethnicity. Examples of the spline fit are shown in the panels of the Figure S4B-H.
Calculating an F-statistic comparing this full model (age spline, sex, ethnicity) to a null model just containing sex and ethnicity) and Bonferroni-adjust the resulting p-values for this F-statistic within each feature summarization type (Gene, Exon, Junction, Transcript, and ER).
Calculating post-hoc Pearson correlation coefficients comparing age and log2 fold changes comparing pre- and post-natal samples for all features – note there are no p-values retained from nor statistical inference performed from these correlations.
Then, for a given gene and feature summarization type (Exon, Junction, Transcript and ER), filtering to only Bonferroni-significant features and checking whether there is at least one feature with positive age correlation and another feature with negative age correlation.
We also computed the difference in positive and negative correlations as a measure of the magnitude of the preferential isoform use, which showed linear replication with the BrainSpan42 project (i.e. computing the same age correlations in identically processed and summarized data, Figure S11). Gene set analyses using pre-defined gene ontology (GO) and Kyoto Encyclopedia of Genes and Genomes (KEGG) sets were performed using the clusterProfiler R/Bioconductor package43, here using the genes (mapping from Ensembl to Entrez ID) that had such preferential isoform use to those that were developmentally regulated (having at least one feature that was associate with age at Bonferroni significance). Enrichments with the PGC2 schizophrenia risk loci – defined by the chr:start-end roughly corresponding to linkage disequilibrium blocks in the published manuscript - were performed both parametrically, by overlapping the genomic coordinates of the 108 risk regions with those genes that had preferential isoform usage, compared to a background of all genes with each set of expressed features, as well as by permuting the locations of the 108 regions across the genome 10,000 times and each time, re-computing the overlap within these null regions – see additional details in Jaffe et al 20157. Empirical p-values were calculated by counting the number of the odds ratios across the 10,000 null permutations to each observed odds ratio.
We performed sensitivity analyses to assess the role of gene length on these GWAS enrichments of isoform switch genes, using either the coding length (log2-transformed) or the number of exons (log2-transformed). We assessed confounding using logistic regression analysis among all expressed genes, computing the odds of genes with isoform shifts being within the risk loci, within and without adjusting for these gene length variables. Schizophrenia GWAS enrichments at the exon and junction level remained significant and approximated the empirical p-values obtained from permutation (as the act of randomly permuting GWAS regions should have removed potential confounding). We performed analogous logistic regression analyses using GWAS LD regions from Type 2 diabetes 16, Parkinson’s Disease 17, and Alzheimer’s Disease 18, adjusting for the log2 coding length and found no association to genes with isoform shifts in the developing cortex.
Reference-based cellular deconvolution
We analogously processed RNA-seq data from Darmanis et al 44 consisting of 25 replicating and 110 quiescent fetal neurons, 18 oligodendrocyte progenitor cells (OPCs), 131 neurons, 62 astrocytes, 38 oligodendrocytes,16 microglia and 20 endothelial cells. We defined stage-specific genes using the same framework described by Jaffe and Irizarry 201423, which involved creating a “barcode” of 40 genes per cell type, such that 20 genes were more highly expressed and another 20 genes were more lowly expressed for one stage compared to all others (t-statistic p-values < 1e-8), and ranking subsequent significant genes by log2 fold changes for selection. From our final set of 258 unique genes, we scaled each gene expression value to the standard normal distribution to improve comparability between single cell and bulk RNA-seq data, and created the regression calibration design matrix based on Houseman et al.45, shown in Table S14. We then projected samples into the design matrix using the `projectCellType()` function in the minfi Bioconductor package46.
eQTL discovery analyses
We performed eQTL analyses separately by feature type (gene, exon, junction, transcript, and ER) allowing for a 500kb window around each of the 7,421,423 common SNPs in the 412 age > 13 samples, adjusting for ancestry (first three MDS components from the genotype data), sex, diagnosis, and the first K principal components (PCs) of the normalized expression features, where K was calculated separately by feature type using the Buja and Eyuboglu permutation-based algorithm39 in the “sva” Bioconductor package40 (gene: 22 PCs, exon: 19 PCs, junction: 26 PCs, transcript: 25 PCs, expressed regions: 20 PCs). The eQTL analyses were run using the MatrixEQTL R package47, which returned the log2 fold change per allele copy, and corresponding T-statistic, p-value, and FDR for each SNP-feature pair. We further used the LD-independent SNPs to estimate the effective number of tests (by counting the number of features within a 500kb window around each LD independent SNP) for a more conservative Bonferroni adjustment. For all five feature types, we retained all eQTLs with FDR < 1%.
eQTL replication analyses
We sought to replicate all significant SNP-Feature pairs for each eQTL in two independent datasets across all five feature summarizations: CommonMind Consortium and the GTEx project. We used chromosome and position of variants to attempt to match across dataset –almost all SNPs in the discovery sample were present in each replication samples. Within each dataset, we tested all polymorphic SNPs (e.g. not monomorphic) and corresponding expressed features, adjusting for the first 10 PCs of each feature summarization type and the first 5 MDS components of the corresponding common genotype data. Analyses within CMC were performed on the 285 controls and analyses in GTEx were performed within each brain region separately. After identifying and matching back on SNP-feature eQTL pairs, we checked whether the counted alleles were the same within the discovery and replication datasets and flipped the directionality of eQTL associations where the alleles were discordant. Note that in GTEx, some residual discordancy was still present across dataset (e.g. off-diagonal points in Figures S6, S7A and S7B) but not within a dataset (Figure S7C). Meta-analysis between discovery (LIBD) and CMC was performed using Stouffer’s Methods 48, by summing the T-statistics and dividing by the square-root of the number of datasets (N=2). Meta-analysis within GTEx brain regions was performed using the same approach, here dividing by the square root of number of datasets/brain regions (N=13). When replication statistics were not present in replication datasets due no/low expression or being monomorphic, the discovery eQTL was “penalized” by setting the replication statistic to 0 prior to meta-analysis.
eQTL clinical enrichment analyses
We downloaded the 128 linkage-disequilibrium-independent variants that reached genome-wide significance in combined analysis from the latest schizophrenia GWAS (their Supplementary Table 2) and matched those variants to our data by chromosome and position relative to hg19. Of the 128 variants, only 106 were present in our final QC’d and common (MAF>5%) genotype data. Most were excluded due to MAFs less than 5% although several variants were dropped for other reasons (not present in 1000 Genomes, failed Hardy Weinberg equilibrium, poorly imputed, etc). We therefore interrogated only those 106 schizophrenia-associated variants among our eQTL associations. We utilized a similar strategy for the latest NHGRI GWAS catalog (downloaded 7/24/2017) with an additional step of lifting over our variants to hg38 and again matching by variant coordinates. Here, only approximately half of the variants were well-measured in our samples (see Table 2). We used 3 significance levels to associate eQTLs with GWAS variants: a) more liberal FDR-significant eQTLs in the discovery dataset, b) these FDR-significant eQTLs with additional replication data support (meta-analysis p-values with CMC < 10−8), and c) Bonferroni-significant eQTLs in the discovery dataset, e.g. Table 1. We assessed the chromatin state enrichments of unannotated sequences associated with these risk variants using published data from the 15 state ChromHMM Epigenome Roadmap project49. We evaluated the set of expressed region (ER) eQTL features that were completely novel in both the SCZD GWAS (1096 regions, 323.7kb total coverage) as well as the NHGRI GWAS catalog (5068 regions, ~1.59Mb total coverage) described in the text. We compared the chromatin states for the ERs compared to the rest of the genome not contained in the ERs (including the entire coding genome).
eQTL conditional analyses
We performed conditional analyses within the eQTLs for each schizophrenia risk variant to remove highly correlated signal and improve resolution of associations. We used the residuals of the statistical model described above within each feature type (regressing out PCs, MDS components and diagnosis) to allow for analyses across feature types. We iteratively conditioned on the expression level of the most significant eQTL feature and recomputed the eQTL p-values for all other features to the risk SNP. Those features that were still marginally significantly (at p<0.05) were retained, and then next-best expression feature (following conditioning) was additionally adjusted for in the statistical model. This procedure of iteratively testing for conditional independence among remaining features and subsequently adjusting for the most significant feature continued until no additional features were independently associated with the genetic risk variant at p < 0.05. This procedure was performed separately within each of the 51 loci with eQTL signal.
Polygene risk score (PRS) analysis:
Using the allelic dosage files following imputation described above and the SNPs from provided by the PGC to the Lieber Institute that did not contain completely different clinical subjects used in the GWAS2. We considered expression associations at the gene, exon and junction-level to the PRS scores from the first 5 clinical SNP sets, corresponding to GWAS p-value thresholds of p < 5e-8 (s1), p < 1e-6 (s2), p < 1e-4 (s3), p < 0.001 (s4), and p < 0.01 (s5) – subsequent SNP sets were ignored due to clinical risk plateauing at s5. We also focused only on Caucasian individuals (96 cases, 113 controls), as the s5 PRS was increased in patients relative to controls in this sample (p=3.2×10⁻⁵), but did not differ among African Americans (p=0.9). Within each expression feature type, we modeled expression levels as a function of each PRS set (s1-s5), adjusting for 3 MDS components of the genotype data, sex, and the first K principal components (PCs) of the normalized expression features, where K was calculated using the Buja and Eyuboglu permutation-based algorithm39 in the “sva” Bioconductor package40. The resulting p-values of PRS on expression, adjusting for the above factors, were subject to false discovery rate (FDR) control to account for multiple testing.
Schizophrenia differential expression analyses
Discovery dataset analysis:
we first filtered the subjects with RNA-seq to retain a more stringent set of 155 SCZD cases and 196 controls (criteria: ages between 17–80, gene assignment rate > 0.5, mapping rate > 0.7, RIN > 6, not outlying on 2nd ancestry PC, only self-reported Caucasians and African Americans). We fit three statistical models across each of the expression summarizations, modeling log2 transformed expression (with an offset of 1) as a function of:
(1) Adjusted (“_adj” suffix in supplementary tables): SCZD diagnosis, adjusting for age, sex, ancestry (SNP PCs 1, 5, 6, 9, 10, which were at least marginally associated with diagnosis), and then observed measures related to RNA quality: RIN, mitochondrial mapping rate, and gene assignment rate.
(2) Adjusted + Quality Surrogate Variables (“_qsva” suffix in supplementary tables): SCZD diagnosis adjusting for “Adjusted” model as well as the first 12 PCs from the degradation matrix (see below) based on polyA+ libraries (selected using to using the BE algorithm 39 in the sva Bioconductor package40 while providing the adjusted model as input).
(3) Adjusted + Principal Components (“_pca” suffix in supplementary tables): SCZD diagnosis adjusting for “Adjusted” model as well as the first k PCs from the expressed features (using the 50000 most variable features) depending on the feature type (gene: 23 PCs, exon: 20 PCs, transcript: 26 PCs, junction: 26 PCs, ERs: 23 PCs).
We used the `lmTest` and `ebayes` functions in the limma Bioconductor package 50 to fit all of the statistical models to estimate log2 fold changes, moderated T-statistics, and corresponding p-values. Multiple testing correction via the false discovery rate (FDR) was applied using the set of expressed features in this sample set for each summarization type: 24,122 genes (mean RPKM > 0.1), 420,022 exons (mean RPKM > 0.2), 61,950 transcripts (mean FPKM > 0.2), 229,846 junctions (mean RP80M > 1), and the 275,885 ERs.
RNA quality correction:
We summarize the RNA quality correction approach here – for more detail, see the companion paper by Jaffe et al 2017. Briefly, the quality surrogate variable analysis (qSVA) uses RNA sequencing data generated from five DLPFC tissue samples left unfrozen for 0, 15, 30 and 60 minutes, resulting in 20 RNA samples. These samples were sequenced with both polyA+ and RiboZero library preparations, and gene, exon and junction counts were derived as above. We utilized the gene-level effects of degradation in these data in Figure S5 to demonstrate residual confounding by RNA quality, which we call the “DEQual Plot”.
For a given preparation type, we identified the genomic regions most susceptible to degradation by correlating coverage at expressed regions 6 to degradation time, adjusting for donor. This statistical modeling identified 515 regions significantly susceptible to degradation (at Bonferroni significance) in the RiboZero libraries and the top 1000 regions most susceptible to degradation (among the 35,287 at Bonferroni significance) in the polyA+ libraries – the BED files for these degradation-susceptible regions are available in Jaffe et al 201721
The algorithm then involves selecting the set of regions for a particular library type and calculating total coverage within each region in the new user-provided samples (e.g. the 495 DLPFC RNA-seq polyA+ samples) to form the degradation matrix (which is either 515 or 1000 rows by N samples). Then PCA is performed on the log2 transformed degradation matrix (with an offset of 1) and the top K PCs are selected, for example using the BE algorithm 39, and extracted – the set of these PCs are referred to as quality surrogate variables (qSVs), and are included as adjustment variables in subsequent differential expression analyses.
Replication dataset analysis:
we performed analogous sample selection procedures as in the discovery dataset to select 159 patients and 172 controls (total gene assignment rate > 0.3, alignment rate > 0.8, RIN > 6, ages between 18–80, non-outlying on genetic ancestry PCs 3 and 5 and keeping only reported Caucasians and African Americans). We similarly fit the three sets of statistical models to all five feature summarizations, with the following differences compared to the discovery analysis:
(1) Adjusted model: the model here was diagnosis adjusting for age, sex, race, brain bank, RIN, gene assignment rate, alignment rate.
(2) qSVA model: the degradation matrix was constructed using the 515 regions based on the RiboZero libraries in the degradation experiment.
(3) PC adjustment: for each feature summarization type, we included: 27 PCs for genes, 29 PCs for exons, 39 PCs for transcripts, 39 PCs for junctions, and 33 PCs for ERs.
In these replication data we did not perform FDR correction. We were using the study for replication, not discovery, and therefore only used the features that were expressed in our data regardless of the expression levels in CMC. We considered features independently replicated if they had the same directionality for the SCZD versus control log2 fold change and were marginally significant (at p < 0.05) in the CMC dataset.
Gene set analyses on replicated differentially expressed features and genes were performed with clusterProfiler43 as described above. Set-level analyses on features in the GWAS risk regions were conducted by assigning each expressed feature a binary variable for whether it was in the risk regions or not. Then we fit a linear regression model of the t-statistics for diagnosis, adjusted by the qSVA approach, as a function as whether the feature was in the risk region, adjusting for its average expression level. This analysis was conducted across and then within each of the five feature summarization types.
Supplementary Material
Acknowledgements:
We thank Dr. Ronald Zielke, Robert D. Vigorito, and Robert M. Johnson of the National Institute of Child Health and Human Development Brain and Tissue Bank for Developmental Disorders at the University of Maryland for their provision of fetal, child, and adolescent brain specimens; This work was supported by the funding from Lieber Institute for Brain Development and the Maltz Research Laboratories, and partially supported by NIH R21MH109956 (A.E.J.) and Consejo Nacional de Ciencia y Tecnología México 351535 (L.C.T.)
The Genotype-Tissue Expression (GTEx) Project was supported by the Common Fund of the Office of the Director of the National Institutes of Health. Additional funds were provided by the NCI, NHGRI, NHLBI, NIDA, NIMH, and NINDS. Donors were enrolled at Biospecimen Source Sites funded by NCI\SAIC-Frederick, Inc. (SAIC-F) subcontracts to the National Disease Research Interchange (10XS170), Roswell Park Cancer Institute (10XS171), and Science Care, Inc. (X10S172). The Laboratory, Data Analysis, and Coordinating Center (LDACC) was funded through a contract (HHSN268201000029C) to The Broad Institute, Inc. Biorepository operations were funded through an SAIC-F subcontract to Van Andel Institute (10ST1035). Additional data repository and project management were provided by SAIC-F (HHSN261200800001E). The Brain Bank was supported by a supplements to University of Miami grants DA006227 & DA033684 and to contract N01MH000028. Statistical Methods development grants were made to the University of Geneva (MH090941 & MH101814), the University of Chicago (MH090951, MH090937, MH101820, MH101825), the University of North Carolina - Chapel Hill (MH090936 & MH101819), Harvard University (MH090948), Stanford University (MH101782), Washington University St Louis (MH101810), and the University of Pennsylvania (MH101822). The data used for the analyses described in this manuscript were obtained from dbGaP accession number phs000424.v6.p1 on October 6, 2015.
Data were generated as part of the CommonMind Consortium supported by funding from Takeda Pharmaceuticals Company Limited, F. Hoffman-La Roche Ltd and NIH grants R01MH085542, R01MH093725, P50MH066392, P50MH080405, R01MH097276, RO1-MH-075916, P50M096891, P50MH084053S1, R37MH057881 and R37MH057881S1, HHSN271201300031C, AG02219, AG05138 and MH06692. Brain tissue for the study was obtained from the following brain bank collections: the Mount Sinai NIH Brain and Tissue Repository, the University of Pennsylvania Alzheimer’s Disease Core Center, the University of Pittsburgh NeuroBioBank and Brain and Tissue Repositories and the NIMH Human Brain Collection Core. CMC Leadership: Pamela Sklar, Joseph Buxbaum (Icahn School of Medicine at Mount Sinai), Bernie Devlin, David Lewis (University of Pittsburgh), Raquel Gur, Chang-Gyu Hahn (University of Pennsylvania), Keisuke Hirai, Hiroyoshi Toyoshiba (Takeda Pharmaceuticals Company Limited), Enrico Domenici, Laurent Essioux (F. Hoffman-La Roche Ltd), Lara Mangravite, Mette Peters (Sage Bionetworks), Thomas Lehner, Barbara Lipska (NIMH).
Members of the BrainSeq consortium include: Christian R Schubert, Patricio O’Donnell, Jie Quan, Jens R Wendland, Hualin S Xi, Ashley R Winslow, Enrico Domenici, Laurent Essioux, Tony Kam-Thong, David C Airey, John N Calley, David A Collier, Hong Wang, Brian Eastwood, Philip Ebert, Yushi Liu, Laura Nisenbaum, Cara Ruble, James Scherschel, Ryan Matthew Smith, Hui-Rong Qian, Kalpana Merchant, Michael Didriksen, Mitsuyuki Matsumoto, Takeshi Saito, Nicholas J Brandon, Alan J Cross, Qi Wang, Husseini Manji, Hartmuth Kolb, Maura Furey, Wayne C Drevets, Joo Heon Shin, Andrew E Jaffe, Rujuta Narurkar, Yankai Jia, Richard E Straub, Amy Deep-Soboslay, Thomas M Hyde, Joel E Kleinman, Daniel R Weinberger.
Footnotes
Accession codes: Synapse.org: doi:10.7303/syn12299750. Processed data (gene, exon, and junction counts) are available at http://eqtl.brainseq.org/phase1
Competing Financial Interests Statement
The following named authors have competing interests: Tony Kam-Thong is employed by F. Hoffmann-La Roche; Hualin S Xi and Jie Quan were employees of Pfizer Inc. at the time these studies were conducted; Alan Cross, and Nicholas J. Brandon were full time employees and shareholders in AstraZeneca at the time these studies were conducted. The remaining authors declare no competing financial interests. The authors declare no conflict of interest.
The following BrainSeq Consortium members have competing interests: CRS, PO, JQ, JRW, HSX and ARW are employees and stockholders of Pfizer. ED, LE and TK-T are employees and stockholders of F Hoffmann-La Roche, AG. DCA, JNC, DAC, HW, BE, PE, YL, LN, CR, JES, RMS and H-RQ are employees and stockholders of Eli Lilly and Company. KM is an employee of TransThera Consulting and an ex-employee of Eli Lilly and Company. MD is an employee and stockholder of H Lundbeck A/S. MM and TS are employees of Astellas Pharma. NJB, AJC and QW are employees and stockholders of AstraZeneca LP. HM, HK, MF and WCD are employees of Janssen Research and Development, LLC, and of Johnson and Johnson, and stockholders of Johnson and Johnson. JHS, AEJ, YJ, RES, AD-S, TMH, JEK and DRW are employees of the Lieber Institute for Brain Development, a non-profit organization. The consortium members declare no conflict of interest.
Data Availability: sequencing reads and meta-data are available through Synapse.org at accession: syn12299750 (doi:10.7303/syn12299750). Links to processed data can be found at http://eqtl.brainseq.org/phase1/
Code availability: R code to support statistical analyses is available at: https://github.com/LieberInstitute/BrainSeq_Phase1.
The Life Sciences Reporting Summary accompanying this paper is available online.
References
- 1.Birnbaum R & Weinberger DR Genetic insights into the neurodevelopmental origins of schizophrenia. Nature reviews. Neuroscience, doi: 10.1038/nrn.2017.125 (2017). [DOI] [PubMed] [Google Scholar]
- 2.Ripke S et al. Biological insights from 108 schizophrenia-associated genetic loci. Nature 511, 421–421, doi: 10.1038/nature13595 (2014). [DOI] [PMC free article] [PubMed] [Google Scholar]
- 3.Maurano MT et al. Systematic localization of common disease-associated variation in regulatory DNA. Science 337, 1190–1195, doi: 10.1126/science.1222794 (2012). [DOI] [PMC free article] [PubMed] [Google Scholar]
- 4.Pertea M et al. StringTie enables improved reconstruction of a transcriptome from RNA-seq reads. Nature biotechnology 33, 290–295, doi: 10.1038/nbt.3122 (2015). [DOI] [PMC free article] [PubMed] [Google Scholar]
- 5.Nellore A et al. Human splicing diversity across the Sequence Read Archive. bioRxiv, doi: 10.1101/038224 (2016). [DOI] [PMC free article] [PubMed] [Google Scholar]
- 6.Collado Torres L et al. Flexible expressed region analysis for RNA-seq with derfinder. Nucleic Acids Research In Press., doi: 10.1101/015370 (2016). [DOI] [PMC free article] [PubMed] [Google Scholar]
- 7.Jaffe AE et al. Developmental regulation of human cortex transcription and its clinical relevance at single base resolution. Nature neuroscience 18, 154–161, doi: 10.1038/nn.3898 (2015). [DOI] [PMC free article] [PubMed] [Google Scholar]
- 8.Tan W et al. Molecular cloning of a brain-specific, developmentally regulated neuregulin 1 (NRG1) isoform and identification of a functional promoter variant associated with schizophrenia. The Journal of biological chemistry 282, 24343–24351, doi: 10.1074/jbc.M702953200 (2007). [DOI] [PubMed] [Google Scholar]
- 9.Kao WT et al. Common genetic variation in Neuregulin 3 (NRG3) influences risk for schizophrenia and impacts NRG3 expression in human brain. Proceedings of the National Academy of Sciences of the United States of America 107, 15619–15624, doi: 10.1073/pnas.1005410107 (2010). [DOI] [PMC free article] [PubMed] [Google Scholar]
- 10.Tao R et al. Expression of ZNF804A in human brain and alterations in schizophrenia, bipolar disorder, and major depressive disorder: a novel transcript fetally regulated by the psychosis risk variant rs1344706. JAMA psychiatry 71, 1112–1120, doi: 10.1001/jamapsychiatry.2014.1079 (2014). [DOI] [PMC free article] [PubMed] [Google Scholar]
- 11.Hyde TM et al. Expression of GABA signaling molecules KCC2, NKCC1, and GAD1 in cortical development and schizophrenia. The Journal of neuroscience : the official journal of the Society for Neuroscience 31, 11088–11095, doi: 10.1523/JNEUROSCI.1234-11.2011 (2011). [DOI] [PMC free article] [PubMed] [Google Scholar]
- 12.Birnbaum R, Jaffe AE, Hyde TM, Kleinman JE & Weinberger DR Prenatal expression patterns of genes associated with neuropsychiatric disorders. Am J Psychiatry 171, 758–767, doi: 10.1176/appi.ajp.2014.13111452 (2014). [DOI] [PMC free article] [PubMed] [Google Scholar]
- 13.Buchanan RW & Carpenter WT Domains of psychopathology: an approach to the reduction of heterogeneity in schizophrenia. The Journal of nervous and mental disease 182, 193–204 (1994). [PubMed] [Google Scholar]
- 14.Winterer G & Weinberger DR Genes, dopamine and cortical signal-to-noise ratio in schizophrenia. Trends in neurosciences 27, 683–690, doi: 10.1016/j.tins.2004.08.002 (2004). [DOI] [PubMed] [Google Scholar]
- 15.Jaffe AE et al. Mapping DNA methylation across development, genotype and schizophrenia in the human frontal cortex. Nature neuroscience 19, 40–47, doi: 10.1038/nn.4181 (2016). [DOI] [PMC free article] [PubMed] [Google Scholar]
- 16.Morris AP et al. Large-scale association analysis provides insights into the genetic architecture and pathophysiology of type 2 diabetes. Nature genetics 44, 981–990, doi: 10.1038/ng.2383 (2012). [DOI] [PMC free article] [PubMed] [Google Scholar]
- 17.Nalls MA et al. Large-scale meta-analysis of genome-wide association data identifies six new risk loci for Parkinson’s disease. Nature genetics 46, 989–993, doi: 10.1038/ng.3043 (2014). [DOI] [PMC free article] [PubMed] [Google Scholar]
- 18.Lambert JC et al. Meta-analysis of 74,046 individuals identifies 11 new susceptibility loci for Alzheimer’s disease. Nature genetics 45, 1452–1458, doi: 10.1038/ng.2802 (2013). [DOI] [PMC free article] [PubMed] [Google Scholar]
- 19.Fromer M et al. Gene expression elucidates functional impact of polygenic risk for schizophrenia. Nature neuroscience 19, 1442–1453, doi: 10.1038/nn.4399 (2016). [DOI] [PMC free article] [PubMed] [Google Scholar]
- 20.Human genomics. The Genotype-Tissue Expression (GTEx) pilot analysis: multitissue gene regulation in humans. Science 348, 648–660, doi: 10.1126/science.1262110 (2015). [DOI] [PMC free article] [PubMed] [Google Scholar]
- 21.Jaffe AE et al. qSVA framework for RNA quality correction in differential expression analysis. Proceedings of the National Academy of Sciences of the United States of America 114, 7130–7135, doi: 10.1073/pnas.1617384114 (2017). [DOI] [PMC free article] [PubMed] [Google Scholar]
- 22.Schizophrenia Working Group of the Psychiatric Genomics, C. Biological insights from 108 schizophrenia-associated genetic loci. Nature 511, 421–427, doi: 10.1038/nature13595 (2014). [DOI] [PMC free article] [PubMed] [Google Scholar]
- 23.Jaffe AE & Irizarry RA Accounting for cellular heterogeneity is critical in epigenome-wide association studies. Genome biology 15, R31, doi: 10.1186/gb-2014-15-2-r31 (2014). [DOI] [PMC free article] [PubMed] [Google Scholar]
- 24.Steijger T et al. Assessment of transcript reconstruction methods for RNA-seq. Nature methods 10, 1177–1184, doi: 10.1038/nmeth.2714 (2013). [DOI] [PMC free article] [PubMed] [Google Scholar]
- 25.Li YI et al. RNA splicing is a primary link between genetic variation and disease. Science 352, 600–604, doi: 10.1126/science.aad9417 (2016). [DOI] [PMC free article] [PubMed] [Google Scholar]
- 26.Weinberger DR & Levitt P in Schizophrenia 393–412 (Wiley-Blackwell, 2011). [Google Scholar]
- 27.Uhlhaas PJ & Singer W Abnormal neural oscillations and synchrony in schizophrenia. Nature reviews. Neuroscience 11, 100–113, doi: 10.1038/nrn2774 (2010). [DOI] [PubMed] [Google Scholar]
- 28.Tyner C et al. The UCSC Genome Browser database: 2017 update. Nucleic Acids Res 45, D626–D634, doi: 10.1093/nar/gkw1134 (2017). [DOI] [PMC free article] [PubMed] [Google Scholar]
- 29.Lipska BK et al. Critical factors in gene expression in postmortem human brain: Focus on studies in schizophrenia. Biological psychiatry 60, 650–658, doi: 10.1016/j.biopsych.2006.06.019 (2006). [DOI] [PubMed] [Google Scholar]
- 30.Kim D et al. TopHat2: accurate alignment of transcriptomes in the presence of insertions, deletions and gene fusions. Genome biology 14, R36, doi: 10.1186/gb-2013-14-4-r36 (2013). [DOI] [PMC free article] [PubMed] [Google Scholar]
- 31.Liao Y, Smyth GK & Shi W featureCounts: an efficient general purpose program for assigning sequence reads to genomic features. Bioinformatics 30, 923–930, doi: 10.1093/bioinformatics/btt656 (2014). [DOI] [PubMed] [Google Scholar]
- 32.Ramu A, Abbott T & Griffith M regtools v. 0.1.0 (2016). <https://github.com/griffithlab/regtools>.
- 33.Trapnell C et al. Transcript assembly and quantification by RNA-Seq reveals unannotated transcripts and isoform switching during cell differentiation. Nature biotechnology 28, 511–515, doi: 10.1038/nbt.1621 (2010). [DOI] [PMC free article] [PubMed] [Google Scholar]
- 34.Frazee AC et al. Ballgown bridges the gap between transcriptome assembly and expression analysis. Nature biotechnology 33, 243–246, doi: 10.1038/nbt.3172 (2015). [DOI] [PMC free article] [PubMed] [Google Scholar]
- 35.Scharpf RB, Irizarry RA, Ritchie ME, Carvalho B & Ruczinski I Using the R Package crlmm for Genotyping and Copy Number Estimation. J Stat Softw 40, 1–32 (2011). [PMC free article] [PubMed] [Google Scholar]
- 36.Howie BN, Donnelly P & Marchini J A flexible and accurate genotype imputation method for the next generation of genome-wide association studies. PLoS genetics 5, e1000529, doi: 10.1371/journal.pgen.1000529 (2009). [DOI] [PMC free article] [PubMed] [Google Scholar]
- 37.Delaneau O, Coulonges C & Zagury JF Shape-IT: new rapid and accurate algorithm for haplotype inference. BMC bioinformatics 9, 540, doi: 10.1186/1471-2105-9-540 (2008). [DOI] [PMC free article] [PubMed] [Google Scholar]
- 38.Purcell S et al. PLINK: a tool set for whole-genome association and population-based linkage analyses. American journal of human genetics 81, 559–575, doi: 10.1086/519795 (2007). [DOI] [PMC free article] [PubMed] [Google Scholar]
- 39.Buja A & Eyuboglu N Remarks on Parallel Analysis. Multivariate Behavioral Research 27, 509–540, doi: 10.1207/s15327906mbr2704_2 (1992). [DOI] [PubMed] [Google Scholar]
- 40.Leek JT, Johnson WE, Parker HS, Jaffe AE & Storey JD The sva package for removing batch effects and other unwanted variation in high-throughput experiments. Bioinformatics 28, 882–883, doi: 10.1093/bioinformatics/bts034 (2012). [DOI] [PMC free article] [PubMed] [Google Scholar]
- 41.Pohl A & Beato M bwtool: a tool for bigWig files. Bioinformatics 30, 1618–1619, doi: 10.1093/bioinformatics/btu056 (2014). [DOI] [PMC free article] [PubMed] [Google Scholar]
- 42.BrainSpan. Atlas of the Developing Human Brain, <http://developinghumanbrain.org> (2011). [Google Scholar]
- 43.Yu G, Wang LG, Han Y & He QY clusterProfiler: an R package for comparing biological themes among gene clusters. Omics : a journal of integrative biology 16, 284–287, doi: 10.1089/omi.2011.0118 (2012). [DOI] [PMC free article] [PubMed] [Google Scholar]
- 44.Darmanis S et al. A survey of human brain transcriptome diversity at the single cell level. Proceedings of the National Academy of Sciences of the United States of America 112, 7285–7290, doi: 10.1073/pnas.1507125112 (2015). [DOI] [PMC free article] [PubMed] [Google Scholar]
- 45.Houseman EA et al. DNA methylation arrays as surrogate measures of cell mixture distribution. BMC bioinformatics 13, 86, doi: 10.1186/1471-2105-13-86 (2012). [DOI] [PMC free article] [PubMed] [Google Scholar]
- 46.Aryee MJ et al. Minfi: a flexible and comprehensive Bioconductor package for the analysis of Infinium DNA methylation microarrays. Bioinformatics 30, 1363–1369, doi: 10.1093/bioinformatics/btu049 (2014). [DOI] [PMC free article] [PubMed] [Google Scholar]
- 47.Shabalin AA Matrix eQTL: ultra fast eQTL analysis via large matrix operations. Bioinformatics 28, 1353–1358, doi: 10.1093/bioinformatics/bts163 (2012). [DOI] [PMC free article] [PubMed] [Google Scholar]
- 48.Stouffer SAS, E.A.; DeVinney LC; Star SA; Williams RM Jr. The American Soldier, Vol.1: Adjustment during Army Life. . Princeton University Press, Princeton, (1949). [Google Scholar]
- 49.Roadmap Epigenomics, C. et al. Integrative analysis of 111 reference human epigenomes. Nature 518, 317–330, doi: 10.1038/nature14248 (2015). [DOI] [PMC free article] [PubMed] [Google Scholar]
- 50.Smyth GK Linear models and empirical Bayes methods for assessing differential expression in microarray experiments. Statistical applications in genetics and molecular biology 3, Article 3 (2004). [DOI] [PubMed] [Google Scholar]
Associated Data
This section collects any data citations, data availability statements, or supplementary materials included in this article.