Abstract
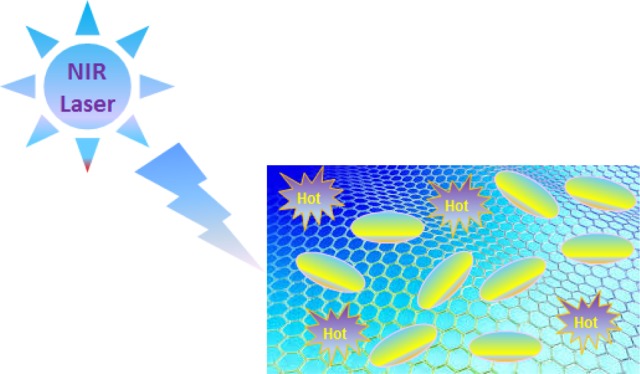
Herein, a promising near-infrared-responsive photothermal agent was designed by anchoring of rice grain-shaped ZnO particles over graphene (GR) nanosheets and subsequent sensitization with cobalt phthalocyanine (CoPc). Thus, produced GR–ZnO–CoPc was able to attain the temperature of 68 °C by irradiating to 980 nm laser for 7 min, which is extremely higher than the endurance temperature of cancer cells. The linear fashioned progression in the photothermal effect of GR nanosheets was conquered by immobilization of ZnO particles and successive sensitization with CoPc. The excellence found in the photothermal effect of GR–ZnO–CoPc was verified by estimation of its photothermal conversion efficiency. The photothermal conversion efficiency assessed for GR–ZnO–CoPc was higher than those for the popular gold- and CuS-based photothermal agents. In addition, it possessed significant stability against photobleaching and structural rupture. It was found that the photothermal effect of GR–ZnO–CoPc is proportional to its concentration. However, by replacement of a 980 nm laser system with 808 nm, the photothermal effect of GR–ZnO–CoPc was reduced, which could be due to lower absorption of GR–ZnO–CoPc at 808 nm compared to 980 nm. On account of its significance and important properties, GR–ZnO–CoPc could be an interesting photothermal agent to employ in future photothermal therapy for cancer.
1. Introduction
Cancer is a current major cause for morbidity and mortality in humans. The main feature of cancer tissues is the decreased level of oxygen called hypoxia, and it leads to proliferation, angiogenesis, and metastasis of cancer cells.1 For cancer therapy, different therapeutic modalities have been employed, in which the mainstream approaches are surgery, chemotherapy, and radiotherapy.2 However, these therapies are associated with a number of disadvantages, such as damaging of healthy tissues, attacking of immune system, invasive, toxic side effects, poor tumor-selectivity, and limited efficacy.2 Therefore, advanced therapies having high efficiency and precision are critically needed for cancer. One of the promising therapies is hyperthermia in which cancer cells are selectively targeted and destroyed by exposing to near-infrared (NIR)-mediated high temperature. Hyperthermia can destroy cancer cells in a selective manner, and a gifted approach for hyperthermia to deliver NIR-facilitated thermal energy to ablate cancer cells is photothermal therapy (PTT). PTT is an innovative method in cancer therapy, and it relies on conversion efficiency of photon energy into heat through a photosensitizer called a photothermal agent under illumination of NIR light. Irradiation of a photothermal agent injected in cancer cells by NIR laser leads to rapid rise in the local cellular temperature above the threshold value beyond 50 °C for 4–6 min of period or over 42–45 °C (a mild hyperthermia condition) with 15–60 min to cause denaturation of protein, disruption of the cellular membrane, and ablation of cancer cells.3 In other words, PTT is a distinct phototherapy that results in damaging of cancer cells owing to heat generated by the photosensitizer by absorption of NIR light radiations.2 So that, the photosensitizer is the key factor to succeed in PTT. Recently, a range of nanomaterials have been discovered and explored as photosensitizers for PTT.3 Among various photothermal agents, graphene (GR) holds critical importance due to its distinctive physical and chemical properties.4,5 GR possess two-dimensional (2D) one-atom-thickness with a honeycomb structure of sp2-hybridized carbon atoms.4 In addition, GR consists of elevated electron transport aptitude at room temperature, excellent elasticity and thermal conductivity, high mechanical strength, tunable optical properties, quantum Hall effect at room temperature, high effective surface area, and tunable band gap.4 Since its revolutionary discovery in 2004 by Geim and Novoselov,6 GR is massively explored in the areas of catalysis, sensing, energy, and electrical and electronics applications.7−10 However, it has been least probed in the biomedical area despite its excellent biocompatibility. In particular, potential use of GR in PTT is still under nascent stage and limited. GR introduced in cancer cells can derive its vibrational modes into thermal energy after irradiating to NIR radiations, cause a rise in temperature around the cancerous tissue, and structurally change their cellular and protein configurations, and cause the ablation.2,4 Therefore, it is currently critically needed to evaluate the possibilities of GR in PTT.
Another important material that has equal importance like GR is ZnO.11 ZnO is an important n-type semiconductor and has a direct wide band gap of 3.37 eV and strong exciton binding energy of 60 meV.12,13 Moreover, ZnO exhibits excellent optical activity, good stability, and high electron mobility of 200–300 cm2 V–1 s–1.12,14 ZnO is inherently nonhazardous to mammalian cells owing to its chemical inertness and stability under physiological conditions. However, ZnO can cause cytotoxic effects in cancer cells and destroy them.11 Hence, ZnO could be a promising candidate for the next-generation biomedical applications, and it has been broadly executed as a nanocarrier for various biomolecules.15,16 However, UV emission connected with excitonic band edge and visible emission attributed with sundry intrinsic defects of ZnO has restricted its use merely to UV and visible radiations.17 Hence, to modify the response of ZnO toward NIR radiations, it is crucial to conjugate it with a secondary candidate such as GR. Owing to the distinct properties of GR, its combination with ZnO can prolong the ability of ZnO to absorb NIR radiations. With this emphasis, herein, ZnO was blended with GR and succeeded in extending the absorption of ZnO toward the NIR region.12,14 So far, application of ZnO in PTT is still at a budding stage, so, execution of possible employment of ZnO in PTT is absolutely needed.
Phthalocyanines (Pcs) are an important class of organic semiconductors as they behave as photosensitizers.18−22 Pcs are known as second-generation photosensitizers, having exceptional photostability and act as p-type semiconductors.23 Pcs hold extended absorption wavelengths (λmax > 660 nm), high extinction coefficients (εmax > 105 L mol–1 cm–1), exceptional thermal stability, and variable photophysical and photochemical properties.21 Furthermore, the absorption of Pcs in the NIR region is particularly important as it takes the benefit of spectral concurrence with the tissue-transparent window, where minimal photon interferences (absorption, autofluorescence, and scattering) from solvents, biomolecules, and the biological matrix allow for deeper light penetration and minimum invasiveness.24 Moreover, Pcs exhibit low dark toxicity and strong phototoxicity because of their capability to produce cytotoxic reactive oxygen species, specially singlet oxygen.24 Owing to their aptitude in generation of singlet oxygen (1O2) by irradiating to light, Pcs are approved by US Food and Drug Administration for clinical applications in cancer therapy.18 However, Pcs have been least employed in PTT owing to their hydrophobic nature that causes poor selectivity, solubility, and transportation of Pcs into cancer cells. Thus, to overcome this major defect of Pcs, their integration with other innovative materials such as ZnO and GR might be the right approach. Therefore, in consideration of their unique benefits, herein, we successfully merged GR, ZnO, and cobalt phthalocyanine (CoPc) by deposition of rice grain-shaped ZnO microparticles over GR nanosheets and subsequent sensitization with CoPc. Thus prepared GR–ZnO–CoPc has demonstrated significant photothermal effect (PTE) required for PTT of cancer. Overall, a methodical augmentation in the PTE of GR was achieved by deposition of ZnO particles on its surfaces and successively sensitizing with CoPc.
2. Results and Discussion
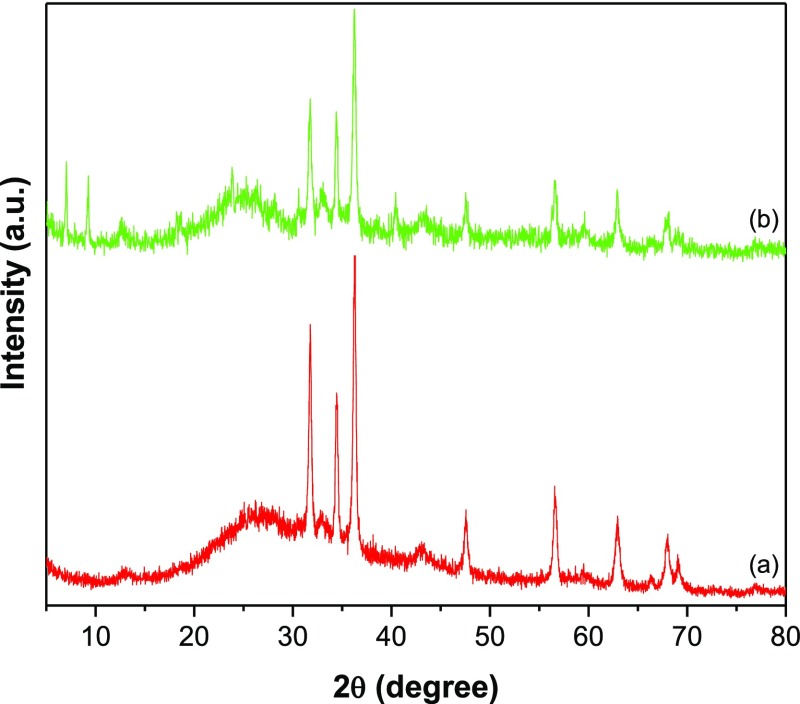
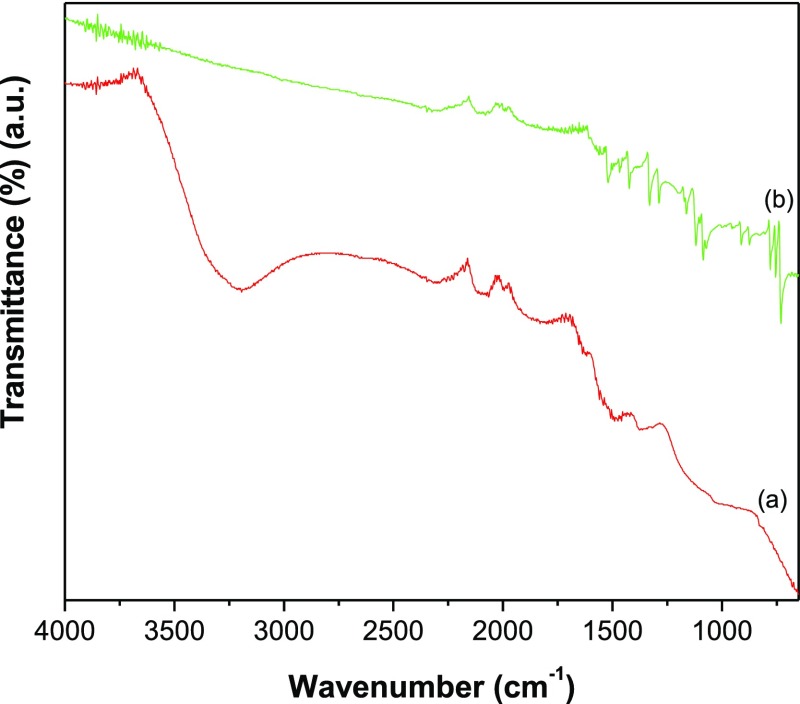
The X-ray diffraction (XRD) of GR–ZnO (Figure 1a) depicted the characteristic reflection of GR nanosheets at 2θ value of 26.2° corresponding to (0 0 2). In addition, it displayed the reflections of ZnO at 31.78°, 34.4°, 36.2°, 47.6°, 56.6°, 62.9°, 68.0°, and 69.0° owing to (1 0 0), (0 0 2), (1 0 1), (1 0 2), (1 1 0), (1 0 3), (1 1 2), and (2 0 1) reflection planes of ZnO (JCPDS file no. 36-1451). The pattern of GR–ZnO–CoPc (Figure 1b) illustrated the diffraction peaks ascribed to both GR and ZnO, in addition to peaks corresponding to CoPc at 7.0°, 9.3°, 23.8°, 33.1°, and 40.4° (JCPDS file no. 44-1994). It reveals the successful preparation of GR–ZnO and its sensitization with CoPC. To further characterize, attenuated total reflection (ATR)–IR spectra were employed. The spectrum of GR–ZnO (Figure 2a) displayed a band at 1491 cm–1 due to the skeletal vibration of GR and additional broad absorption band at 3195 cm–1 by stretching vibrations of hydroxyl groups of water molecules absorbed over the surface of GR–ZnO. However, the spectrum of GR–ZnO–CoPc (Figure 2b) demonstrated the essential characteristic peaks of the Pc moiety, in which, the bands at 730, 754, and 779 cm–1 were consigned to aromatic ring of benzene. In particular, the band at 730 cm–1 is owing to nonplanar deformation vibrations of C–H bonds, whereas the bands found at 754 and 779 cm–1 were due to nonplanar vibrations (out-of-plane bending) of C–H bonds of the benzene ring. The metal to ligand (M–N) vibration of CoPc was perceived at 911 cm–1. The absorptions present at 1086 and 1118 cm–1 were due to C–N stretching and C–H in-plane bending vibrations, respectively, of CoPc.25 The pyrrole C–C stretching tied-up with aza rocking was displayed at 1331 cm–1, and C–H deformation was observed at 1288 cm–1.26 The band at 1424 cm–1 was due to C–C benzene ring skeletal stretching vibrations, and the band at 1521 cm–1 was due to stretching of the pyrrole ring.26
Figure 1.
XRD pattern of (a) GR–ZnO and (b) GR–ZnO–CoPc.
Figure 2.
ATR–IR spectra of (a) GR–ZnO and (b) GR–ZnO–CoPc.
The surface morphology accessed by field emission scanning electron microscopy (FESEM) provided the distinct visibility of the presence of GR nanosheets and ZnO particles in GR–ZnO (Figure 3a,b). The rice grain-shaped ZnO microparticles are strongly adhered over the corrugated and scrolled GR nanosheets. The intimate interaction between GR nanosheets and elongated ZnO particles is obviously identifiable in Figure 3a,b, and it facilitates rapid transfer of photo-generated charge carriers to improve the photosensitive activity of GR–ZnO. In GR–ZnO, ZnO particles are randomly oriented over the smooth and wrinkled surfaces of GR nanosheets. The ZnO particles have hollow interior of about 100 nm diameter and irregular surface morphology (Figure 3b). Nonetheless, the surface morphology of GR–ZnO was not influenced by sensitizing it with CoPc (Figure 3c). Hence, the surface morphology of GR–ZnO is identical in GR–ZnO–CoPc also (Figure 3c). The existence of densely populated ZnO particles on the surface of GR nanosheets is perceptible in GR–ZnO–CoPc. However, existence of CoPc is unidentifiable in GR–ZnO–CoPc, which could be due to low concentration of CoPc. To identify sensitization of GR–ZnO with CoPc in detail, energy-dispersive X-ray spectroscopy (EDS) was implemented. The EDS of GR–ZnO (Figure S1) indicated the occurrence of C, Zn, O, and Cu. Among these, C is originated by GR nanosheets, and Zn and O are owing to ZnO particles. In addition, GR–ZnO exhibited the presence of Cu because of the copper sample holder used in the EDS measurement. The EDS of GR–ZnO–CoPc (Figure S2) demonstrated the peak corresponding to Co apart from C, Zn, and O. To further authenticate the sensitization of GR–ZnO with CoPc, elemental mapping was carried out. The element mapping images of GR–ZnO–CoPc, shown in Figure 4a–d verify the content of C, Zn, O, and Co and their uniform distribution all over the sample. The dispersal of O corresponds well with elemental Zn, and it is in accordance with elemental C and Co mapping. The element mapping reveals uniform distribution of ZnO and CoPc on the GR nanosheets, and the element mapping of GR–ZnO–CoPc is in compliance with its EDS.
Figure 3.
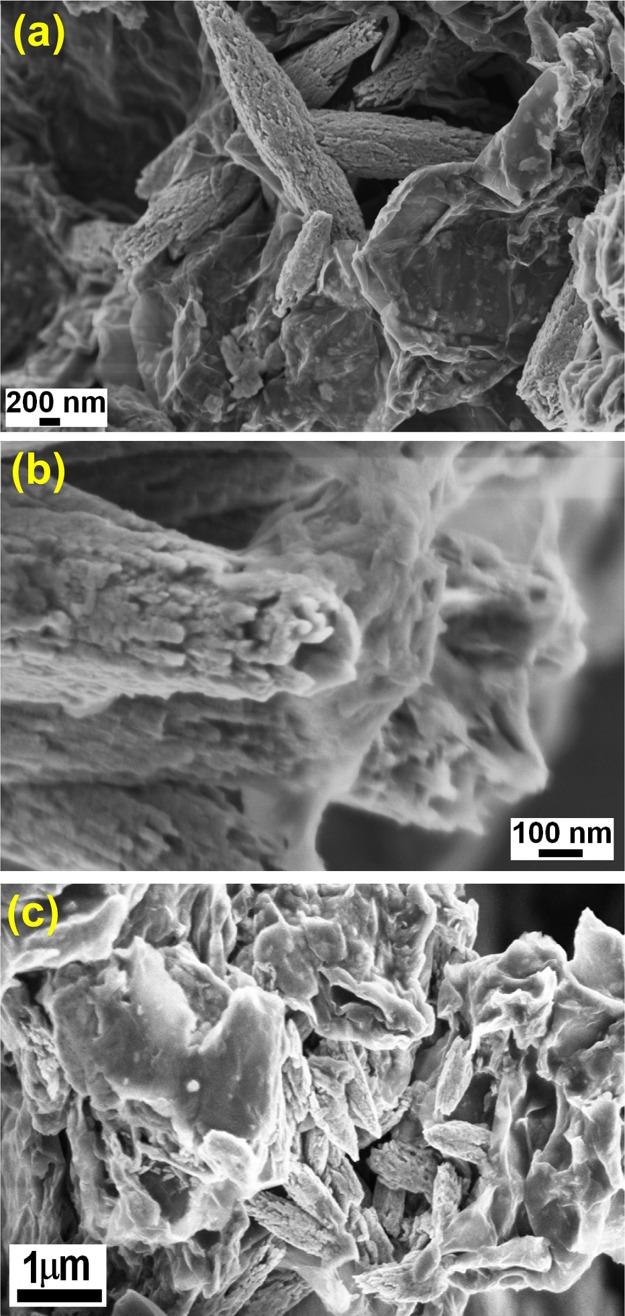
SEM images of (a,b) GR–ZnO and (c) GR–ZnO–CoPc.
Figure 4.
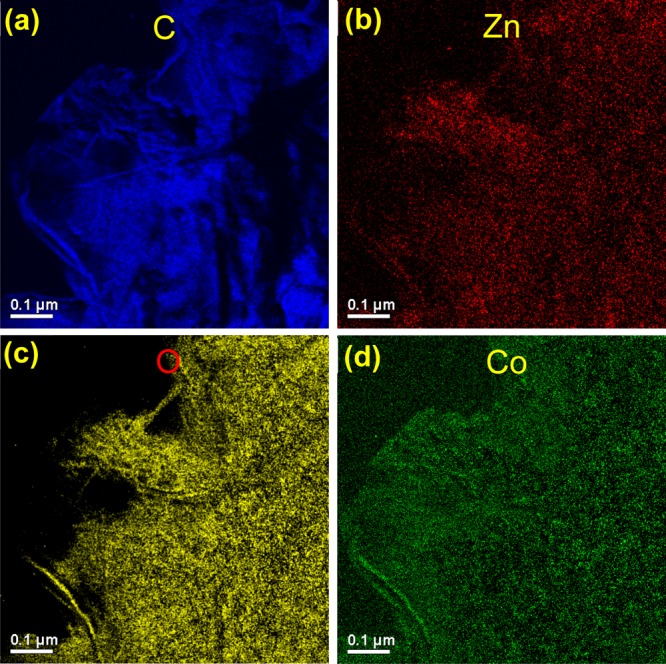
Element mapping images of GR–ZnO–CoPc.
The surface morphology of GR–ZnO and GR–ZnO–CoPc was further examined by transmission electron microscopy (TEM), and the obtained images are depicted in Figure 5a,b, respectively. The manifestation of GR nanosheets and ZnO particles are noticeable in the image of GR–ZnO (Figure 5a). The scrambled nature of GR nanosheets and their close contact and strong interaction with ZnO particles is observable in GR–ZnO. The ZnO particles possess zigzag fashioned edges and a nonuniform surface, whereas the GR nanosheets have a uniform and smooth surface. The 2D nature of GR nanosheets is apparent in the image of GR–ZnO–CoPc (Figure 5b) as these sheets have several microns of length and width, and about 7–8 nm of thickness. Owing to their nanometer thickness, the GR nanosheets appear like a silky wave having absolute transparency. The ZnO particles are immobilized over the GR nanosheet, and the incidence of CoPc is visible in GR–ZnO–CoPc. In Figure 5b, existence of a single GR nanosheet is distinctly visible, and it demonstrates that the deposition of ZnO particles and sensitization with CoPc has successfully prohibited the bundling of GR nanosheets in GR–ZnO–CoPc.
Figure 5.
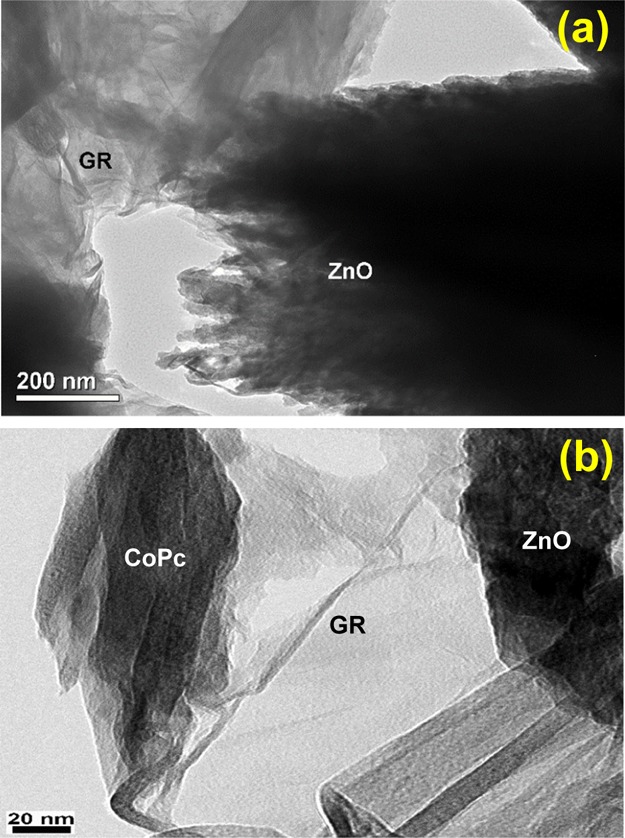
TEM images of (a) GR–ZnO and (b) GR–ZnO–CoPc.
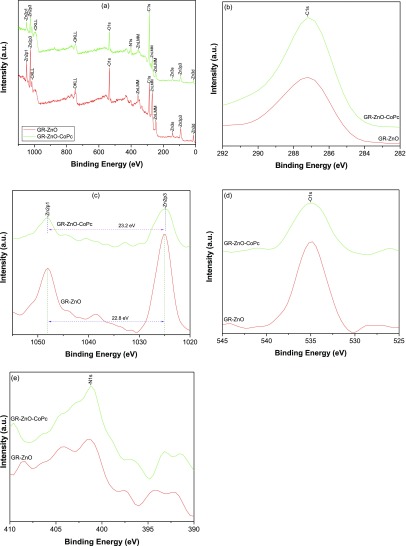
The X-ray photoelectron spectra (XPS) scrutinized the chemical composition and potential structure of GR–ZnO and GR–ZnO–CoPc (Figure 6). The survey spectra of GR–ZnO and GR–ZnO–CoPc presented in Figure 6a exhibited the characteristics peaks corresponding to C, Zn, and O. These elements have been precisely accessed through their high resolution spectra. The spectrum of C 1s (Figure 6b) provided the characteristic peak at 287.2 and 287.1 eV for GR–ZnO and GR–ZnO–CoPc, respectively. This peak of C 1s is assigned to C–C and C=O bonds of the GR nanosheets.27 However, the spectrum of Zn 2p (Figure 6c) was fragmented into two distinctive energy levels, viz., Zn 2p3/2 and Zn 2p1/2 situated at 1025.2 and 1048.0 eV, respectively, in GR–ZnO, and at 1024.8 and 1048.0 eV, respectively, in GR–ZnO–CoPc. The energy value corresponding to the spin–orbital coupling was estimated for the fragmentation of Zn 2p3/2 and Zn 2p1/2 peaks, and it was found to be 22.8 and 23.2 eV for GR–ZnO and GR–ZnO–CoPc, respectively.28 It represents the presence of Zn atoms with their oxidation state of +2 in GR–ZnO and GR–ZnO–CoPc. In particular, the peak displayed around 1025 eV is accompanied with Zn2+ present in wurtzite-structured ZnO. The spectrum of O 1s region (Figure 6d) depicts the peak with the binding energy of 534.8 eV in both GR–ZnO and GR–ZnO–CoPc by oxygen ions of ZnO.29 Accordingly, the intense peaks found for Zn 2p and O 1s regions in Figure 6a reveal the occurrence of Zn2+ and O2– in the formation of bonds between the Zn and O ions of ZnO present in GR–ZnO and GR–ZnO–CoPc. The presence of the peak corresponding to Co 2p around 780 eV is barely detectable in the spectrum of GR–ZnO–CoPc, which could be owing to low concentration of CoPc in the sample. However, GR–ZnO–CoPc displayed the peak of N 1s at 401.2 eV (Figure 6e), which originates from the Pc moiety of CoPc present in GR–ZnO–CoPc. Compared to GR–ZnO, position of the peaks was not significantly varied in GR–ZnO–CoPc; it suggests that sensitization of GR–ZnO with CoPc did not modify the inherent structure of GR–ZnO.
Figure 6.
(a) XPS survey spectra of GR–ZnO and GR–ZnO–CoPc and high resolution spectra of (b) C 1s, (c) Zn 2p, (d) O 1s, and (e) N 1s.
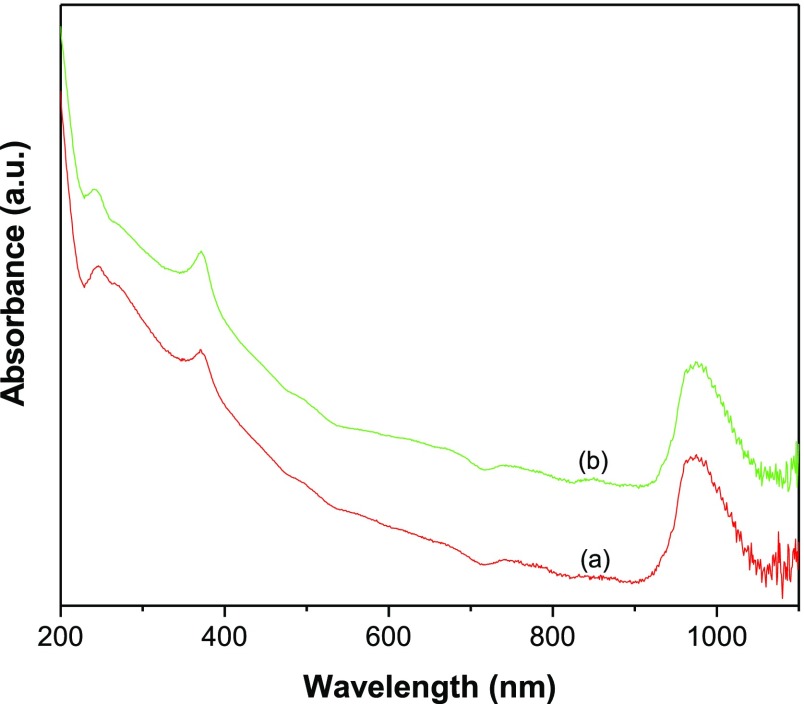
The NIR response of GR–ZnO and GR–ZnO–CoPc was preliminarily estimated using UV–vis–NIR spectra (Figure 7). The spectrum of GR–ZnO (Figure 7a) provided an electronic absorption band at 270 nm, corresponding to π → π* transitions of aromatic C–C bonds present in the GR nanosheets.25 Additional, important absorption was revealed at 375 nm, which is consistent with the characteristic absorption of ZnO.12,25 Therefore, the spectrum of GR–ZnO advises the presence of GR and ZnO. Furthermore, it disclosed the band between 930 and 1050 nm and validated its higher absorption of aqueous dispersion of GR–ZnO in the NIR region. The spectrum of GR–ZnO–CoPc (Figure 7b) revealed the absorption bands analogue to GR and ZnO at 275 and 370 nm, respectively. The absorption owing to CoPc was not observed in GR–ZnO–CoPc, which could be because of minute concentration of CoPc. However, a slight shifting in the bands related to GR and ZnO has been found in GR–ZnO–CoPc compared to GR–ZnO. It could be due to variation in the electronic absorption of GR–ZnO caused by the manifestation of CoPc in GR–ZnO–CoPc. However, GR–ZnO–CoPc revealed its predominant activity under exposure to NIR radiations by exhibiting substantial absorption in the NIR region.
Figure 7.
UV–vis–NIR spectra of (a) GR–ZnO and (b) GR–ZnO–CoPc.
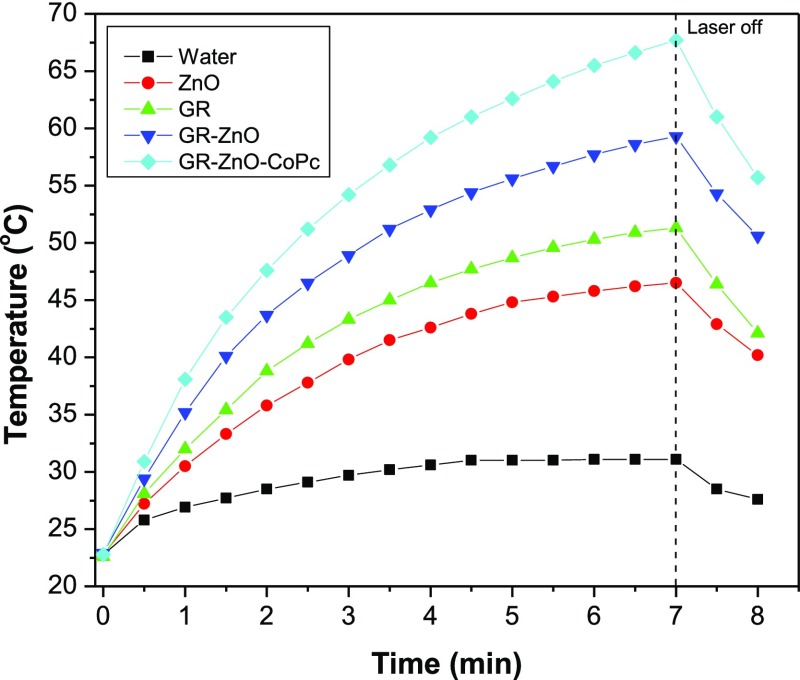
In consideration of their substantial absorption in the NIR region, PTE of GR–ZnO and GR–ZnO–CoPc was measured by irradiating their aqueous dispersion to 980 nm laser and compared with that of water, GR nanosheets, and ZnO particles. Figure 8 illustrates the PTE of the samples determined under identical experimental conditions at their concentration of 1 g/mL. The temperature recorded during measurement of PTE is summarized in Table 1. By continuous illumination to laser for 7 min, temperature of water increased from 22.8 to 31.1 °C with total difference (ΔT) of 8.3 °C. Whereas ΔT found for ZnO particles was 23.7 °C, that is 22.8–46.5 °C. The elevation in temperature measured for GR nanosheets was from 22.6 to 51.3 °C, with an estimated ΔT of 28.7 °C. Interestingly, by conjugation of GR nanosheets and ZnO particles, their PTE was significantly enhanced in GR–ZnO compared to their individual values. In detail, GR–ZnO exhibited ΔT of 36.4 °C with initial and final temperatures of 22.9 and 59.3 °C, respectively. The PTE of GR nanosheets and ZnO particles was enhanced by 7.7 and 12.7 °C, respectively, after their conjugation in GR–ZnO. The improvement found in the PTE of GR nanosheets and ZnO particles after their conjugation was accounted for by the heterojunctioned structure formed between them in GR–ZnO. In case of GR–ZnO–CoPc, an increase of 44.9 °C was recognized from 22.8 to 67.7 °C, so PTE of GR–ZnO was further improved by sensitizing with CoPc. The advancement of 8.5 °C found in GR–ZnO–CoPc compared to GR–ZnO was accounted for by the presence of CoPc. Overall, a systematical improvement in the PTE of the GR nanosheets and ZnO particles is achieved by their perfect combination and subsequent sensitization with CoPc. The advancement in the PTE of GR–ZnO and GR–ZnO–CoPc was precisely estimated through estimation of their photothermal conversion efficiency (η) by means of Roper’s method using eq 1(30−33)
| 1 |
where η is the photothermal efficiency, h is heat-transfer coefficient, and S is the surface area of the sample container. Tmax is the maximum temperature attained by the sample, and Tsurr is the surrounding temperature. The values of these parameters are provided in Table 2. I is power of the laser source (2000 mW), and A980 is absorbance of aqueous dispersion of samples at excitation of 980 nm. Qdis is rate of heat dissipated owing to absorption of light by solvent and container.
Figure 8.
Rise in temperature for aqueous dispersions of samples as a function of time of illumination under exposure to 980 nm laser.
Table 1. Temperature of Samples Recorded during Measurement of PTE.
| sample | laser system (nm) | concentration of aqueous dispersion (mg/mL) | initial temperature prior to irradiation with laser (°C) | final temperature after irradiation with laser for 7 min (°C) | ΔT (Tfinal – Tinitial) (°C) |
|---|---|---|---|---|---|
| water | 980 | 22.8 | 31.1 | 8.3 | |
| ZnO | 980 | 1.00 | 22.8 | 46.5 | 23.7 |
| GR | 980 | 1.00 | 22.6 | 51.3 | 28.7 |
| GR–ZnO | 980 | 1.00 | 22.9 | 59.3 | 36.4 |
| GR–ZnO–CoPc | 980 | 1.00 | 22.8 | 67.7 | 44.9 |
| GR–ZnO–CoPc | 980 | 0.50 | 22.9 | 60.4 | 37.5 |
| GR–ZnO–CoPc | 980 | 0.25 | 22.6 | 51.3 | 28.7 |
| GR–ZnO–CoPc | 808 | 1.00 | 22.7 | 59.5 | 36.8 |
Table 2. Properties Utilized in the Calculation of Photothermal Conversion Efficiency.
| sample | Tmax (°C) | Tsurr (°C) | Tmax – Tsurr (°C) | A980 | η (%) |
|---|---|---|---|---|---|
| GR–ZnO | 59.3 | 22.9 | 36.4 | 0.817 | 25 |
| GR–ZnO–CoPc | 67.7 | 22.8 | 44.9 | 0.821 | 32 |
To evaluate the value of hS, a dimensionless driving force of temperature, θ, was introduced and scaled using the maximum system temperature, Tmax and the surrounding temperature, Tsurr.
| 2 |
and the sample system time constant, τs, was determined by eq 3
| 3 |
The value of τs was estimated by Figures S3 and S4, and it was found to be 347 and 346 s for GR–ZnO and GR–ZnO–CoPc, respectively. Using the value of τs, the unknown parameter, hS was calculated by eq 4.
| 4 |
where mD (1.01 g) is mass of deionized (DI) water, and CD is its heat capacity. The value of Qdis was measured separately using a quartz cuvette containing only DI water without any sample, and it was found to be 25.9 mW.
The photothermal conversion efficiency (η) calculated for GR–ZnO was found to be 25%. This value of η estimated for GR–ZnO containing rice grain-shaped ZnO microparticles was found to be lower than the value determined for GR–ZnO having trapezoid-shaped ZnO nanoparticles (49%).14 Therefore, photothermal conversion efficiency is controlled by morphology of ZnO particles, and the value of η can be tuned by varying the morphology of ZnO particles.
The photothermal conversion efficiency of GR–ZnO was improved after sensitizing with CoPc. Hence, the value of η estimated for GR–ZnO–CoPc was 32%, which is 7% higher than the efficiency of GR–ZnO. It shows that combination of CoPc with GR–ZnO can increase its absorbing aptitude to NIR radiations and result in enhancement of photothermal conversion efficiency. Therefore, sensitizing with CoPc could be an ideal modality to improve PTE of GR–ZnO. However, the photothermal conversion efficiency determined for both GR–ZnO and GR–ZnO–CoPc were comparatively greater than the value estimated for well-known photothermal agents, viz., Au nanoshells (18%),34 Au nanorods (22%),35 and Cu2–xSe nanoparticles (22%).36 Generally, the temperature forbearance of cancer cells is about 50 °C,37,38 whereas the maximum temperature attained with GR–ZnO and GR–ZnO–CoPc during the measurement of their PTE was 59.3 and 67.7 °C, respectively. The temperature attained by GR–ZnO and GR–ZnO–CoPc is beyond the survival temperature of cancer cells. Hence, both GR–ZnO and GR–ZnO–CoPc would be able to generate sufficient heat needed to ablate cancer cells.
To analyze the stability of GR–ZnO–CoPc, it was applied in five cycles of PTE measurement and the PTE was almost constant in all five cycles (Figure S5). In addition, XRD of GR–ZnO–CoPc recorded after employing it in five cycles could not show any considerable modification compared to the unused GR–ZnO–CoPc (Figure S6). Hence, GR–ZnO–CoPc possesses excellent stability against both photobleaching and structural rupture. Apart from this, the influence of concentration over PTE of GR–ZnO–CoPc was identified by measuring at additional lower concentrations of 0.5 and 0.25 g/mL and it was recognized that the PTE of GR–ZnO–CoPc was directly related to its concentration (Figure S7). The calculated values of ΔT for GR–ZnO–CoPc at its concentrations of 0.25, 0.5, and 1 g/mL were 28.7, 37.5, and 44.9 °C, respectively. In detail, ΔT estimated between 0.25 and 0.5 g/mL was 9 °C and it was 7.4 °C between 0.5 and 1 g/mL. Furthermore, the impact of the NIR laser source over PTE of GR–ZnO–CoPc was revealed by replacing the 980 nm laser system with an 808 nm laser. It was found that PTE of GR–ZnO–CoPc was reduced under irradiation to 808 nm laser compared to 980 nm laser (Figure S8). The reduction that occurred in the PTE of GR–ZnO–CoPc under irradiation to 808 nm laser could be explained by its UV–vis–NIR spectrum shown in Figure 7b as it possesses low absorbance at 808 nm compared to 980 nm, which reduced the PTE with 808 nm laser.
3. Conclusions
In summary, a promising photothermal agent, GR–ZnO–CoPc was designed by deposition of rice grain-shaped ZnO particles over GR nanosheets and successive sensitization with CoPc. The PTE of GR–ZnO was considerably improved by its sensitization with CoPc. The hybrid structure formed between GR nanosheets, ZnO particles, and CoPc transpired an exceptional PTE of GR–ZnO–CoPc. The sequential enhancement in the PTE of GR nanosheets was successfully attained by immobilization of ZnO over their surfaces and sensitization of CoPc. The value of the photothermal conversion efficiency estimated for GR–ZnO–CoPc was experimentally verified to show its effectiveness as a promising NIR active photothermal agent. The GR–ZnO–CoPc demonstrated higher photothermal conversion efficiency than well-known gold- and copper-based photothermal agents. Apart from its excellent PTE, GR–ZnO–CoPc demonstrated strong resistance against photobleaching and structural rupture. The PTE of GR–ZnO–CoPc was directly related to its concentration, and it was reduced by replacement of 980 nm laser system with 808 nm laser. The temperature attained by GR–ZnO–CoPc during measurement of PTE was absolutely excessive than survival temperature level of cancer cells. Therefore, on account of its excellence, GR–ZnO–CoPc could be classified as a brilliant photothermal agent to apply in future PTT.
4. Experimental Section
4.1. Materials
The chemicals employed in the experiments were received from Sigma-Aldrich and were used without any further purification. For preparation of aqueous solutions, ultrapure water generated by Milli-Q Plus system (Millipore) was used.
4.2. Preparation of GR–ZnO
The GR–ZnO was prepared according to ref (25), in which GR oxide (GO) (40 mg) prepared by the Hummers and Offeman method with few variations39,40 was dispersed in DI water (25 mL) by sonication for 5 min. Then, 20 mL aqueous solution of ZnCl2 (0.01 mol) was added, and the reaction mixture was stirred for 15 min under ambient conditions. Subsequently, 2 mL of hydrazine hydrate (2 mL) was slowly added, and the reaction was proceeded for 1 h at room temperature. The resultant GR–ZnO was obtained by centrifugation and purifying by sequential washings with DI water.
4.3. Preparation of GR–ZnO–CoPc
GR–ZnO (20 mg) was dispersed by sonication in 25 mL of DI water, and a solution of 2 mg of CoPc in 5 mL dimethyl sulfoxide was gradually added. The resultant mixture was stirred for 2 h at room temperature, and thus formed GR–ZnO–CoPc was extracted by centrifugation and subsequently washed with DI water followed by its drying in vacuum.
4.4. Preparation of ZnO Particles and GR Nanosheets
For control experiments, ZnO particles and GR nanosheets were prepared; among these, the ZnO particles were synthesized by the method referred for GR–ZnO without using GO, and the GR nanosheets were produced by the reduction of GO.41
4.5. Photothermal Effect
PTE of the samples was estimated by 980 and 808 nm NIR lasers (Armlaser Inc. USA) having output power of 2 W/cm2. For all samples, 1 mL aqueous dispersion in a quartz cuvette was irradiated with NIR laser. The resulting elevation in temperature facilitated by irradiation was recorded with Hanna precision digital thermometer (model: HI93510) carrying the thermocouple immersed in sample.
4.6. Characterization
To acquire FESEM images, a JEOL JXA-8900 microscope was used, and for TEM images and EDS, a JEOL 2010 microscope was utilized. To get XPS and XRD patterns, a PerkinElmer PHI 5600 ci X-ray photoelectron spectrometer and Scintag X-ray diffractometer (PAD X) fitted with Cu Kα photon source (45 kV, 40 mA), respectively, were employed. The UV–vis–NIR electronic absorption and ATR–IR spectra were perceived by a Varian Cary 50 Bio spectrophotometer and Smiths ChemID diamond ATR spectrometer, respectively.
Acknowledgments
The authors acknowledge the support from NIH-NIGMS grant 1SC3GM121229-01, the department grant L0002 from Welch Foundation, Texas, United States, and PVAMU Faculty Research Development Grant.
Supporting Information Available
The Supporting Information is available free of charge on the ACS Publications website at DOI: 10.1021/acsomega.8b03222.
EDS of GR–ZnO and GR–ZnO–CoPc; temperature variation found for aqueous dispersion of GR–ZnO and GR–ZnO–CoPc; the plot of time from cooling period versus negative natural logarithm of driving force temperature obtained for GR–ZnO and GR–ZnO–CoPc; temperature variation measured for the aqueous dispersion of GR–ZnO–CoPc for five cycles, XRD of GR–ZnO–CoPc recorded before and after using in five successive cycles of PTE measurement, PTE of GR–ZnO–CoPc measured at different concentrations, PTE of GR–ZnO–CoPc measured under illumination of 980 and 808 nm laser systems (PDF)
The authors declare no competing financial interest.
Supplementary Material
References
- Lim J. H.; Kim D. E.; Kim E.-J.; Ahrberg C. D.; Chung B. G. Functional graphene oxide-based nanosheets for photothermal therapy. Macromol. Res. 2018, 26, 557–565. 10.1007/s13233-018-6067-3. [DOI] [Google Scholar]
- Pan J.; Yang Y.; Fang W.; Liu W.; Le K.; Xu D.; Li X. Fluorescent phthalocyanine-graphene conjugate with enhanced NIR absorbance for imaging and multi-modality therapy. ACS Appl. Nano Mater. 2018, 1, 2785–2795. 10.1021/acsanm.8b00449. [DOI] [Google Scholar]
- Vankayala R.; Hwang K. C. Near-infrared-light-activatable nanomaterial-mediated phototheranostic nanomedicines: An emerging paradigm for cancer treatment. Adv. Mater. 2018, 30, 1706320–1706347. 10.1002/adma.201706320. [DOI] [PubMed] [Google Scholar]
- Ghosal K.; Sarkar K. Biomedical applications of graphene nanomaterials and beyond. ACS Biomater. Sci. Eng. 2018, 4, 2653–2703. 10.1021/acsbiomaterials.8b00376. [DOI] [PubMed] [Google Scholar]
- Neelgund G. M.; Oki A. R. Influence of carbon nanotubes and graphene nanosheets on photothermal effect of hydroxyapatite. J. Colloid Interface Sci. 2016, 484, 135–145. 10.1016/j.jcis.2016.07.078. [DOI] [PMC free article] [PubMed] [Google Scholar]
- Novoselov K. S.; Geim A. K.; Morozov S. V.; Jiang D.; Zhang Y.; Dubonos S. V.; Grigorieva I. V.; Firsov A. A. Electric field effect in atomically thin carbon films. Science 2004, 306, 666–669. 10.1126/science.1102896. [DOI] [PubMed] [Google Scholar]
- Lu Y.-H.; Zhou M.; Zhang C.; Feng Y.-P. Metal-embedded graphene: A possible catalyst with high activity. J. Phys. Chem. C 2009, 113, 20156–20160. 10.1021/jp908829m. [DOI] [Google Scholar]
- Wang B.; Chang Y.-h.; Zhi L.-j. High yield production of graphene and its improved property in detecting heavy metal ions. New Carbon Mater. 2011, 26, 31–35. 10.1016/s1872-5805(11)60064-4. [DOI] [Google Scholar]
- Zhao X.; Hayner C. M.; Kung M. C.; Kung H. H. Flexible holey graphene paper electrodes with enhanced rate capability for energy storage applications. ACS Nano 2011, 5, 8739–8749. 10.1021/nn202710s. [DOI] [PubMed] [Google Scholar]
- Parlak O.; Tiwari A.; Turner A. P. F.; Tiwari A. Template-directed hierarchical self-assembly of graphene based hybrid structure for electrochemical biosensing. Biosens. Bioelectron. 2013, 49, 53–62. 10.1016/j.bios.2013.04.004. [DOI] [PubMed] [Google Scholar]
- Zhang M.; Wu F.; Wang W.; Shen J.; Zhou N.; Wu C. Multifunctional nanocomposites for targeted, photothermal, and chemotherapy. Chem. Mater. 2018, (In press) 10.1021/acs.chemmater.8b00934. [DOI] [Google Scholar]
- Neelgund G. M.; Oki A. Graphene-coupled ZnO: A robust NIR-induced catalyst for rapid photo-oxidation of cyanide. ACS Omega 2017, 2, 9095–9102. 10.1021/acsomega.7b01398. [DOI] [PMC free article] [PubMed] [Google Scholar]
- Bano N.; Hussain I.; Sawaf S.; Alshammari A.; Saleemi F. Enhancement of external quantum efficiency and quality of heterojunction white LEDs by varying the size of ZnO nanorods. Nanotechnology 2017, 28, 245203–245209. 10.1088/1361-6528/aa6f7b. [DOI] [PubMed] [Google Scholar]
- Neelgund G. M.; Oki A. Photothermal effect: an important aspect for the enhancement of photocatalytic activity under illumination by NIR radiation. Mater. Chem. Front. 2018, 2, 64–75. 10.1039/c7qm00337d. [DOI] [PMC free article] [PubMed] [Google Scholar]
- Trino L. D.; Albano L. G. S.; Bronze-Uhle E. S.; George A.; Mathew M. T.; Lisboa-Filho P. N. Physicochemical, osteogenic and corrosion properties of bio-functionalized ZnO thin films: Potential material for biomedical applications. Ceram. Int. 2018, 44, 21004–21014. 10.1016/j.ceramint.2018.08.136. [DOI] [Google Scholar]
- Sandhya P. K.; Jose J.; Sreekala M. S.; Padmanabhan M.; Kalarikkal N.; Thomas S. Reduced graphene oxide and ZnO decorated graphene for biomedical applications. Ceram. Int. 2018, 44, 15092–15098. 10.1016/j.ceramint.2018.05.143. [DOI] [Google Scholar]
- Kang J.-S.; Ham A.-R.; Kang J.-G.; Leung K. T. White and tunable emission from and rhodamine B detection by modified zinc oxide nanowalls. Langmuir 2018, 34, 9774–9780. 10.1021/acs.langmuir.8b01238. [DOI] [PubMed] [Google Scholar]
- Peng J.; Zhao L.; Zhu X.; Sun Y.; Feng W.; Gao Y.; Wang L.; Li F. Hollow silica nanoparticles loaded with hydrophobic phthalocyanine for near-infrared photodynamic and photothermal combination therapy. Biomaterials 2013, 34, 7905–7912. 10.1016/j.biomaterials.2013.07.027. [DOI] [PubMed] [Google Scholar]
- Lim C.-K.; Shin J.; Lee Y.-D.; Kim J.; Oh K. S.; Yuk S. H.; Jeong S. Y.; Kwon I. C.; Kim S. Phthalocyanine-aggregated polymeric nanoparticles as tumor-homing near-infrared absorbers for photothermal therapy of cancer. Theranostics 2012, 2, 871–879. 10.7150/thno.4133. [DOI] [PMC free article] [PubMed] [Google Scholar]
- Jia Q.; Ge J.; Liu W.; Zheng X.; Wang M.; Zhang H.; Wang P. Biocompatible Iron Phthalocyanine-Albumin Assemblies as Photoacoustic and Thermal Theranostics in Living Mice. ACS Appl. Mater. Interfaces 2017, 9, 21124–21132. 10.1021/acsami.7b04360. [DOI] [PubMed] [Google Scholar]
- Li X.; Peng X.-H.; Zheng B.-D.; Tang J.; Zhao Y.; Zheng B.-Y.; Ke M.-R.; Huang J.-D. New application of phthalocyanine molecules: from photodynamic therapy to photothermal therapy by means of structural regulation rather than formation of aggregates. Chem. Sci. 2018, 9, 2098–2104. 10.1039/c7sc05115h. [DOI] [PMC free article] [PubMed] [Google Scholar]
- Taratula O.; Taratula O.; Patel M.; Schumann C.; Naleway M.; He H.; Pang A. Phthalocyanine-loaded graphene nanoplatform for imaging-guided combinatorial phototherapy. Int. J. Nanomed. 2015, 10, 2347–2362. 10.2147/ijn.s81097. [DOI] [PMC free article] [PubMed] [Google Scholar]
- Soliman H. S.; El-Barry A. M. A.; Khosifan N. M.; El Nahass M. M. Structural and electrical properties of thermally evaporated cobalt phthalocyanine (CoPc) thin films. Eur. Phys. J.: Appl. Phys. 2007, 37, 1–9. 10.1051/epjap:2006135. [DOI] [Google Scholar]
- Ogbodu R. O.; Nyokong T. The effect of ascorbic acid on the photophysical properties and photodynamic therapy activities of zinc phthalocyanine-single walled carbon nanotube conjugate on MCF-7 cancer cells. Spectrochim. Acta, Part A 2015, 151, 174–183. 10.1016/j.saa.2015.06.063. [DOI] [PubMed] [Google Scholar]
- Neelgund G. M.; Oki A.; Luo Z. ZnO and cobalt phthalocyanine hybridized graphene: Efficient photocatalysts for degradation of rhodamine B. J. Colloid Interface Sci. 2014, 430, 257–264. 10.1016/j.jcis.2014.04.053. [DOI] [PMC free article] [PubMed] [Google Scholar]
- Gharagozlou M.; Naghibi S. Sensitization of ZnO nanoparticles by metal-free phthalocyanine. J. Lumin. 2018, 196, 64–68. 10.1016/j.jlumin.2017.12.020. [DOI] [Google Scholar]
- Luo Q.; Yang X.; Zhao X.; Wang D.; Yin R.; Li X.; An J. Facile preparation of well-dispersed ZnO/cyclized polyacrylonitrile nanocomposites with highly enhanced visible-light photocatalytic activity. Appl. Catal., B 2017, 204, 304–315. 10.1016/j.apcatb.2016.11.037. [DOI] [Google Scholar]
- Tayyebi A.; Soltani T.; Lee B.-K.; Outokesh M.; Tayebi M. Novel visible light photocatalytic and photoelectrochemical (PEC) activity of carbon-doped zinc oxide/reduced graphene oxide: supercritical methanol synthesis with enhanced photocorrosion suppression. J. Alloys Compd. 2017, 723, 1001–1010. 10.1016/j.jallcom.2017.06.316. [DOI] [Google Scholar]
- Khai T. V.; Thu L. V.; Ha L. T. T.; Thanh V. M.; Lam T. D. Structural, optical and gas sensing properties of vertically well-aligned ZnO nanowires grown on graphene/Si substrate by thermal evaporation method. Mater. Charact. 2018, 141, 296–317. 10.1016/j.matchar.2018.04.047. [DOI] [Google Scholar]
- Keith Roper D.; Ahn W.; Hoepfner M. Microscale heat transfer transduced by surface plasmon resonant gold nanoparticles. J. Phys. Chem. C 2007, 111, 3636–3641. 10.1021/jp064341w. [DOI] [PMC free article] [PubMed] [Google Scholar]
- Neelgund G. M.; Oki A. Advancement in photothermal effect of carbon nanotubes by grafting of poly(amidoamine) and deposition of CdS nanocrystallites. Ind. Eng. Chem. Res. 2018, 57, 7826–7833. 10.1021/acs.iecr.7b04732. [DOI] [PMC free article] [PubMed] [Google Scholar]
- Neelgund G. M.; Oki A. Photothermal effect of Ag nanoparticles deposited over poly(amidoamine) grafted carbon nanotubes. J. Photochem. Photobiol., A 2018, 364, 309–315. 10.1016/j.jphotochem.2018.06.007. [DOI] [PMC free article] [PubMed] [Google Scholar]
- Shi Kam N. W.; O’Connell M.; Wisdom A.; Dai H. Carbon nanotubes as multifunctional biological transporters and nearinfrared agents for selective cancer cell destruction. Proc. Natl. Acad. Sci. U.S.A. 2005, 102, 11600–11605. 10.1073/pnas.0502680102. [DOI] [PMC free article] [PubMed] [Google Scholar]
- Huang P.; Lin J.; Li W.; Rong P.; Wang Z.; Wang S.; Wang X.; Sun X.; Aronova M.; Niu G.; Leapman R. D.; Nie Z.; Chen X. Biodegradable gold nanovesicles with an ultrastrong plasmonic coupling effect for photoacoustic imaging and photothermal therapy. Angew. Chem., Int. Ed. 2013, 52, 13958–13964. 10.1002/anie.201308986. [DOI] [PMC free article] [PubMed] [Google Scholar]
- Hessel C. M.; Pattani V. P.; Rasch M.; Panthani M. G.; Koo B.; Tunnell J. W.; Korgel B. A. Copper selenide nanocrystals for photothermal therapy. Nano Lett. 2011, 11, 2560–2566. 10.1021/nl201400z. [DOI] [PMC free article] [PubMed] [Google Scholar]
- Pattani V. P.; Tunnell J. W. Nanoparticle-mediated photothermal therapy: a comparative study of heating for different particle types. Lasers Surg. Med. 2012, 44, 675–684. 10.1002/lsm.22072. [DOI] [PMC free article] [PubMed] [Google Scholar]
- Ju E.; Dong K.; Liu Z.; Pu F.; Ren J.; Qu X. Tumor microenvironment activated photothermal strategy for precisely controlled ablation of solid tumors upon NIR irradiation. Adv. Funct. Mater. 2015, 25, 1574–1580. 10.1002/adfm.201403885. [DOI] [Google Scholar]
- Yoo D.; Jeong H.; Noh S.-H.; Lee J.-H.; Cheon J. Magnetically triggered dual functional nanoparticles for resistance-free apoptotic hyperthermia. Angew. Chem., Int. Ed. 2013, 52, 13047–13051. 10.1002/anie.201306557. [DOI] [PubMed] [Google Scholar]
- Hummers W. S.; Offeman R. E. Preparation of graphitic oxide. J. Am. Chem. Soc. 1958, 80, 1339. 10.1021/ja01539a017. [DOI] [Google Scholar]
- Neelgund G. M.; Bliznyuk V. N.; Oki A. Photocatalytic activity and NIR laser response of polyaniline conjugated graphene nanocomposite prepared by a novel acid-less method. Appl. Catal., B 2016, 187, 357–366. 10.1016/j.apcatb.2016.01.009. [DOI] [PMC free article] [PubMed] [Google Scholar]
- Neelgund G. M.; Oki A.; Luo Z. In situ deposition of hydroxyapatite on graphene nanosheets. Mater. Res. Bull. 2013, 48, 175–179. 10.1016/j.materresbull.2012.08.077. [DOI] [PMC free article] [PubMed] [Google Scholar]
Associated Data
This section collects any data citations, data availability statements, or supplementary materials included in this article.


