Abstract
Fusobacterium nucleatum, a Gram‐negative oral anaerobe, is a significant contributor to colorectal cancer. Using an in vitro cancer progression model, we discover that F. nucleatum stimulates the growth of colorectal cancer cells without affecting the pre‐cancerous adenoma cells. Annexin A1, a previously unrecognized modulator of Wnt/β‐catenin signaling, is a key component through which F. nucleatum exerts its stimulatory effect. Annexin A1 is specifically expressed in proliferating colorectal cancer cells and involved in activation of Cyclin D1. Its expression level in colon cancer is a predictor of poor prognosis independent of cancer stage, grade, age, and sex. The FadA adhesin from F. nucleatum up‐regulates Annexin A1 expression through E‐cadherin. A positive feedback loop between FadA and Annexin A1 is identified in the cancerous cells, absent in the non‐cancerous cells. We therefore propose a “two‐hit” model in colorectal carcinogenesis, with somatic mutation(s) serving as the first hit, and F. nucleatum as the second hit exacerbating cancer progression after benign cells become cancerous. This model extends the “adenoma‐carcinoma” model and identifies microbes such as F. nucleatum as cancer “facilitators”.
Keywords: Annexin A1, colorectal cancer, FadA, Fusobacterium nucleatum, two‐hit model
Subject Categories: Cancer; Microbiology, Virology & Host Pathogen Interaction; Signal Transduction
Introduction
Colorectal cancer (CRC) is the second leading cause of cancer death in the United States, affecting 1 in 20 individuals 1. CRC has long been recognized to result from host mutations that accumulate over time, developing from pre‐cancerous adenomatous polyps into adenocarcinoma over approximately 10 years 2. Advancements in microbial detection technology and human microbiome research have revolutionized our understanding of a wide spectrum of diseases, including CRC 3, 4, 5, 6, 7. Numerous recent studies have reported that the anaerobic Gram‐negative oral commensal bacterium, Fusobacterium nucleatum, plays a significant role in colorectal carcinogenesis 8, 9, 10, 11, 12, 13, 14. F. nucleatum has been detected in ~10–90% CRC tissues, with higher prevalence in the proximal than distal colon 15, 16, 17. It is often associated with advanced disease, chemo‐resistance, metastasis, and poor prognosis 14, 18, 19, 20. A few studies have supported a causal role of F. nucleatum in CRC 10, 12, 14, 21, but detailed mechanistic investigations are scarce. We have reported previously that F. nucleatum promotes CRC growth through its unique FadA adhesin, which binds to E‐cadherin (CDH1) and activates Wnt/β‐catenin signaling, causing nuclear translocation of β‐catenin and overexpression of inflammatory genes, Wnt genes, and oncogenes c‐Myc and Cyclin D1 (CCND1) 12. Binding of FadA to E‐cadherin requires both the intact pre‐FadA consisting of 129 amino acid residues and mFadA of 111 amino acid residues without the signal peptide. Together, they form the FadAc complex 12, 22. FadA was unable to promote growth of non‐cancerous HEK293 cells even in the presence of E‐cadherin 12. This observation raised the question whether F. nucleatum‐induced growth stimulation is specific for CRC. We report here that F. nucleatum selectively stimulates the growth of colorectal cancerous cells through activation of Annexin A1 (ANXA1), a member of the Annexin family of Ca2+‐dependent phospholipid‐binding proteins 23. Annexin A1 has a molecular weight of 35–40 kDa and can be found in nucleus, cytoplasm, and plasma membrane of various cell types. ANXA1 is involved in a variety of biological processes and has been postulated to be either a tumor suppressor or promoter depending on the tumor types 24, 25. Increased expression of Annexin A1 in CRC has been reported 26, 27, but its role remains unclear. We discover that Annexin A1 is a previously unrecognized Wnt/β‐catenin modulator and a critical growth stimulator of CRC, whose expression is increased in proliferating CRC cells, but not in non‐proliferating or non‐cancerous cells. Given the lack of stimulation of non‐cancerous cells by F. nucleatum, we propose a “two‐hit” model, whereby F. nucleatum becomes a “facilitator” of cancer progression only after the benign cells progress to a malignant phenotype.
Results
Fusobacterium nucleatum selectively stimulates the growth of colorectal cancerous cells
In order to determine the specificity of F. nucleatum‐mediated growth stimulation, we tested the effects of F. nucleatum strain WAL12230 on the PC‐9 lung cancer cells, 22RV1 prostate cancer cells, and MCF7 breast cancer cells, all of which expresses E‐cadherin, as well as UMUC3 bladder cancer cells, which does not express E‐cadherin 28, 29, 30, 31 (Fig EV1A). No growth stimulation was detected; on the contrary, F. nucleatum inhibited the proliferation of PC‐9, 22RV1, and UMUC3 cells, presumably due to toxic effects (Fig 1A).
Figure EV1. Expression of E‐cadherin, Annexin A1, inflammatory genes and oncogene Cyclin D1 in different cell lines.
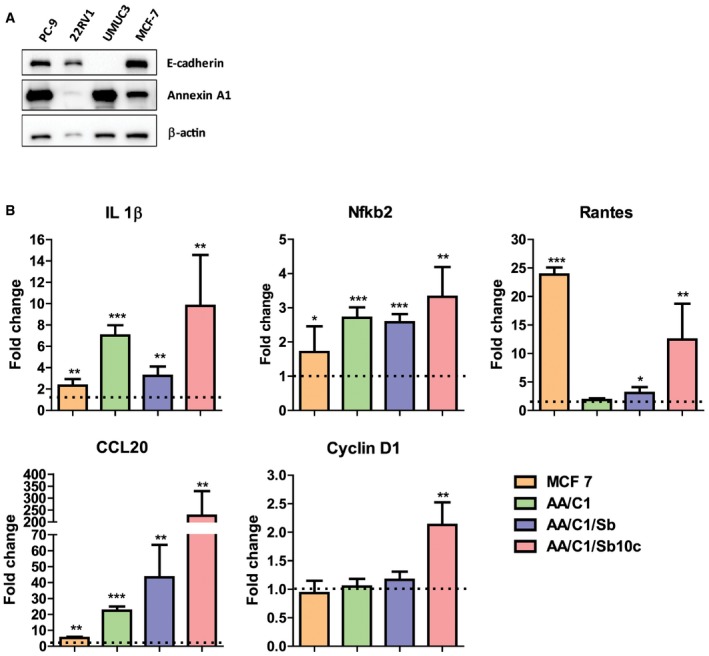
- Western blot analysis of E‐cadherin and Annexin A1 expression in lung cancer cells PC‐9, prostate cancer cells 22RV1, bladder cancer cells UMUC3, and breast cancer cells MCF‐7. β‐Actin was included as an internal control.
- Real‐time qPCR analysis of Il‐1β, Nfkb2, Rantes, CCL20, and CCND1 mRNA in MCF‐7, AA/C1, AA/C1/SB (aka SB), and AA/C1/SB/10C (aka 10C) either untreated or following incubation with wild‐type F. nucleatum 12230. Results obtained from untreated controls were designated as 1. Data were mean values ± SD. The experiment was performed in duplicates and repeated twice. *P < 0.05, **P < 0.01, and ***P < 0.001 (Student's t‐test).
Source data are available online for this figure.
Figure 1. Fusobacterium nucleatum preferentially binds, invades, and stimulates the growth of cancerous colorectal cells via Annexin A1.
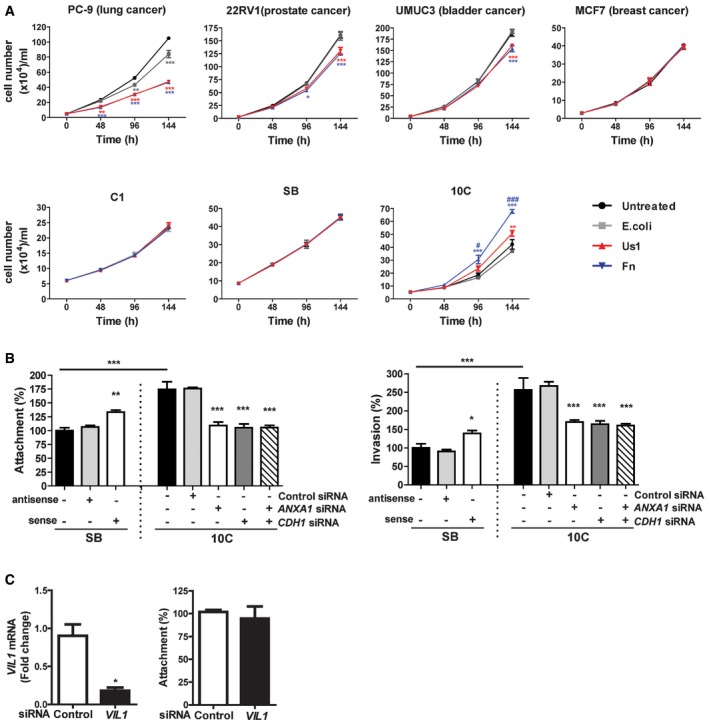
- Lung cancer cells PC‐9, prostate cancer cells 22RV1, bladder cancer cells UMUC3, breast cancer cells MCF‐7, colonic adenoma‐derived non‐cancerous cells AA/C1 (aka C1) and AA/C1/SB (aka SB), or cancerous cells AA/C1/SB/10C (aka 10C) were incubated with wild‐type F. nucleatum 12230 (Fn), the fadA‐deletion mutant US1 (US1), or E. coli DH5α (E. coli) at multiplicity of infection (MOI) of 1,000:1. Cell numbers are mean values ± SEM. The experiment was performed in triplicates and repeated three times. *P < 0.05, **P < 0.01, ***P < 0.001, compared to untreated controls; # P < 0.05, ### P < 0.001, compared to US1‐treated cells (two‐way ANOVA).
- Attachment (left panel) and invasion (right panel) of wild‐type F. nucleatum 12230 (Fn) to the non‐cancerous SB cells, either untreated or transfected with antisense or sense ANXA1, and to the cancerous 10C cells, either untreated or transfected with control or ANXA1‐ or CDH1‐specific siRNA or both (MOI 50:1). F. nucleatum attachment and invasion to the untreated SB cells were designated as 100%, respectively; all other values were expressed as relative to those obtained with untreated SB. Data are mean values ± SEM. The experiment was performed in triplicates and repeated four times. *P < 0.05, **P < 0.01, and ***P < 0.001 (one‐way ANOVA).
- Left panel: qPCR analysis of Villin 1 (VIL1) mRNA levels in 10C cells treated with control siRNA or VIL1‐specific siRNA, demonstrating knockdown of Villin 1. Right panel: Attachment of F. nucleatum 12230 to 10C cells treated with control siRNA or VIL1‐specific siRNA. Data are mean values ± SD. The experiment was performed in triplicates and repeated twice. *P < 0.05 (Student's t‐test).
We then tested F. nucleatum stimulation of the colonic cells, utilizing a CRC progression model consisting of a series of cell lines sequentially derived from a human colonic adenoma 32. AA/C1 is a slow‐growing non‐cancerous adenoma cell line with low colony‐forming efficiency. Following treatment with 1 mM sodium butyrate, it gave rise to the AA/C1/SB cell line, which grows faster with increased colony‐forming efficiency, but remains non‐tumorigenic in mice. The AA/C1/SB cells were further mutagenized with N‐methyl‐N′‐nitro‐N‐nitrosoguanidine to produce a tumorigenic (cancerous) cell line, AA/C1/SB/10C 32. F. nucleatum 12230 accelerated the growth of the AA/C1/SB/10C cells (from now on referred to as “10C”), but not of the non‐tumorigenic AA/C1 or AA/C1/SB (from now on referred to as “SB”) cells (Fig 1A). As with our previous report, the growth stimulation was mediated predominantly through FadA although the fadA‐deletion mutant US1 retained a weak stimulatory effect, suggesting additional component(s) may be involved 12. Although all cell lines tested with F. nucleatum 12230 expressed increased levels of proinflammatory markers, only the cancerous 10C cells exhibited elevated expression of the oncogene Cyclin D1, consistent with growth stimulation (Fig EV1B).
Fusobacterium nucleatum binds and invades cancerous cells more efficiently due to Annexin A1
F. nucleatum 12230 bound 75% more and invaded 150% more efficiently to the cancerous 10C cells, as compared to its non‐cancerous predecessor SB (Fig 1B). These results were consistent with our previous finding that the fadA gene levels (and F. nucleatum) were significantly higher in the human colorectal carcinoma tissues than in the adenoma tissues 12. The results also suggest that 10C and SB may differ in their membrane components, which might explain the differential binding by F. nucleatum.
Previous comparative proteomic analysis revealed two membrane proteins that were increased in 10C compared to SB: Annexin A1 and Villin 1 (VIL1) 33. Down‐regulation of Annexin A1 in the 10C cells by siRNA effectively reduced F. nucleatum binding and invasion, in a similar manner as suppression of CDH1 (Fig 1B), whereas knockdown of VIL1 had no effect (Fig 1C). Transfection of ANXA1 into SB cells significantly increased F. nucleatum binding and invasion (Fig 1B). These results indicate that Annexin A1 plays an important role in F. nucleatum interaction with the cancerous 10C cells. Hence, from this point onward, our investigation focused on Annexin A1.
Annexin A1 is an independent CRC prognosis biomarker
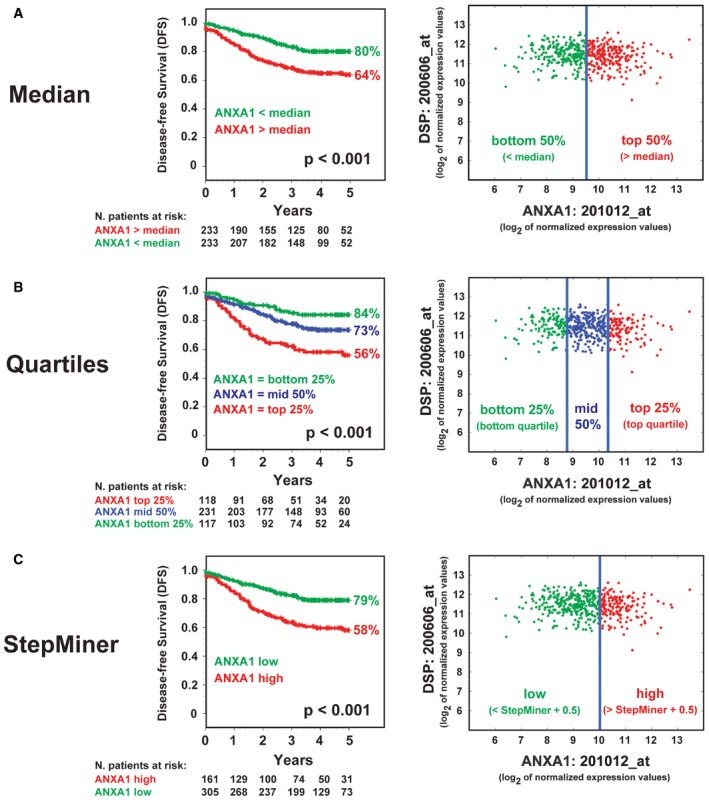
To examine ANXA1 expression in CRC biology in humans, we tested for their association with recurrence rates in a clinical database annotated with microarray gene‐expression measurements from 466 primary colon carcinomas 34. The association was first tested using Kaplan–Meier survival curves, using three different approaches for patient stratification: (i) based on the median of ANXA1 mRNA expression levels (Fig 2A); (ii) based on the quartile distribution of ANXA1 mRNA expression levels (Fig 2B); and (iii) based on expression thresholds calculated using the StepMiner algorithm (Fig 2C), as previously described 35, 36. High levels of ANXA1 mRNA expression were associated with a statistically significant reduction in disease‐free survival (DFS) rates, irrespective of the method used for the stratification (P < 0.001, log‐rank test). Differences in ANXA1 mRNA expression levels did not appear to correlate with differences in each tumor's relative content of epithelial cells (i.e., tumor cell density) as revealed by the lack of visual correlations with the epithelial cell marker Desmoplakin (DSP). Importantly, the association between high levels of ANXA1 mRNA expression and increased risk of recurrence remained statistically significant in a series of multivariate analyses (Cox proportional hazards method) that excluded clinical stage, pathological grade, age, and sex as possible confounding variables, even after modeling ANXA1 expression as a continuous variable (Table 1). The hazard ratio (HR) for disease recurrence associated with increased ANXA1 expression levels was 1.44 (95% CI 1.24–1.68; P < 0.001) when tested alongside clinical stage, age, and sex across the full patient cohort (n = 466), and 1.56 (95% CI 1.21–2.02; P < 0.001) when tested alongside clinical stage, pathological grade, age, and sex in the patient subgroup annotated with pathological grade (n = 216). These analyses demonstrate that ANXA1 is a novel colon cancer prognostic biomarker.
Figure 2. Annexin A1 is a novel colon cancer prognosis marker.
-
A–CRelationship between ANXA1 mRNA expression levels and disease‐free survival (DFS) in colon cancer patients. The relationship between ANXA1 mRNA expression levels and DFS was investigated in a database of 466 primary colon carcinomas, assembled by pooling four independent gene‐expression array datasets from the NCBI‐GEO online repository (GSE14333, GSE17538, GSE31595, GSE37892), as previously described 34. The association between ANXA1 expression levels and DFS was tested using Kaplan–Meier survival curves, after patient stratification in groups with high, medium, and low ANXA1 expression, using three different methods: (A) based on the median of ANXA1 mRNA expression levels (high 50% versus low 50%); (B) based on the quartile distribution of ANXA1 mRNA expression levels (high 25% versus middle 50% versus low 25%); and (C) based on ANXA1 mRNA expression thresholds calculated using the StepMiner algorithm (low versus high), as previously described 35, 36. Overall, high ANXA1 mRNA expression levels were associated with a statistically significant reduction in DFS (P < 0.001, log‐rank test), irrespective of the method used for the stratification. Differences in ANXA1 mRNA expression levels did not appear to correlate with differences in each tumor's relative content of epithelial cells in the analyzed biospecimens (i.e., tumor cell density) as revealed by the lack of visual correlations with the epithelial cell marker Desmoplakin (DSP).
Table 1.
Relationship between ANXA1 mRNA expression levels and risk of recurrence in colon cancer patients
| Cox proportional hazards model | ||||||
|---|---|---|---|---|---|---|
| Univariate | Multivariate | |||||
| HR | 95% CI | P‐value | HR | 95% CI | P‐value | |
| All patients (n = 466) | ||||||
| ANXA1a | 1.46 | 1.25–1.71 | < 0.001*** | 1.44 | 1.24–1.68 | < 0.001*** |
| Stage (I–IV) | 3.47 | 2.62–4.59 | < 0.001*** | 3.73 | 2.74–5.09 | < 0.001*** |
| Agea | 0.99 | 0.97–1.00 | 0.06 | 1.00 | 0.98–1.01 | 0.75 |
| Sex (M/F)b | 1.07 | 0.89–1.28 | 0.49 | 1.05 | 0.88–1.27 | 0.58 |
| Patients annotated with information on tumor grade (n = 216) | ||||||
| ANXA1a | 1.48 | 1.18–1.87 | < 0.001*** | 1.56 | 1.21–2.02 | < 0.001*** |
| Stage (I–IV) | 3.13 | 2.14–4.60 | < 0.001*** | 3.63 | 2.31–5.70 | < 0.001*** |
| Grade (G1–G3) | 1.63 | 0.94–2.82 | 0.08 | 1.02 | 0.58–1.79 | 0.95 |
| Agea | 0.99 | 0.97–1.01 | 0.20 | 1.00 | 0.98–1.02 | 0.85 |
| Sex (M/F)b | 1.15 | 0.88–1.51 | 0.32 | 1.16 | 0.86–1.55 | 0.33 |
CI, confidence interval; HR, hazard ratio.
The relationship between ANXA1 mRNA expression levels and risk of recurrence was investigated in a database of 466 primary colon carcinomas, obtained by assembling four independent gene‐expression array datasets downloaded from the NCBI‐GEO online repository (GSE14333, GSE17538, GSE31595, GSE37892), as previously described 34. The association between ANXA1 mRNA expression levels and risk of recurrence was tested using both univariate and multivariate analyses based on the Cox proportional hazards method, where ANXA1 mRNA expression levels were modeled as a continuous variable. Overall, higher ANXA1 mRNA expression levels were associated with a statistically significant increase in the risk of recurrence when using univariate analysis, in both the whole database (n = 466; P < 0.001) and the subset of patients annotated with information on the pathological grading of the tumors (n = 216; P < 0.001). Importantly, the association remained significant also in a multivariate analysis aimed at excluding possible confounding effects from clinical stage, pathological grade, age, or sex, both when tested across the whole database (n = 466; P < 0.001) and when tested in the subset of patients annotated for the pathological grading of the respective tumors (n = 216; P < 0.001). Hazard ratios (HRs) were tested for statistical significance (null hypothesis: HR=1) using the Wald test.
ANXA1 mRNA levels and age modeled as a continuous variable.
M/F: male versus female.
P < 0.001.
Annexin A1 is a CRC growth factor specifically expressed in proliferating cancerous cells
We found Annexin A1 was selectively expressed in proliferating cancerous cells. In 10C and human CRC cells, HCT116, DLD1, and RKO, ANXA1 gene expression was significantly higher in the non‐confluent than confluent state, despite that very little was expressed in RKO (Fig 3A). Immunofluorescence staining revealed that Annexin A1 was expressed on the outer layer of the growing mass of cancerous 10C cells (Fig 3B; Movie EV1). In contrast, Annexin A1 expression in SB remained at low levels, unaffected by cell density (Fig 3B).
Figure 3. Annexin A1 is a novel CRC growth factor selectively expressed in proliferating cancerous colorectal cells.
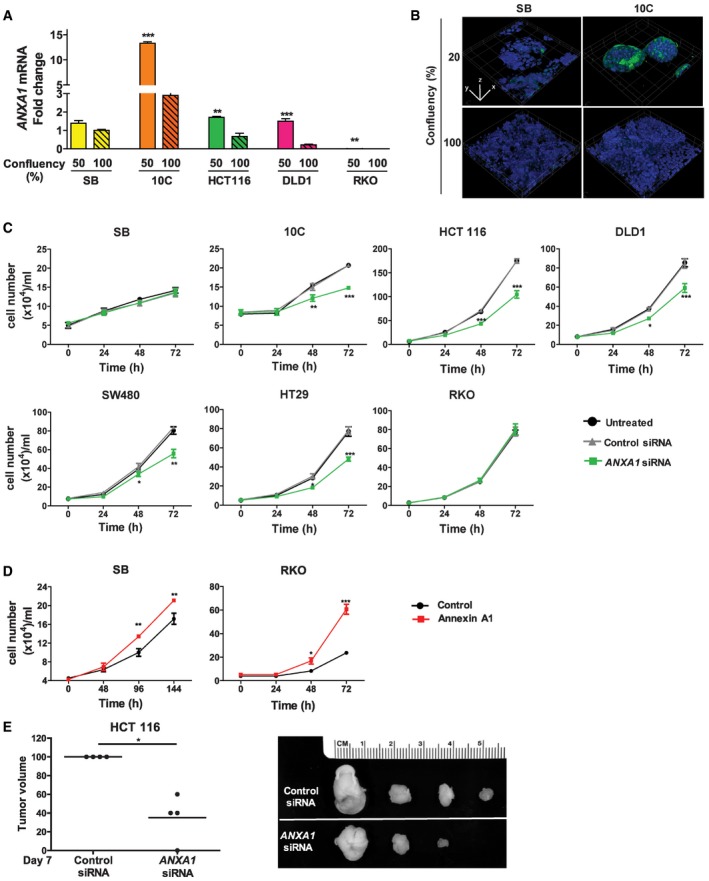
- Real‐time qPCR analysis of ANXA1 expression using mRNA extracted from the non‐cancerous SB, cancerous 10C, and human CRC cell lines HCT116, DLD1, and RKO, each grown to 50 or 100% confluency. All results were normalized to the ANXA1 mRNA levels in SB cells of 100% confluency, which was designated as 1. Data are mean values ± SEM. The experiment was performed in triplicates and repeated twice. **P < 0.01 and ***P < 0.001 (Student's t‐test).
- Confocal microscopy analysis of SB and 10C cells grown to 20% (top panels) or 100% (bottom panels) confluency followed by immunofluorescence staining of Annexin A1 (green). The nuclei were stained with DAPI (blue). A series of 20–50 consecutive images in the z‐axis were stacked together to generate the 3D figure at 400× magnification. Annexin A1 is most abundantly expressed on the outer layer of 20% confluent 10C (also see Movie EV1), compared to 100% confluent 10C, or SB of either confluency. Scale bars, x = 1 μm, y = 1 μm, z = 1.6 μm. The experiment was repeated at least twice.
- Cell proliferation assay of adenoma‐derived non‐cancerous SB and cancerous 10C and human CRC cell lines HCT116, DLD1, SW480, HT29, and RKO either untreated (black lines) or following treatment with control siRNA (gray lines) or ANXA1‐specific siRNA (green lines). Data are mean values ± SEM. The experiment was performed in triplicates and repeated three times. *P < 0.05, **P < 0.01, and ***P < 0.001, compared to the untreated cells (two‐way ANOVA).
- Cell proliferation assay of SB (left panel) and RKO (right panel) cells transfected with ANXA1 (red line), as compared to the control cells (black lines). Data are mean values ± SEM. The experiment was performed in triplicates and repeated three times. *P < 0.05, **P < 0.01, and ***P < 0.001 (two‐way ANOVA).
- Xenografted tumor growth in nude mice following subcutaneous and bilateral inoculation of HCT116 cells transfected with control siRNA or ANXA1‐specific siRNA (n = 4). The tumor volumes were measured after 7 days postinjection (left panel). For each mouse, the tumor resulting from ANXA1‐specific siRNA‐treated cells was normalized to that from control siRNA‐treated cells, which was designated 100%. The line represents the average. *P < 0.05 (paired t‐test). The individual tumor pairs are shown on the right panel: top, tumors arising from control siRNA‐treated cells; bottom, tumors arising from ANXA1‐specific siRNA‐treated cells.
Using ANXA1‐specific siRNA, we were able to inhibit its expression (Fig EV2A). This led to inhibition of the growth of cancerous 10C, HCT116, DLD1, SW480, and HT29, but not the non‐cancerous SB, or the CRC cells RKO, which expressed the lowest level of ANXA1 (Fig 3C). Transfection of ANXA1 into SB and RKO significantly stimulated their growth (Figs 3D and EV2B). Equal numbers of HCT116 cells transfected with control or ANXA1‐specific siRNA were then injected subcutaneously and bilaterally into nude mice. Suppression of ANXA1 significantly attenuated tumor growth compared to controls (Fig 3E). Similar results were obtained with DLD1 (Fig EV2C). As no F. nucleatum was included in these experiments, the results demonstrate that Annexin A1 is a critical growth factor for CRC, regardless of F. nucleatum.
Figure EV2. Annexin A1 knockdown in 10C, HCT116 and DLD1 cells and knock‐in in RKO cells, and the effect of knockdown in DLD1 xenograft tumor growth.
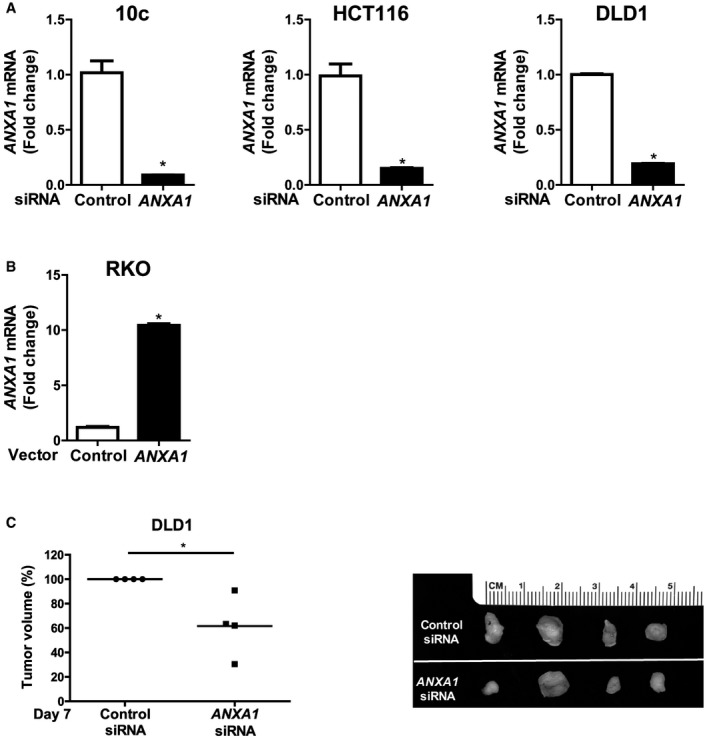
- qPCR analysis of ANXA1 mRNA levels in 10C, HCT116, DLD1 cells transfected with control siRNA or ANXA1‐specific siRNA, demonstrating knockdown of ANXA1. The experiment was performed in triplicates. Data are mean values ± SEM. *P < 0.05 (Student's t‐test).
- qPCR analysis of ANXA1 mRNA levels in RKO cells transfected with control vector or ANXA1, demonstrating knock‐in of ANXA1. The experiment was performed in triplicates. Data are mean values ± SEM. *P < 0.05 (Student's t‐test).
- Xenografted tumor growth in nude mice following subcutaneous and bilateral inoculation of DLD1 cells transfected with control siRNA or ANXA1‐specific siRNA (n = 4). The tumor volumes were measured after 8 days postinjection (left panel). For each mouse, the tumor resulting from ANXA1‐specific siRNA‐treated cells was normalized to that from control siRNA‐treated cells, which was designated as 100%. The line represents the average. *P < 0.05 (paired t‐test). The individual tumor pairs are shown on the right panel: top, tumors arising from control siRNA treated cells; bottom, tumors arising from ANXA1‐specific siRNA‐treated cells.
Fusobacterium nucleatum induces Annexin A1 expression in cancerous cells through FadA and E‐cadherin
We investigated the relationship between F. nucleatum and Annexin A1 and found F. nucleatum induced ANXA1 gene expression in the cancerous 10C, HCT116, and DLD1 cells, but not in the non‐cancerous SB cells (Fig 4A). The induction required FadA, because the fadA‐deletion mutant US1 was defective, and purified FadAc induced Annexin A1 in a dose‐dependent manner (Fig 4A and B). Of note, similar induction was detected upon re‐analysis of a recently published, publicly available RNA‐seq dataset 14 that contains gene‐expression data from human CRC cells HT29 incubated with a different strain, F. nucleatum ATCC 25586 (Fig EV3A). Taken together, these consistent observations indicate that ANXA1 overexpression can be interpreted as a common response of CRC cells to F. nucleatum, across different cell lines and bacterial strains.
Figure 4. FadA induces Annexin A1 expression through E‐cadherin.
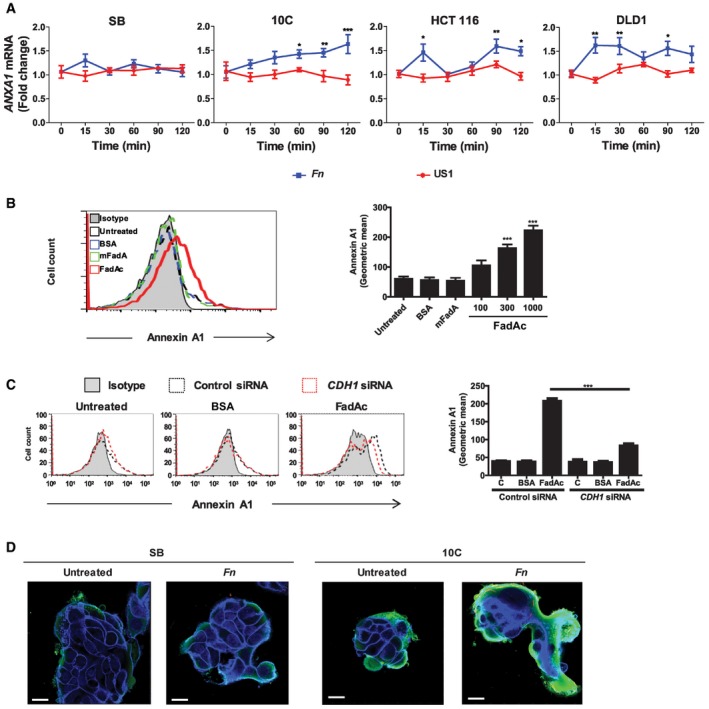
- Real‐time qPCR analysis of ANXA1 mRNA levels in SB, 10C, HCT116, and DLD1 cells incubated with wild‐type F. nucleatum 12230 (Fn) or fadA‐deletion mutant US1 (US1) at MOI of 50:1 for the indicated time periods. The results were normalized to those obtained with untreated cells and were the mean of three independent experiments each performed in triplicates. Data are mean values ± SEM. *P < 0.05, **P < 0.01, and ***P < 0.001 (two‐way ANOVA).
- Flow cytometry analysis of Annexin A1 expression in 10C cells either untreated, or incubated with BSA (1,000 μg/ml), or mFadA (1,000 μg/ml), or FadAc (100, 300, or 1,000 μg/ml) for 1 h. Data are mean values ± SD. The experiment was performed in triplicates and repeated more than three times. ***P < 0.001 (one‐way ANOVA).
- Flow cytometry analysis of Annexin A1 in 10C cells transfected with control siRNA (dotted black line) or CDH1‐specific siRNA (dotted red line) followed by no treatment (untreated), or incubation with BSA (1,000 μg/ml) or FadAc (1,000 μg/ml) for 1 h. Data are mean values ± SD. The experiment was performed in triplicates and repeated twice. ***P < 0.001 (two‐way ANOVA).
- Confocal microscopy analysis of SB and 10C cells either untreated or following incubation with CFSE‐labeled F. nucleatum 12230 (Fn) for 1 h at MOI of 5:1. Annexin A1 was stained green and E‐cadherin blue. Imagines are 800× magnification. Note the enhanced expression of Annexin A1 in 10C compared to SB and its location on the outer layer of the cell mass. The experiment was repeated three times. Scale bar, 250 nm.
Figure EV3. Induction of Annexin A1 mRNA expression in HT29 cells by F. nucleatum 25586 and effect of F. nucleatum 12230 on E‐cadherin mRNA expression in SB, 10C, HCT116 and DLD1 cells.
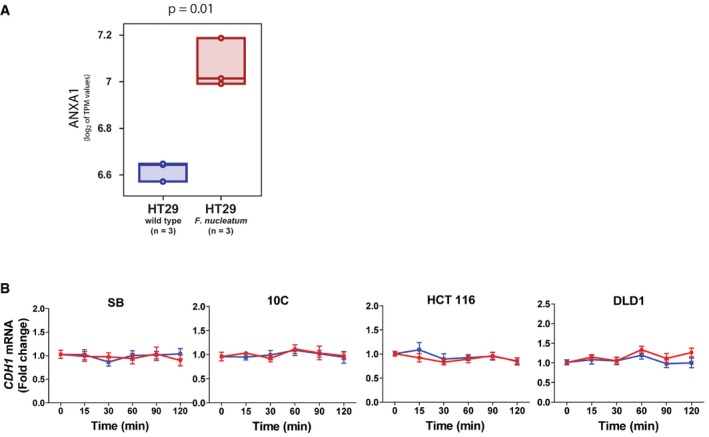
- Statistical analysis of associations between exposure to F. nucleatum and up‐regulation of ANXA1 mRNA expression levels in colon cancer cell HT29. The ANXA1 mRNA levels in HT29 cells were analyzed in an RNA‐sequencing (RNA‐seq) dataset publicly available from the NCBI‐GEO online repository (GSE90944) and containing global gene‐expression measurements from HT29 cells, both at baseline and following incubation with F. nucleatum ATCC25586 in triplicates 14. The distribution of ANXA1 mRNA expression levels in the two sample groups (baseline versus infected) was visualized using boxplots, using the log2 of their TPM (transcripts per million) expression values as a metric. Individual data points were represented as circles, and box‐plots were drawn to span the inter‐quartile range (from the 25th to the 75th percentile) with an internal band to identify the median. Differences in mean log2 TPM values between HT29 cells at baseline (n = 3) and following incubation with F. nucleatum (n = 3) were tested for statistical significance using a two‐tailed t‐test for continuous variables. The analysis revealed that HT29 cells exposed to F. nucleatum were characterized by increased levels of ANXA1 mRNA expression, as compared to HT29 cells at baseline (P = 0.01).
- Real‐time qPCR analysis of E‐cadherin (CDH1) mRNA levels in SB, 10C, HCT116, and DLD1 cells following incubation with F. nucleatum 12230 (Fn) and fadA‐deletion mutant US1 (US1) for indicated time periods. All results were normalized to those of the untreated cells. Data are mean values ± SEM of three independent experiments each performed in triplicates.
We have shown previously that FadA binds to E‐cadherin on CRC cells 12. Therefore, we examined the interactions between FadA, E‐cadherin, and Annexin A1. Induction of Annexin A1 expression by FadA was mediated through E‐cadherin (Fig 4C) despite the fact that F. nucleatum did not affect E‐cadherin expression at the transcriptional level (Fig EV3B). The induced Annexin A1 localized at the outer layer of the cell mass (Fig 4D), consistent with the observation in Fig 3B. No Annexin A1 was induced in the non‐cancerous SB cells by F. nucleatum (Fig 4D), suggesting that the induction was specific for the cancerous cells.
FadA, E‐cadherin, Annexin A1, and β‐catenin form a complex in cancerous cells
Western blot analysis demonstrated a coordinated increase in E‐cadherin, Annexin A1, and β‐catenin protein expression with increased FadAc binding over time (Fig 5A), suggesting possible interactions between these components. All four components could be co‐immunoprecipitated, further supporting the formation of a multi‐component complex (Fig 5B and C).
Figure 5. FadA, E‐cadherin, Annexin A1, and β‐catenin form a complex in cancerous cells.
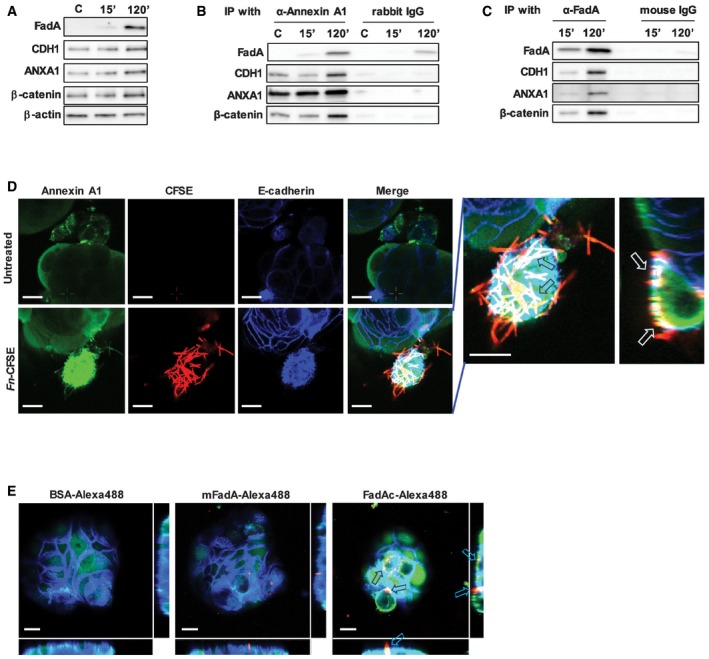
- Western blot analysis of FadA, E‐cadherin (CDH1), Annexin A1 (ANXA1), and β‐catenin in DLD1 cells following incubation with FadAc for 15 or 120 min. C, untreated cells. β‐Actin was included as an internal control. The experiment was repeated three times.
- Co‐immunoprecipitation with Annexin A1. DLD1 cell lysates were incubated with FadAc for 15 or 120 min and then mixed with agarose beads conjugated with rabbit anti‐Annexin A1 polyclonal antibody (α‐Annexin A1) or control rabbit IgG. FadA, E‐cadherin (CDH1), Annexin A1 (ANXA1), and β‐catenin in the eluates were detected by Western blot. C, untreated control. The experiment was repeated three times.
- Co‐immunoprecipitation with FadA. DLD1 cell lysates were incubated with FadAc for 15 or 120 min and then mixed with agarose beads conjugated with mouse anti‐FadA monoclonal antibody (α‐FadA) or control mouse IgG. FadA, E‐cadherin (CDH1), Annexin A1 (ANXA1), and β‐catenin in the eluates were detected by Western blot. The experiment was repeated three times.
- Confocal microscopy analysis of 10C cells either untreated (top panel) or following incubation with CFSE‐labeled F. nucleatum 12230 (red, bottom panel) for 3 h and then immunofluorescent‐stained for Annexin A1 (green) and E‐cadherin (blue). Images are 1,200× magnification. A side view of the enlarged image is shown on the far right. Note the enhanced expression of Annexin A1 in the F. nucleatum‐bound cells and the co‐localization of Annexin A1, E‐cadherin, and F. nucleatum on the cell membranes (arrows). The experiment was repeated more than three times. Scale bar, 500 nm.
- Confocal microscopy analysis of 10C cells following incubation with Alexa Fluor™ 488‐conjugated BSA, mFadA, or FadAc (red) for 1 h followed by immunostaining of Annexin A1 (green) and E‐cadherin (blue). Images are 1,200× magnification. Note the enhanced expression of Annexin A1 and its co‐localization with E‐cadherin in the presence of FadAc (arrows), but not with BSA or mFadA. The experiment was repeated twice. The side views are shown to the right and bottom of each image. Scale bar, 500 nm.
Source data are available online for this figure.
Analysis by confocal microscopy confirmed that F. nucleatum and FadAc co‐localized with E‐cadherin and Annexin A1 in 10C and DLD1 cells on the cell membranes, as well as inside the cells (Figs 5D and E, and EV4). This is consistent with our previous reports that FadAc binds vascular endothelial (VE)‐cadherin and E‐cadherin causing them to internalize 12, 37. It should be noted that, compared to those incubated with mFadA or BSA, 10C cells incubated with FadAc exhibited not only increased expression of Annexin A1, but also enhanced co‐localization of E‐cadherin and Annexin A1, consistent with Fig 4D.
Figure EV4. Co‐localization of F. nucleatum 12230, Annexin A1 and E‐cadherin on DLD1 cells.
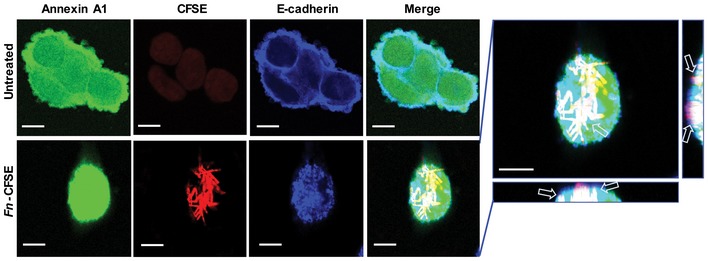
Confocal microscopy analysis of DLD1 cells either untreated (top panel) or following incubation with CFSE‐labeled F. nucleatum 12230 (red, bottom panel) at MOI of ~5:1 for 3 h and immunostaining of Annexin A1 (green) and E‐cadherin (blue). Images were 1,200× magnification. Arrows point to co‐localization of Annexin A1, E‐cadherin, and F. nucleatum. The side views are shown to the right and bottom of the enlarged image. Scale bar, 500 nm.
A positive feedback loop between FadA and Annexin A1 in cancerous cells
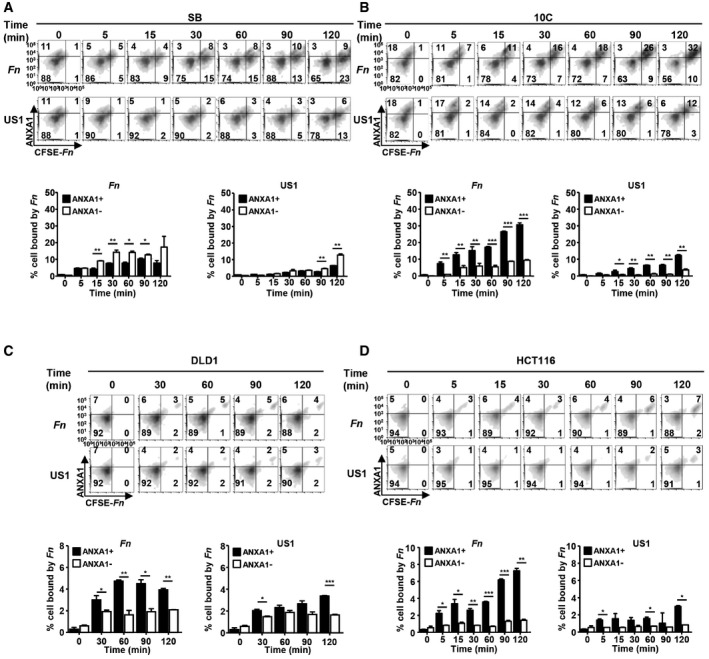
When F. nucleatum was incubated with the 10C cells, it exhibited preferential binding to Annexin A1‐positive cells, starting at as early as 5 min of incubation, whereas slight preference for Annexin A1‐negative cells was detected in SB (Fig 6A and B, compare solid and clear bars). Upon incubation of F. nucleatum with 10C cells, Annexin A1 expression increased with time, and so did F. nucleatum binding to the cells (Fig 6B). Similar observations were made with DLD1 and HCT116 cells (Fig 6C and D). The increase of Annexin A1 protein levels and binding of F. nucleatum were consistent with the kinetics of transcriptional activation (compare Figs 4A and 6). These results suggest a positive feedback loop in which F. nucleatum induces Annexin A1 expression in the cancerous cells, which in turn enhances bacterial binding. The fadA‐deletion mutant US1 did not induce Annexin A1 expression because the amount of Annexin A1‐positive cells did not change over time. However, US1 also exhibited preferential binding to Annexin A1‐positive cells (Fig 6B–D), indicating Annexin A1 may mediate additional F. nucleatum component(s) to bind to the cancer cells.
Figure 6. Positive feedback loop between FadA and Annexin A1.
-
A–DFlow cytometry analysis of SB (A), 10C (B), DLD1 (C), and HCT116 (D) cells incubated with CFSE‐labeled F. nucleatum 12230 (Fn) or its fadA‐deletion mutant US1 (US1) at MOI of 10–20:1 for the indicated time and immunostained with anti‐Annexin A1 antibodies. Shown on the top panels are the density plots. x‐axis, CFSE‐labeled F. nucleatum or US1 (CFSE‐Fn); y‐axis, Annexin A1 (ANXA1). Shown on the bottom panels are the percentages of Annexin A1‐positive (solid bars) or negative (clear bars) cells bound by F. nucleatum or US1 out of the total number of cells analyzed. Data are mean values ± SD. The experiments were performed in triplicates and repeated 2–3 times. *P < 0.05, **P < 0.01, ***P < 0.001 (two‐way ANOVA).
FadA and Annexin A1 co‐express in colorectal tumors in mice and humans
To examine the correlation between FadA and Annexin A1 in vivo, we utilized the Apc min/+ mice, which carry a mutation in one copy of the tumor suppressor APC gene and develop spontaneous tumors in the small intestine and colon. C57BL/6 Apc min/+ mice inoculated with wild‐type F. nucleatum 12230 by oral gavage developed significantly more tumors in the colon than those inoculated with PBS, E. coli DH5α, or the fadA‐deletion mutant US1 (Fig 7A), demonstrating a driver role of FadA in tumorigenesis. In all groups, significantly higher levels of ANXA1 mRNA were detected in the tumors compared to the normal colonic tissues from the same mice, with the highest levels in the tumors induced by wild‐type F. nucleatum (Fig 7B). These observations were consistent with our findings that ANXA1 expression was increased in the proliferating cancerous cells (Fig 3A and B) and that FadA specifically induced ANXA1 expression in those cells (Figs 4 and 6). A positive correlation between fadA and ANXA1 was detected in F. nucleatum‐induced tumors, with a correlation coefficient of 0.43 (P = 0.01; Fig 7C).
Figure 7. FadA and Annexin A1 co‐express in colorectal tumors in mice and humans.
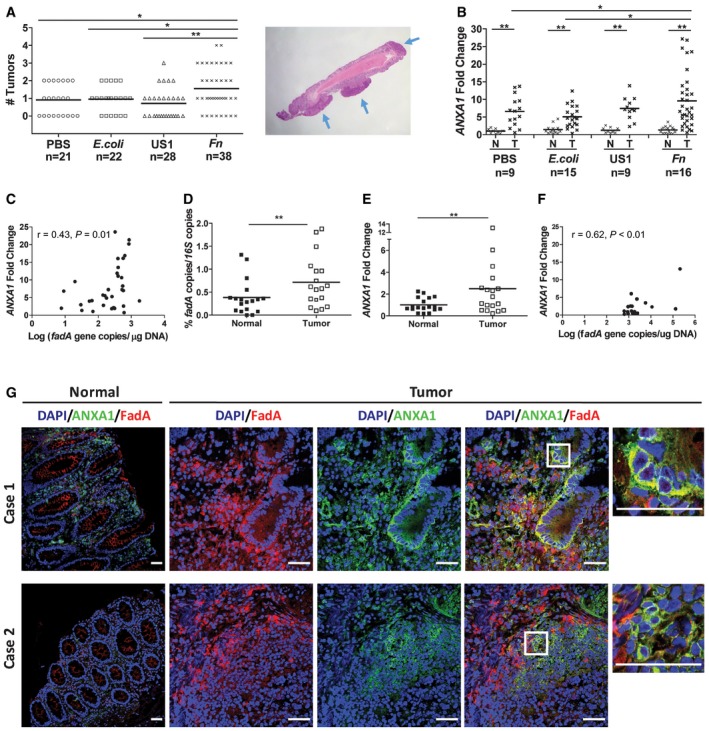
- Colorectal tumors generated in Apc min/+ mice following treatment with PBS, E. coli DH5α (E. coli), fadA‐deletion mutant US1 (US1), or F. nucleatum 12230 (Fn). Each symbol represents one mouse. Horizontal lines represent mean values. Representative tumors formed in the mouse colon are shown on the right, pointed by blue arrows. *P < 0.05, **P < 0.01 (one‐way ANOVA).
- ANXA1 mRNA levels in Apc min/+ mouse paired normal colonic and tumor tissues as measured by real‐time qPCR. Each symbol represents one mouse. Horizontal lines represent mean values. *P < 0.05, **P < 0.01) (two‐way ANOVA).
- Positive correlation between fadA gene copy numbers (x‐axis) and ANXA1 mRNA levels (y‐axis) in F. nucleatum‐induced Apc min/+ mouse colonic tumors (n = 34; Pearson's correlation r = 0.43, P = 0.01). Each dot represents the average of qPCR results performed in duplicates.
- Abundance of fadA in the paired normal and adenocarcinoma tissues from human CRC patients (n = 18) expressed as ratio of fadA over total 16S rRNA genes determined by qPCR. Each symbol shows the average of duplicate qPCR results from one patient. Horizontal lines represent mean values. **P < 0.01 (paired t‐test).
- ANXA1 mRNA levels in paired normal and adenocarcinoma tissues from CRC patients (n = 18). Each symbol shows the average of duplicate qPCR results from one patient. Horizontal lines represent mean values. **P < 0.01 (paired t‐test).
- Positive correlation between fadA gene copy numbers (x‐axis) and ANXA1 mRNA levels (y‐axis) in human colorectal adenocarcinoma tissues (n = 18; Pearson's correlation r = 0.62, P < 0.01). Each dot represents the average of qPCR results performed in duplicates.
- Confocal microscopy analysis of paired normal and carcinoma tissues from two colon cancer patients. The frozen sections were incubated with rabbit anti‐Annexin A1 polyclonal antibodies and 5G11 mouse anti‐FadA monoclonal antibodies. The slides were then stained with Alexa Fluor ®680‐conjugated donkey anti‐rabbit and Alexa Fluor® 555‐conjugated goat anti‐mouse, washed, and covered in mounting medium containing DAPI. The scanning confocal microscopy mages were taken with a Nikon Ti Eclipse inverted microscope at 200× magnification for the normal tissues and 400× for the carcinomas. Scale bar, 50 μm. Co‐localization of FadA (red) and Annexin A1 (green) was observed in carcinomas but not in the paired normal tissues. See Fig EV5 for isotype (rabbit and mouse IgG) controls.
Figure EV5. Isotype controls of paired normal and carcinoma tissues from two colon cancer patients (see Fig 7G).
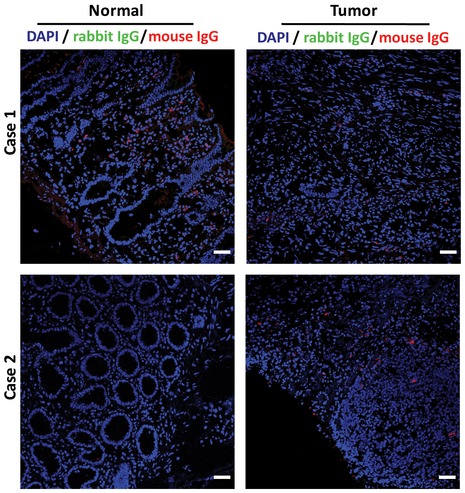
The frozen sections were incubated with rabbit and mouse IgG. The slides were then stained with Alexa Fluor® 680‐conjugated donkey anti‐rabbit and Alexa Fluor® 555‐conjugated goat anti‐mouse IgG antibodies, washed, and covered in mounting medium containing DAPI. The scanning confocal microscopy mages were taken with a Nikon Ti Eclipse inverted microscope at 200× magnification. Scale bar, 50 μm.
Among CRC patients, higher levels of fadA gene copy numbers and ANXA1 mRNA were detected in the tumors than in the adjacent normal tissues by qPCR (Fig 7D and E), with a correlation coefficient of 0.62 (P < 0.01; Fig 7F). Immunofluorescent staining of paired tumor and normal tissues confirmed this finding, with significantly higher levels of FadA and Annexin A1 proteins detected in the tumors. Co‐localization of FadA and Annexin A1 was observed in the tumors but not in the normal tissues (Fig 7G). Together, these results support the role of FadA and Annexin A1 in colorectal tumorigenesis.
FadA modulates β‐catenin signaling in cancerous cells via Annexin A1
We have reported previously that binding of F. nucleatum to E‐cadherin on CRC cells activates β‐catenin signaling leading to overexpression of oncogenes such as Cyclin D1 (CCND1) 12. When ANXA1 was knocked down by siRNA, F. nucleatum‐mediated activation of β‐catenin expression was abolished in the cancerous 10C, HCT116, and DLD1 cells (Fig 8A). Nuclear translocation of β‐catenin in 10C was also inhibited (Fig 8B). These data suggest Annexin A1 is required for activation of Wnt/β‐catenin signaling.
Figure 8. Fusobacterium nucleatum activates β‐catenin signaling via Annexin A1.
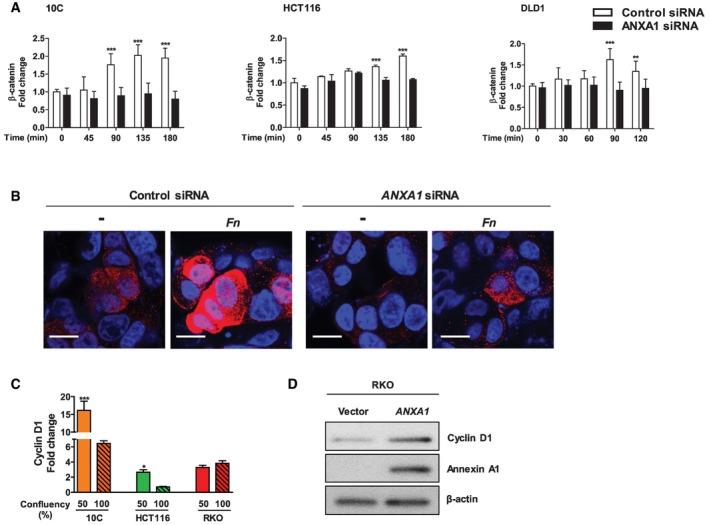
- Flow cytometry analysis of β‐catenin expression in 10C, HCT116, and DLD1 cells transfected with control siRNA (clear bars) or ANXA1‐specific siRNA (solid bars) following incubation with F. nucleatum 12230 at MOI of ˜20:1 for indicated time periods. The geometric means of cells treated with control siRNA at time 0 were designated as 1. Data are mean values ± SD. The experiment was performed in duplicates or triplicates and repeated 1–3 times. **P < 0.01, ***P < 0.001 (two‐way ANOVA).
- Immunostaining of β‐catenin in 10C cells transfected with control siRNA or ANXA1‐specific siRNA following incubation with F. nucleatum 12230 (Fn) at MOI of ˜100:1 for 2 h. β‐Catenin was stained with Alexa Fluor® 680 (red) and the nuclei with DAPI (blue). The images were captured with confocal microscope at 800× magnification. ‐, no bacteria added. Note the increased expression of β‐catenin and its nucleus translocation in response to F. nucleatum in control siRNA‐treated cells, but not in ANXA1 siRNA‐treated cells. The experiment was repeated twice. Scale bar, 200 nm.
- Real‐time qPCR analysis of CCND1 expression using mRNA extracted from the cancerous 10C, HCT116 and RKO, each grown to 50 or 100% confluency. Data are mean values ± SEM. The experiment was performed in triplicates and repeated twice. *P < 0.05, ***P < 0.001 (Student's t‐test).
- Western blot analysis of Cyclin D1, Annexin A1, and β‐actin in RKO cells transfected with control vector or ANXA1. Induction of Cyclin D1 was observed in response to transfection of Annexin A1. The experiment was repeated twice.
Source data are available online for this figure.
In 10C and HCT116 cells, Cyclin D1 gene expression also exhibited cell‐density dependence, significantly higher in the non‐confluent than confluent state, consistent with ANXA1 expression (compare Figs 3A and 8C). In contrast, no expression difference was detected in the RKO cells where ANXA1 was nearly undetectable (compare Figs 3A and 8C). However, when ANXA1 was transfected into the RKO cells, Cyclin D1 expression was increased, indicating a driving role of Annexin A1 in oncogene expression (Fig 8D). These observations support the role of Annexin A1 in modulating β‐catenin signaling.
Discussion
In this study, we elucidate the fundamental mechanistic difference between F. nucleatum interaction with the cancerous and non‐cancerous cells. F. nucleatum preferentially binds to the cancerous cells, aided by Annexin A1, which is specifically expressed in proliferating CRC cells. This is consistent with our previous report that, although F. nucleatum is detected in both colorectal adenoma and adenocarcinoma tissues, the fadA gene levels are significantly higher in the latter than the former 12. Whereas F. nucleatum may not alter pre‐cancerous cells to cancer, once the benign cells become cancerous, they express elevated levels of Annexin A1, through which F. nucleatum activates the Wnt/β‐catenin signaling and stimulates growth. Based on these results, we propose a “two‐hit” model in colorectal carcinogeneis (Fig 9), with the accumulation of host driver mutation(s), e.g., increased expression of Annexin A1, serving as the first “hit”, and microbes, e.g., F. nucleatum, as the second “hit” to exacerbate cancer progression. This model extends the well known “adenoma‐carcinoma” model 38 identifying microbes as facilitators for CRC.
Figure 9. A “two‐hit” model for CRC progression stimulated by F. nucleatum .
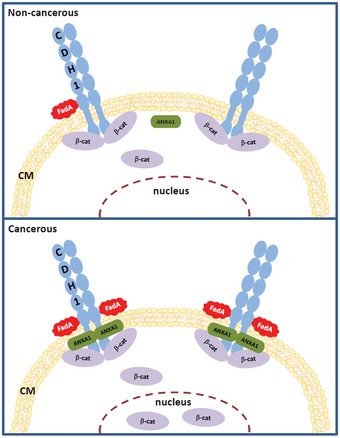
In non‐cancerous cells (top panel), there is low level of Annexin A1 (ANXA1) and weak binding of FadA to E‐cadherin (CDH1). In cancerous cells (bottom panel), Annexin A1 level increases, FadA binding enhances, FadA–E‐cadherin–Annexin A1–β‐catenin complex forms, β‐catenin is activated, resulting in acceleration of cancer progression. CM, cell membrane.
In support of the “two‐hit” model, previous studies have reported microbes promoting cancer in predisposed hosts, i.e., after the “first hit” has occurred. For instance, enterotoxigenic Bacteroides fragilis and colibactin‐producing E. coli are significantly enriched in the colonic mucus of individuals with familial adenomatous polyposis (FAP), who are prone to developing CRC. These two microorganisms collaboratively enhance early tumorigenesis and mortality in the Apc min/+ mouse model 39. Salmonella enterica serovar Typhi has been recognized as a significant risk factor for gallbladder cancer. It induces tumorigenesis in the Apc min/+ mouse model and malignant transformation in predisposed murine gallbladder organoids 40. Although the virulence factors involved and the affected host signaling pathways may differ between the microbes and types of cancer, one commonality of the reported microbial‐driven carcinogenesis is the predisposed host.
In the case of F. nucleatum, stimulation of CRC is through an E‐cadherin‐mediated, positive feedback loop of FadA and Annexin A1, which is uniquely present in the cancerous cells, absent in the non‐cancerous cells. Increased expression of Annexin A1 in the proliferating cancer cells enhances F. nucleatum binding, which in turn stimulates Annexin A1 expression and further enhances F. nucleatum binding and activates β‐catenin signaling. We speculate that FadA binding to E‐cadherin recruits Annexin A1 to the membrane to form a more stable complex, which may reduce cytoplasmic content of Annexin A1 thus stimulate compensatory overexpression of Annexin A1.
Our study elucidates Annexin A1 as a previously unrecognized modulator of Wnt/β‐catenin signaling and a key growth factor of CRC. It is also a novel biomarker for colon cancer recurrence, independent of cancer stage, grade, age, and sex. Our study explains why CRC complicated with F. nucleatum has worse prognosis. Annexin A1 may be used in combination with cancer stage to improve the prognostic stratification of colon cancer patients. Approximately 75% of CRC are caused by mutations in the Wnt/β‐catenin pathway 41. However, Wnt/β‐catenin signaling is involved in a broad spectrum of cellular functions. Due to such complexity, so far no Wnt inhibitors have received FDA approval for cancer treatment 42. Similarly, E‐cadherin, through which F. nucleatum stimulates CRC 12, is also ubiquitous, rendering it an unsuitable therapeutic target, either. In contrast, Annexin A1, due to its selective expression in proliferating cancerous cells, is a promising therapeutic target. Inhibition of Annexin A1 suppresses β‐catenin signaling in cancerous cells without affecting the non‐cancerous cells, thus may have less adverse “off‐target” effects.
F. nucleatum causes chemo‐resistance in CRC and promotes metastasis 14, 19, imposing a significant challenge to treatment. Antibiotic treatment is not desirable due to the risk of affecting the entire flora. A recent study indicates that Annexin A1 confers chemo‐resistance in CRC 43. It may be possible that F. nucleatum induces chemo‐resistance through activating Annexin A1. Hence, Annexin A1 may be a target for overcoming chemo‐resistance.
In short, to the best of our knowledge, this is the first study detailing the molecular mechanism of Annexin A1 in cancer and its interaction with cancer‐stimulating microorganism. Given the broad implication of Wnt/β‐catenin in cancer, and increasing numbers of reports of F. nucleatum in different types of cancer, Annexin A1 may be a novel therapeutic target for various cancers implicated with F. nucleatum. In addition, although Annexin A1 was identified through its interaction with F. nucleatum, we have demonstrated that it is a CRC growth factor independent of the microorganism. Its expression in other cancer types has been detected (Fig EV1A). Future studies will examine the role of Annexin A1 in different cancer types with or without F. nucleatum. Finally, our results of the cell‐density‐dependent expression of oncogenes suggest that subconfluent cells are useful for studying cancer gene regulations.
Materials and Methods
Bacterial strains and cell cultures
E. coli DH5α was grown at 37°C in LB broth in air. Wild‐type F. nucleatum 12230 and its fadA‐deletion mutant US1 were grown at 37°C in Columbia broth supplemented with 5 μg/ml hemin and 1 μg/ml menadione under anaerobic condition. To prepare CFSE‐labeled F. nucleatum, the bacteria were incubated with 5‐(and‐6)‐carboxyfluorescein diacetate succinimidyl ester (CFSE; Invitrogen, Grand Island, NY), followed by enumeration on the blood agar plates. Cell cultures AA/C1 (aka C1), AA/C1/SB (aka SB), AA/C1/SB/10C (aka 10C), HCT116, DLD1, SW480, HT29, RKO, PC‐9, 22RV1, UMUC3, and MCF‐7 were maintained as previously described 12, 32.
Plasmid construction and DNA/RNA transfections
Full‐length ANXA1 was amplified by PCR using primers listed in Table EV1 and cloned in to pcDNA™3.1 (+) Mammalian Expression Vector. Plasmid transfection was performed using Lipofectamine 2000 (Invitrogen, CA) following the manufacturer's instructions. Control siRNA, ANXA1‐specific siRNA, and CDH1‐specific siRNA were purchased from Invitrogen. Transfection of siRNA was performed using Lipofectamine RNAiMAX (Invitrogen) following the manufacturer's instructions.
Protein purification and conjugation
FadAc and mFadA were purified as previously described 22. To conjugate, FadAc, mFadA, and BSA (MP Biomedicals, Santa Ana, CA) were mixed with Alexa Fluor™ 488 tetrafluorophenyl (TFP) ester (Invitrogen). Following reaction, unconjugated Alexa Fluor™ 488 TFP was removed using the PD‐10 Desalting Column (GE Healthcare Life Sciences, Buckinghamshire, UK). The amount of labeled protein was quantified using a spectrophotometer (NanoDrop Technologies, Wilmington, DE).
Cell proliferation assay
Cells were seeded in 24‐well plates and were untreated or incubated with bacteria at an MOI 1,000:1. The media were replaced, and fresh bacteria were added every 48 h. Cells were trypsinized, and cell numbers were counted using a hemocytometer as previously described 12. Each experiment was performed in triplicate and repeated at least three times.
Cell culture attachment and invasion assay
The assay was performed as previously described 44. Briefly, host cells were seeded in 24‐well plates and allowed to grow till 80% confluent. The bacteria were then added at an MOI 50:1 followed by incubation for 1 h. Following washes with PBS and lysis with water, serial dilutions of the lysates were plated onto blood agar plates to enumerate the viable bacterial counts. For the invasion assay, bacteria were incubated with the host cells for 3 h followed by treatment with 300 μg/ml gentamicin and 200 μg/ml metronidazole for 1 h. After washes with PBS, the cells were lysed with water and intracellular bacterial counts were determined as described above. The levels of attachment and invasion were expressed as the percentage of bacteria recovered following cell lysis relative to the total number of bacteria initially added. Each experiment was performed in triplicate and repeated at least three times.
Flow cytometry
Cells were incubated with F. nucleatum or purified FadA for indicated time periods. After washing with PBS, the cells were collected and fixed with 75% cold ethanol. The cells were blocked with 2% skim milk followed by incubation with rabbit anti‐Annexin A1 polyclonal IgG (Invitrogen), or rabbit anti‐β‐catenin polyclonal IgG (Invitrogen), or rabbit IgG isotype control (Invitrogen). The cells were then incubated with Alexa Fluor® 700‐conjugated goat anti‐rabbit IgG (Invitrogen), and the flow cytometric data were acquired by a BD LSR II flow cytometer and analyzed using FlowJo software (Tree Star, San Carlos, CA).
Clinical specimens
This study was approved by the Internal Review Board of Columbia University. A total of 18 CRC cases were retrieved from files at the Department of Pathology at Columbia University Medical Center. Hematoxylin and eosin (H&E) slides were reviewed to confirm the presence of colorectal adenocarcinoma. Frozen sections of the paired tumor and normal tissues were obtained for DNA/RNA extraction and immunofluorescent staining.
DNA and RNA extraction and real‐time quantitative PCR (qPCR)
RNA was extracted from cultured cells using QIAGEN RNeasy Mini Kit. All Prep DNA/RNA Mini Kit was used to extract DNA and RNA from normal and tumor tissues from mice and clinical specimens. DNA and RNA concentrations were measured using NanoDrop ND 1000 spectrophotometer. Reverse transcription was performed using Superscript IV First‐Strand Synthesis System (Invitrogen) following the manufacturer's instructions. Real‐time qPCR was performed in StepOnePlus (Applied Biosystems, CA) in duplicates using primers listed in Table EV1. To quantify gene copies, standard curves using plasmids carrying 16S rRNA gene or fadA gene were generated. For RNA, data were analyzed using the 2(−ΔΔCt) method 45 and normalized to the β‐actin control.
Immunofluorescent staining
Cells seeded into Nunc Lab‐Tek II Chamber Slide System (Thermo Fisher Scientific, Waltham, MA) were incubated with CFSE‐labeled F. nucleatum or Alexa Fluor™ 488‐conjugated FadAc, mFadA, and BSA for indicated time periods. Following washes, the cells were fixed with 4% paraformaldehyde. After blocking with 2% skim milk and 0.3% Triton X‐100, the cells were incubated with goat anti‐human E‐cadherin polyclonal antibodies (R&D Systems, MN) and rabbit anti‐Annexin A1 polyclonal antibodies (Invitrogen) or rabbit anti‐β‐catenin polyclonal IgG (Invitrogen). After washing, the cells were incubated with Cy3‐conjugated donkey anti‐goat IgG (Jackson ImmunoResearch, West Grove, PA) and Alexa Fluor® 680‐conjugated donkey anti‐rabbit IgG (Invitrogen), washed, and covered in mounting medium containing DAPI (Vector Laboratories, Burlingame, CA). The samples were visualized with a Nikon Ti Eclipse inverted microscope for scanning confocal microscopy.
For immunofluorescent staining of human colonic specimens, frozen sections of the paired tumor and normal tissues were fixed in 4% paraformaldehyde for 15 min, and permeabilized using 0.1% Triton X‐100 in PBS followed by blocking of non‐specific binding. The slides were then incubated with rabbit anti‐Annexin A1 polyclonal antibodies (Thermo Fisher Scientific) and mouse anti‐FadA monoclonal antibody 5G11 22, or with isotype controls of rabbit IgG (Invitrogen) and mouse IgG (R&D Systems, Minneapolis, MN). After washes, the slides were incubated with Alexa Fluor® 680‐conjugated donkey anti‐rabbit (Invitrogen) and Alexa Fluor® 555‐conjugated goat anti‐mouse (Invitrogen), washed, and covered in mounting medium containing DAPI. The slides were visualized as above.
Western‐blot analysis
RKO cells transfected with ANXA1 expression vector or expression vector alone were seeded in 6‐well plates and grown for 2 days. The cells were washed with ice‐cold PBS and lysed with RIPA lysis buffer (EMD Millipore, Burlington, MA) containing Halt™ Protease and Phosphatase Inhibitor Single‐Use Cocktail (Thermo Fisher Scientific). The cell lysates were centrifuged at 13,000 × g for 10 min at 4°C, and the protein concentration was measured using the BCA Protein Assay Kit (Thermo Fisher Scientific) according to the manufacturer's instructions. One microgram of total proteins was separated by NuPAGE™ 4‐12% Bis‐Tris Gel (Thermo Fisher Scientific) and transferred onto PVDF membranes (Bio‐Rad, Hercules, CA). The membrane was blocked with 5% skim milk in TBS containing 0.1% Tween‐20 (TBST) at room temperature for 1 h followed by incubation with antibodies against Annexin A1 (Thermo Fisher Scientific, 71‐3400, 1:4,000 dilution), Cyclin D1 (Thermo Fisher, Cat No 701421, 1:250 dilution), β‐catenin (Thermo Fisher Scientific, 71‐2700, 1:2,000 dilution), or β‐actin (Abcam, ab6276, 1:4,000 dilution) in 0.5% skim milk in TBST at 4°C overnight. After washing three times with TBST, the membrane was incubated with HRP‐conjugated secondary antibody in TBST at room temperature for 1 h. The immune reactive bands were detected with ECL Western Blotting Substrate (Thermo Fisher Scientific).
Co‐immunoprecipitation
DLD1 cells were incubated with 1 mg/ml of FadAc for 0, 15, and 120 min, respectively. Rabbit anti‐Annexin A1 antibody (Thermo Fisher Scientific), mouse anti‐FadA antibody 5G11 22, rabbit IgG, or mouse IgG were bound covalently to the agarose resins using the Pierce Co‐Immunoprecipitation Kit (Thermo Fisher Scientific) following the manufacturer's instructions. The cells were lysed and mixed with the antibody‐coupled resins and incubated for 2 h at room temperature. Following washes, the complex bound to the antibodies was eluted and examined by Western blot analysis as described above. Following electrophoresis and transfer, the PVDF membranes were incubated with rabbit anti‐Annexin A1 polyclonal antibodies (Thermo Fisher Scientific), mouse anti‐FadA monoclonal antibodies 7H7, rabbit anti‐E‐cadherin monoclonal antibodies (Cell Signaling Technology), mouse anti‐β‐actin monoclonal antibodies (Cell Signaling Technology), or rabbit anti‐β‐catenin polyclonal antibodies (Thermo Fisher Scientific). After washes, the membranes were incubated with HRP‐conjugated goat anti‐rabbit IgG antibodies (Bio‐Rad) or Poly‐HRP‐conjugated goat anti‐mouse IgG antibodies (Thermo Fisher Scientific). The membranes were washed and incubated with SuperSignal West Pico Chemiluminescent Substrate (Thermo Fisher Scientific) and the bands were detected using ChemiDoc MP Imaging System (Bio‐Rad).
Apc min/+ mouse model
The animal protocol was approved by the Columbia University Institutional Animal Care and Use Committee (New York, NY). All mice were kept in sterilized filtered‐topped cages in a room with 12‐h light cycle, fed autoclaved food and water ad libitum, and handled in a laminar flow hood. Prior to bacterial inoculation, the mice (both male and female) were provided with antibiotic‐supplemented drinking water for 2 weeks. Bacteria cultures were re‐suspended in PBS to an estimated density of 2 × 10¹⁰ CFU/ml. An aliquot of 50 μl of the bacterial suspension was gavaged three times a week for 8 weeks. At the end of the treatment, animals were sacrificed and the tumors in the colon were counted. Tumors and normal intestinal tissues were collected for histological analysis and extraction of DNA and RNA.
Tumor xenografts
Four‐week‐old female nude mice were purchased from Taconic Biosciences (NY, USA). An inoculum of 1 × 10⁷ HCT116 or DLD1 cells treated with either control or ANXA1‐specific siRNA was injected subcutaneously and bilaterally into the nude mice, with control cells injected on the left side and ANXA1‐knockdown cells on the right side. After 7–9 days, the tumor length and width were measured using calipers and tumor volumes were calculated using the following formula: Volume = (width)2 × length/2. The results are expressed as percentage of the size of the control siRNA‐transfected tumor.
Statistical analysis
The differences between groups were examined by two‐tailed t‐test, and one‐way or two‐way ANOVA followed by the Student–Newman–Keuls (SNK) tests. P < 0.05 was considered statistically significant.
Statistical analysis of associations between exposure to F. nucleatum and up‐regulation of ANXA1 mRNA expression levels in colon cancer cell HT29
The relationship between exposure of colon cancer cells to F. nucleatum and up‐regulation of ANXA1 mRNA expression levels was investigated in an RNA‐sequencing (RNA‐seq) dataset publicly available from the NCBI‐GEO online repository (GSE90944) and containing global gene‐expression measurements from HT29 cells, both at baseline and following infection with F. nucleatum, in triplicates 14. The distribution of ANXA1 mRNA expression levels in the two sample groups (baseline versus infected) was visualized using boxplots, using the log2 of their TPM (transcripts per million) expression values as a metric. Differences in mean log2 TPM values between HT29 cells at baseline (n = 3) and following incubation with F. nucleatum (n = 3) were tested for statistical significance using a two‐tailed t‐test for continuous variables.
Statistical analysis of associations between ANXA1 expression levels and survival outcomes in colon cancer patients
The relationship between ANXA1 mRNA expression levels and disease‐free survival (DFS) was investigated in a database of 466 primary colon carcinomas, assembled by pooling four independent gene‐expression microarray datasets downloaded from the NCBI‐GEO online repository (GSE14333, GSE17538, GSE31595, GSE37892), as previously described 34. To evaluate whether differences in ANXA1 mRNA expression levels between different tumor samples might have been grossly distorted by differences in each sample's relative content of epithelial cells (i.e., tumor cell density), ANXA1 mRNA expression levels (Affymetrix probe: 201012_at) were plotted against those of an epithelial‐specific reference marker, such as DSP (Desmoplakin; Affymetrix probe: 200606_at), and visually inspected to exclude meaningful correlations. The association between ANXA1 mRNA expression levels and DFS was visualized using Kaplan–Meier survival curves, after patient stratification in groups with high, medium and low ANXA1 expression levels, using three different methods: (i) based on the median of ANXA1 expression levels (bottom 50% versus top 50%); (ii) based on the quartile distribution of ANXA1 expression levels (bottom 25% versus middle 50% versus top 25%); and (iii) based on ANXA1 expression thresholds calculated using the StepMiner algorithm (low versus high), and adopting as definition of the boundary between low and high levels, the log2 value of ANXA1 normalized expression levels corresponding to StepMiner + 0.5, as previously described 35, 36. Differences in survival rates between patient subgroups were tested for statistical significance using the log‐rank test. The association between high levels of ANXA1 mRNA expression and increased risk of recurrence was also tested using univariate and multivariate analyses based on the Cox proportional hazards method, in which ANXA1 mRNA expression levels were modeled as a continuous variable. The analyses were first conducted across the whole database (n = 466) and subsequently in the subset of patients that were also annotated with the pathological grading of the respective tumors (n = 216), as previously described 34. The multivariate analysis was aimed at excluding possible confounding effects from clinical stage, pathological grade, age, or sex. Hazard ratios (HRs) were tested for statistical significance (null hypothesis: HR=1) using the Wald test.
Author contributions
YWH conceived, designed, and supervised the study. MRR, JEB, RPH, WJR, DS, and PD performed the study. SML provided clinical specimens. YWH, MRR, JEB, SML, PD, and TCW interpreted the results. YWH, MRR, JEB, and PD wrote the manuscript.
Conflict of interest
P.D. receives royalties and/or stocks from OncoMed Pharmaceuticals, Inc., Quanticel Pharmaceuticals, Inc. (now a fully owned subsidiary of Celgene), and Forty Seven, Inc. as a co‐inventor of several patents and patent applications.
Supporting information
Expanded View Figures PDF
Table EV1
Movie EV1
Source Data for Expanded View
Review Process File
Source Data for Figure 5
Source Data for Figure 8
Acknowledgements
We thank Dr. Ann C. Williams for generously providing the AA/C1, AA/C1/SB, and AA/C1/SB/10C cell lines, Dr. Swarnali Acharyya for the PC‐9 cell line, and Dr. Cory T. Abate‐Shen for the 22RV1 and UMUC3 cell lines. This work was supported in part by NIH grants RO1CA192111 to Y.W.H. and T.C.W., and RO1DE014924 and RO1DE023332 to Y.W.H., as well as Damon Runyon‐Rachleff Innovation Award DRR‐44‐16 from the Damon Runyon Cancer Research Foundation to P.D. Images were collected, and image processing and analysis for this work were performed in the Confocal and Specialized Microscopy Shared Resource of the Herbert Irving Comprehensive Cancer Center at Columbia University, supported by NIH grant # P30 CA013696.
EMBO Reports (2019) 20: e47638
References
- 1. ACS (2012) Cancer Facts & Figures 2012. In pp 1–66. American Cancer Society (ACS)
- 2. Vogelstein B, Kinzler KW (1993) The multistep nature of cancer. Trends Genet 9: 138–141 [DOI] [PubMed] [Google Scholar]
- 3. Abreu MT, Peek RM Jr (2014) Gastrointestinal malignancy and the microbiome. Gastroenterology 146: 1534–1546.e3 [DOI] [PMC free article] [PubMed] [Google Scholar]
- 4. Akkari L, Gocheva V, Kester JC, Hunter KE, Quick ML, Sevenich L, Wang HW, Peters C, Tang LH, Klimstra DS et al (2014) Distinct functions of macrophage‐derived and cancer cell‐derived cathepsin Z combine to promote tumor malignancy via interactions with the extracellular matrix. Genes Dev 28: 2134–2150 [DOI] [PMC free article] [PubMed] [Google Scholar]
- 5. Schwabe RF, Jobin C (2013) The microbiome and cancer. Nat Rev Cancer 13: 800–812 [DOI] [PMC free article] [PubMed] [Google Scholar]
- 6. Dulal S, Keku TO (2014) Gut microbiome and colorectal adenomas. Cancer J 20: 225–231 [DOI] [PMC free article] [PubMed] [Google Scholar]
- 7. Keku TO, Dulal S, Deveaux A, Jovov B, Han X (2015) The gastrointestinal microbiota and colorectal cancer. Am J Physiol Gastrointest Liver Physiol 308: G351–G363 [DOI] [PMC free article] [PubMed] [Google Scholar]
- 8. Keku TO, McCoy AN, Azcarate‐Peril AM (2013) Fusobacterium spp. and colorectal cancer: cause or consequence? Trends Microbiol 21: 506–508 [DOI] [PMC free article] [PubMed] [Google Scholar]
- 9. McCoy AN, Araujo‐Perez F, Azcarate‐Peril A, Yeh JJ, Sandler RS, Keku TO (2013) Fusobacterium is associated with colorectal adenomas. PLoS ONE 8: e53653 [DOI] [PMC free article] [PubMed] [Google Scholar]
- 10. Kostic AD, Chun E, Robertson L, Glickman JN, Gallini CA, Michaud M, Clancy TE, Chung DC, Lochhead P, Hold GL et al (2013) Fusobacterium nucleatum potentiates intestinal tumorigenesis and modulates the tumor‐Immune microenvironment. Cell Host Microbe 14: 207–215 [DOI] [PMC free article] [PubMed] [Google Scholar]
- 11. Kostic AD, Gevers D, Pedamallu CS, Michaud M, Duke F, Earl AM, Ojesina AI, Jung J, Bass AJ, Tabernero J et al (2012) Genomic analysis identifies association of Fusobacterium with colorectal carcinoma. Genome Res 22: 292–298 [DOI] [PMC free article] [PubMed] [Google Scholar]
- 12. Rubinstein MR, Wang X, Liu W, Hao Y, Cai G, Han YW (2013) Fusobacterium nucleatum promotes colorectal carcinogenesis by modulating E‐cadherin/β‐catenin signaling via its FadA adhesin. Cell Host Microbe 14: 195–206 [DOI] [PMC free article] [PubMed] [Google Scholar]
- 13. Gur C, Ibrahim Y, Isaacson B, Yamin R, Abed J, Gamliel M, Enk J, Bar‐On Y, Stanietsky‐Kaynan N, Coppenhagen‐Glazer S et al (2015) Binding of the Fap2 protein of Fusobacterium nucleatum to human inhibitory receptor TIGIT protects tumors from immune cell attack. Immunity 42: 344–355 [DOI] [PMC free article] [PubMed] [Google Scholar]
- 14. Yu T, Guo F, Yu Y, Sun T, Ma D, Han J, Qian Y, Kryczek I, Sun D, Nagarsheth N et al (2017) Fusobacterium nucleatum promotes chemoresistance to colorectal cancer by modulating autophagy. Cell 170: 548–563 e16 [DOI] [PMC free article] [PubMed] [Google Scholar]
- 15. Tahara T, Yamamoto E, Suzuki H, Maruyama R, Chung W, Garriga J, Jelinek J, Yamano HO, Sugai T, An B et al (2014) Fusobacterium in colonic flora and molecular features of colorectal carcinoma. Can Res 74: 1311–1318 [DOI] [PMC free article] [PubMed] [Google Scholar]
- 16. Mima K, Cao Y, Chan AT, Qian ZR, Nowak JA, Masugi Y, Shi Y, Song M, da Silva A, Gu M et al (2016) Fusobacterium nucleatum in colorectal carcinoma tissue according to tumor location. Clin Transl Gastroenterol 7: e200 [DOI] [PMC free article] [PubMed] [Google Scholar]
- 17. Yu J, Chen Y, Fu X, Zhou X, Peng Y, Shi L, Chen T, Wu Y (2016) Invasive Fusobacterium nucleatum may play a role in the carcinogenesis of proximal colon cancer through the serrated neoplasia pathway. Int J Cancer 139: 1318–1326 [DOI] [PubMed] [Google Scholar]
- 18. Mima K, Nishihara R, Qian ZR, Cao Y, Sukawa Y, Nowak JA, Yang J, Dou R, Masugi Y, Song M et al (2016) Fusobacterium nucleatum in colorectal carcinoma tissue and patient prognosis. Gut 65: 1973–1980 [DOI] [PMC free article] [PubMed] [Google Scholar]
- 19. Bullman S, Pedamallu CS, Sicinska E, Clancy TE, Zhang X, Cai D, Neuberg D, Huang K, Guevara F, Nelson T et al (2017) Analysis of Fusobacterium persistence and antibiotic response in colorectal cancer. Science 358: 1443–1448 [DOI] [PMC free article] [PubMed] [Google Scholar]
- 20. Flanagan L, Schmid J, Ebert M, Soucek P, Kunicka T, Liska V, Bruha J, Neary P, Dezeeuw N, Tommasino M et al (2014) Fusobacterium nucleatum associates with stages of colorectal neoplasia development, colorectal cancer and disease outcome. Eur J Clin Microbiol Infect Dis 33: 1381–1390 [DOI] [PubMed] [Google Scholar]
- 21. Abed J, Emgard JE, Zamir G, Faroja M, Almogy G, Grenov A, Sol A, Naor R, Pikarsky E, Atlan KA et al (2016) Fap2 mediates Fusobacterium nucleatum colorectal adenocarcinoma enrichment by binding to tumor‐expressed Gal‐GalNAc. Cell Host Microbe 20: 215–225 [DOI] [PMC free article] [PubMed] [Google Scholar]
- 22. Xu M, Yamada M, Li M, Liu H, Chen SG, Han YW (2007) FadA from Fusobacterium nucleatum utilizes both secreted and nonsecreted forms for functional oligomerization for attachment and invasion of host cells. J Biol Chem 282: 25000–25009 [DOI] [PubMed] [Google Scholar]
- 23. Gerke V, Moss SE (2002) Annexins: from structure to function. Physiol Rev 82: 331–371 [DOI] [PubMed] [Google Scholar]
- 24. Guo C, Liu S, Sun MZ (2013) Potential role of Anxa1 in cancer. Fut Oncol 9: 1773–1793 [DOI] [PubMed] [Google Scholar]
- 25. Boudhraa Z, Bouchon B, Viallard C, D'Incan M, Degoul F (2016) Annexin A1 localization and its relevance to cancer. Clin Sci 130: 205–220 [DOI] [PubMed] [Google Scholar]
- 26. Su N, Xu XY, Chen H, Gao WC, Ruan CP, Wang Q, Sun YP (2010) Increased expression of annexin A1 is correlated with K‐ras mutation in colorectal cancer. Tohoku J Exp Med 222: 243–250 [DOI] [PubMed] [Google Scholar]
- 27. Duncan R, Carpenter B, Main LC, Telfer C, Murray GI (2008) Characterisation and protein expression profiling of annexins in colorectal cancer. Br J Cancer 98: 426–433 [DOI] [PMC free article] [PubMed] [Google Scholar]
- 28. Shimoyama Y, Nagafuchi A, Fujita S, Gotoh M, Takeichi M, Tsukita S, Hirohashi S (1992) Cadherin dysfunction in a human cancer cell line: possible involvement of loss of alpha‐catenin expression in reduced cell‐cell adhesiveness. Can Res 52: 5770–5774 [PubMed] [Google Scholar]
- 29. Tiang JM, Butcher NJ, Cullinane C, Humbert PO, Minchin RF (2011) RNAi‐mediated knock‐down of arylamine N‐acetyltransferase‐1 expression induces E‐cadherin up‐regulation and cell‐cell contact growth inhibition. PLoS ONE 6: e17031 [DOI] [PMC free article] [PubMed] [Google Scholar]
- 30. Luo Y, Zhu YT, Ma LL, Pang SY, Wei LJ, Lei CY, He CW, Tan WL (2016) Characteristics of bladder transitional cell carcinoma with E‐cadherin and N‐cadherin double‐negative expression. Oncol Lett 12: 530–536 [DOI] [PMC free article] [PubMed] [Google Scholar]
- 31. Chao YL, Shepard CR, Wells A (2010) Breast carcinoma cells re‐express E‐cadherin during mesenchymal to epithelial reverting transition. Mol Cancer 9: 179 [DOI] [PMC free article] [PubMed] [Google Scholar]
- 32. Williams AC, Harper SJ, Paraskeva C (1990) Neoplastic transformation of a human colonic epithelial cell line: in vitro evidence for the adenoma to carcinoma sequence. Can Res 50: 4724–4730 [PubMed] [Google Scholar]
- 33. Roth U, Razawi H, Hommer J, Engelmann K, Schwientek T, Muller S, Baldus SE, Patsos G, Corfield AP, Paraskeva C et al (2010) Differential expression proteomics of human colorectal cancer based on a syngeneic cellular model for the progression of adenoma to carcinoma. Proteomics 10: 194–202 [DOI] [PubMed] [Google Scholar]
- 34. Dalerba P, Sahoo D, Paik S, Guo X, Yothers G, Song N, Wilcox‐Fogel N, Forgo E, Rajendran PS, Miranda SP et al (2016) CDX2 as a prognostic biomarker in stage II and stage III colon cancer. N Engl J Med 374: 211–222 [DOI] [PMC free article] [PubMed] [Google Scholar]
- 35. Dalerba P, Kalisky T, Sahoo D, Rajendran PS, Rothenberg ME, Leyrat AA, Sim S, Okamoto J, Johnston DM, Qian D et al (2011) Single‐cell dissection of transcriptional heterogeneity in human colon tumors. Nat Biotechnol 29: 1120–1127 [DOI] [PMC free article] [PubMed] [Google Scholar]
- 36. Sahoo D, Dill DL, Tibshirani R, Plevritis SK (2007) Extracting binary signals from microarray time‐course data. Nucleic Acids Res 35: 3705–3712 [DOI] [PMC free article] [PubMed] [Google Scholar]
- 37. Fardini Y, Wang X, Temoin S, Nithianantham S, Lee D, Shoham M, Han YW (2011) Fusobacterium nucleatum adhesin FadA binds vascular endothelial cadherin and alters endothelial integrity. Mol Microbiol 82: 1468–1480 [DOI] [PMC free article] [PubMed] [Google Scholar]
- 38. Fearon ER, Vogelstein B (1990) A genetic model for colorectal tumorigenesis. Cell 61: 759–767 [DOI] [PubMed] [Google Scholar]
- 39. Dejea CM, Fathi P, Craig JM, Boleij A, Taddese R, Geis AL, Wu X, DeStefano Shields CE, Hechenbleikner EM, Huso DL et al (2018) Patients with familial adenomatous polyposis harbor colonic biofilms containing tumorigenic bacteria. Science 359: 592–597 [DOI] [PMC free article] [PubMed] [Google Scholar]
- 40. Scanu T, Spaapen RM, Bakker JM, Pratap CB, Wu LE, Hofland I, Broeks A, Shukla VK, Kumar M, Janssen H et al (2015) Salmonella manipulation of host signaling pathways provokes cellular transformation associated with gallbladder carcinoma. Cell Host Microbe 17: 763–774 [DOI] [PubMed] [Google Scholar]
- 41. Novellasdemunt L, Antas P, Li VS (2015) Targeting Wnt signaling in colorectal cancer. A review in the theme: cell signaling: proteins, pathways and mechanisms. Am J Physiol Cell Physiol 309: C511–C521 [DOI] [PMC free article] [PubMed] [Google Scholar]
- 42. Krishnamurthy N, Kurzrock R (2018) Targeting the Wnt/beta‐catenin pathway in cancer: update on effectors and inhibitors. Cancer Treat Rev 62: 50–60 [DOI] [PMC free article] [PubMed] [Google Scholar]
- 43. Onozawa H, Saito M, Saito K, Kanke Y, Watanabe Y, Hayase S, Sakamoto W, Ishigame T, Momma T, Ohki S et al (2017) Annexin A1 is involved in resistance to 5‐FU in colon cancer cells. Oncol Rep 37: 235–240 [DOI] [PubMed] [Google Scholar]
- 44. Han YW, Shi W, Huang GT, Kinder Haake S, Park NH, Kuramitsu H, Genco RJ (2000) Interactions between periodontal bacteria and human oral epithelial cells: Fusobacterium nucleatum adheres to and invades epithelial cells. Infect Immun 68: 3140–3146 [DOI] [PMC free article] [PubMed] [Google Scholar]
- 45. Livak KJ, Schmittgen TD (2001) Analysis of relative gene expression data using real‐time quantitative PCR and the 2(‐Delta Delta C(T)) Method. Methods 25: 402–408 [DOI] [PubMed] [Google Scholar]
Associated Data
This section collects any data citations, data availability statements, or supplementary materials included in this article.
Supplementary Materials
Expanded View Figures PDF
Table EV1
Movie EV1
Source Data for Expanded View
Review Process File
Source Data for Figure 5
Source Data for Figure 8


