

Vegetation and moisture play the most important roles in controlling daytime urban heat islands and their spatial variability.
Abstract
More than half of the world’s population now live in cities, which are known to be heat islands. While daytime urban heat islands (UHIs) are traditionally thought to be the consequence of less evaporative cooling in cities, recent work sparks new debate, showing that geographic variations of daytime UHI intensity were largely explained by variations in the efficiency with which urban and rural areas convect heat from the land surface to the lower atmosphere. Here, we reconcile this debate by demonstrating that the difference between the recent finding and the traditional paradigm can be explained by the difference in the attribution methods. Using a new attribution method, we find that spatial variations of daytime UHI intensity are more controlled by variations in the capacity of urban and rural areas to evaporate water, suggesting that strategies enhancing the evaporation capability such as green infrastructure are effective ways to mitigate urban heat.
INTRODUCTION
Urbanization is one of the most important human-induced changes in land use (1, 2), and a well-known consequence of urbanization is the urban heat island (UHI), referring to the phenomenon that cities are typically warmer than the surrounding rural areas (3, 4). The UHI effect has important implications for energy consumption, air quality, and urban ecosystems (5). It can also synergistically interact with heat waves (6) and increase morbidity and mortality risks (7).
The UHI intensity is typically defined as the temperature difference (ΔT) between the urban and the surrounding rural areas. This temperature difference can be based on either surface temperature or air temperature. In this study, we define the UHI based on the surface temperature and refer to the UHI as the “surface UHI.” An ongoing debate about the surface UHI is whether its spatial variability is controlled by the urban-rural contrast of “imperviousness” or “aerodynamics.” The traditional paradigm, reinforced by satellite observations (8, 9), is that the daytime UHI intensity is mainly caused by the urban-rural difference in vegetation cover or the fact that urban areas have higher fractions of impervious surface and, thus, lower rates of evaporative cooling (10–12). However, recent work found that spatial variations of daytime UHI intensity across North America were largely explained by variations in the efficiency with which urban and rural areas convect heat from the land surface to the lower atmosphere (13), which contradicts the traditional paradigm.
The efficiency with which urban and rural areas convect heat from the land surface to the lower atmosphere (13) is quantified by the so-called aerodynamic resistance, which is mainly controlled by both momentum and thermal roughness lengths (14). It is important to point out that aerodynamic resistance here refers to the resistance to heat transfer, not momentum transfer. The similarity and dissimilarity between heat and momentum transfer in the lower atmosphere have been extensively studied as reviewed elsewhere (15). It should also be stressed that, while aerodynamic resistance and roughness lengths are strongly related to urban geometry (e.g., building density), their exact relations are complicated. For example, a denser city, which may seemingly be “rougher,” does not necessarily imply a larger momentum roughness length or a smaller aerodynamic resistance (16).
Given the substantial implication of this debate for UHI mitigation, we examine the attribution method leading to the recent findings, the intrinsic biophysical mechanism (IBM) method (17). By attributing the UHI intensity to contributions from net radiation, aerodynamic resistance, the Bowen ratio, heat storage, and anthropogenic heat flux, the IBM method assumes that the Bowen ratio is independent of aerodynamic resistance (and also net radiation, heat storage, and anthropogenic heat flux). This independence assumption has been shown to lead to an overestimation of the aerodynamic resistance contribution to surface temperature change by 10 to 25% (18). In addition, the IBM method tends to underestimate the contributions of net radiation and heat storage during the daytime but overestimate them during the nighttime (19).
In this study, a new attribution method called the two-resistance mechanism (TRM) method is used (18, 19), which uses the surface resistance (mainly reflecting the control of soil moisture and vegetation cover on evapotranspiration) to replace the Bowen ratio as an attributing variable. We apply the TRM and IBM methods to offline simulations carried out with the Geophysical Fluid Dynamics Laboratory (GFDL) land model LM3 (20, 21) coupled with a newly developed and evaluated urban canopy model (UCM) (22, 23) and identify the controlling factors of spatial variability of daytime surface UHI intensity. Then, we discuss the implications of our study for reconciling the debate and urban heat mitigation.
RESULTS
Attribution of UHIs
Figure 1 shows the distribution and attribution of summer daytime UHI intensities of 60 cities across North America using the new TRM method under both current (1981 to 2000) and future (2081 to 2100) climates. We find similar modeled UHI intensities and attribution results using two different forcing datasets (Sheffield and GFDL), suggesting that the findings are robust to varying atmospheric input values. It is clear that under both historical and future climates, the dominant contributor to daytime UHI intensity is the urban-rural contrast of surface resistance, which is caused by the less soil moisture and vegetation in urban areas. This is true when we perform the attribution in three climate zones separately (fig. S1). In addition, urban areas reflect more radiation and store more energy, leading to cooling effects (i.e., negative contributions to UHI intensity) in the daytime. The stored energy is subsequently released at night (10–12) and contributes to the nighttime UHI effect (fig. S2). We caution that the daytime cooling effect from the increased urban albedo depends on the effective urban and rural albedo values used in the climate model (table S1). The effective urban albedo value further depends on the assumed albedo value of each urban facet and the urban geometry (22, 23) provided by a global dataset (24).
Fig. 1. Distribution and attribution of summer daytime surface UHIs across North America.
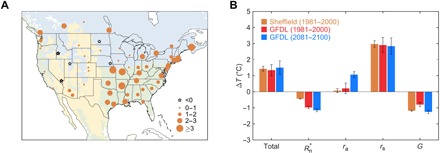
(A) Distribution of simulated surface UHIs across 60 cities using the Sheffield forcing in 1981–2000: continental region (16 cities; blue), arid region (10 cities; yellow), and temperate region (34 cities; green). (B) Attribution of surface UHIs in current and future climates to different biophysical factors using the TRM method. , ra, rs, and G represent contributions from net radiation, aerodynamic resistance, surface resistance, and heat storage, respectively. “Total” represents the sum of four contributions.
Compared to the historical period, the daytime cooling effect of radiation and heat storage is enhanced under future climate (2081 to 2100) as urban areas continue to expand (Fig. 1). The contribution of aerodynamic resistance also increases. This is because in the simulations, the urban geometry (including the building height) is assumed to be invariant with time, but the vegetation dynamically responds to the warming climate. As a result, the aerodynamic resistance of rural areas gradually decreases, which positively contributes to the UHI intensity. Despite the increase in the aerodynamic resistance contribution under future climate, the larger surface resistance of urban areas, again indicating that urban areas have less soil moisture and vegetation cover, remains the most important factor contributing to the daytime UHI intensity.
The impacts of local background climate on UHIs
The relationship between the daytime ΔT and precipitation for the 60 cities across North America is shown in Fig. 2. Similar to the previous study (13), the annual mean daytime ΔT significantly increases with the annual mean precipitation (Fig. 2A), suggesting strong impacts of local background climate on UHIs. When the IBM method is used, the variations of daytime UHI intensity with respect to precipitation are predominately explained by the variations in the efficiency with which urban and rural areas convect heat to the lower atmosphere (i.e., aerodynamic resistance) (Fig. 2B). That is, we reproduce the previous finding (13) when the IBM method is used, albeit with a vastly different climate model and a different analysis period.
Fig. 2. Relationship between precipitation and modeled daytime ΔT among cities.
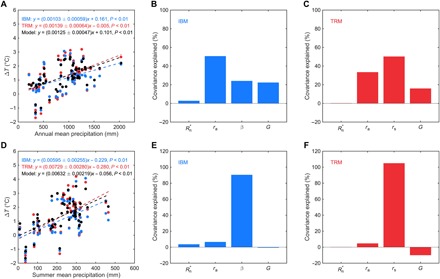
The top panels show annual mean results. The bottom panels show summer mean results. (A and D) The correlation between daytime ΔT and precipitation in 1981–2000. Dash lines are linear regression fits to ΔT from the climate model (black), ΔT from the IBM method (blue), and ΔT from the TRM method (red). Parameter bounds for the regression slope are the 95% confidence interval. (B, C, E, and F) ΔT-precipitation covariance explained by contributions from net radiation (), aerodynamic resistance (ra), the Bowen ratio (β for the IBM method) or surface resistance (rs for the TRM method), and heat storage G.
However, when the TRM method is used, the daytime ΔT-precipitation covariance is found to be more controlled by the capacity of urban and rural areas to evaporate water (i.e., surface resistance) (Fig. 2C). This implies that the UHI intensity in humid regions is larger because of denser vegetation and more evapotranspiration in rural areas rather than a relatively smoother urban land, as the previous finding (13) would indicate.
The correlation between the daytime ΔT and precipitation is found to be only positive and significant in summer (Fig. 2D), but negative and insignificant in winter (fig. S3). As a result, it is more desirable to examine the seasonal dependence of daytime ΔT on precipitation. When the attribution analysis is repeated for summer daytime ΔT, the contributions of the Bowen ratio in the IBM method and surface resistance in the TRM method are significantly increased and become the dominant control of the ΔT-precipitation covariance (Fig. 2, E and F). This finding holds under both historical and future climates (fig. S4) and is in agreement with the traditional paradigm.
The reason that the IBM method tends to favor the aerodynamic resistance explanation, even when applied to a different model and a different time period, is fundamentally tied to its assumption of independence between the Bowen ratio and aerodynamic resistance (18, 19). This highlights that the attribution of land use/land cover change–induced temperature anomalies requires the attributing variables to be independent of each other; otherwise, the conclusions will be nonunique and depend on the selected attributing variables. In addition, the fact that the IBM method identifies the Bowen ratio as the dominant control of the summer UHI variability but aerodynamic resistance as the dominant control of the annual UHI variability suggests that seasonality should be considered and attribution should be conducted at the appropriate time scale.
DISCUSSION
Accurate attribution of the urban-rural temperature difference to different biophysical factors improves our understanding of local temperature response to urbanization. Quantifying the relative importance of aerodynamics and imperviousness for UHIs is critical for designing urban mitigation and adaptation plans. Here, we demonstrate that spatial variations of daytime UHI intensity are controlled by variations in the capacity of urban and rural areas to evaporate water (i.e., imperviousness) instead of variations in the efficiency with which urban and rural areas convect heat into the lower atmosphere (i.e., aerodynamics). As a result, strategies that aim to enhance the evaporation capability of cities such as green roofs and green infrastructure are recommended.
While our study is focused on the surface UHI, another fundamental difference between imperviousness and aerodynamics is their opposing effects on the near-surface air UHI. Reduced aerodynamic resistance would enhance the efficiency with which the land surface convects heat into the lower atmosphere, thereby leading to a decrease in surface temperature but an increase in near-surface air temperature. On the other hand, decreased imperviousness would simultaneously reduce surface temperature and near-surface air temperature. Therefore, mitigation strategies enhancing the evaporation capability have the cobenefit of reducing the near-surface air UHI.
Given that the UHI is defined as the urban-rural temperature difference, it is also important to understand whether the spatial variation of UHI is induced by those of urban temperature or rural temperature, or a combination of both. Recent work found that the spatial correlation between the UHI and the local background precipitation mainly comes from the rural temperature rather than the urban temperature (25). Our results are consistent with this finding, as the local background precipitation strongly modulates soil moisture and meteorological conditions such as vapor pressure deficit, which are key factors controlling the surface resistance of rural vegetation (26).
A few important implications of our results need to be acknowledged. First, we use the subgrid-scale temperature outputs from offline land model simulations to characterize the surface UHI as in the previous study (13), which neglect the urban-atmosphere feedback. However, given the focus on the biophysical factors contributing to the surface UHI and the low spatial resolution of these simulations, the inclusion of urban-atmosphere feedback will likely not alter our conclusions qualitatively. Second, the simulations rely on the UCM recently implemented into the GFDL earth system model. While the UCM captures many important land surface and hydrological processes in urban areas, including the anthropogenic heat flux from building heating and cooling, it is a relatively simple parameterization of the complex urban system. For example, the anthropogenic heat flux is only implicitly considered, but it has been shown to play a small role in contributing to the daytime UHI intensity at such low spatial resolutions (13, 27). In addition, the impact of irrigation on the UHI intensity is not considered. Last, we stress that when the IBM method is applied to our simulated UHIs, the same finding as that of recent work (13) is obtained, suggesting that our new finding arises from the use of a new attribution method instead of a different climate model.
MATERIALS AND METHODS
Model simulations
The model used in this study is the GFDL land model LM3 (20, 21) coupled with a newly developed and evaluated UCM (22, 23). The LM3-UCM model is driven by atmospheric forcing from the GFDL earth system model (28–30) outputs (the GFDL forcing) or gridded datasets based on observations and reanalysis fields (the Sheffield forcing) (31). We conducted long-term simulations (from 1700 to 2100) over North America (20°N-55°N and 130°W-60°W), and we focused on the UHIs in the periods of 1981 to 2000 (historical) and 2081 to 2100 (future).
Attribution methods
We attributed the UHI intensity to contributions from different biophysical factors (i.e., net radiation, aerodynamic resistance, the Bowen ratio or surface resistance, and heat storage) based on two attribution methods: the IBM method (17) and the TRM method (18, 19). We separated the analysis into daytime and nighttime. The two models were optimized to reduce the root mean square error of the modeled ΔT before the attribution was applied (19).
Supplementary Material
Acknowledgments
Funding: This material is based upon work supported by the U.S. Army Research Office (grant no. W911NF-18-1-0360). This work was conducted when W.L. visited Boston University in 2017–2018, which was supported by the National Natural Science Foundation of China (grant no. 41671398) and the International Program for Ph.D. Candidates at Sun Yat-sen University. Author contributions: D.L. designed the study, performed the simulations, and wrote the manuscript. W.L. carried out the analysis and wrote the manuscript. A.J.R., X.L., and D.W. contributed ideas to the analysis. S.M. and E.S. contributed ideas to the model simulations. Competing interests: The authors declare that they have no competing interests. Data and materials availability: All data needed to evaluate the conclusions in the paper are present in the paper and/or the Supplementary Materials. Additional data related to this paper may be requested from the authors.
SUPPLEMENTARY MATERIALS
Supplementary material for this article is available at http://advances.sciencemag.org/cgi/content/full/5/4/eaau4299/DC1
Supplementary Text
Fig. S1. Distribution and attribution of summer daytime surface UHIs across North America.
Fig. S2. Distribution and attribution of summer nighttime surface UHIs across North America.
Fig. S3. Relationship between precipitation and daytime ΔT among 60 cities in winter.
Fig. S4. Relationship between precipitation and daytime ΔT among cities in summer.
Table S1. The selected cities in North America and the effective urban and rural albedo values for each city.
Table S2. The root mean square errors between ΔT from the climate model and those computed using the TRM method.
Reference (32)
REFERENCES AND NOTES
- 1.Zhou L., Dickinson R. E., Tian Y., Fang J., Li Q., Kaufmann R. K., Tucker C. J., Myneni R. B., Evidence for a significant urbanization effect on climate in China. Proc. Natl. Acad. Sci. U.S.A. 101, 9540–9544 (2004). [DOI] [PMC free article] [PubMed] [Google Scholar]
- 2.Kalnay E., Cai M., Impact of urbanization and land-use change on climate. Nature 423, 528–531 (2003). [DOI] [PubMed] [Google Scholar]
- 3.Grimmond S., Urbanization and global environmental change: Local effects of urban warming. Geogr. J. 173, 83–88 (2007). [Google Scholar]
- 4.Arnfield A. J., Two decades of urban climate research: A review of turbulence, exchanges of energy and water, and the urban heat island. Int. J. Climatol. 23, 1–26 (2003). [Google Scholar]
- 5.Grimm N. B., Faeth S. H., Golubiewski N. E., Redman C. L., Wu J., Bai X., Briggs J. M., Global change and the ecology of cities. Science 319, 756–760 (2008). [DOI] [PubMed] [Google Scholar]
- 6.Li D., Bou-Zeid E., Synergistic interactions between urban heat islands and heat waves: The impact in cities is larger than the sum of its parts. J. Appl. Meteor. Climatol. 52, 2051–2064 (2013). [Google Scholar]
- 7.Anderson G. B., Bell M. L., Heat waves in the United States: Mortality risk during heat waves and effect modification by heat wave characteristics in 43 U.S. communities. Environ. Health Perspect. 119, 210–218 (2011). [DOI] [PMC free article] [PubMed] [Google Scholar]
- 8.Peng S., Piao S., Ciais P., Friedlingstein P., Ottle C., Bréon F.-M., Nan H., Zhou L., Myneni R. B., Surface urban heat island across 419 global big cities. Environ. Sci. Technol. 46, 696–703 (2012). [DOI] [PubMed] [Google Scholar]
- 9.Imhoff M. L., Zhang P., Wolfe R. E., Bounoua L., Remote sensing of the urban heat island effect across biomes in the continental USA. Remote Sens. Environ. 114, 504–513 (2010). [Google Scholar]
- 10.Taha H., Urban climates and heat islands: Albedo, evapotranspiration, and anthropogenic heat. Energ. Buildings 25, 99–103 (1997). [Google Scholar]
- 11.Oke T. R., The energetic basis of the urban heat island. Q. J. Roy. Meteorol. Soc. 108, 1–24 (1982). [Google Scholar]
- 12.Carlson T. N., Boland F. E., Analysis of urban–rural canopy using a surface heat flux/temperature model. J. Appl. Meteorol. 17, 998–1013 (1978). [Google Scholar]
- 13.Zhao L., Lee X., Smith R. B., Oleson K., Strong contributions of local background climate to urban heat islands. Nature 511, 216–219 (2014). [DOI] [PubMed] [Google Scholar]
- 14.J. R. Garratt, The Atmospheric Boundary Layer (Cambridge Univ. Press, 1994). [Google Scholar]
- 15.W. Brutsaert, Evaporation into the Atmosphere (Springer, 1982). [Google Scholar]
- 16.Macdonald R. W., Griffiths R. F., Hall D. J., An improved method for the estimation of surface roughness of obstacle arrays. Atmos. Environ. 32, 1857–1864 (1998). [Google Scholar]
- 17.Lee X., Goulden M. L., Hollinger D. Y., Barr A., Black T. A., Bohrer G., Bracho R., Drake B., Goldstein A., Gu L., Katul G., Kolb T., Law B. E., Margolis H., Meyers T., Monson R., Munger W., Oren R., Paw U K. T., Richardson A. D., Schmid H. P., Staebler R., Wofsy S., Zhao L., Observed increase in local cooling effect of deforestation at higher latitudes. Nature 479, 384–387 (2011). [DOI] [PubMed] [Google Scholar]
- 18.Rigden A. J., Li D., Attribution of surface temperature anomalies induced by land use and land cover changes. Geophys. Res. Lett. 44, 6814–6822 (2017). [Google Scholar]
- 19.Liao W., Rigden A. J., Li D., Attribution of local temperature response to deforestation. J. Geophys. Res. Biogeosci. 123, 1572–1587 (2018). [Google Scholar]
- 20.Shevliakova E., Pacala S. W., Malyshev S., Hurtt G. C., Milly P. C. D., Caspersen J. P., Sentman L. T., Fisk J. P., Wirth C., Crevoisier C., Carbon cycling under 300 years of land use change: Importance of the secondary vegetation sink. Global Biogeochem. Cycles 23, GB2022 (2009). [Google Scholar]
- 21.Milly P. C. D., Malyshev S. L., Shevliakova E., Dunne K. A., Findell K. L., Gleeson T., Liang Z., Phillips P., Stouffer R. J., Swenson S., An enhanced model of land water and energy for global hydrologic and Earth-system studies. J. Hydrometeorol. 15, 1739–1761 (2014). [Google Scholar]
- 22.Li D., Malyshev S., Shevliakova E., Exploring historical and future urban climate in the Earth System Modeling framework: 1. Model development and evaluation. J. Adv. Model. Earth Syst. 8, 917–935 (2016). [Google Scholar]
- 23.Li D., Malyshev S., Shevliakova E., Exploring historical and future urban climate in the Earth System Modeling framework: 2. Impact of urban land use over the Continental United States. J. Adv. Model. Earth Syst. 8, 936–953 (2016). [Google Scholar]
- 24.Jackson T. L., Feddema J. J., Oleson K. W., Bonan G. B., Bauer J. T., Parameterization of urban characteristics for global climate modeling. Ann. Assoc. Am. Geogr. 100, 848–865 (2010). [Google Scholar]
- 25.Gu Y., Li D., A modeling study of the sensitivity of urban heat islands to precipitation at climate scales. Urban Clim. 24, 982–993 (2018). [Google Scholar]
- 26.H. G. Jones, Plants and Microclimate: A Quantitative Approach to Environmental Plant Physiology (Cambridge Univ. Press, ed. 3, 2014). [Google Scholar]
- 27.Liao W., Liu X., Wang D., Sheng Y., The impact of energy consumption on the surface urban heat island in China’s 32 major cities. Remote Sens. 9, 250 (2017). [Google Scholar]
- 28.Dunne J. P., John J. G., Shevliakova E., Stouffer R. J., Krasting J. P., Malyshev S. L., Milly P. C. D., Sentman L. T., Adcroft A. J., Cooke W., Dunne K. A., Griffies S. M., Hallberg R. W., Harrison M. J., Levy H., Wittenberg A. T., Phillips P. J., Zadeh N., GFDL’s ESM2 global coupled climate–carbon Earth system models. Part II: Carbon system formulation and baseline simulation characteristics. J. Clim. 26, 2247–2267 (2013). [Google Scholar]
- 29.Dunne J. P., John J. G., Adcroft A. J., Griffies S. M., Hallberg R. W., Shevalikova E., Stouffer R. J., Cooke W., Dunne K. A., Harrison M. J., Krasting J. P., Malyshev S. L., Milly P. C. D., Phillipps P. J., Sentman L. A., Samuels B. L., Spelman M. J., Winton M., Wittenberg A. T., Zadeh N., GFDL’s ESM2 global coupled climate–carbon Earth system models. Part I: Physical formulation and baseline simulation characteristics. J. Clim. 25, 6646–6665 (2012). [Google Scholar]
- 30.Malyshev S., Shevliakova E., Stouffer R. J., Pacala S. W., Contrasting local versus regional effects of land-use-change-induced heterogeneity on historical climate: Analysis with the GFDL earth system model. J. Clim. 28, 5448–5469 (2015). [Google Scholar]
- 31.Sheffield J., Goteti G., Wood E. F., Development of a 50-year high-resolution global dataset of meteorological forcings for land surface modeling. J. Clim. 19, 3088–3111 (2006). [Google Scholar]
- 32.Li D., Bou-Zeid E., Quality and sensitivity of high-resolution numerical simulation of urban heat islands. Environ. Res. Lett. 9, 055001 (2014). [Google Scholar]
Associated Data
This section collects any data citations, data availability statements, or supplementary materials included in this article.
Supplementary Materials
Supplementary material for this article is available at http://advances.sciencemag.org/cgi/content/full/5/4/eaau4299/DC1
Supplementary Text
Fig. S1. Distribution and attribution of summer daytime surface UHIs across North America.
Fig. S2. Distribution and attribution of summer nighttime surface UHIs across North America.
Fig. S3. Relationship between precipitation and daytime ΔT among 60 cities in winter.
Fig. S4. Relationship between precipitation and daytime ΔT among cities in summer.
Table S1. The selected cities in North America and the effective urban and rural albedo values for each city.
Table S2. The root mean square errors between ΔT from the climate model and those computed using the TRM method.
Reference (32)