

Abstract
Mitochondrial dysfunction is one of many key factors in the etiology of alcoholic liver disease (ALD). Lysine acetylation is known to regulate numerous mitochondrial metabolic pathways and recent reports demonstrate that alcohol-induced protein acylation negatively impacts these processes. To identify regulatory mechanisms attributed to alcohol-induced protein post-translational modifications, we employed a model of alcohol consumption within the context of wild type (WT), sirtuin 3 knockout (SIRT3 KO), and sirtuin 5 knockout (SIRT5 KO) mice to manipulate hepatic mitochondrial protein acylation. Mitochondrial fractions were examined by label-free quantitative HPLC-MS/MS to reveal competition between lysine acetylation and succinylation. A class of proteins defined as “differential acyl switching proteins” demonstrate select sensitivity to alcohol-induced protein acylation. A number of these proteins reveal saturated lysine-site occupancy, suggesting a significant level of differential stoichiometry in the setting of ethanol consumption. We hypothesize that ethanol downregulates numerous mitochondrial metabolic pathways through differential acyl switching proteins. Data are available via ProteomeXchange with identifier PXD012089.
Keywords: Sirtuins, acetylation, succinylation, mitochondria, alcoholic liver disease, proteomics, mass spectrometry
Graphical Abstract
INTRODUCTION
Ethanol consumption is currently the third leading preventable cause of death in the United States, with an estimated economic burden of $249 billion in 2010.1–4 A 2018 report by the World Health Organization found that ethanol consumption played a role in 5.3% of all global deaths, or 3 million deaths.3 The majority of ethanol metabolism occurs in the liver, making it one of the most sensitive organs to ethanol toxicity. Ethanol metabolism involves the conversion of ethanol to acetaldehyde by alcohol dehydrogenase, cytochrome P450 2E1 (CYP2E1), and catalase.5 Acetaldehyde is a highly reactive molecule that is metabolized to acetate by aldehyde dehydrogenases (ALDH), the majority of which occurs in the mitochondria.6–8 While alcoholic liver disease (ALD) is distinguished by inflammation, oxidative stress, and steatosis, these factors cannot completely account for the alterations in mitochondrial metabolic pathways seen in ALD.9–10
Ethanol metabolism is known to induce a variety of post-translational protein modifications (PTMs), including acetylation, methylation, carbonylation and phosphorylation.11–17 PTMs play an integral role in regulating protein function by impacting protein activity, stability, and cellular localization.18–19 Lysines, in particular, are susceptible to a myriad of competing acylations, including acetylation, succinylation, malonylation, ubiquitination, and carbonylation.18,20–26 Protein acetylation and succinylation involves the reversible modification of the N-ε-amine of lysine residues with a covalently bound acetyl group or succinyl group supplied by acetyl-CoA and succinyl-CoA.27–28 In mitochondria, protein acetylation and succinylation are thought to occur primarily through non-enzymatic mechanisms.27–30 Furthermore, increased mitochondrial protein acetylation is a direct consequence of ethanol metabolism and increased acetate formation, as well as a general footprint of metabolic status.11–12, 31–34 Succinylation sites identified in yeast, bacteria, and mouse liver demonstrate an extensive overlap with acetylation, revealing a metabolically-derived competition between acetylation and succinylation.35–36 This competitive dynamic is regulated, in part, by the removal of acetyl and succinyl groups from lysine residues by the activity of sirtuins, which deacylate lysine residues throughout the cell.37 The quantitation of lysine acetyl and succinyl competition has yet to be performed for either dietary (starvation or ethanol) or genetic (sirtuin knockout) in vivo models at the same time.
Sirtuins are a highly conserved family of nicotinamide adenine dinucleotide (NAD+)-dependent deacylases with homology to the yeast Sir2 protein.37 Sirtuin 3 (SIRT3) is the predominant regulator of mitochondrial lysine acetylation, while sirtuin 5 (SIRT5) is the major regulator of lysine succinylation.38–39 Each are known to be involved in a variety of pathologies, including nonalcoholic fatty liver disease (NAFLD), diabetes, cardiovascular disease, cancer, neurodegeneration, and aging.11–12,32,40–45 The current model suggests that SIRT3 deacetylates proteins within the tricarboxylic acid (TCA) cycle, the electron transport chain (ETC), fatty acid β-oxidation, ketogenesis, antioxidant defense, and mitochondrial protein synthesis.46–51 SIRT5 is localized in both mitochondria and the cytosol and possesses several enzymatic functions including lysine desuccinylase, demalonylase, and deglutarylase activity.21–23,52–54 In the liver, SIRT5 has been reported to regulate the urea cycle, fatty acid β-oxidation, ketogenesis, glycolysis, and the (TCA) cycle.18–19,23, 54–55 The significant overlap in acetylated and succinylated lysine residues implies that SIRT3 and SIRT5 compete for proteomics substrates in the regulation of metabolic processes, where PTM crosstalk plays a role in regulating protein function.35–36 Initial studies have identified acetylation and succinylation overlap and stoichiometry, however, no studies have investigated the impact of metabolism in general, or ethanol specifically, on the competitive nature of these two modifications on target enzymes in vivo.18–56 In this study, we quantify the hepatic mitochondrial acetylome and succinylome of wild-type (WT), Sirt3−/− (SIRT3 KO), and sirt5−/− (SIRT5 KO) mice subjected to chronic ethanol consumption in order to examine the competitive landscape of protein acylation in a physiologically relevant model. Our analysis identified numerous proteins with increased acetylation and decreased succinylation at the same lysine residue. We refer to these proteins as differential acyl switching proteins, since we hypothesize that differential acetylation and succinylation may act like a variable resistor, incrementally altering protein function as opposed to an on/off switch. The results presented here reveal key regulatory sites of modification on a number of pathologically relevant proteins and pathways involved in the regulation of mitochondrial metabolism.
Experimental
Animals
All procedures involving animals were approved by the Institutional Animal Care and Use Committee of the University of Colorado and were performed in accordance with published National Institutes of Health guidelines. SIRT3 KO and SIRT5 KO mice were kindly provided by Dr. Frederick Alt of Boston Children’s Hospital and Dr. Eric Verdin of the Buck Institute for Research on Aging.38 Knockout mice were backcrossed 10 generations onto the C57BL/6J background. In order to obtain mice the same age and to eliminate the unnecessary production of heterozygous animals, a knockout to knockout breeding strategywas employed, and 7-week-old wild-type (WT) C57BL/6J mice were purchased from The Jackson Laboratory (Bar Harbor, ME). Genotyping of SIRT3 KO and SIRT5 KO mice was performed by PCR using mouse tail snips, and was validated by western blotting (Figure 2C, 2F, 2G). SIRT3 was amplified using primers 5’ TGCAACAAGGCTTTATCTTCC 3’ (WT reverse), 5’ CTTCTGCGGCTCTATACACAG 3’ (common forward), and 5’ TACTGAATATCAGTGGGAACG 3’ (mutant forward). SIRT5 was amplified using primers 5’ AGGAGGTGGCAAAGGTCTTGC 3’ (WT forward), 5’ CTGAGGTAGAGTCTCTCATTG 3’ (common reverse), and 5’ TCATTCTCAGTATTGTTTTGCC 3’ (mutant forward). Male mice (8-weeks-old) were fed a modified Lieber-DeCarli liquid based-diet (Bio-Serv, Frenchtown, NJ) for 6 weeks. Only male animals were used to avoid the addition of gender differences in alcohol metabolism, as well as the potentially confounding effects of hormone differences. Follow up studies will be performed with female mice to investigate gender-based differences in acetylation and succinylation in response to ethanol feeding in WT, SIRT3 KO, and SIRT5 KO mice. The diet consisted of 44% fat-derived calories, 16% protein-derived calories and the remaining balance being comprised of either carbohydrate or ethanol-derived calories (EDC). Importantly, both ethanol treated and control groups were fed diets containing the same quantity of fat-derived calories. Ethanol-fed mice began the study on a diet consisting of 2% (v/v) ethanol, with EDC increased on a weekly basis until sacrifice; week 6 consisted of 6 % ethanol (v/v) or 31.8% EDC. Pair-fed animals were calorically matched to an ethanolfed mouse where EDC were replaced with maltodextrin. Upon completion of the study, animals were anesthetized via intraperitoneal injection of sodium pentobarbital and euthanized via exsanguination. Livers were excised, weighed, and frozen for biochemical characterization, or subjected to differential centrifugation using a sucrose buffer for mitochondrial and cytosolic subcellular fractionation. Briefly, 50 mg of liver tissue were dounce homogenized in 500 μl of 0.25 M sucrose buffer for 15 seconds on ice. Samples were centrifuged at 650g for 10 minutes to remove tissue debris and unbroken cells. The 650g supernatant with mitochondrial and cytosolic components was kept and centrifuged at 6000g for 10 minutes. The pellets with mitochondria were resuspended in 50 μl of 0.25 M sucrose buffer and kept for analysis. Nuclear fractions were obtained using a method by Dimauro et al..57 Briefly, 50 mg of liver tissue were dounce homogenized in 500 μl of 250 mM sucrose buffer for 15 seconds on ice and centrifuged at 800g for 15 minutes. The pellet from this step was resuspended in the sucrose buffer and centrifuged at 500g for 15 minutes. The pellet from this step was resuspended in 20 mM HEPES and was incubated on ice for 30 minutes, vortexing every 2 to 3 minutes for 15 seconds at maximum speed. This suspension was sonicated on ice three times for 10 seconds each time, then centrifuged at 9000g for 30 minutes. The supernatant from this contained the nuclear fraction and was kept for analysis. Plasma alanine aminotransferase (ALT) was measured using a kit from Sekisui Diagnostics (Lexington, MA). Liver triglycerides were quantified utilizing a kit from Sekisui Diagnostics (Lexington, MA).
Figure 2.

Ethanol increases lysine acetylation and decreases succinylation of mitochondrial proteins in WT, SIRT3 KO, and SIRT5 KO mouse livers. (A) Representative anti-acetyllysine Western blot. (B) Representative anti-succinyllysine Western blot. (C) Representative SIRT3, SIRT5, and loading control (COXIV) Western blots. (D-G) Corresponding densitometry quantification using unpaired Student’s t-test (mean ± SEM, n=3, *=p<0.05, **=p<0.005, ***=p<0.0005, ****=p<0.0001).
Immunoblottlng for Acylated Proteins
Protein (15 μg) from liver sub-cellular fractionations was subjected to standard SDS-PAGE using Criterion TGX Stain-Free 8–16% gradient precast gels (Bio-Rad, Hercules, CA) and transferred to an Immobilon®-PSQ membrane (Merck Millipore, Burlington, MA). Membranes were blocked using 5% (w/v) nonfat dry milk in Tris-buffered saline-0.1% Tween 20 (TBS-T) or Odyssey® Blocking Buffer (PBS) (LI-COR Biotechnology, Lincoln, NE) for 1 hour at room temperature. Membranes were then immunoblotted with primary antibodies directed against acetyllysine (9441, Cell Signaling, Boston, MA), succinyllysine (PTM-401, PTM Biolabs, Chicago, IL), SIRT3 (2627, Cell Signaling, Danvers, MA), SIRT5 (8782, Cell Signaling, Danvers, MA), and COXIV (ab 721972, Abcam, Cambridge, MA). Antibodies against aspartate aminotransferase (Abl89863), ornithine transcarbamylase (Ab91418), malate dehydrogenase 2 (Abl81873), hydroxyacyl-coenzyme A dehydrogenase (Ab54477), and superoxide dismutase 2 (Abl3534) were obtained from Abcam (Cambridge, MA). Following 3 washes with TBS-T, or Phosphate-buffered saline (PBS)-Tween 20 (0.1% v/v; PBS-T), a horseradish peroxidase conjugated secondary antibody was applied and membranes were developed using Clarity Western ECL Substrate from BioRad. Chemiluminescence was visualized using a Chemidoc® MP (Bio-Rad). Acetyllysine and succinyllysine blots were also imaged using the Odyssey imaging system with IRDye® 800CW Secondary Antibodies (# 926–32213, LI-COR Biotechnology, Lincoln, NE). Protein band intensities were quantified using Image Lab (Bio-Rad, version 5.0) and normalized to the total protein per lane using stain-free gel imaging on a Chemidoc® MP (Bio-Rad) to ensure equal protein loading.
Immunohistochemistry for Acylated Proteins
Freshly excised liver tissues were fixed in 10% formalin (Sigma, St. Louis, MO) for 16 h, followed by incubation in 70% ethanol overnight. The tissue was then embedded in paraffin, cut, and mounted on slides by the University of Colorado Anschutz Medical Campus Histology Core. Standard hematoxylin and eosin (H&E) staining was performed. Immunohistochemistry (IHC) was performed according to a protocol employed by Assiri et al., using the Citrate Buffer Antigen Retriever (C9999, Sigma-Aldrich, St. Louis, MO) for acetylation and High pH Antigen Unmasking Solution (H-3301, Vector Labs, Burlingame, CA) for succinylation.58 This was followed by blocking in 5% non-fat dry milk in TBST with 2.5% goat serum (PK-6101, Vector Labs, Burlingame, CA), incubation of liver tissue sections with primary antibodies raised against acetyllysine (9441, Cell Signaling, Boston, MA) and succinyllysine (PTM-401, PTM Biolabs, Chicago, IL), washing in TBST, incubation with biotinylated secondary rabbit antibody (MP-7401, Vector Labs, Burlingame, CA), staining using DAB staining solution (SK-4100, Vector Labs, Burlingame, CA), counterstaining with Hemotoxylin QS (H-3404, Vector Labs, Burlingame, CA), and mounting using Aqua-Poly/Mount (18606, Polysciences, Warrington, PA). IHC for Plin2 (20R-AP002, Fitzgerald Industries Inc. Concord, MA) was performed using the Citrate Buffer Antigen Retriever (C9999, Sigma-Aldrich, St. Louis, MO) followed by incubation of liver tissue sections with primary antibodies raised against Plin2. The protocol was the same as described above for acetylation and succinylation, except for the use of a biotinylated secondary guinea pig antibody (PK-4007, Vector Labs, Burlingame, CA). Histologic images were captured on an Olympus BX51 (Waltham, MA) microscope equipped with a 4 megapixel Macrofire digital camera using the PictureFrame Application 2.3 (Optronics, Goleta, CA). All images were cropped and assembled using Photoshop CS2 (Adobe Systems, Inc., San Jose, CA).
Immunoprecipitation of Acetylated and Succinylated Peptides
Liver mitochondria were isolated from three animals per group (wild-type control diet (WT CD), wild-type ethanol diet (WT ED), sirtuin 3 knockout control diet (SIRT3 KO CD), sirtuin 3 knockout ethanol diet (SIRT3 KO ED), sirtuin 5 knockout control diet (SIRT5 KO CD), and sirtuin 5 knockout ethanol diet (SIRT5 KO ED)) using differential centrifugation. Liver mitochondrial protein (1mg) was trypsin-digested overnight, acidified using TFA, purified via Sep-Pak® C18 Classic Cartridges (Waters, #WAT051910), frozen at −80°C for 4 hours, and lyophilized for 48 hours. Samples were spiked with either 10 ng of acetylated BSA or 10 ng of succinylated BSA as an internal standard. Samples were incubated 2 hours at 4 °C with immunoaffinity beads conjugated to acetyllysine antibody or immunoaffinity beads conjugated to succinyllysine antibody (PTMScan® Acetyl-Lysine Motif [Ac-K] Immunoaffinity Beads #13416 and PTMScan® Succinyl-Lysine Motif [Succ-K] Immunoaffinity Beads #13764, Cell Signaling, Boston, MA). After incubation, supernatants were removed and the beads were washed twice with IAP buffer (PTM Scan® IAP Buffer (10×) 9993, Cell Signaling, Boston, MA) and 3 times with Burdick and Jackson LC-MS grade water (Honeywell). Peptides were eluted with 0.15% TFA 3 times, pooled, cleaned on Pierce® C18 Spin Columns (Thermo Scientific, Rockford, IL, #89870), evaporated to dryness, and frozen at −80°C. Dried samples were re-suspended in 3% ACN, 0.1% formic acid in water for LC-MS/MS analysis.
LC-MS/MS Identification and Quantification of Acetylated and Succinylated Mitochondrial Proteins
Accurate mass and retention time (AMRT) library generation
Six pooled groups (WT CD, SIRT3 KO CD, SIRT5 KO CD, WT ED, SIRT3 KO ED, and SIRT5 KO ED) of enriched acetyllysine peptides or enriched succinyllysine peptides were loaded onto a 2cm PepMap 100, nanoviper trapping column and chromatographically resolved on-line using a 0.075 × 250 mm, 2.0μm Acclaim PepMap RSLC reverse phase nano column (Thermo Scientific) using a 1290 Infinity II LC system equipped with a nanoadapter (Agilent). Mobile phases consisted of water + 0.1% formic acid (A) and 90% aq. acetonitrile + 0.1% formic acid (B). Samples were loaded onto the trapping column at 3.2 μL/min for 3.5 minutes at initial condition before being chromatographically separated at an effective flow rate of 330 nl/min using a gradient of 3–10% B over 4 minutes, 10–28% B over 48.5 minutes, and 28–40% B over 7.5 minutes for a total 60 minute gradient at 42°C. The gradient method was followed by a column wash at 70% B for 5 minutes. Data was collected on a 6550 Q-TOF equipped with a nano source (Agilent) operated using intensity dependent CID MS/MS to generate peptide identifications. The capillary voltage, drying gas flow, and drying gas temperature were set to 1300 V, 11.0 L/min and 175 °C, respectively. MS/MS data was collected in positive ion polarity over mass ranges 290–1700 m/z at a scan rate of 10 spectra/second for MS scans and mass ranges 50–1700 m/z at a scan rate of 3 spectra/second for MS/MS scans. All charge states, except singly charged species, were allowed during MS/MS acquisition, and charge states 2 and 3 were given preference. SpectrumMill software (Agilent) was used to extract, search, and summarize peptide identity results. Spectra were searched against the SwissProt Mus Musculus database allowing up to 4 missed tryptic cleavages with fixed carbamidomethyl (C) and variable deamidated (NQ), oxidation (M), and either acetyl (K) or succinyl (K) modifications depending on the enrichment. The monoisotopic peptide mass tolerance allowed was ± 20.0 ppm and the MS/MS tolerance was ± 50 ppm. A minimum peptide score of 8 and scored peak intensity of 50% were used for the generation of the AMRT library.
For MS-only quantitation, data was collected in positive ion polarity over mass ranges 290–1700 m/z at a scan rate of 1.5 spectra/second on a 6550 Q-TOF equipped with a nano source (Agilent) operated in MS-only mode. Enriched acetyllysine peptide samples and enriched succinyllysine peptide samples were acquired using the same LC method and source parameters as the pooled samples for AMRT library generation.
Overall, data analysis for MS quantitation was extracted and aligned using Profinder V.B.08.00 software (Agilent). Retention times, neutral masses, and chemical formulas generated from identified acetyl or succinyl peptides in the AMRT library were used to perform a batch targeted feature extraction. Samples were extracted with an ion count threshold set to two or more ions and 12000 counts and a score threshold of 50. The score was based on how the quality of the mass, isotope abundances and isotope spacing of compounds found in each sample matched to a targeted chemical formula within a specified retention time window generated from the AMRT library. Charge states 2–6 were allowed with H+ and Na+ adducts using the peptide isotope model. Retention time window and mass window alignment setting tolerances were set to 0.8 min and 10 ppm, respectively. Acetyllysine and succinyllysine final extraction and alignment results were exported to Mass Profiler Professional V.14.8 (Agilent) for quantitation. To ensure accuracy in quantifying the competitive nature of acetylation and succinylation, succinyllysine final extraction and alignment results were manually validated by assessing each peptide extracted ion chromatogram.
Statistical analysis was performed at the peptide level. Compounds were filtered to those found in 100% of 1 of 2 conditions for group-to-group comparisons. Acetyl or succinyl peptides were filtered on volcano plots using a moderated t-test and peptides that had a fold change ≤ or ≥ 2.0 and p-value < 0.05 were considered significant. Bonferroni FWER multiple-testing correction was also applied to generate a list of acetyl site candidates that were differentially expressed with high confidence that could be used to probe the effects of acetylation and succinylation modifications in individual proteins. A one-way ANOVA between diets, genotypes, control diet genotypes, ethanol diet genotypes, as well as a two-way ANOVA were performed to determine the overall effects of genetic differences vs dietary differences at various lysine acetylation and succinylation sites.
Pathway Analysis
Pathway analysis was performed with DAVID Bioinformatics Resources version 6.8.59–60 A list of UniprotKB IDs for all acetylated proteins, a list of UniprotKB IDs for all succinylated proteins, and a list of UniprotKB IDs for all proteins acetylated and succinylated at the same lysine residues were uploaded to the database. The entire mouse proteome was used as the reference background. Enrichment analysis was performed using both the functional annotation chart function in order to identify the most overrepresented biological terms correlated with our protein list, and the functional annotation clustering function in order to cluster similar terms correlated with our protein list into groups organized by function. Significance of enrichment terms was measured by the calculation of a p-value using Fisher’s exact test (EASE score) to determine the probability that a given term was more enriched than random chance. The Benjamini-Hochberg procedure was used to globally correct enrichment p-values of individual term members for functional annotation clustering and to adjust the false discovery rate in both analyses. A threshold of significance for each pathway was set at p<0.05. Each pathway had to be represented by 3 or more proteins in the list to be considered significant. Pathways represented in figures were chosen from a larger list for relevance to mitochondrial metabolism and for visual simplicity.
Metabolomics Analysis of Mouse Liver Tissue
Amino acids, acylcamitines and organic acids were analyzed using stable isotope dilution technique. Amino acids and acylcarnitine measurements were made by flow injection tandem mass spectrometry using sample preparation methods described previously.61–62 The data were acquired using a Waters TQD mass spectrometer equipped with AcquityTM UPLC system and controlled by MassLynx 4.1 operating system (Waters, Milford, MA). Organic acids were quantified using methods described previously employing Trace Ultra GC coupled to ISQ MS operating under Xcalibur 2.2 (Thermo Fisher Scientific, Austin, TX).63
Statistics and Data Processing
Statistical analyses and production of graphs were completed using Prism 7 (GraphPad, La Jolla, CA). Differences between the control and ethanol groups for each genotype were calculated using the unpaired Student’s t-test. Results were considered significant if p < 0.05. The unpaired t-test was chosen instead of the paired t-test, because the coefficients of variation for average food intake in WT, SIRT3 KO, and SIRT5 KO mice were all less than 10 %, indicating that food consumption in control and ethanol groups for each genotype was consistent and paired feeding was not impacting differences between the groups. For Western blot densitometry, graphs represent the average of 3 independent experiments with error bars indicating the SEM. Venn diagrams were calculated and generated using the Bioinformatics and Evolutionary Genomics website (bioinformatics.psb.ugent.be/webtools/Venn/).
RESULTS
Chronic Ethanol Ingestion Increases Biochemical Markers of Liver Damage
To assess the impact of chronic ethanol consumption on liver damage, we examined plasma alanine aminotransferase (ALT), liver triglycerides, liver weight to body weight ratio, and body weight change. ALT is a widely used biomarker of hepatocellular injury and liver disease.64 Liver triglycerides are used to assess lipid accumulation in the liver (steatosis), while liver to body weight ratio gives an indication of liver enlargement. Elevated ALT and steatosis are two hallmarks of ALD. ALT was significantly increased when comparing the control and ethanol groups within each genotype (Figure 1). ALT in WT ED mice was increased by 90% (p=0.0002) compared to WT CD mice. SIRT3 KO ED ALT was increased by 202% (p=0.0004) compared to SIRT3 KO CD. SIRT5 KO ED ALT was increased by 44% (p=0.0016) compared to SIRT5 KO CD (Figure 1A). When comparing WT and SIRT3 KO CD mice, ALT increased by 62% (p=0.0002) in the SIRT3 KO CD mice (Figure 1A). ALT increased by 156% (p<0.0001) in SIRT5 KO CD mice compared to WT CD mice (Figure 1A). When examining genotype and diet together (comparing the ethanol effects across genotypes), the SIRT3 KO ED group had the largest increase in ALT compared to the WT ED group (156%, p=0.001), with smaller increases in the SIRT5 KO ED group (90%, p<0.0001) compared to the WT ED group (Figure 1A). ALT analysis reveals that ethanol consumption is the primary factor inducing liver injury. When comparing the control and ethanol groups within each genotype, liver triglycerides were increased by 81% (p=0.029) in WT ED mice, by 85% (p=0.005) in SIRT3 KO ED mice, and by 102% (p=0.0002) in SIRT5 KO ED mice (Figure 1B). Comparisons between the control groups of the three genotypes revealed an increase in liver triglycerides of 73% (p=0.023) in SIRT3 KO CD mice compared to WT CD mice (Figure 1B). When examining genotype and diet together (comparing the ethanol effects across genotypes), liver triglycerides increased by 77% (p=0.094) in SIRT3 KO ED mice compared to WT ED mice (Figure 1B). The liver to body weight ratio was increased in the ED groups compared to the CD groups within each genotype by 13% (p=0.0035) in the WT ED mice, by 29% (p<0.0001) in the SIRT3 KO ED mice, and by 23% (p<0.0001) in the SIRT5 KO ED mice, showing a consistent response to ethanol in all genotypes (Figure 1C). There was no significant difference between the liver to body weight ratio among CD of any of the genotypes, indicating that the difference in liver to body weight ratio is driven primarily by ethanol (Figure 1C). Change in body weight was decreased by 69% (p<0.0002) in the WT ED group compared to the WT CD group (Figure 1D). There were no differences in body weight changes over the course of the 6-week study between SIRT3 KO CD and ED groups or SIRT5 KO CD and ED groups (Figure 1D). Analysis of bodyweight changes in the control groups revealed significant decreases of 46% (p=0.0081) in SIRT3 KO mice and 40% (p=0.0052) in SIRT5 KO mice compared to the WT CD group (Figure 1D). These results indicate that the SIRT3 KO and SIRT5 KO impact body weight to a greater extent than ethanol consumption. Analysis of the ethanol groups revealed no body weight change between the WT ED and SIRT3 KO ED groups, an increase in body weight of 127% (p=0.0046) in the SIRT5 KO ED mice compared to the WT ED mice, and an increase in body weight of 6 6 % (p=0.0241) in SIRT5 KO ED mice compared to SIRT3 KO ED mice (Figure 1D). When comparing the control and ethanol groups within each genotype for food consumption, an increase of 10% (p=0.0004) in WT ED mice compared to WT CD mice was observed, however, no differences were observed between the CD and ED groups for SIRT3 KO and SIRT5 KO mice (Figure 1E). Analysis of food consumption in the control groups revealed significant decreases of 12% (p<0.0001) in SIRT3 KO mice and 9% (p=0.0005) in SIRT5 KO mice compared to the WT CD group, however, no differences in food consumption were observed between SIRT3 KO and SIRT5 KO mice in the control groups (Figure 1E). Analysis of food consumption in the ethanol groups revealed similar decreases of 16% (p<0.0001) in SIRT3 KO mice compared to the WT ED group, 15% (p<0.0001) in SIRT5 KO mice compared to the WT ED group, and no difference between the SIRT3 KO ED and SIRT5 KO ED groups (Figure 1E). While it is known that calorie restriction can induce sirtuins in rodents, the differences in food intake between groups in this study do not appear to be significant enough to play a role in sirtuin expression.65 These data demonstrate that chronic ethanol consumption robustly initiated pathogenic features of ALD.
Figure 1.

Chronic ethanol ingestion increases biochemical markers of liver damage in WT, SIRT3 KO, and SIRT5 KO mice. (A) Analysis of plasma alanine aminotransferase (ALT). (B) Liver Triglycerides. (C) Liver to body weight ratio. (D) Body weight change. (E) Food consumption. Data are presented as mean ± SEM. Statistical significance was determined by unpaired Student’s t-test between each group of mice, *=p<0.05, **= p<0.005, ***=p<0.0005, ****= p<0.0001
Ethanol Metabolism Alters Hepatic Protein Acylation and Lipid Deposition in WT, SIRT3 KO, and SIRT5 KO Mice
Immunoblot analysis with an anti-acetyllysine or anti-succinyllysine antibody of liver mitochondrial extracts from WT, SIRT3 KO, and SIRT5 KO mice fed an ED or a CD revealed that the ED resulted in an increase in protein acetylation and a decrease in succinylation across all genotypes (Figure 2A and 2B). Knockout of Sirt3 and Sirt5 in the liver was confirmed using anti-SIRT3 and anti-SIRT5 antibodies (Figure 2C). ED resulted in a 4.7-fold (p<0.0001) increase in mitochondrial protein acetylation in WT mice, a 1.8-fold (p=0.0003) increase in SIRT3 KO mice, and a 2.1-fold (p=0.02) increase in SIRT5 KO mice (Figure 2D). Contrary to the acetylation data, ED resulted in a 2.0-fold decrease (p=0.0062) in mitochondrial protein succinylation in WT mice, a 3.5-fold decrease (p=0.0072) in SIRT3 KO mice, and a 1.6-fold decrease (p=0.0158) in SIRT5 KO mice (Figure 2E). Our analysis reveals that increases in acetylation and decreases in succinylation with ethanol ingestion are not due to ethanol-induced changes in SIRT3 and SIRT5 expression, since SIRT3 and SIRT5 protein levels did not change in response to ethanol (Figures 2F and 2G)
Immunohistochemistry (IHC) was used to explore the localization of these changes in mitochondrial protein acylation in mouse liver tissue in response to ethanol feeding (Figure 3). The liver is divided into three distinct functional zones based on oxygen supply. Zone 1 surrounds the portal vein, where oxygenated blood enters. Zone 3 surrounds the central vein, where oxygenation of blood is low. Zone 2 is composed of the transitional region between zones 1 and 3. Ethanol ingestion has been shown to result in zone-specific protein expression patterns.58,66–67 IHC analyses revealed that ethanol ingestion increased lysine acetylation and decreased succinylation in WT, SIRT3 KO, and SIRT5 KO hepatocytes, predominantly in zone 3, supporting the immunoblot data (Figures 3C and 3D). Importantly, anti-acetyllysine IHC shows a pattern of acetylation that does not appear to be nuclear. Instead, the acetylation can be seen as punctate dots indicating mitochondrial protein acetylation. Hematoxylin and eosin (H&E) staining and Plin2 IHC were used to assess lipid deposition and steatosis as a result of chronic ethanol feeding. H&E staining showed that ethanol ingestion resulted in steatosis in all genotypes (Figure 3A). By its localization to lipid droplets, the protein Plin2 is a viable marker for examining hepatic triglyceride accumulation during chronic ethanol consumption.68 IHC for Plin2 showed that ED resulted in an increase in lipid deposition, and resultant steatosis, in all genotypes, predominantly in zone 3 (Figure 3B).
Figure 3.

Ethanol metabolism alters hepatic protein acylation and lipid deposition in WT, SIRT3 KO, and SIRT5 KO mice. Paraffin embedded formalin fixed hepatic tissue sections were analyzed using (A) hematoxylin and eosin (H&E) staining and IHC for (B) Plin2, (C) acetyllysine, and (D) succinyllysine. [CV = central vein, PT= portal vein. (10× mag), (n=3)] See also Figures S1–S3.
Metabolomics Analysis of Ethanol Treated WT, SIRT3 KO and SIRT5 KO Mouse Liver Tissue
Ethanol, SIRT3 KO, and SIRT5 KO Inhibit Lipid Oxidation
Metabolomics analysis of liver tissue in WT mice showed that C16 and C18 acylcarnitines increase in response to ethanol treatment, suggesting that the liver is accumulating these lipids normally targeted for oxidation (Figure S1 and S3). In the absence of SIRT3 or SIRT5, there was a trend for the increase in these acylcarnitines by ethanol treatment to be greater than the increase in WT mice (Figure S1). Together, these data suggest that the known reductions in lipid oxidation in the setting of ethanol metabolism are further exacerbated in the absence of SIRT3 or SIRT5. In general, ethanol treatment increases all long-chain acylcarnitine species, which are further increased in the absence of SIRT3 or SIRT5 as demonstrated by an increase in hepatic steatosis (Figures 3A–B, Figures Sl–S3). These findings are supported by our IHC analysis of Plin2 (Figure 3B) and corroborate previously published evidence that mitochondrial sirtuins play a key role in lipid metabolism.50,69
Ethanol Increases Urea Cycle Related Amino Acids in WT Mice
Ethanol feeding in WT mice induces a dramatic rise in ornithine, citrulline, and arginine levels, strongly suggesting alterations to the urea cycle (Figure S4). This suggests that the urea cycle is upregulated with ethanol feeding, however, it is unclear whether the flux is high and intermediates spill out, or if flux is blocked and intermediates spill out. This increase is not seen in the SIRT3 KO or SIRT5 KO mice (Figure S4). Both SIRT3 and SIRT5 have been described to regulate CPS1, so this could be altered here. Ethanol feeding in WT mice had only minor/subtle changes in other AAs.
Ethanol Alters the TCA Cycle Organic Acid Profile of WT, SIRT3 KO and SIRT5 KO Mice
In WT mice, ethanol treatment had dramatic effects on lowering alpha-ketoglutarate, which suggests activation of alpha-ketoglutarate dehydrogenase and increased turnover of alpha-ketoglutarate to succinyl Co-A, or potentially deactivation of isocitrate dehydrogenase or glutamate dehydrogenase (Figure S5). SIRT3 KO mice looked similar in the organic acid profile to WT mice fed ethanol (Figure S5). SIRT5 KO mice, however, had a very different TCA cycle profile where lactate, pyruvate, fumarate, and malate levels, were elevated, which were generally reversed by ethanol feeding (Figure S5).
Quantification of Lysine Acetylation and Succinylation on Peptides from WT, SIRT3 KO, and SIRT5 KO Mouse Liver Mitochondria
Immunoblot and IHC results suggest that competition exists between acetylation and succinylation, which could play a significant role in the pathogenesis of ALD.18, 35–36 This hypothesis was explored further by employing label-free LC-MS/MS quantification of acetylated and succinylated peptides in WT, SIRT3 KO, and SIRT5 KO mice. Changes in the lysine acetylome and succinylome in response to SIRT3 KO, SIRT5 KO, and an ED were quantified (Figure 4A, Table S2, and Table S3). From the quantification, a genotype driven increase in protein acetylation was present in SIRT3 K0 CD mice compared to WT CD mice, validating the function of SIRT3 as a deacetylase (Table 1). Likewise, the quantification showed a genotype driven increase in protein succinylation in SIRT5 KO CD mice compared to WT CD mice (Table 1). Since SIRT3 does not have desuccinylase activity, there was no genotype driven trend toward increased protein succinylation when comparing SIRT3 KO CD mice to WT CD mice (Table 1).
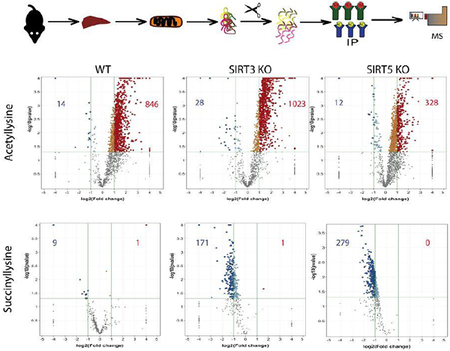
Figure 4.

Quantification of lysine acetylation and succinylation sites on peptides from WT, SIRT3 KO, and SIRT5 KO mouse liver mitochondria. (A) Experimental approach for the enrichment, identification, and quantification of acetylated and succinylated peptides. (B and C) Listed in the boxes for each volcano plot are the numbers of peptides with significant changes in acetylation or succinylation due to ethanol consumption, (n=3, log2(fold change) ≥2 or ≤−2, p<0.05)
Table 1.
Quantification of Lysine Acetylation and Succinylation Sites in WT, SIRT3 KO, and SIRT5 KO Mouse Liver Mitochondria. See also Table S2 and Table S3.
| Mice | Number of Peptides with Significant Quantitative Changes in Acetylation | Number of Peptides with Significant Quantitative Changes in Succinylation | Number of Proteins with Significant Changes in Acylation | |||
|---|---|---|---|---|---|---|
| Diet and Genotype Comparisons | Increased FC ≥ 2 | Decreased FC ≤ −2 | Increased FC ≥ 2 | Decreased FC ≤ −2 | Acetyl | Succinyl |
| WT ED vs WT CD | 846 | 14 | 1 | 9 | 224 | 8 |
| SIRT3 KO ED vs SIRT3 KO CD | 1,023 | 28 | 1 | 171 | 267 | 66 |
| SIRT5 KO ED vs SIRT5 KO CD | 328 | 12 | 0 | 279 | 132 | 280 |
| SIRT3 KO CD vs WT CD | 359 | 6 | 1 | 0 | 152 | 1 |
| SIRT5 KO CD vs WT CD | 11 | 9 | 266 | 1 | 12 | 92 |
| SIRT3 KO ED vs WT ED | 375 | 12 | 94 | 0 | 153 | 42 |
| SIRT5 KO ED vs WT ED | 13 | 96 | 200 | 2 | 55 | 82 |
FC=log2(fold change), (n=3, p<0.05)
Interestingly, when looking at the effects of the ED, a significant increase in the number of acetylated peptides across all genotypes and a significant decrease in the number of succinylated peptides across all genotypes were evident (Figures 4B and 4C, Table 1). In assessing diet alone, WT ED mice demonstrated a significant decrease in succinylation of 8 proteins: ADP/ATP translocase 2, uricase, peroxisomal acyl-coenzyme A oxidase, citrate synthase, pyruvate carboxylase, dehydrogenase/reductase SDR family member 4, 3 beta-hydroxysteroid dehydrogenase type 4 and 3 beta-hydroxysteroid dehydrogenase type 5 (Table S3). These proteins play a role in lipid metabolism, the TCA cycle, steroid metabolism, redox balance, and amino acid biosynthesis (Table S1). The finding that these succinylation sites significantly decrease as acetylation increases suggests they may be fully occupied. Studies comparing saturation of lysine acylation to protein function have yielded equivocal results. Our results indicate that for a number of proteins, lysine occupancy is approaching “full” or 100%. Given our alternative approach utilizing a genetic knockout to force lysine acylation, the combination of SIRT3 KO and ethanol resulted in a further increase in acetylation and decrease in succinylation of peptides compared to SIRT3 KO CD (Figure 4, Table 1). The effects of SIRT5 KO and ethanol appear to result in an increase in acetylation and a decrease in succinylation compared to SIRT5 KO CD (Figure 4, Table 1). This data demonstrates that, while both ethanol and genotype play a significant role in increasing protein acetylation and decreasing protein succinylation, ethanol plays a significant independent role, apart from genotype, in this process. It is interesting to note that the ethanol diet exacerbates the acetylation increase in SIRT3 KO mice, but counteracts the succinylation increase in SIRT5 KO mice.
Quantification of Ethanol-Induced Differential Acyl Switching Proteins Reveals Increased Acetylation and Decreased Succinylation at the Same Lysine Residue
Analysis of all peptides and proteins identified in WT and KO samples revealed that 16% of peptides and 40% of proteins identified were acetylated and succinylated (Figure 5). Further analysis revealed that 21% of the entire list of acetylated peptides were also found in the list of succinylated peptides, while 65% of succinylated peptides were also acetylated. The percentage of specific acetylated lysine residues on peptides that were also succinylated on the same residues was 3% in WT mice, 12% in SIRT3 KO mice, and 15% in SIRT5 KO mice. The percentage of specific succinylated lysine residues on peptides that were also acetylated on the same residues was 25% in WT mice, 55% in SIRT3 KO mice, and 36% in SIRT5 KO mice. The higher level of succinylated residues that are also acetylated suggest that acetylation is a more abundant modification in this model. Investigation into the overlap of acetylated peptides and succinylated peptides between WT, SIRT3 KO, and SIRT5 KO control and ethanol groups demonstrated extensive overlap in both PTMs across diet and genotype (Figure 6 A and 6 B). Many of these increases in acetylation and decreases in succinylation in response to ethanol occurred at the same lysine residue on a given protein, showing that acetyl and succinyl groups compete for occupancy and control of regulatory function, as shown in Figure 7. Differences in peptide acetylation and succinylation across genotypes were calculated for differential acyl switching proteins. These quantitative differences showed a general ethanol-induced trend toward increased acetylation and decreased succinylation of peptides in WT, SIRT3 KO, and SIRT5 KO mouse liver mitochondrial extracts (Figure 7). However, no direct quantitative comparisons were made between acetyl peptides and succinyl peptides, because the immunoprecipitation experiments were performed on separate days. The trend in acetylation and succinylation for differential acyl switching proteins depicted in Figure 7 is representative of the roughly 80 differential acyl switching proteins identified, since they demonstrate increased acetylation and decreased succinylation at the same lysine residue on the same peptide. This trend is primarily seen in the SIRT3 KO and SIRT5 KO mice, with less representation seen in the WT mice, however, this may be a function of mass spectrometer sensitivity, as all of the same proteins and peptides were found across all genotypes and diets, but abundance was lower in the WT samples. Additionally, many peptides representing a wide variety of mitochondrial proteins demonstrated increased acetylation and decreased succinylation at different lysine residues on the same peptide, therefore, these peptides follow a similar trend. However, they were not characterized as differential acyl switching proteins, because the acylation event did not occur at the same lysine residue. This trend was also seen in a smaller number of cases where there was increased acetylation and decreased succinylation on the same lysine residue, but with varied trypsin cleavage profiles for a given protein. A very small minority of peptides showed increased acetylation and increased succinylation at the same lysine residue on the same peptide for a given protein. Western blot analysis of select differential acyl switching proteins shown in Figure 7 confirm that the total amount of each protein was equivalent for the control and ethanol groups for each genotype, which indicates that increases in acetylation and decreases in succinylation are due to the effect of ethanol rather than differences in protein expression and abundance (Figure 8). Pathways represented by differential acyl switching proteins include fatty acid β-oxidation (HADH), the TCA cycle (MDH2), glutamate metabolism (GOT2), the ETC, ketogenesis, alcohol metabolism, pyruvate metabolism, glutathione redox (SOD2), the urea cycle (OTC), and branched chain amino acid degradation. The corresponding differential acyl switching proteins identified in selected pathways can be found in Table S1. Interestingly, metabolomics analysis showed that the urea cycle metabolites ornithine and citrulline rose dramatically after ethanol treatment in WT and SIRT5 KO mice, suggesting that ethanol-induced changes in acylation may have a profound functional effect on the urea cycle (Figure S4). Differential acyl switching proteins with increased acetylation and decreased succinylation near regulatory sites were examined and are represented 1) in the TCA cycle by succinyl-CoA ligase subunit beta K8 8, which is near the substrate binding site at position 94, and by dihydrolipoyl dehydrogenase K277, which is near the NAD+ binding site at position 278, 2) in fatty acid β-oxidation by hydroxyacyl-CoA dehydrogenase K81 and acetyl-CoA acetyltransferases K260, which are near the CoA binding site at position 80 and position 260, respectively, 3) in ketogenesis by hydroxymethylglutaryl Co-A synthase K83 and K256, which are near substrate binding sites at positions 80 and 258, and 4) in glutamate metabolism by aspartate aminotransferase K404 and glutamate dehydrogenase 1 K187, which are near the substrate binding site at position 407 and the active site at position 183, respectively. These differential acyl switching proteins were found in all genotypes, however, many of them were of low abundance in the WT samples and were filtered out by fold-change and p-value cut-offs, which we attribute to limitations in instrument sensitivity. The relation of amino acid location to binding sites for each protein was determined using UniProtKB, therefore, additional acetyllysine and succinyllysine interactions with binding sites may be apparent when looking at available 3D structures of the proteins. Future studies will investigate ethanol-induced alterations in the structure and function of these targeted differential acyl switching proteins.
Figure 5.

Overlap of acetylated and succinylated mitochondrial peptides and proteins in all genotypes. Venn diagrams showing the overlap of acetylation and succinylation on peptides and proteins for all genotypes.
Figure 6.

Comparison of acetylated and succinylated peptides from mitochondrial proteins in WT, SIRT3 KO, and SIRT5 KO mice fed an ethanol diet or a control diet. (A and B) Number of acetylated and succinylated peptides identified in hepatic mitochondrial samples from WT, SIRT3 KO, and SIRT5 KO mice fed control or ethanol diet.. [WT C = wild-type mice fed CD. WT E = wild-type mice fed ED. S3 KO C = SIRT3 KO mice fed CD. S3 KO E = SIRT3 KO mice fed ED. S5 KO C = SIRT5 KO mice fed CD. S5 KO E = SIRT5 KO mice fed ED]
Figure 7.

Label-free acyl-quantitation of differential acyl switching peptides on lysine residues at or near regulatory sites. Acetylation and succinylation relative quantitation of (A) aspartate aminotransferase K404 from amino acid metabolism, (B) ornithine carbamoyltranferase K88 from the urea cycle, (C) malate dehydrogenase K301 from the TCA cycle, (D) hyroxyacyl-coenzyme A dehydrogenase from fatty acid oxidation, (E) superoxide dismutase 2 K68, and (F) K122 from redox pathways and glutathione metabolism (mean ± SEM, n=3, *=p<0.05, **=p<0.005, ***=p<0.0005, ****=p<0.0001). The y-axes reflect MS quantification of acetylated and succinylated peptides obtained from each enrichment.
Figure 8.

Western blot analysis reveals that the abundance of differential acyl switching proteins shown in figure 7 are unchanged in control and ethanol groups within each genotype, confirming that increases in acetylation and decreases in succinylation on these proteins are driven by post-translational modification and not a shift in protein abundance. (A) Representative western blot images for aspartate aminotransferase (AST), ornithine transcarbamylase (OTC), malate dehydrogenase 2 (MDH2), hydroxyacyl-coenzyme A dehydrogenase (HADH), and superoxide dismutase 2 (SOD2). (B-F) Corresponding densitometry quantification using unpaired Student’s t-test (mean ± SEM, n=3, *=p<0.05, **=p<0.005, ***=p<0.0005, ****=p<0.0001).
Pathway Analysis Reveals Extensive Overlap in Metabolic Targets
Pathway analysis of proteins with decreased succinylation, proteins with increased acetylation, proteins with increased acetylation and decreased succinylation at the same lysine residue, and proteins with increased acetylation and/or decreased succinylation revealed widespread overlap of molecular functions, cellular components, and biological processes (Figure 9A–D). Mass spectrometry quantification shows the greatest ethanol-induced increases in acetylation and decreases in succinylation on the same lysine residue (differential acyl switching proteins) for proteins from fatty acid β-oxidation, the TCA cycle, the ETC, ketogenesis, pyruvate metabolism, glutathione redox, the urea cycle, and branched chain amino acid degradation, which are involved in the production of acetyl-CoA, propionyl-CoA, and succinyl-CoA (Figure 9C). These proteins can be found mapped within their pathways in Figure 10. Mass spectrometry quantification of non-overlapping ethanol-induced increases in acetylation and/or decreases in succinylation on different lysine residues shows the largest changes for proteins from all of the same pathways described above, but with almost twice the number of proteins per pathway (Figure 9D). Comparing the pathway analysis for all acetylated peptides versus all succinylated peptides shows a trend of overlapping pathways with the number of proteins represented in the acetylated peptide analysis 1.5 to 2 times greater than for the succinylated peptide analysis (Figure 9A+B).
Figure 9.

Pathway analysis of acetylated and succinylated mitochondrial proteins common to WT, SIRT3 KO and SIRT5 KO mice. (A) Pathway analysis of all WT, SIRT3 KO and SIRT5 KO mouse liver mitochondrial proteins with decreased succinylation. (B) Pathway analysis of all WT, SIRT3 KO and SIRT5 KO mouse liver mitochondrial proteins with increased acetylation. (C) Pathway analysis of all WT, SIRT3 KO and SIRT5 KO mouse liver mitochondrial proteins with increased acetylation and decreased succinylation at the same lysine residue as a function of chronic ethanol feeding (differential acyl switching proteins). (D) Pathway analysis of all WT, SIRT3 KO and SIRT5 KO mouse liver mitochondrial proteins with increased acetylation and/or decreased succinylation on different lysine residues as a function of chronic ethanol feeding.
* The first number after each bar on the graph represents the number of acetylated and/or succinylated proteins identified per pathway. The second number represents the fold enrichment for that pathway.
Figure 10.

Ethanol induces hyperacetylation and hyposuccinylation of mitochondrial proteins involved in diverse metabolic pathways. Map depicts the main mitochondrial pathways showing differential acyl switching proteins identified in each pathway in colored boxes. See also Figures Sl–S5 and Table S1.
Proteins with ethanol-induced increases in acetylation and decreases in succinylation on the same lysine residue, which we term differential acyl switching proteins, are found in most of the mitochondrial metabolic pathways (Figure 10). Here, differential acyl switching proteins are highly represented in the TCA cycle, fatty acid β-oxidation, the ETC, the urea cycle, ketogenesis, glutathione metabolism, glutamate metabolism, and branched chain amino acid degradation. Not surprisingly, proteins containing ethanol-induced increases in acetylation and/or decreases in succinylation, that don’t overlap, demonstrate greater representation in these pathways, as well as representation in a wider array of metabolic pathways in general (Figure 9D). Metabolomics analysis was performed to support and expand upon the acetylation and succinylation pathway analysis data. Metabolomics data can be found in the metabolomics section above and in Figures S1–S5.
DISCUSSION
Lysine acetylation and succinylation is thought to regulate a wide variety of proteins that play central roles in metabolism and cell signaling.30,70–71However, the direct competition that exists among the many lysine-targeted PTMs is poorly characterized and is rarely quantified by HPLC-MS/MS. In order to study the interactions between different acylation events and their potential impact on cellular function, we quantified ethanol-induced changes in hepatic mitochondrial acetylation and succinylation in WT, SIRT3 KO, and SIRT5 KO mice. This research represents the first in vivo analysis where genotype has been used to induce acetylation and succinylation, with the addition of an ethanol diet, to reveal how ethanol metabolism alters lysine acylation. Our investigation led to two major findings. First, ethanol ingestion increases hepatic mitochondrial protein acetylation and decreases succinylation, often at the same lysine residue, supporting the idea that acetyl and succinyl groups compete for occupancy of lysine sites on the same protein. Second, the proteins with increased acetylation and decreased succinylation at the same lysine residue, which we term differential acyl switching proteins, are acylated at or near regulatory sites and map to similar mitochondrial metabolic pathways. These dynamic targets of protein acylation are associated with lipid metabolism, the ETC, TCA cycle, and antioxidant response, demonstrating crosstalk between acetylation and succinylation in ALD. These findings suggest that protein acylation is a regulatory mechanism that modifies lysine residues of differential acyl switching proteins that sense cellular nutrient status and alters global cellular metabolism to accommodate these conditions.
The impact of lysine acetylation and succinylation on proteins imparts a significant alteration in the charge-state of lysine residues. Unmodified lysine residues retain a positive charge, while acetylated lysine residues display a neutral charge, and succinylated lysine residues are negatively charged. The neutralization of positive charges on lysine residues has been shown to impact protein structure and function, particularly in terms of protein activity, protein-protein interactions, protein-DNA interactions, subcellular localization, and protein conformation.58, 72–79 Indeed, the acidification of lysine residues with negatively charged succinyl groups could impair interactions between these lysine residues and negatively charged proteins, cofactors, small molecules, and nucleotides.24,80–81 The results of our quantitative analysis demonstrate that ethanol-induced changes in site-specific acylation occur for many proteins involved in metabolism. Altering protein function via PTMs through amino acid charge-state is a likely regulatory mechanism used within the mitochondria, and the cell as a whole, as an adaptive response to metabolic changes.
Mitochondrial protein deacylation is controlled by sirtuins. Sirtuins are a family of evolutionarily conserved NAD+-dependent lysine deacylases. SIRT3 has been identified as the primary mitochondrial protein deacetylase.38–39 SIRT5 is both a cytosolic and mitochondrial sirtuin with weak deacetylase activity.52–53 In contrast to SIRT3, SIRT5 appears to function as a desuccinylase, demalonylase, and deglutarylase, since it has an affinity for hydrolyzing negatively charged lysine modifications.21–24 SIRT3 has an active site with a negatively charged binding pocket and an affinity for hydrolyzing neutral lysine modifications, such as acetylation.82 Our ethanol model showed no significant changes in SIRT3 and SIRT5 abundance, supporting the hypothesis that ethanol-induced changes in mitochondrial protein acylation occur independently of changes in SIRT3 and SIRT5 abundance.12 Therapeutic intervention aimed at modulating protein acylation at the level of SIRT3 and SIRT5 activation could prove efficacious in altering metabolic and antioxidant responses through control of differential acyl switching proteins.83 Currently, there are no sirtuin modulators that have been approved for the treatment of disease. Up to now, only SIRT1 modulators have entered clinical trials, including one SIRT1 inhibitor (Selistat), and four SIRT1 activators (resveratrol, SRT2104, SRT2379, and SRT3025).83–84 These four SIRT1 activators are the only SIRT1 modulators that have been used in clinical trials involving metabolic diseases. Both have been studied in populations suffering from Type 2 diabetes mellitus, and resveratrol has been studied in populations suffering from nonalcoholic fatty liver disease and metabolic syndrome. Treatment with SRT2104 demonstrated improvement in lipids, but no impact on glucose or insulin control in patients with Type 2 diabetes. Treatment with resveratrol demonstrated a reduction in both fasting glucose and insulin resistance in patients with Type 2 diabetes.85 A total of 14 clinical trials involving SRT2104 have addressed disease conditions including psoriasis (NCT01154101, NCT01702493), ulcerative colitis (NCT01453491), sepsis (NCT01014117), skeletal muscle atrophy (NCT01039909, NCT00964340), chronic obstructive pulmonary disease (NCT00920660), and Type 2 diabetes mellitus (NCT00933530, NCT01018017, NCT00937872, NCT00937326, NCT01031108, NCT00938275, NCT00933062). SRT2379 has been studied in a total of three clinical trials involving sepsis (NCT01262911, NCT01416376) and Type 2 diabetes mellitus (NCT01018628). SRT 3025 has been investigated for the treatment of Type 2 diabetes mellitus and includes NCT01340911. There are over 150 clinical studies of resveratrol on record with NCT registry numbers, covering a broad spectrum of disease indications impacting almost every system in the human body.
In addition to regulating sirtuin activity, NAD+ impacts energy metabolism by acting as an electron acceptor and as a cofactor required for the function of both ADH and ALDH2 in the oxidative metabolism of ethanol. Further consequences of ethanol metabolism include decreased glycolysis and fatty acid oxidation, due in part to lower NAD+ concentrations. Acetyl-CoA flux may be a key driver of protein acetylation along with decreased sirtuin activity resulting from lower NAD+ concentrations.86 Interestingly, our proteomic analysis, as well as Lohr et al., identified Acss3 in mouse liver mitochondria, supporting the idea that acetate may be converted to acetyl-CoA within the mitochondria and may contribute directly to protein acetylation.87 Additional research suggests that acetaldehyde concentrations may influence lysine acetylation.88 In aggregate, the potential exists for NAD+, acetyl-CoA, and acetaldehyde to impact lysine acetylation, especially during ethanol metabolism.89–91
The identification of roughly 80 differential acyl switching proteins that demonstrate an increase in acetylation and decrease in succinylation at the same lysine residue in response to ethanol metabolism proves a significant finding (Table S2, Differential Acyl Switching Proteins Sheet). These proteins are represented in almost every step of the TCA cycle, the ETC, and fatty acid β-oxidation. A number of these differential acyl switching proteins include the rate limiting steps for the TCA cycle (IDH2), the urea cycle (CPS1), β-oxidation of fatty acids (ACSF2 and CPT2), and ketogenesis (HMGCS2), which can be found in Table S1. In addition, differential acyl switching proteins are represented in the ETC, glutathione metabolism, alcohol metabolism, and branched chain amino acid metabolism. Indeed, these differential acyl switching proteins play a major role in energy producing metabolic pathways and antioxidant defenses. If the identified differential acyl switching proteins are inhibited due to protein acetylation, consequences include inhibition of the TCA cycle, β-oxidation, ketogenesis, and antioxidant pathways. Inhibition of the TCA cycle would not only result in decreased levels of NADH and FADH2 for the ETC, but also result in less conversion of isocitrate to α-ketoglutarate and decreased glutamate dehydrogenase activity, which maylead to decreased levels of NADPH.92–96 This idea is further supported by Figure S5, which demonstrates a general trend of decreased α-ketoglutarate and increased citrate in the ethanol groups compared to the control groups for each genotype. However, the only comparison that is statistically significant by two-way ANOVA is the decrease in α-ketoglutarate in the SIRT5 KO ethanol group compared to the SIRT5 KO control group. NADPH is an essential cofactor in the reduction of glutathione, a critical antioxidant known to be decreased during ethanol consumption, which likely impacts the regeneration of GSH within the mitochondria. The cumulative effect of differential acyl switching protein inhibition through acylation could provide novel insight toward mechanistic consequences of ethanol metabolism and alcoholic liver disease.
In aggregate, our data reveal a highly dynamic response to metabolism through lysine acylation within a specific subset of mitochondrial proteins. These newly identified differential acyl switching proteins are altered as a direct consequence of ethanol metabolism. It remains unclear whether the observed ethanol-induced alterations in protein acylation are due to NAD+ decreases, acetyl and succinyl-CoA concentrations, and/or the generation of acetate and acetaldehyde. Regardless, the extensive overlap of the acetylome and succinylome, as well as the observed shift toward increased acetylation and decreased succinylation supports the existence of a competitive environment for lysine site occupation by acetyl and succinyl modifications. Importantly, quantifying the competition among acetyl and succinyl lysine modifications provides the first step toward understanding stoichiometric shifts in protein acylation resulting from metabolism. The discovery of direct competition between the lysine acetylome and succinylome also supports the further quantitative investigation of these PTMs in the context of other models of metabolism (high fat diet and diabetes) as well as how these modifications impact protein structure and function.
Supplementary Material
Table S2. Mass spectrometry quantification of acetylated peptides, DAVID analysis and a list of differential acyl switching proteins with DAVID analysis. (XLSX)
Table S3. Mass spectrometry quantification of succinylated peptides with DAVID analysis. (XLSX)
Figure S1. Effect of ethanol and genotype on acylcarnitines C18–C22 in mouse liver. (PDF)
Figure S2. Effect of ethanol and genotype on acylcarnitines C2–C10 in mouse liver. (PDF)
Figure S3. Effect of ethanol and genotype on acylcarnitines C12–C16 in mouse liver. (PDF)
Figure S4. Effect of ethanol and genotype on amino acids in mouse liver. (PDF)
Figure S5. Effect of ethanol and genotype on organic acids in mouse liver. (PDF)
Table S1. Differential Acyl Switching Proteins and Pathways. (PDF)
ACKNOWLEDGEMENTS
This work was supported by the National Institutes of Health and the NIAAA grant R01AA022146 (K.S.F. and M.D.H.).
Footnotes
Publisher's Disclaimer: This document is confidential and is proprietary to the American Chemical Society and its authors. Do not copy or disclose without written permission. If you have received this item in error, notify the sender and delete all copies.
Supporting Information
The mass spectrometry proteomics data have been deposited to the ProteomeXchange Consortium via the PRIDE partner repository (http://www.ebi.ac.uk/pride/archive/) with the dataset identifier PXD012089.97
The following supporting information is available free of charge on the ACS Publications website http://pubs.acs.org.
The authors declare no competing interests.
REFERENCES
- 1.CDC Alcohol and Public Health: Alcohol-Related Disease Impact (ARDI) Average for United States 2006–2010 Alcohol-Attributable Deaths Due to Excessive Alcohol Use. https://www.cdc.gov/mmwr/Dreview/mmwrhtml/mm6310a2.htm: Center for Disease Control and Prevention: Atlanta, GA, 2013. [Google Scholar]
- 2.NIAAA, NIAAA Alcohol Facts and Statistics https://www.niaaa.nih.gov/alcohol-health/overview-alcohol-consumption/alcohol-facts-and-statistics.
- 3.WHO Global Status Report on Alcohol and Health 2014. http://aDDS.who.int/iris/bitstream/handle/10665/112736/9789240692763_eng.pdf;jsessionid=708EFB859589D263182AE47910B08A25?seauence=1.; World Health Organization:Geneva, 2014. [Google Scholar]
- 4.Sacks JJ; Gonzales KR; Bouchery EE; Tomedi LE; Brewer RD, 2010 National and State Costs of Excessive Alcohol Consumption. American journal of preventive medicine 2015,49 (5), e73–e79. [DOI] [PubMed] [Google Scholar]
- 5.Cederbaum AI, Alcohol metabolism. Clin Liver Dis 2012,16 (4), 667–85. [DOI] [PMC free article] [PubMed] [Google Scholar]
- 6.Ceni E; Mello T; Galli A, Pathogenesis of alcoholic liver disease: role of oxidative metabolism. World J Gastroenterol 2014,20 (47), 17756–72. [DOI] [PMC free article] [PubMed] [Google Scholar]
- 7.Ghosh Dastidar S; Warner JB; Warner DR; McClain CJ; Kirpich IA, Rodent Models of Alcoholic Liver Disease: Role of Binge Ethanol Administration. Biomolecules 2018, 8(1). [DOI] [PMC free article] [PubMed] [Google Scholar]
- 8.Miller AM; Horiguchi N; Jeong WI; Radaeva S; Gao B, Molecular mechanisms of alcoholic liver disease: innate immunity and cytokines. Alcoholism, clinical and experimental research 2011,35 (5), 787–93. [DOI] [PMC free article] [PubMed] [Google Scholar]
- 9.Nassir F; Ibdah JA, Role of mitochondria in alcoholic liver disease. World J Gastroenterol 2014,20 (9), 2136–42. [DOI] [PMC free article] [PubMed] [Google Scholar]
- 10.Han D; Johnson HS; Rao MP; Martin G; Sancheti H; Silkwood KH; Decker CW; Nguyen KT; Casian JG; Cadenas E; Kaplowitz N, Mitochondrial remodeling in the liver following chronic alcohol feeding to rats. Free Radic Biol Med 2017,102, 100–110. [DOI] [PMC free article] [PubMed] [Google Scholar]
- 11.Fritz KS; Galligan JJ; Hirschey MD; Verdin E; Petersen DR, Mitochondrial acetylome analysis in a mouse model of alcohol-induced liver injury utilizing SIRT3 knockout mice. Journal of proteome research 2012,11 (3), 1633–43. [DOI] [PMC free article] [PubMed] [Google Scholar]
- 12.Fritz KS; Green MF; Petersen DR; Hirschey MD, Ethanol metabolism modifies hepatic protein acylation in mice. PloS one 2013,8 (9), e75868. [DOI] [PMC free article] [PubMed] [Google Scholar]
- 13.Lee YJ; Shukla SD, Histone H3 phosphorylation at serine 10 and serine 28 is mediated by p38 MAPK in rat hepatocytes exposed to ethanol and acetaldehyde. European journal of pharmacology 2007,573 (1–3), 29–38. [DOI] [PMC free article] [PubMed] [Google Scholar]
- 14.Pal-Bhadra M; Bhadra U; Jackson DE; Mamatha L; Park PH; Shukla SD, Distinct methylation patterns in histone H3 at Lys-4 and Lys-9 correlate with up-& down-regulation of genes by ethanol in hepatocytes. Life sciences 2007,81 (12), 979–87. [DOI] [PMC free article] [PubMed] [Google Scholar]
- 15.Picklo MJ Sr., Ethanol intoxication increases hepatic N-lysyl protein acetylation. Biochemical and biophysical research communications 2008,376 (3), 615–9. [DOI] [PubMed] [Google Scholar]
- 16.Shepard BD; Tuma DJ; Tuma PL, Chronic Ethanol Consumption Induces Global Hepatic Protein Hyperacetylation. Alcoholism, clinical and experimental research 2010,34 (2), 280–291. [DOI] [PMC free article] [PubMed] [Google Scholar]
- 17.Galligan JJ; Smathers RL; Fritz KS; Epperson LE; Hunter LE; Petersen DR, Protein carbonylation in a murine model for early alcoholic liver disease. Chemical research in toxicology 2012,25 (5), 1012–21. [DOI] [PMC free article] [PubMed] [Google Scholar]
- 18.Nishida Y; Rardin MJ; Carrico C; He W; Sahu AK; Gut P; Najjar R; Fitch M; Hellerstein M; Gibson BW; Verdin E, SIRT5 Regulates both Cytosolic and Mitochondrial Protein Malonylation with Glycolysis as a Major Target. Molecular cell 2015,59 (2), 321–32. [DOI] [PMC free article] [PubMed] [Google Scholar]
- 19.Sadhukhan S; Liu X; Ryu D; Nelson OD; Stupinski JA; Li Z; Chen W; Zhang S; Weiss RS; Locasale JW; Auwerx J; Lin H, Metabolomics-assisted proteomics identifies succinylation and SIRT5 as important regulators of cardiac function. Proc Natl Acad Sci USA 2016,113 (16), 4320–5. [DOI] [PMC free article] [PubMed] [Google Scholar]
- 20.Chen Y; Sprung R; Tang Y; Ball H; Sangras B; Kim SC; Falck JR; Peng J; Gu W; Zhao Y, Lysine propionylation and butyrylation are novel post-translational modifications in histones. Molecular & cellular proteomics: MCP 2007, 6 (5), 812–9. [DOI] [PMC free article] [PubMed] [Google Scholar]
- 21.Du J; Zhou Y; Su X; Yu JJ; Khan S; Jiang H; Kim J; Woo J; Kim JH; Choi BH; He B; Chen W; Zhang S; Cerione RA; Auwerx J; Hao Q; Lin H, Sirt5 is a NAD-dependent protein lysine demalonylase and desuccinylase. Science 2011, 334 (6057), 806–9. [DOI] [PMC free article] [PubMed] [Google Scholar]
- 22.Peng C; Lu Z; Xie Z; Cheng Z; Chen Y; Tan M; Luo H; Zhang Y; He W; Yang K; Zwaans BM; Tishkoff D; Ho L; Lombard D; He TC; Dai J; Verdin E; Ye Y; Zhao Y, The first identification of lysine malonylation substrates and its regulatory enzyme. Molecular & cellular proteomics : MCP 2011,10 (12), M111 012658. [DOI] [PMC free article] [PubMed] [Google Scholar]
- 23.Tan M; Peng C; Anderson KA; Chhoy P; Xie Z; Dai L; Park J; Chen Y; Huang H; Zhang Y; Ro J; Wagner GR; Green MF; Madsen AS; Schmiesing J; Peterson BS; Xu G; Ilkayeva OR; Muehlbauer MJ; Braulke T; Muhlhausen C; Backos DS; Olsen CA; McGuire PJ; Pletcher SD; Lombard DB; Hirschey MD; Zhao Y, Lysine glutarylation is a protein posttranslational modification regulated by SIRT5. Cell metabolism 2014,19 (4), 605–17. [DOI] [PMC free article] [PubMed] [Google Scholar]
- 24.Zhang Z; Tan M; Xie Z; Dai L; Chen Y; Zhao Y, Identification of lysine succinylation as a new post-translational modification. Nature chemical biology 2011, 7(1), 58–63. [DOI] [PMC free article] [PubMed] [Google Scholar]
- 25.Galligan JJ; Smathers RL; Shearn CT; Fritz KS; Backos DS; Jiang H; Franklin CC; Orlicky DJ; Maclean KN; Petersen DR, Oxidative Stress and the ER Stress Response in a Murine Model for Early-Stage Alcoholic Liver Disease. Journal of toxicology 2012,2012, 207594. [DOI] [PMC free article] [PubMed] [Google Scholar]
- 26.Shearn CT; Pulliam CF; Pedersen K; Meredith K; Mercer KE; Saba LM; Orlicky DJ; Ronis MJ; Petersen DR, Knockout of the Gsta4 Gene in Male Mice Leads to an Altered Pattern of Hepatic Protein Carbonylation and Enhanced Inflammation Following Chronic Consumption of an Ethanol Diet. Alcoholism, clinical and experimental research 2018,42 (7), 1192–1205. [DOI] [PMC free article] [PubMed] [Google Scholar]
- 27.Wagner GR; Hirschey MD, Nonenzymatic protein acylation as a carbon stress regulated by sirtuin deacylases. Molecular cell 2014,54 (1), 5–16. [DOI] [PMC free article] [PubMed] [Google Scholar]
- 28.Wagner GR; Payne RM, Widespread and enzyme-independent Nepsilon-acetylation and Nepsilon-succinylation of proteins in the chemical conditions of the mitochondrial matrix. The Journal of biological chemistry 2013,288 (40), 29036–45. [DOI] [PMC free article] [PubMed] [Google Scholar]
- 29.Baeza J; Smallegan MJ; Denu JM, Site-specific reactivity of nonenzymatic lysine acetylation. ACS chemical biology 2015,10 (1), 122–8. [DOI] [PMC free article] [PubMed] [Google Scholar]
- 30.Wagner GR; Bhatt DP; O’Connell TM; Thompson JW; Dubois LG; Backos DS; Yang H; Mitchell GA; Ilkayeva OR; Stevens RD; Grimsrud PA; Hirschey MD, A Class of Reactive Acyl-CoA Species Reveals the Non-enzymatic Origins of Protein Acylation. Cell metabolism 2017,25 (4), 823–837 e8. [DOI] [PMC free article] [PubMed] [Google Scholar]
- 31.Hebert AS; Dittenhafer-Reed KE; Yu W; Bailey DJ; Selen ES; Boersma MD; Carson JJ; Tonelli M; Balloon AJ; Higbee AJ; Westphall MS; Pagliarini DJ; Prolla TA; Assadi-Porter F; Roy S; Denu JM; Coon JJ, Calorie restriction and SIRT3 trigger global reprogramming of the mitochondrial protein acetylome. Molecular cell 2013,49 (1),186–99. [DOI] [PMC free article] [PubMed] [Google Scholar]
- 32.Kendrick AA; Choudhury M; Rahman SM; McCurdy CE; Friederich M; Van Hove JL; Watson PA; Birdsey N; Bao J; Gius D; Sack MN; Jing E; Kahn CR; Friedman JE; Jonscher KR, Fatty liver is associated with reduced SIRT3 activity and mitochondrial protein hyperacetylation. The Biochemical journal 2011,433 (3), 505–14. [DOI] [PMC free article] [PubMed] [Google Scholar]
- 33.Rardin MJ; Newman JC; Held JM; Cusack MP; Sorensen DJ; Li B; Schilling B; Mooney SD; Kahn CR; Verdin E; Gibson BW, Label-free quantitative proteomics of the lysine acetylome in mitochondria identifies substrates of SIRT3 in metabolic pathways. Proc Natl Acad Sci USA 2013,110 (16), 6601–6. [DOI] [PMC free article] [PubMed] [Google Scholar]
- 34.Still AJ; Floyd BJ; Hebert AS; Bingman CA; Carson JJ; Gunderson DR; Dolan BK; Grimsrud PA; Dittenhafer-Reed KE; Stapleton DS; Keller MP; Westphall MS; Denu JM; Attie AD; Coon JJ; Pagliarini DJ, Quantification of mitochondrial acetylation dynamics highlights prominent sites of metabolic regulation. The Journal of biological chemistry 2013,288 (36), 26209–19. [DOI] [PMC free article] [PubMed] [Google Scholar]
- 35.Meyer JG; D’Souza AK; Sorensen DJ; Rardin MJ; Wolfe AJ; Gibson BW; Schilling B, Quantification of Lysine Acetylation and Succinylation Stoichiometry in Proteins Using Mass Spectrometric Data-Independent Acquisitions (SWATH). Journal of the American Society for Mass Spectrometry 2016, 27 (11), 1758–1771. [DOI] [PMC free article] [PubMed] [Google Scholar]
- 36.Weinert BT; Scholz C; Wagner SA; Iesmantavicius V; Su D; Daniel JA; Choudhary C, Lysine succinylation is a frequently occurring modification in prokaryotes and eukaryotes and extensively overlaps with acetylation. Cell reports 2013,4(4), 842–51. [DOI] [PubMed] [Google Scholar]
- 37.Nakagawa T; Guarente L, Sirtuins at a glance. Joumal of cell science 2011,124 (Pt 6), 833–8. [DOI] [PMC free article] [PubMed] [Google Scholar]
- 38.Lombard DB; Alt FW; Cheng HL; Bunkenborg J; Streeper RS; Mostoslavsky R; Kim J; Yancopoulos G; Valenzuela D; Murphy A; Yang Y; Chen Y; Hirschey MD; Bronson RT; Haigis M; Guarente LP; Farese RV Jr.; Weissman S; Verdin E; Schwer B, Mammalian Sir2 homolog SIRT3 regulates global mitochondrial lysine acetylation. Molecular and cellular biology 2007,27 (24), 8807–14. [DOI] [PMC free article] [PubMed] [Google Scholar]
- 39.Schwer B; North BJ; Frye RA; Ott M; Verdin E, The human silent information regulator (Sir)2 homologue hSIRT3 is a mitochondrial nicotinamide adenine dinucleotide-dependent deacetylase. The Journal of cell biology 2002,158 (4), 647–57. [DOI] [PMC free article] [PubMed] [Google Scholar]
- 40.Sun W; Liu C; Chen Q; Liu N; Yan Y; Liu B, SIRT3: A New Regulator of Cardiovascular Diseases. Oxidative Medicine and Cellular Longevity 2018,2018,11. [DOI] [PMC free article] [PubMed] [Google Scholar]
- 41.Shi T; Wang F; Stieren E; Tong Q, SIRT3, a mitochondrial sirtuin deacetylase, regulates mitochondrial function and thermogenesis in brown adipocytes. The Journal of biological chemistry 2005,280 (14), 13560–7. [DOI] [PubMed] [Google Scholar]
- 42.Kong X; Wang R; Xue Y; Liu X; Zhang H; Chen Y; Fang F; Chang Y, Sirtuin 3, a new target of PGC-lalpha, plays an important role in the suppression of ROS and mitochondrial biogenesis. PloS one 2010,5 (7), e11707. [DOI] [PMC free article] [PubMed] [Google Scholar]
- 43.Alhazzazi TY; Kamarajan P; Verdin E; Kapila YL, SIRT3 and cancer: tumor promoter or suppressor? Biochimica et biophysica acta 2011,1816 (1), 80–8. [DOI] [PMC free article] [PubMed] [Google Scholar]
- 44.Bellizzi D; Rose G; Cavalcante P; Covello G; Dato S; De Rango F; Greco V; Maggiolini M; Feraco E; Mari V; Franceschi C; Passarino G; De Benedictis G, A novel VNTR enhancer within the SIRT3 gene, a human homologue of SIR2, is associated with survival at oldest ages. Genomics 2005,85 (2), 258–63. [DOI] [PubMed] [Google Scholar]
- 45.Cho EH, SIRT3 as a Regulator of Non-alcoholic Fatty Liver Disease. Journal of lifestyle medicine 2014,4 (2), 80–5. [DOI] [PMC free article] [PubMed] [Google Scholar]
- 46.Shimazu T; Hirschey MD; Hua L; Dittenhafer-Reed KE; Schwer B; Lombard DB; Li Y; Bunkenborg J; Alt FW; Denu JM; Jacobson MP; Verdin E, SIRT3 deacetylates mitochondrial 3-hydroxy-3-methylglutaryl CoA synthase 2 and regulates ketone body production. Cell metabolism 2010,12 (6), 654–61. [DOI] [PMC free article] [PubMed] [Google Scholar]
- 47.Yang Y; Cimen H; Han MJ; Shi T; Deng JH; Koc H; Palacios OM; Montier L; Bai Y; Tong Q; Koc EC, NAD+-dependent deacetylase SIRT3 regulates mitochondrial protein synthesis by deacetylation of the ribosomal protein MRPL10. The Journal of biological chemistry 2010,285 (10), 7417–29. [DOI] [PMC free article] [PubMed] [Google Scholar]
- 48.Schlicker C; Gertz M; Papatheodorou P; Kachholz B; Becker CF; Steegborn C, Substrates and regulation mechanisms for the human mitochondrial sirtuins Sirt3 and Sirt5. Journal of molecular biology 2008,382 (3), 790–801. [DOI] [PubMed] [Google Scholar]
- 49.Cimen H; Han MJ; Yang Y; Tong Q; Koc H; Koc EC, Regulation of succinate dehydrogenase activity by SIRT3 in mammalian mitochondria. Biochemistry 2010, 49(2), 304–11. [DOI] [PMC free article] [PubMed] [Google Scholar]
- 50.Hirschey MD; Shimazu T; Goetzman E; Jing E; Schwer B; Lombard DB; Grueter CA; Harris C; Biddinger S; Ilkayeva OR; Stevens RD; Li Y; Saha AK; Ruderman NB; Bain JR; Newgard CB; Farese RV Jr.; Alt FW; Kahn CR; Verdin E, SIRT3 regulates mitochondrial fatty-acid oxidation by reversible enzyme deacetylation. Nature 2010,464 (7285), 121–5. [DOI] [PMC free article] [PubMed] [Google Scholar]
- 51.Schwer B; Bunkenborg J; Verdin RO; Andersen JS; Verdin E, Reversible lysine acetylation controls the activity of the mitochondrial enzyme acetyl-CoA synthetase 2. Proc Natl Acad Sci USA 2006,103 (27), 10224–9. [DOI] [PMC free article] [PubMed] [Google Scholar]
- 52.Nakagawa T; Lomb DJ; Haigis MC; Guarente L, SIRT5 Deacetylates carbamoyl phosphate synthetase 1 and regulates the urea cycle. Cell 2009,137 (3), 560–70. [DOI] [PMC free article] [PubMed] [Google Scholar]
- 53.Matsushita N; Yonashiro R; Ogata Y; Sugiura A; Nagashima S; Fukuda T; Inatome R; Yanagi S, Distinct regulation of mitochondrial localization and stability of two human Sirt5 isoforms. Genes to cells : devoted to molecular & cellular mechanisms 2011,16 (2), 190–202. [DOI] [PubMed] [Google Scholar]
- 54.Park J; Chen Y; Tishkoff DX; Peng C; Tan M; Dai L; Xie Z; Zhang Y; Zwaans BM; Skinner ME; Lombard DB; Zhao Y, SIRT5-mediated lysine desuccinylation impacts diverse metabolic pathways. Molecular cell 2013, 50 (6), 919–30. [DOI] [PMC free article] [PubMed] [Google Scholar]
- 55.Rardin MJ; He W; Nishida Y; Newman JC; Carrico C; Danielson SR; Guo A; Gut P; Sahu AK; Li B; Uppala R; Fitch M; Riiff T; Zhu L; Zhou J; Mulhern D; Stevens RD; Ilkayeva OR; Newgard CB; Jacobson MP; Hellerstein M; Goetzman ES; Gibson BW; Verdin E, SIRT5 regulates the mitochondrial lysine succinylome and metabolic networks. Cell metabolism 2013,18 (6), 920–33. [DOI] [PMC free article] [PubMed] [Google Scholar]
- 56.Baeza J; Dowell JA; Smallegan MJ; Fan J; Amador-Noguez D; Khan Z; Denu JM, Stoichiometry of site-specifìc lysine acetylation in an entire proteome. The Journal of biological chemistry 2014,289 (31), 21326–38. [DOI] [PMC free article] [PubMed] [Google Scholar]
- 57.Dimauro I; Pearson T; Caporossi D; Jackson MJ, A simple protocol for the subcellular fractionation of skeletal muscle cells and tissue. BMC research notes 2012,5, 513. [DOI] [PMC free article] [PubMed] [Google Scholar]
- 58.Assiri MA; Roy SR; Harris PS; Ali H; Liang Y; Shearn CT; Orlicky DJ; Roede JR; Hirschey MD; Backos DS; Fritz KS, Chronic Ethanol Metabolism Inhibits Hepatic Mitochondrial Superoxide Dismutase via Lysine Acetylation. Alcoholism, clinical and experimental research 2017,41 (10), 1705–1714. [DOI] [PMC free article] [PubMed] [Google Scholar]
- 59.Huang da W; Sherman BT; Lempicki RA, Systematic and integrative analysis of large gene lists using DAVID bioinformatics resources. Nature protocols 2009, 4 (1), 44–57. [DOI] [PubMed] [Google Scholar]
- 60.Huang da W; Sherman BT; Lempicki RA, Bioinformatics enrichment tools: paths toward the comprehensive functional analysis of large gene lists. Nucleic acids research 2009,37 (1), 1–13. [DOI] [PMC free article] [PubMed] [Google Scholar]
- 61.An J; Muoio DM; Shiota M; Fujimoto Y; Cline GW; Shulman GI; Koves TR; Stevens R; Millington D; Newgard CB, Hepatic expression of malonyl-CoA decarboxylase reverses muscle, liver and whole-animal insulin resistance. Nat Med 2004,10 (3), 268–74. [DOI] [PubMed] [Google Scholar]
- 62.Ferrara CT; Wang P; Neto EC; Stevens RD; Bain JR; Wenner BR; Ilkayeva OR; Keller MP; Blasiole DA; Kendziorski C; Yandell BS; Newgard CB; Attie AD, Genetic networks of liver metabolism revealed by integration of metabolic and transcriptional profiling. PLoS Genet 2008,4 (3), e1000034. [DOI] [PMC free article] [PubMed] [Google Scholar]
- 63.Jensen MV; Joseph JW; Ilkayeva O; Burgess S; Lu D; Ronnebaum SM; Odegaard M; Becker TC; Sherry AD; Newgard CB, Compensatory responses to pyruvate carboxylase suppression in islet beta-cells. Preservation of glucose-stimulated insulin secretion. The Journal of biological chemistry 2006,281 (31), 22342–51. [DOI] [PubMed] [Google Scholar]
- 64.Liu Z; Que S; Xu J; Peng T, Alanine aminotransferase-old biomarker and new concept: a review. International journal of medical sciences 2014,11 (9), 925–35. [DOI] [PMC free article] [PubMed] [Google Scholar]
- 65.Guarente L, Calorie restriction and sirtuins revisited. Genes & development 2013, 27 (19), 2072–85. [DOI] [PMC free article] [PubMed] [Google Scholar]
- 66.Buhler R; Lindros KO; von Boguslawsky K; Karkkainen P; Makinen J; Ingelman-Sundberg M, Perivenous expression of ethanol-inducible cytochrome P450 IIE1 in livers from alcoholics and chronically ethanol-fed rats. Alcohol and alcoholism 1991,1, 311–5. [PubMed] [Google Scholar]
- 67.Tsutsumi M; Lasker JM; Shimizu M; Rosman AS; Lieber CS, The intralobular distribution of ethanol-inducible P450IIE1 in rat and human liver. Hepatology 1989,10 (4), 437–46. [DOI] [PubMed] [Google Scholar]
- 68.Orlicky DJ; Roede JR; Bales E; Greenwood C; Greenberg A; Petersen D; McManaman JL, Chronic ethanol consumption in mice alters hepatocyte lipid droplet properties. Alcoholism, clinical and experimental research 2011,35 (6), 1020–33. [DOI] [PMC free article] [PubMed] [Google Scholar]
- 69.Ye X; Li M; Hou T; Gao T; Zhu WG; Yang Y, Sirtuins in glucose and lipid metabolism. Oncotarget 2017,8 (1), 1845–1859. [DOI] [PMC free article] [PubMed] [Google Scholar]
- 70.Baeza J; Smallegan MJ; Denu JM, Mechanisms and Dynamics of Protein Acetylation in Mitochondria. Trends Biochem Sci 2016,41 (3), 231–44. [DOI] [PMC free article] [PubMed] [Google Scholar]
- 71.Xiong Y; Guan KL, Mechanistic insights into the regulation of metabolic enzymes by acetylation. The Journal of cell biology 2012,198 (2), 155–64. [DOI] [PMC free article] [PubMed] [Google Scholar]
- 72.Carabetta VJ; Cristea IM, Regulation, Function, and Detection of Protein Acetylation in Bacteria. Journal of bacteriology 2017,199 (16). [DOI] [PMC free article] [PubMed] [Google Scholar]
- 73.Glozak MA; Sengupta N; Zhang X; Seto E, Acetylation and deacetylation of non-histone proteins. Gene 2005,363,15–23. [DOI] [PubMed] [Google Scholar]
- 74.Gu W; Roeder RG, Activation of p53 sequence-specific DNA binding by acetylation of the p53 C-terminal domain. Cell 1997, 90 (4), 595–606. [DOI] [PubMed] [Google Scholar]
- 75.Howe FS; Boubriak I; Sale MJ; Nair A; Clynes D; Grijzenhout A; Murray SC; Woloszczuk R; Mellor J, Lysine acetylation controls local protein conformation by influencing proline isomerization. Molecular cell 2014,55 (5), 733–44. [DOI] [PMC free article] [PubMed] [Google Scholar]
- 76.Ishfaq M; Maeta K; Maeda S; Natsume T; Ito A; Yoshida M, Acetylation regulates subcellular localization of eukaryotic translation initiation factor 5A (eIF5A). FEBS letters 2012,586 (19), 3236–41. [DOI] [PubMed] [Google Scholar]
- 77.Li T; Diner BA; Chen J; Cristea IM, Acetylation modulates cellular distribution and DNA sensing ability of interferon-inducible protein IFI16. Proc Natl Acad Sci USA 2012,109 (26), 10558–63. [DOI] [PMC free article] [PubMed] [Google Scholar]
- 78.Zhang T; Wang S; Lin Y; Xu W; Ye D; Xiong Y; Zhao S; Guan KL, Acetylation negatively regulates glycogen phosphorylase by recruiting protein phosphatase 1. Cell metabolism 2012,15 (1), 75–87. [DOI] [PMC free article] [PubMed] [Google Scholar]
- 79.Harris PS; Gomez JD; Backos DS; Fritz KS, Characterizing Sirtuin 3 Deacetylase Affinity for Aldehyde Dehydrogenase 2. Chemical research in toxicology 2017,30 (3), 785–793. [DOI] [PMC free article] [PubMed] [Google Scholar]
- 80.Hirschey MD; Zhao Y, Metabolic Regulation by Lysine Malonylation, Succinylation, and Glutarylation. Molecular & cellular proteomics : MCP 2015, 14 (9), 2308–15. [DOI] [PMC free article] [PubMed] [Google Scholar]
- 81.Yang M; Wang Y; Chen Y; Cheng Z; Gu J; Deng J; Bi L; Chen C; Mo R; Wang X; Ge F, Succinylome Analysis Reveals the Involvement of Lysine Succinylation in Metabolism in Pathogenic Mycobacterium tuberculosis. Molecular & cellular proteomics: MCP 2015,14 (4), 796–811. [DOI] [PMC free article] [PubMed] [Google Scholar]
- 82.Smith BC; Settles B; Hallows WC; Craven MW; Denu JM, SIRT3 substrate specificity determined by peptide arrays and machine learning. ACS chemical biology 2011, 6 (2), 146–57. [DOI] [PMC free article] [PubMed] [Google Scholar]
- 83.Villalba JM; Alcain FJ, Sirtuin activators and inhibitors. Bio Factors 2012, 38 (5), 349–59. [DOI] [PMC free article] [PubMed] [Google Scholar]
- 84.Dai H; Sinclair DA; Ellis JL; Steegborn C, Sirtuin activators and inhibitors: Promises, achievements, and challenges. Pharmacology & therapeutics 2018. [DOI] [PMC free article] [PubMed] [Google Scholar]
- 85.Kane AE; Sinclair DA, Sirtuins and NAD(+) in the Development and Treatment of Metabolic and Cardiovascular Diseases. Circulation research 2018, 123 (7), 868–885. [DOI] [PMC free article] [PubMed] [Google Scholar]
- 86.Kannarkat GT; Tuma DJ; Tuma PL, Microtubules are more stable and more highly acetylated in ethanol-treated hepatic cells. Journal of hepatology 2006, 44 (5), 963–70. [DOI] [PubMed] [Google Scholar]
- 87.Lohr K; Pachl F; Moghaddas Gholami A; Geillinger KE; Daniel H; Kuster B; Klingenspor M, Reduced mitochondrial mass and function add to age-related susceptibility toward diet-induced fatty liver in C57BL/6J mice. Physiological reports 2016,4 (19). [DOI] [PMC free article] [PubMed] [Google Scholar]
- 88.Doody EE; Groebner JL; Walker JR; Frizol BM; Tuma DJ; Fernandez DJ; Tuma PL, Ethanol metabolism by alcohol dehydrogenase or cytochrome P450 2E1 differentially impairs hepatic protein trafficking and growth hormone signaling. Am J Physiol Gastrointest Liver Physiol 2017, ajpgi 00027 2017. [DOI] [PMC free article] [PubMed] [Google Scholar]
- 89.Canto C; Menzies KJ; Auwerx J, NAD(+) Metabolism and the Control of Energy Homeostasis: A Balancing Act between Mitochondria and the Nucleus. Cell metabolism 2015,22 (1), 31–53. [DOI] [PMC free article] [PubMed] [Google Scholar]
- 90.Kim SC; Sprung R; Chen Y; Xu Y; Ball H; Pei J; Cheng T; Kho Y; Xiao H; Xiao L; Grishin NV; White M; Yang XJ; Zhao Y, Substrate and functional diversity of lysine acetylation revealed by a proteomics survey. Molecular cell 2006,23 (4), 60718. [DOI] [PubMed] [Google Scholar]
- 91.Imai SI; Guarente L, It takes two to tango: NAD(+) and sirtuins in aging/longevity control. NPJ aging and mechanisms of disease 2016,2,16017. [DOI] [PMC free article] [PubMed] [Google Scholar]
- 92.Ronchi JA; Figueira TR; Ravagnani FG; Oliveira HC; Vercesi AE; Castilho RF, A spontaneous mutation in the nicotinamide nucleotide transhydrogenase gene of C57BL/6J mice results in mitochondrial redox abnormalities. Free radical biology & medicine 2013,63,446–56. [DOI] [PubMed] [Google Scholar]
- 93.Rydstrom J, Mitochondrial NADPH, transhydrogenase and disease. Biochimica et biophysica acta 2006,1757 (5–6), 721–6. [DOI] [PubMed] [Google Scholar]
- 94.Ronchi JA; Francisco A; Passos LA; Figueira TR; Castilho RF, The Contribution of Nicotinamide Nucleotide Transhydrogenase to Peroxide Detoxification Is Dependent on the Respiratory State and Counterbalanced by Other Sources of NADPH in Liver Mitochondria. The Journal of biological chemistry 2016,291 (38), 20173–87. [DOI] [PMC free article] [PubMed] [Google Scholar]
- 95.Lewis CA; Parker SJ; Fiske BP; McCloskey D; Gui DY; Green CR; Vokes NI; Feist AM; Vander Heiden MG; Metallo CM, Tracing compartmentalized NADPH metabolism in the cytosol and mitochondria of mammalian cells. Molecular cell 2014,55 (2), 253–63. [DOI] [PMC free article] [PubMed] [Google Scholar]
- 96.Goodman RP; Calvo SE; Mootha VK, Spatiotemporal compartmentalization of hepatic NADH and NADPH metabolism. The Journal of biological chemistry 2018,293 (20), 7508–7516. [DOI] [PMC free article] [PubMed] [Google Scholar]
- 97.Vizcaino JA; Csordas A; Del-Toro N; Dianes JA; Griss J; Lavidas I; Mayer G; Perez-Riverol Y; Reisinger F; Ternent T; Xu QW; Wang R; Hermjakob H, 2016 update of the PRIDE database and its related tools. Nucleic acids research 2016,44 (22), 11033. [DOI] [PMC free article] [PubMed] [Google Scholar]
Associated Data
This section collects any data citations, data availability statements, or supplementary materials included in this article.
Supplementary Materials
Table S2. Mass spectrometry quantification of acetylated peptides, DAVID analysis and a list of differential acyl switching proteins with DAVID analysis. (XLSX)
Table S3. Mass spectrometry quantification of succinylated peptides with DAVID analysis. (XLSX)
Figure S1. Effect of ethanol and genotype on acylcarnitines C18–C22 in mouse liver. (PDF)
Figure S2. Effect of ethanol and genotype on acylcarnitines C2–C10 in mouse liver. (PDF)
Figure S3. Effect of ethanol and genotype on acylcarnitines C12–C16 in mouse liver. (PDF)
Figure S4. Effect of ethanol and genotype on amino acids in mouse liver. (PDF)
Figure S5. Effect of ethanol and genotype on organic acids in mouse liver. (PDF)
Table S1. Differential Acyl Switching Proteins and Pathways. (PDF)