Summary
DNA repair is essential to prevent the cytotoxic or mutagenic effects of various types of DNA lesions, which are sensed by distinct pathways to recruit repair factors specific to the damage type. Although biochemical mechanisms for repairing several forms of genomic insults are well understood, the upstream signaling pathways that trigger repair are established for only certain types of damage, such as double-stranded breaks and interstrand crosslinks1–3. Understanding the upstream signaling events that mediate recognition and repair of DNA alkylation damage is particularly important, since alkylation chemotherapy is one of the most widely used systemic modalities for cancer treatment and because environmental chemicals may trigger DNA alkylation4–6. Here, we demonstrate that human cells have a previously unrecognized signaling mechanism for sensing damage induced by alkylation. We find that the ASCC alkylation repair complex7 relocalizes to distinct nuclear foci specifically upon exposure of cells to alkylating agents. These foci associate with alkylated nucleotides, and coincide spatially with elongating RNA polymerase II and splicing components. Proper recruitment of the repair complex requires recognition of K63-linked polyubiquitin by the CUE domain of ASCC2. Loss of this subunit impedes alkylation adduct repair kinetics and increases sensitivity to alkylating agents, but not other forms of DNA damage. We identify RNF113A as the E3 ligase responsible for upstream ubiquitin signaling in the ASCC pathway. Cells from patients with X-linked trichothiodystrophy (TTD), which harbor a mutation in RNF113A, are defective in ASCC foci formation and are hypersensitive to alkylating agents. Together, our work reveals a heretofore unrecognized ubiquitin-dependent pathway induced specifically to repair alkylation damage, shedding light on the molecular mechanism of X-linked TTD.
A crucial first step in DNA repair involves the recognition of the damage, which in turn activates signaling pathways that recruit effectors and resolve the lesion. However, whether this “sensor-transducer-mediator” paradigm is generally applicable to pathways dedicated to repairing each distinct type of DNA lesion, such as alkylated lesions, remains unknown.
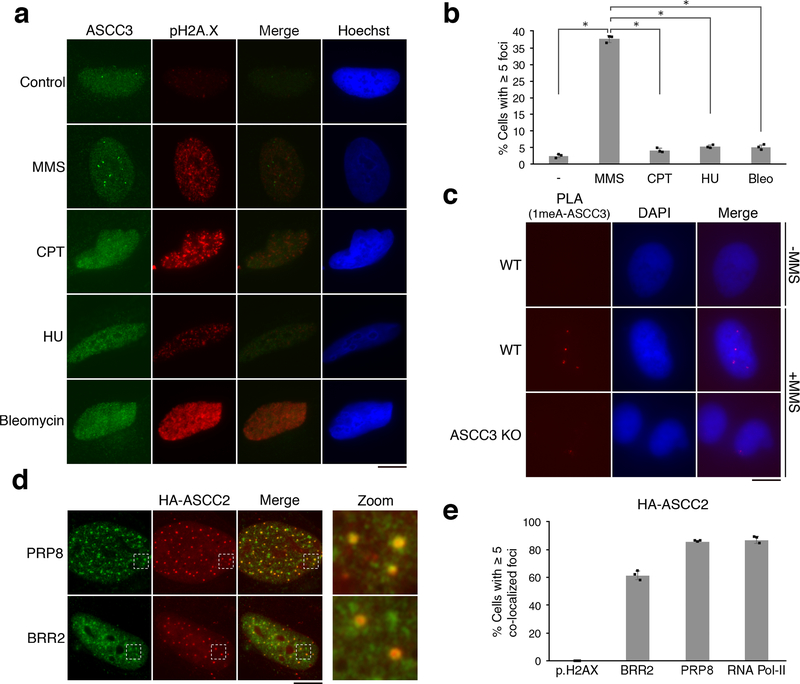
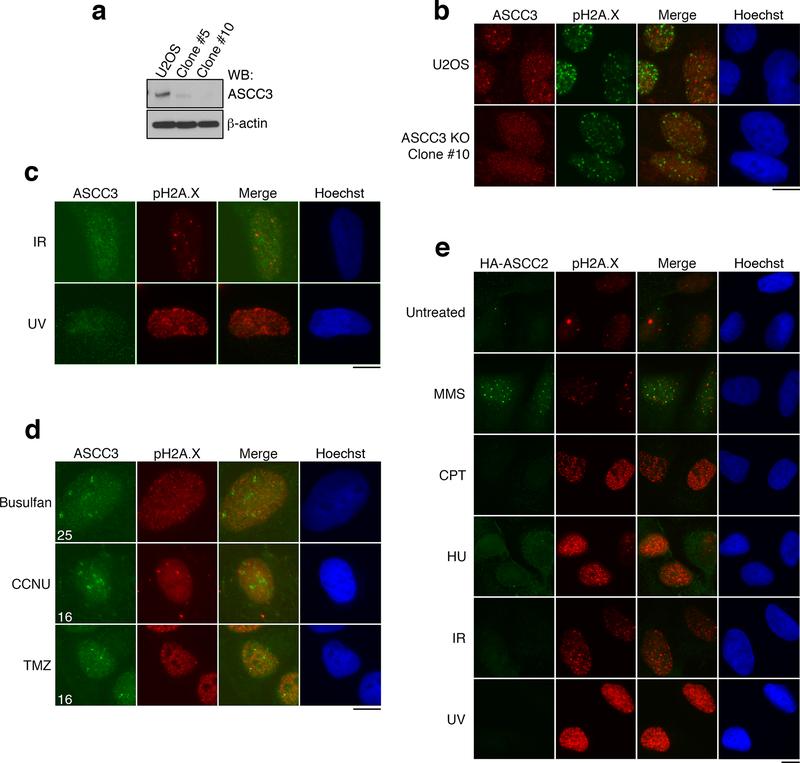
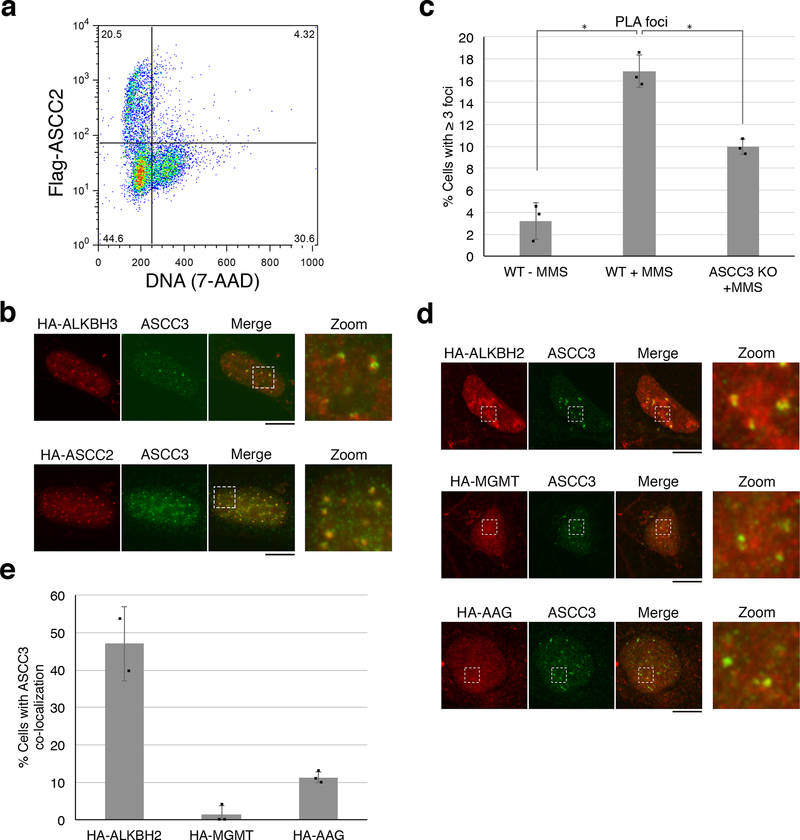
Previous studies established that the dealkylating enzyme, ALKBH3, functions in concert with the ASCC helicase complex7. We tested the subcellular localization of the catalytic subunit, ASCC3 upon exposure to various DNA damaging agents. Endogenous ASCC3 formed nuclear foci upon treatment of U2OS cells with the alkylating agent, methyl methanesulphonate (MMS; Fig. 1A). Knockout of ASCC3 abrogated these foci (Extended Data Fig. 1A and 1B). Strikingly, other types of DNA damaging agents did not significantly induce ASCC3 foci (Fig. 1A and 1B; Extended Data Fig. 1C), although these genotoxins induced pH2A.X foci, indicative of DNA damage. ASCC3 foci were also observed with other alkylating agents used clinically in the treatment of various tumors8 (Extended Data Fig. 1D). The ASCC complex subunit ASCC2 also formed foci specifically after treatment with MMS (Extended Data Fig. 1E). These foci were largely limited to G1/early S-phase of the cell cycle (Extended Data Fig. 2A). Consistent with their known physical association7,9, HA-ASCC2 co-localized with ASCC3 upon MMS treatment, as did the dealkylase ALKBH3 (Extended Data Fig. 2B).
Figure 1. The ASCC complex forms foci upon alkylation damage.
(a) Images of ASCC3 and pH2A.X immunofluorescence after treatment with damaging agents. (b) ASCC3 foci quantitation (n=3 biological replicates; mean ± S.D.; two-tailed t-test, * = p < 0.001). (c) PLA images in control or MMS-treated cells using 1meA and ASCC3 antibodies (n=3 biological replicates). (d) Immunofluorescence of HA-ASCC2 expressing cells treated with MMS. (e) Quantitation of MMS-induced co-localizations of HA-ASCC2 foci (n=3 biological replicates; mean ± S.D.). Scale bars, 10 μm.
To ascertain that the ASCC complex is recruited to regions of the nucleus that have alkylation damage, we performed a proximity ligation assay (PLA). We found that a specific nuclear PLA signal between 1-methyladenosine (1-meA) and ASCC3 is induced upon MMS damage (Fig. 1C and Extended Data Fig. 2C). The dealkylase ALKBH2 also formed foci that co-localized partially with ASCC3 (Extended Data Fig. 2D and 2E). Conversely, two other alkylation repair factors, methylguanine methyltransferase (MGMT) and alkyladenine glycosylase (AAG), showed minimal co-localization with ASCC3 (Extended Data Fig. 2D and 2E)
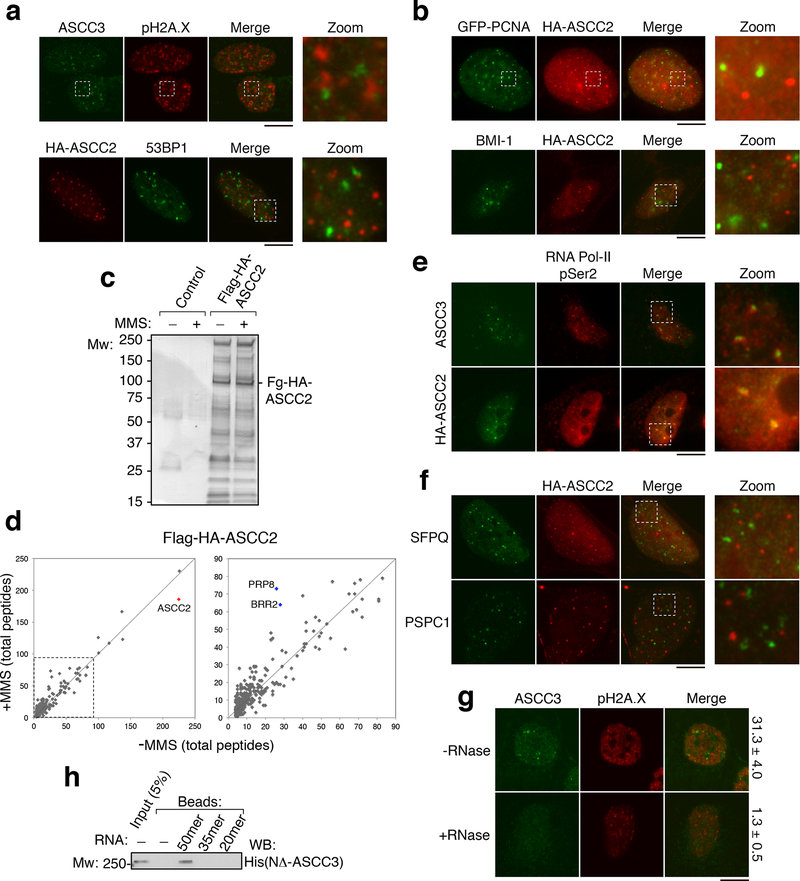
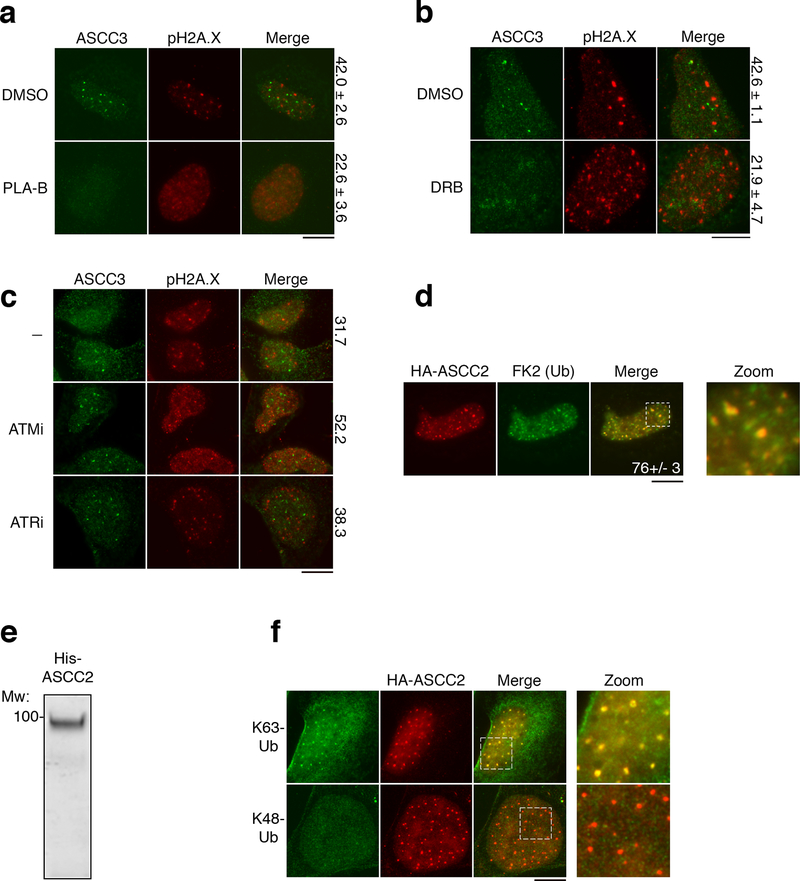
ASCC foci did not co-localize with pH2A.X or 53BP1, demonstrating that they are distinct from double-stranded break (DSB)-induced foci (Extended Data Fig. 3A). These foci were also distinct from GFP-PCNA or BMI-1 (Extended Data Fig. 3B). We took an unbiased proteomic approach to identify the factors associated with ASCC foci in response to alkylation damage using tandem affinity purification (TAP) (Extended Data Fig. 3C). Mass spectrometric analysis of ASCC2-associated proteins revealed the constitutive association of ASCC3 and ASCC1 (Supplementary Table 1). ASCC2 also associated with many spliceosome components and basal transcription factors (Extended Data Fig. 3D and Supplementary Table 1). These factors, including BRR2, PRP8, and TFII-I had 2–3 fold higher total peptide numbers from cells exposed to MMS, suggesting an increased association with the ASCC complex in response to alkylation-induced damage. Focused immunofluorescence studies revealed that ASCC components co-localized with BRR2 and PRP8 upon alkylation damage (Fig. 1D-E). Furthermore, ASCC foci co-localized with elongating (Ser2 phosphorylated) RNA polymerase II, but not other transcription-associated nuclear bodies, such as paraspeckles (Extended Data Fig. 3E-F). Consistently, RNase treatment prior to processing for immunofluorescence significantly reduced ASCC3 foci formation (Extended Data Fig. 3G). Purified ASCC3 bound to ssRNA in vitro (Extended Data Fig. 3H). Chemical inhibition of transcription or splicing during alkylation damage also reduced ASCC3 foci (Extended Data Fig. 4A-B).
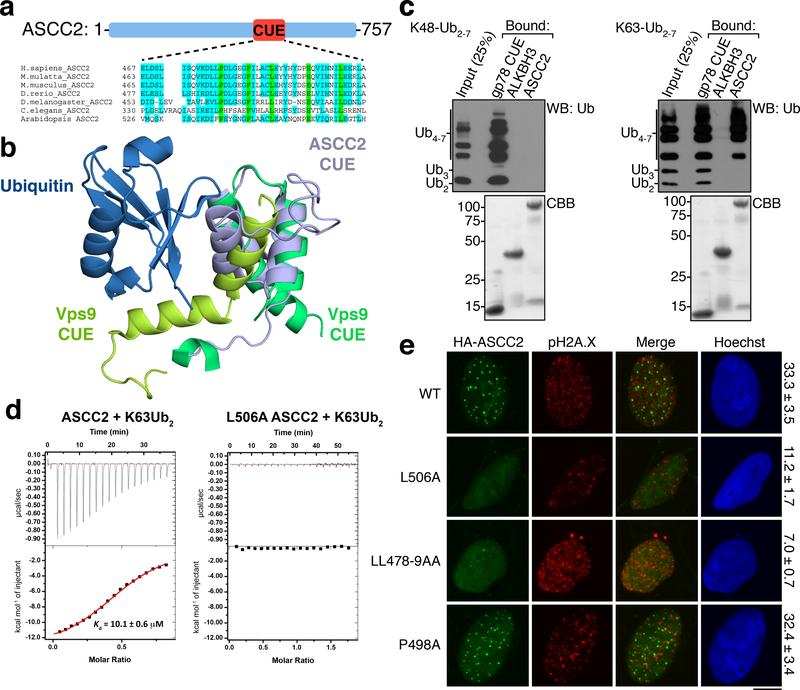
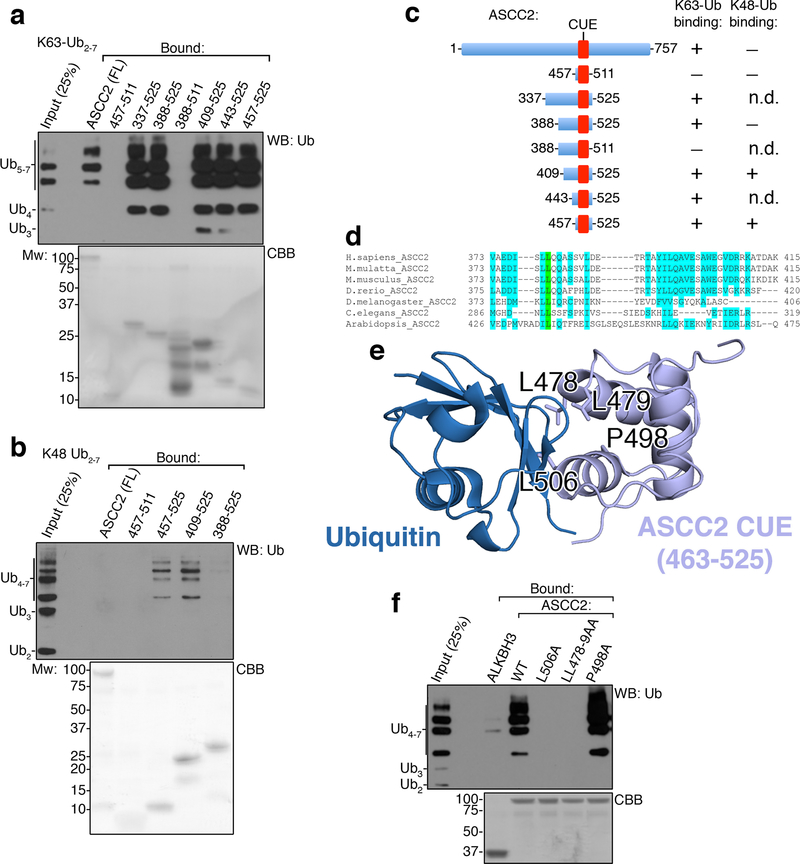
While recruitment of certain repair complexes is dependent on specific upstream signaling kinases1–3, inhibition of ATM moderately increased ASCC3 foci formation, and ATR inhibition had no impact (Extended Data Fig. 4C). We found that HA-ASCC2 foci co-localized with polyubiquitin, suggesting that ubiquitin signaling may recruit this repair complex (Extended Data Fig. 4D). Analysis of the ASCC2 protein sequence revealed a highly conserved CUE domain (residues 467–509), which belongs to the ubiquitin binding domain superfamily10 (Fig. 2A). A deposited but unpublished NMR structure of the ASCC2 CUE domain (PDB ID: 2DI0) was used to model its interaction with ubiquitin in comparison to another CUE domain from Vps9 (Fig. 2B). While Vps9 CUE binds to ubiquitin as a dimer11, our model predicts ubiquitin binding by a monomeric form of the ASCC2 CUE. His-tagged ASCC2 (Extended Data Fig. 4E) bound K63- but not K48-linked ubiquitin chains (Fig. 2C). Furthermore, ASCC2 co-localized with K63- but not K48-linked ubiquitin foci upon MMS damage (Extended Data Fig. 4F). The minimal domain of ASCC2 for ubiquitin binding in vitro was comprised of residues 457–525 (Extended Data Fig. 5A-5D). However, the presence of an additional conserved region adjacent to the CUE domain was necessary for specific binding to K63-linked ubiquitin (Extended Data Fig. 5A-5D).
Figure 2. ASCC2 binds to K63-linked ubiquitin chains via its CUE domain.
(a) ASCC2 sequence alignment. (b) Structure of the ASCC2 CUE domain (PDB ID: 2DI0; grey) overlayed with the Vps9 CUE:ubiquitin complex (PDB ID: 1P3Q). (c) His-ASCC2 was immobilized and assessed for binding to K48-Ub2–7 (left) or K63-Ub2–7. ALKBH3 and gp78-CUE served as controls. Bound material was analyzed by Western blot or Coomassie Blue (CBB) (n=3 independent experiments). (d) ITC was performed with K63-Ub2 and His-ASCC2 or the L506A mutant (n=1 independent experiment; mean ± S.E.). (g) Immunofluorescence images of MMS-induced foci in cells expressing various forms of HA-ASCC2. Numbers indicate the percentage of cells expressing ten or more HA-ASCC2 foci (n=3 biological replicates; mean ± S.D.). Scale bars, 10 μm.
We introduced point mutations in the ASCC2 CUE domain at residues predicted to be critical for ubiquitin recognition (Extended Data Fig. 5E). The mutations L506A and LL478–9AA abrogated ubiquitin binding in vitro, while another, P498A, bound to K63-Ub similar to wild type (WT) ASCC2 (Extended Data Fig. 5F). Isothermal titration calorimetry (ITC) experiments demonstrated that WT ASCC2 bound K63-linked di-ubiquitin chains with a Kd of 10.1 μM, which is similar to other CUE domains12. In contrast, the L506A mutant showed no detectable binding (Fig. 2D). Notably, ASCC2 mutants that abrogate ubiquitin binding showed significantly reduced foci formation upon MMS treatment (Fig. 2E).
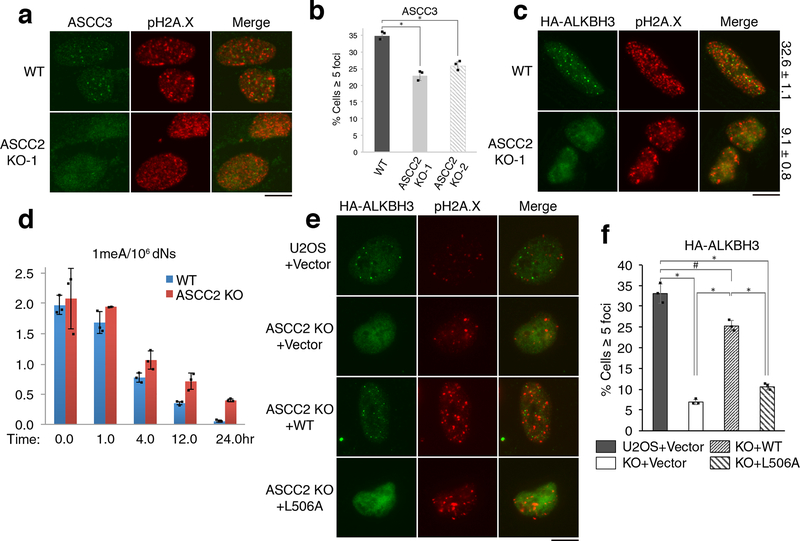
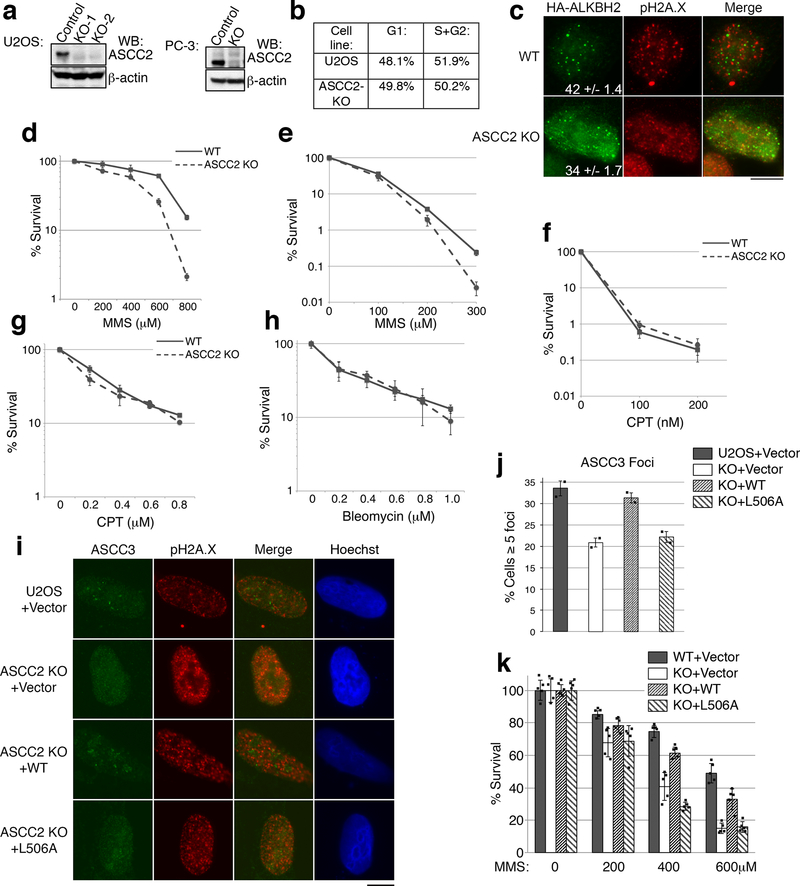
We reasoned that ASCC2 acts as an intermediary subunit to recruit other components of the ASCC-ALKBH3 complex. Thus, we generated ASCC2 knockout cells using CRISPR/Cas9 (Extended Data Fig. 6A). Two independent ASCC2 knockout clones showed a significant reduction in ASCC3 foci formation upon MMS treatment (Fig. 3A-B). This reduction was not due to a change in the population of cells in G1 (Extended Data Fig. 6B). HA-ALKBH3 and HA-ALKBH2 foci were also diminished in the mutant cells, albeit more modestly for HA-ALKBH2 (Fig. 3C and Extended Data Fig. 6C). Consistent with a role in the recruitment of these factors, ASCC2-deficient PC-3 cells were hypersensitive to MMS, but not to camptothecin or bleomycin. (Extended Data Fig. D-H). DNA alkylated lesion repair kinetics was also significantly slower in ASCC2 knockout cells (Fig. 3D).
Figure 3. ASCC2 is critical for ASCC3-ALKBH3 recruitment and alkylation resistance.
(a) MMS-induced ASCC3 foci were assessed in WT and ASCC2-KO cells. (b) Quantitation of (a) (n=3 biological replicates; mean ± S.D.; two-tailed t-test, * = p < 0.001). (c) HA-ALKBH3 foci were assessed as in (a). Numbers indicate the percentage of cells expressing five or more foci (n=2 biological replicates; mean). (d) 1meA quantitation in WT or ASCC2-KO cells after MMS treatment (n=3 biological replicates; mean ± S.D.). (e) Images of WT or ASCC2-KO cells expressing indicated vectors upon MMS. (f) Quantitation of (e) (n=3 biological replicates; mean ± S.D.; two-tailed t-test, * = p < 0.001, # = p < 0.05). Scale bars, 10 μm.
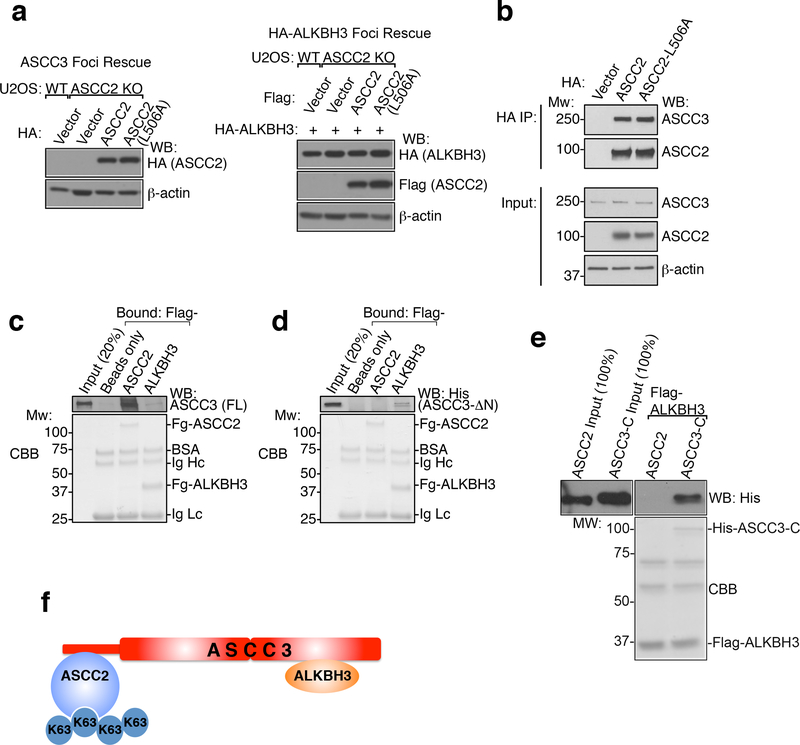
Next, we reconstituted ASCC2-KO cells with WT and mutant versions of ASCC2. WT ASCC2, but not the L506A CUE mutant, restored MMS-induced ASCC3 and HA-ALKBH3 foci formation (Fig. 3E-F and Extended Data Fig. 6I-J and 7A). Similarly, WT, but not L506A ASCC2, rescued MMS sensitivity of ASCC2 knockout cells (Extended Data Fig. 6K). WT and L506A ASCC2 equally co-immunoprecipitated ASCC3 (Extended Data Fig. 7B). Indeed His-ASCC3 bound to immobilized Flag-ASCC2 and Flag-ALKBH3, although binding with ALKBH3 appeared weaker (Extended Data Fig. 7C). Deletion of the ASCC3 N-terminus abrogated its ability to bind ASCC2, while retaining ALKBH3 binding (Extended Data Fig. 7D). Conversely, ASCC2 did not interact with recombinant ALKBH3 (Extended Data Fig. 7E). ASCC2 therefore appears to bridge ASCC3 and K63-linked ubiquitin chains, while ALKBH3 is indirectly recruited by ASCC2 through its interaction with ASCC3 (Extended Data Fig. 7F).
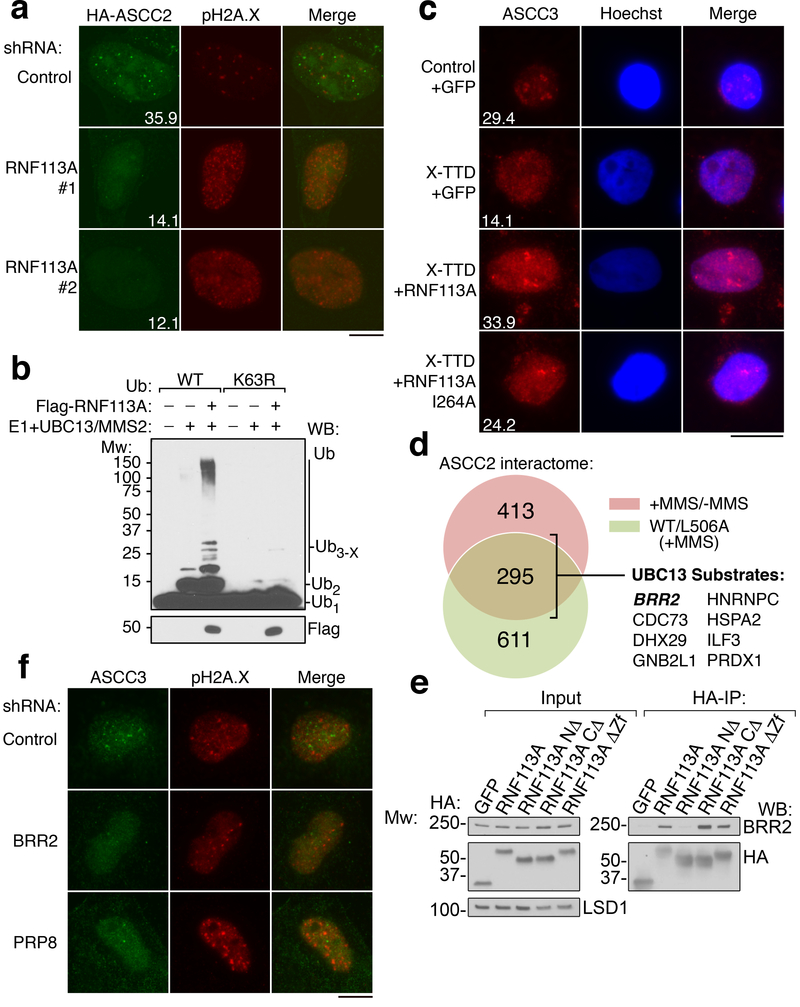
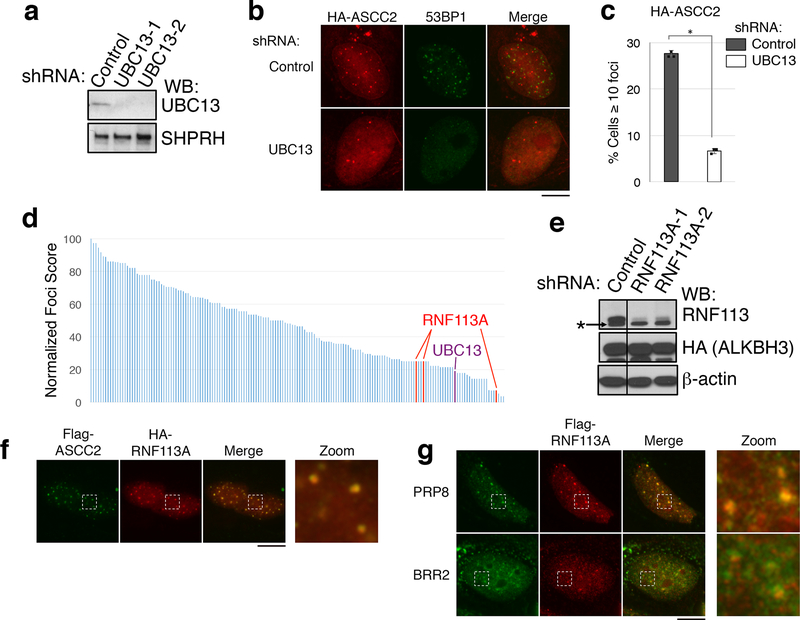
UBC13, a major E2 ubiquitin ligase responsible for formation of K63-linked ubiquitin chains, has been implicated in DNA damage response pathways13–15. Knockdown of UBC13 reduced 53BP1 foci, and also attenuated MMS-induced HA-ASCC2 foci (Extended Data Fig. 8A-8C). However, knockdown of RNF8 or RNF168, two E3 ligases involved in the double-stranded break repair1, did not affect HA-ASCC2 foci formation (data not shown), suggesting that a distinct E3 ligase functions in the alkylation pathway. To identify this E3 ligase, we performed a screen using a custom library of shRNAs that target UBC13-interacting E3 ligases or other ligases implicated in DNA repair (Supplementary Table 2). The screen identified RNF113A as a potential candidate, with three distinct shRNAs reducing HA-ASCC2 foci to UBC13 knockdown levels (Extended Data Fig. 8D). We confirmed that these shRNAs attenuated both RNF113A protein levels and HA-ASCC2 foci formation (Extended Data Fig. 8E and Fig. 4A). Importantly, MMS-induced ASCC2 foci co-localized with RNF113A (Extended Data Fig. 8F). In the absence of damage, RNF113A co-localized with PRP8 and BRR2 (Extended Data Fig. 8G), consistent with previous studies suggesting it nominally serves as a spliceosome component16.
Figure 4. RNF113A ubiquitination recruits the ASCC complex.
(a) MMS-induced foci in U2OS cells expressing indicated shRNAs (n=3 technical replicates; mean). (b) Ubiquitin ligase assays using E1, E2 (UBC13/MMS2; 250 nM), and Flag-RNF113A. K63R ubiquitin was substituted as shown (n=2 independent experiments). (c) Images of X-TTD or control lymphoblasts expressing the indicated vectors after MMS (n=3 technical replicates; mean). (d). ASCC2 interactome analysis. UBC13 substrates were previously described19. (e) HA-RNF113A deletions were immunoprecipitated to analyze BRR2 interaction. (n=3 independent experiments). (f) Images of U2OS cells expressing indicated shRNAs. Numbers indicate the percentage of cells expressing at least five (c) or ten (a) foci. Scale bars, 10 μm.
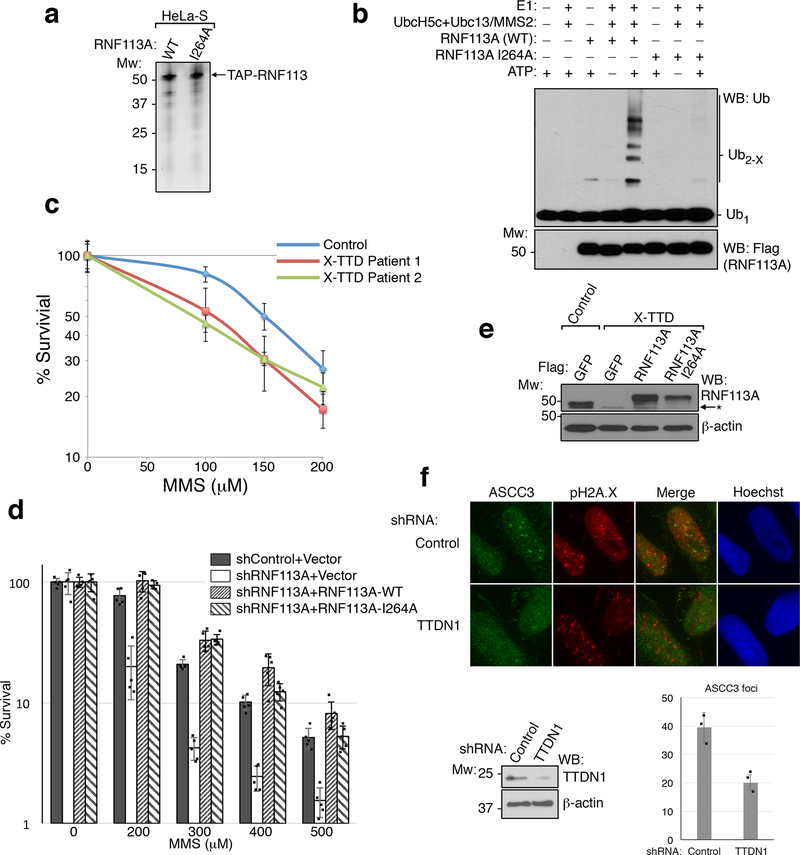
We purified Flag-tagged RNF113A from HeLa-S cells to analyze its E3 ligase activity (Extended Data Fig. 9A). RNF113A exhibited robust E3 activity in vitro, which was significantly reduced with a RING-finger point mutation (I264A; Extended Data Fig. 9B). Use of K63R ubiquitin abrogated chain elongation, suggesting that RNF113A may function to promote the E2 activity of UBC13 (Fig. 4B). A recent study identified a nonsense mutation (Q301*) in RNF113A in two related individuals suffering from X-linked trichothiodystrophy17 (X-TTD). While most TTD patient cells are hypersensitive to UV damage, X-TTD cells do not have this phenotype17. Lymphoblastoid cell lines obtained from these two patients were hypersensitive to MMS, as was an RNF113A knockdown cell line (Extended Data Fig. 9C-D). Strikingly, X-TTD cells had significantly reduced ASCC3 foci formation (Fig. 4C and Extended Data Fig. 9E). Reconstitution of these patient cells with WT RNF113A rescued ASCC3 foci formation, while the I264A mutant gave a partial rescue, possibly due to the small degree of remaining E3 ligase activity. Loss of TTDN1, another TTD-associated gene18, also reduced ASCC3 foci formation (Extended Data Fig. 9F).
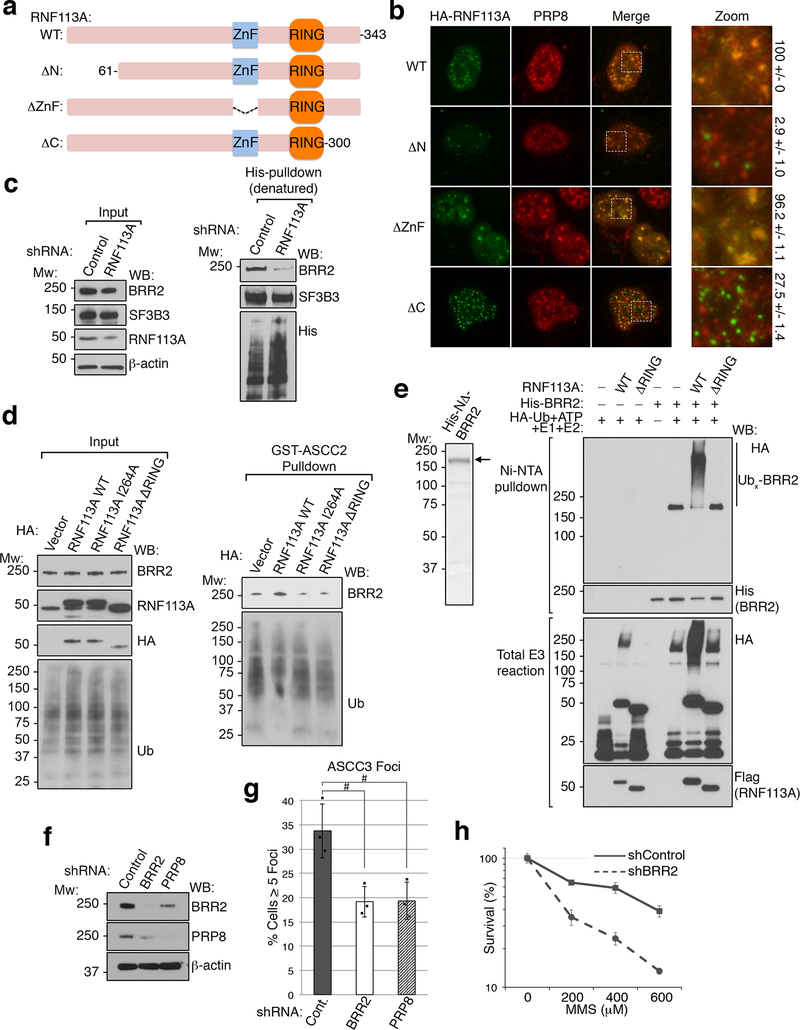
To uncover the relevant RNF113A substrate, we combined our initial proteomics screen (Extended Data Fig. 3D) with a second screen for proteins that interact preferentially with WT ASCC2 relative to the L506A mutant (Fig. 4D and Supplementary Table 3). Of the remaining putative ubiquitinated substrates, eight have been shown to be ubiquitinated by UBC1315. Of these, BRR2 was the most obvious candidate, as it co-localized with RNF113A and ASCC components. Indeed, BRR2 co-immunoprecipitated with RNF113A in a manner dependent upon the N-terminal domain of RNF113A (Fig. 4E). Deletion analysis revealed that the RNF113A N-terminus was also critical for its co-localization with PRP8 (Extended Data Fig. 10A-B). Ubiquitin conjugation of BRR2 was significantly reduced upon loss of RNF113A (Extended Data Fig. 10C). Furthermore, RNF113A promoted BRR2 binding to ASCC2, which was dependent on its RING domain (Extended Data Fig. 10D). Recombinant BRR2 was ubiquitinated in vitro by RNF113A, also in a manner dependent on its RING domain (Extended Data Fig. 10E). Knockdown of BRR2, or its partner PRP816, significantly reduced ASCC3 foci formation upon MMS damage (Extended Data Fig. 10F-G and Fig. 4F). Consistently, loss of BRR2 increased sensitivity to MMS (Extended Data Fig. 10H). Thus, BRR2 likely represents at least one physiologic substrate for RNF113A in this alkylation repair pathway.
Our results provide the first evidence for an alkylation-specific damage response in human cells. The ASCC complex acts as a major node in this pathway, sensing ubiquitin-dependent signaling (via ASCC2) and concomitantly recruiting alkylation repair enzymes (ALKBH3 and ASCC3). As such, ASCC2 serves as an adaptor, and may be analogous to Rap80, which recruits the BRCA1 complex to chromatin during the double-stranded break response1. Indeed, Rap80 recognizes non-proteosomal ubiquitin chains produced by the upstream RNF8/RNF168 E3 ubiquitin ligases before BRCA1 recruitment. Here, RNF113A functions as the E3 ligase to transduce the alkylation damage signal. How alkylation damage uniquely activates RNF113A to recruit ASCC2 versus other repair complexes will be an important question for future studies. RNF113A contains a CCCH-type zinc finger, a motif known to bind RNA. Since RNA is also modified by exposure to alkylating agents, it is possible that damaged RNA serves as the initial signal to activate DNA alkylation repair. As our works strongly suggests the presence of a cellular sensor specific for alkylation damage in human cells, it may be possible to target this pathway to improve tumor responses to conventional chemotherapy. Future studies will undoubtedly clarify these critical questions regarding the upstream signals for this novel damage signaling pathway.
Methods
Data Reporting
No statistical methods were used to predetermine sample size. The experiments were not randomized and the investigators were not blinded to allocation during experiments and outcome assessment.
Plasmids
Human ALKBH3, ASCC2, ASCC3, RNF113A, BRR2, and gp78 cDNAs were isolated as previously described7. For mammalian cell expression, cDNAs were subcloned into pHAGE-CMV-3xHA, pHAGE-CMV-Flag, or pMSCV-Flag-HA as needed by Gateway recombination19. The cDNA for PCNA (a kind gift of Zhongsheng You, Washington University) was subcloned into pHAGE-CMV-GFP. For recombinant protein expression, cDNAs were subcloned into pGEX-4T1, pET28a-Flag, or pDEST10. All constructs derived by PCR, including deletions and point mutations, were confirmed by Sanger sequencing.
Cell culture and cell survival assays
U2OS, PC-3, HeLa-S, and 293T cells (originally from ATCC) were cultured and maintained as previously described20. Cells were tested for mycoplasma at the Washington University Genome Engineering and iPSC Center, and were authenticated using the ATCC human STR profiling services. Normal and X-TTD patient lymphoblastoid cell lines were kind gifts of Drs. Mark Corbett and Jozef Gecz (University of Adelaide). These cells were originally obtained after informed consent and ethical approval from the Women’s and Children’s Health Network Human Research Ethics Committee, as described17. They were maintained in RPMI 1640 media supplemented with 10% FBS and 1% penicillin-streptomycin17. Preparation of viruses, transfection, and viral transduction were performed as described previously20. For knockout cell foci rescue experiments, cells were transduced with the pHAGE-CMV-3xHA or pHAGE-CMV-Flag lentiviral rescue vector. For knockout cell MMS sensitivity rescue experiments, cells were transduced with the pMSCV-Flag-HA retroviral rescue vector. For DNA damaging agent survival assays using PC-3 cells, 10,000 cells/well were cultured overnight in 96-well plates in 100 μl media. Cells were then exposed to medium containing the indicated concentration of methyl methanesulphonate (MMS; Sigma) for 24 hours at 37 °C. The media was then replaced with normal media, and cell viability was assessed using the MTS assay (Promega) 72 hours after initial damaging agent exposure. For experiments involving camptothecin (CPT), or bleomycin (both purchased from Sigma), cells were exposed to medium containing the indicated concentration of the damaging agent in culture medium for 72 hours at 37 °C. Viability was then processed by MTS assay as above.. For survival assays using the patient-derived cells, 10,000 cells were plated in 80 μl media. MMS-containing media was then added for a total volume of 100 μl at the indicated final concentration of MMS and incubated for 72 hours at 37 °C. MTS assay was then performed as above. All MTS-based survival experiments were carried out in quintuplicate.
CRISPR/Cas9 mediated knockouts
U2OS and PC-3 knockout cells were created using CRISPR/Cas9 genome editing at the Genome Engineering and iPSC Center (GEiC) at Washington University School of Medicine (St. Louis). PC-3 ASCC2 and ASCC3 KO clones were initially assessed by deep sequencing and confirmed by Western analysis. All other knockout clones were isolated and confirmed by Western analysis. The gRNA sequences used to generate the knockout cell line were as follows: ASCC2: 5’-GCCAAGTTACTACAGTGACCTGG-3’; ASCC3: 5’-ATGGCTTTACCTCGTCTCACAGG-3’; RNF113A: 5’- TCTTTTGCTTCGACTCCCGGCGG-3’ and 5’-CGGGTGGTGAAGTAGGGTCCTGG-3’.
Immunofluorescence microscopy
All immunofluorescence microscopy was done as previously described31, with minor modifications. After treatment with indicated damaging agent in complete medium at 37°C for six hours (500 μM MMS, unless indicated otherwise; 1 μM camptothecin; 10 mM hydroxyurea; 20 μM bleomycin; 5 Gy IR; or 25 J/m2 UV), U2OS cells were extracted with 1× PBS containing 0.2% Triton X-100 and protease inhibitors (Pierce) for 10–20 minutes on ice prior to fixation with 3.2% paraformaldehyde. The cells were then washed extensively with IF Wash Buffer (1× PBS, 0.5% NP-40, and 0.02% NaN3), then blocked with IF Blocking Buffer (IF Wash Buffer plus 10% FBS) for at least 30 minutes. Primary antibodies were diluted in IF Blocking Buffer overnight at 4°C. After staining with secondary antibodies (conjugated with Alexa Fluor 488 or 594; Millipore) and Hoechst 33342 (Sigma-Aldrich), where indicated, samples were mounted using Prolong Gold mounting medium (Invitrogen). Epifluorescence microscopy was performed on an Olympus fluorescence microscope (BX-53) using an ApoN 60X/1.49 NA oil immersion lens or an UPlanS-Apo 100X/1.4 oil immersion lens and cellSens Dimension software. Raw images were exported into Adobe Photoshop, and for any adjustments in image contrast or brightness, the levels function was applied. For foci quantitation, at least 100 cells were analyzed in triplicate, unless otherwise indicated.
Flow cytometry
Samples were prepared and flow cytometry was performed using the BrdU Flow Kit (BD Pharmingen) protocol with minor modifications. U2OS cells were transduced with pHAGE-CMV-Flag-ASCC2 lentivirus for 72 hours, treated with MMS, washed with PBS, and extracted with Triton X-100 as for immunofluorescence. Cells were then fixed by resuspension in BD Cytofix/Cytoperm Buffer and incubated on ice for 15 minutes. Samples were washed with 1× BD Perm/Wash Buffer, resuspended with Flag antibody diluted in 1× BD Perm/Wash Buffer, incubated at room temperature for 1 hour, and washed again in the same buffer. Samples were resuspended in buffer containing Alexa Fluor 488-conjugated secondary antibody and incubated at room temperature for 20 minutes. Samples were washed and resuspended in staining buffer (1× PBS + 2% FBS) containing 7-amino-actinomycin D and processed by flow cytometry. All flow cytometry analysis was performed on the FACSCalibur Flow Cytometer using the CellQuest software. Postaquisition analysis was performed using the FlowJo software (Tree Star).
Colony formation assay
Parental or knockout cells were trypsinized, counted, and plated at low density. After overnight incubation, the cells were treated with the indicated doses of MMS or CPT for 24 hours in complete medium. The cells were incubated for 12–14 days, fixed, and stained with crystal violet. The experiment was performed in quadruplicate for each cell line and drug dose. Colonies were counted and relative survival was normalized to untreated controls.
In situ Proximity Ligation Assay
PLA was performed using the Duolink detection kit (Sigma) following the manufacturer’s instructions with minor modifications. U2OS cells were extracted and fixed as described above. The cells were washed extensively with IF Wash Buffer, then blocked with 1× Duolink blocking solution for 30 minutes at 37 °C in a pre-warmed humidifier. Primary antibodies were diluted in 1× Duolink antibody diluent and added to samples overnight at 4°C. Samples were washed with Wash Buffer A at room temperature. PLA probes anti-rabbit PLUS and anti-mouse MINUS were diluted 1:5 in 1× Duolink antibody diluent, then added to samples and incubated for 1 hour at 37 °C. Samples were again washed with Wash Buffer A at room temperature. Duolink ligation stock and ligase were diluted 1:5 and 1:40 in pure water, respectively, and applied to samples for 30 minutes at 37°C. After washing with Wash Buffer A, Duolink amplification red probe and polymerase were diluted 1:5 and 1:80 in water and applied to samples for 100 minutes at 37°C. After a brief wash with Wash Buffer B, samples were mounted using Duolink mounting medium with DAPI and imaged as above.
Purification of TAP-ASCC2 complexes and MS/MS analysis
Affinity purification of ASCC2 was performed as previously described for ALKBH3, with minor modifications7. Briefly, Flag-HA-ASCC2 was stably expressed after transduction of pMSCV-Flag-HA-ASCC2 retrovirus into HeLa-S cells. Nuclear extract was prepared from the stable cell line with or without prior treatment with MMS (400 μM for six hours), and the ASCC2 complex was purified using anti-Flag (M2) resin (Sigma), followed by purification using anti-HA (F-7) resin (Santa Cruz) in TAP buffer (50 mM Tris-HCl pH 7.9, 100 mM KCl, 5 mM MgCl2, 10% glycerol, 0.1% NP-40, 1 mM DTT, and protease inhibitors). For comparison of WT ASCC2 versus ASCC2 L506A, the same method was used, except that both samples were treated with MMS and the HA purification was omitted. After peptide elution, the complexes were TCA precipitated and associated proteins were identified by LC-MS/MS at the Taplin Mass Spectrometry Facility (Harvard Medical School) using an LTQ Orbitrap Velos Pro ion-trap mass spectrometer (ThermoFisher) and Sequest software21.
Protein purification
Recombinant proteins (ALKBH3, ASCC2, ASCC3, and gp78 CUE) were purified from Rosetta (DE3) or Sf9 cells using an ÄKTA-pure FPLC (GE Healthcare). For His-tagged bacterially expressed proteins, cells were resuspended in His-lysis buffer (50 mM Tris-HCl pH 7.3, 250 mM NaCl, 0.05% Triton X-100, 3 mM β−ME, 30 mM imidazole, and protease inhibitors) and lysed by sonication. After centrifugation and filtration, the extract was loaded onto a HisTrap HP column using a 50 ml Superloop (GE Healthcare). After extensive washing with lysis buffer, the protein was eluted using lysis buffer containing 400 mM imidazole. His-Flag-ALKBH3 was further purified on a Superdex 200 Increase 10/300 GL size exclusion column. All recombinant proteins were dialyzed into TAP buffer. Flag-tagged RNF113A was purified from HeLa-S cells by resuspension in Flag-lysis buffer (50 mM Tris-HCl pH 7.9, 150 mM NaCl, 10% glycerol 1.0% Triton X-100, 1 mM DTT, and protease inhibitors) and lysed by sonication. After incubation with Flag resin, the protein was eluted with lysis buffer containing 0.4 mg/ml Flag peptide.
Protein and RNA binding assays
All in vitro binding assays were performed as previously described4, with minor modifications. Flag (M2) agarose and Ni-NTA agarose beads were pre-blocked with 10% bovine serum albumin (BSA). For ubiquitin binding assays, 10 μg of His-ASCC2 or His-ASCC2 mutants were added to each reaction, along with 500 ng of either K48- or K63-Ub2–7 (Boston Biochem). The indicated proteins were added to 10 μl of beads in a total volume of 100 μl with TAP Wash Buffer. Reactions were incubated at 4 °C with rotation for 1 hour, then washed extensively with TAP Wash Buffer. A final wash was performed with 1× PBS, and bound material was eluted with 20 μl of Laemmli buffer, analyzed by SDS-PAGE, and stained with Coomassie Brilliant Blue or subjected to Western analysis as indicated. For RNA binding experiments, 0.5 nmol of each 5’-biotinylated RNA (50mer sequence: 5’-UCGAUAGUCUCUAGACAGCAUGUCCUAG CAAGCCAGAAUUCGGCAGCGUC-3’; the 35mer and 20mer removed 15 and 30 nucleotides from the 3’ end of the same sequence, respectively) was immobilized on 10μl streptavidin-agarose beads. To each reaction, 1μg of His-NΔ-ASCC3 (residues 401–2202) was added in a total volume of 100 μl in TAP Wash Buffer with RNase inhibitor (NEB). Reactions were incubated at 25°C with rotation for 30 minutes, then washed extensively with TAP Wash Buffer. A final wash was performed with 1× PBS, and bound material was eluted with 10 μl of Laemmli buffer, analyzed by SDS-PAGE and Western blotting.
Ubiquitin ligase assays
Reactions analyzing ubiquitin chain polymerization were performed in ubiquitin ligase buffer (25 mM Tris pH 7.3, 25 mM NaCl, 10 mM MgCl2, 100 nM ZnCl, 1 mM mercaptoethanol) containing 5 mM ATP and 100 μM of either WT ubiquitin or K63R ubiquitin in a total volume of 20 μl. E1 activating enzyme (UBE1; Boston Biochem) was used at 500 nM, and E2 ubiquitin conjugating enzymes (Ubch5c or Ubc13/MMS2; Boston Biochem) were added at the indicated concentrations. Flag-HA-tagged-RNF113A or RNF113A I264A mutant protein purified from HeLa-S cells was added to each reaction and incubated at 37°C for 3 hours. Reactions were stopped with 20 μl of Laemmli buffer, analyzed by SDS-PAGE, and Western blotted. For ubiquitination of BRR2, 1 μg of His-NΔ-BRR2 (residues 394–2136) purified from Sf9 cells was used as a substrate for ubiquitination with Flag-RNF113A (WT and ΔRING) purified from HeLa cells. Each reaction contained E1 (50 nM), E2 (Ubch5c; 150 nM), 2 μg HA-Ub and 2 mM ATP, and were incubated at 35°C for 2 hours. An aliquot (5μl) of the total E3 reaction was saved, and the remaining reaction was used for binding to Ni-NTA beads for one hour. After extensive washing with TAP buffer, the captured His-BRR2 was eluted with Laemmli buffer, analyzed by SDS-PAGE and analyzed by SDS-PAGE, and Western blotted.
Immunoprecipitation
Immunoprecipitation of HA-tagged RNF113A was carried out by transient expression in 293T cells. The cells were resuspended in high-salt buffer (50 mM Tris-HCl pH 7.9, 300 mM NaCl, 10% glycerol 1.0% Triton X-100, 1 mM DTT, and protease inhibitors), lysed by sonication, and centrifuged. An equal volume of buffer containing no salt was added, and the lysate was incubated with anti-HA resin. After incubation at 4°C with rotation, the beads were washed extensively with buffer containing 150 mM NaCl. Bound material was eluted with Laemmli buffer and analyzed by SDS-PAGE. Immunoprecipitation after denaturation was performed as previously described30 with minor modifications. Briefly, 293T cells were transfected with His-Ub, then transduced with the indicated shRNA lentivirus. Cells were then treated with 500 μM MMS for 6 hours and harvested. Pellets were resuspended in TBS + 1% SDS and further lysed by sonication, boiled and cleared by centrifugation. Samples were diluted to 0.1% SDS with lysis buffer (50mM Tris pH 7.9, 150 mM NaCl, 10% glycerol, 1% Triton X-100, 1mM DTT, and protease inhibitors) and incubated with Ni-NTA beads at 4°C overnight. After incubation and extensive washing with lysis buffer, the bound material was eluted with Laemmli buffer and analyzed by Western blotting.
Isothermal titration calorimetry
All reported ITC data were collected using a MicroCal iTC200 instrument. His-tagged ASCC2, the L506A ASCC2 mutant, and K63-Ub2 were dialyzed in 20 mM HEPES pH 7.5, 150 mM NaCl, and 200 μM Tris(2-carboxyethyl)phosphine prior to the experiment. For the WT ASCC2 binding experiment, a 102 μM K63-Ub2 solution in the sample cell was titrated with 435 μM ASCC2 solution using eighteen 2-μL injections. The L506A ASCC2 binding experiment was performed similarly, with 388 μM L506A ASCC2 titrated into 42 μM K63-Ub2. Fitting was performed using Origin 7 SR4 (OriginLab, Northampton, MA).
Structural analysis
PyMOL (The PyMOL Molecular Graphics System, Version 1.8.0.5 Schrödinger, LLC.) was used to align the structure of ASCC2 residues 463–525 (PDB ID: 2DI0) with the VSP9 CUE:ubiquitin complex structure (PDB ID: 1P3Q). Figure 2C and Extended Data Figure 3E were generated using PyMOL.
Quantification of methylated bases using LC-MS/MS
Cells were grown in DMEM (Sigma-Aldrich), supplemented with 0.03 g/L triple-deuterized L-Methionine (Sigma-Aldrich), for at least five cell divisions prior to the experiment. For each condition, 3 × 10 cm cell culture dishes were used. MMS was added to the growth medium at a final concentration of 1 mM and cells incubated further for 1 h. After a brief wash with pre-warmed PBS, new medium was added and the cells incubated further for various time spans prior to analysis. After medium removal, culture plates (60–80% confluency) were placed on ice and washed with ice cold PBS. Cells were harvested by scraping into ice cold PBS, centrifuged and the pellet washed with ice cold PBS. Dry pellets were snap frozen and stored at −80°C until further processing. Cell lysis and total DNA isolation was performed with the AllPrep DNA/RNA/Protein Mini kit (Qiagen) according to the manufacturer’s instructions. DNA was hydrolyzed to nucleosides by 20 U benzonase (Santa Cruz), 0.2 U nuclease P1, and 0.1 U alkaline phosphatase (Sigma) in 10 mM ammonium acetate pH 6.0 and 1 mM magnesium chloride at 40 °C for 40 min. Three volumes of acetonitrile was added and the sample was centrifuged (16,000 g, 30 min, 4°C). The supernatants were dried and dissolved in 50 μl water for LC-MS/MS analysis of methylated and unmodified nucleosides. Chromatographic separation was performed using an Agilent 1290 Infinity II UHPLC system with an ZORBAX RRHD Eclipse Plus C18 150 × 2.1 mm ID (1.8 μm) column protected with an ZORBAX RRHD Eclipse Plus C18 5 × 2.1 mm ID (1.8 μm) guard column (Agilent). The mobile phase consisted of water and methanol (with 0.1 % formic acid) run at 0.25 ml/min, for methylated nucleosides starting with a 6-min gradient of 5–90 % methanol, followed by 4 min re-equilibration with 5 % methanol, and for unmodified nucleosides maintained isocratically with 20 % methanol. Mass spectrometric detection was performed using an Agilent 6495 Triple Quadrupole system operating in positive electrospray ionization mode, monitoring the mass transitions 282.1/150.1 (mA), 285.1/153.1 (D3-mA), 258.1/126.1 (mC), 261.1/129.1 (D3-mC), 298.1/166.1 (mG), 301.1/169.1 (D3-mG), 268.1/136.1 (A), 244.1/112.1 (C), 284.1/152.1 (G), 245.1/113.1 (U), 266.1/150.1 (m(dA)), 252.1/136.1 (dA), 228.1/112.1 (dC), 268.1/152.1 (dG), and 243.1/127.1 (dT).
shRNA library and targeted E3 ligase screen
The targeted E3 ligase shRNA library was part of the TRC/pLKO.1 vector collection (Sigma). Clone details can be found in Supplementary Table 2. For the screen, U2OS cells were concurrently transduced with pHAGE-CMV-3xHA-ASCC2 lentivirus and individual lentiviral shRNAs. A scrambled pLKO.1 shRNA and a lentivirus targeting UBC13 (TRCN0000039435) served as the negative and positive controls, respectively. After approximately 72 hours, the cells were treated with MMS (500 μM) for six hours and processed for immunofluorescence microscopy using anti-HA and pH2A.X. At least 100 cells per sample were analyzed for HA-ASCC2 foci formation. Quantified results were normalized to the scrambled control. RNF113A was the only candidate E3 ligase with three independent shRNAs exhibiting at least a threefold reduction in MMS-induced HA-ASCC2 foci formation. For verification, U2OS cells were co-transduced with pHAGE-CMV-3xHA-ASCC2 and the candidate lentiviral shRNAs. HA-ASCC2 foci formation was assessed as above.
Statistical Analyses
All p-values were calculated by unpaired, two-tailed Student’s t-test. All error bars represent the standard deviation, unless otherwise noted.
Antibodies
All antibodies for this study are shown in Supplementary Table 4.
Data availability statement
The authors can confirm that all relevant data are included in the paper and/or its supplementary information files.
Extended Data
Extended Data Figure 1. The ASCC complex forms foci upon alkylation damage.
(a) ASCC3 KO cells were generated using CRISPR/Cas9 technology. Lysates were analyzed by Western blotting (n=2 independent experiments). Clone #10 was verified to be a knockout by deep sequencing. (b) Images of U2OS parental cells or ASCC3-KO cells after MMS (n=3 biological replicates). (c) Immunofluorescence of U2OS cells after exposure to γ-irradiation (IR; 5 Gy) or UV (25 J/m2) (n=3 biological replicates). (d) Images of U2OS cells after treatment with the alkylating agents busulfan (4 mM), 1-(2-chloroethyl)-3-cyclohexyl-1-nitrosourea (CCNU; 100 μM), or temozolomide (TMZ; 1.0 mM) (n=2 biological replicates). Numbers indicate the mean percent of cells expressing five or more foci. (e) Immunofluorescence of HA-ASCC2 expressing cells after exposure to the indicated damaging agents (n=3 biological replicates). Scale bars, 10 μm. For gel source data, see Supplementary Figure 1.
Extended Data Figure 2. Subcellular localization of ASCC2 and other alkylation repair factors.
(a) Flow cytometry analysis of Flag-ASCC2 expressing cells after MMS treatment and Triton X-100 extraction. Numbers indicate the percent of total cells in each quadrant (n=2 independent experiments). (b) Images of cells expressing HA-ASCC2 or HA-ALKBH3 after MMS treatment (n=2 independent experiments). (c) PLA quantitation from Figure 1c (n=3 biological replicates; mean ± S.D.; two-tailed t-test, * = p < 0.005). (d) Immunofluorescence of cells expressing HA-ALKBH2, HA-MGMT, or HA-AAG upon MMS treatment. (e) Quantitation of ASCC3 co-localization from (d) (n=3 biological replicates; mean ± S.D.). Scale bars, 10 μm.
Extended Data Figure 3. Localization and interactions of the ASCC complex.
(a) and (b) Images of U2OS or U2OS cells expressing the indicated vectors after MMS treatment (n=3 biological replicates). (c) Silver staining of the Flag-HA-ASCC2 complex purified from HeLa-S nuclear extract separated on 4%−12% SDS-PAGE gel (n=1 independent experiment). (d) Tagged ASCC2 was purified with or without MMS and analyzed by mass spectrometry. Peptide numbers for identified proteins were plotted for each condition. Expanded view is shown on the right (n=1 independent experiment). (e) and (f) Immunofluorescence analysis of U2OS or HA-ASCC2 expressing U2OS cells upon exposure to MMS (n=3 biological replicates). (g) U2OS cells were treated with MMS, and processed for immunofluorescence with or without initial incubation with RNase A (50 nM). Numbers indicate the percent of cells expressing five or more ASCC3 foci (n=3 biological replicates; mean ± S.D.). (h) Biotinylated RNAs (20mer, 35mer, or 50mer) were immobilized and tested for binding to recombinant His-NΔ-ASCC3 (n=2 independent experiments). Scale bars, 10 μm.
Extended Data Figure 4. Functional interactions of the ASCC complex with other signaling pathways.
Immunofluorescence images of U2OS cells treated with MMS in the presence of spliceosomal inhibitor PLA-B (a) (100 nM; n=3 biological replicates; mean ± S.D.), the RNA Pol II inhibitor DRB (b) (100 μM; n=3 biological replicates; mean ± S.D.), or the indicated damage signaling kinase inhibitor (c) (n=2 biological replicates; mean). Numbers indicate the percent of cells expressing five or more ASCC3 foci. (d) Immunofluorescence of HA-ASCC2 and FK2 in cells after MMS (n=3 biological replicates; mean ± S.D.). (e) His-ASCC2 was purified on Ni-NTA, separated on a 10% SDS-PAGE gel, and analyzed by Coomassie blue staining (n=2 independent experiments). (f) Immunofluorescence of HA-ASCC2 cells and K63-ubiquitin (top) or K48-ubiquitin (bottom) after MMS treatment (n=2 independent experiments). Scale bars, 10 μm.
Extended Data Figure 5. ASCC2 binds specifically to K63-linked ubiquitin chains.
(a) and (b) His-ASCC2 or the indicated His-ASCC2 deletions were immobilized on Ni-NTA and assessed for binding to K63-Ub2–7 (a) or K48-Ub2–7 (b) (n=3 independent experiments). (c) Schematic of ASCC2 or different ASCC2 deletions and their observed respective binding towards K63-Ub2–7 or K48-Ub2–7. N.D., not determined. (d) Sequence alignment and conservation of residues 373–415 of human ASCC2. (e) Interaction model between ubiquitin and the CUE domain of ASCC2 (PDB ID: 2DI0). The positions of four residues (L478, L479, P498, and L506) are shown. (f) Binding assays were performed with K63-Ub2–7 using WT or the mutants of His-ASCC2 (n=3 independent experiments).
Extended Data Figure 6. Characterization of ASCC2 KO cells.
(a) ASCC2 gene knockouts in U2OS and PC-3 cells were generated using CRISPR/Cas9 technology and verified by deep sequencing. Whole cell lysates of the parental and KO cells were analyzed by Western blotting as shown (n=2 independent experiments). (b) Flow cytometry of WT and ASCC2-KO U2OS cells after MMS treatment to determine cell cycle distribution. (c) Immunofluorescence analysis of HA-ALKBH2 expressing cells after MMS. Numbers indicate the percent of cells expressing five or more HA-ALKBH2 foci (n=3 biological replicates; mean ± S.D.). (d) MMS sensitivity of WT or ASCC2 KO cells using MTS assay (mean ± S.D.; n=5 biological replicates). (e-f) Sensitivity of WT and ASCC2 KO cells to MMS (e) or camptothecin (f) was assessed by clonogenic survival assay (n=4 biological replicates; mean ± S.D.). (g-h) WT PC-3 and ASCC2-KO cell sensitivity to camptothecin (g) or bleomycin (h) using the MTS assay (n=5 biological replicates; mean ± S.D.). (i) Images of WT or ASCC2 KO cells expressing the indicated vectors after MMS exposure. (j) Quantitation of (i) (n=2 independent experiments; mean ± S.D.). (k) WT or ASCC2-KO cells expressing indicated vectors were assessed for sensitivity to MMS using the MTS assay (n=5 technical replicates; mean ±S.D.). Scale bar, 10 μm.
Extended Data Figure 7. ASCC2 coordinates ASCC-ALKBH3 complex recruitment during alkylation damage.
(a) Whole cell lysates from Extended Data Figure 6i (left) Figure 3e (right) and (right) were collected and expression was analyzed by Western blotting (n=2 independent experiments). (b) Immunoprecipitation of HA-ASCC2 or HA-ASCC2 L506A was performed and analyzed by Western blot as shown (n=2 biological replicates). (c) Flag-ASCC2 or Flag-ALKBH3 were immobilized and tested for binding to full-length (FL) His-ASCC3. (d) Flag-ASCC2 or Flag-ALKBH3 were immobilized and tested for binding to N-terminally deleted His-ASCC3 (His-ASCC3-ΔN) (n=2 independent experiments). (e) Flag-ALKBH3 was immobilized and tested for binding to His-ASCC2, with His-ASCC3-C (C-terminus of ASCC3) serving as a positive control (n=2 independent experiments). (f) ASCC-ALKBH3 complex model.
Extended Data Figure 8. Identification of the RNF113A E3 ligase.
(a) Whole cell lysates of U2OS cells infected with the indicated shRNAs were analyzed by Western blot. SHPRH was used as a loading control (n=1 independent experiment). (b) Immunofluorescence images of MMS-induced HA-ASCC2 foci in cells expressing the indicated shRNAs. (c) HA-ASCC2 foci quantitation from (b) (n=3 biological replicates; mean ± S.D.; two-tailed t-test, * = p < 0.001). (d) Compilation of E3 ligase shRNA screen results. For each candidate, U2OS cells were transduced with HA-ASCC2 and an E3 targeting shRNA. MMS-induced HA-ASCC2 foci formation was analyzed by immunofluorescence. Results were normalized to a scrambled shRNA (normalized score = 100). UBC13 denotes the positive control (purple). Results of three different shRNA to RNF113A are indicated in red (n=1 independent experiment for each shRNA). (e) Whole cell lysates of U2OS cells infected with the indicated shRNAs were analyzed by Western blot. Asterisk (*) indicates a non-specific band in the RNF113A blot (n=2 independent experiments). (f) Localization of Flag-ASCC2 and HA-RNF113A after MMS treatment (n=3 biological replicates). (g) Immunofluorescence of cells expressing Flag-RNF113A without MMS treatment (n=3 biological replicates).
Extended Data Figure 9. Characterization of the E3 ubiquitin ligase activity of RNF113A and TTDN1.
(a) TAP-RNF113A and the I264A RING finger mutant were stably expressed in HeLa-S cells and purified using anti-Flag resin. The eluted proteins were then analyzed by silver staining after SDS-PAGE (n=3 independent experiments). (b) Ubiquitin ligase assays using E1, E2 (UbcH5c plus Ubc13/MMS2; 50 nM each), and wildtype or I264A RNF113A. Reactions were analyzed by Western blot (n=3 independent experiments). (c) MMS sensitivity of lymphoblasts from two X-TTD patients in comparison to an unaffected individual (n=5 biological replicates; mean ± S.D.). (d) U2OS cells expressing the indicated combination of shRNA and RNF113A rescue vector were assessed for MMS sensitivity using MTS assay (n=5 technical replicates; mean ± S.D.). (e) Whole cell lysates of control or X-TTD lymphoblasts expressing indicated vectors after selection (n=2 independent experiments). (f) Immunofluorescence analysis of U2OS cells expressing the indicated shRNAs after MMS treatment. Western blot (n=2 independent experiments) from the same cells is shown on the bottom, as is the quantification of ASCC3 foci (n=3 biological replicates; mean ± S.D.).
Extended Data Figure 10. Functional characterization of RNF113A.
(a) Schematic of human RNF113A and its domain structure. The three deletion constructs used for localization analysis are also shown. (b) Images of cells expressing WT or the indicated HA-RNF113A deletion constructs. Scale bar, 10 μm. Quantitation of co-localization between each RNF113A construct and PRP8 is shown on the right (n=3 biological replicates; mean ± S.D.). (c) 293T cells expressing His-ubiquitin were transduced with control or RNF113A-targeting shRNAs and treated with MMS. Ubiquitinated proteins were isolated by Ni-NTA under denaturing conditions and Western blotted as shown. Input lysates were also analyzed as indicated. SF3B3, another ubiquitinated spliceosomal protein, was used as a control (n=3 independent experiments). (d) Cells expressing the indicated HA-vectors were treated with MMS as in (c). Lysates were then used for ubiquitin pulldown assays using GST-ASCC2, then blotted as shown. Input lysates were also analyzed as indicated (n=2 independent experiments). (e) His-NΔ-BRR2 was purified from Sf9 cells and analyzed by SDS-PAGE and Coomassie staining (left). This was then used as a substrate for ubiquitination assays using HA-Ub and wildtype (WT) or a RING-deletion (ΔRING) RNF113A (n=2 independent experiments). (f) Western blot analysis of U2OS cells expressing the indicated shRNAs used for immunofluorescence analysis in Figure 4F (n=2 independent experiments). (g) Quantitation of Figure 4F (n=3 biological replicates; mean ± S.D.; two-tailed t-test, # = p < 0.001). (h) MMS sensitivity of PC-3 cells expressing the indicated shRNAs was determined by MTS assay (n=5 technical replicates; mean ± S.D.).
Supplementary Material
Acknowledgments
We wish to thank Barry Sleckman, Gene Oltz, Thad Stappenbeck, Skip Virgin, and Ken Murphy for their advice on this manuscript. J.R.B. and A.K.B. are supported by the Cell and Molecular Biology Training Grant (5T32GM007067–40), and J.R.B. is also supported by the Shawn Hu and Angela Zeng student scholarship. J.M.S. is supported by the Monsanto Graduate Program Fellowship. P.M.L. is supported by a fellowship from the American Cancer Society (PF-14–182-01-DMC). We thank the patients and their families, whose help and participation made this work possible. We acknowledge the Alvin J. Siteman Cancer Center at Washington University and Barnes-Jewish Hospital for the use of the GEiC Core. The Siteman Cancer Center is supported by an NCI Cancer Center Support Grant (P30 CA091842; Eberlein, PI). This work was supported by the NIH (R01 GM108648 to A.V., R01 GM109102 to C.W., and R01 CA193318 to N.M.), the Alvin Siteman Cancer Research Fund, the Siteman Investment Program (both to N.M.), and the Children’s Discovery Institute of St. Louis Children’s Hospital (MC-II-2015–453 to N.M.).
Footnotes
The authors declare no competing financial interests.
References
- 1.Jackson SP & Durocher D Regulation of DNA damage responses by ubiquitin and SUMO. Mol Cell 49, 795–807, doi: 10.1016/j.molcel.2013.01.017 (2013). [DOI] [PubMed] [Google Scholar]
- 2.Sirbu BM & Cortez D DNA damage response: three levels of DNA repair regulation. Cold Spring Harbor perspectives in biology 5, a012724, doi: 10.1101/cshperspect.a012724 (2013). [DOI] [PMC free article] [PubMed] [Google Scholar]
- 3.Zhao Y, Brickner JR, Majid MC & Mosammaparast N Crosstalk between ubiquitin and other post-translational modifications on chromatin during double-strand break repair. Trends Cell Biol, doi: 10.1016/j.tcb.2014.01.005 (2014). [DOI] [PMC free article] [PubMed] [Google Scholar]
- 4.Drablos F et al. Alkylation damage in DNA and RNA--repair mechanisms and medical significance. DNA repair 3, 1389–1407, doi: 10.1016/j.dnarep.2004.05.004 (2004). [DOI] [PubMed] [Google Scholar]
- 5.Fu D, Calvo JA & Samson LD Balancing repair and tolerance of DNA damage caused by alkylating agents. Nat Rev Cancer 12, 104–120, doi: 10.1038/nrc3185 (2012). [DOI] [PMC free article] [PubMed] [Google Scholar]
- 6.Sedgwick B, Bates PA, Paik J, Jacobs SC & Lindahl T Repair of alkylated DNA: recent advances. DNA repair 6, 429–442, doi: 10.1016/j.dnarep.2006.10.005 (2007). [DOI] [PubMed] [Google Scholar]
- 7.Dango S et al. DNA unwinding by ASCC3 helicase is coupled to ALKBH3-dependent DNA alkylation repair and cancer cell proliferation. Mol Cell 44, 373–384, doi: 10.1016/j.molcel.2011.08.039 (2011). [DOI] [PMC free article] [PubMed] [Google Scholar]
- 8.Wick W & Platten M Understanding and targeting alkylator resistance in glioblastoma. Cancer discovery 4, 1120–1122, doi: 10.1158/2159-8290.CD-14-0918 (2014). [DOI] [PubMed] [Google Scholar]
- 9.Jung DJ et al. Novel transcription coactivator complex containing activating signal cointegrator 1. Molecular and cellular biology 22, 5203–5211 (2002). [DOI] [PMC free article] [PubMed] [Google Scholar]
- 10.Komander D & Rape M The ubiquitin code. Annual review of biochemistry 81, 203–229, doi: 10.1146/annurev-biochem-060310-170328 (2012). [DOI] [PubMed] [Google Scholar]
- 11.Prag G et al. Mechanism of ubiquitin recognition by the CUE domain of Vps9p. Cell 113, 609–620 (2003). [DOI] [PubMed] [Google Scholar]
- 12.Liu S et al. Promiscuous interactions of gp78 E3 ligase CUE domain with polyubiquitin chains. Structure 20, 2138–2150, doi: 10.1016/j.str.2012.09.020 (2012). [DOI] [PMC free article] [PubMed] [Google Scholar]
- 13.Unk I et al. Human SHPRH is a ubiquitin ligase for Mms2-Ubc13-dependent polyubiquitylation of proliferating cell nuclear antigen. Proc Natl Acad Sci U S A 103, 18107–18112, doi: 10.1073/pnas.0608595103 (2006). [DOI] [PMC free article] [PubMed] [Google Scholar]
- 14.Zhao GY et al. A critical role for the ubiquitin-conjugating enzyme Ubc13 in initiating homologous recombination. Mol Cell 25, 663–675, doi: 10.1016/j.molcel.2007.01.029 (2007). [DOI] [PubMed] [Google Scholar]
- 15.Thorslund T et al. Histone H1 couples initiation and amplification of ubiquitin signalling after DNA damage. Nature 527, 389–393, doi: 10.1038/nature15401 (2015). [DOI] [PubMed] [Google Scholar]
- 16.Hegele A et al. Dynamic protein-protein interaction wiring of the human spliceosome. Mol Cell 45, 567–580, doi: 10.1016/j.molcel.2011.12.034 (2012). [DOI] [PubMed] [Google Scholar]
- 17.Corbett MA et al. A novel X-linked trichothiodystrophy associated with a nonsense mutation in RNF113A. Journal of medical genetics 52, 269–274, doi: 10.1136/jmedgenet-2014-102418 (2015). [DOI] [PubMed] [Google Scholar]
- 18.Nakabayahi K et al. Identification of C7orf11 (TTDN1) gene mutations and genetic heterogeneity in nonphotosensitive trichothiodystrophy. Am J Hum Genet. 76, 510–516 doi: 10.1086/428141 (2005). [DOI] [PMC free article] [PubMed] [Google Scholar]
- 19.Sowa ME, Bennett EJ, Gygi SP & Harper JW Defining the human deubiquitinating enzyme interaction landscape. Cell 138, 389–403, doi: 10.1016/j.cell.2009.04.042 (2009). [DOI] [PMC free article] [PubMed] [Google Scholar]
- 20.Zhao Y et al. Noncanonical regulation of alkylation damage resistance by the OTUD4 deubiquitinase. EMBO J 34, 1687–1703, doi: 10.15252/embj.201490497 (2015). [DOI] [PMC free article] [PubMed] [Google Scholar]
- 21.Eng JK, McCormack AL & Yates JR An approach to correlate tandem mass spectral data of peptides with amino acid sequences in a protein database. J Am Soc Mass Spectrom 5, 976–989, doi: 10.1016/1044-0305(94)80016-2 (1994). [DOI] [PubMed] [Google Scholar]
Associated Data
This section collects any data citations, data availability statements, or supplementary materials included in this article.
Supplementary Materials
Data Availability Statement
The authors can confirm that all relevant data are included in the paper and/or its supplementary information files.


