Abstract
We investigated the phenotype of peripheral blood lymphocytes of patients with bipolar disorder type II in different phases of the disease in order to check whether there are specific changes in the immune parameters. Lymphocytes subpopulations were analyzed ex vivo with flow cytometry in patients in euthymic, depression or hypomanic phase of the disease and compared with healthy controls. All BD patients were characterized by lower percentage of CD3+CD4+ and CD3+CD8+ cells compared with healthy people. But only patients in depression and remission had higher percentage of B cells (CD19+ cells) compared with healthy people. The percentage of CD4+CD25+ and CD8+CD25+ cells was decreased in patients in hypomanic phase compared with healthy control. Patients in remission were characterized by increased concentrations of IL-6 and IL-10 and decreased level of TNF in blood serum. Significant correlations between immunologic parameters and the results of Hamilton or Young scale have also been found. Our results demonstrate that there are significant differences in lymphocyte subpopulations which depend on the phase of the disease the patient is currently in.
Introduction
Psychoneuroimmunology is an interdisciplinary branch of biomedical science that studies the relationship between the nervous system, endocrine and immunology and their interaction with the psyche (mainly stress and its consequences)1. The ability of these systems to communicate with each other is facilitated by the production of various chemical mediators and the presence of their receptors on different cells2,3. Lymphocytes and macrophages have noradrenergic, cholinergic and peptidergic receptors on their surfaces which enables to create “neuroimmunological synapses” between nervous and immune cells4. Lymphocytes can bind different neurotransmitters including norepinephrine, dopamine, adrenaline, GABA, acetylcholine, and peptides (substance P, vasoactive intestinal peptide, somatostatin, neuropeptide Y)4–6. These substances control most of the functions of the immune cells such as differentiation, proliferation, antigen expression and cytokine production4,6–8.
On the other hand, cytokines regulate not only the nervous system, but are also produced by neurons and glial cells2,4,9. Some, like interleukin 1 (IL-1) or tumor necrosis factor α (TNF-α), are involved in the fever development and loss of appetite that accompanies inflammation10. Ye et al. reported that plasma levels of IL-6 and TNF-α are significantly higher in depressed patients than in healthy people11. Treatment with antidepressants significantly reduces plasma levels of IL-6 and TNF-α12–14. At the same time, the level of IL-10, which is neuroprotective and anti-inflammatory cytokine, increases in patients who are being treated with antidepressant drugs belonging to different groups (serotonin re-uptake inhibitors, tricyclics, and heterocyclic)15,16.
Bipolar disorder (BD) is a chronic mental disorder in which the patient experiences both depression and mania (BD type I) or hypomania (BD type II)17. There are also other subtypes and forms of bipolar disorder referred as “bipolar spectrum”18. Treatment of bipolar disorder consists of pharmacotherapy and psychotherapy. Types of interventions and drugs used in treatment depend on the type of disorder, its phase and severity. Main therapeutic goals are the reduction of acute symptoms of depression or hypomania/mania and maintaining of stable state (euthymic state).
Studies have shown that compared with healthy people, BD patients present increased plasma levels of IL-4, IL-10 as well as IL-6 and TNF-α19. Barbosa et al. demonstrated increased levels of soluble receptor for TNF-α type 120,21. BD patients also are characterized by the reduced percentage of total T lymphocytes (CD3+ cells)22,23 as well as population of cytotoxic T lymphocytes (CD3+CD8+ cells) compared with healthy people22. Barbosa et al. also observed that BD patients exhibit higher percentage of activated CD4+CD25+ T cells22.
It should be noted that in the majority of the above cited studies, BD patients qualified for the study were in a state of euthymia. It would be interesting to check if the phase of the disease affects the immune parameters. Therefore, we investigated the proportions of main lymphocyte subpopulations in patients with BD type II depending on the phase of disease they were in and compared them with those observed in healthy people. We also analyzed whether there are differences in the percentages of lymphocytes expressing activation CD25 antigen which is related to IL-2 dependent proliferation, cytokine production and expansion of lymphocyte populations24–26. We investigated the concentration of cytokines (IL-6, TNF-α, IL-17A, IL-10) in the serum of BD patients and healthy individuals. Also, we correlated immunologic parameters with the results of Hamilton or Young scales.
Results
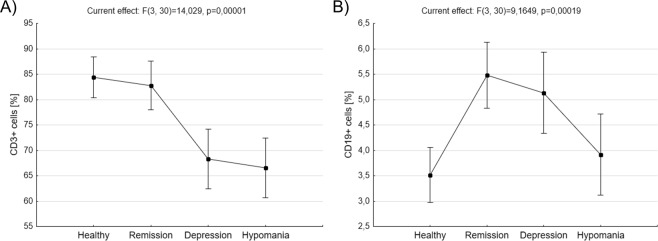
Percentage of two main lymphocyte populations, that is T lymphocytes (CD3+ cells) and B lymphocytes (CD19+ cells), was compared between BD patients in remission, depression, hypomania, and healthy people. BD patients in depression phase of the disease were characterized by significantly lower percentage of CD3+ cells compared to healthy control (68,33 ± 2,87 vs. 84, 38 ± 1,95, p = 0,002477, ANOVA with post-hoc Tukey test) and patients in remission (68,33 ± 2,87 vs. 82, 77 ± 2,35, p = 0,006811, ANOVA with post-hoc Tukey test, Fig. 1A). BD patients in hypomania phase of the disease also were characterized by significantly lower percentage of CD3+ cells compared to healthy control (66,50 ± 2,87 vs. 84, 38 ± 1,95, p = 0,000823, ANOVA with post-hoc Tukey test) and patients in remission (66,50 ± 2,87 vs. 82, 77 ± 2,35, p = 0,002150, ANOVA with post-hoc Tukey test, Fig. 1A). BD patients in remission had significantly higher percentage of CD19+ cells compared to healthy control (5,47 ± 0,32 vs. 3,52 ± 0,26, p = 0,000929, ANOVA with post-hoc Tukey test) and patients in hypomanic phase (5,47 ± 0,32 vs. 3,92 ± 0,39, p = 0,039806, ANOVA with post-hoc Tukey test, Fig. 1B). Also, BD patients in depression had significantly higher percentage of CD19+ cells compared to healthy control (5,13 ± 0,39 vs. 3,52 ± 0,26, p = 0,031415, ANOVA with post-hoc Tukey test, Fig. 1B). No difference has been found in the percentage of CD19+ cells between patients in hypomania and healthy people.
Figure 1.
Comparison of proportions of CD3+ and CD19+ cells ex vivo. Figures show percentages of CD3+ cells (A) and CD19+ cells (B) in healthy people, BD patients in remission, depression or hypomania. Middle points show means and vertical bars represent 0.95 confidence intervals, ANOVA test.
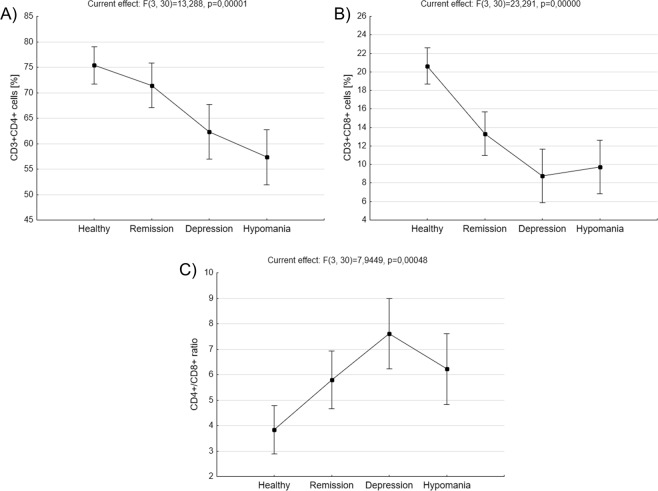
Patients in depression had significantly lower percentage of CD3+CD4+ cells compared to healthy control (62,33 ± 2,64 vs. 75,38 ± 1,79, p = 0,007804, ANOVA with post-hoc Tukey test, Fig. 2A). BD patients in hypomania phase of the disease also were characterized by significantly lower percentage of CD3+CD4+ cells compared with healthy control (57,33 ± 2,64 vs. 75,38 ± 1,79, p = 0,000343, ANOVA test with post-hoc Tukey test) and patients in remission (57,33 ± 2,64 vs. 71,44 ± 2,15, p = 0,003788, ANOVA test with post-hoc Tukey test, Fig. 2A). No difference has been found in the percentage of CD3+CD4+ cells between patients in hypomania and depression.
Figure 2.
Comparison of main CD3+ subpopulations ex vivo. Figures show percentages of CD3+CD4+ cells (A), CD3+CD8+ cells (B) as well as CD4+/CD8+ ratio (C) in healthy people, BD patients in remission, depression or hypomania. Middle points show means and vertical bars represent 0.95 confidence intervals, ANOVA test.
Compared with healthy people, BD patients in depression were characterized by significantly lower percentage of CD3+CD8+ cells (8,77 ± 1,41 vs. 20,62 ± 0,95, p = 0,000166, ANOVA with post-hoc Tukey test, Fig. 2B). Patients in hypomania phase of the disease had also significantly decreased percentage of CD3+CD8+ cells compared with healthy control (9,72 ± 1,41 vs. 20,62 ± 0,95, p = 0,000186, ANOVA with post-hoc Tukey test, Fig. 2B). Euthymic patients also had significantly lower percentage of CD3+CD8+ cells compared with healthy control (13,22 ± 1,15 vs. 20,62 ± 0,95, p = 0,000677, ANOVA with post-hoc Tukey test, Fig. 2B). The significant difference in the CD4+/CD8+ ratio was observed only in patients with depression compared to healthy people (7,61 ± 0,68 vs. 3,84 ± 0,46, p = 0,002689, ANOVA with post-hoc test, Fig. 2C). CD4+/CD8+ ratio was 6,23 ± 0,68 in BD patients in hypomania and 5,79 ± 0,55 in euthymic patients.
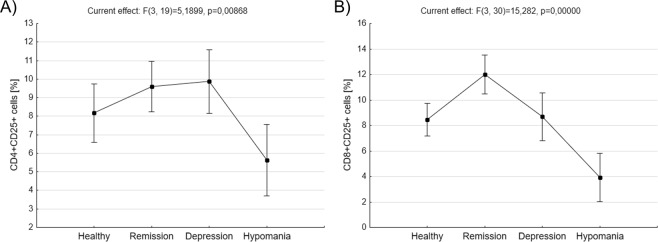
We also analyzed subpopulations of T lymphocytes with the expression of CD25 (activated T cells). BD patients in hypomanic phase of the disease had significantly decreased percentage of CD4+CD25+ cells compared to patients in remission (5,64 ± 0,92 vs. 9,59 ± 0,65, p = 0,030309, ANOVA with post-hoc Tukey test) or depression (5,64 ± 0,92 vs. 9,87 ± 0,82, p = 0,019462, ANOVA with post-hoc Tukey test, Fig. 3A). They also had significantly decreased percentage of CD8+CD25+ cells compared to patients in remission (3,92 ± 0,93 vs. 12 ± 0,75, p = 0,000163, ANOVA with post-hoc Tukey test) or depression (3,92 ± 0,93 vs. 8,68 ± 0,93, p = 0,005437, ANOVA with post-hoc Tukey test) as well as healthy people (3,92 ± 0,93 vs. 8,44 ± 0,63, p = 0,008647, ANOVA with post-hoc Tukey test, Fig. 3B). Additionally, BD patients in remission has significantly increased percentage of CD8+CD25+ cells compared to healthy people (12 ± 0,75 vs. 8,44 ± 0,63, p = 0,011947, ANOVA with post-hoc Tukey test).
Figure 3.
Comparison of T lymphocytes with the expression of CD25 antigen ex vivo. Figures show percentages of CD4+CD25+ cells (A) and CD8+CD25+ cells (B) in healthy people, BD patients in remission, depression or hypomania. Middle points show means and vertical bars represent 0.95 confidence intervals, ANOVA test.
Drugs that patients received (lithium or valproic acid) did not affect the above immunological parameters in the study group (data not shown).
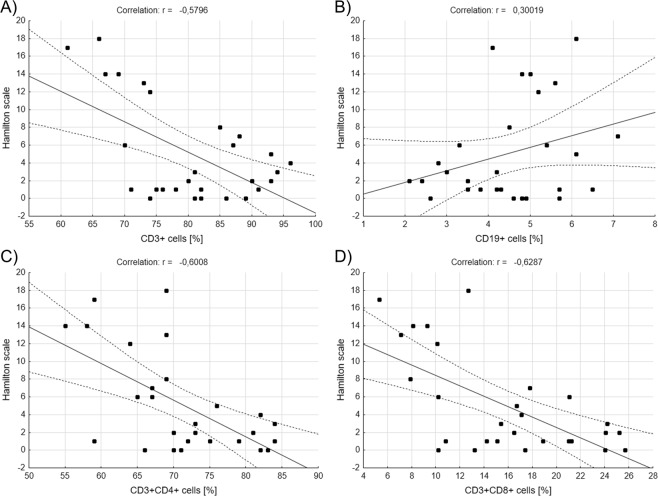
We also correlated percentages of lymphocyte subpopulations with the results of Hamilton Rating Scale for Depression or Young Rating Scale for Mania. We included in the calculations healthy people, BD patients in remission and patients with depression for Hamilton scale (Fig. 4). And so, we found out that there are significantly negative correlations between Hamilton scale results and percentages of CD3+ (r = −0,579642, r2 = 0,335985, p = 0,001227, Pearson’s correlation, Fig. 4A), CD3+CD4+ (r = −0,600828, r2 = 0,360994, p = 0,000722, Pearson’s correlation, Fig. 4C) and CD3+CD8+ (r = −0,628726, r2 = 0,395296, p = 0,000339, Pearson’s correlation, Fig. 4D) cells that is, the higher score the subject received, the lower the percentage of lymphocytes was. No correlation has been found between Hamilton scale results and percentage of CD19+ cells (Fig. 4B). Also, there was significant positive correlation between Hamilton scale results and CD4+/CD8+ ratio (r = 0,581207, r2 = 0,337801, p = 0,001181, Pearson’s correlation, data not shown).
Figure 4.
Correlations between main lymphocytes’ subpopulations ex vivo and results of Hamilton Rating Scale. Figures show correlations between percentages of CD3+, CD19+, CD3+CD4+ or CD3+CD8+ and the results of Hamilton Rating Scale for Depression (A–D), Pearson correlation.
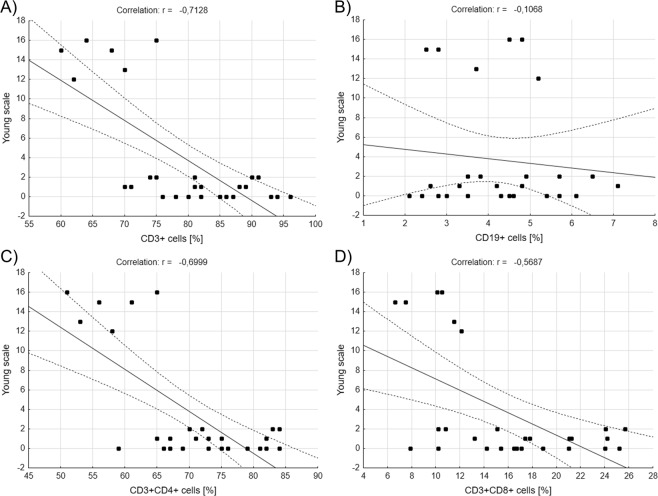
Similar correlations were performed for Young scale – this time healthy people, BD patients in remission and patients with hypomania were included in the calculations (Fig. 5). We saw a significantly negative correlations between Young scale results and percentages of CD3+ (r = −0,712800, r2 = 0,508084, p = 0,000021, Pearson’s correlation, Fig. 5A), CD3+CD4+ (r = −0,699857, r2 = 0,489800, p = 0,000034, Pearson’s correlation, Fig. 5C) and CD3+CD8+ (r = −0,568740, r2 = 0,323465, p = 0,001589, Pearson’s correlation, Fig. 5D) cells. No correlation has been found between Young scale results and percentage of CD19+ cells (Fig. 5B). Also, there was significant positive correlation between Hamilton scale results and CD4+/CD8+ ratio (r = 0,384955, r2 = 0,148190, p = 0,043090, Pearson’s correlation, data not shown).
Figure 5.
Correlations between main lymphocytes’ subpopulations ex vivo and results of Young Rating Scale. Figures show correlations between percentages of CD3+, CD19+, CD3+CD4+ or CD3+CD8+ and the results of Young Rating Scale for Mania (A–D) obtained by healthy people and BD patients, Pearson correlation.
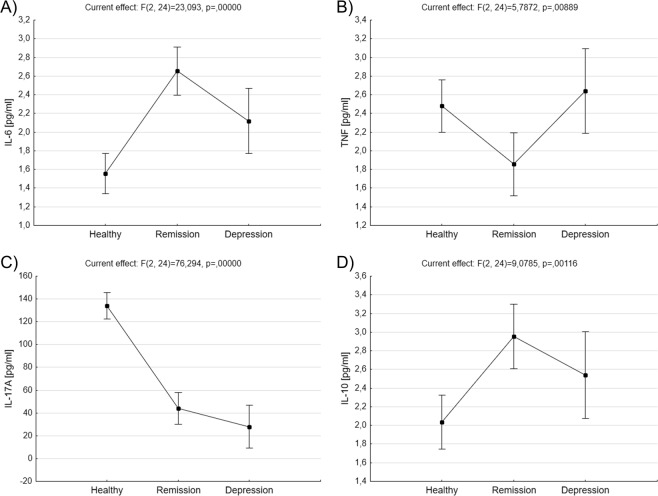
The concentration of cytokines (IL-6, TNF-α, IL-17A, IL-10) was measured in the serum of healthy subjects and BD patients in remission or depression. Euthymic patients were characterized by significantly increased level of IL-6 compared with healthy control (2,65 ± 0,12 vs. 1,55 ± 0,1, p = 0,000132, ANOVA with post-hoc Tukey test, Fig. 6A). TNF-α concentration was significantly decreased in patients in remission compared to healthy people (1,85 ± 0,16 vs. 2,48 ± 0,13, p = 0,032135, ANOVA with post-hoc Tukey test) and patients in depression (1,85 ± 0,16 vs. 2,64 ± 0,22, p = 0,046543, ANOVA with post-hoc Tukey test Fig. 6B). Compared with healthy people BD patients in remission were characterized by significantly decreased concentration of IL-17A (44 ± 6,76 vs. 134,15 ± 5,63, p = 0,000129, ANOVA with post-hoc Tukey test, Fig. 6C). Similar thing concerned patients in depression - mean concentration of IL-17A was 28 ± 9,07 vs. 134,15 ± 5,63 (p = 0,000129, ANOVA with post-hoc Tukey test, Fig. 6C). BD patients in remission had also significantly increased level of IL-10 compared with healthy control (2,95 ± 0,16 vs. 2,03 ± 0,13, p = 0,002037, ANOVA with post-hoc Tukey test, Fig. 6D). No difference has been found in the level of IL-10 cells between patients in depression and healthy people.
Figure 6.
Comparison of cytokines’ levels in serum samples. Figures show concentrations (pg/ml) of IL-6 (A), TNF (B), IL-17A (C) and IL-10 (D) in serum samples of healthy people and BD patients. Middle points show means and vertical bars represent 0.95 confidence intervals, ANOVA test.
Discussion
The results of this study confirm that there are changes in lymphocyte subpopulation ex vivo, which strongly depend on the phase of bipolar disorder the patient is currently in. First of all, BD patients who were depressed or hypomanic were characterized by a low percentage of CD3+ cells compared with healthy people and patients who were in remission, which was accompanied by decrease in the percentages of CD3+CD4+ and CD3+CD8+ cells. These changes were significantly associated with the results of Hamilton (for the depressed patients) or Young (for the patients in hypomanic phase) scales, which means that the higher score the patient received (more depressed or maniac he was), the lower the percentage of T lymphocytes was. Low percentage of T lymphocytes, especially cytotoxic ones (CD3+CD8+ cells), has already been reported by Barbosa et al.22. Unlike us, authors did not observed decrease in the percentage of helper lymphocytes (CD3+CD4+ cells). The difference in these observations can be easily explained; Barbosa et al. included only euthymic BD patients into their studies. Meanwhile we have shown that the percentage of both CD3+CD4+ and CD3+CD8+ cells was decreased in depressed and hypomanic patients, whereas in patients in remission only cytotoxic cells were still lowered. We believe that this is very important clinical observation, which proves that during the active phase of disease all T lymphocytes “disappear” from patient’s blood, probably because they migrate to the brain. Since the classical role of cytotoxic T cells is to mediate host defense against the intracellular infectious agents (especially viruses), decrease of CD3+CD8+ cells observed even during the remission, according to Barbosa et al., could support the hypothesis of a close relationship between BD and infection caused by viruses22. Compared with the general population, BD patients are more predisposed to some infectious diseases, particularly hepatitis B or C27 and human immunodeficiency virus infection28. An increase in the incidence of certain viral diseases in BD patients actually may be the result of immune disorders in the course of the disease, especially since studies have failed to demonstrate the presence of viral genome in patients with psychiatric disorders.
According to study of Barbosa et al.22, euthymic BD patients are characterized by higher percentages of activated (CD4+CD25+) cells ex vivo. Meanwhile, we demonstrated that this is true only for CD8+CD25+ cells, which would also support the thesis of a close relationship between BD and viral infections. Knijff and colleagues showed that BD patients do not present any differences in activated T lymphocytes (expressing CD25+) regardless the phase of the disease29. However, they were studying expression of CD25 after in vitro stimulation which makes difficult to compare their results with the results obtained ex vivo by Barbosa et al. Interestingly, in our study we have demonstrated that patients in hypomania had a low percentage of CD4+CD25+ and CD4+CD25+ cells ex vivo compared with other groups of patients and healthy people, which seems to be their characteristic feature.
Another interesting observation was that patients in remission or depression in opposition to hypomanic patients had higher percentage of B cells ex vivo compared with healthy people. So far, there have been no reports of disturbances in the humoral response in BD. However, there are observations showing that euthymic BD patients are characterized by a higher concentration of IL-1030, a cytokine, which plays an important role in B cell activation and stimulates immunoglobulin class switching. We measured the level of IL-10 in the serum samples of our patients in depression and remission and saw higher, compared with samples from healthy people, concentrations of IL-10 in euthymic patients. Unfortunately, we didn’t have any samples from patients in hypomania to compare and confirm a relationship between IL-10 level and B cell percentage but we believe that the increase of B cell percentage observed ex vivo in these patients could be explained by high level of IL-10. The question remains why patients in remission have immune changes similar to those seen in depressed patients. Maybe it is related to the condition that preceded the remission of the patients who were qualified for our study. The ideal way to answer this question would be to observe the same BD patient in all stages of the disease and analyze whether immunologic changes are related to the particular phase.
Both patients in depression and remission had lower concentration of IL-17A compared with healthy people, which we believe results from high concentration of IL-10 – as demonstrated by Gu et al.31, IL-10 is a negative suppressor of Th17 cell differentiation. Meanwhile, concentration of IL-6 differentiated patients in remission from depressed patients. IL-6 is known to stimulate B cell differentiation into plasma cells and it increases immunoglobulin G production32. Therefore, an increase of IL-6 could be another factor contributing to B cell increase observed in euthymic patients. At the same time, patients in remission were characterized by decreased TNF concentration compared with healthy people and patients in depression. It may be related to the fact that euthymic BD patients have higher blood levels of soluble TNF receptor (sTNFR)20 that can bind TNF. Generally, data regarding the production of IL-6, TNF and IL-10 are contradictory with some studies showing decreased production of these cytokines, while others present no significant differences11–14,19. It seems that several things should be taken into account when comparing immunological results: (1) which patients were qualified for the study (euthymic, depressed or manic), (2) the effect of drugs on some of the parameters which cannot be excluded, and (3) whether the cytokine concentrations were measured in serum or in cell culture supernatants after mitogenic stimulation. According to Modabbernia et al.19 as well as Barbosa et al.33, due to the above-mentioned factors it is almost impossible to draw definite conclusions on specific immune markers for BD. Our team has recently demonstrated that lithium and valproic acid can influence T lymphocytes stimulated with monoclonal anti-CD3 antibody; both drugs can protect lymphocytes from apoptosis34. However, their inhibitory effect on lymphocyte proliferation is visible only at toxic doses. In this study, drugs that BD patients received (lithium or valproic acid) did not affect either percentages of lymphocyte subpopulations ex vivo or concentration of cytokines. Modabbernia et al. demonstrated similar results but for IL-2, IL-4 and INF-γ19. Their meta-analysis also have shown that BD patients had a near significant increase in IL-6 concentrations compared with healthy people probably because patients in mania showed elevated trends of IL-619. Results we obtained for IL-10 concentrations seem to be similar to those shown by other authors19. However, according to Modabbernia et al.19, BD patients seem to rather show significantly higher TNF-α values in patients than healthy control, which our results do not confirm. Discrepancies in the results mean that further research is needed preferably performed in the same patients at different stages of the disease.
These results demonstrate that there are differences in subpopulations of T and B lymphocytes that possibly dependent on the current phase of bipolar disorder, which was also demonstrated by observed correlations between some immunologic parameters and the results of Hamilton Rating Scale for Depression or Young Rating Scale for Mania. In our opinion, immune responses can depend on the form of bipolar disease presentation. Another possibility, more provocative, is that maybe changes in the immune responses can trigger course of the disease towards depression or hypomania. However, we must admit that at the moment we cannot draw definitive conclusions on this subject. First of all, the number of examined patients should be increased in each phase of the disease. Furthermore, it would be a good idea to expand the immunological panel, which would allow to find other features differentiating the phase of bipolar disorder. However, the most interesting results can be provided by observation of the patient for one or even two years during various phases of the disease, to correlate the observed changes in the parameters with the patient’s mental state. This could be the answer to the question whether immune changes are truly specific to specific phases of the disease.
Methods and Material
Patients and healthy control
14 healthy (8 female and 6 male) people (mean age 39,45 ± 10,4) and 22 (11 female and 11 male) bipolar disease type II patients (mean age 37,91 ± 7,4) participated in the study. All participants underwent basic physical examination and psychiatric interview in Clinic of Adult Psychiatry of the Medical University of Gdansk. Patients were diagnosed with the Structured Clinical Interview for DSM-V35. Mental state of patients was assessed using Hamilton Depression Rating Scale36, and Young Mania Rating Scale37. 10 euthymic patients were included in the study, 6 patients with depression and 6 patients in mania phase (Table 1). BD patients with depression achieved significantly higher results in Hamilton scale compared to healthy people (14,66 ± 0,99 vs. 1,92 ± 0,67, p = 0,000132, ANOVA with post-hoc Tukey test) and patients in remission (14,66 ± 0,99 vs. 3,22 ± 0,81, p = 0,000132, ANOVA test with post-hoc Tukey test). Patients in hypomania achieved significantly higher results in Young scale compared to healthy people (14,5 ± 0,43 vs. 0,77 ± 0,29, p = 0,000132, ANOVA with post-hoc Tukey test) and patients in remission (14,5 ± 0,43 vs. 0,66 ± 0,35, p = 0,000132, ANOVA test with post-hoc Tukey test). 10 patients were treated with lithium carbonate and 12 received valproic acid. The time of therapy with lithium or valproic acid was average 14,43 ± 2.02 months.
Table 1.
Basic characteristic of BD patients and healthy people.
| Patients (n = 22) | Healthy people (n = 14) | |||
|---|---|---|---|---|
| Remission (M/F) | Depression (M/F) | Mania (M/F) | ||
| Age (years) | 37,91 ± 7.4 | 39,45 ± 10,4 | ||
| Sex (M/F) | 11/11 | 6/8 | ||
| Phase of Bipolar Disorder | 10 (6/4) | 6 (2/4) | 6 (3/3) | — |
| Lithium carbonate | 10 | — | ||
| Valproic acid | 12 | — | ||
| Hamilton Rating Scale for Depression | 3,22 ± 0,81 | 14,66 ± 0,99 | — | 1,92 ± 0,67 |
| Young Rating Scale for Mania | 0,66 ± 0,35 | — | 14,5 ± 0,43 | 0,77 ± 0,29 |
Exclusion criteria for the control group were: diagnosed mental disorders and/or incidence of mental illness in the family. Exclusion criteria for both patients and healthy people included: autoimmune disorders, chronic inflammatory disorder, diabetes and allergies. None of the patients admitted to drug addiction. A few people admitted to occasional alcohol consumption.
All participants were informed about the purpose of the study and gave their written informed consent. The study was approved by Independent Bioethical Committee for the Scientific Research of the Medical University of Gdansk. All methods were performed in accordance with the relevant guidelines and regulations.
Collecting peripheral blood and serum
3 ml of venous peripheral blood was collected from patients and healthy controls in tubes containing EDTA as the anti-coagulant after overnight fasting for the cytometric analysis of lymphocytes’ subpopulations. 5 ml of blood was collected into anticoagulant-free tubes in order to collect serum for the assessment of cytokine concentrations. Serum samples were stored at −80 °C.
Determination of lymphocyte subpopulations
Samples of 50 μl per tube blood were transferred for staining with monoclonal antibodies and red blood cells (RBCs) lysis. RBCs were lysed with buffer containing 0,8% NH4Cl and 0,1% KHCO3. Cells were then washed with PBS (phosphate buffered saline) buffer and stained with: APC-Cy7-conjugated anti-CD3, PE-Cy5-conjugated anti-CD4, V500-conjugated anti-CD8, PE-Cy7-conjugated anti-CD25 and APC-H7-conugated anti-CD19 antibodies (Becton Dickinson, USA) for 30 minutes at 4 °C in the dark. After this time cells were washed with PBS and suspended in 200 µl of PBS buffer for flow cytometric analysis.
Quantitative fluorescence analysis was performed with FACSVerse (Becton Dickinson, USA). 10000 lymphocytes (based on their forward and side scatter gating) were acquired from each sample. Cytometric data were analyzed with FlowJo X 10.0.7 (Tree Star; USA).
Cytokine measurements in the serum
Cytometric Bead Array (CBA™, BD Biosciences, USA) was used to estimate the level of IL-6, TNF-α, IL-17A, IL-10 cytokines in patients’ serum. Concentrations of cytokines were analyzed with the use of Becton Dickinson CBA software.
Statistical analysis
Statistical analysis was done with the Statistica version 10 (StatSoft, Inc., USA). The Kolmogorov-Smirnov and Lilliefors tests were used for testing normality. The significance tests were chosen according to data distribution with the level of significance p < 0.05.
Acknowledgements
Cytometric analyses were performed using the instrument acquired within the Network for Imaging of Structural and Functional Pathology of Cells of the University and Medical University of Gdansk. This work was supported by the Polish National Science Centre project “PRELUDIUM” NN402 465337 granted to Jacek M. Witkowski and Krzysztof Pietruczuk and by the statutory funds of the Medical University of Gdansk (02-0058/07/262) granted to Jacek M. Witkowski.
Author Contributions
Authors K.P., J.L. and J.M.W. conceived and designed experiments. K.P. performed the experiments. Authors K.P. and K.A.L. wrote the paper. K.G. and K.P. managed the data analysis. K.G., K.A.L., W.J.C., J.L. and J.M.W. reviewed the final manuscript.
Competing Interests
The authors declare no competing interests.
Footnotes
Publisher’s note: Springer Nature remains neutral with regard to jurisdictional claims in published maps and institutional affiliations.
References
- 1.Irwin MR. Human psychoneuroimmunology: 20 Year of discovery. Brain Behav Immun. 2008;22:129–139. doi: 10.1016/j.bbi.2007.07.013. [DOI] [PubMed] [Google Scholar]
- 2.Webster J, Toelli L, Sternberg EM. Neuroendocrine regulation of immunity. Annu Rev Immunol. 2002;20:125–163. doi: 10.1146/annurev.immunol.20.082401.104914. [DOI] [PubMed] [Google Scholar]
- 3.Pietruczuk K, Jakuszkowiak K, Nowicki Z, Witkowski JM. Cytokiny w regulacji snu i jego zaburzeniach. Sen. 2003;3:127–133. [Google Scholar]
- 4.Kohm AP, Sanders VM. Norepinephrine and beta 2-adrenergic receptor stimulation regulate CD4+ T and B lymphocyte function in vitro and in vivo. Pharmacol Rev. 2001;53:487–525. [PubMed] [Google Scholar]
- 5.Kin NW, Sanders VM. It takes nerve to tell T and B cells what to do. J Leukoc Biol. 2006;79:1093–1104. doi: 10.1189/jlb.1105625. [DOI] [PubMed] [Google Scholar]
- 6.Cosentino M, Kustrimovic N, Ferrari M, Rasini E, Marino F. cAMP levels in lymphocytes and CD4+ regulatory T-cell functions are affected by dopamine receptor gene polymorphisms. Immunology. 2018;153:337–341. doi: 10.1111/imm.12843. [DOI] [PMC free article] [PubMed] [Google Scholar]
- 7.Slota C, Shi A, Chen G, Bevans M, Weng NP. Norepinephrine preferentially modulates memory CD8 T cell function inducing inflammatory cytokine production and reducing proliferation in response to activation. Brain Behav Immun. 2015;46:168–179. doi: 10.1016/j.bbi.2015.01.015. [DOI] [PMC free article] [PubMed] [Google Scholar]
- 8.Fujii T, et al. Physiological functions of the cholinergic system in immune cells. J Pharmacol Sci. 2017;134:1–21. doi: 10.1016/j.jphs.2017.05.002. [DOI] [PubMed] [Google Scholar]
- 9.Lutz W, Tarkowski M, Dudek B. Psychoimmunologia. Nowe spojrzenie na funkcjonowanie układu odpornościowego. Medycyna Pracy. 2001;52:203–209. [PubMed] [Google Scholar]
- 10.Kronfol Z, Remick DG. Cytokines and the brain: implications for clinical psychiatry. Am J Psychiatry. 2000;157:683–694. doi: 10.1176/appi.ajp.157.5.683. [DOI] [PubMed] [Google Scholar]
- 11.Ye G, et al. Association between increased serum interleukin-6 levels and sustained attention deficits in patients with major depressive disorder. Psychol Med. 2018;8:1–7. doi: 10.1017/S0033291718000090. [DOI] [PubMed] [Google Scholar]
- 12.O’Brien SM, Scully P, Fitzgerald P, Scott LV, Dinan TG. Plasma cytokine profiles in depressed patients who fail to respond to selective serotonin reuptake inhibitor therapy. J Psychiatr Res. 2007;41:326–331. doi: 10.1016/j.jpsychires.2006.05.013. [DOI] [PubMed] [Google Scholar]
- 13.Basterzi AD, et al. IL-6 levels decrease with SSRI treatment in patients with major depression. Hum Psychopharmacol. 2005;20:473–476. doi: 10.1002/hup.717. [DOI] [PubMed] [Google Scholar]
- 14.Yoshimura R, et al. Higher plasma interleukin-6 (IL-6) level is associated with SSRI- or SNRI-refractory depression. Prog Neuropsychopharmacol Biol Psychiatry. 2009;33:722–726. doi: 10.1016/j.pnpbp.2009.03.020. [DOI] [PubMed] [Google Scholar]
- 15.Green HF, Nolan YM. GSK-3 mediates the release of IL-1β, TNF-α and IL-10 from cortical glia. Neurochem Int. 2012;61:666–671. doi: 10.1016/j.neuint.2012.07.003. [DOI] [PubMed] [Google Scholar]
- 16.Maes M, et al. Negative Immunoregulatory Effects of Antidepressants: Inhibition of Interferon-γ and Stimulation of Interleukin-10 Secretion. Neuropsychopharmacology. 1999;20:370–379. doi: 10.1016/S0893-133X(98)00088-8. [DOI] [PubMed] [Google Scholar]
- 17.Angst J, Ajdacic-Gross V, Rössler W. Classification of mood disorders. Psychiatr Pol. 2015;49:663–671. doi: 10.12740/PP/58259. [DOI] [PubMed] [Google Scholar]
- 18.Akiskal HS. The emergence of the bipolar spectrum: validating along clinical-emipedmiologic and familial-genetic lines. Psychopharmacol Bull. 2007;40:99–115. [PubMed] [Google Scholar]
- 19.Modabbernia A, Taslimi S, Brietzke E, Ashrafi M. Cytokine Alterations in Bipolar Disorder: A Meta-Analysis of 30 Studies. Biol Psychiatry. 2013;74:15–25. doi: 10.1016/j.biopsych.2013.01.007. [DOI] [PubMed] [Google Scholar]
- 20.Barbosa IG, et al. Increased levels of adipokines in bipolar disorder. J Psychiatr Res. 2012;46:389–393. doi: 10.1016/j.jpsychires.2011.11.010. [DOI] [PubMed] [Google Scholar]
- 21.Barbosa IG, et al. Increased plasma levels of soluble TNF receptor I in patients with bipolar disorder. Eur Arch Psychiatry Clin Neurosci. 2011;261:139–143. doi: 10.1007/s00406-010-0116-z. [DOI] [PubMed] [Google Scholar]
- 22.Barbosa, I. G. et al. Monocyte and Lymphocyte Activation in Bipolar Disorder: A New Piece in the Puzzle of Immune Dysfunction in Mood Disorders. Int J Neuropsychopharmacol18: 021 (2014). [DOI] [PMC free article] [PubMed]
- 23.Wu W, et al. Circulating T lymphocyte subsets, cytokines, and immune checkpoint inhibitors in patients with bipolar II or major depression: a preliminary study. Sci Rep. 2017;7:40530. doi: 10.1038/srep40530. [DOI] [PMC free article] [PubMed] [Google Scholar]
- 24.Létourneau S, Krieg C, Pantaleo G, Boyman O. IL-2- and CD25-dependent immunoregulatory mechanisms in the homeostasis of T-cell subsets. Journal of Allergy and Clinical Immunology. 2009;123:758–762. doi: 10.1016/j.jaci.2009.02.011. [DOI] [PubMed] [Google Scholar]
- 25.Shipkova M, Wieland E. Surface markers of lymphocyte activation and markers of cell proliferation. Clinica Chimica Acta. 2012;413:1338–1349. doi: 10.1016/j.cca.2011.11.006. [DOI] [PubMed] [Google Scholar]
- 26.Reddy M, Eirikis E, Davis C, Davis HM, Prabhakar U. Comparative analysis of lymphocyte activation marker expression and cytokine secretion profile in stimulated human peripheral blood mononuclear cell cultures: an in vitro model to monitor cellular immune function. Journal of Immunological Methods. 2004;293:127–142. doi: 10.1016/j.jim.2004.07.006. [DOI] [PubMed] [Google Scholar]
- 27.Yolken RH, Torrey EF. Viruses, schizophrenia, and bipolar disorder. Clin Microbiol Rev. 1995;8:131–145. doi: 10.1128/CMR.8.1.131. [DOI] [PMC free article] [PubMed] [Google Scholar]
- 28.Chong LW, et al. Association of viral hepatitis and bipolar disorder: a nationwide population-based study. J Transl Med. 2018;16:173. doi: 10.1186/s12967-018-1542-3. [DOI] [PMC free article] [PubMed] [Google Scholar]
- 29.Knijff EM, et al. A relative resistance of T cells to dexamethasone in bipolar disorder. Bipolar Disord. 2006;8:740–50. doi: 10.1111/j.1399-5618.2006.00359.x. [DOI] [PubMed] [Google Scholar]
- 30.Altamura AC, et al. An epidemiologic and clinical overview of medical and psychopathological comorbidities in major psychoses. Eur Arch Psychiatry Clin Neurosci. 2011;261:489–508. doi: 10.1007/s00406-011-0196-4. [DOI] [PubMed] [Google Scholar]
- 31.Gu Y, et al. Interleukin 10 suppresses Th17 cytokines secreted by macrophages and T cells. Eur J Immunol. 2008;38:1807–1813. doi: 10.1002/eji.200838331. [DOI] [PMC free article] [PubMed] [Google Scholar]
- 32.Maeda K, Mehta H, Drevets DA, Coggeshall KM. IL-6 increases B-cell IgG production in a feed-forward proinflammatory mechanism to skew hematopoiesis and elevate myeloid production. Blood. 2010;115:4699–46706. doi: 10.1182/blood-2009-07-230631. [DOI] [PMC free article] [PubMed] [Google Scholar]
- 33.Barbosa IG, Bauer ME, Machado-Vieira R, Teixeira AL. Cytokines in bipolar disorder: paving the way for neuroprogression. Neural Plast. 2014;2014:360481. doi: 10.1155/2014/360481. [DOI] [PMC free article] [PubMed] [Google Scholar]
- 34.Pietruczuk K, Lisowska KA, Grabowski K, Landowski J, Witkowski JM. Proliferation and apoptosis of T lymphocytes in patients with bipolar disorder. Sci Rep. 2018;8:3327. doi: 10.1038/s41598-018-21769-0. [DOI] [PMC free article] [PubMed] [Google Scholar]
- 35.Kaltenboeck A, Winkler D, Kasper S. Bipolar and related disorders in DSM-5 and ICD-10. CNS Spectr. 2016;21:318–323. doi: 10.1017/S1092852916000079. [DOI] [PubMed] [Google Scholar]
- 36.Bech P, Allerup P, Larsen ER, Csillag C, Licht RW. The Hamilton Depression Scale (HAM-D) and the Montgomery-Åsberg Depression Scale (MADRS). A psychometric re-analysis of the European genome-based therapeutic drugs for depression study using Rasch analysis. Psychiatry Res. 2014;217:226–232. doi: 10.1016/j.psychres.2014.03.024. [DOI] [PubMed] [Google Scholar]
- 37.Prisciandaro JJ, Tolliver BK. An item response theory evaluation of the young mania rating scale and the montgomery-asberg depression rating scale in the systematic treatment enhancement program for bipolar disorder (STEP-BD) J Affect Disord. 2016;205:73–80. doi: 10.1016/j.jad.2016.06.062. [DOI] [PMC free article] [PubMed] [Google Scholar]


