

Abstract
Background
Pain is a common feature of childhood and adolescence around the world, and for many young people, that pain is chronic. The World Health Organization guidelines for pharmacological treatments for children's persisting pain acknowledge that pain in children is a major public health concern of high significance in most parts of the world. While in the past pain was largely dismissed and was frequently left untreated, views on children's pain have changed over time, and relief of pain is now seen as important.
We designed a suite of seven reviews on chronic non‐cancer pain and cancer pain (looking at antidepressants, antiepileptic drugs, non‐steroidal anti‐inflammatory drugs, opioids, and paracetamol) in order to review the evidence for children's pain utilising pharmacological interventions.
As the leading cause of morbidity in the world today, chronic disease (and its associated pain) is a major health concern. Chronic pain (that is pain lasting three months or longer) can arise in the paediatric population in a variety of pathophysiological classifications (nociceptive, neuropathic, or idiopathic) from genetic conditions, nerve damage pain, chronic musculoskeletal pain, and chronic abdominal pain, as well as for other unknown reasons.
Non‐steroidal anti‐inflammatory drugs (NSAIDs) are used to treat pain, reduce fever, and for their anti‐inflammation properties. They are commonly used within paediatric pain management. Non‐steroidal anti‐inflammatory drugs are currently licensed for use in Western countries, however they are not approved for infants under three months old. The main adverse effects include renal impairment and gastrointestinal issues. Common side effects in children include diarrhoea, headache, nausea, constipation, rash, dizziness, and abdominal pain.
Objectives
To assess the analgesic efficacy and adverse events of NSAIDs used to treat chronic non‐cancer pain in children and adolescents aged between birth and 17 years, in any setting.
Search methods
We searched the Cochrane Central Register of Controlled Trials (CENTRAL) via the Cochrane Register of Studies Online, MEDLINE via Ovid, and Embase via Ovid from inception to 6 September 2016. We also searched the reference lists of retrieved studies and reviews, as well as online clinical trial registries.
Selection criteria
Randomised controlled trials, with or without blinding, of any dose and any route, treating chronic non‐cancer pain in children and adolescents, comparing any NSAID with placebo or an active comparator.
Data collection and analysis
Two review authors independently assessed studies for eligibility. We planned to use dichotomous data to calculate risk ratio and number needed to treat for one additional event, using standard methods. We assessed GRADE and created three 'Summary of findings' tables.
Main results
We included seven studies with a total of 1074 participants (aged 2 to 18 years) with chronic juvenile polyarthritis or chronic juvenile rheumatoid arthritis. All seven studies compared an NSAID with an active comparator. None of the studies were placebo controlled. No two studies investigated the same type of NSAID compared with another. We were unable to perform a meta‐analysis.
Risk of bias varied. For randomisation and allocation concealment, one study was low risk and six studies were unclear risk. For blinding of participants and personnel, three studies were low risk and four studies were unclear to high risk. For blinding of outcome assessors, all studies were unclear risk. For attrition, four studies were low risk and three studies were unclear risk. For selective reporting, four studies were low risk, two studies were unclear risk, and one study was high risk. For size, three studies were unclear risk and four studies were high risk. For other potential sources of bias, seven studies were low risk.
Primary outcomes
Three studies reported participant‐reported pain relief of 30% or greater, showing no statistically significant difference in pain scores between meloxicam and naproxen, celecoxib and naproxen, or rofecoxib and naproxen (P > 0.05) (low‐quality evidence).
One study reported participant‐reported pain relief of 50% or greater, showing no statistically significant difference in pain scores between low‐dose meloxicam (0.125 mg/kg) and high‐dose meloxicam (0.25 mg/kg) when compared to naproxen 10 mg/kg (P > 0.05) (low‐quality evidence).
One study reported Patient Global Impression of Change, showing 'very much improved' in 85% of ibuprofen and 90% of aspirin participants (low‐quality evidence).
Secondary outcomes
Participants reporting an adverse event (one or more per person) by drug were: aspirin 85/202; fenoprofen 28/49; ibuprofen 40/45; indomethacin 9/30; ketoprofen 9/30; meloxicam 18/47; naproxen 44/202; and rofecoxib 47/209 (seven studies) (very low‐quality evidence).
Participants withdrawn due to an adverse event by drug were: aspirin 16/120; celecoxib 10/159; fenoprofen 0/49; ibuprofen 0/45; indomethacin 0/30; ketoprofen 0/30; meloxicam 10/147; naproxen 17/285; and rofecoxib 3/209 (seven studies) (very low‐quality evidence).
Participants experiencing a serious adverse event by drug were: aspirin 13/120; celecoxib 5/159; fenoprofen 0/79; ketoprofen 0/30; ibuprofen 4/45; indomethacin 0/30; meloxicam 11/147; naproxen 10/285; and rofecoxib 0/209 (seven studies) (very low‐quality evidence).
There were too few or no data for our remaining secondary outcomes: Carer Global Impression of Change; requirement for rescue analgesia; sleep duration and quality; acceptability of treatment; physical functioning as defined by validated scales; and quality of life as defined by validated scales.
Quality of evidence
We downgraded the low‐quality outcomes twice due to serious study limitations (risk of bias) and imprecision. We downgraded the very‐low quality outcomes three times due to too few data, or the fact that the number of events was too small to be meaningful, or both.
Authors' conclusions
We identified only a small number of studies, with insufficient data for analysis.
As we could undertake no meta‐analysis, we are unable to comment about efficacy or harm from the use of NSAIDs to treat chronic non‐cancer pain in children and adolescents. Similarly, we cannot comment on our remaining secondary outcomes: Carer Global Impression of Change; requirement for rescue analgesia; sleep duration and quality; acceptability of treatment; physical functioning; and quality of life.
We know from adult randomised controlled trials that some NSAIDs, such as ibuprofen, naproxen, and aspirin, can be effective in certain chronic pain conditions.
Plain language summary
Non‐steroidal anti‐inflammatory drugs (NSAIDs) for chronic non‐cancer pain in children and adolescents
Bottom line
We are uncertain as to whether NSAIDs can provide pain relief for chronic non‐cancer pain in children or adolescents.
Background
Children can experience chronic or recurrent pain related to genetic conditions, nerve damage, muscle or bone pain, stomach pain, or from unknown reasons. Chronic pain is pain that lasts three months or longer and is commonly accompanied by changes in lifestyle and functional abilities, as well as by signs and symptoms of depression and anxiety.
Non‐steroidal anti‐inflammatory drugs are used to treat pain or reduce fever, and are commonly used in children. They include over‐the‐counter medications such as ibuprofen, aspirin, and naproxen, as well as prescription‐only drugs. NSAIDs are currently licensed for use in Western countries, but are not approved for infants under three months old. The key side effects of NSAIDs are kidney failure and stomach problems. Other common side effects in children include diarrhoea, headache, nausea, constipation, rash, dizziness, flatulence, stomach pain, and indigestion.
Study characteristics
In September 2016 we searched for clinical trials where NSAIDs were used to treat chronic pain. We found seven trials (with a total of 1074 participants, aged 2 to 18 years) with chronic juvenile polyarthritis or chronic juvenile rheumatoid arthritis, which they had for more than 3 months.
Key results
The studies looked at different comparisons of aspirin, celecoxib, fenoprofen, ibuprofen, indomethacin, ketoprofen, meloxicam, naproxen, and rofecoxib. No studies compared NSAIDs with placebo. We could not compare these drugs, or the pain results, as the studies all investigated different types of NSAIDs.
Side effects were common, with children reporting problems with aspirin (85 out of 202 participants), fenoprofen (28 out of 49), ibuprofen (40 out of 45), indomethacin (9 out of 30), ketoprofen (9 out of 30), meloxicam (18 out of 47), naproxen (44 out of 202), and rofecoxib (47 out of 209).
Quality of the evidence
We rated the quality of the evidence from studies using four levels: very low, low, moderate, or high. Very low‐quality evidence means that we are very uncertain about the results. High‐quality evidence means that we are very confident in the results.
Overall, the available evidence was low or very low quality due to a lack of data and some problems with the conduct of some studies.
Summary of findings
Background
Pain is a common feature of childhood and adolescence around the world, and for many young people, that pain is chronic. The World Health Organization guidelines for pharmacological treatments for persisting pain in children acknowledge that pain in children is a major public health concern of high significance in most parts of the world (WHO 2012). While in the past, pain was largely dismissed and was frequently left untreated, views on children's pain have changed over time, and relief of pain is now seen as important. Since the 1970s, studies comparing child and adult pain management have revealed a variety of responses to pain, fuelling the need for a more in‐depth focus on paediatric pain (Caes 2016).
Infants (zero to 12 months), children (1 to 9 years), and adolescents (10 to 18 years), WHO 2012, account for 27% (1.9 billion) of the world's population (United Nations 2015); the proportion of those aged 14 years and under ranges from 12% (in Hong Kong) to 50% (in Niger) (World Bank 2014). However, little is known about the pain management needs of this population. For example, in the Cochrane Library, approximately 12 reviews produced by the Cochrane Pain, Palliative and Supportive Care Review Group in the past 18 years have been specifically concerned with children and adolescents, compared to over 100 reviews specific to adults. Additional motivating factors for investigating children's pain include the vast amount of unmanaged pain in the paediatric population and the development of new technologies and treatments. We convened an international group of leaders in paediatric pain to design a suite of seven reviews in chronic pain and cancer pain (looking at antidepressants, antiepileptic drugs, non‐steroidal anti‐inflammatory drugs (NSAIDs), opioids, and paracetamol as priority areas) in order to review the evidence under a programme grant for children's pain utilising pharmacological interventions in children and adolescents (Appendix 1).
This review is based on a template for reviews of pharmacotherapies used to relieve pain in infants, children and adolescents. The aim is for all reviews to use the same methods, based on new criteria for what constitutes reliable evidence (Appendix 2) (Moore 2010a; Moore 2012). This review focused on NSAIDs to treat chronic non‐cancer pain.
Description of the condition
This review focused on chronic non‐cancer pain experienced by children and adolescents as a result of any type of chronic disease that occurs throughout the global paediatric population. Children's level of pain can be mild, moderate, or severe, and pain management is an essential element of patient management during all care stages of chronic disease.
As the leading cause of morbidity in the world today, chronic disease (and its associated pain) is a major health concern. Chronic pain can arise in the paediatric population in a variety of pathophysiological classifications: nociceptive, neuropathic, idiopathic. Chronic pain is pain that lasts three months or longer and may be accompanied by changes in lifestyle, personality, and functional abilities, as well as by signs and symptoms of depression (Ripamonti 2008).
Whilst diagnostic and perioperative procedures performed to treat chronic diseases are a known common cause of pain in these patients, this review did not cover perioperative pain or adverse effects of treatments such as mucositis.
Description of the intervention
Non‐steroidal anti‐inflammatory drugs are used to treat pain, reduce fever, and for their anti‐inflammation properties, and are commonly used within paediatric pain management (Blanca‐Lopez 2015). The two main types of NSAID are selective and non‐selective, which refers to the ability of the NSAID to inhibit specific types of COX enzymes (Misurac 2013). Non‐steroidal anti‐inflammatory drugs are currently licensed for use in Western countries, however they are not approved for use in infants under three months of age (WHO 2012). Non‐steroidal anti‐inflammatory drugs are also widely used for patent ductus arteriosus closure in neonates.
Currently available NSAIDs include: aceclofenac, acetylsalicylic acid, celecoxib, choline magnesium trisalicylates, diclofenac, etodolac, etoricoxib, fenoprofen, ibuprofen, indomethacin, ketoprofen, ketorolac, mefenamic acid, meloxicam, nabumetone, naproxen, parecoxib, phenylbutazone, piroxicam, sulindac, tenoxicam, and tiaprofenic acid (BNF 2016).
Non‐steroidal anti‐inflammatory drugs are used in a variety of doses and are commonly prescribed to children with pain as an oral tablet or liquid formulation. The recommended dose for ibuprofen (for example) is 5 to 10 mg/kg every six to eight hours, with a maximum daily dose of 1200 mg. Additionally, the maximum daily dose recommended for naproxen is 1000 mg per day (WHO 2012). The recommendation for paediatric patients is to use the lowest dose, for the shortest duration possible to control symptoms (NICE 2015); hence, NSAIDs are also used in conjunction with paracetamol to reduce the amount of NSAID administered to children (WHO 2012).
The two primary adverse effects of NSAIDs are renal impairment and gastrointestinal issues (NICE 2015). Common side effects in children include diarrhoea, headache, nausea, constipation, rash, dizziness, flatulence, abdominal pain, and dyspepsia (WHO 2012). Other adverse effects include hepatic function impairment, contraindications with allergic disorders (hypersensitivity to aspirin, asthma, angioedema, urticaria, rhinitis), cardiac impairment, Reye's syndrome, antiplatelet effects, coagulation defects, and dangerous environmental harms (particularly seen in diclofenac). The long‐term safety of the use of NSAIDs in children is unclear (Blanca‐Lopez 2015). However, some safety assessments of ibuprofen in children have been compared with paracetamol and not found a significant increased risk for serious adverse events or main causes of hospitalisation (acute gastrointestinal bleeding, acute renal failure, anaphylaxis, or Reye's syndrome) (Lesko 1995; Lesko 1997; Lesko 1999).
How the intervention might work
One current hypothesis is that damage to the peripheral nerves is followed by an inflammatory reaction that relates to increased production of prostaglandins, amplifying sodium currents and calcium influx in peripheral nociceptive neurons, and enhancing neurotransmitter release in the central nervous system and depolarisation of second‐order nociceptive neurons (Vo 2009). Preclinical data suggest an immune pathogenesis of neuropathic pain, but clinical evidence of a central role of the immune system is less clear (Calvo 2012). Non‐steroidal anti‐inflammatory drugs inhibit the production of prostaglandins, and thus could lessen the peripheral and central sensory hypersensitivity that occurs with nerve injury‐associated inflammation. Non‐steroidal anti‐inflammatory drugs have been shown to reduce sensory hypersensitivity in animal models (Hasnie 2007; Kawakami 2002).
Why it is important to do this review
The paediatric population is at risk of inadequate management of pain (AMA 2013). Some conditions that would be aggressively treated in adult patients are being managed with insufficient analgesia in younger populations (AMA 2013). Although there have been repeated calls for best evidence to treat children's pain, such as Eccleston 2003, there are no easily available summaries of the most effective paediatric pain relief.
This review formed part of a Programme Grant addressing the unmet needs of people with chronic pain, commissioned by the National Institute for Health Research (NIHR) in the UK. This topic was identified in June 2015 during consultation with experts in paediatric pain. Please see Appendix 1 for full details of the meeting. The standards used to assess evidence in chronic pain trials have changed substantially in recent years, with particular attention being paid to trial duration, withdrawals, and statistical imputation following withdrawal, all of which can substantially alter estimates of efficacy. The most important change was to encourage a move from using average pain scores, or average change in pain scores, to the number of people who have a large decrease in pain (by at least 50%). Pain intensity reduction of 50% or more has been shown to correlate with improvements in comorbid symptoms, function, and quality of life (Moore 2011a). These standards are set out in the reference guide for pain studies (AUREF 2012).
Objectives
To assess the analgesic efficacy and adverse events of NSAIDs used to treat chronic non‐cancer pain in children and adolescents aged between birth and 17 years, in any setting.
Methods
Criteria for considering studies for this review
Types of studies
We only included randomised controlled trials, with or without blinding, and participant‐ or observer‐reported outcomes.
Full journal publication was required, with the exception of online clinical trial results, summaries of otherwise unpublished clinical trials, and abstracts with sufficient data for analysis. We included studies published in any language. We excluded abstracts (usually meeting reports) or unpublished data, non‐randomised studies, studies of experimental pain, case reports, and clinical observations.
Types of participants
We included studies of infants, children, and adolescents, aged from birth to 17 years old, with chronic or recurrent pain (lasting for three months or longer), arising from genetic conditions, neuropathy, or other conditions. These included but were not limited to chronic musculoskeletal pain and chronic abdominal pain.
We excluded studies of perioperative pain, acute pain, cancer pain, and pain associated with primary disease or its treatment. We excluded headache and migraine (particularly prophylaxis), as these are addressed in separate Cochrane reviews.
We included studies of participants with more than one type of chronic pain, and then analysed results according to the primary condition.
Types of interventions
We included studies reporting interventions prescribing NSAIDs for the relief of chronic pain, by any route, in any dose, with comparison to placebo or any active comparator.
Types of outcome measures
In order to be eligible for inclusion in this review, studies had to report pain assessment, as well as meeting the other selection criteria.
We included trials measuring pain intensity and pain relief assessed using validated tools such as numerical rating scale (NRS), visual analogue scale (VAS), Faces Pain Scale ‐ Revised (FPS‐R), Colour Analogue Scale (CAS), or any other validated numerical rating scale.
We were particularly interested in Pediatric Initiative on Methods, Measurement, and Pain Assessment in Clinical Trials (PedIMMPACT) definitions for moderate and substantial benefit in chronic pain studies (PedIMMPACT 2008). These are defined as: at least 30% pain relief over baseline (moderate); at least 50% pain relief over baseline (substantial); much or very much improved on Patient Global Impression of Change (PGIC) scale (moderate); very much improved on PGIC (substantial).
These outcomes differ from those used in most earlier reviews, concentrating as they do on dichotomous outcomes where pain responses do not follow a normal (Gaussian) distribution. People with chronic pain desire high levels of pain relief, ideally more than 50% pain intensity reduction, and ideally having no worse than mild pain (Moore 2013a; O'Brien 2010).
We also recorded any reported adverse events. We reported the timing of outcome assessments.
Primary outcomes
Participant‐reported pain relief of 30% or greater
Participant‐reported pain relief of 50% or greater
PGIC much or very much improved
In the absence of self reported pain, we considered the use of 'other‐reported' pain, typically by an observer such as a parent, carer, or healthcare professional (Stinson 2006; von Baeyer 2007).
Secondary outcomes
We identified the following with reference to the PedIMMPACT recommendations, which suggest core outcome domains and measures for consideration in paediatric acute and chronic/recurrent pain clinical trials (PedIMMPACT 2008).
Carer Global Impression of Change
Requirement for rescue analgesia
Sleep duration and quality
Acceptability of treatment
Physical functioning as defined by validated scales
Quality of life as defined by validated scales
Any adverse events
Withdrawals due to adverse events
Any serious adverse event. Serious adverse events typically include any untoward medical occurrence or effect that at any dose results in death, is life‐threatening, requires hospitalisation or prolongation of existing hospitalisation, results in persistent or significant disability or incapacity, is a congenital anomaly or birth defect, is an 'important medical event' that may jeopardise the participant, or may require an intervention to prevent one of the above characteristics or consequences.
Search methods for identification of studies
We developed the search strategy based on previous strategies used within the Cochrane Pain, Palliative and Supportive Care Review Group and carried out the searches.
Electronic searches
We searched the following databases:
Cochrane Central Register of Controlled Trials (CENTRAL) (via the Cochrane Register of Studies Online), searched 6 September 2016;
MEDLINE (via Ovid) 1946 to September week 2 2016, searched 6 September 2016;
Embase (via Ovid) 1974 to 2016 week 38, searched 6 September 2016..
We used medical subject headings (MeSH) or equivalent and text word terms. We restricted our search to randomised controlled trials and clinical trials. There were no language or date restrictions. The focus of the keywords in our search terms was on chronic pain and NSAIDs. We tailored searches to individual databases. The search strategies for MEDLINE, Embase, and CENTRAL are in Appendix 3, Appendix 4, and Appendix 5, respectively.
Searching other resources
We searched ClinicalTrials.gov (www.clinicaltrials.gov) and the World Health Organization International Clinical Trials Registry Platform (WHO ICTRP) (apps.who.int/trialsearch/) on 6 September 2016 for ongoing trials. In addition, we checked reference lists of reviews and retrieved articles for additional studies, and performed citation searches on key articles. We planned to contact experts in the field for unpublished and ongoing trials. We planned to contact study authors for additional information where necessary.
Data collection and analysis
We performed separate analyses according to particular chronic pain conditions. We combined different chronic pain conditions in analyses for exploratory purposes only.
Selection of studies
Two review authors independently determined study eligibility by reading the abstract of each study identified by the search. Review authors independently eliminated studies that clearly did not satisfy the inclusion criteria, and obtained full copies of the remaining studies. Two review authors independently read these studies to select those that met the inclusion criteria, a third review author adjudicating in the event of disagreement. We did not anonymise the studies in any way before assessment. We included a PRISMA flow chart in Figure 1 to illustrate the results of the search and the process of screening and selecting studies for inclusion in the review (Moher 2009), as recommended in section 11.2.1 of the Cochrane Handbook for Systematic Reviews of Interventions (Higgins 2011). We included studies in the review irrespective of whether measured outcome data were reported in a ‘usable’ way.
1.
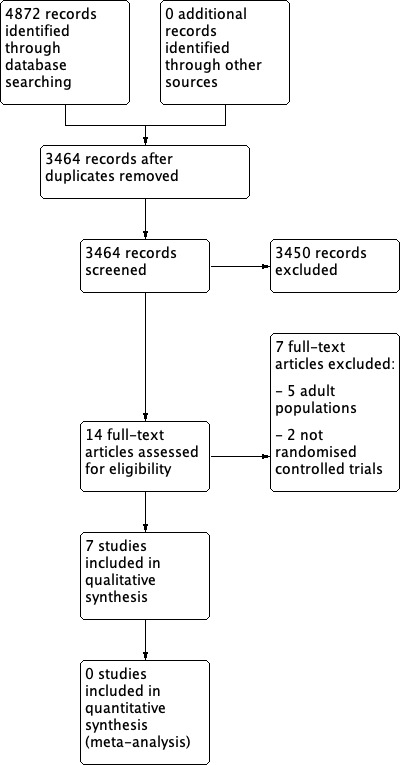
Study flow diagram.
Data extraction and management
We obtained full copies of the studies, and two review authors independently carried out data extraction. Where this information was available, we extracted data on pain condition, number of participants treated, drug and dosing regimen, study design (placebo or active control), study duration and follow‐up, analgesic outcome measures and results, withdrawals, and adverse events (participants experiencing any adverse event or serious adverse event). We collated multiple reports of the same study, so that each study rather than each report was the unit of interest in the review. We collected characteristics of the included studies in sufficient detail to populate a ‘Characteristics of included studies’ table.
We used a template data extraction form and checked for agreement before entry into Cochrane's statistical software Review Manager 5 (RevMan 2014).
If a study had more than two intervention arms, we only included the data from the intervention and control groups that met the eligibility criteria. If we included multi‐arm studies, we planned to analyse multiple intervention groups in an appropriate way that avoided arbitrary omission of relevant groups and double‐counting of participants.
Assessment of risk of bias in included studies
Two review authors independently assessed risk of bias for each study, using the criteria outlined in the Cochrane Handbook for Systematic Reviews of Interventions (Higgins 2011).
We completed a 'Risk of bias' table for each included study using the Cochrane 'Risk of bias' tool in Review Manager 5 (RevMan 2014).
We assessed the following for each study. Any disagreements were resolved by discussion between review authors or by consulting a third review author when necessary.
Random sequence generation (checking for possible selection bias). We assessed the method used to generate the allocation sequence as: low risk of bias (i.e. any truly random process, e.g. random number table; computer random number generator); or unclear risk of bias (when the method used to generate the sequence is not clearly stated). We excluded studies that used a non‐random process and were therefore at high risk of bias (e.g. odd or even date of birth; hospital or clinic record number).
Allocation concealment (checking for possible selection bias). The method used to conceal allocation to interventions prior to assignment determines whether intervention allocation could have been foreseen in advance of, or during, recruitment, or changed after assignment. We assessed the methods as: low risk of bias (e.g. telephone or central randomisation; consecutively numbered, sealed, opaque envelopes); or unclear risk of bias (when the method is not clearly stated). We excluded studies that did not conceal allocation and were therefore at a high risk of bias (e.g. open list).
Blinding of participants and personnel (checking for possible performance bias). We assessed any methods used to blind the participants and personnel from knowledge of which intervention a participant received. We assessed the methods as: low risk of bias (study states that the participants and personnel involved were blinded to treatment groups); unclear risk of bias (study does not state whether or not participants and personnel were blinded to treatment groups); or high risk of bias (participants or personnel were not blinded) (as stated in Types of studies, we included trials with or without blinding, and participant‐ or observer‐reported outcomes).
Blinding of outcome assessment (checking for possible detection bias). We assessed any methods used to blind the outcome assessors from knowledge of which intervention a participant received. We assessed the methods as: low risk of bias (e.g. study states that it was single‐blinded and describes the method used to achieve blinding of the outcome assessor); unclear risk of bias (study states that outcome assessors were blinded but does not provide an adequate description of how this was achieved); or high risk of bias (outcome assessors were not blinded) (as stated in Types of studies, we included trials with or without blinding, and participant‐ or observer‐reported outcomes).
Incomplete outcome data (checking for possible attrition bias due to the amount, nature, and handling of incomplete outcome data). We assessed the methods used to deal with incomplete data as: low risk of bias (i.e. less than 10% of participants did not complete the study or used 'baseline observation carried forward' (BOCF) analysis, or both); unclear risk of bias (used 'last observation carried forward' (LOCF) analysis); or high risk of bias (used 'completer' analysis).
Selective reporting (checking for possible reporting bias). We assessed the methods used to report the outcomes of the study as: low risk of bias (if all planned outcomes in the protocol or methods were reported in the results); unclear risk of bias (if there was not a clear distinction between planned outcomes and reported outcomes); or high risk of bias (if some planned outcomes from the protocol or methods were clearly not reported in the results).
Size of study (checking for possible biases confounded by small size) (Dechartres 2013; Dechartres 2014; McQuay 1998; Nüesch 2010; Thorlund 2011). We assessed studies as being at low risk of bias (200 participants or more per treatment arm); unclear risk of bias (50 to 199 participants per treatment arm); or high risk of bias (fewer than 50 participants per treatment arm).
Other bias, such as multiple publications, financial declarations, participants with conflicts of interest. We assessed studies for any additional sources of bias as low, unclear, or high risk of bias, and provided rationale.
Measures of treatment effect
Where dichotomous data were available, we calculated a risk ratio (RR) with 95% confidence interval (CI) and meta‐analysed the data as appropriate. We calculated numbers needed to treat for an additional beneficial outcome (NNTBs) where appropriate (McQuay 1998); for unwanted effects the NNTB becomes the number needed to treat for an additional harmful outcome (NNTH) and is calculated in the same manner. Where continuous data were reported, we used appropriate methods to combine these data in the meta‐analysis.
Unit of analysis issues
We accepted randomisation to the individual participant only. We split the control treatment arm between active treatment arms in a single study if the active treatment arms were not combined for analysis. We only accepted studies with minimum 10 participants per treatment arm.
Dealing with missing data
We used intention‐to‐treat analysis where the intention‐to‐treat population consisted of participants who were randomised, took at least one dose of the assigned study medication, and provided at least one post baseline assessment. We assigned missing participants zero improvement wherever possible.
Assessment of heterogeneity
We identified and measured heterogeneity as recommended in Chapter 9 of the Cochrane Handbook for Systematic Reviews of Interventions (Higgins 2011). We dealt with clinical heterogeneity by combining studies that examined similar conditions. We undertook and presented a meta‐analysis only if we judged participants, interventions, comparisons, and outcomes to be sufficiently similar to ensure a clinically meaningful answer. We assessed statistical heterogeneity visually and by using the I² statistic (L'Abbé 1987). When I² was greater than 50%, we considered the possible reasons.
Assessment of reporting biases
We assessed the risk of reporting bias, as recommended in chapter 8 of the Cochrane Handbook for Systematic Reviews of Interventions (Higgins 2011).
The aim of this review was to use dichotomous outcomes of known utility and of value to patients (Hoffman 2010; Moore 2010b; Moore 2010c; Moore 2010d; Moore 2013a). The review did not depend on what the authors of the original studies chose to report or not, though clearly difficulties would arise in studies failing to report any dichotomous results. We extracted and used continuous data, which probably reflect efficacy and utility poorly, and may be useful for illustrative purposes only.
We assessed publication bias using a method designed to detect the amount of unpublished data with a null effect required to make any result clinically irrelevant (usually taken to mean a number needed to treat (NNT) of 10 or higher) (Moore 2008).
Data synthesis
We planned to use a fixed‐effect model for meta‐analysis. We used a random‐effects model for meta‐analysis if there was significant clinical heterogeneity and we considered it appropriate to combine studies. We conducted our analysis using the primary outcomes of pain and adverse events, and planned to calculate the NNTHs for adverse events. We used the Cochrane software program Review Manager 5 (RevMan 2014).
Quality of the evidence
To analyse data, two review authors independently rated the quality of each outcome. We used the GRADE approach to assess the quality of the body of evidence related to each of the key outcomes, and reported our judgement in a 'Summary of findings' table per Chapter 12 of the Cochrane Handbook (Appendix 6) (Higgins 2011).
In addition, there may be circumstances where the overall rating for a particular outcome would need to be adjusted per GRADE guidelines (Guyatt 2013a). For example, if there are so few data that the results are highly susceptible to the random play of chance, or if studies used LOCF imputation in circumstances where there were substantial differences in adverse event withdrawals, one would have no confidence in the result, and would need to downgrade the quality of the evidence by three levels, to very low quality. In addition, in circumstances where no data were reported for an outcome, we planned to report that there was no evidence to support or refute (Guyatt 2013b).
'Summary of findings' table
We included two 'Summary of findings' tables as set out in the Cochrane Pain, Palliative and Supportive Care Review Group’s author guide (AUREF 2012), and recommended in section 4.6.6 of the Cochrane Handbook for Systematic Reviews of Interventions (Higgins 2011). We justified and documented all assessments of the quality of the body of evidence.
In an attempt to interpret reliability of the findings for this systematic review, we assessed the summarised data using the GRADE guidelines (Appendix 6) to rate the quality of the body of evidence of each of the key outcomes listed in Types of outcome measures per Chapter 12 of the Cochrane Handbook (Guyatt 2011; Higgins 2011), as appropriate. Utilising the explicit criteria against study design, risk of bias, imprecision, inconsistency, indirectness, and magnitude of effect, we summarised the evidence in an informative, transparent, and succinct 'Summary of findings' table or 'Evidence profile' table (Guyatt 2011).
Subgroup analysis and investigation of heterogeneity
We planned to perform subgroup analyses where a minimum number of data were available (at least 200 participants per treatment arm). We planned to analyse according to age group; type of drug; geographical location or country; type of control group; baseline measures; frequency, dose, and duration of drugs; and nature of drug.
We planned to investigate whether the results of subgroups were significantly different by inspecting the overlap of confidence intervals and performing the test for subgroup differences available in Review Manager 5.
Sensitivity analysis
We did not plan to carry out any sensitivity analysis because the evidence base is known to be too small to allow reliable analysis; we did not plan to pool results from chronic pain of different origins in the primary analyses. We examined details of dose escalation schedules in the unlikely circumstance that this could provide some basis for a sensitivity analysis.
Results
Description of studies
Results of the search
A PRISMA flow diagram of the search results is shown in Figure 1.
The three main databases searches revealed 4872 titles, of which 1408 duplicates were removed. Our searches of ClinicalTrials.gov and the WHO ICTRP yielded no additional eligible studies.
We screened the remaining 3464 titles and abstracts for eligibility, removing 3450 as ineligible studies.
We read the full‐text reports of the remaining 14 studies. We found seven to be ineligible. We identified no ongoing studies.
Seven studies fulfilled the eligibility criteria, and provided data. Due to these studies comparing different types of NSAIDs, none could be entered into a quantitative meta‐analysis.
Included studies
We included seven studies in this review. See Characteristics of included studies.
Bhettay 1978 investigated 30 participants (2 to 16 years of age) in a multicentre, randomised, double‐blind, active comparator‐controlled, cross‐over study. Participants had a diagnosis of juvenile chronic arthritis. The report did not state gender ratios. Participants were split into two groups, and the administration of drugs (ketoprofen versus indomethacin) was randomised. Participants received doses depending on weight. Participants < 20 kg received oral capsules of ketoprofen 25 mg capsule twice daily; participants > 20 kg received ketoprofen capsules x 2 = 50 mg twice daily, or participants < 20 kg received indomethacin 25 mg capsule twice daily; participants > 20 kg received indomethacin capsules x 2 = 50 mg twice daily, for five weeks. People were excluded if known history of contraindications to study drugs; receiving gold, d‐penicillamine, or corticosteroids; or in a state of remission.
Brewer 1982 investigated 99 participants in a multicentre, randomised, double‐blind, active comparator‐controlled, parallel‐group study. Participants had a diagnosis of functional abdominal pain, functional dyspepsia, and irritable bowel syndrome according to the Rome II criteria (see Brewer 1982). Participants were 8 to 17 years old; 73% were female. Participants received oral capsules of aspirin 1500 mg/m2/d increased to 3000 mg/m2/d, maximum 5450 mg/d (n = 49), or fenoprofen 900 mg/m2/d increased to 1800 mg/m2/d, maximum 3200 mg/d (n = 50), for 12 weeks. The study did not report exclusion criteria.
Foeldvari 2009 investigated 242 participants in a multicentre, randomised, double‐blind, active comparator‐controlled, parallel‐group study. Participants had a diagnosis of pauciarticular or polyarticular course juvenile rheumatoid arthritis (JRA), with or without systemic onset, according to American College of Rheumatology (ACR) criteria; > 1 swollen joint with limited motion; parent global assessment ≥ 10 mm (visual analogue scale (VAS) 100 mm). Participants were 2 to 16 years old; 70% were female. Participants received oral capsules of celecoxib 50 mg/5 mL oral suspension (target dose approximately 3 mg/kg twice daily) (n = 77); celecoxib 100 mg/5 mL oral suspension (target dose approximately 6 mg/kg twice daily) (n = 82); or naproxen 125 mg/5 mL oral suspension (target dose approximately 7.5 mg/kg twice daily) (n = 83), for 12 weeks. People were excluded if they had active systemic manifestations; oral corticosteroid doses ≤ 0.2 mg/kg/day or 10 mg prednisone or methotrexate < 1 mg/kg/week.
Giannini 1990 investigated 92 participants in a multicentre, randomised, double‐blind, active comparator‐controlled, parallel‐group study. Participants had a diagnosis of any of the three types of JRA (systemic, pauciarticular, or polyarticular); minimum one joint with active arthritis; free of other chronic illness. Participants were 2 to 15 years old; 83% were female. Participants received ibuprofen suspension (concentration 100 mg/5 mL) + placebo aspirin (n = 45); or aspirin 200 mg tablet (participant weight 10 to 30 kg) or 300 mg capsules (participant weight > 30 kg) + placebo ibuprofen (n = 47). At week 2, physicians had the option to increase dose to 40 mg/kg/day ibuprofen or 80 mg/kg/day aspirin, provided there were no significant side effects. Exclusion criteria included those who did not complete the 72‐hour washout period of all other NSAIDs; previous ibuprofen or slower‐acting antirheumatic drugs at least 3 months before entry; immunosuppressive therapy at least 6 months before entry; acute illnesses that might interfere with or compromise the absorption of the medication.
Moran 1979 investigated 23 participants in a multicentre, randomised, double‐blind, active comparator‐controlled, cross‐over study. Participants had a diagnosis of seronegative juvenile polyarthritis with disease sufficiently active to be considered in need of an anti‐inflammatory analgesic agent. Participants were 5 to 16 years old; gender ratios were not stated. Participants received naproxen 10 mg/kg/24 hours given as a suspension in 2 divided doses; or aspirin soluble 80 mg/kg/day, divided into 4 doses, for 2 x 4 weeks. The study did not report exclusion criteria.
Reiff 2006 investigated 310 participants in a multicentre, randomised, double‐blind, double‐dummy, active comparator‐controlled, parallel‐group study. Participants had a diagnosis of pauciarticular (oligo) or polyarticular course JRA for ≥ 3 months meeting the ACR criteria for JRA, with a patient assessment of overall well‐being (0 to 100 VAS) of > 90 and at least one swollen joint. Participants were 2 to 17 years old (2 to 11 years = children; 12 to 17 years = adolescents); 73% were female. Participants (N = 209) received: (children) lower‐dose rofecoxib 0.3 mg/kg/day maximum 12.5 mg/day, or higher‐dose rofecoxib 0.6 mg/kg/day maximum 25 mg/day; (adolescents) rofecoxib 12.5 or 25 mg daily; or (N = 101): (children) naproxen 15 mg/kg/day 5 mg oral suspension; (adolescents) 15 mg/kg/day maximum 1000 mg/day, for 12 weeks. People were excluded if they had active systemic JRA symptoms within 3 months of randomisation or if they were not within the 5th to 95th percentile of weight for height; hypersensitivity to aspirin and/or an NSAID; unstable antirheumatic medication regimens; requiring alkylating agents, anticonvulsants, warfarin, or rifampicin; female participants who had reached menarche were required to be in a non‐gravid state as determined by measurement of serum beta‐human chorionic gonadotropin.
Ruperto 2005 investigated 90 participants in a multicentre, randomised, double‐blind, active comparator‐controlled, parallel‐group study. Participants had a diagnosis of juvenile idiopathic arthritis (JIA) (Durban criteria); NSAID therapy is required; have at least two joints with active arthritis plus abnormal results in at least two of any of the five remaining JIA core set criteria. Participants were 2 to 16 years old; 65% were male. Participants received oral capsules of meloxicam 0.125 mg/kg, plus a placebo naproxen tablet, one dose per day (n = 73); or meloxicam 0.25 mg/kg, plus a placebo naproxen tablet, one dose per day (n = 74); or naproxen 5 mg/kg, twice per day (n = 78); for 48 weeks. People were excluded if they had current systemic manifestations; abnormal laboratory results unrelated to JIA; pregnancy, breastfeeding; bleeding disorders; peptic ulcer in past six months; hypersensitivity to NSAIDs; other rheumatic conditions; other medications related to rheumatic conditions; taking other NSAIDs.
Excluded studies
See Characteristics of excluded studies.
We excluded seven studies in this review. Five investigated pain in adults, and two were not randomised controlled trials.
Risk of bias in included studies
A summary of the 'Risk of bias' assessment is in Figure 2. Full details of 'Risk of bias' assessments are in the Characteristics of included studies tables.
2.
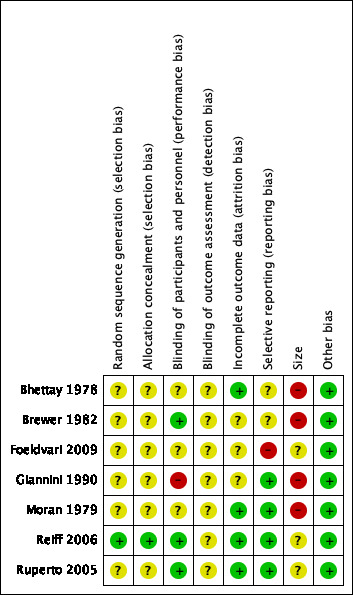
Risk of bias summary: review authors' judgements about each risk of bias item for each included study.
Allocation
Random sequence generation
One study adequately described the methods used to randomise participants (Reiff 2006). We judged this study as at low risk of selection bias for random sequence generation.
Six studies were stated as randomised but no methods used to randomise the participants were described (Bhettay 1978; Brewer 1982; Foeldvari 2009; Giannini 1990; Moran 1979; Ruperto 2005). We judged these studies as at unclear risk of selection bias for random sequence generation.
Allocation concealment
One study adequately described the methods used to conceal treatment group from participants (Reiff 2006). We judged this study as at low risk of selection bias for allocation concealment.
Six studies did not describe any methods used to conceal treatment group from participants (Bhettay 1978; Brewer 1982; Foeldvari 2009; Giannini 1990; Moran 1979; Ruperto 2005). We judged these studies as at unclear risk of selection bias for allocation concealment.
Blinding
Performance bias
Three studies adequately described the methods used to maintain blinding in both participants and study personnel from knowledge of the treatment groups (Brewer 1982; Reiff 2006; Ruperto 2005). We judged these studies as at low risk of performance bias.
Three studies were stated as double‐blind but the methods used to maintain blinding in both participants and study personnel from knowledge of the treatment groups were not adequately described (Bhettay 1978; Foeldvari 2009; Moran 1979). We judged these studies as at unclear risk of performance bias.
One study attempted to double‐blind, however as one treatment was liquid and the other was a tablet it seemed possible that the participants could have known which treatment they received (Giannini 1990). We judged this study as at high risk of performance bias.
Detection bias
None of the studies adequately described the methods used to conceal and blind the outcome assessors from knowledge of the treatment groups (Bhettay 1978; Brewer 1982; Foeldvari 2009; Giannini 1990; Moran 1979; Reiff 2006; Ruperto 2005). We judged all seven included studies as at unclear risk of detection bias.
Incomplete outcome data
Four studies adequately accounted for all participants from the recruitment stage, through randomisation until follow‐up, including counting all withdrawals (Bhettay 1978; Moran 1979; Reiff 2006; Ruperto 2005). We judged these studies as at low risk of attrition bias.
In three studies, the authors did not report whether there were significant differences between completers and non‐completers (Brewer 1982; Foeldvari 2009; Giannini 1990). We judged these studies as at unclear risk of attrition bias.
Selective reporting
Four studies adequately reported on all the planned outcomes as initially listed in the methods sections (Giannini 1990; Moran 1979; Reiff 2006; Ruperto 2005). We judged these studies as at low risk of reporting bias.
Two studies did not adequately report in their results all outcomes that were planned in the methods sections. In Bhettay 1978, many data such as the means and standard deviations, or blood sedimentation rate, haemoglobin level, platelet, and white cell count, were not reported clearly. In Brewer 1982, the authors stated that "all investigators used an identical protocol and case report forms". However, outcomes were not set out clearly in the methods, and we were unable to locate a protocol. We judged these studies as at unclear risk of reporting bias.
In one study, Foeldvari 2009, the Pediatric Quality of Life Inventory score outcome data had been planned but were not reported. We judged this study as at high risk of reporting bias.
Other potential sources of bias
Size
No studies investigated a study population of more than 200 participants per treatment arm, therefore we judged none as at low risk of bias with regard to size.
Three studies investigated study populations between 225 and 310 participants, which resulted in 50 to 200 participants per treatment arm (Foeldvari 2009; Reiff 2006; Ruperto 2005). We judged these studies as at unclear risk of bias with regard to size.
Four studies investigated study populations between 23 and 99 participants, which resulted in fewer than 50 participants per treatment arm (Bhettay 1978; Brewer 1982; Giannini 1990; Moran 1979). We judged these studies as at high risk of bias with regard to size.
Other
We found no other potential sources of bias. We judged all seven included studies as at low risk of bias for this domain.
Effects of interventions
See: Table 1; Table 2; Table 3
Summary of findings for the main comparison. Meloxicam compared with naproxen for chronic non‐cancer pain.
| Meloxicam compared with naproxen for chronic non‐cancer pain | ||||||
|
Patient or population: children and adolescents with chronic non‐cancer pain Settings: multicentre paediatric rheumatology tertiary care units (international) Intervention: meloxicam Comparison: naproxen | ||||||
| Outcomes | Illustrative comparative risks* (95% CI) | Relative effect (95% CI) | No. of participants (studies) | Quality of the evidence (GRADE) | Comments | |
| Naproxen | Meloxicam | |||||
| Participant‐reported pain relief of 30% or greater | 50/78 | 89/147 | N/A | 225 participants (1 study) |
⊕⊕⊝⊝ lowa | |
| Participant‐reported pain relief of 50% or greater | 39/78 | 70/147 | N/A | 225 participants (1 study) |
⊕⊕⊝⊝ lowa | |
| Patient Global Impression of Change much or very much improved | No data | No data | N/A | N/A | No evidence to support or refutec | |
| Any adverse event | 10/78 | 18/147 | N/A | 225 participants (1 study) |
⊕⊝⊝⊝ very lowb | |
| Serious adverse event | 10/78 | 11/147 | N/A | 225 participants (1 study) |
⊕⊝⊝⊝ very lowb | |
| Withdrawals due to adverse events | 10/78 | 10/147 | N/A | 225 participants (1 study) |
⊕⊝⊝⊝ very lowb | |
| *The basis for the assumed risk (e.g. the median control group risk across studies) is provided in footnotes. The corresponding risk (and its 95% confidence interval) is based on the assumed risk in the comparison group and the relative effect of the intervention (and its 95% CI). CI: confidence interval; N/A: not applicable | ||||||
| GRADE Working Group grades of evidence High quality: We are very confident that the true effect lies close to that of the estimate of the effect. Moderate quality: We are moderately confident in the effect estimate; the true effect is likely to be close to the estimate of effect, but there is a possibility that it is substantially different. Low quality: Our confidence in the effect estimate is limited; the true effect may be substantially different from the estimate of the effect. Very low quality: We have very little confidence in the effect estimate; the true effect is likely to be substantially different from the estimate of effect. | ||||||
aDowngraded once for serious study limitations (risk of bias), and once for imprecision.
bDowngraded three levels due to too few data and number of events are too small to be meaningful.
cNo data available for this outcome, and therefore no GRADE rating has been applied and there is no evidence to support or refute.
Summary of findings 2. Celecoxib compared with naproxen for chronic non‐cancer pain.
| Celecoxib compared with naproxen for chronic non‐cancer pain | ||||||
|
Patient or population: children and adolescents with chronic non‐cancer pain Settings: 17 paediatric centres worldwide Intervention: celecoxib Comparison: naproxen | ||||||
| Outcomes | Illustrative comparative risks* (95% CI) | Relative effect (95% CI) | No. of participants (studies) | Quality of the evidence (GRADE) | Comments | |
| Naproxen | Celecoxib | |||||
| Participant‐reported pain relief of 30% or greater | 56/83 | 119/159 | N/A | 242 participants (1 study) | ⊕⊕⊝⊝ lowa | |
| Participant‐reported pain relief of 50% or greater | No data | No data | N/A | N/A | ‐ | No evidence to support or refutec |
| Patient Global Impression of Change much or very much improved | No data | No data | N/A | N/A | ‐ | No evidence to support or refutec |
| Any adverse event | No data | No data | N/A | N/A | ‐ | No evidence to support or refutec |
| Serious adverse event | 0/83 | 5/159 | N/A | 242 participants (1 study) | ⊕⊝⊝⊝ very lowb | |
| Withdrawals due to adverse events | 3/83 | 10/159 | N/A | 242 participants (1 study) | ⊕⊝⊝⊝ very lowb | |
| *The basis for the assumed risk (e.g. the median control group risk across studies) is provided in footnotes. The corresponding risk (and its 95% confidence interval) is based on the assumed risk in the comparison group and the relative effect of the intervention (and its 95% CI). CI: confidence interval; N/A: not applicable | ||||||
| GRADE Working Group grades of evidence High quality: We are very confident that the true effect lies close to that of the estimate of the effect. Moderate quality: We are moderately confident in the effect estimate; the true effect is likely to be close to the estimate of effect, but there is a possibility that it is substantially different. Low quality: Our confidence in the effect estimate is limited; the true effect may be substantially different from the estimate of the effect. Very low quality: We have very little confidence in the effect estimate; the true effect is likely to be substantially different from the estimate of effect. | ||||||
aDowngraded once for serious study limitations (risk of bias), and once for imprecision.
bDowngraded three levels due to too few data and number of events are too small to be meaningful.
cNo data available for this outcome, and therefore no GRADE rating has been applied and there is no evidence to support or refute.
Summary of findings 3. Rofecoxib compared with naproxen for chronic non‐cancer pain.
| Rofecoxib compared with naproxen for chronic non‐cancer pain | ||||||
|
Patient or population: children and adolescents with chronic non‐cancer pain Settings: 41 clinical centres in Australia, Europe, Asia, Central America, South America, USA Intervention: rofecoxib Comparison: naproxen | ||||||
| Outcomes | Illustrative comparative risks* (95% CI) | Relative effect (95% CI) | No. of participants (studies) | Quality of the evidence (GRADE) | Comments | |
| Naproxen | Rofecoxib | |||||
| Participant‐reported pain relief of 30% or greater | 48/87 | 94/187 | N/A | 274 participants (1 study) | ⊕⊕⊝⊝ lowa | |
| Participant‐reported pain relief of 50% or greater | No data | No data | N/A | N/A | ‐ | No evidence to support or refutec |
| Patient Global Impression of Change much or very much improved | No data | No data | N/A | N/A | ‐ | No evidence to support or refutec |
| Any adverse event | 28/101 | 43/209 | N/A | 274 participants (1 study) | ⊕⊝⊝⊝ very lowb | |
| Serious adverse event | 0/101 | 0/209 | N/A | 310 participants (1 study) | ⊕⊝⊝⊝ very lowb | |
| Withdrawals due to adverse events | 3/101 | 3/209 | N/A | 310 participants (1 study) | ⊕⊝⊝⊝ very lowb | |
| *The basis for the assumed risk (e.g. the median control group risk across studies) is provided in footnotes. The corresponding risk (and its 95% confidence interval) is based on the assumed risk in the comparison group and the relative effect of the intervention (and its 95% CI). CI: confidence interval; N/A: not applicable | ||||||
| GRADE Working Group grades of evidence High quality: We are very confident that the true effect lies close to that of the estimate of the effect. Moderate quality: We are moderately confident in the effect estimate; the true effect is likely to be close to the estimate of effect, but there is a possibility that it is substantially different. Low quality: Our confidence in the effect estimate is limited; the true effect may be substantially different from the estimate of the effect. Very low quality: We have very little confidence in the effect estimate; the true effect is likely to be substantially different from the estimate of effect. | ||||||
aDowngraded once for serious study limitations (risk of bias), and once for imprecision.
bDowngraded three levels due to too few data and number of events were too small to be meaningful.
cNo data available for this outcome, and therefore no GRADE rating has been applied and there is no evidence to support or refute.
Results and outcomes of the individual studies are in Appendix 7 (efficacy), and Appendix 8 (adverse events and withdrawals).
Of the seven included studies, no two studies investigated the same type of NSAID compared with another type, therefore none could be entered into a quantitative meta‐analysis; see table below. The qualitative analysis of results follows.
Table 1: Types of drug interventions and conditions of included studies
| Study | Interventions | Condition |
| Bhettay 1978 | ketoprofen vs indomethacin | juvenile chronic arthritis |
| Brewer 1982 | aspirin vs fenoprofen | juvenile rheumatoid arthritis |
| Foeldvari 2009 | celecoxib vs naproxen | juvenile rheumatoid arthritis |
| Giannini 1990 | Ibuprofen vs aspirin | juvenile rheumatoid arthritis |
| Moran 1979 | naproxen vs aspirin | juvenile chronic polyarthritis |
| Reiff 2006 | naproxen vs rofecoxib | juvenile rheumatoid arthritis |
| Ruperto 2005 | meloxicam vs naproxen | juvenile idiopathic arthritis |
Comparison 1: NSAIDs versus an active comparator
Primary outcomes
Participant‐reported pain relief of 30% or greater
Three studies reported participant‐reported pain relief of 30% or greater.
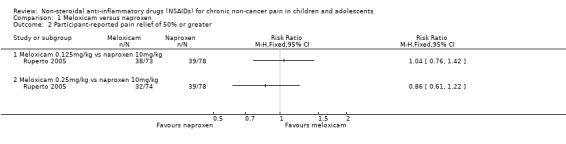
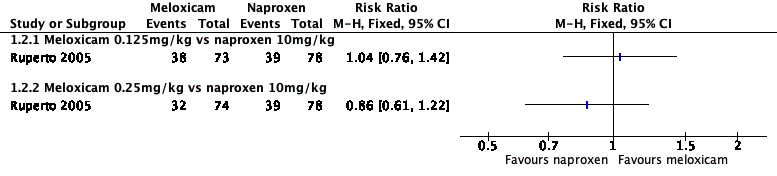
Analysis 1.1, displayed in a forest plot for illustrative purposes only (Figure 3), shows the difference between low‐dose meloxicam (0.125 mg/kg) and high‐dose meloxicam (0.25 mg/kg) versus naproxen (10 mg/kg) is not statistically significant (P > 0.05) (low‐quality evidence) (Ruperto 2005).
1.1. Analysis.

Comparison 1 Meloxicam versus naproxen, Outcome 1 Participant‐reported pain relief of 30% or greater.
3.
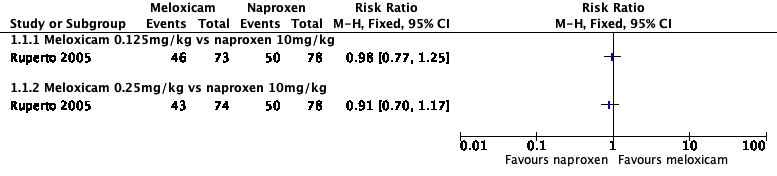
Forest plot of comparison: 1 Meloxicam versus naproxen, outcome: 1.1 Participant‐reported pain relief of 30% or greater.
Analysis 2.1, displayed in a forest plot for illustrative purposes only (Figure 4), shows the difference between low‐dose celecoxib (3 mg/kg) and high‐dose celecoxib (6 mg/kg) versus naproxen (10 mg/kg) is not statistically significant (P > 0.05) (low‐quality evidence) (Foeldvari 2009).
2.1. Analysis.
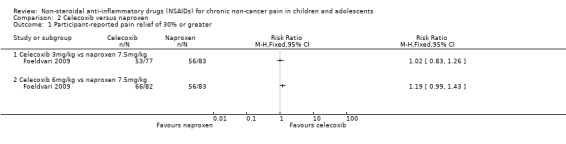
Comparison 2 Celecoxib versus naproxen, Outcome 1 Participant‐reported pain relief of 30% or greater.
4.
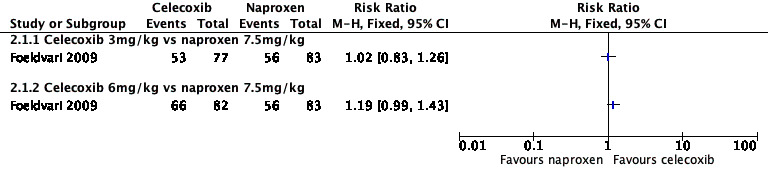
Forest plot of comparison: 2 Celecoxib versus naproxen, outcome: 2.1 Participant‐reported pain relief of 30% or greater.
Analysis 3.1, displayed in a forest plot for illustrative purposes only (Figure 5), shows the difference between low‐dose rofecoxib (0.3 mg/kg, maximum 12.5 mg/kg) and high‐dose rofecoxib (0.6 mg/kg, maximum 25.0 mg/kg) versus naproxen (15 mg/kg) is not statistically significant (P > 0.05) (low‐quality evidence) (Reiff 2006).
3.1. Analysis.
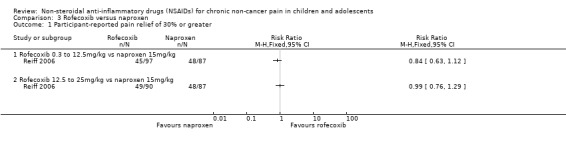
Comparison 3 Rofecoxib versus naproxen, Outcome 1 Participant‐reported pain relief of 30% or greater.
5.
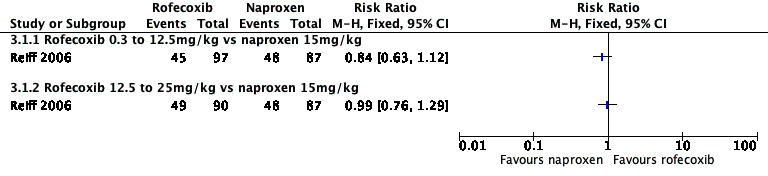
Forest plot of comparison: 3 Rofecoxib versus naproxen, outcome: 3.1 Participant‐reported pain relief of 30% or greater.
We consider the available data for this outcome to be low‐quality evidence, downgraded once for serious study limitations (risk of bias) and once for imprecision. See Table 1; Table 2; Table 3.
The remaining four studies did not report participant‐reported pain relief of 30% or greater (Bhettay 1978; Brewer 1982; Giannini 1990; Moran 1979).
Participant‐reported pain relief of 50% or greater
One study reported participant‐reported pain relief of 50% or greater.
Analysis 1.2, displayed in a forest plot for illustrative purposes only (Figure 6), shows the difference between low‐dose meloxicam (0.125 mg/kg) and high‐dose meloxicam (0.25 mg/kg) is not statistically significant (P > 0.05) (low‐quality evidence) (Ruperto 2005).
1.2. Analysis.
Comparison 1 Meloxicam versus naproxen, Outcome 2 Participant‐reported pain relief of 50% or greater.
6.
Forest plot of comparison: 1 Meloxicam versus naproxen, outcome: 1.2 Participant‐reported pain relief of 50% or greater.
We consider the available data for this outcome to be low‐quality evidence, downgraded once for serious study limitations (risk of bias) and once for imprecision.
The remaining six studies did not report participant‐reported pain relief of 50% or greater (Bhettay 1978; Brewer 1982; Foeldvari 2009; Giannini 1990; Moran 1979; Reiff 2006).
Patient Global Impression of Change much or very much improved
One study reported PGIC.
Giannini 1990 reported very much improved for ibuprofen 22/26 participants (85%) and for aspirin 18/20 participants (90%) (low‐quality evidence).
We consider the available data for this outcome to be low‐quality evidence, downgraded once for serious study limitations (risk of bias) and once for imprecision.
The remaining six studies did not report PGIC (Bhettay 1978; Brewer 1982; Foeldvari 2009; Moran 1979; Reiff 2006; Ruperto 2005).
Quality of the evidence
We downgraded some outcomes twice to low quality due to serious study limitations (risk of bias) and imprecision. We downgraded some outcomes three times to very low‐quality due too few data and the fact that the number of events was too small to be meaningful.
Secondary outcomes
Carer Global Impression of Change
Four studies reported Carer Global Impression of Change in pain scores.
Brewer 1982 reported parent global assessment of participant response (satisfactory) to therapy: fenoprofen 69% and aspirin 61.5%. Foeldvari 2009 reported parent global assessment of overall well‐being (100‐millimetre VAS), least squares mean change from baseline (standard error): celecoxib 3 mg/kg: ‐17.96 (2.42); celecoxib 6 mg/kg: ‐20.45 (2.34); naproxen 7.5 mg/kg: ‐18.25 (2.33). Giannini 1990 reported Carer Global Impression of Change: ibuprofen: 33/42 (79%) and aspirin: 29/35 (83%). Ruperto 2005 reported Carer global impression of disease activity change (VAS 0 to 100) ± (standard deviation), at three months: low‐dose meloxicam: 17.6 ± 20.2; high‐dose meloxicam: 21.9 ± 23.6; naproxen: 20.8 ± 22.4, and at 12 months: low‐dose meloxicam: 13.4 ± 17.6; high‐dose meloxicam: 17.2 ± 22.5; naproxen: 15.9 ± 21.3 (low‐quality evidence).
We consider the available data for this outcome to be low‐quality evidence, downgraded once for serious study limitations (risk of bias) and once for imprecision.
The remaining three studies did not report Carer Global Impression of Change in pain scores (Bhettay 1978; Moran 1979; Reiff 2006).
Additional information
These four studies, as well as Reiff 2006, also reported Physician or Investigator Global Impression of Change. Brewer 1982 reported physician global assessment of participant response: fenoprofen: 62% and aspirin: 63%. Foeldvari 2009 reported physician global assessment of disease activity (100‐millimetre VAS), least squares mean change from baseline (standard error): celecoxib 3 mg/kg: ‐21.07 (1.86); celecoxib 6 mg/kg: ‐23.27 (1.80); naproxen 7.5 mg/kg: ‐21.88 (1.79). Giannini 1990 reported Investigator Global Evaluation: ibuprofen: 34/44 (78%) and aspirin: 27/35 (77%). Reiff 2006 reported investigators' global assessment of disease activity: mean change from baseline (95% confidence interval (CI)): low‐dose rofecoxib: ‐12.45 (95% CI ‐14.95 to ‐9.94); high‐dose rofecoxib: ‐13.27 (95% CI ‐15.88 to ‐10.65); naproxen: ‐12.05 (95% CI ‐14.60 to ‐9.50). Reiff 2006 also reported participant/parent global assessment of pain, mean change from baseline (95%CI): low‐dose rofecoxib: ‐12.50 (95% CI ‐15.98 to ‐9.02); high‐dose rofecoxib: ‐13.12 (95% CI ‐16.75 to ‐9.48); naproxen: ‐8.43 (95% CI ‐11.98 to ‐4.88). Ruperto 2005 reported physician global impression of disease activity change (VAS 0 to 100) ± (standard deviation), at three months: low‐dose meloxicam: 19.4 ± 20.7; high‐dose meloxicam: 20.6 ± 20.3; naproxen: 21.1 ± 19.2, and at 12 months: low‐dose meloxicam: 15.4 ± 20.5; high‐dose meloxicam: 16.8 ± 19.0; naproxen: 14.4 ± 16.7 (no judgement of quality of evidence).
Requirement for rescue analgesia
No studies reported data on this outcome.
Sleep duration and quality
No studies reported data on this outcome.
Acceptability of treatment
One study reported acceptability of treatment.
Moran 1979 reported participants' medication preference at the end of the trial. Of the 23 participants who took part in both the naproxen period and the aspirin period, zero rated naproxen much better; 9 rated naproxen better; 9 rated both drug periods equal; 4 rated aspirin better; and 1 rated aspirin much better (very low‐quality evidence).
We consider the available data for this outcome to be very low‐quality evidence, as the number of events was too small to be meaningful.
The remaining six included studies did not report acceptability of treatment (Bhettay 1978; Brewer 1982; Foeldvari 2009; Giannini 1990; Reiff 2006; Ruperto 2005).
Physical functioning as defined by validated scales
Three studies reported physical functioning.
Foeldvari 2009 reported the parent assessment of physical functioning, Child Health Assessment Questionnaire, disability index (CHAQ‐DI) 0 to 3, least squares mean change from baseline (standard error): celecoxib 3 mg/kg: ‐0.28 (0.05): celecoxib 6 mg/kg: ‐0.32 (0.05): naproxen 7.5 mg/kg: ‐0.31 (0.05). Reiff 2006 reported CHAQ‐DI: mean change from baseline (95% CI): low‐dose rofecoxib: ‐0.11 (95% CI ‐0.18 to ‐0.05); high‐dose rofecoxib: ‐0.15 (95% CI ‐0.21 to ‐0.08); naproxen: ‐0.12 (95% CI ‐0.18 to ‐0.05). Ruperto 2005 reported CHAQ‐DI (0 to 3 points) at three months: low‐dose meloxicam: 0.4 ± 0.5; high‐dose meloxicam: 0.5 ± 0.6; naproxen: 0.5 ± 0.6, and at 12 months: low‐dose meloxicam: 0.3 ± 0.4; high‐dose meloxicam: 0.4 ± 0.6; naproxen: 0.3 ± 0.5 (low‐quality evidence).
We consider the available data for this outcome to be low‐quality evidence, downgraded once for serious study limitations (risk of bias) and once for imprecision.
The remaining four studies did not report physical functioning (Bhettay 1978; Brewer 1982; Giannini 1990; Moran 1979).
Quality of life as defined by validated scales
Two studies reported quality of life.
Foeldvari 2009 reported improved Pediatric Quality of Life Inventory scores. Participants in the celecoxib 6 mg/kg twice‐daily or naproxen 7.5 mg/kg twice‐daily groups scored higher than those in the celecoxib 3 mg/kg twice‐daily group, but results were non‐significant (data not shown in publication). It is unclear whether differences are between groups or over time. Reiff 2006 reported participant/parent assessment of overall well‐being: mean change from baseline (95% CI) (proportion of improvement from baseline): low‐dose rofecoxib: ‐11.57 (95% CI ‐14.78 to ‐8.36) (74.3%); high‐dose rofecoxib: ‐12.08 (95% CI ‐15.44 to ‐8.73) (76%); naproxen: ‐8.56 (95% CI ‐11.85 to ‐5.27) (73%) (low‐quality evidence).
We consider the available data for this outcome to be low‐quality evidence, downgraded once for serious study limitations (risk of bias) and once for imprecision.
The remaining six studies did not report quality of life (Bhettay 1978; Brewer 1982; Giannini 1990; Moran 1979; Ruperto 2005).
Any adverse events
Six studies reported adverse events.
Participants reporting an adverse event (one or more per person) by drug were: aspirin 85/120; fenoprofen 28/49; ibuprofen 40/45; indomethacin 9/30; ketoprofen 9/30; meloxicam 113/147; naproxen 102/202; and rofecoxib 43/209 (Bhettay 1978; Brewer 1982; Giannini 1990; Moran 1979; Reiff 2006). In addition there were unclear data on adverse events from 159 celecoxib participants and 83 naproxen participants (very low‐quality evidence) (Foeldvari 2009).
We consider the available data for this outcome to be very low‐quality evidence, as the number of events was too small to be meaningful.
Withdrawals due to adverse events
All seven studies reported withdrawals due to adverse events.
Participants withdrawn due to an adverse event by drug were: aspirin 16/120; celecoxib 10/159; fenoprofen 0/49; ibuprofen 0/45; indomethacin 0/30; ketoprofen 0/30; meloxicam 10/147; naproxen 17/285; and rofecoxib 3/209 (very low‐quality evidence) (Bhettay 1978; Brewer 1982; Foeldvari 2009; Giannini 1990; Moran 1979; Reiff 2006; Ruperto 2005).
We consider the available data for this outcome to be very low‐quality evidence, due to a lack of available data, and the number of events was too small to be meaningful.
Any serious adverse event
All seven studies reported serious adverse events.
We considered serious adverse events to be hospitalisation or death, however in many cases this level of detail defining a serious adverse event was not provided.
Participants experiencing a serious adverse event by drug were: aspirin 13/120; celecoxib 5/159; fenoprofen 0/79; ketoprofen 0/30; ibuprofen 4/45; indomethacin 0/30; meloxicam 11/147; naproxen 10/285; and rofecoxib 0/209 (very low‐quality evidence) (Bhettay 1978; Brewer 1982; Foeldvari 2009; Giannini 1990; Moran 1979; Reiff 2006; Ruperto 2005).
We consider the available data for this outcome to be very low‐quality evidence, due to a lack of available data, and the number of events was too small to be meaningful.
Quality of the evidence
We downgraded some outcomes twice down to low quality due to serious study limitations (risk of bias) and imprecision. We downgraded some outcomes three times to very low‐quality due too few data and the fact that the number of events was too small to be meaningful.
For some outcomes, no data were reported and therefore there was no evidence to support or refute the use of NSAIDs to treat chronic non‐cancer pain in children and adolescents.
Comparison 2: NSAIDs versus placebo
None of the included studies addressed our second comparison of an NSAID versus placebo. Due to the lack of data, there is no evidence to support or refute the use of NSAIDs compared with a placebo to treat chronic non‐cancer pain in children and adolescents.
Mean response rate for any NSAID at any dose
As data were insufficient for pooled analyses comparing one drug to another, we performed a post hoc analysis using the randomised cohorts of NSAIDs to calculate the mean response rate for any NSAID at any dose. For our primary outcome of at least 50% pain relief, the mean response rate was 45.5%, and the weighted mean by size of the treatment group was 47.3%. This means that nearly 1 in every 2 people will achieve at least 50% pain relief from treatment with one of these NSAIDs. For our primary outcome of at least 30% pain relief, the mean response rate was 26.0%, and the weighted mean by size of the treatment group was 29.1%. This means that about 1 in every 4 people will achieve at least 30% pain relief from treatment with one of these NSAIDs.
Discussion
Summary of main results
We included seven studies in this review reporting data from 1074 participants (aged 2 to 18 years), comparing various combinations of the following NSAIDs: aspirin, celecoxib, fenoprofen, ibuprofen, indomethacin, ketoprofen, meloxicam, naproxen, and rofecoxib. No studies compared the intervention drug with placebo.
No two included studies investigated the same type of NSAID compared with another type of NSAID. Consequently, no studies could be entered into a quantitative meta‐analysis.
Risk of bias for the included studies varied. For randomisation and allocation concealment, one study was low risk and six were unclear risk. For blinding of participants and personnel, three studies were low risk and four were unclear to high risk. For blinding of outcome assessors, all studies were unclear risk. For attrition, four studies were low risk and three were unclear risk. For selective reporting, four studies were low risk, two were unclear risk, and one was high risk. For size, three studies were unclear risk and four were high risk. For other potential sources of bias, seven studies were low risk.
There is no evidence from randomised controlled trials to suggest that NSAIDs are effective in treating chronic non‐cancer pain in children or adolescents, nor do we have evidence to suggest that one NSAID is more effective than another. We were unable to comment on harm.
Overall completeness and applicability of evidence
We identified only a small number of studies (seven), with insufficient data for analysis, of any combination of NSAIDs. As only three studies, Foeldvari 2009, Reiff 2006, and Ruperto 2005, addressed our primary outcome, we compared low doses with high doses of meloxicam, celecoxib, or rofecoxib versus naproxen to investigate 30% and 50% pain relief responders, and found no difference in effect.
As we could undertake no meta‐analysis, we are unable to comment on efficacy from the use of NSAIDs to treat chronic non‐cancer pain in children and adolescents. Similarly, we cannot comment on our remaining secondary outcomes: Carer Global impression of Change; requirement for rescue analgesia; sleep duration and quality; acceptability of treatment; physical functioning; and quality of life. We found small numbers of (mild) adverse effects across the different NSAIDs, and small numbers of serious adverse effects, however none resulted in hospitalisation or death.
All seven studies evaluated participants with musculoskeletal disease‐related pain. We identified no studies in non‐arthritis populations.
The suite of reviews
This review is part of a suite of reviews on pharmacological interventions for chronic pain and cancer‐related pain in children and adolescents (Appendix 1). Taking a broader view on this suite of reviews, some pharmacotherapies (investigated in our other reviews) are likely to provide more data than others. The results were thus as expected considering that randomised controlled trials in children are known to be limited. The results have the potential to inform policymaking decisions for funding future clinical trials into NSAID treatment of child and adolescent pain, therefore any results (large or small) are important in order to capture a snapshot of the current evidence for NSAIDs.
Quality of the evidence
Of the seven included studies, only one study clearly described randomisation methods, and only three studies described double‐blinding methods, however all studies provided information about withdrawals, dropouts, and adverse events.
The studies recruited participants with adequate baseline pain, but not all reported clinically useful outcome measures.
The studies themselves were of moderate quality, however the number of studies and sample sizes for some comparisons were somewhat limited, given what is known about study size and estimates of effect for outcomes derived from studies with few participants and events (Dechartres 2013; Dechartres 2014; McQuay 1998; Nüesch 2010; Thorlund 2011).
We consider the overall quality of the evidence for NSAIDs versus an active comparator or a placebo, across our primary and secondary outcomes with available data?, to be low or very‐low quality.
We downgraded some outcomes twice to low quality due to serious study limitations (risk of bias) and imprecision. We downgraded some outcomes three times to very low‐quality due too few data and the fact that the number of events was too small to be meaningful.
For some outcomes, no data were available and therefore there was no evidence to support or refute the use of NSAIDs to treat chronic non‐cancer pain in children and adolescents.
Potential biases in the review process
We carried out extensive searches of major databases using broad search criteria, and also searched two large clinical trial registries. We consider it to be unlikely that we have missed relevant studies.
Agreements and disagreements with other studies or reviews
We were not able to identify any published systematic reviews on this topic.
Authors' conclusions
Implications for practice.
General
We identified seven randomised controlled trials, however we were unable to analyse these to determine whether to support or refute the use of NSAIDs to treat chronic non‐cancer pain in children and adolescents.
This is disappointing as children and adolescents have specific needs for analgesia. Extrapolating from adult data may be possible but could compromise effectiveness and safety.
Despite the lack of evidence of long‐term effectiveness and safety, clinicians prescribe NSAIDs to children and adolescents when medically necessary, based on extrapolation from adult guidelines, when perceived benefits in conjunction with other multi modalities improve a child’s care. Appropriate medical management is necessary in disease‐specific conditions such as for incurable progressive degenerative conditions of Duchenne muscular dystrophy, osteogenesis imperfecta, congenital degenerative spine, and neurodegenerative conditions such as spasticity/dystonia in mitochondrial Leigh’s disease, leukoencephalopathy, and severe cerebral palsy.
Despite the lack of evidence, NSAIDs are administered to young children and adolescents in current practice, and some are licensed for management of pain in children. Whilst our only current source is the World Health Organization guideline on the pharmacological treatment of persisting pain in children with medical illnesses (WHO 2012), we identified no specific evidence‐based guidelines for the use of NSAIDs in chronic non‐cancer pain.
For children and adolescents with chronic non‐cancer pain
The amount and quality of evidence around the use of NSAIDs for treating chronic non‐cancer pain is very low. This means that at present, treatment is based on clinical experience and advice from respected authorities. We could make no judgement about adverse events or withdrawals.
For clinicians
The amount and quality of evidence around the use of NSAIDs for treating chronic non‐cancer pain is very low. This means that at present, treatment is based on clinical experience and advice from respected authorities. We could make no judgement about adverse events or withdrawals.
For policymakers
The amount and quality of evidence around the use of NSAIDs for treating chronic non‐cancer pain is very low. This means that at present, treatment is based on clinical experience and advice from respected authorities. We could make no judgement about adverse events or withdrawals.
For funders
The amount and quality of evidence around the use of NSAIDs for treating chronic non‐cancer pain is very low. This means that at present, treatment is based on clinical experience and advice from respected authorities. We could make no judgement about adverse events or withdrawals.
Implications for research.
General
The heterogenous nature of pain in children needs to be recognised and presents challenges in designing research studies.
Overall, there appears to be a gap between what is done in practice and what is investigated in prospective clinical trials for treating children's and adolescents' pain with NSAIDs.
The lack of evidence highlighted in this review implies that there is a need to fund and support suitable research for the treatment of chronic non‐cancer pain in children and adolescents.
Design
Several methodological issues stand out.
The first is the use of outcomes of value to children with chronic non‐cancer pain. Existing trials tend to be designed more for purposes of registration and marketing than informing and improving clinical practice, that is the outcomes are often average pain scores or statistical differences, and rarely how many individuals achieve satisfactory pain relief. In the case where pain is initially mild or moderate, consideration needs to be given to what constitutes a satisfactory outcome.
The second issue is the time taken to achieve good pain relief. We have no information about what constitutes a reasonable time to achieve a satisfactory result. This may best be approached initially with a Delphi methodology.
The third issue is design. Studies with a cross‐over design often have significant attrition, therefore parallel‐group designs may be preferable.
The fourth issue is size. The studies need to be suitably powered to ensure adequate data after the effect of attrition due to various causes. Much larger studies of several hundred participants or more are needed.
There are some other design issues that might be addressed. Most important might well be a clear decision concerning the gold‐standard treatment comparator.
An alternative approach may be to design large registry studies. This could provide an opportunity to foster collaboration among paediatric clinicians and researchers, in order to create an evidence base.
Measurement (endpoints)
Trials need to consider the additional endpoint of 'no worse than mild pain' as well as the the standard approaches to pain assessment.
Other
The obvious study design of choice is the prospective randomised trial, but other pragmatic designs may be worth considering. Studies could incorporate initial randomisation but a pragmatic design in order to provide immediately relevant information on effectiveness and costs. Such designs in pain conditions have been published (Moore 2010e).
What's new
| Date | Event | Description |
|---|---|---|
| 7 June 2019 | Amended | We amended the GRADE methods for assessing no evidence, for consistency with the other reviews in this series. Clarification added to Declarations of interest. |
| 18 March 2019 | Review declared as stable | See Published notes. |
History
Protocol first published: Issue 2, 2017 Review first published: Issue 8, 2017
| Date | Event | Description |
|---|---|---|
| 6 July 2018 | Amended | Searches updated with terms relating to 'infants'. We did not identify any new studies. |
| 8 March 2018 | Amended | Affiliation updated. |
| 14 August 2017 | Amended | References for some reviews from the suite amended to reflect correct publication Issue. |
| 20 February 2017 | Amended | References for cancer pain protocols updated. |
Notes
A restricted search in March 2019 did not identify any potentially relevant studies likely to change the conclusions. Therefore, this review has now been stabilised following discussion with the authors and editors. The review will be re‐assessed for updating in five years. If appropriate, we will update the review before this date if new evidence likely to change the conclusions is published, or if standards change substantially which necessitates major revisions.
Acknowledgements
We acknowledge the contribution of Phil Wiffen to the template protocol.
We thank Chantal Wood, Neil Schechter, Jacqueline Clinch, Ewan McNicol, and Sebastian Straube for peer reviewing.
Cochrane Review Group funding acknowledgement: the National Institute for Health Research (NIHR) is the largest single funder of the Cochrane Pain, Palliative and Supportive Care Review Group. Disclaimer: the views and opinions expressed herein are those of the authors and do not necessarily reflect those of the NIHR, National Health Service (NHS), or the Department of Health.
Appendices
Appendix 1. Meeting for NIHR Programme Grant agenda on pain in children
Date
Monday 1st June 2015
Location
International Association of the Study of Pain (IASP) Conference, Seattle, USA
Delegates
Allen Finlay, Anna Erskine, Boris Zernikow, Chantal Wood, Christopher Eccleston, Elliot Krane, George Chalkaiadis, Gustaf Ljungman, Jacqui Clinch, Jeffrey Gold, Julia Wager, Marie‐Claude Gregoire, Miranda van Tilburg, Navil Sethna, Neil Schechter, Phil Wiffen, Richard Howard, Susie Lord.
Purpose
National Institute for Health Research (NIHR) (UK) Programme Grant ‐ Addressing the unmet need of chronic pain: providing the evidence for treatments of pain.
Proposal
Nine reviews in pharmacological interventions for chronic pain in children and adolescents: Children (5 new, 1 update, 1 overview, and 2 rapid) self‐management of chronic pain is prioritised by the planned NICE guideline. Pain management (young people and adults) with a focus on initial assessment and management of persistent pain in young people and adults.
We propose titles in paracetamol, ibuprofen, diclofenac, other NSAIDs, and codeine, an overview review on pain in the community, 2 rapid reviews on the pharmacotherapy of chronic pain, and cancer pain, and an update of psychological treatments for chronic pain.
Key outcomes
The final titles: (1) opioids for cancer‐related pain (Wiffen 2017a), (2) opioids for chronic non‐cancer pain (Cooper 2017a), (3) antiepileptic drugs for chronic non‐cancer pain (Wiffen 2017b), (4) antidepressants for chronic non‐cancer pain (Cooper 2017b), (5) non‐steroidal anti‐inflammatory drugs (NSAIDs) for chronic non‐cancer pain (Eccleston 2017 ‐ this review), (6) non‐steroidal anti‐inflammatory drugs (NSAIDs) for cancer‐related pain (Cooper 2017c), (7) paracetamol for chronic non‐cancer pain (Cooper 2017d).
PICO
Participants: children, aged 3 to 12, chronic pain defined as pain persisting for 3 months (NB: now changed to: birth to 17 years to include infants, children and adolescents).
Interventions: by drug class including antiepileptic drugs, antidepressants, opioids, NSAIDs, paracetamol.
Comparisons: maintain a separation of cancer and non‐cancer, exclude headache, in comparison with placebo and or active control.
Outcomes: we will adopt the IMMPACT criteria.
Appendix 2. Methodological considerations for chronic pain
There have been several recent changes in how the efficacy of conventional and unconventional treatments is assessed in chronic painful conditions. The outcomes are now better defined, particularly with new criteria for what constitutes moderate or substantial benefit (Dworkin 2008); older trials may only report participants with 'any improvement'. Newer trials tend to be larger, avoiding problems from the random play of chance. Newer trials also tend to be of longer duration, up to 12 weeks, and longer trials provide a more rigorous and valid assessment of efficacy in chronic conditions. New standards have evolved for assessing efficacy in neuropathic pain, and we are now applying stricter criteria for the inclusion of trials and assessment of outcomes, and are more aware of problems that may affect our overall assessment. We summarise some of the recent insights that must be considered in this new review.
Pain results tend to have a U‐shaped distribution rather than a bell‐shaped distribution. This is true in acute pain (Moore 2011a; Moore 2011b), back pain (Moore 2010d), and arthritis (Moore 2010c), as well as in fibromyalgia (Straube 2010); in all cases average results usually describe the experience of almost no one in the trial. Data expressed as averages are potentially misleading, unless they can be proven to be suitable.
As a consequence, we have to depend on dichotomous results (the individual either has or does not have the outcome) usually from pain changes or participant global assessments. The Initiative on Methods, Measurement, and Pain Assessment in Clinical Trials (IMMPACT) group has helped with their definitions of minimal, moderate, and substantial improvement (Dworkin 2008). In arthritis, trials of less than 12 weeks' duration, and especially those shorter than eight weeks, overestimate the effect of treatment (Moore 2010c); the effect is particularly strong for less effective analgesics, and this may also be relevant in neuropathic‐type pain.
The proportion of patients with at least moderate benefit can be small, even with an effective medicine, falling from 60% with an effective medicine in arthritis to 30% in fibromyalgia (Moore 2009; Moore 2010c; Moore 2013b; Moore 2014b; Straube 2008; Sultan 2008). A Cochrane review of pregabalin in neuropathic pain and fibromyalgia demonstrated different response rates for different types of chronic pain (higher in diabetic neuropathy and postherpetic neuralgia and lower in central pain and fibromyalgia) (Moore 2009). This indicates that different neuropathic pain conditions should be treated separately from one another, and that pooling should not be done unless there are good grounds for doing so.
Individual patient analyses indicate that patients who get good pain relief (moderate or better) have major benefits in many other outcomes, affecting quality of life in a significant way (Moore 2010b; Moore 2014a).
Imputation methods such as last observation carried forward (LOCF), used when participants withdraw from clinical trials, can overstate drug efficacy, especially when adverse event withdrawals with drug are greater than those with placebo (Moore 2012).
Appendix 3. MEDLINE search strategy (via Ovid)
exp Child/
exp Adolescent/
exp Infant/
(child* or boy* or girl* or adolescen* or teen* or toddler* or preschooler* or pre‐schooler* or baby or babies or infant*).mp
1 or 2 or 3 or 4
exp Anti‐Inflammatory Agents, Non‐Steroidal/
(aspirin or celecoxib or diclofenac or dipyrone or flurbiprofen, or ibuprofen, or indomet?acin or ketorolac or mefenamic acid or naproxen or nefopam or phenylbutazone or piroxicam or ketoprofen or nimesulide).mp.
6 or 7
exp Pain/
4 and 8 and 9
randomized controlled trial.pt.
controlled clinical trial.pt.
randomized.ab.
placebo.ab.
drug therapy.fs.
randomly.ab.
trial.ab.
groups.ab.
11 or 12 or 13 or 14 or 15 or 16 or 17 or 18
10 and 19
Appendix 4. Embase search strategy (via Ovid)
exp Child/
exp Adolescent/
(child* or boy* or girl* or adolescen* or teen* or toddler* or preschooler* or pre‐schooler* or baby or babies or infant*).mp
exp Infant/
1 or 2 or 3 or 4
exp nonsteroid antiinflammatory agent/
(aspirin or celecoxib or diclofenac or dipyrone or flurbiprofen, or ibuprofen, or indomet?acin or ketorolac or mefenamic acid or naproxen or nefopam or phenylbutazone or piroxicam or ketoprofen or nimesulide).mp.
6 or 7
exp Pain/
5 and 8 and 9
crossover‐procedure/
double‐blind procedure/
randomized controlled trial/
(random* or factorial* or crossover* or cross over* or cross‐over* or placebo* or (doubl* adj blind*) or assign* or allocat*).tw.
11 or 12 or 13 or 14
10 and 15
Appendix 5. CENTRAL search strategy (via Cochrane Register of Studies Online)
MESH DESCRIPTOR Child EXPLODE ALL TREES
MESH DESCRIPTOR Adolescent
MESH DESCRIPTOR Infant EXPLODE ALL TREES
(child* or boy* or girl* or adolescen* or teen* or toddler* or preschooler* or pre‐schooler*or baby or babies or infant*) ):TI,AB,KY
#1 OR #2 OR #3 OR #4
MESH DESCRIPTOR Anti‐Inflammatory Agents, Non‐SteroidalEXPLODE ALL TREES
(aspirin or celecoxib or diclofenac or dipyrone or flurbiprofen, or ibuprofen, or indomet?acin or ketorolac or mefenamic acid or naproxen or nefopam or phenylbutazone or piroxicam or ketoprofen or nimesulide):TI,AB,KY
#6 OR #7
MESH DESCRIPTOR Pain EXPLODE ALL TREES
#5 AND #8 AND #9
Appendix 6. GRADE guidelines
Some advantages of utilising the GRADE process are (Guyatt 2008):
transparent process of moving from evidence to recommendations;
clear separation between quality of evidence and strength of recommendations;
explicit, comprehensive criteria for downgrading and upgrading quality of evidence ratings; and
clear, pragmatic interpretation of strong versus weak recommendations for clinicians, participants, and policymakers.
The GRADE system uses the following criteria for assigning grade of evidence:
high: we are very confident that the true effect lies close to that of the estimate of the effect;
moderate: we are moderately confident in the effect estimate; the true effect is likely to be close the estimate of effect, but there is a possibility that it is substantially different;
low: our confidence in the effect estimate is limited; the true effect may be substantially different from the estimate of the effect; and
very low: we have very little confidence in the effect estimate; the true effect is likely to be substantially different from the estimate of effect.
We decreased the grade if there was:
serious (‐1) or very serious (‐2) limitation to study quality;
important inconsistency (‐1);
some (‐1) or major (‐2) uncertainty about directness;
imprecise or sparse data (‐1); or
high probability of reporting bias (‐1).
We increased the grade if there was:
strong evidence of association ‐ significant risk ratio of > 2 (< 0.5) based on consistent evidence from two or more observational studies, with no plausible confounders (+1);
very strong evidence of association ‐ significant risk ratio of > 5 (< 0.2) based on direct evidence with no major threats to validity (+2);
evidence of a dose response gradient (+1); or
all plausible confounders would have reduced the effect (+1).
"In addition, there may be circumstances where the overall rating for a particular outcome would need to be adjusted per GRADE guidelines (Guyatt 2013a). For example, if there were so few data that the results were highly susceptible to the random play of chance, or if studies used LOCF imputation in circumstances where there were substantial differences in adverse event withdrawals, one would have no confidence in the result, and would need to downgrade the quality of the evidence by three levels, to very low quality. In circumstances where no data were reported for an outcome, we planned to report the level of evidence as 'no evidence to support or refute' (Guyatt 2013b)."
Appendix 7. Summary of efficacy in individual studies
| Study | Treatment | Pain outcome | Other efficacy outcomes |
| Bhettay 1978 |
Intervention group (N = 15): indomethacin (2 weeks) then cross‐over to ketoprofen (2 weeks) Control group (N = 15): ketoprofen (2 weeks) then cross‐over to indomethacin (2 weeks) Participants < 20 kg: ketoprofen 25 mg capsule twice daily; participants > 20 kg: ketoprofen capsules x 2 = 50 mg twice daily Participants < 20 kg: indomethacin 25 mg capsule twice daily; participants > 20 kg: indomethacin capsules x 2 = 50 mg twice daily Study duration: 5 weeks |
Participant‐reported pain relief of 30% or greater: no data Participant‐reported pain relief of 50% or greater: no data PGIC much or very much improved: no data |
Patient Global Impression of Change: no data Carer Global Impression of Change: no data Requirement for rescue analgesia: no data Sleep duration and quality: no data Acceptability of treatment: no data Physical functioning: no data Quality of life: no data |
| Brewer 1982 |
Intervention group (N = 50): fenoprofen 900 mg/m2/d increased to 1800 mg/m2/d, maximum 3200 mg/d Control group (N = 49): aspirin 1500 mg/m2/d increased to 3000 mg/m2/d, maximum 5450 mg/d Study duration: 12 weeks |
Participant‐reported pain relief of 30% or greater: ≥ 25% improvement Severity of pain on movement fenoprofen: 23/50 aspirin: 21/49 Severity of limitation of movement fenoprofen: 18/50 aspirin: 16/49 Participant‐reported pain relief of 50% or greater: ≥ 50% improvement Severity of pain on movement fenoprofen: 18/50 aspirin: 15/49 Severity of limitation of movement fenoprofen: 12/50 aspirin: 12/49 PGIC much or very much improved: no data |
Patient Global Impression of Change: Patient global assessment of patient response (satisfactory) to therapy fenoprofen: 30/50 aspirin: 24/49 Carer Global Impression of Change: Parent global assessment of patient response (satisfactory) to therapy fenoprofen: 34/50 aspirin: 30/49 Physician global assessment of patient response fenoprofen: 31/50 aspirin: 31/49 Requirement for rescue analgesia: no data Sleep duration and quality: no data Acceptability of treatment: no data Physical functioning: no data Quality of life: no data |
| Foeldvari 2009 |
Intervention group (N = 77): celecoxib 50 mg/5 mL oral suspension (target dose approximately 3 mg/kg twice daily) Intervention group (N = 82): celecoxib 100 mg/5 mL oral suspension (target dose approximately 6 mg/kg twice daily) Control group (N = 83): naproxen 125 mg/5 mL oral suspension (target dose approximately 7.5 mg/kg twice daily) Study duration: 12 weeks |
Participant‐reported pain relief of 30% or greater: ACR Pediatric‐30 responders, n (%) celecoxib 3 mg/kg: 53/77 (68.8%) celecoxib 6 mg/kg: 66/82 (80.5%) naproxen 7.5 mg/kg: 56/83 (67.5%) Participant‐reported pain relief of 50% or greater: no data PGIC much or very much improved: no data |
Patient Global Impression of Change: no data Carer Global Impression of Change: Parent global assessment of overall well‐being 100‐millimetre VAS, least squares mean change from baseline (SE) celecoxib 3 mg/kg: ‐17.96 (2.42) celecoxib 6 mg/kg: ‐20.45 (2.34) naproxen 7.5 mg/kg: ‐18.25 (2.33) Physician global assessment of disease activity: 100‐millimetre VAS, least squares mean change from baseline (SE) celecoxib 3 mg/kg: ‐21.07 (1.86) celecoxib 6 mg/kg: ‐23.27 (1.80) naproxen 7.5 mg/kg: ‐21.88 (1.79) Requirement for rescue analgesia: no data Sleep duration and quality: no data Acceptability of treatment: no data Physical functioning: Parent assessment of physical functioning, Child Health Assessment Questionnaire, disability index 0 to 3, least squares mean change from baseline (SE) celecoxib 3 mg/kg: ‐0.28 (0.05) celecoxib 6 mg/kg: ‐0.32 (0.05) naproxen 7.5 mg/kg: ‐0.31 (0.05) Quality of life: Pediatric Quality of Life Inventory All treatment groups improved Pediatric Quality of Life Inventory scores. Scores of participants in the celecoxib 6 mg/kg twice‐daily group or naproxen 7.5 mg/kg twice‐daily group were higher than those of participants in the celecoxib 3 mg/kg twice‐daily group, but results were non‐significant (data not shown in publication). Unclear whether differences are between groups or over time. celecoxib 3 mg/kg: no data celecoxib 6 mg/kg: no data naproxen 7.5 mg/kg: no data |
| Giannini 1990 |
Intervention group (N = 45): ibuprofen suspension (concentration 100 mg/5mL) + placebo aspirin Control group (N = 47): aspirin 200 mg tablet (participant weight 10 to 30 kg) or 300 mg capsules (participant weight > 30 kg) + placebo ibuprofen Week 2: physician's option to increase dose to 40 mg/kg/day ibuprofen or 80 mg/kg/day aspirin, provided no significant side effects Study duration: 12 weeks |
Participant‐reported pain relief of 30% or greater: no data Participant‐reported pain relief of 50% or greater: no data PGIC much or very much improved: Patient Global Impression of Change very much improved: ibuprofen: 22/26 (85%) aspirin: 18/20 (90%) Carer Global Impression of Change: ibuprofen: 33/42 (79%) aspirin: 29/35 (83%) Investigator Global Evaluation: ibuprofen: 34/44 (78%) aspirin: 27/35 (77%) |
Patient Global Impression of Change: ibuprofen: 22/26 (85%) aspirin: 18/20 (90%) Carer Global Impression of Change: ibuprofen: 33/42 (79%) aspirin: 29/35 (83%) Investigator Global Evaluation: ibuprofen: 34/44 (78%) aspirin: 27/35 (77%) Requirement for rescue analgesia: no data Sleep duration and quality: no data Acceptability of treatment: no data Physical functioning: no data Quality of life: no data |
| Moran 1979 |
Intervention group (N = 23): naproxen 10 mg/kg/24 hrs given as a suspension in 2 divided doses Control group (N = 23): aspirin soluble 80 mg/kg/day, divided into 4 doses Study duration: 2 x 4 weeks |
Participant‐reported pain relief of 30% or greater: no data Participant‐reported pain relief of 50% or greater: no data PGIC much or very much improved: no data |
Patient Global Impression of Change: no data Carer Global Impression of Change: no data Requirement for rescue analgesia: no data Sleep duration and quality: no data Acceptability of treatment: Medication preference at end of trial: Naproxen much better: 0 Naproxen better: 9 Both periods equal: 9 Aspirin better: 4 Aspirin much better: 1 Physical functioning: no separate data Quality of life: no data |
| Reiff 2006 |
Intervention group (N = 209): (children) LD rofecoxib 0.3mg/kg/day maximum 12.5mg/day, or HD rofecoxib 0.6mg/kg/day maximum 25 mg/day; (adolescents) rofecoxib 12.5 or 25 mg daily Control group (N = 101): (children) naproxen 15 mg/kg/day 5 mg oral suspension; (adolescents) 15 mg/kg/day maximum 1000 mg/day Study duration: 12 weeks |
Participant‐reported pain relief of 30% or greater: ACR Pedi 30% reduction LD rofecoxib: 45/97 (46.2%) HD rofecoxib: 49/90 (54.5%) naproxen: 48/87 (55.1%) Participant‐reported pain relief of 50% or greater: no data PGIC much or very much improved: no data |
Patient Global Impression of Change: no data Carer Global Impression of Change: no data Patient/Parent Global Assessment of Pain: mean change from baseline (95% CI) LD rofecoxib: ‐12.50 (‐15.98; ‐9.02) HD rofecoxib: ‐13.12 (‐16.75; ‐9.48) naproxen: ‐8.43 (‐11.98; ‐4.88) Requirement for rescue analgesia: no data Sleep duration and quality: no data Acceptability of treatment: no data Physical functioning: CHAQ index: mean change from baseline (95% CI) LD rofecoxib: ‐0.11 (‐0.18; ‐0.05) HD rofecoxib: ‐0.15 (‐0.21; ‐0.08) naproxen: ‐0.12 (‐0.18; ‐0.05) Quality of life: Patient/parent assessment of overall well‐being:mean change from baseline (95% CI) (proportion of improvement from baseline) LD rofecoxib: ‐11.57 (‐14.78; ‐8.36) (74.3%) HD rofecoxib: ‐12.08 (‐15.44; ‐8.73) (76%) naproxen: ‐8.56 (‐11.85; ‐5.27) (73%) Additional data Investigators' global assessment of disease activity: mean change from baseline (95% CI) LD rofecoxib: ‐12.45 (‐14.95; ‐9.94) HD rofecoxib: ‐13.27 (‐15.88; ‐10.65) naproxen: ‐12.05 (‐14.60; ‐9.50) |
| Ruperto 2005 |
Intervention group 1 (N = 73): LD meloxicam 0.125 mg/kg, 1 dose per day Intervention group 2 (N = 74): HD meloxicam 0.25 mg/kg, 1 dose per day Control group (N = 78): naproxen 5 mg/kg, twice per day Study duration: 48 weeks |
Participant‐reported pain relief of 30% or greater: @ 3 MONTHS LD meloxicam: 46/73 (63%), 95% CI 52 to 74% HD meloxicam: 43/74 (58%), 95% CI 47 to 69% naproxen: 50/78 (64%), 95% CI 53 to 75% @ 12 MONTHS LD meloxicam: 56/73 (77%), 95% CI 67 to 86% HD meloxicam: 56/74 (76%), 95% CI 66 to 85% naproxen: 58/78 (74%), 95% CI 65 to 84% Participant‐reported pain relief of 50% or greater: @ 3 MONTHS LD meloxicam: 38/73 (52%), 95% CI 41 to 64% HD meloxicam: 32/74 (43%), 95% CI 32 to 55% naproxen: 39/78 (50%), 95% CI 39 to 61% @ 12 MONTHS LD meloxicam: 50/73 (68%), 95% CI 58 to 79% HD meloxicam: 48/74 (65%), 95% CI 54 to 76% naproxen: 53/78 (68%), 95% CI 58 to 78% TOTAL POOLING: P = 0.7 PGIC much or very much improved: no data |
Patient Global Impression of Change: no data Participant reported assessment of discomfort (facial affective scale 1 to 9 points): @ 3 MONTHS LD meloxicam: 0.3 ± 0.2 HD meloxicam: 0.4 ± 0.2 naproxen: 0.3 ± 0.2 @ 12 MONTHS LD meloxicam: 0.3 ± 0.2 HD meloxicam: 0.3 ± 0.2 naproxen: 0.2 ± 0.2 Physician global impression of disease activity (VAS 0 to 100): @ 3 MONTHS LD meloxicam: 19.4 ± 20.7 HD meloxicam: 20.6 ± 20.3 naproxen: 21.1 ± 19.2 @ 12 MONTHS LD meloxicam: 15.4 ± 20.5 HD meloxicam: 16.8 ± 19.0 naproxen: 14.4 ± 16.7 Carer Global Impression of Pain (VAS 0 to 100): @ 3 MONTHS LD meloxicam: 17.6 ± 20.2 HD meloxicam: 21.9 ± 23.6 naproxen: 20.8 ± 22.4 @ 12 MONTHS LD meloxicam: 13.4 ± 17.6 HD meloxicam: 17.2 ± 22.5 naproxen: 15.9 ± 21.3 Requirement for rescue analgesia: no data Sleep duration and quality: no data Acceptability of treatment: no data Physical functioning: CHAQ Disability Index (0 to 3 points) @ 3 MONTHS LD meloxicam: 0.4 ± 0.5 HD meloxicam: 0.5 ± 0.6 naproxen: 0.5 ± 0.6 @ 12 MONTHS LD meloxicam: 0.3 ± 0.4 HD meloxicam: 0.4 ± 0.6 naproxen: 0.3 ± 0.5 Quality of life: no data |
| ACR: American College of Rheumatology; CI: confidence interval; HD: high‐dose; LD: low‐dose; N: number of participants; PGIC: Patient Global Impression of Change;SE: standard error; VAS: visual analogue scale | |||
Appendix 8. Summary of adverse events and withdrawals in individual studies
| Study | Treatment | Adverse events | Withdrawals |
| Bhettay 1978 |
Intervention group (N = 15): indomethacin (2 weeks) then cross‐over to ketoprofen (2 weeks) Control group (N = 15): ketoprofen (2 weeks) then cross‐over to indomethacin (2 weeks) Participants < 20 kg: ketoprofen 25 mg capsule twice daily; participants > 20 kg: ketoprofen capsules x 2 = 50 mg twice daily Participants < 20 kg: indomethacin 25 mg capsule twice daily; participants > 20 kg: indomethacin capsules x 2 = 50 mg twice daily Study duration: 5 weeks |
Total adverse events occurring (may be more than 1 per participant): ketoprofen: 9/30 indomethacin: 9/30 No. participants reporting an adverse event: ketoprofen: 9/30 indomethacin: 9/30 Serious adverse events: ketoprofen: 0/30 indomethacin: 0/30 Specific adverse events: ketoprofen; indomethacin loss of appetite: 1/30; 1/30 nausea: 1/30; 2/30 vomiting: 3/30; 2/30 abdominal pain: 3/30; 2/30 frank blood in stool: 0/30; 1/30 headache: 1/30; 1/30 |
Total all‐cause withdrawals: ketoprofen: 0/30 indomethacin: 0/30 (1 disqualified for non‐compliance, not withdrawn) Withdrawals due to adverse events: ketoprofen: 0/30 indomethacin: 0/30 |
| Brewer 1982 |
Intervention group (N = 50): fenoprofen 900 mg/m2/d increased to 1800 mg/m2/d, maximum 3200 mg/d Control group (N = 49): aspirin 1500 mg/m2/d increased to 3000 mg/m2/d, maximum 5450 mg/d Study duration: 12 weeks |
Total adverse events occurring (may be more than 1 per participant): fenoprofen: n = 78 aspirin: n = 90 No. participants reporting an adverse event: fenoprofen: 28/49 aspirin: 40/50 Serious adverse events: fenoprofen: 0/79 aspirin: 0/50 Specific adverse events: fenoprofen (n = 49); aspirin (n = 50) abdominal pain: 9; 10 stomach discomfort: 12; 9 diarrhoea: 4; 2 vomiting: 2; 9 nausea: 2; 3 nausea and vomiting: 0; 2 general gastrointestinal upset: 0; 2 constipation: 3; 8 anorexia: 2; 3 occult blood in stool: 0; 2 cramps, abdominal: 2; 3 diplopia: 5; 0 dizziness: 0; 2 headache: 4; 2 rash: 6; 2 fatigue: 0; 2 chills: 0; 2 hyperventilation:1; 2 SGOT increase: 0; 7 SGPT increase: 0; 6 |
Total all‐cause withdrawals: fenoprofen: 2/49 (4%); noncompliance (1); difficulty swallowing tablet (1) aspirin: 10/50 (20%); adverse effects (7); inefficacy (1); failed to co‐operate (1); wrong assignment chose to discontinue (1) Withdrawals due to adverse events: fenoprofen: 0/49 (0%) aspirin: 7/50 (14%) |
| Foeldvari 2009 |
Intervention group (N = 77): celecoxib 50 mg/5 mL oral suspension (target dose approximately 3 mg/kg twice daily) Intervention group (N = 82): celecoxib 100 mg/5 mL oral suspension (target dose approximately 6 mg/kg twice daily) Control group (N = 83): naproxen 125 mg/5 mL oral suspension (target dose approximately 7.5 mg/kg twice daily) Study duration: 12 weeks |
Total adverse events occurring (may be more than 1 per participant): celecoxib 3 mg/kg: 49/77 (63.6%) celecoxib 6 mg/kg: 57/82 (69.5%) naproxen 7.5 mg/kg: 60/83 (72.3%) No. participants reporting an adverse event: no data Serious adverse events: celecoxib 3 mg/kg: 3/77 celecoxib 6 mg/kg: 2/82 naproxen 7.5 mg/kg: 0/83 Specific adverse events: Significant AEs: skin and subcutaneous tissue disorders (celecoxib 6 mg; 6/82 (7.3%; P ≤ 0.10) Others AEs: eye disorders; headache (reported most often); gastrointestinal disorders; general disorders and administration site conditions; infections and infestations; injury and poisoning; investigations; musculoskeletal, connective tissue, and bone disorders; nervous system disorders; respiratory, thoracic, and mediastinal disorders |
Total all‐cause withdrawals: celecoxib 3 mg/kg: 10/77 celecoxib 6 mg/kg: 11/82 naproxen 7.5 mg/kg: 9/83 Withdrawals due to adverse events: celecoxib 3 mg/kg: 3/77 celecoxib 6 mg/kg: 7/82 naproxen 7.5 mg/kg: 3/83 |
| Giannini 1990 |
Intervention group (N = 45): ibuprofen suspension (concentration 100 mg/5 mL) + placebo aspirin Control group (N = 47): aspirin 200 mg tablet (participant weight 10 to 30 kg) or 300 mg capsules (participant weight > 30 kg) + placebo ibuprofen Week 2: physician's option to increase dose to 40 mg/kg/day ibuprofen or 80 mg/kg/day aspirin, provided no significant side effects Study duration: 12 weeks |
Total adverse events occurring (may be more than 1 per participant): ibuprofen: unclear aspirin: unclear No. participants reporting an adverse event: ibuprofen: 40/45 aspirin: 44/47 Serious adverse events: ibuprofen: 4/45 aspirin: 13/47 Specific adverse events: ibuprofen; aspirin abnormalities in liver function: 1/45; 22/47; P < 0.01 digestive system adverse effects: 19/45; 33/47 elevated liver enzyme values: 0/45; 5/47 abdominal pain: 0/45; 1/47 positive stool test result: 8/45; 15/47 positive faecal occult blood tests: 2/45; 1/47 |
Total all‐cause withdrawals: ibuprofen: 1/45 aspirin: 9/47 Withdrawals due to adverse events: ibuprofen: 0/45 aspirin: 6/47 |
| Moran 1979 |
Intervention group (N = 23): naproxen 10 mg/kg/24 hrs given as a suspension in 2 divided doses Control group (N = 23): aspirin soluble 80 mg/kg/day, divided into 4 doses Study duration: 2 x 4 weeks |
Total adverse events occurring (may be more than 1 per participant): naproxen: 10/23 aspirin: 2/23 No. participants reporting an adverse event: naproxen: 6/23 aspirin: 1/23 Serious adverse events: naproxen: 0/23 aspirin: 0/23 Specific adverse events: naproxen: 1 ‐ abdominal pain aspirin: 1 ‐ abnormal liver test, nausea, tinnitus, and lassitude; 1 ‐ abnormal liver test; 1 ‐ vomiting |
Total all‐cause withdrawals: naproxen: 1/23 (abdominal pain) aspirin: 3/23 (1 ‐ abnormal liver test, nausea, tinnitus, and lassitude; 1 ‐ abnormal liver test; 1 ‐ vomiting) Withdrawals due to adverse events: naproxen: 1/23 aspirin: 3/23 |
| Reiff 2006 |
Intervention group (N = 209): (children) LD rofecoxib 0.3mg/kg/day maximum 12.5mg/day, or HD rofecoxib 0.6mg/kg/day maximum 25 mg/day; (adolescents) rofecoxib 12.5 or 25 mg daily Control group (N = 101): (children) naproxen 15 mg/kg/day 5 mg oral suspension; (adolescents) 15 mg/kg/day maximum 1000 mg/day Study duration: 12 weeks |
Total adverse events occurring (may be more than 1 per participant): no data No. participants reporting an adverse event: LD rofecoxib: 21/109 (19.3%) HD rofecoxib: 22/100 (22%) naproxen: 28/101 (27.7%) Serious adverse events: LD rofecoxib: 0/109 HD rofecoxib: 0/100 naproxen: 0/101 Specific adverse events: Most common AEs, > 5% in each group: (n) LD rofecoxib; HD rofecoxib; naproxen abdominal pain: 7/109; 6/100; 13/101 headache: 6/109; 5/100; 13/101 upper abdominal pain: 7/109; 12/100; 7/101 nasopharyngitis: 11/109; 10/100; 1/101 pyrexia: 5/109; 4/100; 9/101 diarrhoea: 5/109; 7/100; 4/101 pharyngitis: 7/109; 3/100; 3/101 vomiting: 7/109; 3/100; 3/101 upper respiratory tract infection: 6/109; 6/100; 7/101 nausea: 3/109; 4/100; 6/101 |
Total all‐cause withdrawals: LD rofecoxib: 10/109 HD rofecoxib: 5/100 naproxen: 10/101 Withdrawals due to adverse events: LD rofecoxib: 3/109 (0.03%) HD rofecoxib: 0/100 (0.0%) naproxen: 3/101 (0.03%) |
| Ruperto 2005 |
Intervention group 1 (N = 73): LD meloxicam 0.125 mg/kg, 1 dose per day Intervention group 2 (N = 74): HD meloxicam 0.25 mg/kg, 1 dose per day Control group (N = 78): naproxen 5 mg/kg, twice per day Study duration: 48 weeks |
Total adverse events occurring (may be more than 1 per participant): LD meloxicam: n = 209 HD meloxicam: n= 229 naproxen: n = 247 No. participants reporting an adverse event: LD meloxicam: 54/73 (74%) HD meloxicam: 59/74 (80%) naproxen: 66/78 (85%) Considered to be drug related: LD meloxicam: 7/73 (10%) HD meloxicam: 11/74 (15%) naproxen: 10/78 (13%) Serious adverse events: LD meloxicam: 4/73 (5%) HD meloxicam: 7/74 (9%) naproxen: 10/78 (13%) Specific adverse events: LD meloxicam (n = 73); HD meloxicam (n = 74); naproxen (n = 79) eye disorders: 5; 6; 8 gastrointestinal disorders: 28; 27; 25 pain diarrhoea, nausea, vomiting: 21; 19; 19 pharyngolaryngeal pain: 9; 5; 4 general disorders: 13; 14; 19 pyrexia: 11; 13; 14 infections and infestations: 30; 38; 39 nasopharyngitis: 4; 9; 7 physical examination: 9; 6; 4 musculoskeletal and connective tissue disorders: 11; 22; 10 nervous system disorders: 10; 11; 7 headache not otherwise specified: 9; 10; 5 respiratory, thoracic, and mediastinal disorders: 22; 19; 26 cough: 7; 9; 14 rhinitis not otherwise specified: 13; 11; 16 skin and subcutaneous tissue disorders: 4; 5; 13 eczema, erythema, pruritus, rash: 0; 3; 8 bleeding disorders (rectal haemorrhage, epistaxis, haematuria, haematoma, Henoch‐Schonlein purpura): 3; 2; 9 |
Total all‐cause withdrawals: LD meloxicam: n = 15/73 (21%). LTFU (0); AE (7); lack of efficacy (2); other (4); others (2). HD meloxicam: n = 11/74 (15%). LTFU (0); AE (3); lack of efficacy (1); other (5); others (2). naproxen: n = 17/78 (22%). LTFU (0); AE (10); lack of efficacy (3); other (4); others (0). Withdrawals due to adverse events: LD meloxicam: 7/73 (9.6%) HD meloxicam: 3/74 (4.1%) naproxen: 10/78 (12.8%) |
| AE: adverse event; HD: high‐dose; LD: low‐dose; LTFU: long‐term follow‐up; N: number of participants; SGOT: serum glutamate‐oxaloacetic transaminase; SGPT: serum glutamate‐pyruvate transaminase | |||
Data and analyses
Comparison 1. Meloxicam versus naproxen.
| Outcome or subgroup title | No. of studies | No. of participants | Statistical method | Effect size |
|---|---|---|---|---|
| 1 Participant‐reported pain relief of 30% or greater | 1 | Risk Ratio (M‐H, Fixed, 95% CI) | Totals not selected | |
| 1.1 Meloxicam 0.125mg/kg vs naproxen 10mg/kg | 1 | Risk Ratio (M‐H, Fixed, 95% CI) | 0.0 [0.0, 0.0] | |
| 1.2 Meloxicam 0.25mg/kg vs naproxen 10mg/kg | 1 | Risk Ratio (M‐H, Fixed, 95% CI) | 0.0 [0.0, 0.0] | |
| 2 Participant‐reported pain relief of 50% or greater | 1 | Risk Ratio (M‐H, Fixed, 95% CI) | Totals not selected | |
| 2.1 Meloxicam 0.125mg/kg vs naproxen 10mg/kg | 1 | Risk Ratio (M‐H, Fixed, 95% CI) | 0.0 [0.0, 0.0] | |
| 2.2 Meloxicam 0.25mg/kg vs naproxen 10mg/kg | 1 | Risk Ratio (M‐H, Fixed, 95% CI) | 0.0 [0.0, 0.0] |
Comparison 2. Celecoxib versus naproxen.
| Outcome or subgroup title | No. of studies | No. of participants | Statistical method | Effect size |
|---|---|---|---|---|
| 1 Participant‐reported pain relief of 30% or greater | 1 | Risk Ratio (M‐H, Fixed, 95% CI) | Totals not selected | |
| 1.1 Celecoxib 3mg/kg vs naproxen 7.5mg/kg | 1 | Risk Ratio (M‐H, Fixed, 95% CI) | 0.0 [0.0, 0.0] | |
| 1.2 Celecoxib 6mg/kg vs naproxen 7.5mg/kg | 1 | Risk Ratio (M‐H, Fixed, 95% CI) | 0.0 [0.0, 0.0] |
Comparison 3. Rofecoxib versus naproxen.
| Outcome or subgroup title | No. of studies | No. of participants | Statistical method | Effect size |
|---|---|---|---|---|
| 1 Participant‐reported pain relief of 30% or greater | 1 | Risk Ratio (M‐H, Fixed, 95% CI) | Totals not selected | |
| 1.1 Rofecoxib 0.3 to 12.5mg/kg vs naproxen 15mg/kg | 1 | Risk Ratio (M‐H, Fixed, 95% CI) | 0.0 [0.0, 0.0] | |
| 1.2 Rofecoxib 12.5 to 25mg/kg vs naproxen 15mg/kg | 1 | Risk Ratio (M‐H, Fixed, 95% CI) | 0.0 [0.0, 0.0] |
Characteristics of studies
Characteristics of included studies [ordered by study ID]
Bhettay 1978.
| Methods |
Allocation: randomised Blinding: double‐blind Controlled: placebo Centre: multicentre Arm: 2 arms, cross‐over design |
|
| Participants |
Inclusion criteria: children with juvenile chronic arthritis Exclusion criteria: known history of contraindications to study drugs; receiving gold, d‐penicillamine, or corticosteroids; in a state of remission Baseline characteristics N = 30 Age: mean not reported, range 2 to 16 years Gender: male (unstated); female (unstated) Number randomised: intervention (15); control (15) Number completed: intervention (15); control (15) Setting and location: South Africa |
|
| Interventions |
Intervention group (N = 15): indomethacin (2 weeks), cross‐over ketoprofen (2 weeks) Control group (N = 15): ketoprofen (2 weeks), cross‐over indomethacin (2 weeks) Participants < 20 kg: ketoprofen 25 mg capsule twice daily; participants > 20 kg: ketoprofen capsules x 2 = 50 mg twice daily Participants < 20 kg: indomethacin 25 mg capsule twice daily; participants > 20 kg: indomethacin capsules x 2 = 50 mg twice daily Study duration: 5 weeks |
|
| Outcomes |
Primary outcomes
Secondary outcomes
|
|
| Notes | Sources of funding: Maybaker (SA) (Pty) Ltd provided drug supplies. | |
| Risk of bias | ||
| Bias | Authors' judgement | Support for judgement |
| Random sequence generation (selection bias) | Unclear risk | Comment: Randomised drug administration, not participants |
| Allocation concealment (selection bias) | Unclear risk | Comment: Insufficient information |
| Blinding of participants and personnel (performance bias) All outcomes | Unclear risk | Comment: Insufficient information |
| Blinding of outcome assessment (detection bias) All outcomes | Unclear risk | Quote: Insufficient information |
| Incomplete outcome data (attrition bias) All outcomes | Low risk | Comment: All participants were accounted for. Lost to follow‐up and withdrawals explained. |
| Selective reporting (reporting bias) | Unclear risk | Comment: Means and standard deviations not reported, nor blood sedimentation rate, haemoglobin level, platelet and white cell count. |
| Size | High risk | Comment: Total participants = 30 (< 50 per treatment arm) |
| Other bias | Low risk | Comment: No other potential sources of bias found. |
Brewer 1982.
| Methods |
Allocation: randomised Blinding: double‐blind Controlled: active comparator Centre: multicentre Arm: 2 arms, parallel groups |
|
| Participants |
Inclusion criteria: children with juvenile rheumatoid arthritis Exclusion criteria: unstated Baseline characteristics N = 99 Age: range unstated; mean age 8.5 years Gender: male (23); female (76) Number randomised: fenoprofen (49); aspirin (50) Number completed: fenoprofen (47); aspirin (40) Setting and location: multicentre, location unstated |
|
| Interventions |
Intervention group (N = 49): aspirin 1500 mg/m2/day increased to 3000 mg/m2/day, maximum 5450 mg/day Control group (N = 50): fenoprofen 900 mg/m2/day increased to 1800 mg/m2/day, maximum 3200 mg/day Study duration: 12 weeks |
|
| Outcomes |
Primary outcomes
Secondary outcomes
|
|
| Notes | Sources of funding: unstated | |
| Risk of bias | ||
| Bias | Authors' judgement | Support for judgement |
| Random sequence generation (selection bias) | Unclear risk |
Quote: "99 patients were randomized into the study" Comment: No information regarding method of randomisation |
| Allocation concealment (selection bias) | Unclear risk | Quote: Insufficient information |
| Blinding of participants and personnel (performance bias) All outcomes | Low risk | Quote: "capsules containing either fenoprofen or ASA were white opaque size #2 for the 0.5 to 0.75m2 groups, and white opaque size #1 for the 0.76m2 and over groups. Therefore it was impossible to determine which drug the subjects were receiving by observing capsule size, colour, or administration regimen" |
| Blinding of outcome assessment (detection bias) All outcomes | Unclear risk | Comment: Insufficient information |
| Incomplete outcome data (attrition bias) All outcomes | Unclear risk | Comment: All participants were accounted for. Lost to follow‐up and withdrawals explained. However, authors do not report whether there were significant differences between completers and non‐completers. |
| Selective reporting (reporting bias) | Unclear risk |
Quote: "all investigators used an identical protocol and case report forms" Comment: No outcomes were not set out in the methods. Unable to locate protocol. |
| Size | High risk | Comment: Total participants = 99 (< 50 per treatment arm) |
| Other bias | Low risk | Comment: No other potential sources of bias found. |
Foeldvari 2009.
| Methods |
Allocation: randomised Blinding: double‐blind Controlled: active comparator Centre: multicentre Arm: 2 arms, parallel groups |
|
| Participants |
Inclusion criteria: children ≥ 9 kg, with pauciarticular of polyarticular course JRA, with or without systemic onset, according to ACR criteria; > 1 swollen joint with limited motion; parent global assessment ≥ 10 mm (100‐millimetre VAS) Exclusion criteria: active systemic manifestations; oral corticosteroid doses ≤ 0.2 mg/kg/day or 10 mg prednisone or methotrexate < 1 mg/kg/week Baseline characteristics N = 242 Age: 2 to 16 years Gender: male (71); female (171) Number randomised: intervention A (77); intervention B (82); control (83) Number completed: intervention A (67); intervention B (71); control (74) Setting and location: 17 centres worldwide |
|
| Interventions |
Intervention group (N = 77): celecoxib 50 mg/5 mL oral suspension (target dose approximately 3 mg/kg twice daily) Intervention group (N = 82): celecoxib 100 mg/5 mL oral suspension (target dose approximately 6 mg/kg twice daily) Control group (N = 83): naproxen 125 mg/5 mL oral suspension (target dose approximately 7.5 mg/kg twice daily) Study duration: 12 weeks |
|
| Outcomes |
Primary outcomes
Secondary outcomes
|
|
| Notes | Sources of funding: editorial support funded by Pfizer | |
| Risk of bias | ||
| Bias | Authors' judgement | Support for judgement |
| Random sequence generation (selection bias) | Unclear risk | Quote: "children were randomly assigned to 1 of 3 treatment groups in a 1:1:1 ratio ... randomized according to the allocation number provided by an interactive voice response system" |
| Allocation concealment (selection bias) | Unclear risk | Comment: Insufficient information |
| Blinding of participants and personnel (performance bias) All outcomes | Unclear risk | Comment: Insufficient information |
| Blinding of outcome assessment (detection bias) All outcomes | Unclear risk | Comment: Insufficient information |
| Incomplete outcome data (attrition bias) All outcomes | Unclear risk | Comment: All participants were accounted for. Lost to follow‐up and withdrawals explained. However, authors do not report whether there were significant differences between completers and non‐completers. |
| Selective reporting (reporting bias) | High risk | Comment: Secondary outcome data not reported (e.g. Pediatric Quality of Life Inventory) |
| Size | Unclear risk | Comment: Total participants = 242 (between 50 and 200 per treatment arm) |
| Other bias | Low risk | Comment: No other potential sources of bias found. |
Giannini 1990.
| Methods | ||
| Participants | ||
| Interventions |
Intervention group (N = 45): ibuprofen suspension (concentration 100 mg/5 mL) + placebo aspirin Control group (N = 47): aspirin 200 mg tablet (participant weight 10 to 30 kg) or 300 mg capsules (participant weight > 30 kg) + placebo ibuprofen Week 2: physician's option to increase dose to 40 mg/kg/day ibuprofen or 80 mg/kg/day aspirin, provided no significant side effects Study duration: 12 weeks |
|
| Outcomes | ||
| Notes | ||
| Risk of bias | ||
| Bias | Authors' judgement | Support for judgement |
| Random sequence generation (selection bias) | Unclear risk | Quote: "patients were randomly assigned, in random blocks of four within each centre, to receive ibuprofen or aspirin" |
| Allocation concealment (selection bias) | Unclear risk |
Quote: "patients were assigned numbers sequentially, on the basis of body weight, from blocks of numbers allotted to each site" Quote: "Before initiation of this trial, each centre was given a list of consecutive numbers from Boots Pharamceuticals. Patients were assigned numbers in the sequence in which they entered the study" Quote: "Patients received one of the two active medications plus a dummy of the alternative agent" |
| Blinding of participants and personnel (performance bias) All outcomes | High risk |
Quote: "Patients received one of the two active medications plus a dummy of the alternative agent" Comment: The study personnel would have known what they were giving the participants (as one was a liquid and the other was a tablet). |
| Blinding of outcome assessment (detection bias) All outcomes | Unclear risk | Comment: Insufficient information |
| Incomplete outcome data (attrition bias) All outcomes | Unclear risk | Comment: All participants were accounted for. Lost to follow‐up and withdrawals explained. However, authors do not report whether there were significant differences between completers and non‐completers. |
| Selective reporting (reporting bias) | Low risk | Comment: All planned outcomes from the methods were reported in the results. |
| Size | High risk | Comment: Total participants = 92 (< 50 per treatment arm) |
| Other bias | Low risk | Comment: No other potential sources of bias found. |
Moran 1979.
| Methods |
Allocation: randomised Blinding: double‐blind Controlled: active comparator Centre: single Arm: 2 arms, cross‐over design; 4 weeks, followed by cross‐over and a further 4 weeks |
|
| Participants |
Inclusion criteria: children suffering from seronegative juvenile polyarthritis; disease sufficiently active to be considered in need of an anti‐inflammatory analgesic agent Exclusion criteria: unstated Baseline characteristics N = 23 Age: 5 to 16 years; median 11 to 12 years Gender: male (unstated); female (unstated) Number randomised: intervention (23); control (23) Number completed: intervention (22); control (20) Setting and location: unstated |
|
| Interventions |
Intervention group (N = 23): naproxen 10 mg/kg/24 hrs given as a suspension in 2 divided doses Control group (N = 23): aspirin soluble 80 mg/kg/day, divided into 4 doses Study duration: 2 x 4 weeks |
|
| Outcomes |
Primary outcomes
Secondary outcomes
|
|
| Notes | Sources of funding: unstated | |
| Risk of bias | ||
| Bias | Authors' judgement | Support for judgement |
| Random sequence generation (selection bias) | Unclear risk | Quote: "random allocation for either ... drug" |
| Allocation concealment (selection bias) | Unclear risk | Comment: Insufficient information |
| Blinding of participants and personnel (performance bias) All outcomes | Unclear risk | Quote: "placebo suspension and tablets were given to make the study double‐blind" |
| Blinding of outcome assessment (detection bias) All outcomes | Unclear risk | Quote: "placebo suspension and tablets were given to make the study double‐blind" |
| Incomplete outcome data (attrition bias) All outcomes | Low risk | Comment: All participants were accounted for. Lost to follow‐up and withdrawals explained. |
| Selective reporting (reporting bias) | Low risk | Comment: All planned outcomes from the methods were reported in the results. |
| Size | High risk | Comment: Total participants = 23 (< 50 per treatment arm) |
| Other bias | Low risk | Comment: No other potential sources of bias found. |
Reiff 2006.
| Methods |
Allocation: randomised Blinding: double‐blind, double‐dummy Controlled: active comparator Centre: multicentre Arm: 2 arms, parallel groups |
|
| Participants |
Inclusion criteria: children with pauci‐ (oligo) or polyarticular course JRA for ≥ 3 months meeting the ACR criteria for juvenile rheumatoid arthritis. Must have patient assessment of overall well‐being (0‐to‐100 VAS) of > 90 with at least 1 swollen joint. Exclusion criteria: active systemic JRA symptoms within 3 months of randomisation or if they were not within the 5th to 95th percentile of weight for height; hypersensitivity to aspirin and/or an NSAID; unstable antirheumatic medication regimens; requiring alkylating agents, anticonvulsants, warfarin, or rifampicin; female patients who had reached menarche were required to be in a non‐gravid state as determined by measurement of serum beta‐human chorionic gonadotropin. Baseline characteristics N = 310 Age: 2 to 17 years; mean 9.9 years Gender: male (83); female (227) Number randomised: intervention A (109); intervention B (100); control (101) Number completed: intervention A (99); intervention B (95); control (91) Setting and location: 41 clinical centres in Australia, Europe, Asia, Central America, South America, USA |
|
| Interventions |
Intervention group (N = 209): (children) low‐dose rofecoxib 0.3 mg/kg/day maximum 12.5 mg/day, or high‐dose rofecoxib 0.6 mg/kg/day maximum 25 mg/day; (adolescents) rofecoxib 12.5 or 25 mg daily Control group (N = 101): (children) naproxen 15 mg/kg/day 5 mg oral suspension; (adolescents) 15 mg/kg/day maximum 1000 mg/day Study duration: 12 weeks (+ 52‐week open‐label extension) |
|
| Outcomes |
Primary outcomes
Secondary outcomes
|
|
| Notes | Sources of funding: unstated | |
| Risk of bias | ||
| Bias | Authors' judgement | Support for judgement |
| Random sequence generation (selection bias) | Low risk | Quote: "randomisation to treatment groups in equal proportions was performed using a computer‐generated allocation schedule. Treatment assignment was stratified based on joint involvement (pauci‐ or polyarticular course) and age group (2‐11 years or 12‐17 years)." |
| Allocation concealment (selection bias) | Low risk | Quote: "randomisation to treatment groups in equal proportions was performed using a computer‐generated allocation schedule. Treatment assignment was stratified based on joint involvement (pauci‐ or polyarticular course) and age group (2‐11 years or 12‐17 years)." |
| Blinding of participants and personnel (performance bias) All outcomes | Low risk | Quote: "to maintain blinding to treatment assignment during the base study, each patient received 2 coded test products ‐ active or identical‐appearing placebo" |
| Blinding of outcome assessment (detection bias) All outcomes | Unclear risk | Comment: Insufficient information |
| Incomplete outcome data (attrition bias) All outcomes | Low risk | Comment: All participants were accounted for. Lost to follow‐up and withdrawals explained. |
| Selective reporting (reporting bias) | Low risk | Comment: All planned outcomes from the methods section were reported in the results. |
| Size | Unclear risk | Comment: Total participants = 310 (between 50 and 200 per treatment arm) |
| Other bias | Low risk | Comment: No other potential sources of bias found. |
Ruperto 2005.
| Methods |
Allocation: randomised Blinding: double‐blind, double‐dummy Controlled: active comparator Centre: multicentre Arm: 3 arms, parallel groups |
|
| Participants |
Inclusion criteria: diagnosis of JIA (Durban criteria); NSAID therapy is required; have at least 2 joints with active arthritis plus abnormal results in at least 2 of any of the 5 remaining JIA core set criteria Exclusion criteria: current systemic manifestations; abnormal laboratory results unrelated to JIA; pregnancy, breastfeeding; bleeding disorders; peptic ulcer in past 6 months; hypersensitivity to NSAIDs; other rheumatic conditions; other medications related to rheumatic conditions; taking other NSAIDs Baseline characteristics N = 225 Age: 2 to 16 years Gender: male (148); female (67) Number randomised: meloxicam low (73); meloxicam high (74); naproxen (78) Number completed: meloxicam low (58); meloxicam high (63); naproxen (61) Setting and location: 34 paediatric rheumatology tertiary care units in Austria, Belgium, France, Germany, Italy, Russia, and the UK |
|
| Interventions |
Intervention group 1 (N = 73): meloxicam 0.125 mg/kg, 1 dose per day Intervention group 2 (N = 74): meloxicam 0.25 mg/kg, 1 dose per day Control group (N = 78): naproxen 5 mg/kg, twice per day Placebo 'naproxen' tablets for the meloxicam groups and placebo 'meloxicam' tablets for the naproxen group Study duration: 48 weeks |
|
| Outcomes |
Primary outcomes
Secondary outcomes
|
|
| Notes | Sources of funding: grant from Boehringer Ingelheim Pharma GmbH & Co. KG, Biberach, Germany, to the Paediatric Rheumatology International Trials Organisation | |
| Risk of bias | ||
| Bias | Authors' judgement | Support for judgement |
| Random sequence generation (selection bias) | Unclear risk |
Quote: "patients were allocated to 1 of the 3 treatment groups in a 1:1:1 randomization scheme" Comment: Randomisation method not described. |
| Allocation concealment (selection bias) | Unclear risk | Comment: No description of allocation concealment |
| Blinding of participants and personnel (performance bias) All outcomes | Low risk | Quote: "to keep the trial blinded, children in the meloxicam group also received naproxen placebo suspension and vice versa, in a double‐dummy design" |
| Blinding of outcome assessment (detection bias) All outcomes | Unclear risk | Comment: Insufficient information |
| Incomplete outcome data (attrition bias) All outcomes | Low risk | Comment: All participants were accounted for. Loss to follow‐up and withdrawals explained. However, authors do not report whether there were significant differences between completers and non‐completers. |
| Selective reporting (reporting bias) | Low risk | Comment: All planned outcomes from the methods were reported in the results. |
| Size | Unclear risk | Comment: Total participants = 225 (between 50 and 200 per treatment arm) |
| Other bias | Low risk | Comment: No other potential sources of bias found. |
ACR: American College of Rheumatology; CHAQ: Child Health Assessment Questionnaire; ESR: erythrocyte sedimentation rate;JIA: juvenile idiopathic arthritis; JRA: juvenile rheumatoid arthritis; VAS: visual analogue scale.
Characteristics of excluded studies [ordered by study ID]
| Study | Reason for exclusion |
|---|---|
| Coutinho 1976 | Population: adults |
| Girschick 1999 | Allocation: not a randomised controlled trial |
| Jenkins 1976 | Population: adults |
| Johnsen 1992 | Population: adults |
| Natour 2002 | Population: adults |
| Reicher 1969 | Allocation: not a randomised controlled trial |
| Sadowska‐Wroblewska 1980 | Population: adults |
Differences between protocol and review
We did not consider studies with fewer than 10 participants per treatment arm for inclusion in this review, as is standard practice for this group.
Data were insufficient for pooled analyses comparing one drug to another, so we chose to do a post hoc analysis using the randomised cohorts of NSAIDs to calculate the mean response rate for any NSAID at any dose.
Contributions of authors
TC and CE registered the title.
TC, Phil Wiffen, and CE wrote the template protocol for the suite of children's reviews of which this review is a part.
All authors contributed to writing the protocol, and all authors agreed on the final version.
All authors were responsible for data extraction, analysis, and writing of the Discussion for the full review.
All authors will be responsible for the completion of updates.
Sources of support
Internal sources
No sources of support supplied
External sources
-
National Institute for Health Research (NIHR), UK.
NIHR Programme Grant, Award Reference Number: 13/89/29 (Addressing the unmet need of chronic pain: providing the evidence for treatments of pain)
Declarations of interest
CE: none known. Since CE is an author as well as the PaPaS Co‐ordinating Editor at the time of writing, we acknowledge the input of Andrew Moore who acted as Sign Off Editor for this review. CE had no input into the editorial decisions or processes for this review.
TC: none known.
BA: none known; BA is a specialist anaesthetist and intensive care physician and manages the perioperative care of children requiring surgery and those critically ill requiring intensive care.
EF: none known.
NW: none known; NW is a specialist paediatric rheumatologist and treats patients with chronic pain.
Stable (no update expected for reasons given in 'What's new')
References
References to studies included in this review
Bhettay 1978 {published data only}
- Bhettay E, Thomson AJG. Double‐blind study of ketoprofen and indomethacin in juvenile chronic arthritis. South African Medical Journal 1978;54(7):276‐8. [PubMed] [Google Scholar]
Brewer 1982 {published data only}
- Brewer EJ, Giannini EH, Baum J. Aspirin and fenoprofen (Nalfon) in the treatment of juvenile rheumatoid arthritis results of the double blind‐trial. A segment II study. Journal of Rheumatology 1982;9(1):123‐8. [PubMed] [Google Scholar]
Foeldvari 2009 {published data only}
- Foeldvari I, Szer IS, Zemel LS, Lovell DJ, Giannini EH, Robbins JL, et al. A prospective study comparing celecoxib with naproxen in children with juvenile rheumatoid arthritis. Journal of Rheumatology 2009;36(1):174‐82. [DOI] [PubMed] [Google Scholar]
Giannini 1990 {published data only}
- Giannini EH, Brewer EJ, Miller M L, Gibbas D, Passo MH, Hoyeraal HM. Ibuprofen suspension in the treatment of juvenile rheumatoid arthritis. Journal of Pediatrics 1990;117(4):645‐52. [DOI] [PubMed] [Google Scholar]
Moran 1979 {published data only}
- Moran H, Ansell BM, Hanna B. Naproxen in juvenile chronic polyarthritis. European Journal of Rheumatology and Inflammation 1979;2(1):79‐83. [DOI] [PMC free article] [PubMed] [Google Scholar]
Reiff 2006 {published data only}
- Reiff A, Lovell DJ, Adelsberg J, Kiss MHB, Goodman S, Zavaler MF, et al. Evaluation of the comparative efficacy and tolerability of rofecoxib and naproxen in children and adolescents with juvenile rheumatoid arthritis: a 12‐week randomized controlled clinical trial with a 52‐week open‐label extension. Journal of Rheumatology 2006;33(5):985‐95. [PubMed] [Google Scholar]
Ruperto 2005 {published data only}
- Ruperto N, Nikishina I, Pachanov ED, Shachbazian Y, Prieur AM, Mouy R, et al. A randomized, double‐blind clinical trial of two doses of meloxicam compared with naproxen in children with juvenile idiopathic arthritis. Arthritis & Rheumatism 2005;52(2):563‐72. [DOI] [PubMed] [Google Scholar]
References to studies excluded from this review
Coutinho 1976 {published data only}
- Coutinho A, Bonello J, Carvalho PC. A double‐blind comparative study of the analgesic effects of fenbufen, codeine, aspirin, propoxyphene and placebo. Current Therapeutic Research, Clinical and Experimental 1976;19(1):58‐65. [PubMed] [Google Scholar]
Girschick 1999 {published data only}
- Girschick HJ, Seyberth HW, Huppertz HI. Treatment of childhood hypophosphatasia with nonsteroidal antiinflammatory drugs. Bone 1999;25(5):603‐7. [DOI] [PubMed] [Google Scholar]
Jenkins 1976 {published data only}
- Jenkins DG, Ebbutt AF, Evans CD. Tofranil in the treatment of low back pain. Journal of International Medical Research 1976;4(2 Suppl):28‐40. [PubMed] [Google Scholar]
Johnsen 1992 {published data only}
- Johnsen V, Brun JG, Fjeld E, Hansen K, Sydnes OA, Ugstad MB. Morning stiffness and nighttime pain in ankylosing spondylitis. A comparison between enteric‐coated and plain naproxen tablets. European Journal of Rheumatology and Inflammation 1992;12(2):37‐42. [PubMed] [Google Scholar]
Natour 2002 {published data only}
- Natour J, Puertas EB, Radu AS, Freire M, Bonfigliolo R, Schincaroil NRB, et al. Loxoprofen in the treatment of low back pain ‐ clinical efficacy and safety in comparison to diclofenac. Revista Brasileira de Medicina 2002;59(3):161‐70. [Google Scholar]
Reicher 1969 {published data only}
- Reicher E, Reipert D, Kowalczewska J. Results of the treatment of juvenile rheumatoid arthritis with indomethacine. Polskie Archiwum Medycyny Wewnętrznej 1969;42(1):105‐12. [PubMed] [Google Scholar]
Sadowska‐Wroblewska 1980 {published data only}
- Sadowska‐Wroblewska M, Garwolinska H, Filipovicz‐Sosnowska A. Azapropazone versus indomethacin in a double blind test with patients with ankylosing spondylitis [Azapropazon versus indometacin im doppelblindversuch bei patienten mit spondylitis ankylosans]. Zeitschrift fur Rheumatologie 1980;39:11‐2. [PubMed] [Google Scholar]
Additional references
AMA 2013
- American Medical Association. Pediatric pain management. https://www.ama‐assn.org/ (accessed 25 January 2016).
AUREF 2012
- Cochrane Pain, Palliative and Supportive Care Group. PaPaS author and referee guidance. papas.cochrane.org/papas‐documents (accessed 16 July 2016).
Blanca‐Lopez 2015
- Blanca‐López N, Cornejo‐García JA, Plaza‐Serón MC, Doña I, Torres‐Jaén MJ, Canto G, et al. Hypersensitivity to nonsteroidal anti‐inflammatory drugs in children and adolescents: cross‐intolerance reactions. Journal of Investigational Allergology & Clinical Immunology 2015;25(4):259‐69. [PubMed] [Google Scholar]
BNF 2016
- Joint Formulary Committee. British National Formulary. London (UK): BMJ Group and Pharmaceutical Press, 2016. [Google Scholar]
Caes 2016
- Caes L, Boemer KE, Chambers CT, Campbell‐Yeo M, Stinson J, Birnie KA, et al. A comprehensive categorical and bibliometric analysis of published research articles on pediatric pain from 1975 to 2010. Pain 2016;157(2):302‐13. [DOI: 10.1097/j.pain.0000000000000403] [DOI] [PubMed] [Google Scholar]
Calvo 2012
- Calvo M, Dawes JM, Bennett DL. The role of the immune system in the generation of neuropathic pain. Lancet Neurology 2012;11(7):629‐42. [DOI: 10.1016/S1474-4422(12)70134-5] [DOI] [PubMed] [Google Scholar]
Cooper 2017a
- Cooper TE, Fisher E, Gray A, Krane E, Sethna NF, Tilburg M, et al. Opioids for chronic non‐cancer pain in children and adolescents. Cochrane Database of Systematic Reviews 2017, Issue 7. [DOI: 10.1002/14651858.CD012538.pub2] [DOI] [PMC free article] [PubMed] [Google Scholar]
Cooper 2017b
- Cooper TE, Heathcote L, Clinch J, Gold J, Howard R, Lord S, et al. Antidepressants for chronic non‐cancer pain in children and adolescents. Cochrane Database of Systematic Reviews 2017, Issue 8. [DOI: 10.1002/14651858.CD012535.pub2] [DOI] [PMC free article] [PubMed] [Google Scholar]
Cooper 2017c
- Cooper TE, Heathcote L, Anderson B, Gregoire MC, Ljungman G, Eccleston C. Non‐steroidal anti‐inflammatory drugs (NSAIDs) for cancer‐related pain in children and adolescents. Cochrane Database of Systematic Reviews 2017, Issue 7. [DOI: 10.1002/14651858.CD012563.pub2] [DOI] [PMC free article] [PubMed] [Google Scholar]
Cooper 2017d
- Cooper TE, Fisher E, Anderson B, Wilkinson N, Williams G, Eccleston C. Paracetamol (acetaminophen) for chronic non‐cancer pain in children and adolescents. Cochrane Database of Systematic Reviews 2017, Issue 8. [DOI: 10.1002/14651858.CD012539.pub2] [DOI] [PMC free article] [PubMed] [Google Scholar]
Dechartres 2013
- Dechartres A, Trinquart L, Boutron I, Ravaud P. Influence of trial sample size on treatment effect estimates: meta‐epidemiological study. BMJ 2013;346:f2304. [DOI: 10.1136/bmj.f2304] [DOI] [PMC free article] [PubMed] [Google Scholar]
Dechartres 2014
- Dechartres A, Altman DG, Trinquart L, Boutron I, Ravaud P. Association between analytic strategy and estimates of treatment outcomes in meta‐analyses. JAMA 2014;312:623‐30. [DOI: 10.1001/jama.2014.8166] [DOI] [PubMed] [Google Scholar]
Dworkin 2008
- Dworkin RH, Turk DC, Wyrwich KW, Beaton D, Cleeland CS, Farrar JT, et al. Interpreting the clinical importance of treatment outcomes in chronic pain clinical trials: IMMPACT recommendations. Journal of Pain 2008;9(2):105‐21. [DOI: 10.1016/j.jpain.2007.09.005] [DOI] [PubMed] [Google Scholar]
Eccleston 2003
- Eccleston C, Malleson PM. Management of chronic pain in children and adolescents (editorial). BMJ 2003;326:1408‐9. [DOI] [PMC free article] [PubMed] [Google Scholar]
Guyatt 2008
- Guyatt GH, Oxman AD, Vist GE, Kunz R, Falck‐Ytter Y, Alonso‐Coello P, et al. GRADE: an emerging consensus on rating quality of evidence and strength of recommendations. BMJ 2008;336:924‐6. [DOI: 10.1136/bmj.39489.470347.AD] [DOI] [PMC free article] [PubMed] [Google Scholar]
Guyatt 2011
- Guyatt G, Oxman AD, Akl EA, Kunz R, Vist G, Brozek J, et al. GRADE guidelines: 1. Introduction ‐ GRADE evidence profiles and summary of findings tables. Journal of Clinical Epidemiology 2011;64:383‐94. [DOI: 10.1016/j.jclinepi.2010.04.026] [DOI] [PubMed] [Google Scholar]
Guyatt 2013a
- Guyatt G, Oxman AD, Sultan S, Brozek J, Glasziou P, Alonso‐Coelle P, et al. Making an overall rating of the confidence in effect estimates for a single outcome and for all outcomes. Journal of Clinical Epidemiology 2013;66(2):151‐7. [DOI: 10.1016/j.jclinepi.2012.01.006] [DOI] [PubMed] [Google Scholar]
Guyatt 2013b
- Guyatt GH, Oxman AD, Santesso N, Helfand M, Vist G, Kunz R, et al. GRADE guidelines: 12. Preparing summary of findings tables ‐ binary outcomes. Journal of Clinical Epidemiology 2013;66(2):158‐72. [DOI: 10.1016/j.jclinepi.2012.01.012] [DOI] [PubMed] [Google Scholar]
Hasnie 2007
- Hasnie FS, Breuer J, Parker S, Wallace V, Blackbeard J, Lever I, et al. Further characterization of a rat model of varicella zoster virus‐associated pain: relationship between mechanical hypersensitivity and anxiety‐related behavior, and the influence of analgesic drugs. Neuroscience 2007;144(4):1495‐508. [DOI: 10.1016/j.neuroscience.2006.11.029] [DOI] [PMC free article] [PubMed] [Google Scholar]
Higgins 2011
- Higgins JPT, Green S (editors). Cochrane Handbook for Systematic Reviews of Interventions Version 5.1.0 (updated March 2011). The Cochrane Collaboration, 2011. Available from handbook.cochrane.org. The Cochrane Collaboration.
Hoffman 2010
- Hoffman DL, Sadosky A, Dukes EM, Alvir J. How do changes in pain severity levels correspond to changes in health status and function in patients with painful diabetic peripheral neuropathy?. Pain 2010;149(2):194‐201. [DOI: 10.1016/j.pain.2009.09.017] [DOI] [PubMed] [Google Scholar]
Kawakami 2002
- Kawakami M, Matsumoto T, Hashizume H, Kuribayashi K, Tamaki T. Epidural injection of cyclooxygenase‐2 inhibitor attenuates pain‐related behavior following application of nucleus pulposus to the nerve root in the rat. Journal of Orthopaedic Research 2002;20(2):376‐81. [DOI: 10.1016/S0736-0266(01)00114-0] [DOI] [PubMed] [Google Scholar]
L'Abbé 1987
- L'Abbé KA, Detsky AS, O'Rourke K. Meta‐analysis in clinical research. Annals of Internal Medicine 1987;107:224‐33. [DOI] [PubMed] [Google Scholar]
Lesko 1995
- Lesko SM, Mitchell AA. An assessment of the safety of pediatric ibuprofen. JAMA 1995;273(12):929‐33. [PubMed] [Google Scholar]
Lesko 1997
- Lesko SM, Mitchell AA. Renal function after short‐term ibuprofen use in infants and children. Pediatrics 1997;100(6):954‐7. [DOI] [PubMed] [Google Scholar]
Lesko 1999
- Lesko SM, Mitchell AA. The safety of acetaminophen and ibuprofen among children younger than two years old. Pediatrics 1999;104(4):e39. [DOI] [PubMed] [Google Scholar]
McQuay 1998
- McQuay H, Moore R. An Evidence‐based Resource for Pain Relief. Oxford (UK): Oxford University Press, 1998. [Google Scholar]
Misurac 2013
- Misurac JM, Knoderer CA, Leiser JD, Nailsecu C, Wilson AC, Andreoli SP. Nonsteroidal anti‐inflammatory drugs are an important cause of acute kidney injury in children. Journal of Pediatrics 2013;6:1153‐9 e.1. [DOI: 10.1016/j.jpeds.2012.11.069] [DOI] [PubMed] [Google Scholar]
Moher 2009
- Moher D, Liberati A, Tetzlaff J, Altman DG, the PRISMA Group. Preferred reporting items for systematic reviews and meta‐analyses: the PRISMA statement. PLoS Medicine 2009;6(7):e1000097. [DOI] [PMC free article] [PubMed] [Google Scholar]
Moore 2008
- Moore RA, Barden J, Derry S, McQuay HJ. Managing potential publication bias. In: McQuay HJ, Kalso E, Moore RA editor(s). Systematic Reviews in Pain Research: Methodology Refined. Seattle (WA): IASP Press, 2008:15‐24. [ISBN: 978‐0‐931092‐69‐5] [Google Scholar]
Moore 2009
- Moore RA, Straube S, Wiffen PJ, Derry S, McQuay HJ. Pregabalin for acute and chronic pain in adults. Cochrane Database of Systematic Reviews 2009, Issue 3. [DOI: 10.1002/14651858.CD007076.pub2] [DOI] [PMC free article] [PubMed] [Google Scholar]
Moore 2010a
- Moore RA, Eccleston C, Derry S, Wiffen P, Bell RF, Straube S, et al. "Evidence" in chronic pain ‐ establishing best practice in the reporting of systematic reviews. Pain 2010;150(3):386‐9. [DOI: 10.1016/j.pain.2010.05.011] [DOI] [PubMed] [Google Scholar]
Moore 2010b
- Moore RA, Straube S, Paine J, Phillips CJ, Derry S, McQuay HJ. Fibromyalgia: moderate and substantial pain intensity reduction predicts improvement in other outcomes and substantial quality of life gain. Pain 2010;149(2):360‐4. [DOI] [PubMed] [Google Scholar]
Moore 2010c
- Moore RA, Moore OA, Derry S, Peloso PM, Gammaitoni AR, Wang H. Responder analysis for pain relief and numbers needed to treat in a meta‐analysis of etoricoxib osteoarthritis trials: bridging a gap between clinical trials and clinical practice. Annals of the Rheumatic Diseases 2010;69(2):374‐9. [DOI: 10.1136/ard.2009.107805] [DOI] [PMC free article] [PubMed] [Google Scholar]
Moore 2010d
- Moore RA, Smugar SS, Wang H, Peloso PM, Gammaitoni A. Numbers‐needed‐to‐treat analyses ‐ do timing, dropouts, and outcome matter? Pooled analysis of two randomized, placebo‐controlled chronic low back pain trials. Pain 2010;151(3):592‐7. [DOI: 10.1016/j.pain.2010.07.2013] [DOI] [PubMed] [Google Scholar]
Moore 2010e
- Moore RA, Derry S, McQuay HJ, Straube S, Aldington D, Wiffen P, et al. ACTINPAIN writing group of the IASP Special Interest Group (SIG) on Systematic Reviews in Pain Relief. Clinical effectiveness: an approach to clinical trial design more relevant to clinical practice, acknowledging the importance of individual differences. Pain 2010;149:173‐6. [PUBMED: 19748185] [DOI] [PubMed] [Google Scholar]
Moore 2011a
- Moore RA, Straube S, Paine J, Derry S, McQuay HJ. Minimum efficacy criteria for comparisons between treatments using individual patient meta‐analysis of acute pain trials: examples of etoricoxib, paracetamol, ibuprofen, and ibuprofen/paracetamol combinations after third molar extraction. Pain 2011;152(5):982‐9. [DOI: 10.1016/j.pain.2010.11.030] [DOI] [PubMed] [Google Scholar]
Moore 2011b
- Moore RA, Mhuircheartaigh RJ, Derry S, McQuay HJ. Mean analgesic consumption is inappropriate for testing analgesic efficacy in post‐operative pain: analysis and alternative suggestion. European Journal of Anaesthesiology 2011;28(6):427‐32. [DOI: 10.1097/EJA.0b013e328343c569] [DOI] [PubMed] [Google Scholar]
Moore 2012
- Moore RA, Straube S, Eccleston C, Derry S, Aldington D, Wiffen P, et al. Estimate at your peril: imputation methods for patient withdrawal can bias efficacy outcomes in chronic pain trials using responder analyses. Pain 2012;153(2):265‐8. [DOI: 10.1016/j.pain.2011.10.004] [DOI] [PubMed] [Google Scholar]
Moore 2013a
- Moore RA, Straube S, Aldington D. Pain measures and cut‐offs ‐ 'no worse than mild pain' as a simple, universal outcome. Anaesthesia 2013;68(4):400‐12. [DOI: 10.1111/anae.12148] [DOI] [PubMed] [Google Scholar]
Moore 2013b
- Moore A, Derry S, Eccleston C, Kalso E. Expect analgesic failure; pursue analgesic success. BMJ 2013;346:f2690. [DOI: 10.1136/bmj.f2690] [DOI] [PubMed] [Google Scholar]
Moore 2014a
- Moore RA, Derry S, Taylor RS, Straube S, Phillips CJ. The costs and consequences of adequately managed chronic non‐cancer pain and chronic neuropathic pain. Pain Practice 2014;14(1):79‐94. [DOI] [PubMed] [Google Scholar]
Moore 2014b
- Moore RA, Cai N, Skljarevski V, Tölle TR. Duloxetine use in chronic painful conditions ‐ individual patient data responder analysis. European Journal of Pain 2014;18(1):67‐75. [DOI: 10.1002/j.1532-2149.2013.00341.x] [DOI] [PMC free article] [PubMed] [Google Scholar]
NICE 2015
- National Institute of Health and Care Excellence (NICE). Guidance ‐ sickle cell acute painful episode. https://www.nice.org.uk/guidance/cg143/evidence/full‐guideline‐pdf‐186634333 (accessed 7 September 2015).
Nüesch 2010
- Nüesch E, Trelle S, Reichenbach S, Rutjes AW, Tschannen B, Altman DG, et al. Small study effects in meta‐analyses of osteoarthritis trials: meta‐epidemiological study. BMJ 2010;341:c3515. [DOI: 10.1136/bmj.c3515] [DOI] [PMC free article] [PubMed] [Google Scholar]
O'Brien 2010
- O'Brien EM, Staud RM, Hassinger AD, McCulloch RC, Craggs JG, Atchinson JW, et al. Patient‐centered perspective on treatment outcomes in chronic pain. Pain Medicine 2010;11(1):6‐15. [DOI: 10.1111/j.1526-4637.2009.00685.x] [DOI] [PubMed] [Google Scholar]
PedIMMPACT 2008
- McGrath PJ, Walco GA, Turk DC, Dworking RH, Brown MT, Davidson K, et al. Core outcome domains and measures for pediatric acute and chronic/recurrent pain clinical trials: PedIMMPACT. Journal of Pain 2008;9(9):771‐83. [DOI] [PubMed] [Google Scholar]
RevMan 2014 [Computer program]
- Nordic Cochrane Centre, The Cochrane Collaboration. Review Manager (RevMan). Version 5.3. Copenhagen: Nordic Cochrane Centre, The Cochrane Collaboration, 2014.
Ripamonti 2008
- Ripamonti C, Bandieri E. Pain therapy. Critical Reviews in Oncology/Hematology 2008;70:145‐59. [DOI: 10.1016/j.critrevonc.2008.12.005] [DOI] [PubMed] [Google Scholar]
Stinson 2006
- Stinson JN, Kavanagh T, Yamada J, Gill N, Stevens B. Systematic review of the psychometric properties, interpretability and feasibility of self‐report pain intensity measures for use in clinical trials in children and adolescents. Pain 2006;125(1‐2):143‐57. [DOI: 10.1016/j.pain.2006.05.006] [DOI] [PubMed] [Google Scholar]
Straube 2008
- Straube S, Derry S, McQuay HJ, Moore RA. Enriched enrolment: definition and effects of enrichment and dose in trials of pregabalin and gabapentin in neuropathic pain. A systematic review. British Journal of Clinical Pharmacology 2008;66(2):266‐75. [DOI: 10.1111/j.1365-2125.2008.03200.x] [DOI] [PMC free article] [PubMed] [Google Scholar]
Straube 2010
- Straube S, Derry S, Moore RA, Paine J, McQuay HJ. Pregabalin in fibromyalgia ‐ responder analysis from individual patient data. BMC Musculoskeletal Disorders 2010;11:150. [DOI: 10.1186/1471-2474-11-150] [DOI] [PMC free article] [PubMed] [Google Scholar]
Sultan 2008
- Sultan A, Gaskell H, Derry S, Moore RA. Duloxetine for painful diabetic neuropathy and fibromyalgia pain: systematic review of randomised trials. BMC Neurology 2008;8:29. [DOI: 10.1186/1471-2377-8-29] [DOI] [PMC free article] [PubMed] [Google Scholar]
Thorlund 2011
- Thorlund K, Imberger G, Walsh M, Chu R, Gluud C, Wetterslev J, et al. The number of patients and events required to limit the risk of overestimation of intervention effects in meta‐analysis ‐ a simulation study. PLoS ONE 2011;6(10):e25491. [DOI: 10.1371/journal.pone.0025491] [DOI] [PMC free article] [PubMed] [Google Scholar]
United Nations 2015
- United Nations. World population prospects 2015 ‐ population indicators. esa.un.org/unpd/wpp/Download/Standard/Population/ (accessed 29 February 2016).
Vo 2009
- Vo T, Rice ASC, Dworkin RH. Non‐steroidal anti‐inflammatory drugs for neuropathic pain: How do we explain continued widespread use?. Pain 2009;143(3):169‐71. [DOI: 10.1016/j.pain.2009.03.013] [DOI] [PubMed] [Google Scholar]
von Baeyer 2007
- Baeyer CL, Spagrud LJ. Systematic review of observational (behavioural) measures of pain for children and adolescents aged 3 to 18 years. Pain 2007;127(1‐2):140‐50. [DOI: 10.1016/j.pain.2006.08.014] [DOI] [PubMed] [Google Scholar]
WHO 2012
- World Health Organization. WHO Guidelines on the Pharmacological Treatment of Persisting Pain in Children with Medical Illnesses. Geneva: WHO Press, World Health Organization, 2012. [ISBN 978 92 4 154812 0] [PubMed] [Google Scholar]
Wiffen 2017a
- Wiffen P, Cooper T, Anderson AK, Gray A, Gregoire MC, Ljungman G, et al. Opioids for cancer‐related pain in children and adolescents. Cochrane Database of Systematic Reviews 2017, Issue 7. [DOI: 10.1002/14651858.CD012564.pub2] [DOI] [PMC free article] [PubMed] [Google Scholar]
Wiffen 2017b
- Wiffen PJ, Cooper TE, Heathcote L, Clinch J, Howard R, Krane E, et al. Antiepileptic drugs for chronic non‐cancer pain in children and adolescents. Cochrane Database of Systematic Reviews 2017, Issue 8. [DOI: 10.1002/14651858.CD012536.pub2] [DOI] [PMC free article] [PubMed] [Google Scholar]
World Bank 2014
- World Bank. Data ‐ population ages 0‐14 (% of total). data.worldbank.org/indicator/SP.POP.0014.TO.ZS (accessed 29 February 2016).