

Abstract
Background
Chemotherapy is an effective treatment with good clinical response in patients with cancer. However, it can cause exacerbated toxicities in patients and consequently change the course of treatment. Some factors may interfere with this toxicity such as body composition, especially in gastrointestinal cancer. The aim of this study was to evaluate the effects of body composition, nutritional status, and functional capacity scale in predicting the occurrence of toxicities in gastrointestinal cancer patients during chemotherapy treatment.
Methods
This is a prospective study with gastrointestinal cancer patients at the beginning of chemotherapy treatment. Sarcopenia and muscle attenuation were assessed using the skeletal muscle index from computerized tomography by measuring cross‐sectional areas of the L3 tissue (cm2/m2). Cachexia was graded according to involuntary weight loss associated with sarcopenia. Nutritional status was assessed by using anthropometric evaluation and Patient‐Generated Subjective Global Assessment. Functional capacity was evaluated by handgrip strength and Eastern Cooperative Oncology Group (ECOG) Performance Status scale. Haematological gastrointestinal and dose‐limiting toxicities (DLTs) were defined according to National Cancer Institute Common Toxicity Criteria. The associations among sarcopenia, cachexia, nutritional status, and functional capacity with DLT were assessed by univariate and multivariate Cox regression model.
Results
A total of 60 patients were evaluated (55% male, 60.9 ± 14.0 years) and followed up for a mean of 55 days. Most patients had normal weight (44.2%) and good ECOG Performance Status (≤1) at baseline (78%). During the chemotherapy period, the most prevalent toxicities were diarrhoea, nausea, and anorexia, but the presence of DLT was similar between cycles (P > 0.05). Cachexia was associated with a higher toxicity manifested by diarrhoea (P = 0.02), nausea (P = 0.02), and anorexia (P < 0.01 and P = 0.03 at Cycles 1 and 2, respectively). Sarcopenic and cachetic individuals experienced more toxicities and DLT during chemotherapy. The only factors associated with DLT in the multivariate Cox regression analyses including the presence of metastasis and the chemotherapy protocol were cachexia and the ECOG scale (P < 0.001 for both).
Conclusions
Cachexia and ECOG score may identify patients with an increased risk for developing severe toxicity events during chemotherapy treatment for gastrointestinal cancer.
Keywords: Sarcopenia, Cachexia, Muscle attenuation, Chemotherapy toxicity, Nutritional status, Gastrointestinal cancer
Introduction
Cancer is one of main causes of morbidity and mortality worldwide with 8.2 million deaths annually in the world.1 In Brazil, 600 000 new cases are predicted to occur in 2018, and gastrointestinal cancer is still one of the leading causes of cancer‐related death in cancer diagnosed patients.2 Gastrointestinal cancers are highly prevalent in the population, being associated with elevated rates of malnutrition—almost 80%3—and negative clinical outcomes such as poor chemotherapy tolerance (increase toxicity occurrence, surgical complications, postoperative complications, increased risk of infection and longer hospitalization, and lower overall survival).4, 5
Gastrointestinal cancer treatment includes different strategies including surgery, chemotherapy, and radiation therapy.6 Specifically, there is great heterogeneity in the ability of adults with cancer to tolerate chemotherapy.7 Differences in body composition have been frequently related in studies, and a probable explanation for toxicities is based on pharmacokinetics of dosing chemotherapy when calculated using body surface area parameters of fat‐free mass, which really represents the distribution volume of cytotoxic chemotherapy drugs.8 The presence of sarcopenia that requires low muscle mass as well as evidence of low muscle strength or physical performance,9 is believed to be associated with higher chemotoxicity.4, 10, 11, 12, 13 However, most of the studies which have evaluated the associations between body composition and toxicity are retrospective studies and did not include other conditions associated with muscle mass loss such as the presence of cachexia, or muscle attenuation.6, 10, 11, 14 Additionally, in the majority of the studies with cancer patients, sarcopenia is defined as low muscle mass assessed using computed tomography (CT) images without other muscle function parameters.
Other common condition in cancer patients is cachexia, recognized by previous studies9, 13 as a multifactorial and often irreversible syndrome characterized by inflammation and loss of muscle with or without the loss of fat mass leading to progressive functional impairment.15 Another characteristic of cachexia would be involuntary weight loss in the absence of simple starvation,15 and this assessment may be difficult in clinical practice,16 especially for investigation in retrospective studies. Once sarcopenia can be one of the elements of the proposed definition for cachexia, most cachectic individuals are also sarcopenic, but the occurrence is dependent on the patient response to tumour progression, including the activation of the inflammatory response and energetic inefficiency involving the mitochondria.17
In addition to sarcopenia and cachexia, other factors such as muscle attenuation have been shown to independently predict toxicity in gastrointestinal cancer.18, 19 Although some studies have shown an association between performance status and nutritional screening tools in the prognosis of oncology patients,20, 21, 22 the studies did not show associations of these parameters with toxicities during chemotherapy. Thus, this study aimed to investigate which parameter of body composition, namely, low muscle mass or muscle attenuation, the presence of cachexia, nutritional status, or functional capacity, better predicts toxicity during chemotherapy in gastrointestinal cancer.
Methods
Design and subjects
A single‐centre prospective study was conducted in a primary care hospital—Liga Norteriograndense Contra o Câncer, Brazil. The patients were recruited from January to December 2017. The study protocol was approved by the Human Research Ethics Committee at UFRN (Protocol No. 1.953.759 CAAE 64765517.0.0000.5292). Inclusion criteria were histopathological gastrointestinal cancer diagnosis, CT exam performed 30 days before the start of chemotherapy, no prior chemotherapy and adequate bone marrow reserve. Exclusion criteria were the presence of other diseases which cause a decrease in muscle mass and performance status by the Eastern Cooperative Oncology Group Performance Status (ECOG‐PS) ≥ 3 at the beginning of chemotherapy. Sample size was calculated according to a previous study that evaluated the association between sarcopenia and dose‐limiting toxicity (DLT) during one cycle of chemotherapy in 72 resectable oesophageal cancer patients18 with a power of 80% and an alpha of 0.05 (G*Power®, version 3.1.9.2; Institute for Experimental Psychology in Dusseldorf, Germany).
Procedures
All eligible patients were asked about their interest in participating in the study. After verbal acceptance and signing an informed consent form, the subjects were submitted to an initial assessment performed during diagnosis and staging of the disease, including body composition by CT scan before starting the first chemotherapy cycle.
Clinical and pathological data were obtained from the electronic records at the Hospital: demographic and clinical data such as age, gender, primary tumour site, histological type, chemotherapy regimens used, and ECOG‐PS.
Patients were followed for three chemotherapy cycles regardless of the duration of each cycle, which was established by the physician according to the recommendations for each cancer type. The goal of chemotherapy, for these patients, was to reduce the tumour size before surgery (21 patients with neoadjuvant chemotherapy), reduce the chance of spreading after surgery (27 patients with adjuvant chemotherapy), or palliative chemotherapy (12 patients). The patients had their nutritional and functional assessment evaluated on the first day of each cycle. Gastrointestinal toxicity was evaluated up to 72 h at the beginning of each cycle by medical record or phone contact. Haematological toxicity was assessed through the biochemical data available in the medical record and collected before the start of the next chemotherapy cycle.
Nutritional, functional, and body composition assessment
Body mass index (BMI) was calculated from height and weight. Then, patients were classified as underweight, normal weight, overweight, or obese according to WHO.23 Nutritional status was evaluated by the Patient‐Generated Subjective Global Assessment (PG‐SGA). Patients classified as A were considered well nourished, while patients classified as B and C were considered malnourished.24 Cachexia was classified according the parameters proposed by Fearon15: involuntary weight loss >5% over the last 6 months in the absence of simple starvation; weight loss >2% with a BMI < 20 kg/m2; or weight loss >2% with low skeletal muscle index (SMI).
Functional capacity was assessed at the beginning of each chemotherapy cycle by handgrip strength and by the ECOG‐PS, and low functional capacity was defined as ECOG‐PS ≥ 2.25 Handgrip strength (kg) was measured using a dynamometer (Jamar®) with the dominant hand. The patients kept their hand on a table with their elbow maintained at 90°, and they were asked to squeeze the dynamometer handle at maximum strength for at least 3 s for diagnosing dynapenia (handgrip strength <30 and <20 kg for male and female patients, respectively).9
CT scans were evaluated for muscle mass analysis. Skeletal muscle area was measured on axial CT images26 at the level of the third lumbar vertebra (L3) using appropriate software (Slice O'Matic, Tomovision, CA).27 Skeletal muscle was normalized for height to obtain the SMI (cm2/m2). Low muscularity and low muscle attenuation were defined according to the cut‐off point proposed by Martin et al.28 adjusted by gender and BMI. All patients with low muscularity by CT scan analysis plus dynapenia were considered sarcopenic.
Toxicity assessment and dose limiting
Toxicity was graded according to the National Cancer Institute Common Toxicity Criteria, version 5.029 in four grades, with Grades 3 and 4 being indicative of severe toxicity. Toxicity groups were defined as (i) gastrointestinal toxicity, which included changes such as nausea, constipation, diarrhoea, anorexia, abdominal pain, gastritis, dysphagia, xerostomia, reflux, vomiting, mucositis, and weight loss; and (ii) haematological toxicity, which included changes such as anaemia, leucopenia, neutropenia, thrombocytopenia, and renal function.
Toxicity data were obtained after each chemotherapy cycle, as previously described. The DLT was defined as the need to reduce the drug dose, to delay, or definitively to discontinue the protocol. Patient toxicity assessments were obtained after each chemotherapy cycle (1, 2, and 3). The analysis compares rates of Grade 3/4 toxicity (serious toxicity) and DLT defined for drug dose reduction, delay, or definitive interruption with sarcopenia and cachexia.
Statistical analysis
Statistical procedures were performed using SPSS for Win/v.20.0 (Statistical Package for Social Sciences, Chicago, IL, USA). Data normality was verified by the Kolmogorov–Smirnov test, asymmetry, and kurtosis. Parametric descriptive data were presented in mean and standard deviation (SD), and categorical data were demonstrated as counts and percentages. Comparisons between categorical variables were tested using chi‐squared test or Fisher's exact test. Cox regression models were used to assess hazard ratios (HR) for DLT, after adjustment for presence of metastasis and protocol of chemotherapy. The significance level was adopted at P < 0.05.
Results
A total of 84 patients with a gastrointestinal cancer were initially screened in a single centre in Brazil from March 2017 to February 2018. Therefore, 60 patients were enrolled in this study. Figure 1 summarizes the follow‐up of study volunteers.
Figure 1.
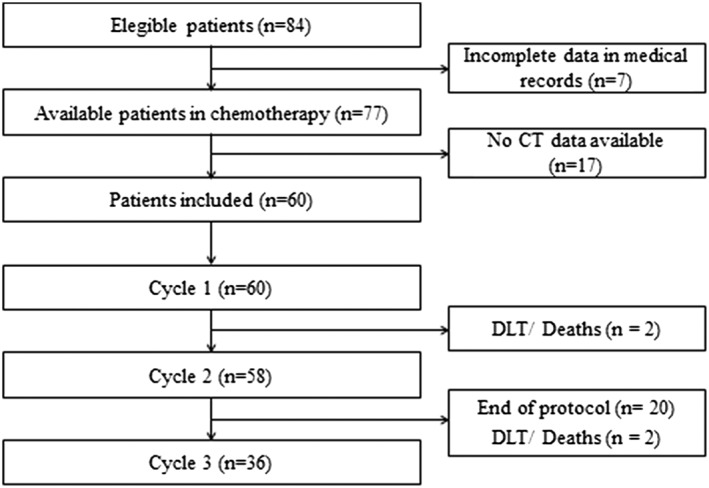
Flow diagram of patient recruitment and follow‐up. CT, computed tomography; DLT, dose‐limiting toxicity.
Table 1 describes the baseline demographic characteristics of the patients, chemotherapy regimens, and nutritional characteristics. The majority of patients was male (55%), with a mean age of 60 years. Colorectal cancer was most prevalent representing almost half of the population, followed by gastric cancer. Furthermore, even if the majority of patients had normal weight, 55% met the criteria for cachexia and almost 24% were sarcopenic (low muscle mass plus dynapenia). Of total cachectic patients (n = 33), all had weight loss higher than 5% over past 6 months, and 12 (about one third) also had low muscularity. Most patients had good performance status at the beginning of treatment (ECOG‐PS < 2), but four patients died during follow‐up (mean 55 days) due to high chemotherapy toxicity (neutropenic fever), with one occurring after finishing the third cycle.
Table 1.
Clinical and nutritional characteristics at baseline (n = 60)
| n (%) | Mean (SD) | |
|---|---|---|
| Age (years) | 60.9 (14.0) | |
| ≤60 years | 27 (45) | |
| >60 years | 33 (55) | |
| Gender | ||
| Female | 27 (45) | |
| Male | 33 (55) | |
| Ethnicity | ||
| Caucasian | 18 (30) | |
| Non‐Caucasian | 42 (70) | |
| Tumour site | ||
| Oesophageal | 6 (10.0) | |
| Gastric | 14 (23.3) | |
| Colon/rectum | 36 (60.0) | |
| Other gastrointestinal site (liver and pancreas) | 4 (6.7) | |
| Clinical TNM stage | ||
| II | 8 (13.3) | |
| III | 24 (40.0) | |
| IV | 28 (46.7) | |
| Treatment modalities | ||
| Chemotherapy | 12 (20.0) | |
| Chemotherapy + radiotherapya | 21 (35.0) | |
| Chemotherapy + surgery | 20 (33.3) | |
| Chemotherapy + radiotherapya + surgery | 7 (11.7) | |
| Chemotherapy protocol | ||
| 5FU + leucovorinb | 36 (46.7) | |
| FOLFOXc | 12 (15.6) | |
| Paclitaxel + carboplatind | 11 (14.3) | |
| Others | 4 (5.2) | |
| Height (m) | 1.60 (0.09) | |
| Weight (kg) | 61.5 (14.9) | |
| Body mass index (kg/m2) | 24.5 (5.7) | |
| Underweight | 6 (10.0) | |
| Normal weight | 26 (43.3) | |
| Overweight | 19 (31.7) | |
| Obese | 9 (15.0) | |
| Weight loss in 6 months (%) | 12.4 (8.8) | |
| Skeletal muscle index (cm2/m2) | ||
| Male | 53.5 (10.1) | |
| Female | 46.4 (8.4) | |
| Muscle attenuation (Hounsfield unit) | 37.8 (9.1) | |
| Low muscle attenuation | 30 (50.0) | |
| Sarcopenia | 14 (23.3) | |
| PG‐SGA | ||
| Nourished | 25 (41.7) | |
| Malnourished | 35 (58.3) | |
| ECOG‐PS scale | ||
| 0–1 | 47 (78.3) | |
| 2 | 13 (21.7) |
ECOG‐PS, Eastern Cooperative Oncology Group Performance Status; PG‐SGA, Patient‐Generated Subjective Global Assessment; TNM, Stage according to American Joint Committee on Cancer (AJCC) Cancer Staging Manual 7th edition.
Radiotherapy protocol: 50.4 Gy.
5FU (370 mg/m2) + leucovorin (50 mg/m2).
Folfox: Oxaliplatin 85 mg/m2 + leucovorin 400 mg/m2 + 5‐FU 400 mg/m2 + continuous 5‐FU 2.400 mg/m2 in 46 h.
Paclitaxel (50 mg/m2) + carboplatin (AUC 2).
The haematological and gastrointestinal toxicity frequencies and DLT are shown in Table 2. The most prevalent gastrointestinal toxicities in the present study were nausea, diarrhoea (Cycles 1, 2, and 3), abdominal pain (Cycle 1), and anorexia (Cycle 3). Neutropenia was the most incident toxicity among the haematological ones in Cycles 1 and 2. However, the same prevalence was observed for leukopenia, anaemia, and neutropenia in Cycle 3. No patient in the study presented thrombocytopenia or elevated creatinine. Malnutrition, detected by PG‐SGA, increased considerably during chemotherapy, identified as 58% of the patients malnourished in Cycle 1 and almost 86% in the last cycle. Dynapenia and ECOG‐PS status results also worsened during follow‐up.
Table 2.
Frequency of haematological and gastrointestinal toxicities and dose‐limiting toxicity during chemotherapy [n (%)]
| Variables | Cycle 1 (n = 60/100%) | Cycle 2 (n = 58/100%) | Cycle 3 (n = 36/100%) |
|---|---|---|---|
| Haematological toxicities | |||
| Anaemia | 3 (5.0) | 7 (12.1) | 4 (11.1) |
| Leukopenia | 4 (6.6) | 5 (8.6) | 2 (5.6) |
| Neutropenia | 7 (11.6) | 2 (3.5) | 2 (5.6) |
| Gastrointestinal toxicities | |||
| Nausea | 15 (25.0) | 8 (13.8) | 12 (33.3) |
| Constipation | 3 (5.0) | 2 (3.5) | 3 (8.3) |
| Diarrhoea | 8 (13.3) | 14 (24.1) | 6 (16.7) |
| Anorexia | 7 (11.6) | 11 (19.0) | 9 (25.0) |
| Abdominal pain | 14 (23.3) | 6 (10.3) | 4 (11.1) |
| Gastritis | 0 (0.0) | 0 (0.0) | 1 (2.8) |
| Dysphagia | 6 (10.0) | 3 (5.2) | 3 (8.3) |
| Dry mouth | 0 (0.0) | 0 (0.0) | 2 (5.6) |
| Reflux | 0 (0.0) | 1 (1.7) | 1 (2.8) |
| Vomiting | 3 (5.0) | 4 (6.9) | 1 (2.8) |
| Mucositis | 0 (0.0) | 0 (0.0) | 0 (0.0) |
| Weight loss | 0 (0.0) | 2 (3.5) | 0 (0.0) |
| Dose‐limiting toxicity | |||
| Present | 14 (23.3) | 12 (20.7) | 8 (22.2) |
Table 3 shows the association between sarcopenia, cachexia, and muscle attenuation with toxicities. Sarcopenia was associated with anorexia in Cycle 1 (P = 0.045) and nausea in Cycle 2 (P = 0.044). Patients with low muscle attenuation showed a significantly higher nausea toxicity in Cycle 1 (P = 0.031). Cachexia was associated with nausea (P = 0.02) in the first cycle. Self‐report toxicity anorexia was associated with cachexia in the first and second cycle (P = 0.001 and P = 0.026, respectively). Cachectic patients had significantly more DLT in all cycles. The relationship between biochemical adverse events and body composition showed an association between sarcopenia and leukopenia during chemotherapy (P = 0.036). Patients with sarcopenia, low muscle attenuation, and cachexia experienced more high‐grade toxicities during treatment. Details about the associations between sarcopenia, cachexia, low muscle attenuation, and dynapenia are available in Supporting Information.
Table 3.
Associations with toxicities and body composition during chemotherapy (n = 60)
| Cycle 1 | Cycle 2 | Cycle 3 | |||||||
|---|---|---|---|---|---|---|---|---|---|
| Variables | LMA (n = 30/50%) | Sarcopenia (n = 14/23.3%) | Cachexia (n = 33/55%) | LMA (n = 29/50%) | Sarcopenia (n = 13/22%) | Cachexia (n = 31/53.4%) | LMA (n = 22/61.1%) | Sarcopenia (n = 12/33.3%) | Cachexia (n = 24/66.7%) |
| Haematological | |||||||||
| Anaemia | 3 | 2 | 3 | 3 | 2 | 2 | 2 | 1 | 3 |
| Leukopenia | 2 | 3 b | 4 | 3 | 2 | 3 | 2 | 2 | 2 |
| Neutropenia | 3 | 3 | 6 | 3 | 1 | 4 | 1 | 0 | 0 |
| Gastrointestinal | |||||||||
| Diarrhoea | 5 | 1 | 7 | 8 | 2 | 8 | 4 | 1 | 5 |
| Abdominal pain | 7 | 4 | 8 | 4 | 3 | 5 | 2 | 2 | 4 |
| Nausea | 11 a | 6 | 12 a | 11 | 7 a | 13 | 8 | 6 | 10 |
| Anorexia | 6 | 4 a | 7 b | 5 | 4 | 9 a | 5 | 4 | 8 |
| Dysphagia | 2 | 3 | 3 | 2 | 0 | 3 | 2 | 2 | 3 |
| Vomiting | 2 | 0 | 3 | 3 | 1 | 3 | 1 | 0 | 1 |
| Constipation | 3 | 2 | 3 | 2 | 0 | 1 | 3 | 1 | 2 |
| Weight loss | 0 | 0 | 0 | 2 | 1 | 2 | 0 | 0 | 0 |
| Dry mouth | 0 | 0 | 0 | 0 | 0 | 0 | 0 | 1 | 2 |
| Gastritis | 1 | 0 | 1 | 0 | 0 | 0 | 1 | 0 | 1 |
| Reflux | 0 | 0 | 1 | 0 | 0 | 1 | 0 | 0 | 1 |
| Mucositis | 0 | 0 | 0 | 0 | 0 | 0 | 0 | 0 | 0 |
| DLT | 8 | 10 | 12 b | 7 | 9 | 11 a | 6 | 7 | 8 b |
Values in the table referring to a number of participants with the toxicity. In bold are marked statistical significant differences. DLT, dose‐limiting toxicity; LMA, low muscle attenuation.
Chi‐square test.
Fisher's exact test.
Significant predictors of chemotherapy toxicity (DLT) were identified in univariate and multivariate Cox regression models (Table 4) after adjustment for the presence of metastasis and chemotherapy protocol: cachexia (HR = 10.65; CI 2.99–37.99, P < 0.01) and ECOG performance status (HR = 3.56; CI 2.10–18.45, P = 0.03).
Table 4.
Univariate and multivariate Cox regression analyses of association between toxicity (DLT) with different muscle measurements and nutritional status (n = 60)
| Univariate HR (95% CI) | P‐value | Multivariatea HR (95% CI) | P‐value | |
|---|---|---|---|---|
| Age (years) | 0.78 | |||
| ≤60 years | 1 | |||
| >60 years | 0.78 (0.35–1.71) | |||
| Gender | 0.14 | |||
| Female | 1 | |||
| Male | 0.55 (0.25–1.21) | |||
| Ethnicity | 0.95 | |||
| Non‐Caucasian | 1 | |||
| Caucasian | 1.03 (0.43–2.46) | |||
| Smoking history | 0.52 | |||
| Never smoked | 1 | |||
| Previous smoker | 0.68 (0.29–1.59) | |||
| Current smoker | 1.93 (0.25–14.89) | |||
| Diagnosis time | 0.23 | |||
| 1–2 months | 1 | |||
| 3–6 months | 1.82 (0.42–7.89) | |||
| >6 months | 0.84 (0.16–4.35) | |||
| Treatment modalities | 0.87 | |||
| Chemotherapy | 1 | |||
| Chemotherapy + radiotherapy | 0.88 (0.29–2.70) | |||
| Chemotherapy + surgery | 0.96 (0.32–2.95) | |||
| Chemotherapy + radiotherapy + surgery | 1.51 (0.41–5.64) | |||
| Chemotherapy protocol | 0.30 | |||
| 5FU + leucovorin | 1 | |||
| FOLFOX | 0.77 (0,22–2.69) | |||
| Paclitaxel + carboplatin | 1.92 (0.73–5.09) | |||
| Others | 2.59 (0.73–9.15) | |||
| Clinical TNM stage | 0.76 | |||
| II | 1 | |||
| III | 0.70 (0.22–2.72) | |||
| IV | 0.93 (0.30–2.89) | |||
| Metastasis presence | 1.21 (0.55–2.65) | 0.64 | ||
| Body mass index | 0.14 | |||
| ≤25 kg/m2 | 1 | |||
| >25 kg/m2 | 1.93 (0.77–4.82) | |||
| PG‐SGA | 0.44 | |||
| Nourished | 1 | |||
| Malnourished | 0.73 (0.33–1.60) | |||
| Dynapenia | 3.58 (0.84–15.22) | 0.09 | ||
| Sarcopenia | 2.23 (0.98–5.06) | 0.06 | ||
| Low muscle attenuation | 1.90 (0.85–4.24) | 0.11 | ||
| Cachexia | 9.00 (2.68–30.24) | <0.001 | 10.65 (2.99–37.99) | <0.001 |
| ECOG‐PS scale | 0.01 | <0.001 | ||
| 0–1 | 1 | 1 | ||
| ≥2 | 5.88 (2.54–13.63) | 6.51 (2.10–18.45) |
ECOG‐PS, Eastern Cooperative Oncology Group Performance Status; HR, hazard ratio; PG‐SGA, Patient‐Generated Subjective Global Assessment; TNM, Stage according to American Joint Committee on Cancer (AJCC) Cancer Staging Manual 7th edition.
Cox regression model adjusted for the presence of metastasis and chemotherapy protocol.
Discussion
Assessment of nutritional status and identification of sarcopenia and cachexia contribute to the decision regarding which patients would benefit from chemotherapy and which patients only need supportive care. This study was the first to show that even though all measures of muscle mass loss (sarcopenia, muscle attenuation, and cachexia) have association with some gastrointestinal toxicity variables, only cachexia and functional capacity (ECOG‐PS) were dose‐limiting toxicity predictors.
In recent years, studies in area of body composition and cancer have focused on the relationship between the quantity and quality of the skeletal muscle in outcomes such as mortality and quality of life.30, 31 About toxicity outcome, previous studies have already shown the impact of sarcopenia for different gastrointestinal cancers such as colon and rectum,8 oesophagus,5, 12 breast cancer,32 and gastric cancer.4 However, this is the first prospective study to date which tracked patients during three chemotherapy cycles and also assessed other muscle mass loss and functional capacity parameters. These analyses may contribute to better understanding of the variables that have an impact on the toxicity and prognosis of patients with gastrointestinal cancer.
Patients' nutritional status at baseline was similar with other studies in the literature which indicate BMI adequacy and considerable frequencies of sarcopenia and cachexia. As observed in other studies, this panorama reflects the increasing rates of overweight/obesity in this population and proposed that less importance should be placed on BMI.33 All patients classified with cachexia in the present study had weight loss higher than 5% in the previous 6 months. However, considering only weight loss to define cachexia can be inadequate, as this fails to account for fluid accumulation, large tumour burden, and the fat visceral organ atrophy present in patients with cancer.34 On the other hand, the present cachexia diagnostic criterion confounds sarcopenia diagnoses by considering only the low muscularity in its definition (weight loss >2% and low SMI).15 Thus, whenever possible, measures of inflammation can be assessed in these patients to complement the diagnosis of cachexia, and the diagnostic of sarcopenia in cancer patients should also include the function assessment. In the present study, this measure was not obtained because it was not part of the routine of exams of the patient. Finally, although the measure of inflammation is extremely important, it is not mandatory according to the current consensus.
The prevalence of sarcopenia and cachexia was almost 52%, and half of the sample had low muscle attenuation. Cachexia induces systemic inflammation and metabolic alterations, which in combination with a decrease in body protein stores may explain the poor prognosis in these patients.35 In the present study, the prevalence of sarcopenia was 23% at the beginning of chemotherapy. According to Ryan,14 sarcopenia is present in between 20% and 70% of patients, depending on the tumour type and how sarcopenia is defined, thus constituting a limitation making it difficult to compare them due to the variety of cut‐off points for sarcopenia that were used.15, 28, 36 In other studies, reduced muscle attenuation was also associated with poor prognosis such as more fatigue—the effect of activating the immune system and fatty infiltration in muscle.37 In patients with renal cell carcinoma,19 higher muscle density was independently associated with survival (HR = 1.85; P = 0.004), and low muscle attenuation in patients with metastatic melanoma was associated with high grades in immune‐related adverse events (OR = 3.57, CI 1.09–11.77, P = 0.036).37
Although both low muscle mass and low muscle function is required for the diagnostic of sarcopenia,38 nowadays, researchers have discussed their independent effects in different conditions, and which is more important for selected outcomes. In elderly, low muscle function seems to have the greatest impact on the risk for physical dependence compared with having low muscle mass alone.39 In contrast, Alexandre et al.40 observed that only low muscle mass was associated with an increased risk for impaired physical independence in the same population. For hospitalized patients, the loss in muscle mass is also important, due to the fact that many drugs are metabolized in skeletal muscle mass, especially chemotherapeutic agents.7, 8, 10 It is also important to recognize that skeletal muscle mass serves as the reserve of amino acids, and its depletion can be considered an independent risk factor for surgical patients.41 The present data showed that low muscle function only was not associated with toxicities during chemotherapy in cancer patients, and low muscle quality (muscle attenuation) had a low impact (results showed in Supporting Information).
In the present study, 54 (75%) patients experienced some grade of self‐reported toxicity during chemotherapy. The most frequent toxicities related were nausea, diarrhoea, and anorexia. In a study with colorectal cancer patients undergoing treatment with a 5‐flurouracil (5‐FU)/leucovorin protocol, Prado et al.8 found that neutropenia, diarrhoea, and nausea were also the most frequent. Similar results were observed by Kim et al.42 and Ziętarska et al.43 Regarding haematological toxicities, there was no significant difference in the incidence of neutropenia, anaemia, creatinine, and thrombocytopenia toxicities between the sarcopenic or non‐sarcopenic and the cachetic or non‐cachetic patients at baseline. Miyata et al.5 also did not find a significant difference in patients during neoadjuvant chemotherapy for oesophageal cancer. This lack of toxicity is probably due to the high cut‐off points for biochemical toxicity adopted in the literature29 to ensure patient safety.
In our study, patients with sarcopenia, cachexia, and low muscle attenuation presented higher toxicity values compared to their controls, however without statistical significance for most variables. This result may be partly attributed to good control of the chemotherapy treatment dosage which minimized the adverse effects, since the relationship between reduced muscle mass and toxicity to chemotherapy is known.11, 12, 13 Other studies have shown similar results, finding body composition that is predictive of Grades 3–4 toxicities in colorectal cancer patients.10, 44 Efforts should be made by medical staff to reduce toxicity during chemotherapy cycles to avoid dose reduction or treatment interruption.
The DLT frequency was relatively high in the sample, and cachectic patients experienced significantly more DLT than non‐cachectic patients. No association was observed between sarcopenia and DLT. Differently, Mir et al.11 in evaluating patients with hepatocellular carcinoma observed that sarcopenic patients experienced significantly more DLT than non‐sarcopenic patients (82% vs. 31%, P = 0.005). In the same way, Cousin45 analysed many different chemotherapy protocols and found that regardless of the drug type, patients with a higher toxicity grade had significantly lower SMI. In a cohort of patients receiving neoadjuvant treatment for esophago‐gastric cancer, Tan12 showed that the presence of sarcopenia was significantly associated with DLT (54.5 vs. 28.9%). In summary, these studies (which did not assess the presence of cachexia) demonstrated that decreased muscle mass and presence of sarcopenia are associated with poor prognostic and less survival after chemotherapy, independent of protocol or gastrointestinal tumour site. Future studies investigating dose reductions in patients with sarcopenia, cachexia, and muscle attenuation are necessary to clarify the impact of body composition in DLT.
The present univariate model only suggested a maintained association between cachexia and ECOG with toxicities when the model was adjusted in multivariable analyses. Poor performance status patients (ECOG‐PS ≥ 2) usually tolerate chemotherapy poorly, with increased toxicity compared to patients with ECOG‐PS 0–1.46, 47 In the present study, poor performance status was also a predictor of toxicity in gastrointestinal cancer patients. This underscores the need to identify clinical characteristics of poor performance status patients, avoiding overtreatment. Although low muscle mass and low muscle attenuation have been associated with poorer tolerance to chemotherapy,7, 13, 37 and low muscle attenuation is highly prevalent in the present study, we did not find this association. One possible explanation is the high prevalence of cachexia in patients, or the small sample size.
A relatively high proportion of patients exhibited cachexia, but not too high, while other studies (above 60%).35, 48 In the present study, cachexia was the best toxicity predictor in the sample, while sarcopenia was not a predictor in the regression model, which is different from other studies in the literature. This condition could be associated with increased treatment toxicity, and frequently necessitate premature interruption. Additionally, cachectic patients have poor performance status.15 Thus, a vicious cycle develops; cachexia reduces the possibility of using cytotoxic agents, thus leading to disease progression, and this in turn promotes the development of resistant cachexia.43 Most research to date has focused on treating muscle depletion as part of the cachexia syndrome using nutritional, exercise, and pharmacological interventions; however, these single‐agent therapies have not provided promising results.49
It is important to highlight that different instruments in literature for assessing loss of muscle mass can produce a relative variability in frequency of sarcopenia and cachexia, and there are multiple methods of adjusting the result for height or for BMI.50 Recently, Blauwhoff‐Buskermolen et al.51 found a large variation of prevalence of low muscle mass (13% to 93%) with different techniques (anthropometry, CT, and bioelectrical impedance) in cancer patients, and it has repercussion in diagnosis of cachexia and sarcopenia. However, despite a large disagreement between muscle measures in identifying a low muscle mass in these patients, the effect on the diagnosis of cancer cachexia was limited. The recent review of the European Consensus of Sarcopenia recognizes the different skeletal muscle mass assessment tools. According to this consensus, for the detection of low muscle quantity and quality, dual x‐ray absorptiometry (DXA) is advised in clinical practice and bioelectrical impedance analyses (BIA), computed tomography (CT), and magnetic resonance imaging (MRI) in research studies.38
Like sarcopenia, the PG‐SGA nutritional assessment tool was not predictive for toxicity. Although there is no consensus on the optimal tool to be employed in the oncology setting and little research has been performed to assess whether tools currently in use are adequately capturing patients with nutrition‐related syndromes,32 recent findings highlight the strong association between nutritional assessment and survival prediction in oncology populations.20 Although malnutrition is a frequent feature of patients with advanced cancer, and 58.3% of patients of the present study had a diagnosis of malnourishment in the beginning of chemotherapy treatment by PG‐SGA, 46.7% of these patients were overweight or obese at this time point. This issue needs to be more discussed in future studies, with a focus on sarcopenic obesity.
To the best of our knowledge, this is the first study to assess CT images and compare different parameters of nutritional status, body composition, and functional capacity tools to prospectively predict toxicity in different chemotherapy cycles. However, we recognize that the study has several limitations. This study is a single‐centre investigation with small sample size. Therefore, our results should be interpreted with caution before being extrapolated to the general population. Another limitation was the evaluation of gastrointestinal toxicity only 72 h after each chemotherapy cycle. It is known that some toxicities may occur after this period,37 and this may have underestimated the frequency of toxicity. The different primary sites of cancer and consequently their different chemotherapeutic schemes should also be recognized as a limitation. Finally, another factor that deserves to be remembered is that 35% of patients were undergoing radiotherapy concomitant with chemotherapy, and the toxicities may have been due to this other treatment modality.
Despite some limitations, the strength of this study is longer follow‐up time and the possibility of longitudinal nutritional status and functional capacity monitoring. Thus, this study contributes to narrow the gap in literature about the relationship in baseline cachexia, sarcopenia, muscle density, and functional status with implications in evaluating toxicities during three cycles.
In conclusion, our findings suggest that cachexia diagnosis was better than sarcopenia and muscle attenuation as the better predictor for haematological and gastrointestinal toxicities during chemotherapy in a gastrointestinal cancer population. In practice, the application and use of the diagnostic criteria for cachexia based on sarcopenia using CT (the gold standard method of body composition analysis in oncology patients) can be used to predict adverse clinical outcomes and identify patients who need a more specific nutritional therapy.
Conflict of Interest
The authors I.M.G.R., A.P.T.F., G.O.C.M., R.A.B., A.M., and M.C.G. declare no conflicts of interest.
Authors' contributions
I.M.G.R. and A.P.T.F. designed the study. I.M.G.R. carried out the data collection. G.O.C.M. analysed the body composition images. I.M.G.R., A.M., and R.A.B. performed the statistical analysis. I.M.G.R., G.O.C.M., R.A.B., A.M., M.C.G., and A.P.T.F. wrote and approved the final manuscript.
Supporting information
Table S1. Relationship between sarcopenia and toxicities after cycle 1, 2 and 3.
Table S2. Relationship between cachexia and toxicities after cycle 1, 2 and 3.
Table S3. Relationship between muscle attenuation and toxicities after cycle 1, 2 and 3.
Table S4. Relationship between dynapenia and toxicities after cycle 1, 2 and 3.
Acknowledgements
The authors certify that they comply with the ethical guidelines for authorship and publication of the Journal of Cachexia, Sarcopenia and Muscle.52
The authors would like to thank to nutritionist group in Liga Norte Riograndense Contra o Câncer, especially Drs Jeane C. A. Souza, Luciana Câmara Silva, and Isa L. S. Aquino.
da Rocha, I. M. G. , Marcadenti, A. , de Medeiros, G. O. C. , Bezerra, R. A. , Rego, J. F. M. , Gonzalez, M. C. , and Fayh, A. P. T. (2019) Is cachexia associated with chemotherapy toxicities in gastrointestinal cancer patients? A prospective study. Journal of Cachexia, Sarcopenia and Muscle, 10: 445–454. 10.1002/jcsm.12391.
References
- 1. Baracos VE, Martin L, Korc M, Guttridge DC, Fearon KCH. Cancer‐associated cachexia. Nat Rev Dis Prim 2018;4:1–18. [DOI] [PubMed] [Google Scholar]
- 2. Brazilian Ministry of Health, National Institute of Cancer José Alencar Gomes da Silva . Estimate 2018‐incidence of cancer in Brazil. 2017; 130.
- 3. Martin L, Senesse P, Gioulbasanis I, Antoun S, Bozzetti F, Deans C, et al. Diagnostic criteria for the classification of cancer‐associated weight loss. J Clin Oncol 2015;33:90–99. [DOI] [PubMed] [Google Scholar]
- 4. Palmela C, Velho S, Agostinho L, Branco F, Santos M, Pia M, et al. Body composition as a prognostic factor of neoadjuvant chemotherapy toxicity and outcome in patients with locally advanced gastric cancer. J Gastric Cancer 2017;17:74–87. [DOI] [PMC free article] [PubMed] [Google Scholar]
- 5. Miyata H, Sugimura K, Motoori M, Fujiwara Y, Omori T, Yanagimoto Y, et al. Clinical assessment of sarcopenia and changes in body composition during neoadjuvant chemotherapy for esophageal cancer. Anticancer Res Res 2017;37:3053–3059. [DOI] [PubMed] [Google Scholar]
- 6. Choi MH, Oh SN, Lee IN, Oh ST, Won DD. Sarcopenia is negatively associated with long‐term outcomes in locally advanced rectal cancer. J Cachexia Sarcopenia Muscle 2018;9:53–59. [DOI] [PMC free article] [PubMed] [Google Scholar]
- 7. Williams GR, Deal AM, Shachar SS, Walko CM, Patel JN, O'Neil B, et al. The impact of skeletal muscle on the pharmacokinetics and toxicity of 5‐fluorouracil in colorectal cancer. Cancer Chemother Pharmacol 2018;81:413–417. [DOI] [PMC free article] [PubMed] [Google Scholar]
- 8. Prado CMM, Baracos VE, McCargar LJ, Mourtzakis M, Mulder KE, Reiman T, et al. Body composition as an independent determinant of 5‐fluorouracil‐based chemotherapy toxicity. Clin Cancer Res 2007;13:3264–3268. [DOI] [PubMed] [Google Scholar]
- 9. Cruz‐Jentoft AJ, Baeyens JP, Bauer JM, Boirie Y, Cederholm T, Landi F, et al. Sarcopenia: European consensus on definition and diagnosis. Age Ageing 2010;39:412–423. [DOI] [PMC free article] [PubMed] [Google Scholar]
- 10. Jung H‐W, Kim JW, Kim J‐Y, Kim S‐W, Yang HK, Lee JW, et al. Effect of muscle mass on toxicity and survival in patients with colon cancer undergoing adjuvant chemotherapy. Support Care Cancer 2015;23:687–694. [DOI] [PubMed] [Google Scholar]
- 11. Mir O, Coriat R, Blanchet B, Durand J, Boudou P, Michels J, et al. Sarcopenia predicts early dose‐limiting toxicities and pharmacokinetics of sorafenib in patients with hepatocellular carcinoma. PLoS One 2012;7:1–7. [DOI] [PMC free article] [PubMed] [Google Scholar]
- 12. Tan BHL, Brammer K, Randhawa N, Welch NT, Parsons SL, James EJ, et al. Sarcopenia is associated with toxicity in patients undergoing neo‐adjuvant chemotherapy for oesophago‐gastric cancer. Eur J Surg Oncol 2015;41:333–338. [DOI] [PubMed] [Google Scholar]
- 13. Wendrich AW, Swartz JE, Bril SI, Wegner I, Graeff A, Smid EJ, et al. Low skeletal muscle mass is a predictive factor for chemotherapy dose‐limiting toxicity in patients with locally advanced head and neck cancer. Oral Oncol 2017;71:26–33. [DOI] [PubMed] [Google Scholar]
- 14. Ryan AM, Power DG, Daly L, Cushen SJ, Ní Bhuachalla E, Prado CM. Cancer‐associated malnutrition, cachexia and sarcopenia: the skeleton in the hospital closet 40 years later. Proc Nutr Soc 2016;75:199–211. [DOI] [PubMed] [Google Scholar]
- 15. Fearon K, Strasser F, Anker SD, Bosaeus I, Bruera E, Fainsinger RL, et al. Definition and classification of cancer cachexia: an international consensus. Lancet Oncol 2011;12:489–495. [DOI] [PubMed] [Google Scholar]
- 16. Bruggeman AR, Kamal AH, LeBlanc TW, Ma JD, Baracos VE, Roeland EJ. Cancer cachexia: beyond weight loss. J Oncol Pract 2016;12:1163–1171. [DOI] [PubMed] [Google Scholar]
- 17. Argilés JM, Busquets S, Stemmler B, López‐Soriano FJ. Cancer cachexia: understanding the molecular basis. Nat Rev Cancer 2014;14:754–762. [DOI] [PubMed] [Google Scholar]
- 18. Anandavadivelan P, Brismar TB, Nilsson M, Johar AM, Martin L. Sarcopenic obesity: a probable risk factor for dose limiting toxicity during neo‐adjuvant chemotherapy in oesophageal cancer patients. Clin Nutr 2016;35:724–730. [DOI] [PubMed] [Google Scholar]
- 19. Antoun S, Lanoy E, Iacovelli R, Albiges‐Sauvin L, Loriot Y, Merad‐Taoufik M, et al. Skeletal muscle density predicts prognosis in patients with metastatic renal cell carcinoma treated with targeted therapies. Cancer 2013;119:3377–3384. [DOI] [PubMed] [Google Scholar]
- 20. Gu W, Zhang G, Sun L, Ma Q, Cheng Y, Zhang H, et al. Nutritional screening is strongly associated with overall survival in patients treated with targeted agents for metastatic renal cell carcinoma. J Cachexia Sarcopenia Muscle 2015;6:222–230. [DOI] [PMC free article] [PubMed] [Google Scholar]
- 21. Isenring E, Elia M. Which screening method is appropriate for older cancer patients at risk for malnutrition? Nutrition 2015;31:594–597. [DOI] [PubMed] [Google Scholar]
- 22. Guinan EM, Doyle SL, Benett AE, O'Neill L, Gannon J, Elliot JA, et al. Sarcopenia during neoadjuvant therapy for oesophageal cancer: characterising the impact on muscle strength and physical performance. Support Care Cancer 2017;26:1569–1576. [DOI] [PubMed] [Google Scholar]
- 23. WHO . Physical status: the use and interpretation of anthropometry. Report of a WHO Expert Committee. Vol. 854, World Health Organization technical report series. 1995; 1–452. [PubMed]
- 24. McCalllum PD. Patient‐Generated Subjective Global Assessment In McCallum PD, Polisena C, eds. The Clinical Guide to Oncology Nutrition. Chicago, IL: American Dietetic Association; 2000. p 11–23. [Google Scholar]
- 25. Oken M, Creech R, Tormey D, Horton J, Davis T, McFadden E, et al. Toxicity and response criteria of the Eastern Cooperative Oncology Group. Am J Clin Oncol 1982;5:649–656. [PubMed] [Google Scholar]
- 26. Heymsfield SB, Wang Z, York N, Baumgartner RN, Ross R. Human body composition: advances in models and methods. Annu Rev Nutr 1997;17:527–558. [DOI] [PubMed] [Google Scholar]
- 27. Mitsiopoulos N, Baumgartner RN, Heymsfield SB, Lyons W, Gallagher D, Ross R, et al. Cadaver validation of skeletal muscle measurement by magnetic resonance imaging and computerized tomography. J Appl Physiol 1998;85:115–122. [DOI] [PubMed] [Google Scholar]
- 28. Martin L, Birdsell L, MacDonald N, Reiman T, Clandinin MT, McCargar LJ, et al. Cancer cachexia in the age of obesity: skeletal muscle depletion is a powerful prognostic factor, independent of body mass index. J Clin Oncol 2013;31:1539–1547. [DOI] [PubMed] [Google Scholar]
- 29. National Institute of Cancer . Common terminology criteria for adverse events (CTCAE). NIH Publ 2010;2009:0–71, Available from: http://ctep.cancer.gov/protocolDevelopment/electronic_applications/docs/ctcaev3.pdf. [Google Scholar]
- 30. Bye A, Sjøblom B, Wentzel‐Larsen T, Grønberg BH, Baracos VE, Hjermstad MJ, et al. Muscle mass and association to quality of life in non‐small cell lung cancer patients. J Cachexia Sarcopenia Muscle 2017;8:759–767. [DOI] [PMC free article] [PubMed] [Google Scholar]
- 31. Dahiya N, Acharya AS, Bachani D, Sharma DN. Quality of life of patients with advanced cervical cancer before and after chemo‐radiotherapy. Asian Pac J Cancer Prev 2016;17:3095–3099. [PubMed] [Google Scholar]
- 32. Klassen O, Schimidt ME, Ulrich CM, Schneeweiss A, Potthoff K, Steindorf K, et al. Muscle strength in breast cancer patients receiving different treatment regimes. J Cachexia Sarcopenia Muscle 2016;8:305–316. [DOI] [PMC free article] [PubMed] [Google Scholar]
- 33. Ní Bhuachalla ÉB, Daly LE, Power DG, Cushen SJ, Maceneaney P, Ryan AM. Computed tomography diagnosed cachexia and sarcopenia in 725 oncology patients: is nutritional screening capturing hidden malnutrition? J Cachexia Sarcopenia Muscle 2018;9:295–305. [DOI] [PMC free article] [PubMed] [Google Scholar]
- 34. Broughman JR, Williams GR, Deal AM, et al. Prevalence of sarcopenia in older patients with colorectal cancer. J Geriatr Oncol 2015;6:442–445. [DOI] [PMC free article] [PubMed] [Google Scholar]
- 35. Daly LE, Bhuachalla ÉBN, Power DG, Cushen SJ, James K, Ryan AM. Loss of skeletal muscle during systemic chemotherapy is prognostic of poor survival in patients with foregut cancer. J Cachexia Sarcopenia Muscle 2018;9:1–10. [DOI] [PMC free article] [PubMed] [Google Scholar]
- 36. Prado CM, Lieffers JR, McCargar LJ, Reiman T, Sawyer MB, Martin L, et al. Prevalence and clinical implications of sarcopenic obesity in patients with solid tumours of the respiratory and gastrointestinal tracts: a population‐based study. Lancet Oncol 2008;9:629–635. [DOI] [PubMed] [Google Scholar]
- 37. Daly LE, Power DG, O'Reilly A, Donnellan P, Cushen SJ, Sullivan KO, et al. The impact of body composition parameters on ipilimumab toxicity and survival in patients with metastatic melanoma. Br J Cancer 2017;116:310–317. [DOI] [PMC free article] [PubMed] [Google Scholar]
- 38. Cruz‐Jentoft AJ, Bahat G, Bauer J, Boirie Y, Bruyère O, Cederholm T et al. Sarcopenia: revised European consensus on definition and diagnosis. Age Ageing 2018; 0: 1–16. [DOI] [PMC free article] [PubMed] [Google Scholar]
- 39. Dos Santos L, Cyrino ES, Antunes M, Santos DA, Sardinha LB. Sarcopenia and physical independence in older adults: the independent and synergic role of muscle mass and muscle function. J Cachexia Sarcopenia Muscle 2017;8:245–250. [DOI] [PMC free article] [PubMed] [Google Scholar]
- 40. Alexandre TS, Duarte YA, Santos JL, Wong R, Lebrao ML. Sarcopenia according to the European Working Group on Sarcopenia in Older People (EWGSOP) versus dynapenia as a risk factor for mortality in the elderly. J Nutr Health Aging 2014;18:751–756. [DOI] [PubMed] [Google Scholar]
- 41. Kudou K, Saeki H, Nakashima Y, Kimura K, Ando K, Oki E, et al. Postoperative skeletal muscle loss predicts poor prognosis of adenocarcinoma of upper stomach and esophagogastric junction. World J Surg 2018;1–8. [DOI] [PubMed] [Google Scholar]
- 42. Kim SH, Ryu MH, Zang DY, Park SR, Han B, Kang WK, et al. Phase II study of oxaliplatin, irinotecan and S‐1 therapy in patients with advanced gastric cancer: the Korean Cancer Study Group ST14‐11. Gastric Cancer 2018;1:1–9. [DOI] [PubMed] [Google Scholar]
- 43. Ziętarska M, Krawczyk‐Lipiec J, Kraj L, Zaucha R, Małgorzewicz S. Chemotherapy‐related toxicity, nutritional status and quality of life in precachectic oncologic patients with, or without, high protein nutritional support. A prospective, randomized study. Nutrients 2017;11:9–10. [DOI] [PMC free article] [PubMed] [Google Scholar]
- 44. Barret M, Antoun S, Dalban C, Malka D, Mansourbakht T, Zaanan A, et al. Sarcopenia is linked to treatment toxicity in patients with metastatic colorectal cancer. Nutr Cancer 2014;66:583–589. [DOI] [PubMed] [Google Scholar]
- 45. Cousin S, Hollebecque A, Koscielny S, Mir O. Low skeletal muscle is associated with toxicity in patients included in phase I trials. Invest New Drugs 2013;32:362–387. [DOI] [PubMed] [Google Scholar]
- 46. Reljic T, Kumar A, Klocksieben FA, Djulbegovic B. Treatment targeted at underlying disease versus palliative care in terminally ill patients: a systematic review. BMJ Open 2017;7:1–9. [DOI] [PMC free article] [PubMed] [Google Scholar]
- 47. Sweeney CJ, Zhu J, Sandler AB, Schiller J, Belani CP, Langer C, et al. Outcome of patients with a performance status of 2 in Eastern Cooperative Oncology Group Study E1594: a phase III trial in metastatic non‐small cell lung carcinoma. Cancer 2001;92:2635–2647. [DOI] [PubMed] [Google Scholar]
- 48. Muscaritoli M, Lucia S, Farcomeni A, Lorusso V, Saracino V, Barone C, et al. Prevalence of malnutrition in patients at first medical oncology visit: the PreMio study. Oncotarget 2017;8:884–896. [DOI] [PMC free article] [PubMed] [Google Scholar]
- 49. Daly LE, Prado CM, Ryan AM. A window beneath the skin: how computed tomography assessment of body composition can assist in the identification of hidden wasting conditions in oncology that profoundly impact outcomes. Proc Nutr Soc 2018. May;77:135–151. [DOI] [PubMed] [Google Scholar]
- 50. Cooper C, Fielding R, Visser M, van Loon LG, Rolland Y, Orwoll E, et al. Tools in the assessment of sarcopenia. Calcif Tissue Int 2013;93:201–210. [DOI] [PMC free article] [PubMed] [Google Scholar]
- 51. Blauwhoff‐Buskermolen S, Langius JAE, Becker A, Verheul HMW, de van der Schueren MAE. The influence of different muscle mass measurements on the diagnosis of cancer cachexia. J Cachexia Sarcopenia Muscle 2017;8:615–622. [DOI] [PMC free article] [PubMed] [Google Scholar]
- 52. von Haehling S, Morley JE, Coats AJS, Anker SD. Ethical guidelines for publishing in the Journal of Cachexia, Sarcopenia and Muscle: update 2017. J Cachexia Sarcopenia Muscle 2017;8:1081–1083. [DOI] [PMC free article] [PubMed] [Google Scholar]
Associated Data
This section collects any data citations, data availability statements, or supplementary materials included in this article.
Supplementary Materials
Table S1. Relationship between sarcopenia and toxicities after cycle 1, 2 and 3.
Table S2. Relationship between cachexia and toxicities after cycle 1, 2 and 3.
Table S3. Relationship between muscle attenuation and toxicities after cycle 1, 2 and 3.
Table S4. Relationship between dynapenia and toxicities after cycle 1, 2 and 3.