

Abstract
Background
Stimulation of β2‐adrenoceptors can promote muscle hypertrophy and fibre type shift, and it can counteract atrophy and weakness. The underlying mechanisms remain elusive.
Methods
Fed wild type (WT), 2‐day fasted WT, muscle‐specific insulin (INS) receptor (IR) knockout (M‐IR−/−), and MKR mice were studied with regard to acute effects of the β2‐agonist formoterol (FOR) on protein metabolism and signalling events. MKR mice express a dominant negative IGF1 receptor, which blocks both INS/IGF1 signalling. All received one injection of FOR (300 μg kg−1 subcutaneously) or saline. Skeletal muscles and serum samples were analysed from 30 to 240 min. For the study of chronic effects of FOR on muscle plasticity and function as well as intracellular signalling pathways, fed WT and MKR mice were treated with formoterol (300 μg kg−1 day−1) for 30 days.
Results
In fed and fasted mice, one injection of FOR inhibited autophagosome formation (LC3‐II content, 65%, P ≤ 0.05) that was paralleled by an increase in serum INS levels (4‐fold to 25‐fold, P ≤ 0.05) and the phosphorylation of Akt (4.4‐fold to 6.5‐fold, P ≤ 0.05) and ERK1/2 (50% to two‐fold, P ≤ 0.05). This led to the suppression (40–70%, P ≤ 0.05) of the master regulators of atrophy, FoxOs, and the mRNA levels of their target genes. FOR enhanced (41%, P ≤ 0.05) protein synthesis only in fed condition and stimulated (4.4‐fold to 35‐fold, P ≤ 0.05) the prosynthetic Akt/mTOR/p70S6K pathway in both fed and fasted states. FOR effects on Akt signalling during fasting were blunted in both M‐IR−/− and MKR mice. Inhibition of proteolysis markers by FOR was prevented only in MKR mice. Blockade of PI3K/Akt axis and mTORC1, but not ERK1/2, in fasted mice also suppressed the acute FOR effects on proteolysis and autophagy. Chronic stimulation of β2‐adrenoceptors in fed WT mice increased body (11%, P ≤ 0.05) and muscle (15%, P ≤ 0.05) growth and downregulated atrophy‐related genes (30–40%, P ≤ 0.05), but these effects were abolished in MKR mice. Increases in muscle force caused by FOR (WT, 24%, P ≤ 0.05) were only partially impaired in MKR mice (12%, P ≤ 0.05), and FOR‐induced slow‐to‐fast fibre type shift was not blocked at all in these animals. In MKR mice, FOR also restored the lower levels of muscle SDH activity to basal WT values and caused a marked reduction (57%, P ≤ 0.05) in the number of centrally nucleated fibers.
Conclusions
NS/IGF1 signalling is necessary for the anti‐proteolytic and hypertrophic effects of in vivo β2‐adrenergic stimulation and appears to mediate FOR‐induced enhancement of protein synthesis. INS/IGF1 signalling only partially contributes to gain in strength and does not mediate fibre type transition induced by FOR.
Keywords: β2‐adrenoceptor, Insulin/IGF1 signalling, Protein metabolism, Skeletal muscle function, Skeletal muscle plasticity, Autophagy‐lysosomal system
Introduction
The stimulation of β2‐adrenoceptors (AR) has attracted the attention of clinicians for preventing or even reversing the muscle wasting and weakness in several pathological conditions, including cancer cachexia,1, 2 sarcopenia,3 and muscular dystrophies.4, 5 In addition to changes in trophism, strength gain by β2‐agonists may be also achieved by switching from slow‐oxidative to fast‐glycolytic fibre type,6, 7 which present the highest force development.8 Although these adrenergic effects may benefit patients with muscle wasting,9 the underlying mechanisms and intracellular signalling involved are not fully understood.
In a previous study, we have shown in a physiological state of fasting that the absence of catecholamines accelerates protein breakdown and muscle wasting.10 Catecholamines may directly exert these protective effects on skeletal muscle because epinephrine and β2‐agonists in vitro inhibit protein degradation in isolated rat muscles.11 Similarly, in humans, epinephrine infusion reduced aminoacidemia indicating an anti‐catabolic action on muscle.12 However, the infusion of epinephrine12 or the β‐agonist isoproterenol13 significantly increases the circulating levels of insulin (INS), a major regulator of muscle proteostasis, suggesting that this hormone could mediate, at least partially, the in vivo actions of sympathomimetics in protein anabolism. In apparent disagreement with this notion, skeletal muscle hypertrophy is still observed in streptozotocin (STZ)‐induced diabetic rats orally treated with the β2‐agonist clenbuterol (CB) for 8 days,14 although this may be due to other hormonal changes as CB can also up‐regulate the muscle content of INS‐like growth factor‐1 (IGF1).15 INS and IGF1 play overlapping roles in the suppression of muscle atrophy,16 and IGF1 is also a potent hypertrophy inducer.17 Like INS, the role of IGF1 in the growth‐promoting action of β2‐agonists is unclear, since other studies have demonstrated that CB administration to normal, denervated or hindlimb‐suspended rats caused no alteration in IGF1 peptide.18, 19 These discrepancies in INS/IGF1 levels in response to β2‐agonists may be due to the differences in the dosage and timing of treatment or even reflects a desensitization of β2‐AR signalling during chronic treatment.20
The in vivo stimulation of β2‐AR by CB also activates the classical downstream targets of INS (IR) and IGF1 (IGF1R) receptors, Akt and the mitogen‐activated protein kinases (MAPKs) ERK1/2, in fast‐twitch muscles, suggesting an indirect role of INS/IGF1 in activating these kinases.6, 19, 21, 22 In contrast, it has been postulated in different cell types, including myocytes, that β2‐agonist may directly stimulate Akt and ERK1/2 either via the subunits βγ of Gi protein‐coupled β2‐AR23, 24 or via the exchange protein directly activated by cAMP isoform 1 (Epac1), a guanine nucleotide exchange factor for the Ras‐like small GTPases.7, 25, 26 Akt is a crucial regulator of muscle strength and proteostasis27, 28 by increasing protein synthesis, via activation of the mechanistic target of rapamycin complex 1 (mTORC1) signalling and inhibition of GSK3β, and by reducing protein degradation, through inhibition of the transcriptional factors Forkhead box class O.29, 30, 31 Interestingly, the FoxO family (FoxO1, 3, and 4) is a major transcriptional activator of ubiquitin (Ub)‐proteasome (UPS) and autophagic/lysosomal (ALS) systems, which degrade most cellular proteins and organelles in skeletal muscle during physiologic and pathologic states.29, 30, 31, 32 β2‐agonists have been suggested to act at this level by increasing Akt/FoxO3 phosphorylation in fed20 and fasted21 states. As a consequence, the expression of some FoxO target genes, such as the muscle‐specific Ub‐ligases Atrogin‐1 and Murf1, is down‐regulated by β2‐agonists especially in atrophic muscles.19, 21, 22, 33 Recently, two novel Ub‐ligases, Smart and Musa1, controlled by FoxO have been identified as the critical genes for muscle loss31, 34, 35; however, no information is available about their regulation by adrenergic system.
Akt/mTORC1 signalling not only stimulates protein synthesis but also inhibits proteolysis by blocking autophagy,36 the pathway that delivers intracellular substrates to lysosomes. Although the mTORC1 inhibitor rapamycin (RAPA) almost entirely prevented CB‐induced muscle hypertrophy,22 it is unclear whether this kinase serves as an enhancer of protein synthesis, an inhibitor of autophagy, or both. The interpretation of the effects of sympathomimetics on autophagy in skeletal muscle are confusing since both increased20 and decreased33 protein content of the autophagy marker LC3‐II have been reported.
Similar to Akt, it has been demonstrated in non‐muscle cells that ERK1/2 can also activate mTORC137 and repress FoxO,38 which could lead to stimulation of protein synthesis and repression of ALS and UPS. Indeed, the inhibition of ERK1/2 by PD‐98059 or overexpression of the dual‐specificity MAPK phosphatase‐1 (MKP‐1) up‐regulated the expression of Atrogin‐1 and Murf1 and proteasome activity in myocytes.39 In addition, ERK1/2 blockade impaired muscle hypertrophy induced by IGF140 and CB.6 Although these evidences suggest that ERK1/2 signalling is necessary for β2‐agonist‐induced muscle growth, there is no direct evidence that MAPKs mediate the protein anabolic effects of β2‐agonists.
The purpose of the present work was to investigate the role of INS/IGF1 signalling in the acute and chronic effects of the highly selective β2‐agonist FOR on in vivo muscle protein metabolism, plasticity and function and identify the intracellular mediators of these processes. Herein, we show using genetic and pharmacological approaches that the integrity of INS/IGF1 receptor signalling via PI3K/Akt, but not MEK1/2‐ERK1/2, pathway is mandatory for the suppression of muscle proteolysis by β2‐AR stimulation during fasting and probably mediates FOR‐induced enhancement of protein synthesis in fed condition. We also demonstrate that the chronic treatment with FOR induced body and muscle growth, effects that were completely dependent on INS/IGF1 signalling. On the other hand, FOR caused fibre type transition toward a faster phenotype in an INS/IGF1 signalling‐independent manner, which contributed to strength gain even in transgenic mice resistant to INS/IGF1.
Material and methods
Animals, treatments, and conditions
For most experiments, C57Bl6/J mice (10‐ to 16‐week‐old male mice, ~30 g) were used. For in vitro experiments, the small intact muscles of fed and 2‐day‐fasted Wistar rats (4‐week‐old male rats, ~80 g) were used to allow for the adequate diffusion of metabolites and oxygen. Muscle‐specific INS receptor (IR) knockout (M‐IR−/−) and littermate control mice have been previously described.41 MKR transgenic mice were kindly supplied by Dr Derek LeRoith from Icahn School of Medicine at Mount Sinai (New York, NY) and have been previously described.42 FVB/N mice were used as wildtype controls (WT) for experiments with MKR mice. Mice were deprived of food for 2 days to reduce the levels of INS and growth factors, increase proteolysis,43 and cause maximum up‐regulation of FoxO‐target genes31, 44 and muscle atrophy.45 Insulin deficiency was induced by an intravenous injection of streptozotocin (STZ, 70 mg kg−1 in overnight fasted mice), and mice were used in the experiments 3 days later. In vivo treatment with β2‐agonists consisted of two different settings: (i) a single subcutaneous (s.c.) injection of FOR (300 μg kg−1; FOR was first dissolved in DMSO and then diluted in saline) and vehicle (saline/DMSO) in fed, 2‐day fasted or 3‐day STZ‐treated mice; and (ii) a daily injection of FOR (300 μg kg−1 day−1) during 30 days, being the last injection administered 30 min before euthanasia. In preliminary experiments, we tested three different doses of FOR (30, 300, and 3000 μg kg−1) being the highest one similar to the dose of the classical β2‐agonist CB that has been previously shown to suppress atrophy‐related genes and mitigate atrophy during fasting21 and motor denervation,19 respectively. The intermediary dose of FOR (i.e. 300 μg kg−1) was chosen because it showed the most consistent results in activating INS/IGF1 signalling and reducing atrophy‐related genes. In some experiments, mice were injected intraperitoneally (i.p.) with 0.4 mg kg−1 rapamycin (RAPA) 2 h prior to FOR or saline. Animals were euthanized by cervical dislocation at various time points after the injection as described in each experiment. However, decapitation was performed in some experiments for collecting blood. After euthanasia, muscles were rapidly weighed, frozen in liquid nitrogen, and stored at −80°C until further processing for subsequent analysis. All animals were housed in a room with a 12–12 h light–dark cycle and were given free access to water and a normal lab chow diet until the start of the experiment.
Adult skeletal muscle in vivo transfection
Mice were anaesthetized by intraperitoneal injection of 85 mg kg−1 ketamine and 10 mg kg−1 xylazine. A minor incision was performed on mouse hindlimb to expose tibialis anterior (TA) muscle, which was injected along its length with 30 μL of 0.9% saline containing plasmid DNA purified (PureLink HiPure Plasmid Filter Purification Kit, Invitrogen). For evaluation of autophagosome number, 15 μg of YFP‐LC3 were injected into muscle. For evaluation of FoxO activity, 10 μg of DBE‐FoxO luciferase and 5 μg of pRL‐null‐Renilla luciferase were used. Electric pulses were then applied using an electroporator (CUY21; Tokiwa Science, Fukuoka, Japan) and two stainless steel spatula electrodes placed on each side of the isolated muscle belly. Five square‐wave pulses with a pulse length of 20‐ and 200‐ms intervals between each pulse were delivered at 21 volts. Muscle damage was minimal and myofibres with abnormal morphology were excluded from the analysis.
Histology and microscopy
TA muscles for histology were frozen in liquid nitrogen‐cooled isopentane and mounted in optimal cutting temperature medium (Sakura Finetek). Cryosections of TA were stained for haematoxylin and eosin (H&E), succinate dehydrogenase (SDH), and periodic acid‐Schiff (PAS). H&E, SDH, and PAS stainings were examined in a fluorescence microscope Leica DM5000B equipped with a Leica DFC300‐FX digital charge‐coupled device camera by using Leica DC Viewer software. Cross‐sectional area (CSA) of more than 220 fibres stained for SDH (×20 magnification) per muscle was measured using the software ImageJ/Fiji (version 1.51). Fibre typing of whole muscle was determined by immunofluorescence (IF) using combinations of the following monoclonal anti‐myosin heavy chain (MHC) antibodies distributed by the Developmental Studies Hybridoma Bank (DSHB, University of Iowa): BA‐D5 (IgG2b, 1:100 dilution) specific for MHC‐I, SC‐71 (IgG1, 1:100 dilution) specific for MHC‐IIA and BF‐F3 (IgM, 1:100 dilution) specific for MHC‐IIB. Type IIX fibres are not recognized by these antibodies, and so appear black. Skeletal muscle cell membrane was stained by IF for dystrophin (Dys; Abcam, reference ab15277; 1:100 dilution). IF pictures were collected with Cytell Cell Imaging System (GE Healthcare). Single‐colour images were merged to obtain a whole muscle reconstruction with Adobe Photoshop CC2015 (Adobe Systems Inc.). Morphometric analyses were made using the software SMASH‐Semiautomatic Image Processing of Skeletal Muscle Histology.46 All histological analyses were conducted by a single observer (D.A.G.) blinded to mouse identity.
Luciferase reporter assay
Skeletal muscles were homogenized in Passive Lysis Buffer using TissueLyser II (Qiagen), and luciferase activity was quantified using a Dual‐Luciferase Reporter Assay (Promega). FoxO activity was determined by normalizing firefly luciferase activity (DBE‐FoxO reporter) to pRL‐null‐Renilla luciferase activity.
The quantification of LC3‐vesicles
TA muscles were cotransfected with YFP‐LC3, and 5 days later, mice were fasted for 2 days and then received an injection of FOR or saline. Autophagosomes were quantified by counting YFP‐LC3‐positive dots and normalizing for fibre CSA using ImageJ/Fiji (version 1.51). Cryosections of muscles were examined using an epifluorescence Leica DM5000B microscope equipped with a Leica DFC300‐FX digital charge‐coupled device camera by using Leica DC Viewer software.
Autophagic flux quantification
Autophagic flux was monitored in fasted condition using colchicine (COL; C9754, Sigma‐Aldrich) protocol modified from JU et al.,47 which has been shown to cause no body mass loss, distress,47 and myopathic phenotype.48 Briefly, fasted mice were treated, by i.p. injection, with vehicle (saline) or with 0.4 mg kg−1 colchicine. The treatment was administered three times, at 48, 24, and 1 h before injecting FOR or saline.
Isolated skeletal muscles
The extensor digitorum longus (EDL) muscle was rapidly dissected, weighed, and maintained at approximately its resting length by securing the tendons in inert plastic supports. Tissues were incubated at 37°C in Krebs–Ringer bicarbonate buffer (pH 7.4) equilibrated with 95% oxygen and 5% carbon dioxide; the buffer contained 5 mM glucose and 0.2–0.3% DMSO [the solvent for FOR (0.2%) and kinase inhibitors (0.1%)].
Measurements of protein degradation
Overall proteolysis was measured using a method as described previously.19 Muscles from 2‐day fasted rats were incubated for 120 min with FOR (10−4 M, dissolved in 0.2% DMSO), CB (10−4 M), wortmannin (a PI3K inhibitor; 0.5 μM, dissolved in 0.003% DMSO), triciribine (an Akt inhibitor; 10 μM, dissolved in 0.1% DMSO) and/or U0126 (an inhibitor of MEK/ERK1/2 signalling; 10 μM, dissolved in 0.1% DMSO). Muscles were exposed to wortmannin, triciribine, or U0126 for 60 min before the addition of FOR.
Measurements of in vivo protein synthesis with SUnSET
In vivo measurements of protein synthesis were performed by using the SUnSET technique.49 Mice received an intraperitoneal injection of 0.040 μmol/g puromycin dissolved in 100 μL of phosphate buffered saline (PBS). At exactly 30 min after injection, TA muscles were collected and frozen in liquid nitrogen for western blot analysis of puromycin‐labelled peptides.
Quantitative PCR
Total RNA was extracted from muscle using TRIzol (Invitrogen) then reverse transcribed into cDNA using SuperScript IV First‐Strand Synthesis System (Invitrogen) according to the manufacturer's protocols. Quantitative PCR was carried out using PowerUp SYBR Green Master Mix (Thermo Fisher) with primers as detailed in Tables S1 and S2 and normalized to Rpl39 or to Actin.
Western blotting analysis
Skeletal muscle tissues were homogenized in RIPA buffer containing 10 mM sodium pyrophosphate, 100 mM sodium fluoride, 10 mM sodium orthovanadate, 5 μg/mL of aprotinin, 1 mg mL−1 of leupeptin, and 1 mM phenylmethyl‐sulfonyl fluoride. Lysates were subjected to sodium dodecyl sulfate polyacrylamide gel electrophoresis, blotted using antibodies listed in Tables S3 and S4, and visualized using enhanced chemiluminescence (ECL) reagents on ChemiDoc XRS+ System (Bio‐Rad). Band intensities were quantified using the software ImageJ/Fiji (version 1.51, National Institutes of Health, USA).
In vivo muscle mechanics
In vivo force measurements were performed as described previously.27 Briefly, mice were anaesthetized and stainless‐steel electrode wires were placed on either side of the sciatic nerve. Torque production of the plantar flexors was measured using a muscle lever system (Model 305c; Aurora Scientific). The force–frequency curves were determined by increasing the stimulation frequency in a step wise manner, pausing for 30 s between stimuli to avoid effects due to fatigue. Muscle force was normalized for the mass of the triceps sural muscle.
Metabolites and hormone measurements
Blood glucose concentrations were determined using the glucometer Accu‐Check Performa Nano (Roche). Serum insulin levels and muscular cAMP levels were measured using a method based on a competitive enzyme immunoassay system (Millipore and GE Healthcare, respectively). Serum corticosterone levels were measured by specific radioimmunoassay as previously described.50
Plasmids, drugs, and reagents
YFP‐LC3 plasmid was obtained from Dr Eiki Kominami (Juntendo University School of Medicine, Tokyo, Japan) and has been previously described.51 The DBE‐FoxO reporter containing six forkhead (DAF‐16) binding sites was previously described30; pRL‐null Renilla was from Promega. All drugs and reagents were purchased from Sigma‐Aldrich (St. Louis, Missouri), Thermo Scientific (Waltham, Massachusetts), HyClone (Pittsburgh, PA), Invitrogen (Carlsbad, CA), Calbiochem EMD Biosciences (La Jolla, CA), or Amersham Biosciences (Piscataway, NJ).
Statistics
The data are presented as the mean ± standard error mean. The means from different groups were analysed using unpaired Student's t‐test. Multiple comparisons were made using one‐way ANOVA or two‐way ANOVA followed by a Tukey post hoc test in normally distributed variables or those that showed a normal distribution after loge transformation. The normality of the dependent variables was assessed using the Kolmogorov–Smirnov test. P ≤ 0.05 was taken as the criterion for significance.
Study approval
Animal studies were performed according to protocols approved by Ribeirão Preto Medical School from the University of São Paulo–Ethical Commission of Ethics in Animal Research (CETEA; no 130/2012).
Results
The stimulation of β2‐AR increases protein synthesis in muscles from fed mice and suppresses the activities of autophagy and FoxO in fed and fasted mice
As expected, fasting for 2 days reduced body mass (25 ± 0.6 vs. 30.2 ± 0.8 g in fed group, n = 12–13, P ≤ 0.05) and TA mass (48.2 ± 1.3 vs. 53.8 0.02 mg in fed group, n = 12–13, P ≤ 0.05). These effects were associated with an increase (60%) in the total protein degradation, as determined in vitro by tyrosine release, and a decrease (35%) in protein synthesis, as estimated in vivo by SUnSET method49 (Figure S1C–S1E). A single injection of FOR (300 μg kg−1) did not alter muscle protein synthesis in fasted mice (Figure S1C–S1D) but increased it at 60 min in fed mice (Figure S1A–S1B). In fasting setting, FOR tended to reduce (66%, P = 0.06) the high protein levels of Atrogin‐1 (Figure 1A–1B), a sensitive marker of muscle protein degradation by UPS, to values similar to control fed mice. At 30 and 60 min after injection, FOR reduced by ~65% both LC3‐II content and LC3‐II/LC3‐I ratio in muscles from fed (Figure S3D and S3G) and fasted (Figure 1C–1D) mice indicating an inhibition of autophagy. In order to measure autophagic flux, mice were concomitantly fasted and treated for 2 days with colchicine (COL), a microtubule‐disrupting agent that inhibits autophagosome‐lysosome fusion.47 This treatment induced the accumulation of LC3‐II (four‐fold) in muscles from fasted mice, and FOR reduced it by 67% at 30 min (Figure 1E–1F), indicating that β2‐AR stimulation transiently represses the net autophagic flux during food deprivation. Moreover, fasting‐induced overall proteolysis in isolated muscles was significantly reduced (~30%) by the addition of 10−4 M FOR or the classical β2‐agonist CB to the incubation medium for 2 h (Figure S1E).
Figure 1.
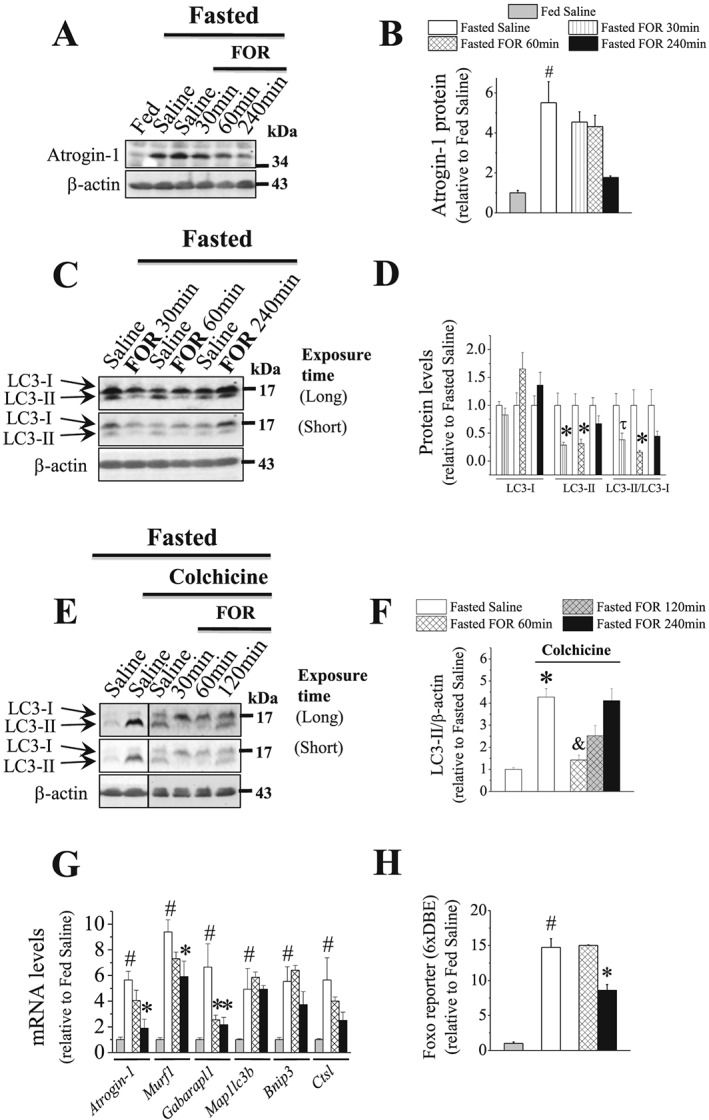
The acute stimulation of β2‐AR suppresses the ubiquitination markers and the activities of autophagy and FoxO transcription factors in muscles during fasting. (A–G) The temporal effects of a single injection of FOR (300 μg kg−1; sc) on (A–B) the protein content of Atrogin‐1 (n = 3–7/group), on LC3‐II/LC3‐I ratio in the (C–D) absence (n = 3–4/group) and (E–F) presence of COL (n = 4–10/group; the blots are from samples run on separate gels) and on (G) the expression of FoxO‐target genes (n = 3–7/group) in muscles from 2‐day fasted mice. (H) The temporal effects of FOR on FoxO transcriptional activity in TA muscles from fasted mice transfected with FoxO‐dependent reporter, in which the FoxO binding site is repeated six times (6xDBE‐reporter) (n = 3–6/group). (# P ≤ 0.05 vs. fed saline group; * P ≤ 0.05 vs. fasted saline group; and P ≤ 0.05 vs. fasted saline group treated with COL; τ P = 0.07 vs. fasted saline group, ANOVA.)
Fasting also caused a dramatic increase in FoxO activity (~15‐fold; Figure 1H) and in the expression of its downstream target genes the Ub‐ligases Atrogin‐1 (~5.5‐fold) and Murf1 (~9.5‐fold) and the ALS‐related genes Gabarapl1 (6.5‐fold), Map1lc3b (~5‐fold), Bnip3 (5.5‐fold), and Ctsl (5.5‐fold) (Figure 1G). At 60 min, FOR induced a 60% reduction in Gabarapl1 mRNA without affecting other genes and FoxO activity (Figure 1G–1H). At 240 min, FOR down‐regulated the transcriptional activity of FoxO (~40%) and the mRNA levels of Atrogin‐1 (70%), Murf1 (~40%), and Gabarapl1 (~60%) (Figure 1G–1H). Thus, our data suggest that the acute stimulation of β2‐AR enhances protein synthesis and inhibit autophagy in muscles from fed mice and suppresses UPS and ALS by down‐regulating delivery of substrate to proteasome and lysosome in fasted state. In addition, we provide the first direct evidence that FoxO transcriptional activity in skeletal muscle is inhibited by a β2‐agonist.
The stimulation of β2‐AR induces hyperinsulinemia and stimulates INS/IGF1 signalling in muscles from fed and fasted mice
Fasting induced a marked increase (~eight‐fold) in serum corticosterone levels (Figure S2A), a key hormone required to activate muscle protein catabolism during food deprivation.52 Fasting also decreased (82%) serum insulin (INS) levels (Figure 2G) that was accompanied by down‐regulation of the phosphorylation levels of ERK1/2 (42%) in TA muscles (Figure 2A and 2D) and of Akt (77%), FoxO1 (30%), and ERK1/2 (~40%) in gastrocnemius muscles (Figure S2B–S2E). The levels of cAMP were reduced (36%; Figure 2F), and the phosphorylation of the cAMP response element‐binding protein (CREB) showed a trend toward lower levels (~30%; Figure 2A and 2E) in TA muscles from fasted mice. In gastrocnemius muscles, CREB phosphorylation was significantly reduced (58%; Figure S2A and S2F) by fasting, indicating a low sympathetic activity in skeletal muscles during food deprivation as previously shown in a recent study from our group10 in fasted rats. Interestingly, FOR treatment caused a huge elevation of serum INS levels (Figure 2G) from 30 (~25‐fold) to 240 min (~10‐fold) and increased the phosphorylation levels of Akt (6.5‐fold), FoxO1 (4‐fold), and ERK1/2 (~2‐fold) in TA muscles at 30 min (Figure 2A–2D). In gastrocnemius muscles, FOR caused similar effects on the phosphorylation levels of FoxO1, Akt, and ERK1/2 at 15 min (Figure S2B–S2E). FOR increased cAMP content (~55%) in TA muscles at 60 and 240 min (Figure 2F) and CREB phosphorylation (three‐fold) in gastrocnemius muscles at 15 min (Figure S2F). Except for cAMP and Akt phosphorylation that remained elevated until 240 min, the phosphorylation of FoxO1 and ERK1/2 gradually reduced in muscles from FOR‐treated fasted mice, reaching values similar to that in saline‐treated fasted mice at 240 min (Figure 2A–2F). Fasting‐induced increase in serum corticosterone levels were unaffected by FOR at 30 min (Figure S2A). In fed mice, FOR also increased serum INS levels (4‐fold) and the phosphorylation levels of Akt (4.4‐fold), FoxO1 (~3‐fold), ERK1/2 (50%), and the ribosomal protein S6 (17‐fold for Ser235/236 and 7‐fold for Ser240/244) at 30 min in TA muscles (Figure S3A–S3F). CREB phosphorylation tended to up‐regulate (66%) in FOR‐treated fed mice (Figure S3A–S3B). At 120 min, although FOR effects on the phosphorylation of Akt, FoxO1, and ERK1/2 were still observed, INS levels and S6 phosphorylation returned to basal values (Figure S3A–S3F). Curiously, FOR decreased (40%) and increased (the band was absent in fed saline group) 4EBP1 phosphorylation and its hypophosphorylated α form, respectively, at 120 min, without affecting them at 30 min (Figure S3D and S3F). GSK3α/β phosphorylation was unaltered by FOR at any studied period (Figure S3D and S3F). Taken together, these findings suggest the involvement of two classical INS/IGF1 downstream targets, Akt and ERK1/2, in the anabolic and anti‐proteolytic actions of FOR in muscles from fed and food‐deprived mice, respectively, and raise the possibility that at least part of these effects might be indirectly mediated by the FOR‐induced rise in INS.
Figure 2.
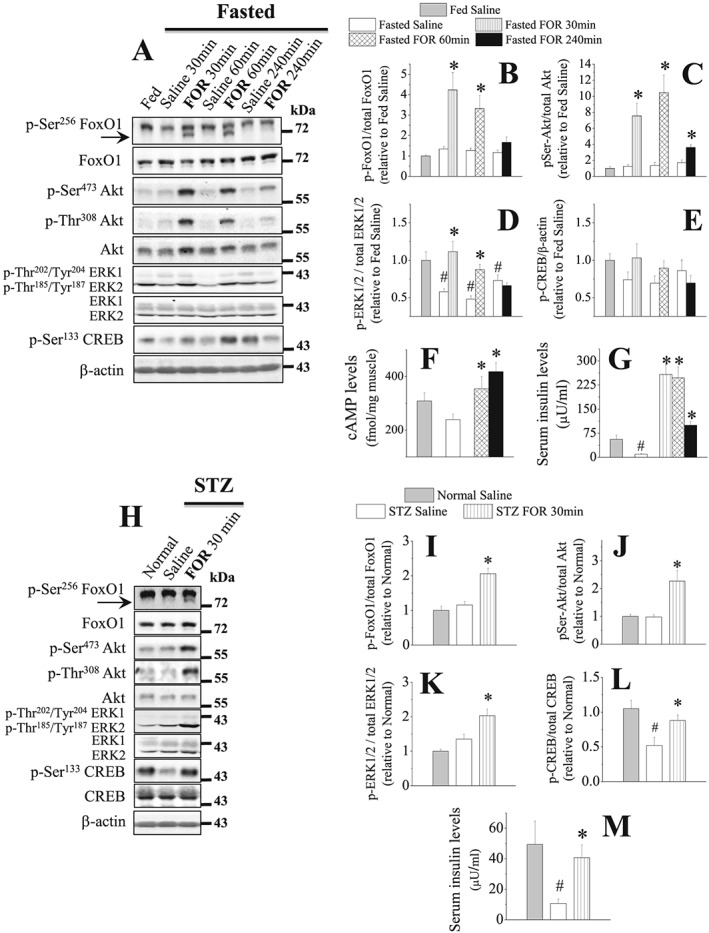
The stimulation of β2‐AR increases INS levels and the activation status of Akt and ERK1/2 in muscles from 2‐day fasted and 3‐day streptozotocin (STZ)‐diabetic mice. (A–G) The temporal effects of a single injection of FOR (300 μg kg−1; sc) on (A–E) total protein content and phosphorylation levels of FoxO1, Akt, ERK1/2, and CREB (n = 4–6/group) as well as on (F) cAMP levels (n = 4–7/group) in TA muscles and (G) insulin levels (n = 4–5/group) in serum from fed and 2‐day fasted mice. (H–M) The effects of FOR on (H–L) total protein content and phosphorylation levels of FoxO1, Akt, ERK1/2, and CREB in TA muscles (n = 4–6/group) and on (M) insulin levels (n = 3–5/group) in serum from normal and STZ‐treated mice. (# P ≤ 0.05 vs. fed or Normal saline; * P ≤ 0.05 vs. fasted or STZ saline, Student's t‐test for western blot in fasting and ANOVA for the others.)
INS/IGF1 signalling mediates the effects of β2‐AR stimulation on Akt signalling and proteolysis markers in muscles from fasted mice
In order to prevent the rise in serum INS levels induced by the stimulation of β2‐AR, mice were treated with streptozotocin (STZ) to cause β‐cell death and then INS deficiency. Similar to fasted mice, FOR was able to rescue the low serum INS levels (Figure 2M) and induced an approximately 2‐fold increase in the muscle phosphorylation levels of Akt, FoxO1, ERK1/2, and CREB (Figure 2H–2L) at 30 min in 3‐day STZ mice. Because it has been described53 that STZ reduces but does not eliminate INS from mouse pancreas, it is likely that the rise in INS levels caused by β2‐AR stimulation in STZ‐treated mice comes from the remaining β‐pancreatic cells. To further evaluate the role of INS in the anti‐catabolic effects of FOR, muscle‐specific INS receptor (IR) knockout mice (M‐IR−/−), which exhibit a muscle‐specific ablation of IR signalling,41 were fasted and then treated with FOR or saline. As expected, the stimulatory effects of FOR on the phosphorylation levels of Akt (~7‐fold), FoxO (~2.5‐fold), S6 (35‐fold), and CREB (4‐fold) in littermate control mice were significantly reduced in M‐IR−/− mice (Figure 3A–3E and 3G). S6 phosphorylation in M‐IR−/− muscles showed a trend toward higher levels (~3.5‐fold) 30 min after FOR injection, but the magnitude of this response was smaller than in control mice (Figure 3A and 3E). Curiously, despite the high intragroup variability, β2‐agonist treatment in M‐IR−/− mice tended to down‐regulate LC3‐II/LC3‐I ratio (84%) and Atrogin‐1 mRNA (50%) similar to WT mice (Figure 3A, 3F, and 3H). FOR also tended to similarly increase (~3‐fold) circulating INS levels in both WT and M‐IR−/− mice (Figure 3I). ERK1/2 phosphorylation was unaltered in any condition (Figure 3A and 3D). Confirming the genotype, the mRNA levels of Insr, the gene that encodes for IR, was dramatically reduced (90%) in muscles from M‐IR−/− mice (Figure 3H).
Figure 3.
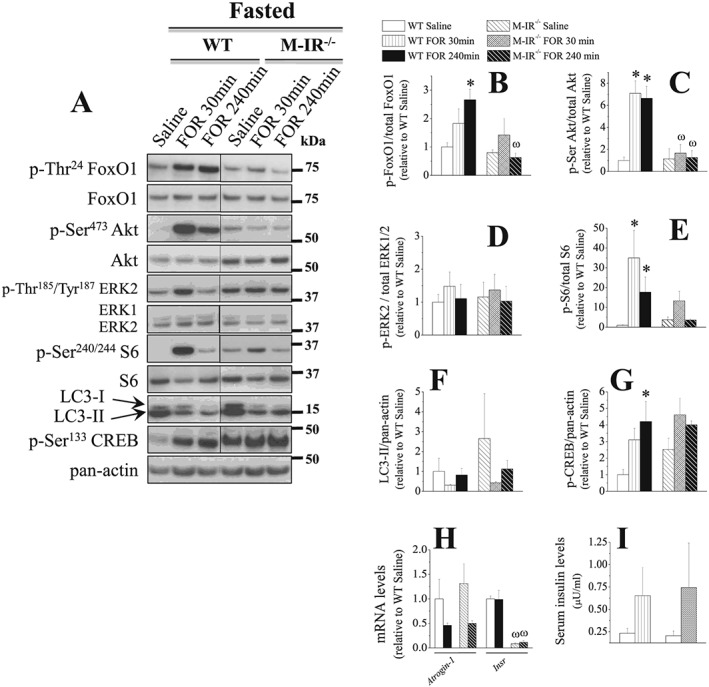
The stimulation of β2‐AR suppresses catabolic markers, but does not activate Akt signalling, in skeletal muscles from 2‐day fasted, INS‐resistant M‐IR−/− mice. The temporal effects of a single injection of FOR (300 μg kg−1; sc) on (A–G) total protein content and phosphorylation levels of FoxO1, Akt, ERK1/2, S6, and CREB as well as on the content of LC3‐I and LC3‐II and (H) mRNA levels of Atrogin‐1 and Insr (mouse insulin receptor) in TA muscles and (I) insulin (INS) levels in serum from 2‐day fasted WT and M‐IR−/− mice (n = 3/group). (* P ≤ 0.05 vs. respective saline‐treated group; ω P ≤ 0.05 vs. respective WT group, two‐way ANOVA.)
Although these data suggest that at least part of the in vivo effects of β2‐sympathomimetic on Akt signalling depends on IR, they do not rule out the possibility that INS is mediating such effects by binding to IGF1 receptor (IGF1R).16 Thus, we used a mouse strain known as MKR, which overexpresses in skeletal muscle a dominant negative (d.n.) IGF1R able to abrogate the IGF1 and INS intracellular signalling.42 In fasted WT mice, FOR also activated Akt/FoxO and Akt/mTORC1/p70S6K/S6 signalings at 30 min (Figure 4A–4E). As expected due to the stimulation of INS/IGF1/Akt signalling in skeletal muscle, FOR caused a reduction in glycemia 30 min after the injection in WT mice (Figure S4B). In addition, FOR suppressed the expression of FoxO‐target genes Atrogin‐1 (80%), Smart (30%), and Musa1 (60%) (Figure 4H) and the content of LC3‐II (38%; Figure 4A and 4F) induced the expression of CREB target gene Sik1 (5‐fold; Figure S4A) at 240 min. Except for Sik1 and Smart mRNAs, all effects of FOR were completely prevented in MKR mice (Figures 4 and S4). Interestingly, at 240 min, FOR induced a delayed stimulation of S6 phosphorylation (~4‐fold) and had a stronger effect on Sik1 mRNA (~2.5‐fold) in MKR mice compared with WT mice (Figures 4A and 4E and S4A). The expression of 4epb1, a FoxO‐target gene, was higher in MKR than in WT mice and was unaffected by FOR (Figure 4H). ERK1/2 phosphorylation and Fbxo31 expression were unchanged in any group. The genotype of MKR mice was confirmed by the up‐regulation (~15‐fold) of IGF1R mRNA (Figure 4H). Altogether, these results indicate that the acute stimulation β2‐AR by FOR requires INS/IGF1 signalling to activate Akt and to suppress proteolysis in skeletal muscles from fasted mice.
Figure 4.
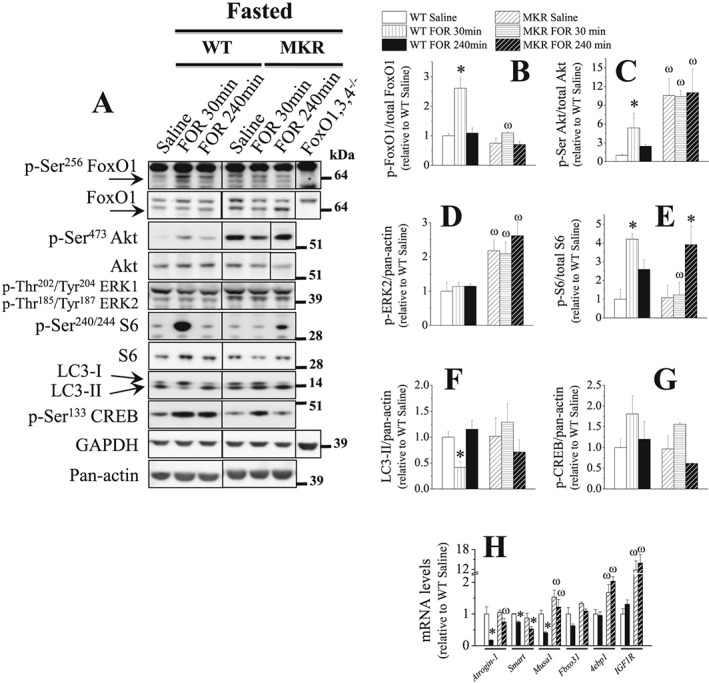
The muscle anti‐catabolic signals induced by β2‐AR stimulation in 2‐day fasted mice depends on the integrity of INS/IGF1 signalling. The effects of FOR on (A–G) total protein content and phosphorylation levels of FoxO1, Akt, ERK1/2, S6, and CREB as well as on the content of LC3‐I and LC3‐II and (H) mRNA levels of Atrogin‐1, Smart, Musa1, Fbxo31, 4ebp1, and IGF1R (human IGF1 receptor) in TA muscles from fasted WT and MKR mice (n = 3–5/group). Black lines between lanes indicate that samples were run on the same gel but were noncontiguous. (* P ≤ 0.05 vs. respective saline‐treated group; ω P ≤ 0.05 vs. respective WT group, two‐way ANOVA.)
PI3K/Akt/mTORC1 signalling is the intracellular mediator of the suppressive effect of β2‐agonist on autophagy and proteolysis in muscles from fasted rodents
In order to determine which intracellular signalling pathway is responsible for the suppression of muscle proteolysis induced by the in vitro stimulation of β2‐AR, pharmacological approaches were used to interfere with Akt and ERK1/2. In isolated EDL muscles from fasted rats, the incubation with FOR (10−4 M) during 120 min increased Akt (70%), FoxO1 (~5.5‐fold), and CREB (47%) phosphorylation, without altering ERK1/2 phosphorylation (Figure S5). The addition of triciribine (10 μM, an Akt inhibitor), but not of U0126 (10 μM; an inhibitor of MEK/ERK1/2 signalling), abolished the anti‐proteolytic effect of FOR (Figure 5A) indicating that β2‐agonist inhibits proteolysis in an Akt‐dependent and ERK1/2‐independent manner. Consistently, the coincubation with wortmannin (0.5 μM, a PI3K inhibitor) mimicked triciribine by blocking the inhibitory action of FOR in muscle proteolysis (Figure 5A). As shown in Figure 5B–5C, wortmannin and triciribine efficiently reduced by ~65% Akt phosphorylation, while U0126 reduced by 50% ERK1/2 phosphorylation and increased by 3‐fold Akt phosphorylation.
Figure 5.
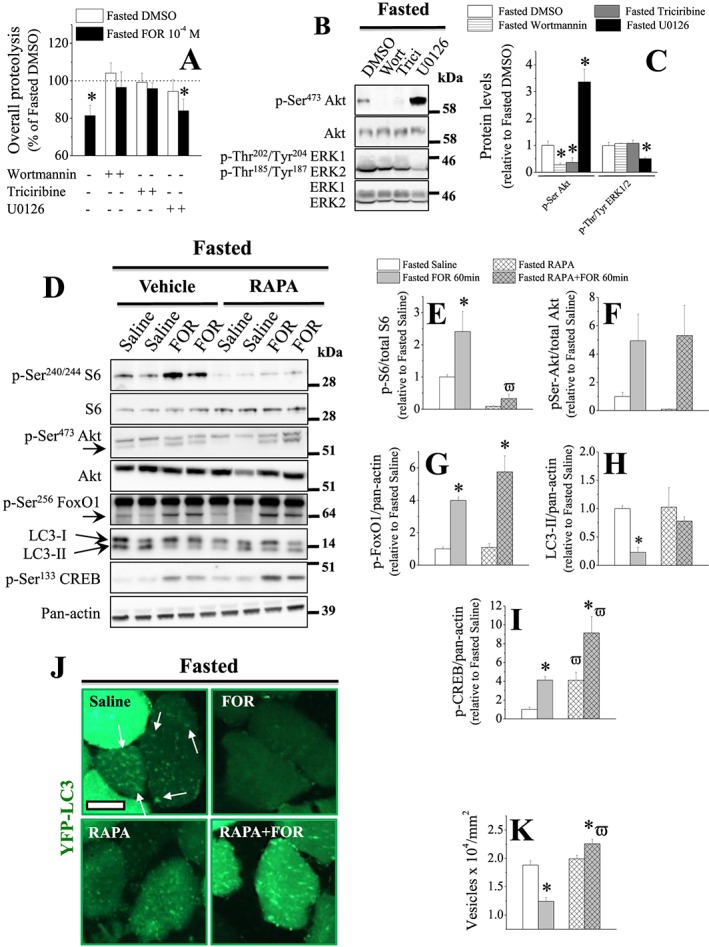
The stimulation of β2‐AR inhibits proteolysis via PI3K/Akt pathway and autophagy via mTORC1 in skeletal muscles from 2‐day fasted rodents. In vitro effects of the PI3K inhibitor wortmannin (wort; 0.5 μM), the Akt inhibitor triciribine (10 μM) and the MEK/ERK1/2 inhibitor U0126 (10 μM) on (A; n = 5–6/group) the inhibition of overall proteolysis induced by FOR (10−4 M) and (B–C; n = 4/group) total protein content and phosphorylation levels of Akt and ERK1/2 in EDL muscles from fasted rats. Muscles were isolated and pre‐incubated with inhibitors for 30 min and then incubated with inhibitors and/or FOR for 2 h. Data of overall proteolysis are expressed as % of values in EDL muscles from fasted rats incubated with DMSO (considered as 100%; 0.321 ± 0.014 nmol mg−1 2 h−1). (D–K) The in vivo effects of mTORC1 inhibition by rapamycin (RAPA; 400 μg kg−1; ip; 2 h prior to FOR) on (D–I) total protein content and phosphorylation levels of S6, Akt, FoxO1, and CREB as well as on the content of LC3‐I and LC3‐II (n = 3–4/group) and (J–K) the number of autophagosomes (i.e. YFP‐LC3‐positive dots, n > 100 fibres each muscle from 3–4 mice/group) in muscles from fasted mice. (J) Representative images of histology cross sections of TA muscles transfected with plasmid encoding YFP‐LC3 and (K) quantification of autophagic vesicles. Scale bar, 25 μm. (* P ≤ 0.05 vs. fasted DMSO group; ϖ P ≤ 0.05 vs. respective group treated with vehicle of RAPA, Student's t‐test for two groups and two‐way ANOVA for more.)
To further investigate the contribution of mTORC1, a target of Akt signalling, to the inhibition of autophagy by β2‐AR stimulation, 2‐day fasted mice, whose muscles were previously transfected with plasmid encoding a fluorescent marker of autophagosome formation YFP‐LC3, received one injection of mTORC1 inhibitor rapamycin (RAPA) prior to FOR. RAPA treatment caused an expected reduction (~90%) in S6 phosphorylation (Figure 5D–5E). mTORC1 inhibition also induced a decrease and an increase, respectively, in Akt (~90%) and CREB (~4‐fold) phosphorylation (Figure 5D, 5F, and 5I). RAPA efficiently blocked FOR‐induced S6 phosphorylation and LC3‐II down‐regulation, without altering the effects of β2‐agonist on Akt and FoxO phosphorylation (Figure 5D–5H). CREB phosphorylation was further increased (~2‐fold) by FOR in muscles from RAPA‐treated mice (Figure 5D and 5I). Consistently with the results obtained by immunoblot, FOR caused a marked reduction (34%) in the presence of YFP‐LC3‐positive vesicles (Figure 5J and 5K). Intriguingly, the inhibitory effect of FOR on autophagosome formation observed in saline‐treated animals was the opposite in muscles from RAPA‐treated mice, that is, β2‐agonist caused a further increase (13%) in the number of YFP‐LC3‐positive vesicles (Figure 5J and 5K). Taken together, these results demonstrate that β2‐AR stimulation requires PI3K/Akt/mTORC1 signalling, but not MEK/ERK1/2, to inhibit autophagy and protein breakdown in skeletal muscle from fasted mice.
INS/IGF1 signalling mediates growth‐promoting effects induced by chronic stimulation of β2‐AR
Because it is well‐known that chronic treatment with β2‐agonists induces muscle hypertrophy,4, 20, 22, 54 we investigated the role of INS/IGF1 signalling in mediating such effects in FOR‐treated mice. Fed WT and MKR mice were treated with FOR (300 μg kg−1 day−1) for 30 days, being the last injection administered 30 min before euthanasia. In WT mice, FOR caused an increase in body mass (11%), the ratio of muscle mass‐to‐body mass (~15%), and the average CSA of all fibres in TA muscles (30%), an effect that was associated with the increase (~30%) in CSA of type IIB fibres (Figure 6A–6E). Gastrocnemius muscle also presented hypertrophy after chronic FOR treatment (Figure 6B), but soleus muscle was unaffected (data not shown). As previously reported,55 MKR mice presented lower (~10%) body mass at the beginning of the treatment (Figures 6A). Unexpectedly, saline‐treated MKR mice showed 8% increase in their body mass within 30 days, which may be attributed to the compensatory muscle hyperplasia already described in MKR mice growing to adulthood.55 Additionally, transgenic mice showed a reduced (~15%) muscles masses and average fibre CSA due to effects on type IIB fibres (Figure 6B–6E). FOR did not alter any of these parameters in MKR mice but, unexpectedly, caused a decrease (16%) in CSA of type IIA fibres (Figure 6A–6E). The analysis of CSA in oxidative mitochondrial rich (dark fibres) and glycolytic mitochondrial poor (pale fibres) fibres by SDH staining confirmed the results obtained in immunostaining for MHC isoforms, except for oxidative fibres that had a slight increase (14%) compared with glycolytic fibres (38%) in FOR‐treated WT mice (Figures 7J and S7D).
Figure 6.
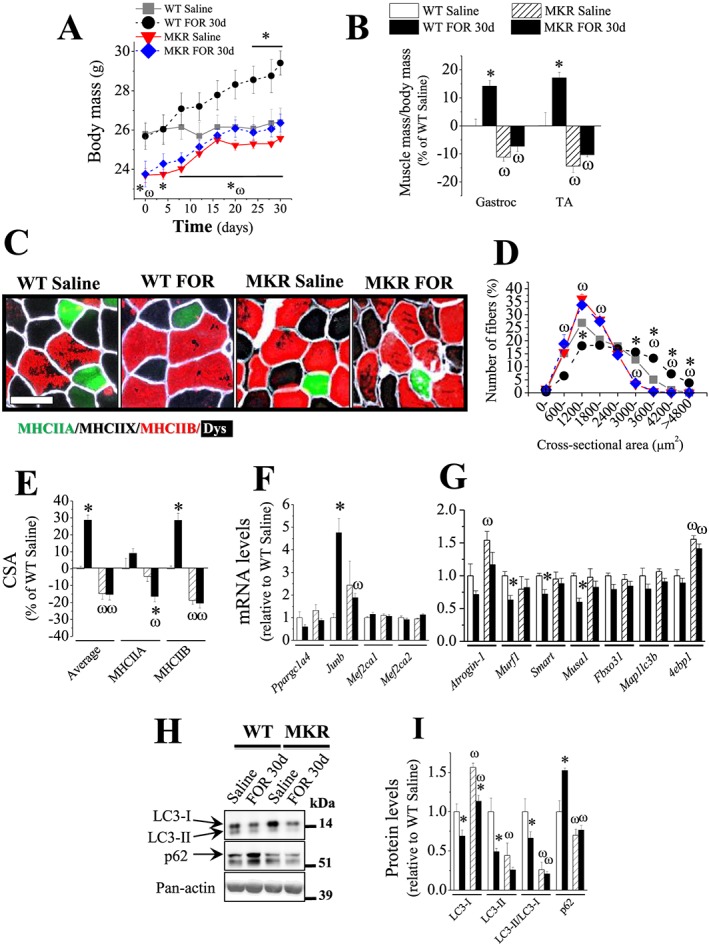
Chronic stimulation of β2‐AR by FOR promotes body and muscle growth and a gene expression profile favouring protein anabolism in INS/IGF1 signalling‐dependent manner. (A–B) The in vivo effects of chronic treatment with FOR (300 μg kg−1 day−1; for 30 days; sc) on masses of (A) body and (B) gastrocnemius and TA muscles from fed WT and MKR mice (n = 3–5/group). (C) Representative images of immunostaining in TA cross sections for the different isoforms of myosin heavy chains (MHC) and the cell membrane marker dystrophin (Dys). Scale bar, 50 μm. (D) Frequency histogram of TA muscles showing the distribution of cross‐sectional areas (CSA, μm2) of fed WT and MKR mice after chronic treatment with FOR (n = 3–5/group). (E–H) The effects of FOR on (E) mean CSA of MHCIIA, MHCIIB and all (average) fibres, mRNA levels of (F) hypertrophic and (G) atrophic genes and (H–I) protein content of autophagy markers LC3‐I and LC3‐II and p62 in TA muscles from fed WT and MKR mice (n = 3–5/group). (* P ≤ 0.05 vs. respective saline‐treated group; ω P ≤ 0.05 vs. respective WT group, two‐way ANOVA.)
Figure 7.
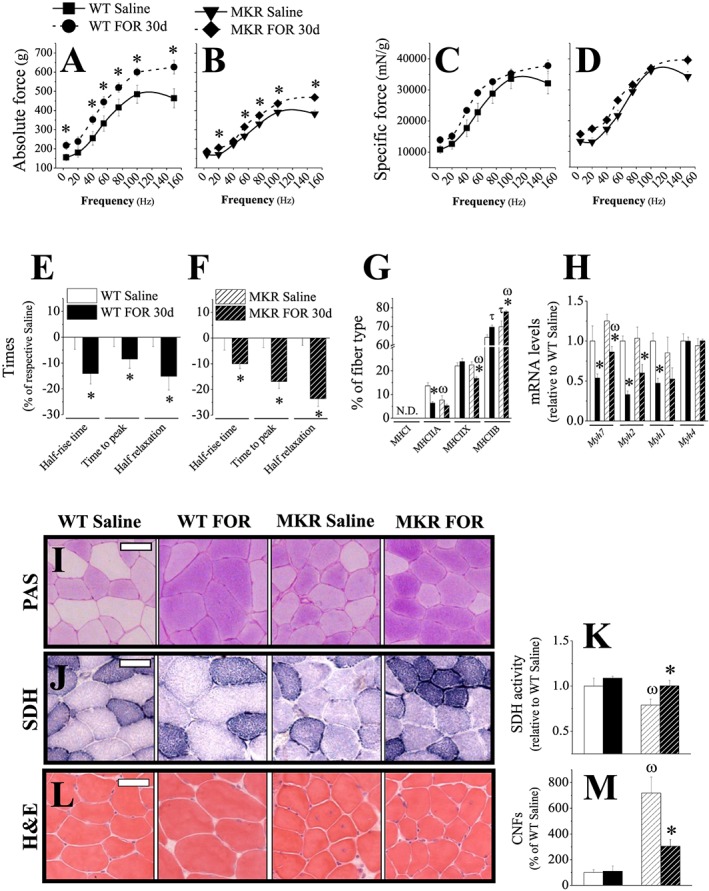
Chronic stimulation of β2‐AR by FOR increases muscle force, induces a fast‐glycolytic phenotype and reduces the prevalence of regenerating fibres independently of INS/IGF1 signalling. (A–D) Force‐frequency curves and (E–F) contraction kinetics measured in vivo on triceps sural muscles (n = 9–14 muscles each from 5–7 mice/group) as well as (G) proportion of fibres containing MHCI, MHCIIA, MHCIIX and MHCIIB (analysed from Figure 6C) and (H) the expression their respective mRNA (i.e. Myh7, Myh2, Myh1 and Myh4) levels in TA muscles (n = 3–5/group) from fed WT and MKR mice chronically treated with FOR (300 μg kg−1 day−1; for 30 days; sc). (I–K) representative images of (I) periodic acid‐Schiff (PAS) and (J) succinate dehydrogenase (SDH) activity stainings in TA cross sections (n = 3–5/group). Scale bar, 50 μm. Quantification of SDH activity is shown on (K) and cross‐sectional area (CSA) of oxidative mitochondrial rich (dark fibres) and glycolytic mitochondrial poor (pale fibres) fibres on the supplemental material. (L) Representative images of haematoxylin and eosin (H&E) staining and (M) quantification of the number of centrally nucleated fibres (CNFs) in TA cross sections (n = 3–5/group). Scale bar, 50 μm. (* P ≤ 0.05 vs. respective saline‐treated group; ω P ≤ 0.05 vs. respective WT group. τ P = 0.06 vs. respective control group, Student's t‐test for two groups and two‐way ANOVA for more.)
Next, we focused on the well‐established markers of muscle atrophy and hypertrophy. In WT mice, FOR treatment up‐regulated the hypertrophic gene Junb (4.8‐fold) and down‐regulated the gene expression of Murf1 (40%), Smart (30%), and Musa1 (40%) suggesting a suppression of UPS (Figure 6F–6G). Moreover, FOR reduced autophagy as estimated by the reduction of LC3‐II (51%) and LC3‐II/LC3‐I ratio (34%) and the accumulation of the protein marker of autophagic flux p62 (52%) (Figure 6H–6I). FOR also increased the expression of the CREB target gene Sik1 (2.4‐fold) (Figure S6B). The hypotrophic phenotype of MKR mice was paralleled by an up‐regulation of Atrogin‐1 (50%) and 4ebp1 (60%) mRNAs and a down‐regulation of LC3‐II/LC3‐I ratio (74%) and p62 protein (30%) (Figure 6G–6I). FOR treatment in MKR mice was unable to affect these atrophy/hypertrophy markers. The levels of the hypertrophic genes Ppargc1a4 (Pgc‐1α4), Mef2ca1, and Mef2ca2 and the CREB target gene Ppargc1a (Pgc‐1α) did not change in any condition (Figures 6F and S6B). Altogether, these findings show that chronic stimulation of β2‐AR promotes body and muscle growth and induces a molecular profile favouring protein anabolism by a mechanism that depends on the integrity of INS/IGF1 signalling.
INS/IGF1 signalling partially contribute to strength gain but does not mediate fibre type shift induced by chronic stimulation of β2‐AR
To investigate further whether or not muscle hypertrophy induced by β2‐AR stimulation is functionally relevant and the involvement of INS/IGF1 signalling in such effect, we measured muscle force and contraction kinetics in living WT and MKR mice chronically treated with FOR. Force‐frequency curves show that FOR increased absolute force in muscles from both WT and MKR mice (Figure 7A–7B). Maximum absolute tetanic force, obtained when stimulating at 100 Hz, was higher in both WT (~24%) and MKR (~12%) mice treated with FOR when compared with their respective saline‐treated groups (Figure S7A–S7B). Interestingly, when the stimulation was performed at 150 Hz, WT (~58%) and MKR (~18%) mice treated with FOR were able to continue increasing force production compared with saline‐treated mice, whose force‐frequency curves presented a plateau (Figure 7A–7B). Thus, FOR effects on strength gain were more pronounced in WT than in MKR mice. However, when values were normalized to muscle mass, no change in force (specific force) was detected in both WT and MKR mice treated with FOR (Figures 7C–7D and S7A–S7B). We also observed that FOR induced a significant decrease in half‐rise time (WT: 14%; MKR: 10%), time to peak (WT: 8%; MKR: 17%) and half relaxation time (WT: 15%; MKR: 24%) independently of the genotype (Figure 7E–7F). The analysis of these data revealed that FOR caused more prominent alterations in time parameters in MKR than in WT mice, indicating a shortening of Ca2+ transients and/or an acceleration of cross‐bridge turnover kinetics.
Immunostaining for MHC isoforms showed that TA muscles from FOR‐treated mice presented a faster phenotype, an effect more evident in MKR than in WT mice. FOR induced a significant decrease (54%) in the proportion of type IIA fibres and tended to increase (~10%, P = 0.06) IIB fibres in WT mice (Figures 6C and 7G). Similar muscle phenotype was detected in saline‐treated MKR mice (Figures 6C and 7G). In these mutants, FOR reduced (24%) the number of type IIX fibres and caused a further increase (21%) in type IIB fibres (Figures 6C and 7G). Again, type I fibres were not detected in any group. Consistently with the histology, the mRNA levels of the gene that encodes for MHCI (Myh7, 50%), MHCIIA (Myh2, 70%), and MHCIIX (Myh1, 50%) were down‐regulated by FOR in muscles from both WT and MKR mice equally (Figure 7H). No change was observed in Myh4 (MHCIIB) mRNA in any condition (Figure 7H). Next, we further characterized fibre type identity by estimating glycogen content and mitochondria activity in cryosections stained for PAS and SDH activity, respectively. Qualitative analysis of glycogen by PAS staining revealed that FOR treatment in WT mice induced a carbohydrate accumulation (Figure 7I). Saline‐treated MKR mice also presented darker PAS staining in TA muscles when compared with WT mice and FOR treatment did not cause any additional change (Figure 7I). SDH activity showed no major alterations in FOR‐treated WT mice but had a significant reduction (21%) in saline‐treated MKR mice that was restored to basal WT values by FOR treatment (Figure 7J–7K). A more detailed inspection of H&E stained transverse muscle sections revealed a marked increase (7‐fold) in the number of centrally nucleated fibres (CNFs) in saline‐treated MKR mice (Figure 7L–7M), a feature of regenerating muscles. This abnormality was reduced (57%) by FOR treatment, contributing to the improvement in muscle force and health in hypotrophic mice. FOR did not alter the occurrence of CNFs in WT mice (Figure 7L–7M). Taken together, these results suggest that although INS/IGF1 signalling is partially required for strength gain induced by FOR, probably by mediating muscle growth, it does not mediate fibre type transition, faster contractile kinetic and the decrease in the number of CNFs after chronic stimulation of β2‐AR.
Chronic stimulation of β2‐AR suppresses INS/IGF1 signalling pathway
As shown in Figure 8, in contrast to the acute treatment in fed and fasted mice, chronic treatment of WT mice with FOR did not increase the phosphorylation levels of Akt and caused an opposite effect on its targets by reducing the phosphorylation status of proteins involved in proteolysis, FoxO1 (Thr24; ~60%) and FoxO3 (Ser318/321; 66%), and protein synthesis, GSK3β (41%). The phosphorylation levels of ERK2 (43%) and its downstream target 4EBP1 at Ser65 (39%) were also reduced by β2‐agonist. The phosphorylation levels of the targets of mTORC1 signalling, p70S6K and S6, and CREB were unaffected by FOR in WT. As previously reported,56 Akt phosphorylation (~13‐fold) and total protein (81%) were increased in muscles from MKR mice. Consequently, the phosphorylation status of S6 (2.2‐fold) and 4EBP1 (Thr37/46, 55%), another mTORC1 target, were also elevated. Total 4EBP1 protein was also up‐regulated (~30%). In contrast, FoxO1 and FoxO3 phosphorylation was unchanged. FOR treatment in transgenic mice did not affect Akt (phosphorylated and total protein) and total 4EBP1 protein but reduced the phosphorylation levels of p70S6K (23%), S6 (62%), and 4EBP1 at Ser65 and Thr37/46 (~45%), restoring the activation status of mTORC1 pathway to basal levels. Similarly, CREB phosphorylation was higher (2‐fold) in MKR muscles, an effect that was normalized by FOR. Unlike WT mice, MKR mice were resistant to the down‐regulation of GSK3β and ERK1/2 phosphorylation induced by FOR. As observed in WT mice, the phosphorylation levels of FoxO1 and FoxO3 were suppressed ~45% by FOR in hypotrophic muscles of transgenic mice. In addition, total FoxO3 protein (36%) was significantly reduced. The phosphorylation status of FoxO1 at Ser319 and Ser256 (data not shown) and FoxO4 at Ser262 did not alter in any group (Figure 8C–8D).
Figure 8.
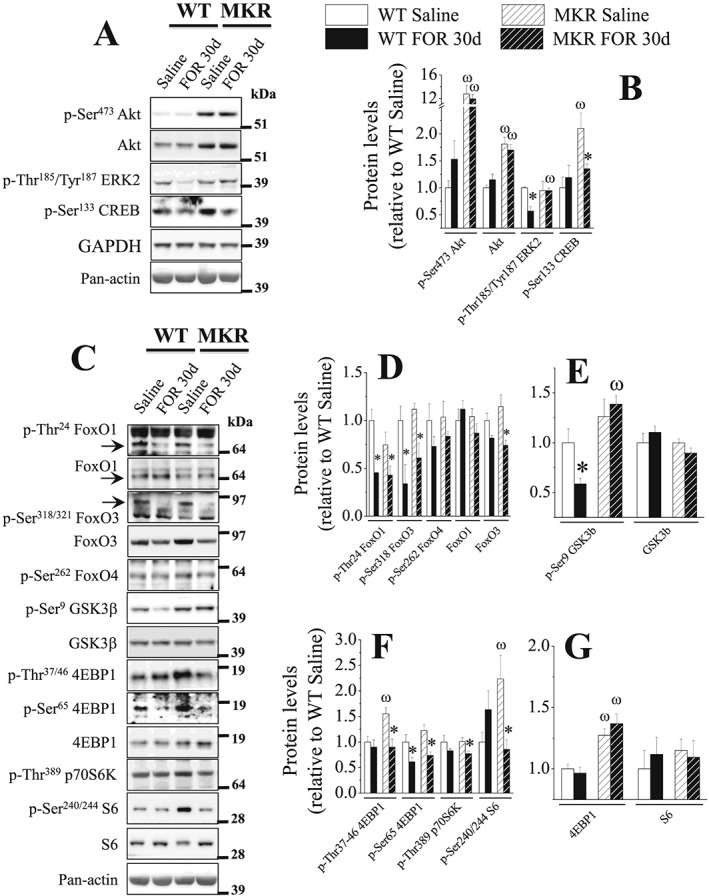
Chronic stimulation of β2‐AR by FOR down‐regulates INS/IGF1 and adrenergic signalling pathways in muscles. The in vivo effects of chronic treatment with FOR (300 μg kg−1 day−1; for 30 days; sc) on total content and phosphorylation levels of proteins involved in INS/IGF1 and adrenergic signallings (n = 3–5/group). (* P ≤ 0.05 vs. respective saline‐treated group; ω P ≤ 0.05 vs. respective WT group, two‐way ANOVA.)
Discussion
The present study clarifies the molecular basis of the stimulation of β2‐AR by FOR in skeletal muscles from fed and 2‐day fasted mice and shows that the INS/IGF1 signalling exerts a crucial role in the regulation of muscle proteostasis and trophism. In contrast, this signalling pathway partially contributes to strength gain and does not mediate fibre type shift promoted by β2‐sympathomimetic.
In accordance with previous studies in fed rodents,6, 20, 21, 22 we found that a single injection of FOR, a long‐acting β2‐agonist,57 caused a marked activation of Akt and ERK1/2, the major intracellular anabolic signals of INS/IGF1, in muscles from both fed and fasted mice. Despite that, FOR induced a transient increase in muscle protein synthesis only in fed condition, without effect on fasted mice probably due to the absence of an anabolism supportive milieu. In the latter group, the acute stimulation of β2‐AR reduced the rate of protein degradation through the inhibition of both UPS and ALS. In this sense, FOR may have suppressed substrate delivery to proteasome by down‐regulating the expression of atrophy‐related Ub‐ligases (i.e. Atrogin‐1, Murf1, Musa1, and Smart). As far as we know, this is the first evidence showing a suppression of the novel Ub‐ligases Musa1 and Smart by β2‐AR stimulation. A few studies have investigated the effects of sympathomimetics on ALS and the results are conflicting. JOASSARD et al.20 have shown that treatment with a high dose of FOR (2000 μg kg−1) up‐regulated the protein content of LC3‐I and LC3‐II and the mRNA levels of Map1lc3b but did not change the protein content of autophagy protein markers like p62, concluding that ALS was unaffected by β2‐agonist. Conversely, treatment with a low dose of FOR (50 μg kg−1) reduced LC3 lipidation in atrophic muscles from arthritic rats.33 Therefore, the FOR effects on ALS seem to vary accordingly to the doses. In agreement with this notion, we clearly demonstrated that the basal and fasting‐induced autophagy, as estimated by different approaches, was reduced by a low dose of FOR (300 μg kg−1). Additionally, a lower dose of FOR (30 μg kg−1) also suppressed the expression of the autophagy genes Map1lc3b and Bnip3 while a higher dose (3000 μg kg−1) of this β2‐agonist amplified their expression induced by fasting (data not shown).
The present study shows that the in vivo stimulation of β2‐AR caused a rapid increase in FoxO1 phosphorylation at Ser256, a critical residue for the suppression of its transcriptional activity58 as observed in DBE‐FoxO reporter at a later time‐point. Although it seems that there is a hierarchical order where FOR‐induced down‐regulation of FoxO activity parallels the expression of its target genes, the ability of β2‐AR signalling in increasing mRNA degradation may not be ruled out. For example, while the mRNA levels of Gabarapl1, whose half‐life is about 17 h in MCF‐7 cells, was reduced as soon as 60 min after FOR injection, the FoxO activity decreased only at 240 min.59 It is also noteworthy that β2‐AR stimulation suppressed autophagy faster than DBE‐FoxO reporter and atrophy‐related genes, which suggests that β2‐sympathomimetics may inhibit proteolysis by acting at a post‐translational level. Accordingly, our in vitro experiments show that the anti‐proteolytic action of FOR occurred in the presence of the inhibitor of protein synthesis cycloheximide, a compound that is required for the evaluation of protein degradation rate in isolated muscles. Furthermore, in vitro and in vivo experiments with pharmacological inhibitors identified PI3K/Akt/mTORC1 signalling as the intracellular mediator of the suppressive action of β2‐sympathomimetics in muscle proteolysis and autophagy during fasting. Intriguingly, the activation of mTORC1/p70S6K/S6 pathway by FOR did not affect the low rates of muscle protein synthesis in fasted mice, indicating that suppression of autophagy and stimulation of protein synthesis by mTORC1 might be two processes dissociated from each other in the setting of fasting.
It has been postulated that the stimulatory effect of Akt by β2‐agonists might be mediated through the direct coupling of the β2‐AR to Gsα (stimulatory guanine‐nucleotide binding protein (G protein) alpha subunit)‐adenylyl cyclase‐cAMP‐Epac1‐PI3K7, 25, 26 or to Giα (inhibitory G protein alpha subunit)‐Gβγ‐PI3K23, 24 signalling pathways. In agreement with this notion, we found that deletion of β2‐AR prevented CB‐induced Akt activation in vivo 21 and wortmannin, a PI3K inhibitor, blocked the inhibition of proteolysis and the increase of Akt phosphorylation caused by FOR (present study) and epinephrine,26 respectively, in isolated rat muscles. Although the role of Giα/Gβγ has never been tested in skeletal muscle, in vitro experiments incubating muscles with the Epac activator 8CPT‐2Me‐cAMP have shown that this cAMP effector mimics epinephrine action on protein metabolism by reducing rates of proteolysis and increasing phosphorylation levels of Akt and FoxO3a.26 The possible activation of Epac by FOR could also explains how the in vitro stimulation of β2‐AR directly activated PI3K/Akt signalling and inhibited proteolysis in isolated muscles. Indeed, in vivo experiments with whole body Epac1 KO mice have suggested that this protein mediates the activation of Akt by CB.7 However, Akt classically lies downstream of INS/IGF1 signalling and the defective INS secretion and the muscle resistance to the action of this hormone in Epac1 KO mice60 might account for the impairment of CB‐activated Akt in muscles from these mutants.7 Further experiments are needed to define the direct role of Epac in mediating the effects of sympathomimetics in skeletal muscle.
Although the in vitro data show that β2‐AR stimulation can exert a direct anti‐proteolytic action on skeletal muscle, our in vivo experiments reveal the existence of indirect mechanisms mediated by a rise in circulating INS that seems to overcome the direct effects of β2‐agonists. Indeed, serum INS concentrations were drastically increased by a single injection of FOR in fed, fasted, and STZ‐treated mice. In parallel, we observed that fasted WT mice treated with FOR showed more severe hypoglycemia and were less active than normal within 30 min post‐injection. Following, glycemia and active behaviour returned to pre‐treatment status. It is also to note that, unlike α‐AR stimulation by catecholamines, β‐AR stimulation in β‐pancreatic cells strongly stimulates INS release in systemically infused humans13 and in locally infused canine pancreas.61 This effect is probably mediated by the activation of cAMP signalling, a well described second messenger that stimulates the release of INS by β‐cells via PKA and Epac.62 In order to confirm the involvement of INS in the inhibitory effect of FOR on protein degradation, we used INS‐resistant M‐IR−/− mice. However, experiments with these animals during fasting showed that FOR effects on Akt signalling were only attenuated and insufficient to prevent the down‐regulation of the proteolysis markers Atrogin‐1 and LC3‐II. Because INS and IGF1 cross‐react with each other's receptors and share overlapping downstream signalling pathways,41, 42 we hypothesized that INS released by FOR could be acting on IGF1R and mediating the anti‐catabolic effects on skeletal muscle. To address this issue, we used MKR mice, a strain that has a muscle‐specific blockade of both IR and IGF1R,42 and observed that FOR was unable to activate Akt signalling and to suppress atrophy‐related genes and autophagy during fasting. Previous findings reporting that β2‐agonists can stimulate local production of IGF1 in muscle within a few hours after an injection15, 63 via CREB‐regulated transcriptional coregulators‐2/3 (Crtc2/3)64 raise the possibility that this growth factor may also have mediated the anti‐catabolic actions of FOR in vivo.
Our new findings with fed MKR mice chronically treated with β2‐agonist indicate that INS/IGF1 signalling is also essential for the effects of FOR on body growth. This anabolic response may have been indirectly favoured by an increase in food intake as reported by Busquets et al.1 More importantly, FOR‐induced body growth was associated with the preferential muscle hypertrophy of the fast‐twitch glycolytic fibres (type IIB). In fact, it has been proposed that stimulation of both Akt and ERK1/2 promoted by CB exclusively in fast‐twitch muscles mediates the fibre type‐specific hypertrophy.6, 19 Unlike the acute injection in fed and fasted mice, the present data show that chronic simulation of β2‐AR by FOR in fed WT mice did not alter Akt phosphorylation and reduced ERK1/2 phosphorylation.20 These findings are consistent with data from studies performed in rats treated with FOR and are probably due to ‘desensitization’ caused by a decrease in the content of β2‐AR and an increase in the inhibitory phosphorylation (Ser636/639) of insulin receptor substrate‐1 (IRS‐1), a downstream target of IR/IGF1R, leading to the down‐regulation of Akt and ERK1/2 signalling.20 Accordingly, we found that chronic, but not acute, treatment with FOR reduced GSK3β phosphorylation in muscles from fed WT mice. Although these findings do not fit with the accumulation of muscle carbohydrate observed in PAS staining in WT mice chronically treated with FOR, it cannot be excluded that an increase in GSK3β phosphorylation may have occurred between 2 h and 30 days, which was the only time‐points examined in the present study. In agreement with the involvement of GSK3 in FOR effects on muscle glycogen, Yamamoto et al.65 have demonstrated that β2‐AR stimulation activates a PI3K pathway that enhances glycogen synthesis through GSK3 in skeletal muscle cells. In addition, chronic administration of FOR reduced Akt‐induced phosphorylation of FoxO1 and FoxO3 in both fed WT and MKR mice, but it down‐regulated the expression of the FoxO‐target genes Murf1, Smart, and Musa1 only in WT mice, indicating that Akt‐independent mechanisms could be also recruited by INS/IGF1 signalling to inhibit FoxO. JunB transcription factor belongs to the activator protein‐1 (AP‐1) family and its overexpression reduces proteolysis by blocking FoxO3 binding to Atrogin‐1 and Murf1 promoters and stimulates protein synthesis independently of the Akt/mTORC1 pathway.66 Interestingly, Junb expression in chronically treated groups mirrored FOR effects on muscle trophism and the expression of atrophy‐related genes in both WT and MKR mice, that is, β2‐agonist increased Junb mRNA in WT mice but this effect was abrogated in MKR mice suggesting that this transcription factor may be an important anabolic factor linking INS/IGF1 to β2‐adrenergic signalling. Further studies are needed to confirm this hypothesis.
This study also demonstrates that chronic simulation of β2‐AR exerts a number of effects on skeletal muscle independently of INS/IGF1 signalling. For instance, FOR increased muscle force in MKR mice, even in the absence of muscle hypertrophy, suggesting that strength gain is not causally related to muscle growth after β2‐agonist treatment. This effect is clinically relevant for improving muscle function in INS‐resistant patients with type 2 diabetes mellitus67 or with myotonic dystrophies68 because they may not be beneficiated by growth‐promoting actions of β2‐AR stimulation. The strength gain effect of FOR was associated with an increase in the quantity of type IIB fibre that, as expected, displayed faster contraction kinetics and an accumulation of carbohydrate to fuel glycolytic metabolism. It could be argued that the transition toward fast‐glycolytic phenotype would limit the therapeutic potential of β2‐agonists as occurs with BRL‐47672, which reduces muscle oxidative capacity and accelerates fatigue.69 Curiously, low dose of FOR does not increase the fatigability of normal or dystrophic muscles,4 which may be due to the elevation in mitochondrial function, as indicated by SDH activity in FOR‐treated MKR mice.
In summary, the data show that acute stimulation of the β2‐AR raises serum INS levels and recruits IR/IGF1R/PI3K/Akt signalling that in turn enhances protein synthesis in fed condition and inhibits FoxO1 and stimulates mTORC1 to restrain the process of ubiquitination and autophagic flux in both fed and fasted states. In addition to Akt, ERK1/2 kinases are also activated by FOR, but they do not mediate the adrenergic anti‐proteolytic action in fasted mice. Finally, the data show that the chronic stimulation of the β2‐AR requires INS/IGF1 signalling for skeletal muscle growth‐promoting effects, but not for fibre type transition toward a faster and more glycolytic phenotype and strength gain. Altogether, our findings shed light on the cellular and molecular mechanism by which β2‐agonists improve muscle quality and health.
Author contributions
D.A.G. designed the study, researched data, and wrote the manuscript. W.A.S. researched data and helped design experiments. L.H.M., A.A., and L.N. researched data and helped write the manuscript. F.A.G., J.M., M.G.P., and N.L. researched data. B.T.O. and E.B. researched data, helped design experiments, and helped write the manuscript. D.A. and S.R. provided critical reagents. C.R.K. provided critical reagents and helped design experiments. M.S., I.C.K., and L.C.N. designed the study and helped write the manuscript.
Conflict of interest
The authors have declared that no conflict of interest exists.
Supporting information
Figure S1 The acute stimulation of β2‐AR stimulates muscle protein synthesis in fed, but not fasted, state, and inhibits muscle proteolysis during fasting. (A and C) Representative western blot and (B and D) densitometric analysis of puromycin‐labeled peptides, used for estimating protein synthesis, in TA muscles from fed (A‐B; n = 4/group) and 2‐d fasted (C‐D; n = 3/group) mice treated with a single injection of FOR (300 μg kg‐1; sc). (E) In vitro effects of FOR and CB (10‐4 M; 2h) on the rate of overall proteolysis in isolated EDL muscles from 2‐d fasted rats (n = 7/group). (# P≤0.05 vs. Fed (DMSO or Saline) group; * P≤0.05 vs. Fasted (DMSO or Saline) group, ANOVA.)
Figure S2 The acute stimulation of β2‐AR increases the activation status of Akt and ERK1/2 in gastrocnemius muscles from fasted mice without altering serum corticosterone levels. The effects of a single injection of FOR (300 μg kg‐1; sc) on (A) serum corticosterone levels and (B‐F) total protein content and phosphorylation levels of FoxO1, Akt, ERK1/2 and CREB in gastrocnemius muscles from fed and 2‐d fasted mice (n = 3‐5/group). Black lines between lanes indicate that samples were run on the same gel but were noncontiguous. (# P≤0.05 vs. Fed Saline; * P ≤ 0.05 vs. Fasted Saline, ANOVA.)
Figure S3 The acute stimulation of β2‐AR increases insulin (INS) levels, the activation status of Akt and ERK1/2 signallings and inhibits autophagy in muscles from fed mice. The temporal effects of a single injection of FOR (300 μg kg‐1; sc) on (A‐B and D‐G) total protein content and phosphorylation levels of FoxO1, Akt, ERK1/2 and CREB as well as on the content of LC3‐I and ‐II in TA muscles (n = 3‐5/group) and (C) insulin levels (n = 4‐5/group) in serum from fed mice. (* P≤0.05 vs. Fed Saline; # P≤0.05 vs. Fed FOR 60 min, ANOVA.)
Figure S4 The in vivo effects of a single injection of FOR (300 μg kg‐1; sc) on (A) mRNA levels of Sik1 in TA muscle and (B) blood glucose levels in 2‐d fasted MKR mice (n = 3‐4/group). (* P≤0.05 vs. respective Saline‐treated group; ω P≤0.05 vs. respective WT group, 2‐way ANOVA.)
Figure S5 The in vitro stimulation of β2‐AR stimulates Akt/FoxO and PKA/CREB signallings. In vitro effects of FOR (10‐4 M; 120 min) on total protein content and phosphorylation levels of FoxO1, Akt, ERK1/2 and CREB in isolated EDL muscles from 2‐d fasted rats (n = 4/group). (* P≤0.05 vs. Fasted DMSO group, Student's t‐test)
Figure S6 (A) Representative images of immunostaining in whole TA cross‐sections for the different isoforms of myosin heavy chains (MHC) and the cell membrane marker dystrophin (Dys) showed in Figure 6C. Scale bar, 1 mm. (B) The in vivo effects of chronic stimulation of β2‐AR by FOR (300 μg kg‐1 day‐1; for 30 d; sc) on mRNA levels of Sik1, Ppargc1a and IGF1R (human IGF1 receptor) in TA muscle from fed WT and MKR mice (n = 3‐5/group). (* P≤0.05 vs. respective Saline‐treated group; ω P≤0.05 vs. respective WT group, 2‐way ANOVA.)
Figure S7 The in vivo effects of chronic stimulation of β2‐AR by FOR (300 μg kg‐1 day‐1; for 30 d; sc) on maximum absolute tetanic force, obtained when stimulating at 100 Hz, measured in vivo on triceps sural muscles from fed WT and MKR mice (n = 9‐14 muscles each from 5‐7 mice/group). – related to Figures 7A‐D. (C) Representative images of periodic acid‐Schiff (PAS) and succinate dehydrogenase (SDH) activity stainings in whole TA cross‐sections showed in Figures 7I‐J (n = 3‐5/group). Scale bar, 1 mm. (B) Quantification of cross‐sectional area (CSA) of oxidative mitochondrial rich (dark fibres) and glycolytic mitochondrial poor (pale fibres) fibres is shown. (* P≤0.05 vs. respective Saline‐treated group; ω P≤0.05 vs. respective WT group, Student's t‐test for 2 groups and 2‐way ANOVA for more.)
Table S1 Oligonucleotide primers used for qPCR analysis
Table S2 Oligonucleotide primers used for qPCR analysis
Table S3 Antibodies for western blot
Table S4 Antibodies for western blot
Supporting info item
Acknowledgements
This work was supported by grants from the Fundação de Amparo à Pesquisa do Estado de São Paulo‐FAPESP (12/18861‐0 to D.A.G., 15/21112‐7 to J.M., 10/11015‐0 to F.A.G., and 12/24524‐6 and 18/10089‐2 to I.C.K./L.C.N.), Coordenação de Aperfeiçoamento de Pessoal de Nível Superior‐CAPES (PNPD20131672 to W.A.S., 233261/2014‐1 to M.G.P., 306624/2015‐0 to L.C.N. and finance code 001 to N.L.), Conselho Nacional de Desenvolvimento Científico e Tecnológico‐CNPq (167033/2017‐4 to N.L.), AFM‐Telethon (19524 to M.S.), Italian Ministry of Education (MiUR) (PRIN 2010/2011 to M.S.), Fondation Leducq (to M.S.), AIRC (17388 to M.S.), H2020‐MSCA‐RISE (645648 to M.S.). This work was also supported by grants from the National Institutes of Health (R01DK031036 and R01DK033201 to C.R.K. and K08DK100543 to B.T.O.). The authors certify that they comply with the ethical guidelines for authorship and publishing of the Journal of Cachexia, Sarcopenia and Muscle.70
We are also indebted to Dr José Antunes Rodrigues and Maria Valci A. S. Silva for their assistance to measure serum corticosterone levels, to Lilian do Carmo Heck, Neusa Maria Zanon, Elza Aparecida Filippin, Maria Antonieta R. Garófalo, and Victor Diaz Galban for their technical assistance at Ribeirão Preto Medical School‐USP, and to Dr. Stefano Ciciliot for instructing the fibre typing analysis.
Gonçalves, D. A. , Silveira, W. A. , Manfredi, L. H. , Graça, F. A. , Armani, A. , Bertaggia, E. , O´Neill, B. T. , Lautherbach, N. , Machado, J. , Nogara, L. , Pereira, M. G. , Arcidiacono, D. , Realdon, S. , Kahn, C. R. , Sandri, M. , Kettelhut, I. C. , and Navegantes, L. C. C. (2019) Insulin/IGF1 signalling mediates the effects of β2‐adrenergic agonist on muscle proteostasis and growth. Journal of Cachexia, Sarcopenia and Muscle, 10: 455–475. 10.1002/jcsm.12395.
Contributor Information
Dawit A. Gonçalves, Email: dawit@ufmg.br.
Luiz Carlos C. Navegantes, Email: navegantes@fmrp.usp.br.
References
- 1. Busquets S, Figueras MT, Fuster G, Almendro V, Moore‐Carrasco R, Ametller E, et al. Anticachectic effects of formoterol: a drug for potential treatment of muscle wasting. Cancer Res 2004;64:6725–6731. [DOI] [PubMed] [Google Scholar]
- 2. Toledo M, Penna F, Oliva F, Luque M, Betancourt A, Marmonti E, et al. A multifactorial anti‐cachectic approach for cancer cachexia in a rat model undergoing chemotherapy. J Cachexia Sarcopenia Muscle 2016;7:48–59. [DOI] [PMC free article] [PubMed] [Google Scholar]
- 3. Ryall JG, Schertzer JD, Lynch GS. Attenuation of age‐related muscle wasting and weakness in rats after formoterol treatment: therapeutic implications for sarcopenia. J Gerontol A Biol Sci Med Sci 2007;62:813–823. [DOI] [PubMed] [Google Scholar]
- 4. Harcourt LJ, Schertzer JD, Ryall JG, Lynch GS. Low dose formoterol administration improves muscle function in dystrophic mdx mice without increasing fatigue. Neuromuscul Disord 2007;17:47–55. [DOI] [PubMed] [Google Scholar]
- 5. Dufresne SS, Boulanger‐Piette A, Frenette J. Osteoprotegerin and β2‐agonists mitigate muscular dystrophy in slow‐ and fast‐twitch skeletal muscles. Am J Pathol 2017;187:498–504. [DOI] [PubMed] [Google Scholar]
- 6. Shi H, Zeng C, Ricome a, Hannon KM, Grant AL, Gerrard DE. Extracellular signal‐regulated kinase pathway is differentially involved in beta‐agonist‐induced hypertrophy in slow and fast muscles. Am J Physiol Cell Physiol 2007;292:C1681–C1689. [DOI] [PubMed] [Google Scholar]
- 7. Ohnuki Y, Umeki D, Mototani Y, Jin H, Cai W, Shiozawa K, et al. Role of cyclic AMP sensor Epac1 in masseter muscle hypertrophy and myosin heavy chain transition induced by β2‐adrenoceptor stimulation. J Physiol 2014;592:5461–5475. [DOI] [PMC free article] [PubMed] [Google Scholar]
- 8. Schiaffino S, Reggiani C. Fiber types in mammalian skeletal muscles. Physiol Rev 2011;91:1447–1531. [DOI] [PubMed] [Google Scholar]
- 9. Lynch GS, Ryall JG. Role of β‐adrenoceptor signaling in skeletal muscle: implications for muscle wasting and disease. Physiol Rev 2008;88:729–767. [DOI] [PubMed] [Google Scholar]
- 10. Graça FA, Gonçalves DA, Silveira WA, Lira EC, Chaves VE, Zanon NM, et al. Epinephrine depletion exacerbates the fasting‐induced protein breakdown in fast‐twitch skeletal muscles. Am J Physiol Endocrinol Metab 2013;305:E1483–E1494. [DOI] [PubMed] [Google Scholar]
- 11. Navegantes LC, Resano NM, Migliorini RH, Kettelhut IC. Role of adrenoceptors and cAMP on the catecholamine‐induced inhibition of proteolysis in rat skeletal muscle. Am J Physiol Endocrinol Metab 2000;279:E663–E668. [DOI] [PubMed] [Google Scholar]
- 12. Del Prato S, DeFronzo RA, Castellino P, Wahren J, Alvestrand A. Regulation of amino acid metabolism by epinephrine. Am J Physiol 1990;258:E878–E887. [DOI] [PubMed] [Google Scholar]
- 13. Porte D. Beta adrenergic stimulation of insulin release in man. Diabetes 1967;16:150–155. [DOI] [PubMed] [Google Scholar]
- 14. McElligott MA, Mulder JE, Chaung LY, Barreto A. Clenbuterol‐induced muscle growth: investigation of possible mediation by insulin. Am J Physiol 1987;253:E370–E375. [DOI] [PubMed] [Google Scholar]
- 15. Awede BL, Thissen J‐P, Lebacq J. Role of IGF‐I and IGFBPs in the changes of mass and phenotype induced in rat soleus muscle by clenbuterol. Am J Physiol Endocrinol Metab 2002;282:E31–E37. [DOI] [PubMed] [Google Scholar]
- 16. O'Neill BT, Lee KY, Klaus K, Softic S, Krumpoch MT, Fentz J, et al. Insulin and IGF‐1 receptors regulate FoxO‐mediated signaling in muscle proteostasis. J Clin Invest 2016;126:3433–3446. [DOI] [PMC free article] [PubMed] [Google Scholar]
- 17. Shavlakadze T, Chai J, Maley K, Cozens G, Grounds G, Winn N, et al. A growth stimulus is needed for IGF‐1 to induce skeletal muscle hypertrophy in vivo. J Cell Sci 2010;123:960–971. [DOI] [PubMed] [Google Scholar]
- 18. Yimlamai T, Dodd SL, Borst SE, Park S. Clenbuterol induces muscle‐specific attenuation of atrophy through effects on the ubiquitin‐proteasome pathway. J Appl Physiol 2005;99:71–80. [DOI] [PubMed] [Google Scholar]
- 19. Gonçalves DAP, Silveira WA, Lira EC, Graça FA, Paula‐Gomes S, Zanon NM, et al. Clenbuterol suppresses proteasomal and lysosomal proteolysis and atrophy‐related genes in denervated rat soleus muscles independently of Akt. Am J Physiol Endocrinol Metab 2012;302:E123–E133. [DOI] [PubMed] [Google Scholar]
- 20. Joassard OR, Amirouche A, Gallot YS, Desgeorges MM, Castells J, Durieux A‐C, et al. Regulation of Akt‐mTOR, ubiquitin‐proteasome and autophagy‐lysosome pathways in response to formoterol administration in rat skeletal muscle. Int J Biochem Cell Biol 2013;45:2444–2455. [DOI] [PubMed] [Google Scholar]
- 21. Gonçalves DA, Lira EC, Baviera AM, Cao P, Zanon NM, Arany Z, et al. Mechanisms involved in 3′,5′‐cyclic adenosine monophosphate‐mediated inhibition of the ubiquitin‐proteasome system in skeletal muscle. Endocrinology 2009;150:5395–5404. [DOI] [PubMed] [Google Scholar]
- 22. Kline WO, Panaro FJ, Yang H, Bodine SC. Rapamycin inhibits the growth and muscle‐sparing effects of clenbuterol. J Appl Physiol 2007;102:740–747. [DOI] [PubMed] [Google Scholar]
- 23. Xiao RP. Beta‐adrenergic signaling in the heart: dual coupling of the beta2‐adrenergic receptor to G(s) and G(i) proteins. Sci STKE 2001;2001:re15. [DOI] [PubMed] [Google Scholar]
- 24. Daaka Y, Luttrell LM, Lefkowitz RJ. Switching of the coupling of the beta2‐adrenergic receptor to different G proteins by protein kinase A. Nature 1997;390:88–91. [DOI] [PubMed] [Google Scholar]
- 25. Fang Y, Olah ME. Cyclic AMP‐dependent, protein kinase A‐independent activation of extracellular signal‐regulated kinase 1/2 following adenosine receptor stimulation in human umbilical vein endothelial cells: role of exchange protein activated by cAMP 1 (Epac1). J Pharmacol Exp Ther 2007;322:1189–1200. [DOI] [PubMed] [Google Scholar]
- 26. Baviera AM, Zanon NM, Navegantes LCC, Kettelhut IC. Involvement of cAMP/Epac/PI3K‐dependent pathway in the antiproteolytic effect of epinephrine on rat skeletal muscle. Mol Cell Endocrinol 2010;315:104–112. [DOI] [PubMed] [Google Scholar]
- 27. Blaauw B, Canato M, Agatea L, Toniolo L, Mammucari C, Masiero E, et al. Inducible activation of Akt increases skeletal muscle mass and force without satellite cell activation. Faseb 2009;23:3896–3905. [DOI] [PubMed] [Google Scholar]
- 28. Bodine SC, Stitt TN, Gonzalez M, Kline WO, Stover GL, Bauerlein R, et al. Akt/mTOR pathway is a crucial regulator of skeletal muscle hypertrophy and can prevent muscle atrophy in vivo. Nat Cell Biol 2001;3:1014–1019. [DOI] [PubMed] [Google Scholar]
- 29. Mammucari C, Milan G, Romanello V, Masiero E, Rudolf R, Del Piccolo P, et al. FoxO3 controls autophagy in skeletal muscle in vivo. Cell Metab 2007;6:458–471. [DOI] [PubMed] [Google Scholar]
- 30. Sandri M, Sandri C, Gilbert A, Skurk C, Calabria E, Picard A, et al. Foxo transcription factors induce the atrophy‐related ubiquitin ligase Atrogin‐1 and cause skeletal muscle atrophy. Cell 2004;117:399–412. [DOI] [PMC free article] [PubMed] [Google Scholar]
- 31. Milan G, Romanello V, Pescatore F, Armani A, Paik J‐H, Frasson L, et al. Regulation of autophagy and the ubiquitin–proteasome system by the FoxO transcriptional network during muscle atrophy. Nat Commun 2015;6:6670. [DOI] [PMC free article] [PubMed] [Google Scholar]
- 32. Bonaldo P, Sandri M. Cellular and molecular mechanisms of muscle atrophy. Dis Model Mech 2013;6:25–39. [DOI] [PMC free article] [PubMed] [Google Scholar]
- 33. Gomez‐SanMiguel AB, Gomez‐Moreira C, Nieto‐Bona MPMP, Fernandez‐Galaz C, Villanua MA, Martin AI, et al. Formoterol decreases muscle wasting as well as inflammation in the rat model of rheumatoid arthritis. Am J Physiol Endocrinol Metab 2016;310:E925–E937. [DOI] [PubMed] [Google Scholar]
- 34. Sartori R, Schirwis E, Blaauw B, Bortolanza S, Zhao J, Enzo E, et al. BMP signaling controls muscle mass. Nat Genet 2013;45:1309–1318. [DOI] [PubMed] [Google Scholar]
- 35. Bodine SC, Latres E, Baumhueter S, Lai VK, Nunez L, Clarke BA, et al. Identification of ubiquitin ligases required for skeletal muscle atrophy. Science 2001;294:1704–1708. [DOI] [PubMed] [Google Scholar]
- 36. Castets P, Lin S, Rion N, Di Fulvio S, Romanino K, Guridi M, et al. Sustained activation of mTORC1 in skeletal muscle inhibits constitutive and starvation‐induced autophagy and causes a severe, late‐onset myopathy. Cell Metab 2013;17:731–744. [DOI] [PubMed] [Google Scholar]
- 37. Carriere A, Romeo Y, Acosta‐Jaquez HA, Moreau J, Bonneil E, Thibault P, et al. ERK1/2 phosphorylate raptor to promote ras‐dependent activation of mTOR complex 1 (mTORC1). J Biol Chem 2011;286:567–577. [DOI] [PMC free article] [PubMed] [Google Scholar]
- 38. Yang J, Zong CS, Xia W, Yamaguchi H, Ding Q, Xie X, et al. ERK promotes tumorigenesis by inhibiting FOXO3a via MDM2‐mediated degradation. Nat Cell Biol 2008;10:138–148. [DOI] [PMC free article] [PubMed] [Google Scholar]
- 39. Shi H, Scheffler JM, Zeng C, Pleitner JM, Hannon KM, Grant AL, et al. Mitogen‐activated protein kinase signaling is necessary for the maintenance of skeletal muscle mass. Am J Physiol Cell Physiol 2009;296:C1040–C1048. [DOI] [PubMed] [Google Scholar]
- 40. Haddad F, Adams GR. Inhibition of MAP/ERK kinase prevents IGF‐I‐induced hypertrophy in rat muscles. J Appl Physiol 2004;96:203–210. [DOI] [PubMed] [Google Scholar]
- 41. O'Neill BT, Lauritzen HPMM, Hirshman MF, Smyth G, Goodyear LJ, Kahn CR. Differential role of insulin/IGF‐1 receptor signaling in muscle growth and glucose homeostasis. Cell Rep 2015;11:1220–1235. [DOI] [PMC free article] [PubMed] [Google Scholar]
- 42. Fernández AM, Kim JK, Yakar S, Dupont J, Hernandez‐Sanchez C, Castle AL, et al. Functional inactivation of the IGF‐I and insulin receptors in skeletal muscle causes type 2 diabetes. Genes Dev 2001;15:1926–1934. [DOI] [PMC free article] [PubMed] [Google Scholar]
- 43. Wing SS, Haas AL, Goldberg AL. Increase in ubiquitin‐protein conjugates concomitant with the increase in proteolysis in rat skeletal muscle during starvation and atrophy denervation. Biochem J 1995;307:639–645. [DOI] [PMC free article] [PubMed] [Google Scholar]
- 44. Jagoe RT, Lecker SH, Gomes M, Goldberg AL. Patterns of gene expression in atrophying skeletal muscles: response to food deprivation. FASEB J 2002;16:1697–1712. [DOI] [PubMed] [Google Scholar]
- 45. Gomes MD, Lecker SH, Jagoe RT, Navon A, Goldberg AL. Atrogin‐1, a muscle‐specific F‐box protein highly expressed during muscle atrophy. Proc Natl Acad Sci U S A 2001;98:14440–14445. [DOI] [PMC free article] [PubMed] [Google Scholar]
- 46. Smith LR, Barton ER. SMASH ‐ semi‐automatic muscle analysis using segmentation of histology: a MATLAB application. Skelet Muscle 2014;4:21. [DOI] [PMC free article] [PubMed] [Google Scholar]
- 47. Ju J‐S, Varadhachary AS, Miller SE, Weihl CC. Quantitation of ‘autophagic flux’ in mature skeletal muscle. Autophagy 2010;6:929–935. [DOI] [PMC free article] [PubMed] [Google Scholar]
- 48. Ching JK, Ju JS, Pittman SK, Margeta M, Weihl CC. Increased autophagy accelerates colchicine‐induced muscle toxicity. Autophagy 2013;9:2115–2125. [DOI] [PubMed] [Google Scholar]
- 49. Goodman CA, Mabrey DM, Frey JW, Miu MH, Schmidt EK, Pierre P, et al. Novel insights into the regulation of skeletal muscle protein synthesis as revealed by a new nonradioactive in vivo technique. FASEB J 2011;25:1028–1039. [DOI] [PMC free article] [PubMed] [Google Scholar]
- 50. Durlo FV, Castro M, Elias LLK, Antunes‐Rodrigues J. Interaction of prolactin, ANPergic, oxytocinergic and adrenal systems in response to extracellular volume expansion in rats. Exp Physiol 2004;89:541–548. [DOI] [PubMed] [Google Scholar]
- 51. Tanida I, Sou Y, Ezaki J, Minematsu‐Ikeguchi N, Ueno T, Kominami E. HsAtg4B/HsApg4B/autophagin‐1 cleaves the carboxyl termini of three human Atg8 homologues and delipidates microtubule‐associated protein light chain 3‐ and GABAA receptor‐associated protein‐phospholipid conjugates. J Biol Chem 2004;279:36268–36276. [DOI] [PubMed] [Google Scholar]
- 52. Shimizu N, Maruyama T, Yoshikawa N, Matsumiya R, Ma Y, Ito N, et al. A muscle‐liver‐fat signalling axis is essential for central control of adaptive adipose remodelling. Nat Commun 2015;6:6693. [DOI] [PMC free article] [PubMed] [Google Scholar]
- 53. Zhang B, Yang L, Yu L, Lin B, Hou Y, Wu J, et al. Acetylcholinesterase is associated with apoptosis in β cells and contributes to insulin‐dependent diabetes mellitus pathogenesis. Acta Biochim Biophys Sin (Shanghai) 2012;44:207–216. [DOI] [PubMed] [Google Scholar]
- 54. Koopman R, Gehrig SM, Léger B, Trieu J, Walrand S, Murphy KT, et al. Cellular mechanisms underlying temporal changes in skeletal muscle protein synthesis and breakdown during chronic {beta}‐adrenoceptor stimulation in mice. J Physiol 2010;588:4811–4823. [DOI] [PMC free article] [PubMed] [Google Scholar]
- 55. Fernández AM, Dupont J, Farrar RP, Lee S, Stannard B, Le Roith D. Muscle‐specific inactivation of the IGF‐I receptor induces compensatory hyperplasia in skeletal muscle. J Clin Invest 2002;109:347–355. [DOI] [PMC free article] [PubMed] [Google Scholar]
- 56. Vijayakumar A, Buffin NJ, Gallagher EJ, Blank J, Wu Y, Yakar S, et al. Deletion of growth hormone receptors in postnatal skeletal muscle of male mice does not alter muscle mass and response to pathological injury. Endocrinology 2013;154:3776–3783. [DOI] [PMC free article] [PubMed] [Google Scholar]
- 57. Lötvall J. Pharmacological similarities and differences between beta2‐agonists. Respir Med 2001;95 Suppl B:S7–S11. [DOI] [PubMed] [Google Scholar]
- 58. Zhang X, Gan L, Pan H, Guo S, He X, Olson ST, et al. Phosphorylation of serine 256 suppresses transactivation by FKHR (FOXO1) by multiple mechanisms. Direct and indirect effects on nuclear/cytoplasmic shuttling and DNA binding. J Biol Chem 2002;277:45276–45284. [DOI] [PubMed] [Google Scholar]
- 59. Hervouet E, Claude‐Taupin A, Gauthier T, Perez V, Fraichard A, Adami P, et al. The autophagy GABARAPL1 gene is epigenetically regulated in breast cancer models. BMC Cancer 2015;15:729. [DOI] [PMC free article] [PubMed] [Google Scholar]
- 60. Kai AKL, Lam AKM, Chen Y, Tai ACP, Zhang X, Lai AKW, et al. Exchange protein activated by cAMP 1 (Epac1)‐deficient mice develop β‐cell dysfunction and metabolic syndrome. FASEB J 2013;27:4122–4135. [DOI] [PubMed] [Google Scholar]
- 61. Iversen J. Adrenergic receptors and the secretion of glucagon and insulin from the isolated, perfused canine pancreas. J Clin Invest 1973;52:2102–2116. [DOI] [PMC free article] [PubMed] [Google Scholar]
- 62. Tengholm A, Gylfe E. cAMP signalling in insulin and glucagon secretion. Diabetes Obes Metab 2017;19 Suppl 1:42–53. [DOI] [PubMed] [Google Scholar]
- 63. Jesinkey SR, Korrapati MC, Rasbach KA, Beeson CC, Schnellmann RG. Atomoxetine prevents dexamethasone‐induced skeletal muscle atrophy in mice. J Pharmacol Exp Ther 2014;351:663–673. [DOI] [PMC free article] [PubMed] [Google Scholar]
- 64. Bruno NE, Kelly KA, Hawkins R, Bramah‐Lawani M, Amelio AL, Nwachukwu JC, et al. Creb coactivators direct anabolic responses and enhance performance of skeletal muscle. EMBO J 2014;33:1027–1043. [DOI] [PMC free article] [PubMed] [Google Scholar]
- 65. Yamamoto DL, Hutchinson DS, Bengtsson T. Beta(2)‐adrenergic activation increases glycogen synthesis in L6 skeletal muscle cells through a signalling pathway independent of cyclic AMP. Diabetologia 2007;50:158–167. [DOI] [PubMed] [Google Scholar]
- 66. Raffaello A, Milan G, Masiero E, Carnio S, Lee D, Lanfranchi G, et al. JunB transcription factor maintains skeletal muscle mass and promotes hypertrophy. J Cell Biol 2010;191:101–113. [DOI] [PMC free article] [PubMed] [Google Scholar]
- 67. Tajiri Y, Kato T, Nakayama H, Yamada K. Reduction of skeletal muscle, especially in lower limbs, in Japanese type 2 diabetic patients with insulin resistance and cardiovascular risk factors. Metab Syndr Relat Disord 2010;8:137–142. [DOI] [PubMed] [Google Scholar]
- 68. Renna LV, Bosè F, Iachettini S, Fossati B, Saraceno L, Milani V, et al. Receptor and post‐receptor abnormalities contribute to insulin resistance in myotonic dystrophy type 1 and type 2 skeletal muscle. PLoS One 2017;12:e0184987. [DOI] [PMC free article] [PubMed] [Google Scholar]
- 69. Baker DJ, Constantin‐Teodosiu D, Jones SW, Timmons JA, Greenhaff PL. Chronic treatment with the beta(2)‐adrenoceptor agonist prodrug BRL‐47672 impairs rat skeletal muscle function by inducing a comprehensive shift to a faster muscle phenotype. J Pharmacol Exp Ther 2006;319:439–446. [DOI] [PubMed] [Google Scholar]
- 70. von Haehling S, Morley JE, Coats AJS, Anker SD. Ethical guidelines for publishing in the journal of cachexia, sarcopenia and muscle: update 2017. J Cachexia Sarcopenia Muscle 2017;8:1081–1083. [DOI] [PMC free article] [PubMed] [Google Scholar]
Associated Data
This section collects any data citations, data availability statements, or supplementary materials included in this article.
Supplementary Materials
Figure S1 The acute stimulation of β2‐AR stimulates muscle protein synthesis in fed, but not fasted, state, and inhibits muscle proteolysis during fasting. (A and C) Representative western blot and (B and D) densitometric analysis of puromycin‐labeled peptides, used for estimating protein synthesis, in TA muscles from fed (A‐B; n = 4/group) and 2‐d fasted (C‐D; n = 3/group) mice treated with a single injection of FOR (300 μg kg‐1; sc). (E) In vitro effects of FOR and CB (10‐4 M; 2h) on the rate of overall proteolysis in isolated EDL muscles from 2‐d fasted rats (n = 7/group). (# P≤0.05 vs. Fed (DMSO or Saline) group; * P≤0.05 vs. Fasted (DMSO or Saline) group, ANOVA.)
Figure S2 The acute stimulation of β2‐AR increases the activation status of Akt and ERK1/2 in gastrocnemius muscles from fasted mice without altering serum corticosterone levels. The effects of a single injection of FOR (300 μg kg‐1; sc) on (A) serum corticosterone levels and (B‐F) total protein content and phosphorylation levels of FoxO1, Akt, ERK1/2 and CREB in gastrocnemius muscles from fed and 2‐d fasted mice (n = 3‐5/group). Black lines between lanes indicate that samples were run on the same gel but were noncontiguous. (# P≤0.05 vs. Fed Saline; * P ≤ 0.05 vs. Fasted Saline, ANOVA.)
Figure S3 The acute stimulation of β2‐AR increases insulin (INS) levels, the activation status of Akt and ERK1/2 signallings and inhibits autophagy in muscles from fed mice. The temporal effects of a single injection of FOR (300 μg kg‐1; sc) on (A‐B and D‐G) total protein content and phosphorylation levels of FoxO1, Akt, ERK1/2 and CREB as well as on the content of LC3‐I and ‐II in TA muscles (n = 3‐5/group) and (C) insulin levels (n = 4‐5/group) in serum from fed mice. (* P≤0.05 vs. Fed Saline; # P≤0.05 vs. Fed FOR 60 min, ANOVA.)
Figure S4 The in vivo effects of a single injection of FOR (300 μg kg‐1; sc) on (A) mRNA levels of Sik1 in TA muscle and (B) blood glucose levels in 2‐d fasted MKR mice (n = 3‐4/group). (* P≤0.05 vs. respective Saline‐treated group; ω P≤0.05 vs. respective WT group, 2‐way ANOVA.)
Figure S5 The in vitro stimulation of β2‐AR stimulates Akt/FoxO and PKA/CREB signallings. In vitro effects of FOR (10‐4 M; 120 min) on total protein content and phosphorylation levels of FoxO1, Akt, ERK1/2 and CREB in isolated EDL muscles from 2‐d fasted rats (n = 4/group). (* P≤0.05 vs. Fasted DMSO group, Student's t‐test)
Figure S6 (A) Representative images of immunostaining in whole TA cross‐sections for the different isoforms of myosin heavy chains (MHC) and the cell membrane marker dystrophin (Dys) showed in Figure 6C. Scale bar, 1 mm. (B) The in vivo effects of chronic stimulation of β2‐AR by FOR (300 μg kg‐1 day‐1; for 30 d; sc) on mRNA levels of Sik1, Ppargc1a and IGF1R (human IGF1 receptor) in TA muscle from fed WT and MKR mice (n = 3‐5/group). (* P≤0.05 vs. respective Saline‐treated group; ω P≤0.05 vs. respective WT group, 2‐way ANOVA.)
Figure S7 The in vivo effects of chronic stimulation of β2‐AR by FOR (300 μg kg‐1 day‐1; for 30 d; sc) on maximum absolute tetanic force, obtained when stimulating at 100 Hz, measured in vivo on triceps sural muscles from fed WT and MKR mice (n = 9‐14 muscles each from 5‐7 mice/group). – related to Figures 7A‐D. (C) Representative images of periodic acid‐Schiff (PAS) and succinate dehydrogenase (SDH) activity stainings in whole TA cross‐sections showed in Figures 7I‐J (n = 3‐5/group). Scale bar, 1 mm. (B) Quantification of cross‐sectional area (CSA) of oxidative mitochondrial rich (dark fibres) and glycolytic mitochondrial poor (pale fibres) fibres is shown. (* P≤0.05 vs. respective Saline‐treated group; ω P≤0.05 vs. respective WT group, Student's t‐test for 2 groups and 2‐way ANOVA for more.)
Table S1 Oligonucleotide primers used for qPCR analysis
Table S2 Oligonucleotide primers used for qPCR analysis
Table S3 Antibodies for western blot
Table S4 Antibodies for western blot
Supporting info item