Abstract
Background
Prior to this report, members of the inward rectifier family, or Kir, have been found only in eukaryotes. Like most K+ channels, the pore-forming part of the protein is formed by four identical, or closely related, subunits. Each subunit contains a transmembrane M1-P-M2 motif that is followed by a relatively large C-terminus region unique to Kir's.
Results
In searching unfinished microbial genomes for K+ channels, we identified five sequences in the prokaryote Burkholderia pseudomallei, Burkholderia cepacia, Burkholderia fungorum LB400, Magentospirillum magnetotacticum, and Nostoc Punctiforme genomes that code for proteins whose closest relatives in current sequence databases are eukaryote Kir's. The sequence similarity includes the C-terminus portion of Kir's, for which there are no other close homologs in current prokaryote sequences. Sequences of the pore-forming P and M2 segments of these proteins, which we call KirBac, is intermediate between those of eukaryotic Kir's and several other K+ channel families.
Conclusions
Although KirBac's are more closely related to Kir's than to other families of K+ channels, the intermediate nature of their pore-forming P and M2 segments suggests that they resemble an ancestral precursor to the eukaryotic Kir's. The similarity of KirBac to the bacterial KcsA channel, whose transmembrane structure has been solved, helps align Kir's with KcsA. KirBac's may assist in solving the three-dimensional structure of a member of the Kir family since bacterial membrane proteins are more easily expressed in the quantities necessary for crystallography.
Background
Kir's have numerous functions depending upon the member of the family and the cells in which they are expressed. Most are open under resting membrane potentials, and thus help maintain the voltage across the membrane near the K+ equilibrium potential. Specific functions include modulation of electrical activity of cardiac and neuronal cells, insulin secretion, and epithelial K+ transport [1]. The crystal structure of the transmembrane region of a K+ channel, KcsA, from the bacteria Streptomyces lividans has been determined [2]. Like KcsA, Kir's are 2TM proteins that have two transmembrane segments, M1 and M2, that flank a P segment. The P segment transverses only the outer portion of the transmembrane region. The first part of P dips into the transmembrane region as an α-helix and its latter portion returns to the surface in a relatively extended conformation that lies near the four-fold axis of the pore. Backbone oxygens from all four subunits of the latter portion of P form a series of K+ binding sites and thus determine the selectivity of the pore. This K+ selectivity filter region is the only portion of KcsA that shares substantial sequence identity with eukaryotic Kir's. Kir N- and C-termini segments that precede and follow the M1-P-M2 motif contain regions that are well conserved among Kir's (see Fig. 1), but that are not similar to sequences of any other K+ channels. In at least some Kir's, these cytoplasmic domains modulate the activity of the channel. Homology models [3,4] of the M1-P-M2 portion of Kir's have been developed using the backbone structure of KcsA. The validity of these models has been challenged by experiments [5] that were interpreted as indicating that the sequence alignment between KcsA and Kir proposed originally by Doyle et al [2] for M2 and used in these models is incorrect. Fortunately, the putative bacterial KirBac sequences reported here can be aligned unambiguously with the pore-forming P and M2 segments of both KscA and the eukaryotic Kir's. This turns out to be the same alignment that was used in developing the Kir homology models [3], [4].
Figure 1.
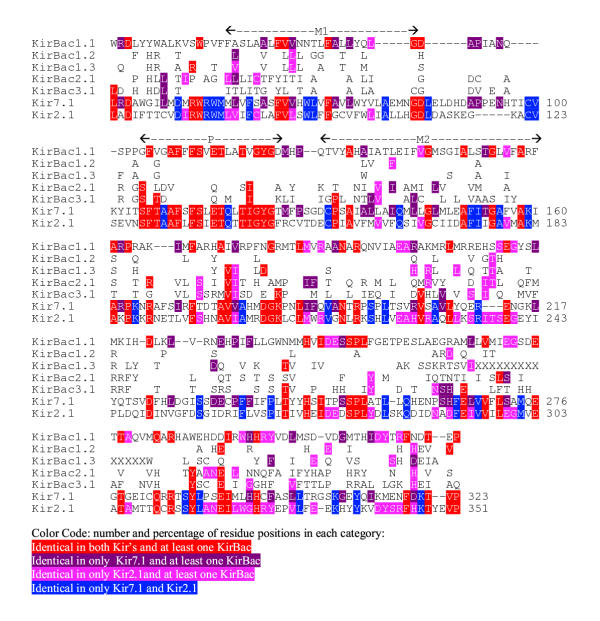
Alignment of the KirBac sequences with Kir7.1 and Kir2.1. Locations of the Ml, P, and M2 segments are indicated above the sequences. The numbers under the Kir2.1 sequence indicate features that are well conserved among most eukaryotic Kir's but that do not occur in KirBac's or other K+ channels. Only residues that differ from KirBac 1.1 are shown for the other KirBac sequences.
Results
In analyzing evolutionary relationships among K+ channels and their homologs, we identified five prokaryotic sequences that should code for proteins whose closest relatives are Kir's. The Burkholderia pseudomallei (KirBac 1.1) and Burkholderia cepacia (KirBac 1.2) sequences were determined by the Sequencing Group at the Sanger Centre and can be obtained from http://www.sanger.ac.uk/Projects/Microbes/. The Burkholderia fungorum LB400 (KirBac1.3), Magentospirillum magnetotacticum (KirBac2.1), and Nostoc Punctiforme (KirBac3.1) sequences are being determined by the DOE Joint Genome Institute and can be found at http://www.jgi.doe.gov/. These sequences are preliminary and could contain errors. The eukaryotic Kir's have been classified into seven subfamilies called Kir 1 to Kir7. We used several multisequence alignment methods (PsiBlast [6], Clustal W 1.74 [7], Pileup of the GCG package [8]) to initially align KirBac with eukaryotic Kir sequences accessible in public databases. The methods all predict essentially the same alignment with only minor differences in the locations of some insertions and deletions (indels); the final alignment shown in Fig. 1 was adjusted manually for those few positions where discrepancies arose. Portions of the sequences at the N- and C-termini that are difficult to align because they are poorly conserved among the sequences were not included in the calculations or Table 1 or the alignment of Fig. 1. Table 1 shows the evolutionary distances calculated among members of the Kir family and KirBac. These analyses support the phylogenetic tree shown in Fig. 2, in which the eukaryotic Kir's and prokaryotic KirBac's form two distinct families. Members of each family are more closely related to each other than to members of the other family. KirBac1.1, 1.2, and 1.3 were placed in the same subfamily because of their high degree of similarity, as indicated in Table 1. The alignments used for the calculations of Table 1 and illustrated in Fig. 1 are rigorous because they consider many sequences and almost identical alignments are obtained with a variety of methods that all take into account residue similarities as well as identities. However, for illustrative purposes it is more convenient to consider only identities for a few sequences. Fig. 1 illustrates our alignment of the KirBac sequences with the Kir7.1 and Kir2.1 sequences. Kir2.1 was selected for the illustration because it is the Eukaroyte Kir studied by Minor et al [5] and because it is closely related to members of the Kir3, Kir5, and Kir6 subfamilies (see Fig. 2). Kir7 was selected because it is the Kir subfamily most distant from the other Kir subfamilies, as indicated in Table 1. Of the different K+ channel families, KirBac's were found to be most similar to the Kir superfamily in the PsiBlast searches primarily because of the homology of their similar, relatively long C-terminal sequences following the M2 segments. When the M1-P-M2 regions of all of the different families of K+ channels are compared, one finds that the eukaryotic Kir's are the most divergent. Accordingly, the M1-P-M2 region of most eukaryotic Kir's has numerous unique features that distinguish them from other families of K+ channels. These features, which are numbered in Fig. 3 under the Kir2.1 sequence, include in sequential order: 1) A DxxTTxxDxxWR motif immediately preceding M1, 2) a highly conserved tryptophan in M1, 3) an insertion in the M1-P loop that contains a CVxx (V or I) motif, 4) the absence of an aromatic residue at the first 'aromatic cuff position [2] in the P segment helix, 5) a glutamine near the end of the P helix, 6) the absence of an aspartate at the end of the P segment signature sequence (TVGYGD) and a RxxTxxCP motif in the P-M2 loop that is two residues longer than in most other K+ channels, 7) a glutamine in the first part of S6, and 8) a hydrophilic residue (Asn, Asp, or Glu) near the mid region of S6 that when negatively charged is involved in blockade of some Kir's by Mg2+[9]. Fig. 3 shows that none of these features are present in the KirBac's. In fact, if only the P-M2 transmembrane pore-forming region is considered, KirBac's are more similar to some other K+ channel families than to the eukaryotic Kir's (see below). This finding suggests that the common ancestor to KirBac and the eukaryotic Kir's did not have these features, and that they developed after the divergence of the eukaryotic Kir subfamilies.
Table 1.
Distance matrix for Kir's and KirBac's Below diagonal: Uncorrected distances Above diagonal: Jukes-Cantor distances
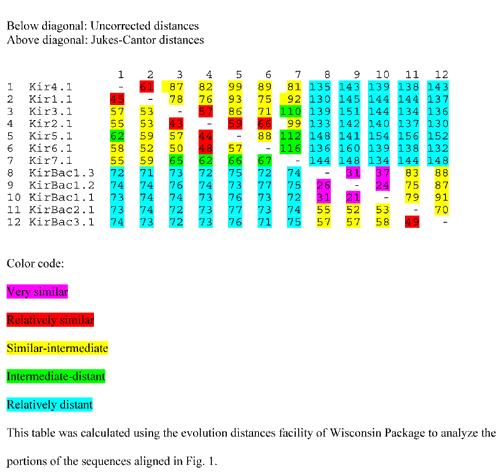 |
Figure 2.
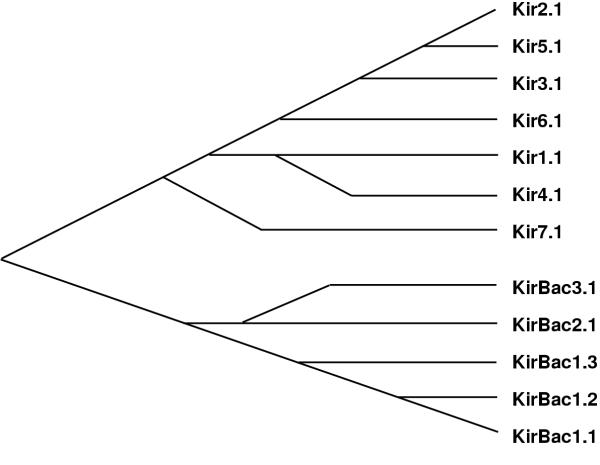
Phylogenetic tree of members of the Kir and KirBac families. The X axis is a non-quantitative representation of time.
Figure 3.
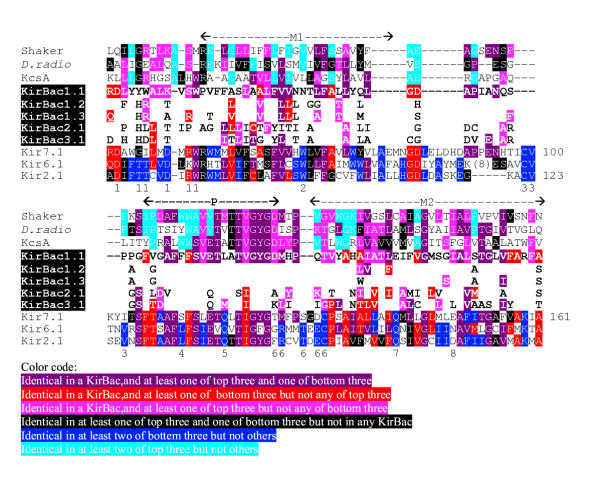
Alignment of the M1-P-M2 region of KirBac family with three non-Kir (Shaker Kv, a sequence from Dienococcus radiodurans that belongs to the Kbac6TM1 family and KcsA) and with three eukaryotic Kir's (Kir7.1, Kir4.1, and Kir2.1). Only those residues that differ from KirBac1.1 are shown for the other KirBac's. Note the relatively large number of residues in the first and last three sequences that are identical to at least one residue in the KirBac sequences. Features unique to Kir's are indicated by numbers under the sequences.
The intermediate nature of the KirBac P-M2 region between sequences of the eukaryotic Kir family and several other K+ channel families can be analyzed several different ways. One way is to perform a Blast search of the nonredundant database using only the P-M2 or M1-P-M2 regions of KirBac. When only the P-M2 region is used, the highest scores are with members of the voltage-gated K+ channel family (Kv), and with members of a bacterial family of putative K+ channels that have transmembrane segments quite similar to those of the Kv family. We call this family K-bac6tm1. When the M1-P-M2 region is used, a Blast search also finds some Kir sequences among the highest scores. To analyze these relationships more quantitatively, we aligned the M1-P-M2 regions for 224 Kv, 11 K-bac6tm1, and 129 Kir sequences. We also aligned the M1-P-M2 region of KcsA with the ten bacterial sequences in the microbial sequence database that were most similar to KcsA to produce a KcsA-like family. We then developed sequence profiles from each of these multisequence alignments. To identify the best alignments of the Kir and KirBac families to the transmembrane segments of these families, similarities of the sequence profiles were calculated as described in the Methods for different alignments of KirBac's for both the M1 and M2 segments. The length of the hydrophobic region of M1 is longer for Kir's than for the other families. To search for the best alignment between Kir' or KirBac's and the other families, longer M1 and M2 Kir and KirBac sequence profile blocks where scanned through M1 and M2 blocks indicated in Fig. 3 for the other families. No indels were permitted in these calculations because they are unlikely to occur in transmembrane segments. The P segment was not included in this analysis due to the high number of identical residues indicating the obviously correct alignment between the different K+ channel families. Z scores (see Methods) for two alignments, Alignment A of Fig. 3 and Alignment B proposed by Minor et al. [5], are given in Table 2. The Z value is the number of standard deviations the raw alignment score is from the mean of the normal distribution of scores obtained by random permutations of the alignment columns. The more positive the Z value, the less likely it is that the alignment occured by chance and that the two protein families are not related. A Z value of zero indicates that the alignment is no more likely than a random permutation of the sequence of amino acids. For M2, Alignment A was best for all comparisons. All Z values of Alignment A are greater than 4.3 for all comparisons except when the Kir family is compared to the non-Kir's, for which the values range from 2.2 to 3.9. The finding that Alignment A is clearly the best for comparisons of the KirBac family to both the non-Kir families and the Kir family, strengthens the argument that it is the proper alignment for Kirs with the non-Kir's. Alignment A is also predicted to be best by all of the other methods that we used. (Except that for some Kir and KirBac sequences the PhiBlast approach predicted that the two residue indel near the beginning of S6 occurred within S6 instead of in the P-S6 loop. We favor the loop location predicted by Clustal W because indels are more likely to occur in loops than within transmembrane helices.) Furthermore, when Z values were calculated for alignments of the different family profiles, this alignment was found to score quite highly for Kir's even without considering KirBac (see Table 2). The fact that KirBac's score are more similar to the Kv and Kbac6TM1 families for M2 but as more similar to the Kir's for the remaining portions of the protein illustrates their intermediate nature.
Table 2.
Z scores for M1 and M2 sequence profiles for alignments A and B.
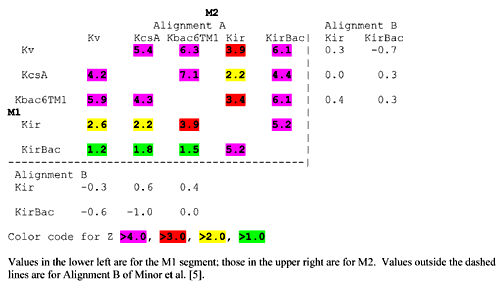 |
The best alignment for M1 is less apparent. Alignment A produces high Z scores when the M1 profiles of nonKir families are compared to each other and when the KirBac families are compared to the Kir family. The Z scores of Alignment A for comparisons of the Kir family to the other families are also reasonably high (2.2–3.9). However, the Z scores for comparison of KirBac to the non-Kir of families are only between 1.2 and 1.8; and some other alignments scored higher for comparisons of the KirBac family to the Kv and Kbac6tm1 families. Nonetheless, Alignment A can be inferred to be the best because it scores highest for comparisons of KirBac's to Kir's and for comparisons of Kir's to the other families. M1 lies on the exterior of the KscA crystal structure where it should be very exposed to lipids when the protein is in a membrane (see Fig. 4a). This relatively exposed peripheral location explains why it tends to be poorly conserved when different families are compared.
Figure 4.
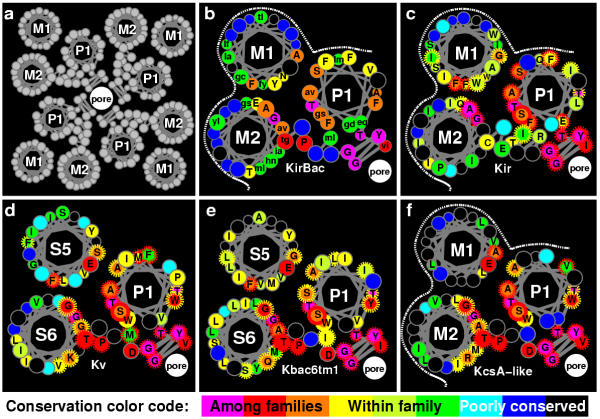
Helical wheel representation of the M1-P-M2 or S5-P-S6 region of different K+ families as viewed from the outside. (a) Representation of the positions of the helices in the tetrameric channel. (b-f) Representation for different families in which side chains (small circles) that are identical or conserved among all or most of the of the families are colored magenta, red or orange, those that well conserved within the family but not among most families are yellow to green, and those that are poorly conserved within the family are cyan to black. For (c-f) side chains that are identical or very similar to conserved residues of the KirBac's are encircled by red or orange dashed lines. In (b) side chains were colored by how many residue types occurred at that position in the alignment for the five KirBac's : 1 = yellow, 2 = green, 3 = blue, 4 or 5 = black. In (c-f) side chain colors were determined by the percentage of conservation at that position calculated by the GCG editor [8] using the Blossum 55 substitution matrix [22] with a cutoff value of 2. Higher levels are colored yellow to green, lower values cyan to black. The more conserved side chains were labeled with the consensus residue determined by the GCG editor. The white dashed line represents the surface that is exposed to the lipid alkyl chains. The representation is somewhat misleading because the axes of the helices in the KcsA crystal structure are not exactly orthogonal to the plane of the membrane. The following groups of residues were considered as conservative substitutions: (K, R, H), (E, Q, D, N), (G, A, S, T, C), (V, I, L, M), and (F, Y, W).
We favor Alignment A for M1 for several additional reasons. 1) This alignment does not require any indels for alignment of KirBac's with most members of the Kv and KcsA-like families for the entire M1-P-M2 segments. Indel penalties were not included in our profile calculations. 2) Second site suppressor experiments on Kir2.1 strongly suggest that a serine residue in M1 forms a H bond with a glutamine residue in M2 [5]. This can occur when Alignment A is used to develop homology models based on the KcsA structure. Futhermore, when a homology model (to be presented elsewhere) of KirBac1.1 was developed, the analogous glutamate residue in M2, which is absolutely conserved among KirBac's, can form H-Bonds to the two adjacent asparagines residues in M1; the first of these is analogous to the Kir2.1 serine mentioned above and the second is absolutely conserved among KirBac's. This interaction between the most polar conserved residue on M1 (the glutamate) and the most polar conserved residue on M2 (the asparagine) cannot occur with most other alignments of M1 when the strongly predicted Alignment A is used for M2. 3) When Alignment A is used to develop homology models, most residues that are highly conserved both within and between the different families interact with residues of other transmembrane segments. This point is illustrated in the helical wheel representations shown in Fig. 4 of the M1-P-M2 segments for the different families. Note that both M1 and M2 display patterns that we call unilateral conservation [10] in which residues that are exposed to lipid on the outer surface are poorly conserved and very hydrophobic, whereas those that interact with other protein residues tend to be more highly conserved. These patterns would not be expected to be the same in the Kv and Kbac6tm1 families because they have four additional transmembrane segments per subunit that should surround their core S5-P-S6 region. In these models, residues that are conserved among the different families tend to cluster together, either near the center of the pore, where they determine the K+ selectivity, or at the region where M1, P, and M2 interact within the subunit. In the latter case, most of the very highly conserved residues are small (glycine, alanine, serine, threonine, or cysteine). Small residues are common where axes of adjacent transmembrane α helices come close together [11]. Although there is little sequence similarity for the M1 and M2 sequences when the Kir sequences are compared to those of the other families, the patterns of sequence conservation of the Kir and KirBac families are remarkably similar to those of the other families when Alignment A is used. Also note that many of the residues that are highly conserved within each family are identical or very similar to residues that are conserved within the KirBac family, as indicated by the red and orange dashed lines that encircle some of the side chains.
The patterns of sequence conservation in Fig. 4 are complemented nicely by mutagenesis studies that have been performed on Kir's as shown in Fig. 5. For example, note how well the poorly conserved (black) and highly conserved (red, orange and yellow) residues of M1 for the Kbac6TM1 family of Fig. 4f correspond to the tolerant (blue) and intolerant (red) Kir residues of M1 in Fig. 5a, that was developed from the screening experiments of Minor et al [5]; and note how well the poorly conserved residues (black, blue, cyan, and green) residues and highly conserved residue positions (magenta, red, and orange) on M2 of the KirBac (Fig. 4b) and KcsA-like (Fig. 4d) families correspond to the tolerant (blue) and intolerant (red) M2 Kir resiude positions of Fig. 5b, that were colored according to results of alanine and tryptophan scanning experiments [12]. These similarities of residue conservation patterns between Kir's and the other families do not match as well for most other alignments between Kir's and the other families.
Figure 5.
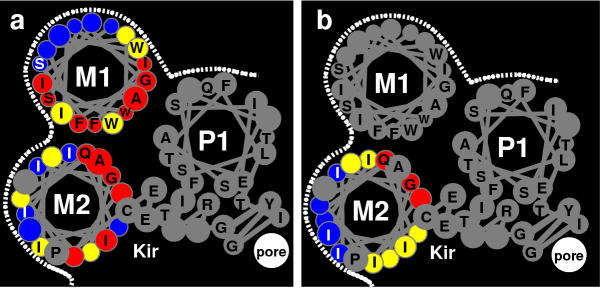
Helical whell representation of one subunit of the Kir family colored according to the results of mutagenesis experiments. (a) The side chains of Ml and M2 are colored according to the categories from the screening experiments of Minor et al. [5]. [b] The side chains of M2 are colored according to the alanine and tryptophan scanning experiments of Choe et al. [12]; black tolerates both tryptophan and alanine, yellow tolerates alanine but not tryptophan, red tolerates neither alanine nor tryptophan.
Three groups [2-4] have used Alignment A for M2 of KcsA and the eukaryotic Kir's. However, based on the results from yeast mutant screens that identify second site suppressor mutations in M1 and M2 segments in Kir2.1, Minor et al. [5] proposed Alignment B in which the Kir sequences of Fig. 3 would be shifted three positions to the left relative to the other sequences for M1, while those for M2 would be shifted three positions to the right. They proposed a model to explain their data in which the Kir2.1 has a structure different from that of KcsA in which M1 interacts with M1 helices of adjacent subunits throughout the entire transmembrane region. We are skeptical about the validity of this model because our three-dimensional modeling efforts indicate that the Minor et al. model requires exclusion of the P segment from the transmembrane region. It is highly unlikely that the only portion of the protein with substantial sequence identity between Kir's and KcsA and that determines the selectivity of the channels for potassium would have entirely different structures and/or exist in different locations in these two proteins. Our calculations indicate that Alignment B is clearly inferior to Alignment A for both M2 and M1; in fact, the Z values in Table 2 of Alignment B average zero, as expected for an incorrect alignment. Futhermore, Alignment A requires no indels for the M1-P-M2 regions for most sequences, which were not included in the calculations, whereas Alignment B requires two. Finally, in our hands homology models based on KcsA developed with Alignment A satisfy the mutagenesis data on which Alignment B is based as do models using alignment B, and models using Alignment A are more consistent with mutagenesis studies of other groups [3,13]. No single model in which the P segment has the structure of KcsA can satisfy all of the second site suppressor data of Minor et al. [5]. However, their data are from an open conformation and the KcsA structure is probably a closed conformation. Most of their data can be satisfied by a combination of two conformations by dramatically altering the position of M1 and the inner portion of M2 for the open conformation (personal observation). It is also conceivable that some of the second site suppressor data are due to an essential intermediate stage of protein folding that differs from the final structure.
Conclusions
Gene transfer between organisms often complicates the interpretation of their evolution. There are now three families of eukaryotic ion channel genes for which only a few homologs have been identified in prokaryotes: the first family is a glutamate-activated K+ channel, GluR0 [14] from Synechocystis PCC 6803, that is homologous to eukaryotic ionotrophic glutamate receptors; the second family is a Na+ channel, NaChBac, from Bacillus halodurans[15], [26] and homologous sequences from Thermobifida fusca and Magnetococcus sp. MC1 (personal observation, http://www.jgi.doe.gov/) with only one 6TM motif per subunit that is homologous to the CatSper Ca2+ channel of sperm cells [16] and to each of four homologous 6TM motifs of the pore-forming subunit of eukaryotic Ca2+ channels; and KirBac is the third family. In each case, the nature of the prokaryotic sequence supports the hypothesis that the gene evolved first in the prokaryotes rather than being transferred to the prokaryote from a eukaryote. For example, mutagenesis experiments [17,18] suggests that the ion selective region of eukaryotic glutamate receptor pores have a gross structure similar to that of K+ channels; however, only GluR0 has a K+ channel signature sequence and forms a K+ selective channel. This is consistent with the hypothesis that glutamate receptors evolved first in bacteria from K+ channels and then lost their selectivity in eukaryotes. Similarly, the fact that NaChBac is about equidistant from consensus sequences of all four 6TM motifs of eukaryotic Ca2+ channels [15] is consistent with the hypothesis that Ca2+ channels initially evolved first in prokaryotes as homotetramers from 6TM Kv-like channels and then underwent two consecutive gene duplication events to evolve into the eukaryotic Ca2+ channels that have only one pore-forming subunit that contains four consecutive 6TM motifs. Likewise, the hypothesis that KirBac evolved after transfer of a eukaryotic Kir to a bacteria is inconsistent with several findings: 1) all eukaryotic Kir's are more closely related to each other than to any KirBac, 2) the P-M2 region of KirBac's is more similar to that of some other bacterial K+ channels than it is to that of eukaryotic Kir's, and 3) the M1-P-M2 region of eukaryotic Kir's have numerous features that occur in no other K+ channels, including KirBac. Thus, the Kir's probably evolved first in prokaryotes as proteins similar to KirBac. This finding suggests KirBac has diverged less from the common ancestor to KirBac and eukaryotic Kir's than have the eukaryotic Kir's and supports the hypothesis that Kir's evolved first in bacteria.
The utility of bacterial channels in structural studies has been made abundantly clear by the KcsA structure. Currently little is known about the three-dimensional structure of Kir's. Thus, determination of the structure of KirBac would be a major breakthrough in understanding the structure and functional mechanisms of this important family of K+ channels. Also, it would be interesting to compare the functional properties of KirBac's to those of other Kir's. Chimeric experiments in which proteins are generated that combine part of a KirBac with part of a Kir could be useful in identifying the role of features that are conserved among eukaryotic Kir's but that are not present in KirBac's.
Methods
Sequence searches were performed with the web-based programs Blast and PsiBlast at http://www3.ncbi.nlm.nih.gov/BLAST/ for sequences that were deposited in data bases and by tblastn at http://www.ncbi.nlm.nih.gov/MicrobJ3last/unfinishedgenome.html for unpublished microbial sequences. The default matrix (BLOSUM62) and gap cost were used but a filter was not used in these searches. The Wisconsin Package Version 10.2, Genetics Computer Group (GCG), Madison, Wisc. USA. was used to align and edit multiple sequences and to calculated the distance matrices. Clustal W1.74 [7] was also used to make multisequence alignments of the M1-P-M2 region for members of each Kir subfamily plus the other sequences illustrated in Fig. 3.
Quantification of the similarity of the transmembrane segments of the different channel families was accomplished by first transforming the multiple sequence alignments into log-odds residue profile matrices. This was done by the method of Henikoff & Henikoff [19], as previously described [20]. In summary, the first step was to weight each sequence in a multiple sequence alignment block according to its degree of similarity to the other sequences, which has the effect of minimizing the influence of highly redundant sequences in the final profile. These weights were calculated according to the method of Henikoff & Henikoff [21], which is based on the residue diversity at each position of the alignment. Next, the sequence-weighted counts were used to calculate the observed occurrence frequency of amino acid residues at each column of the alignment block. To these real residue counts, pseudo-counts were added to better approximate the full set of related sequences in nature (of which only an incomplete, non-random sample is known). Calculation of the pseudo-counts was based on the degree of diversity and statistical substitution probabilities for the specific residues occurring in each of the alignment columns. The recommended value of 5.0 times the residue diversity was used for the total number of pseudo-counts, and the amino acid substitution probabilities were taken from the BLOSUM 62 matrix [22]. A substitution matrix based on transmembrane helices [23] was also used in some cases, however, the results were not altered substantially. Finally, the log-odds of occurrence of a specific residue is obtained from the logarithm of the sum of real and pseudo-counts divided by the background frequency that would occur in a random sequence by chance. The latter was calculated from the relative occurrence of all amino acids in the SWISS-PROT protein sequence database [24]. The final profiles were then constructed as matrices of dimension 20 by the number of positions in the multiple sequence alignment, where the column vectors provide the log-odds of occurrence of the 20 different amino acids at each position.
Having numerically represented the distribution of residues in the multiple sequence alignments, the similarity of two profiles was calculated according to the method of Pietrokovski [25]. Specifically, the standard Pearson correlation coefficient was calculated for each aligned pair of column vectors and summed over the length of the alignment to provide a raw score. This was then converted to a Z-score, which is the number of standard deviations the raw score is from the mean of the normal distribution of scores that would occur by chance. This distribution was estimated from the scores obtained by randomly permuting the columns of one of the two profiles over 40 thousand times. In contrast to our previous method of calculating the chance distribution from the Blocks database [24], using the profiles corrects for the specific composition of amino acids in the segments. The Z-score provides a measure of the statistical significance that can be compared among pairs of aligned profiles. More positive scores are less likely to occur by chance, and thus indicate a greater probability that the two protein segments are homologous.
Abbreviations
Kir: Inward rectifying K+ channel
KirBac: Inward rectifying K+ channel homolog from bacteria
Kv: Voltage-gated K+ channel
Kbac6TM1: a family of prokaryotic channels whose closest relatives are Kv channels.
2TM channel: A channel with only two transmembrane segments per subunit
6TM channel: A channel with six transmembrane segments per subunit.
Contributor Information
Stewart R Durell, Email: Durell@helix.nih.gov.
H Robert Guy, Email: bg4y@nih.gov.
References
- Reimann F, Ashcroft FM. Inwardly rectifying potassium channels. Curr Opin Cell Biol. 1999;11:503–508. doi: 10.1016/S0955-0674(99)80073-8. [DOI] [PubMed] [Google Scholar]
- Doyle DA, Morais Cabral J, Pfuetzner RA, Kuo A, Gulbis JM, Cohen SL, Chait BT, MacKinnon R. The structure of the potassium channel: molecular basis of K+ conduction and selectivity. Science. 1998;280:69–77. doi: 10.1126/science.280.5360.69. [DOI] [PubMed] [Google Scholar]
- Loussouarn G, Makhina EN, Rose T, Nichols CG. Structure and dynamics of the pore of inwardly rectifying K(ATP) channels. J Biol Chem. 2000;275:1137–1144. doi: 10.1074/jbc.275.2.1137. [DOI] [PubMed] [Google Scholar]
- Capener CE, Shrivastava IH, Ranatunga KM, Forrest LR, Smith GR, Sansom MS. Homology modeling and molecular dynamics simulation studies of an inward rectifier potassium channel. Biophys J. 2000;78:2929–2942. doi: 10.1016/S0006-3495(00)76833-0. [DOI] [PMC free article] [PubMed] [Google Scholar]
- Minor DL, Jr, Masseling SJ, Jan YN, Jan LY. Transmembrane Structure of an Inwardly Rectifying Potassium Channel. Cell. 1999;96:879–891. doi: 10.1016/s0092-8674(00)80597-8. [DOI] [PubMed] [Google Scholar]
- Altschul SF, Madden TL, Schäffer AA, Zhang J, Zhang Z, Miller W, Lipman DJ. Gapped BLAST and PSI-BLAST: a new generation of protein database search programs. Nucleic Acids Res. 1997;25:3389–3402. doi: 10.1093/nar/25.17.3389. [DOI] [PMC free article] [PubMed] [Google Scholar]
- Thompson JD, Higgins DG, Gibson TJ TJ. CLUSTAL W: improving the sensitivity of progressive multiple sequence alignment through sequence weighting, position-specific gap penalties and weight matrix choice. Nucleic Acids Res. 1994;22:4673–4680. doi: 10.1093/nar/22.22.4673. [DOI] [PMC free article] [PubMed] [Google Scholar]
- Wisconsin Package Version 10.2, Genetics Computer Group (GCG), Madison, Wisc USA.
- Lu Z, MacKinnon R. Electrostatic tuning of Mg2+ affinity in an inward-rectifier K+ channel. Nature. 1994;371:243–246. doi: 10.1038/371243a0. [DOI] [PubMed] [Google Scholar]
- Guy HR. Models of voltage- and transmitter-activated channels based on their amino acid sequences. In Pasternak, C A (Ed): Monovalent Cations in Biological Systems Boca Raton, CRC, 1990. pp. 31–58.
- Eilers M, Shekar SC, Shieh T, Smith SO, Fleming PJ. Internal packing of helical membrane proteins. Proc Natl Acad Sci USA. 2000;97:5796–5801. doi: 10.1073/pnas.97.11.5796. [DOI] [PMC free article] [PubMed] [Google Scholar]
- Choe S, Stevens CF, Sullivan JM. Three Distinct Structural Environments of a Transmembrane Domain in the Inwardly Rectifying Potassium Channel ROMK1 Defined by Perturbation. Proc Natl Acad Sci U S A. pp. 12046–12049. [DOI] [PMC free article] [PubMed]
- Loussouarn G, Phillips LR, Masia R, Rose T, Nichols CG. Flexibility of the Kir6.2 inward rectifier K+ channel pore. Proc Natl Acad Sci U S A. 2001;98:4227–4232. doi: 10.1073/pnas.061452698. [DOI] [PMC free article] [PubMed] [Google Scholar]
- Chen GQ, Cui C, Mayer ML, Gouaux E. Functional characterization of a potassium-selective prokaryotic glutamate receptor. Nature. 1999;402:817–821. doi: 10.1038/45568. [DOI] [PubMed] [Google Scholar]
- Durell SR, Guy HR. A putative prokaryote voltage-gated Ca2+ channel with only one 6TM motif per subunit. Biochem Biophys Res Commun. 2001;281:741–746. doi: 10.1006/bbrc.2001.4408. [DOI] [PubMed] [Google Scholar]
- Ren D, Navarro B, Perez G, Jackson AC, Hsu S, Shi Q, Tilly JL, Clapham DE. A sperm ion channel required for sperm motility and male fertility. Nature. 2001;413:603–609. doi: 10.1002/(SICI)1096-9861(19991101)413:4<603::AID-CNE9>3.0.CO;2-K. [DOI] [PMC free article] [PubMed] [Google Scholar]
- Kuner T, Wollmuth LP, Karlin A, Seeburg PH, Sakmann B. Structure of the NMDA receptor channel M2 segment inferred from the accessibility of substituted cysteines. Neuron. 1996;17:343–352. doi: 10.1016/s0896-6273(00)80165-8. [DOI] [PubMed] [Google Scholar]
- Panchenko VA, Glasser CR, Mayer ML. Structural Similarities between Glutamate Receptor Channels and K+ Channels Examined by Scanning Mutagenesis. J Gen Physiol. 2001;117:345–360. doi: 10.1085/jgp.117.4.345. [DOI] [PMC free article] [PubMed] [Google Scholar]
- Henikoff JG, Henikoff S. Using substitution probabilities to improve position-specific scoring matrices. Comput Appl Biosci. 1996;12:135–143. doi: 10.1093/bioinformatics/12.2.135. [DOI] [PubMed] [Google Scholar]
- Durell SR, Hao Y, Nakamura T, Bakker EP, Guy HR. Evolutionary relationship between K+ channels and symporters. Biophys J. 1999;77:775–788. doi: 10.1016/S0006-3495(99)76931-6. [DOI] [PMC free article] [PubMed] [Google Scholar]
- Henikoff S S, Henikoff JG. Position-based sequence weights. J Mol Biol. 1994;243:574–578. doi: 10.1016/0022-2836(94)90032-9. [DOI] [PubMed] [Google Scholar]
- Henikoff JG, Henikoff S. Amino acid substitution matrices from protein blocks. Proc Natl Acad Sci U S A. 1992;89:10915–10919. doi: 10.1073/pnas.89.22.10915. [DOI] [PMC free article] [PubMed] [Google Scholar]
- Ng PC, Henikoff JG, Henikoff S. PHAT: a transmembrane-specific substitution matrix. Bioinformatics. 2000;16:760–766. doi: 10.1093/bioinformatics/16.9.760. [DOI] [PubMed] [Google Scholar]
- Bairoch A, Apweiler R. The SWISS-PROT protein sequence data bank and its supplement TrEMBL in 1998. Nucleic Acids Res. 1998;26:38–42. doi: 10.1093/nar/26.1.38. [DOI] [PMC free article] [PubMed] [Google Scholar]
- Pietrokovski S. Searching databases of conserved sequence regions by aligning protein multiple-alignments. Nucleic Acids Res. 1996;24:3836–3845. doi: 10.1093/nar/24.19.3836. [DOI] [PMC free article] [PubMed] [Google Scholar]
- Ren D, Navarro B, Yue L, Shi Q, Clapham DE. A prokaryotic Voltage-gated sodium channel. Science. 2001;294:2372–2375. doi: 10.1126/science.1065635. [DOI] [PubMed] [Google Scholar]


