

Abstract
Spliceosomal introns are ubiquitous non-coding RNAs typically destined for rapid debranching and degradation. Here, we describe 34 excised Saccharomyces cerevisiae introns that, although rapidly degraded in log-phase growth, accumulate as linear RNAs under either saturated-growth conditions or other stresses that cause prolonged inhibition of TORC1, a key integrator of growth signaling. Introns that become stabilized remain associated with components of the spliceosome and differ from other spliceosomal introns in having a short distance between their lariat branch point and 3′ splice site, which is necessary and sufficient for their stabilization. Deletion of these unusual introns is disadvantageous in saturated conditions and causes aberrantly high growth rates of yeast chronically challenged with the TORC1 inhibitor rapamycin. Reintroduction of native or engineered stable introns suppresses this aberrant rapamycin response. Thus, excised introns function within the TOR growth-signaling network of S. cerevisiae, and more generally, excised spliceosomal introns can have biological functions.
Spliceosomal introns are a defining feature of eukaryotic life; they are present in all known eukaryotic genomes and absent from all known non-eukaryotic genomes1,2. Introns and splicing can play important roles in eukaryotic gene evolution, mRNA expression, and protein diversification3, and once excised from the primary transcript, introns can sometimes be further processed to generate smaller noncoding RNAs, such as microRNAs or small nucleolar RNAs (snoRNAs)4. In principle, full-length excised introns could also be a fertile source of functional ncRNAs. However, excised lariat introns are debranched and degraded within seconds5–9, and thus generally viewed as inert, ephemeral byproducts of gene expression10.
Functions for individual introns have been examined most thoroughly in the intron-poor budding yeast S. cerevisae, which contains approximately 300 spliceosomal introns, with only a few annotated cases of alternative-splicing events11–13. For most introns tested, no growth phenotypes are detected upon their removal14–16, but for a few, phenotypes are observed. Some functions inferred from these phenotypes, such as influencing gene expression17,18 manifest entirely during pre-mRNA production and processing and thus before the introns exist as separate RNA molecules. Other functions, such as providing a source of snoRNAs, occur post-spicing, although in these cases flanking portions of the intron are still rapidly catabolized19. Thus, functional analyses in S. cerevisiae support the prevailing view that the collective fate of introns post-splicing is solely to be debranched and at least partially degraded.
Although most yeast introns have now been individually assayed for function, relatively few experimental conditions have been explored. Most experiments assay cells in log-phase growth, which provides consistent measurements in a standardized system sensitized to detect differences in growth and metabolism. However, outside of the laboratory, yeast cells are unlikely to spend many consecutive generations rapidly dividing and more often face limiting nutrients or other stresses20. Accordingly, we set out to examine gene regulation of S. cerevisiae outside of the context of log-phase growth.
Accumulation of excised, linear introns
We performed RNA sequencing (RNA-seq) on two S. cerevisiae samples: one taken from a culture in log-phase growth and the other from a saturated culture in which cell density was minimally increasing. For most intron-containing genes (exemplified by ACT1), very few intron-mapping RNA-seq reads were observed from either culture condition (Fig. 1a), as expected if introns were rapidly degraded post-splicing. However, for a subset of genes (exemplified by ECM33), many intron-mapping reads were observed specifically from the saturated culture (Fig. 1b). Indeed, the higher density of reads for the ECM33 intron compared to that for its exons suggested that in this growth condition, the intron accumulated to much greater levels (10 fold) than did its corresponding mature mRNA.
Figure 1. Some excised linear introns accumulate in yeast.
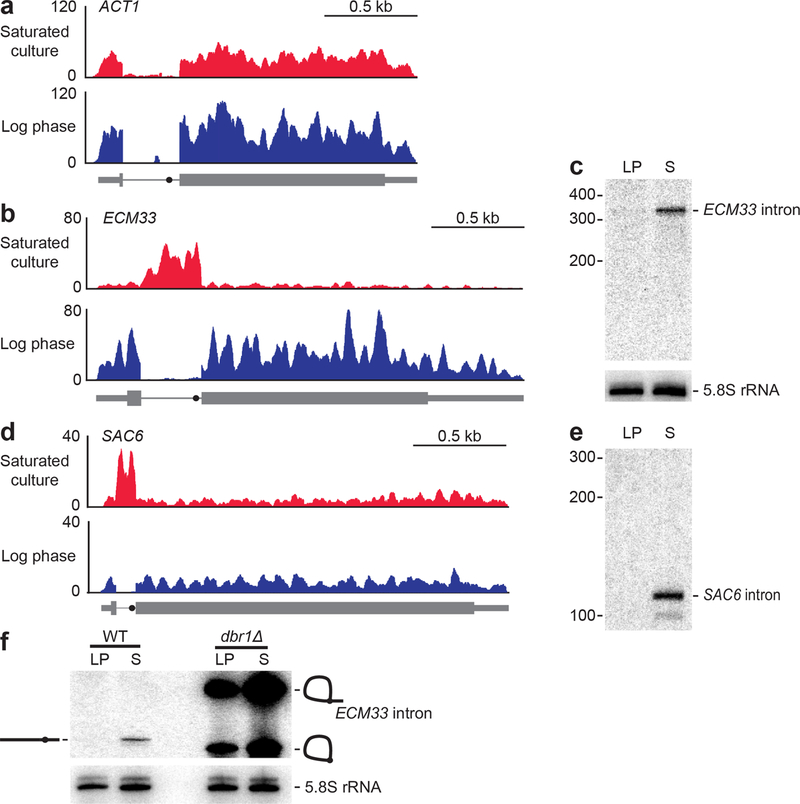
a, Undetectable accumulation of the ACT1 intron. Shown are RNA-seq profiles for ACT1 (thick box, coding sequence; thin box, untranslated region; line, intron; closed circle on intron, BP) in both log-phase and saturated cultures. Plotted for each nucleotide of the locus is the number of reads per million combined exon- and intron-mapping reads of the library. n = 2 biological replicates, b, Accumulation of the ECM33 intron in saturated but not log-phase culture, otherwise as in a. c, Accumulation of intact ECM33 intron in saturated culture. Shown is an RNA blot that resolved total RNA from both log-phase (LP) and saturated (S) cultures and was probed for the ECM33 intron. Migration of markers with lengths indicated (nucleotides) is at the left. For a loading control, the blot was reprobed for 5.8S rRNA. n = 12 biological replicates, d, Accumulation of the SAC6 intron in saturated but not log-phase culture, otherwise as in a. e, Intact SAC6 intron detected by reprobing the RNA blot of c; otherwise, as in c. f, Accumulation of debranched ECM33 intron in saturated culture. Analysis is as in c; except the RNA blot included samples from both WT and dbrlΔ cultures. Migration of the linear isoform is indicated (diagram on the left) as is migration of both the lariat and the circular isoforms (diagrams on the right). n = 3 biological replicates.
Read coverage dropped abruptly at the 5′ and 3′ boundaries of the ECM33 intron (Fig. 1b), which suggested accumulation of full-length intron. To examine whether our RNA-seq analysis was indeed detecting accumulation of excised introns of a defined size, we probed RNA blots for the inferred RNA species. Probes to the ECM33 intron detected a single major species migrating at the position expected for the full-length intron (Fig. 1c). Likewise, a probe for SAC6, another intron inferred by RNA-seq to accumulate in saturated culture (Fig. 1d), detected an RNA of the size expected for the full-length excised intron (Fig. 1e). These introns that accumulate in saturated cultures are hereafter called “stable introns.”
A known mechanism by which excised introns can be protected from degradation is if they evade debranching and persist as either lariat RNAs or circular derivatives in which the lariat tail is missing8,21. However, these nonlinear species have either branched RNA or a 2′–5′ phosphodiester linkage, which would impede reverse transcriptase7,22 and thereby cause RNA-seq reads to be depleted in the region of the branch point—a pattern that we did not observe in the RNA-seq profiles (Fig. 1b, Extended Data Fig. 1). To test further whether ECM33 intronic RNA accumulated as either a lariat RNA or its circular derivative, we harvested RNA from yeast lacking Dbr1, the enzyme required to debranch intron lariats8, and compared the ECM33 intronic RNA that accumulated in the dbr1Δ strain with RNA that accumulated in wild-type saturated cultures. As expected, in dbr1Δ cultures, ECM33 intron was detected as two abundant species, which corresponded to branched lariat and its circle derivative (Fig. 1f). Importantly, neither of these non-linear species co-migrated with the linear intron identified in wild-type saturated culture. These results confirmed that Dbr1 is necessary to form linear introns outside of log phase and showed that the previously known mode of decreased intron turnover cannot explain the accumulation of excised introns in a saturated culture.
Another mechanism that might protect stable introns from degradation in saturated cultures is incorporation into a ribonucleoprotein complex. Indeed, the ECM33 intron predominantly co-sedimented with complexes about the size of ribosomal subunits (35–50 Svedberg units, Extended Data Fig. 2a). To identify proteins that associate with the intron, we performed pull-down experiments from gradient fractions containing the intron and used quantitative mass spectrometry to identify co-purifying proteins. For these experiments, we took advantage of the observation that tagged versions of the ECM33 intron excised from expression constructs retained the behavior of the endogenous ECM33 intron (Extended Data Fig. 2b, c). Each of the top 10 proteins that consistently co-purified with MS2-tagged versions of the ECM33 intron (average enrichment, 4.9-fold) were spliceosomal proteins, the identities of which indicated that the excised and debranched ECM33 intron resided in a specific complex, which when compared to known spliceosome complexes most closely resembled the intron-lariat spliceosome (ILS) complex (Extended Data Table 1)23.
Studies in log-phase extracts indicate that introns are debranched after spliceosome disassembly24. If stable introns were also debranched outside the spliceosome, they would then need to re-associate with spliceosome components as linear RNAs. A simpler model is of continued association of stable introns with ILS components during their debranching, in which case the relationship between ILS disassembly and debranching presumably varies, depending on growth condition and/or intron identity. In either scenario, our findings indicate that in saturated cultures accumulating introns are bound to and presumably protected by a complex resembling the ILS.
Defining features of stable introns
We performed a systematic search for all introns that undergo a switch in stability and accumulate as linear RNAs in saturated cultures. In this search, RNA-seq reads of each intron-containing gene were analyzed for a preponderance of reads mapping to introns, particularly those mapping to edges of excised introns (consistent with a post-splicing intron) relative to those mapping across splice sites and splice junctions (which represented signatures of intron retention and mature mRNA expression, respectively)25 (Extended Data Fig. 3a). Inspection of RNA-seq reads that mapped to 3′ edges of stable introns identified many that were extended by one or more untemplated adenosine residues (Extended Data Fig. 3b). Short 3′-terminal oligo(A) tails are added by TRAMP complex to mark nuclear RNAs for degradation26,27. Our finding that many stable-intron molecules had these tails suggests that these molecules might have been targeted for exosomal decay yet somehow escaped this decay. Regardless of their function, these untemplated adenosine residues provided an additional criterion for annotation of stable introns, which helped us confidently identify another 28 introns that accumulated in saturated cultures (Extended Data Fig. 4, Extended Data Table 2).
We searched for common features among the 30 stable introns, which cellular machinery might use to differentiate them from the remaining introns that are rapidly degraded in saturated cultures. Compared to other introns, stable introns had similar strengths of canonical splicing motifs (Extended Data Fig. 5a), similar length distributions (Extended Data Fig. 5b), no common predicted structures or enriched sequence motifs (Extended Data Fig. 5c and d), and no enriched functional ontologies of their host genes. Of the features examined, the only one that differed was the distance between the lariat branch point (BP) and 3′ splice site (3′SS), which tended to be shorter for stable introns (Fig. 2a).
Figure 2. Stable introns have short BP-3′SS distances.
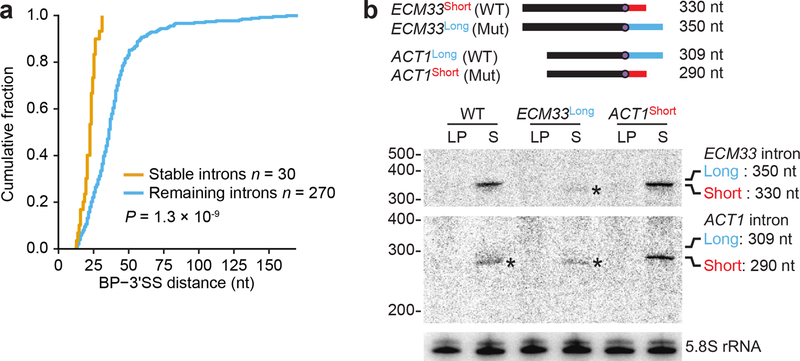
a, Shorter BP-3′SS distances of stable introns. Plotted are cumulative distributions of BP-3′SS distances (P= 1.3 × 10⁻⁹, two-tailed Kolmogorov-Smimov test). b, Causal relationship between BP-3′SS distance and stable-intron formation. The diagram (top) shows WT and mutant (Mut) introns, in which the WT ECM33 BP-3′SS distance was extended from 25 nt (short, red) to 45 nt (long, blue), and the WT ACT1 BP-3′SS distance was shortened from 44 nt (long, blue) to 25 nt (short, red). Below, an RNA blot that resolved samples from the indicated strains and was probed sequentially for the ECM33 intron (top), the ACT1 intron (middle), and 5.8S rRNA. Probes were complementary to portions of introns common to both short and long isoforms. Expected migration of long and short linear isoforms of each intron is at the right. The asterisks (*) mark detection of long-isoform degradation products, which each migrate faster than the short isoform. n = 3 biological replicates.
To investigate a potential role of BP position in influencing intron stability, we made mutations that changed endogenous BP–3′SS distances and examined the effects on intron accumulation.
Lengthening the short BP–3′SS distance of the normally stable ECM33 intron from 25 to 45 nt abrogated accumulation of full-length excised intron, which indicated that a short BP–3′SS distance is required for stability of this intron (Fig. 2b). Moreover, shortening the BP–3′SS distance of the normally unstable ACT1 intron from 44 to 25 nt conferred stability to this intron in saturated culture, which suggested that a short BP–3′SS distance is not only necessary but also sufficient for stability (Fig. 2b).
The notion that a short BP–3′SS distance is sufficient for stability suggested that introns that had short BP–3′SS distances yet were not identified as stable introns (Fig. 2a) might not have been transcribed during the period at which stable introns are protected from degradation. To investigate this possibility, we used our expression construct to expressed introns that had not been identified as stable introns, choosing two introns with a short (20- and 25-nucleotide) and two with a long (37- and 44-nucleotide) BP–3′SS distance. The two with short BP–3′SS distances accumulated specifically in saturated cultures, whereas the two with long BP–3′SS distances were unstable in both conditions (Extended Data Fig. 5e).
Thus, the two defining features of stable introns are 1) a short BP–3′SS distance and 2) expression within a cellular context in which introns are stabilized. After being modified to satisfy these criteria, all tested non-stable introns became stable introns (Fig. 2b, Extended Data Fig. 5e), which indicated that no other feature of either the intron or the host gene is required to achieve stability.
Regulation of stable introns
We next monitored levels of the ECM33 stable intron and its host mRNA through 72 h of culture to determine when the switch in intron stability occurred (Fig. 3a). The ECM33 mRNA levels were highest during rapid growth, whereas its intron levels were low through 8 h of growth and then dramatically increased as cells exited rapid growth (Fig. 3a). Intron abundance remained high for at least the next 62 h, even as levels of mature mRNA decreased 23-fold. Although the dynamics of the ECM33 intron and mRNA illustrated the different behaviors sometimes observed for stable introns and their host mRNAs, the large decrease in the levels of the mature mRNA in saturated culture was not observed for all mRNAs that hosted stable introns (Extended Data Fig. 5f).
Figure 3. Stable-intron accumulation occurs after prolonged TORC1 inhibition.
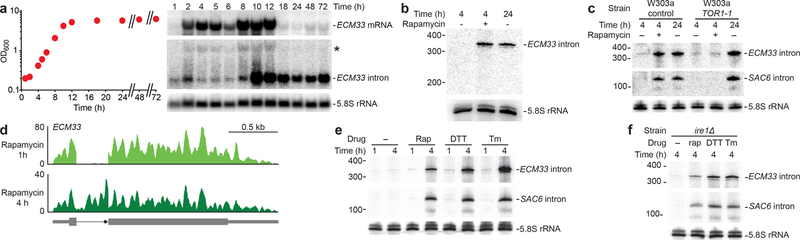
a, Distinct accumulation patterns of the ECM33 stable intron and its host mRNA. After seeding at OD600 = 0.2, growth was monitored (left), and aliquots were harvested for RNA-blot analysis (right). The blot is as in Fig. 1c, except it utilized a gel designed to resolve longer RNAs. The asterisk (*) marks migration of ECM33 pre-mRNA. b, Accumulation of the ECM33 stable intron in cells cultured with rapamycin. Cultures were seeded at OD600 = 0.2 from an overnight culture, allowed to grow to early log phase, collected by vacuum filtration, and resuspended in fresh media without (lanes 1 and 3) or with (lane 2) 100 nM rapamycin. Cultures were harvested at indicated times and analyzed as in Fig. 1c. n = 6 biological replicates, c, Requirement of rapamycin-sensitive TORC1 for induction of stable introns by rapamycin. Compared are results of a W303a control strain and a W303a strain containing a rapamycin-insensitive allele of TOR1 (TOR1-1)45. Otherwise, this panel is as in b, except the RNA blot was additionally reprobed for the SAC6 intron. n = 2 biological replicates, d, Undetectable accumulation of the ECM33 intron after 1 h of rapamycin treatment. Accumulation of this intron after 4 h of rapamycin treatment is shown for comparison. Otherwise, this panel is as in Fig. 1a. e, Accumulation of stable introns in cells cultured with 100 nM rapamycin (Rap), 5 mM dithiothreitol (DTT), or 1 µg mL−l tunicamycin (Tm). Otherwise, this panel is as in b, except that the RNA blot was also probed for the SAC6 intron. n = 3 biological replicates, f, Accumulation of stable introns in cells cultured with DTT or tunicamycin despite deletion of IRE1. Otherwise, this panel is as in e. n = 2 biological replicates.
The timing of stable-intron accumulation suggested that their formation might be linked to exit from rapid growth. With this in mind, we used rapamycin to inhibit TORC1 (target of rapamycin complex 1), a broadly conserved master integrator of nutritional and other environmental signals28,29. In yeast, rapamycin-mediated TORC1 inhibition leads to repression of anabolic processes, stimulation of catabolic processes, and greatly reduced growth28. When a log-phase culture was resuspended in fresh media containing rapamycin, ECM33 intron accumulated after 4 h (Fig. 3b). A repeat of this experiment using a strain with a rapamycin-resistant allele of TOR1 (TOR1–1) yielded no accelerated intron accumulation upon treatment with rapamycin (Fig. 3c). TOR1–1 cultures nonetheless accumulated stable introns upon reaching saturation (Fig. 3c), as expected in this strain known to be sensitive to endogenous TORC1 inhibition30. Thus, rapamycin-induced intron accumulation was specifically due to inhibition of TORC1. Inhibition of protein synthesis in a TORC1-independent way did not cause stable-intron formation (Extended Data Fig. 6a). Moreover, stable introns accumulated to lower levels in TORC1*, a strain which contains six hyperactive alleles of the regulatory network31 (Extended Data Fig. 7a)—results that further validated the involvement of TORC1 signaling.
To extend this investigation transcriptome-wide, we prepared RNA-seq libraries from yeast treated for 4 h with rapamycin. We also investigated stable-intron formation in a metabolically different saturated-growth scenario: a lawn of yeast grown over 3 days in an aerobic environment. When compared to saturated-liquid culture, both rapamycin-treated cells and cells from the lawn showed similar accumulation of not only the ECM33 intron (Extended Data Fig. 7b) but also other stable introns (Extended Data Fig. 7c). In total, 34 introns (11% of S. cerevisiae introns) were classified as stable introns in at least one of the three conditions (Extended Data Fig. 4, Extended Data Table 2).
We tested several genetic and environmental perturbations for their effects on stable-intron accumulation. Gain-of-function mutations in TAP42 or SCH9 (the two major effector branches of TORC1) were individually insufficient to override TORC1 repression and attenuate stable-intron formation (Extended Data Fig. 6b,c), and Sch9 activity was not required for stable-intron regulation (Extended Data Fig. 6d), which implicated involvement of another effector branch of TORC1. Although depletion of carbon, nitrogen, and amino acids rapidly inhibit facets of TORC1 signaling28, these conditions did not induce premature stable-intron formation (Extended Data Fig. 6e). Likewise, direct perturbations of general amino acid control [GAAC] pathway did not disrupt stable-intron regulation (Extended Data Fig. 6f,g). Thus, the role of TORC1 in stable-intron regulation appeared separable from its role in rapid response to nutrient deprivation.
As illustrated for the ECM33 intron (Fig. 3d), stable introns were not detected after treating with rapamycin for 1 h, a time period sufficient to phenocopy the TORC1 response to nutrient deprivation. This result agreed with our observation that some conditions known to rapidly inhibit aspects of TORC1 signaling did not induce stable introns and motivated an attempt to account for this delayed response to rapamycin. Few studies have explored prolonged TORC1 inhibition in yeast, and those that report on ≥2 h rapamycin treatments observe strikingly different TORC1-mediated responses compared to short-term rapamycin treatment or starvation32–35. Interestingly, some of these studies33–35. show that prolonged TORC1 inhibition (≥2 h treatment with rapamycin or tunicamycin) phenocopies secretory stress more closely than nutrient stress. Indeed, we found that the secretory stressors tunicamycin and dithiothreitol induced stable-intron formation, that this induction required extended treatment durations similar to that required for rapamycin, and that induction of stable introns by these canonical unfolded-protein response (UPR) activators did not require the essential UPR sensor IRE1 (Fig. 3e,f). These results indicated that TORC1-mediated stable-intron accumulation depends on connections between TORC1 and membrane-trafficking or secretory stress36,37, and not the more-often-considered connections between TORC1 and nutrient stress.
Biological function of stable introns
The discovery of stable introns and their link to the TORC1 growth-signaling pathway brought to the fore the question of their function. To build strains to test for loss-of-function phenotypes, we used a CRISPR-Cas9 system38,39 that facilitated precise removal of introns without affecting exonic sequences. We reasoned that stable introns might contribute collectively to function, and therefore generated a quintuple mutant that lacked stable introns of five genes (ECM33, UBC4, HNT1, SAC6, and RFA2). Because introns from these genes normally accumulated to high levels, this strain, which we call EUHSR, had less than half the stable intron molecules compared to the wild-type (WT) strain (Fig. 4a, Extended Data Fig. 8a).
Figure 4. Stable introns influence yeast fitness and growth.
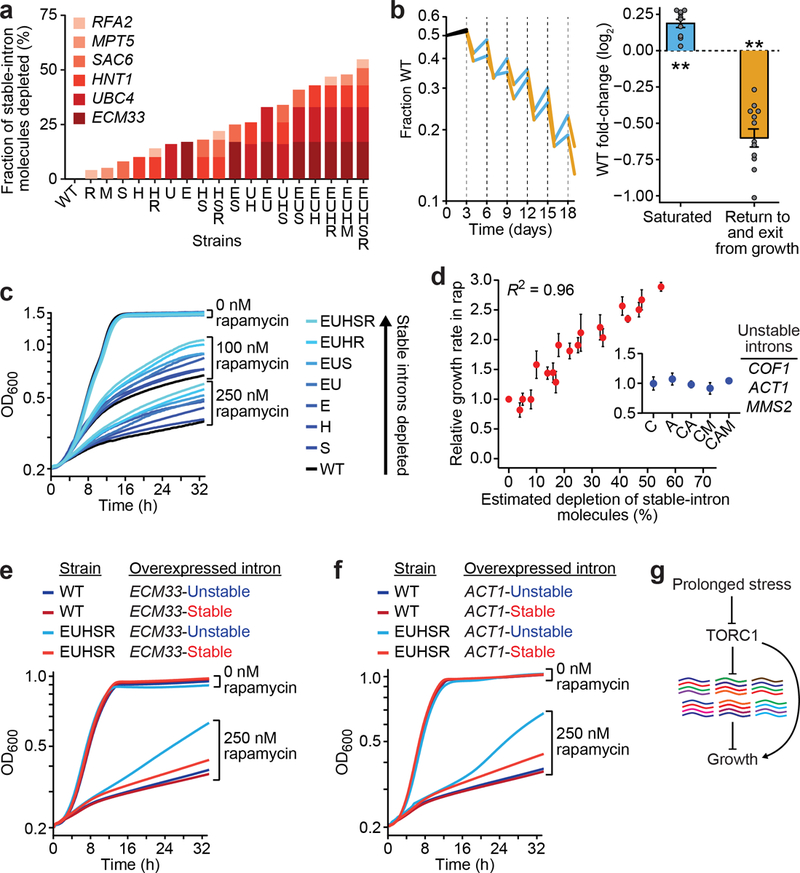
a, Stable-intron genomic deletions and their estimated effect on total stable-intron molecules. Strains were named using single-letter abbreviations of the genes with deleted introns (color key), b, Altered fitness of the EUHSR strain. Left, co-cultures of WT and EUHSR were diluted every three days (dashed lines). Plotted is the fraction of WT in each co-culture, measured before each dilution and a day after each dilution. Lines for each biological replicate are colored to indicate periods of saturated growth (blue), returning to and exiting rapid growth (orange), and initial post-seeding (black, not considered in calculations). Right, mean fold-change of WT (expressed as log2 (fraction of WT at earlier time point/fraction of WT at later time point)) during periods of saturated growth (blue, n = 10, P = 9.4 × 10⁻⁵, 95% confidence interval 0.12 to 0.25, two-tailed t test) and return to and exit from growth (orange, n = 12, P = 1.0 × 10⁻⁶, 95% confidence interval −0.74 to −0.46, two-tailed t test). Error bars, s.e.m; **, P < 10−4. c, Rapamycin response of strains with fewer stable-intron molecules. Shown are growth curves of WT and deletion strains (color key) in either 0, 100, or 250 nM rapamycin. d, Relationship between depletion of stable-intron molecules and increased growth in 250 nM rapamycin. Inset, control strains in which 1–3 unstable introns were deleted (n= 12 for WT, n = 3 for all other strains; error bars, s.e.m.). e, Rescue of the rapamycin-response defect by the ECM33 intron. Shown are growth curves of WT and EUHSR strains overexpressing either the native (red) or unstable (blue) ECM33 intron cultured in either 0 or 250 nM rapamycin. n = 3 biological replicates, f, Rescue by an engineered ACT1 stable intron. As in e, but expressing either the native (blue) or stable (red) ACT1 intron. g, Stable introns in the TORC1 network.
To detect consequences of reducing stable-intron abundance, we co-cultured the EUHSR and WT strains in a competitive-growth assay. The co-culture was grown for three days, diluted, grown for three days again, and so on for a total of six cycles of growth. Time points taken just before dilution and after a day of regrowth revealed a saw-tooth pattern in which the WT strain had a significant advantage during the period of sustained saturated culture, whereas EUHSR had a significant advantage during the period that included re-entry to growth and exit from growth (Fig. 4b). These results indicated that stable-intron expression is beneficial in some physiological contexts and detrimental in others.
Because of the connection between TORC1 inhibition and stable-intron formation (Fig. 3b–f), we tested the effect of rapamycin on growth of mutant strains from a series of intron deletions that produced decreasing amounts of stable introns (Fig. 4a). In contrast to the co-culture experiment (Fig. 4b), seeding was with log-phase cultures, which helped explain why all strains grew at equivalent rates in the absence of rapamycin (Fig. 4c). In the presence of rapamycin, growth was inhibited for all strains, but this growth inhibition was attenuated for strains with fewer stable introns (Fig. 4c). A striking correlation was observed between the estimated fraction of stable-intron molecules depleted from the transcriptome and attenuation of the rapamycin response (Fig. 4d). In contrast, the rapamycin response of control strains that lacked non-stable introns of highly expressed genes was indistinguishable from that of wild type (Fig. 4d, inset), which showed that the observed phenotype was specific to depletion of stable introns and not merely a consequence of decreased splicing load.
The attenuated response to TORC1 inhibition seemed to depend solely on the number of stable-intron molecules removed from the cell and not on the identities of either the removed introns or their host genes (Fig. 4d). This result disfavored the idea that the phenotype might have resulted from subtle changes in host-gene expression or other secondary effects of intron removal or strain construction (such as off-target effects of gene editing). To test the conclusion that the attenuated response to TORC1 inhibition depended solely on the aggregate number of stable-intron molecules produced, we examined the ability of ectopically expressed introns to rescue the phenotype. We first overexpressed the ECM33 stable intron or, as a control, its unstable derivative that had a lengthened BP–3′SS distance (ECM33-stable and ECM33-unstable, respectively). The stability of this overexpressed intron had no detectable effect on either WT or EUHSR growth in the absence of rapamycin, and it had little effect on growth of the WT strain in rapamycin (Fig. 4e). Importantly, however, the stability of this ectopically expressed intron dramatically influenced growth of the quintuple mutant in the presence of rapamycin—nearly completely rescuing its defective response to rapamycin (Fig. 4e). Analogous results were observed when ectopically expressing stabilized and normal versions of the ACT1 intron (ACT1-stable and ACT1-unstable, respectively) (Fig. 4f), The ability of a stable version of the ACT1 intron, which does not exist naturally in S. cerevisiae, to rescue the quintuple-mutant phenotype confirmed that this phenotype was a primary consequence of reduced stable-intron abundance.
Taken together, our results show that stable introns function within the TORC1-mediated stress response in S. cerevisiae (Fig. 4g). TORC1 activity prevents stable-intron formation, as shown by accumulation of these introns when cells undergo prolonged TORC1 inhibition (Fig. 3b–f), and stable introns inhibit growth of cells with decreased TORC1 activity, as shown by increased growth observed in TORC1-inhibited strains with fewer stable introns (Fig. 4c–f). Thus, this double-negative regulation, in which TORC1 inhibits stable introns, which in turn inhibit growth, forms a previously unknown node of the TOR regulatory network, which works in concert with other TORC1-dependent and TORC1-independent pathways to control growth in S. cerevisiae (Fig. 4g).
Mechanistic possibilities
The discovery of this node of the TOR regulatory network raises mechanistic questions, including that of how stable-intron accumulation might inhibit growth. Our results imply that the stoichiometry of stable introns relative to some cellular component underlies this function. One possibility is that stable introns sequester spliceosomes to reduce splicing activity. Supporting this idea, stable introns associate with spliceosome components (Extended Data Table 1) and S. cerevisiae pre-mRNAs compete for limited splicing machinery40. Moreover, in budding yeast, sequestering spliceosomes might disproportionally affect mRNAs of ribosomal protein genes (RPGs); because of their high expression levels and frequent possession of an intron, RPG mRNAs are substrates for 90% of all splicing events in log-phase S. cerevisiae41. Although this percentage presumably decreases as cells exit log phase, stable introns could function as part of a larger regulatory network that uses inefficient splicing to help keep ribosome production low during prolonged environmental and intracellular insults41,42.
To evaluate this idea, we revisited our RNA-seq data from rapamycin-treated yeast with the goal of determining the aggregate level of stable introns relative to spliceosome components. This analysis showed that stable-intron molecules reached 40% of the level of U5 snRNA molecules (Extended Data Fig. 8b), and in principle, an essential splicing protein could be more limiting than this snRNA. Thus, stable-intron accumulation was within a regime in which depleting 55% of stable-intron molecules—as in our EUHSR strain—could substantially alter spliceosome availability. Furthermore, overexpressing a stable intron (ECM33) in the EUHSR strain grown in rapamycin resulted in more intron retention and less RPG mRNA accumulation as compared with overexpression of a non-stable intron (ACT1) (Extended Data Fig. 8c,d). Future characterization of the stable-intron complex will provide more detailed information on cellular machinery that is sequestered and might also provide insight into other mechanistic questions, such as how stable introns are protected from degradation and how this protection is biochemically coupled to TORC1 inhibition.
Discussion
The ease with which we were able to observe accumulation of stable introns raised the question of why they were not detected earlier. The answer lies with two features of our analysis. First, we examined cells in saturated culture, whereas most analyses examine cells in log phase, a stage at which all excised introns are rapidly degraded. Second, we avoided mRNA poly(A) selection, whereas many analyses perform poly(A) selection prior to RNA-seq, which depletes excised introns because they lack poly(A) tails. In addition, we used an in-house RNA-seq protocol in which RNA was fragmented and 27- to 40-nucleotide fragments were isolated for sequencing, whereas most analyses use commercial RNA-seq kits that deplete RNAs shorter than a few hundred nucleotides, the size of excised yeast introns. In principle, studies that used splicing-isoform microarrays to assay intron retention during stress, including rapamycin and DTT treatment, might have detected stable introns40,43,44. However, those studies focus on measurements over the course of 40 min, with no measurements taken beyond 2 h of treatment, which might not have been enough time to detect stable introns under these conditions. Our findings on prolonged TORC1 inhibition strengthen the links between TORC1 signaling and secretory stress in yeast33–35, and show that short and long durations of TORC1 inhibition can result in distinct effects on some downstream biological processes—including stable-intron regulation.
Although our ideas regarding the mechanism of stable-intron function require validation, one interesting aspect of this mechanism is that it operates regardless of stable-intron sequence or genomic origin. This observation provides an example in which the history of a noncoding RNA (that is, how the molecule is born) can be sufficient to impart a cellular function—independent of any primary-sequence considerations. Similar principles might apply to other noncoding RNAs, especially those that lack primary-sequence conservation.
Our results add an unexpected dimension to possible fates and functions of spliceosomal introns within eukaryotic biology. Although noteworthy examples of intron lariats and trimmed linear introns with lives post-splicing have been reported10, the introns described here are unique in that they persist as excised, full-length, debranched RNAs. Moreover, their stability is regulated in response to environmental changes, and they collectively act as a newly defined type of functional ncRNA. Our focus has been on the contexts of TORC1 inhibition and saturated growth, but stable introns might also be induced and have similar functions in other conditions. Although intron-rich eukaryotes cannot as obviously leverage spliceosome availability to manipulate production of specific subsets of proteins, some might use excised linear introns to perform biological functions— perhaps in environmental conditions that have not yet been extensively profiled. At this point, we know that excised linear introns accumulate and function in at least one eukaryotic lineage, and we would be surprised if this is the only one.
METHODS
Yeast strains and genetic manipulations
S. cerevisiae strains used in this study are listed in Supplementary Table 1. With the exception of strains acquired for TOR1–1 (Fig. 3c) and TORC1* (Extended Data Fig. 7a) experiments, all strains were in the BY4741 background. A TAP42 heterozygous diploid knockout strain (Horizon Discovery) was transformed with plasmids encoding either wild-type (TAP42) or mutant (tap42–11) alleles before sporulation and tetrad dissection. Transformations were performed using standard methods. Intron deletions and endogenous BP manipulations were made using a CRISPR-Cas9 system adapted for use in S. cerevisiae38,39 and were confirmed by colony PCR and Sanger sequencing of relevant genomic loci. Clones with correct deletions were counter-selected for the Cas9 plasmid by plating onto 5-FOA media before their use in experiments. This process was iterated to generate strains with multiple deleted introns. Strains that underwent 5-FOA counter-selection were confirmed to not be petite by patching to YP-glycerol plates. his3Δ1 repair was performed by transforming BY4741 with linear HIS3 DNA, selecting for His+ transformants, and confirming repair of the endogenous locus by colony PCR and Sanger sequencing. Plasmids used in this study are listed in Supplementary Table 2. Oligonucleotides (IDT) used for guide RNAs and repair templates are listed in Supplementary Table 3.
Growth conditions and harvesting
Yeast were grown at 30 °C on standard synthetic complete (SC) plate and liquid media, except experiments involving TORC1* strains (Extended Data Fig. 7a), which were performed according to previously described protocols31, and tap42∷KanMX strains (Extended Data Fig. 6b), which were performed at 25 °C owing to temperature sensitivity. SC-Ura and SC-Trp were used in some experiments to maintain selection for URA3- and TRP1-expressing plasmids. SC-His was used in experiments involving 3-aminotriazole. Rapamycin (LC Laboratories; 10 mM stock in DMSO) aliquots were stored at −80 °C, and diluted to 10 μM in water immediately before use. 3-aminotriazole (Sigma-Aldrich; 1 M stock in water), cycloheximide (Sigma-Aldrich; 100 mg mL−1 stock in DMSO), DTT (Thermo Scientific; 1 M stock in water), and tunicamycin (Millipore-Sigma; 10 mg mL−1 stock in DMSO) aliquots were stored at −20 °C. Cultures were seeded at OD600 0.2 from overnight cultures (typically OD600 ~6) for growth to log phase or saturation. Log-phase cultures were harvested during early log phase, typically at OD600 0.5, reached 4–5 h after seeding. Unless otherwise indicated, saturated cultures were harvested 18–20 h after seeding. In acute nutrient depletion experiments, cultures were grown to mid-log phase (OD600 ~1), filtered, washed twice with water, and resuspended in appropriate media (SC–glucose, SC–ammonium sulfate, SC–leucine, or SC–uracil). All cultures were rapidly harvested by vacuum filtration and flash frozen in liquid nitrogen as described46. Frozen pellets were mechanically lysed using a Sample Prep 6870 Freezer/Mill (Spex SamplePrep; 10 cycles of 2 min on, 2 min off at setting 10). Lysate powder was aliquoted and stored at −80 °C.
Competitive growth
WT and EUHSR strains were co-cultured in a series of batch cultures, which were performed in biological replicate. The experiment started with a 50 mL co-culture in a 250 mL baffled flask seeded with an equal amount of the two strains at a combined OD600 of 0.2. The co-culture was then allowed to grow to confluence for 3 days. At this point, it was diluted to OD600 of 0.2, and growth and dilution were repeated for a total of 6 cycles. Two 1 mL samples were taken at each cycle, one immediately before dilution and the other 24 h after dilution. Genomic DNA was harvested using the “Bust ‘n Grab” protocol47, and the relative abundance of WT and EUHSR was measured by PCR across the ECM33 and UBC4 intron-deletion loci (primers listed in Supplementary Table 3). By comparing to a standard curve of PCR results that had been templated with defined ratios of independently isolated WT and EUHSR genomic DNA (ranging from 1:4 to 4:1), the fractional content of WT cell was determined at each time point.
RNA-seq
Total RNA was extracted from lysate powder using TRI Reagent (Ambion) according to the manufacturer’s protocol. rRNA was depleted from 5 μg of total RNA using the Ribo-Zero Gold Yeast rRNA Removal Kit (Illumina) according to the manufacturer’s protocol. RNA-seq libraries were prepared as described48 and sequenced on the Illumina HiSeq platform using 40-bp single reads. A detailed protocol is available at http://bartellab.wi.mit.edu/protocols.html.
RNA-seq Analyses
Reads were trimmed of adapter sequence using cutadapt (v1.8) (ref. 49). Trimmed reads were aligned to the S. cerevisiae genome (R64–1-1, downloaded from www.yeastgenome.org) using STAR (v2.4) (ref. 50) with the parameters “--alignIntronMax 1000 --sjdbOverhang 31 -- outSAMtype BAM SortedByCoordinate --quantMode GeneCounts” and with “--sjdbGTFfile” supplied with transcript annotations. Intron annotations were constructed from the UCSC Genome browser and the Ares lab yeast intron database (http://intron.ucsc.edu/yeast4.3/), with the Ares lab database11,12 providing branch-point annotations used in subsequent analyses. RNA-seq visualization was performed using IGV (v2.3.57) (ref. 51,52). If multiple biological replicates were sequenced, figures show representative RNA-seq profiles from one of the replicates.
Untemplated nucleotides were found and cataloged by extracting reads from BAM files that uniquely mapped to the sense strand of an intron but which also contained soft-clipped, non-mapping nucleotides at the 3′ end of the read. The Mixture-of-Isoforms (MISO, v0.5.4) (ref. 25) framework was used to quantify relative expression of three potential isoforms for every intron: spliced (intron degraded), spliced (intron stable), and intron retained. MISO requires uniform read length as input. As such, the 3′ adapter sequence was removed by trimming a constant 8 nt from every read. Based on the distribution of prior cutadapt-mediated trimming, this removed all 3′ adapter sequence from >98% of reads. Retained intron GFF events were constructed using “gff_make_annotation” from rnaseqlib (http://rnaseqlib.readthedocs.io/en/clip/). Stable intron GFF events were made by directly modifying the retained intron GFF events to instead include “intron only” as a potential outcome of splicing. Although reads that supported a stable-intron splicing event necessarily could also support a retained-intron splicing event, in practice, the greater abundance of most stable introns relative to flanking exons enabled MISO to identify stable intron as the predominant isoform for many introns in stable-intron–inducing conditions.
To be identified as a stable intron expressed in a given condition, accumulation of the intron had to exceed thresholds calibrated on experimentally validated cases. First, intron accumulation (transcripts per million, TPM) in the stable-intron–inducing condition had to be greater than half of its associated mRNA accumulation (TPM). Second, the intron accumulation (TPM) in the stable-intron–inducing condition had to be more than twice that of its accumulation (TPM) in log phase (a pseudocount of 0.01 TPM was added to all introns to account for introns with zero mapped reads). Third, the ratio of intron:mRNA accumulation in the stable-intron–inducing condition had to be greater than four-fold that of the intron:mRNA ratio in log phase. Imposing these thresholds eliminated many false-positives, including some attributed to intronic snoRNA expression or constitutively poor splicing. Additionally, all snoRNA-containing introns were manually inspected for evidence of full-length introns, which was not found to be the case. For introns exceeding these accumulation thresholds, at least one of the following two additional criteria were required for annotation as a stable intron: 1) ≥ 2 terminal adenylylated reads mapping to the 3′ terminus of the intron, or 2) MISO-based support for preferential accumulation of the stable-intron isoform in the stable-intron–inducing condition (Bayes factor ≥ 30 when compared to log phase). These criteria identified conservative sets of stable introns expressed in a given condition, erring towards reducing false-positive identifications.
A search for motifs enriched in stable introns was performed using the MEME Suite53 with remaining introns as the background set. k-mer frequencies were generated with fasta-get-markov program from the MEME Suite. In addition, a search for enrichment of position-specific motifs was performed using kpLogo54 with remaining introns as the background set.
Growth curves
Growth curves were collected using Nunc Edge 2.0 96-well plates in a Multiskan GO Microplate Spectrophotometer. Wells were seeded at OD600 = 0.2 from early-log-phase cultures, and plates were incubated at 30 °C. Absorbance was read every 5 min with shaking on the “background” setting, cycling between 1 min on and 1 min off. Every strain tested on each plate was run in technical triplicate. Single wells were censored if artifactual spikes in OD600 attributable to bubbles or condensation were observed. Strains were censored if more than one well was censored. Biological replicates for each strain included at least two independently derived transformants. A replicate of parental BY4741 was included on every plate as a control strain, and SC media was included on every plate as a control condition for every strain being assayed. Growth rate was calculated from the log-linear portion of each growth curve. Growth curves were analyzed with SkanIt (v3.2).
RNA blots
Total RNA was extracted from lysate powder using TRI Reagent (Ambion) according to the manufacturer’s protocol. Ten micrograms of total RNA for each sample was resolved on a denaturing polyacrylamide gel and transferred onto a Hybond membrane (GE Healthcare) using a semi-dry transfer cell. Because UV crosslinking is biased against shorter RNAs, EDC (N-(3-dimethylaminopropyl)-N′-ethylcarbodiimide; Sigma-Aldrich) was used to chemically crosslink 5′ phosphates to the membrane55. Blots were hybridized to radio-labeled DNA probes. Probe oligonucleotides are listed in Supplementary Table 4. More details of this protocol are available at http://bartellab.wi.mit.edu/protocols.html. For experiments in Fig. 3a, RNAs were instead resolved on a glyoxal agarose gel and transferred overnight onto a Nytran SuPerCharge Turboblotter membrane (GE Healthcare). RNA-blot data were analyzed with ImageQuant TL (v8.1.0.0).
Sedimentation velocity
Crude lysates were prepared by re-suspending an aliquot of thawed lysate powder (500–800 μL of loosely packed powder) in 1 mL of lysis buffer (10 mM Tris-HCl [pH 7.4], 5 mM MgCl2, 100 mM KCl, 1% Triton X−100, 1% Sodium Deoxycholate, 2 mM DTT, 20 U/ml SUPERase•In [Ambion], cOmplete EDTA-free Protease Inhibitor Cocktail [Roche]). The lysates were placed on a rotator mixer at 4 °C for 5 min to allow for re-suspension. Following brief vortexing, lysates were centrifuged at 1,300 × g for 10 min, and the supernatant loaded onto a 12.5 mL linear 10–30% (w/v) sucrose gradient (20 mM HEPES-KOH [pH 7.4], 5 mM MgCl2, 100 mM KCl, 2 mM DTT, 20 U/ml SUPERase•In). Gradients were centrifuged in a pre-chilled SW-41 Ti rotor at 38,000 rpm for 4 hr at 4 °C. Gradients were fractionated using a Piston Gradient Fractionator (Biocomp) in 1 mL fractions. For RNA analysis, total RNA was extracted from a portion of each fraction using TRI Reagent. RNA blots were performed as described for total RNA, except RNA loading was normalized by percent of gradient fraction rather than by RNA concentration. For pull-downs, fractions were flash frozen and stored at −80 °C.
Ectopic intron expression, affinity purification, and mass spectrometry
Intron overexpression constructs were based on SC-Ura-selectable pRSII416 (CEN) or pRSII426 (2μ) vectors56 (Extended Data Fig. 3c, Supplementary Table 2). Introns were inserted 49 nucleotides downstream of the URA3 start codon by Gibson assembly. Proper splicing was confirmed by RNA blot and cell viability, as cells unable to produce Ura3p through intron removal could not grow on SC-Ura media.
Pull-down experiments were performed in the ECM33Δintron strain. Introns were purified utilizing two MS2 hairpins (2×MS2) inserted in various positions within the ECM33 intron (Supplementary Table 5). To minimize potential effects on splicing, sequence within 60 nt of the 5′ splice site and 80 nt of the branch point was kept constant across all constructs. The 2×MS2 hairpin sequence was based on CRISPR RNA scaffold designs57. 3×FLAG-tagged MS2 coat protein with a C-terminal nuclear-localization signal (FLAG-MCP) was co-expressed from the constructs that also expressed MS2-tagged introns.
We were unable to purify intact introns from supernatant of saturated cultures owing to increased endogenous RNase activity in saturated cultures58. To circumvent this, sucrose gradient fractions containing the intron of interest (typically fractions 6–9, determined by RNA blot) were pooled and used as the starting material for purification. Anti-FLAG M2 Magnetic Beads (Sigma-Aldrich) (20 μL of packed bead volume) were equilibrated and washed twice in 10 volumes of buffer 1 (100 mM KCl, 20 mM HEPES KOH [pH 7.9], 1% Triton X−100, 20 U/ml SUPERase•In, and cOmplete EDTA-free Protease Inhibitor Cocktail). Four hundred microliters of the pooled fractions was added to the beads and incubated on a rotator mixer for 30 min at 4 °C. Remaining at 4 °C, the beads were washed twice in 10 volumes of buffer 1 and twice in 10 volumes of buffer 2 (200 mM KCl, 20 mM HEPES KOH [pH 7.9], 1% Triton X−100, 20 U/ml SUPERase•In, and cOmplete EDTA-free Protease Inhibitor Cocktail). Bound FLAG-MCP was eluted from beads with 30 μL of 150 ng/μL 3× FLAG peptide (Sigma-Aldrich) on a rotator mixer for 30 min at 4 °C. The eluents were precipitated with TCA, digested with trypsin, and labeled with TMTs to allow for quantitative comparisons between six total samples (three control and three test samples). Peptides were analyzed by liquid chromatography-tandem mass spectrometry (LC-MS/MS) using an Orbitrap Elite (Thermo Fisher) coupled with a NanoAcquity UPLC system (Waters). Peptides were identified using SEQUEST and data analyzed using PEAKS Studio (Bioinformatics Solutions).
Experimental design and reproducibility
No statistical methods were used to predetermine sample size. Growth-curve cultures were randomized by permutation of strain placement on 96-well plates across experiments. Edge effects were not significant within the time span that measurements were taken. The investigators were not blinded to allocation during experiments and outcome assessment. RNA-seq results for biological replicates correlated well (log-phase culture, R2 = 0.98 [mRNA, n = 5652]; saturated culture, R2 = 0.88 [mRNA, n = 5762] and 0.78 [stable introns, n = 30]).
Extended Data
Extended Data Fig. 1 |. RNA-seq coverage across the branch point and to the 3′SS of the ECM33 intron.
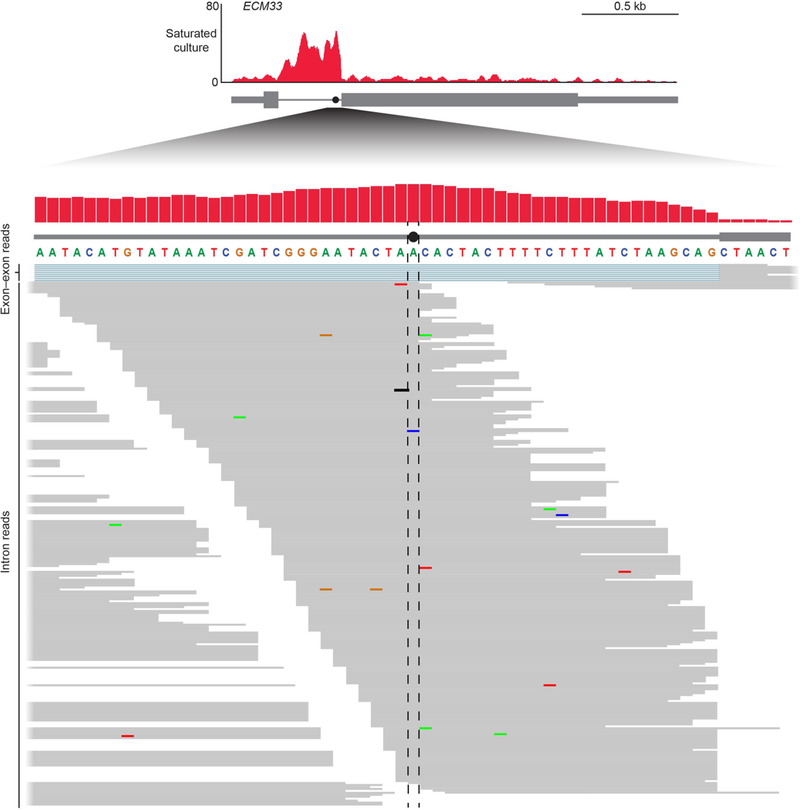
The pileup of reads mapping to the 61-nucleotide region centred on the ECM33 branch point, replotted from Fig. 1b, is shown (red, top). The position of the branch point (closed circle with flanking dashed lines) is indicated on the intron (thick grey line) and relative to the 3′ exon (grey box). Bottom, all reads mapping uniquely to this region are shown (thin grey lines). Reads mapping across the exon-exon junction are coloured blue in the region of the excised intron and are shown above the other reads. Mismatched nucleotides within reads are indicated with coloured bars, with the colour of the bar indicating the identity of the mismatch. Terminal untemplated nucleotides have been clipped from reads.
Extended Data Fig. 2 |. Stable-intron sedimentation and expression constructs for pull-down and mass spectrometry.
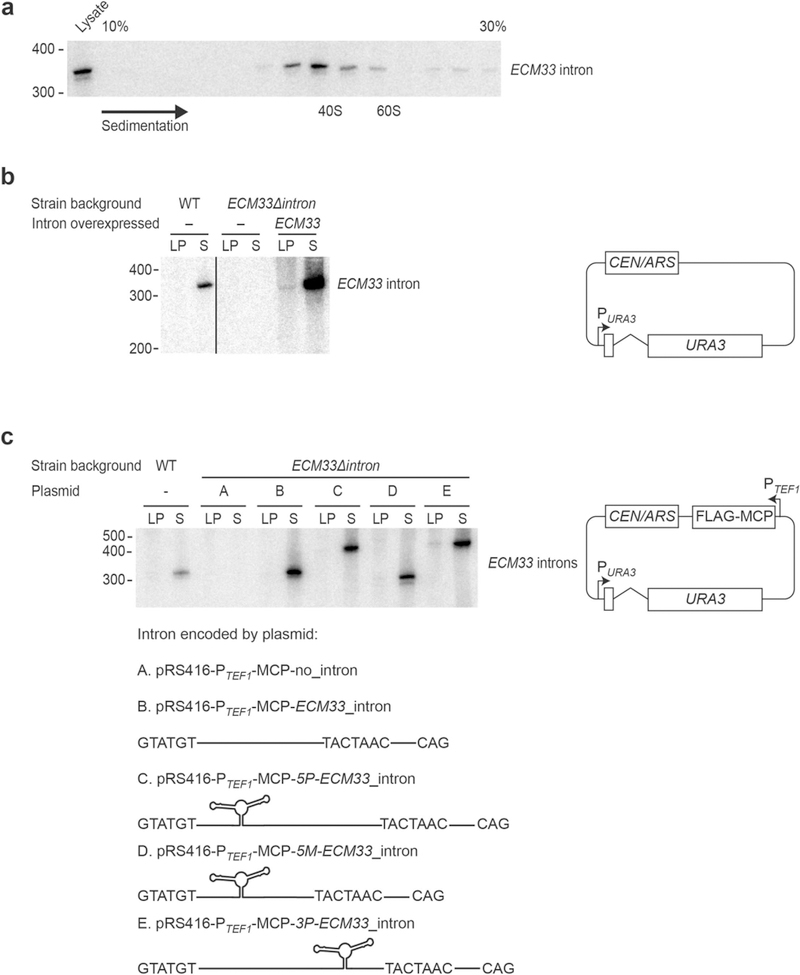
a, Co-sedimentation of the ECM33 stable intron with large ribonucleoprotein complexes. Cleared lysate from a saturated yeast culture was fractionated by sedimentation into a 10–30% sucrose gradient, and RNA was extracted from each fraction. An RNA blot that resolved 25% of the RNA from each fraction and was probed for the ECM33 intron is shown. Fractions are oriented with increasing sedimentation from left to right. RNA was also extracted from 12.5% of the total lysate before sedimentation, of which 50% was loaded for comparison (left lane). The sedimentation of 40S and 60S complexes is marked on the basis of the location of ribosome subunits. Migration of markers with lengths indicated (in nucleotides) is shown on the left. n = 6 biological replicates. b, Behaviour of stable introns ectopically expressed from the URA3 gene. An RNA blot probed for the ECM33 intron after resolving total RNA from cultures expressing the ECM33 intron from the endogenous ECM33 locus (WT, left lanes), cultures from a strain in which the intron had been deleted (ECM33Δintron, middle lanes) and cultures of this deletion strain ectopically expressing the ECM33 intron spliced from the plasmid-borne URA3 reporter gene (right lanes) is shown. pRS416-ECM33_intron plasmid shown on right; PURA3, URA3 promoter; CEN/ARS (centromere/autonomously replicating sequence), low-copy origin of replication. Interior lanes that were not relevant to this experiment were removed from this image (vertical line). Otherwise, this panel is as in Fig. 1c. n = 4 biological replicates. c, Behaviour of stable introns with MS2 hairpins inserted to be used as affinity tags for pull-downs. Five different plasmids with a common backbone (right; PTEF1, TEF1 promoter; FLAG–MCP, coding region of Flag-tagged MS2 coat protein) each expressed URA3 with a different variant of the ECM33 intron (variants A–E, schematized below). These plasmids were each expressed in the strain that lacked an endogenous ECM33 intron (ECM33Δintron). The RNA blot resolved total RNA from the indicated cultures and was probed for a sequence common to the intron variants; otherwise, as in Fig. 1c. The 2 × MS2 hairpin region is 90 nucleotides long, and the expected linear-intron sizes were: A, no intron; B, 330 nucleotides; C, 420 nucleotides; D, 300 nucleotides; and E, 420 nucleotides. n ≥ 2 biological replicates.
Extended Data Fig. 3 |. Stable introns have oligoadenylate tails.
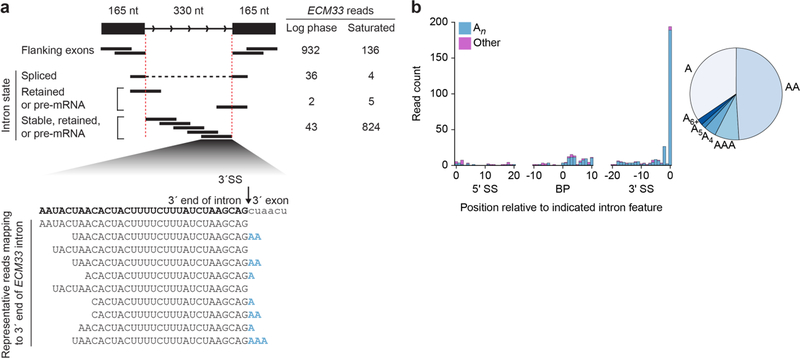
a, Example of RNA-seq support for intron accumulation and terminal adenylylation. The diagram (top, left) classifies the RNA-seq reads that derive from the possible intron states of ECM33 transcripts (black lines, reads; red dashed lines, intron boundaries). Read counts from log-phase and saturated cultures (normalized for library depth) are listed for each class of reads (top, right). For convenient comparison to intron accumulation, exon reads are only counted if they map within 165 nucleotides of either splice site (thereby encompassing 330 nucleotides, the length of the intron). The alignment (bottom) shows representative reads mapping to the intron 3′ terminus, aligned below the sequence of the 3′ intron–exon junction. Many of these reads had untemplated terminal adenosine residues (blue). b, Composition of untemplated tailing nucleotides observed in a saturated culture. Reads that had at least one terminal untemplated nucleotide after trimming the 3′ adaptor sequence were collected, and the position of this tail was annotated as that of the last templated nucleotide. Counts of reads with tails added at positions 0 to +20 relative to the 5′SS, −10 to +10 relative to the branch point, and −20 to 0 relative to the 3′SS are plotted, binning counts for tails of only adenosines (An, teal) separately from those of all other tails (other, purple). For An tails that map to the 3′-terminal nucleotide of introns, the fraction with each indicated length is plotted (right). The relative abundance of An at positions −2 and −1 relative to the 3′SS was ambiguous because most introns have an adenosine at position −1 (3′SS consensus sequence, YAG), which causes tails of length n at position −1 to be indistinguishable from tails of length n + 1 at position −2.
Extended Data Fig. 4 |. RNA-seq profiles of genes with stable introns.
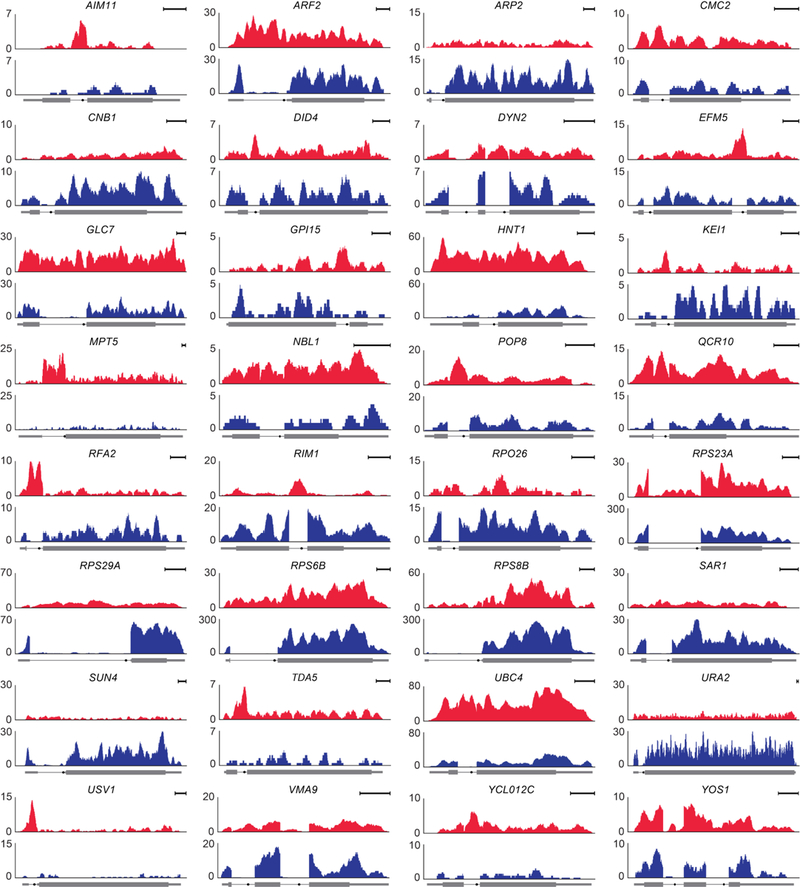
Profiles from the stable-intron-inducing condition (red) and log-phase culture (blue) are shown for the indicated 32 genes with confidently identified stable introns not already depicted in Fig. 1. For all but four of these, the profile of the stable-intron-inducing condition is from RNA-seq of the saturated-liquid sample. The four exceptions were not confidently identified in saturated liquid (Extended Data Table 2); for these, the profile of the stable-intron-inducing condition is from either the rapamycintreated sample (TDA5 and YOS1) or the saturated lawn (RPO26 and RPS8B). Scale bars, 100 nucleotides. Otherwise, this panel is as in Fig. 1a.
Extended Data Fig. 5 |. Stable introns are indistinguishable from other introns in many respects.
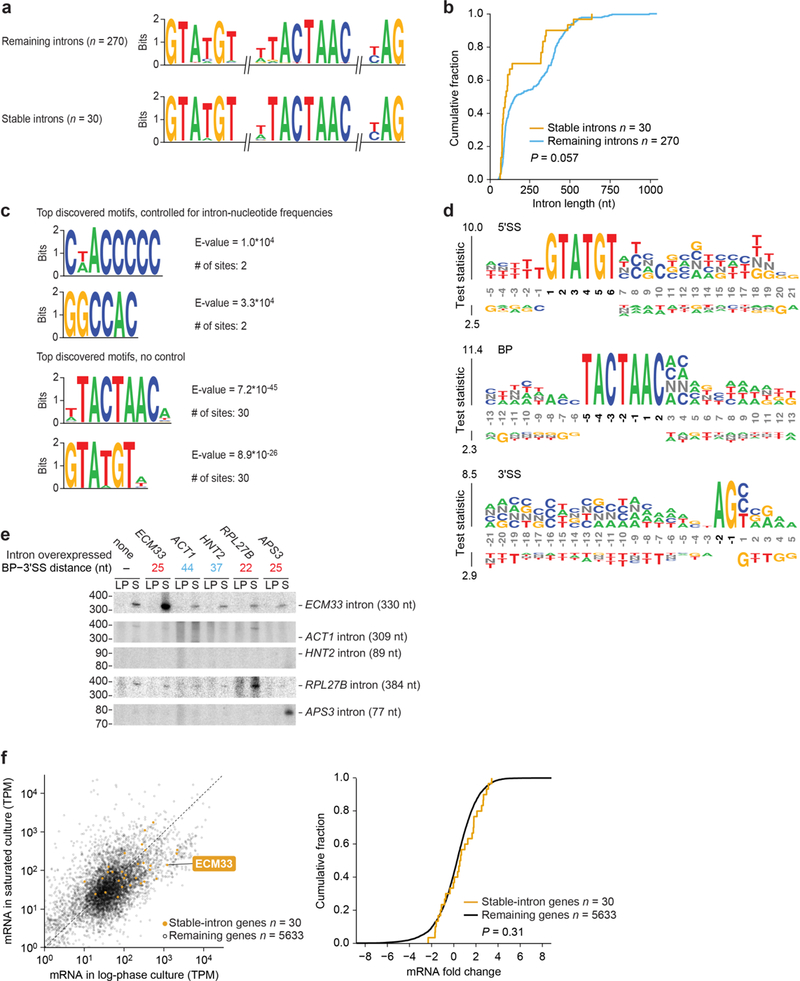
a, Similar splicing motifs compared to other introns. Information-content logos of splicing motifs (6-mer 5′SS, 8-mer branch point and 3-mer 3′SS) for stable introns (bottom) and other introns (top) are plotted. b, Similar length distribution compared to other introns. Cumulative distributions of intron lengths are plotted (P = 0.057, two-tailed Kolmogorov–Smirnov test). c, No significantly enriched motifs within stable introns. Stable-intron sequence motifs discovered by MEME53 are plotted, either controlling for k-mer frequencies of nonstable introns (top) or without controlling (bottom). No significant motifs were discovered in stable introns when k ≥ 6. The motifs discovered without controlling for k-mer frequencies matched the canonical branch point and 5′SS motifs (see a). Branch point and 5′SS motifs were also the only significantly enriched motifs discovered when k ≤ 5. d, No enriched positional k-mer motifs detected by kpLogo54 in stable introns. The most enriched k-mers at positions relative to 5′SS (top), branch point (middle), and 3′SS (bottom) are plotted, comparing stable introns to unstable introns. Stacked nucleotides at a position represent the most significant motif starting at that position. The height is scaled relative to the significance of the motif, as determined by the one-sided binomial test statistic (y axes). Black numbers indicate invariant nucleotides occurring >95% of the time at the position. No k-mers were significantly enriched when using a Bonferroni-corrected P of 0.01. e, Support for a role of branch point–3′SS distance in specifying stable-intron formation. The indicated introns were ectopically expressed from the URA3 splicing construct (Extended Data Fig. 2b). Results are shown from an RNA blot that resolved total RNA from cultures overexpressing the indicated introns and was probed for the indicated introns (length of excised intron in parentheses). The ECM33 and RPL27B introns were probed sequentially, and then the ACT1, HNT2 and APS3 introns were probed concurrently. ACT1 probe was validated on synthetic transcripts resembling the ACT1 intron, which were produced by in vitro transcription (not shown). Migration of markers with lengths (in nucleotides) indicated is at the left. n ≥ 2 biological replicates. f, Expression of mRNAs from genes containing stable introns. Left, relationship between the expression in log-phase and saturated cultures (expression cutoff, 1 TPM in both samples). Points for genes containing stable introns are indicated (orange), and the point for ECM33 is labelled. Right, comparison of the expression results of genes with stable introns to those of the remaining genes. The cumulative distributions of fold changes in expression (expressed as log2(mRNA in log-phase culture/mRNA in saturated culture)) observed between log-phase and saturated cultures are plotted, which shows no significant difference between stable-intron genes and other genes (P = 0.31 two-tailed Kolmogorov–Smirnov test).
Extended Data Fig. 6 |. Assessing aspects of TORC1 regulation on stable-intron expression.
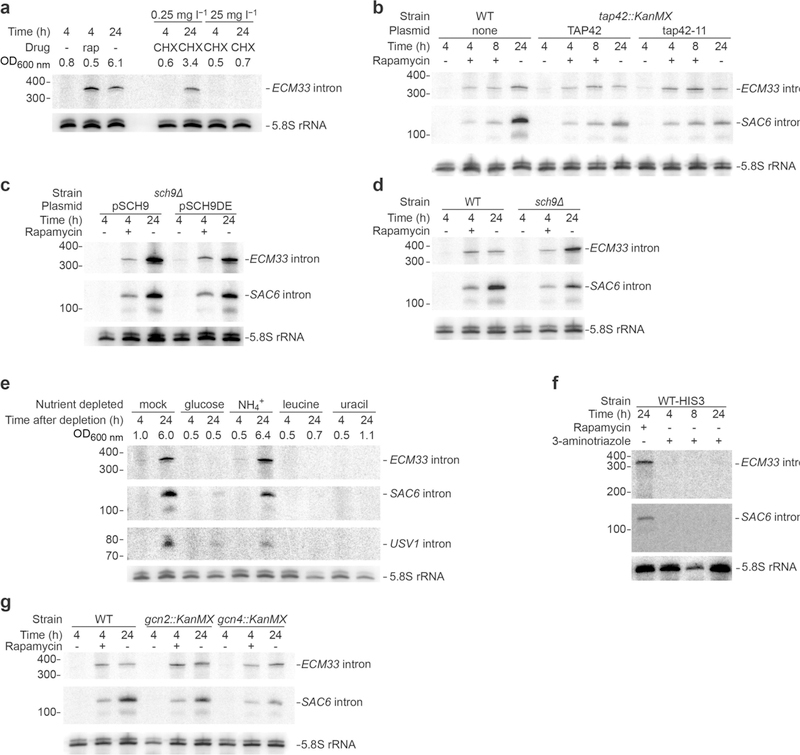
a, Inability of TORC1-independent inhibition of protein synthesis to prematurely induce stable-intron accumulation. The left lanes show a replicate of Fig. 3b, and the right lanes show results after treatment with either low (0.25 mg l−1) or high (25 mg l−1) concentrations of cycloheximide. As indicated by OD600 nm at collection, the mild cycloheximide treatment allowed the culture to reach an OD600 nm of 3.4 after 24 h, which was equivalent to the OD600 nm of 10 h without cycloheximide (Fig. 3a). b, Dispensability of TORC1-responsive Tap42 for stable-intron formation. Samples were grown at 25 °C owing to temperature sensitivity of the tap42–11 allele. Additionally, owing to slower growth at 25 °C, the duration of pre-growth was extended to 5.5 h before reseeding in medium with (+) or without (−)rapamycin, such that the change in OD600 nm of the pre-growth sample matched that of wildtype cultures grown at 30 °C for 4 h. Otherwise, this panel is as in Fig. 3b. n = 2 biological replicates. c, Dispensability of TORC1-responsive Sch9 for stable-intron formation. Samples were grown in SC–Trp medium to maintain plasmids that either rescued (pSCH9) or did not rescue (pSCH9DE) Sch9 activity. Because of the slower growth of the sch9Δ pRS414::SCH9 and sch9Δ pRS414::SCH9DE strains (possibly owing to the requisite –Ura medium) the duration of pre-growth was extended to 5 h, such that the change in OD600 nm of the pre-growth sample matched that of wild-type cultures grown for 4 h. Otherwise, this panel is as in Fig. 3b. n = 3 biological replicates. d, Dispensability of Sch9 for stableintron formation. The left lanes show a replicate of Fig. 3b, and the right lanes show the same experiments performed in the sch9Δ strain. n = 2 biological replicates (sch9Δ samples). e, Inability of acute deprivation of select nutrients to induce accumulation of stable introns. To prevent contamination of starting cultures with stable introns contributed by inoculum, cultures were seeded at OD600 nm = 0.2 from an overnight culture that was allowed to grow to mid-log phase collected by vacuum filtration, washed in water and re-suspended in fresh medium that lacked the indicated nutrients. Cultures were collected after the indicated times and analysed as in Fig. 1c, except the RNA blot was sequentially re-probed for the ECM33, SAC6 and USV1 introns. As indicated by OD600 nm at collection, the sample deprived of ammonium sulfate (the main source of nitrogen) was still able to reach a high density after 24 h. n ≥ 2 biological replicates. f, Inability of the general amino acid control response to induce stable introns. Mid-log-phase cultures were treated with either 100 nM rapamycin or 50 mM 3-aminotriazole for the indicated times. Cultures were grown in SC–His to force inhibition of histidine biosynthesis by 3-aminotriazole. Cultures treated with 3-aminotriazole for 24 h did not reach a density sufficient to induce stable-intron accumulation by approaching saturated growth. g, Stable-intron accumulation despite inability to induce the general amino acid control pathway. The left lanes show a replicate of Fig. 3b, and the middle and right lanes show the same experiments performed in gcn2Δ and gcn4Δ strains, respectively.
Extended Data Fig. 7 |. The influence of hyperactive TORC1 on stable-intron formation.
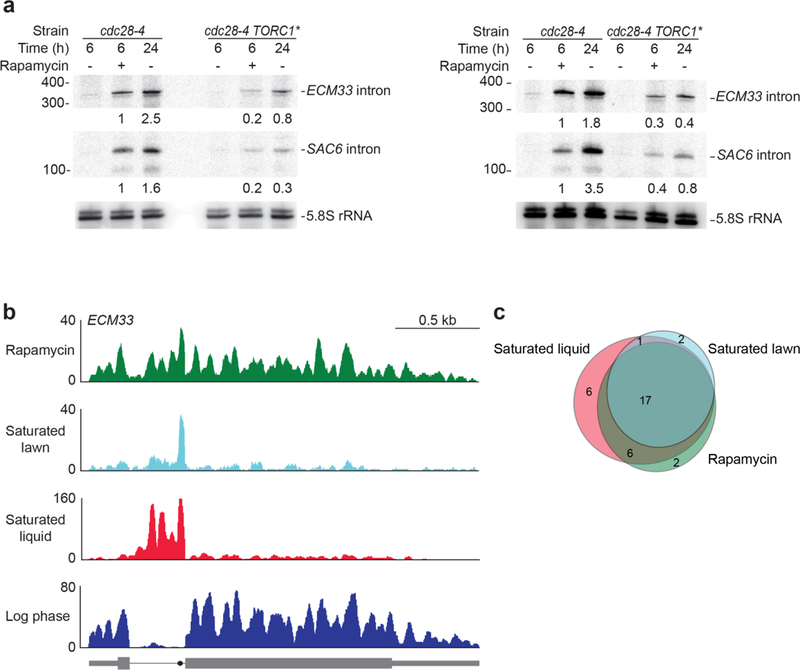
a, The left and right panels are biological replicates comparing ECM33 and SAC6 intron levels in a strain with hyperactive TORC1 (TORC1*) to those in a strain-background control (cdc28-4). Growth conditions were as described for these strains31. Overexpression of Sfp1 was induced 1 h before treatment with rapamycin (or no treatment). Owing to the decreased growth rate of these strains in the requisite conditions, samples with and without rapamycin were collected after 6 h of treatment rather than after 4 h of treatment. Numbers below the ECM33 and SAC6 intron blots indicate the level of each intron normalized to the level in the cdc28-4 rapamycin-treated samples, after first normalizing all lanes to the 5.8S rRNA loading control (set to 1). b, Accumulation of the ECM33 intron in rapamycin-treated saturated-lawn and saturated-liquid cultures, detected using RNA-seq. Results showing accumulation of this intron in saturated-liquid culture but not log-phase culture are from a different biological replicate than that shown in Fig. 1a, b; otherwise, this panel is as in Fig. 1a. Rapamycin results are re-plotted from Fig. 3d (4 h). c, Overlap between stable introns identified in saturated-liquid, saturatedlawn and rapamycin-treated cultures.
Extended Data Fig. 8 |. Evidence for spliceosome sequestration and control of ribosome production by stable introns.
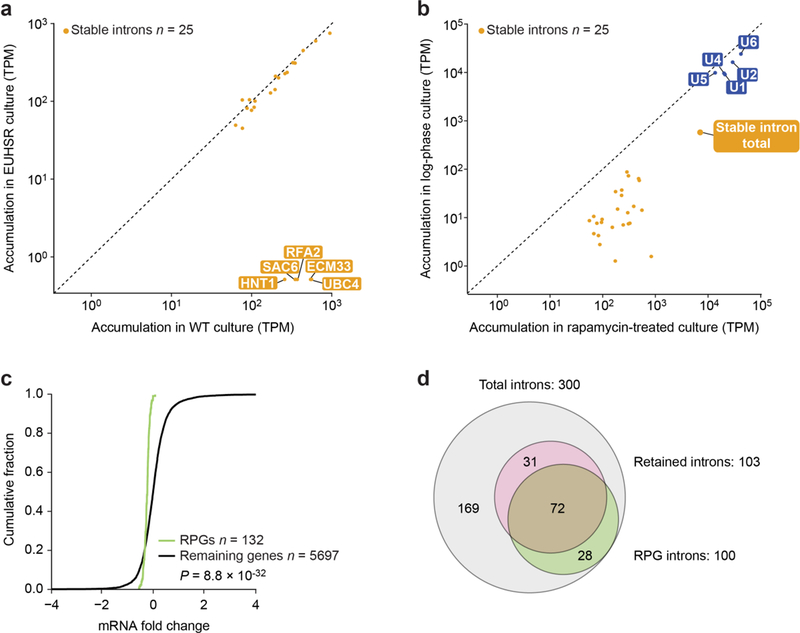
a, No evidence for compensatory stable-intron expression after genomic deletion of five stable introns. The scatter plot shows the relationship between intron accumulation in rapamycin-treated, wild-type culture and in rapamycintreated, EUHSR culture, focusing on the 25 stable introns detected after rapamycin treatment (Extended Data Table 2). The dashed line is placed at x = y. Stable introns are indicated (closed orange circles). Points for introns deleted from the EUHSR genome (ECM33, UBC4, HNT1, SAC6, and RFA2) are labelled. All introns were pseudocounted at 0.5 TPM. b, Aggregate stable-intron accumulation approaching that of spliceosomal RNAs. Levels of stable introns and spliceosomal RNAs (labelled closed blue circles) are plotted, comparing levels in log-phase, wild-type culture to those in rapamycin-treated, wild-type culture. The aggregate stableintron abundance (closed orange circle, stable intron total) is also plotted. Much of the apparent accumulation observed in log-phase culture was attributable to reads from a few highly transcribed stable-intron genes (for example, RPS29A, which has an intron:mRNA TPM ratio of 107:2,030 in log phase compared to 289:319 in saturated culture). Otherwise, as in a. c, Reduced expression of mRNA of ribosomal protein genes (RPGs) when overexpressing a stable intron in rapamycin-treated EUHSR culture. The cumulative distributions of fold changes in mRNA expression (expressed as log2(mRNA in EUHSR expressing ECM33 intron/mRNA in EUHSR expressing ACT1 intron)) observed between an EUHSR culture with stable-intron (ECM33) ectopic expression and an EUHSR culture with control-intron (ACT1) ectopic expression are plotted. The distribution of changes for mRNAs of RPGs (green) differed from that of other genes (black), with generally lower expression of RPGs in the culture that overexpresses the stable intron (P = 8.8 × 10⁻³², one-tailed Kolmogorov– Smirnov test; expression cutoff, 1 TPM in both samples). d, Less efficient splicing—as detected by increased intron retention—when overexpressing a stable intron in rapamycin-treated, EUHSR culture. When analyzing the dataset in c, 103 genes had significantly more intron retention when ectopically expressing the stable intron compared to when expressing the control intron (MISO, Bayes factor > 100). The Venn diagram shows the overlap between these genes with increased intron retention and introncontaining RPGs (P = 3.9 × 10⁻²², hypergeometric test).
Extended Data Table 1.
Proteins associated with stable introns
| |
Enrichment
values |
|
||||||||||
|---|---|---|---|---|---|---|---|---|---|---|---|---|
| Protein name | Control 1 | Control 2 | Control 3 | Test 1 | Test 2 | Test 3 | Mean control | Mean test | Fold difference | |||
| Prp9 | 0.11 | 1.00 | 0.57 | 4.84 | 6.34 | 4.83 | 0.56 | 5.34 | 9.54 | |||
| Hsh49 | 0.60 | 1.00 | 1.20 | 5.67 | 5.15 | 5.24 | 0.93 | 5.35 | 5.74 | |||
| Cef1 | 0.93 | 1.00 | 0.99 | 3.45 | 6.04 | 5.79 | 0.97 | 5.09 | 5.23 | |||
| Rse1 | 0.66 | 1.00 | 0.90 | 3.17 | 4.16 | 5.80 | 0.85 | 4.38 | 5.13 | |||
| Bud31 | 0.68 | 1.00 | 0.96 | 3.96 | 3.96 | 4.16 | 0.88 | 4.03 | 4.58 | |||
| Prp45 | 0.88 | 1.00 | 0.71 | 3.12 | 3.77 | 3.86 | 0.86 | 3.58 | 4.15 | |||
| Prp19 | 0.87 | 1.00 | 1.05 | 3.28 | 4.03 | 4.20 | 0.97 | 3.84 | 3.94 | |||
| Brr2 | 0.78 | 1.00 | 0.69 | 2.22 | 3.21 | 3.66 | 0.82 | 3.03 | 3.68 | |||
| Prp8 | 0.75 | 1.00 | 0.73 | 2.00 | 2.63 | 3.46 | 0.83 | 2.70 | 3.26 | |||
| Smb1 | 0.67 | 1.00 | 1.10 | 2.49 | 2.80 | 2.69 | 0.92 | 2.66 | 2.88 | |||
Results are shown for the ten proteins that were consistently enriched ≥ 2-fold in stable-intron pull-down eluates. Three control samples without a tagged intron and three test samples with unique tagged introns (Extended Data Fig. 2, Supplementary Table 5) were simultaneously analysed by quantitative mass spectrometry. These ten proteins were the only proteins that were enriched ≥ 2-fold in each of the 9 possible pairwise comparisons between test and control samples. The identities of these proteins were consistent with the excised and debranched introns being part of a complex that resembles the ILS complex, in that all ten are known components of the ILS identified through biochemical studies23, and most (all but Brr2, Hsh49, Prp9 and Rse1) have also been identified in a cryo-EM structure of the ILS complex59. Moreover, several early spliceosome components (Luc7, Prp3, Snp1 and Snu13) as well as an essential disassembly factor (Prp43) were detected in all samples but not enriched in tagged-intron eluates. The observation that the intron did not co-purify with exonic sequences also helped to rule out the possibility that it was part of a complex that resembled earlier spliceosomal complexes. Enrichment values were those reported by PEAKS Studio, which are reported relative to values of control 2.
Extended Data Table 2.
Stable introns of S. cerevisiae
| Stable intron | Liquid | Rapamycin | Lawn | BP-3’SS distance (nt) | Intron length (nt) | Descriptton of gene function |
|---|---|---|---|---|---|---|
| AIM11 | • | • | 20 | 75 | Protein of unknown function | |
| ARF2 | • | • | • | 18 | 332 | ADP-ribosylation factor |
| ARP2 | • | • | 15 | 123 | Essential component of the Arp2/3 complex | |
| CMC2 | • | • | • | 29 | 85 | Protein involved m respiratory chain complex assembly or maintenance |
| CNB1 | • | • | 19 | 76 | Calcmeurin B | |
| DID4 | • | 23 | 68 | Class E Vps protein of the ESCRT-III complex | ||
| DYN2_2 | • | 17 | 80 | Cytoplasmic light chain dynein microtubule motor protein | ||
| ECM33 | • | • | • | 25 | 330 | GPI-anchored protein of unknown function |
| EFM5_2 | • | • | • | 25 | 93 | S-adenosylmethionine-dependent lysine methyltransferase |
| GLC7 | • | • | • | 31 | 525 | Type 1 S/T protein phosphatase (PP1) catalytic subunit |
| GPI15 | • | • | 14 | 74 | Protein involved in the synthesis of GIcNAc-PI | |
| HNT1 | • | • | 23 | 111 | Adenosine 5′-monophosphoramidase | |
| KEI1 | • | 31 | 101 | Component of inositol phosphorylceramide (IPC) synthase | ||
| MPT5 | • | • | • | 25 | 640 | mRNA-bindmg protein of the PUF family |
| NBL1 | • | • | • | 12 | 67 | Subunit of the conserved chromosomal passenger complex (CPC) |
| POP8 | • | • | • | 20 | 75 | Subunit of both RNase MRP and nuclear RNase P |
| QCR10 | • | 15 | 63 | Subunit of the ubiqunol-cytochrome c oxidoreductase complex | ||
| RFA2 | • | • | • | 24 | 108 | Subunit of heterotrimeric Replication Protein A (RPA) |
| RIM1 | • | • | • | 26 | 83 | ssDNA-binding protein essential for mitochondrial genome maintenance |
| RP026 | • | 21 | 76 | RNA polymerase subunit ABC23 | ||
| RPS23A | • | 23 | 319 | Ribosomal protein 28 (rp28) of the small (40S) nbosomal subunit | ||
| RPS29A | • | • | 22 | 488 | Protein component of the small (40S) ribosomal subunit | |
| RPS68 | • | • | • | 23 | 352 | Protein component of the small (40S) ribosomal subunit |
| RPS8B | • | 24 | 360 | Protein component of the small (40S) ribosomal subunit | ||
| SAC6 | • | • | • | 20 | 111 | Fimbrin, actin-bundling protein |
| SAR1 | • | • | 19 | 139 | ARF family GTPase | |
| SUN4 | • | 22 | 346 | Cell wall protein related to glucanases | ||
| TDA5 | • | 19 | 71 | Protein of unknown function | ||
| UBC4 | • | • | • | 26 | 95 | Ubiquitm-conjugatmg enzyme (E2) |
| URA2 | • | • | • | 22 | 320 | Bifunctional carbamoylphosphate synthetase/aspartate transcarbamyiase |
| USV1 | • | • | • | 24 | 75 | Putative transcription factor containing a C2H2 zinc finger |
| VMA9_1 | • | • | • | 22 | 77 | Vacuolar H+ ATPase subunit e of the V-ATPase V0 subcomplex |
| YCL012C | • | • | • | 13 | 65 | Protein of unknown function |
| YOS1_2 | • | 24 | 111 | Integral membrane protein required for ER to Golgi transport |
If a host gene has two introns, a suffix specifies whether the first or second intron is stabilized (_1 and _2, respectively). Description of gene function is from YeastMine (https://yeastmine.yeastgenome.org/). Liquid, saturated-liquid sample; lawn, saturated-lawn sample; rapamycin, rapamycin-treated sample.
Supplementary Material
ACKNOWLEDGEMENTS
We thank A. Amon, C. Burge, D. Pincus, D. Sabatini, P. Sharp, and members of the Bartel and Fink labs for comments and discussion, G. Li, T. Pham, and A. Symbor-Nagrabska for experimental assistance, A. Amon, R. Loewith, S. Schreiber, and Vyas for reagents, and Whitehead core facilities for sequencing and mass spectrometry. This work was supported by NIH grants GM035010 (G.R.F.) and GM118135 (D.P.B.). D.P.B. is an investigator of the Howard Hughes Medical Institute.
Footnotes
Data availability
Sequencing data and the processed data for each gene and intron are available at the Gene Expression Omnibus (http://www.ncbi.nlm.nih.gov/geo) under accession number GSE121765. For gel source data, see Supplementary Figure 1. All other data are available upon reasonable request.
Competing Interests
The authors declare no competing financial interests.
REFERENCES
- 1.Koonin EV The origin of introns and their role in eukaryogenesis: a compromise solution to the introns-early versus introns-late debate? Biol Direct 1, 22 (2006). [DOI] [PMC free article] [PubMed] [Google Scholar]
- 2.Irimia M & Roy SW Origin of spliceosomal introns and alternative splicing. Cold Spring Harbor perspectives in biology 6, a016071 (2014). [DOI] [PMC free article] [PubMed] [Google Scholar]
- 3.Nilsen TW & Graveley BR Expansion of the eukaryotic proteome by alternative splicing. Nature 463, 457 (2010). [DOI] [PMC free article] [PubMed] [Google Scholar]
- 4.Cech TR & Steitz JA The noncoding RNA revolution—trashing old rules to forge new ones. Cell 157, 77–94 (2014). [DOI] [PubMed] [Google Scholar]
- 5.Grabowski PJ, Padgett RA & Sharp PA Messenger RNA splicing in vitro: an excised intervening sequence and a potential intermediate. Cell 37, 415–427 (1984). [DOI] [PubMed] [Google Scholar]
- 6.Padgett RA, Konarska MM, Grabowski PJ, Hardy SF & Sharp PA Lariat RNA’s as intermediates and products in the splicing of messenger RNA precursors. Science 225, 898–904 (1984). [DOI] [PubMed] [Google Scholar]
- 7.Ruskin B, Krainer AR, Maniatis T & Green MR Excision of an intact intron as a novel lariat structure during pre-mRNA splicing in vitro. Cell 38, 317–331 (1984). [DOI] [PubMed] [Google Scholar]
- 8.Chapman KB & Boeke JD Isolation and characterization of the gene encoding yeast debranching enzyme. Cell 65, 483–492 (1991). [DOI] [PubMed] [Google Scholar]
- 9.Pai AA et al. The kinetics of pre-mRNA splicing in the Drosophila genome and the influence of gene architecture. Elife 6, e32537 (2017). [DOI] [PMC free article] [PubMed] [Google Scholar]
- 10.Hesselberth JR Lives that introns lead after splicing. Wiley interdisciplinary reviews. RNA 4, 677–691 (2013). [DOI] [PubMed] [Google Scholar]
- 11.Spingola M, Grate L, Haussler D & Ares M Jr Genome-wide bioinformatic and molecular analysis of introns in Saccharomyces cerevisiae. RNA 5, 221–234 (1999). [DOI] [PMC free article] [PubMed] [Google Scholar]
- 12.Davis CA, Grate L, Spingola M & Ares M Jr Test of intron predictions reveals novel splice sites, alternatively spliced mRNAs and new introns in meiotically regulated genes of yeast. Nucleic acids research 28, 1700–1706 (2000). [DOI] [PMC free article] [PubMed] [Google Scholar]
- 13.Juneau K, Palm C, Miranda M & Davis RW High-density yeast-tiling array reveals previously undiscovered introns and extensive regulation of meiotic splicing. Proceedings of the National Academy of Sciences of the United States of America 104, 1522–1527 (2007). [DOI] [PMC free article] [PubMed] [Google Scholar]
- 14.Ng R, Domdey H, Larson G, Rossi J & Abelson J A test for intron function in the yeast actin gene. Nature 314, 183–184 (1985). [DOI] [PubMed] [Google Scholar]
- 15.Parenteau J et al. Deletion of many yeast introns reveals a minority of genes that require splicing for function. Molecular biology of the cell 19, 1932–1941 (2008). [DOI] [PMC free article] [PubMed] [Google Scholar]
- 16.Hooks KB, Naseeb S, Parker S, Griffiths-Jones S & Delneri D Novel intronic RNA structures contribute to maintenance of phenotype in Saccharomyces cerevisiae. Genetics 203, 1469–1481 (2016). [DOI] [PMC free article] [PubMed] [Google Scholar]
- 17.Parenteau J et al. Introns within ribosomal protein genes regulate the production and function of yeast ribosomes. Cell 147, 320–331 (2011). [DOI] [PubMed] [Google Scholar]
- 18.Bonnet A et al. Introns Protect Eukaryotic Genomes from Transcription-Associated Genetic Instability. Molecular cell 67, 608–621 e606 (2017). [DOI] [PubMed] [Google Scholar]
- 19.Petfalski E, Dandekar T, Henry Y & Tollervey D Processing of the precursors to small nucleolar RNAs and rRNAs requires common components. Molecular and cellular biology 18, 1181–1189 (1998). [DOI] [PMC free article] [PubMed] [Google Scholar]
- 20.Gray JV et al. “Sleeping beauty”: quiescence in Saccharomyces cerevisiae. Microbiol Mol Biol Rev 68, 187–206 (2004). [DOI] [PMC free article] [PubMed] [Google Scholar]
- 21.Wu T-T, Su Y-H, Block TM & Taylor JM Evidence that two latency-associated transcripts of herpes simplex virus type 1 are nonlinear. Journal of virology 70, 5962–5967 (1996). [DOI] [PMC free article] [PubMed] [Google Scholar]
- 22.Lorsch JR, Bartel DP & Szostak JW Reverse transcriptase reads through a 2′–5′ linkage and a 2′-thiphosphate in a template. Nucleic acids research 23, 2811–2814 (1995). [DOI] [PMC free article] [PubMed] [Google Scholar]
- 23.Fourmann JB et al. Dissection of the factor requirements for spliceosome disassembly and the elucidation of its dissociation products using a purified splicing system. Genes & development 27, 413–428 (2013). [DOI] [PMC free article] [PubMed] [Google Scholar]
- 24.Martin A, Schneider S & Schwer B Prp43 is an essential RNA-dependent ATPase required for release of lariat-intron from the spliceosome. Journal of Biological Chemistry 277, 17743–17750 (2002). [DOI] [PubMed] [Google Scholar]
- 25.Katz Y, Wang ET, Airoldi EM & Burge CB Analysis and design of RNA sequencing experiments for identifying isoform regulation. Nature methods 7, 1009–1015 (2010). [DOI] [PMC free article] [PubMed] [Google Scholar]
- 26.LaCava J et al. RNA degradation by the exosome is promoted by a nuclear polyadenylation complex. Cell 121, 713–724 (2005). [DOI] [PubMed] [Google Scholar]
- 27.Qin D, Huang L, Wlodaver A, Andrade J & Staley JP Sequencing of lariat termini in S. cerevisiae reveals 5′ splice sites, branch points, and novel splicing events. RNA 22, 237–253 (2016). [DOI] [PMC free article] [PubMed] [Google Scholar]
- 28.Wullschleger S, Loewith R & Hall MN TOR signaling in growth and metabolism. Cell 124, 471–484 (2006). [DOI] [PubMed] [Google Scholar]
- 29.Saxton RA & Sabatini DM mTOR signaling in growth, metabolism, and disease. Cell 168, 960–976 (2017). [DOI] [PMC free article] [PubMed] [Google Scholar]
- 30.Jorgensen P et al. A dynamic transcriptional network communicates growth potential to ribosome synthesis and critical cell size. Genes & development 18, 2491–2505 (2004). [DOI] [PMC free article] [PubMed] [Google Scholar]
- 31.Goranov AI et al. Changes in cell morphology are coordinated with cell growth through the TORC1 pathway. Current Biology 23, 1269–1279 (2013). [DOI] [PMC free article] [PubMed] [Google Scholar]
- 32.Zaragoza D, Ghavidel A, Heitman J & Schultz MC Rapamycin induces the G0 program of transcriptional repression in yeast by interfering with the TOR signaling pathway. Molecular and cellular biology 18, 4463–4470 (1998). [DOI] [PMC free article] [PubMed] [Google Scholar]
- 33.Lempiäinen H et al. Sfp1 interaction with TORC1 and Mrs6 reveals feedback regulation on TOR signaling. Molecular cell 33, 704–716 (2009). [DOI] [PubMed] [Google Scholar]
- 34.Mulleder M et al. Functional Metabolomics Describes the Yeast Biosynthetic Regulome. Cell 167, 553–565 (2016). [DOI] [PMC free article] [PubMed] [Google Scholar]
- 35.Rousseau A & Bertolotti A An evolutionarily conserved pathway controls proteasome homeostasis. Nature 536, 184–189 (2016). [DOI] [PMC free article] [PubMed] [Google Scholar]
- 36.Aronova S, Wedaman K, Anderson S, Yates J III & Powers T Probing the membrane environment of the TOR kinases reveals functional interactions between TORC1, actin, and membrane trafficking in Saccharomyces cerevisiae. Molecular biology of the cell 18, 2779–2794 (2007). [DOI] [PMC free article] [PubMed] [Google Scholar]
- 37.Zurita-Martinez SA, Puria R, Pan X, Boeke JD & Cardenas ME Efficient Tor signaling requires a functional class C Vps protein complex in Saccharomyces cerevisiae. Genetics 176, 2139–2150 (2007). [DOI] [PMC free article] [PubMed] [Google Scholar]
- 38.Vyas VK, Barrasa MI & Fink GR A Candida albicans CRISPR system permits genetic engineering of essential genes and gene families. Science advances 1, e1500248 (2015). [DOI] [PMC free article] [PubMed] [Google Scholar]
- 39.Vyas VK et al. New CRISPR Mutagenesis Strategies Reveal Variation in Repair Mechanisms among Fungi. mSphere 3, e00154–18 (2018). [DOI] [PMC free article] [PubMed] [Google Scholar]
- 40.Munding EM, Shiue L, Katzman S, Donohue JP & Ares M Jr Competition between pre-mRNAs for the splicing machinery drives global regulation of splicing. Molecular cell 51, 338–348 (2013). [DOI] [PMC free article] [PubMed] [Google Scholar]
- 41.Warner JR The economics of ribosome biosynthesis in yeast. Trends in biochemical sciences 24, 437–440 (1999). [DOI] [PubMed] [Google Scholar]
- 42.Gasch AP et al. Genomic expression programs in the response of yeast cells to environmental changes. Molecular biology of the cell 11, 4241–4257 (2000). [DOI] [PMC free article] [PubMed] [Google Scholar]
- 43.Pleiss JA, Whitworth GB, Bergkessel M & Guthrie C Rapid, transcript-specific changes in splicing in response to environmental stress. Molecular cell 27, 928–937 (2007). [DOI] [PMC free article] [PubMed] [Google Scholar]
- 44.Bergkessel M, Whitworth GB & Guthrie C Diverse environmental stresses elicit distinct responses at the level of pre-mRNA processing in yeast. RNA 17, 1461–1478, (2011). [DOI] [PMC free article] [PubMed] [Google Scholar]
- 45.Zheng X-F, Fiorentino D, Chen J, Crabtree GR & Schreiber SL TOR kinase domains are required for two distinct functions, only one of which is inhibited by rapamycin. Cell 82, 121–130 (1995). [DOI] [PubMed] [Google Scholar]
- 46.Weinberg DE et al. Improved Ribosome-Footprint and mRNA Measurements Provide Insights into Dynamics and Regulation of Yeast Translation. Cell reports 14, 1787–1799 (2016). [DOI] [PMC free article] [PubMed] [Google Scholar]
- 47.Harju S, Fedosyuk H & Peterson KR Rapid isolation of yeast genomic DNA: Bust n’Grab. BMC biotechnology 4, 8 (2004). [DOI] [PMC free article] [PubMed] [Google Scholar]
- 48.Subtelny AO, Eichhorn SW, Chen GR, Sive H & Bartel DP Poly(A)-tail profiling reveals an embryonic switch in translational control. Nature 508, 66–71 (2014). [DOI] [PMC free article] [PubMed] [Google Scholar]
- 49.Martin M Cutadapt removes adapter sequences from high-throughput sequencing reads. EMBnet. journal 17, pp. 10–12 (2011). [Google Scholar]
- 50.Dobin A et al. STAR: ultrafast universal RNA-seq aligner. Bioinformatics 29, 15–21 (2013). [DOI] [PMC free article] [PubMed] [Google Scholar]
- 51.Robinson JT et al. Integrative genomics viewer. Nature biotechnology 29, 24–26 (2011). [DOI] [PMC free article] [PubMed] [Google Scholar]
- 52.Thorvaldsdóttir H, Robinson JT & Mesirov JP Integrative Genomics Viewer (IGV): high-performance genomics data visualization and exploration. Briefings in bioinformatics 14, 178–192 (2013). [DOI] [PMC free article] [PubMed] [Google Scholar]
- 53.Bailey TL et al. MEME SUITE: tools for motif discovery and searching. Nucleic acids research 37, W202–W208 (2009). [DOI] [PMC free article] [PubMed] [Google Scholar]
- 54.Wu X & Bartel DP kpLogo: positional k-mer analysis reveals hidden specificity in biological sequences. Nucleic acids research 45, W534–W538 (2017). [DOI] [PMC free article] [PubMed] [Google Scholar]
- 55.Pall GS, Codony-Servat C, Byrne J, Ritchie L & Hamilton A Carbodiimide-mediated cross-linking of RNA to nylon membranes improves the detection of siRNA, miRNA and piRNA by northern blot. Nucleic acids research 35, e60 (2007). [DOI] [PMC free article] [PubMed] [Google Scholar]
- 56.Chee MK & Haase SB New and Redesigned pRS Plasmid Shuttle Vectors for Genetic Manipulation of Saccharomycescerevisiae. G3 (Bethesda) 2, 515–526, doi: 10.1534/g3.111.001917 (2012). [DOI] [PMC free article] [PubMed] [Google Scholar]
- 57.Zalatan JG et al. Engineering complex synthetic transcriptional programs with CRISPR RNA scaffolds. Cell 160, 339–350 (2015). [DOI] [PMC free article] [PubMed] [Google Scholar]
- 58.McFarlane ES Ribonuclease activity during Gl arrest of the yeast Saccharomyces cerevisiae. Archives of microbiology 124, 243–247 (1980). [DOI] [PubMed] [Google Scholar]
- 59.Wan R, Yan C, Bai R, Lei J & Shi Y Structure of an intron lariat spliceosome from Saccharomyces cerevisiae. Cell 171, 120–132. e112 (2017). [DOI] [PubMed] [Google Scholar]
Associated Data
This section collects any data citations, data availability statements, or supplementary materials included in this article.