

Abstract
Background
The current paradigm for cardiovascular disease (CVD) emphasises absolute risk assessment to guide treatment decisions in primary prevention. Although the derivation and validation of multivariable risk assessment tools, or CVD risk scores, have attracted considerable attention, their effect on clinical outcomes is uncertain.
Objectives
To assess the effects of evaluating and providing CVD risk scores in adults without prevalent CVD on cardiovascular outcomes, risk factor levels, preventive medication prescribing, and health behaviours.
Search methods
We searched the Cochrane Central Register of Controlled Trials (CENTRAL) in the Cochrane Library (2016, Issue 2), MEDLINE Ovid (1946 to March week 1 2016), Embase (embase.com) (1974 to 15 March 2016), and Conference Proceedings Citation Index‐Science (CPCI‐S) (1990 to 15 March 2016). We imposed no language restrictions. We searched clinical trial registers in March 2016 and handsearched reference lists of primary studies to identify additional reports.
Selection criteria
We included randomised and quasi‐randomised trials comparing the systematic provision of CVD risk scores by a clinician, healthcare professional, or healthcare system compared with usual care (i.e. no systematic provision of CVD risk scores) in adults without CVD.
Data collection and analysis
Three review authors independently selected studies, extracted data, and evaluated study quality. We used the Cochrane 'Risk of bias' tool to assess study limitations. The primary outcomes were: CVD events, change in CVD risk factor levels (total cholesterol, systolic blood pressure, and multivariable CVD risk), and adverse events. Secondary outcomes included: lipid‐lowering and antihypertensive medication prescribing in higher‐risk people. We calculated risk ratios (RR) for dichotomous data and mean differences (MD) or standardised mean differences (SMD) for continuous data using 95% confidence intervals. We used a fixed‐effects model when heterogeneity (I²) was at least 50% and a random‐effects model for substantial heterogeneity (I² > 50%). We evaluated the quality of evidence using the GRADE framework.
Main results
We identified 41 randomised controlled trials (RCTs) involving 194,035 participants from 6422 reports. We assessed studies as having high or unclear risk of bias across multiple domains. Low‐quality evidence evidence suggests that providing CVD risk scores may have little or no effect on CVD events compared with usual care (5.4% versus 5.3%; RR 1.01, 95% confidence interval (CI) 0.95 to 1.08; I² = 25%; 3 trials, N = 99,070). Providing CVD risk scores may reduce CVD risk factor levels by a small amount compared with usual care. Providing CVD risk scores reduced total cholesterol (MD −0.10 mmol/L, 95% CI −0.20 to 0.00; I² = 94%; 12 trials, N = 20,437, low‐quality evidence), systolic blood pressure (MD −2.77 mmHg, 95% CI −4.16 to −1.38; I² = 93%; 16 trials, N = 32,954, low‐quality evidence), and multivariable CVD risk (SMD −0.21, 95% CI −0.39 to −0.02; I² = 94%; 9 trials, N = 9549, low‐quality evidence). Providing CVD risk scores may reduce adverse events compared with usual care, but results were imprecise (1.9% versus 2.7%; RR 0.72, 95% CI 0.49 to 1.04; I² = 0%; 4 trials, N = 4630, low‐quality evidence). Compared with usual care, providing CVD risk scores may increase new or intensified lipid‐lowering medications (15.7% versus 10.7%; RR 1.47, 95% CI 1.15 to 1.87; I² = 40%; 11 trials, N = 14,175, low‐quality evidence) and increase new or increased antihypertensive medications (17.2% versus 11.4%; RR 1.51, 95% CI 1.08 to 2.11; I² = 53%; 8 trials, N = 13,255, low‐quality evidence).
Authors' conclusions
There is uncertainty whether current strategies for providing CVD risk scores affect CVD events. Providing CVD risk scores may slightly reduce CVD risk factor levels and may increase preventive medication prescribing in higher‐risk people without evidence of harm. There were multiple study limitations in the identified studies and substantial heterogeneity in the interventions, outcomes, and analyses, so readers should interpret results with caution. New models for implementing and evaluating CVD risk scores in adequately powered studies are needed to define the role of applying CVD risk scores in primary CVD prevention.
Keywords: Adult, Humans, Anticholesteremic Agents, Anticholesteremic Agents/therapeutic use, Antihypertensive Agents, Antihypertensive Agents/therapeutic use, Blood Pressure, Cardiovascular Diseases, Cardiovascular Diseases/blood, Cardiovascular Diseases/etiology, Cardiovascular Diseases/prevention & control, Cholesterol, Cholesterol/blood, Heart Diseases, Heart Diseases/prevention & control, Primary Prevention, Primary Prevention/methods, Randomized Controlled Trials as Topic, Risk Assessment, Risk Factors, Stroke, Stroke/prevention & control
Plain language summary
Clinical effects of cardiovascular risk scores in people without cardiovascular disease
Review question
What is the evidence about the potential clinical benefits and harms of providing cardiovascular disease (CVD) risk scores in people without a history of heart disease or stroke?
Background
Cardiovascular disease (CVD) is a group of conditions that includes heart disease and stroke. CVD prevention guidelines emphasise the use of risk scores, equations that use clinical variables to estimate the chance of a first heart attack or stroke, to guide treatment decisions in the general population. While there has been much attention to developing different types of CVD risk scores, there is uncertainty about the effects of providing a CVD risk score in clinical practice.
The aim of this systematic review was to assess the effects of evaluating CVD risk scores in adults without a history of heart disease or stroke on cardiovascular outcomes, risk factor levels, preventive medication prescribing, and health behaviours.
Study characteristics
We searched scientific databases for randomised trials (clinical studies that randomly put people into different treatment groups) that systematically provided CVD risk scores or usual care to adults without a history of heart disease or stroke. The evidence is current to March 2016. Funding for the majority of trials came from government sources or pharmaceutical companies.
Key results
We identified 41 trials that included 194,035 participants. Many of the studies had limitations. Low‐quality evidence suggests that providing CVD risk scores had little or no effect on the number of people who develop heart disease or stroke. Providing CVD risk scores may reduce CVD risk factor levels (like cholesterol, blood pressure, and multivariable CVD risk) by a small amount and may increase cholesterol‐lowering and blood pressure‐lowering medication prescribing in higher risk people. Providing CVD risk scores may reduce harms, but the results were imprecise.
Quality of the evidence
There is low‐quality evidence to guide the use of CVD risk scores in clinical practice. Studies had multiple limitations and used different methods to provide CVD risk scores. It is likely that further research will influence these results.
Summary of findings
Summary of findings 1. CVD risk scoring for the primary prevention of cardiovascular disease.
| CVD risk scoring for the primary prevention of cardiovascular disease | ||||||
| Patient or population: adults without prevalent cardiovascular disease (primary cardiovascular disease prevention) Setting: outpatient Intervention: providing CVD risk scores Comparison: not providing CVD risk scores/usual care | ||||||
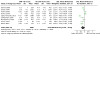
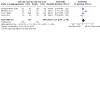
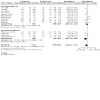
| Outcomes | Anticipated absolute effects* (95% CI) | Relative effect (95% CI) | N of participants (studies) | Quality of the evidence (GRADE) | Comments | |
| Risk with not providing CVD risk scores/usual care | Risk with providing CVD risk scores | |||||
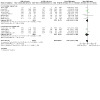
| CVD events follow‐up: range 1‐10 years | Study population | RR 1.01 (0.95 to 1.08) | 99,070 (3 RCTs) | ⊕⊕⊝⊝ Lowa,b | — | |
| 53 per 1000 | 54 per 1000 (51 to 58) | |||||
| Total cholesterol (mmol/L) follow‐up: median 1 years | In the comparison group, the range of mean total cholesterol level was 5.1 to 6.6 mmol/L and the range of mean change from baseline in total cholesterol level was 0.09 lower to 0.14 mmol/L higher | The mean difference in total cholesterol in the intervention group was 0.10 mmol/L lower (0.20 lower to 0.00) | — | 20,437 (12 RCTs) | ⊕⊕⊝⊝ Lowc,d | — |
| Systolic blood pressure (mmHg) follow‐up: median 1 years | In the comparison group, the range of mean systolic blood pressure level was 124.1 to 159.0 mmHg and the range of mean change from baseline in systolic blood pressure level was 5.3 lower to 1.0 higher mmHg | The mean difference in systolic blood pressure in the intervention group was 2.77 mmHg lower (4.16 lower to 1.38 lower) | — | 32,954 (16 RCTs) | ⊕⊕⊝⊝ Lowc,d | — |
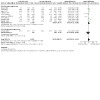
| Change in multivariable CVD risk (SD) follow‐up: median 1 years | In the comparison group, the range of mean change from baseline in multivariable CVD risk was 5.3 lower to 0.77 higher SDs | The mean difference in multivariable CVD risk in the intervention group was 0.21 SDs lower (0.39 lower to 0.02 lower) | — | 9549 (9 RCTs) | ⊕⊕⊝⊝ Lowc,d | Standardised mean differences were calculated for this outcome due to the use of different multivariable CVD risk scales. An effect size of ~0.20 SD units reflects a small effect. |
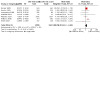
| Investigator‐defined adverse events follow‐up: range 1 month to 1 year | Study population | RR 0.72 (0.49 to 1.04) | 4630 (4 RCTs) | ⊕⊕⊝⊝ Lowe,f | Adverse events were defined heterogeneously by investigators and included some events that may have been due to newly prescribed medications rather than the provision of a CVD risk score itself. | |
| 27 per 1000 | 19 per 1000 (13 to 28) | |||||
| New/intensified lipid‐lowering medication follow‐up: median 6 months | Study population | RR 1.47 (1.15 to 1.87) | 14,175 (11 RCTs) | ⊕⊕⊝⊝ Lowd,e | Prescribing rates in the comparison group varied among the included trials (range 4% to 22%). Median prescribing rate presented | |
| 107 per 1000 | 157 per 1000 (123 to 200) | |||||
| New/intensified antihypertensive medication follow‐up: median 1 years | Study population | RR 1.51 (1.08 to 2.11) | 13,255 (8 RCTs) | ⊕⊕⊝⊝ Lowd,e | Prescribing rates in the comparison group varied among the included trials (range 0% to 27%). Median prescribing rate presented | |
| 114 per 1000 | 172 per 1000 (123 to 240) | |||||
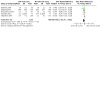
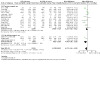
| *The risk in the intervention group (and its 95% confidence interval) is based on the assumed risk in the comparison group and the relative effect of the intervention (and its 95% CI). CI: confidence interval; RCT: randomised controlled trial; RR: risk ratio; SD: standard deviation. | ||||||
| GRADE Working Group grades of evidence High quality: we are very confident that the true effect lies close to that of the estimate of the effect Moderate quality: we are moderately confident in the effect estimate: the true effect is likely to be close to the estimate of the effect, but there is a possibility that it is substantially different Low quality: our confidence in the effect estimate is limited: the true effect may be substantially different from the estimate of the effect Very low quality: we have very little confidence in the effect estimate: the true effect is likely to be substantially different from the estimate of effect | ||||||
aDowngraded due to study limitations, primarily driven by high risk of selection bias in Holt 2010 and high risk of reporting bias in Bucher 2010 and Jorgensen 2014. bDowngraded due to imprecision; trials reported being underpowered for CVD events. cDowngraded due to study limitations, primarily in the domains of attrition bias (missing data for follow‐up risk factor levels) and other sources of bias (poor intervention fidelity, potential conflicts of interest). dDowngraded due to heterogeneity in pooled estimates. eDowngraded due to study limitations, primarily in the domains of attrition bias (missing data for medication prescribing in follow‐up) and other sources of bias (poor intervention fidelity, potential conflicts of interest). fDowngraded due to imprecision, because confidence interval includes 1 and sample size does not meet threshold for optimal information size.
Background
Description of the condition
Cardiovascular disease (CVD), which includes ischaemic heart disease and stroke, is the leading cause of mortality and disability worldwide (Murray 2012; Naghavi 2015). According to the Global Burden of Disease study, ischaemic heart disease and stroke accounted for 12.9 million deaths worldwide in 2013, or one in every four of the total (Naghavi 2015). CVD is also costly, and the World Economic Forum estimates that the direct cost attributable to CVD is USD 863 billion worldwide, with a projected rise of 22% by 2030 (Bloom 2011).
The incidence of CVD is largely explained by several modifiable risk factors, which include abnormal cholesterol, elevated blood pressure, diabetes mellitus, smoking, unhealthy diet, excessive alcohol intake, abdominal obesity, psychosocial stress, and lack of physical activity. These nine modifiable risk factors increase the risk of future CVD events and contribute to an estimated 90% of the population attributable risk fraction of ischaemic heart disease and stroke worldwide (O'Donnell 2010; Yusuf 2004). Prevention, treatment, and control of these risk factors before clinical manifestation are therefore primary targets of interventions to reduce the burden of CVD.
Description of the intervention
CVD events are often determined by the confluence of multiple, co‐existing risk factors (Smith 2004). The multifactorial nature of CVD has led to the development and application of multivariable risk assessment tools, or CVD risk scores, to calculate CVD risk. CVD risk scores allow clinicians to integrate information from multiple CVD risk factors and quantitatively estimate a person's absolute risk for, or likelihood of experiencing, a CVD event during a defined period of time.
The first widely used multivariable CVD risk score was derived from the Framingham Heart Study in the USA (Anderson 1991; Wilson 1998). The Framingham risk score incorporated the effects of age, sex, systolic blood pressure, total cholesterol, high‐density lipoprotein (HDL) cholesterol, smoking status, antihypertensive treatment status, and diabetes mellitus to estimate 10‐year risk of coronary heart disease. During the past two decades, there has been widespread development of additional CVD risk scores such as the European Systematic COronary Risk Evaluation (SCORE) algorithm (Conroy 2003); the German Prospective Cardiovascular Munster (PROCAM) model (Assmann 2002); the UK QRISK and QRISK2 equations (Hippisley‐Cox 2007; Hippisley‐Cox 2008); the World Health Organization (WHO) risk chart (WHO 2007); the American College of Cardiology (ACC)/American Heart Association (AHA) 2013 Pooled Cohort risk equations (Goff 2014); and the Globorisk cardiovascular risk equation for use globally, including in low‐ and middle‐income countries (Hajifathalian 2015). CVD prevention guidelines recommend use of these risk scores to guide treatment decisions for primary prevention in people who do not yet have clinical manifestations of CVD (Anderson 2013; NCEP 2002; NICE 2014; Piepoli 2016; Stone 2014; WHO 2007).
How the intervention might work
The current paradigm for CVD risk reduction in primary prevention matches the intensity of prevention efforts to a person's absolute risk for developing CVD (Bethesda 1996; Smith 2004). Risk‐based prevention, therefore, directs treatments toward people at increased risk who derive greater benefit from treatment, while sparing people at lower risk for whom benefits may not outweigh the costs and harms of treatment. Qualitative assessment of CVD risk, however, is fraught with error, thereby providing a rationale for quantitative risk assessment tools (Grover 1995; Meland 1994; Pignone 2003; Van der Weijden 2008). Prevention guidelines in the USA, the UK, Europe, Canada, and the developing world promote the use of multivariable CVD risk scores to guide treatment decisions in primary prevention (Anderson 2013; NCEP 2002; NICE 2014; Piepoli 2016; Stone 2014; WHO 2007). The 2013 ACC/AHA Cholesterol Guidelines in the USA, described in Stone 2014, and the National Institute for Health and Care Excellence (NICE) recommendations for the prevention of CVD in the UK, laid out in NICE 2014, both advocate risk‐based prevention strategies that incorporate multivariable CVD risk scores to estimate short‐ and long‐term CVD risk, providing a quantitative framework to guide clinician‐patient discussions regarding statins in primary prevention.
Analyses of randomised clinical trials (RCTs) provide empiric support for risk stratification by demonstrating that the absolute risk reduction from preventive medications is related more to the magnitude of pretreatment risk than the relative risk reduction associated with treating a single risk factor (BPLTTC 2014; CTT 2012; Jackson 2005). Therefore, use of CVD risk scores not only has the potential to effectively and efficiently direct preventive care to those in greatest need but may help maximise benefit of treatment in high‐risk people and minimise harms of over‐treatment in people at low risk. Additional purported benefits of CVD risk scores also include raising awareness of disease, improving communication between clinician and patient, and motivating adherence to recommended lifestyle changes or preventive therapies (Goff 2014).
Why it is important to do this review
Although considerable research has focused on the derivation and validation of multivariable CVD risk prediction tools in different populations, the effects of CVD risk scores to direct clinical practice is poorly understood, and few studies have examined their utility in clinical practice (Damen 2016). In 2006 and 2008, two related systematic reviews performed with Cochrane methodology identified only four RCTs testing the clinical effects of CVD risk scores and found no clear evidence that CVD risk assessment improved health outcomes (Beswick 2008; Brindle 2006). In 2008, a systematic review examining the clinical benefits or harms of providing CVD risk scores identified six trials showing that physicians presented with risk information tended to appropriately prescribe preventive therapies (Sheridan 2008). Another systematic review examining the effect of giving CVD risk information to adults in clinical practice identified 18 studies (14 RCTs) demonstrating that global CVD risk information improved accuracy of risk perception and increased patients' intent to start pharmacotherapy (Sheridan 2010). However, in both reviews the effect of CVD risk scores on health outcomes, risk factors, and health behaviours was unclear.
In spite of widespread recommendations for the use of multivariable CVD risk scores in clinical practice guidelines (Anderson 2013; NCEP 2002; NICE 2014; Piepoli 2016; Stone 2014; WHO 2007), uncertainty remains about their effects on health‐related outcomes. Given the publication of new trials and the continued prominence of multivariable CVD risk scores in primary CVD prevention guidelines, a systematic review of the literature is warranted.
Objectives
To assess the effects of evaluating and providing CVD risk scores in adults without prevalent CVD on cardiovascular outcomes, risk factor levels, preventive medication prescribing, and health behaviours.
Methods
Criteria for considering studies for this review
Types of studies
We included RCTs and quasi‐RCTs (systematic allocation) with individual or cluster allocation. We included studies reported as full text and abstracts as well as unpublished data.
Types of participants
We included studies that reported results for adults (18 years of age and older) in outpatient settings free of clinical CVD (defined as prior heart attack, stroke, heart failure, symptomatic peripheral vascular disease, or atrial fibrillation). Participants with diabetes mellitus or elevated risk factors as well as those already on background preventive medications were eligible for inclusion. For studies that included a combination of participants with and without prevalent CVD, we included studies that reported results for primary prevention participants. When studies included both primary and secondary prevention populations, we included only those studies with < 30% of the study population having prevalent CVD.
Types of interventions
We included trials that compared the systematic provision of a multivariable CVD risk score by a clinician, healthcare professional, or healthcare system versus usual care (i.e. no systematic provision of a CVD risk score) in primary CVD prevention. We excluded health risk appraisals not based on a risk score and studies testing risk of hypothetical patients.
Types of outcome measures
Primary outcomes
CVD events (a composite of fatal and non‐fatal myocardial infarction and stroke)
-
Change in risk factor levels
Cholesterol: total cholesterol, low‐density lipoprotein (LDL) cholesterol
Blood pressure: systolic blood pressure, diastolic blood pressure
Change in multivariable CVD risk: a summary score or risk estimate that incorporates multiple and simultaneous changes in different CVD risk factor levels
Investigator‐defined adverse events, including but not limited to physical or psychosocial events, including anxiety or depression
Secondary outcomes
-
Preventive medication prescribing in higher risk people
Lipid‐lowering medications
Antihypertensive medications
Aspirin
Medication adherence
-
Health‐related behaviours
Smoking cessation
Exercise
Diet
Decisional conflict, measured according to the decisional conflict scale
Health‐related quality of life, measured according to any validated scale concerning quality of life
Costs
Search methods for identification of studies
Key inclusion criteria were studies that were relevant to CVD primary prevention, employed a prospective design, and provided or incorporated a CVD risk score to guide treatment decisions in CVD prevention.
Exclusion criteria were studies that were unrelated to CVD risk scores; those addressing health risk appraisals not based on a quantitative risk score; those relying only on self‐reported risk factors and lifestyle; and those involving clinical vignettes or hypothetical patients rather than real patients.
Electronic searches
We identified trials through systematic searches of the following bibliographic databases on 15 March 2016.
Cochrane Central Register of Controlled Trials (CENTRAL; 2016 Issue 2) in the Cochrane Library (Wiley).
Ovid MEDLINE(R) (1946 to March Week 1 2016).
Ovid MEDLINE(R) In‐Process & Other Non‐Indexed Citations (14 March 2016).
Embase, including Embase Classic, via embase.com (1947 to 15 March 2016).
Conference Proceedings Citation Index‐Science (CPCI‐S) via Web of Science (1990 to 15 March 2016).
Two authors (KNK, MAB) designed the database searches based on the MEDLINE search strategy used in a previous systematic review published with Cochrane methodology (Beswick 2008). The search strategies for each database are available in Appendix 1. For the MEDLINE search, we applied the Cochrane sensitivity and precision maximizing RCT filter (Lefebvre 2011). For Embase, we translated from Ovid to embase.com syntax, the multiterm Embase filter with the best balance of sensitivity and specificity (Wong 2006), and we limited the search to records indexed in Embase. For Conference Proceedings Citation Index‐Science we used a combination of terms for identifying trials described in section 6.3.2.2 of the Cochrane Handbook for Systematic Reviews of Interventions (Lefebvre 2011). We applied no filters to the CENTRAL search.
We searched all databases from their inception to March 2016, and we imposed no restriction on language of publication.
Searching other resources
We tried to identify other potentially eligible trials or ancillary publications by searching the reference lists of retrieved included studies and relevant review articles for additional references. We also searched ClinicalTrials.gov (www.ClinicalTrials.gov) and the WHO International Clinical Trials Registry Platform (ICTRP) Search Portal (apps.who.int/trialsearch/) on 16 March 2016. Lastly, we contacted study authors of included or registered trials to identify further studies or unpublished data that could contribute to our review.
Data collection and analysis
Selection of studies
Three authors (KNK and SDP or MDH) independently screened titles and abstracts of every record retrieved to determine which studies to assess further, resolving disagreements by consensus. We then retrieved full‐text study reports/publications of all eligible or potentially eligible reports. Three authors (KNK and SDP or MDH) independently screened full‐text articles, identified studies for inclusion, and recorded reasons for exclusion of the ineligible studies. We resolved any disagreements through discussion or, if required, recourse to the third author (SDP or MDH). We identified and excluded duplicate reports and collated multiple reports of the same study so that each study, rather than each report, was the unit of analysis. We recorded the selection process in sufficient detail to complete a PRISMA flow diagram and Characteristics of excluded studies table.
Data extraction and management
For studies that fulfilled the inclusion criteria, we used standardised data extraction forms to record study characteristics and outcome data. We extracted the following study characteristics.
Methods: study design, total duration of study, details of any run‐in period, number of study centres and location, study country and setting, withdrawals, and date of study.
Participants: N, mean age, age range, sex, severity of condition, diagnostic criteria, baseline CVD risk, smoking history, inclusion criteria, and exclusion criteria.
Interventions: CVD risk score used, comparator group.
Outcomes: primary and secondary outcomes specified and collected, and time points reported.
Notes: funding for trial, and notable conflicts of interest of trial authors.
Three authors (KNK and SDP or MDH) independently extracted outcome data from included studies in duplicate. We resolved disagreements by consensus or by involving the third author. One author (KNK) transferred data into Review Manager 5 (RevMan 2014), and another author (SDP) spot‐checked to ensure that study characteristics and study data were entered correctly.
Assessment of risk of bias in included studies
Three authors (KNK and SDP or MDH) independently assessed risk of bias for each study using the criteria outlined in the Cochrane Handbook for Systematic Reviews of Interventions (Higgins 2011). We resolved disagreements by consensus or by involving the third author. We assessed risk of bias according to the following domains.
Random sequence generation.
Allocation concealment.
Blinding of participants and personnel.
Blinding of outcome assessment.
Incomplete outcome data.
Selective outcome reporting.
Other bias (e.g. industry funding).
We judged risk of bias criteria as low risk, unclear risk, or high risk and evaluated individual bias items as described in Higgins 2011. When considering treatment effects, we took into account the risk of bias for the studies that contributed to that outcome. For cluster‐RCTs, we followed Cochrane recommendations for assessing risk of bias, with particular attention across the domains of recruitment, baseline imbalances, loss of cluster, incorrect analyses, and comparability with individually RCTs (Higgins 2011). Two of the review authors (SDP and DLJ) performed two studies included in this review (Persell 2013; Persell 2015). For these two studies, data extraction and risk of bias assessment were performed by review authors who were not involved with the conduct of either study (KNK and MDH).
Assessment of bias in conducting the systematic review
We conducted the review according to a published protocol and reported any deviations from it in the Differences between protocol and review section.
Measures of treatment effect
We analysed dichotomous data as risk ratios (RRs) with 95% confidence intervals (CIs). We used inverse variance methods to facilitate meta‐analysis of outcomes from individual RCTs and appropriately analysed cluster‐RCTs (Chapter 16.3.3 of Higgins 2011). We used RevMan 2014 to convert the reported effect estimates to a common risk ratio format. We analysed continuous data as mean difference (MD) or standardised mean difference (SMD) with 95% CIs. We entered data presented as a scale with a consistent direction of effect. For meta‐analyses of mean differences, we pooled results of studies that reported final values with those reporting changes from baseline (Chapter 9.4.5.2 of Higgins 2011). For meta‐analyses of SMDs, we pooled results of studies that reported change from baseline (change scores).
Unit of analysis issues
We included RCTs with parallel design and cluster‐RCTs. For cluster‐RCTs, we recorded whether investigators accounted for clustering in their analyses (e.g. multilevel model, generalised estimating equations). If analyses adjusted for clustering, then we meta‐analysed individual RCTs with cluster‐RCTs. For continuous outcomes, we used the inverse‐variance method to calculate MDs and SMDs. For dichotomous outcomes, we used the generic inverse‐variance method to meta‐analyse the reported effect estimate (and corresponding standard error or confidence interval) from the appropriately‐analysed cluster‐RCT and the reported or calculated effect estimate from the individual RCT (Chapter 16.3.3 of Higgins 2011).
Dealing with missing data
We contacted investigators or study sponsors to verify key study characteristics and obtain missing numerical outcome data where possible (e.g. when a study is identified as abstract only). We investigated attrition rates, losses to follow‐up, withdrawals, and critically appraised methods for handling missing data and imputation methods. If standard deviations for outcomes were not available, we imputed these values from data within the trial using methods outlined in Chapter 16.1.3 of Higgins 2011 and through RevMan 2014
Assessment of heterogeneity
We used the I² statistic to measure heterogeneity among the trials in each analysis. If we identified substantial (I² > 50%) heterogeneity, we reported it and explored possible causes by subgroup analyses.
Assessment of reporting biases
We created and examined a funnel plot to explore possible publication and small study bias for the primary outcomes.
Data synthesis
We undertook meta‐analyses only if the treatments, participants, and the underlying clinical questions in the studies were similar enough for pooling to be appropriate. If there was no or moderate heterogeneity (I² < 50%), we performed fixed‐effect model meta‐analyses. If there was substantial heterogeneity (I² > 50%), we performed a random‐effects model meta‐analyses with cautious interpretation.
Subgroup analysis and investigation of heterogeneity
We had planned on performing the following pre‐specified subgroup analyses on our primary outcomes.
Sex (patient).
RCTs versus quasi‐RCTs.
Trials providing CVD risk scores to clinicians versus trials providing CVD risk scores to patients.
Trials that incorporated a multivariable CVD risk score within a clinical decision support tool (either clinician‐facing or patient‐facing).
Among these prespecified subgroups, we were only able to perform a subgroup analysis among trials that used or did not use a clinical decision support tool. We did not have sufficient data from each trial to perform subgroup analysis by sex. We identified only one quasi‐RCT. Lastly, many studies and protocols were unclear as to whether CVD risk scores were exclusively directed to a clinician or patient. Frequently, such risk scores were provided to both clinicians and patients during a clinical encounter.
Based on the substantial heterogeneity identified in our meta‐analysis, we also performed two post hoc subgroup analyses on:
Trials that utilised health information technology (IT) for risk assessment or risk communication.
Trials that exclusively enrolled participants with higher risk (defined as 10‐year CVD risk ≥ 10% or a high‐risk condition such as diabetes mellitus).
We used the formal test for subgroup interactions in RevMan 2014.
Sensitivity analysis
We had planned to carry out sensitivity analyses excluding studies assessed as being at unclear or high risk of bias in any domain. However, we assessed nearly all studies as being at unclear or high risk of bias, so this sensitivity analysis was not performed.
Summary of findings and assessment of the certainty of the evidence
We assessed the quality of the evidence for each outcome according to the GRADE approach and presented results in a 'Summary of findings' table (Guyatt 2008). We rated the quality of evidence as: high, moderate, low, or very low after consideration of within‐study risk of bias (methodological quality), directness of evidence, heterogeneity, precision of effect estimates, and risk of publication bias.
Results
Description of studies
See: Characteristics of included studies; Characteristics of excluded studies; Characteristics of studies awaiting classification; Characteristics of ongoing studies.
Results of the search
We identified 8723 records through database searching and an additional 13 records from prior systematic reviews of this topic (Brindle 2006; Beswick 2008; Sheridan 2008; Sheridan 2010; Willis 2012; Usher‐Smith 2015). The article selection process is depicted in the PRISMA flowchart in Figure 1. After removing duplicates, we screened 6422 records and excluded 6238 based on title and abstract. We removed an additional 5 duplicate records and assessed 179 full‐text records and 4 trial registry records for eligibility. We excluded 94 records of 77 studies and 2 trial registry records with reasons, identified 11 records of 10 ongoing studies, and listed 3 studies as awaiting classification. In total, we included 73 records of 41 studies (N = 194,035) in this systematic review.
1.
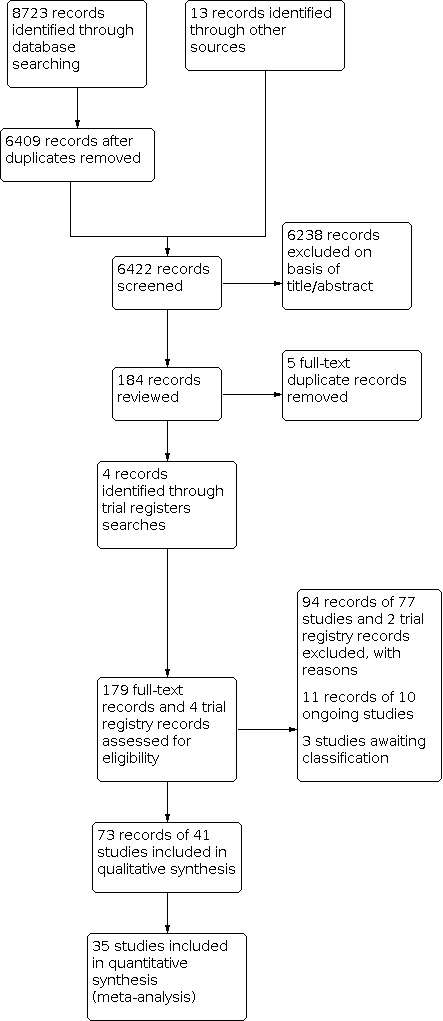
Study flow diagram.
Included studies
Study design and location
Details of the methods, participants, intervention, comparison group, and outcome measures for each of the studies in this review are shown in the Characteristics of included studies table. We identified 23 individual‐level RCTs (N = 117,040), 17 cluster‐RCTs (N = 76,672), and 1 quasi‐RCT (N = 323). The earliest trial was reported in 1994 (British Family Heart 1994), and the most recent was reported in 2016 (Perestelo‐Perez 2016). Fifteen trials took place in European countries outside the UK (Benner 2008; Bucher 2010; Christensen 2004; Cobos 2005; Denig 2014; Engberg 2002; Hanon 2000; Hetlevik 1999; Jorgensen 2014; Koelewijn‐van Loon 2010; Krones 2008; Lopez‐Gonzalez 2015; Perestelo‐Perez 2016; Van Steenkiste 2007; Welschen 2012); 12 trials in the USA (Bertoni 2009; Eaton 2011; Edelman 2006; Jacobson 2006; Mann 2010; Persell 2013; Persell 2015; Sheridan 2006; Sheridan 2011; Turner 2012; Williams 2006; Zullig 2014); 7 trials in the UK (British Family Heart 1994; Hall 2003; Hanlon 1995; Holt 2010; Montgomery 2000; Montgomery 2003; Price 2011); 3 trials in Canada (Grover 2007; Lowensteyn 1998; Wister 2007); 3 trials in Australia or New Zealand (Peiris 2015; Vagholkar 2014; Webster 2010); and 1 Internet‐based trial that did not report a specific country (Soureti 2011). All studies were conducted in the outpatient setting. Participant follow‐up ranged from no follow‐up in Hall 2003, Jacobson 2006 and Sheridan 2006 to 10 years of extended follow‐up in Jorgensen 2014. In total, 21 out of 41 trials reported a follow‐up of one year or more.
Participants
Mean age reported in the trials ranged from 40 years in Engberg 2002 to 71 years in Montgomery 2000, and the proportion of female participants ranged from 8% in Hanlon 1995 to 80% in Edelman 2006. In the 20 trials that reported participants' ethnicity, most (16 out of 20) included a majority of white or European participants; the remaining 4 trials included a majority of African American participants (Jacobson 2006; Mann 2010; Persell 2015; Turner 2012). Participants in the included trials had varying past medical histories. Ten trials included only participants with higher CVD risk (defined as diabetes mellitus or 10‐year CVD risk ≥ 10%) (Benner 2008; Denig 2014; Grover 2007; Hall 2003; Mann 2010; Perestelo‐Perez 2016; Persell 2013; Persell 2015; Price 2011; Welschen 2012), and 5 of these trials included only participants with diabetes mellitus (Denig 2014; Mann 2010; Perestelo‐Perez 2016; Price 2011; Welschen 2012). The other 31 trials included participants with all risk levels. There were 13 trials that included participants with prevalent CVD, but based on our selection criteria we included only those trials where these participants made up < 30% of the total sample (Bertoni 2009; British Family Heart 1994; Cobos 2005; Eaton 2011; Grover 2007; Holt 2010; Krones 2008; Montgomery 2000; Peiris 2015; Perestelo‐Perez 2016; Turner 2012; Webster 2010; Zullig 2014). One trial included participants with human immunodeficiency virus (HIV) who were part of the Swiss HIV Cohort Study (Bucher 2010).
Interventions and comparison groups
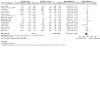
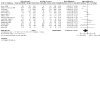
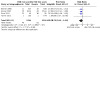
Interventions varied across trials, which featured different CVD risk scores, risk presentations, and co‐interventions (Figure 2). The two most common CVD risk scores used were the Framingham Coronary Heart Disease Risk Score (24 trials) and the UK Prospective Diabetes Study (UKPDS) risk engine (6 trials). In these trials, baseline CVD risk was presented as a 5‐ or 10‐year absolute risk of a CVD event. Six trials used risk‐adjusted cardiovascular age (called by various names such as heart age, cardiovascular age, or vascular age) in addition to or in lieu of the absolute CVD risk information (Eaton 2011; Grover 2007; Lopez‐Gonzalez 2015; Lowensteyn 1998; Peiris 2015; Soureti 2011). In addition to the risk message, interventions also included: patient education material (31 trials); clinician‐ or patient‐facing decision‐support tools (27 trials); nurse counselling (11 trials); academic detailing/continuing medical education (9 trials); electronic health record integration (10 trials); electronic or paper‐based reminders (7 trials); and audit and feedback (4 trials). A few trials implemented only one of these components (Hall 2003; Hanon 2000; Lopez‐Gonzalez 2015; Welschen 2012), while on the opposite side of the spectrum, there were five or more of these components (Bertoni 2009; Denig 2014; ; Koelewijn‐van Loon 2010; Peiris 2015; Sheridan 2011; Turner 2012; Vagholkar 2014; Wister 2007). In total, among the 41 studies, 28 studies incorporated health IT for some aspect of the risk score intervention. The range of co‐interventions is summarised in Figure 2.
2.
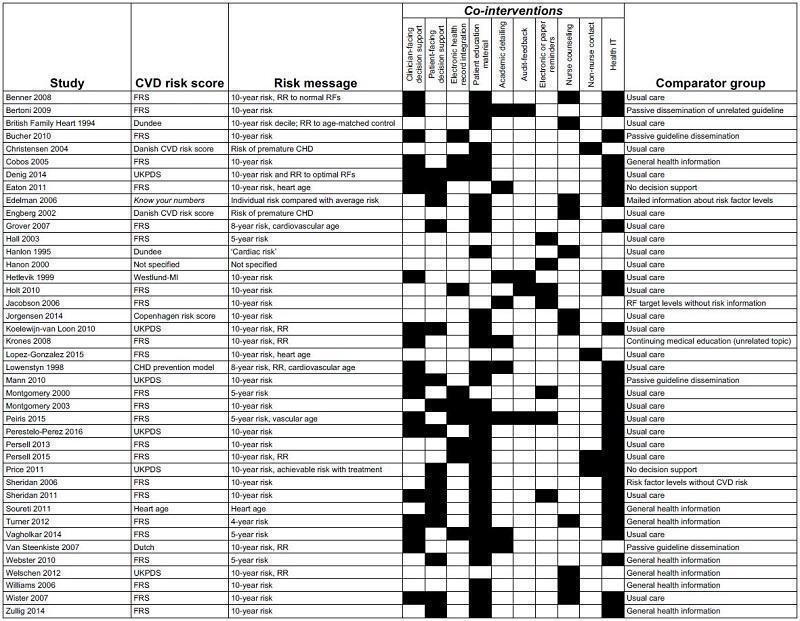
Summary of CVD risk score interventions by included study. Abbreviations: CHD: coronary heart disease; CVD: cardiovascular disease; FRS: Framingham risk score; MI: myocardial infarction; RF: risk factors, RR: risk ratio; UKPDS: United Kingdom Prospective Diabetes Study
Comparison groups were generally characterised as 'usual care' by study authors and did not include the systematic provision of CVD risk scores. Some studies described the addition of: passive guideline dissemination (Bucher 2010; Mann 2010; Van Steenkiste 2007), provision of risk factor levels alone (Edelman 2006; Jacobson 2006; Sheridan 2006), continuing medical education for an unrelated topic (Bertoni 2009; Krones 2008), and general health and risk factor information (Cobos 2005; Soureti 2011; Turner 2012; Webster 2010; Welschen 2012; Zullig 2014). Comparison group descriptions are summarised in Figure 2.
Outcomes
Among the included trials, the most common primary outcome in 10 trials addressed a clinical care process measure such as risk factor screening, preventive treatment discussions, guideline adherence, or achievement of risk factor targets (Bertoni 2009; Cobos 2005; Eaton 2011; Grover 2007; Jacobson 2006; Lowensteyn 1998; Montgomery 2000; Peiris 2015; Persell 2015; Sheridan 2006). Other primary outcomes reported in the included studies were multivariable CVD risk in eight trials (Benner 2008; British Family Heart 1994; Edelman 2006; Hanlon 1995; Krones 2008; Turner 2012; Wister 2007; Zullig 2014), patient‐reported outcomes in seven trials (Christensen 2004; Denig 2014; Koelewijn‐van Loon 2010; Mann 2010; Montgomery 2003; Perestelo‐Perez 2016; Welschen 2012), CVD risk factor levels in six trials (Bucher 2010; Grover 2007; Hanon 2000; Lopez‐Gonzalez 2015; Persell 2013; Persell 2015), medication prescribing rates in four trials (Hall 2003; Vagholkar 2014; Van Steenkiste 2007; Webster 2010), and health behaviours in three trials (Price 2011; Soureti 2011; Williams 2006). Only two trials reported CVD events as a primary outcome, but both reported being underpowered for this endpoint after completion of the study (Holt 2010; Jorgensen 2014).
Study funding sources
We present detailed information on study funding sources in the Characteristics of included studies table. Five trials reported receiving study funding exclusively from pharmaceutical companies (Benner 2008; Cobos 2005; Grover 2007; Lowensteyn 1998; Soureti 2011). There were 19 trials that reported funding from public and/or federal government sources (Bertoni 2009; Denig 2014; Edelman 2006; Hanlon 1995; Hetlevik 1999; Koelewijn‐van Loon 2010; Krones 2008; Montgomery 2000; Montgomery 2003; Peiris 2015; Perestelo‐Perez 2016; Persell 2013; Persell 2015; Sheridan 2011; Vagholkar 2014; Van Steenkiste 2007; Welschen 2012; Williams 2006; Wister 2007), 7 trials that reported study funding from a combination of public and private sources (British Family Heart 1994; Bucher 2010; Christensen 2004; Engberg 2002; Jorgensen 2014; Turner 2012; Webster 2010), and 3 trials with study funding from internal (usually hospital) sources (Holt 2010; Jacobson 2006; Sheridan 2006). Five trials did not report sources of study funding (Eaton 2011; Hall 2003; Hanon 2000; Lopez‐Gonzalez 2015; Mann 2010).
Excluded studies
We excluded 94 records of 77 studies after full‐text review and 2 trial registry records. The most common reason for exclusion was that a risk score was not part of the intervention (41 trials). We excluded other studies because they provided CVD risk scores in all treatment groups without a usual care comparator group (16 trials), were not an RCT or quasi‐RCT (10 trials), did not study a primary prevention population (11 trials), or used clinical vignettes and hypothetical patients (1 trial).
A complete list of excluded studies, along with the reason for exclusion of each study, is presented in the Characteristics of excluded studies table.
Studies awaiting classification
We identified three studies awaiting classification (Adamson 2013; Gryn 2012; Roach 2012). Two of these studies included participants with diabetes mellitus (Adamson 2013; Roach 2012), and one included participants with hypertension (Gryn 2012). All three studies reported having an intervention group that received a personalised CVD risk estimate, but the identified records were abstracts and did not provide sufficient details to determine eligibility for this systematic review. Authors of two of these studies reported preparing manuscripts (Gryn 2012; Roach 2012). We present additional details of these studies in the Characteristics of studies awaiting classification table.
Ongoing studies
We identified 11 reports of 10 ongoing studies. Three of these studies are taking place in Europe (Badenbroek 2014; Ijkema 2014; Maindal 2014), one in the USA (Sanghavi 2015), one in Canada (NCT00694239), one in the UK (Silarova 2015), one in Australia (Redfern 2014), and three in low‐ and middle‐income countries (NCT02096887; Ogedegbe 2014; Praveen 2013). Two studies will supplement CVD risk scores with novel sources of CVD risk information: Ijkema 2014 with coronary artery calcium scores and Silarova 2015 with genetic risk information. Three ongoing studies will test innovative implementation models to provide CVD risk scores. These include: direct‐to‐patient health portals within an electronic health record (Redfern 2014), non‐physician healthcare workers in resource‐poor settings (Praveen 2013), and financial incentives linked to CVD risk assessment and absolute risk reduction (Sanghavi 2015). The Characteristics of ongoing studies table presents details of these studies.
Risk of bias in included studies
Overall and trial‐specific assessment of risk of bias are shown in Figure 3 and Figure 4. In general, there was high risk of bias across the included studies. Due to the nature of the intervention, few trials were able to blind participants, study personnel, or both. Thus, in our overall risk of bias assessment, we put greater weight on blinding of outcome assessment (detection bias) compared to blinding of participants or study personnel (performance bias). We concluded that only three trials had an overall low risk of bias across most domains (Peiris 2015; Persell 2013; Persell 2015). We summarise risk of bias assessment across each domain below, but detailed documentation supporting risk of bias assessment for each trial is included in the Characteristics of included studies table.
3.
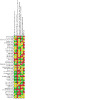
Risk of bias summary: review authors' judgements about each risk of bias item for each included study.
4.
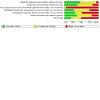
Risk of bias graph: review authors' judgements about each risk of bias item presented as percentages across all included studies.
Allocation
There were 19 trials that adequately reported the methods used for random sequence generation, and we assessed them as being at low risk of bias (Benner 2008; Bucher 2010; Cobos 2005; Denig 2014; Hanlon 1995; Jorgensen 2014; Koelewijn‐van Loon 2010; Montgomery 2000; Montgomery 2003; Peiris 2015; Perestelo‐Perez 2016; Persell 2013; Persell 2015; Price 2011; Vagholkar 2014; Van Steenkiste 2007; Webster 2010; Welschen 2012; Wister 2007). We assessed 19 trials as being at unclear risk of bias and 3 trials as having an inadequate method of random sequence generation.
Sixteen trials reported adequate allocation concealment (Bucher 2010; Denig 2014; Engberg 2002; Grover 2007; Koelewijn‐van Loon 2010; Montgomery 2000; Montgomery 2003; Peiris 2015; Persell 2013; Persell 2015; Price 2011; Sheridan 2006; Vagholkar 2014; Webster 2010; Welschen 2012; Williams 2006). Among the remaining trials, there were 18 at unclear risk of bias and 7 trials at high risk of bias for allocation concealment.
In total, 12 trials were assessed as being at low risk of selection bias, that is, for both random sequence generation and allocation concealment (Bucher 2010; Denig 2014; Koelewijn‐van Loon 2010; Montgomery 2000; Montgomery 2003; Peiris 2015; Persell 2013; Persell 2015; Price 2011; Vagholkar 2014; Webster 2010; Welschen 2012).
Blinding
Due to the nature of the intervention, we assessed 38 out of 41 trials as being at high risk of bias due to an unblinded study design. The trials with low or unclear risk of bias were Internet‐based studies where research personnel had no direct contact with participants (Soureti 2011; Webster 2010). Therefore, we used blinding of outcome assessors to determine overall risk of bias. Among the 41 trials, 12 trials reported adequate blinding of outcome assessors (Bertoni 2009; Eaton 2011; Edelman 2006; Holt 2010; Jorgensen 2014; Peiris 2015; Persell 2013; Persell 2015; Price 2011; Turner 2012; Vagholkar 2014; Wister 2007). The remaining 18 trials were at unclear risk of bias, and 11 trials were at high risk of bias due to unblinded outcome assessors.
Incomplete outcome data
Many studies suffered from high losses to follow‐up and missing data, particularly data used for calculating follow‐up cholesterol levels or risk scores. Moreover, few studies performed intention‐to‐treat analyses. Only 13 trials adequately addressed incomplete data (Bucher 2010; Eaton 2011; Grover 2007; Hall 2003; Hanlon 1995; Holt 2010; Jorgensen 2014; Lopez‐Gonzalez 2015; Montgomery 2003; Peiris 2015; Sheridan 2011; Webster 2010; Wister 2007). We assessed 8 trials as being at unclear risk of bias and 20 trials as being at high risk of bias due to incomplete outcome data.
Selective reporting
Several of the included studies either had protocols available for review or were prospectively registered. The risk of bias associated with selective reporting was low in 15 trials (Benner 2008; Bertoni 2009; British Family Heart 1994; Denig 2014; Holt 2010; Krones 2008; Peiris 2015; Persell 2013; Persell 2015; Price 2011; Sheridan 2006; Sheridan 2011; Webster 2010; Welschen 2012; Williams 2006), unclear in 18 trials, and high in 8 trials.
Other potential sources of bias
Other potential sources of bias are reviewed in detail in the Characteristics of included studies table. Common sources of potential bias included: pharmaceutical funding or potential financial conflicts of interest among study authors (Benner 2008; Cobos 2005; Engberg 2002; Grover 2007; Holt 2010; Lowensteyn 1998; Soureti 2011; Williams 2006); contamination bias (Denig 2014; Grover 2007; Hanlon 1995; Holt 2010; Jacobson 2006; Jorgensen 2014; Persell 2015; Sheridan 2006; Sheridan 2011; Welschen 2012; Wister 2007); and poor fidelity to the intervention protocol (Bertoni 2009; British Family Heart 1994; Denig 2014; Eaton 2011; Mann 2010).
Effects of interventions
See: Table 1
See: Summary of findings for the main outcomes (Table 1).
Primary outcomes
Cardiovascular disease events
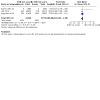
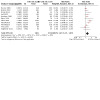
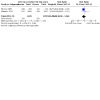
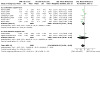
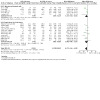
We identified only three RCTs (N = 99,070) that reported the effects of providing CVD risk scores on CVD events (Bucher 2010; Holt 2010; Jorgensen 2014). Among participants in the CVD risk score group, there was low‐quality evidence suggesting little or no effect on CVD events compared with usual care (5.4% versus 5.3%; RR 1.01, 95% CI 0.95 to 1.08; I² = 25%; Analysis 1.1). Notably, study authors from two of these trials reported being underpowered for this endpoint because of limited recruitment of participants over the age of 50 and low CVD event rates (Holt 2010; Jorgensen 2014). The third trial was in a cohort of people with HIV in Switzerland (Bucher 2010). Due to the unique characteristics and limited generalisability of this cohort, we reanalysed data excluding this study; results were unchanged in direction and magnitude (Analysis 1.2).
1.1. Analysis.
Comparison 1: CVD risk score versus no CVD risk score/usual care, Outcome 1: CVD events
1.2. Analysis.
Comparison 1: CVD risk score versus no CVD risk score/usual care, Outcome 2: CVD events, excluding Bucher 2010
Cholesterol level
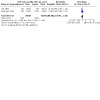
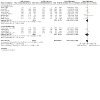
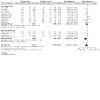
Effects of providing CVD risk scores on cholesterol levels were reported for total cholesterol and LDL cholesterol. We identified 12 RCTs (N = 20,437) that reported the effects of providing CVD risk scores on total cholesterol and were included in the meta‐analysis. There was low‐quality evidence suggesting that providing CVD risk scores may slightly reduce total cholesterol levels compared with usual care (MD −0.10 mmol/L, 95% CI −0.20 to 0.00; I² = 94%; Analysis 1.3). We also identified 10 RCTs (N = 22,122) that reported on the effects of providing CVD risk scores on LDL cholesterol levels. There was uncertainty about the effect of providing CVD risk scores compared with usual care on LDL cholesterol levels (MD −0.03 mmol/L, 95% CI −0.10 to 0.04; I² = 84%; low‐quality evidence; Analysis 1.4); the results were imprecise but similar in direction and magnitude to those for total cholesterol. There was substantial heterogeneity for both outcomes that was not explained by a single trial, so these effect estimates should be interpreted with caution. There was no evidence of publication bias by funnel plot for total cholesterol level (Figure 5). Many of the trials identified in this review reported on achievement of guideline‐recommended cholesterol goals after provision of a CVD risk score. However, this outcome was deemed to be unsuitable for meta‐analysis due to the marked variation in cholesterol goals from different countries, guidelines, and time periods. One pragmatic clinical trial (N = 435) did not use systematic follow‐up procedures after providing CVD risk scores but reported that participants in the CVD risk score group had a greater proportion of repeat LDL cholesterol levels > 30 mg/dL lower than baseline compared with those in the usual care group (22.5% vs. 16.1%, OR 1.59, 95% CI 1.05 to 2.41, P = 0.029; Persell 2013).
1.3. Analysis.
Comparison 1: CVD risk score versus no CVD risk score/usual care, Outcome 3: Total cholesterol
1.4. Analysis.
Comparison 1: CVD risk score versus no CVD risk score/usual care, Outcome 4: Low‐density lipoprotein cholesterol
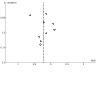
5.
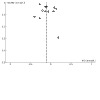
Funnel plot of comparison: 1 CVD risk score versus no CVD risk score/usual care, outcome: 1.3 Total cholesterol (mmol/L).
Blood pressure level
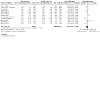
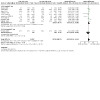
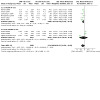
Trials reported the effects of providing CVD risk scores on blood pressure levels for systolic blood pressure, diastolic blood pressure, or both. We identified low‐quality evidence suggesting that providing CVD risk scores may slightly reduce systolic blood pressure compared with usual care (MD −2.77 mmHg, 95% CI −4.16 to −1.38; I² = 93%; 16 trials, N = 32,954; Analysis 1.5). Similarly, we found low‐quality evidence suggesting that providing CVD risk scores may slightly reduce diastolic blood pressure compared with usual care (MD −1.12 mmHg, 95% CI −2.11 to −0.13; I² = 94%; 14 trials, N = 22,378; Analysis 1.6). There was substantial heterogeneity for both outcomes that was not explained by a single trial, so readers should interpret these estimates with caution. There was no evidence of publication bias by funnel plot for systolic blood pressure (Figure 6). Of note, there were two RCTs that reported the effects of providing CVD risk scores on systolic and diastolic blood pressures, but we did not pool them because of insufficient data (Bucher 2010; Hanon 2000). Neither trial found a difference in blood pressure level between the CVD risk score versus usual care groups.
1.5. Analysis.
Comparison 1: CVD risk score versus no CVD risk score/usual care, Outcome 5: Systolic blood pressure
1.6. Analysis.
Comparison 1: CVD risk score versus no CVD risk score/usual care, Outcome 6: Diastolic blood pressure
6.
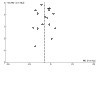
Funnel plot of comparison: 1 CVD risk score versus no CVD risk score/usual care, outcome: 1.5 Systolic blood pressure (mmHg).
Multivariable CVD risk
In total, 17 RCTs (N = 29,119) reported on the effects of providing CVD risk scores on multivariable CVD risk (a summary measure that incorporated changes in multiple different CVD risk factor levels simultaneously). The scale of this measure varied among studies. Moreover, some studies compared final values between the two treatment groups while others compared change from baseline values. We elected to calculate standardised mean differences (SMDs) for change from baseline values for the CVD risk score group and the usual care comparator for our main outcomes. We identified low‐quality evidence suggesting that providing CVD risk scores may slightly reduce multivariable CVD risk compared with usual care (SMD −0.21, 95% CI −0.39 to −0.02; I² = 94%; 9 trials, N = 9549; Analysis 1.7). There was substantial heterogeneity that was not explained by a single trial, so readers should interpret these estimates with caution. There was no evidence of publication bias by funnel plot (Figure 7). We also meta‐analysed studies that compared final values for multivariable CVD risk estimates between the intervention and comparison groups and observed similar findings (SMD −0.15, 95% CI −0.25 to −0.06; Analysis 5.1).
1.7. Analysis.
Comparison 1: CVD risk score versus no CVD risk score/usual care, Outcome 7: Change in multivariable CVD risk
7.
Funnel plot of comparison: 1 CVD risk score versus no CVD risk score/usual care, outcome: 1.7 Change in multivariable CVD risk.
5.1. Analysis.
Comparison 5: Multivariable CVD risk, Outcome 1: Multivariable CVD risk
Five trials reported the effects of the intervention on multivariable CVD risk, but we did not pool these in the meta‐analyses because of how they reported data (British Family Heart 1994, Bucher 2010; Hetlevik 1999; Price 2011; Zullig 2014). One of these trials demonstrated a reduction in multivariable CVD risk with the provision of a CVD risk score (British Family Heart 1994). This cluster‐RCT randomised 12,472 men and women in 13 towns in Britain to a nurse‐led screening and counselling programme based on Dundee score (a measure of coronary heart disease risk) or usual care. After one year, the intervention reduced the Dundee risk score by 16.1% (95% CI 10.9% to 21.1%) in men and 15.7% (95% CI 7.4% to 23.3%) in women compared with usual care. The other four studies (N = 6626), however, did not find that provision of a CVD risk score changed multivariable CVD risk (Bucher 2010; Hetlevik 1999; Price 2011; Zullig 2014).
Adverse events
There were four RCTs (N = 4630) that reported on adverse events after providing a CVD risk score (Benner 2008; Grover 2007; Price 2011; Turner 2012). Definition of adverse events varied between studies and included back pain, headache, cough, upper respiratory infection, musculoskeletal pain, and anxiety. There was low‐quality evidence suggesting that providing a CVD risk score may reduce adverse events compared with usual care, but the results were imprecise (1.9% versus 2.7%; RR 0.72, 95% CI 0.49 to 1.04; I² = 0%; Analysis 1.8). There were three RCTs (N = 968) that specifically reported on the effect of the CVD risk scores on anxiety (Montgomery 2000; Van Steenkiste 2007; Welschen 2012). Two measured anxiety as a continuous variable and observed that providing CVD risk scores may have little to no effect on anxiety compared with usual care (SMD −0.07, 95% CI −0.27 to 0.13; I² = 0%; 2 studies, N = 388; low‐quality evidence; Analysis 1.9). We did not include Van Steenkiste 2007 in meta‐analysis due to insufficient reporting of data but observed no difference in the proportion of anxious participants who received a CVD score versus usual care (16% vs 16%, P value not provided). Lastly, one trial measured psychological distress in middle‐aged participants who received a CVD risk assessment (with or without primary care physician follow‐up) compared with usual care (Christensen 2004). This trial found no difference in psychological distress at one and five years between participants in the two treatment groups that received a CVD risk assessment compared with those in the usual care group (P = 0.466 at one year and P = 0.579 at five years).
1.8. Analysis.
Comparison 1: CVD risk score versus no CVD risk score/usual care, Outcome 8: Adverse events (investigator defined)
1.9. Analysis.
Comparison 1: CVD risk score versus no CVD risk score/usual care, Outcome 9: Anxiety
Secondary outcomes
Medication prescriptions in higher risk individuals
New or intensified lipid‐lowering medications
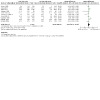
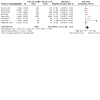
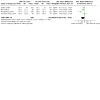
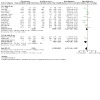
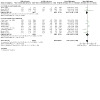
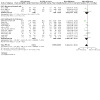
We identified low‐quality evidence suggesting that providing CVD risk scores may increase prescriptions for new or intensified lipid‐lowering medications in higher risk people compared with usual care (15.7% versus 10.7%; RR 1.47, 95% CI 1.15 to 1.87; I² = 40%; 11 trials, N = 14,175; Analysis 1.10). There was substantial heterogeneity among studies that was not explained by a single trial, so readers should interpret these estimates with caution.
1.10. Analysis.
Comparison 1: CVD risk score versus no CVD risk score/usual care, Outcome 10: New/intensified lipid‐lowering medication
Four additional studies reported the effects of providing a CVD risk score on lipid‐lowering medication prescribing compared with usual care, but we did not include them in the meta‐analysis because they did not report sufficient data to determine which higher‐risk participants received a lipid‐lowering medication (Bertoni 2009; Cobos 2005; Krones 2008; Webster 2010). None of these studies reported a change in lipid‐lowering medication prescribing. In Bertoni 2009, use of a CVD risk score‐based decision support tool increased "guideline‐concordant lipid‐lowering therapy" compared with passive dissemination of an unrelated guideline (9.7%, 95% CI 2.8% to 16.6%), but this was primarily driven by a reduction in inappropriate prescribing in lower risk individuals. Authors reported no difference in appropriate lipid‐lowering medication prescribing rates (P = 0.37) (Bertoni 2009). Similarly, in Cobos 2005, a computerised decision‐support tool that provided a personalised CVD risk score decreased inappropriate statin prescribing (primarily in lower risk individuals) but did not increase guideline‐recommended statin prescribing compared with usual care. In Krones 2008, the authors reported no difference in the proportion of participants with CVD risk >15% who were treated with preventive medications between the CVD risk score group and the usual care comparator but formal statistical testing was not presented. Lastly, in Webster 2010, there was no difference in new or increased lipid‐lowering medication prescribing in a group of Australian adults randomised to a web‐based decision support tool (percent difference −1.6%, 95% CI −3.57 to 0.57, P = 0.15), but insufficient data were available to determine risk status of participants who received therapy.
New or intensified antihypertensive medications
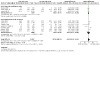
We identified low‐quality evidence that providing CVD risk scores may increase new or intensified antihypertensive medications compared with usual care (17.2% versus 11.4%; RR 1.51, 95% CI 1.08 to 2.11, I² = 53%; 8 studies, N = 13,255; Analysis 1.11). There was substantial heterogeneity among studies that was not explained by a single trial, so readers should interpret these estimates with caution. We did not pool three studies reporting the effects of providing CVD risk scores on antihypertensive medication prescribing in the meta‐analysis because they did not provide sufficient information to determine which high‐risk participants were prescribed antihypertensive medications. None of these studies reported a difference in antihypertensive medication prescribing between the two groups (Jacobson 2006; Krones 2008; Montgomery 2003).
1.11. Analysis.
Comparison 1: CVD risk score versus no CVD risk score/usual care, Outcome 11: New/intensified antihypertensive medication
New aspirin prescriptions
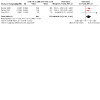
Providing CVD risk scores may increase new aspirin prescribing compared with usual care (RR 2.71, 95% CI 1.24 to 5.91, I² = 0%; 3 studies, N = 1614; Analysis 1.12). We did not pool three additional studies reporting the effect of providing CVD risk scores on aspirin prescribing in the meta‐analysis because it was unclear which participants were at higher risk (Jacobson 2006; Krones 2008), and the trials did not provide data on primary prevention (Peiris 2015). Two of these studies reported no difference in aspirin prescribing in the overall study population (Jacobson 2006; Krones 2008). The other study reported an increase in aspirin prescribing among participants with prevalent CVD (17.8% vs 2.7%; RR 4.79, 95% CI 2.47 to 9.29), but this did not meet the primary prevention focus of this review (Peiris 2015).
1.12. Analysis.
Comparison 1: CVD risk score versus no CVD risk score/usual care, Outcome 12: New aspirin
Medication adherence
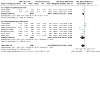
There was uncertainty whether providing CVD risk scores had an effect on medication adherence compared with usual care (RR 1.14, 95% CI 0.92 to 1.41, I² = 58%; 4 studies, N = 621; Analysis 1.13). One additional study (N = 150) reported "no difference" in medication adherence rates between participants randomised to a statin decision support tool but did not provide specific estimates or statistical testing (Mann 2010).
1.13. Analysis.
Comparison 1: CVD risk score versus no CVD risk score/usual care, Outcome 13: Medication adherence
Health behaviours
Smoking
Providing a CVD risk score may increase smoking cessation compared with usual care (RR 1.38, 95% CI 1.13 to 1.69, I² = 0%; 7 studies, N = 5346; Analysis 1.14). There were nine additional studies that reported on the effects of providing CVD risk scores on the prevalence of smoking rates, and results were mixed. Five of these studies reported reductions in smoking prevalence in the CVD risk score group compared with the usual care group (British Family Heart 1994; Jorgensen 2014; Koelewijn‐van Loon 2010; Lopez‐Gonzalez 2015; Van Steenkiste 2007), whereas four studies reported no change in smoking prevalence in the CVD risk score group compared with usual care (Denig 2014; Hetlevik 1999; Price 2011; Zullig 2014). In the only study to biochemically verify smoking status, there was no difference in urine cotinine for participants who received a CVD risk score compared with usual care (SMD −0.53, 95% CI −1.23 to 0.17, P = 0.136; Price 2011).
1.14. Analysis.
Comparison 1: CVD risk score versus no CVD risk score/usual care, Outcome 14: Smoking cessation
Exercise
There were eight RCTs (N = 8391) that reported the effects of providing CVD risk scores on physical activity (Edelman 2006; Hanlon 1995; Koelewijn‐van Loon 2010; Lopez‐Gonzalez 2015; Price 2011; Van Steenkiste 2007; Webster 2010; Wister 2007). Physical activity outcomes varied by studies and included: self‐reported increase in physical activity, number of days exercising > 30 minutes, and proportion meeting physical activity guidelines. Two studies (N = 2595) measured self‐reported increase in physical activity, and demonstrated no evidence that providing a CVD risk score had an effect on this outcome compared with usual care (RR 0.98, 95% CI 0.90 to 1.06, I² = 0%; Analysis 1.15). The remaining 6 RCTs reported mixed results on physical activity. One RCT of 154 participants reported an increase in the number of days with physical activity > 30 minutes (3.7 days in intervention versus 2.4 days in control; P = 0.002; Edelman 2006). Similarly, Lopez‐Gonzalez 2015 reported an increase in self‐reported exercise sessions per week in participants receiving a Framingham risk message compared with usual care: 3.48 sessions (95% CI 3.35 to 3.62) in the Framingham risk message group versus 3.60 sessions (95% CI 3.47 to 3.73) in the usual care group. In Van Steenkiste 2007, authors reported an increase in within‐group physical activity among participants receiving a CVD risk score compared with usual care, but there were marked baseline imbalances between the two treatment groups and follow‐up data were missing from >50% of participants. In contrast, there was no change in physical activity in the CVD risk score group compared with usual care in two RCTs involving 930 participants (Koelewijn‐van Loon 2010; Wister 2007). Only one RCT (N = 198) used an objective measure of physical activity with an accelerometer and showed no difference in total accelerometer counts between those in the CVD risk score group and those in the usual care group (SMD 0.086, 95% CI −0.202 to 0.374, P = 0.559; Price 2011).
1.15. Analysis.
Comparison 1: CVD risk score versus no CVD risk score/usual care, Outcome 15: Exercise
Diet
There were six RCTs (N = 5375) that reported information on the effects of providing CVD risk scores on diet (Hanlon 1995; Koelewijn‐van Loon 2010; Price 2011; Soureti 2011; Webster 2010; Wister 2007). Measures of diet were highly variable with little overlap, so we did not perform quantitative meta‐analysis. Results varied among studies. Two studies reported improvements in heart‐healthy diets after providing a CVD risk score (Hanlon 1995; Wister 2007). In Hanlon 1995, self‐reported increase in fruit and vegetable consumption (24.3% versus 11.6%, P < 0.001) and self‐reported reduction in fat consumption (30.0% versus 9.4%, P < 0.001) was greater in the CVD risk score group compared with usual care (Hanlon 1995). Similarly, in Wister 2007 nutritional level (as measured by a 5‐point ordinal scale based on the number of recommended food groups met per day)was higher in the CVD risk score group compared with the usual care group (0.30, 95% CI 0.13 to 0.47 versus −0.05, 95% CI −0.22 to 0.12; p <0.01; units not provided). In contrast, four studies reported no difference in healthy dietary patterns between the two groups (Koelewijn‐van Loon 2010; Price 2011; Soureti 2011; Webster 2010).
Decisional conflict
We identified evidence suggesting that providing a CVD risk score may reduce decisional conflict compared with usual care (SMD −0.29, 95% CI −0.57 to −0.01, I² = 79%; 4 studies, N = 1261; Analysis 1.16). The effect estimate had substantial heterogeneity that was explained by Montgomery 2003, the study with the largest magnitude reduction in decisional conflict. The direction of the effect was similar, but the magnitude was attenuated when excluding this trial from the analysis (SMD −0.16, 95% CI −0.28 to −0.04, I² = 0%; 3 studies, N = 1049 participants).
1.16. Analysis.
Comparison 1: CVD risk score versus no CVD risk score/usual care, Outcome 16: Decisional conflict
Health‐related quality of life
One trial (N = 308) reported on the effect of providing CVD risk scores on health‐related quality of life, measured by the Dutch Euro quality of life (EQ5D‐NL) scale. There was no evidence to suggest that providing CVD risk scores compared with usual care had an effect on quality of life in this one study (effect size −0.006, 95% CI −0.035 to 0.023, I² = 0%; Denig 2014).
Costs
One trial conducted in Spain reported the effects of providing CVD risk scores on direct costs (Cobos 2005). Providing a CVD risk score to a clinician decreased overall lipid‐lowering medication prescribing rates by decreasing prescriptions in low‐risk individuals. The adjusted mean treatment cost per patient was EUR 237 in the usual care group versus EUR 178 in the intervention group, for a difference of EUR 59 (95% CI 34, 83; P < 0.001), a savings of 25% in treatment costs. Similarly, the adjusted means of the total costs per patient were EUR 283 in the usual care group versus EUR 223 in the intervention group, for a difference of EUR 60 (95% CI 33, 86; P = 0.001), a total savings of 21%. A reduction in lipid‐lowering medication prescribing rates among low‐risk participants was also seen in a quality improvement trial employing a personal digital assistant (PDA) that calculated 10‐year coronary heart disease risk (Bertoni 2009); however, investigators performed no formal cost‐effectiveness analysis. Likewise, British Family Heart 1994 did not perform a formal cost‐effectiveness analysis, but based on the observed risk factor changes and the projected reduction in coronary events, the authors suggested that the modest improvements did not support broader implementation of the intervention.
Subgroup and sensitivity analyses
We performed a subgroup analysis evaluating the effects of providing CVD risk scores on CVD risk factor levels (total cholesterol, LDL‐cholesterol, systolic blood pressure, diastolic blood pressure, and multivariable CVD risk) by use of clinical decision‐support tools to provide CVD risk scores. Results were similar in magnitude and direction, but substantial heterogeneity remained for all analyses (Analysis 2.1; Analysis 2.2; Analysis 2.3; Analysis 2.4; Analysis 2.5).
2.1. Analysis.
Comparison 2: CVD risk score versus no CVD risk score/usual care by decision support use, Outcome 1: Total cholesterol by decision support use
2.2. Analysis.
Comparison 2: CVD risk score versus no CVD risk score/usual care by decision support use, Outcome 2: Low‐density lipoprotein cholesterol by decision support
2.3. Analysis.
Comparison 2: CVD risk score versus no CVD risk score/usual care by decision support use, Outcome 3: Systolic blood pressure by decision support use
2.4. Analysis.
Comparison 2: CVD risk score versus no CVD risk score/usual care by decision support use, Outcome 4: Diastolic blood pressure by decision support use
2.5. Analysis.
Comparison 2: CVD risk score versus no CVD risk score/usual care by decision support use, Outcome 5: Change in multivariable CVD risk by decision support
Due to the substantial heterogeneity observed for CVD risk factor levels, we also performed post hoc subgroup analyses evaluating the effects of providing CVD risk scores by use of health IT and by trials that exclusively enrolled participants with higher risk (defined as 10‐year CVD risk ≥ 10% or a high‐risk condition such as diabetes mellitus). For subgroup analyses by use of health IT, results were similar in magnitude and direction, but substantial heterogeneity remained for all analyses (Analysis 3.1; Analysis 3.2; Analysis 3.3; Analysis 3.4; Analysis 3.5). In contrast, heterogeneity for the effects of providing CVD risk scores on total cholesterol and LDL cholesterol was attenuated when including trials that exclusively enrolled higher‐risk participants (MD −0.13 mmol/L, 95% CI −0.22 to −0.03, I² = 34%; 3 studies, N = 4105 for total cholesterol, Analysis 4.1; and MD −0.07 mmol/L, 95% CI −0.11 to −0.03, I² = 0%; 3 studies, N = 14,219 for LDL cholesterol, Analysis 4.2). This attenuation of heterogeneity was not seen for systolic blood pressure (Analysis 4.3), diastolic blood pressure (Analysis 4.4), or multivariable CVD risk (Analysis 4.5), which may reflect the greater emphasis on risk‐based treatment in cholesterol guidelines compared with blood pressure guidelines.
3.1. Analysis.
Comparison 3: CVD risk score versus no CVD risk score/usual care by health IT use, Outcome 1: Total cholesterol by health IT use
3.2. Analysis.
Comparison 3: CVD risk score versus no CVD risk score/usual care by health IT use, Outcome 2: Low‐density lipoprotein cholesterol by health IT use
3.3. Analysis.
Comparison 3: CVD risk score versus no CVD risk score/usual care by health IT use, Outcome 3: Systolic blood pressure by health IT use
3.4. Analysis.
Comparison 3: CVD risk score versus no CVD risk score/usual care by health IT use, Outcome 4: Diastolic blood pressure by health IT use
3.5. Analysis.
Comparison 3: CVD risk score versus no CVD risk score/usual care by health IT use, Outcome 5: Change in multivariable CVD risk by health IT use
4.1. Analysis.
Comparison 4: CVD risk score versus no CVD risk score/usual care by risk status of participants, Outcome 1: Total cholesterol by risk status
4.2. Analysis.
Comparison 4: CVD risk score versus no CVD risk score/usual care by risk status of participants, Outcome 2: Low‐density lipoprotein cholesterol by risk status
4.3. Analysis.
Comparison 4: CVD risk score versus no CVD risk score/usual care by risk status of participants, Outcome 3: Systolic blood pressure by risk status
4.4. Analysis.
Comparison 4: CVD risk score versus no CVD risk score/usual care by risk status of participants, Outcome 4: Diastolic blood pressure by risk status
4.5. Analysis.
Comparison 4: CVD risk score versus no CVD risk score/usual care by risk status of participants, Outcome 5: Change in multivariable CVD risk by risk status
We did not identify sufficient data to perform subgroup analyses by sex or trial design (RCT versus quasi‐RCT). Additionally, after reading study protocols, it was often unclear whether CVD risk scores were provided directly to patients or to clinicians because frequently CVD risk scores were provided to both within the context of a clinical encounter. We did not perform sensitivity analyses because we assessed all studies as being at unclear or high risk of bias.
Discussion
Summary of main results
The trials identified in this systematic review provide low‐quality evidence that current strategies for providing CVD risk scores in primary prevention may have little to no effect on CVD events compared with usual care. However, only three studies reported this outcome, and all had limitations. Compared with usual care, providing CVD risk scores may reduce CVD risk factors like cholesterol, blood pressure and multivariable CVD risk by a small amount and may reduce adverse events, but results were imprecise. There was substantial heterogeneity for many analyses, particularly when analysing change in risk factor levels. This was likely a result of: diverse risk levels of the participants recruited for the studies; the multifaceted and varying nature of the interventions tested; different baseline medication treatment rates; and the different outcomes collected. Given this heterogeneity, readers should interpret results with caution. Providing CVD risk scores may increase prescriptions for new or intensified lipid‐lowering medications, new or intensified antihypertensive medications, and new aspirin therapy in higher‐risk people. Further, providing CVD risk scores may increase smoking cessation and may reduce decisional conflict compared with usual care. However, providing CVD risk scores may have little to no effect on medication adherence or health‐related quality of life. Measurement of exercise and diet was highly variable among the included studies, and the effects of providing CVD risk scores on these outcomes were mixed. Data on costs were also limited but suggest a reduction in healthcare costs after providing CVD risks scores. Full reporting of effect sizes and quality of evidence ratings for main outcomes are listed in Table 1.
Overall completeness and applicability of evidence
This review provides the most contemporary appraisal of the evidence to date. We identified 73 records of 41 studies (N = 193,614), 8 ongoing studies, and 3 studies awaiting classification. This compares with only four trials (N = 4648) identified in two previous systematic reviews addressing a similar objective and using Cochrane methodology (Brindle 2006; Beswick 2008). We employed broad selection criteria that led to the inclusion of a wide range of trials with different designs, risk levels among participants, and choices of outcomes. CVD risk score interventions also ranged from simple CVD risk score presentations to multifaceted interventions that incorporated different risk messages, clinical decision support tools, electronic reminders, patient activation material, audit and feedback, and nurse‐led counselling sessions. These inclusive selection criteria led to substantial heterogeneity in many of our pooled estimates. However, they also enhance the external validity of our findings due to the varied settings, populations, and interventions studied in the trials. Although many CVD prevention guidelines recommend the use of multivariable CVD risk scores to guide primary prevention treatment strategies (Anderson 2013; NCEP 2002; NICE 2014; Piepoli 2016; Stone 2014; WHO 2007), we identified multiple evidence gaps to guide the application of CVD risk scores in clinical practice. Trials generally had a short‐term focus, had methodological limitations particularly in the domains of attrition bias and detection bias, and were underpowered for clinical endpoints. Given the multifactorial nature of many of the CVD risk score interventions, it is also unclear which component of the intervention was most effective at improving CVD prevention. Thus, there is uncertainty about optimal implementation of CVD risk scores in practice to improve cardiovascular health outcomes.
Quality of the evidence
Using the GRADE framework, we rated the quality of evidence guiding the clinical application of CVD risk scores in primary CVD prevention as low overall. Quality assessments were generally downgraded due to: study limitations across multiple risk of bias domains; inconsistency of results due to the substantial unexplained heterogeneity in pooled estimates; and imprecision. Specifically, we rated the quality of evidence for the effects of providing CVD risk scores on CVD events as low, downgrading due to study limitations and imprecision. We rated the quality of evidence for the effects of providing CVD risk scores on CVD risk factor levels (total cholesterol, systolic blood pressure, and multivariable CVD risk) as low, downgrading due to study limitations and inconsistency. We rated the quality of evidence for the effects of providing CVD risk scores on adverse events as low, downgrading due to study limitations and imprecision. We rated the quality of evidence for the effects of providing CVD risk scores on new or intensified lipid‐lowering medications and antihypertensive medications as low, downgrading due to study limitations and inconsistency.
Potential biases in the review process
Our review has several strengths. First, we followed a pre‐specified, published protocol to guide our systematic review and noted any deviations from this protocol. Second, we conducted a comprehensive, transparent search strategy that was guided by an information specialist (MAB) and that identified published reports, conference abstracts, and clinical trial registers. Third, we included only RCTs or quasi‐RCTs that used a systematic method of allocation to the CVD risk score intervention. Fourth, we performed all title screening, data extraction, and risk of bias assessments in duplicate to minimise bias. Fifth, we used the GRADE framework to rate the quality of evidence and factored this quality assessment to guide our conclusions regarding the effects of providing CVD risk scores.
The principal limitation of this review is the quality of the available data. Nearly all trials (38 out of 41) had high or unclear risk of bias across multiple domains. Moreover, most trials were powered for process outcomes rather than clinical outcomes, were designed for short duration, did not use systematic follow‐up procedures, and delivered CVD risk messages at a single time point only. Trials also varied in terms of design, risk levels of participants, complexity of CVD risk score interventions, content of risk messages, and choice of outcomes. This heterogeneity is demonstrated in the results of our meta‐analysis and should temper confidence in our reported effect estimates. This inconsistency is also reflected in our GRADE quality assessments. Our selection criteria of trials with all or ≥70% primary prevention participants and where only the intervention group received a multivariable CVD risk score led to the exclusion of several well‐known trials that included a majority of participants with established CVD (Cleveringa 2008; Ketola 2001; Weymiller 2007). Other prominent but excluded trials provided a CVD risk score to both treatment groups (Keyserling 2014; Kullo 2016). Nevertheless, we feel that our inclusive definition of a CVD risk score intervention and the methods we used to select and evaluate the evidence outweigh these limitations.
Agreements and disagreements with other studies or reviews
Our results are consistent with prior systematic reviews performed on this topic. Two previous systematic reviews performed with Cochrane methodology identified no strong evidence that CVD risk scores improved health outcomes (Beswick 2008; Brindle 2006). However, both reviews searched literature through 2004 and only included interventions that provided a CVD risk score to clinicians. Therefore, they identified only four studies (N = 4648). In contrast, our search was performed through March 2016 and included CVD risk score assessment provided directly to patients or performed at the health system level. Consequently, we identified a greater number of trials and were able to provide greater detail about the effects of CVD risk scores on a variety of intermediate outcomes and health behaviours. Other systematic reviews have also highlighted that CVD risk scores can increase patients’ intent to start therapy and physicians’ prescribing of cardiovascular medications with no evidence of harm (Sheridan 2008; Sheridan 2010). However, these reviews did not systematically collect or report effects of CVD risk scores on individual risk factor levels or cardiovascular outcomes.
Our results complement the findings of a recently published non‐Cochrane systematic review that evaluated the effect of providing a CVD risk score on clinical outcomes (Usher‐Smith 2015). This review identified 17 trials (N = 19,036) and reported a small reduction in modelled CVD risk (−0.39%, 95% CI −0.71 to −0.07); a trend toward lower mean total or LDL cholesterol (−0.11 mmol/L, 95% CI −0.23 to 0.01); an increase in lipid‐lowering and antihypertensive medication prescribing in high‐risk participants (RR 2.11, 95% CI 1.27 to 3.49 and RR 2.38, 95% CI 1.11 to 5.10, respectively); and mixed effects on smoking cessation, physical activity, and alcohol consumption. Notably, this review did not identify evidence that providing CVD risk scores had an effect on blood pressure level (systolic blood pressure: −0.82 mmHg, 95% CI −2.70 to 1.05; diastolic blood pressure: −0.48 mmHg, 95% CI −1.41 to 0.44). This review, however, has notable limitations. For example, it included non‐randomised, before‐after studies at high risk of selection bias. Additionally, the authors did not use a systematic framework, such as GRADE, to assess the quality of evidence or guide recommendations. Lastly, the authors used restrictive inclusion criteria that led to the exclusion of many contemporary trials that incorporated CVD risk score interventions within complex, multifaceted interventions. Our review addresses many of these limitations by including only RCTs or quasi‐RCTs, using GRADE to assess the quality of evidence, and including trials with multifaceted interventions such as Peiris 2015, where provision of a CVD risk score was just one component of a larger implementation model. Thus, our review may provide a more comprehensive and generalisable assessment of the current state of the science.
Authors' conclusions
Implications for practice.
Due to the low‐quality evidence available, we are unable to draw firm conclusions about the clinical effectiveness of providing CVD risk scores in primary CVD prevention. Providing CVD risk scores may increase lipid‐lowering and blood pressure‐lowering medication prescribing in higher risk people and may have a small effect on reducing cardiovascular risk factor levels; however, there is insufficient high‐quality evidence to determine whether this translates into improved CVD outcomes. For clinical outcomes, not only was there low‐quality evidence, but only three studies reported this endpoint. Much uncertainty remains about the optimal implementation of CVD risk scores in clinical practice to improve cardiovascular health outcomes.
Implications for research.
In spite of the widespread promulgation of CVD risk scores in prevention guidelines, there is low‐quality evidence and several gaps in evidence for guiding implementation in practice. Given the low event rates in primary prevention, it may not be feasible or practical to conduct a study with a large enough size and duration to determine the effects of providing CVD risk scores on CVD outcomes. Future studies should clearly identify how well the intended CVD risk score application was implemented in practice and evaluate its effectiveness in studies powered to identify reductions in causal risk factor levels. Moreover, studies should identify the optimal content and format of CVD risk messages that motivate behaviour change in physicians and patients, assess the impact of providing CVD risk information longitudinally over time, and look beyond initiation of evidence‐based risk‐reducing therapies to address uptake and long‐term adherence to these therapies to achieve risk factor changes and eventual improvements in health outcomes.
What's new
| Date | Event | Description |
|---|---|---|
| 9 June 2021 | Amended | This review has a relatively large evidence base with 41 trials (with over 190,000 participants). Three additional trials are known to be eligible for inclsuion (INTEGRATE, CONNECT, NCT04047147) but have been assessed by the review authors as not changing the overall findings of the review. The review is therefore considered up‐to‐date. |
History
Protocol first published: Issue 1, 2008 Review first published: Issue 3, 2017
Acknowledgements
We acknowledge Karen Rees and Mariana Dyakova for their assistance with the protocol development. We also acknowledge Andrew Beswick, Peter Brindle, Shah Ebrahim, and Tom Fahey, authors of two prior systematic reviews published with Cochrane methodology (Beswick 2008; Brindle 2006). The authors would also like to thank Amelie Yavchitz for assistance with translation of Hanon 2000 and David Prieto‐Merino for statistical advice for the meta‐analysis.
Appendices
Appendix 1. Database search strategies
Cochrane Central Register of Controlled Trials (CENTRAL; 2016, Issue 2) in the Cochrane Library‐Wiley
#1 ((cardiovascular or cv or cvd or coronary or chd or "heart disease") near/3 risk):ti,ab,kw and (risk next (estimat* or assessment* or scor* or equation* or calculat*)):ti,ab,kw
#2 MeSH descriptor: [Cardiovascular Diseases] this term only
#3 (cardiovascular next disease*):ti,ab,kw
#4 MeSH descriptor: [Coronary Disease] this term only
#5 (heart next disease*):ti,ab,kw
#6 (coronary near/2 disease*):ti,ab,kw
#7 (coronary next risk*):ti,ab,kw
#8 (cardiovascular next risk*):ti,ab,kw
#9 MeSH descriptor: [Hypertension] this term only
#10 MeSH descriptor: [Hyperlipidemias] explode all trees
#11 cholesterol:ti,ab,kw
#12 MeSH descriptor: [Arteriosclerosis] explode all trees
#13 (arteriosclerosis or atherosclerosis):ti,ab,kw
#14 {or #2‐#13}
#15 (risk next function*):ti,ab,kw
#16 (risk next equation*):ti,ab,kw
#17 (risk next chart*):ti,ab,kw
#18 (risk near/3 tool*):ti,ab,kw
#19 ("risk assessment" next function*):ti,ab,kw
#20 "risk assessor":ti,ab,kw
#21 (risk next appraisal*):ti,ab,kw
#22 (risk next calculation*):ti,ab,kw
#23 (risk next calculator*):ti,ab,kw
#24 (("risk factor" or "risk factors") next calculator*):ti,ab,kw
#25 (("risk factor" or "risk factors") next calculation*):ti,ab,kw
#26 (risk next engine*):ti,ab,kw
#27 (risk next estimate*):ti,ab,kw
#28 (risk next table*):ti,ab,kw
#29 (risk next threshold*):ti,ab,kw
#30 (risk next disc*):ti,ab,kw
#31 (risk next disk*):ti,ab,kw
#32 ("risk scoring" next (method* or system*)):ti,ab,kw
#33 (scoring next scheme*):ti,ab,kw
#34 (risk next prediction*):ti,ab,kw
#35 ((predictive or prediction or prognostic) next (instrument* or model*)):ti,ab,kw
#36 (project* near/1 risk*):ti,ab,kw
#37 {or #15‐#36}
#38 #14 and #37
#39 #1 or #38
#40 ("new zealand" near/3 (equation* or table* or chart*)):ti,ab,kw
#41 (sheffield next table*):ti,ab,kw
#42 procam:ti,ab,kw
#43 "general rule to enable atheroma treatment":ti,ab,kw
#44 (dundee near/3 (guideline* or risk* or score*)):ti,ab,kw
#45 ("British Family Heart" or "British Regional Heart" or brhs):ti,ab,kw
#46 precard:ti,ab,kw
#47 (framingham near/3 (guideline* or function* or risk or equation or model* or algorithm* or score*)):ti,ab,kw
#48 busselton:ti,ab,kw and (risk*:ti,ab,kw or score*:ti,ab,kw)
#49 (who near/3 erica):ti,ab,kw
#50 (("National Cholesterol Education Program" or NCEP) near/6 guideline*):ti,ab,kw
#51 (("Standing Medical Advisory Committee" or SMAC) near/6 guideline*):ti,ab,kw
#52 (copenhagen near/3 risk*):ti,ab,kw
#53 (aboriginal and (cardio* or coronary) and (risk* or score*)):ti,ab,kw
#54 (("american heart association" or aha) near/3 (risk* or score*)):ti,ab,kw
#55 (("american college of cardiology" or acc) near/3 (risk* or score*)):ti,ab,kw
#56 (aric near/3 (risk or score*)):ti,ab,kw
#57 assign:ti,ab,kw and score*:ti,ab,kw and (cardio*:ti,ab,kw or coronary:ti,ab,kw)
#58 (("adult treatment panel" or atp) near/3 (risk* or score*)):ti,ab,kw
#59 cardiff:ti,ab,kw and (risk:ti,ab,kw or score*:ti,ab,kw) and (cardio*:ti,ab,kw or coronary:ti,ab,kw or vasc*:ti,ab,kw)
#60 "carta del rischio":ti,ab,kw
#61 "cardiovascular event reduction tool":ti,ab,kw
#62 (cha and (cardio* or coronary or vasc*) and (risk or score*)):ti,ab,kw
#63 morgam:ti,ab,kw
#64 "chinese multi‐provincial cohort":ti,ab,kw
#65 ("cardiorisk manager" or "cardio risk manager"):ti,ab,kw
#66 (("diabetes audit" or darts or godarts) and tayside):ti,ab,kw
#67 ("diabetes epidemiology" and "collaborative analysis of diagnostic criteria"):ti,ab,kw
#68 (dubbo and (cardio* or coronary or vasc*)):ti,ab,kw
#69 ((esc or "european society of cardiology") near/3 (risk or score*)):ti,ab,kw
#70 ("family heart study" near/3 (risk or score*)):ti,ab,kw
#71 (finrisk and (cardio* or coronary or vasc*)):ti,ab,kw
#72 (global near/3 ("risk score" or "risk scores")):ti,ab,kw
#73 ("hong kong diabetes" near/3 (risk or score* or equation*)):ti,ab,kw
#74 "progetto cuore":ti,ab,kw
#75 indana:ti,ab,kw
#76 ((jbs2 or jbs3 or jbsrc or jhss) and (risk or score*)):ti,ab,kw
#77 ("johns hopkins" and ("multiple risk" or (risk near/3 (score* or equation*)))):ti,ab,kw
#78 "metabolic syndrome model":ti,ab,kw
#79 (mrfit or "chd prevention model"):ti,ab,kw
#80 "paris prospective study":ti,ab,kw
#81 "personal heart":ti,ab,kw
#82 ((predict next cvd*) or "heart forecast"):ti,ab,kw
#83 (((heart or cardio* or coronary) near/3 (risk or score*)) and predict and "new zealand"):ti,ab,kw
#84 qrisk*:ti,ab,kw
#85 (cvr next pc):ti,ab,kw
#86 regicor:ti,ab,kw
#87 (reynolds and ((risk next assessment*) or (risk next score*))):ti,ab,kw
#88 ("scottish heart health extended cohort" or shhec or stulong or "assign score"):ti,ab,kw
#89 ((ukpds or ulsam) near/3 (risk or score*)):ti,ab,kw
#90 ("world health organization" near/3 (risk or score*)):ti,ab,kw
#91 ((women* next "health study"):ti,ab,kw or whs:ti,ab,kw or (women* next "health intiative"):ti,ab,kw or whi:ti,ab,kw) and (risk:ti,ab,kw or scor*:ti,ab,kw)
#92 cardiovascular:ti,ab,kw and ("check up study":ti,ab,kw or "uninformed patients":ti,ab,kw)
#93 ("systematic coronary risk evaluation" or (euro next score)):ti,ab,kw
#94 ("pooled cohort" near/3 (risk or scor* or equation*)):ti,ab,kw
#95 {or #40‐#94}
#96 MeSH descriptor: [Decision Support Techniques] explode all trees
#97 MeSH descriptor: [Diagnosis, Computer‐Assisted] explode all trees
#98 MeSH descriptor: [Decision Making, Computer‐Assisted] this term only
#99 MeSH descriptor: [Decision Support Systems, Clinical] this term only
#100 MeSH descriptor: [Algorithms] this term only
#101 (algorithm or algorithms or algorythm or algorythms):ti,ab,kw
#102 (decision next (support or aid)):ti,ab,kw
#103 ((predictive or prediction or prognostic) next model*):ti,ab,kw
#104 (treatment next decision*):ti,ab,kw
#105 (scoring next method*):ti,ab,kw
#106 (prediction* near/3 method*):ti,ab,kw
#107 cdss:ti,ab,kw
#108 {or #96‐#107}
#109 MeSH descriptor: [Risk Factors] this term only
#110 MeSH descriptor: [Risk Assessment] explode all trees
#111 ((risk* near/1 assess*) or risk):ti,ab,kw
#112 (risk next factor*):ti,ab,kw
#113 {or #109‐#112}
#114 #14 and #108 and #113
#115 #14 and #95
#116 #39 or #114 or #115
Ovid MEDLINE(R) 1946 to March Week 1 2016 and Ovid MEDLINE(R) In‐Process & Other Non‐Indexed Citations March 14, 2016
1. ((cardiovascular or cv or cvd or coronary or chd or heart disease) adj3 risk adj (estimat* or assessment* or scor* or equation* or calculat*)).tw.
2. Cardiovascular Diseases/
3. cardiovascular disease*.tw.
4. coronary disease/
5. heart disease*.tw.
6. (coronary adj2 disease*).tw.
7. coronary risk?.tw.
8. cardiovascular risk?.tw.
9. hypertension/
10. exp Hyperlipidemias/
11. cholesterol.tw.
12. exp Arteriosclerosis/
13. (arteriosclerosis or atherosclerosis).tw.
14. or/2‐13
15. risk function.tw.
16. Risk Assessment/mt [Methods]
17. risk functions.tw.
18. risk equation*.tw.
19. risk chart?.tw.
20. (risk adj3 tool*).tw.
21. risk assessment function?.tw.
22. risk assessor.tw.
23. risk appraisal*.tw.
24. risk calculation*.tw.
25. risk calculator*.tw.
26. risk factor* calculator*.tw.
27. risk factor* calculation*.tw.
28. risk engine*.tw.
29. risk estimate*.tw.
30. risk table*.tw.
31. risk threshold*.tw.
32. risk disc?.tw.
33. risk disk?.tw.
34. risk scoring method?.tw.
35. scoring scheme?.tw.
36. risk scoring system?.tw.
37. risk prediction?.tw.
38. predictive instrument?.tw.
39. ((predictive or prediction or prognostic) adj model*).tw.
40. project* risk?.tw.
41. or/15‐40
42. 14 and 41
43. 1 or 42
44. (new zealand adj3 (equation* or table* or chart*)).tw.
45. sheffield table*.tw.
46. procam.tw.
47. General Rule to Enable Atheroma Treatment.tw.
48. (dundee adj3 (guideline* or risk* or score*)).tw.
49. (British Family Heart or British Regional Heart or brhs).tw.
50. precard.tw.
51. (framingham adj3 (guideline* or function* or risk or equation or model* or algorithm* or score*)).tw.
52. busselton.tw. and (risk* or score*).mp.
53. (WHO adj3 ERICA).tw.
54. ((National Cholesterol Education Program or NCEP) adj guideline?).tw.
55. ((Standing Medical Advisory Committee or SMAC) adj guideline?).tw.
56. (copenhagen adj3 risk?).tw.
57. ((aboriginal and (cardio* or coronary)) adj3 (risk* or score*)).tw.
58. ((American Heart Association or AHA) adj3 (risk* or score*)).tw.
59. (("American College of Cardiology" or ACC) adj3 (risk* or score*)).tw.
60. (ARIC adj3 (risk or score*)).tw.
61. (assign and score* and (cardio* or coronary)).tw.
62. ((Adult Treatment Panel or ATP) adj3 (risk* or score*)).tw.
63. (Cardiff and (risk or score*) and (cardio* or coronary or vasc*)).tw.
64. (Carta del Rischio adj3 (risk or score*)).tw.
65. cardiovascular event reduction tool.tw.
66. (CHA and (cardio* or coronary or vasc*) and (risk or score*)).tw.
67. morgam.tw.
68. chinese multi‐provincial cohort.tw.
69. CardioRisk Manager.tw.
70. ((diabetes audit or DARTS or goDARTs) and tayside).tw.
71. "DECODE Study Group".au.
72. (Diabetes Epidemiology and "Collaborative analysis of Diagnostic criteria").tw.
73. (dubbo and (cardio* or coronary or vasc*)).tw.
74. ((ESC or European Society of Cardiology) adj3 (risk or score*)).tw.
75. (Family heart study adj3 (risk or score*)).tw.
76. (finrisk and (cardio* or coronary or vasc*)).tw.
77. (global adj3 risk score*).tw.
78. (hong kong diabetes adj3 (risk or score* or equation*)).tw.
79. progetto cuore.tw.
80. INDANA.tw.
81. ((JBS2 or JBS3 or JBSRC or JHSS) and (risk or score*)).tw.
82. (Johns Hopkins and (multiple risk or (risk adj3 (score* or equation*)))).tw.
83. Metabolic Syndrome Model.tw.
84. (mrfit or chd prevention model).tw.
85. Paris Prospective Study.tw.
86. personal heart.tw.
87. (PREDICT‐CVD* or heart forecast).tw.
88. (((heart or cardio* or coronary) adj3 (risk or score*)) and PREDICT).tw. and new zealand.mp.
89. QRISK?.tw.
90. cvr‐pc.tw.
91. REGICOR.tw.
92. (reynolds and (risk assessment* or risk score*)).tw.
93. (Scottish Heart Health Extended Cohort or SHHEC or STULONG or ASSIGN score).tw.
94. ((UKPDS or ULSAM) adj3 (risk or score*)).tw.
95. (World Health Organization adj3 (risk or score*)).tw.
96. ((Women's Health Study or WHS or Women's Health Intiative or WHI) and (risk or scor*)).tw.
97. (cardiovascular and (check up study or uninformed patients)).tw.
98. ("Systematic Coronary Risk Evaluation" or euro‐score).tw.
99. (pooled cohort adj3 (risk or scor* or equation*)).tw.
100. or/44‐99
101. exp decision support techniques/
102. Diagnosis, Computer‐Assisted/
103. Decision Making, Computer‐Assisted/
104. Decision Support Systems, Clinical/
105. algorithms/
106. algorithm?.tw.
107. algorythm?.tw.
108. decision support?.mp.
109. decision aid.tw.
110. ((predictive or prediction or prognostic) adj model*).tw.
111. treatment decision?.tw.
112. scoring method*.tw.
113. (prediction* adj3 method*).tw.
114. cdss.tw.
115. or/101‐114
116. Risk Factors/
117. exp Risk Assessment/
118. ((risk? adj1 assess*) or risk).tw.
119. risk factor?.tw.
120. or/116‐119
121. 14 and 115 and 120
122. 14 and 100
123. 43 or 121 or 122
124. randomised controlled trial.pt.
125. controlled clinical trial.pt.
126. randomized.ab.
127. placebo.ab.
128. clinical trials as topic.sh.
129. randomly.ab.
130. trial.ti.
131. 124 or 125 or 126 or 127 or 128 or 129 or 130
132. exp animals/ not humans.sh.
133. 131 not 132
134. 123 and 133
Embase 1974 to 15 March 2016; Embase Classic 1947‐1973; Medline 1966 to 15 March 2016 (embase.com)
#118 #117 NOT ('animal'/exp NOT 'human'/exp)
#117 #116 AND [embase]/lim
#116 #114 AND #115
#115 random*:ab,ti OR placebo* OR (double NEXT/1 blind*):ab,ti
#114 #39 OR #112 OR #113
#113 #14 AND #95
#112 #14 AND #106 AND #111
#111 #107 OR #108 OR #109 OR #110
#110 (risk NEXT/1 factor*):ab,ti
#109 (risk* NEAR/1 assess*):ab,ti OR risk:ab,ti
#108 'risk assessment'/de
#107 'risk factor'/de
#106 #96 OR #97 OR #98 OR #99 OR #100 OR #101 OR #102 OR #103 OR #104 OR #105
#105 cdss:ab,ti
#104 (prediction* NEAR/3 method*):ab,ti
#103 (scoring NEXT/1 method*):ab,ti
#102 (treatment NEXT/1 decision*):ab,ti
#101 ((predictive OR prediction OR prognostic) NEXT/1 model*):ab,ti
#100 (decision NEXT/1 (support OR aid)):ab,ti
#99 algorithm:ab,ti OR algorithms:ab,ti OR algorythm:ab,ti OR algorythms:ab,ti
#98 'algorithm'/de
#97 'computer assisted diagnosis'/de
#96 'decision support system'/de
#95 #40 OR #41 OR #42 OR #43 OR #44 OR #45 OR #46 OR #47 OR #48 OR #49 OR #50 OR #51 OR #52 OR #53 OR #54 OR #55 OR #56 OR #57 OR #58 OR #59 OR #60 OR #61 OR #62 OR #63 OR #64 OR #65 OR #66 OR #67 OR #68 OR #69 OR #70 OR #71 OR #72 OR #73 OR #74 OR #75 OR #76 OR #77 OR #78 OR #79 OR #80 OR #81 OR #82 OR #83 OR #84 OR #85 OR #86 OR #87 OR #88 OR #89 OR #90 OR #91 OR #92 OR #93 OR #94
#94 ('pooled cohort' NEAR/3 (risk OR scor* OR equation*)):ab,ti
#93 'systematic coronary risk evaluation':ab,ti OR (euro NEXT/1 score):ab,ti
#92 cardiovascular:ab,ti AND ('check up study':ab,ti OR 'uninformed patients':ab,ti)
#91 (women* NEXT/1 'health study'):ab,ti OR whs:ab,ti OR (women* NEXT/1 'health intiative'):ab,ti OR whi:ab,ti AND (risk:ab,ti OR scor*:ab,ti)
#90 ('world health organization' NEAR/3 (risk OR score*)):ab,ti
#89 ((ukpds OR ulsam) NEAR/3 (risk OR score*)):ab,ti
#88 'scottish heart health extended cohort':ab,ti OR shhec:ab,ti OR stulong:ab,ti OR 'assign score':ab,ti
#87 reynolds:ab,ti AND ((risk NEXT/1 assessment*):ab,ti OR (risk NEXT/1 score*):ab,ti)
#86 regicor:ab,ti
#85 (cvr NEXT/1 pc):ab,ti
#84 qrisk*:ab,ti
#83 ((heart OR cardio* OR coronary) NEAR/3 (risk OR score*)):ab,ti AND predict:ab,ti AND 'new zealand'
#82 (predict NEXT/1 cvd*):ab,ti OR 'heart forecast':ab,ti
#81 'personal heart':ab,ti
#80 'paris prospective study':ab,ti
#79 mrfit:ab,ti OR 'chd prevention model':ab,ti
#78 'metabolic syndrome model':ab,ti
#77 'johns hopkins':ab,ti AND ('multiple risk':ab,ti OR (risk NEAR/3 (score* OR equation*)):ab,ti)
#76 jbs2:ab,ti OR jbs3:ab,ti OR jbsrc:ab,ti OR jhss:ab,ti AND (risk:ab,ti OR score*:ab,ti)
#75 indana:ab,ti
#74 'progetto cuore':ab,ti
#73 ('hong kong diabetes' NEAR/3 (risk OR score* OR equation*)):ab,ti
#72 (global NEAR/3 ('risk score' OR 'risk scores')):ab,ti
#71 finrisk:ab,ti AND (cardio*:ab,ti OR coronary:ab,ti OR vasc*:ab,ti)
#70 ('family heart study' NEAR/3 (risk OR score*)):ab,ti
#69 ((esc OR 'european society of cardiology') NEAR/3 (risk OR score*)):ab,ti
#68 dubbo:ab,ti AND (cardio*:ab,ti OR coronary:ab,ti OR vasc*:ab,ti)
#67 'diabetes epidemiology':ab,ti AND 'collaborative analysis of diagnostic criteria':ab,ti
#66 'diabetes audit':ab,ti OR darts:ab,ti OR godarts:ab,ti AND tayside:ab,ti
#65 'cardiorisk manager':ab,ti OR 'cardio risk manager':ab,ti
#64 'chinese multi‐provincial cohort':ab,ti
#63 morgam:ab,ti
#62 cha:ab,ti AND (cardio*:ab,ti OR coronary:ab,ti OR vasc*:ab,ti) AND (risk:ab,ti OR score*:ab,ti)
#61 'cardiovascular event reduction tool':ab,ti
#60 'carta del rischio':ab,ti
#59 cardiff:ab,ti AND (risk:ab,ti OR score*:ab,ti) AND (cardio*:ab,ti OR coronary:ab,ti OR vasc*:ab,ti)
#58 (('adult treatment panel' OR atp) NEAR/3 (risk* OR score*)):ab,ti
#57 assign:ab,ti AND score*:ab,ti AND (cardio*:ab,ti OR coronary:ab,ti)
#56 (aric NEAR/3 (risk OR score*)):ab,ti
#55 (('american college of cardiology' OR acc) NEAR/3 (risk* OR score*)):ab,ti
#54 (('american heart association' OR aha) NEAR/3 (risk* OR score*)):ab,ti
#53 aboriginal:ab,ti AND (cardio*:ab,ti OR coronary:ab,ti) AND (risk*:ab,ti OR score*:ab,ti)
#52 (copenhagen NEAR/3 risk*):ab,ti
#51 (('standing medical advisory committee' OR smac) NEAR/1 guideline*):ab,ti
#50 (('national cholesterol education program' OR ncep) NEAR/1 guideline*):ab,ti
#49 (who NEAR/3 erica):ab,ti
#48 busselton:ab,ti AND (risk*:ab,ti OR score*:ab,ti)
#47 (framingham NEAR/3 (guideline* OR function* OR risk OR equation OR model* OR algorithm* OR score*)):ab,ti
#46 precard:ab,ti
#45 'british family heart':ab,ti OR 'british regional heart':ab,ti OR brhs:ab,ti
#44 (dundee NEAR/3 (guideline* OR risk* OR score*)):ab,ti
#43 'general rule to enable atheroma treatment':ab,ti
#42 procam:ab,ti
#41 (sheffield NEXT/1 table*):ab,ti
#40 ('new zealand' NEAR/3 (equation* OR table* OR chart*)):ab,ti
#39 #1 OR #38
#38 #14 AND #37
#37 #15 OR #16 OR #17 OR #18 OR #19 OR #20 OR #21 OR #22 OR #23 OR #24 OR #25 OR #26 OR #27 OR #28 OR #29 OR #30 OR #31 OR #32 OR #33 OR #34 OR #35 OR #36
#36 (project* NEAR/1 risk*):ab,ti
#35 ((predictive OR prediction OR prognostic) NEXT/1 (instrument* OR model*)):ab,ti
#34 (risk NEXT/1 prediction*):ab,ti
#33 (scoring NEXT/1 scheme*):ab,ti
#32 ('risk scoring' NEXT/1 (method* OR system*)):ab,ti
#31 (risk NEXT/1 disk*):ab,ti
#30 (risk NEXT/1 disc*):ab,ti
#29 (risk NEXT/1 threshold*):ab,ti
#28 (risk NEXT/1 table*):ab,ti
#27 (risk NEXT/1 estimate*):ab,ti
#26 (risk NEXT/1 engine*):ab,ti
#25 (('risk factor' OR 'risk factors') NEXT/1 calculation*):ab,ti
#24 (('risk factor' OR 'risk factors') NEXT/1 calculator*):ab,ti
#23 (risk NEXT/1 calculator*):ab,ti
#22 (risk NEXT/1 calculation*):ab,ti
#21 (risk NEXT/1 appraisal*):ab,ti
#20 'risk assessor':ab,ti
#19 ('risk assessment' NEXT/1 function*):ab,ti
#18 (risk NEAR/3 tool*):ab,ti
#17 (risk NEXT/1 chart*):ab,ti
#16 (risk NEXT/1 equation*):ab,ti
#15 (risk NEXT/1 function*):ab,ti
#14 #2 OR #3 OR #4 OR #5 OR #6 OR #7 OR #8 OR #9 OR #10 OR #11 OR #12 OR #13
#13 arteriosclerosis:ab,ti OR atherosclerosis:ab,ti
#12 'arteriosclerosis'/exp
#11 cholesterol:ab,ti
#10 'hyperlipidemia'/exp
#9 'hypertension'/de
#8 (cardiovascular NEXT/1 risk*):ab,ti
#7 (coronary NEXT/1 risk*):ab,ti
#6 (coronary NEAR/2 disease*):ab,ti
#5 (heart NEXT/1 disease*):ab,ti
#4 'coronary artery disease'/de
#3 (cardiovascular NEXT/1 disease*):ab,ti
#2 'cardiovascular disease'/de
#1 ((cardiovascular OR cv OR cvd OR coronary OR chd OR 'heart disease') NEAR/3 risk):ab,ti AND (risk NEXT/1 (estimat* OR assessment* OR scor* OR equation* OR calculat*)):ab,ti
Conference Proceedings Citation Index‐ Science (CPCI‐S; 1990 to 15 March 2016) via Web of Science
#13 #12 AND #11
#12 TS=(random* or blind* or allocat* or assign* or trial* or placebo* or crossover* or cross‐over* or group*)
#11 #5 OR #9 OR #10
#10 #2 AND #6
#9 #2 AND #7 AND #8
#8 TS=(risk* NEAR/1 (assess* OR factor*)) OR TS=risk
#7 TS=(decision NEAR/1 (support OR aid)) OR TS=("computer assisted" NEAR/3 (diagnosis OR decision)) OR TS=(algorithm OR algorithms OR algorythm OR algorythms) OR TS=((predictive OR prediction OR prognostic) NEAR/1 model*) OR TS=(treatment NEAR/1 decision*) OR TS=(scoring NEAR/1 method*) OR TS=(prediction* NEAR/3 method*) OR TS=cdss
#6 TS=("new zealand" NEAR/3 (equation* or table* or chart*)) OR TS=(sheffield NEAR/1 table*) OR TS=procam OR TS=("general rule" AND atheroma) OR TS=(dundee NEAR/3 (guideline* or risk* or score*)) OR TS=("British Family Heart" or "British Regional Heart" or brhs) OR TS=precard OR TS=(framingham NEAR/3 (guideline* OR function* OR risk OR equation OR model* OR algorithm* OR score*)) OR TS=(busselton AND (risk* OR score*)) OR TS=(who NEAR/3 erica) OR TS=(("National Cholesterol Education Program" or NCEP) NEAR/6 guideline*) OR TS=(("Standing Medical Advisory Committee" or SMAC) NEAR/6 guideline*) OR TS=(copenhagen NEAR/3 risk*) OR TS=(aboriginal AND (cardio* OR coronary) AND (risk* OR score*)) OR TS=(("american heart association" OR aha) NEAR/3 (risk* OR score*)) OR TS=(("american college" NEAR/2 cardiology) NEAR/3 (risk* OR score*)) OR TS=(aric NEAR/3 (risk OR score*)) OR TS=(assign AND score* AND (cardio* OR coronary)) OR TS=(("adult treatment panel" OR atp) NEAR/3 (risk* OR score*)) OR TS=(cardiff AND (risk OR score*) AND (cardio* OR coronary OR vasc*)) OR TS="carta del rischio" OR TS=("cardiovascular event reduction tool") OR TS=(cha AND (cardio* OR coronary OR vasc*) AND (risk OR score*)) OR TS=morgam OR TS="chinese multi‐provincial cohort" OR TS=("cardiorisk manager" OR "cardio risk manager") OR TS=(("diabetes audit" OR darts OR godarts) AND tayside) OR TS=("diabetes epidemiology" AND ("collaborative analysis" NEAR/2 "diagnostic criteria")) OR TS=(dubbo AND (cardio* OR coronary OR vasc*)) OR TS=((esc OR "european society" NEAR/2 cardiology) NEAR/3 (risk OR score*)) OR TS=("family heart study" NEAR/3 (risk OR score*)) OR TS=(finrisk AND (cardio* OR coronary OR vasc*)) OR TS=(global NEAR/3 ("risk score" OR "risk scores")) OR TS=("hong kong diabetes" NEAR/3 (risk OR score* OR equation*)) OR TS="progetto cuore" OR TS=indana OR TS=((jbs2 OR jbs3 OR jbsrc OR jhss) AND (risk OR score*)) OR TS=("johns hopkins" AND ("multiple risk" OR (risk NEAR/3 (score* OR equation*)))) OR TS="metabolic syndrome model" OR TS=(mrfit OR "chd prevention model") OR TS="paris prospective study" OR TS="personal heart" OR TS=((predict NEAR/1 cvd*) OR "heart forecast") OR TS=(((heart OR cardio* OR coronary) NEAR/3 (risk OR score*)) AND predict AND "new zealand") OR TS=(qrisk*) OR TS=(cvr NEAR/1 pc) OR TS=regicor OR TS=(reynolds AND (risk NEAR/1 (assessment* OR score*))) OR TS=("scottish heart health extended cohort" OR shhec OR stulong OR "assign score") OR TS=((ukpds OR ulsam) NEAR/3 (risk OR score*)) OR TS=("world health organization" NEAR/3 (risk OR score*)) OR TS=(((women* NEAR/1 "health study") OR whs OR (women* NEAR/1 "health intiative") OR whi) AND (risk OR scor*)) OR TS=(cardiovascular AND ("check up study" OR "uninformed patients")) OR TS=("systematic coronary risk evaluation" OR (euro NEAR/1 score)) OR TS=("pooled cohort" NEAR/3 (risk OR scor* OR equation*))
#5 #1 OR #4
#4 #2 AND #3
#3 TS=(risk NEAR/1 (function* OR equation* OR chart* OR appraisal* OR calculation* OR calculator* OR engine* OR estimate* OR table* OR threshold* OR disc* OR disk* OR prediction*)) OR TS=("risk assessment" NEAR/1 function*) OR TS=("risk assessor") OR TS=("risk factor*" NEAR/1 (calculator* OR calculation*)) OR TS=("risk scoring" NEAR/1 (method* or system*)) OR TS=(scoring NEAR/1 scheme*) OR TS=((predictive OR prediction OR prognostic) NEAR/1 (instrument* or model*)) OR TS=(project* NEAR/1 risk*)
#2 TS=("cardiovascular disease*") OR TS=((heart OR coronary) NEAR/2 disease*) OR TS=((coronary OR cardiovascular) NEAR/1 risk*) OR TS=(hypertension OR hyperlipidemia OR cholesterol OR arteriosclerosis OR atherosclerosis)
#1 TS=((cardiovascular OR cv OR cvd OR coronary OR chd OR "heart disease") NEAR/3 risk) AND TS=(risk NEAR/1 (estimat* OR assessment* OR scor* OR equation* OR calculat*))
Clinicaltrials.gov
clinicaltrials.gov/ct2/home
Advanced Search on 16 March 2016
Search Terms: risk AND (calculator OR calculation OR equation or score OR scoring)
Study Type: Interventional Studies
Conditions: cardiovascular OR atherosclerosis OR coronary
World Health Organization International Clinical Trials Registry Platform (WHO ICTRP)
apps.who.int/trialsearch
Advanced Search on 16 March 2016
Title: risk AND calculator OR risk AND calculation OR risk AND equation or risk AND score OR risk AND scoring
Condition: cardiovascular OR atherosclerosis OR coronary
Recruitment Status: ALL
Data and analyses
Comparison 1. CVD risk score versus no CVD risk score/usual care.
| Outcome or subgroup title | No. of studies | No. of participants | Statistical method | Effect size |
|---|---|---|---|---|
| 1.1 CVD events | 3 | 99070 | Risk Ratio (IV, Fixed, 95% CI) | 1.01 [0.95, 1.08] |
| 1.2 CVD events, excluding Bucher 2010 | 2 | 95708 | Risk Ratio (IV, Fixed, 95% CI) | 1.01 [0.94, 1.08] |
| 1.3 Total cholesterol | 12 | 20437 | Mean Difference (IV, Random, 95% CI) | ‐0.10 [‐0.20, 0.00] |
| 1.4 Low‐density lipoprotein cholesterol | 10 | 22122 | Mean Difference (IV, Random, 95% CI) | ‐0.03 [‐0.10, 0.04] |
| 1.5 Systolic blood pressure | 16 | 32954 | Mean Difference (IV, Random, 95% CI) | ‐2.77 [‐4.16, ‐1.38] |
| 1.6 Diastolic blood pressure | 14 | 22378 | Mean Difference (IV, Random, 95% CI) | ‐1.12 [‐2.11, ‐0.13] |
| 1.7 Change in multivariable CVD risk | 9 | 9549 | Std. Mean Difference (IV, Random, 95% CI) | ‐0.21 [‐0.39, ‐0.02] |
| 1.8 Adverse events (investigator defined) | 4 | 4630 | Risk Ratio (IV, Fixed, 95% CI) | 0.72 [0.49, 1.04] |
| 1.9 Anxiety | 2 | 388 | Std. Mean Difference (IV, Fixed, 95% CI) | ‐0.07 [‐0.27, 0.13] |
| 1.10 New/intensified lipid‐lowering medication | 11 | 14175 | Risk Ratio (IV, Random, 95% CI) | 1.47 [1.15, 1.87] |
| 1.11 New/intensified antihypertensive medication | 8 | 13255 | Risk Ratio (IV, Random, 95% CI) | 1.51 [1.08, 2.11] |
| 1.12 New aspirin | 3 | 1614 | Risk Ratio (IV, Fixed, 95% CI) | 2.71 [1.24, 5.91] |
| 1.13 Medication adherence | 4 | 621 | Risk Ratio (IV, Random, 95% CI) | 1.14 [0.92, 1.40] |
| 1.14 Smoking cessation | 7 | 5346 | Risk Ratio (IV, Fixed, 95% CI) | 1.38 [1.13, 1.69] |
| 1.15 Exercise | 2 | 2595 | Risk Ratio (IV, Fixed, 95% CI) | 0.98 [0.90, 1.06] |
| 1.16 Decisional conflict | 4 | 1261 | Std. Mean Difference (IV, Random, 95% CI) | ‐0.29 [‐0.57, ‐0.01] |
Comparison 2. CVD risk score versus no CVD risk score/usual care by decision support use.
| Outcome or subgroup title | No. of studies | No. of participants | Statistical method | Effect size |
|---|---|---|---|---|
| 2.1 Total cholesterol by decision support use | 12 | 20437 | Mean Difference (IV, Random, 95% CI) | ‐0.10 [‐0.20, 0.00] |
| 2.1.1 Decision support use | 8 | 9444 | Mean Difference (IV, Random, 95% CI) | ‐0.09 [‐0.20, 0.01] |
| 2.1.2 No decision support use | 4 | 10993 | Mean Difference (IV, Random, 95% CI) | ‐0.11 [‐0.27, 0.06] |
| 2.2 Low‐density lipoprotein cholesterol by decision support | 10 | 22122 | Mean Difference (IV, Random, 95% CI) | ‐0.03 [‐0.10, 0.04] |
| 2.2.1 Decision support use | 9 | 21739 | Mean Difference (IV, Random, 95% CI) | ‐0.02 [‐0.10, 0.06] |
| 2.2.2 No decision support use | 1 | 383 | Mean Difference (IV, Random, 95% CI) | ‐0.11 [‐0.25, 0.03] |
| 2.3 Systolic blood pressure by decision support use | 16 | 32954 | Mean Difference (IV, Random, 95% CI) | ‐2.77 [‐4.16, ‐1.38] |
| 2.3.1 Decision support use | 13 | 22457 | Mean Difference (IV, Random, 95% CI) | ‐2.17 [‐3.52, ‐0.82] |
| 2.3.2 No decision support use | 3 | 10497 | Mean Difference (IV, Random, 95% CI) | ‐4.57 [‐6.89, ‐2.25] |
| 2.4 Diastolic blood pressure by decision support use | 14 | 22378 | Mean Difference (IV, Random, 95% CI) | ‐1.12 [‐2.11, ‐0.13] |
| 2.4.1 Decision support use | 10 | 11385 | Mean Difference (IV, Random, 95% CI) | ‐0.76 [‐1.29, ‐0.23] |
| 2.4.2 No decision support use | 4 | 10993 | Mean Difference (IV, Random, 95% CI) | ‐2.09 [‐3.33, ‐0.85] |
| 2.5 Change in multivariable CVD risk by decision support | 9 | 9549 | Std. Mean Difference (IV, Random, 95% CI) | ‐0.21 [‐0.39, ‐0.02] |
| 2.5.1 Decision support use | 7 | 6209 | Std. Mean Difference (IV, Random, 95% CI) | ‐0.17 [‐0.27, ‐0.07] |
| 2.5.2 No decision support use | 2 | 3340 | Std. Mean Difference (IV, Random, 95% CI) | ‐0.26 [‐0.98, 0.46] |
Comparison 3. CVD risk score versus no CVD risk score/usual care by health IT use.
| Outcome or subgroup title | No. of studies | No. of participants | Statistical method | Effect size |
|---|---|---|---|---|
| 3.1 Total cholesterol by health IT use | 12 | 20437 | Mean Difference (IV, Random, 95% CI) | ‐0.10 [‐0.20, 0.00] |
| 3.1.1 Health IT use | 8 | 9444 | Mean Difference (IV, Random, 95% CI) | ‐0.09 [‐0.20, 0.01] |
| 3.1.2 No health IT use | 4 | 10993 | Mean Difference (IV, Random, 95% CI) | ‐0.11 [‐0.27, 0.06] |
| 3.2 Low‐density lipoprotein cholesterol by health IT use | 10 | 22122 | Mean Difference (IV, Random, 95% CI) | ‐0.03 [‐0.10, 0.04] |
| 3.2.1 Health IT use | 9 | 21739 | Mean Difference (IV, Random, 95% CI) | ‐0.02 [‐0.10, 0.06] |
| 3.2.2 No health IT use | 1 | 383 | Mean Difference (IV, Random, 95% CI) | ‐0.11 [‐0.25, 0.03] |
| 3.3 Systolic blood pressure by health IT use | 16 | 32954 | Mean Difference (IV, Random, 95% CI) | ‐2.77 [‐4.16, ‐1.38] |
| 3.3.1 Health IT use | 13 | 22457 | Mean Difference (IV, Random, 95% CI) | ‐2.17 [‐3.52, ‐0.82] |
| 3.3.2 No health IT use | 3 | 10497 | Mean Difference (IV, Random, 95% CI) | ‐4.57 [‐6.89, ‐2.25] |
| 3.4 Diastolic blood pressure by health IT use | 14 | 22378 | Mean Difference (IV, Random, 95% CI) | ‐1.12 [‐2.11, ‐0.13] |
| 3.4.1 Health IT use | 10 | 11385 | Mean Difference (IV, Random, 95% CI) | ‐0.76 [‐1.29, ‐0.23] |
| 3.4.2 No health IT use | 4 | 10993 | Mean Difference (IV, Random, 95% CI) | ‐2.09 [‐3.33, ‐0.85] |
| 3.5 Change in multivariable CVD risk by health IT use | 9 | 9549 | Std. Mean Difference (IV, Random, 95% CI) | ‐0.21 [‐0.39, ‐0.02] |
| 3.5.1 Health IT use | 6 | 5387 | Std. Mean Difference (IV, Random, 95% CI) | ‐0.19 [‐0.26, ‐0.12] |
| 3.5.2 No health IT use | 3 | 4162 | Std. Mean Difference (IV, Random, 95% CI) | ‐0.15 [‐0.69, 0.39] |
Comparison 4. CVD risk score versus no CVD risk score/usual care by risk status of participants.
| Outcome or subgroup title | No. of studies | No. of participants | Statistical method | Effect size |
|---|---|---|---|---|
| 4.1 Total cholesterol by risk status | 12 | 20437 | Mean Difference (IV, Random, 95% CI) | ‐0.10 [‐0.20, 0.00] |
| 4.1.1 High‐risk participants only | 3 | 4105 | Mean Difference (IV, Random, 95% CI) | ‐0.13 [‐0.22, ‐0.03] |
| 4.1.2 Participants of all risk levels | 9 | 16332 | Mean Difference (IV, Random, 95% CI) | ‐0.10 [‐0.23, 0.03] |
| 4.2 Low‐density lipoprotein cholesterol by risk status | 10 | 22122 | Mean Difference (IV, Random, 95% CI) | ‐0.03 [‐0.10, 0.04] |
| 4.2.1 High‐risk participants only | 3 | 14219 | Mean Difference (IV, Random, 95% CI) | ‐0.07 [‐0.11, ‐0.03] |
| 4.2.2 Participants of all risk levels | 7 | 7903 | Mean Difference (IV, Random, 95% CI) | ‐0.01 [‐0.11, 0.09] |
| 4.3 Systolic blood pressure by risk status | 16 | 32954 | Mean Difference (IV, Random, 95% CI) | ‐2.77 [‐4.16, ‐1.38] |
| 4.3.1 High‐risk participants only | 5 | 18375 | Mean Difference (IV, Random, 95% CI) | ‐2.22 [‐4.04, ‐0.40] |
| 4.3.2 Participants of all risk levels | 11 | 14579 | Mean Difference (IV, Random, 95% CI) | ‐2.96 [‐4.68, ‐1.24] |
| 4.4 Diastolic blood pressure by risk status | 14 | 22378 | Mean Difference (IV, Random, 95% CI) | ‐1.12 [‐2.11, ‐0.13] |
| 4.4.1 High‐risk participants only | 3 | 4091 | Mean Difference (IV, Random, 95% CI) | ‐0.90 [‐2.42, 0.63] |
| 4.4.2 Participants of all risk levels | 11 | 18287 | Mean Difference (IV, Random, 95% CI) | ‐1.20 [‐2.26, ‐0.14] |
| 4.5 Change in multivariable CVD risk by risk status | 9 | 9549 | Std. Mean Difference (IV, Random, 95% CI) | ‐0.21 [‐0.39, ‐0.02] |
| 4.5.1 High‐risk participants only | 2 | 4038 | Std. Mean Difference (IV, Random, 95% CI) | ‐0.15 [‐0.21, ‐0.09] |
| 4.5.2 Participants of all risk levels | 7 | 5511 | Std. Mean Difference (IV, Random, 95% CI) | ‐0.22 [‐0.49, 0.05] |
Comparison 5. Multivariable CVD risk.
| Outcome or subgroup title | No. of studies | No. of participants | Statistical method | Effect size |
|---|---|---|---|---|
| 5.1 Multivariable CVD risk | 5 | 1921 | Std. Mean Difference (IV, Fixed, 95% CI) | ‐0.15 [‐0.25, ‐0.06] |
Characteristics of studies
Characteristics of included studies [ordered by study ID]
Benner 2008.
| Study characteristics | ||
| Methods | Cluster‐randomised trial, parallel group (1:1) | |
| Participants | Patients from outpatient clinics in 9 European countries Unit of randomisation: primary care clinic Inclusion criteria: 45–64 years of age with a history of hypertension, systolic blood pressure ≥ 140 mmHg (or ≥ 130 mmHg if renal disease), and a 10‐year risk of coronary heart disease (CHD) ≥ 10% Exclusion criteria: individuals with a history of CHD, diabetes mellitus, fasting plasma glucose > 6.9 mmol/L, or practices that routinely used risk calculators 101 clinics randomised: n = 51 intervention, n = 50 usual care; 1 clinic excluded prior to participant recruitment 1103 participants randomised: n = 565 intervention, n = 538 usual care Mean (SD) age: 56.8 (5.1) years, 14% women, 96% white; no diabetes mellitus |
|
| Interventions | Intervention group:
Comparison group: usual care (risk factor assessment but 10‐year CHD risk not provided) |
|
| Outcomes | Primary outcome: Framingham 10‐year CHD risk at 6 months Secondary outcomes: changes in blood pressure and cholesterol levels; attainment of blood pressure and ATP‐III LDL‐C goals; knowledge; attitude; behaviour; adverse effects Number of clinics analysed: n = 50 intervention, n = 50 usual care Number of participants analysed for safety: n = 563 intervention, n = 533 usual care Number of participants analysed for efficacy: n = 524 intervention, n = 461 usual care Follow‐up: 6 months |
|
| Study funding sources | "This study was sponsored by Pfizer Inc, who were involved in the study design, data collection, data analysis, manuscript preparation and publication decisions." | |
| Notes | Endpoints analysed using mixed effects models to account for clustering Did not meet recruitment target. 91 participants (n = 30 intervention, n = 61 usual care) were excluded from efficacy analyses due to failure of hand‐held electronic devices. |
|
| Risk of bias | ||
| Bias | Authors' judgement | Support for judgement |
| Random sequence generation (selection bias) | Low risk | Computer based algorithm to assign study sites to allocation |
| Allocation concealment (selection bias) | Unclear risk | Method of allocation concealment not reported |
| Blinding of participants and personnel (performance bias) All outcomes | High risk | Physicians unblinded |
| Blinding of outcome assessment (detection bias) All outcomes | High risk | Risk factors in follow‐up were measured by the unblinded physicians |
| Incomplete outcome data (attrition bias) All outcomes | High risk | > 10% excluded due to device failure or loss to follow‐up. Disproportionate loss to follow‐up in usual care and these individuals were excluded from analyses. ITT analysis not performed |
| Selective reporting (reporting bias) | Low risk | All outcomes from protocol were reported |
| Other bias | High risk | Pharmaceutical funding and several investigators had ties to industry |
Bertoni 2009.
| Study characteristics | ||
| Methods | Cluster‐randomised trial, parallel group (1:1) | |
| Participants | 66 primary care practices in North Carolina randomised (n = 32 intervention, n = 34 comparison). 5 practices withdrew before intervention started (3 intervention, 2 comparison). Medical records abstracted from 5057 participants at baseline (n = 2841 intervention, n = 2216 comparison). Inclusion criteria: self‐described primary care practices, staffed by internal medicine or family medicine providers, 3 h driving radius of research site in North Carolina. Exclusion criteria: direct affiliation to medical school or residency programme, practices providing subspecialty care, sites outside of North Carolina Mean age of participants: 46 years, 57% women, 62% non‐Hispanic white, 9% African American; 7% established CVD, 9% diabetes mellitus |
|
| Interventions | Both groups received guideline dissemination, patient education materials, continuing medical education, feedback based on baseline chart audit, and 4 visits for intervention‐specific academic detailing. Intervention group:
Comparison group: no decision support, dissemination of JNC‐7 guidelines, blood pressure measurement devices provided to participants |
|
| Outcomes | Primary outcome: proportion of participants treated appropriately to lipid‐lowering treatment 4 months after intervention Secondary outcomes: proportion of participants with appropriate lipid‐lowering treatment, inappropriate lipid‐lowering treatment, and lipid screening 61 practices analysed (n = 29 intervention; n = 32 comparison) Medical records abstracted from 3821 participants at follow‐up (n = 2010 intervention, n = 1811 comparison) Follow‐up: 1 year |
|
| Study funding sources | Funded by that National Heart, Lung, and Blood Institute, USA | |
| Notes | Endpoints analysed using generalised estimating equations to account for clustering Analyses compared overall prescribing rates in randomly selected participants before and after the intervention but did not follow individual participants Analyses Trial reported a net improvement in appropriate management but this was due to a reduction in inappropriate lipid‐lowering treatment compared with the comparison group. |
|
| Risk of bias | ||
| Bias | Authors' judgement | Support for judgement |
| Random sequence generation (selection bias) | Unclear risk | Method of random sequence generation not reported by authors "Randomization was stratified by practice type and size and blocked" |
| Allocation concealment (selection bias) | Unclear risk | Method of allocation concealment not reported by authors |
| Blinding of participants and personnel (performance bias) All outcomes | High risk | "The intervention was not blinded." |
| Blinding of outcome assessment (detection bias) All outcomes | Low risk | "Abstractors were not informed regarding the practice's intervention arm." |
| Incomplete outcome data (attrition bias) All outcomes | High risk | 2 practices withdrew after randomisation and data were not collected |
| Selective reporting (reporting bias) | Low risk | All outcomes reported in clinical trial registration were reported |
| Other bias | Unclear risk | 46% of practices stopped using the clinical decision support tool |
British Family Heart 1994.
| Study characteristics | ||
| Methods | Cluster‐randomised trial with internal and external comparators | |
| Participants | Men and women from 14 towns in the UK with 2 matched‐practices within each town. Unit of randomisation: general medical practice Inclusion criteria: all men aged 40‐59 years and their partners regardless of age Exclusion criteria: not specified The trial consisted of 2 comparison groups, an internal comparison and an external comparison. Regions were first randomised to the study or usual care (defined as the external comparison group). Within the study region, general medical practices were then randomised to the nurse‐led screening and the CVD risk score intervention or usual care (defined as the internal comparison). Total randomised: 28 practices (n = 14 intervention, n = 14 comparison). Authors did not specify how many practices were in the internal comparison group and how many were in the external comparison group Total participants (n = 12,924): intervention, 2011 men and 1425 women; internal comparison, 2174 men and 1402 women; external comparison, 3519 men and 2393 women Mean (SD) age: 51.5 (5.7) years for men and 49.1 (6.8) years for women; 42% women; 5.1% of men and 1.6% of women reported prior coronary heart disease; 1.8% of men and 0.5% of women reported diabetes mellitus |
|
| Interventions | Intervention group: nurse‐led cardiovascular risk screening and lifestyle intervention:
Comparison group: usual care without nurse‐screening, lifestyle counselling, or communication of Dundee risk score (Note: for analyses, we used comparisons between the intervention group and the internal control group as this was the authors' primary outcome) |
|
| Outcomes | Primary outcome: change in Dundee risk score Secondary outcome: distribution and means of cardiovascular risk factors (systolic blood pressure, diastolic blood pressure, total cholesterol, smoking prevalence); proportion of participants with risk factor levels above prespecified cut‐points Number analysed in follow‐up: 26 practices (13 intervention, 13 comparison) Participants analysed at 1‐year follow‐up: total, n = 12,472; intervention, 1767 men and 1217 women; internal comparison, 2174 men and 1402 women; external comparison, 3519 men and 2393 women Follow‐up: 1 year |
|
| Study funding sources | Public and private sources. "The study was funded by the Family Heart Association with an educational grant from Merck Sharp and Dohme, the family health service authorities and Fife Health Board, Boehringer Mannheim UK, Wessex Regional Health Authority, the Health Education Authority, the Scottish Home and Health Department, and the Department of Health." | |
| Notes | Endpoints analysed using random effects models to account for clustering Data reported separately for men and women by the authors but combined for meta‐analyses in this review Protocol deviation identified by 1 nurse in an intervention practice. An executive committee decided (without sight of data) to discard all data from this intervention practice and therefore to disregard all data from the comparison practice. Authors did not perform a formal cost‐effectiveness analysis but the overall predicted risk reduction of 12% from the intervention was not felt to be cost‐effective. |
|
| Risk of bias | ||
| Bias | Authors' judgement | Support for judgement |
| Random sequence generation (selection bias) | Unclear risk | "All men aged 40‐59 years in each intervention and comparison practice were randomly ordered at the same time within five year age groups. . . [and] randomly divided into two groups: intervention and an internal comparison group" |
| Allocation concealment (selection bias) | High risk | "[W]ithin each age group their households were approached in order" Participants were also recruited after individual practices were randomised. |
| Blinding of participants and personnel (performance bias) All outcomes | High risk | Participants and personnel unblinded |
| Blinding of outcome assessment (detection bias) All outcomes | Unclear risk | Method of outcome assessment not reported |
| Incomplete outcome data (attrition bias) All outcomes | High risk | 14% lost to follow‐up in intervention group; those who did not return were more likely to be smokers and have higher risk factor levels |
| Selective reporting (reporting bias) | Low risk | All outcomes from protocol reported |
| Other bias | High risk | Protocol deviations by 1 nurse in intervention group. Executive committee decided to discard data from the entire practice and the comparator practice. No baseline measurements in comparison groups |
Bucher 2010.
| Study characteristics | ||
| Methods | Cluster‐randomised trial, parallel group (1:1) | |
| Participants | Physicians in the Swiss HIV Cohort Study (SHCS) in Switzerland caring for HIV‐infected participants Unit of randomisation: physician Inclusion criteria: all physicians who were part of the SCHS were eligible. Eligible patients were those registered with the SHCS, not pregnant, aged ≥ 18 years, continuous ART for 90 days prior to baseline and with complete data on CHD risk factors at baseline Exclusion criteria: no additional criteria from above 165 physicians randomised at baseline (n = 80 intervention, n = 85 comparison) 117 physicians included (n = 57 intervention, n = 60 comparison) ‐ 45 physicians were excluded because they did not have any participants with risk factor assessment and 3 physicians did not have any eligible participants 4097 participants eligible at baseline (n = 2097 intervention, n = 2000 comparison) Mean age (IQR): 44 (39‐51) , 30% women, 5% diabetes mellitus, 26% with Framingham risk score (FRS) ≥ 10% |
|
| Interventions | Intervention group: risk profile generated by the data centre for each participant randomised to the intervention group; profile consisted of 10‐year CHD risk as calculated by FRS. Study nurses added the FRS risk profile to the patient chart. Each risk profile also included individualised targets for LDL cholesterol, systolic/diastolic blood pressure. Comparison group: booklet of evidence‐based guidelines for management of CHD risk factors. Guidelines also gave directions on how to approach and motivate lifestyle modifications and how to calculate CHD risk from a website |
|
| Outcomes | Primary outcome: total cholesterol Secondary outcomes: systolic and diastolic blood pressure, Framingham risk score Follow‐up: 12‐18 months 3362 participants analysed at follow‐up (n = 1680 intervention, n = 1682 comparison) |
|
| Study funding sources | Public and private sources. "This trial was funded by a grant from the Swiss National Science Foundation for nested cohort projects. . . and an unrestricted educational grant from Bristol‐Myers Squibb, Baar, Switzerland." | |
| Notes | Primary and secondary outcomes analysed using generalised estimating equations to account for clustering Analyses reporting the effect of the intervention on medication prescribing and CVD events (not mentioned in methods, or in trial registration) |
|
| Risk of bias | ||
| Bias | Authors' judgement | Support for judgement |
| Random sequence generation (selection bias) | Low risk | "Randomized groups were assigned according to a computerized list for each strata generated by a biostatistician not otherwise involved in the trial." |
| Allocation concealment (selection bias) | Low risk | See above |
| Blinding of participants and personnel (performance bias) All outcomes | High risk | "This was an open intervention trial, that is, physicians knew whether they received the intervention or not but were not told what outcomes would be measured." |
| Blinding of outcome assessment (detection bias) All outcomes | Unclear risk | Method used for outcome assessment not provided |
| Incomplete outcome data (attrition bias) All outcomes | Low risk | 80% of participants had a final assessment with data recorded for the primary outcome; ITT analysis performed |
| Selective reporting (reporting bias) | High risk | Trial prospectively registered (NCT00264394). Primary and secondary outcomes reported but medication prescribing outcome not prespecified |
| Other bias | Unclear risk | Analyses for primary and secondary outcomes accounted for clustering but unclear if medication prescribing outcome accounted for clustering |
Christensen 2004.
| Study characteristics | ||
| Methods | Randomised controlled, parallel group (1:1:1) trial | |
| Participants | 1507 middle‐aged (30‐49 years) participants registered in general practice clinics in the district of Ebeltoft, Denmark Inclusion criteria: aged 30‐49 years (by 1 January 1991); registered with a local general practitioner (GP) in Ebeltoft, Denmark Exclusion criteria: none reported Baseline characteristics not provided, 11% were high CVD risk |
|
| Interventions | Participants were randomised into a control group and 2 intervention groups Intervention group 1: health screening + written feedback from GP + optional discussions with GP (n = 502) Intervention group 2: health screening + written feedback from GP + scheduled 45‐min discussion with GP annually (n = 504) Control group: usual care (n = 501) Among those randomised to intervention group 1, 89% (449/502) received a health screening. Among those randomised to intervention group 2, 90% (456/504) received health screening and 88% (443/504) received GP visit. In total, 90% of those in the 2 intervention groups received a cardiovascular risk score. Health screening was performed by laboratory assistants and consisted of cardiovascular risk calculation and categorisation into low, moderate, elevated, or high. Intervention groups were combined for analyses by the authors because there were no differences between the 2 groups. Results were compared to usual care participants who did not receive a CVD risk score |
|
| Outcomes | Psychological distress, measured by GHQ‐12 – measured anxiety/insomnia, depression, social impairment/hypochondria, and social dysfunction Measured at baseline, 1 year, and 5 years Authors report 84.1% follow‐up at 1 year and 79.2% follow‐up at 5 years but few other details on the number of participants analysed in follow‐up |
|
| Study funding sources | Study funded by a combination of Danish public organisations and private industry (i.e. Novo Nordisk, Bayer Denmark, Roche) | |
| Notes | Few trial details provided. No details on baseline characteristics. Psychological distress measured 1 and 5 years after participants received their CVD risk score | |
| Risk of bias | ||
| Bias | Authors' judgement | Support for judgement |
| Random sequence generation (selection bias) | Unclear risk | Method of random sequence generation not reported |
| Allocation concealment (selection bias) | Unclear risk | Method of allocation concealment not reported |
| Blinding of participants and personnel (performance bias) All outcomes | High risk | Participants and personnel not blinded |
| Blinding of outcome assessment (detection bias) All outcomes | Unclear risk | Method of outcome assessment not reported |
| Incomplete outcome data (attrition bias) All outcomes | High risk | 20% missing data for GHQ‐12 at 1 year; 25% missing data for GHQ‐12 at 5 year; ITT analysis reported but not performed |
| Selective reporting (reporting bias) | Unclear risk | Protocol document not available |
| Other bias | High risk | Unlikely that measurement of psychological distress at 1 and 5 years after a CVD risk score intervention is meaningful |
Cobos 2005.
| Study characteristics | ||
| Methods | Cluster‐randomised trial, parallel group (1:1) | |
| Participants | People with hypercholesterolemia recruited from primary care health practices in Catalonia region, Spain Unit of randomisation: primary care health practices Inclusion criteria: total cholesterol level > 200 mg/dL Exclusion criteria: triglycerides > 400 mg/dL or participating in another study within the medical centre 44 primary care health practices randomised (n = 22 intervention, n = 22 comparison). 2 practices withdrew before participants recruited 2191 participants recruited after selection criteria (n = 1046 intervention, n = 1145 comparison) Mean age: 60 years, 57% women, 16% with diabetes mellitus, and 12% with CHD; ~ 50% of participants were previously treated with lipid‐lowering drugs |
|
| Interventions | Intervention group:
Control group: usual care with health promotion pamphlets but no calculation of CHD risk |
|
| Outcomes | ITT analysis performed on the 2191 participants recruited (described above). Per‐protocol analyses also presented in the manuscript Primary outcomes: proportion of participants meeting LDL goals (for CHD, 10‐year CHD risk ≥ 20%, and 10‐year CHD risk < 20%); total direct costs Secondary outcomes: final lipid profile; healthcare resource consumption incurred during the study Mean follow‐up: 12 months |
|
| Study funding sources | "Study supported by the Department of Outcomes Research & Disease Management, Novartis Farmaceutica SA, Spain" | |
| Notes | Endpoints analysed using generalised estimating equations to account for clustering Only 71% of physicians in the intervention group used the decision support tool |
|
| Risk of bias | ||
| Bias | Authors' judgement | Support for judgement |
| Random sequence generation (selection bias) | Low risk | "The randomization table was prepared by the statistician, using blocks of four practices." |
| Allocation concealment (selection bias) | High risk | Randomisation performed using blocks of 4 practices |
| Blinding of participants and personnel (performance bias) All outcomes | High risk | No blinding of personnel or participants |
| Blinding of outcome assessment (detection bias) All outcomes | Unclear risk | Method for outcome assessment not reported |
| Incomplete outcome data (attrition bias) All outcomes | Unclear risk | > 20% missing lipid levels in follow‐up; ITT analysis used but no imputation of missing values |
| Selective reporting (reporting bias) | Unclear risk | Protocol not available |
| Other bias | High risk | Study supported by Novartis and 1 author had industry ties. Approximately 71% of physicians in the intervention group did not use the decision support tool |
Denig 2014.
| Study characteristics | ||
| Methods | Randomised controlled trial, 2 × 2 factorial | |
| Participants | Participants with type 2 diabetes mellitus aged < 65 years managed in primary care setting Inclusion criteria: no additional criteria reported Exclusion criteria: people with myocardial infarction (MI) in preceding year, stroke, heart failure, angina, or terminal illness 344 participants randomised at baseline (n = 225 intervention, n = 119 for usual care group) Mean (SD) age: 61.7 (8.5), 44% women, > 90% white, 100% diabetes mellitus; high‐rate of baseline treatment (76% treated with statin) |
|
| Interventions | Intervention group: decision aid for people with diabetes mellitus that provided individually‐tailored risk information and treatment options for multiple cardiovascular risk factors; the decision‐aid was offered to participants before a regular diabetes mellitus check‐up and to healthcare provider during the consultation Comparison group: usual care For this systematic review, groups randomised to the decision aid, which provided a CVD risk score, were compared to those in the usual care group (who did not receive a decision aid) |
|
| Outcomes | Primary outcome: diabetes empowerment scale Secondary outcome: changes in drug prescription in those with high HbA1c, systolic blood pressure, or LDL; self‐efficacy; satisfaction; negative emotions; and general health status (EQ‐5D); smoking status 306 participants analysed for the study's primary outcome (n = 199 intervention, n = 107 comparison). Not explicitly stated how many were analysed for secondary outcomes obtained from the electronic health record Follow‐up: 6 months before and after intervention |
|
| Study funding sources | Funded by Netherlands Organization for Health Research and Development | |
| Notes | 4 different formats of the decision aid were tested in exploratory analyses but outcomes for participants allocated to any decision aid were combined by the study authors in this manuscript and was similarly done for this systematic review | |
| Risk of bias | ||
| Bias | Authors' judgement | Support for judgement |
| Random sequence generation (selection bias) | Low risk | "A stratified computer generated allocation sequence was used." |
| Allocation concealment (selection bias) | Low risk | "We used a predefined computer algorithm with a blockwise scheme to conceal the allocation process from the healthcare provider." |
| Blinding of participants and personnel (performance bias) All outcomes | High risk | Participants and personnel not blinded |
| Blinding of outcome assessment (detection bias) All outcomes | Unclear risk | High‐risk for patient‐reported outcomes Low‐risk for clinical outcomes (automatic data extraction from database) |
| Incomplete outcome data (attrition bias) All outcomes | Unclear risk | 31 participants excluded (22 intervention vs 9 control); excluded from analysis |
| Selective reporting (reporting bias) | Low risk | All outcomes from protocol reported |
| Other bias | High risk | Randomisation occurred within a practice, increasing the risk for contamination. Decision aid was accessed for 88% (198/225) of intervention participants but only 46% (103/225) of intervention participants received all basic elements of the intervention |
Eaton 2011.
| Study characteristics | ||
| Methods | Cluster‐randomised trial, parallel group (1:1) | |
| Participants | Patients from 30 primary care practices in southeastern New England, USA Inclusion criteria: no additional criteria reported Exclusion criteria: no additional criteria reported in text but PRISMA flow diagram in the paper notes that participants were excluded if they were pregnant, died, or left the practice during the 1 year follow‐up 30 practices randomised (n = 15 intervention, n = 15 comparison) 4105 participants after exclusion criteria (n = 2100 intervention, n = 2000 comparison) Mean (SD) age: 54.0 years (1.1) in intervention group and 52.3 (1.1) in control group; 29% women; 96% white; 20% CHD; 10% diabetes mellitus |
|
| Interventions | Both groups received a 1‐h academic detailing session where ATP‐III guidelines were discussed and pocket guidelines were given Intervention group:
Comparison group: personal digital assistant without decision support |
|
| Outcomes | Primary outcome: proportion of participants screened and treated per 2001 guidelines Follow‐up: 1 year 30 practices analysed (n = 15 intervention, n = 15 comparison) 4105 participants analysed (n = 2100 intervention, n = 2000 comparison) |
|
| Study funding sources | Not reported | |
| Notes | Endpoints analysed using generalised linear mixed models to account for clustering. Only 39% had a Heart Age calculated by clinicians. In post hoc analyses, physicians with above‐median use of the decision support tool were more likely to have their participants meet LDL goals (OR 1.23, 95% CI 1.04 to 1.06) |
|
| Risk of bias | ||
| Bias | Authors' judgement | Support for judgement |
| Random sequence generation (selection bias) | Unclear risk | Method of random sequence generation not reported |
| Allocation concealment (selection bias) | Unclear risk | Method of allocation concealment not reported |
| Blinding of participants and personnel (performance bias) All outcomes | High risk | Participants and personnel not blinded |
| Blinding of outcome assessment (detection bias) All outcomes | Low risk | Chart outcome abstractors blinded to physician and practice |
| Incomplete outcome data (attrition bias) All outcomes | Low risk | No practices lost to follow‐up and ITT analysis performed for primary outcome |
| Selective reporting (reporting bias) | Unclear risk | Protocol document unavailable |
| Other bias | High risk | Low uptake of both patient activation tool among patients and decision support tool among physicians |
Edelman 2006.
| Study characteristics | ||
| Methods | Randomised controlled trial, parallel group (1:1) | |
| Participants | Adults ≥ 45 years without prevalent CVD Inclusion criteria: ≥ 1 cardiovascular risk factors (diabetes mellitus, HTN, dyslipidaemia, smoking, or elevated BMI) Exclusion criteria: history of MI, stroke, heart failure, terminal illness, pregnant women 154 adults enrolled and randomised (n = 77 intervention, n = 77 comparison) Mean (SD) age: 52.2 years (5.2) in intervention group, 53.4 years (4.8) in control group; 81% women, 76% white, 20% African American, 16% diabetes mellitus |
|
| Interventions | Intervention group:
Comparison group: usual care, mailed health assessment (blood test values but CVD risk score not provided) |
|
| Outcomes | Primary outcome: Framingham risk score Secondary outcome: BMI, waist circumference, blood pressure, fasting lipid profile, smoking status, exercise frequency, readiness to increase exercise Follow‐up: baseline, 5 months, and 10 months |
|
| Study funding sources | Center for Medicare and Medicaid Services, Veterans Affairs Health Services Research & Development career development award | |
| Notes | Resource intensive intervention from health coaches with multiple follow‐up meetings | |
| Risk of bias | ||
| Bias | Authors' judgement | Support for judgement |
| Random sequence generation (selection bias) | Unclear risk | Method of random sequence generation not reported |
| Allocation concealment (selection bias) | Unclear risk | Method of allocation concealment not reported |
| Blinding of participants and personnel (performance bias) All outcomes | High risk | Participants and personnel not blinded |
| Blinding of outcome assessment (detection bias) All outcomes | Low risk | "A research assistant blinded to treatment arm assignment measured the data required to calculate FRS at baseline, 5 months, and 10 months." |
| Incomplete outcome data (attrition bias) All outcomes | High risk | > 20% loss to follow‐up |
| Selective reporting (reporting bias) | Unclear risk | Protocol document not available for review |
| Other bias | Low risk | Other sources of bias not identified |
Engberg 2002.
| Study characteristics | ||
| Methods | Randomised controlled trial, parallel group (1:1:1) | |
| Participants | Men and women aged 30‐49 years from primary care clinics in Ebeltoft, Denmark Inclusion criteria: additional criteria not reported Exclusion criteria: none reported 1507 participants randomised (n = 504 health screening + physician discussion, n = 502 health screening only, n = 501 comparison/usual care) Mean age: 40.5 years, 51% women, 100% Danish |
|
| Interventions | Intervention groups: 2 health screenings or 2 health screenings + 45 min follow‐up consultation with general practitioner to discuss health‐related lifestyle goals Comparison group: usual care For the analyses in this review, the "health screening + physician discussion" and "health screening only" groups were combined since both groups received a personalised CVD risk score |
|
| Outcomes | Primary outcome not specified; Danish CVD risk score, BMI, cholesterol level, systolic blood pressure, and diastolic blood pressure reported 1093 participants analysed at 5 years (n = 346 health screening + physician discussion, n = 378 health screening only, n = 369 usual care) Follow‐up: 1 year and 5 years |
|
| Study funding sources | Funded by County Health Insurance office and other private/public sponsors, including Novo Nordisk, ASTRA‐Denmark, Bayer, and Roche | |
| Notes | — | |
| Risk of bias | ||
| Bias | Authors' judgement | Support for judgement |
| Random sequence generation (selection bias) | Unclear risk | Method of random sequence generation not reported |
| Allocation concealment (selection bias) | Low risk | "An employee of Aarhus County who was not otherwise involved in the study carried out the randomization." |
| Blinding of participants and personnel (performance bias) All outcomes | High risk | "Participants were informed by their general practitioner about which intervention they would be offered." |
| Blinding of outcome assessment (detection bias) All outcomes | Unclear risk | Unclear risk of bias for cardiovascular risk factors. High‐risk of bias for patient‐reported outcomes |
| Incomplete outcome data (attrition bias) All outcomes | High risk | 25‐30% loss to follow‐up in all 3 treatment groups by 5 years. No imputation of missing values |
| Selective reporting (reporting bias) | Unclear risk | Primary and secondary outcomes unclear in protocol document |
| Other bias | Unclear risk | Partial funding from pharmaceutical industry. Authors speculate on potential risk of contamination between participants in different treatment groups but attempted to mitigate this risk by allocating cohabitating couples into the same intervention group |
Grover 2007.
| Study characteristics | ||
| Methods | Randomised controlled trial, parallel group (1:1) | |
| Participants | Patients in primary care clinics across 10 provinces in Canada Inclusion criteria:
Exclusion criteria: hypersensitivity to statins, risk of pregnancy, breastfeeding, active liver disease or liver enzyme abnormalities, elevated creatine kinase, elevated triglycerides (> 939 mg/dL), history of pancreatitis, significant renal insufficiency 3053 participants enrolled and randomised (n = 1510 intervention, n = 1543 comparison) Mean age: 56 years, 32% women, 50% diabetes mellitus, 23% CVD |
|
| Interventions | Intervention group: physicians and participants provided with coronary risk profile consisting of a 8‐year CHD risk estimate, cardiovascular age, and age gap; repeat profile provided at 3 months to demonstrate response to therapy and amount of risk reduction Comparison group: usual care |
|
| Outcomes | Primary outcomes: change in LDL‐C level, change in TC/HDL ratio, percentage of participants reaching national lipid targets Secondary outcomes: change in nonlipid risk factors, global 10‐year risk 3053 participants analysed for efficacy outcomes (n = 1510 intervention, n = 1543 comparison) Follow‐up: 1 year |
|
| Study funding sources | Funded by Pfizer Canada and multiple investigators with pharmaceutical industry ties | |
| Notes | Protocol violation noted for 121 participants (n = 56 intervention, n = 65 comparison) | |
| Risk of bias | ||
| Bias | Authors' judgement | Support for judgement |
| Random sequence generation (selection bias) | Unclear risk | Method of random sequence generation not reported |
| Allocation concealment (selection bias) | Low risk | "Randomization was completed at a central coordinating centre" |
| Blinding of participants and personnel (performance bias) All outcomes | High risk | Participants and personnel not blinded |
| Blinding of outcome assessment (detection bias) All outcomes | Unclear risk | Method for outcome assessment not reported |
| Incomplete outcome data (attrition bias) All outcomes | Low risk | 12% loss to follow‐up which was similar in the 2 groups; ITT analysis performed |
| Selective reporting (reporting bias) | Unclear risk | Protocol document not available for review |
| Other bias | High risk | Pharmaceutical funding Potential for contamination bias since randomisation occurred within physician practice (investigators attempted to evaluate for this with sensitivity analyses) Protocol violation noted for 4% of participants (n = 121) |
Hall 2003.
| Study characteristics | ||
| Methods | Quasi‐randomised controlled trial, parallel group (1:1) | |
| Participants | Participants aged 35‐75 years, with type 2 diabetes mellitus and no history of CVD or renal disease attending a specialised diabetes mellitus clinic in the UK Inclusion criteria: not reported Exclusion criteria: not reported 323 participants recruited (n = 162 intervention, n = 161 comparison) Mean age of participants not reported; 48% women; 100% diabetes mellitus |
|
| Interventions | The New Zealand cardiovascular risk score was calculated for all participants Intervention group: CVD risk score was documented on the front of the participant's chart before visit Comparison group: no risk score documentation |
|
| Outcomes | Primary outcome: not specified Outcomes reported: changes in diabetes mellitus treatment, changes in antihypertensive treatment, referral to dietician, risk score mentioned in letter to GP Follow‐up: none |
|
| Study funding sources | Funding source not reported by authors | |
| Notes | — | |
| Risk of bias | ||
| Bias | Authors' judgement | Support for judgement |
| Random sequence generation (selection bias) | High risk | "We allocated patients alternately to experimental and control groups." |
| Allocation concealment (selection bias) | High risk | See above |
| Blinding of participants and personnel (performance bias) All outcomes | High risk | Not blinded |
| Blinding of outcome assessment (detection bias) All outcomes | Unclear risk | Method for outcome assessment not reported |
| Incomplete outcome data (attrition bias) All outcomes | Low risk | All participants included in study were analysed |
| Selective reporting (reporting bias) | Unclear risk | No protocol available for review |
| Other bias | High risk | Small study bias |
Hanlon 1995.
| Study characteristics | ||
| Methods | Randomised controlled trial, parallel group (1:1:1:1:1) | |
| Participants | 1371 employees from 2 Glasgow factories randomised to 5 groups (n = 293 group 1, n = 297 group 2, n = 285 group 3, n = 263 group 4, n = 233 group 5) Inclusion criteria: additional criteria not reported Exclusion criteria: night‐shift workers and workers participating in another cholesterol treatment study 58% of sample were 40‐59 years of age, 9% women |
|
| Interventions | 4 intervention groups:
1 comparison group (internal control): group 5 no health intervention This review reports results for the comparison of group 4 and group 5 |
|
| Outcomes | Outcomes reported: change in Dundee score; plasma cholesterol concentration; diastolic blood pressure, BMI; self‐reported behaviours 1157 employees analysed at 5 months (n = 247 group 1, n = 250 group 2, n = 241 group 3, n = 219 group 4, n = 200 group 5) 1107 employees analysed at 12 months (n = 240 group 1, n = 237 group 2, n = 226 group 3, n = 211 group 4, n = 193 group 5) Follow‐up: baseline, 5 months, and 12 months |
|
| Study funding sources | Scottish Chief Scientist Office | |
| Notes | Authors also compared the effects of the intervention to an external control site that was not randomised. These comparisons were reported in the manuscript but are not presented in this review. Outcomes for changes in risk factors and health behaviours only reported at 5 months |
|
| Risk of bias | ||
| Bias | Authors' judgement | Support for judgement |
| Random sequence generation (selection bias) | Low risk | "[S]ubjects were allocated, by means of computer generated randomisation, to one of five groups." |
| Allocation concealment (selection bias) | Unclear risk | Method of allocation concealment not reported |
| Blinding of participants and personnel (performance bias) All outcomes | High risk | Participants and personnel not blinded |
| Blinding of outcome assessment (detection bias) All outcomes | Unclear risk | Method of outcome assessment not reported |
| Incomplete outcome data (attrition bias) All outcomes | Low risk | ITT analysis performed |
| Selective reporting (reporting bias) | High risk | Protocol not available and no trial registration. 12 month outcomes not reported |
| Other bias | High risk | Potential for contamination bias. "We recognised that subjects in group 5 (internal control) were open to influences from colleagues because the messages given to other participants were being freely discussed in the workplace." |
Hanon 2000.
| Study characteristics | ||
| Methods | Randomised controlled trial, parallel group (1:1) | |
| Participants | 1526 hypertensive participants (aged 18‐75 years) with uncontrolled treated hypertension (systolic blood pressure > 140 mmHg or diastolic blood pressure > 90 mmHg). Number randomised per group not reported Inclusion criteria: same criteria as above Exclusion criteria: pregnancy, diabetes mellitus, severe hypertension, renal or pulmonary disease, psychiatric disease, secondary hypertension Baseline age (SD): 60 years (10); 46% women |
|
| Interventions | All groups were treated with a therapeutic strategy that consisted of fosinopril 20 mg/day for 8 weeks with the possible increase to fosinopril + hydrochlorothiazide at 4 weeks. Participants randomised to the intervention group had their 10‐year Framingham risk information provided to their treating physician. | |
| Outcomes | Primary and secondary outcomes not specified. Outcomes reported include: agreement between calculated risk and estimated risk by general practitioner, blood pressure at week 8 1273 participants analysed but number per group not reported Follow‐up: 8 weeks |
|
| Study funding sources | Not reported. 1 author affiliated with a pharmaceutical company | |
| Notes | Study published in French | |
| Risk of bias | ||
| Bias | Authors' judgement | Support for judgement |
| Random sequence generation (selection bias) | Unclear risk | Randomisation stated but method for random sequence generation not reported |
| Allocation concealment (selection bias) | Unclear risk | Method of allocation concealment not reported |
| Blinding of participants and personnel (performance bias) All outcomes | High risk | Participants not blinded |
| Blinding of outcome assessment (detection bias) All outcomes | Unclear risk | Blinding of outcome assessment not reported |
| Incomplete outcome data (attrition bias) All outcomes | High risk | 1527 randomised but only 1273 analysed; no reasons provided for loss to follow‐up; no imputation |
| Selective reporting (reporting bias) | High risk | Outcomes not prespecified and study not registered |
| Other bias | Unclear risk | Few study details provided in text |
Hetlevik 1999.
| Study characteristics | ||
| Methods | Cluster‐randomised controlled trial, parallel group (1:1) | |
| Participants | People with hypertension from 29 primary care health centres in Sor and Nord‐Trondelag counties in Norway Unit of randomisation: health centre Number recruited: 29 health centres and 2239 participants total (n = 17 health centres with 984 participants in the intervention group; n = 12 health centres with 1255 participants in the comparison group) Mean age: 64 years, 58% women, 100% Norwegian |
|
| Interventions | Intervention group:
Comparison group: usual care |
|
| Outcomes | Outcomes measured: last registered cholesterol, blood pressure, weight (or BMI), number of cigarettes Risk score calculated only if enough information available during the search period Number analysed at 18 month follow‐up: n = 887 intervention, n = 1127 comparison Number analysed after 3 month extension (21 month follow‐up): n = 879 intervention, n = 1119 comparison Follow‐up: 18 months initially, trial extended 3 months due to missing data |
|
| Study funding sources | Norwegian Medical Association with contribution from the foundation promoting general practice in Sor‐Trondelag | |
| Notes | Issues with intervention fidelity: "After 18 months the CDSS had been used, partly or totally, in the treatment of 104 patient in the intervention group." Trial extended by 3 months because of inadequate collection of data at 18 months |
|
| Risk of bias | ||
| Bias | Authors' judgement | Support for judgement |
| Random sequence generation (selection bias) | Unclear risk | Method of random sequence generation not reported |
| Allocation concealment (selection bias) | Unclear risk | Method of allocation concealment not reported |
| Blinding of participants and personnel (performance bias) All outcomes | High risk | Personnel not blinded, and not clear that participants were blinded |
| Blinding of outcome assessment (detection bias) All outcomes | High risk | Outcomes abstracted by primary investigator who was not blinded |
| Incomplete outcome data (attrition bias) All outcomes | High risk | > 90% of participants in both groups were missing data to calculate 10‐year CHD risk at 18 months. The trial was extended by 3 months which decreased this amount to ~ 50% |
| Selective reporting (reporting bias) | Unclear risk | No protocol available for review |
| Other bias | High risk | Trial extended by 3 months due to missing data. Clinicians provided lists of missing participant information and were asked to resolve this. Poor intervention fidelity (CDSS was used partially or totally in the treatment of only 104 participants in the intervention group) |
Holt 2010.
| Study characteristics | ||
| Methods | Randomised controlled trial, parallel group (1:1) | |
| Participants | People aged 50 years and older from primary care practices in West Midlands, UK running the EMIS (Egton Medical Information Systems) LV software Total number randomised: 38,417 (n = 18,912 intervention, n = 19,235 comparison) |
|
| Interventions | Intervention group: receives electronic alert messages identifying participants at high‐risk for CVD, those whose risk factor data is incomplete, and those who may have undiagnosed diabetes mellitus. Health record searched and updated every 24 h. Treatment recommendations not provided. Alerts can be ignored by clinicians Comparison group: usual care. Computer software acquires data from the electronic health record but does not generate an electronic alert for the clinician |
|
| Outcomes | Primary outcome: difference in annual incidence rate of CVD events (composite of CHD, stroke/TIA, myocardial infarction, sudden cardiac death) Secondary outcomes include differences in the proportion of: high‐risk participants identified, participants with missing data, participants with undefined diabetes mellitus status Number analysed at follow‐up: 36,092 (n = 18,021 intervention, n = 18,071 comparison) Follow‐up: 2 years |
|
| Study funding sources | Department of Health PhD Studentship from Warwick Medical School | |
| Notes | User was not obliged to respond to the alert "Recruitment into the study had to be closed before the required number of patients over 50 years could be achieved, due to resource constraints." |
|
| Risk of bias | ||
| Bias | Authors' judgement | Support for judgement |
| Random sequence generation (selection bias) | High risk | "The e‐Nudge software automatically randomised registered patients within each practice to intervention and control arms, depending on whether the last digit of the 10‐digit NHS number was odd or even." |
| Allocation concealment (selection bias) | High risk | See above |
| Blinding of participants and personnel (performance bias) All outcomes | High risk | Physicians were kept unaware of odd/even rule for allocation but an alert would appear each time a patient record was opened Personnel not blinded; unclear if participants were blind |
| Blinding of outcome assessment (detection bias) All outcomes | Low risk | Outcomes assessed by electronic abstraction from medical record |
| Incomplete outcome data (attrition bias) All outcomes | Low risk | 1 practice withdrew from study at 6 months but overall < 10% missing data |
| Selective reporting (reporting bias) | Low risk | Authors clearly report changes to the protocol and outcomes reported match the protocol and trial registration |
| Other bias | High risk | Risk of contamination bias because randomisation was at the individual level, and the same physician may have taken care of participants randomised to intervention and control groups Senior author is the medical director of the software company that provided the e‐Nudge software. Underpowered for primary outcome |
Jacobson 2006.
| Study characteristics | ||
| Methods | Randomised controlled trial, parallel group (1:1) | |
| Participants | People with LDL‐C > 100 mg/dL, no history of CHD or vascular disease, and not currently receiving lipid‐lowering therapy Inclusion criteria: additional criteria not reported Exclusion criteria: people older than 74 years, LDL‐C < 100 mg/dL, charts missing risk factor information used to calculate 10‐year CHD risk Total number of participants randomised: 368 (n = 186 intervention, n = 182 comparison) Mean (SD) age: 58 (9), 72% women, 92% African American, 6% white, 23% diabetes mellitus |
|
| Interventions | Intervention group: charts appended to include 10‐year absolute CHD risk, ATP‐II risk category, and potential treatment options Comparison group: charts appended with ATP‐II LDL‐C targets and consensus targets for blood pressure, BMI, and haemoglobin A1c. No risk information included Both groups received a 1‐h academic detailing session to review the importance of risk assessment in cholesterol management |
|
| Outcomes | Primary outcome: proportion of high‐risk participants who were recommended a statin Secondary outcomes: proportion of moderate‐risk participants who were recommended a statin; proportion of entire cohort receiving lifestyle counselling, intensified blood pressure management, or documentation of risk in chart Total number of participants analysed: 351 (n = 182 intervention, n = 169 comparison) |
|
| Study funding sources | Emory University Medical Care Foundation | |
| Notes | Authors report possible protocol violations and randomisation errors | |
| Risk of bias | ||
| Bias | Authors' judgement | Support for judgement |
| Random sequence generation (selection bias) | High risk | Method of random sequence generation not reported. "Randomization errors" reported by authors |
| Allocation concealment (selection bias) | Unclear risk | Method of allocation concealment not reported |
| Blinding of participants and personnel (performance bias) All outcomes | High risk | No blinding of personnel; unclear if participants were blinded |
| Blinding of outcome assessment (detection bias) All outcomes | Unclear risk | Method of outcome assessment not reported |
| Incomplete outcome data (attrition bias) All outcomes | High risk | Differential loss to follow‐up (greater in control group); ITT analysis not performed |
| Selective reporting (reporting bias) | Unclear risk | No protocol available for review |
| Other bias | High risk | Risk of contamination bias as same physician may have taken care of participants randomised to intervention and control groups |
Jorgensen 2014.
| Study characteristics | ||
| Methods | Randomised controlled trial, parallel group (1:1) | |
| Participants | Danish residents aged 30‐60 years from 11 municipalities in suburban Copenhagen, Denmark 61,301 people originally randomised within the study but 59,993 people met the inclusion criteria at baseline for this analysis Total randomised: 59,993 (n = 11,708 intervention, n = 48,285 comparison) Mean age: not reported, 50% women, 88% Danish |
|
| Interventions | Intervention group: invited for screening, risk assessment, and lifestyle counselling up to 4 times over a 5‐year period; high‐risk individuals were offered additional lifestyle counselling on smoking cessation, diet, and physical activity Comparison group: not invited for screening; formal risk assessment not provided |
|
| Outcomes | Primary outcome: incident ischaemic heart disease Secondary outcome: incident stroke, incident combined ischaemic heart disease and stroke, mortality, and attendance rates Total analysed in follow‐up: 59,616 (n = 11,629 intervention, n = 47,987 comparison) Follow‐up: 10 years |
|
| Study funding sources | Public, private, and industry sources: Danish Research Councils, Health Foundation, Danish Centre for Evaluation and Health Technology Assessment, Copenhagen County, Danish Heart Foundation, Ministry of Health and Prevention, Association of Danish Pharmacies, Augustinus Foundation, Novo Nordisk, Velux Foundation, Becket Foundation, and Ib Henriksens Foundation | |
| Notes | Trial powered for 70% participation rate in the intervention group but only 52% of people in the intervention group accepted the invitation and were examined at baseline Data for risk factor levels not available given the pragmatic study design |
|
| Risk of bias | ||
| Bias | Authors' judgement | Support for judgement |
| Random sequence generation (selection bias) | Low risk | "The 61 301 people were randomised by computer generated random numbers with different randomisation ratios in the different age and sex groups …" *Note for this analysis, 59,313 people met the baseline inclusion criteria. |
| Allocation concealment (selection bias) | Unclear risk | Method of allocation concealment not reported |
| Blinding of participants and personnel (performance bias) All outcomes | High risk | Personnel and participants not blinded to intervention but "neither the control group nor their doctor knew that they formed a control group." |
| Blinding of outcome assessment (detection bias) All outcomes | Low risk | "Use of data from central registers further blinded the assessment of endpoints in relation to randomisation group." |
| Incomplete outcome data (attrition bias) All outcomes | Low risk | < 1% loss to follow‐up of event data |
| Selective reporting (reporting bias) | High risk | Cardiovascular outcomes were not prespecified in the original trial protocol |
| Other bias | High risk | Potential for contamination bias because randomisation was at the participant level |
Koelewijn‐van Loon 2010.
| Study characteristics | ||
| Methods | Cluster‐randomised controlled trial, parallel group (1:1) | |
| Participants | Adults from 25 practices with blood pressure ≥ 140 mmHg or already being treated for high blood pressure, total cholesterol ≥ 6.5 mmol/L or already being treated for high cholesterol, smoking (men ≥ 50 years, women ≥ 55 years), diabetes mellitus, family history of CVD and visible obesity. Unit of randomisation: primary care practice Exclusion criteria: existing CVD, familial hypercholesterolaemia Total randomised: 25 practices with 615 participants (13 practices with 322 participants in the intervention group, 12 practices with 293 participants in the comparison group) Mean age: 57 years, 55% women, 14% diabetes mellitus |
|
| Interventions | Intervention group: received individual 10‐year CVD risk assessment, risk communication via decision aid, motivational interviewing by nurses regarding lifestyle modifications Comparison group: usual care consistent with Dutch guidelines |
|
| Outcomes | Primary outcome: questionnaires to assess fruits and vegetables intake, fat intake, physical exercise, smoking, alcohol consumption; self‐reported adherence to medical treatment; cardiovascular risk factor levels Secondary outcomes: perception of own health behaviour, attitude towards behaviour change, self‐efficacy, risk perception, anxiety, satisfaction Total analysed at follow‐up: 24 practices with 526 participants (13 practices with 264 participants in the intervention group, 11 practices with 258 participants in the comparison group) Follow‐up: baseline, 12 weeks, and 52 weeks |
|
| Study funding sources | The Netherlands Organization for Health Research and Development | |
| Notes | Study includes patient‐reported outcomes only | |
| Risk of bias | ||
| Bias | Authors' judgement | Support for judgement |
| Random sequence generation (selection bias) | Low risk | "An independent statistician performed a central block randomization" |
| Allocation concealment (selection bias) | Low risk | Treatment allocation performed centrally by an independent statistician |
| Blinding of participants and personnel (performance bias) All outcomes | High risk | "Because of the training, nurses could not be blinded. To minimize potential bias, patients were informed about the aim of the study, but not about being part of an intervention or control group." |
| Blinding of outcome assessment (detection bias) All outcomes | Unclear risk | Method of outcome assessment was not reported for all outcomes, but several outcomes were self‐report questionnaires |
| Incomplete outcome data (attrition bias) All outcomes | High risk | Participants with missing data were excluded; ITT analysis not performed |
| Selective reporting (reporting bias) | High risk | Protocol and trial registration reports risk factor levels (cholesterol, blood pressure, and 10‐year CVD risk) as outcomes that would be collected. Protocol also discusses economic analysis but these data are not provided in the published report |
| Other bias | Low risk | Other sources of bias not identified |
Krones 2008.
| Study characteristics | ||
| Methods | Cluster‐randomised controlled trial, parallel group (1:1) | |
| Participants | Adults with measured cholesterol level from 162 primary care practices in Hessen, Germany; recruited from 14 continuing medical education (CME) groups Unit of randomisation: CME group Inclusion criteria: additional criteria not reported Exclusion criteria: CME groups excluded if they participated in previous quality improvement projects Total randomised at baseline: 14 CME groups (N = 1132) Intervention group: 7 CME groups with 44 practices (n = 550) Comparison group: 7 CME groups with 47 practices (n = 582) Mean age: 59 years, 56% women, 97% German nationality, 18% diabetes mellitus, 20% CVD |
|
| Interventions | Intervention group: 2 CME sessions to learn shared decision‐making communication strategies, guideline booklet, paper‐based risk calculator, and individual risk summary sheet for each participant Comparison group: CME unrelated to CVD prevention |
|
| Outcomes | Primary outcomes: relative change in global risk at 6 months, patient participant scale Secondary outcomes: GP prescription behaviour, CV risk status after 6 months Total analysed at follow‐up: Intervention group: 7 CME groups with 40 practices (n = 460) Comparison group: 7 CME groups with 41 practices (n = 466) Follow‐up: baseline, after consultation, at 6 months |
|
| Study funding sources | The study was funded by the German Federal Ministry of Education and Research, grant No. 01GK0401 | |
| Notes | Baseline imbalances with more diabetics and more participants with prior CVD events in the comparison group | |
| Risk of bias | ||
| Bias | Authors' judgement | Support for judgement |
| Random sequence generation (selection bias) | Unclear risk | Method of random sequence generation not reported |
| Allocation concealment (selection bias) | High risk | Physicians recruited participants after cluster‐randomisation "physicians were asked to approach all consecutive patients who had their cholesterol levels measured during a period of 4 weeks" Baseline imbalances between the 2 groups for diabetes mellitus, secondary prevention, and desire to participate in decision‐making |
| Blinding of participants and personnel (performance bias) All outcomes | High risk | "Participating family doctors could not be blinded because of the intervention. Patients were informed that different kinds of risk communication and decision support would be assessed; they were unaware of their physicians’ group allocation, however." |
| Blinding of outcome assessment (detection bias) All outcomes | High risk | "Family doctors provided data on risk factors to calculate a CVD risk score for each patient at baseline and at follow‐up." |
| Incomplete outcome data (attrition bias) All outcomes | Unclear risk | 18% loss to follow‐up. Imputed missing values for individuals missing a single value to calculate 10‐year CVD risk. Large amount of missing data for shared decision‐making questionnaire (but this outcome was not included in this systematic review) |
| Selective reporting (reporting bias) | Low risk | All outcomes reported in trial registration were reported |
| Other bias | Low risk | Other sources of bias not identified |
Lopez‐Gonzalez 2015.
| Study characteristics | ||
| Methods | Randomised controlled trial, parallel group (1:1:1) | |
| Participants | Public sector workers from Spain recruited from an annual work health assessment Inclusion criteria: additional criteria not reported Exclusion criteria: unable to understand medical advice, lacking permanent work contract, failed to attend the 2 scheduled visits ‐ separated by 1 year Total randomised 3153 participants: (n = 1051 intervention group receiving 10‐year Framingham risk score, n = 1045 intervention group receiving heart age, n = 1057 comparison group with conventional medical advice) Mean age: 46 (7.1) years, 52% women |
|
| Interventions | Intervention groups:
Comparison group: conventional medical advice without provision of a CVD risk score |
|
| Outcomes | Outcomes reported: BMI, fasting lipids (total cholesterol, triglycerides, HDL, glucose), blood pressure, self‐reported smoking, self‐reported physical activity. Results for intervention groups 1 and 2 were combined for the analyses reported in this systematic review Number analysed at follow‐up 2844 participants: (n = 955 in group 1, n = 914 in group 2, n = 975 in comparison group) Follow‐up: 1 year |
|
| Study funding sources | Not reported by authors | |
| Notes | Few details provided within the study about the means used for calculating and providing the CVD risk score | |
| Risk of bias | ||
| Bias | Authors' judgement | Support for judgement |
| Random sequence generation (selection bias) | Unclear risk | "Using a computerized random number generator, the 3153 participants were randomly allocated to one of the three study groups" However, marked differences in baseline characteristics raises questions about the adequacy of randomisation |
| Allocation concealment (selection bias) | Unclear risk | Method of allocation concealment not reported |
| Blinding of participants and personnel (performance bias) All outcomes | High risk | "[S]ingle blind design" |
| Blinding of outcome assessment (detection bias) All outcomes | Unclear risk | Method of outcome assessment unclear |
| Incomplete outcome data (attrition bias) All outcomes | Low risk | 10% loss to follow‐up |
| Selective reporting (reporting bias) | Unclear risk | No protocol available for review |
| Other bias | Unclear risk | Risk calculator developed by Unilever. Unclear if this model was validated |
Lowensteyn 1998.
| Study characteristics | ||
| Methods | Cluster‐randomised controlled trial, parallel group (2:1) | |
| Participants | Adults age 30‐74 years without CVD, recruited from 253 physician practices in Quebec, Canada Unit of randomisation: continuing medical education (CME) meeting Inclusion and exclusion criteria: additional criteria not reported Total randomised at baseline: 24 CME meetings with 253 physicians and 958 enrolled participants Intervention group: 16 CME meetings with 170 physicians and 782 enrolled participants Comparison group: 8 CME meetings with 83 comparison group physicians and 176 enrolled participants Mean age 51 years, 35% women |
|
| Interventions | Intervention group: physicians received coronary risk profile (8‐year CHD risk and cardiovascular age) for their participants within 10 working days after the baseline participant assessment Comparison group: usual care, received coronary risk profile at completion of study (after outcomes collected) |
|
| Outcomes | Primary outcome: likelihood of high‐risk vs low‐risk participants being seen at 3‐month follow‐up Secondary outcome: CVD risk factor levels, 8‐year CHD risk Total analysed at follow‐up: 291 participants (n = 202 intervention and n = 89 comparison) Follow‐up: 3 months |
|
| Study funding sources | Grant‐in‐aid from Merck Frosst Canada, Inc | |
| Notes | Authors of the study had a financial stake in the computer risk model used for risk prediction | |
| Risk of bias | ||
| Bias | Authors' judgement | Support for judgement |
| Random sequence generation (selection bias) | Unclear risk | Method of sequence generation not reported by authors, but participants "selected" by physicians after randomisation |
| Allocation concealment (selection bias) | Unclear risk | Method of allocation concealment not reported |
| Blinding of participants and personnel (performance bias) All outcomes | High risk | Participants and personnel not blinded |
| Blinding of outcome assessment (detection bias) All outcomes | Unclear risk | Method of outcome assessment unclear but likely clinicians who were not blinded |
| Incomplete outcome data (attrition bias) All outcomes | High risk | High loss to follow‐up rate. Approximately 70% of participants (667/958) were not reassessed at follow‐up and not included in analyses. Differential loss to follow‐up in intervention group |
| Selective reporting (reporting bias) | Unclear risk | No protocol available for review |
| Other bias | High risk | Study funded by Merck. 4 authors had financial stake in the prediction tool that was developed |
Mann 2010.
| Study characteristics | ||
| Methods | Randomised controlled trial, parallel group (1:1) | |
| Participants | Adult primary care patients with a diagnosis of diabetes mellitus; English‐ or Spanish‐speaking from urban New York Exclusion criteria: additional criteria not reported Total randomised at baseline 150 participants (n = 80 intervention, n = 70 comparison) Mean age: 58 years (SD 11.5), women 73%, 89% Black or Latino, 100% diabetes mellitus |
|
| Interventions | The intervention consisted of a provider‐led discussion of the participant's risk using the Statin Choice tool which provided a 10‐year underlying risk category (average ≤ 15%, elevated = 15%‐30%, or high > 30%), a revised risk with statin therapy, and risks of statin treatment Comparison group: printed material from the American Diabetes Association on how to reduce cholesterol through dietary modifications |
|
| Outcomes | Primary outcomes not specified Outcomes assessed from surveys: statin knowledge, decision Total analysed at follow‐up ‐ not specified by authors |
|
| Study funding sources | Not reported by authors | |
| Notes | There was limited use of the Statin Choice decision support tool by the 46 providers (mean use 1.7 times) Adherence outcome poorly reported: "At 3 and 6 months, 70% and 80% of the participants reported good adherence to statins with no difference between groups." No further details provided |
|
| Risk of bias | ||
| Bias | Authors' judgement | Support for judgement |
| Random sequence generation (selection bias) | Unclear risk | Method of random sequence generation not reported |
| Allocation concealment (selection bias) | Unclear risk | Method of allocation concealment not reported |
| Blinding of participants and personnel (performance bias) All outcomes | High risk | Participants and personnel not blinded to intervention group |
| Blinding of outcome assessment (detection bias) All outcomes | High risk | Self‐reported outcomes |
| Incomplete outcome data (attrition bias) All outcomes | Unclear risk | Not reported |
| Selective reporting (reporting bias) | Unclear risk | Protocol not available |
| Other bias | High risk | Limited use of decision support tool in trial |
Montgomery 2000.
| Study characteristics | ||
| Methods | Cluster‐randomised controlled trial, parallel group (1:1:1) | |
| Participants | Adults aged 60‐79 years with high blood pressure from 27 general practices from UK Unit of randomisation: general practice Exclusion criteria: non‐ambulatory patients, life‐threatening illness, recent major surgery Total randomised at baseline: 27 general practices with 715 participants (n = 269 computerised decision support + risk chart, n = 264 risk chart, n = 182 usual care) Mean age: 71 years, 54% women, 11% diabetes mellitus, 11% history of MI or stroke |
|
| Interventions | Intervention groups:
In the "CVD risk chart" group, CVD risk information was manually extracted by nurses and included in the medical record Comparison group: usual care |
|
| Outcomes | Primary outcome: percentage of participants in each group with 5‐year CVD risk ≥ 10% Secondary outcomes: systolic and diastolic blood pressure, CVD drug prescription Total analysed at 12 months follow‐up 531 participants (n = 202 computerised decision support + risk chart, n = 199 risk chart, n = 1 usual care) Follow‐up: 12 months |
|
| Study funding sources | NHS Wales Office of Research and Development, grant number RC016, NHS Research and Development Primary Care Career Scientist Award | |
| Notes | For the analyses in this systematic review, participants randomised to both intervention groups were combined (both these groups received CVD risk scores) and were compared with usual care (did not receive systematic provision of a CVD risk score) | |
| Risk of bias | ||
| Bias | Authors' judgement | Support for judgement |
| Random sequence generation (selection bias) | Low risk | "Randomisation was performed with a table of random numbers by a researcher not involved in the study and who was blind to the identity of the practices." |
| Allocation concealment (selection bias) | Low risk | See above |
| Blinding of participants and personnel (performance bias) All outcomes | High risk | "Because of the nature of the study, neither the doctors and nurses nor the patients were blind to their study group." |
| Blinding of outcome assessment (detection bias) All outcomes | High risk | Outcome assessors were unblinded clinic staff |
| Incomplete outcome data (attrition bias) All outcomes | High risk | 41% of participants had missing cholesterol data |
| Selective reporting (reporting bias) | Unclear risk | Protocol not available for review |
| Other bias | Low risk | Other sources of bias not identified |
Montgomery 2003.
| Study characteristics | ||
| Methods | Randomised controlled trial, factorial design (2 × 2) | |
| Participants | Adults aged 32‐80 years with newly diagnosed hypertension from South Western UK Exclusion criteria: severe hypertension requiring immediate treatment, secondary hypertension, hypertension associated with pregnancy, dementia Total randomised: n = 217 participants (n = 51 to decision aid + video/leaflet, n = 52 decision aid only, n = 55 video/leaflet only, n = 59 usual care) Mean age: 59 years, 49% women |
|
| Interventions | Intervention group: factorial design with decision support tool ± instructional video and leaflet about cardiovascular risk factors Comparison group: usual care Participants randomised to the decision support tool received a CVD risk score |
|
| Outcomes | Primary outcome: decisional conflict scale Secondary outcomes: subscales of decision conflict scale related to uncertainty and decision quality; intention to start treatment; anxiety; knowledge; treatment decision Total analysed at follow‐up for primary outcome: n = 212 (n = 50 decision aid + video/leaflet, n = 50 decision aid only, n = 54 video/leaflet only, n = 58 usual care) Total analysed at 3‐month follow‐up for secondary outcomes: n = 199 (n = 48 decision aid + video/leaflet, n = 48 decision aid only, n = 51 video/leaflet only, n = 52 usual care) Follow‐up: 3 months for initial study 3‐year extended follow‐up reported in a subsequent study published by Emmert et al. 2005 Total analysed at 3 years follow‐up: n = 188 (n = 87 decision aid, n = 101 no decision aid) |
|
| Study funding sources | Medical Research Council, National Health Service Primary Care Career Scientist Award | |
| Notes | For the analyses in this systematic review, all participants randomised to the decision support tool, which provided a CVD risk score, were combined and compared with participants not randomised to the decision support tool | |
| Risk of bias | ||
| Bias | Authors' judgement | Support for judgement |
| Random sequence generation (selection bias) | Low risk | "The allocation schedule was computer‐generated by an individual not involved in the study and executed by one of the authors (AM), to whom the allocation was concealed in advance by the nature of the minimisation procedure." |
| Allocation concealment (selection bias) | Low risk | See above |
| Blinding of participants and personnel (performance bias) All outcomes | High risk | "Given the nature of the interventions, there was no masking of participants or the researcher administering the interventions (AM)." |
| Blinding of outcome assessment (detection bias) All outcomes | High risk | "Likewise, blinding was not possible for outcome assessment, as this was conducted principally through self‐completion questionnaires." |
| Incomplete outcome data (attrition bias) All outcomes | Low risk | < 10% loss to follow‐up; ITT analysis performed |
| Selective reporting (reporting bias) | Unclear risk | Protocol document not available |
| Other bias | Low risk | Other sources of bias not identified |
Peiris 2015.
| Study characteristics | ||
| Methods | Cluster‐randomised controlled trial, parallel group (1:1) | |
| Participants | Patients from primary care practices in Sydney, Australia and New Zealand who had attended the service 3 or more times in a 24 month period and at least once in a 6 month period. Unit of randomisation: primary care practice Specific inclusion and exclusion criteria not reported Total randomised at baseline: 61 primary care practices with 38,725 participants (n = 31 practices with 19,385 participants in intervention group; n = 30 practices with 19,340 participants in comparison group) Total "high‐risk" participants randomised at baseline: 10,308 participants (n = 5392 intervention group, n = 4916 comparison group) Mean age: 61 years, 58% women, 17% diabetes mellitus, 13% CVD |
|
| Interventions | Intervention group: clinical decision support software, audit and feedback tools, guideline dissemination and staff training. Clinical decision support software presented 5‐year CVD risk information and heart age. Comparison group: usual care |
|
| Outcomes | Primary outcome: proportion of participants who received "appropriate" screening of CVD risk factors by end of study; proportion of high‐risk participants receiving recommended medication prescription Secondary outcomes: CV risk factor levels, incident CVD events, escalation of drug prescriptions in high‐risk people Total analysed at follow‐up: 60 primary care practices (n = 30 intervention group, n = 30 comparison group). 1 practice withdrew from the intervention group shortly after randomisation, but this did not affect number of total participants. Total 'high‐risk' participants analysed at follow‐up: 10,181 participants (n = 5335 intervention group, n = 4846 comparison group) Median follow‐up: 17 months |
|
| Study funding sources | The National Health and Medical Research Council of Australia and the New South Wales Department of Health | |
| Notes | Authors report higher than anticipated intracluster coefficients in their analyses | |
| Risk of bias | ||
| Bias | Authors' judgement | Support for judgement |
| Random sequence generation (selection bias) | Low risk | "Permuted block randomisation was centrally performed using a web‐based form." |
| Allocation concealment (selection bias) | Low risk | See above |
| Blinding of participants and personnel (performance bias) All outcomes | High risk | "Participating services did not make any special provisions to advertise the trial and their allocation status to patients; however, it would be reasonable to assume that when the tools were used during a consultation, patients may have been aware of the intervention." |
| Blinding of outcome assessment (detection bias) All outcomes | Low risk | "[O]utcome analyses were conducted blinded to randomised allocation" |
| Incomplete outcome data (attrition bias) All outcomes | Low risk | ITT analysis used |
| Selective reporting (reporting bias) | Low risk | All outcomes from protocol and trial registration were reported |
| Other bias | Unclear risk | Marked baseline imbalances between the groups that were not statistically significant due to larger than expected intracluster coefficients (ICC) |
Perestelo‐Perez 2016.
| Study characteristics | ||
| Methods | Cluster‐randomised trial, parallel group (1:1) | |
| Participants | Patients from primary care centres in Tenerife, Spain Unit of randomisation: clinician Study aim: to assess the efficacy of the statin choice decision aid compared to usual primary care in Spanish participants with type 2 diabetes mellitus Inclusion criteria: 18 years of age or older, type 2 diabetes mellitus, Spanish language‐speaking, and no cognitive or sensorial impairments Exclusion criteria: no additional criteria listed Total randomised at baseline: 29 physicians with 168 participants (n = 15 physicians with 86 participants in intervention group, n = 14 physicians with 82 participants in the comparison group) Mean age (SD): intervention 63.9 years (9.7) and control 59.6 years (12.3); sex: intervention 41% women, control 34% women; 100% diabetes mellitus; 10‐year risk category: intervention 37.6% high risk, control 25.3% high risk; ischaemic heart disease: intervention 24%, control 18% |
|
| Interventions | Intervention group: statin choice decision aid about the use of statins. The decision aid consisted of a 3‐page pamphlet listing: CVD risk factors, 10‐year CVD risk based on the UKPDS risk engine presented in pictographs with and without statins, list of adverse effects of statins and their incidence Comparison group: usual care |
|
| Outcomes | Primary and secondary outcomes not specified Outcomes reported: statin knowledge, risk perception, decisional conflict scale (DCS), satisfaction with decision‐making, problem areas in diabetes questionnaire, self‐report of statin taking, self‐report of adherence at 3 months (Morisky), consultation time by physician Follow‐up: immediately after encounter and at 3 months Total analysed at 3 months follow‐up: 131 participants (n = 67 intervention, n = 64 comparison) |
|
| Study funding sources | Spanish Ministry of Health, Social Services and Equality (grant number: EC10‐005) | |
| Notes | Analyses of outcomes accounted for clustering, but no power calculations performed. Significant baseline differences between intervention and control groups. At 3 months, 20% of participants were lost to follow‐up (but 42% missing data for adherence outcome). ITT analysis not performed Study funded by Spanish Ministry of Health, Social Services and Equality (grant number: EC10‐005) No conflicts of interest reported |
|
| Risk of bias | ||
| Bias | Authors' judgement | Support for judgement |
| Random sequence generation (selection bias) | Low risk | "Physicians who consented to participate were randomised to intervention or usual care by means of a computer‐generated list." |
| Allocation concealment (selection bias) | High risk | Participants were recruited to the trial by clinicians and this occurred after clinicians were randomised Significant baseline difference between the 2 treatment groups suggests high risk of selection bias. Participants in the intervention group were significantly older, had more hypertension, and were more likely to be prescribed statins at baseline than participants in the control group |
| Blinding of participants and personnel (performance bias) All outcomes | High risk | Participants and clinicians not blinded to intervention |
| Blinding of outcome assessment (detection bias) All outcomes | Unclear risk | Not reported by authors but all outcomes were measured by participant self‐report |
| Incomplete outcome data (attrition bias) All outcomes | High risk | 34/168 (20%) participants were lost to follow‐up. Adherence data were missing for 71/168 (42%) participants. ITT analysis not performed |
| Selective reporting (reporting bias) | High risk | Per clinical trial registration, the primary outcome was adherence at 3 months as measured by Morisky scale, chart abstraction, and pharmacy records. This was not reported as a primary outcome by the authors and the latter 2 methods were not used to measure adherence Several secondary outcomes not reported: haemoglobin A1c, lipid profile, health‐related quality of life, consultation time |
| Other bias | High risk | Small study bias |
Persell 2013.
| Study characteristics | ||
| Methods | Cluster‐randomised controlled trial, parallel group (1:1) | |
| Participants | Participants aged 40‐79 years from 29 physician panels with a Framingham risk score of at least 5%, LDL cholesterol level above guideline threshold for drug treatment, and not prescribed a lipid‐lowering medication Exclusion criteria: coronary heart disease, heart failure, stroke, diabetes mellitus, peripheral vascular disease Total randomised at baseline: 29 physicians with 435 participants (n = 14 physicians and 218 participants in the intervention group, n = 15 physicians and 217 participants in the comparison group). Mean age 60.7 years, 23% women, mean Framingham Risk score (SD): 14.2 (6.7) in intervention group and 13.8 (6.3) in comparison group |
|
| Interventions | Intervention group: patients of physicians randomised to the intervention group were mailed individualised CVD risk messages that described benefits of using a statin (and controlling hypertension or quitting smoking when relevant) Comparison group: usual care |
|
| Outcomes | Primary outcome: occurrence of a LDL‐cholesterol level that was at least 30 mg/dL lower than prior Secondary outcome: lipid‐lowering drug prescription, aspirin prescription, change in systolic and diastolic blood pressure, difference in number of antihypertensive medications prescribed, documentation of quitting smoking Follow‐up: 9 months; but extended to 18 months post hoc Total analysed in follow‐up: same as above |
|
| Study funding sources | Agency for Healthcare Research and Quality, USA | |
| Notes | Primary endpoint at 9 months not met in the original protocol but analyses included a 18‐month post hoc analysis that did achieve the primary endpoint | |
| Risk of bias | ||
| Bias | Authors' judgement | Support for judgement |
| Random sequence generation (selection bias) | Low risk | "Randomization was performed using a random number generator (SAS 9.2, SAS Institute Inc., Cary, NC) by a researcher who was not aware of the physicians’ order in the blocks. Allocation to intervention or control groups was not revealed until after randomization was completed." |
| Allocation concealment (selection bias) | Low risk | See above |
| Blinding of participants and personnel (performance bias) All outcomes | High risk | Participants and personnel not blinded |
| Blinding of outcome assessment (detection bias) All outcomes | Low risk | "All outcomes were assessed by applying the outcome criteria to patient data automatically collected from EHRs using automated searches. No human judgment was involved in outcome assessments." |
| Incomplete outcome data (attrition bias) All outcomes | Unclear risk | ITT analysis performed All included participants analysed but only 38% of intervention and 34% of control had LDL testing which biases result to null |
| Selective reporting (reporting bias) | Low risk | All outcomes from trial registration were reported |
| Other bias | Unclear risk | Initial trial follow‐up planned for 9 months; extended to 18 months post hoc |
Persell 2015.
| Study characteristics | ||
| Methods | Randomised controlled trial, parallel group (1:1) | |
| Participants | 646 men 35 years or older and women 45 years or older, without CVD or diabetes mellitus, and with a 10‐year risk of CHD > 10% in 11 federally qualified health centres in the USA Exclusion criteria: diagnosed vascular disease, diabetes mellitus, primary language other than English or Spanish, primary care clinician discretion Mean age 60 years, 11% women, 50% African American, 33% non‐Hispanic white, 13% Hispanic |
|
| Interventions | Intervention group: the intervention group received telephone and mailed outreach with individualised CVD risk information and uncontrolled risk factors provided by lay health workers. Comparison group: usual care |
|
| Outcomes | Primary outcome: discussion about drug treatment for cholesterol at 6 months, follow‐up LDL‐cholesterol level > 30 mg/dL lower than baseline value Secondary outcome: statin prescription at 6 months, repeat LDL‐cholesterol test at 1 year Follow‐up: 1 year |
|
| Study funding sources | Agency for Healthcare Research and Quality, USA | |
| Notes | — | |
| Risk of bias | ||
| Bias | Authors' judgement | Support for judgement |
| Random sequence generation (selection bias) | Low risk | "A Northwestern investigator (SP) who was not aware of patients' identities, stratified eligible patients by CHC network then randomly assigned patients in a 1:1 ratio within each stratum using a random number generator in SAS 9.3 statistical software." |
| Allocation concealment (selection bias) | Low risk | See above |
| Blinding of participants and personnel (performance bias) All outcomes | High risk | Participants and personnel were not blinded to intervention |
| Blinding of outcome assessment (detection bias) All outcomes | Low risk | "Northwestern investigators reviewed these charts and were blinded to study group assignments." |
| Incomplete outcome data (attrition bias) All outcomes | Unclear risk | Pragmatic trial design. Outcomes obtained as a part of routine care. Only 36% of participants had a repeat LDL cholesterol test after 1 year. |
| Selective reporting (reporting bias) | Low risk | All outcomes from clinical trial registration reported. Post hoc outcomes and analyses delineated in manuscript |
| Other bias | Unclear risk | Potential for contamination bias since randomisation occurred at the level of participant |
Price 2011.
| Study characteristics | ||
| Methods | Randomised controlled trial, 2 × 2 factorial design | |
| Participants | Adults at increased CVD risk (10‐year Framingham risk ≥ 20%) recruited from 4 general practices in Oxfordshire, UK Exclusion criteria: prevalent cardiovascular disease (MI, stroke, TIA, prior revascularisation), physical disability or condition reducing the ability to walk Total randomised at baseline 194 (n = 99 to personalised 10‐year CVD risk estimate, n = 95 to risk factor levels only) Mean age: 62 years, 33% women, 98% white, 19% diabetes mellitus |
|
| Interventions | Participants were randomised in a 2 × 2 factorial design to receive: either a personalised 10‐year cardiovascular disease risk estimate from a decision support tool or were told their blood pressure, total cholesterol, and fasting glucose values and if they were elevated per guidelines. Participants were simultaneously randomised to receive or not receive a brief lifestyle intervention by slideshow targeting physical activity, diet, and smoking. Results presented for decision support tool compared with no decision support |
|
| Outcomes | Primary outcome: physical activity at 1 month, cardiovascular risk factor levels at 1 month Secondary outcomes: BMI, cholesterol levels, fasting glucose, anxiety, quality of life, self‐regulation, worry about heart attack risk, intention to increase physical activity, recall of risk information Total analysed at follow‐up 185 (n = 94 in personalised 10‐year CVD risk group, n = 91 in risk factor levels only group) Follow‐up: 1 month |
|
| Study funding sources | Diabetes Trials Unit Fellowship, Insulin Dependent Diabetes Trust | |
| Notes | — | |
| Risk of bias | ||
| Bias | Authors' judgement | Support for judgement |
| Random sequence generation (selection bias) | Low risk | "Computerized randomization was used to allocate participants and was performed internally." |
| Allocation concealment (selection bias) | Low risk | See above |
| Blinding of participants and personnel (performance bias) All outcomes | High risk | Participants were not blinded. "One research fellow remained unblinded in order to deliver the intervention." |
| Blinding of outcome assessment (detection bias) All outcomes | Low risk | "Research nurses who inputted data were blind to intervention allocation." |
| Incomplete outcome data (attrition bias) All outcomes | High risk | ITT analysis but "valid baseline and follow‐up accelerometer data were only available for 125 participants (64%)". |
| Selective reporting (reporting bias) | Low risk | Outcomes reported as outlined in the protocol document |
| Other bias | Low risk | Other sources of bias not identified |
Sheridan 2006.
| Study characteristics | ||
| Methods | Randomised controlled trial, parallel group (1:1) | |
| Participants | Men and women aged 35‐75 years without CVD in North Carolina, USA Exclusion criteria: prior history of CVD, serious chronic medical condition that would limit their candidacy for screening (i.e. chronic renal failure, cirrhosis of the liver, HIV, current non‐skin cancer), people who had participated in a previous quality improvement initiative Total randomised 87 adults (n = 49 to intervention group, n = 38 to comparison group) Mean age 53 years, 59% women, 73% white, 23% African American, 8% diabetes mellitus |
|
| Interventions | Intervention group: participants provided with most‐recent risk factor information and instructed to review a computerised decision support tool prior to clinic visit. The decision support tool provided individualised CHD risk, the pros and cons of pertinent risk‐reducing therapies, and the amount of risk reduction achievable after 1 or more therapeutic interventions. Comparison group: provided a list of their cardiovascular risk factors |
|
| Outcomes | Primary outcome: discussion with provider about CHD risk reduction, plans for CHD risk reduction Secondary outcomes: knowledge about CHD prevention, perception of CHD risk, interest in participating in decision‐making, accuracy of risk perception, self‐perceived barriers to risk reduction Total analysed 75 adults (n = 41 in intervention group, n = 34 in comparison group) |
|
| Study funding sources | Internal funding from Department of Medicine at University of North Carolina | |
| Notes | 2 authors received consulting and licensing fees from Bayer, Inc. 1 author received honoraria and consulting fees from Merck, Pfizer, and Glaxo Smith Kline. Small pilot study |
|
| Risk of bias | ||
| Bias | Authors' judgement | Support for judgement |
| Random sequence generation (selection bias) | Unclear risk | "We used a computerized random number generator to randomize patients to receive either the Heart to Heart decision aid or a list of their CHD risk factors that they could present to their doctor." Baseline imbalances in key parameters such as CHD risk factors, baseline CHD risk, and interest in prevention strategies |
| Allocation concealment (selection bias) | Low risk | "Intervention assignments were sealed in security envelopes until after subjects agreed to participate in the study. The research assistant then broke the seal to determine intervention assignment." |
| Blinding of participants and personnel (performance bias) All outcomes | High risk | "We blinded patients to the purpose of our study by telling them only that they were participating in a study about "prevention of CHD." Doctors were not blinded and saw patients in both the decision aid and control group. |
| Blinding of outcome assessment (detection bias) All outcomes | Unclear risk | Method of outcome assessment not reported |
| Incomplete outcome data (attrition bias) All outcomes | Unclear risk | 12 participants excluded postrandomisation (8 because they did not meet eligibility criteria); ITT analysis not performed |
| Selective reporting (reporting bias) | Low risk | All outcomes from trial registration were reported |
| Other bias | High risk | Small study bias with key baseline imbalances in spite of randomisation Possible contamination bias as same doctors saw participants who were in intervention and control groups |
Sheridan 2011.
| Study characteristics | ||
| Methods | Randomised controlled trial, parallel group (1:1) | |
| Participants | Men and women aged 40‐79 years with no history of CVD or diabetes mellitus, at moderate or high‐risk based on Framingham risk score Exclusion criteria: serious medical condition that limited life expectancy to less than 5 years, first clinic visit, no cholesterol level checked in 18 months, extreme risk factor levels (systolic blood pressure > 180 mmHg or total cholesterol > 300 mg/dL) Total randomised at baseline: 160 participants (n = 81 to intervention group, n = 79 to comparison group) Mean age: 63 years, 28% women, 86% white, 10% African American |
|
| Interventions | Intervention group:
Comparison group: usual care |
|
| Outcomes | Primary outcome: feasibility of subject recruitment, intervention delivery, and measurement of study outcomes Secondary outcomes: self‐reported adherence, global CHD risk, blood pressure, serum total and HDL cholesterol levels, smoking status, aspirin use, intent to start CHD reducing medication, self‐efficacy for CHD risk reduction Total analysed: 154 participants (n = 77 intervention group, n = 77 comparison group) Follow‐up: 3 months |
|
| Study funding sources | National Heart, Lung, and Blood Institute, USA; National Cancer Institute, USA; American Heart Association | |
| Notes | Feasibility study, no power calculation | |
| Risk of bias | ||
| Bias | Authors' judgement | Support for judgement |
| Random sequence generation (selection bias) | Unclear risk | Method for sequence generation not reported. Baseline imbalances between intervention and control noted |
| Allocation concealment (selection bias) | Unclear risk | "Patients were randomised by study staff who accessed an online randomised schedule." |
| Blinding of participants and personnel (performance bias) All outcomes | High risk | "Physicians were not blinded and saw patients in both the intervention and control group." |
| Blinding of outcome assessment (detection bias) All outcomes | Unclear risk | Method of outcome assessment not reported |
| Incomplete outcome data (attrition bias) All outcomes | Low risk | "The study lost 6 patient participants during follow‐up, resulting in a 96% follow up rate." |
| Selective reporting (reporting bias) | Low risk | All outcomes reported in trial registration reported |
| Other bias | High risk | "[P]hysicians saw patients in both the intervention and control groups, which may have resulted in contamination between study groups." |
Soureti 2011.
| Study characteristics | ||
| Methods | Randomised controlled trial, parallel group (1:1:1:1) | |
| Participants | Men and women age 30‐60 years with obesity (BMI ≥ 29 kg/m²) Exclusion criteria: diagnosis of a heart condition or cancer, being pregnant Total randomised at baseline 781 participants (n = 197 to CVD risk message, n = 194 to CVD risk message + automated health planning tool, n = 195 to health planning tool alone, n = 195 to educational information (control) Mean age: 47 years. Few baseline characteristics presented |
|
| Interventions | Participants randomised to 1 of 3 intervention groups: a CVD risk message, CVD risk message + automated health planning tool, health planning tool alone Comparison group: educational information about diet low in saturated fats without CVD risk message or planning tool For this systematic review, data for participants in the 2 CVD risk message groups were combined and compared with participants in the 2 groups that did not receive a CVD risk message (n = 392 intervention group, n = 389 comparison group) |
|
| Outcomes | Primary outcome: saturated fat intake as measured by self‐reported food‐frequency questionnaire, 2‐item scale to evaluate consumption of low‐fat foods Secondary outcomes: CVD risk perception, intention to reduce saturated fat intake, self‐efficacy, planning and outcome expectancies Total analysed in follow‐up 581 participants (n = 141 in CVD risk message group, n = 137 in CVD risk message + automated health planning tool, n = 141 in automated health planning tool alone, n = 141 in educational information (control) For this systematic review, n = 278 in CVD risk groups, n = 282 in comparison groups Follow‐up: 5 weeks |
|
| Study funding sources | Unilever funded and created the Heart Age score tested in the study | |
| Notes | Internet‐based trial with a large amount of missing data | |
| Risk of bias | ||
| Bias | Authors' judgement | Support for judgement |
| Random sequence generation (selection bias) | Unclear risk | Method of random sequence generation not reported |
| Allocation concealment (selection bias) | Unclear risk | Method of allocation concealment not reported |
| Blinding of participants and personnel (performance bias) All outcomes | Unclear risk | Method of blinding not reported |
| Blinding of outcome assessment (detection bias) All outcomes | High risk | Outcomes were patient‐reported |
| Incomplete outcome data (attrition bias) All outcomes | High risk | > 20% loss to follow‐up; ITT analysis not performed |
| Selective reporting (reporting bias) | High risk | Trial registered retrospectively |
| Other bias | High risk | Trial funded by Unilever and multiple authors were employees of Unilever. Heart Age Calculator software was also proprietary of Unilever |
Turner 2012.
| Study characteristics | ||
| Methods | Randomised controlled trial, parallel group (1:1) | |
| Participants | African American adults aged 40‐75 years with uncontrolled hypertension Exclusion criteria: individuals with > 40% missed or cancelled clinic appointments during the past 3 years Total randomised: 280 participants (n = 136 intervention group, n = 144 comparison group) Mean age: 62 years, 65% women, 100% African Americans, 54% diabetes mellitus, 18% with CAD or equivalent |
|
| Interventions | Intervention group:
Comparison group: received written material, brochures, and cookbook from American Heart Association addressing healthy lifestyle |
|
| Outcomes | Primary outcome: change in 4‐year CHD risk at 6 months Secondary outcomes: 5 mmHg or greater reduction in SBP at 6 months; absolute change in blood pressure Total analysed for primary outcome: 212 participants (n = 96 intervention group, n = 118 comparison group) Follow‐up: 6 months |
|
| Study funding sources | Robert Wood Johnson Foundation and the staff of the Finding Answers, Disparities Research for Change Program; unrestricted | |
| Notes | Intervention targeted to individuals with uncontrolled hypertension but mean blood pressure was 140.5/81.2 mmHg | |
| Risk of bias | ||
| Bias | Authors' judgement | Support for judgement |
| Random sequence generation (selection bias) | Unclear risk | "[R]andomised at a 1:1 ratio using random computer‐generated assignments" |
| Allocation concealment (selection bias) | Unclear risk | Method of allocation concealment not reported |
| Blinding of participants and personnel (performance bias) All outcomes | High risk | "[S]ingle‐blinded study;" "All providers were blinded to the study arm." |
| Blinding of outcome assessment (detection bias) All outcomes | Low risk | "The 6‐month endpoint blood pressure was performed by blinded office medical assistants" |
| Incomplete outcome data (attrition bias) All outcomes | High risk | Greater missing data in the intervention group "After 6 months, 94 (69%) intervention subjects and 118 (82%) control subjects had 4‐year CHD risk assessed" |
| Selective reporting (reporting bias) | Unclear risk | Trial registration retrospectively; all outcomes from trial registration reported |
| Other bias | Unclear risk | Unrestricted supplementary funding from Pfizer, Inc |
Vagholkar 2014.
| Study characteristics | ||
| Methods | Cluster‐randomised trial, parallel group (1:1) | |
| Participants | People aged 45‐69 years without CVD, recruited from 34 general practices in urban Sydney, Australia Unit of randomisation: practice Exclusion criteria: insufficient English skills, cognitively impaired, Aboriginal or Torres Strait Islander, diagnosed or treated CVD Total randomised: 34 clusters of 1074 participants (n = 18 practices with 567 participants in the intervention group, n = 16 practice with 507 participants in the comparison group) Mean age: 56 years, 58% women, 56% Anglo‐Celtic, 12% diabetes mellitus |
|
| Interventions | Intervention group: physicians received training on the importance of absolute risk assessment and use of a CVD risk calculator; participants received a 20‐30 min consultation that involved calculating cardiovascular risk and providing appropriate management based on risk level and current guidelines Comparison group: general health check |
|
| Outcomes | Primary outcome: antihypertensive medication prescription, lipid‐lowering medication prescription at 12 months Secondary outcomes: changes in blood pressure and blood lipids; self‐reported smoking; self‐reported physical activity levels; diet consumption Total analysed: 34 clusters of 906 participants (n = 18 practices with 475 participants in the intervention group; n = 15 practices with 431 participants in the comparison group) Follow‐up: 12 months |
|
| Study funding sources | National Health and Medical Research Council of Australia | |
| Notes | Only 685/1074 (64%) had values available for risk assessment | |
| Risk of bias | ||
| Bias | Authors' judgement | Support for judgement |
| Random sequence generation (selection bias) | Low risk | "A person (U.J.) independent of the intervention and data collection conducted the allocation using a computer randomization program." |
| Allocation concealment (selection bias) | Low risk | See above |
| Blinding of participants and personnel (performance bias) All outcomes | High risk | Personnel not blinded to intervention |
| Blinding of outcome assessment (detection bias) All outcomes | Low risk | "Research staff collecting practice data were blinded to group allocation, as were patients." |
| Incomplete outcome data (attrition bias) All outcomes | High risk | Large amount of missing data. Only 64% of participants had values available for risk assessment |
| Selective reporting (reporting bias) | High risk | Several outcomes (such as health‐related quality of life) mentioned in trial registry and protocol were not reported in this report |
| Other bias | Low risk | Other sources of bias not identified |
Van Steenkiste 2007.
| Study characteristics | ||
| Methods | Cluster‐randomised controlled trial, parallel group (1:1) | |
| Participants | People aged 40‐75 years without CVD recruited from 45 primary care clinicians Unit of randomisation: primary care clinician Additional inclusion and exclusion criteria not reported Total randomised: 45 primary care clinicians with 623 participants (n = 19 primary care clinicians with 332 participants in intervention group, n = 26 primary care clinicians with 291 participants in the comparison group Mean age: 54 years, 55% women, 100% Dutch, 20% diabetes mellitus |
|
| Interventions | Intervention group: primary care clinicians trained to use cardiovascular risk in guidelines and in the use of a clinical decision support tool (paper booklet) provided to participants prior to clinic visit (2 clinic visits separated by 2 weeks) Comparison group: educational materials about the guidelines on paper |
|
| Outcomes | Primary outcome not specified. Outcomes reported: appropriate risk classification, appropriate assessment, appropriate smoking advice, appropriate dietary advice Secondary outcomes: anxiety, appropriateness of perceived risk, self‐reported lifestyle changes (smoking in past 7 d, phys activity > 2 h, EtOH use, BMI > 30), self‐efficacy regarding lifestyle changes Total analysed at 0 weeks: 490 participants (n = 276 intervention group, n = 200 comparison group) Total analysed at 26 weeks: 427 participants (n = 227 intervention group, n = 200 comparison group) Follow‐up: 26 weeks |
|
| Study funding sources | The Netherlands Organization for Health Research and Development | |
| Notes | — | |
| Risk of bias | ||
| Bias | Authors' judgement | Support for judgement |
| Random sequence generation (selection bias) | Low risk | "A computer was used for the stratified randomization, which was at practice level to prevent contamination of the intervention within group practices." |
| Allocation concealment (selection bias) | High risk | Participant recruitment occurred after cluster‐randomisation which increases the risk of selection bias |
| Blinding of participants and personnel (performance bias) All outcomes | High risk | Participants and personnel not blinded |
| Blinding of outcome assessment (detection bias) All outcomes | High risk | Outcomes assessed by physicians who were not blinded to intervention |
| Incomplete outcome data (attrition bias) All outcomes | High risk | > 20% loss to follow‐up; ITT analysis not performed |
| Selective reporting (reporting bias) | Unclear risk | Protocol not available for review |
| Other bias | Low risk | Other sources of bias not identified |
Webster 2010.
| Study characteristics | ||
| Methods | Randomised controlled trial, parallel group (1:1) | |
| Participants | Adult Australian residents with access to the Internet, trial recruitment strategies geared toward individuals with self‐reported hypercholesterolemia Total randomised: 2099 participants (n = 1062 participants intervention group, n = 1037 participants comparison group) Mean age: 56 years, 55% women, 12% diabetes mellitus, 9% CHD |
|
| Interventions | Intervention group: individuals assigned to intervention received immediate, fully automated, personally tailored cholesterol treatment advice based on current Australian guidelines regarding the need for starting or increasing statin therapy or non‐drug intervention strategies. Comparison group: provided with general information about cholesterol management |
|
| Outcomes | Primary outcome: number of participants reporting starting or increasing lipid‐lowering medication Secondary outcomes: number of participants who self‐reported: a cholesterol level, doctor visit, start of a healthy diet, start of an exercise programme, weight‐loss, smoking cessation, blood pressure check‐up Total analysed: same as above (ITT) Follow‐up: 8 weeks |
|
| Study funding sources | MBF Australia, Pfizer, National Health and Medical Research Council of Australia Program Grant (Grant ID: 571281) | |
| Notes | Internet‐based study, no human contact | |
| Risk of bias | ||
| Bias | Authors' judgement | Support for judgement |
| Random sequence generation (selection bias) | Low risk | "Randomization was done automatically in real time by a central computerized service run by the investigators at The George Institute for International Health." |
| Allocation concealment (selection bias) | Low risk | See above |
| Blinding of participants and personnel (performance bias) All outcomes | Low risk | "Participants were not informed of the precise randomised comparison being made and were simply told that they were participating in a trial that sought to ‘find out if advice about cholesterol provided on the Internet can improve your cholesterol management.’" "Investigators were blinded to the allocation of all individuals throughout the trial." |
| Blinding of outcome assessment (detection bias) All outcomes | High risk | Outcomes self‐reported by participants |
| Incomplete outcome data (attrition bias) All outcomes | Low risk | 93% follow‐up, ITT analysis performed |
| Selective reporting (reporting bias) | Low risk | All prespecified outcomes reported |
| Other bias | High risk | Outcomes subject to recall bias |
Welschen 2012.
| Study characteristics | ||
| Methods | Randomised controlled trial, parallel group (1:1) | |
| Participants | Type‐2 diabetics under the age of 75 years newly referred to the Diabetes Care System West‐Friesland, a managed care system in the Netherlands Exclusion criteria: unable to read/write Dutch, history of stroke/TIA Total randomised: 262 participants (n = 132 intervention group, n = 130 comparison group) Mean age 59 years, 44% women, 100% diabetes mellitus |
|
| Interventions | Intervention group: received: risk communication intervention from trained diabetes nurses and dieticians in addition to usual care. Risk communication consisted of: general explanation about risks of diabetes mellitus, presentation of 10‐year absolute CVD risk, visual/graphical presentation of absolute and relative risk, and explanation of treatment benefits using a 'positive' frame Comparison group: received usual care provided by the diabetes nurses and dieticians of the Diabetes Care System which consisted of general information about having diabetes mellitus and education about treatment options and lifestyle modifications |
|
| Outcomes | Primary outcome: appropriateness of risk perception. Secondary outcomes: anxiety, generalised worry, illness perception, attitude, intention to change behaviour, satisfaction with communication Total analysed: 204 participants (n = 102 intervention group, n = 102 comparison group) Follow‐up: 12 weeks |
|
| Study funding sources | Dutch Diabetes Research Foundation Grant 2007.13.004 | |
| Notes | — | |
| Risk of bias | ||
| Bias | Authors' judgement | Support for judgement |
| Random sequence generation (selection bias) | Low risk | "All participating patients gave written informed consent and were randomised into an intervention and a control group by means of a list drawn up by a computerized randomisation program (version 1.0.0; Random Allocation Software)." |
| Allocation concealment (selection bias) | Low risk | "The manager of the DCS [Diabetes Care System], who is not involved in the patients' care, allocates the patient to one of the two groups on the basis of the randomisation list." |
| Blinding of participants and personnel (performance bias) All outcomes | High risk | Participants and personnel not blinded to intervention |
| Blinding of outcome assessment (detection bias) All outcomes | High risk | Outcomes derived from self‐report questionnaires |
| Incomplete outcome data (attrition bias) All outcomes | High risk | > 20% loss to follow‐up; ITT analysis not performed |
| Selective reporting (reporting bias) | Low risk | All pre‐specified outcomes from protocol were reported |
| Other bias | High risk | Potential for contamination because the same diabetes nurses and dieticians delivered the risk communication intervention and usual care |
Williams 2006.
| Study characteristics | ||
| Methods | Randomised controlled trial, parallel group (7:3) | |
| Participants | Inclusion criteria: adult smokers who smoked > 5 cigarettes/day Exclusion criteria: history of psychotic illness, unable to read/speak English, minimum life expectancy of 18 months Total randomised: 1006 participants (n = 714 intervention group, n = 292 comparison group) Mean age: 46 years, 64% women, 82% white |
|
| Interventions | Intervention group: multifaceted intervention
Counselors were trained to support participants in making clear and autonomous choices and goal‐setting. Comparison group: received booklets on smoking cessation and healthy diet; also encouraged to enrol in a smoking cessation programme and to meet with their physician |
|
| Outcomes | Primary outcome: 12‐month prolonged tobacco abstinence Secondary outcomes: change in percent calories from fat, LDL‐C from baseline to 18 months Total analysed: same as above (ITT analysis) Follow‐up: 18 months |
|
| Study funding sources | National Institute of Mental Health, USA; National Cancer Institute, USA | |
| Notes | — | |
| Risk of bias | ||
| Bias | Authors' judgement | Support for judgement |
| Random sequence generation (selection bias) | Unclear risk | Method of random sequence generation not reported |
| Allocation concealment (selection bias) | Low risk | "The results of a stratified permutated blocked randomization were placed in numbered double‐sealed security envelopes." |
| Blinding of participants and personnel (performance bias) All outcomes | High risk | Participants and personnel not blinded to treatment assignment |
| Blinding of outcome assessment (detection bias) All outcomes | High risk | Self‐reported outcomes |
| Incomplete outcome data (attrition bias) All outcomes | High risk | 28% loss to follow‐up at 18 months; ITT analysis reported by authors but analyses appear to be completers analysis for LDL |
| Selective reporting (reporting bias) | Low risk | Prespecified outcomes all reported |
| Other bias | Unclear risk | Received funding from pharmaceutical industry |
Wister 2007.
| Study characteristics | ||
| Methods | Randomised controlled trial, parallel group (1:1) | |
| Participants | Participants age 45‐64 years from the Fraser Health region in British Columbia, Canada Exclusion criteria: no additional criteria specified Number of primary prevention participants randomised: 315 participants (n = 157 intervention group, n = 158 comparison group) Mean age: 56 years, 58% women |
|
| Interventions | Intervention group: participants and their primary care doctor received a 'report card' showing the person's CVD risk profile; also participants received Telehealth lifestyle counselling by 2 kinesiologists trained in motivational interviewing every 6 months for approximately 30 min per session. Comparison group: usual care |
|
| Outcomes | Primary outcome: Framingham risk score Total analysed: same as above (ITT analysis) Follow‐up: 1 year |
|
| Study funding sources | Canadian Institutes of Health Research, Community Alliance for Health Research Program, project 43267 | |
| Notes | This study included participants eligible for either primary or secondary prevention but randomised and analysed these 2 groups separately. For this systematic review, we report on the 315 participants in the primary prevention group. | |
| Risk of bias | ||
| Bias | Authors' judgement | Support for judgement |
| Random sequence generation (selection bias) | Low risk | "The study statistician then randomly assigned the participants to the intervention or control study arm according to computer‐generated random numbers." |
| Allocation concealment (selection bias) | Unclear risk | "The research coordinator received the assignment codes in envelopes, which were concealed from all members of the research team and were not opened by the coordinator until the point of randomization." Not reported if sealed or opaque |
| Blinding of participants and personnel (performance bias) All outcomes | High risk | Personnel not blinded to intervention but "all data were collected without patients’ knowledge of group allocation." |
| Blinding of outcome assessment (detection bias) All outcomes | Low risk | "The outcome assessors were blinded to group allocation …" |
| Incomplete outcome data (attrition bias) All outcomes | Low risk | No major loss to follow‐up. ITT analysis with multiple imputation of missing data performed |
| Selective reporting (reporting bias) | Unclear risk | No protocol document available for review |
| Other bias | Unclear risk | Potential for contamination bias but sensitivity analysis removing analysis of all participants who shared a physician did not result in change in point estimates |
Zullig 2014.
| Study characteristics | ||
| Methods | Randomised controlled trial, parallel group (1:1) | |
| Participants | Adults with CVD or a CVD‐risk equivalent condition, at least 1 modifiable risk factor (e.g. hypertension or active smoking) Exclusion criteria: patients with metastatic cancer, dementia, psychosis, or end‐stage renal disease; no Internet access; nursing care; unable to read English; heart transplant; hospitalised for a cardiac‐related illness in the previous 3 months Total randomised: 96 participants (n = 47 intervention group. n = 49 comparison group) Mean age: 63 years, 68% women, 62% white, 32% African American, 29% diabetes mellitus |
|
| Interventions | Intervention group: participants were presented a web‐based decision support tool that calculated their CVD risk based on the Framingham risk score and in subsequent online encounters could select modules with evidence‐based recommendations regarding healthy lifestyle behaviours (medication adherence, diet, risk factor knowledge, smoking cessation) Comparison group: usual care, received general printed educational CVD information |
|
| Outcomes | Outcomes reported: mean differences in 10‐year Framingham risk score, BMI, smoking status, systolic blood pressure, and self‐reported medication adherence Total analysed: not reported Follow‐up: 3 months |
|
| Study funding sources | Informed Medical Decisions Foundation, grant number 0170‐1 | |
| Notes | — | |
| Risk of bias | ||
| Bias | Authors' judgement | Support for judgement |
| Random sequence generation (selection bias) | Unclear risk | Method of random sequence generation not reported but authors report baseline differences between participants, so this may be high risk of bias |
| Allocation concealment (selection bias) | Unclear risk | "Randomization assignments were placed in sealed, consecutively numbered envelopes." Not reported if envelopes were opaque |
| Blinding of participants and personnel (performance bias) All outcomes | High risk | Participants and personnel were not blinded to the intervention. |
| Blinding of outcome assessment (detection bias) All outcomes | Unclear risk | Unclear who assessed 3 month follow‐up visit outcomes. Medication use was self‐reported |
| Incomplete outcome data (attrition bias) All outcomes | Unclear risk | Outcome data were not clearly reported including number of participants contributing to data |
| Selective reporting (reporting bias) | Unclear risk | Protocol document not available |
| Other bias | Unclear risk | Small study bias |
ATP: Adult Treatment Panel, of the National Cholesterol Education Program; BMI: body mass index; CAD: coronary artery disease; CDSS: computerised clinical decision support; CHD: coronary heart disease; CME: continuing medical education; CVD: cardiovascular disease; FRS: Framingham risk score; GHQ: general health questionnaire; HTN: hypertension; ITT: intention‐to‐treat; LDL: low‐density lipoprotein; MI: myocardial infarction; SBP: systolic blood pressure; TIA: transient ischaemic attack.
Characteristics of excluded studies [ordered by study ID]
| Study | Reason for exclusion |
|---|---|
| Ajay 2014 | Risk score not part of the intervention |
| Allen 2011 | Risk score not part of the intervention |
| Avis 1989 | Risk score not part of the intervention (health risk appraisal) |
| Baruth 2011 | Risk score not part of the intervention |
| Berra 2007 | Risk score not part of the intervention |
| Bjarnason‐Wehrens 2013 | Risk score not part of the intervention |
| Black 2014 | Risk score not part of the intervention |
| Botija‐Yague 2007 | Risk score not part of the intervention |
| Branda 2013 | Risk intervention used in both groups |
| Brett 2012 | Risk score used in both groups |
| Bruckert 2008 | Risk score not part of the intervention |
| Carrington 2012 | Risk score not part of the intervention |
| CARRS 2012 | Risk score not part of the intervention |
| Carter 2009 | Risk score not part of the intervention |
| Carter 2015 | Not primary prevention |
| Chow 2009 | Risk score not part of the intervention |
| Claes 2007 | Risk score used in both groups |
| Cleveringa 2008 | Not primary prevention |
| Cochrane 2012 | Risk score not part of the intervention |
| Colwell 2011 | Risk score not part of the intervention |
| Daniels 2012 | Risk score not part of the intervention |
| Deales 2014 | Risk score not part of the intervention |
| Dresser 2009 | Risk score not part of the intervention |
| Edwards 2006 | Clinical vignettes/hypothetical patients |
| El Fakiri 2008 | Risk score not part of the intervention |
| Evans 2010 | Risk score used in both groups |
| Fabregas 2014 | Risk score not part of the intervention |
| Fretheim 2006 | Risk score not part of the intervention |
| Freund 2015 | Not RCT or quasi‐RCT |
| Gill 2009 | Risk score not part of the intervention |
| Gomez‐Marcos 2006 | Risk score not part of the intervention |
| Green 2014 | Risk score used in both groups |
| Harmsen 2014 | Risk score used in both groups |
| Holbrook 2011 | Risk score not part of the intervention |
| Hormigo‐Pozo 2009 | Risk score not part of the intervention |
| Huntink 2013 | Risk score not part of the intervention |
| Ishani 2011 | Risk score not part of the intervention |
| Jacobs 2011 | Risk score used in both groups |
| Jennings 2006 | Risk score not part of the intervention |
| Jones 2009 | Not primary prevention |
| Kaczorowski 2011 | Risk score not part of the intervention |
| Ketola 2001 | Not primary prevention |
| Keyserling 2014 | Risk score used in both groups |
| Kullo 2016 | Risk score used in both groups |
| Laan 2012 | Not RCT or quasi‐RCT |
| Lalonde 2004 | Not RCT or quasi‐RCT |
| Lalonde 2006 | Risk score used in both groups |
| Lauritzen 2008 | Risk score not part of the intervention |
| Liddy 2015 | Risk score not part of the intervention |
| Lindholm 1995 | Risk score not part of the intervention |
| Ma 2009 | Risk score not part of the intervention |
| Mendis 2010 | Risk score not part of the intervention |
| Mills 2010 | Risk score not part of the intervention |
| Mortsiefer 2015 | Risk score not part of the intervention |
| NCT01134458 | Not primary prevention |
| NCT01979471 | Not primary prevention |
| Nebieridze 2011 | Risk score used in both groups |
| Paterson 2002 | Not RCT or quasi‐RCT |
| Pignone 2004 | Not RCT or quasi‐RCT |
| Powers 2011 | Not primary prevention |
| Qureshi 2012 | Risk score used in both groups |
| Reid 1995 | Risk score not part of the intervention |
| Rodriguez‐Salceda 2010 | Risk score used in both groups |
| Selvaraj 2012 | Risk score not part of the intervention |
| Sheridan 2012 | Risk score used in both groups |
| Skinner 2011 | Risk score not part of the intervention |
| Smith 2008 | Risk score not part of the intervention |
| Soureti 2010 | Risk score used in both groups |
| Stewart 2012 | Risk score not part of the intervention |
| Thomsen 2001 | Not RCT or quasi‐RCT |
| Vaidya 2012 | Not RCT or quasi‐RCT |
| Van Breukelen‐van der Stoep 2014 | Not RCT or quasi‐RCT |
| Van den Brekel‐Dijkstra 2016 | Not RCT or quasi‐RCT |
| Van Limpt 2011 | Not primary prevention |
| Waldron 2010 | Risk score used in both groups |
| Weymiller 2007 | Not primary prevention |
| Zamora 2013 | Not primary prevention |
| Zamora 2015 | Not primary prevention |
| Zhu 2013 | Not RCT or quasi‐RCT |
RCT: randomised controlled trial.
Characteristics of studies awaiting classification [ordered by study ID]
Adamson 2013.
| Methods | Randomised controlled trial, parallel group (1:1) |
| Participants | 31 participants attending a specialist diabetes clinic appointment at the Oxford Centre for Diabetes. Mean age: 51 years, 55% women, 100% diabetes mellitus |
| Interventions | Intervention group: received a facilitated discussion based on 10‐year coronary heart disease and stroke risk estimate generated by the UKPDS Risk engine Control group: received routine discussion of CVD risk factors |
| Outcomes | Participant satisfaction, measured by questionnaire and semi‐structured interviews |
| Notes | Abstract only, full report not published |
Gryn 2012.
| Methods | Randomised controlled trial, parallel group (1:1) |
| Participants | 78 individuals with hypertension aged 30‐84 years Exclusion criteria: no prior MI, stroke, heart failure, or pregnancy Mean age 62 years, 55% women, 17% diabetes mellitus |
| Interventions | Intervention group: received information on their personalised estimated risk of heart disease and stroke and education about the utility of effective blood pressure management in decreasing their risk estimate. Control group: usual care |
| Outcomes | Primary outcome: adherence at baseline, 3, 6, and 12 months measured by pill counting and electronic pill bottles Secondary outcomes: blood pressure, self‐perception of cardiovascular and stroke risk, perceived benefit of treatment |
| Notes | Published abstract and scientific poster reviewed. Manuscript still in preparation |
Roach 2012.
| Methods | Randomised controlled trial, parallel group (1:1) |
| Participants | 144 type‐2 diabetics from 4 urban primary care clinics |
| Interventions | Intervention group: randomised to a Spanish‐language, tablet computer‐based CVD risk communication intervention incorporating the individual’s unique 10‐year CVD risk information. Comparison group: usual care |
| Outcomes | CVD risk discussion during clinic visit, medication change |
| Notes | Published abstract reviewed. Manuscript in preparation |
CVD: cardiovascular disease; MI: myocardial infarction; UKPDS: United Kingdom Prospective Diabetes Study.
Characteristics of ongoing studies [ordered by study ID]
Badenbroek 2014.
| Study name | The INTEGRATE study |
| Methods | Stepped‐wedge randomised controlled trial |
| Participants | All eligible patients 45‐70 years of age from 40 general practices in the Netherlands with electronic medical records |
| Interventions | The intervention is the Personalized Prevention Approach for CardioMetabolic Risk (PPA CMR). An online risk estimation tool based on the FINDRISK score is used to screen for participants with increased CVD risk. Participants with a FINDRISK score above risk threshold are offered additional measurements by their GP. In clinic, a GP uses SCORE to assess 10‐year CVD risk and then provides participants with increased risk with tailored lifestyle advice and/or medication. Control group: wailting list control; do not receive risk score nor lifestyle advice; recieve intervention at 1 year. |
| Outcomes | Primary outcomes: number of newly detected participants with CVD; change in individual risk factors (smoking, physical inactivity, obesity, unhealthy diet, blood pressure, cholesterol levels); expected new participants with CVD and mortality at 5, 10, 20 years; cost‐effectiveness; non‐participation and compliance Secondary outcomes: difference in primary outcome at 5 years; willingness to change lifestyle; change in health status |
| Starting date | 1 April 2014 |
| Contact information | Professor N. J. de Wit Julius Health Centre UMC Utrecht Huispost Str. 6.131 PO Box 85500 3508 GA Utrecht Netherlands N.J.deWit@umcutrecht.nl |
| Notes | www.integrateproject.nl NTR4277, the Netherlands National Trial Register |
Ijkema 2014.
| Study name | Risk Or Benefit IN Screening for CArdiovascular disease (ROBINSCA) study |
| Methods | Population‐based randomised screening trial, parallel group (1:1:1) |
| Participants | 39,000 participants at increased risk for CVD |
| Interventions | Comparison of 3 cardiovascular screening strategies: classic risk screening based on the Systematic COronary Risk Evaluation (SCORE) model; screening for coronary artery calcium using computed tomography; usual care All groups will receive written general lifestyle advice. Individuals at increased risk for CVD based on classic risk assessment or coronary calcium will be referred to general practitioner for lifestyle advice or medical therapy |
| Outcomes | Primary outcome: cumulative 5‐year fatal and non‐fatal coronary heart disease Secondary outcomes: sensitivity of the screening tests, favorable and unfavorable effects of screening, cost‐effectiveness |
| Starting date | First quarter 2014 |
| Contact information | H.J. de Koning, Department of Public Health, Erasmus MC, University Medical Center Rotterdam, PO Box 2040, 3000 CA Rotterdam, The Netherlands h.dekoning@erasmusmc.nl. |
| Notes | www.robinsca.nl |
Maindal 2014.
| Study name | The CORE‐trial: a pragmatic randomized controlled trial in primary care investigating effectiveness and cost‐effectiveness of the Check Your Health Preventive Programme offered population‐wide to 30‐49 years |
| Methods | Pragmatic household‐cluster‐randomised trial |
| Participants | 10,505 participants aged 30‐49 years from 35 practices within central Denmark |
| Interventions | The intervention consists of a preventive health check that consists of a health examination and individual risk profile (Heart‐SCORE model) during a single office visit. Follow‐up visits are stratified by risk profile to a health promoting consultation, behavioural programme, or no follow‐up Comparison group: standard prevention and treatment strategy |
| Outcomes | Primary outcomes: 10‐year risk of fatal CVD, physical activity (self‐report and cardiorespiratory fitness), health‐related quality of life, functional capacity (affiliation to the labour market and sick leave > 3 weeks) Secondary outcomes: cost‐effectiveness as measured by life‐years gained, direct costs, and total health cost |
| Starting date | May 2013; anticipated completion April 2017 |
| Contact information | Annelli Sandbæk, PhD Professor, Department of Public Health, University of Aarhus; annelli.sandbaek@alm.au.dk Helle T Maindal, PhD, Associate Professor, Department of Public Health, University of Aarhus; htm@ph.au.dk |
| Notes | ClinicalTrials.gov ID: NCT02028195 |
NCT00694239.
| Study name | Risk Assessment and Treat Compliance in Hypertension Education Trial (RATCHET) |
| Methods | Randomised controlled trial, parallel group (1:1) |
| Participants | Adults aged 30‐84 years Inclusion criteria: essential hypertension (new diagnosis or established diagnosis) meeting criteria for pharmacologic therapy as defined by current guidelines. Exclusion criteria: lack of written informed consent, previous myocardial infarction, previous stroke, congestive heart failure, stage 3 or greater chronic kidney disease, pregnancy, use of medication bubble/blister package |
| Interventions | Intervention group: knowledge of cardiovascular risk assessment plus standard care Control group: standard/usual care |
| Outcomes | Primary outcome: medication compliance Secondary outcomes: patient perception of cardiovascular risk, pilot feasibility study, blood pressure, cholesterol level, Framingham risk score Follow‐up: 1 year |
| Starting date | May 2007 |
| Contact information | George Dresser University of Western Ontario, Canada LHSC Victoria Hospital, Rm E6‐302 519.685.8500 ext.33342 George.Dresser@lhsc.on.ca |
| Notes | Anticipated completion date March 2011 but no results posted yet |
NCT02096887.
| Study name | Effect of Patient Education on Compliance and Cardiovascular Risk Parameters (FAILAKA) |
| Methods | Cluster‐randomised controlled trial, parallel group (1:1) |
| Participants | Adults aged 30‐70 years Inclusion criteria:
Exclusion criteria:
|
| Interventions | Intervention group: participants attending clinics randomised to structured patient education will receive education targeting their risk factors and receive information about evidence‐based targets. Physician in education clinics will also calculate Framingham risk score and provide a booklet entitled, 'Know your numbers'. Control group: usual care |
| Outcomes | Primary outcome: cardiovascular risk factor control (HbA1c, blood pressure, LDL‐cholesterol, body mass index, and smoking cessation) Medication compliance: assessed by Morisky scale |
| Starting date | June 2014 |
| Contact information | Dr. Samia Almusallam Director of the Family Medicine residency programme Kuwait Institute for Medical Specialization |
| Notes | Anticipated completion date January 2016 but no results posted |
Ogedegbe 2014.
| Study name | Task shifting and blood pressure control in Ghana: a cluster‐randomized trial |
| Methods | Cluster‐randomised trial, parallel group (1:1) assignment |
| Participants | 640 participants with uncomplicated hypertension (BP 140‐179/90‐99 mmHg and absence of target organ damage) from 32 community health centres and district hospitals in Ghana |
| Interventions | The intervention consists of WHO Package CV risk assessment, patient education, initiation and titration of antihypertensive medications, behavioural counselling, and assessment of barriers to adherence Comparison group: usual care |
| Outcomes | Primary outcome: mean change in systolic blood pressure from baseline to 12 months Secondary outcomes: proportion of participants with adequate systolic blood pressure control at 12 months; levels of physical activity; percent change in weight; and dietary intake of fruits and vegetables at 12 months |
| Starting date | May 2013; completion date March 2017 |
| Contact information | Gbenga Ogedegbe, MD, MS, MPH, Center for Healthful Behavior Change, Division of Health & Behavior, Department of Population Health, New York University School of Medicine, 550 1st Avenue, New York, NY 10016 Olugbenga.ogedegbe@nyumc.org |
| Notes | ClinicalTrials.gov ID: NCT01802372 |
Praveen 2013.
| Study name | Systematic Appraisal Referral and Treatment of CVD risk in rural India (SMARTHealth India) |
| Methods | Stepped wedge cluster‐randomised trial |
| Participants | 15,000 adults age 40 years and older at high cardiovascular disease risk from 18 primary health centres and 54 villages in rural Andhra Pradesh |
| Interventions | Intervention group: a mobile device‐based clinical decision support system for non‐physician healthcare workers and primary care doctors to assess and manage CVD risk, provide lifestyle advice, and manage risk factors according to Indian national guidelines. Comparison group: usual care |
| Outcomes | The primary study outcome is the difference in the proportion of people meeting guideline‐recommended blood pressure targets in the intervention period vs the control period. Secondary outcomes include mean reduction in blood pressure levels; change in cardiovascular disease risk factors (BMI, smoking, healthy eating habits, physical activity, self‐reported use of BP and other cardiovascular medicines, quality of life), and CVD event rates (hospitalisation data). |
| Starting date | Fourth quarter of 2013; randomisation planned to continue until first quarter of 2016 |
| Contact information | Devarsetty Praveen, the George Institute for Global Health, Hyderabad, India, dpraveen@georgeinstitute.org.in |
| Notes | — |
Redfern 2014.
| Study name | Consumer Navigation of Electronic Cardiovascular Tools (CONNECT) study |
| Methods | Randomised controlled trial, parallel group (1:1) |
| Participants | 2000 regular adult health service attendees at Australian general practice or Aboriginal Community Controlled Health Services |
| Interventions | Intervention group: will be able to securely access a consumer portal to view participant data uploaded from the clinic record, use interactive tools to view their personal CVD risk and explore relative risk reductions from various CVD management strategies, access healthy lifestyle reminders and motivational message prompts, and connect with peers to set healthy lifestyle goals. Comparison group: usual care |
| Outcomes | Primary outcome: proportion of participants meeting the Australian guideline BP and lipid targets. Secondary outcomes: proportion meeting guideline‐recommended BP and LDL‐cholesterol targets separately, difference in mean systolic and diastolic blood pressure, difference in mean cholesterol levels, difference in mean BMI, difference in health literacy scores, difference in cardiovascular and renal events, physical activity levels, smoking, fruits/vegetable intake, adherence to cardioprotective medications, health‐related quality of life |
| Starting date | October 2014; still recruiting |
| Contact information | Professor Julie Redfern, the George Institute for Global Health, Level 10, King George V Building, Missenden Road, Camperdown NSW 2050, Australia jredfern@georgeinstitute.org.au |
| Notes | Australian New Zealand Clinical Trials Registry number: ACTRN12613000715774 |
Sanghavi 2015.
| Study name | Million hearts: cardiovascular disease risk reduction model |
| Methods | Cluster‐randomised trial (1:1) parallel group |
| Participants | 720 general medical practices, Medicare fee‐for‐service beneficiaries aged 18‐79 years of age without history of myocardial infarction or stroke |
| Interventions | Intervention group: practices will be asked to screen all eligible Medicare beneficiaries for their 10‐year risk of a heart attack or stroke using the American College of Cardiology/American Heart Association (ACC/AHA) 10‐year Atherosclerotic Cardiovascular Disease (ASCVD) pooled cohort risk calculator. For participants at the highest risk (10‐year ASCVD risk > 30%), providers will receive a monthly per beneficiary Cardiovascular Care Management payment to reduce their practice‐wide absolute risk Control group: practices will be asked to report only clinical data (such as age, cholesterol level, and other information) on their attributed Medicare Beneficiaries at years 1, 2, 3, and 5 of the model. Control group practices will be paid a USD 20 per‐beneficiary payment (based on the estimated costs of preparing and transmitting the required data) for each reporting cycle. |
| Outcomes | Population‐wide reduction in 10‐year composite risk and population‐wide reduction in composite incidence of myocardial infarction and stroke. Trial is powered for latter outcome based on Medicare fee‐for‐service claims data. |
| Starting date | January 2016 reported. Trial has not started yet. |
| Contact information | Darshak M Sanghavi, MD, Centers for Medicare and Medicaid Services, Prevention and Population Health Models Group, 7500 Security Blvd, Baltimore, MD 21244 darshak.sanghavi@cms.hhs.gov |
| Notes | Trial conducted by Center for Medicare and Medicaid Innovation |
Silarova 2015.
| Study name | Information and Risk Modification Trial (INFORM) |
| Methods | Randomised controlled trial, parallel group (1:1:1:1) |
| Participants | 932 men and women blood donors with no previous history of CVD aged 40‐94 years in England. |
| Interventions | 4 groups:
|
| Outcomes | Primary outcome: change in objectively measured physical activity Secondary outcomes: objectively measured dietary behaviours, CVD risk factors, medication and healthcare usage, perceived risk, cognitive evaluation of provision of CHD risk scores, psychological outcomes |
| Starting date | January 2015 |
| Contact information | Professor Simon Griffin, Cambridge Institute of Public Health, University of Cambridge School of Clinical Medicine Forvie Site, Cambridge Biomedical Campus, Cambridge CB2 0SR, United Kingdom sjg49@medschl.cam.ac.uk |
| Notes | Participants who took part in the INTERVAL study (www.intervalstudy.org.uk, ISRCTN24760606) and completed their 2‐year questionnaire participate in the INFORM study. |
CVD: cardiovascular disease.
Differences between protocol and review
1. For the main outcomes presented in our Abstract, Plain language summary, and 'Summary of findings' table, we prioritised clinical outcomes (CVD events, adverse events), selected CVD risk factor levels (total cholesterol, systolic blood pressure, and multivariable CVD risk), and commonly prescribed medications for primary CVD prevention (lipid‐lowering medications and antihypertensive medications). We included a mixture of these primary and secondary outcomes because we judged these to be of greatest relevance for stakeholders such as patients, clinicians, policy makers, and guideline developers.
2. We modified the secondary outcome of preventive medication prescribing to 'new or intensified medication prescribing in higher risk participants' to capture the anticipated behaviour change from providing a CVD risk score. Similarly, for the smoking outcome, we reported 'smoking cessation,' the desired behaviour change from providing a CVD risk score.
3. We edited the 'objectives' sentence to include main outcomes including risk factor levels and preventive medication prescribing.
4. We had initially planned on analysing all data at the level of the individual using the intra‐cluster coefficient (ICC) to generate a cluster design effect. However, few studies reported outcome‐specific ICC and estimates varied substantially between trials. After statistical consultation, we meta‐analysed data from cluster‐RCTs using the reported effect estimate with its 95% confidence interval as long as the authors reported using appropriate statistical analyses (e.g. multilevel model, generalised estimating equations) that accounted for clustering (Chapter 16.3.3 of Higgins 2011). All 17 cluster‐RCTs included in this review reported adjusting for clustering in their analyses.
5. We imputed standard deviations for some trials that reported standard errors or 95% confidence intervals (Chapter 16.1.3 of Higgins 2011).
6. We included two post hoc subgroup analyses to identify reasons for heterogeneity. These included subgroups comparing: trials including high‐risk participants only versus trials including all risk levels; and trials incorporating the CVD risk score with health IT versus trials that did not incorporate health IT.
Contributions of authors
KNK ‐ design of review, article screening, data collection, data analysis, data interpretation, manuscript writing
SDP ‐ design of review, article screening, data collection, data interpretation, and manuscript revision for important intellectual content
PP ‐ data interpretation and manuscript revision for important intellectual content
DML‐J ‐ data interpretation and manuscript revision for important intellectual content
MAB ‐ development and execution of database searches, manuscript revision for important intellectual content
MDH ‐ design of review, article screening, data collection, data interpretation, manuscript revision for important intellectual content
Sources of support
Internal sources
Northwestern University, Chicago, IL, USA
External sources
-
National Heart, Lung, and Blood Institute, USA
Cardiovascular Epidemiology and Prevention Training grant (5 T32 HL069771‐11)
This project was supported by the National Institute for Health Research via Cochrane Infrastructure to the Heart Group. The views and opinions expressed therein are those of the authors and do not necessarily reflect those of the Systematic Reviews Programme, NIHR, NHS or the Department of Health, UK
Declarations of interest
KNK ‐ none known. KNK received support from the National Heart, Lung, and Blood Institute training grant in cardiovascular epidemiology and prevention during the conduct of this work (T32 HL069771).
SDP ‐ author on 2 included studies*. SDP receives grant support from Pfizer, Inc. for research outside the submitted work.
PP ‐ none known.
DML‐J ‐ author on 2 included studies*.
MAB ‐ none known.
MDH ‐ MDH receives support from the World Heart Federation to serve as the senior programme advisor for its Emerging Leaders programme, which has been supported by Boehringer Ingelheim, Novartis, Bupa, and AstraZeneca. MDH is also a Cochrane Heart Group satellite coordinating editor and associate editor for JAMA for which he receives compensation from the American Medical Association. MDH also receives travel support from the American Heart Association.
*Note that data extraction and risk of bias assessment for these two trials were performed by authors not involved in the study (KNK and MDH).
Edited (no change to conclusions)
References
References to studies included in this review
Benner 2008 {published data only}
- Benner JS, Cherry SB, Erhardt L, Fernandes M, Flammer M, Gaciong Z, et al. Rationale, design, and methods for the risk evaluation and communication health outcomes and utilization trial (REACH OUT). Contemporary Clinical Trials 2007;28:662-73. [DOI] [PubMed] [Google Scholar]
- Benner JS, Erhardt L, Flammer M, Moller RA, Rajicic N, Changela K, et al. A novel programme to evaluate and communicate 10-year risk of CHD reduces predicted risk and improves patients' modifiable risk factor profile. International Journal of Clinical Practice 2008;62:1484-98. [DOI] [PMC free article] [PubMed] [Google Scholar]
Bertoni 2009 {published data only}
- Bertoni AG, Bonds DE, Chen H, Hogan P, Crago L, Rosenberger E, et al. Impact of a multifaceted intervention on cholesterol management in primary care practices: guideline adherence for heart health randomized trial. Archives of Internal Medicine 2009;169:678-86. [DOI] [PMC free article] [PubMed] [Google Scholar]
British Family Heart 1994 {published data only}
- Family Heart Study Group. British family heart study: its design and method, and prevalence of cardiovascular risk factors. British Journal of General Practice 1994;44:62-7. [PMC free article] [PubMed] [Google Scholar]
- Family Heart Study Group. Randomised controlled trial evaluating cardiovascular screening and intervention in general practice: principal results of British family heart study. BMJ 1994;308:313-20. [PMC free article] [PubMed] [Google Scholar]
Bucher 2010 {published data only}
- Bucher HC, Rickenbach M, Young J, Glass TR, Vallet Y, Bernasconi E, et al. Randomized trial of a computerized coronary heart disease risk assessment tool in HIV-infected patients receiving combination antiretroviral therapy. Antiviral Therapy 2010;15(1):31-40. [DOI] [PubMed] [Google Scholar]
Christensen 2004 {published data only}
- Christensen B, Engberg M, Lauritzen T. No long-term psychological reaction to information about increased risk of coronary heart disease in general practice. European Journal of Cardiovascular Prevention and Rehabilitation 2004;11(3):239-43. [DOI] [PubMed] [Google Scholar]
Cobos 2005 {published data only}
- Cobos A, Vilaseca J, Asenjo C, Pedro-Botet J, Sanchez E, Val A, et al. Cost effectiveness of a clinical decision support system based on the recommendations of the European Society of Cardiology and other societies for the management of hypercholesterolemia: Report of a cluster-randomized trial. Disease Management and Health Outcomes 2005;13(6):421-32. [Google Scholar]
Denig 2014 {published data only}
- Denig P, Dun M, Schuling J, Haaijer-Ruskamp FM, Voorham J. The effect of a patient-oriented treatment decision aid for risk factor management in patients with diabetes (PORTDA-diab): study protocol for a randomised controlled trial. Trials 2012;13:219. [DOI] [PMC free article] [PubMed] [Google Scholar]
- Denig P, Schuling J, Haaijer-Ruskamp F, Voorham J. Effects of a patient oriented decision aid for prioritising treatment goals in diabetes: pragmatic randomised controlled trial. BMJ 2014;349:g5651. [DOI] [PubMed] [Google Scholar]
Eaton 2011 {published and unpublished data}
- Eaton CB, Parker DR, Borkan J, McMurray J, Roberts MB, Lu B, et al. Translating cholesterol guidelines into primary care practice: a multimodal cluster randomized trial. Annals of Family Medicine 2011;9(6):528-37. [DOI] [PMC free article] [PubMed] [Google Scholar]
Edelman 2006 {published data only}
- Edelman D, Oddone EZ, Liebowitz RS, Yancy WS Jr, Olsen MK, Jeffreys AS, et al. A multidimensional integrative medicine intervention to improve cardiovascular risk. Journal of General Internal Medicine 2006;21(7):728-34. [DOI] [PMC free article] [PubMed] [Google Scholar]
Engberg 2002 {published data only}
- Engberg M, Christensen B, Karlsmose B, Lous J, Lauritzen T. Can systematic general health checks and health discussions improve the cardiovascular risk profile in the population?: A randomized and controlled study in general practice with five years follow-up [Kan systematiske generelle helbredsundersøgelser og helbredssamtaler forbedre den kardiovaskulaere risikoprofil i befolkningen?: En randomiseret og kontrolleret undersøgelse i almen praksis med fem års opfølgning]. Ugeskrift for Laeger 2002;164:3354-60. [PubMed] [Google Scholar]
- Engberg M, Christensen B, Karlsmose B, Lous J, Lauritzen T. General health screenings to improve cardiovascular risk profiles: a randomized controlled trial in general practice with 5-year follow-up. Journal of Family Practice 2002;51:546-52. [PubMed] [Google Scholar]
- Lauritzen T, Leboeuf-Yde C, Lunde IM, Nielsen KD. Ebeltoft project: baseline data from a five-year randomized, controlled, prospective health promotion study in a Danish population. British Journal of General Practice 1995;45:542-7. [PMC free article] [PubMed] [Google Scholar]
Grover 2007 {published data only}
- Grover SA, Lowensteyn I, Joseph L, Kaouache M, Marchand S, Coupal L, et al. Discussing coronary risk with patients to improve blood pressure treatment: secondary results from the CHECK-UP study. Journal of General Internal Medicine 2009;24:33-9. [DOI] [PMC free article] [PubMed] [Google Scholar]
- Grover SA, Lowensteyn I, Joseph L, Kaouache M, Marchand S, Coupal L, et al. Patient knowledge of coronary risk profile improves the effectiveness of dyslipidemia therapy - The CHECK-UP study: a randomized controlled trial. Archives of Internal Medicine 2007;167:2296-303. [DOI] [PubMed] [Google Scholar]
Hall 2003 {published data only}
- Hall LM, Jung RT, Leese GP. Controlled trial of effect of documented cardiovascular risk scores on prescribing. BMJ 2003;326:251-2. [DOI] [PMC free article] [PubMed] [Google Scholar]
Hanlon 1995 {published data only}
- Hanlon P, McEwen J, Carey L, Gilmour H, Tannahill C, Tannahill A, et al. Health checks and coronary risk: further evidence from a randomised controlled trial. BMJ 1995;311:1609-13. [DOI] [PMC free article] [PubMed] [Google Scholar]
Hanon 2000 {published data only}
- Hanon O, Franconi G, Mourad JJ, Baleydier A, Croce I, Girerd X. The estimation of cardiovascular risk in hypertensive patients is not modified by management of the hypertension [L'estimation du risque cardiovasculaire chez des patients hypertendus ne modifie pas la prise en charge de l'HTA]. Archives des Maladies du Coeur et des Vaisseaux 2000;93(8):943-7. [PubMed] [Google Scholar]
Hetlevik 1999 {published data only}
- Hetlevik I, Holmen J, Kruger O. Implementing clinical guidelines in the treatment of hypertension in general practice. Evaluation of patient outcome related to implementation of a computer-based clinical decision support system. Scandinavian Journal of Primary Health Care 1999;17:35-40. [DOI] [PubMed] [Google Scholar]
Holt 2010 {published data only}
- Holt TA, Thorogood M, Griffiths F, Munday S, Friede T, Stables D. Automated electronic reminders to facilitate primary cardiovascular disease prevention: randomised controlled trial. British Journal of General Practice 2010;60:e137-43. [DOI] [PMC free article] [PubMed] [Google Scholar]
- Holt TA, Thorogood M, Griffiths F, Munday S. Protocol for the 'e-Nudge trial': A randomised controlled trial of electronic feedback to reduce the cardiovascular risk of individuals in general practice [ISRCTN64828380]. Trials 2006;7:11. [DOI] [PMC free article] [PubMed] [Google Scholar]
Jacobson 2006 {published data only}
- Jacobson TA, Gutkin SW, Harper CR. Effects of a global risk educational tool on primary coronary prevention: the Atherosclerosis Assessment ViaTotal Risk (AVIATOR) study. Current Medical Research and Opinion 2006;22:1065-73. [DOI] [PubMed] [Google Scholar]
Jorgensen 2014 {published data only}
- Baumann S, Toft U, Aadahl M, Jorgensen T, Pisinger C. The long-term effect of screening and lifestyle counseling on changes in physical activity and diet: the Inter99 Study - a randomized controlled trial. International Journal of Behavioral Nutrition and Physical Activity 2015;12:33. [DOI] [PMC free article] [PubMed] [Google Scholar]
- Jorgensen T, Jacobsen RK, Toft U, Aadahl M, Glumer C, Pisinger C. Effect of screening and lifestyle counselling on incidence of ischaemic heart disease in general population: Inter99 randomised trial. BMJ 2014;348:g3617. [DOI] [PMC free article] [PubMed] [Google Scholar]
- Jorgensen T, Ladelund S, Borch-Johnsen K, Pisinger C, Schrader AM, Thomsen T, et al. Screening for risk of cardiovascular disease is not associated with mental distress: the Inter99 study. Preventive Medicine 2009;48:242-6. [DOI] [PubMed] [Google Scholar]
- Pisinger C, Glumer C, Toft U, Huth Smith L, Aadahl M, Borch-Johnsen K, et al. High risk strategy in smoking cessation is feasible on a population-based level. The Inter99 study. Preventive Medicine 2008;46(6):579-84. [DOI] [PubMed] [Google Scholar]
- Toft U, Kristoffersen L, Ladelund S, Ovesen L, Lau C, Borch-Johnsen K, et al. The impact of a population-based multi-factorial lifestyle intervention on changes in long-term dietary habits: the Inter99 study. Preventive Medicine 2008;47(4):378-83. [DOI] [PubMed] [Google Scholar]
- Von Huth Smith L, Ladelund S, Borch-Johnsen K, Jorgensen T. A randomized multifactorial intervention study for prevention of ischaemic heart disease (Inter99): the long-term effect on physical activity. Scandinavian Journal of Public Health 2008;36(4):380-8. [DOI] [PubMed] [Google Scholar]
Koelewijn‐van Loon 2010 {published data only}
- Koelewijn-van Loon MS, Weijden T, Ronda G, Steenkiste B, Winkens B, Elwyn G, et al. Improving lifestyle and risk perception through patient involvement in nurse-led cardiovascular risk management: a cluster-randomized controlled trial in primary care. Preventive Medicine 2010;50(1-2):35-44. [DOI] [PubMed] [Google Scholar]
- Koelewijn-van Loon MS, Weijden T, Steenkiste B, Ronda G, Winkens B, Severens JL, et al. Involving patients in cardiovascular risk management with nurse-led clinics: a cluster randomized controlled trial. Canadian Medical Association Journal 2009;181(12):E267-E274. [DOI] [PMC free article] [PubMed] [Google Scholar]
- Koelewijn-van Loon MS, Steenkiste B, Ronda G, Wensing M, Stoffers HE, Elwyn G, et al. Improving patient adherence to lifestyle advice (IMPALA): a cluster-randomised controlled trial on the implementation of a nurse-led intervention for cardiovascular risk management in primary care [protocol]. BMC Health Services Research 2008;8:9. [DOI] [PMC free article] [PubMed] [Google Scholar]
Krones 2008 {published data only}
- Keller H, Krones T, Becker A, Hirsch O, Sonnichsen AC, Popert U, et al. Arriba: effects of an educational intervention on prescribing behaviour in prevention of CVD in general practice. European Journal of Preventive Cardiology 2012;19(3):322-9. [DOI] [PubMed] [Google Scholar]
- Krones T, Keller H, Sonnichsen A, Sadowski EM, Baum E, Wegscheider K, et al. Absolute cardiovascular disease risk and shared decision making in primary care: a randomized controlled trial. Annals of Family Medicine 2008;6:218-27. [DOI] [PMC free article] [PubMed] [Google Scholar]
Lopez‐Gonzalez 2015 {published data only}
- Lopez-Gonzalez AA, Aguilo A, Frontera M, Bennasar-Veny M, Campos I, Vicente-Herrero T, et al. Effectiveness of the Heart Age tool for improving modifiable cardiovascular risk factors in a Southern European population: a randomized trial. European Journal of Preventive Cardiology 2015;22(3):389-96. [DOI] [PubMed] [Google Scholar]
Lowensteyn 1998 {published data only}
- Lowensteyn I, Joseph L, Levinton C, Abrahamowicz M, Steinert Y, Grover S. Can computerized risk profiles help patients improve their coronary risk? The results of the Coronary Health Assessment Study (CHAS). Preventive Medicine 1998;27(5 Pt 1):730-7. [DOI] [PubMed] [Google Scholar]
Mann 2010 {published data only}
- Mann DM, Ponieman D, Montori VM, Arciniega J, McGinn T. The Statin Choice decision aid in primary care: a randomized trial. Patient Education and Counseling 2010;80:138-140. [DOI] [PubMed] [Google Scholar]
Montgomery 2000 {published data only}
- Fahey T, Montgomery AA, Peters TJ. Randomized trial evaluating the framing of cardiovascular risk and its impact on blood pressure control [ISRCTN87597585]. BMC Health Services Research 2001;1:10. [DOI] [PMC free article] [PubMed] [Google Scholar]
- Montgomery AA, Fahey T, Peters TJ, MacIntosh C, Sharp DJ. Evaluation of computer based clinical decision support system and risk chart for management of hypertension in primary care: randomised controlled trial. BMJ 2000;320:686-90. [DOI] [PMC free article] [PubMed] [Google Scholar]
Montgomery 2003 {published data only}
- Emmett CL, Montgomery AA, Peters TJ, Fahey T. Three-year follow-up of a factorial randomised controlled trial of two decision aids for newly diagnosed hypertensive patients. British Journal of General Practice 2005;55:551-3. [PMC free article] [PubMed] [Google Scholar]
- Montgomery AA, Fahey T, Peters TJ. A factorial randomised controlled trial of decision analysis and an information video plus leaflet for newly diagnosed hypertensive patients. British Journal of General Practice 2003;53:446-53. [PMC free article] [PubMed] [Google Scholar]
Peiris 2015 {published data only}
- Panaretto KS, Peiris D, Usherwood T, Harris M, Hunt J, Patel A. Health Tracker: does electronic decision support improve identification and management of cardiovascular risk in Australian primary health care? Circulation 2012;125:e808. [Google Scholar]
- Peiris D, Usherwood T, Panaretto K, Harris M, Hunt J, Patel B, et al. The treatment of cardiovascular risk in primary care using electronic decision support (TORPEDO) study: Intervention development and protocol for a cluster randomised, controlled trial of an electronic decision support and quality improvement intervention in Australian primary healthcare. BMJ Open 2012;2(6):e002177. [DOI] [PMC free article] [PubMed] [Google Scholar]
- Peiris D, Usherwood T, Panaretto K, Harris M, Hunt J, Redfern J, et al. Effect of a computer-guided, quality improvement program for cardiovascular disease risk management in primary health care: the treatment of cardiovascular risk using electronic decision support cluster-randomized trial. Circulation: Cardiovascular Quality and Outcomes 2015;8:87-95. [DOI] [PubMed] [Google Scholar]
- Peiris D, Usherwood T, Panaretto K, Harris M, Hunt J, Zwar N, et al. Effect of a multi-faceted quality improvement intervention to improve cardiovascular disease risk identification and management in Australian primary health care: the torpedo cluster-randomised trial. Global Heart 2014;9:e28. [Google Scholar]
Perestelo‐Perez 2016 {published data only}
- Perestelo-Perez L, Rivero-Santana A, Boronat M, Sanchez-Afonso JA, Perez-Ramos J, Montori VM, et al. Effect of the statin choice encounter decision aid in Spanish patients with type 2 diabetes: a randomized trial. Patient Education and Counseling 2016;99(2):295-9. [DOI] [PubMed] [Google Scholar]
Persell 2013 {published data only}
- Persell SD, Lloyd-Jones DM, Friesema EM, Cooper AJ, Baker DW. Electronic health record-based patient identification and individualized mailed outreach for primary cardiovascular disease prevention: a cluster randomized trial. Journal of General Internal Medicine 2013;28(4):554-60. [DOI] [PMC free article] [PubMed] [Google Scholar]
- Persell SD, Lloyd-Jones DM, Friesma EM, Cooper AJ, Baker DW. Electronic health record-based patient identification and individualized mailed outreach for primary cardiovascular disease prevention: a cluster randomized trial. Journal of General Internal Medicine 2012;27:S181-2. [DOI] [PMC free article] [PubMed] [Google Scholar]
Persell 2015 {published data only}
- Persell SD, Brown T, Lee JY, Shah S, Henley E, Long T, et al. Individualized risk communication and outreach for primary cardiovascular disease prevention in community health centers: randomized trial. Circulation: Cardiovascular Quality and Outcomes 2015;8(6):560-6. [DOI] [PubMed] [Google Scholar]
- Persell SD, Shah S, Brown T, Lee JY, Sanchez T, Knight RG, et al. Individualized risk communication and lay outreach for the primary prevention of cardiovascular disease in community health centers: a randomized controlled trial. Circulation 2014;130:A14008. [DOI] [PubMed] [Google Scholar]
- Shah S, Brown T, Lee JY, Jean-Jacques M, Kandula NR, Persell SD. Individualized risk communication and lay outreach for the primary prevention of cardiovascular disease in community health centers: preliminary results of a randomized controlled trial. Journal of General Internal Medicine 2014;29:S126. [Google Scholar]
Price 2011 {published data only}
- Price HC, Griffin SJ, Holman RR. Impact of personalized cardiovascular disease risk estimates on physical activity-a randomized controlled trial. Diabetic Medicine 2011;28(3):363-72. [DOI] [PubMed] [Google Scholar]
- Price HC, Tucker L, Griffin SJ, Holman RR. The impact of individualised cardiovascular disease (CVD) risk estimates and lifestyle advice on physical activity in individuals at high risk of CVD: a pilot 2 x 2 factorial understanding risk trial. Cardiovascular Diabetology 2008;7:21. [DOI] [PMC free article] [PubMed] [Google Scholar]
Sheridan 2006 {published data only}
- Sheridan SL, Shadle J, Simpson RJ Jr, Pignone MP. The impact of a decision aid about heart disease prevention on patients' discussions with their doctor and their plans for prevention: a pilot randomized trial. BMC Health Services Research 2006;6:121. [DOI] [PMC free article] [PubMed] [Google Scholar]
Sheridan 2011 {published data only}
- Sheridan SL, Draeger LB, Pignone MP, Keyserling TC, Simpson RJ Jr, Rimer B, et al. A randomized trial of an intervention to improve use and adherence to effective coronary heart disease prevention strategies. BMC Health Services Research 2011;11:331. [DOI] [PMC free article] [PubMed] [Google Scholar]
- Sheridan SL, Draeger LB, Pignone MP, Rimer B, Bangdiwala SI, Cai J, et al. The effect of a decision aid intervention on decision making about coronary heart disease risk reduction: secondary analyses of a randomized trial. BMC Medical Informatics and Decision Making 2014;14:14. [DOI] [PMC free article] [PubMed] [Google Scholar]
Soureti 2011 {published data only}
- Soureti A, Murray P, Cobain M, Mechelen W, Hurling R. Web-based risk communication and planning in an obese population: exploratory study. Journal of Medical Internet Research 2011;13:e100. [DOI] [PMC free article] [PubMed] [Google Scholar]
Turner 2012 {published data only}
- Turner BJ, Hollenbeak CS, Liang Y, Pandit K, Joseph S, Weiner MG. A randomized trial of peer coach and office staff support to reduce coronary heart disease risk in African-Americans with uncontrolled hypertension. Journal General Internal Medicine 2012;27:1258-64. [DOI] [PMC free article] [PubMed] [Google Scholar]
Vagholkar 2014 {published and unpublished data}
- Vagholkar S, Zwar N, Jayasinghe UW, Denney-Wilson E, Patel A, Campbell T, et al. Influence of cardiovascular absolute risk assessment on prescribing of antihypertensive and lipid-lowering medications: a cluster randomized controlled trial. American Heart Journal 2014;167(1):28-35. [DOI] [PubMed] [Google Scholar]
- Wan Q, Harris MF, Zwar N, Campbell T, Patel A, Vagholkar S, et al. Study protocol for a randomized controlled trial: the feasibility and impact of cardiovascular absolute risk assessment in Australian general practice. American Heart Journal 2009;157:436-41. [DOI] [PubMed] [Google Scholar]
Van Steenkiste 2007 {published data only}
- Van Steenkiste B, Weijden T, Stoffers HE, Kester AD, Timmermans DR, Grol R. Improving cardiovascular risk management: a randomized, controlled trial on the effect of a decision support tool for patients and physicians. European Journal of Prevention and Rehabilitation 2007;14:44-50. [DOI] [PubMed] [Google Scholar]
- Van Steenkiste B, Weijden TM, Stoffers JH, Grol RP. Patients' responsiveness to a decision support tool for primary prevention of cardiovascular diseases in primary care 1498. Patient Education and Counseling 2008;72(1):63-70. [DOI] [PubMed] [Google Scholar]
Webster 2010 {published data only}
- Webster R, Li SCh, Sullivan DR, Jayne K, Su SY, Neal B. Effects of internet-based tailored advice on the use of cholesterol-lowering interventions: a randomized controlled trial. Journal of Medical Internet Research 2010;12(3):e42. [DOI] [PMC free article] [PubMed] [Google Scholar]
Welschen 2012 {published data only}
- Welschen LM, Bot SD, Dekker JM, Timmermans DR, Weijden T, Nijpels G. The @RISK Study: Risk communication for patients with type 2 diabetes: design of a randomised controlled trial. BMC Public Health 2010;10:457. [DOI] [PMC free article] [PubMed] [Google Scholar]
- Welschen LM, Bot SD, Kostense PJ, Dekker JM, Timmermans DR, Weijden T, et al. Effects of cardiovascular disease risk communication for patients with type 2 diabetes on risk perception in a randomized controlled trial: the @RISK study. Diabetes Care 2012;35:2485-92. [DOI] [PMC free article] [PubMed] [Google Scholar]
- Welschen LMC, Bot SDM, Weijden T, Timmermans DRM, Dekker JM, Nijpels G. Cardiovascular disease risk communication for patients with type 2 diabetes: the @RISK study. Diabetologia 2010;53:S487. [Google Scholar]
Williams 2006 {published data only}
- Williams GC, McGregor H, Sharp D, Kouides RW, Levesque CS, Ryan RM, et al. A self-determination multiple risk intervention trial to improve smokers' health. Journal of General Internal Medicine 2006;21:1288-94. [DOI] [PMC free article] [PubMed] [Google Scholar]
- Williams GC, Minicucci DS, Kouides RW, Levesque CS, Chirkov VI, Ryan RM, et al. Self-determination, smoking, diet and health. Health Education Research 2002;17(5):512-21. [DOI] [PubMed] [Google Scholar]
Wister 2007 {published data only}
- Wister A, Loewen N, Kennedy-Symonds H, McGowan B, McCoy B, Singer J. One-year follow-up of a therapeutic lifestyle intervention targeting cardiovascular disease risk. Canadian Medical Association Journal 2007;177(8):859-65. [DOI] [PMC free article] [PubMed] [Google Scholar]
Zullig 2014 {published data only}
- Zullig LL, Sanders LL, Shaw RJ, McCant F, Danus S, Bosworth HB. A randomised controlled trial of providing personalised cardiovascular risk information to modify health behaviour. Journal of Telemedicine and Telecare 2014;20:147-52. [DOI] [PubMed] [Google Scholar]
References to studies excluded from this review
Ajay 2014 {published data only}
- Ajay VS, Tian M, Chen H, Wu Y, Li X, Dunzhu D, et al. A cluster-randomized controlled trial to evaluate the effects of a simplified cardiovascular management program in Tibet, China and Haryana, India: study design and rationale. BMC Public Health 2014;14:924. [DOI] [PMC free article] [PubMed] [Google Scholar]
Allen 2011 {published data only}
- Allen JK, Dennison-Himmelfarb CR, Szanton SL, Bone L, Hill MN, Levine DM, et al. Community Outreach and Cardiovascular Health (COACH) Trial: a randomized, controlled trial of nurse practitioner/community health worker cardiovascular disease risk reduction in urban community health centers. Circulation: Cardiovascular Quality and Outcomes 2011;4(6):595-602. [DOI] [PMC free article] [PubMed] [Google Scholar]
Avis 1989 {published data only}
- Avis NE, Smith KW, McKinlay JB. Accuracy of perceptions of heart attack risk: what influences perceptions and can they be changed? American Journal of Public Health 1989;79(12):1608-12. [DOI] [PMC free article] [PubMed] [Google Scholar]
Baruth 2011 {published data only}
- Baruth M, Wilcox S, Sallis JF, King AC, Marcus BH, Blair SN. Changes in CVD risk factors in the activity counseling trial. International Journal of General Medicine 2011;4:53-62. [DOI] [PMC free article] [PubMed] [Google Scholar]
Berra 2007 {published data only}
- Berra K, Ma J, Klieman L, Hyde S, Monti V, Guardado A, et al. Implementing cardiac risk-factor case management: lessons learned in a county health system. Critical Pathways in Cardiology 2007;6:173-9. [DOI] [PubMed] [Google Scholar]
Bjarnason‐Wehrens 2013 {published data only}
- Bjarnason-Wehrens B, Albus C, Heming C, Gysan D, Herold G, Latsch J, et al. Can a multimodale intervention improve exercise capacity in patients with high cardiovascular risk on a sustained basis-the PreFord-study. European Journal of Preventive Cardiology 2013;20:S3. [Google Scholar]
- Predel HG, Gysan DB, Albus C, Bjarnason-Wehrens B, Gohlke H, Latsch J, et al. Substantial improvement of primary cardiovascular prevention by a systematic score-based multimodal and lifestyle approach: a randomized endpoint-study-the Preford-study. Circulation 20115;132:A17097. [DOI] [PubMed] [Google Scholar]
Black 2014 {published data only}
- Black JA, Sharp SJ, Wareham NJ, Sandbaek A, Rutten GE, Lauritzen T, et al. Does early intensive multifactorial therapy reduce modelled cardiovascular risk in individuals with screen-detected diabetes? Results from the ADDITION-Europe cluster randomized trial. Diabetic Medicine 2014;31:647-656. [DOI] [PMC free article] [PubMed] [Google Scholar]
Botija‐Yague 2007 {published data only}
- Botija-Yague MP, Lizan-Tudela L, Gosalbes-Soler V, Bonet-Pla A, Fornos-Garrigos A. How does intensive therapy to control cardiovascular risk factors affect health-related quality of life in diabetic patients? [¿Cómo influye el trata- miento intensivo de los factores de riesgo cardiovascular en la calidad de vida relacionada con la salud de los pacientes diabéticos?]. Atencion Primaria 2007;39:227-34. [DOI] [PMC free article] [PubMed] [Google Scholar]
Branda 2013 {published data only}
- Branda ME, LeBlanc A, Shah ND, Tiedje K, Ruud K, Van Houten H, et al. Shared decision making for patients with type 2 diabetes: a randomized trial in primary care. BMC Health Services Research 2013;13:301. [DOI] [PMC free article] [PubMed] [Google Scholar]
Brett 2012 {published data only}
- Brett T, Arnold-Reed D, Phan C, Cadden F, Walker W, Manea-Walley W, et al. The Fremantle Primary Prevention Study: a multicentre randomised trial of absolute cardiovascular risk reduction. British Journal of General Practice 2012;62:e22-8. [DOI] [PMC free article] [PubMed] [Google Scholar]
Bruckert 2008 {published data only}
- Bruckert E, Giral P, Paillard F, Ferrières J, Schlienger JL, Renucci JF, et al. Effect of an educational program (PEGASE) on cardiovascular risk in hypercholesterolaemic patients. Cardiovascular Drugs and Therapy 2008;22:495-505. [DOI] [PubMed] [Google Scholar]
Carrington 2012 {published data only}
- Carrington MJ, Schute F, Haluska B, Marwick TH, Holliday J, Stewart S. Preliminary results of the impress study: reducing cardiovascular risk factors in a nurse-led primary intervention program for high risk participants. European Heart Journal 2012;33:1063. [Google Scholar]
CARRS 2012 {published data only}
- CARRS Trial Writing Group, Shah S, Singh K, Ali MK, Mohan V, Kadir MM, et al. Improving diabetes care: multi-component cardiovascular disease risk reduction strategies for people with diabetes in South Asia--the CARRS multi-center translation trial. Diabetes Research and Clinical Practice 2012;98(2):285-94. [DOI] [PMC free article] [PubMed] [Google Scholar]
Carter 2009 {published data only}
- Carter M, Karwalajtys T, Chambers L, Kaczorowski J, Dolovich L, Gierman T, et al. Implementing a standardized community-based cardiovascular risk assessment program in 20 Ontario communities. Health Promotion International 2009;24(4):325-33. [DOI] [PubMed] [Google Scholar]
Carter 2015 {published data only}
- Carter BL, Coffey CS, Chrischilles EA, Ardery G, Ecklund D, Gryzlak B, et al. A cluster-randomized trial of a centralized clinical pharmacy cardiovascular risk service to improve guideline adherence. Pharmacotherapy 2015;35(7):653-62. [DOI] [PMC free article] [PubMed] [Google Scholar]
Chow 2009 {published data only}
- Chow CK, Joshi R, Gottumukkala AK, Raju K, Raju R, Reddy S, et al. Rationale and design of the Rural Andhra Pradesh Cardiovascular Prevention Study (RAPCAPS): a factorial, cluster-randomized trial of 2 practical cardiovascular disease prevention strategies developed for rural Andhra Pradesh, India. American Heart Journal 2009;158:349-55. [DOI] [PubMed] [Google Scholar]
Claes 2007 {published data only}
- Claes N, Jacobs N. The PreCardio-study protocol--a randomized clinical trial of a multidisciplinary electronic cardiovascular prevention programme. BMC Cardiovascular Disorders 2007;7:27. [DOI] [PMC free article] [PubMed] [Google Scholar]
Cleveringa 2008 {published data only}
- Cleveringa FG, Gorter KJ, den Donk M, Rutten GE. Combined task delegation, computerized decision support, and feedback improve cardiovascular risk for type 2 diabetic patients: a cluster randomized trial in primary care. Diabetes Care 2008;31:2273-5. [DOI] [PMC free article] [PubMed] [Google Scholar]
- Cleveringa FG, Welsing PM, den Donk M, Gorter KJ, Niessen LW, Rutten GE, et al. Cost-effectiveness of the diabetes care protocol, a multifaceted computerized decision support diabetes management intervention that reduces cardiovascular risk. Diabetes Care 2010;33(2):258-63. [DOI] [PMC free article] [PubMed] [Google Scholar]
- Cleveringa FGW, Gorter KJ, den Donk M, Rutten GEH. Task delegation and computerised decision support improve cardiovascular risk for type 2 diabetes patients. A randomised controlled trial in primary care. Diabetologia 2007;50:S117. [Google Scholar]
Cochrane 2012 {published data only}
- Cochrane T, Davey R, Iqbal Z, Gidlow C, Kumar J, Chambers R, et al. NHS health checks through general practice: randomised trial of population cardiovascular risk reduction. BMC Public Health 2012;12:944. [DOI] [PMC free article] [PubMed] [Google Scholar]
Colwell 2011 {published data only}
- Colwell B, Mathers N, Bradley A, Ng CJ. Does a PDA improve knowledge about treatment choices for patients with type 2 diabetes mellitus when making decisions about starting insulin? Quantitative analysis from the PANDAs study. Diabetologia 2011;54:S406. [Google Scholar]
Daniels 2012 {published data only}
- Daniels EC, Powe BD, Metoyer T, McCray G, Baltrus P, Rust GS. Increasing knowledge of cardiovascular risk factors among African Americans by use of community health workers: the ABCD community intervention pilot project. Journal of the National Medical Association 2012;104(3-4):179-85. [DOI] [PMC free article] [PubMed] [Google Scholar]
Deales 2014 {published data only}
- Deales A, Fratini M, Romano S, Rappelli A, Penco M, Perna GP, et al. Care manager to control cardiovascular risk factors in primary care: the Raffaello cluster randomized trial. Nutrition, Metabolism & Cardiovascular Diseases 2014;24:563-71. [DOI] [PubMed] [Google Scholar]
- Romano S, Rappelli A, Musilli A, Perna G, Fratini M, Manzoli L, et al. Project Raffaello: Application and evaluation of the disease and care management approach in cardiovascular disease prevention. European Heart Journal 2011;32:219. [Google Scholar]
Dresser 2009 {published data only}
- Dresser GK, Moor R, Khan R, Khanna R, Har BJ. Compliance with prescribed therapy and patient perceptions in the treatment of hypertension. Journal of Clinical Hypertension 2009;11:A57. [Google Scholar]
Edwards 2006 {published data only}
- Edwards A, Thomas R, Williams R, Ellner AL, Brown P, Elwyn G. Presenting risk information to people with diabetes: evaluating effects and preferences for different formats by a web-based randomised controlled trial. Patient Education and Counseling 2006;63:336-49. [DOI] [PubMed] [Google Scholar]
El Fakiri 2008 {published data only}
- El Fakiri F, Bruijnzeels MA, Uitewaal PJ, Frenken RA, Berg M, Hoes AW. Intensified preventive care to reduce cardiovascular risk in healthcare centres located in deprived neighbourhoods: a randomized controlled trial. European Journal of Cardiovascular Prevention and Rehabilitation 2008;15:488-93. [DOI] [PubMed] [Google Scholar]
Evans 2010 {published data only}
- Evans CD, Eurich DT, Taylor JG, Blackburn DF. The Collaborative Cardiovascular Risk Reduction in Primary Care (CCARP) study. Pharmacotherapy 2010;30(8):766-75. [DOI] [PubMed] [Google Scholar]
Fabregas 2014 {published data only}
- Fàbregas M, Berges I, Fina F, Hermosilla E, Coma E, Méndez L, et al. Effectiveness of an intervention designed to optimize statins use: a primary prevention randomized clinical trial. BMC Family Practice 2014;15:135. [DOI] [PMC free article] [PubMed] [Google Scholar]
Fretheim 2006 {published data only}
- Fretheim A, Oxman AD, Havelsrud K, Treweek S, Kristoffersen DT, Bjorndal A. Rational prescribing in primary care (RaPP): a cluster randomized trial of a tailored intervention. PLOS Medicine 2006;3(6):e134. [DOI] [PMC free article] [PubMed] [Google Scholar]
- Fretheim A, Oxman AD, Treweek S, Bjorndal A. Rational Prescribing in Primary Care (RaPP-trial). A randomised trial of a tailored intervention to improve prescribing of antihypertensive and cholesterol-lowering drugs in general practice [ISRCTN48751230]. BMC Health Services Research 2003;3:5. [DOI] [PMC free article] [PubMed] [Google Scholar]
Freund 2015 {published data only}
- Freund N, Friedli BC, Junker T, Zimmermann M, Zellweger MJ. Cardiovascular risk assessment and effects on behavior in Switzerland: the Swiss Heart Foundation HerzCheck(R)/Cardio-Test(R). Open Cardiovascular Medicine Journal 2015;9:35-9. [DOI] [PMC free article] [PubMed] [Google Scholar]
Gill 2009 {published data only}
- Gill JM, Chen YX, Glutting JJ, Diamond JJ, Lieberman MI. Impact of decision support in electronic medical records on lipid management in primary care. Population Health Management 2009;12(5):221-6. [DOI] [PubMed] [Google Scholar]
Gomez‐Marcos 2006 {published data only}
- Gomez-Marcos MA, Ortiz LG, Gonzalez-Elena LJ, Rodriguez AS. Effectiveness of an intervention to improve quality care in reducing cardiovascular risk in hypertensive patients [Efectividad de una intervención de mejora de calidad en la reducción del riesgo coronario y del riesgo de mortalidad cardiovascular en pacientes hipertensos]. Atencion Primaria 2006;37:498-503. [DOI] [PMC free article] [PubMed] [Google Scholar]
Green 2014 {published data only}
- Green BB, Anderson ML, Cook AJ, Catz S, Fishman PA, McClure JB, et al. e-Care for heart wellness: a feasibility trial to decrease blood pressure and cardiovascular risk. American Journal of Preventive Medicine 2014;46(4):368-77. [DOI] [PMC free article] [PubMed] [Google Scholar]
Harmsen 2014 {published data only}
- Harmsen CG, Jarbøl DE, Nexøe J, Støvring H, Gyrd-Hansen D, Nielsen JB, et al. Impact of effectiveness information format on patient choice of therapy and satisfaction with decisions about chronic disease medication: the Influence of intervention Methodologies on Patient Choice of Therapy (IMPACT) cluster-randomised trial in general practice. BMC Health Services Research 2013;13:76. [DOI] [PMC free article] [PubMed] [Google Scholar]
- Harmsen CG, Kristiansen IS, Larsen PV, Nexoe J, Stovring H, Gyrd-Hansen D, et al. Communicating risk using absolute risk reduction or prolongation of life formats: cluster-randomised trial in general practice. The British Journal of General Practice 2014;64(621):e199-207. [DOI] [PMC free article] [PubMed] [Google Scholar]
Holbrook 2011 {published data only}
- Holbrook A, Pullenayegum E, Thabane L, Troyan S, Foster G, Keshavjee K, et al. Shared electronic vascular risk decision support in primary care: Computerization of Medical Practices for the Enhancement of Therapeutic Effectiveness (COMPETE III) randomized trial. Archives of Internal Medicine 2011;171(19):1736-44. [DOI] [PubMed] [Google Scholar]
Hormigo‐Pozo 2009 {published data only}
- Hormigo-Pozo A, Viciana-Lopez MA, Gomez-Jimenez L, Gallego-Parrilla MD, Orellana-Lozano J, Morales-Asencio JM. Improved effectiveness in the management of cardiovascular risk among type 2 diabetic patients in primary health care [Mejora de la efectividad en el manejo del riesgo cardiovascular de pacientes diabéticos tipo 2 en atención primaria]. Atencion Primaria 2009;41:240-5. [DOI] [PMC free article] [PubMed] [Google Scholar]
Huntink 2013 {published data only}
- Huntink E, Heijmans N, Wensing M, Lieshout J. Effectiveness of a tailored intervention to improve cardiovascular risk management in primary care: study protocol for a randomised controlled trial. Trials 2013;14(1):433. [DOI] [PMC free article] [PubMed] [Google Scholar]
Ishani 2011 {published data only}
- Ishani A, Greer N, Taylor BC, Kubes L, Cole P, Atwood M, et al. Effect of nurse case management compared with usual care on controlling cardiovascular risk factors in patients with diabetes: a randomized controlled trial. Diabetes Care 2011;34:1689-94. [DOI] [PMC free article] [PubMed] [Google Scholar]
Jacobs 2011 {published data only}
- Jacobs N, Drost R, Ament A, Evers S, Claes N. Willingness to pay for a cardiovascular prevention program in highly educated adults: a randomized controlled trial. International Journal of Technology Assessment in Health Care 2011;27(4):283-9. [DOI] [PubMed] [Google Scholar]
Jennings 2006 {published data only}
- Jennings C, Wood D. EUROACTION: a family-based preventive cardiology programme in primary care. Practical Cardiovascular Risk Management 2006;4:12-15. [Google Scholar]
Jones 2009 {published data only}
- Jones LA, Weymiller AJ, Shah N, Bryant SC, Christianson TJ, Guyatt GH, et al. Should clinicians deliver decision aids? Further exploration of the statin choice randomized trial results. Medical Decision Making 2009;29:468-74. [DOI] [PubMed] [Google Scholar]
Kaczorowski 2011 {published data only}
- Kaczorowski J, Chambers LW, Dolovich L, Paterson JM, Karwalajtys T, Gierman T, et al. Improving cardiovascular health at population level: 39 community cluster randomised trial of Cardiovascular Health Awareness Program (CHAP). BMJ 2011;342:d442. [DOI] [PMC free article] [PubMed] [Google Scholar]
- Kaczorowski J, Chambers LW, Karwalajtys T, Dolovich L, Farrell B, McDonough B, et al. Cardiovascular Health Awareness Program (CHAP): a community cluster-randomised trial among elderly Canadians. Preventive Medicine 2008;46(6):537-44. [DOI] [PubMed] [Google Scholar]
- Kaczorowski JA, Chambers LW, Dolovich L, Farrell B, McDonough B, Sebaldt R, et al. Improving cardiovascular health at the population level: a 39 community cluster randomized trial of the Cardiovascular Health Awareness Program (C-CHAP). Stroke 2010;41:e474. [Google Scholar]
Ketola 2001 {published data only}
- Ketola E, Mäkelä M, Klockars M. Individualised multifactorial lifestyle intervention trial for high-risk cardiovascular patients in primary care. British Journal of General Practice 2001;51:291-4. [PMC free article] [PubMed] [Google Scholar]
Keyserling 2014 {published data only}
- Keyserling TC, Sheridan SL, Draeger LB, Finkelstein EA, Gizlice Z, Kruger E, et al. A comparison of live counseling with a web-based lifestyle and medication intervention to reduce coronary heart disease risk: a randomized clinical trial. JAMA Internal Medicine 2014;174(7):1144-57. [DOI] [PMC free article] [PubMed] [Google Scholar]
- Sheridan SL, Draeger LB, Pignone MP, Sloane PD, Samuel-Hodge C, Finkelstein EA, et al. Designing and implementing a comparative effectiveness study of two strategies for delivering high quality CHD prevention: methods and participant characteristics for the Heart to Health study. Contemporary Clinical Trials 2013;36(2):394-405. [DOI] [PMC free article] [PubMed] [Google Scholar]
- Sheridan SL, Keyserling TC, Draeger LB. A randomized trial of a web-based versus counselor based intervention to reduce CHD risk. Journal of General Internal Medicine 2013;28:S13. [Google Scholar]
Kullo 2016 {published data only}
- Brown SA, Jouni H, Austin E, Marroush T, Kullo I. Effect of disclosure of genetic risk for coronary heart disease on information seeking and information sharing in a randomized clinical trial (from the MI-GENES Investigators). Circulation 2015;132:A16508. [Google Scholar]
- Kullo IJ, Jouni H, Austin EE, Brown SA, Kruisselbrink TM, Isseh IN, et al. Incorporating a genetic risk score into coronary heart disease risk estimates: effect on low-density lipoprotein cholesterol levels (the MI-GENES Clinical Trial). Circulation 2016;133(12):1181-8. [DOI] [PMC free article] [PubMed] [Google Scholar]
- Kullo IJ, Jouni H, Olson JE, Montori VM, Bailey KR. Design of a randomized controlled trial of disclosing genomic risk of coronary heart disease: the Myocardial Infarction Genes (MI-GENES) study. BMC Medical Genomics 2015;8:51. [DOI] [PMC free article] [PubMed] [Google Scholar]
- Robinson CL, Jouni H, Kruisselbrink TM, Austin EE, Christensen KD, Green RC, et al. Disclosing genetic risk for coronary heart disease: effects on perceived personal control and genetic counseling satisfaction. Clinical Genetics 2016;89(2):251-7. [DOI] [PMC free article] [PubMed] [Google Scholar]
- Robinson CL, Jouni H, Kruisselbrink TM, Christensen KD, Green RC, Kullo IJ. The effect of disclosing genetic risk for coronary heart disease on perceived personal control and genetic counseling satisfaction: the MI-genes study. Circulation 2014;130:A20188. [DOI] [PMC free article] [PubMed] [Google Scholar]
Laan 2012 {published data only}
- Laan EK, Kraaijenhagen RA, Peek N, Busschers WB, Deutekom M, Bossuyt PM, et al. Effectiveness of a web-based health risk assessment with individually-tailored feedback on lifestyle behaviour: study protocol. BMC Public Health 2012;12:200. [DOI] [PMC free article] [PubMed] [Google Scholar]
Lalonde 2004 {published data only}
- Lalonde L, O'Connor AM, Drake E, Duguay P, Lowensteyn I, Grover SA. Development and preliminary testing of a patient decision aid to assist pharmaceutical care in the prevention of cardiovascular disease. Pharmacotherapy 2004;24:909-22. [DOI] [PubMed] [Google Scholar]
Lalonde 2006 {published data only}
- Lalonde L, O'Connor AM, Duguay P, Brassard J, Drake E, Grover SA. Evaluation of a decision aid and a personal risk profile in community pharmacy for patients considering options to improve cardiovascular health: the OPTIONS pilot study. International Journal of Pharmacy Practice 2006;14:51-62. [Google Scholar]
Lauritzen 2008 {published data only}
- Lauritzen T, Jensen MS, Thomsen JL, Christensen B, Engberg M. Health tests and health consultations reduced cardiovascular risk without psychological strain, increased healthcare utilization or increased costs. An overview of the results from a 5-year randomized trial in primary care. The Ebeltoft Health Promotion Project (EHPP). Scandinavian Journal of Public Health 2008;36(6):650-61. [DOI] [PubMed] [Google Scholar]
Liddy 2015 {published data only}
- Liddy C, Hogg W, Russell G, Wells G, Armstrong CD, Akbari A, et al. Improved delivery of cardiovascular care (IDOCC) through outreach facilitation: study protocol and implementation details of a cluster randomized controlled trial in primary care. Implementation Science 2011;6(1):110. [DOI] [PMC free article] [PubMed] [Google Scholar]
- Liddy C, Hogg W, Singh J, Taljaard M, Russell G, Deri Armstrong C, et al. A real-world stepped wedge cluster randomized trial of practice facilitation to improve cardiovascular care. Implementation Science 2015;10:150. [DOI] [PMC free article] [PubMed] [Google Scholar]
Lindholm 1995 {published data only}
- Lindholm LH, Ekbom T, Dash C, Eriksson M, Tibblin G, Scherstén B. The impact of health care advice given in primary care on cardiovascular risk. BMJ 1995;310:1105-9. [DOI] [PMC free article] [PubMed] [Google Scholar]
Ma 2009 {published data only}
- Ma J, Berra K, Haskell WL, Klieman L, Hyde S, Smith MW, et al. Case management to reduce risk of cardiovascular disease in a county health care system. Archives of Internal Medicine 2009;169(21):1988-95. [DOI] [PMC free article] [PubMed] [Google Scholar]
Mendis 2010 {published data only}
- Mendis S, Johnston SC, Fan W, Oladapo O, Cameron A, Faramawi MF. Cardiovascular risk management and its impact on hypertension control in primary care in low-resource settings: a cluster-randomized trial. Bulletin of the World Health Organization 2010;88(6):412-9. [DOI] [PMC free article] [PubMed] [Google Scholar]
Mills 2010 {published data only}
- Mills M, Loney P, Jamieson E, Gafni A, Browne G, Bell B, et al. A primary care cardiovascular risk reduction clinic in Canada was more effective and no more expensive than usual on-demand primary care--a randomised controlled trial. Health & Social Care in the Community 2010;18:30-40. [DOI] [PubMed] [Google Scholar]
Mortsiefer 2015 {published data only}
- Mortsiefer A, Meysen T, Schumacher M, Abholz HH, Wegscheider K, In der Schmitten J. From hypertension control to global cardiovascular risk management: an educational intervention in a cluster-randomised controlled trial. BMC Family Practice 2015;16:56. [DOI] [PMC free article] [PubMed] [Google Scholar]
NCT01134458 {unpublished data only}
- NCT01134458. Personalized cardiovascular risk information to initiate and maintain health behavior changes (FIMDM_CVD) [Personalized Cardiovascular Risk Information to Initiate and Maintain Health Behavior Changes]. clinicaltrials.gov/ct2/show/NCT01134458 (first received 28 May 2010).
NCT01979471 {unpublished data only}
- NCT01979471. The Alberta vascular risk reduction community pharmacy project: RxEACH (RxEACH) [The Alberta Vascular Risk Reduction Community Pharmacy Project: RxEACH]. clinicaltrials.gov/ct2/show/NCT01979471 (first received 1 November 2013).
Nebieridze 2011 {published data only}
- Nebieridze D, Safarian AS, Shalnova SA, Deev AD, Oganov RG. The efficacy of integration in clinical practice of electronic version of SCORE in treating hypertensive patients. European Journal of Cardiovascular Prevention and Rehabilitation 2011;18:S81. [Google Scholar]
Paterson 2002 {published data only}
- Paterson JM, Llewellyn-Thomas HA, Naylor CD. Using disease risk estimates to guide risk factor interventions: field test of a patient workbook for self-assessing coronary risk. Health Expectations 2002;5(1):3-15. [DOI] [PMC free article] [PubMed] [Google Scholar]
Pignone 2004 {published data only}
- Pignone M, Sheridan SL, Lee YZ, Kuo J, Phillips C, Mulrow C, et al. Heart to Heart: a computerized decision aid for assessment of coronary heart disease risk and the impact of risk-reduction interventions for primary prevention. Preventive Cardiology 2004;7(1):26-33. [DOI] [PubMed] [Google Scholar]
Powers 2011 {published data only}
- Powers BJ, Danus S, Grubber JM, Olsen MK, Oddone EZ, Bosworth HB. The effectiveness of personalized coronary heart disease and stroke risk communication. American Heart Journal 2011;161(4):673-80. [DOI] [PubMed] [Google Scholar]
Qureshi 2012 {published data only}
- Qureshi N, Armstrong S, Dhiman P, Saukko P, Middlemass J, Evans PH, et al. Effect of adding systematic family history enquiry to cardiovascular disease risk assessment in primary care: a matched-pair, cluster randomized trial. Annals of Internal Medicine 2012;156(4):253-62. [DOI] [PubMed] [Google Scholar]
Reid 1995 {published data only}
- Reid C, McNeil JJ, Williams F, Powles J. Cardiovascular risk reduction: a randomized trial of two health promotion strategies for lowering risk in a community with low socioeconomic status. Journal of Cardiovascular Risk 1995;2:155-63. [PubMed] [Google Scholar]
Rodriguez‐Salceda 2010 {published data only}
- Rodriguez-Salceda I, Escortell-Mayor E, Rico-Blazquez M, Riesgo-Fuertes R, Asunsolo-del Barco A, Valdivia-Perez A, et al. EDUCORE project: a clinical trial, randomised by clusters, to assess the effect of a visual learning method on blood pressure control in the primary healthcare setting. BMC Public Health 2010;10:449. [DOI] [PMC free article] [PubMed] [Google Scholar]
Selvaraj 2012 {published data only}
- Selvaraj FJ, Mohamed M, Omar K, Nanthan S, Kusiar Z, Subramaniam SY, et al. The impact of a disease management program (COACH) on the attainment of better cardiovascular risk control in dyslipidaemic patients at primary care centres (the DISSEMINATE Study): a randomised controlled trial. BMC Family Practice 2012;13:97. [DOI] [PMC free article] [PubMed] [Google Scholar]
Sheridan 2012 {published data only}
- Sheridan SL, Draeger LB, Pignone M, Keyserling TC. Patients' choices for lifestyle change versus medication use to reduce elevated CVD risk. Journal of General Internal Medicine 2012;27:S268. [Google Scholar]
Skinner 2011 {published data only}
- Skinner TC, Barrett M, Greenfield C. Impact of providing people with type 2 diabetes with their actual risk for five diabetes complications: A pilot study. Diabetologia 2011;54:S405-S406. [Google Scholar]
Smith 2008 {published data only}
- Smith SA, Shah ND, Bryant SC, Christianson TJH, Bjornsen SS, Giesler PD, et al. Chronic care model and shared care in diabetes: randomized trial of an electronic decision support system. Mayo Clinic Proceedings 2008;83:747-57. [DOI] [PubMed] [Google Scholar]
Soureti 2010 {published data only}
- Soureti A, Hurling R, Murray P, Mechelen W, Cobain M. Evaluation of a cardiovascular disease risk assessment tool for the promotion of healthier lifestyles. European Journal of Cardiovascular Prevention and Rehabilitation 2010;17:519-23. [DOI] [PubMed] [Google Scholar]
Stewart 2012 {published data only}
- Stewart S, Carrington MJ, Swemmer CH, Anderson C, Kurstjens NP, Amerena J, et al. Effect of intensive structured care on individual blood pressure targets in primary care: multicentre randomised controlled trial. BMJ 2012;345:e7156. [DOI] [PMC free article] [PubMed] [Google Scholar]
- Stewart S, Carrington MJ, Swemmer CH, Kurstjens NP, Jennings GJ. A national, multicentre, randomized controlled trial of the efficacy of structured care algorithm in achieving individual blood pressure targets at 26 weeks in primary care. European Heart Journal 2012;33:679. [Google Scholar]
- Stewart S, Carrington MJ, Swemmer CH, Kurstjens NP, Jennings GJ. Reduced blood pressure and risk of future cardiovascular disease from structured care algorithm in primary care patients with persistent hypertension: a multicentere randomized controlled trial. European Heart Journal 2012;33:811. [Google Scholar]
Thomsen 2001 {published data only}
- Thomsen TF, Davidsen M, Ibsen H, Jorgensen T, Jensen G, Borch-Johnsen K. A new method for CHD prediction and prevention based on regional risk scores and randomized clinical trials; PRECARD and the Copenhagen Risk Score. Journal of Cardiovascular Risk 2001;8(5):291-7. [DOI] [PubMed] [Google Scholar]
Vaidya 2012 {published data only}
- Vaidya R, Pandya KV, Denney-Wilson E, Harris M. Sustaining cardiovascular absolute risk management in Australian general practice. Australian Journal of Primary Health 2012;18(4):304-7. [DOI] [PubMed] [Google Scholar]
Van Breukelen‐van der Stoep 2014 {published data only}
- Van Breukelen-van der Stoep DF, Zijlmans J, Van Zeben D, Meulen N, Klop B, Vries MA, et al. Self-reported adherence to cardiovascular risk reduction intervention of patients with rheumatoid arthritis: results of the Francis study. Atherosclerosis 2014;235:e272. [Google Scholar]
Van den Brekel‐Dijkstra 2016 {published data only}
- Van den Brekel-Dijkstra K, Rengers AH, Niessen MA, Wit NJ, Kraaijenhagen RA. Personalized prevention approach with use of a web-based cardiovascular risk assessment with tailored lifestyle follow-up in primary care practice - a pilot study. European Journal of Preventive Cardiology 2016;23(5):544-51. [DOI] [PubMed] [Google Scholar]
Van Limpt 2011 {published data only}
- Van Limpt PM, Harting J, Assema P, Ruland E, Kester A, Gorgels T, et al. Effects of a brief cardiovascular prevention program by a health advisor in primary care; the 'Hartslag Limburg' project, a cluster randomized trial. Preventive Medicine 2011;53(6):395-401. [DOI] [PubMed] [Google Scholar]
Waldron 2010 {published data only}
- Waldron CA, Gallacher J, Weijden T, Newcombe R, Elwyn G. The effect of different cardiovascular risk presentation formats on intentions, understanding and emotional affect: a randomised controlled trial using a web-based risk formatter (protocol). BMC Medical Informatics and Decision Making 2010;10:41. [DOI] [PMC free article] [PubMed] [Google Scholar]
Weymiller 2007 {published data only}
- Weymiller AJ, Montori VM, Jones LA, Gafni A, Guyatt GH, Bryant SC, et al. Helping patients with type 2 diabetes mellitus make treatment decisions: statin choice randomized trial. Archives of Internal Medicine 2007;167(10):1076-82. [DOI] [PubMed] [Google Scholar]
Zamora 2013 {published data only}
- Zamora A, Fernández de Bobadilla F, Carrion C, Vázquez G, Paluzie G, Elosua R, et al. Pilot study to validate a computer-based clinical decision support system for dyslipidemia treatment (HTE-DLP). Atherosclerosis 2013;231:401-4. [DOI] [PubMed] [Google Scholar]
Zamora 2015 {published data only}
- Zamora A, Carrion C, Vazquez G, Martin-Urda A, Vilaseca M, Paluzie G, et al. A clinical decision support system can improves the quality of lipid-lowering therapy in coronary patients. European Heart Journal 2015;36:285-86. [Google Scholar]
Zhu 2013 {published data only}
- Zhu B, Haruyama Y, Muto T, Yamasaki A, Tarumi F. Evaluation of a community intervention program in Japan using Framingham risk score and estimated 10-year coronary heart disease risk as outcome variables: a non-randomized controlled trial. BMC Public Health 2013;13:219. [DOI] [PMC free article] [PubMed] [Google Scholar]
References to studies awaiting assessment
Adamson 2013 {published data only}
- Adamson R, Sourij H, Ring A, Price HC, Holman RR. Adding value to the experience of attending a diabetes clinic appointment: Provision of personalised 10 year cardiovascular disease (CVD) risk estimates. Diabetic Medicine 2013;30:194. [Google Scholar]
Gryn 2012 {published data only}
- Gryn S, Har B, Dresser G. Evaluation of the effect of cardiovascular risk assessment on treatment compliance in hypertension. Journal of Clinical Hypertension 2012;14.
Roach 2012 {published data only}
- Roach P, Saha C, Marrero DG. Communicating cardiovascular risk to Latinos with type 2 diabetes using a Spanish language-based multimedia program. Diabetes 2012;61:A88. [Google Scholar]
References to ongoing studies
Badenbroek 2014 {published data only}
- Badenbroek IF, Stol DM, Nielen MM, Hollander M, Kraaijenhagen RA, Wit GA, et al. Design of the INTEGRATE study: effectiveness and cost-effectiveness of a cardiometabolic risk assessment and treatment program integrated in primary care. BMC Family Practice 2014;15:90. [DOI] [PMC free article] [PubMed] [Google Scholar]
Ijkema 2014 {published data only}
- De Koning HJ, Aalst CM, Aerde MA, Ijkema R, Bruggen R, Oudkerk M. Design and recruitment of the ROBINSCA trial: Screening for cardiovascular disease. European Heart Journal 2015;36:985. [Google Scholar]
- Ijkema R, Van Aerde M A, Van Der Aalst C M, Van Ballegooijen M, Oudkerk M, De Koning H J. A randomized controlled trial measuring the effectiveness of screening for cardiovascular disease using classic risk assessment and coronary artery calcium: The ROBINSCA study. European Journal of Preventive Cardiology 2014;21:S21. [Google Scholar]
Maindal 2014 {published data only}
- Maindal HT, Stovring H, Sandbaek A. Effectiveness of the population-based Check your health preventive programme conducted in primary care with 4 years follow-up [the CORE trial]: study protocol for a randomised controlled trial. Trials 2014;15:341. [DOI] [PMC free article] [PubMed] [Google Scholar]
NCT00694239 {unpublished data only}
- NCT00694239. Risk assessment and treat compliance in hypertension education trial (RATCHET) [Evaluation of the Effect of Cardiovascular Risk Assessment in Treatment Compliance in Hypertension]. clinicaltrials.gov/ct2/show/NCT00694239 (first received 6 June 2008).
NCT02096887 {unpublished data only}
- NCT02096887. Effect of patient education on compliance and cardiovascular risk parameters (FAILAKA) [Effect of Patient Awareness and Education on Compliance and Cardiovascular Risk Factor Control]. clinicaltrials.gov/ct2/show/NCT02096887 (First received 24 March 2014).
Ogedegbe 2014 {published data only}
- Ogedegbe G, Plange-Rhule J, Gyamfi J, Chaplin W, Ntim M, Apusiga K, et al. A cluster-randomized trial of task shifting and blood pressure control in Ghana: study protocol. Implementation Science 2014;9:73. [DOI] [PMC free article] [PubMed] [Google Scholar]
Praveen 2013 {published data only}
- Praveen D, Patel A, McMahon S, Prabhakaran D, Clifford GD, Maulik PK, et al. A multifaceted strategy using mobile technology to assist rural primary healthcare doctors and frontline health workers in cardiovascular disease risk management: protocol for the SMARTHealth India cluster randomised controlled trial. Implementation Science 2013;8(1):137. [DOI] [PMC free article] [PubMed] [Google Scholar]
Redfern 2014 {published data only}
- Redfern J, Usherwood T, Harris MF, Rodgers A, Hayman N, Panaretto K, et al. A randomised controlled trial of a consumer-focused e-health strategy for cardiovascular risk management in primary care: the Consumer Navigation of Electronic Cardiovascular Tools (CONNECT) study protocol. BMJ Open 2014;4:e004523. [DOI] [PMC free article] [PubMed] [Google Scholar]
Sanghavi 2015 {published data only}
- Sanghavi DM, Conway PH. Paying for Prevention: A Novel Test of Medicare Value-Based Payment for Cardiovasculr Risk Reduction. JAMA 2015;314(2):123-124. [DOI] [PubMed] [Google Scholar]
Silarova 2015 {published data only}
- Silarova B, Lucas J, Butterworth AS, Di Angelantonio E, Girling C, Lawrence K, et al. Information and Risk Modification Trial (INFORM): design of a randomised controlled trial of communicating different types of information about coronary heart disease risk, alongside lifestyle advice, to achieve change in health-related behaviour. BMC Public Health 2015;15:868. [DOI] [PMC free article] [PubMed] [Google Scholar]
Additional references
Anderson 1991
- Anderson KM, Odell PM, Wilson PW, Kannel WB. Cardiovascular disease risk profiles. American Heart Journal 1991;121(1 Pt 2):293-8. [PMID: ] [DOI] [PubMed] [Google Scholar]
Anderson 2013
- Anderson TJ, Grégoire J, Hegele RA, Couture P, Mancini GB, McPherson R, et al. 2012 update of the Canadian Cardiovascular Society guidelines for the diagnosis and treatment of dyslipidemia for the prevention of cardiovascular disease in the adult. Canadian Journal of Cardiology 2013;29(2):151-67. [PMID: ] [DOI] [PubMed] [Google Scholar]
Assmann 2002
- Assmann G, Cullen P, Schulte H. Simple scoring scheme for calculating the risk of acute coronary events based on the 10-year follow-up of the prospective cardiovascular Münster (PROCAM) study. Circulation 2002;105(3):310-5. [PMID: ] [DOI] [PubMed] [Google Scholar]
Beswick 2008
- Beswick AD, Brindle P, Fahey T, Ebrahim S. A systematic review of risk scoring methods and clinical decision aids used in the primary prevention of coronary heart disease (Supplement). London (UK): Royal College of General Practitioners; May 2008. NICE Clinical Guidelines No. 67S. [PMID: ] [PubMed]
Bethesda 1996
- No authors listed. 27th Bethesda Conference. Matching the intensity of risk factor management with the hazard for coronary disease events. September 14-15, 1995. Journal of the American College of Cardiology 1996;27(5):957-1047. [PMID: ] [PubMed] [Google Scholar]
Bloom 2011
- Bloom DE, Cafiero ET, Jané-Llopis E, Abrahams-Gessel S, Bloom LR, Fathima S, et al. The Global Economic Burden of Non-communicable Diseases. Geneva: World Economic Forum, 2011. [Google Scholar]
BPLTTC 2014
- Blood Pressure Lowering Treatment Trialists' Collaboration (BPLTTC), Sundström J, Arima H, Woodward M, Jackson R, Karmali K, et al. Blood pressure-lowering treatment based on cardiovascular risk: a meta-analysis of individual patient data. Lancet 2014;384(9943):591-8. [PMID: ] [DOI] [PubMed] [Google Scholar]
Brindle 2006
- Brindle P, Beswick A, Fahey T, Ebrahim S. Accuracy and impact of risk assessment in the primary prevention of cardiovascular disease: a systematic review. Heart 2006;92(12):1752-9. [PMID: ] [DOI] [PMC free article] [PubMed] [Google Scholar]
Conroy 2003
- Conroy RM, Pyörälä K, Fitzgerald AP, Sans S, Menotti A, De Backer G, et al. Estimation of ten-year risk of fatal cardiovascular disease in Europe: the SCORE project. European Heart Journal 2003;24(11):987-1003. [PMID: ] [DOI] [PubMed] [Google Scholar]
CTT 2012
- Cholesterol Treatment Trialists' (CTT) Collaborators, Mihaylova B, Emberson J, Blackwell L, Keech A, Simes J, et al. The effects of lowering LDL cholesterol with statin therapy in people at low risk of vascular disease: meta-analysis of individual data from 27 randomised trials. Lancet 2012;380(9841):581-90. [PMID: ] [DOI] [PMC free article] [PubMed] [Google Scholar]
Damen 2016
- Damen JA, Hooft L, Schuit E, Debray TP, Collins GS, Tzoulaki I, et al. Prediction models for cardiovascular disease risk in the general population: systematic review. BMJ 2016;353:i2416. [PMID: ] [DOI] [PMC free article] [PubMed] [Google Scholar]
Goff 2014
- Goff DC Jr, Lloyd-Jones DM, Bennett G, Coady S, D'Agostino RB Sr, Gibbons R, et al. 2013 ACC/AHA guideline on the assessment of cardiovascular risk: a report of the American College of Cardiology/American Heart Association task force on practice guidelines. Circulation 2014;129(25 Suppl 2):S49-73. [PMID: ] [DOI] [PubMed] [Google Scholar]
Grover 1995
- Grover SA, Lowensteyn I, Esrey KL, Steinert Y, Joseph L, Abrahamowicz M. Do doctors accurately assess coronary risk in their patients? Preliminary results of the coronary health assessment study. BMJ 1995;310(6985):975-8. [PMID: ] [DOI] [PMC free article] [PubMed] [Google Scholar]
Guyatt 2008
- Guyatt GH, Oxman AD, Vist GE, Kunz R, Falck-Ytter Y, Alonso-Coello P, et al. GRADE: an emerging consensus on rating quality of evidence and strength of recommendations. BMJ 2008;336(7650):924-6. [PMID: ] [DOI] [PMC free article] [PubMed] [Google Scholar]
Hajifathalian 2015
- Hajifathalian K, Ueda P, Lu Y, Woodward M, Ahmadvand A, Aguilar-Salinas CA, et al. A novel risk score to predict cardiovascular disease risk in national populations (Globorisk): a pooled analysis of prospective cohorts and health examination surveys. Lancet Diabetes & Endocrinology 2015;3(5):339-55. [DOI] [PMC free article] [PubMed] [Google Scholar]
Higgins 2011
- Higgins JPT, Green S (editors). Cochrane Handbook for Systematic Reviews of Interventions Version 5.1 [updated March 2011]. The Cochrane Collaboration, 2011. Available from www.cochrane-handbook.org.
Hippisley‐Cox 2007
- Hippisley-Cox J, Coupland C, Vinogradova Y, Robson J, May M, Brindle P. Derivation and validation of QRISK, a new cardiovascular disease risk score for the United Kingdom: prospective open cohort study. BMJ 2007;335(7611):136. [PMID: ] [DOI] [PMC free article] [PubMed] [Google Scholar]
Hippisley‐Cox 2008
- Hippisley-Cox J, Coupland C, Vinogradova Y, Robson J, Minhas R, Sheikh A, et al. Predicting cardiovascular risk in England and Wales: prospective derivation and validation of QRISK2. BMJ 2008;336(7659):1475-82. [PMID: ] [DOI] [PMC free article] [PubMed] [Google Scholar]
Jackson 2005
- Jackson R, Lawes CM, Bennett DA, Milne RJ, Rodgers A. Treatment with drugs to lower blood pressure and blood cholesterol based on an individual's absolute cardiovascular risk. Lancet 2005;365(9457):434-41. [PMID: ] [DOI] [PubMed] [Google Scholar]
Lefebvre 2011
- Lefebvre C, Manheimer E, Glanville J. Chapter 6: Searching for studies. In: Cochrane Handbook for Systematic Reviews of Interventions Version 5.1.0 [updated March 2011]. The Cochrane Collaboration, 2011. Available from www.cochrane-handbook.org.
Meland 1994
- Meland E, Laerum E, Stensvold I. Assessment of coronary heart disease risk, I. A postal inquiry among primary care physicians. Family Practice 1994;11(2):117-21. [PMID: ] [DOI] [PubMed] [Google Scholar]
Murray 2012
- Murray CJ, Vos T, Lozano R, Naghavi M, Flaxman AD, Michaud C, et al. Disability-adjusted life years (DALYs) for 291 diseases and injuries in 21 regions, 1990-2010: a systematic analysis for the Global Burden of Disease Study 2010. Lancet 2012;380(9859):2197-223. [PMID: ] [DOI] [PubMed] [Google Scholar]
Naghavi 2015
- Naghavi M, Wang H, Lozano R, Davis A, Liang X, Zhou M, et al. Global, regional, and national age-sex specific all-cause and cause-specific mortality for 240 causes of death, 1990-2013: a systematic analysis for the Global Burden of Disease Study 2013. Lancet 2015;385(9963):117-71. [DOI] [PMC free article] [PubMed] [Google Scholar]
NCEP 2002
- National Cholesterol Education Program (NCEP) expert panel on detection, evaluation, and treatment of high blood cholesterol in adults (Adult Treatment Panel III). Third report of the National Cholesterol Education Program (NCEP) expert panel on detection, evaluation, and treatment of high blood cholesterol in adults (Adult Treatment Panel III) final report. Circulation 2002;106(25):3143-421. [PMID: ] [PubMed] [Google Scholar]
NICE 2014
- National Institute for Health and Care Excellence (NICE). Lipid modification: Cardiovascular risk assessment and the modification of blood lipids for primary and secondary prevention of cardiovascular disease. www.nice.org.uk/guidance/cg181 (accessed 20 January 2016). [PubMed]
O'Donnell 2010
- O'Donnell MJ, Xavier D, Liu L, Zhang H, Chin SL, Rao-Melacini P, et al. Risk factors for ischaemic and intracerebral haemorrhagic stroke in 22 countries (the INTERSTROKE study): a case-control study. Lancet 2010;376(9735):112-23. [PMID: 20561675] [DOI] [PubMed] [Google Scholar]
Piepoli 2016
- Piepoli MF, Hoes AW, Agewall S, Albus C, Brotons C, Catapano AL, et al. 2016 European guidelines on cardiovascular disease prevention in clinical practice: the sixth joint task force of the European Society of Cardiology and other societies on cardiovascular disease prevention in clinical practice (constituted by representatives of 10 societies and by invited experts). European Heart Journal 2016;37(29):2315-81. [PMID: ] [DOI] [PMC free article] [PubMed] [Google Scholar]
Pignone 2003
- Pignone M, Phillips CJ, Elasy TA, Fernandez A. Physicians' ability to predict the risk of coronary heart disease. BMC Health Services Research 2003;3(1):13. [PMID: ] [DOI] [PMC free article] [PubMed] [Google Scholar]
RevMan 2014 [Computer program]
- Review Manager (RevMan). Version 5.3. Copenhagen: Nordic Cochrane Centre, The Cochrane Collaboration, 2014.
Sheridan 2008
- Sheridan SL, Crespo E. Does the routine use of global coronary heart disease risk scores translate into clinical benefits or harms? A systematic review of the literature. BMC Health Services Research 2008;8:60. [PMID: ] [DOI] [PMC free article] [PubMed] [Google Scholar]
Sheridan 2010
- Sheridan SL, Viera AJ, Krantz MJ, Ice CL, Steinman LE, Peters KE, et al. The effect of giving global coronary risk information to adults: a systematic review. Archives of Internal Medicine 2010;170(3):230-9. [PMID: ] [DOI] [PubMed] [Google Scholar]
Smith 2004
- Smith SC Jr, Jackson R, Pearson TA, Fuster V, Yusuf S, Faergeman O, et al. Principles for national and regional guidelines on cardiovascular disease prevention: a scientific statement from the World Heart and Stroke Forum. Circulation 2004;109(25):3112-21. [PMID: ] [DOI] [PubMed] [Google Scholar]
Stone 2014
- Stone NJ, Robinson J, Lichtenstein AH, Bairey Merz CN, Blum CB, Eckel RH, et al. 2013 ACC/AHA guideline on the treatment of blood cholesterol to reduce atherosclerotic cardiovascular risk in adults: a report of the American College of Cardiology/American Heart Association Task Force on Practice Guidelines. Circulation 2014;129(25 Suppl 2):S1-45. [PMID: ] [DOI] [PubMed] [Google Scholar]
Usher‐Smith 2015
- Usher-Smith JA, Silarova B, Schuit E, Moons KG, Griffin SJ. Impact of provision of cardiovascular disease risk estimates to healthcare professionals and patients: a systematic review. BMJ Open 2015;5(10):e008717. [DOI] [PMC free article] [PubMed] [Google Scholar]
Van der Weijden 2008
- Van der Weijden T, Bos LB, Koelewijn-van Loon MS. Primary care patients' recognition of their own risk for cardiovascular disease: implications for risk communication in practice. Current Opinion in Cardiology 2008;23(5):471-6. [PMID: ] [DOI] [PubMed] [Google Scholar]
WHO 2007
- World Health Organization. Prevention of Cardiovascular Disease: Guidelines for Assessment and Management of Total Cardiovascular Risk. Geneva: WHO Press, 2007. [Google Scholar]
Willis 2012
- Willis A, Davies M, Yates T, Khunti K. Primary prevention of cardiovascular disease using validated risk scores: a systematic review. Journal of Royal Society of Medicine 2012;105(8):348-56. [DOI] [PMC free article] [PubMed] [Google Scholar]
Wilson 1998
- Wilson PW, D'Agostino RB, Levy D, Belanger AM, Silbershatz H, Kannel WB. Prediction of coronary heart disease using risk factor categories. Circulation 1998;97(18):1837-47. [PMID: ] [DOI] [PubMed] [Google Scholar]
Wong 2006
- Wong SS, Wilczynski NL, Haynes RB. Developing optimal search strategies for detecting clinically sound treatment studies in EMBASE. Journal of the Medical Library Association 2006;94(1):41-7. [PMC free article] [PubMed] [Google Scholar]
Yusuf 2004
- Yusuf S, Hawken S, Ounpuu S, Dans T, Avezum A, Lanas F, et al. Effect of potentially modifiable risk factors associated with myocardial infarction in 52 countries (the INTERHEART study): case-control study. Lancet 2004;364(9438):937-52. [PMID: ] [DOI] [PubMed] [Google Scholar]