

Abstract
Background
There is a trend towards greater patient involvement in healthcare decisions. Although screening is usually perceived as good for the health of the population, there are risks associated with the tests involved. Achieving both adequate involvement of consumers and informed decision making are now seen as important goals for screening programmes. Personalised risk estimates have been shown to be effective methods of risk communication.
Objectives
To assess the effects of personalised risk communication on informed decision making by individuals taking screening tests. We also assess individual components that constitute informed decisions.
Search methods
Two authors searched the Cochrane Central Register of Controlled Trials (CENTRAL, The Cochrane Library, Issue 3, 2012), MEDLINE (OvidSP), EMBASE (OvidSP), CINAHL (EbscoHOST) and PsycINFO (OvidSP) without language restrictions. We searched from 2006 to March 2012. The date ranges for the previous searches were from 1989 to December 2005 for PsycINFO and from 1985 to December 2005 for other databases. For the original version of this review, we also searched CancerLit and Science Citation Index (March 2001). We also reviewed the reference lists and conducted citation searches of included studies and other systematic reviews in the field, to identify any studies missed during the initial search.
Selection criteria
Randomised controlled trials incorporating an intervention with a 'personalised risk communication element’ for individuals undergoing screening procedures, and reporting measures of informed decisions and also cognitive, affective, or behavioural outcomes addressing the decision by such individuals, of whether or not to undergo screening.
Data collection and analysis
Two authors independently assessed each included trial for risk of bias, and extracted data. We extracted data about the nature and setting of interventions, and relevant outcome data. We used standard statistical methods to combine data using RevMan version 5, including analysis according to different levels of detail of personalised risk communication, different conditions for screening, and studies based only on high‐risk participants rather than people at 'average’ risk.
Main results
We included 41 studies involving 28,700 people. Nineteen new studies were identified in this update, adding to the 22 studies included in the previous two iterations of the review. Three studies measured informed decision with regard to the uptake of screening following personalised risk communication as a part of their intervention. All of these three studies were at low risk of bias and there was strong evidence that the interventions enhanced informed decision making, although with heterogeneous results. Overall 45.2% (592/1309) of participants who received personalised risk information made informed choices, compared to 20.2% (229/1135) of participants who received generic risk information. The overall odds ratios (ORs) for informed decision were 4.48 (95% confidence interval (CI) 3.62 to 5.53 for fixed effect) and 3.65 (95% CI 2.13 to 6.23 for random effects). Nine studies measured increase in knowledge, using different scales. All of these studies showed an increase in knowledge with personalised risk communication. In three studies the interventions showed a trend towards more accurate risk perception, but the evidence was of poor quality. Four out of six studies reported non‐significant changes in anxiety following personalised risk communication to the participants. Overall there was a small non‐significant decrease in the anxiety scores. Most studies (32/41) measured the uptake of screening tests following interventions. Our results (OR 1.15 (95% CI 1.02 to 1.29)) constitute low quality evidence, consistent with a small effect, that personalised risk communication in which a risk score was provided (6 studies) or the participants were given their categorised risk (6 studies), increases uptake of screening tests.
Authors' conclusions
There is strong evidence from three trials that personalised risk estimates incorporated within communication interventions for screening programmes enhance informed choices. However the evidence for increasing the uptake of such screening tests with similar interventions is weak, and it is not clear if this increase is associated with informed choices. Studies included a diverse range of screening programmes. Therefore, data from this review do not allow us to draw conclusions about the best interventions to deliver personalised risk communication for enhancing informed decisions. The results are dominated by findings from the topic area of mammography and colorectal cancer. Caution is therefore required in generalising from these results, and particularly for clinical topics other than mammography and colorectal cancer screening.
Keywords: Female, Humans, Male, Communication, Decision Making, Mass Screening, Mass Screening/adverse effects, Risk, Breast Neoplasms, Breast Neoplasms/prevention & control, Colorectal Neoplasms, Colorectal Neoplasms/prevention & control, Community Participation, Community Participation/methods, Patient Education as Topic, Randomized Controlled Trials as Topic
Plain language summary
Personalised risk communication for informed decision making about taking screening tests
Screening is generally seen as an effective and safe method to prevent diseases, but there are risks and disadvantages with the procedures involved. It is important for the person undergoing screening to know about the risks of the disease and also how this is relevant to him or her. Such information would help people to make an informed choice about taking up a screening procedure.
In this review we looked at studies that provided personalised risk information for each participant, so that he or she could make a decision about whether to undergo screening, based on their personal risk profile. We found 41 studies with 28,700 participants that provided such personalised risk information to the participants. We integrated the results of all these studies and found that when such a risk profile was included in the intervention, the participants made more informed decisions about screening, compared to people who were provided with more general risk information. Overall 45.2% (592/1309) of participants who received personalised risk information made informed choices as compared to 20.2% (229/1135) of participants who received generic risk information.
We also found that these interventions seemed to increase knowledge and may increase accuracy of risk perception in the trial participants. However they did not significantly affect participants' anxiety. The results also indicated that providing people with personalised risks of the disease resulted in a small increase in the number of people who undertook the screening procedure. The results from this review are dominated by studies screening for breast cancer and colorectal cancer. Caution is required in applying these results to other types of screening.
Summary of findings
Summary of findings for the main comparison. Personalised risk communication versus general risk information for informed decision making about taking screening tests.
| Patient or population: patients with informed decision making about taking screening tests Settings: screening test in primary and secondary care setting Intervention: personalised risk communication versus general risk information | ||||||
| Outcomes | Illustrative comparative risks* (95% CI) | Relative effect (95% CI) | No of Participants (studies) | Quality of the evidence (GRADE) | Comments | |
| Assumed risk8 | Corresponding risk | |||||
| Control | Personalised risk communication versus general risk information | |||||
| Informed decision ‐ Numerical risk and categorised risk combined MMIC1 | 202 per 1000 | 480 per 1000 (350 to 612) | OR 3.65 (2.13 to 6.23) | 2444 (3 studies) | ⊕⊕⊕⊕ high2,3,4,7 | Random‐effects estimate presented due to significant heterogeneity |
| Uptake of screening test ‐ Numerical and categorised risk combined Number of participants taking up the test | 532 per 1000 | 566 per 1000 (537 to 594) | OR 1.15 (1.02 to 1.29) | 6442 (12 studies) | ⊕⊕⊝⊝ low5,6,7 | Fixed‐effect estimate |
| *The basis for the assumed risk (e.g. the median control group risk across studies) is provided in footnotes. The corresponding risk (and its 95% confidence interval) is based on the assumed risk in the comparison group and the relative effect of the intervention (and its 95% CI). CI: Confidence interval; OR: Odds ratio; | ||||||
| GRADE Working Group grades of evidence (we have not assessed publication bias for any of the groups) High quality: Further research is very unlikely to change our confidence in the estimate of effect. Moderate quality: Further research is likely to have an important impact on our confidence in the estimate of effect and may change the estimate. Low quality: Further research is very likely to have an important impact on our confidence in the estimate of effect and is likely to change the estimate. Very low quality: We are very uncertain about the estimate. | ||||||
1 MMIC: Multi‐dimensional Measure of Informed Choice 2 Significant heterogeneity among studies but all studies have same direction of effect and hence not down graded. 3Good quality randomised studies with low risk of bias. 4All studies consistently demonstrating an odds ratio of > 2 and quality upgraded by one point. 5Moderate or low heterogeneity among studies and not down graded for inconsistency. 6Out of 12 studies: 5 mentioned generation of random sequence, only 2 studies mentioned concealing allocation, blinding of participants, personnel and outcome assessors was mostly unclear across studies, 9 studies were low risk for attrition bias and 5 studies were high risk for reporting bias. Quality was downgraded by 1 point. 7Personalised risk communication is delivered as a part of the interventions. Informed choice and uptake are promoted by influencing many other elements such as knowledge, perceived risk etc leading to indirectness of evidence and hence down graded by a point.
8Control risk was used as baseline risk, due to lack of studies that measure this in detail to be presented as baseline risk for the population.
Summary of findings 2. Personalised risk communication versus general risk information for informed decision making about taking screening tests.
| Patient or population: patients with informed decision making about taking screening tests Settings: screening test in primary and secondary care setting Intervention: personalised risk communication versus general risk information | ||||||
| Outcomes | Illustrative comparative risks* (95% CI) | Relative effect (95% CI) | No of Participants (studies) | Quality of the evidence (GRADE) | Comments | |
| Assumed risk10 | Corresponding risk | |||||
| Control | Personalised risk communication versus general risk information | |||||
| Knowledge regarding screening test/condition concerned ‐ calculated risk score (numerical) versus general information various continuous scales | The mean knowledge regarding screening test/condition concerned ‐ calculated risk score (numerical) versus general information in the intervention group was 0.4 standard deviations higher (0.23 to 0.56 higher) | 588 (1 study) | ⊕⊕⊕⊝ moderate1,14 | SMD 0.4 (0.23 to 0.56) Fixed‐effect estimate |
||
| Knowledge regarding screening test/condition concerned ‐ calculated risk score (categorised) versus general information various continuous scales | The mean knowledge regarding screening test/condition concerned ‐ calculated risk score (categorised) versus general information in the intervention group was 0.57 standard deviations higher (0.32 to 0.82 higher) | 260 (1 study) | ⊕⊕⊝⊝ low2,11,14 | SMD 0.57 (0.32 to 0.82) Fixed‐effect estimate |
||
| Knowledge regarding screening test/condition concerned ‐ personal risk factor list versus general information various continuous scales | The mean knowledge regarding screening test/condition concerned ‐ personal risk factor list versus general information in the intervention group was 0.89 standard deviations higher (0.75 to 1.04 higher) | 838 (2 studies) | ⊕⊕⊕⊕ high3,14 | SMD 0.89 (0.75 to 1.04) Fixed effect estimate |
||
| Knowledge regarding screening test/condition concerned ‐ calculated risk score (numerical) versus general information proportion with good knowledge | 244 per 1000 | 457 per 1000 (291 to 633) | OR 2.6 (1.27 to 5.34) | 1413 (3 studies) | ⊕⊕⊕⊕ high4,6,13,14 |
Random‐effects estimate |
| Knowledge regarding screening test / condition concerned ‐ personal risk factor list v general information proportion with good knowledge | 166 per 1000 | 586 per 1000 (535 to 636) | OR 7.13 (5.79 to 8.79) | 2107 (2 studies) | ⊕⊕⊕⊕ high6, 12,14 | Fixed‐effect estimate |
| Accurately‐perceived risk proportion of participants who perceived risk accurately | 225 per 1000 | 324 per 1000 (218 to 450) | OR 1.65 (0.96 to 2.81) | 1264 (3 studies) | ⊕⊕⊝⊝ low7,8,13,14 | Random‐effects estimate |
| Anxiety ‐ all groups various continuous scales | The mean anxiety in the intervention groups was 0.13 standard deviations lower (0.29 lower to 0.03 higher) | 1848 (6 studies) | ⊕⊝⊝⊝ very low5,8,9,14 | SMD ‐0.13 (‐0.29 to 0.03) Random‐effects estimate |
||
| *The basis for the assumed risk (e.g. the median control group risk across studies) is provided in footnotes. The corresponding risk (and its 95% confidence interval) is based on the assumed risk in the comparison group and the relative effect of the intervention (and its 95% CI). CI: Confidence interval; OR: Odds ratio; | ||||||
| GRADE Working Group grades of evidence (we have not assessed publication bias for any of the groups) High quality: Further research is very unlikely to change our confidence in the estimate of effect. Moderate quality: Further research is likely to have an important impact on our confidence in the estimate of effect and may change the estimate. Low quality: Further research is very likely to have an important impact on our confidence in the estimate of effect and is likely to change the estimate. Very low quality: We are very uncertain about the estimate. | ||||||
1 This study was high risk for reporting bias. Four risk of bias items were low risk and four were unclear risk. Quality down graded by a point. 2 Seven out of nine risk of bias items were unclear. Quality down graded by a point. 3 One out of two studies included in this analysis was of very good quality. The other study had mostly unclear risk of bias. Overall we have not downgraded the quality for this analysis. 4 Two out of three studies had more than four risk of bias items assessed as low risk. The other study had most unclear risk of bias items. Overall quality was not downgraded. 5 Substantial/significant heterogeneity of results exists and all studies did not show similar direction of effect. Quality down graded by a point. 6 Consistently large effects favouring personalised risk communication and hence upgraded the quality by one point. 7 Most risk of bias items were unclear with some high risk items. Quality downgraded by one point. 8 Pooled estimate includes no effect and hence down graded by one point. 9 Two out of six studies had more than four risk of bias items assessed as low risk. The remaining studies had most risk of bias items assessed as unclear. Quality downgraded by one point.
10Control risk was used as baseline risk due to lack of studies that measure this in detail to be presented as baseline risk for the population.
11Sample size less than the Optimal Information size (OIS). Quality downgraded by one point.
12Both studies were of low risk of bias and hence not downgraded.
13Significant heterogeneity among studies but all studies have same direction of effect and hence quality not down graded.
14Not downgraded for indirectness of evidence.
Background
Risk communication is an integral part of modern healthcare practice. It is important in various strategies to help individuals make the right choices. Be it a public screening programme or a matter of starting a new treatment, providing evidence‐based risk and benefit information to patients, and ensuring they understand it, forms the cornerstone of informed decision making (Naik 2012). However, understanding is still limited of how best to present and discuss risks and benefits of health care in general, and screening in particular, for an individual.
Screening: what are the issues around policies and practice?
Screening is defined as "the systematic application of a test or inquiry, to identify individuals at sufficient risk of a specific disorder to warrant further investigation or direct preventive action, amongst persons who have not sought medical attention on account of symptoms of that disorder"(UKNSC 1998).
Many tests and procedures form part of screening programs ‐ programs with the objective of sorting out apparently well persons who probably have a disease, from those who probably do not. They may only highlight a risk of disease, and are not intended to definitely diagnose a disease or condition. Screening is a complex event that can have various outcomes for the participant, some of which can cause unnecessary distress (Collins 2011). Although screening programmes are generally seen as an effective measure to reduce mortality and morbidity in the target populations, there are several issues surrounding them. The evolution of evidence regarding certain screening programmes has led to fierce debate about actual benefits and harms (Bewley 2011; Hackshaw 2012). A recent review of breast cancer screening for example, suggests that it is unclear whether such screening does more harm than good, and that balanced, evidence‐based risk‐benefit information should be provided to help women make an informed decision about undergoing screening (Gøtzsche 2011). Directly harmful effects of screening include: complications arising from the investigation, adverse effects of treatment, unnecessary treatment of persons with true‐positive test results who have inconsequential disease, adverse effects of labelling or early diagnosis, anxiety generated by the investigations and treatment, and the costs or inconvenience incurred during investigations and treatment (Barratt 1999). Other harms, such as failure to detect disease, only apply to those with the condition. In either of these scenarios, Raffle 2001 warns that "harm to uninformed participants leads to anger, bitterness, and potentially to litigation". Furthermore screening can have significant social and psychological costs which are difficult to evaluate and quantify (Stewart‐Brown 1997).
These well recognised potential harms have led to increasing debate about the policy and practice of screening. A review of breast cancer screening policy has been proposed in the United Kingdom (UK), prompted by concerns about the accuracy and transparency of information provided to women about the benefits and harms of screening (Richards 2011). The American Cancer Society has also highlighted the confusion created by screening guidelines, and proposes providing the public with clear guidance about the benefits, limitations, and harms associated with taking a screening test (Brawley 2012).
Informed decision making
An informed decision is defined as one where "a reasoned choice is made by a reasonable individual using relevant information about the advantages and disadvantages of all the possible courses of action, in accord with the individual’s beliefs" (Bekker 1999).
The UK national guidance confirms that the purpose of information about screening is to ensure that participants can make a fully informed choice about whether to take the test (GMC 1998). The UK National Screening Committee some time ago proposed a new definition for screening to incorporate the importance of informed choice in screening:
"a public health service in which members of a defined population, who do not necessarily perceive they are at risk of, or are already affected by, a disease or its complications, are asked a question or offered a test to identify those individuals who are more likely to be helped than harmed by further tests or treatment to reduce the risk of disease or its complications" (UKNSC 2000)
Jepson and colleagues reiterate this policy and recommend evaluating screening programmes to ensure that people invited for screening are genuinely making informed choices, and explore how comprehensive information affects other variables such as uptake, cost effectiveness, and satisfaction (Jepson 2005).
How can informed decisions be measured?
Briss 2004 provides a conceptual framework for informed decision making which includes: knowledge, participation in decision making at a personally desirable level, and consistency between the decision and individual preferences or values. A systematic review by Mullen et al, on measures of informed decision making in cancer screening, observed no single study measuring all of these three aspects (Mullen 2006). They recommended the development and use of validated measures of informed decision making and the use of theoretical frameworks for such screening studies.
Marteau and colleagues have proposed the multi‐dimensional measure of informed choice, which has been validated for Down’s syndrome screening (Michie 2002; Marteau 2001). This is based on assessing the consistency between knowledge, attitudes to tests and choices of uptake of tests. To date, few studies in screening have used this scale as a measure for informed choice (Nagle 2008; Smith 2010; Steckelberg 2011). This scale is promising and could form the basis for development of a universal measure of informed choice for uptake of screening tests. Further research is needed to validate this scale in other areas. Furthermore, increasingly the outcomes described in the literature include 'affective' measures such as satisfaction with the decision made, and 'decisional conflict'. This includes whether an individual feels a decision is consistent with their personal values, and certainty about making the right decision (Edwards 1999a; Holmes‐Rovner 1996; Llewelyn‐Thomas 1995).
Description of the intervention
What is tailoring and why is personalising risk information important?
Tailored health communication refers to providing information to someone based on characteristics that are unique to that person. Kreuter et al define tailoring as: "Any combination of information or change strategies intended to reach one specific person, based on characteristics that are unique to that person, related to the outcome of interest and have been derived from an individual assessment" (Kreuter 1999a; Kreuter 1999b).
Tailoring could address any characteristics such as the person’s educational background, cultural orientation, and general level of comprehension. Many studies have adopted a theoretically‐driven approach and have tailored their interventions on behavioural constructs that are based on behaviour change models (Noar 2007), for example the Transtheoretical Model (Prochaska 1992; Prochaska 1997) and Heath Belief Model (Becker 1974; Rosenstock 1988; Rosenstock 2000).
A high rate of participation is expected in most established screening programmes to ensure that they run effectively. Health authorities may employ a variety of strategies to promote screening and enhance uptake amongst the target populations. Some screening programmes provide information which is personally tailored and more relevant to the person in question. Others provide information about population or 'average' risks of contracting a disease as a basis for discussion or decision making about undergoing screening, or perhaps simply to try to motivate people to attend for tests which are perceived by authorities to be in the person's or population's best interests (Slaytor 1998). Such tactics may be seen as questionable, working against the spirit of informed decision making and consumer autonomy, and amounting to a disregard for the principles of medical ethics and good practice (Beauchamp 2001). Foster and Anderson (Foster 1998) criticise the implementers of the UK's National Cervical Screening Programme, including general practitioners, for their persuasive tactics in getting patients to comply.
According to the Health Belief Model one of the key determinants of health‐related behaviour is perceived threat (Becker 1974). This is made up of two components: the individuals perceiving themselves as susceptible to the disease, and the perceived severity of the disease. Tailoring information using an individual’s specific risk factors is what we describe as 'personalised risk communication', sometimes also called 'individualised risk communication'. This may be based on the individual's own risk factors for a condition (such as age or family history). In some cases it is calculated from an individual's risk factors using formulae derived from epidemiological data, with the information presented as an absolute risk or as a risk score, for example the Gail score for the risk of breast cancer (Gail 1989) and Q‐risk score for cardiovascular risk (Hippisley‐Cox 2008). Risk information may also be categorised into, for example, high, medium or low risk groups. It may be less detailed, involving a listing, for example, of a person's risk factors as a focus for discussion and intervention.
How the intervention might work
Evidence suggests that the format in which risk information is presented affects patients’ understanding and perception of risk (Ahmed 2012). It is assumed that tailored messages are perceived as more relevant to an individual, and are therefore better processed and understood (Barratt 2005). Foster and Anderson (Foster 1998) have emphasised the importance of providing good‐quality information to those undergoing cervical screening procedures. They stress that women should be made aware of the risks (discomfort, over‐treatment of abnormal smears) and limitations (false positives; false negatives), as well as the benefits of the test. Further, they also point out that people have different risks of contracting the cervical cancer, based on factors such as age, sexual activity, social class and smoking. A systematic review of studies with interventions designed to provide tailored information on cancer risk and screening method has shown that personally‐tailored risk information improved subjects' knowledge and realistic perception of cancer risk, compared to the provision of generic risk information only (Albada 2009). Noar et al found in their meta‐analytic review that tailored messages outperformed comparison messages in affecting health behaviour change, lending support to claims made by other authors of narrative reviews that tailoring does in fact 'work' (Noar 2007).
There is recognition that uptake of tests per se is not necessarily desirable (for example, prostate specific antigen screening and antenatal cystic fibrosis screening are contentious areas). Also some screening tests are only recommended for those who are at high risk for disease susceptibility, for example genetic testing for breast and ovarian cancer (US PSTF 2005). Making an informed choice about taking screening tests, and adherence to the consumer's chosen option, are widely regarded as more desirable goals for risk communication (Edwards 1999a; Liao 1996; Sarfati 1998).
In this light, providing individualised risk information may seem to be more pertinent than providing generic risk information about the disease for which the screening intervention is designed. Personalised risk communication is more likely to be useful in decision making about whether or not to participate in screening, and individuals who perceive their personal risk as high may feel more susceptible to the disease in question. They may weigh this risk information with the harmful effects of screening, leading to an informed choice to take up the test. Similarly, those who consider themselves at low or no risk may opt out of the screening programme.
Why it is important to do this review
Public health impact, the scope and limitations
The UK National Health Service incorporates 11 different screening activities within its national health programme (UK National Screening Portal). In England alone, 2.24 million women were sent invitations to attend breast cancer screening in 2010‐11 (NHS Information Centre 2011a). Invitations to attend cervical cancer screening were sent to 1.79 million women (NHS Information Centre 2011b). Significant volumes of screening procedures can also be expected to be taking place within breast and cervical cancer programmes and other screening programmes globally. People invited for such screening procedures should make informed and balanced choices. However, focusing narrowly on this outcome may ignore conflicting implications for uptake, cost‐effectiveness and other important public health goals. Stakeholders and policy makers must carefully consider these factors. We attempt to organise such evidence, wherever available, in this systematic review. Further research would certainly be necessary to place the findings of this review in context with existing or planned screening programmes.
Other reviews in the field
Risk communication itself may be subdivided by the dyad involved (for example between agencies and the public, or from individual communicators), as well as according to the nature of the risk, which may be familiar or non‐familiar (Vlek 1987). Reviews of 'mass' risk communication, primarily from the environmental health discipline (Covello 1986; Fischhoff 1979; Keeney 1986), and from narrow clinical fields such as familial cancer (Bottorff 1996), are available. Briss 2004 also reviewed interventions that sought to promote informed decisions about cancer screening, but not through 'personalising' risk information. In addressing the effects of personalised methods of risk communication, this review focuses on risk communication which is provided, used and evaluated in healthcare encounters with individuals, couples, or immediate families (for example, parents of young children). As such, the review is broader than previous clinical risk communication reviews (Bottorff 1996) but still aims to be relevant to the community and the clinical needs of healthcare professionals across a range of disciplines. It focuses on the domain of healthcare screening. In contrast, Albada and colleagues (Albada 2009) in their systematic review have reviewed interventions that provided tailored information specifically about cancer risk and screening. Information in the included studies was tailored to the personal characteristics related to behaviour change theories or constructs, and to the participant’s individualised risks. Their main outcome measures were risk perception, cancer knowledge and screening behaviour. A recent systematic review (Stacey 2011) evaluated randomised controlled trials (RCTs) of decision aids that provided information about treatment or screening options and their associated outcomes, compared to standard care. Decision attributes, behavioural, health, and health system effects were studied as outcome measures. Several other reviews have sought to consolidate evidence on the most effective means of increasing screening uptake (Bonfill 2001; Everett 2011; Flight 2004).
This review updates the 2006 version, which identified 22 relevant studies (Edwards 2006).
Objectives
We primarily compare the effects of personalised and general risk communication interventions in promoting an informed decision about participating in health screening. We also compare the effects of these interventions on people's cognitive, affective and behavioural outcomes. These include their knowledge, risk perception, satisfaction with decision making and decisional conflict, emotional well‐being and behaviour (i.e. taking or intending to take screening tests).
Methods
Criteria for considering studies for this review
Types of studies
Randomised controlled trials (RCTs).
Types of participants
Participants were people facing real life decisions (not hypothetical exercises) about whether to undergo screening. They were individuals making decisions alone or on another's behalf (for example, for a young child), or couples making decisions together.
The screening activities involved an investigation performed by a health professional. Examples of these include:
mammography;
cervical 'Papanicolaou' smears;
colorectal cancer screening;
prostatic cancer screening (PSA test);
antenatal screening (including Down's syndrome, neural tube defects and other fetal anomalies);
genetic screening (including breast cancer gene testing);
high cholesterol/cardiovascular risk screening;
neonatal screening (including cystic fibrosis and Duchenne testing);
skin cancer screening;
lung cancer screening.
We excluded studies if they described only:
mass communication; or
military or school or prison‐based interventions (where people are less free to choose than in other healthcare settings).
Types of interventions
The interventions comprise one of the three levels of personalised risk information:
individualised risk score or individual actual risk information (i.e. absolute or relative risk information); or
categorisations of risk status based on these estimates (for example, high, medium or low risk status); or
discussion of personal risk factors relevant to the screening decision (that is, the individual's own characteristics are taken into account in assessing their actual risk or elevated risk status relative to others).
The interventions address decision making about screening tests; that is, testing whose objective is the presumptive identification of unrecognised disease or defect (including genetic markers for disease) by the application of tests or other procedures, which can be applied rapidly. These tests are intended to sort out apparently well people who may have a disease from those who probably do not, and they are not intended to be diagnostic (Rose 1978; Wilson 1968).
The risk communication intervention could come before screening, at the time of the screening intervention, or at the time of counselling or promotion of screening. Personalised risk communication could be delivered via oral, written, video, or electronic (e.g. Internet or CD‐ROM) media.
Personalised risk information is compared to generalised risk communication interventions, including: population risk estimates, general information on risk factors, or general encouragement to acknowledge risks or change risk behaviour.
We excluded studies which simply evaluated health education/promotion to reduce risk factors or increase adherence to screening, without discussion of risks and benefits of undergoing or not undergoing screening; or if general rather than personalised risk communication was the main basis of the intervention.
Types of outcome measures
Primary outcomes
Measures of an informed decision. An informed decision is defined as one where "a reasoned choice is made by a reasonable individual using relevant information about the advantages and disadvantages of all the possible courses of action, in accord with the individual’s beliefs" (Bekker 1999). An example is the Multidimensional Measure of Informed Choice (MMIC), proposed by Marteau and colleagues, based on assessing the consistency between knowledge, attitudes to tests and choices of uptake of tests. This has been validated for Down's syndrome screening (Michie 2002; Marteau 2001).
Secondary outcomes
Other outcome measures focus on identifying changes in any of the following key areas of informed decision making (Llewelyn‐Thomas 1995; Edwards 1999a), if appropriate data were available:
'cognitive' outcomes: knowledge of risk, accurate risk perception;
'affective' outcomes: anxiety/emotional well‐being, satisfaction with decisions made, decisional conflict, anxiety, intention to take up screening;
behavioural outcomes: uptake of tests, adherence to choice regarding screening test, 'appropriate' uptake;
health status outcomes: specific status measures or quality of life measures such as SF‐36;
economic outcomes: cost of intervention.
Search methods for identification of studies
Electronic searches
Two authors searched:
the Cochrane Central Register of Controlled Trials (CENTRAL, The Cochrane Library, Issue 3 2012),
MEDLINE (OvidSP) (2005 to March 2012),
EMBASE (OvidSP) (2005 to March 2012),
CINAHL (EbscoHOST) (2005 to March 2012), and
PsycINFO (OvidSP) (2005 to March 2012).
We developed the search strategies from earlier work by Matthews et al (Matthews 1999) and the previous versions of this review (Edwards 2006; Edwards 2003b; Edwards 2003c), as well as that used by Jepson et al (Jepson 2000) in their systematic review. The strategies comprised three layers of search terms ‐ keywords and medical subject headings (MeSH) ‐ aimed at identifying articles about screening involving counselling/education or risk specifically. The goal was for high recall (sensitivity) of literature in the field of risk communication in screening (which may therefore be at the expense of precision (specificity). We searched from 2006 to March 2012 for all databases. We tailored search strategies to the relevant databases, and as appropriate used mainly subject headings (for example, MEDLINE, CINAHL) or the equivalent translated text words (for example, EMBASE). We used 'explode' functions on all subject headings. We have not applied language restrictions to the searches.
The date ranges for the previous searches (Edwards 2006) were from 1989 to December 2005 for PsycINFO and from 1985 to December 2005 for all other databases.
Overall the search date range for the CENTRAL, MEDLINE, EMBASE and CINAHL databases was from 1985 to March 2012. For PsycINFO the overall date range was from 1989 to March 2012.
For the first publication of this review (Edwards 2003b; Edwards 2003c) we also searched CancerLit (1985 to 2001) and Science Citation Index Expanded (searched March 2002). Strategies are available from the lead author upon request.
We present all search strategies in Appendices.
Searching other resources
We also reviewed the reference lists and conducted citation searches of included studies and other systematic reviews in the field (Albada 2009), to identify other potentially‐relevant studies.
Data collection and analysis
Selection of studies
Two authors (GN and HA) independently made an initial selection of potentially‐eligible studies from search outputs (titles and abstracts). Disagreements were resolved by discussion. In cases of doubt about relevance to this review, we retrieved papers in full for final decision making. Papers rejected at this stage were circulated to other review authors to review the decision, and if finally excluded, were listed in the table 'Characteristics of Excluded Studies' with a reason for exclusion given.
Data extraction and management
Two authors (GN and HA) independently extracted and collated on a template key information from all included studies. Data extracted included country of origin, health professional group involved, screening program and patient group involved, setting, sample size, and key outcomes. We also extracted data on differences in baseline risk, for assessment of effect modifiers. We checked consistency of assessment by weighted kappa agreement scores.
We also collected data on the nature/design of the intervention. This included: the type of personalised risk communication in the main intervention: estimate or calculation of numerical risk or risk score; estimated or calculated risk categorised as, for example, high, medium or low level of risk for consumer; or listing of personal risk factors without estimate or calculation of risk level. The nature of the intervention also covered whether specific counselling or behavioural change strategies, or both, were included in the risk communication intervention.
Assessment of risk of bias in included studies
We extracted data to assess the risk of bias of the included studies. Two authors independently assessed all studies against the Risk of Bias tool derived from the Cochrane Handbook for Systematic Reviews of Interventions (Higgins 2011). We resolved the differences in assessment of the risk of bias included studies by discussion.
The principal elements used for this review are:
Random sequence generation (selection bias): Studies that describe the random sequence generation were marked as low risk. If there was no mention of this then the studies were marked as unclear. Quasi‐randomised trials were marked as high risk.
Allocation concealment (selection bias): Studies that describe allocation concealment were marked as low risk. If there was no mention of this then the studies were marked as unclear. Studies were marked as high risk if an allocation concealment procedure was clearly not followed.
Blinding of participants and personnel (performance bias): Studies that describe blinding in detail were marked as low risk. If there was no mention of this then the studies were marked as unclear. Studies were marked as high risk if a blinding procedure was clearly not followed or the trialists described the participants and personnel in the study as unblinded.
Blinding of outcome assessment (detection bias): Studies that describe blinding in detail were marked as low risk. If there was no mention of this then the studies were marked as unclear. Studies were marked as high risk if a blinding procedure was clearly not followed or the trialists described the outcome assessment procedure as unblinded.
Incomplete outcome data (attrition bias): Studies were marked as low risk if there was a low attrition rate (less than 20%) or if an intention‐to‐treat principle was adopted. If there was no description of attrition in the study, this element was marked as unclear. If no adjustments were made despite a significant drop out rate studies were marked as high risk for attrition bias.
Selective reporting (reporting bias): Studies were marked as low risk if the protocols were available and all outcomes listed in it were addressed. They were marked as unclear if protocols were not available. High risk status was assigned if there was clear evidence of selective reporting based on the outcomes mentioned in the methods section of the included studies.
Other biases, e.g. baseline comparability, measure against contamination and funding for the screening test: Studies that describe the components in detail were marked as low risk. If there was no mention of this then the studies were marked as unclear. Studies were marked as high risk if the components were clearly not addressed, or demonstrated biases.
We report the risk of bias assessment in Figures and the table Characteristics of included studies. We conducted the sensitivity analysis by excluding studies that were considered as high risk for each risk of bias item mentioned above and then studying how this affected the results. We have also incorporated these assessments whilst rating the quality of the evidence using the GRADE working group's recommendations (Guyatt 2008).
Measures of treatment effect
Dichotomous data
We present dichotomous data as odds ratios (ORs) with 95% confidence intervals (CIs), calculated from absolute change in numbers between the intervention and control groups.
Continuous data
We present continuous data as mean differences (MDs) with 95% CIs, calculated from the mean change (and the standard deviation) between the intervention and control groups. When the same outcomes were measured on different scales we used standardised mean differences (SMDs) when combining data in the meta‐analysis.
Unit of analysis issues
We included studies randomised at individual and cluster level. For studies that were cluster randomised, we used outcome measures adjusted for clustering in the analysis.
Dealing with missing data
We contacted authors to procure missing data. If data were still unavailable, these studies were still included and reported in the narrative. We did not conduct an intention‐to‐treat (ITT) analysis and data were analysed as reported. We documented loss to follow‐up and assessed it as a source of potential bias. We conducted sensitivity analysis by excluding studies that were considered at high risk for attrition bias.
Assessment of heterogeneity
We used the I2 statistic to assess heterogeneity (Deeks 2011). We expected heterogeneity of the studies in terms of the screening tests addressed, participants and design of intervention. We used a fixed‐effect model to present pooled data where heterogeneity was of low or moderate significance i.e. I2 < 60%. Results from a random‐effects model (which gives a more conservative confidence interval on the estimate of effect size) were examined and presented in cases (in addition to fixed‐effect estimates), where this was of substantial significance i.e. I2 = 60% to 79%. We did not pool the data if there was considerable heterogeneity between the studies i.e. I2 = / > 79%.
Data synthesis
Studies in this review derive from a heterogeneous group of screening programmes. Nevertheless the essential characteristic of the risk communication interventions (personalised elements) rendered data combination appropriate. We first examined studies for narrative synthesis. We then used standard statistical methods described in the Cochrane Handbook (Deeks 2011) to combine data. Data to be studied were entered and meta‐analysed in the statistical software package incorporated within RevMan 5. Outcome data extracted comprised the absolute changes in numbers between groups (for dichotomous variables), and the mean change and standard deviation of the mean change (for continuous variables). From these, we calculated the odd ratios (ORs) for dichotomous variables, and mean differences (MDs) for continuous outcomes. When the same outcomes were measured on different scales we used SMDs when combining data in the meta‐analysis. For cluster randomised studies, we used the generic inverse variance method to incorporate the adjusted ORs and the MDs. We also used the generic inverse variance method to combine studies where the raw data were not available, despite contacting the authors for further information. We recorded the statistical significance of results for all analysed outcomes. Insufficient data were provided in many studies to enable (raw) data entry into RevMan 5.
Subgroup analysis and investigation of heterogeneity
The categorisation of personalised risk communication into three levels of detail given to consumers (numerical risk, categorised risk and listing of personal risk factors) was examined for evidence of a different effect at each level. We also tested for heterogeneity within subgroups.We expected the interventions to be spread across a wide range of screening programmes and populations. Hence we also examined important effect modifiers on the changes in outcomes demonstrated, examining in particular, if the data were available, for the influence of: screening program or condition, setting, professional group involved, type of intervention, differences in baseline risk, high risk status of target population for screening, age, gender, educational level and the funding for the screening procedure. We then analysed different sections of the data, for example according to different conditions for screening, or studies based only on ‘high risk’ participants rather than people at ‘average risk’.
Sensitivity analysis
We included all studies in the meta‐analysis where possible. We performed a series of sensitivity analyses to investigate how the results changed when studies with greater risk of bias were excluded in each risk of bias category.
Results
Description of studies
Results of the search
Twenty‐two studies were already included in the last version of the review (Edwards 2006). From the new searches (2006 onwards), we identified 8371 publications. From these, we excluded 8025 publications after we examined the titles and abstracts. We retrieved 346 potentially‐relevant studies in full‐text for detailed evaluation. Of these, 15 new publications met our inclusion criteria. We also undertook a manual follow‐up of references from key publications and journals, and of key authors. We identified a systematic review by Albada and colleagues (Albada 2009) as being highly relevant to this review. Four studies were added by hand searching reference lists of included studies in the Albada review, bringing the total of newly‐included studies to 19. In total this updated review includes 41 studies. (See Figure 1).
1.

Study flow diagram. Search dates from 2006 to March 2012.
Included studies
We describe the main characteristics of the 41 studies, including participants, interventions and outcomes measured, in the table Characteristics of included studies. All were published in English. Thirty‐four were from the USA, four from Australia, one from Canada, one from Germany and one from the UK. There appeared to be increasing interest in the subject over time, with no studies published in the 1980s, 14 studies published in the 1990s and 27 published after 1999. The studies varied in size, with 4 studies involving less than 200 patients, 19 studies involving between 200 and 500 patients, 9 studies involving 500 to 1000 patients and 9 studies involving over 1000 patients.
All included studies were RCTs. Five studies used cluster randomisation (Geller 2006; Glazebrook 2006; Manne 2009; Manne 2010; Nagle 2008), of which one study reported an insignificant cluster effect (Manne 2009). We contacted six authors of included studies, mainly for further clarification of data and to gather information on how the risks were personalised. Three authors responded.
Study setting, recruitment and duration
The patient population and screening programme varied. Most of the studies related to breast cancer screening followed by colorectal cancer screening. They are as illustrated in the table below:
Most of the studies (35 out of 41) were based in the community, 2 were in an out‐patient department setting and 4 were in primary care settings.
Time of outcome assessment varied from immediately after the intervention to 18 months post intervention. The mean time in months for outcome measurement was 7.26 and the median was 6 months.
Participants
The 41 studies in this review included 28,700 people. The number of people in each study varied from 140 to 3152 (median: 435). Recruitment of participants in most studies was done through clinic lists/GP lists/tumour registries (15 studies). Bowen 2002 had two methods of recruitment. The following table shows the method of recruitment for all studies included in the review.
| Recruitment | Study IDs | Number of studies |
| Clinic/GP lists | Bodurtha 2009; Campbell 1997; Champion 2002; Champion 2003; Champion 2007; Glazebrook 2006; Helmes 2006; Hutchison 1998; Kreuter 1996; Myers 1999; Nagle 2008; Saywell 1999; Sequist 2011; Skinner 1994; Trevena 2008 | 15 |
| Newspaper adverts/community networks | Bowen 2002; Bowen 2006; Lipkus 2007b | 3 |
| Community health centre/GP co‐operatives/Lists from agencies/insurance companies | Bowen 2010; Champion 2000a; Curry 1993; Jibaja‐Weiss 2003; Lee 1991; Lipkus 2005; Marcus 2005; Rimer 2002; Smith 2010; Steckelberg 2011 | 10 |
| First degree relatives of index cancer patients/patients with cancer identified from tumour registries | Bastani 1999; Bloom 2006; Bowen 2002; Geller 2006; Glanz 2007; Lerman 1995; Lerman 1997; Manne 2009; Manne 2010; Rawl 2008; Schwartz 1999; Skinner 2002 | 12 |
| Random digit dialling | Champion 1994; Champion 1995 | 2 |
Healthcare group involved
Healthcare groups delivering/developing the interventions were as follows:
| Healthcare Group | Study IDs | Number of studies |
| General practitioners/Family care physicians/Community clinicians | Campbell 1997; Jibaja‐Weiss 2003; Nagle 2008; Sequist 2011; Skinner 2002 | 5 |
| Trained counsellors/genetic counsellors/health educators/health advisors | Bloom 2006; Bowen 2002; Bowen 2006; Bowen 2010; Champion 2007; Geller 2006; Glanz 2007; Helmes 2006; Lerman 1997*; Lipkus 2005; Manne 2009; Manne 2010; Myers 1999; Rimer 2002 | 14 |
| Nursing professionals | Champion 1994; Champion 1995; Champion 2000a; Champion 2002; Champion 2003; Lerman 1995; Lerman 1997*; Saywell 1999 | 8 |
| Information specialists | Marcus 2005 | 1 |
| Multidisciplinary teams (involving primary care, public health, secondary care professionals, psychologists and/or researchers) | Bodurtha 2009; Glazebrook 2006; Smith 2010 | 3 |
| Not stated | Bastani 1999; Curry 1993; Hutchison 1998; Kreuter 1996; Lee 1991; Lipkus 2007b; Rawl 2008; Schwartz 1999; Skinner 1994; Steckelberg 2011; Trevena 2008 | 11 |
| * Both nursing professionals and counsellors delivered the interventions | ||
Interventions
The personalised risk communication formed components of a wide range of interventions, with some studies using multiple or combined interventions of varying complexity. In general, the interventions used educational counselling (oral), written material such as tailored print material, computer/web‐based interventions, and decision aids. Many studies tailored the interventions using constructs from behaviour change theories. Several studies used more than one theoretical construct to base their interventions. The table Characteristics of included studies provides further information on the interventions. With regard to the interventions targeted at patients, 19 studies reported on single component interventions and 22 reported on multiple component/complex interventions. They are illustrated in the table below:
| Intervention type | Study IDs | Number of studies |
| Studies assessing single component interventions for patients | ||
| Written material/Tailored print | Bastani 1999; Campbell 1997; Curry 1993; Hutchison 1998; Jibaja‐Weiss 2003; Kreuter 1996; Lee 1991; Lipkus 2007b; Marcus 2005; Rawl 2008; Skinner 2002; Skinner 1994 | 12 |
| Face to face education/Counselling | Bowen 2002; Schwartz 1999 | 2 |
| Telephone counselling | Bloom 2006; Geller 2006 | 2 |
| Computer/web based | Glazebrook 2006; Sequist 2011; Steckelberg 2011 | 3 |
| Studies assessing multiple component/complex interventions | ||
| Written material with face to face or telephone education/counselling | Bodurtha 2009; Bowen 2006; Bowen 2010; Champion 1994; Champion 1995; Champion 2000a; Champion 2002; Champion 2003; Champion 2007; Glanz 2007; Helmes 2006; Lerman 1995; Lerman 1997; Lipkus 2005; Manne 2009; Manne 2010; Myers 1999; Rimer 2002; Saywell 1999 | 19 |
| Decision aids | Nagle 2008; Smith 2010; Trevena 2008 | 3 |
Studies examined interventions based on several behaviour change theoretical constructs. Some studies had a combination approach, incorporating two or more behaviour change theories in their interventions. They are illustrated in the table below:
| Theoretical model | Study IDs | Number of studies |
| Health belief model (Becker 1974) | Bloom 2006; Bodurtha 2009; Champion 1994; Champion 1995; Champion 2000a; Champion 2002; Champion 2003; Champion 2007; Geller 2006; Glazebrook 2006; Lipkus 2005; Lipkus 2007b; Manne 2009; Marcus 2005; Rawl 2008; Saywell 1999; Skinner 1994 | 17 |
| Transtheoretical model (Prochaska 1992; Prochaska 1997) | Bloom 2006; Champion 1995; Champion 2000a; Champion 2002; Champion 2003; Champion 2007; Geller 2006; Manne 2009; Marcus 2005; Rawl 2008; Rimer 2002 | 11 |
| Precaution Adoption Process Model (Weinstein 2002) | Lipkus 2005; Rimer 2002; Geller 2006; Glanz 2007 | 4 |
| Theory of planned behaviour (Fishbein 1975) | Geller 2006; Manne 2010; Trevena 2008 | 3 |
| Elaboration likelihood model (Cacioppo 1984) | Rimer 2002; Skinner 2002 | 2 |
| Other | Myers 1999; Skinner 2002; Bloom 2006; Geller 2006; Lipkus 2007b; Manne 2009; Manne 2010 | 7 |
Personalised risk was delivered to the participants in three basic methods. Ten studies had interventions that included a calculated numerical risk estimate, such as from the Gail model for breast cancer risk (Gail 1989). Seven studies had interventions that categorised risk level, such as into 'high’, 'medium’ or 'low’ strata. The other 24 studies examined interventions that included the most basic level of ’personalised risk’, such as the listing of risk factors pertinent to an individual.
| Level of personalised risk communication | Study IDs | Number of studies |
| Calculated numerical risk estimate | Bloom 2006; Bowen 2002; Bowen 2006; Glazebrook 2006; Helmes 2006; Lerman 1995; Nagle 2008; Rimer 2002; Schwartz 1999; Trevena 2008 | 10 |
| Categorised risk estimate | Bastani 1999; Bodurtha 2009; Bowen 2010; Glanz 2007; Lee 1991; Sequist 2011; Skinner 2002 | 7 |
| Listing of personal risk factors | Campbell 1997; Champion 1994; Champion 1995; Champion 2000a; Champion 2002; Champion 2003; Champion 2007; Curry 1993; Geller 2006; Hutchison 1998; Jibaja‐Weiss 2003; Kreuter 1996; Lerman 1997; Lipkus 2005; Lipkus 2007b; Manne 2009; Manne 2010; Marcus 2005; Myers 1999; Rawl 2008; Saywell 1999; Skinner 1994; Smith 2010; Steckelberg 2011 | 24 |
Comparison
In 20 studies, the control participants received general risk information intended to be similar in length to the personal risk intervention being studied, and in 16 studies they received only the usual care. In five studies the interventions for control participants were delayed until the completion of the study.
| Comparison/control group | Study IDs | Number of studies |
| Received general risk information intended to be similar in length to the personal risk intervention being studied | Bastani 1999; Bodurtha 2009; Curry 1993; Glanz 2007; Hutchison 1998; Lee 1991; Lerman 1995; Lipkus 2005; Lipkus 2007b; Manne 2009; Manne 2010; Marcus 2005; Myers 1999; Nagle 2008; Rawl 2008; Schwartz 1999; Skinner 1994; Skinner 2002; Smith 2010; Steckelberg 2011 | 20 |
| Usual care | Campbell 1997; Champion 1994; Champion 1995; Champion 2000a; Champion 2002; Champion 2003; Champion 2007; Geller 2006; Glazebrook 2006; Jibaja‐Weiss 2003; Kreuter 1996; Lerman 1997; Rimer 2002; Saywell 1999; Sequist 2011; Trevena 2008 | 16 |
| Interventions for control participants were delayed until the completion of the study | Bloom 2006; Bowen 2002; Bowen 2006; Bowen 2010; Helmes 2006 | 5 |
Outcomes
We extracted data on all reported outcomes specified in the review. The primary focus was on measures of an informed decision. We also list below studies reporting other cognitive, affective and behavioural outcomes.
Informed decision
Three newly‐identified studies reported informed decision as an outcome measure in their study (Nagle 2008; Smith 2010; Steckelberg 2011). All of these studies used outcome measures based on Marteau’s multi‐dimensional measure of informed choice (Marteau 2001).
Knowledge regarding the screening test
Nine studies reported knowledge as one of their outcome measures. Different scales were used, with four studies measuring knowledge as a continuous variable (Glazebrook 2006; Smith 2010; Skinner 2002; Lerman 1997). Five studies dichotomised this outcome, measuring the proportion of participants with adequate knowledge after the intervention (Nagle 2008; Smith 2010; Steckelberg 2011; Trevena 2008; Rimer 2002).
Improvement in risk comprehension
Lerman 1995 reported improvement in risk comprehension as an outcome measure.
Perceived risk
One study (Bowen 2002) reported perceiving self as an appropriate candidate for the test, and three studies (Lerman 1995; Rimer 2002; Skinner 2002) reported accurately perceived risk as outcome measures. Another study (Helmes 2006) measured perceived risk as the perceived chance of developing the disease, which was not included in the meta‐analysis.
Anxiety
Six studies measured anxiety. Different scales were used, with two studies (Nagle 2008; Smith 2010) using the State Trait Anxiety Inventory (STAI), one study (Lerman 1995) using the IES breast cancer distress scale, and three studies (Bloom 2006; Helmes 2006; Skinner 2002) using the breast cancer worry score, on different scales where higher scores correspond to increased anxiety or worry.
Satisfaction with decision
Smith 2010 measured satisfaction with the decision made.
Decision conflict
This was used by two studies. Smith 2010 measured the proportion of participants with low decision conflict and Nagle 2008 used the decision conflict scale as a continuous measure.
Intention to take the screening test
Ten studies (Bodurtha 2009; Bowen 2002; Trevena 2008; Geller 2006; Lee 1991; Skinner 2002; Jibaja‐Weiss 2003; Lerman 1997; Helmes 2006; Bowen 2010) reported this outcome. Three studies (Bowen 2002; Bowen 2010; Helmes 2006) which measured intention to take up breast cancer genetic screening in lower risk participants have been placed in separate meta‐analytic tables (Analysis 1.12; Analysis 1.13). This is because the interventions do not encourage lower risk participants to take up this screening procedure. Currently genetic testing for breast and ovarian cancers are generally not recommended for lower risk individuals (US PSTF 2005).
1.12. Analysis.

Comparison 1 personalised risk communication versus general risk information, Outcome 12 intention to take genetic screening test in normal risk patients.
1.13. Analysis.

Comparison 1 personalised risk communication versus general risk information, Outcome 13 intention to take genetic screening test in normal risk patients.
Uptake of the test
Six studies (Bloom 2006; Glazebrook 2006; Nagle 2008; Rimer 2002; Schwartz 1999; Trevena 2008) that provided numerical risk scores, six studies (Bastani 1999; Bodurtha 2009; Bowen 2010; Glanz 2007; Lee 1991; Sequist 2011) that categorised their participants' risk and 20 studies (Campbell 1997; Champion 1994; Champion 1995; Champion 2000a; Champion 2003; Champion 2007; Curry 1993; Geller 2006; Hutchison 1998; Jibaja‐Weiss 2003; Lipkus 2005; Lipkus 2007b; Manne 2009; Manne 2010; Marcus 2005; Myers 1999; Rawl 2008; Saywell 1999; Smith 2010; Steckelberg 2011) that listed their participants' risk factors in their interventions, measured the uptake of the screening procedure.
Appropriate use of cholesterol test
Hutchison 1998 measured the appropriate use of a cholesterol test.
Stages of change for uptake of test
Three studies (Rawl 2008; Skinner 1994; Champion 2007) reported the movement across the stages of change based on the Transtheoretical model (Prochaska 1992).
Making a recommended behaviour change
Kreuter 1996 reported this outcome.
Excluded studies
Several studies were considered closely for inclusion but were eventually excluded. We excluded 29 studies from this review. The primary reason for exclusion (14 studies) was that the intervention did not involve a personalised estimate of the participant's risk. Six studies designed the intervention around participants' health beliefs rather than their risks, and we excluded four studies for not containing a control group. Of the remaining five studies, one was a longitudinal study rather than a randomised trial, one was a study protocol, and in three studies, the outcome could not be regarded as a screening test. See Characteristics of excluded studies. Two studies were still on‐going and could not be included, see Characteristics of ongoing studies.
Risk of bias in included studies
As described in the Characteristics of included studies, six main risk of bias criteria (random sequence generation, allocation concealment, blinding: participants and personnel, blinding: outcome assessors, incomplete outcome data, selective reporting) and three other risk of bias items (baseline comparability, measures against contamination and funding for screening tests) were applied to each study. Only nine studies met four or more of the nine criteria for low risk of bias (Bodurtha 2009; Glazebrook 2006; Manne 2009; Manne 2010; Nagle 2008; Sequist 2011; Smith 2010; Steckelberg 2011; Trevena 2008). The three studies (Nagle 2008; Smith 2010; Steckelberg 2011) reporting informed decision, our primary outcome measures, met six, eight and all of the nine criteria respectively (Figure 2; Figure 3).
2.

Risk of bias summary: review authors' judgements about each risk of bias item for each included study.
3.

Risk of bias graph: review authors' judgements about each risk of bias item presented as percentages across all included studies.
Allocation
The allocation sequence was adequately generated in 10 studies (Bodurtha 2009; Champion 2000a; Champion 2003; Glazebrook 2006; Jibaja‐Weiss 2003; Lee 1991; Nagle 2008; Smith 2010; Steckelberg 2011; Trevena 2008), whereas 2 studies (Campbell 1997; Geller 2006) described a quasi‐random component in the sequence generation process. Other (29) studies did not report sufficient information to determine this risk of bias.
The allocation was adequately concealed only in four studies (Nagle 2008; Smith 2010; Steckelberg 2011; Trevena 2008). The majority of the studies (37) did not describe the allocation concealment in sufficient detail to permit evaluation.
Blinding
The majority of the interventions provided to clients were difficult to blind for clients, providers and outcomes assessors. Therefore, only two studies (Smith 2010; Steckelberg 2011) could blind clients, providers and outcome assessors.
Incomplete outcome data
Twenty‐six studies adequately addressed incomplete outcome data (Bloom 2006; Bodurtha 2009; Bowen 2002; Bowen 2006; Bowen 2010; Campbell 1997; Champion 1994; Champion 1995; Champion 2007; Curry 1993Glanz 2007; Helmes 2006; Lee 1991; Lipkus 2005; Lipkus 2007b; Manne 2009; Manne 2010; Marcus 2005; Myers 1999; Nagle 2008; Schwartz 1999; Sequist 2011; Skinner 2002; Smith 2010; Steckelberg 2011; Trevena 2008) whereas six studies did not (Bastani 1999; Champion 2002; Geller 2006; Hutchison 1998; Rimer 2002; Saywell 1999). The principal reason for the attrition bias was that missing outcomes are enough to induce clinically‐relevant bias in observed effect estimates. Nine studies reported insufficient information to evaluate this criterion.
Selective reporting
Only five studies provided trial registration numbers, for which protocols were available. Of these five studies, one (Trevena 2008) did not contain adequate details for outcome measures in the protocol. The other four studies (Nagle 2008; Sequist 2011; Smith 2010; Steckelberg 2011) reported all planned outcomes and were definitely free of reporting bias. Ten studies (Bloom 2006; Bowen 2006; Bowen 2010; Champion 1995; Champion 2002; Glazebrook 2006; Jibaja‐Weiss 2003; Lee 1991; Manne 2009; Skinner 1994) did not report all the outcomes mentioned in the paper. The other 26 studies reported all outcomes mentioned in the paper, but were marked as unclear due to unavailability of study protocol.
Other potential sources of bias
In 28 studies (Bodurtha 2009; Bowen 2002; Bowen 2006; Bowen 2010; Campbell 1997; Champion 2007; Geller 2006; Glanz 2007; Glazebrook 2006; Helmes 2006; Hutchison 1998; Jibaja‐Weiss 2003; Kreuter 1996; Lerman 1995; Lerman 1997; Lipkus 2005; Lipkus 2007b; Manne 2009; Manne 2010; Marcus 2005; Nagle 2008; Rawl 2008; Rimer 2002; Saywell 1999; Sequist 2011; Skinner 1994; Skinner 2002; Smith 2010; Steckelberg 2011; Trevena 2008) the baseline characteristics of participants in all study arms were comparable to each other. In five studies (Bastani 1999; Champion 1994; Champion 2002; Champion 2003; Hutchison 1998) there were differences in the baseline characteristics of participants between the study arms. The remaining eight studies did not provide adequate information to assess this source of bias.
Nine studies (Bastani 1999; Campbell 1997; Geller 2006; Glazebrook 2006; Hutchison 1998; Manne 2009; Manne 2010; Nagle 2008; Steckelberg 2011) had adequate protection against contamination. We assessed a further seven studies (Bloom 2006; Bowen 2002; Glanz 2007; Lerman 1995; Lerman 1997; Rawl 2008; Schwartz 1999) as being at high risk due to the potential for contamination within recruited members, and without mention of protection against contamination. We assessed as unclear the other 25 studies in which there was no mention of protection against contamination.
We included funding for the screening test as one of the risk of bias elements, as this can influence the intentions and the uptake of screening tests. Only 13 studies (Bodurtha 2009; Glanz 2007; Glazebrook 2006; Helmes 2006; Lipkus 2005; Lipkus 2007b; Manne 2009; Manne 2010; Rawl 2008; Saywell 1999; Sequist 2011; Smith 2010; Steckelberg 2011) reported how participants would have had their screening tests funded; i.e. if tests were provided free of charge by the researchers, if participants themselves had to pay for these tests, or if they were provided by the health organisation or insurance companies.
Effects of interventions
Informed decision
Our primary outcome of interest was 'informed decision'. This was measured in three newly‐included studies, with the measures based on Marteau’s Multidimensional Measure of Informed choice (Marteau 2001). One study provided personalised risk to the consumers undergoing screening, within interventions that used a calculated risk score (Nagle 2008). The other two studies (Steckelberg 2011; Smith 2010) listed out the personal risk factors to the participants. Overall there is strong evidence from these three trials that personalised risk communication, when presented as a part of complex interventions such as decision aids, promotes informed uptake of screening tests. Overall 45.2% (592/1309) of participants who received personalised risk information made informed choices, compared to 20.2% (229/1135) of participants who received generic risk information. The odds ratio (OR) for the study that provided numerical risk in its intervention (Nagle 2008) was OR 2.08 (95% CI 1.14 to 3.81). The pooled OR for the two studies that used listing of risk factors in their intervention was 4.98 (95% CI 3.97 to 6.24). The overall ORs were 4.48 (95% CI 3.62 to 5.53) for fixed‐effect and 3.65 (95% CI 2.13 to 6.23) for random‐effects. The effect measures showed significant heterogeneity (I2 = 77%), probably due to differences in the type of interventions and the populations within each study. However all studies consistently demonstrated a similar direction of effect, favouring personalised risk communication (see Analysis 1.1 and Table 1).
1.1. Analysis.
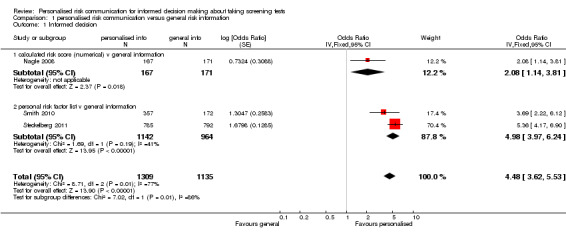
Comparison 1 personalised risk communication versus general risk information, Outcome 1 Informed decision.
Knowledge
Nine studies measured knowledge regarding the screening test. Four studies measured this on continuous outcome scales. The scales used varied with studies and we present these as standardised mean differences (SMDs). There were considerable subgroup differences, but all studies showed a significant increase in knowledge with personalised risk communication. We present the SMDs (by fixed‐effects model) in each subgroup below in the table (also see Analysis 1.2 subcategories 1‐3 and Table 2):
1.2. Analysis.

Comparison 1 personalised risk communication versus general risk information, Outcome 2 knowledge regarding screening test / condition concerned.
| Knowledge measured on continuous scales | |
|
Subgroup |
Standardised Mean Difference (SMD) |
| Fixed‐effect model | |
| Calculated risk score (numerical) versus general information | 0.40 (95% CI 0.23 to 0.56) |
| Calculated risk score (categorised) versus general information | 0.57 (95% CI 0.32 to 0.82) |
| Personal risk factor list versus general information | 0.89 (95% CI 0.75 to 1.04) |
Five studies measured the proportion of participants with good knowledge in each of their study arms. Again, there were significantly higher proportions of participants with good knowledge within the intervention arms of the studies, when personalised risk communication was delivered:
| Knowledge ‐ measured as proportion with good knowledge | ||
|
Subgroup |
Odds Ratios (OR) | |
| Fixed‐effect model | Random‐effects model | |
| Calculated risk score (numerical) versus general information (see Analysis 1.3) | 2.11 (95% CI 1.52 to 2.91) | 2.60 (95% CI 1.27 to 5.34) |
| Personal risk factor list v general information (see Analysis 1.4) | 7.13 (95% CI 5.79 to 8.79) | ‐ |
Risk perception/comprehension
In three studies the interventions showed a trend towards more accurate risk perception (fixed‐effect OR 1.46 (95% CI 1.13 to 1.88); random‐effects OR 1.65 (95% CI 0.96 to 2.81), see Analysis 1.5 ). However the evidence from these studies was of low quality (see Table 2). Another study (Bowen 2002) examined whether people perceived themselves as appropriate for the tests after the intervention, with a non‐significant trend towards fewer people perceiving appropriateness of tests after the intervention(see Analysis 1.6). Skinner 2002 studied the effect of tailored print material on the decision to take up genetic screening in women with personal history of breast and ovarian cancer. This study showed that women were more knowledgeable (SMD 0.57 (95% CI 0.32 to 0.82)), and had more accurate perceptions of risk (OR 2.50 (95% CI 1.48 to 4.20)), but fewer intended to take tests after the personalised risk intervention (OR 0.21 (95% CI 0.07 to 0.64)), see Analysis 1.2; Analysis 1.5; Analysis 1.11. Lerman 1995 reported a small (non‐significant) improvement in risk comprehension after personalised risks were delivered (see Analysis 1.17).
1.5. Analysis.

Comparison 1 personalised risk communication versus general risk information, Outcome 5 accurately perceived risk.
1.6. Analysis.

Comparison 1 personalised risk communication versus general risk information, Outcome 6 perceived risk ‐ perceiving self as appropriate candidate for test.
1.11. Analysis.

Comparison 1 personalised risk communication versus general risk information, Outcome 11 intention to take screening test.
1.17. Analysis.

Comparison 1 personalised risk communication versus general risk information, Outcome 17 improvement in risk comprehension/perception.
Anxiety
Four out of six studies reported non‐significant changes in anxiety following personalised risk communication to the participants. Overall there was a small, non‐significant decrease in anxiety scores in the intervention group (fixed‐effect SMD ‐0.13 (95% CI ‐0.22 to ‐0.03); random‐effects SMD ‐0.13 (95% CI ‐0.29 to 0.03); negative values indicate a decrease in anxiety and favouring personalised risk communication), see Analysis 1.7 and Table 2.
1.7. Analysis.

Comparison 1 personalised risk communication versus general risk information, Outcome 7 Anxiety (Cancer related anxiety and helplessness scale; IES breast cancer distress).
Uptake of test
Most studies (32/41) measured the uptake of screening tests following personalised risk communication interventions. There was significant heterogeneity (I2 > 80%) within these studies. Subgroup analysis revealed this was less significant when studies were examined by the levels of risk communication that was provided within their interventions. Heterogeneity was least significant in studies where risk was provided in a more detailed manner, i.e. as a numerical score. There were six studies in this group, with personalised risk communication having little effect on the uptake of screening tests (fixed‐effect OR 0.95 (95% CI 0.78 to 1.15)), see Analysis 1.14 subcategory 01 and Table 1). For risk estimates or calculations which were categorised into high, medium or low strata of risk (six studies), the results were significant ( OR 1.29 (95% CI 1.11 to 1.51) (see Analysis 1.14 subcategory 02 and Table 1). Overall, pooling of these two subgroups yielded a combined OR of 1.15 (95% CI 1.02 to 1.29) – indicative of weak evidence, consistent with a small effect, that personalised risk communication where a risk score was provided or the participants were given their categorised risk, increases uptake of screening tests.
1.14. Analysis.

Comparison 1 personalised risk communication versus general risk information, Outcome 14 uptake of screening test.
For studies that listed personal risk factors in their interventions (20 studies), there was considerable heterogeneity between studies for uptake of test, and we do not present a pooled estimate for this subgroup. However 10/20 studies (50%) showed a significant increase in the uptake of the screening tests following personalised risk communication interventions (see Analysis 1.15 subcategory 01).
1.15. Analysis.

Comparison 1 personalised risk communication versus general risk information, Outcome 15 uptake of screening test.
One study (Hutchison 1998) also assessed 'appropriate uptake' of tests (externally‐defined appropriateness: that is, uptake for people at higher risk, and non‐uptake for people at lower risk) and found more appropriate uptake after the personalised risk intervention (OR 1.32 (95% CI 1.14 to 1.55) (Analysis 1.16).
1.16. Analysis.

Comparison 1 personalised risk communication versus general risk information, Outcome 16 appropriate use of cholesterol test.
Intention to take up screening test
Seven studies measured the intention to take screening tests, and had considerably heterogeneous results (see Analysis 1.11). Three other studies measured the intention to take up genetic testing in normal or low risk participants. These tests (as discussed earlier in this review) are not necessarily indicated in consumers with such low or average risks. In one study (Bowen 2002) the results were inconclusive (see Analysis 1.12). The other two studies (Helmes 2006; Bowen 2010) demonstrated a significant decrease in participants' intentions to take up the genetic tests following personalised risk communication interventions. The mean difference (MD) for fixed‐effect was ‐0.53 (95% CI ‐0.63 to ‐0.44) and for random‐effects was ‐0.77 (95% CI ‐1.42 to ‐0.13) (negative values indicate a decrease in intention and favour personalised risk communication; see Analysis 1.13).
Decision conflict
Nagle 2008 measured decision conflict regarding prenatal testing for foetal abnormality. The results of this study showed a non‐significant increase in decision conflict following personalised risk communication (see Analysis 1.9).
1.9. Analysis.

Comparison 1 personalised risk communication versus general risk information, Outcome 9 decision conflict.
Satisfaction with decision
Smith 2010 measured satisfaction with decision in interventions to support informed choice about bowel cancer screening and found no change after personalised risk communication (see Analysis 1.10).
1.10. Analysis.

Comparison 1 personalised risk communication versus general risk information, Outcome 10 satisfaction with decision.
Stages of change
Three studies looked at the stages of change based on the Transtheoretical model (Prochaska 1992; Prochaska 1997). Champion 2007 found all interventions were effective (compared to usual care) in moving women forward in mammography stage (versus same or backward). However, the combination of tailored telephone and print interventions (versus usual care) had the largest effect (OR 1.95 (95% CI 1.36 to 2.81)). Rawl 2008 found that the forward movement of stage was slightly higher in the risk tailored group for colorectal cancer screening. Skinner 1994 found that 71% of participants did not change; 14% advanced one stage; 12% 'regressed'; no significant differences between tailored message and control groups were noticed (see Analysis 1.18).
1.18. Analysis.
Comparison 1 personalised risk communication versus general risk information, Outcome 18 stages of change.
| stages of change | |
|---|---|
| Study | |
| personal risk factor list v general information | |
| Champion 2007 | All interventions were effective (compared to usual care) in moving women forward in mammography stage (versus same or backward). However, the combination of tailored telephone and print interventions versus usual care, had the largest effect. (OR 1.949, 95% CI 1.355 to 2.815) |
| Rawl 2008 | Forward movement of stage was:
Forward movement of stage was slightly higher in the risk tailored group. |
| Skinner 1994 | 71% did not change; 14% advanced one stage; 12% 'regressed': no significant differences between tailored message and control. |
Making a recommended behaviour change
One study (Kreuter 1996) measured the proportion of participants making a recommended behaviour change after personalised risks were communicated. There were slight, non‐significant differences between the groups (OR 0.98 95% CI 0.76 to 1.28).
Quality of life (SF‐36)
One study (Bowen 2010) measured quality of life scores on the SF‐36 scale after interventions to promote breast health behaviours. There was significant improvement on this measure following personalised risk communication(MD 7.10 (95% CI 5.90 to 8.30), see Analysis 1.20).
1.20. Analysis.

Comparison 1 personalised risk communication versus general risk information, Outcome 20 Quality of life (SF‐36).
Subgroup analysis
The results for the studies addressing mammography showed similar effects with uptake of screening and to the overall data set. The numerical calculated risk estimates were associated with lower ORs for uptake of tests (OR 0.84 (95% CI 0.68 to 1.03)) (See Analysis 3.5 and subcategories). The subgroups for categorised risk and listing of risk factors showed considerable heterogeneity with uptake of the tests and it was not appropriate to pool these results (see Analysis 3.6 and Analysis 3.7).
3.5. Analysis.

Comparison 3 personalised risk communication versus general risk information for MAMMOGRAPHY, Outcome 5 uptake of screening test.
3.6. Analysis.

Comparison 3 personalised risk communication versus general risk information for MAMMOGRAPHY, Outcome 6 uptake of screening test.
3.7. Analysis.

Comparison 3 personalised risk communication versus general risk information for MAMMOGRAPHY, Outcome 7 uptake of screening test.
The 11 studies examining risk communication in high‐risk individuals showed trends towards larger ORs for uptake of tests than the other studies. The OR for numerical estimates of risk was 1.05 by fixed‐effect (95% CI 0.79 to 1.40) and 1.08 by random‐effects (95% CI 0.63 to 1.84). The OR for categorised estimates of risk was 1.38 (95%CI 1.06 to1.80). Overall, pooling of these two subgroups yielded a combined OR of 1.22 (95% CI 1.00 to 1.48), indicative of a higher uptake of screening tests when only the high‐risk group studies were analysed (Analysis 5.6).
5.6. Analysis.

Comparison 5 personalised risk communication versus general risk information for 'HIGH RISK' PEOPLE, Outcome 6 uptake of screening test.
For studies whose interventions listed personal risk factors, there was considerable heterogeneity between studies for uptake of test, and we do not present a pooled estimate for this subgroup (See Analysis 5.7).
5.7. Analysis.

Comparison 5 personalised risk communication versus general risk information for 'HIGH RISK' PEOPLE, Outcome 7 uptake of screening test.
Ten studies measured uptake of tests in colorectal cancer screening programmes. The overall OR for uptake was 1.02 by fixed‐effect (95% CI 0.90 to 1.16) and 1.06 by random‐effects (95% CI 0.82 to 1.37) (see Analysis 6.8).
6.8. Analysis.

Comparison 6 personalised risk communication versus general risk information for COLORECTAL SCREENING, Outcome 8 uptake of screening test.
Sensitivity analysis
We conducted a sensitivity analysis for the uptake of screening tests, by excluding studies that were either at either unclear or high risk of bias for four risk of bias domains that we considered to be most important for this topic. The results were as follows:
Random sequence generation (selection bias)
In this analysis we included only low risk studies. The analysis for this risk of bias domain yielded a lower uptake of tests, with an OR of 1.10 (95% CI 0.88 to 1.39) when the two groups with limited heterogeneity (i.e. those which provided either numerical or categorised risks) were pooled. Five low risk studies accounted for this analysis (Bodurtha 2009; Glazebrook 2006; Lee 1991; Nagle 2008; Trevena 2008). The studies that provided listing of risk factors remained considerably heterogeneous, even after studies with high risk of bias for the above domain were excluded.
Incomplete outcome data (attrition)
In this analysis we included only low risk studies. The analysis for this risk of bias domain yielded similar uptake of tests, with an OR of 1.15 (95% CI 0.99 to 1.35) when the two groups with limited heterogeneity (i.e. those which provided either numerical or categorised risks) were pooled. Nine low risk studies accounted for this analysis (Bloom 2006; Bodurtha 2009; Bowen 2010; Glanz 2007; Lee 1991; Nagle 2008; Schwartz 1999; Sequist 2011Trevena 2008). The studies that provided listing of risk factors remained considerably heterogeneous, even after studies with high risk of bias for the above domain were excluded.
Selective reporting (reporting bias)
In this analysis we only excluded studies that were at high risk for selective reporting. We included low risk studies and the 'unclear' studies which reported all outcomes mentioned in their methods sections, but were marked 'unclear' due to unavailability of study protocol. The analysis for this risk of bias domain reduced the uptake of tests, with an OR of 1.03 (95% CI 0.90 to 1.18) when the two groups with limited heterogeneity (i.e. those which provided either numerical or categorised risks) were pooled. Seven studies accounted for this analysis (Bastani 1999; Bodurtha 2009; Glanz 2007; Nagle 2008; Rimer 2002; Schwartz 1999; Sequist 2011). The studies that provided listing of risk factors remained considerably heterogeneous, even after studies with high risk of bias for the above domain were excluded.
Baseline comparability
The analysis for this risk of bias domain again yielded a similar measure of uptake of tests, with an OR of 1.15 (95% CI 1.00 to 1.33) for fixed‐effect and 1.22 (95% CI 0.94 to 1.57) for random‐effects model (I2 = 63%), when the two groups with limited heterogeneity (i.e. those which provided either numerical or categorised risks) were pooled. Eight studies accounted for this analysis (Bodurtha 2009; Bowen 2010; Glanz 2007; Glazebrook 2006; Nagle 2008; Rimer 2002; Sequist 2011; Trevena 2008). The studies that provided listing of risk factors remained considerably heterogeneous, even after studies with high risk of bias for the above domain were excluded.
The sensitivity analyses for selection bias, attrition bias and baseline comparability did not alter the uptake measure significantly. By excluding the studies that had a high risk for selective reporting bias, the OR for uptake was lower, probably due to the exclusion of studies that may have reported only significant results.
Discussion
Summary of main results
This review updates the second (2006) publication of this review (Edwards 2006). Risk communication, particularly in the field of screening, is evolving with time. We have identified 19 new studies with elements of personalised risk communication in screening, which takes the total number of studies in this review to 41. The earlier two versions of this review (Edwards 2003c; Edwards 2006) included studies that measured outcomes that form elements of an informed decision, but identified no studies measuring informed decision as such. This updated review includes three studies (Nagle 2008; Smith 2010; Steckelberg 2011) that specifically have measured informed decision for the uptake of screening tests after personalised risk communication. From these three studies, there was strong evidence that personalised risk communication enhanced informed decision making, although with heterogeneous results. We expected this heterogeneity due to the varied nature of the interventions and the level of risk communication that was used in each of these studies. However, all studies had significant effect sizes, all favouring personalised risk communication.
Other recent studies have sought to address knowledge, perceived risk, and other elements of informed decision making. Overall these studies showed an increase in knowledge and a trend towards more accurate risk perception when personalised risk was included in their interventions. This field of risk communication in screening mirrors other clinical areas of health care, where there is an increasing trend to involve consumers in their own healthcare choices. In the same way that screening recommendations have developed in recent years from simply seeking to maximise uptake, to promotion of informed choice about participation in screening programmes (Holland 2005), the trial literature also now shows some development towards this.
Further, there was weak evidence to suggest that such interventions promote uptake of screening tests, although effects were small.
Some data also show that when the personalised risk information disclosed is more detailed, the uptake of tests is lower than when the risk communication is less detailed or numerically unspecific (i.e. when categorised into risk groups). Significant heterogeneity was noted among studies that merely listed the personal risk factors in their intervention. Test uptake thus becomes unpredictable when less specific ways of communicating personal risk factors are used. This may reflect the differences in perception of actual risk among participants between studies when such less specific methods of personalised risk communication are employed, but may also reflect the different nature of screening programme where some are more controversial (e.g. mammography and PSA testing) that the others (e.g. colorectal cancer screening).
High risk status an effect modifier
The effects of interventions on screening uptake appeared greater among consumers or patients deemed to be at higher risk of a disease than average. In this group of studies, most favoured the intervention, irrespective of the level of risk communication. This suggests that the 'high risk status' of the consumer may be an important effect modifier for personalised risk communication. There appears to be potential for substantial modification of choices made among this group of consumers. It may be appropriate that the scope for interventions to influence decisions is large in this group of consumers. Equally, however, interventions could be harmful if they are not introduced carefully. Healthcare professionals must take steps to ensure that they are achieving informed decision making by these consumers.
Overall completeness and applicability of evidence
We have used a highly‐sensitive search strategy (Matthews 1999) to identify as many papers as possible in this field, from all relevant databases. The search covers studies published until March 2012, in an effort to outline the most contemporary evidence at the time of publication. To further increase the completeness of this search, we have followed this up by handsearching journals and reference lists, and also have looked at other similar reviews in the field to identify any papers missed in the initial search. This updated review presents a significant increase in the number of included studies, compared to the previous versions. Notably, however, the interventions used in these studies cover a range of methods to deliver the personalised element of risk communication. In addition, the measures of components of informed decision vary widely across studies. The settings in which the studies were conducted include a diverse range of screening programmes. Therefore, data from this review do not allow us to draw a firm conclusion about the best interventions to deliver personalised risk st= in enhancing informed decisions. The results are dominated by findings from the topic area of mammography and colorectal cancer. Caution is therefore required in generalising from these results, particularly for clinical topics other than mammography and colorectal cancer screening.
Further, in all studies the effects are a measure of the ('complex') intervention as a whole rather than that of personalised risk communication per se. However, isolating the effect of personalised risk communication on informed decisions or the uptake of tests, and drawing firm conclusions based on this, poses a great challenge to researchers working in this field.
Quality of the evidence
We included 41 studies in this review. It is difficult to draw general conclusions from this review because these studies varied widely according to interventions provided, outcomes measured, the screening programme, and duration of interventions and follow‐up. A substantial number of people are included in this review (28,700), and the number of participants within each study varied widely, from 140 to 3152 people.
The studies that reported direct measures of informed decision were few (n = 3) in number, but were of very good methodological quality. Most other studies that measured other outcomes (i.e. components of informed decision) were not explicit in reporting elements that could introduce biases into their design, although studies reporting several of the knowledge outcomes were also of high quality. Only five studies (Lerman 1995; Lerman 1997; Manne 2010; Nagle 2008; Smith 2010) provided information of the validity of scales used to measure the outcomes of interest.
We have illustrated the quality of evidence for our main outcomes using GRADE Working Group recommendations (Guyatt 2008) in Table 1 and Table 2.
Overall, the outcome ‘informed decision’ and several of the knowledge outcomes were subject to less risk of bias and provide better quality of evidence than the other reported outcomes (in particular, screening uptake, accuracy of perceived risk, and anxiety).
Potential biases in the review process
Despite the extensive search strategy, we may have missed some studies of interventions including personalised risk communication for screening tests if they were not indexed in the bibliographic databases appropriately to be identified by our search terms. We made significant efforts to contact trial authors for further data, where these were not available, and for further details of how the risks were personalised. Some data that were not extractable or were unclear were not included, if we did not receive further clarification from the authors.
As expected, the other main limitation of this review lies in the fact that we did not find any studies that examined the effect of personalised risk communication in isolation. All studies studied the effect of their interventions which included personalised risk communication. The interventions as such were diverse in nature, and it is hard to draw firm conclusions on the weight of effect that personalised risk communication has contributed to. There was considerable heterogeneity in some of the groups, in which case we did not pool these data. Many studies that were unclear on the risk of bias items are still included within the overall meta‐analyses, and we present a sensitivity analysis by excluding such studies. Lastly, ways to measure the outcomes were also diverse which may have biased the review. Common validated methods of measuring informed decision are yet to be developed for wider use.
Agreements and disagreements with other studies or reviews
We are not aware of any other systematic reviews that assessed specifically the effect of personalised risk communication on measures of informed decision. Albada 2009 was the most similar review assessing the effects of tailored information based on theoretical (behavioural) constructs and providing cancer risk for individuals undergoing screening. The authors assessed the effects on risk perception, knowledge and screening behaviour. They concluded that interventions based on theoretical constructs increased risk perception and knowledge of cancer as compared to generic interventions, and information tailored to individual risk specifically increased realistic risk perceptions. As with our review, they found limited evidence for enhancing screening behaviour. A recent review (Stacey 2011) also found that decision aids that are tailored to support individual healthcare decisions increased people's involvement, and improved knowledge and realistic perception of outcomes, but had variable effect on choice behaviour.
Noar et al presented the first meta‐analytic review of tailored print interventions for health behaviour change. In contrast with our review, their findings suggest that tailored print information focusing on preventive health behaviours out‐perform generic interventions. However a host of behaviour change studies other than screening are included in their review (Noar 2007).
Briss 2004 studied interventions that were generally consistent in improving individuals’ knowledge about the disease, accuracy of risk perceptions, or knowledge and beliefs about the pros and cons of screening and treatment options. They reported insufficient evidence that such interventions promote informed decisions, due to a paucity of studies that fully measured this outcome. They recommended further research in this area, providing a conceptual framework to evaluate this outcome. We have found only three studies that used informed decision as an outcome measure, reiterating the recommendations proposed by Briss 2004.
Authors' conclusions
Implications for practice.
There is strong evidence, from three trials, that personalised risk estimates incorporated within communication interventions for screening programmes enhance informed choice. However the evidence for similar interventions increasing the uptake of such screening tests is weak and it is not clear if this increase is associated with informed choice. Focusing on the achievement and demonstration of informed choice in isolation, would, nonetheless, fail to address the wider context. This context concerns an apparent tension between public health and individual health policy. Policies of greater patient involvement in decisions are being pursued, and this is justified from both ethical perspectives and some (though perhaps more limited) evidence of improved health outcomes (Guadagnoli 1998). There is a need to evaluate whether such policies mean that those people invited for screening are genuinely making informed choices, and how comprehensive information affects other variables such as uptake, cost effectiveness, and satisfaction (Jepson 2005). Appropriate risk communication has an integral role in this (Elwyn 2000). But as this is followed through, it is possible that public health objectives might be compromised.
An example may be seen in breast cancer screening. Younger women are at lower risk of developing cancer (Nelson 2009), but may perceive themselves as at higher risk due to screening activity, publicity and public health messages about the importance of screening for the population. Some women may choose not to have regular screening when informed of the absolute levels of risk and benefit from screening programmes. But the public health message, aided sometimes by financial incentives for clinicians to achieve high uptake figures, means that informed decision making by patients is still a major challenge (Thomson 2005). Further, recent literature demonstrates uncertainties surrounding actual estimates of risks and benefits associated with breast cancer screening. McPherson 2010 analyses such evidence in a recent article, concluding "Arguments that polarise are unhelpful and render women, many with strong preferences, more helpless (to make informed decisions). For too long they have been misled and confused by too much agenda driven analyses of these data. What is required now is a full examination of all the data, preferably individual patient data, from all the recent studies, by dispassionate epidemiologists to get the best estimates in the UK screening setting.”
The same tension exists in relation to cardiovascular screening (Marteau 2002). These tensions between public health goals and individual choices must be recognised (Rogers 2002). An informed debate should be conducted among the relevant interest groups ‐ government, public health, clinicians, and particularly patients and patient representative groups. There are some signs that this debate is now taking place (Marteau 2002; Stefanek 2011). Policy developments could explore whether individually appropriate choices, which vary from those recommended by standards and guidelines, can be accommodated in assessments of achieving best practice (i.e. meeting standards) at population level. One solution may be for care to be viewed as 'adherent to guidelines' or 'satisfactory' if adequate steps have been made to achieve and demonstrate informed decision making by patients ‐ even if it deviates from the conventional (bio‐medical) recommendations of those guidelines. However it is also important to consider ethical implications whilst trying to achieve informed choice specially in certain disadvantaged populations. The question is whether this deters such individuals from undergoing the immediate inconveniences of screening, especially if the diagnosis necessitates a change in their behaviour or lifestyle and thus potentially widening the inequities in healthcare provision. Kellar and colleagues in their study conclude that in such circumstances efforts to enhance informed choice may require that the immediate benefits are communicated, and efforts to address the apparent barriers are made, if the potential for inequity is to be avoided (Kellar 2011).
Taking the example of cervical cancer screening, a full discussion of the pros and cons of screening for cervical cancer may be viewed as a satisfactory goal for the healthcare provider, even if an individual woman chooses not to undergo screening, thus against public health advice. Counting such scenarios as satisfactory or adherent to guidelines (for example for purposes of audit) may allow healthcare professionals to enhance their communication with patients. If this is incorporated into the goals of health care, then improvements in care can be achieved without falling foul of requirements for governance, audit, and payment targets. An example was evident in the criteria for Fellowship by Assessment (FBA) of the Royal College of General Practitioners (UK). In the case of vaccination targets, the criteria stated that "candidates who are unable to demonstrate these standards must exceed the average level of vaccination and show how patients/ parents/ care givers are enabled to make an informed choice about vaccination" (RCGP 2002). The FBA scheme has now been revised, but the issue of informed decision making in preventive activities could equally apply to screening choices. The need for measures to demonstrate informed choice across a number of healthcare decisions is further reiterated.
Implications for research.
In future, studies that use standardised and validated measures of informed decision are needed. Further, studies designed to measure the effect of personalised risk communication more accurately still need to be developed. We discuss three main areas in which research should be focused in risk communication for screening:
Calculating risk scores
The relative paucity of data in the screening area reflects the difficulties for researchers or clinicians in communicating personalised risk to consumers. The range of clinical topics for which risk scores in specified populations are available is narrow. Calculation or estimation of risk is dependent on adequate epidemiological background data, and feasible means of converting these into information for consumers based on their individual risk factors. Examples include the Gail model (Gail 1989) and methods for calculating cardiovascular risk (Hippisley‐Cox 2008; Heart 1999), but only the latter has permeated into routine clinical practice. In some cases, risk scores can only be calculated after the screening test ‐ an example is the FRAX® score (Kanis 2009) used to calculate risk of osteoporotic fractures. In clinical practice patients are offered screening if they have known risk factors for developing osteoporosis. Currently treatment recommendations are not exclusively based on FRAX® assessment scores. This remains a matter of clinical judgement. However the scores can provide patients with a personalised estimate of the risk of sustaining an osteoporotic fracture, and help them make informed decisions about adopting preventive measures or starting prophylactic medications. There is a need for equivalent epidemiological research into an extended range of clinical topics. This could provide a basis for models that allow calculation of personalised risk estimates for individuals about other conditions, such as cervical, prostate or colorectal cancer. Then further evaluation of the effects of providing such personalised risk information to consumers would be possible.
Presenting risk information
Further challenges for clinicians arise from limitations in the available literature. Despite the large body of evidence, there seems to be a lack of consensus concerning the most appropriate method with which to communicate medical risk (Ghosh 2005). Lipkus states that the available evidence has yet to suggest a best practice approach. Reasons for this are the lack of consistency in testing communication formats using the same outcome measure, the relative lack of randomised controlled trials, and the lack of emphasis on developing communication strategies that are built upon a solid theoretical background (Lipkus 2007a). Of the studies that are available, very few have used shared decision making or informed decision making as the outcome measure. Most studies look at risk perception, knowledge, or understanding and these may not be the most appropriate measures of effective risk communication. Future research must address this in an attempt to involve patients in decision making, promoting informed choices in health care in general and in screening in particular.
Demonstrating informed choices
There may also be an onus on clinicians to demonstrate this informed decision making with evidence. Further research is required into how such informed decision making by consumers can be demonstrated validly. There are some outcome measures in this field such as the multi‐dimensional measure of informed choice in Down's syndrome screening (Marteau 2001). This is based on assessing the consistency between knowledge, attitudes to tests and choices of uptake of tests. This measure is specific to Down's screening at present. Further research should explore the development of measures for other screening choices, or whether a generic measure of informed choice for screening decisions is feasible. This would require more general cognitive measures than the condition‐specific knowledge items. Other scales currently available offer the scope to derive such a cognitive component for a generic measure (O'Connor 1995; Barry 1997; Edwards 2003a) but at the present time, there is no validated measure of informed choice in cancer screening (Jepson 2005). There would be value in developing a generic measure of informed decision making for screening choices by consumers. Using such a measure widely would also be important in assessing the true effect of personalised risk communication on people's use of screening tests.
What's new
| Date | Event | Description |
|---|---|---|
| 24 January 2013 | New citation required and conclusions have changed | This review updates the issue 4 2006 version of the Cochrane review (Edwards 2006). We identified 19 new studies, bringing the total number of included studies to 41. The review conclusions were revised particularly in light of three new studies which specifically measured the principal outcome of informed decision (not just the key components that form informed decision). The byline has changed for this update. |
| 24 March 2012 | New search has been performed | New searches run. |
History
Protocol first published: Issue 4, 1999 Review first published: Issue 1, 2003
| Date | Event | Description |
|---|---|---|
| 21 July 2006 | New citation required and conclusions have changed | Substantive amendment. The review was updated on Issue 4 2006 of The Cochrane Library. Nine new studies were identified, bringing the total number of included studies to 22. The review's conclusions were amended in light of the new studies included in the review. The title of the review also changed slightly. It was first published on Issue 1 2003 of The Cochrane Library as "Personalised risk communication for informed decision making about entering screening programs". |
Acknowledgements
The review authors thank the many people who commented on the project protocol and Cochrane protocol and review at various stages, helping to make them feasible. In particular this includes the 1998 consumer advisory group established for this review by the Cochrane Consumers and Communication Review Group (comprising Hilda Bastian and Genny Nolan (Australia), Teenah Handiside (New Zealand), and Christine Brunswick (USA)); Professors Theresa Marteau (then University of London) and Alex Barratt (University of Sydney) for discussions about screening programmes; Silvana Unigwe and Rhodri Evans for work on the previous versions of the review; the original Contact Editor ‐ the late Dominique Broclain, the current Contact Editor Sandy Oliver, the editors of the Cochrane Consumers and Communication Review Group, Managing Editor Megan Prictor, Coordinating Editor Sophie Hill, former Trials Search Coordinator Judy Stoelwinder, and external peer reviewers. We also thank current Trials Search Coordinator John Kis‐Rigo for his help in amending our search strategy, and the UK Cochrane Centre for their support through well‐organised review courses for our authors. We gratefully acknowledge the financial support from the Cochrane Health Promotion and Public Health Field which enabled completion of the first published version of this review in 2003 (Edwards 2003c) and the UK Department of Health for its support (via the Review Group) to speed up completion of the updated review in 2006. Finally we thank the members of the Support Unit for Research Evidence (SURE), Cardiff University for all the support extended during the process of this review update.
Appendices
Appendix 1. Search Strategy: CENTRAL
The Cochrane Central Register of Controlled Trials (CENTRAL, The Cochrane Library Issue 3, 2012)
#1 MeSH descriptor Risk explode all trees
#2 MeSH descriptor Disease Susceptibility explode all trees
#3 (tailor* near counsel*) or (tailor* near message*) or (tailor* near material*) or (tailor* near intervention*) or (personal* near counsel*) or (personal* near message*) or (personal* near material*) or (personal* near intervention*) or (individual* near counsel*) or (individual* near message*) or (individual* near material*) or (individual* near intervention*)
#4 tailored or tailoring or individualised or personalised
#5 risk* or susceptib*
#6 (#1 OR #2 OR #3 OR #4 OR #5)
#7 MeSH descriptor Communication, this term only
#8 MeSH descriptor Persuasive Communication, this term only
#9 MeSH descriptor Counseling, this term only
#10 MeSH descriptor Genetic Counseling, this term only
#11 MeSH descriptor Health Promotion, this term only
#12 MeSH descriptor Health Education, this term only
#13 MeSH descriptor Patient Education as Topic, this term only
#14 MeSH descriptor Health Knowledge, Attitudes, Practice, this term only
#15 MeSH descriptor Attitude to Health, this term only
#16 MeSH descriptor Informed Consent explode all trees
#17 MeSH descriptor Patient Acceptance of Health Care, this term only
#18 MeSH descriptor Decision Making, this term only
#19 (informed near consent) or (informed near choice) or (informed near decision*)
#20 (#7 OR #8 OR #9 OR #10 OR #11 OR #12 OR #13 OR #14 OR #15 OR #16 OR #17 OR #18 OR #19)
#21 (#6 AND #20)
#22 (risk* near notifi*) or (risk* near inform*) or (risk* near communicat*) or (risk* near counsel*) or (risk* near appraisal*) or (risk* near assesment*) or (risk* near perception*) or (risk* near perciev*)
#23 (#21 OR #22)
#24 MeSH descriptor Mass Screening explode all trees
#25 (screen* or test* or testing or detection or early diagnosis)
#26 MeSH descriptor Early Diagnosis explode all trees
#27 MeSH descriptor Diagnostic Techniques and Procedures explode all trees
#28 MeSH descriptor Laboratory Techniques and Procedures explode all trees
#29 MeSH descriptor Tumor Markers, Biological explode all trees
#30 MeSH descriptor Predictive Value of Tests, this term only
#31 (mammography or mammogram* or colonoscopy or sigmoidoscopy or occult blood or vaginal smear* or pap* smear* or prostate specific antigen* or brca* or chest x‐ray or tomograph* or bronchoscop*)
#32 prostate* and psa
#33 (#24 OR #25 OR #26 OR #27 OR #28 OR #29 OR #30 OR #31 OR #32)
#34 (#23 AND #33)
#35 (#34), from 2006 to 2011
Appendix 2. Search Strategy: CINAHL
CINAHL (EBSCO) (2006 to March 2012)
| # | Query | Limiters/Expanders |
| S49 | S36 and S46 | Limiters ‐ Published Date from: 20060101‐20111231; Exclude MEDLINE records Search modes ‐ Boolean/Phrase |
| S48 | S36 and S46 | Limiters ‐ Published Date from: 20060101‐20111231 Search modes ‐ Boolean/Phrase |
| S47 | S36 and S46 | Search modes ‐ Boolean/Phrase |
| S46 | S37 or S38 or S39 or S40 or S41 or S42 or S43 or S44 or S45 | Search modes ‐ Boolean/Phrase |
| S45 | TI (singl* or doubl* or tripl* or trebl*) and TI (blind* or mask*) | Search modes ‐ Boolean/Phrase |
| S44 | AB (singl* or doubl* or tripl* or trebl*) and AB (blind* or mask*) | Search modes ‐ Boolean/Phrase |
| S43 | AB (random* or trial or placebo*) or TI (random* or trial or placebo*) | Search modes ‐ Boolean/Phrase |
| S42 | MH Quantitative Studies | Search modes ‐ Boolean/Phrase |
| S41 | MH Placebos | Search modes ‐ Boolean/Phrase |
| S40 | MH Random Assignment | Search modes ‐ Boolean/Phrase |
| S39 | MH Clinical Trials+ | Search modes ‐ Boolean/Phrase |
| S38 | PT Clinical Trial | Search modes ‐ Boolean/Phrase |
| S37 | "randomi?ed controlled trial*" | Search modes ‐ Boolean/Phrase |
| S36 | S27 and S35 | Search modes ‐ Boolean/Phrase |
| S35 | S28 or S29 or S30 or S31 or S32 or S33 or S34 | Search modes ‐ Boolean/Phrase |
| S34 | TX prostate* and psa | Search modes ‐ Boolean/Phrase |
| S33 | TX (mammography or mammogram* or colonoscopy or sigmoidoscopy or occult blood or vaginal smear* or pap* smear* or prostate specific antigen* or brca* or chest x‐ray or tomograph* or bronchoscop*) | Search modes ‐ Boolean/Phrase |
| S32 | (MH "Predictive Value of Tests") | Search modes ‐ Boolean/Phrase |
| S31 | (MH "Tumor Markers, Biological+") | Search modes ‐ Boolean/Phrase |
| S30 | TX (screen* or test? or testing or detection or early diagnosis) | Search modes ‐ Boolean/Phrase |
| S29 | (MH "Early Diagnosis+") | Search modes ‐ Boolean/Phrase |
| S28 | (MH "Cancer Screening") OR (MH "Health Screening+") OR (MH "Genetic Screening") OR (MH "Health Screening (Iowa NIC)") | Search modes ‐ Boolean/Phrase |
| S27 | S25 or S26 | Search modes ‐ Boolean/Phrase |
| S26 | TX (risk* n3 notifi*) or (risk* n3 inform*) or (risk* n3 communicat*) or (risk* n3 counsel*) or (risk* n3 appraisal*) or (risk* n3 assesment*) or (risk* n3 perception*) or (risk* n3 perciev*) | Search modes ‐ Boolean/Phrase |
| S25 | S6 and S24 | Search modes ‐ Boolean/Phrase |
| S24 | S7 or S8 or S9 or S10 or S11 or S12 or S13 or S14 or S15 or S16 or S17 or S18 or S19 or S20 or S21 or S22 or S23 | Search modes ‐ Boolean/Phrase |
| S23 | TX health behaviour model or trans theoretical model or trans‐theoretical model or transtheoretical model | Search modes ‐ Boolean/Phrase |
| S22 | (MH "Health Behavior+") | Search modes ‐ Boolean/Phrase |
| S21 | (MH "Health Beliefs") OR (MH "Health Belief Model") | Search modes ‐ Boolean/Phrase |
| S20 | TX (informed n2 consent) or (informed n2 choice) or (informed n2 decision*) | Search modes ‐ Boolean/Phrase |
| S19 | (MH "Consent+") | Search modes ‐ Boolean/Phrase |
| S18 | (MH "Decision Making") OR "decision making" OR (MH "Decision Making, Patient") OR (MH "Decision‐Making Support (Iowa NIC)") | Search modes ‐ Boolean/Phrase |
| S17 | (MH "Patient Attitudes") | Search modes ‐ Boolean/Phrase |
| S16 | "health practice" | Search modes ‐ Boolean/Phrase |
| S15 | (MH "Attitude to Health") | Search modes ‐ Boolean/Phrase |
| S14 | (MH "Health Knowledge") | Search modes ‐ Boolean/Phrase |
| S13 | (MH "Patient Education") | Search modes ‐ Boolean/Phrase |
| S12 | (MH "Health Education") | Search modes ‐ Boolean/Phrase |
| S11 | (MH "Health Promotion") | Search modes ‐ Boolean/Phrase |
| S10 | (MH "Genetic Counseling") | Search modes ‐ Boolean/Phrase |
| S9 | (MH "Counseling") | Search modes ‐ Boolean/Phrase |
| S8 | TX (persuasive communication) | Search modes ‐ Boolean/Phrase |
| S7 | (MH "Communication") | Search modes ‐ Boolean/Phrase |
| S6 | S1 or S2 or S3 or S4 or S5 | Search modes ‐ Boolean/Phrase |
| S5 | TX (risk* or susceptib*) | Search modes ‐ Boolean/Phrase |
| S4 | TX (tailored or tailoring or individuali?ed or personali?ed) | Search modes ‐ Boolean/Phrase |
| S3 | TX (tailor*n2 counsel*) or (tailor* n2 message*) or (tailor* n2 material*) or (tailor* n2 intervention*) or (personal* n2 counsel*) or (personal* n2 message*) or (personal* n2 material*) or (personal* n2 intervention*) or (individual* n2 counsel*) or (individual* n2 message*) or (individual* n2 material*) or (individual* n2 intervention*) | Search modes ‐ Boolean/Phrase |
| S2 | (MH "Disease Susceptibility") | Search modes ‐ Boolean/Phrase |
| S1 | "risk" | Search modes ‐ Boolean/Phrase |
Appendix 3. Search Strategy: EMBASE
EMBASE (OvidSP) (2006 to March 2012)
1. risk/ or cancer risk/ or cardiovascular risk/ or coronary risk/ or genetic risk/ or high risk patient/ or high risk population/ or population risk/ or risk assessment/ or risk benefit analysis/ or risk factor/
2. exp disease predisposition/
3. ((tailor* or personal* or individual*) adj2 (counsel* or message* or material* or intervention*)).tw.
4. (tailored or tailoring or individuali#ed or personali#ed).tw.
5. or/1‐4
6. interpersonal communication/
7. patient information/
8. medical information/
9. persuasive communication/
10. counseling/
11. genetic counseling/
12. parent counseling/
13. patient counseling/
14. exp health education/
15. attitude to health/
16. patient attitude/
17. patient compliance/
18. informed consent/
19. decision making/
20. (informed adj2 (consent or choice or decision*)).tw.
21. or/6‐20
22. 5 and 21
23. (risk* adj3 (notif* or inform* or communicat* or counsel* or apprais* or assessment or perception* ot perceiv*)).tw.
24. 22 or 23
25. exp screening/
26. (screen* or test? or testing or detection or early diagnosis).tw.
27. exp diagnosis/
28. exp tumor marker/
29. (mammography or mammogram* or colonoscopy or sigmoidoscopy or occult blood or vaginal smear* or pap* smear* or pap* test* or prostate specific antigen* or (prostat* and psa) or brca* or chest x‐ray or tomograph* or bronchoscop* or bone density or absorptiometry).tw.
30. or/25‐29
31. 24 and 30
32. randomized controlled trial/
33. controlled clinical trial/
34. single blind procedure/ or double blind procedure/
35. crossover procedure/
36. random*.tw.
37. ((singl* or doubl*) adj (blind* or mask*)).tw.
38. (crossover or cross over or factorial* or latin square).tw.
39. ((allocat* or assign*) adj4 (experiment* or intervention* or control* or group*)).tw.
40. or/32‐39
41. nonhuman/ not (human/ and nonhuman/)
42. 40 not 41
43. 31 and 42
44. limit 43 to yr="2006 ‐Current"
Appendix 4. Search Strategy: MEDLINE
MEDLINE (OvidSP) (2006 to March 2012)
1. exp risk/
2. exp disease susceptibility/
3. ((tailor* or personal* or individual*) adj2 (counsel* or message* or material* or intervention*)).tw.
4. (tailored or tailoring or individuali#ed or personali#ed).tw.
5. (risk* or susceptib*).tw.
6. or/1‐5
7. communication/
8. persuasive communication/
9. counseling/
10. genetic counseling/
11. health promotion/
12. health education/
13. patient education as topic/
14. health knowledge, attitudes, practice/
15. attitude to health/
16. exp informed consent/
17. patient acceptance of health care/
18. decision making/
19. (informed adj2 (consent or choice or decision*)).tw.
20. or/7‐19
21. 6 and 20
22. (risk* adj3 (notif* or inform* or communicat* or counsel* or appraisal or assessment or perception* or perceiv*)).tw.
23. 21 or 22
24. exp mass screening/
25. (screen* or test? or testing or detection or early diagnosis).tw.
26. exp early diagnosis/
27. exp "diagnostic techniques and procedures"/
28. exp "laboratory techniques and procedures"/
29. exp tumor markers biological/
30. predictive value of tests/
31. (mammography or mammogram* or colonoscopy or sigmoidoscopy or occult blood or vaginal smear* or pap* smear* or prostate specific antigen* or (prostat* and psa) or brca* or chest x‐ray or tomograph* or bronchoscop*).tw.
32. or/24‐31
33. 23 and 32
34. randomized controlled trial.pt.
35. controlled clinical trial.pt.
36. randomized.ab.
37. placebo.ab.
38. clinical trials as topic.sh.
39. randomly.ab.
40. trial.ti.
41. or/34‐40
42. exp animals/ not humans.sh.
43. 41 not 42
44. 33 and 43
45. limit 44 to yr=2006 to 2011
Appendix 5. Search Strategy: PsycINFO
PsycINFO (OvidSP) (2006 to March 2012)
1. risk factors/
2. risk assessment/
3. risk perception/
4. at risk populations/
5. "susceptibility (disorders)"/
6. predisposition/
7. (risk* or susceptib*).ti,ab,id.
8. personalization/
9. ((tailor* or personal* or individual*) adj2 (counsel* or message* or material* or intervention*)).ti,ab,id.
10. (tailored or tailoring or individuali#ed or personali#ed).ti,ab,id.
11. or/1‐10
12. communication/
13. persuasive communication/
14. information/
15. messages/
16. counseling/
17. genetic counseling/
18. health promotion/
19. health education/
20. client education/
21. individualized instruction/
22. health knowledge/
23. health attitudes/
24. informed consent/
25. treatment compliance/
26. decision making/
27. (informed adj2 (consent or choice or decision*)).ti,ab,id.
28. or/12‐27
29. 11 and 28
30. (risk* adj3 (notif* or inform* or communicat* or counsel* or apprais* or assessment or perception* ot perceiv*)).ti,ab,id.
31. 29 or 30
32. screening/
33. exp health screening/
34. exp screening tests/
35. (screen* or test? or testing or detection or early diagnosis).ti,ab,id.
36. exp diagnosis/
37. biological markers/
38. (mammography or mammogram* or colonoscopy or sigmoidoscopy or occult blood or vaginal smear* or pap* smear* or pap* test* or prostate specific antigen* or (prostat* and psa) or brca* or chest x‐ray or tomograph* or bronchoscop* or bone density or absorptiometry).ti,ab,id.
39. or/32‐38
40. 31 and 39
41. random*.ti,ab,hw,id.
42. trial*.ti,ab,hw,id.
43. control*.ti,ab,hw,id.
44. placebo*.ti,ab,hw,id.
45. ((singl* or doubl* or trebl* or tripl*) and (blind* or mask*)).ti,ab,hw,id.
46. (cross over or crossover or factorial* or latin square).ti,ab,hw,id.
47. (assign* or allocat* or volunteer*).ti,ab,hw,id.
48. treatment effectiveness evaluation/
49. mental health program evaluation/
50. exp experimental design/
51. "2000".md.
52. or/41‐51
53. 40 and 52
54. limit 53 to yr="2006 ‐Current"
Data and analyses
Comparison 1. personalised risk communication versus general risk information.
| Outcome or subgroup title | No. of studies | No. of participants | Statistical method | Effect size |
|---|---|---|---|---|
| 1 Informed decision | 3 | 2444 | Odds Ratio (Fixed, 95% CI) | 4.48 [3.62, 5.53] |
| 1.1 calculated risk score (numerical) v general information | 1 | 338 | Odds Ratio (Fixed, 95% CI) | 2.08 [1.14, 3.81] |
| 1.2 personal risk factor list v general information | 2 | 2106 | Odds Ratio (Fixed, 95% CI) | 4.98 [3.97, 6.24] |
| 2 knowledge regarding screening test / condition concerned | 4 | Std. Mean Difference (Fixed, 95% CI) | Subtotals only | |
| 2.1 calculated risk score (numerical) v general information | 1 | 588 | Std. Mean Difference (Fixed, 95% CI) | 0.40 [0.23, 0.56] |
| 2.2 calculated risk score (categorised) v general information | 1 | 260 | Std. Mean Difference (Fixed, 95% CI) | 0.57 [0.32, 0.82] |
| 2.3 personal risk factor list v general information | 2 | 838 | Std. Mean Difference (Fixed, 95% CI) | 0.89 [0.75, 1.04] |
| 3 knowledge regarding screening test / condition concerned‐ proportion with good knowledge | 3 | Odds Ratio (Random, 95% CI) | Subtotals only | |
| 3.1 calculated risk score (numerical) v general information | 3 | 1413 | Odds Ratio (Random, 95% CI) | 2.60 [1.27, 5.34] |
| 4 knowledge regarding screening test / condition concerned‐ proportion with good knowledge | 2 | 2107 | Odds Ratio (Fixed, 95% CI) | 7.13 [5.79, 8.79] |
| 4.1 personal risk factor list v general information | 2 | 2107 | Odds Ratio (Fixed, 95% CI) | 7.13 [5.79, 8.79] |
| 5 accurately perceived risk | 3 | 1264 | Odds Ratio (M‐H, Random, 95% CI) | 1.65 [0.96, 2.81] |
| 5.1 calculated risk score (numerical) v general information | 2 | 1004 | Odds Ratio (M‐H, Random, 95% CI) | 1.22 [0.91, 1.64] |
| 5.2 calculated risk score (categorised) v general information | 1 | 260 | Odds Ratio (M‐H, Random, 95% CI) | 2.50 [1.48, 4.20] |
| 6 perceived risk ‐ perceiving self as appropriate candidate for test | 1 | Odds Ratio (M‐H, Fixed, 95% CI) | Totals not selected | |
| 6.1 calculated risk score (numerical) v general information | 1 | Odds Ratio (M‐H, Fixed, 95% CI) | 0.0 [0.0, 0.0] | |
| 7 Anxiety (Cancer related anxiety and helplessness scale; IES breast cancer distress) | 6 | 1848 | Std. Mean Difference (Random, 95% CI) | ‐0.13 [‐0.29, 0.03] |
| 7.1 calculated risk score (numerical) v general information | 4 | 1058 | Std. Mean Difference (Random, 95% CI) | ‐0.19 [‐0.42, 0.04] |
| 7.2 calculated risk score (categorised) v general information | 1 | 260 | Std. Mean Difference (Random, 95% CI) | 0.0 [‐0.24, 0.24] |
| 7.3 personal risk factor list v general information | 1 | 530 | Std. Mean Difference (Random, 95% CI) | ‐0.02 [‐0.20, 0.16] |
| 8 decision conflict (proportion with lower scores) | 1 | Odds Ratio (M‐H, Fixed, 95% CI) | Totals not selected | |
| 8.1 personal risk factor list v general information | 1 | Odds Ratio (M‐H, Fixed, 95% CI) | 0.0 [0.0, 0.0] | |
| 9 decision conflict | 1 | Mean Difference (Fixed, 95% CI) | Totals not selected | |
| 9.1 calculated risk score (numerical) v general information | 1 | Mean Difference (Fixed, 95% CI) | 0.0 [0.0, 0.0] | |
| 10 satisfaction with decision | 1 | Mean Difference (IV, Fixed, 95% CI) | Totals not selected | |
| 10.1 personal risk factor list v general information | 1 | Mean Difference (IV, Fixed, 95% CI) | 0.0 [0.0, 0.0] | |
| 11 intention to take screening test | 7 | Odds Ratio (Random, 95% CI) | Totals not selected | |
| 11.1 calculated risk score (numerical) v general information | 1 | Odds Ratio (Random, 95% CI) | 0.0 [0.0, 0.0] | |
| 11.2 calculated risk score (categorised) v general information | 3 | Odds Ratio (Random, 95% CI) | 0.0 [0.0, 0.0] | |
| 11.3 personal risk factor list v general information | 3 | Odds Ratio (Random, 95% CI) | 0.0 [0.0, 0.0] | |
| 12 intention to take genetic screening test in normal risk patients | 1 | Odds Ratio (M‐H, Fixed, 95% CI) | Totals not selected | |
| 12.1 calculated risk score (numerical) | 1 | Odds Ratio (M‐H, Fixed, 95% CI) | 0.0 [0.0, 0.0] | |
| 13 intention to take genetic screening test in normal risk patients | 2 | Mean Difference (Random, 95% CI) | ‐0.77 [‐1.42, ‐0.13] | |
| 13.1 calculated risk score (numerical) | 1 | Mean Difference (Random, 95% CI) | ‐0.52 [‐0.61, ‐0.43] | |
| 13.2 calculated risk score (categorised) | 1 | Mean Difference (Random, 95% CI) | ‐1.2 [‐1.88, ‐0.52] | |
| 14 uptake of screening test | 12 | 6442 | Odds Ratio (Fixed, 95% CI) | 1.15 [1.02, 1.29] |
| 14.1 calculated risk score (numerical) v general information | 6 | 2569 | Odds Ratio (Fixed, 95% CI) | 0.95 [0.78, 1.15] |
| 14.2 calculated risk score (categorised) v general information | 6 | 3873 | Odds Ratio (Fixed, 95% CI) | 1.29 [1.11, 1.51] |
| 15 uptake of screening test | 20 | Odds Ratio (Random, 95% CI) | Totals not selected | |
| 15.1 personal risk factor list v general information | 20 | Odds Ratio (Random, 95% CI) | 0.0 [0.0, 0.0] | |
| 16 appropriate use of cholesterol test | 1 | Odds Ratio (M‐H, Fixed, 95% CI) | Totals not selected | |
| 16.1 calculated risk score (numerical) v general information | 1 | Odds Ratio (M‐H, Fixed, 95% CI) | 0.0 [0.0, 0.0] | |
| 17 improvement in risk comprehension/perception | 1 | Odds Ratio (M‐H, Fixed, 95% CI) | Totals not selected | |
| 17.1 calculated risk score (numerical) v general information | 1 | Odds Ratio (M‐H, Fixed, 95% CI) | 0.0 [0.0, 0.0] | |
| 18 stages of change | Other data | No numeric data | ||
| 18.1 personal risk factor list v general information | Other data | No numeric data | ||
| 19 making a recommended behaviour change | 1 | Odds Ratio (M‐H, Fixed, 95% CI) | Totals not selected | |
| 19.1 personal risk factor list v general information | 1 | Odds Ratio (M‐H, Fixed, 95% CI) | 0.0 [0.0, 0.0] | |
| 20 Quality of life (SF‐36) | 1 | Mean Difference (Fixed, 95% CI) | Totals not selected | |
| 20.1 calculated risk score (categorised) v general information | 1 | Mean Difference (Fixed, 95% CI) | 0.0 [0.0, 0.0] |
1.3. Analysis.

Comparison 1 personalised risk communication versus general risk information, Outcome 3 knowledge regarding screening test / condition concerned‐ proportion with good knowledge.
1.4. Analysis.

Comparison 1 personalised risk communication versus general risk information, Outcome 4 knowledge regarding screening test / condition concerned‐ proportion with good knowledge.
1.8. Analysis.

Comparison 1 personalised risk communication versus general risk information, Outcome 8 decision conflict (proportion with lower scores).
1.19. Analysis.

Comparison 1 personalised risk communication versus general risk information, Outcome 19 making a recommended behaviour change.
Comparison 2. personalised risk communication versus general risk information for PAP SMEARS.
| Outcome or subgroup title | No. of studies | No. of participants | Statistical method | Effect size |
|---|---|---|---|---|
| 1 intention to take screening test | 1 | Odds Ratio (M‐H, Fixed, 95% CI) | Totals not selected | |
| 1.1 personal risk factor list v general information | 1 | Odds Ratio (M‐H, Fixed, 95% CI) | 0.0 [0.0, 0.0] | |
| 2 uptake of screening test | 3 | Odds Ratio (M‐H, Fixed, 95% CI) | Totals not selected | |
| 2.1 calculated risk score (numerical) v general information | 1 | Odds Ratio (M‐H, Fixed, 95% CI) | 0.0 [0.0, 0.0] | |
| 2.2 personal risk factor list v general information | 2 | Odds Ratio (M‐H, Fixed, 95% CI) | 0.0 [0.0, 0.0] |
2.1. Analysis.

Comparison 2 personalised risk communication versus general risk information for PAP SMEARS, Outcome 1 intention to take screening test.
2.2. Analysis.

Comparison 2 personalised risk communication versus general risk information for PAP SMEARS, Outcome 2 uptake of screening test.
Comparison 3. personalised risk communication versus general risk information for MAMMOGRAPHY.
| Outcome or subgroup title | No. of studies | No. of participants | Statistical method | Effect size |
|---|---|---|---|---|
| 1 knowledge regarding screening test / condition concerned | 1 | Odds Ratio (M‐H, Fixed, 95% CI) | Totals not selected | |
| 1.1 calculated risk score (numerical) v general information | 1 | Odds Ratio (M‐H, Fixed, 95% CI) | 0.0 [0.0, 0.0] | |
| 2 accuracy of perceived risk | 1 | Odds Ratio (M‐H, Fixed, 95% CI) | Totals not selected | |
| 2.1 calculated risk score (numerical) v general information | 1 | Odds Ratio (M‐H, Fixed, 95% CI) | 0.0 [0.0, 0.0] | |
| 3 anxiety (Cancer related anxiety and helplessness scale; IES breast cancer distress) | 1 | Mean Difference (IV, Fixed, 95% CI) | Totals not selected | |
| 3.1 calculated risk score (numerical) v general information | 1 | Mean Difference (IV, Fixed, 95% CI) | 0.0 [0.0, 0.0] | |
| 4 intention to take screening test | 2 | Odds Ratio (Fixed, 95% CI) | Totals not selected | |
| 4.1 calculated risk score (categorised) v general information | 1 | Odds Ratio (Fixed, 95% CI) | 0.0 [0.0, 0.0] | |
| 4.2 personal risk factor list v general information | 1 | Odds Ratio (Fixed, 95% CI) | 0.0 [0.0, 0.0] | |
| 5 uptake of screening test | 4 | 1595 | Odds Ratio (M‐H, Fixed, 95% CI) | 0.84 [0.68, 1.03] |
| 5.1 calculated risk score (numerical) v general information | 4 | 1595 | Odds Ratio (M‐H, Fixed, 95% CI) | 0.84 [0.68, 1.03] |
| 6 uptake of screening test | 3 | Odds Ratio (M‐H, Random, 95% CI) | Totals not selected | |
| 6.1 calculated risk score (categorised) v general information | 3 | Odds Ratio (M‐H, Random, 95% CI) | 0.0 [0.0, 0.0] | |
| 7 uptake of screening test | 8 | Odds Ratio (M‐H, Random, 95% CI) | Totals not selected | |
| 7.1 personal risk factor list v general information | 8 | Odds Ratio (M‐H, Random, 95% CI) | 0.0 [0.0, 0.0] | |
| 8 stages of change | Other data | No numeric data | ||
| 8.1 personal risk factor list v general information | Other data | No numeric data |
3.1. Analysis.

Comparison 3 personalised risk communication versus general risk information for MAMMOGRAPHY, Outcome 1 knowledge regarding screening test / condition concerned.
3.2. Analysis.

Comparison 3 personalised risk communication versus general risk information for MAMMOGRAPHY, Outcome 2 accuracy of perceived risk.
3.3. Analysis.

Comparison 3 personalised risk communication versus general risk information for MAMMOGRAPHY, Outcome 3 anxiety (Cancer related anxiety and helplessness scale; IES breast cancer distress).
3.4. Analysis.

Comparison 3 personalised risk communication versus general risk information for MAMMOGRAPHY, Outcome 4 intention to take screening test.
3.8. Analysis.
Comparison 3 personalised risk communication versus general risk information for MAMMOGRAPHY, Outcome 8 stages of change.
| stages of change | |
|---|---|
| Study | |
| personal risk factor list v general information | |
| Skinner 1994 | 71% did not change; 14% advanced one stage; 12% 'regressed': no significant differences between tailored message and control. |
Comparison 4. personalised risk communication versus general risk information for CHOLESTEROL TESTS.
| Outcome or subgroup title | No. of studies | No. of participants | Statistical method | Effect size |
|---|---|---|---|---|
| 1 uptake of screening test | 2 | Odds Ratio (M‐H, Fixed, 95% CI) | Totals not selected | |
| 1.1 calculated risk score (numerical) v general information | 1 | Odds Ratio (M‐H, Fixed, 95% CI) | 0.0 [0.0, 0.0] | |
| 1.2 calculated risk score (categorised) v general information | 0 | Odds Ratio (M‐H, Fixed, 95% CI) | 0.0 [0.0, 0.0] | |
| 1.3 personal risk factor list v general information | 1 | Odds Ratio (M‐H, Fixed, 95% CI) | 0.0 [0.0, 0.0] | |
| 2 appropriate use of cholesterol test | 1 | Odds Ratio (M‐H, Fixed, 95% CI) | Totals not selected | |
| 2.1 personal risk factor list v general information | 1 | Odds Ratio (M‐H, Fixed, 95% CI) | 0.0 [0.0, 0.0] |
4.1. Analysis.

Comparison 4 personalised risk communication versus general risk information for CHOLESTEROL TESTS, Outcome 1 uptake of screening test.
4.2. Analysis.

Comparison 4 personalised risk communication versus general risk information for CHOLESTEROL TESTS, Outcome 2 appropriate use of cholesterol test.
Comparison 5. personalised risk communication versus general risk information for 'HIGH RISK' PEOPLE.
| Outcome or subgroup title | No. of studies | No. of participants | Statistical method | Effect size |
|---|---|---|---|---|
| 1 knowledge regarding screening test / condition concerned | 3 | 1156 | Std. Mean Difference (Fixed, 95% CI) | 0.59 [0.47, 0.71] |
| 1.1 calculated risk score (numerical) v general information | 1 | 588 | Std. Mean Difference (Fixed, 95% CI) | 0.40 [0.23, 0.56] |
| 1.2 calculated risk score (categorised) v general information | 1 | 260 | Std. Mean Difference (Fixed, 95% CI) | 0.57 [0.32, 0.82] |
| 1.3 personal risk factor list v general information | 1 | 308 | Std. Mean Difference (Fixed, 95% CI) | 1.02 [0.78, 1.26] |
| 2 perceived risk ‐ perceiving self as appropriate candidate for test | 1 | Odds Ratio (M‐H, Fixed, 95% CI) | Totals not selected | |
| 2.1 calculated risk score (numerical) v general information | 1 | Odds Ratio (M‐H, Fixed, 95% CI) | 0.0 [0.0, 0.0] | |
| 3 accurately perceived risk | 2 | 460 | Odds Ratio (M‐H, Fixed, 95% CI) | 2.25 [1.44, 3.53] |
| 3.1 calculated risk score (numerical) v general information | 1 | 200 | Odds Ratio (M‐H, Fixed, 95% CI) | 1.69 [0.70, 4.06] |
| 3.2 calculated risk score (categorised) v general information | 1 | 260 | Odds Ratio (M‐H, Fixed, 95% CI) | 2.50 [1.48, 4.20] |
| 4 anxiety (Cancer related anxiety and helplessness scale; IES breast cancer distress) | 3 | 662 | Mean Difference (IV, Fixed, 95% CI) | 0.07 [‐0.14, 0.28] |
| 4.1 calculated risk score (numerical) v general information | 2 | 402 | Mean Difference (IV, Fixed, 95% CI) | 0.16 [‐0.16, 0.48] |
| 4.2 calculated risk score (categorised) v general information | 1 | 260 | Mean Difference (IV, Fixed, 95% CI) | 0.0 [‐0.28, 0.28] |
| 5 intention to take screening test | 3 | 854 | Odds Ratio (Fixed, 95% CI) | 1.29 [0.97, 1.72] |
| 5.1 calculated risk score (categorised) v general information | 1 | 260 | Odds Ratio (Fixed, 95% CI) | 0.21 [0.07, 0.64] |
| 5.2 personal risk factor list v general information | 2 | 594 | Odds Ratio (Fixed, 95% CI) | 1.47 [1.09, 1.97] |
| 6 uptake of screening test | 5 | 2085 | Odds Ratio (Fixed, 95% CI) | 1.22 [1.00, 1.48] |
| 6.1 calculated risk score (numerical) v general information | 3 | 1156 | Odds Ratio (Fixed, 95% CI) | 1.05 [0.79, 1.40] |
| 6.2 calculated risk score (categorised) v general information | 2 | 929 | Odds Ratio (Fixed, 95% CI) | 1.38 [1.06, 1.80] |
| 7 uptake of screening test | 7 | Odds Ratio (Random, 95% CI) | Totals not selected | |
| 7.1 personal risk factor list v general information | 7 | Odds Ratio (Random, 95% CI) | 0.0 [0.0, 0.0] | |
| 8 stages of change | Other data | No numeric data | ||
| 8.1 personal risk factor list v general information | Other data | No numeric data |
5.1. Analysis.

Comparison 5 personalised risk communication versus general risk information for 'HIGH RISK' PEOPLE, Outcome 1 knowledge regarding screening test / condition concerned.
5.2. Analysis.

Comparison 5 personalised risk communication versus general risk information for 'HIGH RISK' PEOPLE, Outcome 2 perceived risk ‐ perceiving self as appropriate candidate for test.
5.3. Analysis.

Comparison 5 personalised risk communication versus general risk information for 'HIGH RISK' PEOPLE, Outcome 3 accurately perceived risk.
5.4. Analysis.

Comparison 5 personalised risk communication versus general risk information for 'HIGH RISK' PEOPLE, Outcome 4 anxiety (Cancer related anxiety and helplessness scale; IES breast cancer distress).
5.5. Analysis.

Comparison 5 personalised risk communication versus general risk information for 'HIGH RISK' PEOPLE, Outcome 5 intention to take screening test.
5.8. Analysis.
Comparison 5 personalised risk communication versus general risk information for 'HIGH RISK' PEOPLE, Outcome 8 stages of change.
| stages of change | |
|---|---|
| Study | |
| personal risk factor list v general information | |
| Rawl 2008 | Forward movement of stage was:
Forward movement of stage was slightly higher in the risk tailored group. |
Comparison 6. personalised risk communication versus general risk information for COLORECTAL SCREENING.
| Outcome or subgroup title | No. of studies | No. of participants | Statistical method | Effect size |
|---|---|---|---|---|
| 1 Informed decision | 2 | 2107 | Odds Ratio (Fixed, 95% CI) | 4.99 [3.98, 6.25] |
| 1.1 personal risk factor list v general information | 2 | 2107 | Odds Ratio (Fixed, 95% CI) | 4.99 [3.98, 6.25] |
| 2 knowledge regarding screening test / condition concerned | 3 | 2378 | Odds Ratio (M‐H, Fixed, 95% CI) | 6.81 [5.57, 8.34] |
| 2.1 calculated risk score (numerical) v general information | 1 | 271 | Odds Ratio (M‐H, Fixed, 95% CI) | 4.26 [1.86, 9.74] |
| 2.2 personal risk factor list v general information | 2 | 2107 | Odds Ratio (M‐H, Fixed, 95% CI) | 7.04 [5.72, 8.67] |
| 3 knowledge regarding screening test / condition concerned | 1 | Mean Difference (IV, Fixed, 95% CI) | Totals not selected | |
| 3.1 personal risk factor list v general information | 1 | Mean Difference (IV, Fixed, 95% CI) | 0.0 [0.0, 0.0] | |
| 4 anxiety (Cancer related anxiety and helplessness scale; IES breast cancer distress) | 1 | Mean Difference (IV, Fixed, 95% CI) | Totals not selected | |
| 4.1 personal risk factor list v general information | 1 | Mean Difference (IV, Fixed, 95% CI) | 0.0 [0.0, 0.0] | |
| 5 satisfaction with decision | 1 | Mean Difference (IV, Fixed, 95% CI) | Totals not selected | |
| 5.1 personal risk factor list v general information | 1 | Mean Difference (IV, Fixed, 95% CI) | 0.0 [0.0, 0.0] | |
| 6 Decision conflict (proportion with low scores) | 1 | Odds Ratio (M‐H, Fixed, 95% CI) | Totals not selected | |
| 6.1 personal risk factor list v general information | 1 | Odds Ratio (M‐H, Fixed, 95% CI) | 0.0 [0.0, 0.0] | |
| 7 intention to take screening test | 1 | Odds Ratio (M‐H, Fixed, 95% CI) | Totals not selected | |
| 7.1 calculated risk score (numerical) v general information | 1 | Odds Ratio (M‐H, Fixed, 95% CI) | 0.0 [0.0, 0.0] | |
| 8 uptake of screening test | 10 | 5567 | Odds Ratio (M‐H, Random, 95% CI) | 1.06 [0.82, 1.37] |
| 8.1 calculated risk score (numerical) v general information | 1 | 271 | Odds Ratio (M‐H, Random, 95% CI) | 0.78 [0.28, 2.17] |
| 8.2 calculated risk score (categorised) v general information | 3 | 1557 | Odds Ratio (M‐H, Random, 95% CI) | 1.34 [1.01, 1.77] |
| 8.3 personal risk factor list v general information | 6 | 3739 | Odds Ratio (M‐H, Random, 95% CI) | 0.96 [0.68, 1.35] |
| 9 stages of change | Other data | No numeric data | ||
| 9.1 personal risk factor list v general information | Other data | No numeric data |
6.1. Analysis.

Comparison 6 personalised risk communication versus general risk information for COLORECTAL SCREENING, Outcome 1 Informed decision.
6.2. Analysis.

Comparison 6 personalised risk communication versus general risk information for COLORECTAL SCREENING, Outcome 2 knowledge regarding screening test / condition concerned.
6.3. Analysis.

Comparison 6 personalised risk communication versus general risk information for COLORECTAL SCREENING, Outcome 3 knowledge regarding screening test / condition concerned.
6.4. Analysis.

Comparison 6 personalised risk communication versus general risk information for COLORECTAL SCREENING, Outcome 4 anxiety (Cancer related anxiety and helplessness scale; IES breast cancer distress).
6.5. Analysis.

Comparison 6 personalised risk communication versus general risk information for COLORECTAL SCREENING, Outcome 5 satisfaction with decision.
6.6. Analysis.

Comparison 6 personalised risk communication versus general risk information for COLORECTAL SCREENING, Outcome 6 Decision conflict (proportion with low scores).
6.7. Analysis.

Comparison 6 personalised risk communication versus general risk information for COLORECTAL SCREENING, Outcome 7 intention to take screening test.
6.9. Analysis.
Comparison 6 personalised risk communication versus general risk information for COLORECTAL SCREENING, Outcome 9 stages of change.
| stages of change | |
|---|---|
| Study | |
| personal risk factor list v general information | |
| Rawl 2008 | Forward movement of stage was:
Forward movement of stage was slightly higher in the risk tailored group. |
Comparison 7. personalised risk communication versus general risk information for PROSTATE CANCER SCREENING.
| Outcome or subgroup title | No. of studies | No. of participants | Statistical method | Effect size |
|---|---|---|---|---|
| 1 uptake of screening test | 1 | Odds Ratio (M‐H, Fixed, 95% CI) | Totals not selected | |
| 1.1 personal risk factor list v general information | 1 | Odds Ratio (M‐H, Fixed, 95% CI) | 0.0 [0.0, 0.0] |
7.1. Analysis.

Comparison 7 personalised risk communication versus general risk information for PROSTATE CANCER SCREENING, Outcome 1 uptake of screening test.
Comparison 8. Personalised risk communication versus general risk information for SKIN CANCER SCREENING.
| Outcome or subgroup title | No. of studies | No. of participants | Statistical method | Effect size |
|---|---|---|---|---|
| 1 knowledge regarding screening test / condition concerned (Generic Inverse Variance) | 1 | Std. Mean Difference (Fixed, 95% CI) | Totals not selected | |
| 1.1 calculated risk score(numerical) v general information | 1 | Std. Mean Difference (Fixed, 95% CI) | 0.0 [0.0, 0.0] | |
| 2 intention to take screening test | 1 | Odds Ratio (Fixed, 95% CI) | Totals not selected | |
| 2.1 Personal risk factor list v general information | 1 | Odds Ratio (Fixed, 95% CI) | 0.0 [0.0, 0.0] | |
| 3 uptake of screening test | 3 | 1284 | Odds Ratio (Fixed, 95% CI) | 1.69 [1.32, 2.18] |
| 3.1 calculated risk score(numerical) v general information | 1 | 587 | Odds Ratio (Fixed, 95% CI) | 1.67 [1.04, 2.69] |
| 3.2 personal risk factor list v general information | 2 | 697 | Odds Ratio (Fixed, 95% CI) | 1.70 [1.26, 2.29] |
8.1. Analysis.

Comparison 8 Personalised risk communication versus general risk information for SKIN CANCER SCREENING, Outcome 1 knowledge regarding screening test / condition concerned (Generic Inverse Variance).
8.2. Analysis.

Comparison 8 Personalised risk communication versus general risk information for SKIN CANCER SCREENING, Outcome 2 intention to take screening test.
8.3. Analysis.

Comparison 8 Personalised risk communication versus general risk information for SKIN CANCER SCREENING, Outcome 3 uptake of screening test.
Comparison 9. Personalised risk communication versus general risk information for PRENATAL TESTING FOR FOETAL ABNORMALITY.
| Outcome or subgroup title | No. of studies | No. of participants | Statistical method | Effect size |
|---|---|---|---|---|
| 1 Informed decision | 1 | 338 | Odds Ratio (Fixed, 95% CI) | 2.08 [1.14, 3.81] |
| 1.1 calculated risk score(numerical) v general information | 1 | 338 | Odds Ratio (Fixed, 95% CI) | 2.08 [1.14, 3.81] |
| 2 knowledge regarding screening test / condition concerned | 1 | Odds Ratio (M‐H, Fixed, 95% CI) | Totals not selected | |
| 2.1 calculated risk score(numerical) v general information | 1 | Odds Ratio (M‐H, Fixed, 95% CI) | 0.0 [0.0, 0.0] | |
| 3 uptake of screening test | 1 | Odds Ratio (M‐H, Fixed, 95% CI) | Totals not selected | |
| 3.1 calculated risk score(numerical) v general information | 1 | Odds Ratio (M‐H, Fixed, 95% CI) | 0.0 [0.0, 0.0] | |
| 4 anxiety | 1 | Mean Difference (IV, Fixed, 95% CI) | Totals not selected | |
| 4.1 calculated risk score(numerical) v general information | 1 | Mean Difference (IV, Fixed, 95% CI) | 0.0 [0.0, 0.0] | |
| 5 decision conflict | 1 | Mean Difference (IV, Fixed, 95% CI) | Totals not selected | |
| 5.1 calculated risk score(numerical) v general information | 1 | Mean Difference (IV, Fixed, 95% CI) | 0.0 [0.0, 0.0] |
9.1. Analysis.

Comparison 9 Personalised risk communication versus general risk information for PRENATAL TESTING FOR FOETAL ABNORMALITY, Outcome 1 Informed decision.
9.2. Analysis.

Comparison 9 Personalised risk communication versus general risk information for PRENATAL TESTING FOR FOETAL ABNORMALITY, Outcome 2 knowledge regarding screening test / condition concerned.
9.3. Analysis.

Comparison 9 Personalised risk communication versus general risk information for PRENATAL TESTING FOR FOETAL ABNORMALITY, Outcome 3 uptake of screening test.
9.4. Analysis.

Comparison 9 Personalised risk communication versus general risk information for PRENATAL TESTING FOR FOETAL ABNORMALITY, Outcome 4 anxiety.
9.5. Analysis.

Comparison 9 Personalised risk communication versus general risk information for PRENATAL TESTING FOR FOETAL ABNORMALITY, Outcome 5 decision conflict.
Characteristics of studies
Characteristics of included studies [ordered by study ID]
Bastani 1999.
| Methods | RCT | |
| Participants | Women over 30; breast cancer in first degree relative; resident in USA or Canada. Number of participants included in the analysis = 753. | |
| Interventions | Mailed personalised risk assessment notification and other theoretically driven (Adherence Model) materials tailored for high risk women. | |
| Outcomes | Uptake of mammography one year after baseline survey. | |
| Notes | ||
| Risk of bias | ||
| Bias | Authors' judgement | Support for judgement |
| Random sequence generation (selection bias) | Unclear risk | No information provided. |
| Allocation concealment (selection bias) | Unclear risk | No information provided. |
| Blinding of participants and personnel (performance bias) All outcomes | Unclear risk | Authors do not mention blinding of participants and/or personnel. |
| Blinding of outcome assessment (detection bias) All outcomes | Unclear risk | Authors do not mention blinding of outcome assessors. |
| Incomplete outcome data (attrition bias) All outcomes | High risk | Significant loss to follow‐up. 22% loss in the intervention arm and 11% loss in the control arm. Incomplete data were excluded from the analysis. |
| Selective reporting (reporting bias) | Unclear risk | Study protocol was not available but all outcomes in the methods section of the study were reported. |
| Funding for the screening test | Unclear risk | No information provided. |
| Baseline comparability | High risk | Lower education levels in intervention group. |
| Measure against contamination | Low risk | Members of the same family received the same interventions. |
Bloom 2006.
| Methods | RCT | |
| Participants | Breast cancer screening in high risk women (those who have first degree relatives with breast cancer diagnosed at age < 50). Number of participants included in the analysis = 163. | |
| Interventions | Telephone counselling. | |
| Outcomes | Breast cancer worry, Achievement of more accurate risk perception, Improvements in health behaviours, breast cancer screening‐ mammography and clinical breast examination; six months post intervention. | |
| Notes | Mammography adherence reported for women aged more that 40 years only. | |
| Risk of bias | ||
| Bias | Authors' judgement | Support for judgement |
| Random sequence generation (selection bias) | Unclear risk | No information provided. |
| Allocation concealment (selection bias) | Unclear risk | No information provided. |
| Blinding of participants and personnel (performance bias) All outcomes | Unclear risk | Authors do not mention blinding of participants and/or personnel. |
| Blinding of outcome assessment (detection bias) All outcomes | Unclear risk | Authors do not mention blinding of outcome assessors. |
| Incomplete outcome data (attrition bias) All outcomes | Low risk | Intention‐to‐treat analysis done. |
| Selective reporting (reporting bias) | High risk | Study protocol was not available. Mammography adherence reported for women aged more that 40 years only. |
| Funding for the screening test | Unclear risk | No information provided. |
| Baseline comparability | Unclear risk | Baseline demographic and behavioural characteristics not mentioned separately for control and intervention arms. |
| Measure against contamination | High risk | The participants were relatives of those who were diagnosed with breast cancer. They were recruited through the index cancer patients. There may be a high chance of contamination and authors do not mention any measures taken to prevent this. |
Bodurtha 2009.
| Methods | RCT | |
| Participants | Recruitment occurred in waiting rooms of four women’s health clinics in the Virginia Commonwealth University Health System in Richmond, Virginia, USA Women eligible for the study were:
Number of participants included in the analysis = 899. |
|
| Interventions | Participants in the intervention group had 5‐year and lifetime probabilities for breast cancer using the Gail model. Information sheets for those in intervention groups provided this personalised risk detail and also addressed other traditional constructs of Health Belief Model. Nutrition and physical activity were also included. | |
| Outcomes |
|
|
| Notes | ||
| Risk of bias | ||
| Bias | Authors' judgement | Support for judgement |
| Random sequence generation (selection bias) | Low risk | A biostatistician prepared stratified (by clinic) block randomisation assignments before the study. |
| Allocation concealment (selection bias) | Unclear risk | No information provided. |
| Blinding of participants and personnel (performance bias) All outcomes | Unclear risk | Authors do not mention blinding of participants and/or personnel. |
| Blinding of outcome assessment (detection bias) All outcomes | Unclear risk | Authors do not mention blinding of outcome assessors. |
| Incomplete outcome data (attrition bias) All outcomes | Low risk | Analysis preserved the intention to treat. |
| Selective reporting (reporting bias) | Unclear risk | Study protocol was not available. All outcomes in the study methods section were reported. |
| Funding for the screening test | Low risk | Most participants had some form of medical insurance. Self pay participants in the control and intervention groups were comparable at baseline. |
| Baseline comparability | Low risk | Baseline characteristics were comparable. |
| Measure against contamination | Unclear risk | No information provided. |
Bowen 2002.
| Methods | RCT | |
| Participants | Women with first degree relative with breast cancer; Seattle, USA. Number of participants included in the analysis = 317. | |
| Interventions | Individual or group‐based genetic counselling, including Gail and Claus scores. | |
| Outcomes | Interest in having BRCA tests; perception of self as appropriate candidate for tests, measured at six months. | |
| Notes | ||
| Risk of bias | ||
| Bias | Authors' judgement | Support for judgement |
| Random sequence generation (selection bias) | Unclear risk | No information provided. |
| Allocation concealment (selection bias) | Unclear risk | No information provided. |
| Blinding of participants and personnel (performance bias) All outcomes | Unclear risk | The authors do not report blinding of participants and/or personnel. |
| Blinding of outcome assessment (detection bias) All outcomes | Unclear risk | The authors do not report blinding of outcome assessors. |
| Incomplete outcome data (attrition bias) All outcomes | Low risk | Insignificant loss to follow‐up. |
| Selective reporting (reporting bias) | Unclear risk | Study protocol was unavailable. All stated outcomes in the methods section are reported. |
| Funding for the screening test | Unclear risk | No information provided. |
| Baseline comparability | Low risk | Baseline characteristics of participants in each arm did not differ significantly. |
| Measure against contamination | High risk | The participants were relatives of those who were diagnosed with breast cancer. Some were recruited through the index cancer patients, others by newspaper advertisements. There may be a chance of contamination and authors do not mention any measures taken to prevent this. |
Bowen 2006.
| Methods | RCT | |
| Participants | Sexual minority women (lesbian and bisexual women) aged 18 to 75. Participants were recruited by announcements in lesbian and gay mailing lists and organisations, newspapers at sexual minority women's community centres and Gay and Lesbian Employee network. Inclusion criteria:
|
|
| Interventions | Breast cancer counselling including information on screening mammography, breast self examination, stress management and social support session. A personalised assessment of breast cancer risk based on Gail and Claus model was provided to the participants in intervention group. | |
| Outcomes | Outcomes measured at 6 and 24 months were:
|
|
| Notes | Data could not be used in our analysis, but study reports increase in screening uptake in those aged above 40 in the intervention group. Perceived risk and the anxiety associated with breast cancer decreased significantly in the intervention group. | |
| Risk of bias | ||
| Bias | Authors' judgement | Support for judgement |
| Random sequence generation (selection bias) | Unclear risk | No information provided. |
| Allocation concealment (selection bias) | Unclear risk | No information provided. |
| Blinding of participants and personnel (performance bias) All outcomes | Unclear risk | The authors do not report blinding of participants and/or personnel. |
| Blinding of outcome assessment (detection bias) All outcomes | Unclear risk | The authors do not report blinding of outcome assessors. |
| Incomplete outcome data (attrition bias) All outcomes | Low risk | Low drop out rate in the study which is not significant. Those who dropped out of the study did not differ significantly in baseline characteristics. |
| Selective reporting (reporting bias) | High risk | Study protocol was not available. Uptake selectively reported for participants above age of 40. No mention of number of participants in these groups. |
| Funding for the screening test | Unclear risk | No information provided. |
| Baseline comparability | Low risk | Participants were comparable at baseline. |
| Measure against contamination | Unclear risk | No information provided. |
Bowen 2010.
| Methods | RCT | |
| Participants | Participants were recruited via telephone from purchased lists of women in general population in the Pacific Northwest. USA. Number of participants included in the analysis = 1366. | |
| Interventions | Participants were divided into average risk (70% in total), mixed risk (25%) and genetic risk (5%) depending on risk factors for breast cancer, Gail score and level of cancer worry. They were provided with stepped care interventions depending on their category. Mail intervention for all in intervention group, which was then stepped up for other intervention strategies according to risk; for example, genetic counselling for genetic risk individuals. | |
| Outcomes | Outcomes measured at one year were:
|
|
| Notes | ||
| Risk of bias | ||
| Bias | Authors' judgement | Support for judgement |
| Random sequence generation (selection bias) | Unclear risk | No information provided. |
| Allocation concealment (selection bias) | Unclear risk | No information provided. |
| Blinding of participants and personnel (performance bias) All outcomes | Unclear risk | The authors do not report blinding of participants and/or personnel. |
| Blinding of outcome assessment (detection bias) All outcomes | Unclear risk | The authors do not report blinding of outcome assessors. |
| Incomplete outcome data (attrition bias) All outcomes | Low risk | Intention‐to‐treat principle has been used. There was no difference in the characteristics of participants who were followed up compared with those lost to follow up. |
| Selective reporting (reporting bias) | High risk | Study protocol not available. Some outcomes in methods section have not been reported. |
| Funding for the screening test | Unclear risk | No information provided. |
| Baseline comparability | Low risk | Both study arms comparable at baseline. |
| Measure against contamination | Unclear risk | No information provided. |
Campbell 1997.
| Methods | RCT | |
| Participants | Women who had not had a cervical (Pap) smear in previous 30 months; New South Wales, Australia. Number of participants included in the analysis = 411. | |
| Interventions | Computer generated printed feedback, listing 'risk factor' of not having a smear within past 2 years. | |
| Outcomes | Uptake of cervical (Pap) smear was measured at 6 months | |
| Notes | ||
| Risk of bias | ||
| Bias | Authors' judgement | Support for judgement |
| Random sequence generation (selection bias) | High risk | Randomisation was undertaken according to day of attendance at practice. |
| Allocation concealment (selection bias) | Unclear risk | No information provided. |
| Blinding of participants and personnel (performance bias) All outcomes | Unclear risk | The authors do not report blinding of participants and/or personnel. |
| Blinding of outcome assessment (detection bias) All outcomes | Unclear risk | The authors do not report blinding of outcome assessors. |
| Incomplete outcome data (attrition bias) All outcomes | Low risk | Intervention was delivered immediately after recruitment and outcome ascertainment was carried out using self reporting and routinely collected data. There were no issues of loss to follow‐up. |
| Selective reporting (reporting bias) | Unclear risk | Study protocol not available. The only outcome measure was uptake of screening as mentioned in the study. |
| Funding for the screening test | Unclear risk | No information provided. |
| Baseline comparability | Low risk | No significant baseline difference between groups. |
| Measure against contamination | Low risk | Authors state randomisation by day of attendance was a measure against contamination. |
Champion 1994.
| Methods | RCT | |
| Participants | Women aged >= 35 ; never having had breast cancer. USA. Number of participants included in the analysis = 300. | |
| Interventions | In‐home interviews conducted by graduate nursing research assistants. Discussion about individual risk factors ‐ susceptibility intervention ‐ as part of a belief modifying intervention. | |
| Outcomes | Change in beliefs and knowledge (including susceptibility scores) post‐intervention; mammography compliance one year post‐intervention. | |
| Notes | ||
| Risk of bias | ||
| Bias | Authors' judgement | Support for judgement |
| Random sequence generation (selection bias) | Unclear risk | Random digit dialling but no other information provided. |
| Allocation concealment (selection bias) | Unclear risk | No information provided. |
| Blinding of participants and personnel (performance bias) All outcomes | Unclear risk | The authors do not report blinding of participants and/or personnel. |
| Blinding of outcome assessment (detection bias) All outcomes | Unclear risk | The authors do not report blinding of outcome assessors. |
| Incomplete outcome data (attrition bias) All outcomes | Low risk | Low attrition rate of 7%. Those who dropped out had moved their residence. |
| Selective reporting (reporting bias) | Unclear risk | Study protocol not available. All outcomes mentioned in the study have been reported. |
| Funding for the screening test | Unclear risk | No information provided. |
| Baseline comparability | High risk | Much higher baseline compliance rate for mammography in intervention group. |
| Measure against contamination | Unclear risk | No measures reported. |
Champion 1995.
| Methods | RCT | |
| Participants |
|
|
| Interventions | In‐home interviews conducted by graduate nursing students. Discussion about individual risk factors ‐ susceptibility intervention ‐ as part of a belief modifying intervention. | |
| Outcomes | Change in beliefs and knowledge, including susceptibility (scores); mammography compliance; movement across stages of change were measured at one year. | |
| Notes | ||
| Risk of bias | ||
| Bias | Authors' judgement | Support for judgement |
| Random sequence generation (selection bias) | Unclear risk | No information provided. |
| Allocation concealment (selection bias) | Unclear risk | No information provided. |
| Blinding of participants and personnel (performance bias) All outcomes | Unclear risk | The authors do not report blinding of participants and/or personnel. |
| Blinding of outcome assessment (detection bias) All outcomes | Unclear risk | The authors do not report blinding of outcome assessors. |
| Incomplete outcome data (attrition bias) All outcomes | Low risk | Low attrition rate of 7%. Those who dropped out had moved their residence. |
| Selective reporting (reporting bias) | High risk | Collected data for > 35 year olds but only reported for > 40 year olds. |
| Funding for the screening test | Unclear risk | No information provided. |
| Baseline comparability | Unclear risk | Unclear how many participants in each arm were in stage 3 of adoption of screening. |
| Measure against contamination | Unclear risk | No measures reported. |
Champion 2000a.
| Methods | RCT | |
| Participants | Low‐income African American women aged 45 to 64; Indiana, USA. Number of participants included in the analysis = 278. | |
| Interventions | In‐person tailored interventions based on Health Belief and Transtheoretical Models, including listing of susceptibility factors. | |
| Outcomes | Screening mammography uptake at one year. | |
| Notes | ||
| Risk of bias | ||
| Bias | Authors' judgement | Support for judgement |
| Random sequence generation (selection bias) | Low risk | Computer generated randomised sequence. |
| Allocation concealment (selection bias) | Unclear risk | No information provided. |
| Blinding of participants and personnel (performance bias) All outcomes | Unclear risk | The authors do not report blinding of participants and/or personnel. |
| Blinding of outcome assessment (detection bias) All outcomes | Unclear risk | The authors do not report blinding of outcome assessors. |
| Incomplete outcome data (attrition bias) All outcomes | Unclear risk | Low attrition rate of 11%. However authors do not give information on the reasons for this and the actual figures in each of the study arms. Incomplete data excluded from analysis. |
| Selective reporting (reporting bias) | Unclear risk | Study protocol not available. All outcomes mentioned in the study have been reported. |
| Funding for the screening test | Unclear risk | No information provided. |
| Baseline comparability | Unclear risk | No differences reported but very little data provided. |
| Measure against contamination | Unclear risk | No measures reported. |
Champion 2002.
| Methods | RCT | |
| Participants | Women aged over 50 not adherent to mammography recommendations; medical clinic at St Louis and HMO in Indianapolis, USA. Number of participants included in the analysis = 976. | |
| Interventions | Tailored interventions based on Health Belief and Transtheoretical Models, including perceived risk and risk factors (e.g. age, family history). | |
| Outcomes | Self‐reported mammography uptake at two months. | |
| Notes | ||
| Risk of bias | ||
| Bias | Authors' judgement | Support for judgement |
| Random sequence generation (selection bias) | Unclear risk | No information provided. |
| Allocation concealment (selection bias) | Unclear risk | No information provided. |
| Blinding of participants and personnel (performance bias) All outcomes | Unclear risk | The authors do not report blinding of participants and/or personnel. |
| Blinding of outcome assessment (detection bias) All outcomes | Unclear risk | The authors do not report blinding of outcome assessors. |
| Incomplete outcome data (attrition bias) All outcomes | High risk | Significant rate of attrition. This has not been clearly described. No mention of adjustments for missing data. |
| Selective reporting (reporting bias) | High risk | Study protocol not available. Not all outcomes addressed, sub‐group reporting. |
| Funding for the screening test | Unclear risk | No information provided. |
| Baseline comparability | High risk | Baseline characteristics have not been described separately for each study arms. |
| Measure against contamination | Unclear risk | No measures reported. |
Champion 2003.
| Methods | RCT | |
| Participants | Women in the 51 to 84 years age range who have not received a mammogram in the last 15 months; from an HMO and general medicine clinic, USA. Number of participants included in the analysis = 773. | |
| Interventions | Tailored interventions based on Health Belief and Transtheoretical Models, including listing of susceptibility factors. | |
| Outcomes | Screening mammography uptake at six months to one year. | |
| Notes | ||
| Risk of bias | ||
| Bias | Authors' judgement | Support for judgement |
| Random sequence generation (selection bias) | Low risk | Computer generated allocation sequence. |
| Allocation concealment (selection bias) | Unclear risk | No information provided. |
| Blinding of participants and personnel (performance bias) All outcomes | Unclear risk | The authors do not report blinding of participants and/or personnel. |
| Blinding of outcome assessment (detection bias) All outcomes | Unclear risk | The authors do not report blinding of outcome assessors. |
| Incomplete outcome data (attrition bias) All outcomes | Unclear risk | Insignificant attrition rate. However no reasons given for attrition and attrition rate in each of the study arms not explicit. Incomplete data excluded from analysis. |
| Selective reporting (reporting bias) | Unclear risk | Study protocol unavailable. Outcome mentioned in the study has been reported. |
| Funding for the screening test | Unclear risk | No information provided. |
| Baseline comparability | High risk | There are more African Americans in the control group. |
| Measure against contamination | Unclear risk | No measures reported. |
Champion 2007.
| Methods | RCT | |
| Participants | Participants recruited from two sites: A university‐affiliated general medicine clinic setting serving predominately low‐income clientele in St. Louis and a HMO comprised mainly of enrollees in Indianapolis, IN, USA. Number of participants included in the analysis = 1244. | |
| Interventions | Computer‐tailored interventions addressed each woman’s perceived risk of breast cancer, benefits and/or barriers related to screening and self‐efficacy for obtaining mammography, and her knowledge of the mammography procedure. | |
| Outcomes | Mammography adherence used for our review and forward stage movement (pre‐contemplation to contemplation, contemplation to action or pre‐contemplation to action) from baseline to 2 month post follow up. | |
| Notes | ||
| Risk of bias | ||
| Bias | Authors' judgement | Support for judgement |
| Random sequence generation (selection bias) | Unclear risk | No information provided. |
| Allocation concealment (selection bias) | Unclear risk | No information provided. |
| Blinding of participants and personnel (performance bias) All outcomes | Unclear risk | The authors do not report blinding of participants and/or personnel. |
| Blinding of outcome assessment (detection bias) All outcomes | Unclear risk | The authors do not report blinding of outcome assessors. |
| Incomplete outcome data (attrition bias) All outcomes | Low risk | No significant attrition. |
| Selective reporting (reporting bias) | Unclear risk | Study protocol not available. Outcomes mentioned in the study have been addressed. |
| Funding for the screening test | Unclear risk | No information provided. |
| Baseline comparability | Low risk | The study reports that there were no significant differences at baseline. |
| Measure against contamination | Unclear risk | No information provided. |
Curry 1993.
| Methods | RCT | |
| Participants | Women aged > = 50; newly enrolled in an HMO, without prior history of breast cancer or of mammography use in the previous 12 months. USA. Number of participants included in the analysis = 841. | |
| Interventions | Mailed risk factor questionnaire plus personal risk invitation detailing personal risk factors. | |
| Outcomes | Mammography use within 1 year of invitation. | |
| Notes | ||
| Risk of bias | ||
| Bias | Authors' judgement | Support for judgement |
| Random sequence generation (selection bias) | Unclear risk | No information provided. |
| Allocation concealment (selection bias) | Unclear risk | No information provided. |
| Blinding of participants and personnel (performance bias) All outcomes | Unclear risk | The authors do not report blinding of participants and/or personnel. |
| Blinding of outcome assessment (detection bias) All outcomes | Unclear risk | The authors do not report blinding of outcome assessors. |
| Incomplete outcome data (attrition bias) All outcomes | Low risk | Intention‐to‐treat analysis has been used. |
| Selective reporting (reporting bias) | Unclear risk | Study protocol unavailable. All outcomes mentioned in the study have been reported. |
| Funding for the screening test | Unclear risk | No information provided. |
| Baseline comparability | Unclear risk | Differences in response rates to baseline survey and rates of previous breast biopsy between study arms. |
| Measure against contamination | Unclear risk | No measures reported. |
Geller 2006.
| Methods | RCT | |
| Participants | Siblings of melanoma patients living in the USA were approached to participate in the study. Patients were recruited from the Boston area teaching hospital dermatology clinics, within a month after diagnosis of melanoma. Participants were at least 18 years of age with no previous history of skin cancer. Number of participants included in the analysis = 494. | |
| Interventions | The intervention drew on a number of psychosocial theories of health behaviour change, including Social Cognitive Theory, Theory of Planned Behaviour, The Health Belief Model, The Precaution Adoption Model, and The Transtheoretical Model. Intervention condition participants received an initial motivational and goal‐setting telephone intervention session delivered by the health educator. Thereafter computer‐generated tailored print materials were sent at 1, 3, and 5 months after randomization. | |
| Outcomes | Having skin cancer screen by dermatologist, personal examination of moles and use of sun protection at one year. | |
| Notes | ||
| Risk of bias | ||
| Bias | Authors' judgement | Support for judgement |
| Random sequence generation (selection bias) | High risk | Alternate patient groups used. |
| Allocation concealment (selection bias) | Unclear risk | No information provided. |
| Blinding of participants and personnel (performance bias) All outcomes | Unclear risk | The authors do not report blinding of participants and/or personnel. |
| Blinding of outcome assessment (detection bias) All outcomes | Unclear risk | The authors do not report blinding of outcome assessors. |
| Incomplete outcome data (attrition bias) All outcomes | High risk | Significant loss to follow‐up. No mention of any adjustments or intention‐to‐treat principle. |
| Selective reporting (reporting bias) | Unclear risk | Study protocol unavailable. All outcomes mentioned in the study analysed/reported. |
| Funding for the screening test | Unclear risk | No information provided. |
| Baseline comparability | Low risk | All study arms were comparable at baseline. |
| Measure against contamination | Low risk | Cluster randomised study. |
Glanz 2007.
| Methods | RCT | |
| Participants | First degree relatives of colorectal cancer from Hawaii, USA. Number of participants included in the analysis = 176. | |
| Interventions | Intervention included personal risk and culturally tailored intervention. | |
| Outcomes | Primary outcome was adherence to screening at one year. | |
| Notes | ||
| Risk of bias | ||
| Bias | Authors' judgement | Support for judgement |
| Random sequence generation (selection bias) | Unclear risk | No information provided. |
| Allocation concealment (selection bias) | Unclear risk | No information provided. |
| Blinding of participants and personnel (performance bias) All outcomes | Unclear risk | The authors do not report blinding of participants and/or personnel. |
| Blinding of outcome assessment (detection bias) All outcomes | Unclear risk | The authors do not report blinding of outcome assessors. |
| Incomplete outcome data (attrition bias) All outcomes | Low risk | Adjustment done in analysis. Reasons for attrition given. |
| Selective reporting (reporting bias) | Unclear risk | Study protocol unavailable. All outcomes mentioned in the study were reported. |
| Funding for the screening test | Low risk | 98.3% had health insurance. Insurance status was comparable at baseline. |
| Baseline comparability | Low risk | All study arms were comparable at baseline. |
| Measure against contamination | High risk | The participants were relatives of those who were diagnosed with colorectal cancer. They were recruited through the index cancer patients. There may be a high chance of contamination and authors do not mention any measures taken to prevent this. |
Glazebrook 2006.
| Methods | RCT | |
| Participants | Participants were recruited from Family Practices within Nottinghamshire, England. Number of participants included in the analysis = 589. | |
| Interventions | Multimedia programme called "Skinsafe" with eight sections designed to be completed in 10 to 15 minutes was used. It included animation, photographs and simple text to inform users about the dangers from excessive sun exposure; how to protect skin from the sun; characteristics of skin at risk; early signs of melanoma; how to reduce risk from melanoma; how to check skin for suspicious lesions. The last section was designed to provide individualised feedback on the persons relative risk for skin cancer (melanoma). Health Belief Model was used to base the intervention. | |
| Outcomes | Knowledge, skin protective behaviour, perceived risk and screening uptake measured at six months. | |
| Notes | ||
| Risk of bias | ||
| Bias | Authors' judgement | Support for judgement |
| Random sequence generation (selection bias) | Low risk | Coin toss. |
| Allocation concealment (selection bias) | Unclear risk | No information provided. |
| Blinding of participants and personnel (performance bias) All outcomes | Unclear risk | The authors do not report blinding of participants and/or personnel. |
| Blinding of outcome assessment (detection bias) All outcomes | Unclear risk | The authors do not report blinding of outcome assessors. |
| Incomplete outcome data (attrition bias) All outcomes | Unclear risk | Significant loss to follow‐up. Missing values were replaced by baseline values ‐ perhaps retains intention‐to‐treat principle |
| Selective reporting (reporting bias) | High risk | Study protocol unavailable. Perceived risk not fully reported |
| Funding for the screening test | Low risk | National Health Service funded. |
| Baseline comparability | Low risk | Study arms were comparable at baseline. |
| Measure against contamination | Low risk | Cluster randomised. |
Helmes 2006.
| Methods | RCT | |
| Participants | Participants were recruited from the Washington State Physicians' Networks' computerized database. They were aged 18 to 64; had no personal history of breast or ovarian cancer, or of genetic counselling or testing for cancer risk; and were able to speak and write English. All participants who did not refuse were called to complete a brief eligibility survey by phone and then were mailed a baseline survey. If participants returned the survey and gave written consent, they were then randomised to one of the counselling conditions or the control group. Number of participants included in the analysis = 335. | |
| Interventions | This study measured the effects of an intervention (individualised Gail risk score) in person and by telephone, compared to a control group. | |
| Outcomes | Cancer worry, breast health intentions, perceived risk and intention to take up genetic testing measured at three months. | |
| Notes | ||
| Risk of bias | ||
| Bias | Authors' judgement | Support for judgement |
| Random sequence generation (selection bias) | Unclear risk | No information provided. |
| Allocation concealment (selection bias) | Unclear risk | No information provided. |
| Blinding of participants and personnel (performance bias) All outcomes | Unclear risk | The authors do not report blinding of participants and/or personnel. |
| Blinding of outcome assessment (detection bias) All outcomes | Unclear risk | The authors do not report blinding of outcome assessors. |
| Incomplete outcome data (attrition bias) All outcomes | Low risk | Intention‐to‐treat principle used. Reasons for drop outs given. |
| Selective reporting (reporting bias) | Unclear risk | Study protocols unavailable. All outcomes mentioned in the study were addressed. |
| Funding for the screening test | Low risk | All participants had health insurance |
| Baseline comparability | Low risk | Participants were comparable at baseline. |
| Measure against contamination | Unclear risk | No information provided |
Hutchison 1998.
| Methods | RCT | |
| Participants | Patients aged 20 to 69 years, from two Canadian primary care group practices. Number of participants included in the analysis = 3152. | |
| Interventions | Risk appraisal questionnaire (yielding risk score). Those with scores above 2 advised to go for screening. | |
| Outcomes | Rate of cholesterol testing during the three months of follow up. | |
| Notes | ||
| Risk of bias | ||
| Bias | Authors' judgement | Support for judgement |
| Random sequence generation (selection bias) | Unclear risk | No information provided. |
| Allocation concealment (selection bias) | Unclear risk | No information provided. |
| Blinding of participants and personnel (performance bias) All outcomes | Unclear risk | The authors do not report blinding of participants and/or personnel. |
| Blinding of outcome assessment (detection bias) All outcomes | Unclear risk | The authors do not report blinding of outcome assessors. |
| Incomplete outcome data (attrition bias) All outcomes | High risk | Significant loss to follow‐up. Incomplete data excluded from analysis. |
| Selective reporting (reporting bias) | Unclear risk | Study protocol not available. All outcomes mentioned in the study reported. |
| Funding for the screening test | Unclear risk | No information provided. |
| Baseline comparability | High risk | Greater proportion of high‐risk patients in control group. |
| Measure against contamination | Low risk | Randomised by household unit. |
Jibaja‐Weiss 2003.
| Methods | RCT. | |
| Participants | Women registered at 2 urban community health centres; Houston, USA. Number of participants included in the analysis = 1483. | |
| Interventions | Personalised letter, tailored for risk factor data and giving screening recommendations. | |
| Outcomes | Scheduling and uptake of cervical (Pap) smear test and mammogram measured at one year after intervention. | |
| Notes | ||
| Risk of bias | ||
| Bias | Authors' judgement | Support for judgement |
| Random sequence generation (selection bias) | Low risk | Computer generated random number assignment. |
| Allocation concealment (selection bias) | Unclear risk | No information provided. |
| Blinding of participants and personnel (performance bias) All outcomes | Low risk | Participants and service providers blinded. |
| Blinding of outcome assessment (detection bias) All outcomes | Unclear risk | Unclear if outcome assessors were blinded. |
| Incomplete outcome data (attrition bias) All outcomes | Unclear risk | Intervention in the form of postal letters could not be delivered (reason not known) to a significant number of recruits in the intervention arms. These were not accounted for in the analysis. |
| Selective reporting (reporting bias) | High risk | Study protocol unavailable. Data on breast cancer collected from 18 to 64 year olds but only reported for > 40 year olds. |
| Funding for the screening test | Unclear risk | No information provided. |
| Baseline comparability | Low risk | No significant differences between groups at baseline. |
| Measure against contamination | Unclear risk | No measures reported. |
Kreuter 1996.
| Methods | RCT | |
| Participants | Patients aged 18 to 75 from 8 family medical practices, North Carolina, USA. Number of participants included in the analysis = 1131. | |
| Interventions | Mailed HRA (Health Risk Appraisal) ‐ risk information tailored to information given at baseline questionnaire. | |
| Outcomes | Rate of Pap smear, mammography and cholesterol uptake after six months in those contemplating these behaviours at baseline. | |
| Notes | ||
| Risk of bias | ||
| Bias | Authors' judgement | Support for judgement |
| Random sequence generation (selection bias) | Unclear risk | No information provided. |
| Allocation concealment (selection bias) | Unclear risk | No information provided. |
| Blinding of participants and personnel (performance bias) All outcomes | Unclear risk | The authors do not report blinding of participants and/or personnel. |
| Blinding of outcome assessment (detection bias) All outcomes | Unclear risk | The authors do not report blinding of outcome assessors. |
| Incomplete outcome data (attrition bias) All outcomes | Unclear risk | 14% loss to follow‐up. No differences in attrition rates in the two intervention arms, but we are unclear about how this compares to the attrition rate in the control arm. |
| Selective reporting (reporting bias) | Unclear risk | Study protocol unavailable. All outcomes mentioned in the study reported. |
| Funding for the screening test | Unclear risk | No information provided. |
| Baseline comparability | Low risk | No significant differences in baseline characteristics. |
| Measure against contamination | Unclear risk | No measures reported |
Lee 1991.
| Methods | RCT, stratified for previous screening history and risk status. | |
| Participants | Federal employees aged > = 40 years. USA. Number of participants included in the analysis = 278. | |
| Interventions | Colorectal cancer risk appraisal ‐ categorised as high, medium or low personal risk. | |
| Outcomes | Knowledge, intention to take test, and uptake measured at three months after intervention. | |
| Notes | ||
| Risk of bias | ||
| Bias | Authors' judgement | Support for judgement |
| Random sequence generation (selection bias) | Low risk | Random number table. |
| Allocation concealment (selection bias) | Unclear risk | No information provided. |
| Blinding of participants and personnel (performance bias) All outcomes | Unclear risk | The authors do not report blinding of participants and/or personnel. |
| Blinding of outcome assessment (detection bias) All outcomes | Unclear risk | The authors do not report blinding of outcome assessors. |
| Incomplete outcome data (attrition bias) All outcomes | Low risk | Similar loss to follow‐up in either of the study arms and low attrition rates. |
| Selective reporting (reporting bias) | High risk | Study protocol was not available. Outcomes mentioned not fully reported. |
| Funding for the screening test | Unclear risk | No information provided. |
| Baseline comparability | Unclear risk | Differences between family history and fat consumption between groups but authors controlled for this in analysis. |
| Measure against contamination | Unclear risk | None reported. |
Lerman 1995.
| Methods | RCT | |
| Participants | Women aged 35 years and older with a family history of breast cancer in a first degree relative. USA. Number of participants included in the analysis = 239. | |
| Interventions | Breast cancer risk counselling including discussion of factors contributing to elevated risk and presentation of individualized risk data. | |
| Outcomes | Changes/improvement in risk comprehension. | |
| Notes | Additional paper (Lerman 1996) addresses effects on general and breast cancer‐specific distress measured at three months after intervention. | |
| Risk of bias | ||
| Bias | Authors' judgement | Support for judgement |
| Random sequence generation (selection bias) | Unclear risk | No information provided. |
| Allocation concealment (selection bias) | Unclear risk | No information provided. |
| Blinding of participants and personnel (performance bias) All outcomes | Unclear risk | The authors report blinding of randomisation personnel only. |
| Blinding of outcome assessment (detection bias) All outcomes | Low risk | The authors report blinding of outcome assessors. |
| Incomplete outcome data (attrition bias) All outcomes | Unclear risk | 12% loss to follow‐up. However it is not clear as to the number of drop outs in each of the study arms. No mention of adjustment/intention‐to‐treat analysis. |
| Selective reporting (reporting bias) | Unclear risk | Study protocol unavailable. All outcomes mentioned in the study are reported. |
| Funding for the screening test | Unclear risk | No information provided. |
| Baseline comparability | Unclear risk | Unclear. There were significant baseline differences. However these were attempted to be controlled at the analysis stage. |
| Measure against contamination | High risk | The participants were relatives of those who were diagnosed with breast cancer. They were recruited through the index cancer patients. There may be a high chance of contamination and authors do not mention any measures taken to prevent this. |
Lerman 1997.
| Methods | RCT | |
| Participants | Women aged 18 to 75 who had at least one first degree relative with breast and/or ovarian cancer. USA. Number of participants included in the analysis = 320. | |
| Interventions | Educational session including a review of individual risk factors for breast and ovarian cancers. | |
| Outcomes | Changes in risk perception; testing intentions (breast cancer gene testing) measured at one month after intervention. | |
| Notes | No data on taking test in control group. | |
| Risk of bias | ||
| Bias | Authors' judgement | Support for judgement |
| Random sequence generation (selection bias) | Unclear risk | No information provided. |
| Allocation concealment (selection bias) | Unclear risk | No information provided. |
| Blinding of participants and personnel (performance bias) All outcomes | Unclear risk | The authors do not report blinding of participants and/or personnel. |
| Blinding of outcome assessment (detection bias) All outcomes | Unclear risk | The authors do not report blinding of outcome assessors. |
| Incomplete outcome data (attrition bias) All outcomes | Unclear risk | 9% loss to follow‐up. However it is not clear as to the number of drop outs in each of the study arms. No mention of adjustment/intention‐to‐treat analysis. |
| Selective reporting (reporting bias) | Unclear risk | Study protocol unavailable. All outcomes mentioned in the study reported. |
| Funding for the screening test | Unclear risk | Unclear, may have different sources as recruitment was by identifying relatives of index patients with cancer and self referrals. |
| Baseline comparability | Low risk | Study arms comparable at baseline. |
| Measure against contamination | High risk | The participants were relatives of those who were diagnosed with breast cancer. They were recruited through the index cancer patients. There may be a high chance of contamination and authors do not mention any measures taken to prevent this. |
Lipkus 2005.
| Methods | RCT (2 x 2 factorial with basic versus more comprehensive information as well as personalised (tailored) versus non‐personalised). | |
| Participants | 99% male, New Jersey Carpenters' Fund members; aged over 50 years. Number of participants included in the analysis = 860. | |
| Interventions | Tailored risk information with information about risk factors for colorectal cancer derived from baseline questionnaire. | |
| Outcomes | Faecal Occult Blood Test (FOBT) uptake at one, two and three years after intervention. | |
| Notes | Also assessed 'attributions of colorectal cancer risk' but not as risk perceptions directly affected by interventions. | |
| Risk of bias | ||
| Bias | Authors' judgement | Support for judgement |
| Random sequence generation (selection bias) | Unclear risk | No information provided. |
| Allocation concealment (selection bias) | Unclear risk | No information provided. |
| Blinding of participants and personnel (performance bias) All outcomes | Unclear risk | The authors do not report blinding of participants and/or personnel. |
| Blinding of outcome assessment (detection bias) All outcomes | Unclear risk | The authors do not report blinding of outcome assessors. |
| Incomplete outcome data (attrition bias) All outcomes | Low risk | Intention‐to‐treat principle used. |
| Selective reporting (reporting bias) | Unclear risk | Study protocol unavailable. All outcomes mentioned in the study were addressed adequately. |
| Funding for the screening test | Low risk | FOBT kits were provided by the research group. |
| Baseline comparability | Low risk | Participants were comparable at baseline. |
| Measure against contamination | Unclear risk | No information provided. |
Lipkus 2007b.
| Methods | RCT | |
| Participants | Participants were recruited by newspaper adverts in Orange, Durham and Wake counties of North Carolina, USA. Subjects were included if they did not have a history of colorectal cancer, were 50 to 75 years of age, had never had a colonoscopic/sigmoidoscopic examination and not had an FOBT in the last 2 years. Number of participants included in the analysis = 160. | |
| Interventions | Participants were first stratified to high and low colorectal cancer risk groups and were then randomised to the three study groups ‐ Control, Absolute risk only and Absolute + Comparative risk groups. All groups received general information on basic facts about colorectal cancer. The Absolute risk group were provided with a list of risk factors that were relevant to them. The Comparative + Absolute risk groups also received information on if their number of risk factors was high or low compared to the average number of risk factors for the population their geographical area, age and sex groups. Health Belief Model used to base the constructs. | |
| Outcomes |
|
|
| Notes | The primary outcomes have not been included in the meta‐analysis due to inadequate statistical details. | |
| Risk of bias | ||
| Bias | Authors' judgement | Support for judgement |
| Random sequence generation (selection bias) | Unclear risk | No information provided. |
| Allocation concealment (selection bias) | Unclear risk | No information provided. |
| Blinding of participants and personnel (performance bias) All outcomes | Unclear risk | The authors do not report blinding of participants and/or personnel. |
| Blinding of outcome assessment (detection bias) All outcomes | Unclear risk | The authors do not report blinding of outcome assessors. |
| Incomplete outcome data (attrition bias) All outcomes | Low risk | No drop out. Two errors dealt with appropriately. |
| Selective reporting (reporting bias) | Unclear risk | Study protocol unavailable. All outcomes mentioned in the study were reported. |
| Funding for the screening test | Low risk | FOBT was free of charge. Participants were paid $40 for taking part in the test. |
| Baseline comparability | Low risk | Study arms were comparable at baseline. |
| Measure against contamination | Unclear risk | No information provided. |
Manne 2009.
| Methods | Cluster RCT. | |
| Participants | Participants were siblings of (index) patients recruited from the oncology, gastroenterology, and surgical practices at 26 participating medical centres’ located across the USA (sites contributed 1 to 93 participants). Prospective patients were identified from tumour registries or medical records. Age of participants was < 35 years or < than 10 years younger that the age of diagnosis in the index patient. Number of participants included in the analysis = 412. | |
| Interventions | Interventions for control group was generic educational print material used by Centre for Disease Control for prevention of colorectal cancer. There were two intervention groups. One group was provided with tailored print material including list of personal risk factors and the other group had the tailored print material along with telephone counselling. | |
| Outcomes | Adherence to colorectal screening programme and the effect of mediators (decisional balance) on adherence measured at six months after intervention. | |
| Notes | We have compared generic print group with tailored print group. | |
| Risk of bias | ||
| Bias | Authors' judgement | Support for judgement |
| Random sequence generation (selection bias) | Unclear risk | No information provided. |
| Allocation concealment (selection bias) | Unclear risk | No information provided. |
| Blinding of participants and personnel (performance bias) All outcomes | Unclear risk | The authors do not report blinding of participants and/or personnel. |
| Blinding of outcome assessment (detection bias) All outcomes | Unclear risk | The authors do not report blinding of outcome assessors. |
| Incomplete outcome data (attrition bias) All outcomes | Low risk | Reasons for drop‐outs mentioned. Intention‐to‐treat analysis used. |
| Selective reporting (reporting bias) | High risk | Study protocol unavailable. Several outcomes mentioned in the study are not reported. |
| Funding for the screening test | Low risk | Most participants were covered by health insurance. |
| Baseline comparability | Low risk | Participants were comparable at baseline. |
| Measure against contamination | Low risk | Randomisation done by family. |
Manne 2010.
| Methods | RCT. | |
| Participants | First degree relatives of patients with skin cancer, with additional risk factors; aged over 20. Number of participants included in the analysis = 443. | |
| Interventions | Tailored interventions with print material and telephone counselling, including personalised list of risk factors. | |
| Outcomes | Uptake of screening, self skin examination and adopting sun protection habits measured at six months post intervention. | |
| Notes | ||
| Risk of bias | ||
| Bias | Authors' judgement | Support for judgement |
| Random sequence generation (selection bias) | Unclear risk | No information provided. |
| Allocation concealment (selection bias) | Unclear risk | No information provided. |
| Blinding of participants and personnel (performance bias) All outcomes | Unclear risk | The authors do not report blinding of participants and/or personnel. |
| Blinding of outcome assessment (detection bias) All outcomes | Unclear risk | The authors do not report blinding of outcome assessors. |
| Incomplete outcome data (attrition bias) All outcomes | Low risk | Intention‐to‐treat used. Reasons for attrition given. |
| Selective reporting (reporting bias) | Unclear risk | Study protocol unavailable. All outcomes mentioned in the study are reported. |
| Funding for the screening test | Low risk | Most people had health insurance. Health insurance status comparable in both study arms. |
| Baseline comparability | Low risk | Comparable at baseline. |
| Measure against contamination | Low risk | Randomisation done by family. |
Marcus 2005.
| Methods | RCT | |
| Participants | Callers to one of nine participating regional Cancer Information Service offices in the USA. Number of participants included in the analysis = 2224. | |
| Interventions | Tailored print materials were tested for efficacy in promoting colorectal cancer. Transtheoretical and Health Belief Model used to draw behavioural constructs. | |
| Outcomes | Screening adherence at 14 months after intervention. | |
| Notes | ||
| Risk of bias | ||
| Bias | Authors' judgement | Support for judgement |
| Random sequence generation (selection bias) | Unclear risk | No information provided. |
| Allocation concealment (selection bias) | Unclear risk | No information provided. |
| Blinding of participants and personnel (performance bias) All outcomes | Unclear risk | The authors do not report blinding of participants and/or personnel. |
| Blinding of outcome assessment (detection bias) All outcomes | Unclear risk | The authors do not report blinding of outcome assessors. |
| Incomplete outcome data (attrition bias) All outcomes | Low risk | Attrition described and intention‐to‐treat analysis used. |
| Selective reporting (reporting bias) | Unclear risk | Study protocol unavailable. All outcomes mentioned in the study are reported. |
| Funding for the screening test | Unclear risk | Unclear risk. No mention of insurance status/funding for the screening test. |
| Baseline comparability | Low risk | Comparable at baseline. |
| Measure against contamination | Unclear risk | No measures mentioned. |
Myers 1999.
| Methods | RCT | |
| Participants | African American men, aged 40 to 70 years. Patients at the University of Chicago, USA. Number of participants included in the analysis = 413. | |
| Interventions | A personalised 'ProRecord' which included a tailored risk factors and symptoms form. | |
| Outcomes | 'Adherence', i.e. men who made an office visit for prostate cancer education and early detection within a year. | |
| Notes | ||
| Risk of bias | ||
| Bias | Authors' judgement | Support for judgement |
| Random sequence generation (selection bias) | Unclear risk | No information provided. |
| Allocation concealment (selection bias) | Unclear risk | No information provided. |
| Blinding of participants and personnel (performance bias) All outcomes | Low risk | The follow‐up surveys were carried out by an external agency. It is unlikely that participants were aware of the intervention group allocation. |
| Blinding of outcome assessment (detection bias) All outcomes | Unclear risk | The authors do not report blinding of outcome assessors. |
| Incomplete outcome data (attrition bias) All outcomes | Low risk | No loss to follow‐up after assignment to intervention and control arms. |
| Selective reporting (reporting bias) | Unclear risk | Study protocol unavailable. All outcomes mentioned in the study are reported. |
| Funding for the screening test | Unclear risk | Unclear risk. No mention of insurance status/funding for the screening test. |
| Baseline comparability | Unclear risk | No information provided. |
| Measure against contamination | Unclear risk | No information provided. |
Nagle 2008.
| Methods | RCT | |
| Participants | Pregnant women aged > 18 years and less than 12 weeks gestation. Number of participants included in the analysis = 339. | |
| Interventions | Decision aid for prenatal testing of foetal abnormalities to improve women’s informed decision making. Decision aid included individual age‐related risk report. | |
| Outcomes |
Outcomes were measured within 14 weeks of intervention. |
|
| Notes | ||
| Risk of bias | ||
| Bias | Authors' judgement | Support for judgement |
| Random sequence generation (selection bias) | Low risk | Computer generated random numbers by an independent statistician. |
| Allocation concealment (selection bias) | Low risk | Allocation was concealed. |
| Blinding of participants and personnel (performance bias) All outcomes | High risk | Study reports that it was not possible to blind personnel and the participants. |
| Blinding of outcome assessment (detection bias) All outcomes | Unclear risk | The authors do not report blinding of outcome assessors. |
| Incomplete outcome data (attrition bias) All outcomes | Low risk | Intention‐to‐treat analysis used. |
| Selective reporting (reporting bias) | Low risk | Study protocol available. All outcomes adequately reported. |
| Funding for the screening test | Unclear risk | Some screening tests were public funded depending on maternal age and others had private insurance. |
| Baseline comparability | Low risk | Study arms were comparable at baseline. |
| Measure against contamination | Low risk | Cluster randomised. |
Rawl 2008.
| Methods | RCT | |
| Participants | First degree relatives aged 40 and above of colorectal cancer survivors. Participants were able to read English; no personal colorectal cancer history; had not been screened for colorectal cancer according to American Cancer Society guidelines for screening. Number of participants included in the analysis = 140. | |
| Interventions | Personalised versus general print intervention detailing colorectal cancer risk and recommendations for screening. | |
| Outcomes | Uptake of screening (FOBT or sigmoidoscopy or colonoscopy) and change in stage of adoption for screening three months after intervention. | |
| Notes | ||
| Risk of bias | ||
| Bias | Authors' judgement | Support for judgement |
| Random sequence generation (selection bias) | Unclear risk | Authors state 'Computer randomisation', no further details provided. |
| Allocation concealment (selection bias) | Unclear risk | No information provided. |
| Blinding of participants and personnel (performance bias) All outcomes | Unclear risk | The authors do not report blinding of participants and/or personnel. |
| Blinding of outcome assessment (detection bias) All outcomes | Unclear risk | The authors do not report blinding of outcome assessors. |
| Incomplete outcome data (attrition bias) All outcomes | Unclear risk | 208 subjects were randomised. 177 completed baseline interview. However further 37 subjects were disqualified as 'ineligible' at this stage leaving a total of 140. Loss is higher in the intervention arm. |
| Selective reporting (reporting bias) | Unclear risk | Study protocol was unavailable. All outcome mentioned in the study were reported. |
| Funding for the screening test | Low risk | Participants given $20 gift voucher upon completion of data collection. Participants were insured. |
| Baseline comparability | Low risk | Groups were comparable at baseline. |
| Measure against contamination | High risk | The participants were relatives of those who were diagnosed with colorectal cancer. They were recruited through the index cancer patients. There may be a high chance of contamination and authors do not mention any measures taken to prevent this. |
Rimer 2002.
| Methods | RCT | |
| Participants | Women aged in their 40s and 50s, and members of Blue Cross and Blue Shield, North Carolina, USA. Number of participants included in the analysis = 1091. | |
| Interventions | Tailored print materials detailing a woman's personal risk (numerical and graphical) of breast cancer based on Gail score. | |
| Outcomes | Knowledge, accuracy of risk perceptions; mammography uptake measured at one year after intervention. | |
| Notes | Tailored print + telephone counselling arm excluded as different and extra content. | |
| Risk of bias | ||
| Bias | Authors' judgement | Support for judgement |
| Random sequence generation (selection bias) | Unclear risk | No information provided. |
| Allocation concealment (selection bias) | Unclear risk | No information provided. |
| Blinding of participants and personnel (performance bias) All outcomes | Unclear risk | The authors do not report blinding of participants and/or personnel. |
| Blinding of outcome assessment (detection bias) All outcomes | Unclear risk | The authors do not report blinding of outcome assessors. |
| Incomplete outcome data (attrition bias) All outcomes | High risk | Significant loss to follow‐up. Missing data were excluded from the analysis. |
| Selective reporting (reporting bias) | Unclear risk | Study protocol unavailable. All outcomes mentioned in the study are reported. |
| Funding for the screening test | Unclear risk | No information provided. |
| Baseline comparability | Low risk | Study arms were comparable at baseline. |
| Measure against contamination | Unclear risk | None reported. |
Saywell 1999.
| Methods | RCT | |
| Participants | Women 50 to 85 years; non‐compliant with mammography guidelines; no history of breast cancer, USA. Number of participants included in the analysis = 808. | |
| Interventions | Telephone and in‐person counselling including discussion of personal risk factors. | |
| Outcomes | Mammography compliance 4 to 6 weeks after counselling. | |
| Notes | ||
| Risk of bias | ||
| Bias | Authors' judgement | Support for judgement |
| Random sequence generation (selection bias) | Unclear risk | No information provided. |
| Allocation concealment (selection bias) | Unclear risk | No information provided. |
| Blinding of participants and personnel (performance bias) All outcomes | Unclear risk | The authors do not report blinding of participants and/or personnel. |
| Blinding of outcome assessment (detection bias) All outcomes | Unclear risk | The authors do not report blinding of outcome assessors. |
| Incomplete outcome data (attrition bias) All outcomes | High risk | 14% loss to follow‐up. Considerably higher loss in the control arm compared to the intervention groups of interest in this review (33/143 in control and 14/251 in intervention arm). No adjustments made for the loss to follow‐up. |
| Selective reporting (reporting bias) | Unclear risk | Study protocol unavailable. All outcomes mentioned in the study were reported. |
| Funding for the screening test | Low risk | Participants belonged to an HMO in the USA. |
| Baseline comparability | Low risk | Groups comparable at baseline. |
| Measure against contamination | Unclear risk | None reported. |
Schwartz 1999.
| Methods | RCT | |
| Participants | Women with family history of breast cancer (first degree relative of sufferer) aged 40 years and older. USA. Number of participants included in the analysis = 508. | |
| Interventions | Risk counselling including individualised risk figures. | |
| Outcomes | Self‐reported mammography use one year after (compared to baseline). | |
| Notes | This is a follow‐up to the Lerman 1995 trial. | |
| Risk of bias | ||
| Bias | Authors' judgement | Support for judgement |
| Random sequence generation (selection bias) | Unclear risk | No information provided. |
| Allocation concealment (selection bias) | Unclear risk | No information provided. |
| Blinding of participants and personnel (performance bias) All outcomes | Unclear risk | Participants were blinded up to the point of intervention delivery. It may be difficult to blind the personnel but no information is provided. |
| Blinding of outcome assessment (detection bias) All outcomes | Low risk | The authors report blinding of outcome assessors at follow‐up interview. |
| Incomplete outcome data (attrition bias) All outcomes | Low risk | Significant loss to follow‐up. Intention‐to‐treat analysis done with no significant differences in results. |
| Selective reporting (reporting bias) | Unclear risk | Study protocol unavailable. All outcomes mentioned in the study are reported. |
| Funding for the screening test | Unclear risk | No information provided. |
| Baseline comparability | Unclear risk | Baseline characteristics differed amongst control and intervention groups but authors state they controlled for differences in analysis. |
| Measure against contamination | High risk | The participants were relatives of those who were diagnosed with breast cancer. They were recruited through the index cancer patients. There may be a chance of contamination within the family and authors do not mention any measures taken to prevent this. |
Sequist 2011.
| Methods | RCT | |
| Participants | Patients (age range 50 to 75 years) of 174 primary care physicians at 14 health centres who had a visit with a Harvard Vanguard Medical Associates primary care physician during the prior 18 months, and an active personal health record account, USA. Number of participants included in the analysis = 1103. | |
| Interventions | Electronic patient messages and personalized risk assessments delivered via an electronic personal health record. | |
| Outcomes | Screening uptake at one and four months. | |
| Notes | ||
| Risk of bias | ||
| Bias | Authors' judgement | Support for judgement |
| Random sequence generation (selection bias) | Unclear risk | No information provided. |
| Allocation concealment (selection bias) | Unclear risk | No information provided |
| Blinding of participants and personnel (performance bias) All outcomes | Unclear risk | The authors do not report blinding of participants and/or personnel. |
| Blinding of outcome assessment (detection bias) All outcomes | Unclear risk | The authors do not report blinding of outcome assessors. |
| Incomplete outcome data (attrition bias) All outcomes | Low risk | No loss to follow‐up. |
| Selective reporting (reporting bias) | Low risk | Study protocol was available. All outcomes reported adequately. |
| Funding for the screening test | Low risk | Most participants had some form of insurance and insurance status was comparable at baseline. |
| Baseline comparability | Low risk | Study participants comparable at baseline. |
| Measure against contamination | Unclear risk | None reported. |
Skinner 1994.
| Methods | RCT, stratified between clinics. | |
| Participants | Female family practice attenders aged 40 to 65 years. USA. Number of participants included in the analysis = 435. | |
| Interventions | Tailored text about beliefs, mammography stages, risk factors and barriers. | |
| Outcomes | Mammography stage and uptake measured at eight months after intervention. | |
| Notes | ||
| Risk of bias | ||
| Bias | Authors' judgement | Support for judgement |
| Random sequence generation (selection bias) | Unclear risk | No information provided. |
| Allocation concealment (selection bias) | Unclear risk | No information provided. |
| Blinding of participants and personnel (performance bias) All outcomes | Unclear risk | The authors do not report blinding of participants and/or personnel. |
| Blinding of outcome assessment (detection bias) All outcomes | Unclear risk | The authors do not report blinding of outcome assessors. |
| Incomplete outcome data (attrition bias) All outcomes | Unclear risk | 11% drop out rate, no information on spread of loss of follow‐up across the study arms. |
| Selective reporting (reporting bias) | High risk | Some of the outcomes mentioned in the study were not reported. |
| Funding for the screening test | Unclear risk | No information provided. |
| Baseline comparability | Low risk | Baseline characteristics comparable. |
| Measure against contamination | Unclear risk | None reported. |
Skinner 2002.
| Methods | RCT | |
| Participants | Women with personal and family history of breast and/or ovarian cancer; North Carolina, USA. Number of participants included in the analysis = 262. | |
| Interventions | Tailored print materials about cancer, risk factors, genes and genetic testing and risk quartile in verbal or verbal and numerical format according to woman's preference. | |
| Outcomes | Knowledge, anxiety, accuracy of perceived risk and intention to take genetic test. | |
| Notes | ||
| Risk of bias | ||
| Bias | Authors' judgement | Support for judgement |
| Random sequence generation (selection bias) | Unclear risk | No information provided. |
| Allocation concealment (selection bias) | Unclear risk | No information provided. |
| Blinding of participants and personnel (performance bias) All outcomes | Unclear risk | The authors do not report blinding of participants and/or personnel. |
| Blinding of outcome assessment (detection bias) All outcomes | Unclear risk | The authors do not report blinding of outcome assessors. |
| Incomplete outcome data (attrition bias) All outcomes | Low risk | 16% drop out rate and equal in both study arms. |
| Selective reporting (reporting bias) | Unclear risk | Study protocol unavailable. All outcomes mentioned in the study were reported. |
| Funding for the screening test | Unclear risk | No information provided. |
| Baseline comparability | Low risk | No differences between groups. |
| Measure against contamination | Unclear risk | None reported. |
Smith 2010.
| Methods | RCT | |
| Participants | Participants were aged 55 to 64 years; speaking mainly English; average or slightly above average colorectal cancer risk; and low educational attainment. Potential participants were randomly drawn from the New South Wales electoral register, using the Australian Bureau of Statistics 'Socio‐Economic Index for Area' codes to target areas identified as socio‐economically disadvantaged (low educational attainment, high unemployment, and unskilled occupations). Number of participants included in the analysis = 572. | |
| Interventions | Intervention was in form of decision aids for colorectal cancer screening. Participants in the intervention group received a paper based booklet and DVD (with or without a question prompt list) that had been designed for adults with low education and literacy skills. The aid contained an interactive exercise for the reader to identify his or her risk factor. | |
| Outcomes | Primary outcomes: Informed choice, knowledge, screening attitudes and behaviour, and involvement preferences in screening decision Secondary: Decision conflict, decision satisfaction, anxiety (STAI), cancer worry and uptake of test measured at two weeks after intervention. |
|
| Notes | ||
| Risk of bias | ||
| Bias | Authors' judgement | Support for judgement |
| Random sequence generation (selection bias) | Low risk | Random permuted blocks of size 6 and 9 for each sex stratum. A statistician who had no contact with participants generated this randomisation list. |
| Allocation concealment (selection bias) | Low risk | Interviewers were unaware of allocation. Due to the nature of the intervention it is not possible to blind the participants of the allocation and allocation concealment was done as best as possible. |
| Blinding of participants and personnel (performance bias) All outcomes | Low risk | Interviewers at baseline interview were blind. |
| Blinding of outcome assessment (detection bias) All outcomes | Low risk | It was not possible to blind interviewers at follow‐up interview, but questions with standardised wordings and pre‐coded responses were used within a supervised environment. |
| Incomplete outcome data (attrition bias) All outcomes | Low risk | Reasons for missing data reported and dealt with at analysis stage. Intention‐to‐treat principle used. |
| Selective reporting (reporting bias) | Low risk | Study protocol was available. All outcomes are reported. |
| Funding for the screening test | Low risk | Screening kits were provided with the intervention packs. |
| Baseline comparability | Low risk | Participants were comparable at baseline. |
| Measure against contamination | Unclear risk | No information provided. |
Steckelberg 2011.
| Methods | RCT | |
| Participants | The study recruited people insured by a large German statutory health insurance scheme, the Gmünder ErsatzKasse (GEK), who were members of the target group for colorectal cancer screening in Germany (age 50 to 75, no history of colorectal cancer). Number of participants included in the analysis = 1586. | |
| Interventions | Evidence based brochure with listing of risk factors were provided to the participants. Internet modules with information based on UKMRC framework for complex interventions were also a part of the interventions. | |
| Outcomes | Primary: Informed consent (Marteau). Secondary: Knowledge, uptake of screening and planned uptake of screening. Outcomes were measured at six weeks after intervention. |
|
| Notes | ||
| Risk of bias | ||
| Bias | Authors' judgement | Support for judgement |
| Random sequence generation (selection bias) | Low risk | Computer‐generated random sequence. |
| Allocation concealment (selection bias) | Low risk | Allocation was concealed. Identity numbers were independent of allocation and study members did not have access to data. |
| Blinding of participants and personnel (performance bias) All outcomes | Low risk | Trial staff who sent out questionnaires and reminder letters and entered data were unaware of the study arm to which participants had been assigned, as was the statistician. |
| Blinding of outcome assessment (detection bias) All outcomes | Low risk | Trial staff who sent out questionnaires and reminder letters and entered data were unaware of the study arm to which participants had been assigned, as was the statistician. |
| Incomplete outcome data (attrition bias) All outcomes | Low risk | Low risk. Intention‐to‐treat principle used at analysis. |
| Selective reporting (reporting bias) | Low risk | Study protocol available. All outcomes adequately reported. |
| Funding for the screening test | Low risk | All participants were members of statutory insurance scheme. |
| Baseline comparability | Low risk | Participants were comparable at baseline. |
| Measure against contamination | Low risk | People in same family given same intervention. |
Trevena 2008.
| Methods | RCT | |
| Participants | List of patients between the ages of 50 and 74 years from general practice databases, New South Wales, Australia. Number of participants included in the analysis = 271. | |
| Interventions | Self administered mailed decision aid with personalised risk component versus general information for colorectal cancer screening | |
| Outcomes | Primary outcomes: adequate knowledge, clear values and screening intention (decision) at 4 months post intervention. Secondary outcomes self‐reported FOBT uptake, the Ottawa acceptability scale, short‐form state anxiety scale (not fully published), full decisional conflict scale (not fully published) and self‐efficacy scale, measured at one month. |
|
| Notes | ||
| Risk of bias | ||
| Bias | Authors' judgement | Support for judgement |
| Random sequence generation (selection bias) | Low risk | Sequential ID numbers randomly assigned using computer programme. |
| Allocation concealment (selection bias) | Low risk | Allocation was concealed via password protected programme. |
| Blinding of participants and personnel (performance bias) All outcomes | Unclear risk | The authors do not report blinding of participants and/or personnel. |
| Blinding of outcome assessment (detection bias) All outcomes | Unclear risk | The authors do not report blinding of outcome assessors. |
| Incomplete outcome data (attrition bias) All outcomes | Low risk | 14% attrition and equal in both arms. |
| Selective reporting (reporting bias) | High risk | Study protocol available, but had inadequate details for outcome measures. Some of the secondary outcomes mentioned in the study were not reported fully. |
| Funding for the screening test | Unclear risk | No information provided. |
| Baseline comparability | Low risk | Participants were comparable at baseline. |
| Measure against contamination | Unclear risk | No information provided. |
FOBT: Faecal Occult Blood Test
HMO: Health Maintenance Organization
RCT: randomised controlled trial
USA: United States of America
Characteristics of excluded studies [ordered by study ID]
| Study | Reason for exclusion |
|---|---|
| Alexander 1996 | A one group pre‐test and post‐test design. No control group. |
| Arimori 2006 | This was an evaluation of decision guide with no communication or classification of risk. |
| Champion 2000b | Not personalised risk elements despite some attention to susceptibility; personalisation is for transtheoretical stage. |
| Champion 2006b | Intervention was tailored to Health Belief Model constructs rather that to risk. |
| Chan 2011 | Interventions were delivered in group settings and did not involve personalised risk communication. |
| Costanza 2007 | This was evaluation of motivational interviewing rather than risk communication. |
| Dignan 1996 | Individualised counselling based on each woman's barriers to obtaining cervical screening, but not estimating her personal level of risk or risk factors. |
| Engelstad 2005 | Intervention for follow‐up of abnormal Pap smears, not screening. |
| Gagnon 1996 | Intervention involved counselling in which an estimate of a woman's risk of developing breast cancer was given, but no control group present; and main behavioural outcome was not mammography but breast self‐examination. |
| Giles 2001 | Personalised risks given, but no control group for this pre‐post study. |
| Jerant 2007 | Intervention was tailored to Health Belief Model constructs rather that to risk. |
| Kadison 1998 | No control group. |
| Kreuter 2005 | Tailoring for beliefs and cultural adaptation but not of risk information itself. |
| Leigh 1991 | A longitudinal study, with risk calculated after cardiovascular screening. |
| Lipkus 2000 | Tailored print and counselling, but no clear evidence that personalised risk information was given. |
| Miller 2005 | Patient initiated call for information, consideration of testing; not screening. |
| Misra 2011 | Intervention tailored towards participants health beliefs with no personalisation of risk. |
| Myers 2007 | Intervention was tailored to Health Belief Model constructs rather that to risk. |
| Ockhuysen‐Vermey 2008 | This was a protocol with no data. |
| Pye 1988 | Identified from the Jepson review as being a 'risk factor assessment study'; but questionnaire assessed symptoms and not risk factors as such. |
| Rakowski 1998 | Stage (of change) matched intervention but not explicitly dealing with individually calculated risk estimates. |
| Rhodes 2001 | Personal health recommendations but not risk communication in screening. Process measures and no outcomes. |
| Rimer 1999 | A tailored intervention, but not with regards to personal risks. |
| Russell 2010 | Intervention was tailored to Health Belief Model constructs rather that to risk. |
| Schroy 2008 | This study did not address screening. |
| Vernon 2011 | Intervention was tailored to behaviour theoretical constructs rather that to risk. |
| Walker 2008 | Risk was not personalised in this study. |
| Walsh 2010 | Intervention was tailored to Health Belief Model constructs rather that to risk. |
| Weber 1997 | Structured outreach, with identification and removal of barriers to care, but not estimating her personal level of risk or risk factors. |
Characteristics of ongoing studies [ordered by study ID]
Glenn 2011.
| Trial name or title | Changes in risk perceptions in relation to self‐reported colorectal cancer screening among first‐degree relatives of colorectal cancer cases enrolled in a randomized trial. |
| Methods | RCT |
| Participants | People with colorectal cancer, identified through the California Cancer Registry, were contacted and invited to refer their first‐degree relatives to the study. |
| Interventions | Print booklet with information on colorectal cancer and screening, with a personalised risk assessment based on actual risk information assessed during baseline interview. |
| Outcomes | Changes in self‐reported perceived risk in relation to screening behaviour |
| Starting date | Not known |
| Contact information | Beth A Glenn Division of Cancer Prevention and Control Research, School of Public Health and Jonsson Comprehensive Cancer Centre, University of California, Los Angeles, CA 90095‐6900, United States. email: bglenn@ucla.edu |
| Notes | This is a secondary analysis of data. The manuscript for the primary study 'Increasing colorectal cancer screening with a sample of ethnically‐diverse first‐degree relatives of Colorectal cancer cases' has not yet been published. |
Lowery 2012.
| Trial name or title | The Family Health Promotion Project (FHPP): design and baseline data from a randomized trial to increase colonoscopy screening in high risk families. |
| Methods | RCT |
| Participants | Participants were recruited from eight Colorectal Family Register (CFR) and four Cancer Genetics Network (CGN) registry sites. |
| Interventions | Interventions are grounded in several behaviour change theoretical models and delivered via motivational interviewing counselling framework. |
| Outcomes | Adherence to risk appropriate colonoscopic screening in high‐risk individuals. |
| Starting date | Not known |
| Contact information | Jan T. Lowery University of Colorado Cancer Centre, Anschutz Medical Campus, Bldg 500, MS F‐538, PO Box 6508, Aurora, CO 80045‐0508, United States. email: jan.lowery@ucdenver.edu |
| Notes |
Differences between protocol and review
Differences between the protocol and the review are as follows:
We have included two quasi‐randomised studies as we felt this was appropriate, considering a significant number of included studies did not have clear information on the process of randomisation. They were rated as having a high risk for selection bias.
We considered measures of informed decision as our primary outcome, as we had studies that specifically measured this in this review update.
Other outcome measures focus on identifying changes in any of the key components of informed decision making
Risk of Bias assessment was based on the new guidance derived from the Cochrane Handbook for Systematic Reviews of Interventions (Higgins 2011).
Unit of analysis was defined ‐ We will include studies randomised at individual and cluster level. For studies that were cluster randomised, outcome measures adjusted for clustering will be used in the analysis.
We have used standardised mean differences (SMDs) to pool data that measured the same outcome/effect on different scales.
Tests for assessment of heterogeneity were defined. We used the I2 statistic to assess heterogeneity (Deeks 2011). We expected heterogeneity of the studies in terms of the screening tests addressed, participants, and design of the intervention. We used a fixed‐effect model to present pooled data where heterogeneity was of low or moderate significance i.e. I2 < 60%. Results from a random‐effects model (which gives a more conservative confidence interval on the estimate of effect size) were examined and presented in cases (in addition to fixed‐effect estimates) where there was heterogeneity of substantial significance i.e. I2= 60% to 79%. We have not pooled the data if there was considerable heterogeneity between the studies i.e. I2 > 79%.
Contributions of authors
AE developed the protocol for the review, with input from GE; GN and HA conducted the literature searches; GN and HA appraised all studies with input from AE, for inclusion of exclusion and for data extraction; KH, TP and RP gave statistical advice regarding data extraction and synthesis; all authors contributed to discussions and drafting of the review report. AE is the guarantor for the review.
Sources of support
Internal sources
-
Welsh Assembly Government, UK.
GN's post as an 'Associate Academic Fellow' in Cardiff University was funded by the Welsh Assembly Government
External sources
No sources of support supplied
Declarations of interest
None known.
New search for studies and content updated (conclusions changed)
References
References to studies included in this review
Bastani 1999 {published data only}
- Bastani R, Maxwell AE, Bradford C, Das IP, Yan KX. Tailored risk notification for women with a family history of breast cancer. Preventive Medicine 1999;29(5):355‐64. [DOI] [PubMed] [Google Scholar]
Bloom 2006 {published data only}
- Bloom JR, Stewart SL, Chang S, You M. Effects of a telephone counseling intervention on sisters of young women with breast cancer. Preventive Medicine 2006;43(5):379‐84. [DOI] [PubMed] [Google Scholar]
Bodurtha 2009 {published data only}
- Bodurtha J, Quillin JM, Tracy KA, Borzelleca J, McClish D, Wilson DB, et al. Mammography screening after risk‐tailored messages: the Women Improving Screening through Education and Risk assessment (WISER) randomized controlled trial. Journal of Women's Health 2009;18(1):41‐7. [DOI] [PMC free article] [PubMed] [Google Scholar]
Bowen 2002 {published data only}
- Bowen D, Burke W, Yasui Y, McTiernan A, McLeran D. Effects of risk counseling on interest in breast cancer genetic testing for lower risk women. Genetics in Medicine 2002;4(5):359‐65. [DOI] [PubMed] [Google Scholar]
Bowen 2006 {published data only}
- Bowen DJ, Powers D, Greenlee H. Effects of breast cancer risk counseling for sexual minority women. Health Care for Women International 2006;27(1):59‐74. [DOI] [PubMed] [Google Scholar]
Bowen 2010 {published data only}
- Bowen DJ, Powers D. Effects of a mail and telephone intervention on breast health behaviors. Health Education and Behavior 2010;37(4):479‐89. [DOI] [PubMed] [Google Scholar]
Campbell 1997 {published data only}
- Campbell E, Peterkin D, Abbott R, Rogers J. Encouraging underscreened women to have cervical cancer screening: the effectiveness of a computer strategy. Preventive Medicine 1997;26(6):801‐7. [DOI] [PubMed] [Google Scholar]
Champion 1994 {published data only}
- Champion V. Strategies to increase mammography utilization. Medical Care 1994;32(2):118‐29. [DOI] [PubMed] [Google Scholar]
Champion 1995 {published data only}
- Champion V, Huster G. Effect of interventions on stage of mammography adoption. Journal of Behavioral Medicine 1995;18(2):169‐87. [DOI] [PubMed] [Google Scholar]
Champion 2000a {published data only}
- Champion VL, Ray DW, Heilman DK, Springston J. A tailored intervention for mammography among low‐income African‐American women. Journal of Psychosocial Oncology 2000;18(4):1‐13. [Google Scholar]
Champion 2002 {published data only (unpublished sought but not used)}
- Champion V, Skinner C, Menon U, Seshadri R, Anzalone D, Rawl S. Comparisons of tailored mammography interventions at two months postintervention. Annals of Behavioral Medicine 2002;24(3):211‐8. [DOI] [PubMed] [Google Scholar]
Champion 2003 {published data only}
- Champion V, Maraj M, Hui S, Perkins AJ, Tierney W, Menon U, et al. Comparison of tailored interventions to increase mammography screening in nonadherent older women. Preventive Medicine 2003;36(2):150‐8. [DOI] [PubMed] [Google Scholar]
Champion 2007 {published data only}
- Champion V, Skinner CS, Hui S, Monahan P, Juliar B, Daggy J, Menon U. The effect of telephone versus print tailoring for mammography adherence. Patient Education and Counseling 2007;65(3):416‐23. [DOI] [PMC free article] [PubMed] [Google Scholar]
Curry 1993 {published data only}
- Curry SJ, Taplin SH, Anderman C, Barlow WE, McBride C. A randomized trial of the impact of risk assessment and feedback on participation in mammography screening. Preventive Medicine 1993;22(3):350‐60. [DOI] [PubMed] [Google Scholar]
Geller 2006 {published data only}
- Geller AC, Emmons KM, Brooks DR, Powers C, Zhang Z, Koh HK, et al. A randomized trial to improve early detection and prevention practices among siblings of melanoma patients. Cancer 2006;107(4):806‐14. [DOI] [PubMed] [Google Scholar]
Glanz 2007 {published data only}
- Glanz K, Steffen AD, Taglialatela LA. Effects of colon cancer risk counseling for first‐degree relatives. Cancer Epidemiology, Biomarkers & Prevention 2007;16(7):1485‐91. [DOI] [PubMed] [Google Scholar]
Glazebrook 2006 {published data only}
- Glazebrook C, Garrud P, Avery A, Coupland C, Williams H. Impact of multimedia intervention "Skinsafe" on patients' knowledge and protective behaviours. Preventive Medicine 2006;42:449‐54. [DOI] [PubMed] [Google Scholar]
Helmes 2006 {published data only}
- Helmes AW, Culver JO, Bowen DJ. Results of a randomized study of telephone versus in‐person breast cancer risk counseling. Patient Education and Counseling 2006;64(1‐3):96‐103. [DOI] [PubMed] [Google Scholar]
Hutchison 1998 {published data only}
- Hutchison B, Birch S, Evans C, Goldsmith L, Markham B, Frank J, Paterson M. Screening for hypercholesterolaemia in primary care: randomised controlled trial of postal questionnaire appraising risk of coronary heart disease. BMJ 1998;316(7139):1208‐13. [DOI] [PMC free article] [PubMed] [Google Scholar]
Jibaja‐Weiss 2003 {published data only}
- Jibaja‐Weiss M, Volk R, Kingery P, Smith Q, Holcomb J. Tailored messages for breast and cervical cancer screening of low‐income and minority women using medical records data. Patient Education and Counseling 2003;50(2):123‐32. [DOI] [PubMed] [Google Scholar]
- Jibaja‐Weiss M, Volk R, Smith Q, Holcomb J, Kingery P. Differential effects of messages for breast and cervical cancer screening. Journal of Health Care for the Poor and Underserved 2005;16(1):42‐52. [DOI] [PubMed] [Google Scholar]
Kreuter 1996 {published data only}
- Kreuter MW, Strecher VJ. Do tailored behaviour change messages enhance the effectiveness of health risk appraisal? Results from a randomized trial. Health Education Research 1996;11(1):97‐105. [DOI] [PubMed] [Google Scholar]
Lee 1991 {published data only}
- Lee CY. A randomized controlled trial to motivate work site fecal occult blood testing. Yonsei Medical Journal 1991;32(2):131‐8. [DOI] [PubMed] [Google Scholar]
Lerman 1995 {published data only}
- Lerman C, Lustbader E, Rimer B, Daly M, Miller S, Sands C, et al. Effects of individualized breast cancer risk counseling: a randomised trial. Journal of the National Cancer Institute 1995;87(4):286‐92. [DOI] [PubMed] [Google Scholar]
- Lerman C, Schwartz MD, Miller SM, Daly M, Sands C, Rimer BK. A randomized trial of breast cancer risk counseling: interacting effects of counseling, educational level, and coping style. Health Psychology 1996;15(2):75‐83. [DOI] [PubMed] [Google Scholar]
Lerman 1997 {published data only}
- Lerman C, Biesecker B, Bekendorf JL, Kerner J, Gomez‐Caminero A, Hughes C, et al. Controlled trial of pretest education approaches to enhance informed decision‐making for BRCA1 gene testing. Journal of the National Cancer Institute 1997;89(2):148‐57. [DOI] [PubMed] [Google Scholar]
Lipkus 2005 {published data only}
- Lipkus I, Skinner C, Dement J, Pompeii L, Moser B, Samsa G, et al. Increasing colorectal cancer screening among individuals in the carpentry trade: test of risk communication interventions. Preventive Medicine 2005;40(5):489‐501. [DOI] [PubMed] [Google Scholar]
- Lipkus I, Skinner C, Green L, Dement J, Samsa G, Ransohoff D. Modifying attributions of colorectal cancer risk. Cancer Epidemiology Biomarkers and Prevention 2004;13(4):560–6. [PubMed] [Google Scholar]
Lipkus 2007b {published data only}
- Lipkus IM, Klien WM. Effects of communicating social comparison information on risk perceptions for colorectal cancer. Journal of Health Communication 2007;11(4):391‐407. [DOI] [PubMed] [Google Scholar]
Manne 2009 {published data only}
- Manne S, Coups EJ, Markowitz A, Meropol NJ, Haller D, Jacobsen PB, et al. A randomized trial of generic versus tailored interventions to increase colorectal cancer screening among intermediate risk siblings. Annals of Behavioral Medicine 2009;37(2):207‐17. [DOI] [PMC free article] [PubMed] [Google Scholar]
Manne 2010 {published data only}
- Manne S, Jacobsen PB, Ming ME, Winkel G, Dessureault S, Lessin SR. Tailored versus generic interventions for skin cancer risk reduction for family members of melanoma patients. Health Psychology 2010;29(6):583‐93. [DOI] [PMC free article] [PubMed] [Google Scholar]
Marcus 2005 {published data only}
- Marcus AC, Mason M, Wolfe P, Rimer BK, Lipkus I, Strecher V, et al. The efficacy of tailored print materials in promoting colorectal cancer screening: results from a randomized trial involving callers to the National Cancer Institute's cancer information service. Journal of Health Communication 2005;10(1):83‐104. [DOI] [PubMed] [Google Scholar]
Myers 1999 {published data only}
- Myers R, Chodak G, Wolf T, Burgh D, McGrory G, Marcus S, et al. Adherence by African American men to prostate cancer education and early detection. Cancer 1999;86(1):88‐104. [DOI] [PubMed] [Google Scholar]
Nagle 2008 {published data only}
- Nagle C, Gunn J, Bell R, Lewis S, Meiser B, Metcalfe S, et al. Use of a decision aid for prenatal testing of fetal abnormalities to improve women's informed decision making: a cluster randomised controlled trial. British Journal of Obstetrics and Gynaecology 2008;115(3):339‐47. [DOI] [PubMed] [Google Scholar]
Rawl 2008 {published data only}
- Rawl SM, Champion VL, Scott LL, Zhou H, Monahan P, Ding Y, et al. A randomized trial of two print interventions to increase colon cancer screening among first degree relatives. Patient Education and Counseling 2008;71(2):215‐27. [DOI] [PMC free article] [PubMed] [Google Scholar]
Rimer 2002 {published data only}
- Rimer B, Halabi S, Skinner C, Lipkus I, Strigo T, Kaplan E, et al. Effects of a mammography decision‐making intervention at 12 and 24 months. American Journal of Preventive Medicine 2002;22(4):247‐57. [DOI] [PubMed] [Google Scholar]
- Rimer B, Halabi S, Sugg Skinner C, Kaplan E, Crawford Y, Samsa G, et al. The short‐term impact of tailored mammography decision‐making interventions. Patient Education and Counseling 2001;43(3):269‐85. [DOI] [PubMed] [Google Scholar]
Saywell 1999 {published data only}
- Saywell RM Jr, Champion VL, Skinner CS, McQuillen D, Martin D, Maraj M. Cost‐effectiveness comparison of five interventions to increase mammography screening. Preventive Medicine 1999;29(5):374‐82. [DOI] [PubMed] [Google Scholar]
Schwartz 1999 {published data only}
- Schwartz M, Rimer B, Daly M, Sands C, Lerman C. A randomized trial of breast cancer risk counseling: the impact on self‐reported mammography use. American Journal of Public Health 1999;89(6):924‐6. [DOI] [PMC free article] [PubMed] [Google Scholar]
Sequist 2011 {published data only}
- Sequist T, Zaslavsky A, Ayanian J, Colditz G. Electronic patient messages and personalized risk assessments to promote colorectal cancer screening: a randomised controlled trial. Journal of General Internal Medicine 2011;25:636‐41. [DOI] [PMC free article] [PubMed] [Google Scholar]
Skinner 1994 {published data only (unpublished sought but not used)}
- Skinner CS, Strecher VJ, Hospers H. Physicians' recommendations for mammography: do tailored messages make a difference?. American Journal of Public Health 1994;84(1):43‐9. [DOI] [PMC free article] [PubMed] [Google Scholar]
Skinner 2002 {published data only}
- Skinner C, Schildkraut J, Berry D, Calingaert B, Marcom P, Sugarman J, et al. Pre‐counseling education materials for BRCA testing: does tailoring make a difference?. Genetic Testing 2002;6(2):93‐105. [DOI] [PubMed] [Google Scholar]
Smith 2010 {published data only}
- Smith SK, Trevena L, Simpson JM, Barratt A, Nutbeam D, McCaffery KJ. A decision aid to support informed choices about bowel cancer screening among adults with low education: randomised controlled trial. BMJ (Clinical research ed.) 2010;341:c5370. [DOI] [PMC free article] [PubMed] [Google Scholar]
Steckelberg 2011 {published data only}
- Steckelberg A, Hulfenhaus C, Haastert B, Muhlhauser I. Effect of evidence based risk information on "informed choice" in colorectal cancer screening: randomised controlled trial. BMJ 2011;342:d3193. [DOI] [PMC free article] [PubMed] [Google Scholar]
Trevena 2008 {published data only}
- Trevena LJ, Irwig L, Barratt A. Randomized trial of a self‐administered decision aid for colorectal cancer screening. Journal of Medical Screening 2008;15(2):76‐82. [DOI] [PubMed] [Google Scholar]
References to studies excluded from this review
Alexander 1996 {published data only}
- Alexander NE, Ross J, Sumner W, Nease RF Jr, Littenberg B. The effect of an educational intervention on the perceived risk of breast cancer. Journal of General Internal Medicine 1996;11(2):92‐7. [DOI] [PubMed] [Google Scholar]
Arimori 2006 {published data only}
- Arimori N. Randomized controlled trial of decision aids for women considering prenatal testing: the effect of the Ottawa Personal Decision Guide on decisional conflict. Japan Journal of Nursing Science 2006;3:119‐30. [Google Scholar]
Champion 2000b {published data only}
- Champion V, Skinner C, Foster J. The effects of standard care counseling or telephone/in‐person counseling on beliefs, knowledge, and behavior related to mammography screening. Oncology Nursing Forum 2000;27(10):1565‐71. [PubMed] [Google Scholar]
Champion 2006b {published data only}
- Champion VL, Springston JK, Zollinger TW, Saywell Jr RM, Monahan PO, Zhao Q, et al. Comparison of three interventions to increase Mammography screening in low income African American women. Cancer Detection and Prevention 2006;30:535‐44. [DOI] [PubMed] [Google Scholar]
Chan 2011 {published data only}
- Chan ECY, McFall SL, Byrd TL, Mullen PD, Volk RJ, Ureda J, et al. A community‐based intervention to promote informed decision making for prostate cancer screening among Hispanic American men changed knowledge and role preferences: a cluster RCT. Patient Education and Counseling 2011;84:e44‐51. [DOI] [PubMed] [Google Scholar]
Costanza 2007 {published data only}
- Costanza ME, Luckmann R, Stoddard AM, White M, Stark JR, Avrunin JS, et al. Using tailored telephone counseling to accelerate the adoption of colorectal cancer screening. Cancer Detection and Prevention 2007;31:191‐8. [DOI] [PubMed] [Google Scholar]
Dignan 1996 {published data only}
- Dignan M, Michielutte R, Blinson K, Wells HB, Case LD, Sharp P, et al. Effectiveness of health education to increase screening for cervical cancer among eastern band Cherokee Indian women in North Carolina. Journal of the National Cancer Institute 1996;88(22):1670‐6. [DOI] [PubMed] [Google Scholar]
Engelstad 2005 {published data only}
- Engelstad L, Stewart S, Otero‐Sabogal R, Leung M, Davis P, Pasick R. The effectiveness of a community outreach intervention to improve follow‐up among underserved women at highest risk for cervical cancer. Preventive Medicine 2005;41(3):741‐8. [DOI] [PubMed] [Google Scholar]
Gagnon 1996 {published data only}
- Gagnon P, Massie MJ, Gronert M, Heerdt AS, Brown K, et al. Perception of breast cancer risk and psychological distress in women attending a surveillance program. Psycho‐oncology 1996;5:259‐69. [Google Scholar]
Giles 2001 {published data only}
- Giles JT, Kennedy DT, Dunn EC, Wallace WL, Meadows SL, Cafiero AC. Results of a community pharmacy‐based breast cancer risk‐assessment and education program. Pharmacotherapy 2001;21(2):243‐53. [DOI] [PubMed] [Google Scholar]
Jerant 2007 {published data only}
- Jerant A, Kravitz RL, Rooney M, Amerson S, Kreuter M, Franks P. Effects of a tailored interactive multimedia computer program on determinants of colorectal cancer screening: a randomized controlled pilot study in physician offices. Patient Education and Counseling 2007;66:67‐74. [DOI] [PubMed] [Google Scholar]
Kadison 1998 {published data only}
- Kadison P, Pelletier EM, Mounib EL, Oppedisano P, Harry T. Improved screening for breast cancer associated with a telephone‐based risk assessment. Preventive Medicine 1998;27(3):493‐501. [DOI] [PubMed] [Google Scholar]
Kreuter 2005 {published data only}
- Kreuter M, Sugg‐Skinner C, Holt C, Clark E, Haire‐Joshu D, Fu Q, et al. Cultural tailoring for mammography and fruit and vegetable intake among low‐income African‐American women in urban public health centers. Preventive Medicine 2005;41(1):53‐62. [DOI] [PubMed] [Google Scholar]
Leigh 1991 {published data only}
- Leigh J, Harrison J. Reduction of ischaemic heart disease risk factors following direct probabilistic risk communication in the workplace. Journal of Occupational Health & Safety 1991;7:467‐72. [Google Scholar]
Lipkus 2000 {published data only}
- Lipkus IM, Rimer BK, Halabi S, Strigo TS. Can tailored interventions increase mammography use among HMO women?. American Journal of Preventive Medicine 2000;18(1):1‐10. [DOI] [PubMed] [Google Scholar]
Miller 2005 {published data only}
- Miller S, Fleisher L, Roussi P, Buzaglo J, Schnoll R, Slater E, et al. Facilitating informed decision making about breast cancer risk and genetic counseling among women calling the NCI's Cancer Information Service. Journal of Health Communication 2005;10(Suppl 1):119‐36. [DOI] [PubMed] [Google Scholar]
Misra 2011 {published data only}
- Misra S, Lairson DR, Chan W, Chang Y, Bartholomew LK, Greisinger A, et al. Cost effectiveness of interventions to promote screening for colorectal cancer: a randomized trial. Journal of Preventative Medicine and Public Health 2011;44(3):101‐10. [DOI] [PMC free article] [PubMed] [Google Scholar]
Myers 2007 {published data only}
- Myers RE, Sifri R, Hyslop T, Rosenthal M, Vernon SW, Cocroft J, et al. A randomized control trial of the impact of targeted and tailored interventions on colorectal cancer screening. Cancer 2007;110(9):2083‐91. [DOI] [PubMed] [Google Scholar]
Ockhuysen‐Vermey 2008 {published data only}
- Ockhuysen‐Vermey CF, Henneman L, Asperen CJ, Oosterwijk JC, Menko FH, Timmermans DRM. Design of the BRISC study: a multicentre controlled clinical trial to optimize the communication of breast cancer risks in genetic counseling. BioMed Central Cancer 2008;8:283. [DOI] [PMC free article] [PubMed] [Google Scholar]
Pye 1988 {published data only}
- Pye G, Christie M, Chamberlain JO, Moss SM, Hardcastle JD. A comparison of methods for increasing compliance within a general practitioner based screening project for colorectal cancer and the effect on practitioner workload. Journal of Epidemiology and Community Health 1988;42(1):66‐71. [DOI] [PMC free article] [PubMed] [Google Scholar]
Rakowski 1998 {published data only}
- Rakowski W, Ehrich B, Goldstein MG, Rimer BK, Pearlman DN, Clark MA, et al. Increasing mammography among women aged 40‐74 by use of a stage‐matched, tailored intervention. Preventive Medicine 1998;27(5 pt 1):748‐56. [DOI] [PubMed] [Google Scholar]
Rhodes 2001 {published data only}
- Rhodes K, Lauderdale D, Stocking C, Howes D, Roizen M, Levinson W. Better health while you wait: a controlled trial of a computer‐based intervention for screening and health promotion in the emergency department. Annals of Emergency Medicine 2001;37(3):284‐91. [DOI] [PubMed] [Google Scholar]
Rimer 1999 {published data only}
- Rimer BK, Conaway M, Lyna P, Glassman B, Yarnall KSH, Lipkus I, et al. The impact of tailored interventions on a community health center population. Patient Education and Counseling 1999;37(2):125‐40. [DOI] [PubMed] [Google Scholar]
Russell 2010 {published data only}
- Russell KM, Champion VL, Monahan PO, Millon‐Underwood S, Zhao Q, Spacey N, et al. Randomized trial of a lay health adviser and computer intervention to increase mammography screening in African American women. Cancer Epidemiology Biomarkers and Prevention 2010;19:201‐10. [DOI] [PMC free article] [PubMed] [Google Scholar]
Schroy 2008 {published data only}
- Schroy PC, Glick JT, Wilson S, Robinson PA, Heeran TC. An effective educational strategy for improving knowledge, risk perception and risk communication among colorectal adenoma patients. Journal of Clinical Gastroenterology 2008;42:708‐14. [DOI] [PubMed] [Google Scholar]
Vernon 2011 {published data only}
- Vernon SW, Bartholomew LK, McQueen A, Bettencourt JL, Greisinger A, Coan SP, et al. A randomized controlled trial of a tailored interactive computer‐delivered intervention to promote colorectal cancer screening: sometimes more is just the same. Annals of Behavioral Medicine 2011;41(3):284‐99. [DOI] [PMC free article] [PubMed] [Google Scholar]
Walker 2008 {published data only}
- Walker EA, Schechter CB, Caban A, Basch CE. Telephone intervention to promote diabetic retinopathy screening among the urban poor. American Journal of Preventative Medicine 2008;34(3):185‐91. [DOI] [PMC free article] [PubMed] [Google Scholar]
Walsh 2010 {published data only}
- Walsh JME, Salazar R, Nguyen TT, Kaplan C, Nguyen L, Hwang J, et al. Healthy Colon, Healthy Life: a novel colorectal cancer screening intervention. American Journal of Preventative Medicine 2010;39(1):1‐14. [DOI] [PMC free article] [PubMed] [Google Scholar]
Weber 1997 {published data only}
- Weber B, Reilly B. Enhancing mammography use in the inner city: a randomized trial of intensive case management. Archives of Internal Medicine 1997;157:2345‐9. [PubMed] [Google Scholar]
References to ongoing studies
Glenn 2011 {published data only}
- Glenn BA, Herrmann AK, Crespi CM, Mojica CM, Chang LC, Maxwell AE, et al. Changes in risk perceptions in relation to self‐reported colorectal cancer screening among first‐degree relatives of colorectal cancer cases enrolled in a randomized trial. Health Psychology 2011;30(4):481‐91. [DOI] [PMC free article] [PubMed] [Google Scholar]
Lowery 2012 {published data only}
- Lowery JT, Marcus AL, Kinney A, Bowen D, Finklestein DM, Horick N, et al. The family health promotion project (FHPP): Design and baseline data from a randomized trial to increase colonoscopy screening in high risk families. Contemporary Clinical Trials 2012;33:426‐35. [DOI] [PMC free article] [PubMed] [Google Scholar]
Additional references
Ahmed 2012
- Ahmed H, Naik G, Willoughby H, Edwards AG. Communicating risk. BMJ 2012;344:e3996. [DOI] [PubMed] [Google Scholar]
Albada 2009
- Albada A, Ausems MGEM, Bensing JM, Dulmen S. Tailored information about cancer risk and screening: a systematic review. Patient Education and Counseling 2009;77(2):155‐71. [DOI] [PubMed] [Google Scholar]
Barratt 1999
- Barratt A, Irwig L, Glasziou P, Cumming RG, Raffle A, Hicks N, et al. Users' Guides to the Medical Literature XVII. How to Use Guidelines and Recommendations About Screening. Evidence‐Based Medicine Working Group. Journal of American Medical Association 1999;281(21):2029–34. [DOI] [PubMed] [Google Scholar]
Barratt 2005
- Barratt A, Edwards A, Trevena L, McCaffery K, Woloshin S, Bekker H, et al. Presenting probabilities. In: O’Connor A, Llewellyn‐Thomas H, Stacey D editor(s). IPDAS Collaboration Background Document. Draft VIII ed. IPDAS Collaboration, 2005:11‐16. [Google Scholar]
Barry 1997
- Barry MJ, Cherkin D, Chang Y, Fowler C, Skates S. A randomized trial of a multimedia shared decision‐making program for men facing a treatment decision for benign prostatic hyperplasia. Disease Management and Clinical Outcomes 1997;1:5‐14. [Google Scholar]
Beauchamp 2001
- Beauchamp T, Childress J. Principles of Biomedical Ethics. 5th Edition. Oxford: Oxford University Press, 2001. [Google Scholar]
Becker 1974
- Becker MH. The Health Belief Model and Personal Health Behavior. San Francisco: Society for Public Health Education, 1974. [Google Scholar]
Bekker 1999
- Bekker H, Thornton JG, Airey CM, Connelly JB, Hewison J, Robinson MB, et al. Informed decision making: an annotated bibliography and systematic review. Health Technology Assesment 1999;3(1):1‐156. [PubMed] [Google Scholar]
Bewley 2011
- Bewley S. The NHS breast screening programme needs independent review. BMJ 2011;343:d6894. [DOI] [PubMed] [Google Scholar]
Bonfill 2001
- Bonfill X, Marzo M, Pladevall M, Martí J, Emparanza JI. Strategies for increasing the participation of women in community breast cancer screening. Cochrane Database of Systematic Reviews 2001, Issue 1. [DOI: 10.1002/14651858.CD002943] [DOI] [PMC free article] [PubMed] [Google Scholar]
Bottorff 1996
- Bottorff JD, Ratner PA, Johnson JL, Lovato CY, Joab SA. Uncertainties and challenges: communicating risk in the context of familial cancer. Report to the National Cancer Institute of Canada. Vancouver: School of Nursing and Institute of Health Promotion Research, University of British Columbia, 1996. [Google Scholar]
Brawley 2012
- Brawley O, Byers T, Chen A, Pignone M, Ransohoff D, Schenk M, et al. New American Cancer Society process for creating trustworthy cancer screening guidelines. JAMA 2012;306(22):2495‐9. [DOI] [PubMed] [Google Scholar]
Briss 2004
- Briss P, Rimer B, Reilley B, Coates R, Lee N, Mullen P, et al. Promoting informed decisions about cancer screening in communities and healthcare systems. American Journal of Preventive Medicine 2004;26(1):67‐80. [DOI] [PubMed] [Google Scholar]
Cacioppo 1984
- Cacioppo JT, Petty RE. The Elaboration Likelihood model of persuasion. Advances in Consumer Research 1984;11:673‐5. [Google Scholar]
Collins 2011
- Collins RE, Lopez LM, Marteau TM. Emotional impact of screening: a systematic review and meta‐analysis. BMC Public Health 2011;11:603. [DOI: 10.1186/1471-2458-11-603] [DOI] [PMC free article] [PubMed] [Google Scholar]
Covello 1986
- Covello VT, Winterfeldt D, Slovic P. Risk communication: a review of the literature. Risk Abstracts 1986;3(4):171‐81. [Google Scholar]
Deeks 2011
- Deeks JJ, Higgins JPT, Altman DG (editors). Chapter 9: Analysing data and undertaking meta‐analyses. In: Higgins JPT, Green S editor(s). Cochrane Handbook for Systematic Reviews of Interventions. Version 5.1.0. The Cochrane Collaboration, Updated March 2011. Available from www.cochrane‐handbook.org. [Google Scholar]
Edwards 1999a
- Edwards AGK, Elwyn GJ. How should 'effectiveness' of risk communication to aid patients' decisions be judged? A review of the literature. Medical Decision Making 1999;19(4):428‐34. [DOI] [PubMed] [Google Scholar]
Edwards 2003a
- Edwards A, Elwyn G, Hood K, Robling M, Atwell C, Holmes‐Rovner M, et al. The development of COMRADE – a patient‐based outcome measure to evaluate the effectiveness of risk communication and treatment decision making in consultations. Patient Education and Counseling 2003;50(3):311‐22. [DOI] [PubMed] [Google Scholar]
Elwyn 2000
- Elwyn G, Edwards A, Kinnersley P, Grol R. Shared decision‐making and the concept of equipoise: defining the 'competences' of involving patients in health care choices. British Journal of General Practice 2000;50(460):892‐9. [PMC free article] [PubMed] [Google Scholar]
Everett 2011
- Everett T, Bryant A, Griffin MF, Martin‐Hirsch PP, Forbes CA, Jepson RG. Interventions targeted at women to encourage the uptake of cervical screening. Cochrane Database of Systematic Reviews 2011, Issue 5. [DOI: 10.1002/14651858.CD002834] [DOI] [PMC free article] [PubMed] [Google Scholar]
Fischhoff 1979
- Fischhoff B, Slovic P, Lichtenstein S. Which risks are acceptable?. Environment 1979;21:17‐38. [Google Scholar]
Fishbein 1975
- Fishbein M, Ajzen I. Belief, Attitude, Intention and Behaviour: An Introduction to Theory and Research. Reading, Massachusetts: Addison‐Wesley Publishing Company, Inc, 1975. [Google Scholar]
Flight 2004
- Flight IHK, Wilson CL, Griffiths L, Myers RE. Interventions for improving uptake of population‐based screening for colorectal cancer using fecal occult blood testing. Cochrane Database of Systematic Reviews 2004, Issue 4. [DOI: 10.1002/14651858.CD005035] [DOI] [Google Scholar]
Foster 1998
- Foster P, Anderson CM. Reaching targets in the national cervical screening programme: are current practices unethical?. Journal of Medical Ethics 1998;24(3):151‐7. [DOI] [PMC free article] [PubMed] [Google Scholar]
Gail 1989
- Gail MH, Brinton LA, Byar DP, Corle DK, Green SB, Schairer C, et al. Projecting individualized probabilities of developing breast cancer for white females who are being examined annually. Journal of the National Cancer Institute 1989;81(24):1879‐86. [DOI] [PubMed] [Google Scholar]
Ghosh 2005
- Ghosh AK, Ghosh K. Translating evidence‐based information into effective risk communication: current challenges and opportunities. Journal of Laboratory and Clinical Medicine 2005;145(4):171‐80. [DOI] [PubMed] [Google Scholar]
GMC 1998
- The General Medical Council. Seeking patients' consent: the ethical considerations. London, United Kingdom: General Medical Council, 1998. [Google Scholar]
Guadagnoli 1998
- Guadagnoli E, Ward P. Patient participation in decision‐making. Social Science & Medicine 1998;47(3):329‐39. [DOI] [PubMed] [Google Scholar]
Guyatt 2008
- Guyatt GH, Oxman AD, Vist GE, Kunz R, Falck‐Ytter Y, Alonso‐Coello P, et al. GRADE: an emerging consensus on rating quality of evidence and strength of recommendations. BMJ 2008;336:924‐6. [DOI] [PMC free article] [PubMed] [Google Scholar]
Gøtzsche 2011
- Gøtzsche PC, Nielsen M. Screening for breast cancer with mammography. Cochrane Database of Systematic Reviews 2011, Issue 1. [DOI: 10.1002/14651858.CD001877.pub4] [DOI] [PubMed] [Google Scholar]
Hackshaw 2012
- Hackshaw A. Benefits and harms of mammography screening. BMJ 2012;344:d8279. [DOI] [PubMed] [Google Scholar]
Heart 1999
- British Cardiac Society, British Hyperlipidaemia Association, British Hypertension Society. Joint British recommendations on prevention of coronary heart disease in clinical practice. Heart 1999;80 (Supplement 2):S1‐S29. [PMC free article] [PubMed] [Google Scholar]
Higgins 2011
- Higgins JPT, Altman DG, Sterne JAC (editors). Chapter 8: Assessing risk of bias in included studies. In: Higgins JPT, Green S editor(s). Cochrane Handbook for Systematic Reviews of Interventions. Version 5.1.0. The Cochrane Collaboration, Updated March 2011. Available from www.cochrane‐handbook.org. [Google Scholar]
Hippisley‐Cox 2008
- Hippisley‐Cox J, Coupland C, Vinogradova Y, Robson J, Minhas R, Sheikh A, et al. Predicting cardiovascular risk in England and Wales: prospective derivation and validation of QRISK2. BMJ 2008;336:1475‐82. [DOI] [PMC free article] [PubMed] [Google Scholar]
Holland 2005
- Holland W, Stewart S. Key issues in screening: genetics, information and economics. In: Holland W, Stewart S editor(s). Screening in Disease Prevention: What Works?. 1st Edition. Oxford: Radcliffe, 2005:17‐32. [Google Scholar]
Holmes‐Rovner 1996
- Holmes‐Rovner M, Kroll J, Schmitt N, Rovner DR, Breer ML, Rothert ML, et al. Patient satisfaction with health care decisions: the satisfaction with decision scale. Medical Decision Making 1996;16(1):58‐64. [DOI] [PubMed] [Google Scholar]
Jepson 2000
- Jepson R, Clegg A, Forbes C, Lewis R, Sowden A, Kleijnen J. The determinants of screening uptake and interventions for increasing uptake: a systematic review. Health Technology Assessment Programme, UK National Health Service 2000; Vol. 4, issue 14. [PubMed]
Jepson 2005
- Jepson R, Hewison J, Thompson A, Weller D. How should we measure informed choice? The case of cancer screening. Journal of Medical Ethics 2005;31:192‐6. [DOI] [PMC free article] [PubMed] [Google Scholar]
Kanis 2009
- Kanis JA, Oden A, Johanssen H, Borgström F, Ström O, McCloskey E. FRAX® and its applications to clinical practice. Bone 2009;44:734‐43. [DOI] [PubMed] [Google Scholar]
Keeney 1986
- Keeney RL, Winterfeldt D. Improving risk communication. Risk Analysis 1986;6(4):417‐24. [DOI] [PubMed] [Google Scholar]
Kellar 2011
- Kellar I, Mann E, Kinmonth AL, Prevost AT, Sutton S, Marteau TM. Can informed choice invitations lead to inequities in intentions to make lifestyle changes among participants in a primary care diabetes screening programme? Evidence from a randomized trial. Public Health 2011;125(9):645‐52. [DOI] [PubMed] [Google Scholar]
Kreuter 1999a
- Kreuter MW, Farrell DW, Olevitch LR, Brennan LK. Tailoring Health Messages: Customizing Communication with Computer Technology. New Jersey: Lawrence Erlbaum Associates, Inc, 1999. [Google Scholar]
Kreuter 1999b
- Kreuter MW, Bull FC, Clark EM, Oswald DL. Understanding how people process health information: a comparison of tailored and nontailored weight‐loss materials. Health Psychology 1999;18(5):487‐94. [DOI] [PubMed] [Google Scholar]
Liao 1996
- Liao L, Jollis JG, DeLong ER, Peterson ED, Morris KG, Mark DB. Impact of an interactive video on decision making of patients with ischaemic heart disease. Journal of General Internal Medicine 1996;11(6):373‐6. [DOI] [PubMed] [Google Scholar]
Lipkus 2007a
- Lipkus IM. Numeric, verbal, and visual formats of conveying health risks: suggested best practices and future recommendations. Medical Decision Making 2007;27(5):696‐713. [DOI] [PubMed] [Google Scholar]
Llewelyn‐Thomas 1995
- Llewellyn‐Thomas HA. Patients' health care decision‐making: a framework for descriptive and experimental investigations. Medical Decision Making 1995;15:101‐6. [DOI] [PubMed] [Google Scholar]
Marteau 2001
- Marteau TM, Dormandy E, Michie S. A multi‐dimensional measure of informed choice. Health Expectations 2001;4:99‐108. [DOI] [PMC free article] [PubMed] [Google Scholar]
Marteau 2002
- Marteau TM, Kinmonth AL. Screening for cardiovascular risk: public health imperative or matter for individual informed choice?. BMJ 2002;325(7355):78‐80. [DOI] [PMC free article] [PubMed] [Google Scholar]
Matthews 1999
- Matthews E, Edwards A, Barker J, Bloor M, Covey J, Hood K, et al. Efficient literature searching in diffuse topics: lessons from a systematic review of research on communicating risk to patients in primary care. Health Libraries Review 1999;16(2):112‐20. [DOI] [PubMed] [Google Scholar]
McPherson 2010
- McPherson K. Screening for breast cancer—balancing the debate. BMJ 2010;340:c3106. [DOI] [PubMed] [Google Scholar]
Michie 2002
- Michie S, Dormandy E, Marteau TM. The multi‐dimensional measure of informed choice: a validation study. Patient Education and Counseling 2002;48(1):87‐91. [DOI] [PubMed] [Google Scholar]
Mullen 2006
- Mullen PD, Allen JD, Glanz K, Fernandez ME, Bowen DJ, Pruitt SL, et al. Measures used in studies of informed decision making about cancer screening: a systematic review. Annals of Behavioral Medicine 2006;32(3):188‐201. [DOI] [PubMed] [Google Scholar]
Naik 2012
- Naik G, Ahmed H, Edwards AG. Communicating risk to patients and the public. British Journal of General Practice 2012;62(597):213‐6. [DOI] [PMC free article] [PubMed] [Google Scholar]
Nelson 2009
- Nelson HD, Tyne K, Nalk A, Bougatsos K, Chan BK, Humphrey L. Screening for breast cancer: an update for the US Preventive Services Task Force. Annals of Internal Medicine 2009;151:727‐37. [DOI] [PMC free article] [PubMed] [Google Scholar]
NHS Information Centre 2011a
- The NHS Information Centre. Breast Screening Programme, England 2009‐10 [Online]. Available at: http://www.ic.nhs.uk/webfiles/publications/008_Screening/Breastscrn0910/Breast_Screening_Publication_2010_Report.pdf 2011 (accessed on 12/02/2012).
NHS Information Centre 2011b
- The NHS Information Centre. Cervical Screening Programme, England 2010‐11 [Online]. Available at: http://www.ic.nhs.uk/webfiles/publications/008_Screening/cervscreen1011/Cervical_Bulletin_2010_11_v1_1.pdf, 2011 (accessed on 12/02/2012).
Noar 2007
- Noar SM, Benac CN, Harris MS, et al. Does tailoring matter? Meta‐analytic review of tailored print health behavior change interventions. Psychological Bulletin 2007;133(4):673‐93. [DOI] [PubMed] [Google Scholar]
O'Connor 1995
- O'Connor AM. Validation of a decisional conflict scale. Medical Decision Making 1995;15(1):25‐30. [DOI] [PubMed] [Google Scholar]
Prochaska 1992
- Prochaska JO, DiClemente CC. Stages of change in the modification of problem behaviors. Progress in Behavior Modification 1992;28:183‐218. [PubMed] [Google Scholar]
Prochaska 1997
- Prochaska JO, Velicer WF. The transtheoretical model of health behavior change. American Journal of Health Promotion 1997;12(1):38‐48. [DOI] [PubMed] [Google Scholar]
Raffle 2001
- Raffle A. Information about screening ‐ is it to achieve high uptake or to ensure informed choice?. Health Expectations 2001;4:92‐8. [DOI] [PMC free article] [PubMed] [Google Scholar]
RCGP 2002
- Royal College of General Practitioners. Fellowship by Assessment Handbook. 13th Edition. London: Royal College of General Practitioners, 2002. [Google Scholar]
Richards 2011
- Richards M. Breast cancer screening; an independent review is under way. BMJ 2011;343:d6843. [DOI] [PubMed] [Google Scholar]
Rogers 2002
- Rogers W. Are guidelines ethical? Some considerations for general practice. British Journal of General Practice 2002;52(481):663‐8. [PMC free article] [PubMed] [Google Scholar]
Rose 1978
- Rose G, Barker DJ. Epidemiology for the uninitiated: screening. BMJ 1978;2(6149):1417‐8. [DOI] [PMC free article] [PubMed] [Google Scholar]
Rosenstock 1988
- Rosenstock IM, Strecher VJ, Becker MH. Social learning theory and the Health Belief Model. Health Education Quarterly 1988;15(2):175‐83. [DOI] [PubMed] [Google Scholar]
Rosenstock 2000
- Rosenstock IM. Health Belief model. In: Kazdin, AE editor(s). Encyclopedia of Psychology. 4th Edition. Vol. 4, Washington DC: American Psychological Association; Oxford University Press, 2000:78‐80. [Google Scholar]
Sarfati 1998
- Sarfati D, Howden‐Chapman P, Woodward, Salmond C. Does the frame affect the picture? A study into how attitudes to screening for cancer are affected by the way benefits are expressed. Journal of Medical Screening 1998;5:137‐40. [DOI] [PubMed] [Google Scholar]
Slaytor 1998
- Slaytor E, Ward JE. How risks of breast cancer and benefits of screening are communicated to women: analysis of 58 pamphlets. BMJ 1998;317:263‐4. [DOI] [PMC free article] [PubMed] [Google Scholar]
Stacey 2011
- Stacey D, Bennett CL, Barry MJ, Col NF, Eden KB, Holmes‐Rovner M, et al. Decision aids for people facing health treatment or screening decisions. Cochrane Database of Systematic Reviews 2011, Issue 10. [DOI: 10.1002/14651858.CD001431] [DOI] [PubMed] [Google Scholar]
Stefanek 2011
- Stefanek M E. Uninformed Compliance or Informed Choice? A Needed Shift in our Approach to Cancer Screening. Journal of the National Cancer Institute 2011;103(24):1821‐26. [DOI] [PubMed] [Google Scholar]
Stewart‐Brown 1997
- Stewart‐Brown S, Farmer A. Screening could seriously damage your health [Editorial]. BMJ 1997;314:533. [DOI] [PMC free article] [PubMed] [Google Scholar]
Thomson 2005
- Thomson R, Murtagh M, Khaw F. Tensions in public health policy: patient engagement, evidence‐based public health and health inequalities. Quality & Safety in Health Care 2005;14(6):398‐400. [DOI] [PMC free article] [PubMed] [Google Scholar]
UK National Screening Portal
- UK National Screening Committee. UK Screening Portal (Online). Available at: http://www.screening.nhs.uk/programmes (accessed on 12/02/2012).
UKNSC 1998
- UK National Screening Committee. First Report. Departments of Health for England, Scotland, Northern Ireland, and Wales web site, Available at http://www.dh.gov.uk 1998 (accessed on 12/02/2012).
UKNSC 2000
- UK National Screening Committee. Second Report. Departments of Health for England, Scotland, Northern Ireland, and Wales web site, Available at http://www.dh.gov.uk. London, 2000 (accessed on 12/02/2012).
US PSTF 2005
Vlek 1987
- Vlek C. Risk assessment, risk perception and decision making about courses of action involving genetic risk: an overview of concepts and methods. Birth Defects: Original Article Series 1987;23(2):171‐207. [PubMed] [Google Scholar]
Weinstein 2002
- Weinstein ND, Sandman PM. The precaution adoption process model. In: Glanz K, Rimmer BK, Lewis FM editor(s). Health Behaviour and Health Education: Theory, Research and Practice. 3rd Edition. San Francisco: Jossey‐Bass, 2002:121‐43. [Google Scholar]
Wilson 1968
- Wilson JMG, Jungner G. Principles and Practice of Screening for Disease (Public Health Paper Number 34). Geneva: World Health Organisation, 1968. [Google Scholar]
References to other published versions of this review
Edwards 1999b
- Edwards A, Hood K, Matthews E, Russell I, Wilkinson C. Personalised risk communication in health screening programs. Cochrane Database of Systematic Reviews 1999, Issue 4. [Google Scholar]
Edwards 2003b
- Edwards A, Unigwe S, Elwyn G, Hood K. Effects of communicating individual risks in screening programmes: Cochrane systematic review. BMJ 2003;327(7417):703‐9. [DOI] [PMC free article] [PubMed] [Google Scholar]
Edwards 2003c
- Edwards A, Unigwe S, Elwyn G, Hood K. Personalised risk communication for informed decision making about entering screening programs. Cochrane Database of Systematic Reviews 2003, Issue 1. [DOI: 10.1002/14651858.CD001865] [DOI] [PubMed] [Google Scholar]
Edwards 2006
- Edwards AG, Evans R, Dundon J, Haigh S, Hood K, Elwyn GJ. Personalised risk communication for informed decision making about taking screening tests. Cochrane Database of Systematic Reviews 2006, Issue 4. [DOI: 10.1002/14651858.CD001865.pub2] [DOI] [PubMed] [Google Scholar]