

Abstract
Background
The success of evidence‐based practice depends on the clear and effective communication of statistical information.
Objectives
To evaluate the effects of using alternative statistical presentations of the same risks and risk reductions on understanding, perception, persuasiveness and behaviour of health professionals, policy makers, and consumers.
Search methods
We searched Ovid MEDLINE (1966 to October 2007), EMBASE (1980 to October 2007), PsycLIT (1887 to October 2007), and the Cochrane Central Register of Controlled Trials (The Cochrane Library, 2007, Issue 3). We reviewed the reference lists of relevant articles, and contacted experts in the field.
Selection criteria
We included randomized and non‐randomized controlled parallel and cross‐over studies. We focused on four comparisons: a comparison of statistical presentations of a risk (eg frequencies versus percentages) and three comparisons of statistical presentation of risk reduction: relative risk reduction (RRR) versus absolute risk reduction (ARR), RRR versus number needed to treat (NNT), and ARR versus NNT.
Data collection and analysis
Two authors independently selected studies for inclusion, extracted data, and assessed risk of bias. We contacted investigators to obtain missing information. We graded the quality of evidence for each outcome using the GRADE approach. We standardized the outcome effects using adjusted standardized mean difference (SMD).
Main results
We included 35 studies reporting 83 comparisons. None of the studies involved policy makers. Studies of alternative formats for presenting risks focused on either diagnostic or screening tests. Participants (health professionals and consumers) understood natural frequencies better than percentages (SMD 0.69 (95% confidence interval (CI) 0.45 to 0.93)). In studies of alternative formats for presenting risk reductions of interventions, and compared with ARR, RRR had little or no difference in understanding (SMD 0.02 (95% CI ‐0.39 to 0.43)) but was perceived to be larger (SMD 0.41 (95% CI 0.03 to 0.79)) and more persuasive (SMD 0.66 (95% CI 0.51 to 0.81)). Compared with NNT, RRR was better understood (SMD 0.73 (95% CI 0.43 to 1.04)), was perceived to be larger (SMD 1.15 (95% CI 0.80 to 1.50)) and was more persuasive (SMD 0.65 (95% CI 0.51 to 0.80)). Compared with NNT, ARR was better understood (SMD 0.42 (95% CI 0.12 to 0.71)), was perceived to be larger (SMD 0.79 (95% CI 0.43 to 1.15)).There was little or no difference for persuasiveness (SMD 0.05 (95% CI ‐0.04 to 0.15)). The sensitivity analyses including only high quality comparisons showed consistent results for persuasiveness for all three comparisons. Overall there were no differences between health professionals and consumers. The overall quality of evidence was rated down to moderate because of the use of surrogate outcomes and/or heterogeneity. None of the comparisons assessed behaviour.
Authors' conclusions
Natural frequencies are probably better understood than percentages in the context of diagnostic or screening tests. For communicating risk reductions, relative risk reduction (RRR), compared with absolute risk reduction (ARR) and number needed to treat (NNT), may be perceived to be larger and is more likely to be persuasive. However, it is uncertain whether presenting RRR is likely to help people make decisions most consistent with their own values and, in fact, it could lead to misinterpretation. More research is needed to further explore this question.
Keywords: Humans; Data Interpretation, Statistical; Risk; Risk Reduction Behavior; Behavior; Community Participation; Comprehension; Controlled Clinical Trials as Topic; Cross‐Over Studies; Health Personnel; Perception; Persuasive Communication; Probability; Randomized Controlled Trials as Topic
Plain language summary
Using different statistical formats for presenting health information
Examples illustrating the statistical terms used in this summary:
You read that a study found that an osteoporosis drug cuts the risk of having a hip fracture in the next three years by 50%. Specifically, 10% of the untreated people had a hip fracture at three years, compared with 5% of the people who took the osteoporosis drug every day for three years. Thus 5% (10% minus 5%) less people would suffer a hip fracture if they take the drug for 3 years. In other words, 20 patients need to take the osteoporosis drug over 3 years for an additional patient to avoid a hip fracture. "Cuts the risk of fracture by 50%" represents a relative risk reduction. "Five per cent less would suffer a fracture" represents an absolute risk reduction. "Twenty patients need to take the osteoporosis drug over 3 years for an additional patient to avoid a hip fracture" represents a number needed to treat.
You read that another study found that the risk of suffering a hip fracture over a three year period among people not taking any osteoporotic drug is 10%; another way of expressing this risk would be: 100 of 1000 people not taking any osteoporotic drug will suffer a hip fracture over a three year period. "10%" represents a percentage while "100 of 1000" represents a frequency.
Summary:
Health professionals and consumers may change their choices when the same risks and risk reductions are presented using alternative statistical formats. Based on the results of 35 studies reporting 83 comparisons, we found the risk of a health outcome is better understood when it is presented as a natural frequency rather than a percentage for diagnostic and screening tests. For interventions, and on average, people perceive risk reductions to be larger and are more persuaded to adopt a health intervention when its effect is presented in relative terms (eg using relative risk reduction which represents a proportional reduction) rather than in absolute terms (eg using absolute risk reduction which represents a simple difference). We found no differences between health professionals and consumers. The implications for clinical and public health practice are limited by the lack of research on how these alternative presentations affect actual behaviour. However, there are strong logical arguments for not reporting relative values alone, as they do not allow a fair comparison of benefits and harms as absolute values do.
Please refer to the Cochrane Collaboration Glossary for further explanations of the statistical terms used in this review.
Summary of findings
Summary of findings for the main comparison. Natural frequencies versus probabilities.
| Natural frequencies compared to percentages for presenting risks | ||||
| Patient or population: health professionals and consumers Settings: hypothetical scenarios Intervention: natural frequencies Comparison: percentages | ||||
| Outcomes | Average effect* | No of Participants (comparisons) | Quality of the evidence (GRADE) | Comments† |
| Understanding (measured as correct estimate or interpretation of a risk) | The mean Understanding in the intervention groups was 0.69 SD higher (0.45 to 0.93 higher) |
642 (7 comparisons) | moderate1 | SMD 0.69 (0.45 to 0.93) corresponding to 1.4 point difference on a 10‐point Likert scale. These results suggest frequencies may be understood better than percentages (moderate effect size). |
| * SD: standard deviation † We interpreted SMDs using the following rules suggested by the Cochrane Handbook:
We back translated the results by multiplying SMD by the standard deviation from a representative study (SD of 2 on a 10‐point Likert‐type scale). | ||||
| GRADE Working Group grades of evidence High quality: Further research is very unlikely to change our confidence in the estimate of effect. Moderate quality: Further research is likely to have an important impact on our confidence in the estimate of effect and may change the estimate. Low quality: Further research is very likely to have an important impact on our confidence in the estimate of effect and is likely to change the estimate. Very low quality: We are very uncertain about the estimate. | ||||
1 Outcome is a surrogate for health behaviour.
Summary of findings 2. Relative risk reduction (RRR) versus absolute risk reduction (ARR).
| Relative risk reductions (RRR) compared to absolute risk reductions (ARR) for presenting risk reductions | ||||
| Patient or population: health professionals and consumers Settings: hypothetical scenarios Intervention: relative risk reductions (RRR) Comparison: absolute risk reductions (ARR) | ||||
| Outcomes | Average effect* | No of Participants (comparisons) | Quality of the evidence (GRADE) | Comments† |
| Understanding (measured as correct estimate or interpretation of a risk reduction) | The mean Understanding in the intervention groups was 0.02 SD higher (0.39 lower to 0.43 higher) |
469 (3 comparisons) | moderate1,2 | SMD 0.02 (‐0.39 to 0.43) corresponding to 0.04 point difference on a 10‐point Likert scale. These results suggest there is little or no difference in understanding. |
| Perception (measured as rating on a scale of perceived effectiveness) | The mean Perception in the intervention groups was 0.41 SD higher (0.03 to 0.79 higher) |
1116 (5 comparisons) | low2,3 | SMD 0.41 (0.03 to 0.79) corresponding to 0.8 point difference on a 10‐point Likert scale. These results suggest the RRR may be perceived to be larger than the ARR (moderate effect size). |
| Persuasiveness (measured as a hypothetical decision or intention or willingness to adopt an intervention) | The mean Persuasiveness in the intervention groups was 0.66 SDs higher (0.51 to 0.81 higher) |
11221 (27 comparisons) | moderate2,4 | SMD 0.66 (0.51 to 0.81) corresponding to 1.3 point difference on a 10‐point Likert scale. These results suggest RRR are more likely to be persuasive (moderate effect size). |
| * SD: standard deviation † We interpreted SMDs using the following rules suggested by the Cochrane Handbook:
We back translated the results by multiplying SMD by the standard deviation from a representative study (SD of 2 on a 10‐point Likert‐type scale). | ||||
| GRADE Working Group grades of evidence High quality: Further research is very unlikely to change our confidence in the estimate of effect. Moderate quality: Further research is likely to have an important impact on our confidence in the estimate of effect and may change the estimate. Low quality: Further research is very likely to have an important impact on our confidence in the estimate of effect and is likely to change the estimate. Very low quality: We are very uncertain about the estimate. | ||||
1 The results were inconsistent. We did not however downgrade for inconsistency because the SMD is on the border of no to small effects in either direction. 2 Outcome is a surrogate for health behaviour. 3 The results were inconsistent. In three of the five comparisons RRR was perceived to be larger. Two found little or no difference. The overall estimate was also imprecise with the lower confidence limit bordering on no difference. 4 The results were inconsistent. However, the I2 test is very powerful for SMD. In addition, the robustness of the results with the various analytic methods (fixed or random effects model; risk ratios, risk differences or standardized effects) and the magnitude of the effect (average effect across the included studies was moderate or large) limit our concerns about heterogeneity.
Summary of findings 3. Relative risk reduction (RRR) versus number needed to treat (NNT).
| Relative risk reductions (RRR) compared to number needed to treat (NNT) for presenting risk reductions | ||||
| Patient or population: health professionals and consumers Settings: hypothetical scenarios Intervention: relative risk reductions (RRR) Comparison: number needed to treat (NNT) | ||||
| Outcomes | Average effect* | No of Participants (comparisons) | Quality of the evidence (GRADE) | Comments† |
| Understanding (measured as correct estimate or interpretation of a risk reduction) | The mean Understanding in the intervention groups was 0.73 SD higher (0.43 to 1.04 higher) | 182 (1 comparison) | moderate1,2 | SMD 0.73 (0.43 to 1.04) corresponding to 1.5 point difference on a 10‐point Likert scale. These results suggest the RRR may be understood better than NNT (large effect size). |
| Perception (measured as rating on a scale of perceived effectiveness) | The mean Perception in the intervention groups was 1.15 SD higher (0.8 to 1.5 higher) | 970 (3 comparisons) | moderate2,3 | SMD 1.15 (0.8 to 1.5) corresponding to 2.3 point difference on a 10‐point Likert scale. These results suggest the RRR may be perceived to be larger than the NNT (large effect size). |
| Persuasiveness (measured as a hypothetical decision or intention or willingness to adopt an intervention) | The mean Persuasiveness in the intervention groups was 0.65 SD higher (0.51 to 0.8 higher) | 9582 (22 comparisons) | moderate2,3 | SMD 0.65 (0.51 to 0.8) corresponding to 1.3 point difference on a 10‐point Likert scale. These results suggest RRR are more likely to be persuasive (moderate effect size) |
| * SD: standard deviation † We interpreted SMDs using the following rules suggested by the Cochrane Handbook:
We back translated the results by multiplying SMD by the standard deviation from a representative study (SD of 2 on a 10‐point Likert‐type scale). | ||||
| GRADE Working Group grades of evidence High quality: Further research is very unlikely to change our confidence in the estimate of effect. Moderate quality: Further research is likely to have an important impact on our confidence in the estimate of effect and may change the estimate. Low quality: Further research is very likely to have an important impact on our confidence in the estimate of effect and is likely to change the estimate. Very low quality: We are very uncertain about the estimate. | ||||
1 Only one comparison evaluated this outcome. 2 Outcome is a surrogate for health behaviour 3 The results were inconsistent. However, the I2 test is very powerful for SMD. In addition, the robustness of the results with the various analytic methods (fixed or random effects model; risk ratios, risk differences or standardized effects) and the magnitude of the effect (average effect across the included studies was moderate or large) limit our concerns about heterogeneity.
Summary of findings 4. Absolute risk reduction (ARR) versus number needed to treat (NNT).
| Absolute risk reductions (ARR) compared to number needed to treat (NNT) for presenting risk reductions | ||||
| Patient or population: health professionals and consumers Settings: hypothetical scenarios Intervention: absolute risk reductions (ARR) Comparison: number needed to treat (NNT) | ||||
| Outcomes | Average effect* | No of Participants (comparisons) | Quality of the evidence (GRADE) | Comments† |
| Understanding (measured as correct estimate or interpretation of a risk reduction) | The mean Understanding in the intervention groups was 0.42 SD higher (0.12 to 0.71 higher) | 182 (1 comparison) | moderate1,2 | SMD 0.42 (0.12 to 0.71) corresponding to 0.8 point difference on a 10‐point Likert scale. These results suggest the ARR may be understood better than NNT (moderate effect size). |
| Perception (measured as rating on a scale of perceived effectiveness) | The mean Perception in the intervention groups was 0.79 SD higher (0.43 to 1.15 higher) | 949 (3 comparisons) | moderate2,3 | SMD 0.79 (0.43 to 1.15) corresponding to 1.6 point difference on a 10‐point Likert scale. These results suggest the ARR may be perceived to be larger than the NNT (large effect size). |
| Persuasiveness (measured as a hypothetical decision or intention or willingness to adopt an intervention) | The mean Persuasiveness in the intervention groups was 0.05 SD higher (0.04 lower to 0.15 higher) | 9024 (20 comparisons) | moderate2,4 | SMD 0.05 (‐0.04 to 0.15) corresponding to 0.1 point difference on a 10‐point Likert scale. These results suggest there is little or no difference in persuasiveness. |
| * SD: standard deviation † We interpreted SMDs using the following rules suggested by the Cochrane Handbook:
We back translated the results by multiplying SMD by the standard deviation from a representative study (SD of 2 on a 10‐point Likert‐type scale). | ||||
| GRADE Working Group grades of evidence High quality: Further research is very unlikely to change our confidence in the estimate of effect. Moderate quality: Further research is likely to have an important impact on our confidence in the estimate of effect and may change the estimate. Low quality: Further research is very likely to have an important impact on our confidence in the estimate of effect and is likely to change the estimate. Very low quality: We are very uncertain about the estimate. | ||||
1 Only one comparison evaluated this outcome. 2 Outcome is a surrogate for health behaviour 3 The results were inconsistent. However, the I2 test is very powerful for SMD. In addition, the robustness of the results with the various analytic methods (fixed or random effects model; risk ratios, risk differences or standardized effects) and the magnitude of the effect (average effect across the included studies was large) limit our concerns about heterogeneity. 4 The results were inconsistent. We did not however downgrade for inconsistency because the SMD is in the borders of no to small effects in either direction.
Background
Description of the condition
Recently, there have been efforts to better integrate the results of research into clinical practice (Guyatt 2008). This has coincided with a growing consensus among researchers, health professionals, and consumers that each of these groups should more directly participate in decisions about health care at all levels. The success of both aims ‐ evidence‐based practice, and participation in healthcare decisions ‐ depends inherently on the clear and effective communication of research evidence, including the magnitude of risks and risk reductions.
In a number of studies, presenting statistical information, in particular risks or risk reductions, using different but equivalent formats lead to different decisions. For example, people have more difficulties reasoning with probabilities compared to natural frequencies (Hoffrage 2000). Clinicians might be more willing to recommend, and patients more willing to accept, an intervention when its benefits are presented in relative compared with absolute terms (Feinstein 1992). Similarly, while drugs and other interventions simply reduce the risk of a bad outcome, there is a common misunderstanding that they eliminate such risk.
Indeed, well‐informed decisions by health professionals, policymakers, and consumers depend on their understanding and correct perceptions of the magnitudes of risks and risk reductions. Persuasiveness, typically assessed in the form of hypothetical decision making, is often used as a surrogate for actual decisions and behaviours. However, persuasiveness does not necessarily guarantee the consistency of the decision with the values and preferences of the health consumers. It is also uncertain whether a hypothetical decision consistent with values and preferences is more likely to translate into actual behaviour (Carling 2008). Indeed, both internal factors (eg motivation) and external factors (eg health system barriers) may impede the translation of a decision into an actual behaviour.
Description of the intervention
There are alternative statistical formats for presenting risks and risk reductions (Appendix 1). Formats for presenting a risk include frequency (eg 50 in 1000, 1 in 20), percentage (eg 5%), and probability (eg 0.05). Formats for presenting risk reductions include relative risk reduction (RRR), absolute risk reduction (ARR), and number needed to treat (NNT).
The RRR is the reduction of risk in the intervention group relative to the risk in the control group. For a risk of 10% in the control group and a risk of 5% in the intervention group, the RRR would be 50%. One can present the risk in the control group along with the RRR (eg 50% relative risk reduction from a baseline of 10%).
The ARR is the difference in risks between two groups. For a risk of 10% in the control group and a risk of 5% in the intervention group, the ARR would be 5%. In presenting ARR, one can present: the risk reduction (eg absolute reduction of 5%), the risk reduction and the risk in the control group (eg reduced by 5% from a baseline of 10%), the risks in the intervention and control groups (eg risk reduced from 10% in group A to 5% in group B), or the risks in the intervention and control groups and the risk reduction (eg reduced by 5% from 10% in group A to 5% in group B). The risks used in presenting ARR (ie in the intervention and control groups) and the risk reduction can be expressed as frequencies, percentages or probabilities.
The NNT is the number of patients who need to be treated in order to prevent one additional bad outcome (ie the number of patients that need to be treated for one to benefit compared with a control in a clinical trial). The NNT can be separated into the NNT to benefit (NNTB) and NNT to harm (NNTH) where the latter expresses the occurrence of adverse events (Cochrane Handbook, chapter 12).
How the intervention might work
Scientists have proposed a number of theories and explanations of why presenting risks or risk reductions using different but equivalent formats can lead to different decisions.
In terms of presenting risks, Gigerenzer argued that through the process of adapting to risky environments humans evolved to deal with absolute frequencies, because they experienced information during most of existence in terms of discrete cases (eg 3 out of 20 cases rather than 15%) (Gigerenzer 1996).
In terms of presenting risk reduction, Feinstein argued that clinicians are more impressed by the bigger numbers of the relative changes than by the smaller absolute changes for the same results (Feinstein 1992). In addition, absolute terms offer physicians more concrete information about an intervention because they are based on both the magnitude of the reduction of risk and the baseline risk. Relative terms may thus be misleading because they ignore the baseline risk (Nuovo 2002).
Number needed to treat is thought to be an easily understood and a clinically useful measure of treatment effect, at least for health professionals (Cook 1995). However, some authors have argued that for drug therapies aimed at slowly developing disease processes, rather than completely preventing adverse outcomes in a single patient or a small fraction of patients (as suggested by NNT), an intervention may postpone the event for many treated patients (Halvorsen 2007). Other authors have proposed that patients may be insensitive to the size of NNT (Kristiansen 2002), but sensitivity to the NNT may depend on the threshold NNT (Akl 2004).
Why it is important to do this review
Health professionals and consumers are prone to interpretations exerted by alternative statistical presentations of the same evidence. While standardization may be important in improving the presentation of research evidence (and participation in healthcare decisions), we are not sure which of the many presentations leads to decisions most consistent with the interests of those affected. In this review we will summarize evidence from studies comparing alternative statistical presentations of risks and risk reductions in order to inform decisions about how best to present this evidence.
We identified five published systematic reviews addressing the presentation of risk reductions. Most were in the larger context of the effects of alternative iterations of the presentation of risk information (McGettigan 1999; Moxey 2003; Trevena 2006). The conclusions of these reviews demonstrated that RRR had larger effects on perception, understanding and adoption of the message compared to ARR or NNT. However, most reviews failed to evaluate the methodological quality of included studies, and none of them assessed separately the impact of the alternative presentation on the outcomes of understanding, perception, and persuasiveness. We address these limitations, and have conducted a more extensive and up‐to‐date search. Other reviews have addressed the effects of alternative graphical, numerical and presentations of risks (Edwards 2002; Lipkus 1999), but this was not the focus of our review.
Objectives
To evaluate the effects of using alternative statistical presentations of the same risks and risk reductions on understanding, perception, persuasiveness and behaviour of health professionals, policy makers, and consumers.
Methods
Criteria for considering studies for this review
Types of studies
Randomized controlled trials, controlled trials, and cross‐over studies.
Types of participants
Participants of interest included health professionals, policy makers, and consumers. Consumers included patients, the general public, and students. Because of their lack of clinical exposure, we considered students of health professions as consumers, for the purposes of this review.
Types of interventions
Interventions of interest consisted of presentations of a risk (eg frequencies, percentages, and probabilities) or of a risk reduction (eg RRR, ARR, NNT) of the same evidence about health.
We excluded studies focused on comparing positive and negative framing of the message on the same evidence (Akl 2007), alternative graphical or verbal presentations of the same evidence, alternative orders of comparing risks or comparisons, or alternative media to present the same information.
We also excluded studies in which participants chose between different interventions with different benefits and harms using alternative presentation formats, since any effects of the presentations would be completely confounded by any effects of the differences in benefits and harms.
Types of outcome measures
Outcomes of interest consisted of understanding, perception, persuasiveness, and actual decisions or behaviours. We considered only objective understanding (eg correctly stating which treatment is more effective after being presented with statistical data) and not self‐reported understanding. Perception refers to how effective an intervention is perceived to be (eg rating of the perceived effectiveness of vaccination). Persuasiveness refers to how likely participants are to make a hypothetical decision in favour of an intervention (eg hypothetical decision to treat cholesterol). Appendix 2 provides examples of outcomes assessed in the studies classified according to this review typology of outcomes.
Primary outcomes
The primary outcome of interest was actual decisions or behaviours.
Secondary outcomes
Secondary outcomes of interest consisted of understanding, perception, and persuasiveness. We considered only objective understanding (eg correctly stating which treatment is more effective after being presented with statistical data) and not self reported understanding. Perception refers to how effective an intervention is perceived to be (eg rating of the perceived effectiveness of vaccination). Persuasiveness refers to how likely participants are to make a hypothetical decision in favour of an intervention (eg hypothetical decision to treat cholesterol). Appendix 2 provides examples of outcomes assessed in the studies classified according to this review typology of outcomes.
A study meeting the other selection criteria did not have to report one of our primary or secondary outcomes in order to be included in this review.
Search methods for identification of studies
Electronic searches
The search was part of a larger search for studies assessing alternative presentations of the same empirical evidence about health. We conducted the initial search in June 2002, and updated it in September 2004, and October 2007.
We used Ovid to search MEDLINE (1966 to 2007), EMBASE (1980 to 2007), and PsycLIT (1887 to 2007) using no language or date restriction. We searched the Cochrane Controlled Trials Register (The Cochrane Library 2007, Issue 3) using FRAM* and PRESENT* as text words. We searched MEDINE, EMBASE, and PsycLIT by ANDing a search for study type with a search for intervention type (see Appendix 3: Electronic search strategies).
Searching other resources
We used the 'Related Articles' feature of PubMed MEDLINE to find additional articles. We searched MEDLINE and PsycINFO databases for articles published by the first authors of included studies and of excluded but closely related studies. We reviewed the reference lists of related systematic reviews, included studies and excluded but closely related studies. Finally, we contacted experts in the field.
Data collection and analysis
Selection of studies
Two review authors independently screened the title and abstract of identified articles for relevance. We retrieved the full text of articles judged potentially relevant by at least one review author. Two review authors then independently screened the full text article for inclusion or exclusion. The review authors resolved their disagreements by discussion or by consulting a third review author.
Data extraction and management
We developed a standardized data extraction form. Two review authors independently extracted data from each included study and resolved their disagreements by discussion or by consulting a third review author. We extracted data related to study methods, participants, intervention, assessed outcome, and study results. We extracted data for the longer follow‐up time when the study authors reported more than one. We attempted to contact study authors for incompletely reported data.
We noted whether the ARR was expressed as a frequency or a percentage reduction and whether a baseline risk was provided. We also noted the scenarios (or an illustrative extract) used in the study.
Assessment of risk of bias in included studies
Two review authors independently assessed the risk of bias each included study and resolved their disagreements by discussion or by consulting a third review author. Methodological data included:
Randomization. We considered the following methods of sequence generation as adequate: (1) repeated coin‐tossing; (2) throwing dice; (3) dealing previously shuffled cards; (4) using a published list of random numbers; and (5) using a list of random numbers generated by a computer.
Allocation concealment. We considered the following methods of concealment of allocation as adequate: (1) central randomization; (2) sequentially numbered drug containers; and (3) sequentially numbered, opaque, sealed envelopes. For cross‐over studies we assessed the randomization of the order of interventions.
Objectivity and directness of outcomes: yes (eg real understanding, behaviour); no (eg hypothetical outcome, such as hypothetical decisions).
Response rate (participation rate): high (> 50%), low (≤ 50%)
We also assessed whether the presentation of the risk reduction was appropriate for the intended type of presentation. For a presentation of a RRR to be considered appropriate, it should have included the word 'relative' or used a fraction term (eg reduced the risk by one third). For a presentation of an ARR to be considered appropriate, it should have included the word 'absolute' or provided the absolute risks in the two groups, or expressed the reduction in frequency (eg reduce the chance by 10 in 1000 persons).
We also graded the quality of the underlying evidence for each outcome using the Grading of Recommendations Assessment, Development and Evaluation (GRADE) approach (Guyatt 2008). For the purpose of assessing the quality of evidence, we considered understanding, perception and persuasiveness as surrogates of behaviour (our primary outcome) and hence downgraded the evidence accordingly.
Measures of treatment effect
We analyzed the results of included studies for each eligible comparison. Because outcomes in these studies are typically scaled responses to survey questions, we standardized the effects using Hedges standardized mean difference (SMD). The SMD ensures that the differences across the scales are standardized to a uniform scale before they are combined. For comparisons where we were not able to calculate the SMD directly, we calculated the t‐values using the means and standard errors: t = (m1‐m2)/(se22/n1 + se22/n2)1/2 then calculated the corresponding SMD using SMD = 2t/sqrt(N) (Cooper 1994) and adjusted it using the same adjustment factor. In all cases, we calculated the adjusted standard error for the resulting SMD.
If a paper reported the results of two or more separate comparisons enrolling different participants, we treated these as separate comparisons. One study used a between‐subjects factorial design but reported no interaction between the effects of the interventions so we treated the comparisons as independent (Natter 2005a; Natter 2005b).
Assessment of heterogeneity
We quantified results for heterogeneity across studies using the I2 test (Higgins 2003) and used the following interpretation of the value of I2:
0 to 50 = low;
50 to 80 = moderate and worthy of investigation;
80 to100 = severe and worthy of understanding;
95 to 100 = aggregate with major caution (Julian Higgins, personal communication).
Data synthesis
We pooled multiple outcome measures for a single trial ‐ for example, three different questions about perception or responses to three different scenarios by the same participants ‐ using fixed‐effect models into a single SMD for that comparison. The main purpose of this method was to take into account all available evidence. We specifically used the fixed‐effect model because it assumes that the estimate of outcome from each measure is a sample from the same distribution.
We pooled data from different studies when appropriate, using random effects models with the inverse variance approach. We interpreted SMDs using the following rules of thumb (Cochrane Handbook):
< 0.40 represents a small effect size
0.40 to 0.70 represents a moderate effect size
> 0.70 represents a large effect size
In addition, we back translated the results by multiplying SMD by the standard deviation (SD) from a representative study (SD of 2 on a 10‐point Likert‐type scale) (Brotons 2002). The analytic process attempts to reconcile the need to standardize the results (by using SMDs in the analysis) and the helpfulness of using an original scale (by back translating the results into a 10‐point Likert‐type scale).
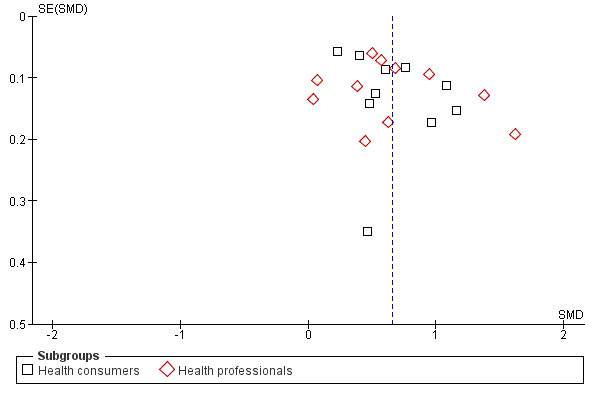
We created inverted funnel plots of individual study results plotted against inverse of the variance in order to investigate small study effects that may occur because of publication bias.
Subgroup analysis and investigation of heterogeneity
We conducted pre‐planned subgroup analyses based on type of participants which we divided into health professionals and consumers.
Sensitivity analysis
We also conducted pre‐planned sensitivity analyses excluding studies:
of lower methodological quality (ie those which did not meet at least two of the four methodological criteria);
in which the presentation of the risk reduction was not appropriate for the intended type of presentation (see Assessment of risk of bias in included studies);
in which the amount of information varied for the different presentations;
in which there were mismatches between the different presentations (inaccurate conversions).
We conducted post‐hoc analyses of the persuasiveness outcome restricted to comparisons reporting binary data, and calculated both pooled risk ratio (relative risk) and pooled risk difference. We used relative risk (instead of odds ratio) for ease of interpretation. Although odds ratio has better statistical properties when rates are high, its use did not significantly change the results to alter our interpretation of the quality of evidence.
Results
Description of studies
Results of the search
Our electronic searches identified a total of 23,493 unique citations (10,732 unique citations in June 2002, 2,637 additional unique citations in September 2004, and 10,124 additional unique citations in October 2007). The title and abstract screening identified 92 citations as potentially eligible for this review. The full text screening identified 33 eligible studies. We included two additional study published after our electronic search date (Carling 2008; Carling 2009).
Included studies
Of the 35 studies, 20 were conducted with health consumers, 14 with health professionals, and 1 with both. No study was conducted with policy makers. The response rate was high (> 50%) in 26 studies (63%); low (≤ 50%) in 8 studies (20%); and not reported in 7 studies (17%). The 35 studies reported 41 comparisons, 21 of which were three‐way (ie RRR versus ARR versus NNT), making the total number of comparisons 83:
8 comparisons of natural frequencies versus percentages;
31 comparisons of RRR versus ARR;
23 comparisons of RRR versus NNT; and
21 comparisons of ARR versus NNT.
Please note that many studies assessing percentages labelled them as 'probabilities'.
We did not identify any comparison including odds ratios or NNTH. Three studies assessed number needed to screen (NNS) (Adily 2004; Sarfati 1998; Young 2003). We analyzed studies assessing NNS along with studies assessing NNT, given their small number and their consistent results.
The different studies covered a number of chronic diseases (mainly cancer, cardiovascular), genetic testing, and vaccination. Some of the 83 comparisons included more than one outcome with a total of 92 outcome measurements: 12 for understanding, 11 for perception and 69 for persuasiveness. Persuasiveness outcomes consisted of hypothetical choice of a health intervention (see Appendix 2). None of the comparisons reported actual decisions or behaviours as an outcome.
Excluded studies
We excluded 58 studies for the following reasons: not an original study (n = 21); not an appropriate study design (n = 5); use of different information in the comparison groups (n = 6); not a comparison of interest (n = 22); article did not report the necessary data for the comparison of interest (n = 4).
Risk of bias in included studies
Figure 1 and Figure 2 respectively show the methodological quality graph and summary of the quality of included studies. Of the 41 comparisons, 19 were of cross‐over design (46%) and 22 were of parallel design (54%). Of the 41 comparisons, allocation was concealed in 7 (17%), not concealed in 3 (7%), and unclear whether concealed or not in 31 (76%). The design was randomized (random allocation for parallel group studies and randomization of the order of presentation for cross‐over studies) in 30 studies (73%), not randomized in 4 studies (10%), and unclear whether randomized or not in 7 studies (17%). Of the 41 comparisons, 12 (29%) evaluated an objective outcome and 29 (71%) did not. The response rate was high (> 50%) in 26 (63%), low (≤ 50%) in 8 (20%), and not reported in 7 (17%) studies.
1.
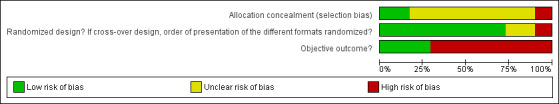
Methodological quality graph: review authors' judgments about each methodological quality item presented as percentages across all included studies.
2.
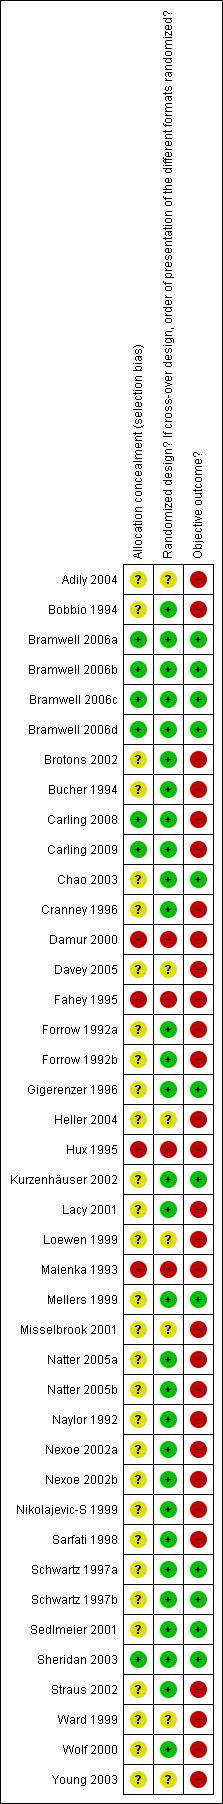
Methodological quality summary: review authors' judgments about each methodological quality item for each included study.
In most of the studies the presentation of the risk reduction was not appropriate for the RRR (see Assessment of risk of bias in included studies). One study provided different amounts of information for the statistics being compared (Davey 2005). In three of the included studies (Adily 2004; Misselbrook 2001; Young 2003), we identified mismatches between the different statistics (inaccurate conversions) (See Characteristics of included studies). We excluded these four studies in the sensitivity analysis.
The quality of evidence was moderate for the comparison of presentations of risk (Table 1) and varied from low to moderate (mostly moderate) for the comparisons of presentations of risk reduction (Table 2; Table 3; Table 4).
Effects of interventions
See: Table 1; Table 2; Table 3; Table 4
Comparison 1 ‐ Natural frequencies versus percentages
Understanding
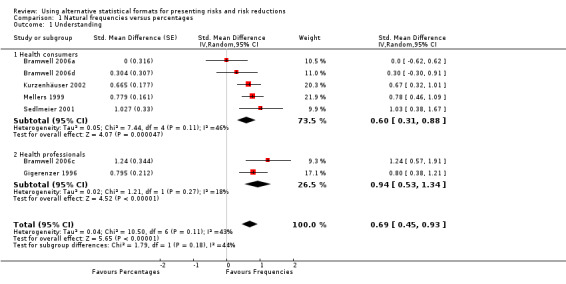
Five eligible studies reported eight comparisons of natural frequencies and percentages for the presentation of risk: five comparisons with health consumers (Bramwell 2006a; Bramwell 2006d; Kurzenhäuser 2002; Mellers 1999; Sedlmeier 2001) and three comparisons with health professionals (Bramwell 2006b; Bramwell 2006c; Gigerenzer 1996).One of the comparisons (Bramwell 2006b) assessed a dichotomous outcome (ie estimating the percentage of disease within 5% of the correct one) but reported no events and was thus not included in the meta‐analysis.
The overall pooled SMD was statistically significant at 0.69 (95% CI 0.45 to 0.93) (I2 = 43%), corresponding to 1.4 point difference on a 10‐point Likert scale in favour of natural frequencies (Figure 3; Analysis 1.1). The quality of evidence for this estimate was moderate (Table 1). In subgroup analysis, the pooled SMD was 0.60 (95% CI 0.31 to 0.88) (I2 = 46%) with health consumers and 0.94 (95% CI 0.53 to 1.34) (I2 = 18%) with health professionals; the test for interaction was not statistically significant (P = 0.17) (Figure 3; Analysis 1.1). No sensitivity analysis was required.
3.
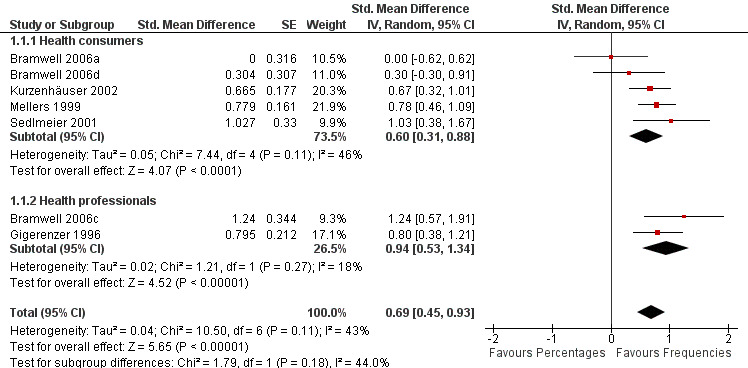
Forest plot of comparison: 1 Natural frequencies versus percentages, outcome: 1.1 Understanding.
1.1. Analysis.
Comparison 1 Natural frequencies versus percentages, Outcome 1 Understanding.
Comparison 2 ‐ RRR versus ARR
Understanding
Two eligible studies reported three comparisons of RRR and ARR, all with health consumers (Schwartz 1997a; Schwartz 1997b; Sheridan 2003). The quality of supporting evidence was moderate (Table 2). The pooled SMD was not statistically significant at 0.02 (95% CI ‐0.39 to 0.43) (I2 = 80%) corresponding to < 0.1 point difference on a 10‐point Likert scale (Figure 4; Analysis 2.1). The sensitivity analysis included only one high quality comparison (Sheridan 2003) and the SMD was statistically significant at 0.33 (95% CI 0.03 to 0.62) in favour of RRR.
4.
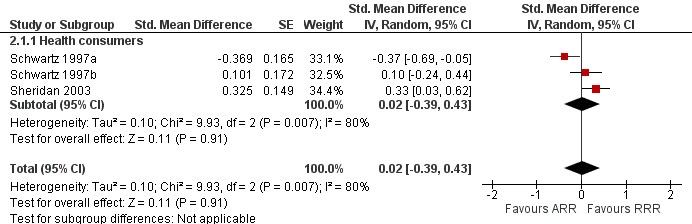
Forest plot of comparison: 2 RRR versus ARR, outcome: 2.1 Understanding.
2.1. Analysis.
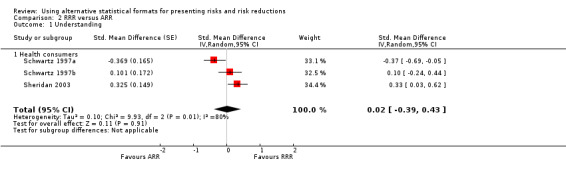
Comparison 2 RRR versus ARR, Outcome 1 Understanding.
Perception
Four eligible studies reported five comparisons of RRR and ARR: two comparisons with health consumers (Natter 2005a; Natter 2005b) and three comparisons with health professionals (Brotons 2002; Bucher 1994; Naylor 1992). The overall pooled SMD was statistically significant at 0.41 (95% CI 0.03 to 0.79) (I2 = 89%) corresponding to 0.8 point difference on a 10‐point Likert scale in favour of RRR being perceived as larger (Figure 5; Analysis 2.2). The quality of evidence for this estimate was low (Table 2). In subgroup analysis, the pooled SMD was 0.44 (95% CI ‐0.68 to 1.57) (I2 = 94%) with health consumers and 0.39 (95% CI ‐0.04 to 0.82) (I2 = 90%) with health professionals; the test for interaction was not statistically significant (P = 0.51). The sensitivity analysis included two high quality comparisons (Bucher 1994; Naylor 1992) with a pooled SMD of 0.42 (95% CI ‐0.34 to 1.19) (I2 = 92%).
5.
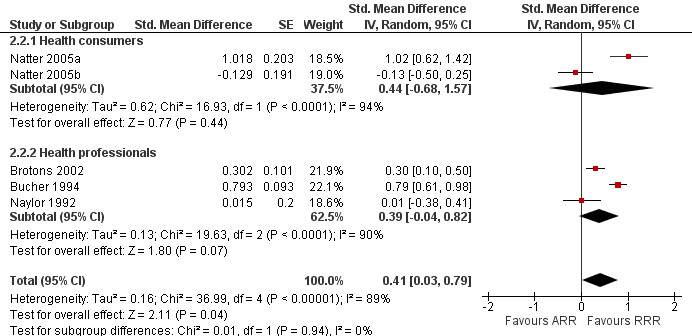
Forest plot of comparison: 2 RRR versus ARR, outcome: 2.2 Perception.
2.2. Analysis.
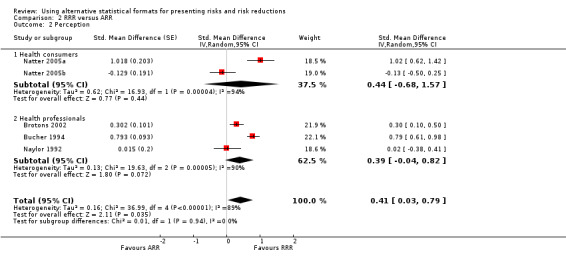
Comparison 2 RRR versus ARR, Outcome 2 Perception.
Persuasiveness
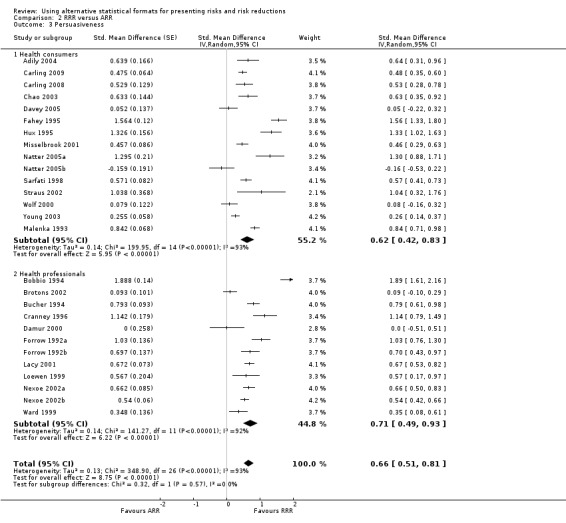
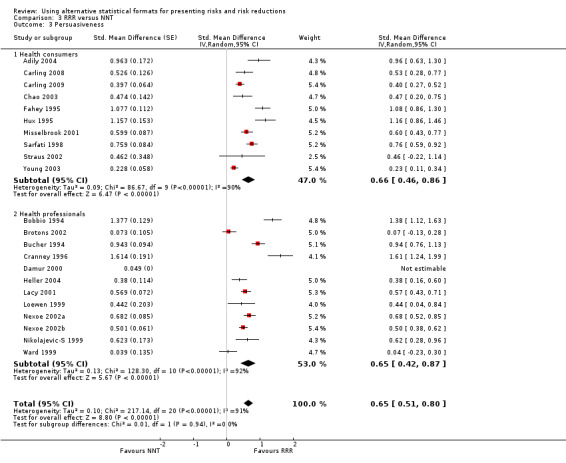
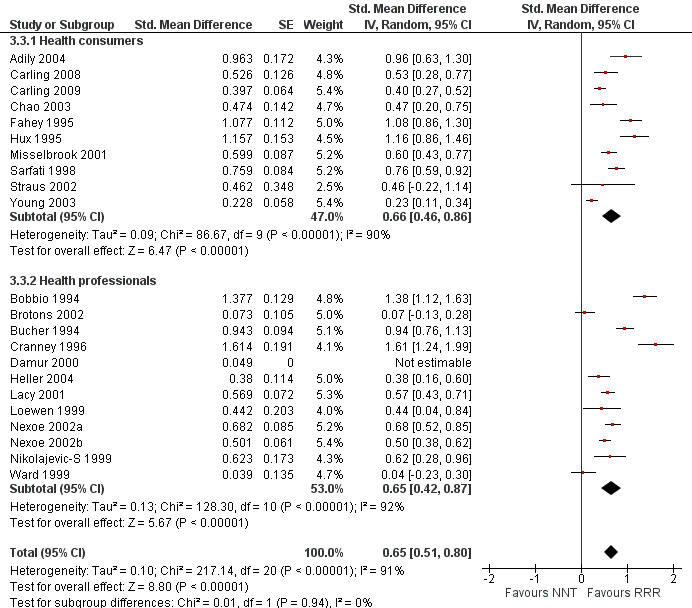
Twenty three eligible studies reported 25 comparisons of RRR and ARR: 14 comparisons with health consumers (Adily 2004; Carling 2009; Carling 2008; Chao 2003; Davey 2005; Fahey 1995; Hux 1995; Misselbrook 2001; Natter 2005a; Natter 2005b; Sarfati 1998; Straus 2002; Wolf 2000; Young 2003) and 11 comparisons with health professionals Bobbio 1994; Brotons 2002; Bucher 1994; Cranney 1996; Forrow 1992a; Forrow 1992b; Lacy 2001; Loewen 1999; Nexoe 2002a; Nexoe 2002b; Ward 1999). The funnel plots did not suggest that the small study effects may be related to publication bias (Figure 6; Analysis 2.3). The overall pooled SMD was statistically significant at 0.66 (95% CI 0.51 to 0.81) (I2 = 93%) corresponding to 1.3 point difference on a 10‐point Likert scale in favour of RRR (Figure 7; Analysis 2.3). The quality of evidence for this estimate was moderate (Table 2). In subgroup analysis, the pooled SMD was 0.62 (95% CI 0.42 to 0.83) (I2 = 93%) with health consumers and 0.71 (95% CI 0.49 to 0.93) (I2 = 92%) with health professionals; the test for interaction was statistically significant (P = 0.006). The sensitivity analysis included four high quality comparisons (Bucher 1994; Chao 2003; Lacy 2001; Sarfati 1998) and the overall pooled SMD remained statistically significant at 0.67 (95% CI 0.57 to 0.76) (I2 = 8%). The post‐hoc analysis restricted to comparisons reporting binary data (n = 20) resulted in a pooled absolute risk difference of ‐0.24 (95% CI ‐0.30 to ‐0.18) (Figure 8) and a pooled risk ratio of 0.68 (95% CI 0.60 to 0.77) where the RRR was more persuasive (Figure 9).
6.
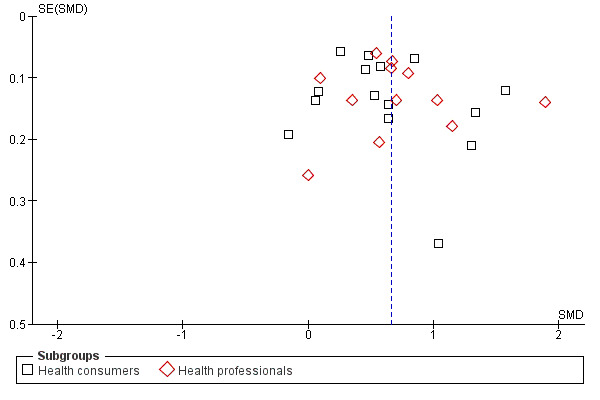
Funnel plot of comparison: 2 RRR versus ARR, outcome: 2.3 Persuasiveness.
2.3. Analysis.
Comparison 2 RRR versus ARR, Outcome 3 Persuasiveness.
7.
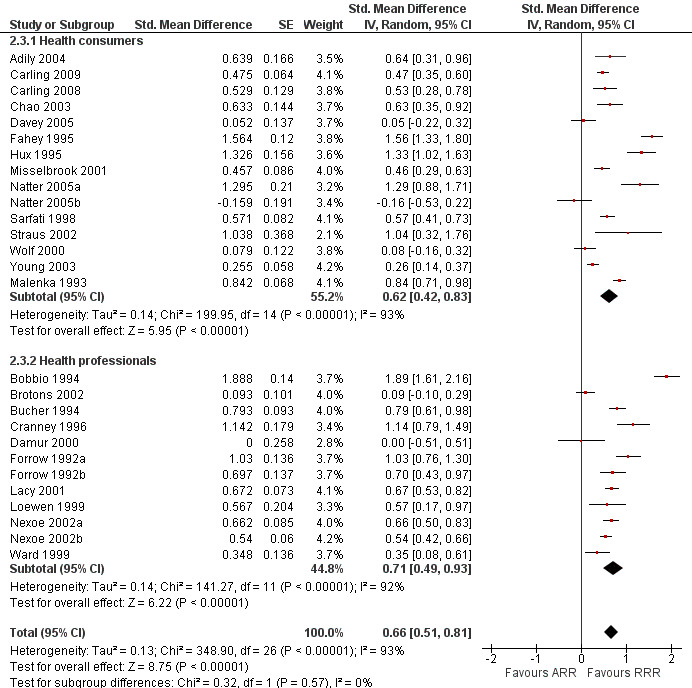
Forest plot of comparison: 2 RRR versus ARR, outcome: 2.3 Persuasiveness
8.
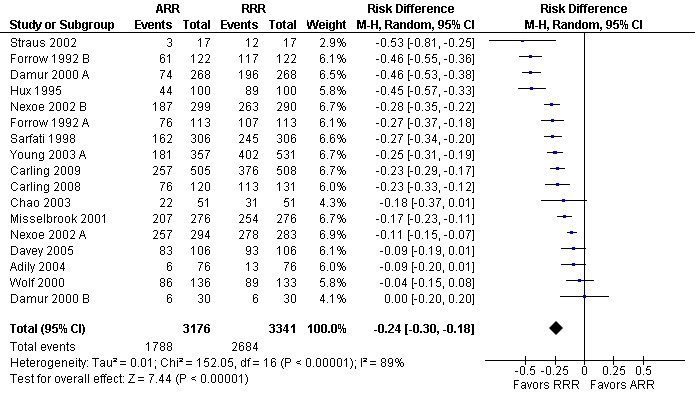
Additional analysis: RRR versus ARR persuasiveness (binary data) (risk difference)
9.
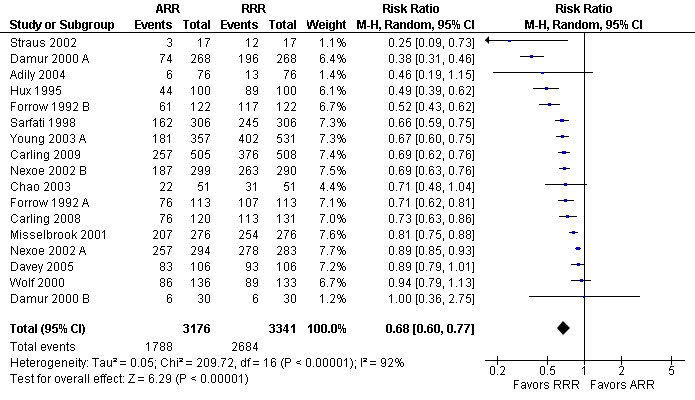
Additional analysis: RRR versus ARR persuasiveness (binary data) (risk ratio)
Comparison 3 ‐ RRR versus NNT
Understanding
One eligible study reported one comparison of RRR and NNT with health consumers (Sheridan 2003). The SMD was 0.73 (95% CI 0.43 to 1.04) corresponding to 1.5 point difference on a 10‐point Likert scale, ie RRR was better understood. The quality of evidence for this estimate was moderate (Table 3).
Perception
Three eligible studies reported three comparisons of RRR and NNT, all with health professionals (Brotons 2002; Bucher 1994; Naylor 1992). The pooled SMD was statistically significant at 1.15 (95% CI 0.80 to 1.50) (I2 = 82%) corresponding to 2.3 point difference on a 10‐point Likert scale in favour of RRR (Figure 10; Analysis 3.2). The quality of evidence for this estimate was moderate (Table 3). All three comparisons included in the analysis were of lower methodological quality, leaving no study to be included in the sensitivity analysis.
10.
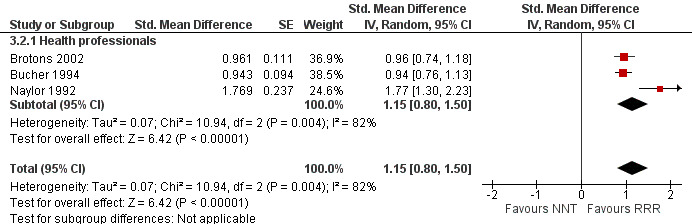
Forest plot of comparison: 3 RRR versus NNT, outcome: 3.2 Perception
3.2. Analysis.
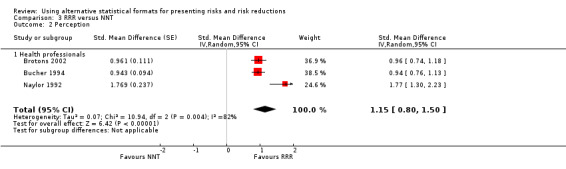
Comparison 3 RRR versus NNT, Outcome 2 Perception.
Persuasiveness
Twenty one eligible studies reported 21 comparisons of RRR and NNT: 10 comparisons with health consumers (Adily 2004; Carling 2009; Carling 2008; Chao 2003; Fahey 1995; Hux 1995; Misselbrook 2001; Sarfati 1998; Straus 2002; Young 2003) and 11 comparisons with health professionals (Bobbio 1994; Brotons 2002; Bucher 1994; Cranney 1996; Heller 2004; Lacy 2001; Loewen 1999; Nexoe 2002a; Nexoe 2002b; Nikolajevic‐S 1999; Ward 1999). The funnel plot did not suggest that the small study effects may be related to publication bias (Figure 11; Analysis 3.3). The overall pooled SMD was statistically significant at 0.65 (95% CI 0.51 to 0.80) (I2 = 91%) corresponding to 1.3 point difference on a 10‐point Likert scale in favour of RRR (Figure 12; Analysis 3.3). The quality of evidence for this estimate was moderate (Table 3). In subgroup analysis, the pooled SMD was 0.66 (95% CI 0.46 to 0.86) (I2 = 90%) with health consumers and 0.65 (95% CI 0.42 to 0.87) (I2 = 92%) with health professionals; the test for interaction was not statistically significant (P = 0.14). The sensitivity analysis included three high quality comparisons and the overall pooled SMD remained statistically significant at 0.62 (95% CI 0.46 to 0.78) (I2 = 53%). The post‐hoc analysis restricted to comparisons reporting binary data (n = 16) resulted in a pooled absolute risk difference of ‐0.25 (95% CI ‐0.33 to ‐0.17) (Figure 13) and a pooled risk ratio of 0.64 (95% CI 0.54 to 0.76) (Figure 14).
11.
Funnel plot of comparison: 3 RRR versus NNT, outcome: 3.3 Persuasiveness
3.3. Analysis.
Comparison 3 RRR versus NNT, Outcome 3 Persuasiveness.
12.
Forest plot of comparison: 3 RRR versus NNT, outcome: 3.3 Persuasiveness
13.
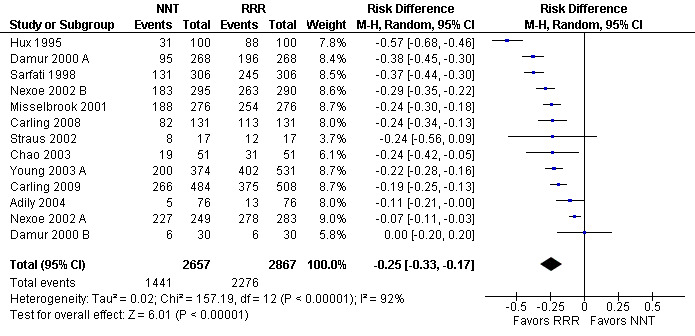
Additional analysis: RRR versus NNT persuasiveness (binary data) (risk difference)
14.
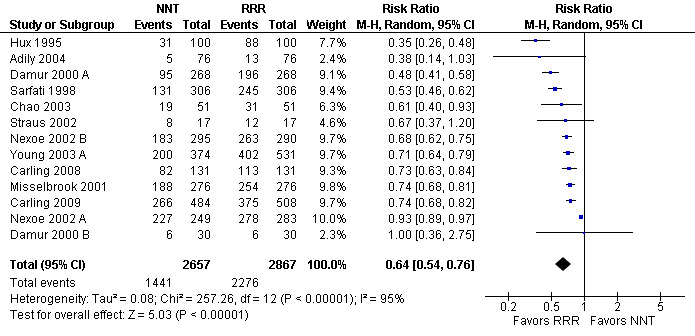
Additional analysis: RRR versus NNT persuasiveness (binary data) (risk ratio)
Comparison 4 ‐ ARR versus NNT
Understanding
One eligible study reported one comparison of ARR and NNT with health consumers (Sheridan 2003). The SMD was 0.42 (95% CI 0.12 to 0.71) corresponding to 0.8 point difference on a 10‐point Likert scale, ie ARR was better understood. The quality of evidence for this estimate was moderate (Table 4).
Perception
Three eligible studies reported three comparisons of ARR and NNT with health professionals (Brotons 2002; Bucher 1994; Naylor 1992). The pooled SMD was statistically significant at 0.79 (95% CI 0.43 to 1.15) (I2 = 84%) corresponding to 1.6 point difference on a 10‐point Likert scale in favour of ARR (Figure 15; Analysis 4.2). The quality of evidence for this estimate was moderate (Table 4). All three comparisons included in the analysis were of lower methodological quality leaving no study to be included in the sensitivity analysis.
15.
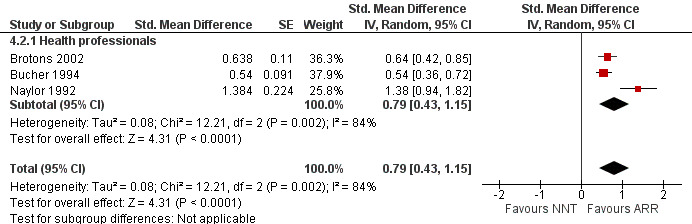
Forest plot of comparison: 4 ARR versus NNT, outcome: 4.2 Perception.
4.2. Analysis.
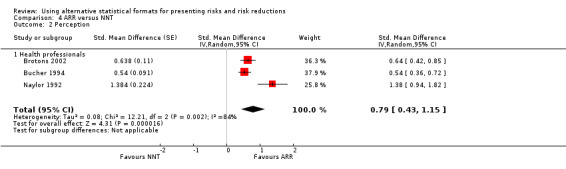
Comparison 4 ARR versus NNT, Outcome 2 Perception.
Persuasiveness
Nineteen eligible studies reported 19 comparisons of ARR and NNT: 10 comparisons with health consumers (Adily 2004; Carling 2009; Carling 2008; Chao 2003; Fahey 1995; Hux 1995; Misselbrook 2001; Sarfati 1998; Straus 2002; Young 2003) and 9 comparisons with health professionals (Bobbio 1994; Brotons 2002; Bucher 1994; Cranney 1996; Lacy 2001; Loewen 1999; Nexoe 2002a; Nexoe 2002b; Ward 1999). The overall pooled SMD was 0.05 (95% CI ‐0.04 to 0.15) (I2 = 75%) corresponding to 0.1 point difference on a 10‐point Likert scale, ie little or no difference in persuasiveness (Figure 16; Analysis 4.3). The quality of evidence for this estimate was moderate (Table 4). In subgroup analysis, the pooled SMD was 0.05 (95% CI ‐0.04 to 0.14) (I2 = 42%) with health consumers and 0.07 (95% CI ‐0.10 to 0.24) (I2 = 85%) with health professionals; the test for interaction was not statistically significant (P = 0.63). The sensitivity analysis included eight high quality comparisons (Carling 2009; Carling 2008; Chao 2003; Cranney 1996; Lacy 2001; Nexoe 2002a; Nexoe 2002b; Sarfati 1998) and the overall pooled SMD was 0.06 (95% CI ‐0.06 to 0.17) (I2 = 71%). The post‐hoc analysis restricted to comparisons reporting binary data (n = 16) resulted in a pooled absolute risk difference of 0.00 (95% CI ‐0.02 to 0.03) and a pooled risk ratio of 1.00 (95% CI 0.96 to 1.05).
16.
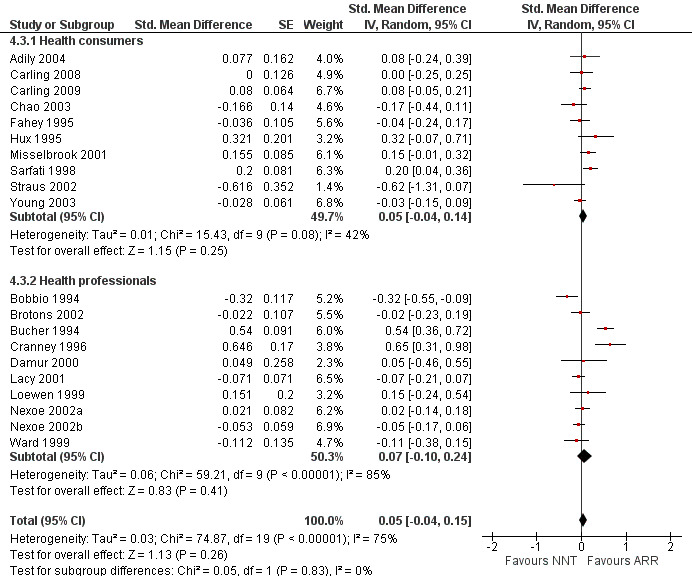
Forest plot of comparison: 4 ARR versus NNT, outcome: 4.3 Persuasiveness
4.3. Analysis.
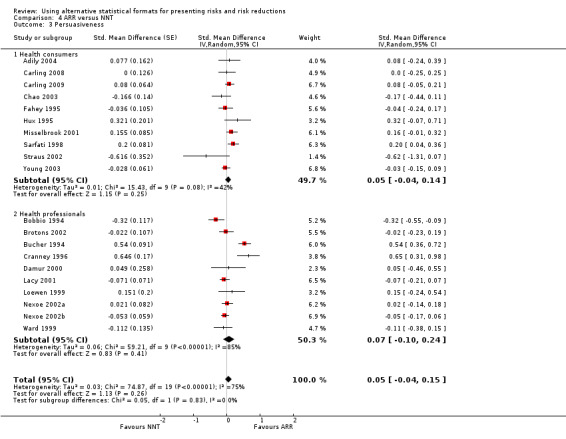
Comparison 4 ARR versus NNT, Outcome 3 Persuasiveness.
Additional results
In Appendix 4 we summarize the results of additional analyses reported by the included studies on the following: alternative presentations of frequency, consistency of decision with values outcome, providing baseline information, understanding and education, and postponement of event.
Discussion
Summary of main results
Participants in the included studies understood risks better when exposed to natural frequencies compared to percentages (moderate effect size) in the context of diagnostic or screening tests. They perceived interventions to be more effective (moderate to large effects sizes) and were more persuaded to prescribe or accept an intervention (moderate effect sizes) when exposed to RRR compared to ARR and NNT. RRR conveyed better understanding than NNT (large effect size) but not ARR. Participants perceived interventions to be more effective and showed better understanding (moderate to large effects sizes) when exposed to ARR compared to NNT; there was little or no difference in being persuaded to prescribe or accept an intervention.
Overall there were no differences between health professionals and consumers. While this finding might be due to lack of statistical power or to biased results, it might reflect an actual lack of difference. This would be of concern because health professionals play a key role in medical decision making. It also suggests that the formal education and training of health professionals apparently has no effect on their handling of statistical information.
Overall completeness and applicability of evidence
The effectiveness of communication of risks and risk reductions is directly linked to its effects on consumers’ informed medical decision making and clinicians’ evidence‐based practice. However, none of the studies included in this review assessed actual behaviour in response to a message relating to a real life health issue and, thus, we downgraded the quality of evidence for indirectness.
It remains uncertain to what extent the results of these studies using hypothetical scenarios reflect actual behaviours. Context affects the way information is understood and processed (Rohrbaugh 1999), so it is likely that decisions made under hypothetical conditions might differ from real decisions. Nonetheless, there is some evidence that responses made under hypothetical conditions may predict real‐life behaviour (Wiseman 1996). One could argue that the consistency of the results for perceived risk reductions and persuasiveness support a plausible mechanism for actual differences in decisions. This is challenged by the results for understanding not being consistent with those for perception and persuasiveness.
Determining which presentation to use based on this evidence is further complicated by uncertainty about what is 'best'. From the perspective of industry, public health advocates or other advocates of an intervention, RRR might be considered the 'best' presentation. However, from the perspective of those affected, the best presentation would be the one resulting in decisions most consistent with good understanding and their values in the context of the expected utility theory. Only one study (Carling 2009) assessed the effects of alternative presentations on the consistency of decisions with values, and it found no important differences among the different summary statistics.
Nonetheless, the RRR without baseline information (the risk without the intervention) is likely to misinform decisions, particularly when the baseline risk is low, since it is likely to be perceived as an equally large effect whether the absolute effect is very small or very large. For example, an RRR of 50% would be the same given a baseline risk of 1 per 100,000 (ARR = 5 per 1000,000; NNT = 200,000) or 50 per 100 (ARR = 25 per 100; NNT = 4).
Quality of the evidence
About half the comparisons were of cross‐over design. Potentially, the exposure to the first statistical presentation might bias the response to the subsequent presentation. Only 17% of studies reported adequate concealment of allocation. However, it is not clear whether the risk of bias associated with lack of adequate concealment is as significant in trials in which participants are randomized by randomly distributing different versions of a questionnaire (as in most included studies), as it is in studies of therapeutic interventions. The sensitivity analysis excluding studies of lower methodological quality did not substantially alter the results.
The quality of evidence by outcome ‐ based on the GRADE approach ‐ was moderate for the comparison of presentations of risk, and varied from low to moderate (mostly moderate) for the comparisons of presentations of risk reduction. The quality of evidence was mainly affected by the use of surrogate outcomes and inconsistency. The variety of the type of reported data across studies might explain some of the observed heterogeneity. For example, of 18 cross‐over studies, 12 studies reported their results as categorical data while 6 of reported their results as continuous data. Of the latter group, studies reported dispersion around the mean either the SD of the difference of means, the standard deviation by study group or the CI for each group's mean. Another reason for the observed heterogeneity might be the statistical approach we used for dealing with binary data in cross‐over trials. This approach treats the data as if it were coming from parallel group trials and includes the same participants twice. As a result, these trials will have smaller confidence intervals and will receive more weighting in the meta‐analysis than they should.
In some cases, we did not downgrade for inconsistency because the SMD bordered on no to small effects in either direction. In addition, the I2 test is very powerful for SMD; and the robustness of the results with the various analytic methods (fixed‐effect or random‐effects model; risk ratios, risk differences or standardized effects) and the magnitude of the effect (average effect across the included studies was moderate or large) limited our concerns about heterogeneity.
Potential biases in the review process
Our electronic search strategy was designed for the effects of alternative presentations of risk information and not specifically for statistical presentations. We plan on designing a specific strategy for our next update. In addition to using more specific and more adequate search terms, the updated strategy would benefit from widening the scope of searching (eg CINAHL, ERIC, some trial registers and some grey literature). Although our electronic search may not have captured all eligible studies, our additional search strategies were apparently effective. Still, the date of search for this systematic review will be over three years old by the time of its publication.
Because the included studies reported their outcomes using different scales, we had to use SMD to analyze and present our results. We tried to make our results more interpretable by back translating the SMD into a scaled value.
As noted above, our statistical approach for dealing with binary data in cross‐over trials is limited. Since we designed our initial plan of analysis, new statistical methods have become available, and we intend to use them with our next update (Curtin 2002; Elbourne 2002).
Agreements and disagreements with other studies or reviews
Four of the earlier reviews (Edwards 2001; McGettigan 1999; Moxey 2003; Trevena 2006) identified respectively seven, three, four, and two studies comparing RRR versus ARR or NNT. Across these reviews, RRR compared to ARR or NNT was perceived to indicate a larger effect and to persuade participants to adopt the intervention. Covey 2007's systematic review identified 24 articles reporting 31 unique comparisons included in a meta‐analysis. The meta‐analysis pooled together data for different types of outcomes (eg perception, persuasiveness). Overall, treatments were evaluated more favourably when the relative risk format was used rather than the absolute risk or NNT format. Subgroup analyses and a meta‐regression analysis found the greater effect of RRR compared to ARR to be associated with the following factors: the subject groups (there were larger effects for students than physicians and patients); the way the relativity of the effect was worded ("percentage" produced larger effects than "reduce by" or "relative reduction"); baseline risk information (not presenting baseline risk information alongside RRR produced a larger effect), and absolute format (percentage or mixed formats produced larger effects than frequency formats). The authors reported similar patterns of results for RRR versus NNT and acknowledged that the meta‐regression models might have been compromised by the relatively small ratios of outcomes to predictors.
Overall, our results in agreement with those of the above mentioned systematic reviews. While we found larger effects sizes for RRR (over absolute measures) in health professionals compared with health consumers, Covey 2007 reported larger effects in students compared with physicians and patients. This discrepancy is probably related to a number of factors:
the different groupings of studies' participants;
our inclusion of seven additional studies; and
our separate analysis of the outcomes of understanding, perception, and persuasiveness, unlike the analysis by Covey 2007.
Authors' conclusions
Implications for practice.
In deciding how to use the results of this review, one has to be mindful of the uncertainty regarding the effects observed in hypothetical scenarios and whether they will translate into similar effects on actual behaviour. In presenting risks to consumers and clinicians, natural frequencies appear to be a better choice than percentages in the context of diagnostic or screening tests, because they are better understood. Relative risk reduction is perceived to be larger and is more persuasive than absolute risk reduction or number needed to treat. If relative risk reduction is used, the baseline risk or the absolute change in risk should also be presented; otherwise relative risk reduction is likely to misinform decisions, particularly when the baseline risk is low.
Implications for research.
Future research should be conducted in real life settings and address some populations of interest (eg individuals with low numeracy, non English speaking countries), unstudied presentations (eg odds ratio, number needed to treat for an additional harmful outcome), and more relevant outcomes (eg actual behaviour and consistency of decisions with values). There is also a need to improve the methodological quality of studies, specifically through the use of parallel randomized designs (ie avoiding cross‐over design), and the use of objective and validated outcome measures. The use of different baseline risks in the scenarios and the use of different wordings (see Appendix 1) should be explored as an effect modifiers. In future updates of this review, it may be possible to use meta‐regression analyses to explore potential effect modifiers, provided more studies with sufficient data are identified. Experimental research would be the best way to explore those factors that can be manipulated (baseline risk and wording formats) and within study comparisons are more likely to provide robust results for different populations. However, it may be possible to investigate the impact of effect modifiers across studies, if more such studies are undertaken.
Feedback
Feedback from Woloshin and Schwartz; and authors' reply, 26 July 2011
Summary
The Akl Cochrane review (1) of formats for presenting statistical information concluded that natural frequencies are probably better understood than probabilities. We are concerned that this conclusion may mislead readers about how to best represent absolute risks to communicate treatment effects.
The review only included studies in a specialized context: Bayesian probability revisions in diagnostic testing. There were no trials testing these formats in the context far more relevant to decision making: comparing the effects of treatment.
Three trials have tested formats in this context. One trial, missed by the review, found small differences favouring probabilities (2). The second, published after the search, found that comprehension of treatment effects in natural frequencies and probabilities were the same (3). Finally, we published a large randomized trial comparing understanding of percents versus frequencies for comparison groups presented in tables (4). In this trial, conducted in a national US sample, the more succinct probability format resulted in slightly better comprehension overall ‐ and substantially better comprehension for absolute differences.
Until it is updated, we ask that the review's conclusion be revised to clarify that natural frequencies were only shown to be better in the context of interpreting diagnostic test results, and that for communicating the benefits and harms of treatment, the available evidence favours probabilities.
References
Akl EA, Oxman AD, Herrin J, Vist GE, Terrenato I, Sperati F, et al. Using alternative statistical formats for presenting risks and risk reductions. Cochrane Database of Systematic Reviews 2011 (Issue 3). Art. No.: CD006776. DOI: 10.1002/14651858.CD006776.pub2.
Waters EA, Weinstein ND, Colditz G, Emmons K. Formats for improving risk communication in medical tradeoff decisions. Journal of Health Communication 2006;11:167‐82.
Cuite C, Weinstein N, Emmons K, Colditz G. A test of numeric formats for communicating risk probabilities. Medical Decision Making 2008;28:377 ‐84.
Woloshin S, Schwartz LM. Communicating data about the benefits and harms of treatment: A randomized trial. Annals of Internal Medicine 2011;155:87‐96.
Reply
We thank Drs. Woloshin and Schwartz for their feedback.
We agree that the studies included in our systematic review address understanding of diagnostic and screening test results. None of them address the benefits and harms of treatment. We have revised our conclusions to clarify this.
Woloshin and Schwartz correctly refer to Waters 2006 (1) as a trial missed by our search. That study found small differences favouring percentages versus frequencies when presenting the benefits and harms of treatment. However, the outcome measure that was used is the ability to perform relatively complex calculations that require applying treatment effects (expressed as fractions) to frequencies versus percentages. This study would not affect the results of our meta‐analysis related to diagnosis, and does not directly compare frequencies and percentages for presenting treatment effects; i.e. by presenting either frequencies or percentages for both the intervention and control groups.
Woloshin and Schwartz also refer to Cuite 2008 (2) and their own paper, Woloshin 2011 (3). As they point out, these two studies were published after the date of our last search. Cuite 2008 is a second study published by three of the same authors as Waters 2006 and uses a similar outcome measure. As Woloshin and Schwartz point out, the Cuite 2008 study did not find a statistically significant or important difference between frequencies and percentages in this context.
Woloshin 2011 is the only one of the three cited papers that directly compares the use of frequencies versus percentages for presenting treatment effects. We agree with Woloshin and Schwartz that this important new evidence should be incorporated in our review, as should any other new evidence. We have initiated an update of this review, in which we plan to analyse studies focusing on diagnostic and screening test results separately from those focusing on treatment effects. In the meantime we appreciate the opportunity to clarify our conclusions and to bring attention to Woloshin and Schwartz’s recently published trial.
Elie A. Akl
Andrew D. Oxman
Holger J. Schünemann
References
Waters EA, Weinstein ND, Colditz G, Emmons K. Formats for improving risk communication in medical tradeoff decisions. Journal of Health Communication 2006;11:167‐82.
Cuite C, Weinstein N, Emmons K, Colditz G. A test of numeric formats for communicating risk probabilities. Medical Decision Making 2008;28:377‐84.
Woloshin S, Schwartz LM. Communicating data about the benefits and harms of treatment: A randomized trial. Annals of Internal Medicine 2011;155:87‐96.
Contributors
Steven Woloshin, MD, MS
Lisa M. Schwartz, MD, MS
The Dartmouth Institute for Health Policy and Clinical Practice, Lebanon, NH USA
What's new
| Date | Event | Description |
|---|---|---|
| 2 September 2011 | Amended | The review authors have amended the review in response to the feedback. In particular, the conclusions have been changed to reflect the fact that the studies in the review address understanding of diagnostic and screening test results. None of the studies in the review address the benefits and harms of treatment. The review will be updated with a new search in the near future. |
| 29 August 2011 | Feedback has been incorporated | Steven Woloshin and Lisa Schwartz have submitted feedback on this review, which appears at Feedback 1, together with the review authors' response. |
History
Protocol first published: Issue 4, 2007 Review first published: Issue 3, 2011
| Date | Event | Description |
|---|---|---|
| 14 March 2011 | Amended | Minor typographical corrections. |
Acknowledgements
The authors would like to thank Dominique Broclain for his contributions to the protocol for this review; the editors and members of the Cochrane Consumers and Communication Review Group, particularly Sophie Hill and Megan Prictor, for their careful review and editing; Ms. Ann Grifasi for her administrative assistance; and the authors of the primary studies who provided us with missing or supplementary information. They would also like to thank the State University of New York at Buffalo, the Italian National Cancer Institute Regina Elena, the National Institute of Public Health and the Norwegian Research Council for supporting their efforts on this review.
Appendices
Appendix 1. Alternative wordings formats of statistical presentations
Risk:
Percentage: 5%
Probability: 0.05
Rate:1 in 20
Frequency: 50 in 1000
Natural frequencies: Out of each 1000 patients, 40 are infected. Out of 40 infected patients, 30 will test positive. Out of 960 uninfected patients, 120 will also test positive.
Normalized frequencies: Out of each 1000 patients, 40 are infected. Out of 1000 infected patients, 750 will test positive. Out of 1000 uninfected patients, 125 will also test positive.
Absolute risk reduction:
Absolute risk reduction can be presented in one of the following formats:
treatment/control (or pre/post): risk reduced from 10% in group A to 5% in group B
reduction: risk reduced by 5%
control and reduction: reduced by 5% from a baseline of 10%
treatment/control (or pre/post) and reduction: reduced by 5% from 10% in group A to 5% in group B
Risks may be expressed as:
percentage
natural frequency
probability
rate
Relative risk reduction:
Relative risk reduction may be worded as:
Reduced by 50%
Relative reduction of 50%
50% event reduction
Relative risk reduction may be presented:
With baseline risk: 50% risk reduction from a baseline of 10%
Without baseline risk: 50% risk reduction
Appendix 2. Examples of study outcomes classified according to the systematic review typology of outcomes
Understanding
Determining the probability of cancer
Estimating the probability of disease after treatment
Estimating the probability of disease within 5% of the correct one
Estimating the risk of being affected by the flu with and without vaccination
Interpreting risk and benefit information
Stating which treatment is more effective after being presented with statistical data
Perception
Rating of the perceived effectiveness of drug treatment
Rating of the perceived effectiveness of the vaccination
Rating of perceived efficacy on an a scale
Persuasiveness
Endorsement of adjuvant chemotherapy
Hypothetical decision to treat cholesterol
Hypothetical decision to start taking a medication
Intention to prescribe HRT in different clinical scenarios
Intention to begin or continue colorectal cancer screening
Level of support for government funding of new screening programs for breast cancer
Likelihood of agreeing to implement a screening program or a smoking cessation program
Likelihood to fund a mammography program or cardiac rehabilitation program
Likelihood of being vaccinated
Likelihood of starting a drug on a hypothetical patient
Probability of using a medication based on a case scenario
Willingness to fund a cardiac rehabilitation program
Willingness to prescribe a drug
Willingness to recommend medication
Willingness to start a treatment
Willingness to have a test
Willingness to be screened
Preference for treatment for a hypothetical elderly hypertensive patient
Appendix 3. Electronic search strategies
The search used in MEDLINE (starting January 1966) and EMBASE (starting January 1980) was:
1‐randomized controlled trial.pt.
2‐controlled clinical trial.pt.
3‐((random$ or control$) adj5 trial$).mp.
4‐((random$ or control$) adj5 (trial$ or stud$)).mp.
5‐cross?section$.mp.
6‐(cross$ adj section$ adj3 (trial$ or stud$)).mp.
7‐(random$ adj allocat$).mp.
8‐randomized controlled trials/
9‐controlled clinical trials/
10‐cross‐sectional studies/
11‐random$.ti,ab.
12‐1 or 2 or 4 or 5 or 6 or 7 or 8 or 9 or 10 or 11
13‐*Risk/
14‐exp communication barriers/
15‐exp probability learning/
16‐(fram$ adj4 effect$).mp.
17‐(communicat$ adj5 risk$).mp.
18‐((quantit$ or amount) adj2 information).mp.
19‐((way$ or method$ or manner) adj2 (present$ or interpret$ or report$) adj3 (evidence or information or data or results)).mp.
20‐health education.mp.
21‐patient education.mp.
22‐graphic$.mp.
23‐(information$ adj5 display).mp.
24‐(risk adj5 presentation).mp.
25‐13 or 14 or 15 or 16 or 17 or 18 or 19 or 20 or 21or 22.mp. or 23 or 24
26‐12 and 25
In PsycLIT (starting January 1887), we used the same search for intervention type as in Medline and the following search for study type:
1‐randomi#ed controlled trial$.tw.
2‐((singl$ or doubl$ or trebl$ or tripl$) adj3 (blind$ or mask$)).tw.
3‐placebo/
4‐placebo$.tw.
5‐random$.tw.
6‐comparative studies$.tw.
7‐(clin$ adj3 trial$).tw.
8‐1 or 2 or 3 or 4 or 5 or 6 or 7
In addition, we searched MEDLINE, EMBASE and PsycINFO using “framing” as title word (framing.ti).
Appendix 4. Additional results
Alternative presentations of frequency
Grimes 1999 compared different formats of frequency for presenting the risk of Down syndrome at maternal ages of 35 and 40 years, to women attending several university‐affiliated obstetrics and gynecology outpatient clinics in San Francisco. They compared frequency using factors of 10 (2.6 versus 8.9 per 1000 women) versus frequencies using the '1 in x' format (1 in 384 and 1 in 112). The former were easier to understand.
Consistency of decision with values outcome
Only one study (Carling 2009) assessed the effects of alternative presentations of risk reductions on the consistency of decisions (to start statins) with values among adult volunteers who participated through an interactive website. There was a clear relationship between values and the choices participants made across all summary statistics, ie as relative importance scores (RIS) increased, the likelihood of choosing to start statins increased. Consistently with our findings, relative risk reduction (RRR) resulted in 21% more participants deciding to take statins over all values of RIS compared to the absolute summary statistics suggesting that people are more likely to be persuaded when presented with a relative summary statistic regardless of their values.
Providing baseline information
Natter 2005a compared relative with absolute risk formats for presenting the effect of the flu vaccine to the general public. The authors provided the risk information with and without baseline information. In the absence of baseline information, the relative risk format resulted in higher ratings of: satisfaction; perceived effectiveness of vaccination; and likelihood of being vaccinated. However, these differences disappeared when baseline information was presented. Moreover, provision of baseline information resulted in more accurate risk estimates and more positive evaluations of the risk messages.
Sorensen 2008 randomized lay people to receive versus not receive baseline risk along with RRR of a drug to prevent heart attack. They found no significant difference in acceptance rates between the two groups.
Understanding and education
Schwartz 1997a and Schwartz 1997b found understanding to be associated with numeracy in female veterans drawn from a New England registry. Sheridan 2003 had similar findings among patients attending a university internal medicine clinic. Grimes 1999 found that women with little formal education had difficulty understanding risks, irrespective of the form of presentation. Malenka 1993 found subjects with at least some college education were significantly more likely to select the medication with benefit presented in relative terms than were those with less education or not taking any medications.
Postponement of event
Halvorsen 2007 compared number needed to treat (NNT) (“NNT of 13 patients to prevent 1 heart attack”) to equivalent postponements (“postponement of heart attack by 2 months for all patients” or “postponement by 8 months for 1 of 4 patients”) for expressing the treatment effects of a hypothetical therapy to reduce the risk of heart attack. Number needed to treat yielded higher consent rates to receive the therapy than did equivalent postponements. For one of the two scenarios (hip fracture but not heart attack), older people and those with less education had more difficulty understanding the treatment effect in general.
Data and analyses
Comparison 1. Natural frequencies versus percentages.
| Outcome or subgroup title | No. of studies | No. of participants | Statistical method | Effect size |
|---|---|---|---|---|
| 1 Understanding | 7 | Std. Mean Difference (Random, 95% CI) | 0.69 [0.45, 0.93] | |
| 1.1 Health consumers | 5 | Std. Mean Difference (Random, 95% CI) | 0.60 [0.31, 0.88] | |
| 1.2 Health professionals | 2 | Std. Mean Difference (Random, 95% CI) | 0.94 [0.53, 1.34] |
Comparison 2. RRR versus ARR.
| Outcome or subgroup title | No. of studies | No. of participants | Statistical method | Effect size |
|---|---|---|---|---|
| 1 Understanding | 3 | Std. Mean Difference (Random, 95% CI) | 0.02 [‐0.39, 0.43] | |
| 1.1 Health consumers | 3 | Std. Mean Difference (Random, 95% CI) | 0.02 [‐0.39, 0.43] | |
| 2 Perception | 5 | Std. Mean Difference (Random, 95% CI) | 0.41 [0.03, 0.79] | |
| 2.1 Health consumers | 2 | Std. Mean Difference (Random, 95% CI) | 0.44 [‐0.68, 1.57] | |
| 2.2 Health professionals | 3 | Std. Mean Difference (Random, 95% CI) | 0.39 [‐0.04, 0.82] | |
| 3 Persuasiveness | 27 | Std. Mean Difference (Random, 95% CI) | 0.66 [0.51, 0.81] | |
| 3.1 Health consumers | 15 | Std. Mean Difference (Random, 95% CI) | 0.62 [0.42, 0.83] | |
| 3.2 Health professionals | 12 | Std. Mean Difference (Random, 95% CI) | 0.71 [0.49, 0.93] |
Comparison 3. RRR versus NNT.
| Outcome or subgroup title | No. of studies | No. of participants | Statistical method | Effect size |
|---|---|---|---|---|
| 1 Understanding | 1 | Std. Mean Difference (Random, 95% CI) | 0.73 [0.43, 1.04] | |
| 1.1 Health consumers | 1 | Std. Mean Difference (Random, 95% CI) | 0.73 [0.43, 1.04] | |
| 2 Perception | 3 | Std. Mean Difference (Random, 95% CI) | 1.15 [0.80, 1.50] | |
| 2.1 Health professionals | 3 | Std. Mean Difference (Random, 95% CI) | 1.15 [0.80, 1.50] | |
| 3 Persuasiveness | 22 | Std. Mean Difference (Random, 95% CI) | 0.65 [0.51, 0.80] | |
| 3.1 Health consumers | 10 | Std. Mean Difference (Random, 95% CI) | 0.66 [0.46, 0.86] | |
| 3.2 Health professionals | 12 | Std. Mean Difference (Random, 95% CI) | 0.65 [0.42, 0.87] |
3.1. Analysis.
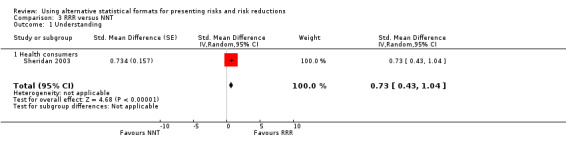
Comparison 3 RRR versus NNT, Outcome 1 Understanding.
Comparison 4. ARR versus NNT.
| Outcome or subgroup title | No. of studies | No. of participants | Statistical method | Effect size |
|---|---|---|---|---|
| 1 Understanding | 1 | Std. Mean Difference (Random, 95% CI) | 0.42 [0.12, 0.71] | |
| 1.1 Health consumers | 1 | Std. Mean Difference (Random, 95% CI) | 0.42 [0.12, 0.71] | |
| 2 Perception | 3 | Std. Mean Difference (Random, 95% CI) | 0.79 [0.43, 1.15] | |
| 2.1 Health professionals | 3 | Std. Mean Difference (Random, 95% CI) | 0.79 [0.43, 1.15] | |
| 3 Persuasiveness | 20 | Std. Mean Difference (Random, 95% CI) | 0.05 [‐0.04, 0.15] | |
| 3.1 Health consumers | 10 | Std. Mean Difference (Random, 95% CI) | 0.05 [‐0.04, 0.14] | |
| 3.2 Health professionals | 10 | Std. Mean Difference (Random, 95% CI) | 0.07 [‐0.10, 0.24] |
4.1. Analysis.
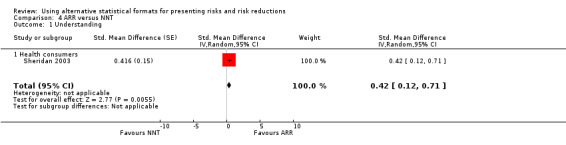
Comparison 4 ARR versus NNT, Outcome 1 Understanding.
Characteristics of studies
Characteristics of included studies [ordered by study ID]
Adily 2004.
| Methods | Cross‐over study; hypothetical outcome. | |
| Participants | 76 population healthcare staff. Participation rate: 73%. |
|
| Interventions | Effectiveness of a colorectal cancer screening program and a smoking cessation program presented as RRR, ARR, NNS/NNT. | |
| Outcomes | Likelihood of agreeing to implement the colorectal cancer screening program and the smoking cessation program (persuasiveness). | |
| Notes | Wording of the scenario appropriate for ARR but not RRR. ARR expressed as percentage. Mismatch between statistics in scenario 1: NNS for ARR of 0.4% should be 250. Scenario 1
(Programme D presented as leading to no reduction in all cause mortality not considered). Scenario 2:
|
|
| Risk of bias | ||
| Bias | Authors' judgement | Support for judgement |
| Allocation concealment (selection bias) | Unclear risk | No details provided. |
| Randomized design? If cross‐over design, order of presentation of the different formats randomized? | Unclear risk | No details provided. |
| Objective outcome? | High risk | |
Bobbio 1994.
| Methods | Cross‐over study; hypothetical outcome. | |
| Participants | 148 general practitioners participating in 6 refresher courses in Italy; 110 male, mean age 47; mean length since graduation 18 years. Participation rate: "about half". |
|
| Interventions | Results of a clinical trial were presented as RRR, ARR, % of event free patients (%EFP), and NNT. | |
| Outcomes | Willingness to prescribe a drug (persuasiveness). | |
| Notes | Wording of the scenario appropriate for ARR but not RRR. Order of different formats randomized. ARR was presented as a percentage reduction. Scenarios: During 5 years follow up, for drug A, a 34% cardiac event reduction was demonstrated (RRR). For drug B an absolute reduction of cardiac events of 1.4% was demonstrated (ARR). For drug C the rate of event‐free patients increased from 95.9% to 97.3% (% EFP). For drug D, 71 patients needed to be treated in order to avoid one cardiac event (NNT). |
|
| Risk of bias | ||
| Bias | Authors' judgement | Support for judgement |
| Allocation concealment (selection bias) | Unclear risk | No details provided. |
| Randomized design? If cross‐over design, order of presentation of the different formats randomized? | Low risk | |
| Objective outcome? | High risk | Hypothetical outcome. |
Bramwell 2006a.
| Methods | Randomized parallel study; objective outcomes. | |
| Participants | 4 groups: 43 pregnant women, 40 of their companions, 42 midwives, and 41 obstetricians. Bramwell 2006a refers to the group of companions. Participation rate: 48% |
|
| Interventions | Positive screening test result presented in percentage or frequency format. | |
| Outcomes | Whether numerical estimate of probability of disease was within 5% of the correct one (understanding). | |
| Notes |
Scenarios: Version 1: The serum test screens pregnant women for babies with Down's syndrome. The test is a very good one, but not perfect. Roughly 1% of babies have Down's syndrome. If the baby has Down's syndrome, there is a 90% chance that the result will be positive. If the baby is unaffected, there is still a 1% chance that the result will be positive. A pregnant woman has been tested and the result is positive. What is the chance that her baby actually has Down's syndrome? ‐...........% (percentages). Version 2: The serum test screens pregnant women for babies with Down's syndrome. The test is a very good one, but not perfect. Roughly 100 babies out of 10 000 have Down's syndrome. Of these 100 babies with Down's syndrome, 90 will have a positive test result. Of the remaining 9900 unaffected babies, 99 will still have a positive test result. How many pregnant women who have a positive result to the test actually have a baby with Down's syndrome?........... out of............ (frequencies). |
|
| Risk of bias | ||
| Bias | Authors' judgement | Support for judgement |
| Allocation concealment (selection bias) | Low risk | In order to randomly assign scenarios to participants, the questionnaires were placed in sealed plain A5 envelopes, which were hand shuffled by the researcher so that the sequence was completely concealed. As respondents were recruited, the researcher took the next envelope from the stack. |
| Randomized design? If cross‐over design, order of presentation of the different formats randomized? | Low risk | |
| Objective outcome? | Low risk | |
Bramwell 2006b.
| Methods | Randomized parallel study; objective outcomes. | |
| Participants | 4 groups: 43 pregnant women, 40 of their companions, 42 midwives, and 41 obstetricians. Bramwell 2006b refers to the group of midwives. Participation rate: 89%. |
|
| Interventions | Positive screening test result presented in percentage or frequency format. | |
| Outcomes | Whether numerical estimate of probability of disease was within 5% of the correct one (understanding). | |
| Notes |
Scenarios: Version 1: The serum test screens pregnant women for babies with Down's syndrome. The test is a very good one, but not perfect. Roughly 1% of babies have Down's syndrome. If the baby has Down's syndrome, there is a 90% chance that the result will be positive. If the baby is unaffected, there is still a 1% chance that the result will be positive. A pregnant woman has been tested and the result is positive. What is the chance that her baby actually has Down's syndrome? ‐...........% (percentages). Version 2: The serum test screens pregnant women for babies with Down's syndrome. The test is a very good one, but not perfect. Roughly 100 babies out of 10 000 have Down's syndrome. Of these 100 babies with Down's syndrome, 90 will have a positive test result. Of the remaining 9900 unaffected babies, 99 will still have a positive test result. How many pregnant women who have a positive result to the test actually have a baby with Down's syndrome?........... out of............ (frequencies). |
|
| Risk of bias | ||
| Bias | Authors' judgement | Support for judgement |
| Allocation concealment (selection bias) | Low risk | In order to randomly assign scenarios to participants, the questionnaires were placed in sealed plain A5 envelopes, which were hand shuffled by the researcher so that the sequence was completely concealed. As respondents were recruited, the researcher took the next envelope from the stack. |
| Randomized design? If cross‐over design, order of presentation of the different formats randomized? | Low risk | |
| Objective outcome? | Low risk | |
Bramwell 2006c.
| Methods | Randomized parallel study; objective outcomes. | |
| Participants | 4 groups: 43 pregnant women, 40 of their companions, 42 midwives, and 41 obstetricians. Bramwell 2006c refers to the group of obstetricians. Participation rate: 71%. |
|
| Interventions | Positive screening test result presented in percentage or frequency format. | |
| Outcomes | Whether numerical estimate of probability of disease was within 5% of the correct one (understanding). | |
| Notes |
Scenarios: Version 1: The serum test screens pregnant women for babies with Down's syndrome. The test is a very good one, but not perfect. Roughly 1% of babies have Down's syndrome. If the baby has Down's syndrome, there is a 90% chance that the result will be positive. If the baby is unaffected, there is still a 1% chance that the result will be positive. A pregnant woman has been tested and the result is positive. What is the chance that her baby actually has Down's syndrome? ‐...........% (percentages) Version 2: The serum test screens pregnant women for babies with Down's syndrome. The test is a very good one, but not perfect. Roughly 100 babies out of 10 000 have Down's syndrome. Of these 100 babies with Down's syndrome, 90 will have a positive test result. Of the remaining 9900 unaffected babies, 99 will still have a positive test result. How many pregnant women who have a positive result to the test actually have a baby with Down's syndrome?........... out of............ (frequencies). |
|
| Risk of bias | ||
| Bias | Authors' judgement | Support for judgement |
| Allocation concealment (selection bias) | Low risk | In order to randomly assign scenarios to participants, the questionnaires were placed in sealed plain A5 envelopes, which were hand shuffled by the researcher so that the sequence was completely concealed. As respondents were recruited, the researcher took the next envelope from the stack. |
| Randomized design? If cross‐over design, order of presentation of the different formats randomized? | Low risk | |
| Objective outcome? | Low risk | |
Bramwell 2006d.
| Methods | Randomized parallel study; objective outcomes. | |
| Participants | 4 groups:43 pregnant women, 40 of their companions, 42 midwives, and 41 obstetricians. Bramwell 2006d refers to the group of pregnant women. Participation rate: 54%. |
|
| Interventions | Positive screening test result presented in percentage or frequency format. | |
| Outcomes | Whether numerical estimate of probability of disease was within 5% of the correct one (understanding). | |
| Notes |
Scenarios: Version 1: The serum test screens pregnant women for babies with Down's syndrome. The test is a very good one, but not perfect. Roughly 1% of babies have Down's syndrome. If the baby has Down's syndrome, there is a 90% chance that the result will be positive. If the baby is unaffected, there is still a 1% chance that the result will be positive. A pregnant woman has been tested and the result is positive. What is the chance that her baby actually has Down's syndrome? _______% (percentages). Version 2: The serum test screens pregnant women for babies with Down's syndrome. The test is a very good one, but not perfect. Roughly 100 babies out of 10 000 have Down's syndrome. Of these 100 babies with Down's syndrome, 90 will have a positive test result. Of the remaining 9900 unaffected babies, 99 will still have a positive test result. How many pregnant women who have a positive result to the test actually have a baby with Down's syndrome? _____ out of____ (frequencies). |
|
| Risk of bias | ||
| Bias | Authors' judgement | Support for judgement |
| Allocation concealment (selection bias) | Low risk | In order to randomly assign scenarios to participants, the questionnaires were placed in sealed plain A5 envelopes, which were hand shuffled by the researcher so that the sequence was completely concealed. As respondents were recruited, the researcher took the next envelope from the stack. |
| Randomized design? If cross‐over design, order of presentation of the different formats randomized? | Low risk | |
| Objective outcome? | Low risk | |
Brotons 2002.
| Methods | Randomized parallel study; self reported and hypothetical outcomes. | |
| Participants | 559 cardiologists excluding paediatric cardiologists and cardiovascular surgeons. Participation rate: 40%. |
|
| Interventions | Results of randomized controlled trials and a meta‐analysis of primary and secondary cardiovascular prevention were presented as RRR, ARR, or NNT. Each participant was presented with five scenarios. | |
| Outcomes | Perception of treatment efficacy on a Likert scale (perception). Probability of using a medication based on a case scenario (persuasiveness). | |
| Notes | Wording of the scenario appropriate for ARR and RRR. Presentation of effect estimates were accompanied by the statement "These results are statistically significant with a confidence interval...". ARR was reported as a frequency and not a percentage reduction. Scenarios: QUESTIONNAIRE A. According to the results of a primary prevention study, hypolipaemic drugs cause a relative reduction in the risk of non fatal infarction or coronary death in 31% of patients. (RRR) QUESTIONNAIRE B. According to the results of a study of primary prevention, acetylsalicylic acid prevents 9 cases of myocardial infarct for every 1000 patients treated over a 5‐year period. (ARR) QUESTIONNAIRE C. According to the results of a study of primary prevention in 108 patients over 5 years, treatment with acetylsalicylic acid is necessary to avoid acute myocardial infarction. (NNT) |
|
| Risk of bias | ||
| Bias | Authors' judgement | Support for judgement |
| Allocation concealment (selection bias) | Unclear risk | No details provided. |
| Randomized design? If cross‐over design, order of presentation of the different formats randomized? | Low risk | |
| Objective outcome? | High risk | Self reported and hypothetical outcomes. |
Bucher 1994.
| Methods | Randomized parallel study (for RRR and ARR but not NNT); self reported and hypothetical outcomes. | |
| Participants | 409 internists and general practitioners in Switzerland. Participation rate: 62%. |
|
| Interventions | Results of a clinical trial (cardiovascular primary prevention) for 3 endpoints were presented as RRR or ARR. Then both group received the results presented as NNT. | |
| Outcomes | The effectiveness of drug treatment was rated on an 11 point scale (perception). The likelihood of starting treatment with the drug on a hypothetical patient (persuasiveness). | |
| Notes | Wording of the scenario appropriate for ARR and RRR. The presentation of the effects estimates were accompanied by statements on whether the result was statistically significant or not. ARR was reported as a frequency and not a percentage reduction. Scenarios: Questionnaire A. A cholesterol lowering drug treatment reduces the relative risk of a fatal and non‐fatal myocardial infarction by 34%. (RRR) Questionnaire B. A cholesterol lowering drug treatment reduces the incidence of fatal and non‐fatal myocardial infarction by 14 per 1000 patients and five years of treatment. (ARR) During a cholesterol lowering drug treatment 71 patients have to be treated for five years to prevent on fatal or non‐fatal myocardial infarction. (NNT) |
|
| Risk of bias | ||
| Bias | Authors' judgement | Support for judgement |
| Allocation concealment (selection bias) | Unclear risk | No details provided. |
| Randomized design? If cross‐over design, order of presentation of the different formats randomized? | Low risk | |
| Objective outcome? | High risk | Self reported and hypothetical outcomes. |
Carling 2008.
| Methods | Internet‐based randomized controlled trial, hypothetical outcome. | |
| Participants | 770 Internet users. Very low participation rate (782 out of about 700,000 invited). |
|
| Interventions | Information about CHD risk reduction associated with statin use presented as RRR, ARR, NNT, event rates, tablets needed to take, and natural frequencies. | |
| Outcomes | Decision to start taking statins (persuasiveness). Consistency of decision with values. |
|
| Notes | Wording of the scenario appropriate for ARR but not RRR. ARR reported as a percentage reduction. Scenarios: Among those who take the pills, there will be a 33% reduced risk of heart disease during the next 10 years.(RRR) Among those who take the pills, there will be a 2% absolute reduction in the risk of getting heart disease during the next 10 years. (ARR) Among 50 people who take the pills for the next 10 years, there will be one additional person who will not get heart disease during that time. (NNT) Among those who take the pills, the risk of getting heart disease during the next 10 years will be reduced from 6% to 4%. (Event rates) Among 50 people that take the pills for the next 10 years, they will swallow a total of 182,500 pills and there will be one additional person who will not get heart disease during that time.(Tables needed to take) Among 100 people that do not take the pills, 94 will not get heart disease and 6 will get heart disease during the next 10 years. It is not possible to say whether you would be one of the 94 or one of the 6. Among 100 people that do take the pills, 96 will not get heart disease and 4 will get heart disease during the next 10 years. Again, it is not possible to say whether you would be one of the 96 or one of the 4. (natural frequency) |
|
| Risk of bias | ||
| Bias | Authors' judgement | Support for judgement |
| Allocation concealment (selection bias) | Low risk | Randomization part of the automatic process of logging on to the survey website. |
| Randomized design? If cross‐over design, order of presentation of the different formats randomized? | Low risk | |
| Objective outcome? | High risk | Hypothetical outcome. |
Carling 2009.
| Methods | Internet‐based randomized controlled trial, hypothetical outcome. | |
| Participants | 2,978 Internet users. Very low participation rate (2,978 out of hundreds of thousands invited). |
|
| Interventions | Information about CHD risk reduction associated with statin use presented as RRR, ARR, NNT, event rates, tablets needed to take, and natural frequencies. | |
| Outcomes | Decision to start taking statins (persuasiveness). Consistency of decision with values. |
|
| Notes | Wording of the scenario appropriate for ARR but not RRR. ARR reported as a percentage reduction. We did not include one the comparisons comparing natural frequencies and event rates (probabilities) for persuasiveness to start a medication because the scenario for natural frequencies was framed both positively and negatively while the probabilities scenario was framed only positively. Scenarios: Among those who take the pills, there will be a 33% reduced risk of heart disease during the next 10 years.(RRR) Among those who take the pills, there will be a 2% absolute reduction in the risk of getting heart disease during the next 10 years. (ARR) Among 50 people who take the pills for the next 10 years, there will be one additional person who will not get heart disease during that time. (NNT) Among those who take the pills, the risk of getting heart disease during the next 10 years will be reduced from 6% to 4%. (Event rates) Among 50 people that take the pills for the next 10 years, they will swallow a total of 182,500 pills and there will be one additional person who will not get heart disease during that time.(Tables needed to take) Among 100 people that do not take the pills, 94 will not get heart disease and 6 will get heart disease during the next 10 years. It is not possible to say whether you would be one of the 94 or one of the 6. Among 100 people that do take the pills, 96 will not get heart disease and 4 will get heart disease during the next 10 years. Again, it is not possible to say whether you would be one of the 96 or one of the 4. (Natural frequency) |
|
| Risk of bias | ||
| Bias | Authors' judgement | Support for judgement |
| Allocation concealment (selection bias) | Low risk | Randomization part of the automatic process of logging on to the survey website. |
| Randomized design? If cross‐over design, order of presentation of the different formats randomized? | Low risk | |
| Objective outcome? | High risk | Hypothetical outcome. |
Chao 2003.
| Methods | Randomized parallel study; subjective and objective outcomes. | |
| Participants | 203 first‐ and second‐year medical students. Participation rate not reported. |
|
| Interventions | Benefit of chemotherapy for a patient with breast cancer presented as RRR, ARR, NNT or Absolute Survival Benefit (ASB). Each participant was randomized to one of these 4 presentations. Each participant received 2 scenarios with 2 different tumour sizes and was randomized to the order of scenario presentation. | |
| Outcomes | Endorsement of adjuvant chemotherapy (persuasiveness). Correct interpretation of the risk and benefit information (understanding). |
|
| Notes | Wording of the scenario appropriate for ARR and RRR. ASB is an ARR with mortality expressed as survival. ARR and ASB reported as a percentage reduction. ARR and RRR scenarios were both framed positively (reduction of the risk of death). NNT and ASB scenarios were both framed positively (increase of the chance of survival). To avoid the risk of confounding, we compared ARR to RRR and, separately, NNT to ASB. Because of the way it is reported, data for understanding could not be pooled with that of other studies. Scenarios: With your mother’s treatment of surgery and Tamoxifen, her risk of dying in the next ten years is 15%. This means that out of 100 people with conditions similar to hers, 15 will die in the next ten years (baseline risk). By adding chemotherapy to her treatment she can reduce her relative risk of death in the next ten years by 12% (RRR). By adding chemotherapy to her treatment she can reduce the risk of death in the next ten years by 2% (from 15% to 13%) (ARR) |
|
| Risk of bias | ||
| Bias | Authors' judgement | Support for judgement |
| Allocation concealment (selection bias) | Unclear risk | No details provided. |
| Randomized design? If cross‐over design, order of presentation of the different formats randomized? | Low risk | Only data from Part 1 used (Part 2, no randomization). |
| Objective outcome? | Low risk | |
Cranney 1996.
| Methods | Cross‐over study; hypothetical outcome. | |
| Participants | 73 general practitioners attending a refresher course in the UK. Participation rate: 100%. |
|
| Interventions | Results of a clinical trial were presented as RRR, ARR, % of event free patients (%EFP) pre and post, and NNT. The effect estimates relate to rates and not risks. | |
| Outcomes | Treatment preference (Likert scale) for a hypothetical elderly hypertensive patient (persuasiveness). | |
| Notes | Wording of the scenario appropriate for ARR but not RRR. Order of different formats randomized. ARR presented as percentage reduction with pre and post intervention rates provided. Scenarios: Drug A: Patients receiving drug A had 3.65 strokes per 100 patients over 5 years. The placebo group had 5.4 strokes (P = 0.03). This means drug A produced a 1.75% absolute reduction in the number of strokes over a 5‐year period. (ARR) Drug B: Patients on drug B had 32.4% fewer strokes over the trial period of five years compared with the placebo group (P = 0.03). (RRR) Drug C: Over 5 years, the rate of 'stroke free' patients increased from 94.6% to 96.35% by virtue of taking drug C (P = 0.03). (%EFP) Drug D: It is calculated that, compared with the placebo, you would need to treat 57 patients with drug D for 5 years to avoid one stroke. (NNT) |
|
| Risk of bias | ||
| Bias | Authors' judgement | Support for judgement |
| Allocation concealment (selection bias) | Unclear risk | No details provided |
| Randomized design? If cross‐over design, order of presentation of the different formats randomized? | Low risk | Order of different formats randomized. |
| Objective outcome? | High risk | Hypothetical outcome. |
Damur 2000.
| Methods | Cross‐over trial, no randomization of the order of presentation of the different formats. | |
| Participants | 139 4th‐year medical students, 129 6th‐year medical students, 119 physicians attending a continuing education course and 30 physicians attending an EBM course (before and after) Participation rate: not reported. |
|
| Interventions | Presentation of the benefits of three medications (that actually have the same benefit), as ARR, RRR and NNT and percentage of those not having an event in the two groups respectively. | |
| Outcomes | Selecting the medication for therapy (persuasiveness). | |
| Notes | Wording of the scenario appropriate for ARR but not RRR. Order of different formats not randomized. ARR presented as percentage. Scenarios: Helskinki heart study over five years of study: Medication 1 caused a 34% risk reduction in cardiac events (RRR); medication 2 caused an absolute risk reduction of cardiac events of 1.4 (ARR)%; medication 3 required treatment of 371 patients for 5 years to prevent one cardiac event; with medication 4 (NNT), the number of patients without cardiac event increased from 95.9% to 97.3%. |
|
| Risk of bias | ||
| Bias | Authors' judgement | Support for judgement |
| Allocation concealment (selection bias) | High risk | |
| Randomized design? If cross‐over design, order of presentation of the different formats randomized? | High risk | |
| Objective outcome? | High risk | |
Davey 2005.
| Methods | Cross‐over study; hypothetical outcome. | |
| Participants | 109 women recruited from general practices in Sydney. Participation rate: 91%. |
|
| Interventions | Effectiveness of mammography screening (reduction of mortality) expressed as RRR and ARR. | |
| Outcomes | Willingness to have the test (persuasiveness). | |
| Notes | Wording of the scenario appropriate for ARR but not RRR. ARR expressed as a frequency; baseline risk provided. The amount of information varied by scenario (more information provided in ARR scenario). Scenarios: Having this test every two years will reduce your chance of dying from breast cancer by about 34% over a 10‐year period (RRR). If we imagine 1000 women at the moment aged between 50 and 69 years, the chances are that 6 of these women will die from breast cancer. This means that the odds of dying from breast cancer are 6 in 1000. With this new screening test, the odds change. Of 1000 women all having this new test every two years, instead of 6 women dying, the chances are that 4 women will die from breast cancer. This means the odds have been reduced to 4 in a 1000. This means that 2 fewer women will die from breast cancer for every 1000 women who have this test. (ARR) |
|
| Risk of bias | ||
| Bias | Authors' judgement | Support for judgement |
| Allocation concealment (selection bias) | Unclear risk | No details provided. |
| Randomized design? If cross‐over design, order of presentation of the different formats randomized? | Unclear risk | No details provided. |
| Objective outcome? | High risk | |
Fahey 1995.
| Methods | Cross‐over study; hypothetical outcome. | |
| Participants | 137 executive and non‐executive members of health authorities, family health services authorities, and health commissions in Anglia and Oxford. Participation rate: 75%. |
|
| Interventions | Results of a randomized controlled trial and a systematic review were presented as RRR, ARR, % of event free patients (%EFP) pre and post, and NNT. | |
| Outcomes | Likelihood to fund a mammography program or cardiac rehabilitation program (persuasiveness). | |
| Notes | Wording of the scenario appropriate for ARR but not RRR. Order of different formats not randomized. ARR presented as a percentage reduction. Scenarios: During a seven year follow up:
|
|
| Risk of bias | ||
| Bias | Authors' judgement | Support for judgement |
| Allocation concealment (selection bias) | High risk | Not applicable. |
| Randomized design? If cross‐over design, order of presentation of the different formats randomized? | High risk | |
| Objective outcome? | High risk | Hypothetical outcome. |
Forrow 1992a.
| Methods | Cross‐over study; hypothetical outcome. | |
| Participants | 113 practicing physicians and faculty and fellows in training programs in clinical epidemiology and social science research methods attending educational conferences in the US. Participation rate: varied from 30% to 75%. |
|
| Interventions | Results from a published study on the treatment of hypertension where two questions reported the same study results as RRR or ARR. | |
| Outcomes | Hypothetical decision to treat cholesterol (persuasiveness) | |
| Notes | Wording of the scenario appropriate for ARR and RRR. Order of different formats randomized. ARR presented as percentage reduction with pre and post intervention percentages provided. Scenarios: Hypercholesterolemia summaries: The death rate from coronary heart disease after 7 years was found to be 2.0% in the group given the placebo and 1.6% in the group given the drug, a reduction in the death rate from coronary heart disease of 0.4%. (ARR) A statistically significant 24% relative reduction in the rate of death from coronary heart disease over 7 years. (RRR) |
|
| Risk of bias | ||
| Bias | Authors' judgement | Support for judgement |
| Allocation concealment (selection bias) | Unclear risk | No details provided. |
| Randomized design? If cross‐over design, order of presentation of the different formats randomized? | Low risk | |
| Objective outcome? | High risk | Hypothetical outcome. |
Forrow 1992b.
| Methods | Cross‐over study; hypothetical outcome. | |
| Participants | 122 practicing physicians and faculty and fellows in training programs in clinical epidemiology and social science research methods in the US. Participation rate varied from 30% to 75%. |
|
| Interventions | Results from a published study on the treatment of hypercholesterolaemia where two questions reported the same study results as RRR or ARR. | |
| Outcomes | Hypothetical decision to treat hypertension (persuasiveness). | |
| Notes | Wording of the scenario appropriate for ARR and RRR. Order of different formats randomized. ARR presented as percentage reduction with pre and post intervention percentages provided. Scenarios: Hypertension summaries: the drug treatment regimen used reduced overall mortality of the 5 years of the study from 7.8% in the 'usual care' control group to 6.3%, a statistically significant reduction in total mortality of 1.5% over those 5 years. (ARR) A 'special' program of pharmacologic treatment reduced the overall mortality rate by 20.3% compared with that in the control group of men who received usual medical care. (RRR) |
|
| Risk of bias | ||
| Bias | Authors' judgement | Support for judgement |
| Allocation concealment (selection bias) | Unclear risk | No details provided. |
| Randomized design? If cross‐over design, order of presentation of the different formats randomized? | Low risk | |
| Objective outcome? | High risk | Hypothetical outcome. |
Gigerenzer 1996.
| Methods | Cross‐over study; objective outcome. | |
| Participants | 48 physicians (average of 14 years of experience) in German university hospitals, private or public hospitals, and private practice. Participation rate: not reported. |
|
| Interventions | Four diagnostic problems with information about risk presented as probability in 2 cases and as frequency in 2 cases. | |
| Outcomes | Whether numerical estimate of probability of disease was within 5% of the correct ones (understanding). | |
| Notes | Order of different formats and of the problems randomized. Scenarios: The probability that one of these women has breast cancer is 1%. If a woman has breast cancer, the probability is 80% that she will have a positive mammography test. If a woman does not have breast cancer, the probability is 10% that she will still have a positive mammography test. Imagine a woman (aged 40 to 50, no symptoms) who has a positive mammography test in you breast cancer screening. What is the probability that she actually has breast cancer?_____% (percentage). Ten out of every 1,000 women have breast cancer. Of these 10 women with breast cancer, 8 will have a positive mammography test. Of the remaining 990 women without breast cancer, 99 will still have a positive mammography test. Imagine a sample of women (aged 40 to 50, no symptoms) who have positive mammography tests in you breast cancer screening. How many of these women do actually have breast cancer?_____out of_____ (frequency). |
|
| Risk of bias | ||
| Bias | Authors' judgement | Support for judgement |
| Allocation concealment (selection bias) | Unclear risk | Unclear. Not reported. |
| Randomized design? If cross‐over design, order of presentation of the different formats randomized? | Low risk | |
| Objective outcome? | Low risk | |
Heller 2004.
| Methods | Cross‐over study; hypothetical outcome. | |
| Participants | 156 physicians in the UK. Participation rate: estimated to be 77%. |
|
| Interventions | Presentation of the benefit of beta‐blockers in CHF as RRR or NNT. | |
| Outcomes | Willingness to start treatment (persuasiveness). | |
| Notes | Wording of the scenario not appropriate for RRR. Not clear whether order of different formats randomized. Scenarios: Treating 37 patients with heart failure will save one life. (NNT) Treating patients with heart failure will reduce mortality by 34 %. (RRR) |
|
| Risk of bias | ||
| Bias | Authors' judgement | Support for judgement |
| Allocation concealment (selection bias) | Unclear risk | No details provided. |
| Randomized design? If cross‐over design, order of presentation of the different formats randomized? | Unclear risk | No details provided. |
| Objective outcome? | High risk | Hypothetical outcome. |
Hux 1995.
| Methods | Cross‐over study; hypothetical outcome. | |
| Participants | 100 outpatients of the family practice, hypertension and cardiology services at Sunnybrook Health Science Center; age between 35 and 65. Participation rate not reported. |
|
| Interventions | Presentation of the results of a hypercholesterolaemia RCT as either RRR, ARR or NNT. Also presentation of the results of a hypertension RCT as either RRR or ARR. | |
| Outcomes | Decision whether or not to take the medication (persuasiveness). | |
| Notes | Wording of the scenario appropriate for ARR but not RRR. Order of different formats not randomized. ARR presented as percentage reduction with pre and post intervention percentages provided. Scenarios: Persons in the group treated with this medicine had 34% fewer heart attacks than the non‐treated group. (RRR) If 71 people took it for an average of just over 5 years, the medicine would prevent one of the 71 from having a heart attack. Two people of the 71 would have heart attacks. (NNT) It was found that 2.5%of the people who took the cholesterol medicine had a heart attack compared to 3.9% of those people who did not take it‐‐a difference of 1.4%. (ARR) |
|
| Risk of bias | ||
| Bias | Authors' judgement | Support for judgement |
| Allocation concealment (selection bias) | High risk | Not applicable. |
| Randomized design? If cross‐over design, order of presentation of the different formats randomized? | High risk | |
| Objective outcome? | High risk | Hypothetical outcome. |
Kurzenhäuser 2002.
| Methods | Randomized parallel study; objective outcome. | |
| Participants | 208 medical students in their second and third semesters, in an obligatory all‐day course on human genetics at the Free University of Berlin. Participation rate: low. |
|
| Interventions | Participants were presented with scenarios using either frequencies or probabilities (pre‐test consisted of a Down’s problem already mentioned. The post‐test also consisted of either a problem on mammography or a genetic test for diabetes). | |
| Outcomes | Whether estimate of the positive predictive value was in a range of plus/minus 5% of the correct solution (pre‐test at the beginning of training session and post‐test two months later) (understanding) | |
| Notes |
Scenarios: The probability that a pregnant woman will give birth to a child with Down’s syndrome is 0.15% [prevalence]. If a woman is pregnant with a child who has Down’s syndrome, the probability that the ultrasound test on nuchal translucency shows positive is 80% [sensitivity]. If the woman is pregnant with a child who does not have Down’s syndrome, the probability that the ultrasound test still shows positive is 8% [false alarm rate, ie the complement of the specificity].What is the probability that a woman is pregnant with a child who has Down’s syndrome, given a positive ultrasound test [positive predictive value]? (percentage) Out of 10,000 pregnant women, 15 will give birth to a child with Down’s syndrome. Out of these 15 women, 12 will receive a positive result from the ultrasound test on nuchal translucency. Out of the 9985 women who are pregnant with a child that does not have Down’s syndrome, 799 will receive a positive ultrasound test. Imagine a new sample of pregnant women who receive a positive result in the ultrasound test: How many are actually pregnant with a child who has Down’s syndrome?” (frequency) |
|
| Risk of bias | ||
| Bias | Authors' judgement | Support for judgement |
| Allocation concealment (selection bias) | Unclear risk | No details provided. |
| Randomized design? If cross‐over design, order of presentation of the different formats randomized? | Low risk | |
| Objective outcome? | Low risk | |
Lacy 2001.
| Methods | Cross‐over study; hypothetical outcome. | |
| Participants | 289 physicians in practice or in training and 111 practicing pharmacists or pharmacy students; 62% Americans and 38% Europeans. Participation rate: estimated to be >90%. |
|
| Interventions | Results from a trial were presented using RRR, ARR, increase in life expectancy, and NNT. | |
| Outcomes | Willingness to prescribe (persuasiveness). | |
| Notes | Wording of the scenario appropriate for ARR and RRR. Order of different formats randomized. ARR presented as percentage reduction. Scenarios: Drug B: In the patients receiving drug B there is a 15.2% relative reduction in total mortality compared with placebo. (RRR) Drug D: To prevent one death compared with placebo, 36 patients have to be treated with drug D. (NNT) Drug E: For patients randomized to drug E, the estimated life expectancy is increased 2.7 years compared with placebo (increase in life expectancy) Drug F: Subjects randomized to drug F have a 2.8% absolute reduction in mortality compared with placebo. (ARR) |
|
| Risk of bias | ||
| Bias | Authors' judgement | Support for judgement |
| Allocation concealment (selection bias) | Unclear risk | No details provided. |
| Randomized design? If cross‐over design, order of presentation of the different formats randomized? | Low risk | |
| Objective outcome? | High risk | Hypothetical outcome. |
Loewen 1999.
| Methods | Cross‐over study; hypothetical outcome. | |
| Participants | 50 hospital pharmacists attending a continuing education event. Participation rate: not reported. |
|
| Interventions | Results from a RCT of treatment of isolated systolic hypertension were presented as either RRR, ARR or NNT. | |
| Outcomes | Willingness to prescribe (persuasiveness). | |
| Notes | Appropriateness of wording of the scenario for ARR and RRR: not clear. Not clear whether order of different formats randomized. ARR presented as percentage reduction. Scenarios: Not provided. |
|
| Risk of bias | ||
| Bias | Authors' judgement | Support for judgement |
| Allocation concealment (selection bias) | Unclear risk | No details provided. |
| Randomized design? If cross‐over design, order of presentation of the different formats randomized? | Unclear risk | No details provided. |
| Objective outcome? | High risk | Hypothetical outcome. |
Malenka 1993.
| Methods | Cross‐over study; hypothetical outcome. | |
| Participants | 470 patients from the outpatient practice of an academic general internal medicine group in rural New Hampshire, USA. Participation rate: 92%. | |
| Interventions | Presentation of the benefits of two equally efficacious medications for a hypothetical serious disease stated as RRR or ARR. | |
| Outcomes | Hypothetical treatment choice (persuasiveness). | |
| Notes | Wording of the scenario appropriate for ARR but not RRR. Order of different formats not randomized. ARR presented as frequency. Scenarios: Medication A: If you take this medication it will decrease your risk of dying by 80% (four fifths) over the next year. Medication B: If 100 people with the disease, like you, take this medication 8 deaths can be prevented over the next year. |
|
| Risk of bias | ||
| Bias | Authors' judgement | Support for judgement |
| Allocation concealment (selection bias) | High risk | Not applicable. |
| Randomized design? If cross‐over design, order of presentation of the different formats randomized? | High risk | |
| Objective outcome? | High risk | Hypothetical scenario. |
Mellers 1999.
| Methods | Randomized parallel study; objective outcome. | |
| Participants | 248 undergraduate students at the University of California, Berkeley taking psychology courses. Participation rate: not reported. |
|
| Interventions | A problem presenting information about risks of breast cancer presented as natural frequencies or probabilities. | |
| Outcomes | Correct answer to determining probability of cancer (understanding). | |
| Notes |
Scenarios: The probability of breast cancer is 1% for a woman at age 40 who participates in routine screening. The probability is 80% that a woman with breast cancer will get a positive mammography. The probability is 9.6% that a woman without breast cancer will get a positive mammography. A woman at age 40 has a positive mammography in a routine screening. What is the probability that she actually has breast cancer? (percentage) The frequency of breast cancer is 10 out of every 1,000 women at age 40 who participate in routine screening. Eight out of every 10 women with breast cancer will get positive mammographies. 95 out of every 990 women without breast cancer will get positive mammographies. Here is a new representative sample of women at age 40 who got positive mammographies in routine screening. How many of them actually have breast cancer? (Frequency) |
|
| Risk of bias | ||
| Bias | Authors' judgement | Support for judgement |
| Allocation concealment (selection bias) | Unclear risk | No details provided. |
| Randomized design? If cross‐over design, order of presentation of the different formats randomized? | Low risk | |
| Objective outcome? | Low risk | Understanding. |
Misselbrook 2001.
| Methods | Cross‐over study; hypothetical outcome. | |
| Participants | 89 hypertensive patients and 187 normotensive patients aged 35 to 64 years from a practice in south London. Participation rate: 89%. |
|
| Interventions | Presentation of the probability of benefit of a medication for a hypothetical 'Stroke Prediction Factor 2' stated as RRR ARR or NNT. | |
| Outcomes | Willingness to choose the treatment (persuasiveness). | |
| Notes | Wording of the scenario appropriate for ARR but not RRR. Not clear whether order of different formats randomized. ARR presented as rates with pre and post intervention rates provided. Conversion between NNT and ARR not accurate: NNT should be 935 for ARR of 0.107%. Scenarios: Would you take the pills described above if they reduced your risk of having a stroke by 45%? (RRR) What if you were unlikely to have a stroke, so that it worked out that in a year you would have only a 1 in 400 chance of having a stroke, but the pills could reduce this to a 1 in 700 chance? Would you take the pills? (ARR) If the doctor had to treat 35 patients for 25 years in order to prevent one stroke, do you think it would be worth taking the treatment yourself? (NNT) |
|
| Risk of bias | ||
| Bias | Authors' judgement | Support for judgement |
| Allocation concealment (selection bias) | Unclear risk | No details provided. |
| Randomized design? If cross‐over design, order of presentation of the different formats randomized? | Unclear risk | No details provided. |
| Objective outcome? | High risk | Hypothetical outcome. |
Natter 2005a.
| Methods | Factorial design RCT; hypothetical outcome. | |
| Participants | 110 people from the general public. Participation rate: 98%. |
|
| Interventions | Reduction in the risk of being affected by the flu with the flu vaccine communicate either in relative or absolute terms, without the communication of the baseline risk. | |
| Outcomes | Likelihood of being vaccinated (persuasiveness). Perceived effectiveness of the vaccination (perception). Numerical estimates of the risk of being affected by the flu with and without vaccination (understanding). |
|
| Notes | Wording of the scenario not appropriate for ARR or RRR. ARR presented as percentage. No baseline risk provided. Data for understanding not appropriate for meta‐analysis. Scenarios: With vaccination, the risk of being affected by the flu is 5% lower (ARR). With vaccination, the risk of being affected by the flu is reduced by 50% (RRR). |
|
| Risk of bias | ||
| Bias | Authors' judgement | Support for judgement |
| Allocation concealment (selection bias) | Unclear risk | No details provided. |
| Randomized design? If cross‐over design, order of presentation of the different formats randomized? | Low risk | |
| Objective outcome? | High risk | Understanding is objective however related data not used in meta‐analysis. |
Natter 2005b.
| Methods | Factorial design RCT; objective and hypothetical outcomes. | |
| Participants | 110 people from the general public. Participation rate: 98%. |
|
| Interventions | Reduction in the risk of being affected by the flu with the flu vaccine communicate either in relative or absolute terms, with the communication of the baseline risk. | |
| Outcomes | Likelihood of being vaccinated (persuasiveness). Perceived effectiveness of the vaccination (perception). Numerical estimates of the risk of being affected by the flu with and without vaccination (understanding). |
|
| Notes | Wording of the scenario appropriate for ARR but not RRR. ARR presented as percentage. Baseline risk provided. Data for understanding not appropriate for meta‐analysis. Scenarios: It is predicted that 10% of the adult population (ie 10 out of every 100 adults) will be affected by the flu (baseline risk). With vaccination, the risk of being affected by the flu is 5% lower (ARR). With vaccination, the risk of being affected by the flu is reduced by 50% (RRR). |
|
| Risk of bias | ||
| Bias | Authors' judgement | Support for judgement |
| Allocation concealment (selection bias) | Unclear risk | No details provided. |
| Randomized design? If cross‐over design, order of presentation of the different formats randomized? | Low risk | |
| Objective outcome? | High risk | |
Naylor 1992.
| Methods | Randomized parallel study (for RRR and ARR but not NNT); self reported perception of efficacy. | |
| Participants | Convenience sample of 100 faculty and house staff in internal medicine and family medicine. Participation rate: 75%. |
|
| Interventions | Results from the Helsinki Heart study were presented as RRR or ARR. Then both group received the results presented as NNT. | |
| Outcomes | Rating of efficacy on an 11‐point scale (perception). | |
| Notes | Wording of the scenario appropriate for ARR and RRR. ARR presented as percentage reduction with pre and post intervention percentages provided. Scenarios: A medical intervention results in a 26% relative decrease in the incidence of fatal myocardial infarction (RRR). A medical intervention results in a 0.1% decrease in the incidence of fatal myocardial infarction (0.3% versus 0.4%) (ARR). |
|
| Risk of bias | ||
| Bias | Authors' judgement | Support for judgement |
| Allocation concealment (selection bias) | Unclear risk | No details provided. |
| Randomized design? If cross‐over design, order of presentation of the different formats randomized? | Low risk | |
| Objective outcome? | High risk | Self‐reported perception of efficacy. |
Nexoe 2002a.
| Methods | Randomized parallel study; hypothetical outcome. | |
| Participants | 1127 general practitioners active members of the Danish General Practitioners' Organization. Participation rate: 75%. |
|
| Interventions | A case scenario with benefit of a medication on a hypothetical disease presented as RRR, ARR, NTT or a combination of these | |
| Outcomes | Willingness to recommend medication (persuasiveness) | |
| Notes | Wording of the scenario appropriate for ARR but not RRR ARR presented as frequency Scenarios: The drug must be used by 100 persons, in order to prevent one death from the disease after 5 years. (NNT) The drug reduces the risk of death from the disease by 50% after 5 years. (RRR) Treatment of 1000 persons will result in 990 avoiding death from the disease after 5 years, compared with 980, if untreated. (ARR) |
|
| Risk of bias | ||
| Bias | Authors' judgement | Support for judgement |
| Allocation concealment (selection bias) | Unclear risk | No details provided |
| Randomized design? If cross‐over design, order of presentation of the different formats randomized? | Low risk | |
| Objective outcome? | High risk | Hypothetical outcome |
Nexoe 2002b.
| Methods | Randomized parallel study; hypothetical outcome | |
| Participants | 826 general practitioners active members of the Danish General Practitioners' Organization Participation rate: 42%. |
|
| Interventions | A case scenario with benefit of a medication on a hypothetical disease presented as RRR, ARR, NTT or a combination of these. | |
| Outcomes | Willingness to recommend medication (persuasiveness). | |
| Notes | Wording of the scenario appropriate for ARR but not RRR. Data for Danish GPs already reported in Nexoe 2002a and not included here. ARR presented as frequency. Scenarios: The drug must be used by 100 persons, in order to prevent one death from the disease after 5 years. (NNT) The drug reduces the risk of death from the disease by 50% after 5 years. (RRR) Treatment of 1000 persons will result in 990 avoiding death from the disease after 5 years, compared with 980, if untreated. (ARR) |
|
| Risk of bias | ||
| Bias | Authors' judgement | Support for judgement |
| Allocation concealment (selection bias) | Unclear risk | No details provided. |
| Randomized design? If cross‐over design, order of presentation of the different formats randomized? | Low risk | |
| Objective outcome? | High risk | |
Nikolajevic‐S 1999.
| Methods | Randomized parallel study; hypothetical outcome. | |
| Participants | 215 family physicians practicing in New South Wales in Australia. Participation rate: 54%. |
|
| Interventions | Treatment outcomes (both benefits and harms) of hormone replacement therapy (HRT) presented as RRR or NNT to prevent or cause an event (range of uncertainty rather than point estimate presented). | |
| Outcomes | Intention to prescribe HRT in seven clinical scenarios (persuasiveness). | |
| Notes | Wording of the scenario not appropriate for RRR. Scenarios: Treatment with HRT might result in a decrease of between 39% and 69% in the incidence of myocardial infarction compared with the non‐use of HRT. (RRR) Between 106 and 187 such women would have to be treated with HRT for 10 years to prevent 1 myocardial infarction. (NNT) |
|
| Risk of bias | ||
| Bias | Authors' judgement | Support for judgement |
| Allocation concealment (selection bias) | Unclear risk | No details provided. |
| Randomized design? If cross‐over design, order of presentation of the different formats randomized? | Low risk | |
| Objective outcome? | High risk | Hypothetical outcome. |
Sarfati 1998.
| Methods | Cross‐over study; hypothetical outcome. | |
| Participants | 306 members of the general public in Wellington, New Zealand. Participation rate: 76%. |
|
| Interventions | Information on the benefit of a screening test for unspecified cancer expressed as RRR, ARR (frequency) or number needed to be screened (NNS) to prevent on death. | |
| Outcomes | Willingness to be screened (persuasiveness). | |
| Notes | Wording of the scenario appropriate for ARR and RRR. Order of different formats randomized. ARR presented as pre and post intervention frequency. Scenarios: If you have this test every two years, it will reduce your chance of dying from this cancer by around one third. (RRR) If you have this test every two years, it will reduce your chance of dying from cancer from around three in a thousand to around two in a thousand over the next ten years. (ARR) If around a thousand people have this test every two years, one person will be saved from dying from this cancer every 10 years. (NNT) |
|
| Risk of bias | ||
| Bias | Authors' judgement | Support for judgement |
| Allocation concealment (selection bias) | Unclear risk | No details provided. |
| Randomized design? If cross‐over design, order of presentation of the different formats randomized? | Low risk | |
| Objective outcome? | High risk | Hypothetical outcome. |
Schwartz 1997a.
| Methods | Randomized parallel study; objective outcome. | |
| Participants | 150 female veterans (randomly drawn from a registry). Participation rate: 61% | |
| Interventions | Information about the benefit of breast cancer mammography screening using RRR or ARR; information about baseline risk given to two groups. | |
| Outcomes | Accuracy of estimated risk (understanding). | |
| Notes | Wording of the scenario appropriate for ARR but not RRR. Authors also assessed the perceived benefit. ARR presented as frequency reduction with/without baseline risk. Scenarios: 33% risk reduction from 12 in 1000. (RRR) 4 in 1000 risk reduction from 12 in 1000. (ARR) |
|
| Risk of bias | ||
| Bias | Authors' judgement | Support for judgement |
| Allocation concealment (selection bias) | Unclear risk | No details provided. |
| Randomized design? If cross‐over design, order of presentation of the different formats randomized? | Low risk | |
| Objective outcome? | Low risk | Accuracy of estimated risk. |
Schwartz 1997b.
| Methods | Randomized parallel study; objective outcome. | |
| Participants | 137 female veterans (randomly drawn from a registry). Participation rate: 61%. | |
| Interventions | Information about the benefit of breast cancer mammography screening using RRR or ARR; no information about baseline risk given to any groups. | |
| Outcomes | Accuracy of estimated risk (understanding). | |
| Notes | Wording of the scenario appropriate for ARR but not RRR. Authors also assessed the perceived benefit. ARR presented as frequency reduction with/without baseline risk. Scenarios: 33% risk reduction from 12 in 1000. (RRR) 4 in 1000 risk reduction from 12 in 1000. (ARR) |
|
| Risk of bias | ||
| Bias | Authors' judgement | Support for judgement |
| Allocation concealment (selection bias) | Unclear risk | No details provided. |
| Randomized design? If cross‐over design, order of presentation of the different formats randomized? | Low risk | |
| Objective outcome? | Low risk | Understanding. |
Sedlmeier 2001.
| Methods | Randomzied parallel study, objective outcome. | |
| Participants | 72 students at the University of Munich, Germany. Participation rate: not reported. |
|
| Interventions | Computerized tutorial program to train people to construct frequency representations versus insert probabilities into Bayes’ rule relating to women undergoing screening mammography. | |
| Outcomes | (at baseline test (Test 1), a posttest (Test 2), a test 1 week later (Test 3) and a test 15 weeks later (Test 4). | |
| Notes |
Scenario:
A reporter for a women’s monthly magazine would like to write an article about breast cancer. As a part of her research, she focuses on mammography as an indicator of breast cancer. She wonders what it really means if a woman tests positive for breast cancer during her routine mammography examination. She has the following data: probabilities:
frequencies:
|
|
| Risk of bias | ||
| Bias | Authors' judgement | Support for judgement |
| Allocation concealment (selection bias) | Unclear risk | No details provided. |
| Randomized design? If cross‐over design, order of presentation of the different formats randomized? | Low risk | |
| Objective outcome? | Low risk | Understanding. |
Sheridan 2003.
| Methods | Randomized parallel study; objective outcome. | |
| Participants | 357 patients of a university internal medicine clinic, ages 50 to 80. Participation rate: 74%. | |
| Interventions | Benefits of two drug treatments for a hypothetical disease presented as RRR, ARR, NNT or a combination of these. | |
| Outcomes | Stating which treatment is more effective (understanding). Estimating the probability of disease after treatment (understanding). | |
| Notes | Wording of the scenario appropriate for ARR but not RRR. ARR presented as frequency reduction. Scenarios: Treatment A reduces the chance that you will develop Disease Y by 25%. (RRR) Treatment A reduces the chance that you will develop Disease Y by 10 per 1000 persons. (ARR) 100 persons just like you would have to be treated with Treatment A for 5 years for a benefit against Disease Y to be evident in one of you. (NNT) |
|
| Risk of bias | ||
| Bias | Authors' judgement | Support for judgement |
| Allocation concealment (selection bias) | Low risk | Assignments sealed in security envelopes. |
| Randomized design? If cross‐over design, order of presentation of the different formats randomized? | Low risk | |
| Objective outcome? | Low risk | Understanding. |
Straus 2002.
| Methods | Cross‐over study; hypothetical outcome. | |
| Participants | 17 patients with non‐valvular atrial fibrillation admitted to a general medicine inpatient service. Participation rate: 94%. |
|
| Interventions | Treatment outcomes (both benefits and harms) of warfarin therapy for atrial fibrillation presented as RRR/RRI, ARR/ARI or NNT/NNH. | |
| Outcomes | Willingness to take the medication (persuasiveness). | |
| Notes | Appropriateness of wording of the scenario for ARR and RRR: not clear. Scenarios: not reported. |
|
| Risk of bias | ||
| Bias | Authors' judgement | Support for judgement |
| Allocation concealment (selection bias) | Unclear risk | No details provided. |
| Randomized design? If cross‐over design, order of presentation of the different formats randomized? | Low risk | |
| Objective outcome? | High risk | |
Ward 1999.
| Methods | Cross‐over study; hypothetical outcome. | |
| Participants | 110 cardiologists and cardiothoracic surgeons in New South Wales, Australia. Participation rate: 63%. |
|
| Interventions | Benefits of a cardiac rehabilitation programme presented as RRR, ARR, NNT. | |
| Outcomes | Willingness to fund the cardiac rehabilitation programme (persuasiveness). | |
| Notes | Wording of the scenario appropriate for ARR but not RRR. ARR expressed as percentage. Scenarios: Programme A reduced the rate of deaths by 20% (RRR). Programme B produced an absolute reduction in deaths of 3% (ARR). Programme C required 31 people to be enrolled in it to prevent one death (NNT). |
|
| Risk of bias | ||
| Bias | Authors' judgement | Support for judgement |
| Allocation concealment (selection bias) | Unclear risk | No details provided. |
| Randomized design? If cross‐over design, order of presentation of the different formats randomized? | Unclear risk | No details provided. |
| Objective outcome? | High risk | |
Wolf 2000.
| Methods | Randomized parallel study; hypothetical outcome. | |
| Participants | 266 elderly patients during a routine visit to their primary care providers. Participation rate: 54%. |
|
| Interventions | Risk reduction with screening for colorectal cancer mortality presented either as RRR or ARR. | |
| Outcomes | Intent to begin or continue colorectal cancer screening (persuasiveness). | |
| Notes | Wording of the scenario appropriate for ARR but not RRR. ARR presented as with and without screening frequency. Scenarios: The chances of dying from colon cancer drop by 30% or 30 in 100 if you are screened (RRR). Your risk of dying drops from a little over 2 in hundred to a little under 2 in 100 (ARR). |
|
| Risk of bias | ||
| Bias | Authors' judgement | Support for judgement |
| Allocation concealment (selection bias) | Unclear risk | No details provided. |
| Randomized design? If cross‐over design, order of presentation of the different formats randomized? | Low risk | |
| Objective outcome? | High risk | |
Young 2003.
| Methods | Cross‐over study; hypothetical outcome. | |
| Participants | 1062 women aged 18 to 70 recruited from general practices in poor urban region of Sydney. Participation rate was 75%. |
|
| Interventions | Effectiveness of screening programs for breast cancer expressed as RRR, ARR, or NSS. | |
| Outcomes | Level of support for government funding of each of four new screening programs for breast cancer (persuasiveness). | |
| Notes | Wording of the scenario appropriate for ARR but not RRR. ARR expressed as rates with pre and post intervention rates provided. Mismatch between statistics: for a risk reduction from 1 in 45 (2.22%) to 1 in 46 (2.17%), NNT should be 2083 and RRR should be 2.16%. Scenarios: Program A will reduce the risk of dying from breast cancer by 34% among those who are offered screening compared with those who are not (RRR). Program B will reduce the risk of dying from breast cancer from 1 in 45 to 1 in 46 (ARR). Program C will prevent on death from breast cancer for every 1,592 women screened (NNS). |
|
| Risk of bias | ||
| Bias | Authors' judgement | Support for judgement |
| Allocation concealment (selection bias) | Unclear risk | No details provided. |
| Randomized design? If cross‐over design, order of presentation of the different formats randomized? | Unclear risk | No details provided. |
| Objective outcome? | High risk | |
Characteristics of excluded studies [ordered by study ID]
| Study | Reason for exclusion |
|---|---|
| Baron 1997 | Information presented was different in comparison groups. |
| Bergus 2002 | Information presented was different in comparison groups. |
| Bhandari 2004 | Not an appropriate study design (outcome: choice between two different interventions with different benefits and risks). |
| Carneiro 2003 | Not an original study. |
| Christensen 2003 | Not a comparison of interest (NNT to avoid one hip fracture compared with the duration of postponement of hip fracture). |
| Christensen‐Sza 1992 | Not a comparison of interest. |
| Cosmides 1996 | Not a comparison of interest. |
| Dahl 2007 | Information presented was different in comparison groups. |
| Dupuy 2003 | Not an original study. |
| Edwards 2001 | Not an original study (editorial). |
| Edwards 2002 | Not an original study (review). |
| Edwards 2006 | Not a comparison of interest. |
| Emmons 2004 | Not a comparison of interest. |
| Fortin 2001 | Not an appropriate study design (qualitative study). |
| Ghosh 2005 | Not an original study (review). |
| Goldman 2006 | Not a comparison of interest. |
| Grimes 1999 | Not a comparison of interest (risk versus rate). |
| Grisaffe 1997 | Not a comparison of interest (graphical presentation of information; additional versus no additional information). |
| Halvorsen 2005 | Information presented was different in comparison groups. |
| Halvorsen 2005a | Information presented was different in comparison groups. |
| Halvorsen 2007 | Not a comparison of interest. |
| Hembroff 2004 | Does not report the necessary data for comparison of interest. |
| Hilton 2006 | Not a comparison of interest. |
| Hinshaw 2007 | Not a comparison of interest. |
| Hoffmann 2006 | Not an appropriate study design (qualitative). |
| Hoffrage 2000 | Not an original study (review). |
| Hux 1994 | Not a comparison of interest (average versus stratified gain in life expectancy). |
| Ke 2006 | Not an original study (review). |
| Kirsch 2007 | Not an original study. |
| Knapp 2004 | Not a comparison of interest. |
| Lipkus 1999 | Not a comparison of interest. |
| Lipkus 2001 | Information presented was different in comparison groups. |
| Marteau 2001 | Not a comparison of interest. |
| Martin 2006 | Not a comparison of interest. |
| Matthews 1999 | Not an original study. |
| Mazur 1994 | Not a comparison of interest (limited versus extensive explanation). |
| Mazur 1996 | Not a comparison of interest. |
| McGettigan 1999 | Not an original study (review). |
| Misselbrook 2002 | Not an original study. |
| Montazemi 1989 | Not an original study (review). |
| Nexoe 2005 | Not a comparison of interest. |
| Replogle 2007 | Not an original study. |
| Rothman 1999 | Not an original study. |
| Sanfey 1998 | Not a comparison of interest. |
| Schapira 2001 | Not an appropriate study design (qualitative). |
| Sheridan 2002 | Does not report the necessary data. |
| Siegrist 1997 | Does not report the necessary data for comparison of interest (probability versus natural frequency). |
| Skolbekken 1998 | Not an original study. |
| Thomson 2005 | Not an original study (review). |
| Trevena 2006 | Not an original study (review). |
| van Walraven 1999 | Not a comparison of interest (NNT versus ARR are used as different response options and not as different statistical presentations of an effect measure). |
| Weeks 2004 | Not an original study. |
| Weinstein 1993 | Not an original study. |
| Wen 2005 | Not an original study. |
| Woloshin 1999 | Not an original study. |
| Yamagishi 1997 | Does not report necessary data for comparison of interest (probability versus natural frequency). |
| Young 2006 | Not a comparison of interest. |
Differences between protocol and review
The protocol title was: 'Using different statistical formats for presenting health information'.
The protocol inclusion criteria for type of studies included RCTS, quasi‐RCTs and controlled before and after studies (CBAs). We omitted CBAs from the review because its categorization mainly reflects the outcome assessment method which could apply to different types of study designs.
The protocol inclusion criteria for type of outcome included any measure (including self‐reported) of the different outcomes. In the review, and for the outcome understanding, we considered only objective measurements after carefully considering the nature of that outcome.
Contributions of authors
EAA: study conception and design, screening, data extraction, data analysis and interpretation.
ADO: study conception and design, data analysis and interpretation.
JH: study conception and design, data extraction data analysis and interpretation.
IT: data extraction, data analysis
FS: data extraction, data analysis
GV: screening, data extraction, data analysis and interpretation.
CC: screening, data extraction.
DB: screening, data extraction.
HJS: study conception and design, screening, data extraction, data analysis and interpretation.
Sources of support
Internal sources
-
State University of New York at Buffalo, NY, USA.
Salary support, infrastructure
-
Italian National Cancer Institute, Regina Elena, Rome, Italy.
Salary support
External sources
-
Norwegian Research Council, Norway.
Salary support
-
HJS is funded by a European Commission: The human factor, mobility and Marie Curie Actions. Scientist Reintegration Grant: IGR 42194 ‐ GRADE., Not specified.
Salary support
Declarations of interest
Some of the review authors were also authors of two included studies: Carling 2008 and Carling 2009. A review author who was not a study author (IT), as well as EA, were involved in data abstraction and analysis for these studies.
Edited (no change to conclusions), comment added to review
References
References to studies included in this review
Adily 2004 {published data only}
- Adily A, Ward J. Evidence based practice in population health: a regional survey to inform workforce development of organisational change. Journal of Epidemiology and Community Health 2004;58:455‐60. [DOI] [PMC free article] [PubMed] [Google Scholar]
Bobbio 1994 {published data only}
- Bobbio M, Demichelis B, Giustetto G. Completeness of reporting trial results: effect on physicians' willingness to prescribe. Lancet 1994;343(8907):1209‐11. [DOI] [PubMed] [Google Scholar]
Bramwell 2006a {published data only}
- Bramwell R, West H, Salmon P. Health professionals' and service users' interpretation of screening test results: experimental study. BMJ 2006;333:284. [DOI] [PMC free article] [PubMed] [Google Scholar]
Bramwell 2006b {published data only}
- Bramwell R, West H, Salmon P. Health professionals' and service users' interpretation of screening test results: experimental study. BMJ 2006;333:284. [DOI] [PMC free article] [PubMed] [Google Scholar]
Bramwell 2006c {published data only}
- Bramwell R, West H, Salmon P. Health professionals' and service users' interpretation of screening test results: experimental study. BMJ 2006;333:284. [DOI] [PMC free article] [PubMed] [Google Scholar]
Bramwell 2006d {published data only}
- Bramwell R, West H, Salmon P. Health professionals' and service users' interpretation of screening test results: experimental study. BMJ 2006;333:284. [DOI] [PMC free article] [PubMed] [Google Scholar]
Brotons 2002 {published data only}
- Brotons C, Moral I, Ribera A, Cascant P, Iglesias M, Permanyer‐Miralda G, et al. Methods of reporting research‐results and their influence on decision‐making by cardiologists prescribing drugs for primary and secondary prevention. Revista Española de Cardiología 2002;55(10):1042‐51. [DOI] [PubMed] [Google Scholar]
Bucher 1994 {published data only}
- Bucher HC, Weinbacher M, Gyr K. Influence of method of reporting study results on decision of physicians to prescribe drugs to lower cholesterol concentration. BMJ 1994;309(6957):761‐4. [DOI] [PMC free article] [PubMed] [Google Scholar]
Carling 2008 {published data only}
- Carling C, Tove Kristoffersen D, Herrin J, Treweek S, Oxman AD, Schünemann HJ, et al. How should the impact of different presentations of treatment effects on patient choice be evaluated? A pilot randomized trial. PLoS ONE 2008;3(11):e3693. [DOI] [PMC free article] [PubMed] [Google Scholar]
Carling 2009 {published data only}
- Carling CLL, Kristoffersen DT, Montori VM, Herrin J, Schünemann HJ, Treweek S, et al. The effect of alternative summary statistics for communicating risk reduction on decisions about taking statins: a randomized trial. PLoS Medicine 2009;6(8):e1000134. [DOI] [PMC free article] [PubMed] [Google Scholar]
Chao 2003 {published data only}
- Chao C, Studts JL, Abell T, Hadley T, Roetzer L, Dineen S. Adjuvant chemotherapy for breast cancer: How presentation of recurrence risk influences decision‐making. Journal of Clinical Oncology 2003;21:4299‐305. [DOI] [PubMed] [Google Scholar]
Cranney 1996 {published data only}
- Cranney M, Walley T. Same information, different decisions: the influence of evidence on the management of hypertension in the elderly. British Journal of General Practice 1996;46(412):661‐3. [PMC free article] [PubMed] [Google Scholar]
Damur 2000 {published data only}
- Damur JS. Do doctors judge therapy results differently from students? [Beurteilen Arzte Therapieergebnisse anders als Studenten?]. Schweizerische Medizinische Wochenschrift 2000;1(30):171‐6. [PubMed] [Google Scholar]
Davey 2005 {published data only}
- Davey C, White V, Gattellari M, Ward JE. Reconciling population benefits and women's individual autonomy in mammographic screening: in‐depth interviews to explore women's views about 'informed choice'. Australian and New Zealand Journal of Public Health 2005;29:69‐77. [DOI] [PubMed] [Google Scholar]
Fahey 1995 {published data only}
- Fahey T, Griffiths S, Peters TJ. Evidence based purchasing: Understanding results of clinical trials and systematic reviews. BMJ 1995;311(7012):1056. [DOI] [PMC free article] [PubMed] [Google Scholar]
Forrow 1992a {published data only}
- Forrow L, Taylor WC, Arnold RM. Absolutely relative: how research results are summarized can affect treatment decisions. American Journal of Medicine 1992;92(2):121‐4. [DOI] [PubMed] [Google Scholar]
Forrow 1992b {published data only}
- Forrow L, Taylor WC, Arnold RM. Absolutely relative: how research results are summarized can affect treatment decisions. American Journal of Medicine 1992;92(2):121‐4. [DOI] [PubMed] [Google Scholar]
Gigerenzer 1996 {published data only}
- Gigerenzer G. The psychology of good judgment: frequency formats and simple algorithms. Medical Decision Making 1996;16(3):273‐80. [DOI] [PubMed] [Google Scholar]
- Hoffrage U, Gigerenzer G. Using natural frequencies to improve diagnostic inferences. Academic Medicine 1998;73(5):538‐40. [DOI] [PubMed] [Google Scholar]
Heller 2004 {published data only}
- Heller RF, Sandars JE, Patterson L, McElduff P. GPs' and physicians' interpretation of risks, benefits and diagnostic test results. Family Practice 2004;21(2):155‐9. [DOI] [PubMed] [Google Scholar]
Hux 1995 {published data only}
- Hux JE, Naylor CD. Communicating the benefits of chronic preventive therapy: does the format of efficacy data determine patients' acceptance of treatment?. Medical Decision Making 1995;15(2):152‐7. [DOI] [PubMed] [Google Scholar]
Kurzenhäuser 2002 {published data only}
- Kurzenhäuser S, Hoffrage U. Teaching Bayesian reasoning: an evaluation of a classroom tutorial for medical students. Medical Teacher 2002;24(5):516‐21. [DOI] [PubMed] [Google Scholar]
Lacy 2001 {published data only}
- Lacy CR, Barone JA, Suh DC, Malini PL, Bueno M, Moylan DM, Kostis JB. Impact of presentation of research results on likelihood of prescribing medications to patients with left ventricular dysfunction. American Journal of Cardiology 2001;87(2):203‐7. [DOI] [PubMed] [Google Scholar]
Loewen 1999 {published data only}
- Loewen PS, Marra CA, Marrra F. Influence of presentation of clinical trial data on pharmacists willingness to recommend drug therapy. Canadian Journal of Hospital Pharmacy 1999;52:145‐9. [Google Scholar]
Malenka 1993 {published data only}
- Malenka DJ, Baron JA, Johansen S, Wahrenberger JW, Ross JM. The framing effect of relative and absolute risk. Journal of General Internal Medicine 1993;8(10):543‐8. [DOI] [PubMed] [Google Scholar]
Mellers 1999 {published data only}
- Mellers BA, McGraw AP. How to improve Bayesian Reasoning: comment on Gigerenzer and Hoffrage (1995). Psychological Review 1997;106(2):417‐24. [Google Scholar]
Misselbrook 2001 {published data only}
- Misselbrook D, Armstrong D. Patients' responses to risk information about the benefits of treating hypertension. British Journal of General Practice 2001;51:276‐9. [PMC free article] [PubMed] [Google Scholar]
Natter 2005a {published data only}
- Natter HM, Berry DC. Effects of presenting the baseline risk when communicating absolute and relative risk reductions. Psychology, Health & Medicine 2005;10(4):326‐34. [Google Scholar]
Natter 2005b {published data only}
- Natter HM, Berry DC. Effects of presenting the baseline risk when communicating absolute and relative risk reductions. Psychology, Health & Medicine 2005;10(4):326‐34. [Google Scholar]
Naylor 1992 {published data only}
- Naylor CD, Chen E, Strauss B. Measured enthusiasm: does the method of reporting trial results alter perceptions of therapeutic effectiveness?. Annals of Internal Medicine 1992;117(11):916‐21. [DOI] [PubMed] [Google Scholar]
Nexoe 2002a {published data only}
- Nexoe J, Gyrd‐Hansen D, Kragstrup J, Kristiansen IS, Nielsen JB. Danish GPs' perception of disease risk and benefit of prevention. Family Practice 2002;19(1):3‐6. [DOI] [PubMed] [Google Scholar]
Nexoe 2002b {published data only}
- Nexoe J, Oltarzewska AM, Sawicka‐Powierza J, Kragstrup J, Kristiansen IS. Perception of risk information. Similarities and differences between Danish and Polish general practitioners. Scandinavian Journal of Primary Health Care 2002;20:183‐7. [DOI] [PubMed] [Google Scholar]
Nikolajevic‐S 1999 {published data only}
- Nikolajevic‐Sarunac J, Henry DA, O'Connell DL, Robertson J. Effects of information framing on the intentions of family physicians to prescribe long‐term hormone replacement therapy. Journal of General Internal Medicine 1999;14(10):591‐8. [DOI] [PMC free article] [PubMed] [Google Scholar]
Sarfati 1998 {published data only}
- Sarfati D, Howden‐Chapman P. Does the frame affect the picture? A study into how attitudes to screening for cancer are affected by the way benefits are expressed. Journal of Medical Screening 1998;5(3):137‐40. [DOI] [PubMed] [Google Scholar]
Schwartz 1997a {published data only}
- Schwartz LM, Woloshin S, Black WC, Welch HG. The role of numeracy in understanding the benefit of screening mammography. Annals of Internal Medicine 1997;127(11):966‐72. [DOI] [PubMed] [Google Scholar]
Schwartz 1997b {published data only}
- Schwartz LM, Woloshin S, Black WC, Welch HG. The role of numeracy in understanding the benefit of screening mammography. Annals of Internal Medicine 1997;127(11):966‐72. [DOI] [PubMed] [Google Scholar]
Sedlmeier 2001 {published data only}
- Sedlmeier P, Gigerenzer G. Teaching Bayesian reasoning in less than two hours. Journal of Experimental Psychology 2001;130:380‐400. [DOI] [PubMed] [Google Scholar]
Sheridan 2003 {published data only}
- Sheridan SL, Pignone MP, Lewis CL. A randomized comparison of patients' understanding of number needed to treat and other common risk reduction formats. Journal of General Internal Medicine 2003;18(11):884‐92. [DOI] [PMC free article] [PubMed] [Google Scholar]
Straus 2002 {published data only}
- Straus SE. Individualizing treatment decisions: The likelihood of being helped or harmed. Evaluation & the Health Professions 2002;25:210. [DOI] [PubMed] [Google Scholar]
Ward 1999 {published data only}
- Ward JE, Shah S, Donnelly N. Resource allocation in cardiac rehabilitation: Muir Gray's aphorisms might apply in Australia. Clinician in Management 1999;8:24‐6. [Google Scholar]
Wolf 2000 {published data only}
- Wolf AMD, Schorling JB. Does informed consent alter elderly patient's preferences for colorectal cancer screening?. Journal of General Internal Medicine 2000;15:24‐30. [DOI] [PMC free article] [PubMed] [Google Scholar]
Young 2003 {published data only}
- Young JM, Davey C, Ward JE. Influence of 'framing effect' on women's support for government funding of breast cancer screening. Australian New Zealand Journal of Public Health 2003;27:287‐90. [DOI] [PubMed] [Google Scholar]
References to studies excluded from this review
Baron 1997 {published data only}
- Baron J. Confusion of relative and absolute risk in valuation. Journal of Risk and Uncertainty 1997;14:301‐9. [Google Scholar]
Bergus 2002 {published data only}
- Bergus GR, Levin IP, Elstein AS. Presenting risks and benefits to patients. Journal of General Internal Medicine 2002;17(8):612‐7. [DOI] [PMC free article] [PubMed] [Google Scholar]
Bhandari 2004 {published data only}
- Bhandari M, Tornetta P. Communicating the risks of surgery to patients. European Journal of Trauma 2004; Vol. 30, issue 3:177‐81.
Carneiro 2003 {published data only}
- Carneiro AV. Measures of association in clinical trials: definition and interpretation. Revista Portuguesa de Cardiologia 2003;22(11):1393‐401. [PubMed] [Google Scholar]
Christensen 2003 {published data only}
- Christensen PM, Brosen K, Brixen K, Andersen M, Kristiansen IS. A randomized trial of laypersons' perception of the benefit of osteoporosis therapy: Number needed to treat versus postponement of hip fracture. Clinical Therapeutics 2003;25(10):2575‐85. [DOI] [PubMed] [Google Scholar]
Christensen‐Sza 1992 {published data only}
- Christensen‐Szalanski JJ, Beach LR. Experience and the base‐rate fallacy. Organizational Behaviour and Human Performance 1982;29(2):270‐8. [DOI] [PubMed] [Google Scholar]
Cosmides 1996 {published data only}
- Cosmides L, Tooby J. Are humans good intuitive statisticians after all? Rethinking some conclusions from the literature on judgment under uncertainty. Cognition 1996;58(1):1‐73. [Google Scholar]
Dahl 2007 {published data only}
- Dahl R, Gyrd‐Hansen D, Kristiansen I, Nexoe J, Bo Nielsen J, Dahl R, et al. Can postponement of an adverse outcome be used to present risk reductions to a lay audience? A population survey. BMC Medical Informatics and Decision Making 2007; Vol. 7:8. [DOI] [PMC free article] [PubMed]
Dupuy 2003 {published data only}
- Dupuy A, Guillaume JC. Odds ratio and relative risk. Annales de Dermatologie et de Vénéréologie 2003;130(11):1083. [PubMed] [Google Scholar]
Edwards 2001 {published data only}
- Edwards A, Elwyn GJ. Risks: listen and don't mislead. British Journal of General Practice 2001;51(465):259‐60. [PMC free article] [PubMed] [Google Scholar]
Edwards 2002 {published data only}
- Edwards A, Elwyn G, Mulley A. Explaining risks: turning numerical data into meaningful pictures. BMJ 2002;324(7341):827‐30. [DOI] [PMC free article] [PubMed] [Google Scholar]
Edwards 2006 {published data only}
- Edwards A, Thomas R, Williams R, Ellner AL, Brown P, Elwyn G, et al. Presenting risk information to people with diabetes: evaluating effects and preferences for different formats by a web‐based randomised controlled trial. Patient Education and Counseling 2006; Vol. 63, issue 3:336‐49. [DOI] [PubMed]
Emmons 2004 {published data only}
Fortin 2001 {published data only}
- Fortin JM, Hirota LK, Bond BE, O'Connor AM, Col NF. Identifying patient preferences for communicating risk estimates: a descriptive pilot study. BMC Medical Informatics and Decision Making 2001;1:2. [DOI] [PMC free article] [PubMed] [Google Scholar]
Ghosh 2005 {published data only}
Goldman 2006 {published data only}
- Goldman RE, Parker DR, Eaton CB, Borkan JM, Gramling R, Cover RT, et al. Patients' perceptions of cholesterol, cardiovascular disease risk, and risk communication strategies. Annals of Family Medicine 2006; Vol. 4, issue 3:205‐12. [DOI] [PMC free article] [PubMed]
Grimes 1999 {published data only}
- Grimes DA, Snively GR. Patients' understanding of medical risks: implications for genetic counseling. Obstetrics & Gynecology 1999;93(6):910‐4. [DOI] [PubMed] [Google Scholar]
Grisaffe 1997 {published data only}
- Grisaffe D, Shellabarger S. Consumer comprehension of efficacy data in four experimental over‐the‐counter label conditions. Drug Information Journal 1997;31:937‐61. [Google Scholar]
Halvorsen 2005 {published data only}
- Halvorsen PA, Kristiansen IS. Decisions on drug therapies by numbers needed to treat: a randomized trial. Archives of Internal Medicine 2005;165(10):1140‐6. [DOI] [PubMed] [Google Scholar]
Halvorsen 2005a {published data only}
Halvorsen 2007 {published data only}
Hembroff 2004 {published data only}
- Hembroff LA, Holmes‐Rovner M, Wills CE, Hembroff LA, Holmes‐Rovner M, Wills CE. Treatment decision‐making and the form of risk communication: results of a factorial survey. BMC Medical Informatics and Decision Making 2004; Vol. 4:20. [DOI] [PMC free article] [PubMed]
Hilton 2006 {published data only}
- Hilton DJ, Reid CM, Paratz J. An under‐used yet easily understood statistic: the number needed to treat (NNT). Physiotherapy 2006; Vol. 92, issue 4:240‐6.
Hinshaw 2007 {published data only}
Hoffmann 2006 {published data only}
Hoffrage 2000 {published data only}
- Hoffrage U, Lindsey S, Hertwig R, Gigerenzer G. Medicine. Communicating statistical information. Science 2000;290(5500):2261‐2. [DOI] [PubMed] [Google Scholar]
Hux 1994 {published data only}
- Hux JE, Levinton CM, Naylor CD. Prescribing propensity: influence of life‐expectancy gains and drug costs. Journal of General Internal Medicine 1994;9(4):195‐201. [DOI] [PubMed] [Google Scholar]
Ke 2006 {published data only}
- Ke DS. Using "number needed to treat" to interpret treatment effect. [Chinese]. Acta Neurologica Taiwanica 2006; Vol. 15, issue 2:120‐6. [1019‐6099] [PubMed]
Kirsch 2007 {published data only}
Knapp 2004 {published data only}
- Knapp P, Raynor DK, Berry DC. Comparison of two methods of presenting risk information to patients about the side effects of medicines. Quality and Safety in Health Care 2004; Vol. 13, issue 3:176‐80. [DOI] [PMC free article] [PubMed]
Lipkus 1999 {published data only}
- Lipkus IM, Crawford Y, Fenn K, Biradavolu M, Binder RA, Marcus A, et al. Testing different formats for communicating colorectal cancer risk. Journal of Health Communication 1999;4(4):311‐24. [DOI] [PubMed] [Google Scholar]
Lipkus 2001 {published data only}
- Lipkus IM, Klein WMP, Rimer BK. Communicating breast cancer risks to women using different formats. Cancer Epidemiology Biomarkers and Prevention 2001;10:895‐8. [PubMed] [Google Scholar]
Marteau 2001 {published data only}
- Marteau TM, Senior V, Sasieni P. Women's understanding of a "normal smear test result": experimental questionnaire based study. BMJ 2001;322(7285):526‐8. [DOI] [PMC free article] [PubMed] [Google Scholar]
Martin 2006 {published data only}
Matthews 1999 {published data only}
- Matthews EJ, Edwards AGK, Barker J, Bloor M, Covey J, Hood K, et al. Efficient literature searching in diffuse topics: lessons from a systematic review of research on communicating risk to patients in primary care. Health Libraries Review 1999;16:112‐20. [DOI] [PubMed] [Google Scholar]
Mazur 1994 {published data only}
- Mazur DJ, Hickam DH. The effect of physician's explanations on patients' treatment preferences: five‐year survival data. Medical Decision Making 1994;14(3):255‐8. [DOI] [PubMed] [Google Scholar]
Mazur 1996 {published data only}
- Mazur DJ, Hickam DH. Five‐year survival curves: how much data are enough for patient‐physician decision making in general surgery?. European Journal of Surgery 1996;162(2):101‐4. [PubMed] [Google Scholar]
McGettigan 1999 {published data only}
- McGettigan P, Sly K, O'Connell D, Hill S, Henry D. The effects of information framing on the practices of physicians. Journal of General Internal Medicine 1999;14(10):633‐42. [DOI] [PMC free article] [PubMed] [Google Scholar]
Misselbrook 2002 {published data only}
- Misselbrook D, Armstrong D. Thinking about risk. Can doctors and patients talk the same language?. Family Practice 2002;19(1):1‐2. [DOI] [PubMed] [Google Scholar]
Montazemi 1989 {published data only}
- Montazemi A, Wang S. The effects of modes of information presentation on decision‐making: A review and meta‐analysis. Journal of Management Information Systems 1989;5(3):101‐27. [Google Scholar]
Nexoe 2005 {published data only}
Replogle 2007 {published data only}
- Replogle WH, Johnson WD. Interpretation of absolute measures of disease risk in comparative research. Family Medicine 2007; Vol. 39, issue 6:432‐5. [PubMed]
Rothman 1999 {published data only}
- Rothman AJ, Kiviniemi MT. Treating people with information: an analysis and review of approaches to communicating health risk information. Journal of the National Cancer Institute Monographs 1999;25:44‐51. [DOI] [PubMed] [Google Scholar]
Sanfey 1998 {published data only}
- Sanfey A, Hastie R. Does evidence presentation format affect judgement? an experimental evaluation of displays of data for judgements. Psychological Science 1998;9(2):99‐103. [Google Scholar]
Schapira 2001 {published data only}
- Schapira MM, Nattinger AB, McHorney CA. Frequency or probability? A qualitative study of risk communication formats used in health care. Medical Decision Making 2001;21(6):459‐67. [DOI] [PubMed] [Google Scholar]
Sheridan 2002 {published data only}
- Sheridan SL, Pignone M. Numeracy and the medical student's ability to interpret data. Effective Clinical Practice 2002;5(1):35‐40. [PubMed] [Google Scholar]
Siegrist 1997 {published data only}
- Siegrist, M. Communicating low risk magnitudes: Incidence rates expressed as frequency versus rates expressed as probability. Risk Analysis 1997;17(4):507‐10. [Google Scholar]
Skolbekken 1998 {published data only}
- Skolbekken JA. Communicating the risk reduction achieved by cholesterol reducing drugs. BMJ 1998;316(7149):1956‐8. [DOI] [PMC free article] [PubMed] [Google Scholar]
Thomson 2005 {published data only}
- Thomson R, Edwards A, Grey J. Risk communication in the clinical consultation. Clinical Medicine, Journal of the Royal College of Physicians of London 2005; Vol. 5, issue 5:465‐9. [DOI] [PMC free article] [PubMed]
Trevena 2006 {published data only}
van Walraven 1999 {published data only}
- Walraven C, Mahon JL, Moher D, Bohm C, Laupacis A. Surveying physicians to determine the minimal important difference: implications for sample‐size calculation. Journal of Clinical Epidemiology 1999;52(8):717‐23. [MEDLINE: ] [DOI] [PubMed] [Google Scholar]
Weeks 2004 {published data only}
Weinstein 1993 {published data only}
- Weinstein N, Sandman PM. Some criteria for evaluating risk messages. Risk Analysis 1993;13(1):103‐14. [Google Scholar]
Wen 2005 {published data only}
Woloshin 1999 {published data only}
- Woloshin S, Schwartz LM. How can we help people make sense of medical data?. Effective Clinical Practice 1999;2(4):176‐83. [PubMed] [Google Scholar]
Yamagishi 1997 {published data only}
- Yamagishi, K. When a 12.86% mortality is more dangerous than 24.14%: Implications for risk communication. Applied Cognitive Psychology 1997;11:495‐506. [Google Scholar]
Young 2006 {published data only}
- Young SD, Oppenheimer DM. Different methods of presenting risk information and their influence on medication compliance intentions: results of three studies. Clinical Therapeutics 2006;28(1):129‐39. [DOI] [PubMed] [Google Scholar]
Additional references
Akl 2004
- Akl EA, Schunemann HJ. Goodbye, number needed to treat?. Journal of Clinical Epidemiology 2004;57:219–20. [DOI] [PubMed] [Google Scholar]
Akl 2007
- Akl EA, Oxman AD, Herrin J, Vist GE, Costiniuk C, Blank D, Schünemann H. Negative versus positive framing of health information. Cochrane Database of Systematic Reviews 2007, Issue 4. [DOI: 10.1002/14651858.CD006777] [DOI] [PMC free article] [PubMed] [Google Scholar]
Cochrane Handbook
- Higgins JPT, Green S (editors). Cochrane Handbook for Systematic Reviews of Interventions Version 5.0.1. The Cochrane Collaboration, September 2008. [Google Scholar]
Cook 1995
- Cook RJ, Sackett DL. The number needed to treat: a clinically useful measure of treatment effect. BMJ 1995;310:452‐54. [DOI] [PMC free article] [PubMed] [Google Scholar]
Cooper 1994
- Cooper H, Hedges LV. The Handbook of Research Synthesis. New York: Russell Sage Foundation, 1994. [Google Scholar]
Covey 2007
- Covey J. A meta‐analysis of the effects of presenting treatment benefits in different formats. Medical Decision Making 2007;27:638–54. [DOI] [PubMed] [Google Scholar]
Curtin 2002
- Curtin F, Elbourne D, Altman DG. Meta‐analysis combining parallel and cross‐over clinical trials. II: Binary outcomes. Statistics in Medicine 2002;21:2145‐59. [DOI] [PubMed] [Google Scholar]
Edwards 2001
- Edwards A, Elwyn G, Covey J, Matthews E, Pill R. Presenting risk information: a review of the effects of "framing" and other manipulations on patient outcomes. Journal of Health Communication 2001;6:61‐82. [DOI] [PubMed] [Google Scholar]
Elbourne 2002
- Elbourne DR, Altman DG, Higgins JP, Curtin F, Worthington HV, Vail A. Meta‐analyses involving cross‐over trials: methodological issues. International Journal of Epidemiology 2002;31:140‐9. [DOI] [PubMed] [Google Scholar]
Feinstein 1992
- Feinstein AR. Invidious comparisons and unmet clinical challenges. American Journal of Medicine 1992;92(2):117‐20. [DOI] [PubMed] [Google Scholar]
Guyatt 2008
- Guyatt G, Oxman AD, Vist GE, Kunz R, Falck‐Ytter Y, Alonso‐Coello P, et al. GRADE: an emerging consensus on rating quality of evidence and strength of recommendations. BMJ 2008;336:924‐6. [DOI] [PMC free article] [PubMed] [Google Scholar]
Higgins 2003
- Higgins JPT, Thompson SG, Deeks JJ, Altman DG. Measuring inconsistency in meta‐analysis. BMJ 2003;327:557‐60. [DOI] [PMC free article] [PubMed] [Google Scholar]
Kristiansen 2002
- Kristiansen I, Gyrd‐Hansen D, Nexøe J, Nielsen J. Number needed to treat: easily understood and intuitively meaningful? Theoretical considerations and a randomized trial. Journal of Clinical Epidemiology 2002;55:888‐92. [DOI] [PubMed] [Google Scholar]
Moxey 2003
- Moxey A, O'Connell D, McGettigan P, Henry D. Describing treatment effects to patients. How they are expressed makes a difference. Journal of General Internal Medicine 2003;18(11):948‐59. [DOI] [PMC free article] [PubMed] [Google Scholar]
Nuovo 2002
- Nuovo J, Melnikow J, Chang D. Reporting number needed to treat and absolute risk reduction in randomized controlled trials. JAMA 2002;287:2813‐4. [DOI] [PubMed] [Google Scholar]
Rohrbaugh 1999
- Rohrbaugh CC, Shanteau J. Context, process, and experience: research on applied judgment and decision making. In: Durso F editor(s). Handbook of Applied Cognition. New York: John Wiley, 1999:115‐39. [Google Scholar]
Sorensen 2008
- Sorensen L, Gyrd‐Hansen D, Kristiansen IS, Nexøe J, Nielsen JB. Laypersons' understanding of relative risk reductions: Randomised cross‐sectional study. BMC Medical Informatics and Decision Making 2008;8:31. [DOI] [PMC free article] [PubMed] [Google Scholar]
Wiseman 1996
- Wiseman D, Levin IP. Comparing risky decision making under conditions of real and hypothetical consequences. Organizational Behavior and Human Decision Processes 1996;66:241‐50. [Google Scholar]