

Abstract
Background
There is evidence that certain antiepileptic drugs (AEDs) are teratogenic and are associated with an increased risk of congenital malformation. The majority of women with epilepsy continue taking AEDs throughout pregnancy; therefore it is important that comprehensive information on the potential risks associated with AED treatment is available.
Objectives
To assess the effects of prenatal exposure to AEDs on the prevalence of congenital malformations in the child.
Search methods
We searched the Cochrane Epilepsy Group Specialized Register (September 2015), Cochrane Central Register of Controlled Trials (CENTRAL) (2015, Issue 11), MEDLINE (via Ovid) (1946 to September 2015), EMBASE (1974 to September 2015), Pharmline (1978 to September 2015), Reprotox (1983 to September 2015) and conference abstracts (2010‐2015) without language restriction.
Selection criteria
We included prospective cohort controlled studies, cohort studies set within pregnancy registries and randomised controlled trials. Participants were women with epilepsy taking AEDs; the two control groups were women without epilepsy and women with epilepsy who were not taking AEDs during pregnancy.
Data collection and analysis
Three authors independently selected studies for inclusion. Five authors completed data extraction and risk of bias assessments. The primary outcome was the presence of a major congenital malformation. Secondary outcomes included specific types of major congenital malformations. Where meta‐analysis was not possible, we reviewed included studies narratively.
Main results
We included 50 studies, with 31 contributing to meta‐analysis. Study quality varied, and given the observational design, all were at high risk of certain biases. However, biases were balanced across the AEDs investigated and we believe that the results are not explained by these biases.
Children exposed to carbamazepine (CBZ) were at a higher risk of malformation than children born to women without epilepsy (N = 1367 vs 2146, risk ratio (RR) 2.01, 95% confidence interval (CI) 1.20 to 3.36) and women with untreated epilepsy (N = 3058 vs 1287, RR 1.50, 95% CI 1.03 to 2.19). Children exposed to phenobarbital (PB) were at a higher risk of malformation than children born to women without epilepsy (N = 345 vs 1591, RR 2.84, 95% CI 1.57 to 5.13). Children exposed to phenytoin (PHT) were at an increased risk of malformation compared with children born to women without epilepsy (N = 477 vs 987, RR 2.38, 95% CI 1.12 to 5.03) and to women with untreated epilepsy (N = 640 vs 1256, RR 2.40, 95% CI 1.42 to 4.08). Children exposed to topiramate (TPM) were at an increased risk of malformation compared with children born to women without epilepsy (N = 359 vs 442, RR 3.69, 95% CI 1.36 to 10.07). The children exposed to valproate (VPA) were at a higher risk of malformation compared with children born to women without epilepsy (N = 467 vs 1936, RR 5.69, 95% CI 3.33 to 9.73) and to women with untreated epilepsy (N = 1923 vs 1259, RR 3.13, 95% CI 2.16 to 4.54). There was no increased risk for major malformation for lamotrigine (LTG). Gabapentin (GBP), levetiracetam (LEV), oxcarbazepine (OXC), primidone (PRM) or zonisamide (ZNS) were not associated with an increased risk, however, there were substantially fewer data for these medications.
For AED comparisons, children exposed to VPA had the greatest risk of malformation (10.93%, 95% CI 8.91 to 13.13). Children exposed to VPA were at an increased risk of malformation compared with children exposed to CBZ (N = 2529 vs 4549, RR 2.44, 95% CI 2.00 to 2.94), GBP (N = 1814 vs 190, RR 6.21, 95% CI 1.91 to 20.23), LEV (N = 1814 vs 817, RR 5.82, 95% CI 3.13 to 10.81), LTG (N = 2021 vs 4164, RR 3.56, 95% CI 2.77 to 4.58), TPM (N = 1814 vs 473, RR 2.35, 95% CI 1.40 to 3.95), OXC (N = 676 vs 238, RR 3.71, 95% CI 1.65 to 8.33), PB (N = 1137 vs 626, RR 1.59, 95% CI 1.11 to 2.29, PHT (N = 2319 vs 1137, RR 2.00, 95% CI 1.48 to 2.71) or ZNS (N = 323 vs 90, RR 17.13, 95% CI 1.06 to 277.48). Children exposed to CBZ were at a higher risk of malformation than those exposed to LEV (N = 3051 vs 817, RR 1.84, 95% CI 1.03 to 3.29) and children exposed to LTG (N = 3385 vs 4164, RR 1.34, 95% CI 1.01 to 1.76). Children exposed to PB were at a higher risk of malformation compared with children exposed to GBP (N = 204 vs 159, RR 8.33, 95% CI 1.04 to 50.00), LEV (N = 204 vs 513, RR 2.33, 95% CI 1.04 to 5.00) or LTG (N = 282 vs 1959, RR 3.13, 95% CI 1.64 to 5.88). Children exposed to PHT had a higher risk of malformation than children exposed to LTG (N = 624 vs 4082, RR 1.89, 95% CI 1.19 to 2.94) or to LEV (N = 566 vs 817, RR 2.04, 95% CI 1.09 to 3.85); however, the comparison to LEV was not significant in the random‐effects model. Children exposed to TPM were at a higher risk of malformation than children exposed to LEV (N = 473 vs 817, RR 2.00, 95% CI 1.03 to 3.85) or LTG (N = 473 vs 3975, RR 1.79, 95% CI 1.06 to 2.94). There were no other significant differences, or comparisons were limited to a single study.
We found significantly higher rates of specific malformations associating PB exposure with cardiac malformations and VPA exposure with neural tube, cardiac, oro‐facial/craniofacial, and skeletal and limb malformations in comparison to other AEDs. Dose of exposure mediated the risk of malformation following VPA exposure; a potential dose‐response association for the other AEDs remained less clear.
Authors' conclusions
Exposure in the womb to certain AEDs carried an increased risk of malformation in the foetus and may be associated with specific patterns of malformation. Based on current evidence, LEV and LTG exposure carried the lowest risk of overall malformation; however, data pertaining to specific malformations are lacking. Physicians should discuss both the risks and treatment efficacy with the patient prior to commencing treatment.
Plain language summary
Treatment for epilepsy in pregnant women and the physical health of the child
Background
For most women who have epilepsy, continuing their medication during pregnancy is important for their health. Over the last 25 years, research has shown that children exposed to these medications in the womb can be at a higher risk of having a malformation or birth defect.
Research question
This review aimed to understand whether exposure to antiepileptic drugs (AEDs) during pregnancy is linked to an increased risk of having a child with a malformation.
Characteristics of the studies
The review included 50 published studies. We compared the children of women with epilepsy who were taking a single AED to the children of women without epilepsy or women who had epilepsy but who were not treating it with AEDs. We also made comparisons between children exposed to different AEDs in the womb. The evidence presented in this review was up to date in September 2015.
Results
The amount of data available from the studies reviewed varied greatly by the AED under investigation, and this could account for some of the findings.
‐ Children exposed to valproate compared to other AEDs had the highest level of risk of a malformation at 10.93%. The children exposed to valproate had a higher level of risk than both groups of control children and than children exposed to carbamazepine, gabapentin, levetiracetam, lamotrigine, oxcarbazepine, phenobarbital, phenytoin, topiramate and zonisamide. The level of risk of having a malformation was linked to the amount or dose of valproate the child was exposed to in the womb.
‐ Children exposed to carbamazepine were at a higher risk of malformations than both groups of control children and children exposed to levetiracetam and lamotrigine.
‐ Children exposed to phenobarbital were at a higher risk of malformations than children born to women without epilepsy but not those born to women with untreated epilepsy. They were also at a higher risk of malformation than children exposed to gabapentin, levetiracetam or lamotrigine.
‐ Children exposed to phenytoin were at an increased risk of malformation compared with both groups of control children and children exposed to levetiracetam and lamotrigine.; although the result of the comparison to levetriacetam is less clear.
‐ Children exposed to topiramate were at a higher risk of malformation than children born to women without epilepsy but not those born to women with untreated epilepsy. They were at a higher risk of malformation in comparison to the children exposed to levetiracetam or lamotrigine.
‐ There were no other significant differences between AEDs, or comparisons were limited to a single study.
‐ We also found higher rates of specific types of malformations, particularly associating phenobarbital exposure with heart malformations and valproate exposure with a range of specific types of malformation affecting a number of different areas of the body.
Quality of the studies
The quality of how studies were designed varied, but we do not consider that this accounts for the results of the review.
Conclusions
This review found that children exposed to valproate in the womb were at an increased risk of having a malformation at birth and that the level of risk is determined by the dose of valproate the child is exposed to. Based on current evidence, levetiracetam and lamotrigine appear to be the AEDs associated with the lowest level of risk, but more data are needed, particularly concerning individual types of malformation.
Background
Description of the condition
Epilepsy is a common disorder affecting up to 1% of the population (Hauser 1990). Approximately one third of people receiving antiepileptic drugs (AEDs) are of reproductive age (Yerby 1994), and between 0.5% to 0.6% of all pregnancies are reportedly exposed to an AED (Man 2012). There is a large body of research that demonstrates an association between children born to women with epilepsy treated with AEDs and an increased risk of congenital malformations, including cardiac, neural tube and craniofacial defects (Jentink 2010; Meador 2008; Tomson 2011).
Description of the intervention
AEDs are the most common treatment for epilepsy, and most women with epilepsy require treatment continuation during pregnancy. AEDs readily cross the placenta from the mother into the foetus (Bossi 1982).
How the intervention might work
Prospective observational studies (e.g. Canger 1999), registry‐based studies (e.g. Tomson 2011), large case control studies (Jentink 2010), and meta‐analysis studies (Meador 2008) provide evidence of an association between treatment with particular AEDs and an increased prevalence of malformations. There have been reports of differential outcomes for the AEDs with sodium valproate (VPA), which are associated with the largest increase in prevalence (Canger 1999; EURAP; Meador 2006; North American Register; UK Register).
The mechanisms through which prenatal exposure to AEDs is associated with an increased prevalence of major and minor congenital malformations remain unknown, and they may differ by treatment type. Therefore, this review investigates the outcomes for each monotherapy separately so as to provide the most reliable evidence available.
Why it is important to do this review
The decision to continue AED treatment during pregnancy requires taking a risk‐benefit decision. On the one hand, there is the potential risk exposure in utero that AEDs pose to the physical and neurodevelopment of the child, with lifelong implications when the medication in question is a teratogen (Bromley 2014). On the other hand lies the health and well‐being of the mother, who requires treatment for epilepsy throughout her pregnancy to minimise the risk of seizures, with varying efficacy against seizure activity depending on treatment type (EURAP STUDY GROUP 2006).
While a number of studies indicate a teratogenic risk from AEDs, there are conflicting results regarding the degree of risk and the type of malformations associated with specific AEDs, and the strength of the evidence is often limited by cohort size. This makes it difficult to counsel women about treatment choices before or during pregnancy. There is, therefore, a clear need for a systematic review and meta‐analysis of existing data to inform these decisions. Although randomised controlled trials (RCTs) would provide the most reliable evidence about the effects of AEDs taken in pregnancy, they have been considered unethical in this area, and even if undertaken would pose considerable difficulties in terms of design, recruitment and interpretation.
In view of this, we have decided to proceed with a systematic review of all available evidence including registry‐based, prospective cohort studies and RCTs. At the protocol stage we decided not to include malformation case‐control studies (e.g. Jentink 2010; Jentink 2010b) and studies using electronic health care resources (e.g. Wide 2004) due to the lack of understanding of how these methods compare to prospective observational cohort studies. This decision is discussed further in Overall completeness and applicability of evidence.
Evidence from this review along with the related review by the same Cochrane team will aid the decisions clinicians and women with epilepsy have to make about the treatment of epilepsy during the potential childbearing years (Bromley 2014). This review and its linked review, Bromley 2014 replace the previously published review entitled 'Common antiepileptic drugs in pregnancy in women with epilepsy' (Adab 2004).
Objectives
To assess the effects of prenatal exposure to commonly prescribed AEDs on the prevalence of congenital malformations in the child.
This review examines the association between AED exposure and the prevalence of congenital malformations compared to the general population or unexposed pregnancies in women with epilepsy. It also compares the prevalence of congenital malformations in children exposed to different monotherapy AEDs.
Methods
Criteria for considering studies for this review
Types of studies
We considered the following types of studies.
Randomised controlled trials (RCTs). These are studies that included women with epilepsy requiring treatment and randomised them to a particular AED prior to conception. The intervention group(s) comprised women with epilepsy taking an AED of interest as monotherapy.
Prospective observational cohort studies. These included consecutive participants from single or multicentre participating sites, where investigators collected information regarding the pregnancy and history prior to the birth of the child. The intervention group(s) comprised women with epilepsy taking an AED of interest as monotherapy.
Registry studies. Registry studies involve the collection of data from a wide region, country or number of countries, and recruitment is often based on self referral or clinician referral leading to non‐sequential case ascertainment. We considered both independent and industry‐sponsored registry datasets to be eligible. These included recruited pregnant women ascertained prospectively prior the birth of the child. The intervention group(s) comprised women with epilepsy taking an AED of interest as monotherapy.
Types of participants
Pregnant women with epilepsy taking a single AED of interest were eligible for the intervention group.
Participants eligible for the comparator groups were:
pregnant women with epilepsy taking an AED;
pregnant women with epilepsy taking no AED; or
pregnant women who do not have epilepsy.
We excluded studies reporting AED use solely in pregnant women with other conditions (e.g. mood disorders, pain, etc). We included studies involving women taking AEDs for epilepsy and other conditions, but we only included their results in meta‐analysis if the rate of other conditions was lower than 10% of the total treatment group.
Types of interventions
Intervention group
Women with epilepsy who received any of the following AEDs in monotherapy: phenobarbitone, phenytoin, carbamazepine, oxcarbazepine, sodium valproate, lamotrigine, topiramate, gabapentin, vigabatrin, tiagabine, zonisamide, levetiracetam, ethosuximide, clobazam, clonazepam, zonisamide, pregabalin, lacosamide, retigabine, rufinamide or sulthiame.
Comparator groups
We used two separate types of comparator groups in this review, as currently there is no clear evidence regarding the reliability of combining data from these two different groups. The two comparator groups are:
controls: women with a diagnosis of epilepsy who were not taking AEDs and women without epilepsy.
comparator treatment: women with epilepsy taking monotherapy treatment, evaluated in subgroup analyses to enable treatment comparisons.
Types of outcome measures
Primary outcomes
Major congenital malformations
The proportion of children who present with any type of major congenital malformation (as defined by original study authors). Major congenital malformations are structural abnormalities of the body or organs present from birth that impair viability and require significant intervention (EUROCAT).
Secondary outcomes
Specific major congenital malformations
The proportion of children who present with the following specific major congenital malformations by area of the body.
Neural tube malformations.
Cardiac malformations.
Orofacial cleft/craniofacial malformation.
Skeletal or limb malformations.
We chose the above disorders because they are important major malformations associated with exposure to AEDs in utero and because of the availability of data within the included studies (Brent 2004). When extracting data from included studies, we compiled a list of all the specified malformations. JCS, a clinical geneticist, then reviewed the list and classified the items into one of the four specific malformation categories.
Minor congenital malformations
Minor congenital malformations are a structural anomaly or dysmorphic feature present from birth which does not impair viability or require intervention or treatment (EUROCAT).
The proportion of children who present with the following minor congenital malformations.
All minor congenital malformations.
Eyes (e.g. epicanthal folds, hypertelorism).
Ears (e.g. low set ears).
Nose (e.g. flat and or broad nasal bridge, long/short/shallow philtrum, anteverted nostrils).
Mouth (e.g. microstomia, prominent lower lip, thin upper lip).
Digits (e.g. distal phalangeal, finger or nail hypoplasia, arachnodactyly, toe or toenail hypoplasia).
Limb (not inducing significant life impacting difficulty, e.g. mild talipes correctable by physiotherapy, and not requiring surgical correction, e.g. limb reduction, congenital dislocation of hip, joint laxity).
Other (e.g. hernia, sacral dimples).
Search methods for identification of studies
Electronic searches
We searched the following databases.
Cochrane Epilepsy Review Group Specialized Register, using the search strategy set out in Appendix 1 (14 September 2015).
The Cochrane Central Register of Controlled trials (CENTRAL, The Cochrane Library, 2015 Issue 9), using the search strategy set out in Appendix 2.
MEDLINE (Ovid) using the search strategy set out in Appendix 3 (1946 to September 2015).
EMBASE (1974 to September 2015).
Pharmline (1978 to September 2015).
Reprotox (1983 to September 2015).
ClinicalTrials.gov, using the search terms: "congenital malformation" AND epilepsy (14 September 2015).
WHO International Clinical Trials Registry Platform (ICTRP) using the search terms: congenital malformation AND epilepsy (15 September 2015).
We adapted the MEDLINE search strategy to meet requirements of the EMBASE, Pharmline and Reprotox databases.
We did not impose any language restrictions in the search, and when necessary we obtained translations of articles written in languages other than English.
Searching other resources
We reviewed conference abstracts from neurology meetings published from 2010 to 2015 , including abstracts from the International League Against Epilepsy meetings (American Epilepsy Society, International Epilepsy Congress, European Congress on Epileptology, Asian and Oceanian Epilepsy Congress and Latin American Congress on Epilepsy) and Teratology meetings (The Teratology Society and European Teratology Society). Where possible, we linked abstracts to published datasets or categorised them as awaiting classification.
We handsearched the Epilepsia Journal supplements from 2010 to 2015 for conference proceedings.
We cross matched reference lists of original research and review articles to the studies generated from the electronic searches. We handsearched reference lists of recent review articles and contacted lead and corresponding authors in the area for any relevant unpublished material.
Data collection and analysis
Selection of studies
Three authors (RB, JW, JG) reviewed the titles and abstracts of articles highlighted by the searches and removed studies that obviously did not meet the inclusion criteria. Two authors (RB, JW) used full‐text reports to determine study eligibility. We discussed disagreements and sought the opinion of a third author (JG) when necessary. Multiple reports from single studies are common in this field, so if it was unclear if study populations overlapped, we linked them together by date of recruitment and tried to contact authors to determine whether different reports referred to single study populations..
Data extraction and management
Five authors (RB, JW, NA, JG, AM) undertook data extraction on the included studies by splitting the number of studies into equal parts. We used pre‐standardised electronic data extraction forms that members of the review team piloted and then amended where necessary. We then cross‐checked data extraction.
Assessment of risk of bias in included studies
Due to the observational design of some of the studies, we decided to utilise a draft version of the extended Cochrane tool for assessing risk of bias, which the Cochrane Non‐Randomised Studies Methods Group was developing. This has now been superseded by the ROBINS‐I tool that will be used in future updates of this review. The extended version of the Cochrane tool for assessing risk of bias examines selection bias (sequence generation, allocation concealment), performance bias (blinding), attrition bias (incomplete outcome data, blinding), detection bias (blinding, other potential threats to validity), reporting bias (selective outcome reporting) and the influence of confounding variables. We used a five‐point scale to rate the domains of blinding, incomplete outcome data, selective outcome reporting, confounding variables and other bias according to the risk of bias on the outcome. See Appendix 4 and Appendix 5 for extended risk of bias tools. The review authors determined the parameters of this scale; see Table 1 for scale parameters.
1. Risk of bias scale parameters.
|
1 Low risk |
2 | 3 | 4 |
5 High risk |
|
| Confounding | All important1 confounders considered2 and suitable method of adjustment3 employed. Outcome unlikely to be affected. | Most important4 confounders considered and suitable method of adjustment employed. Outcome unlikely to be affected. | Some confounders5 considered and full or partial adjustment employed6. Possible implication on outcome. | Some confounders considered and no adjustment employed. Likely to affect outcome. | No important confounders considered and no adjustment employed. Likely to affect outcome. |
| Blinding | Assessors blinded to participant's drug regimen and participants blinded to drug regimen. Outcome unlikely to be affected. | Assessors blinded to participants drug regimen. Outcome unlikely to be affected | Partial blinding7 involved in study. Possible implication on outcome. | Partial or no blinding involved in study. Outcome likely to be affected. | No blinding involved in study. Outcome likely to be affected. |
| Incomplete outcome data | No missing data and/or appropriate analysis8 used to deal with missing data. Unlikely to affect outcome. |
Smaller amount (<25%) of missing data with reasons given, balanced across groups. Unlikely to affect outcome. | Larger amount of missing data (>25%) with or without reasons given, balanced across groups. Possible implication on outcome. | Larger amount (>25%) of missing data, imbalance across groups. Outcome likely to be affected. |
No information provided regarding missing data. Likely to affect outcome. |
| Selective outcome reporting | A priori outcomes measured, analysed and reported in main report. Protocol available. Unlikely to affect outcome. | A priori outcomes measured, analysed and reported in main report9. Protocol not available. Unlikely to affect outcomes. | Limited information regarding a priori outcomes and measures. Possible implication on outcome. | Outcomes measured but not analysed or reported. Outcome likely to be affected. | Outcomes measured but not analysed or reported and clinical judgement infers the presence of an unreported measured outcome10. Likely to affect outcome. |
| Other bias | No other bias identified. | Bias identified. Unlikely to affect outcome. | Bias identified. Possible implication on outcome. | Bias identified. Likely to affect outcome. | Bias identified. Extremely likely to affect outcome. |
1 Important confounders include: maternal factors (socio‐economic status, folate use, age, parity, epilepsy type, seizure exposure, polytherapy, other concomitant disease, smoking, alcohol and child factors (family history of malformations, gestational age, birth weight, sex and ethnicity).
2 Reported demographic information and other confounders.
3 Matching scores, multiple regression, analysis of co‐variance, stratification.
4 At least five out of eight of important confounders include: socio‐economic status, folate use, gestational age, family history of malformations.
5 At least two out of eight of important confounders.
6 Full adjustment of confounding variables e.g. see footnote 2 or partial adjustment e.g. researchers select limited number of variables to adjust for.
7 Assessors of outcome are only blinded to certain groups e.g. blinded to intervention group but not controls.
8 Intention‐to‐treat analysis.
9 An a priori statement is made in methods section of main report regarding measurement and analysis of outcome.
10 For example, no data reported on number of deaths when obvious this outcome must have been recorded.
For RCTs, we assessed all domains of the current Cochrane tool for assessing risk of bias (Higgins 2011).
We intended, where applicable, to create 'Summary of findings' tables for outcomes and to grade each outcome accordingly using the GRADE (Grading of Recommendations Assessment, Development and Evaluation) approach (Guyatt 2008). However, we did not create 'Summary of findings' tables due to the complexity and vast amount of comparisons this review investigates (see Differences between protocol and review).
Measures of treatment effect
Both the primary and secondary outcomes are presented as risk ratios (RRs). We also computed risk differences (RDs) using Review Manager (RevMan) to take into account studies with no reported events. We calculated these effect estimates in accordance with the Cochrane Handbook for Systematic Reviews of Interventions and reported them in the results section (Higgins 2011).
In some cases the reporting of the analyses were required to be presented the opposite way around to the meta‐analyses (i.e. Table 2). These were calculated as follows: A risk ratio for A vs. B is presented as RR [Lower Limit (LL), Upper Limit (UL)]. A risk ratio for B vs. A can be calculated as the reciprocal by (1/RR) [1/UL, 1/LL]. A risk difference for A vs. B is presented as RD [LL, UL]. A risk difference for B vs. A can be calculated by RD*(‐1) [UL*(‐1), LL*(‐1)].
2. Risk Ratios and Risk Differences‐ Overall Malformation Risk.
| Active | CBZ | GBP | LEV | LTG | OXC | PB | PHT | PRM | TPM | VPA | ZNS |
| Comparator | |||||||||||
| Women without epilepsy |
RR: 2.01 (1.20, 3.36) RD: 0.02 (0.00*, 0.03) |
RR: 0.61 (0.07, 5.18) RD: −0.00 (−0.02, 0.01) |
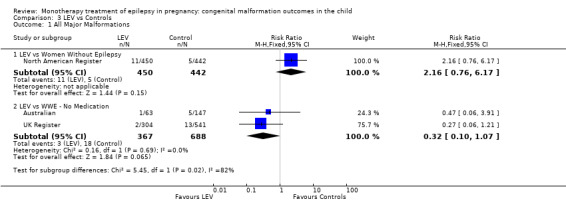
RR: 2.16 (0.76, 6.17) RD: 0.01 (−0.00, 0.03) |
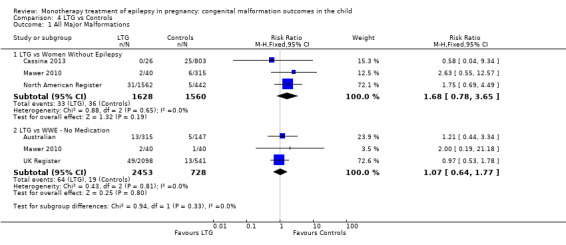
RR: 1.68 (0.78, 3.65) RD: 0.01 (−0.00, 0.02) |
RR: 1.94 (0.53, 7.15) RD: 0.01 (−0.01, 0.03) |
RR: 2.84 (1.57, 5.13) RD: 0.04 (0.01, 0.06) |
RD: 2.38 (1.12, 5.03) RD: 0.02 (−0.00, 0.04) |
RR: 0.48 (0.03, 8.43) RD: −0.04 (−0.12, 0.03) |
RR: 3.69 (1.36, 10.07) RD: 0.03 (0.01, 0.05) |
RR: 5.69 (3.33, 9.73) RD: 0.08 (0.05, 0.11) |
RR: 0.44 (0.02, 7.93) RD: −0.01 (−0.03, 0.01) |
| Women with epilepsy untreated | RR: 1.50 (1.03, 2.19) RD: 0.01 (0.00*, 0.03) | RR: 1.16 (0.23, 5.93) RD: −0.00 (−0.06, 0.05) |
RR: 0.32 (0.10, 1.07) RD: −0.02 (−0.03, −0.00) |
RR: 1.07 (0.64, 1.77) RD: 0.00 (−0.01, 0.02) | RR: 2.75 (0.53, 14.43) RD: 0.03 (−0.09, 0.14) |
RR: 1.95 (0.97, 3.93), P = 0.06 RD: 0.03 (−0.01, 0.07) | RR: 2.40 (1.42, 4.08) RD: 0.03 (0.01, 0.06) |
RR(FE): 2.81 (1.13, 7.02) RR(RE): 3.92 (0.76, 20.14), P = 0.10 RD: 0.07 (−0.00, 0.14) |
RR: 1.99 (0.65, 6.08) RD: 0.02 (−0.02, 0.05) | RR: 3.13 (2.16, 4.54), p<0.00001 RD: 0.06 (0.04, 0.08) | RR: No studies RD: No studies |
| CBZ | RR: 0.44 (0.13, 1.49) RD: −0.02 (−0.04, −0.00) |
RR: 0.54 (0.30, 0.97) RD: −0.01 (−0.02, −0.00) |
RR: 0.75 (0.57, 0.990) RD: −0.01 (−0.02, −0.00) |
RR: 0.69 (0.32, 1.52) RD: 0.01 (−0.01, 0.04), |
RR: 1.19 (0.86, 1.67) RD: 0.01 (−0.02, 0.03) | RR: 1.22 (0.90, 1.64) RD: 0.01 (−0.01, 0.02) |
RR(FE): 1.25 (0.64, 2.44) RR(RE): 1.56 (0.50, 4.76) RD: 0.02 (−0.05, 0.09) |
RR: 1.28 (0.76, 2.13) RD: 0.01 (−0.01, 0.03) |
RR: 2.44 (2.00, 2.94) RD: 0.05 (0.04, 0.07) |
RR: 0.18 (0.01, 2.94), RD: −0.03(−0.05, −0.01) |
|
| GBP | RR: 2.28 (0.67, 7.79) RD: 0.02 (0.00*, 0.04) |
RR: 1.52 (0.43, 5.42) RD: 0.01 (−0.01, 0.03) |
RR: 1.67 (0.48,5.88) RD: 0.01 (−0.01, 0.03) |
RR: 3.23 (0.36, 25.00) RD: 0.01 (−0.01, 0.04) |
RR: 8.33 (1.04, 50.00) RD: 0.05 (0.01, 0.08) |
RR: 2.81 (0.77, 10.23) RD: 0.03 (0.00*, 0.05) |
RR: No studies RD: No studies |
RR: 3.13 (0.85, 11.11) RD: 0.03 (0.01, 0.05) |
RR: 6.21 (1.91, 20.23) RD: 0.08 (0.05, 0.11) |
RR: 0.53 (0.02, 12.50) RD: −0.01 (−0.03, 0.02) |
|
| LEV |
RR: 1.84 (1.03, 3.29) RD: 0.01 (0.00*, 0.02) |
RR: 0.66 (0.18, 2.33) RD: −0.01 (−0.03, 0.01) |
RR(FE): 1.37 (0.78, 2.44) RR(RE): 1.61 (0.53, 5.00) RD: 0.01 (−0.00, 0.02) |
RR: 0.95 (0.33, 2.78) RD: −0.00 (−0.03, 0.02) |
RR: 2.33 (1.04, 5.00) RD: 0.03 (−0.01, 0.06) |
RR(FE): 2.04 (1.09, 3.85) RR(RE): 2.94 (0.67, 12.50) RD(FE): 0.02 (0.00*, 0.04) RD(RE): 0.03 (−0.01, 0.06) |
RR: No studies RD: No studies |
RR: 2.00 (1.03, 3.85) RD: 0.02 (−0.00, 0.04) |
RR: 5.82 (3.13, 10.81) RD(FE): 0.07 (0.05, 0.09) RD(RE): 0.08 (0.05, 0.10) |
RR: 0.22 (0.01, 3.57) RD: −0.02 (−0.05, −0.00) |
|
| LTG |
RR: 1.34 (1.01, 1.76) RD: 0.01 (0.00*, 0.02) |
RR: 0.60 (0.17, 2.07) RD: −0.01 (−0.03, 0.01) |
RR(FE): 0.73 (0.41, 1.29) RR(RE): 0.62 (0.20, 1.88) RD: −0.01 (−0.02, 0.00) |
RR: 1.08 (0.41, 2.86) RD: −0.00 (−0.02, 0.02) |
RR: 3.13 (1.64, 5.88) RD: 0.04 (0.01, 0.07) |
RR: 1.89 (1.19, 2.94) RD: 0.02 (0.00*, 0.04) |
RR: No studies RD: No studies |
RR: 1.79 (1.06, 2.94) RD: 0.02 (−0.00, 0.04) |
RR: 3.56 (2.77, 4.58) RD (FE): 0.06 (0.05, 0.07) RD(RE): 0.08 (0.05, 0.11) | RR: 0.27 (0.02, 4.35) RD: −0.02 (−0.04, −0.00) |
|
| OXC | RR: 1.44 (0.66, 3.16) RD: 0.01 (−0.01, 0.04) |
RR: 0.31 (0.04, 2.78) RD: −0.01 (−0.04, 0.01) |
RR: 1.05 (0.36, 3.03) RD: 0.00 (−0.02, 0.03) |
RR: 0.93 (0.35, 2.43) RD: 0.00 (−0.02, 0.02) |
RR: 2.52 (0.98, 6.43) RD: 0.03 (−0.01, 0.08) |
RR: 1.08 (0.43, 2.71) RD: 0.00 (−0.02, 0.03) |
RR: 1.49 (0.11, 20.00) RD: 0.06 (−0.31, 0.42) |
RR: 1.75 (0.64, 5.00) RD: 0.02 (−0.01, 0.05) |
RR: 3.71 (1.65, 8.33) RD: 0.08 (0.04, 0.11) |
RR: 0.22 (0.01, 4.17) RD: −0.02 (−0.05, 0.01) |
|
| PB | RR: 0.84 (0.60, 1.16) RD: −0.01 (−0.03, 0.02) |
RR: 0.12 (0.02, 0.96) RD: −0.05 (−0.08, −0.01) |
RR: 0.43 (0.20, 0.96) RD: −0.03 (−0.06, 0.01) |
RR: 0.32 (0.17, 0.61) RD: −0.04 (−0.07, −0.01) | RR: 0.40 (0.16, 1.02) RD: −0.03 (−0.08, 0.01) |
RR: 0.80 (0.53, 1.21) RD: −0.01 (−0.04, 0.02) |
RR: 2.00 (0.86, 4.76) RD: 0.05 (−0.02, 0.12) |
RR: 0.74 (0.35, 1.54) RD: −0.01 (−0.05, 0.03) |
RR: 1.59 (1.11, 2.29) RD: 0.04 (0.01, 0.08) |
RR: 0.10 (0.01, 1.61) RD: −0.06 (−0.09, −0.02) |
|
| PHT | RR: 0.82 (0.61, 1.11) RD: −0.01 (−0.02, 0.01) |
RR: 0.36 (0.10, 1.30) RD: −0.03 (−0.05, −0.00) |
RR(FE): 0.49 (0.26, 0.92) RR(RE): 0.34 (0.08, 1.50) RD(FE): −0.02 (−0.04, −0.00) RD(RE): −0.03 (−0.06, 0.01) |
RR: 0.53 (0.34, 0.84) RD: −0.02 (−0.04, −0.00) |
RR: 0.93 (0.37, 2.33) RD: −0.00 (−0.03, 0.02) |
RR: 1.25 (0.83, 1.89) RD: 0.01 (−0.02, 0.04) |
RR: 1.22 (0.60, 2.50) RD: 0.02 (−0.06, 0.09) |
RR: 1.11 (0.60, 2.04) RD: 0.00 (−0.02, 0.03) |
RR: 2.00 (1.48, 2.71) RD: 0.05 (0.03, 0.08) |
RR: 0.18 (0.01, 3.03) RD: −0.03 (−0.05, −0.01) |
|
| PRM | RR(FE): 0.80 (0.41, 1.57) RR(RE): 0.64 (0.21, 2.01) RD: −0.02 (−0.09, 0.05) |
RR: No studies RD: No studies |
RR: No studies RD: No studies |
RR: No studies RD: No studies |
RR: 0.67 (0.05, 8.73) RD: −0.06 (−0.42, 0.31) |
RR: 0.50 (0.21, 1.16) RD: −0.05 (−0.12, 0.02) |
RR: 0.82 (0.40, 1.68) RD: −0.02 (−0.09, 0.06) |
RR: No studies RD: No studies |
RR: 1.39 (0.71, 2.70) RD: 0.04 (−0.05, 0.13) |
RR: No studies RD: No studies |
|
| TPM | RR: 0.78 (0.47, 1.31) RD: −0.01 (−0.03, 0.01) |
RR: 0.32 (0.09, 1.17) RD: −0.03 (−0.05, −0.01) |
RR: 0.50 (0.26, 0.97) RD: −0.02 (−0.04, 0.00) |
RR: 0.56 (0.34, 0.94) RD: −0.02 (−0.04, 0.00) |
RR: 0.57 (0.20, 1.57) RD: −0.02 (−0.05, 0.01) |
RR: 1.36 (0.65, 2.84) RD: 0.01 (−0.03, 0.05) |
RR: 0.90 (0.49, 1.67) RD: −0.00 (−0.03, 0.02) |
RR: No studies RD: No studies |
RR: 2.35 (1.40, 3.95) RD(FE): 0.05 (0.03, 0.08) RD(RE): 0.06 (0.01, 0.10) |
RR: 0.13 (0.01, 2.13) RD: −0.04 (−0.07, −0.02) |
|
| VPA |
RR: 0.41 (0.34, 0.50) RD: −0.05 (−0.07, −0.04) |
RR: 0.16 (0.05, 0.52) RD: −0.08 (−0.11, −0.05) |
RR: 0.17 (0.09, 0.32) RD(FE): −0.07 (−0.09, −0.05) RD(RE): −0.08 (−0.10, −0.05) |
RR: 0.28 (0.22, 0.36) RD(FE): −0.06 (−0.07, −0.05) RD(RE): −0.08 (−0.11, −0.05) |
RR: 0.27 (0.12, 0.61) RD: −0.08 (−0.11, −0.04) |
RR: 0.63 (0.44, 0.90) RD: −0.04 (−0.08, −0.01) |
RR: 0.50 (0.37, 0.68) RD: −0.05 (−0.08, −0.03) |
RR: 0.72 (0.37, 1.40) RD: −0.04 (−0.13, 0.05) |
RR: 0.43 (0.25, 0.71) RD(FE): −0.05 (−0.08, −0.03) RD(RE): −0.06 (−0.10, −0.01) |
RR: 0.06 (0.004, 0.94) RD: −0.09 (−0.13, −0.06) |
|
| ZNS | RR: 5.54 (0.34, 89.86) RD: 0.03 (0.01, 0.05) |
RR: 1.87 (0.08, 45.41) RD: 0.01 (−0.02, 0.03) |
RR: 4.64 (0.28, 78.05) RD: 0.02 (0.00*, 0.05) |
RR: 3.67 (0.23, 59.46) RD: 0.02 (0.00*, 0.04) |
RR: 4.48 (0.24, 82.23) RD: 0.02 (−0.01, 0.05) |
RR: 10.46 (0.62, 175.67) RD: 0.06 (0.02, 0.09) |
RR: 5.46 (0.33, 91.31) RD: 0.03 (0.01, 0.05) |
RR: No studies RD: No studies |
RR: 7.84 (0.47, 129.74) RD: 0.04 (0.02, 0.07) |
RR: 17.13 (1.06, 277.48) RD: 0.09 (0.06, 0.13) |
Results highlighted bold were statistically significant
*Confidence limit rounded to be on boundary of significance.
Unit of analysis issues
Data published in studies are often duplicated with updated data over time, particularly in the case of the prospective pregnancy registries, which update their publications as the numbers of enrolled pregnancies increases. In such cases, we considered the latest time point as the main study. In some cohorts, this meant that investigators used different publications for different AEDs. Further, there are studies that report on data from a number of registers (e.g. EURAP; Samren 1997); we could not confirm the independence of this data and therefore only reviewed these studies narratively. We carefully examined data to ensure that we did not include them more than once in the analysis and that we did not omit any non‐duplicated data. Where appropriate, we intended to use subgroup analysis to account for the likelihood of omitting non‐duplicated data. We expected studies to use different definitions of major and minor congenital malformations, and we examined these variations thoroughly in order to inform the combination of data for analysis.
Dealing with missing data
We contacted study authors to obtain missing statistics from studies. We also investigated reasons for missing data to determine if they were missing at random or not.
Assessment of heterogeneity
We assessed clinical heterogeneity by examining the differences in study characteristics in order to inform decisions regarding the combination of study data in meta‐analysis. A priori hypotheses of sources of clinical heterogeneity included: type of population (regional, national or international, single or multicentre), loss to follow‐up, maternal factors including age, duration of AED treatment, family history of congenital malformation, lifestyle factors, monotherapy, socioeconomic status, type of epilepsy, use of other medications and years of education. Child factors included: age of assessment, gestational age at birth, sex, seizure exposure, time of follow‐up and outcome measurement. Where applicable, we also assessed statistical heterogeneity by examining the I2 statistic and a Chi2 test, using the guidelines outlined in Higgins 2011 for interpreting the results. According to these guidelines, an I2 statistic of 0% to 40% may not be important, 30% to 60% may indicate moderate heterogeneity, 50% to 90% may indicate substantial heterogeneity and 75% to 100% indicated considerable heterogeneity. Therefore for this review, we considered an I2 statistic of more than 50% to indicate significant heterogeneity. The I2 statistic was not applicable in comparisons where there was only a single study or when only one study contributed data to the analysis. When interpreting the Chi2 test, a P value of less than 0.01 was considered to indicate significant heterogeneity. When we found statistical heterogeneity, we presented both fixed‐effect and random‐effects analyses to enable exploration of differences.
Assessment of reporting biases
We investigated included studies using the ORBIT classification system if we suspected selective outcome reporting bias. We requested all protocols from included study authors to enable comparison of outcomes of interest; however, we received very little response from them, complicating our performance of this comparison.
Our comprehensive search of multiple sources, together with our requests for unpublished data from authors, minimised the risk of publication bias. We looked for small‐study effects to establish the likelihood of publication bias and examined funnel plots when we could combine an appropriate number of studies. Cochrane recommends combining a minimum of 10 studies when examining funnel plots (Higgins 2011). We found no evidence of reporting bias in the funnel plot inspection.
Data synthesis
We employed both fixed‐effect and random‐effects meta‐analyses to synthesise the data. We presented the primary outcome (major congenital malformations) and the secondary outcome of specific malformations as a risk ratio (RR). We intended to present the secondary outcome (minor congenital malformations) as an RR; however, meta‐analysis was not possible due to extremely limited data.
Due to the small number of events within certain comparisons, we have also presented the risk differences (RD) for both the primary outcome and the secondary outcome of specific malformation type. In the event that we deemed meta‐analysing appropriate (e.g. presence of clinical heterogeneity), we applied a narrative form to the review, discussing all comparisons according to the findings presented within the studies.
Comparisons carried out included:
specific intervention monotherapy group versus controls on major congenital malformations;
specific intervention monotherapy group versus controls on specific major congential malformation types;
specific intervention monotherapy group versus specific intervention monotherapy group on major congential malformations;
specific intervention monotherapy group versus specific intervention monotherapy group on specific major congential malformations.
We stratified each comparison by control group and comparator group to ensure appropriate combination of study data.
Subgroup analysis and investigation of heterogeneity
Subgroup analysis was stratified by AED and type of control or comparator group. When heterogeneity was present across outcomes, we carried out a random‐effects analysis. We examined differences between analyses and reported the appropriate analysis.
Sensitivity analysis
We intended to carry out sensitivity analysis if we found peculiarities in study quality, but this step was not required.
Results
Description of studies
Results of the search
The search identified 11,695 records from the databases outlined in Electronic searches, and we found 48 records through handsearching. Following the removal of duplicates, 11,348 records remained; these were screened for inclusion in the review. We excluded 11,215 records due to irrelevance, leaving 133 full texts (80 unique studies) to be assessed for eligibility. We excluded 21 and categorised 9 as 'awaiting classification' (Babic 2014; Idriz‐Oglu 2014; Jones 1992; Kaabi 2013; Kutlu 2013; Lazzaroni Fossati 1986; Midi 2014; Shvartzman 1986; Vlasov 2014). See Characteristics of excluded studies and Characteristics of studies awaiting classification for available details of these studies and Figure 1 for the study flow diagram. We ultimately included 50 studies in the review, from 103 reports; we included 31 of these in the meta‐analyses, with the remainder contributing to the review narratively.
1.
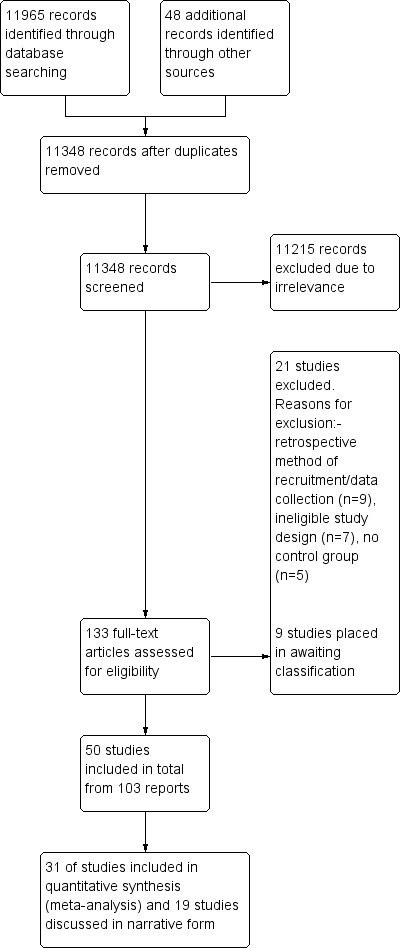
Study flow diagram.
Included studies
A total of 103 included full texts reported on 50 independent studies included in this review, of which all but one were non‐randomised studies. There were 53 linked papers pertaining to 23 studies. These full texts were related to an included study, as they presented information on the same cohort of children but either at a different time point or on a related, but not included, outcome (i.e. obstetric or neurodevelopmental outcome).
Excluded studies
We excluded 21 studies from the review (Annegers 1974; Artama 2013; Arteaga‐Vazques 2012; Baermig 1973; Canun‐Serrano 1986; Castilla‐Puentes 2014; Dobos 1985; Elshove 1971; Holmes 1994; Jacobsen 2014; Knight 1975; Lamotrigine Pregnancy Register; Miskov 2009; Monson 1973; Montouris 2003; Mostacci 2014; Nakane 1980; Pearse 1992; Robert 1983; Starveld‐Zimmerman 1975; Veiby 2014). Several of these papers were not written in the English language and therefore were sent for translation and data extraction in order to determine the study design and methodology used. Sixteen of the excluded studies employed a retrospective design or they were classed as a record linkage study or case series, and were therefore not eligible for inclusion within this review.
Risk of bias in included studies
We rated all domains of bias except sequence generation and allocation concealment on a scale of 1 (low risk of bias) to 5 (high risk of bias). We describe the scale parameters for each domain in Table 1. We rated sequence generation and allocation concealment as having low, high or unclear risk of bias.
Allocation
For the domains of sequence generation and allocation concealment, we rated all included studies as being at high risk of bias. Whether carried out prospectively or as a registry study, the included studies did not employ rigorous methods (that is, randomisation to treatment), as the research questions were not conducive to the features of these types of study design. However, the non‐randomised risk of bias tool used in this review required the assessment of these two domains. See Figure 2 for a summary of risk of bias judgements. There was one RCT; however, it provided no information regarding randomisation to the treatment group (controls were not randomised), and therefore we still considered this study to be at high risk of bias (Barqawi 2005).
2.
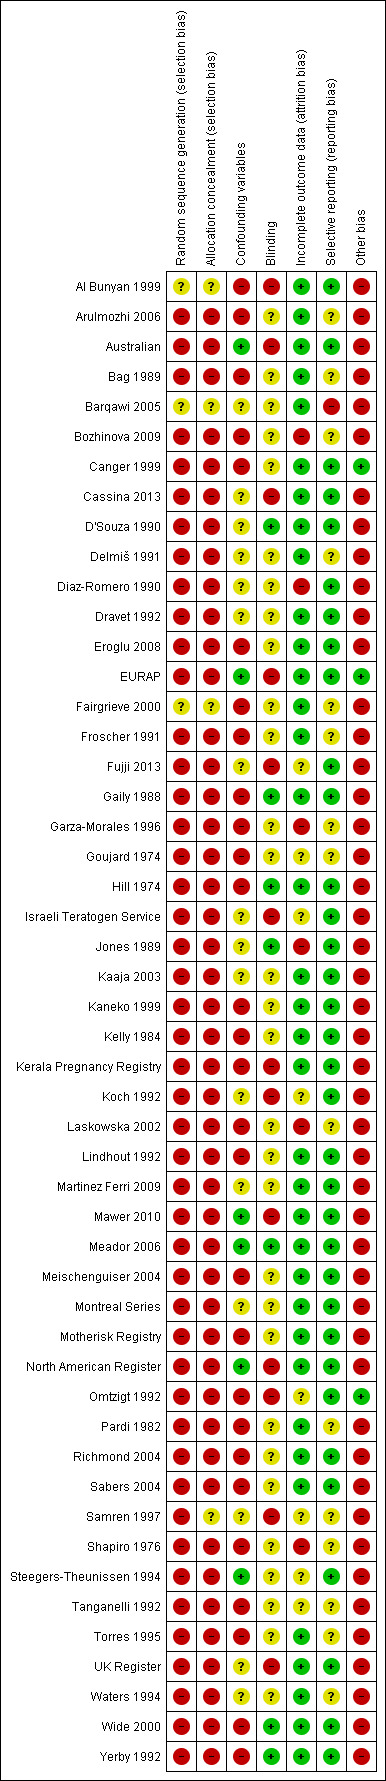
Risk of bias summary: review authors' judgements about each risk of bias item for each included study.
Blinding
We did not rate any studies as '1', which would have meant that assessors and participants were blinded to drug regimen. Eight studies employed full assessor blinding (D'Souza 1990; Gaily 1988; Hill 1974; Jones 1989; Mawer 2010; Meador 2006; Wide 2000; Yerby 1992). Motherisk Registry employed partial blinding with a possible impact on outcome, whilst Kerala Pregnancy Registry employed partial blinding with a likely effect on outcome. Ten studies did not employ any blinding of assessors, and usually their judgements regarding the presence or absence of a malformation were made in routine healthcare situations (Al Bunyan 1999; Australian; Cassina 2013; EURAP; Israeli Teratogen Service; Koch 1992; North American Register; Omtzigt 1992; Samren 1997; UK Register). Unfortunately, 30 studies failed to provide information as to whether the outcome assessors were blinded or not, and therefore we had to rate them as being at an unclear risk (Arulmozhi 2006; Bag 1989; Barqawi 2005; Bozhinova 2009; Canger 1999; Delmiš 1991; Diaz‐Romero 1990; Dravet 1992; Eroglu 2008; Fairgrieve 2000; Froscher 1991; Fujji 2013; Garza‐Morales 1996; Goujard 1974; Kaaja 2003; Kaneko 1999; Kelly 1984; Laskowska 2002; Lindhout 1992; Martinez Ferri 2009; Meischenguiser 2004; Montreal Series; Pardi 1982; Richmond 2004; Sabers 2004; Shapiro 1976; Steegers‐Theunissen 1994; Tanganelli 1992; Torres 1995; Waters 1994) leaving open the possibility that the outcomes were affected by knowledge of the AED treatment.
Incomplete outcome data
We assigned a rating of '1' to only five studies, as there were no missing data (Al Bunyan 1999; Barqawi 2005; D'Souza 1990; Delmiš 1991; Richmond 2004). We gave the majority of studies a '2', as there was only a small amount of missing data from the reports (< 25%), and study authors gave appropriate reasons (i.e. foetal loss or loss to follow‐up) (Arulmozhi 2006; Australian; Bag 1989; Canger 1999; Cassina 2013; Dravet 1992; Eroglu 2008; EURAP; Fairgrieve 2000; Froscher 1991; Gaily 1988; Hill 1974; Kaaja 2003; Kaneko 1999; Kelly 1984; Kerala Pregnancy Registry; Lindhout 1992; Martinez Ferri 2009; Mawer 2010; Meador 2006; Meischenguiser 2004; Montreal Series; Motherisk Registry; North American Register; Omtzigt 1992; Pardi 1982; Sabers 2004; Torres 1995; UK Register; Waters 1994; Wide 2000; Yerby 1992). We assigned a rating of '3' to Israeli Teratogen Service, as there was a possible impact from missing data on the assessment of outcomes due to a larger amount of missing data, and to six other studies where the number of participants recruited or analysed was unclear, introducing a possible impact of missing data on study outcomes (Fujji 2013; Goujard 1974; Koch 1992; Samren 1997; Steegers‐Theunissen 1994; Tanganelli 1992). We rated Jones 1989 as '4', as there was a large amount of missing data that was imbalanced across the groups, suggesting a likely effect on the outcomes. Finally, we rated five studies a '5', suggesting a high risk of bias, due to the lack of information pertaining to missing data (Bozhinova 2009; Diaz‐Romero 1990; Garza‐Morales 1996; Laskowska 2002; Shapiro 1976).
Selective reporting
We rated selective outcome reporting on a scale of 1 to 5, where '1' denotes a low risk of bias and '5' a high risk of bias. We requested study protocols from authors with contact details available on the Internet. We received only 14 responses and eight protocols (Australian; Cassina 2013; Fujji 2013; Israeli Teratogen Service; Mawer 2010; Meador 2006; UK Register; Wide 2000). For the eight studies with an available protocol, we assigned a rating of '1' for low risk of bias, as there was no evidence of selective outcome reporting following protocol review.
We assigned a '2' to the majority of studies, as there was no evidence of selective outcome reporting within the publications (Al Bunyan 1999; Canger 1999; D'Souza 1990; Diaz‐Romero 1990; Dravet 1992; Eroglu 2008; EURAP; Gaily 1988; Hill 1974; Jones 1989; Kaaja 2003; Kaneko 1999; Kelly 1984; Kerala Pregnancy Registry; Koch 1992; Lindhout 1992; Martinez Ferri 2009; Meischenguiser 2004; Montreal Series; Motherisk Registry; North American Register; Omtzigt 1992; Richmond 2004; Sabers 2004; Samren 1997; Steegers‐Theunissen 1994; Yerby 1992); however, we could not test the studies against their protocols, as they were not available. We rated 15 studies as '3', as the risk of bias was unclear due to limited information regarding a priori outcomes in the text (Arulmozhi 2006; Bag 1989; Barqawi 2005; Bozhinova 2009; Delmiš 1991; Fairgrieve 2000; Froscher 1991; Garza‐Morales 1996; Goujard 1974; Laskowska 2002; Pardi 1982; Shapiro 1976; Tanganelli 1992; Torres 1995; Waters 1994). We didn't give any studies a rating of '4' or '5'.
Other potential sources of bias
We examined any other potential sources of bias and rated the risk on a scale of 1 to 5. The main other sources of bias that we identified included grouped analysis of AEDs, or analysis of monotherapy and polytherapy data for a specific drug together, recruitment of pregnancies at any time in gestation (or a failure to report upper limit of pregnancy enrolment) and failure to exclude malformations that occurred with genetic conditions. We rated only three studies as '1', indicating that they were at low risk for other sources of bias (Canger 1999; EURAP; Omtzigt 1992). We assigned a '5' to all other studies, indicating that they were at high risk of one or more of the other biases listed above. See the 'Risk of bias' tables for the individual studies in the Characteristics of included studies.
Confounding variables
We compiled a pre‐specified list of confounding variables prior to carrying out the review as described in Assessment of risk of bias in included studies. We did not rate any studies as a '1', as no studies had considered and adjusted for all possible confounders. We rated six studies as '2' to indicate that they had considered and adjusted for all important confounders (Australian; EURAP; Mawer 2010; Meador 2006; North American Register; Steegers‐Theunissen 1994). Fourteen studies considered and adjusted for some important confounders, so we assigned a rating of '3' (Cassina 2013; D'Souza 1990; Delmiš 1991; Diaz‐Romero 1990; Dravet 1992; Israeli Teratogen Service; Jones 1989; Kaaja 2003; Koch 1992; Martinez Ferri 2009; Montreal Series; Samren 1997; UK Register; Waters 1994). Fourteen studies had considered but not adjusted for confounders, so we gave them a '4' (Al Bunyan 1999; Arulmozhi 2006; Bag 1989; Canger 1999; Gaily 1988; Hill 1974; Kerala Pregnancy Registry; Lindhout 1992; Meischenguiser 2004; Motherisk Registry; Omtzigt 1992; Richmond 2004; Wide 2000; Yerby 1992). Finally, a further 14 studies failed to undertake any consideration or adjustment for confounders, so we rated them as '5' (Bozhinova 2009; Eroglu 2008; Fairgrieve 2000; Froscher 1991; Garza‐Morales 1996; Goujard 1974; Kaneko 1999; Kelly 1984; Laskowska 2002; Pardi 1982; Sabers 2004; Shapiro 1976; Tanganelli 1992; Torres 1995).
Effects of interventions
We computed pooled prevalences of malformations within AED groups (using fixed‐effect models, unless otherwise stated) and report them at the beginning of each drug section. Table 3 displays a matrix of comparisons and their results for quick reference.
3. Comparison Matrix.
Table displays links to specific analyses to assist with navigation around the review.
The reported results are from fixed‐effect meta‐analyses unless otherwise stated. Outcomes are reported as both RR and RDs. The RR is a measure of relative effect expressed as the ratio of the risk of an event in the two groups. If the 95% confidence interval includes the value of 1.00, this implies there is no difference between the groups (i.e. a non‐significant result). If the value of 1.00 lies outside the 95% confidence interval, this implies there is a difference between the groups (i.e. a significant result). The RD is a measure of absolute effect expressed as the difference of the risk of an event in the two groups. If the 95% confidence interval contains the value of 0.00, this implies there is no difference between the groups (i.e. both groups have the same risk). If the value of 0.00 lies outside the 95% confidence interval, this implies there is a difference between the groups (i.e. a significant result). We explicitly state whether all of the results shown in the Results section are significant or not. The significance of the RR and RD may be different, as the RD takes into account comparisons where there were no events in either arm, whilst the other does not. Where the lower or upper CIs were on the line of no effect for both RR and RD calculations, we added an asterisk to draw readers' attention to a remote possibility of no effect.
Although the RR estimates are large in many comparisons, the corresponding risk difference estimates are fairly small (see Table 2), but even a small increase in risk for a specific major malformation is clinically meaningful. In these cases it would be up to the patient/clinician to interpret these risk estimates in the context of the adverse outcome and in relation to the potential benefits of treatment (e.g. treatment efficacy).
Finally, we did not carry out any formal analysis of a dose‐response relationship. We have taken any dose‐response results reported directly from the study papers.
We provide the results of the meta‐analyses and narrative report below by AED type, with comparisons to the controls presented first and comparisons between different AEDs following.
Carbamazepine
The prevalence of major malformations (any type) for children exposed to carbamazepine (CBZ) (N = 4666), based on data from 30 studies, was 3.71% (95% CI 3.19 to 4.27; I2 = 45.5%, P value = 0.004). Due to significant variance, we undertook random‐effects modelling, giving a prevalence of 4.93% (95% CI 3.84 to 6.16; I2 = 45.5%, P value = 0.004).
1 CBZ versus controls
1.1 All major malformations
1.1.1 CBZ versus no medication (in women without epilepsy)
Pooled results from eight studies reported a significant outcome (RR 2.01, 95% CI 1.20 to 3.36; I2 = 0%), with children exposed to CBZ (N = 1367) experiencing more major malformations than control children (N = 2146) (Arulmozhi 2006; Cassina 2013; Israeli Teratogen Service; Koch 1992; Mawer 2010; North American Register; Steegers‐Theunissen 1994; Tanganelli 1992; see Analysis 1.1). This gave a significant RD (RD 0.02, 95% CI 0.00* to 0.03; I2 = 0%).
1.1. Analysis.
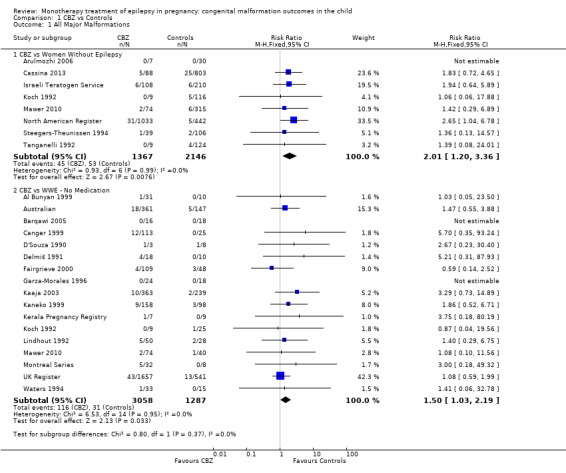
Comparison 1 CBZ vs Controls, Outcome 1 All Major Malformations.
We did not combine data from Motherisk Registry, which included women treated with CBZ for epilepsy and other conditions, within the meta‐analysis. This study reported prevalence of major congenital malformations to be 2/35 (5.7%) for those exposed to CBZ and 2/36 (5.6%) for the control children. The multicentre study Samren 1997 reported 22 (8%) cases of major malformation from 280 infants exposed to CBZ. However, the numbers from centres with a control group were smaller, with four cases of malformation out of just 14 exposed infants. This gave a significantly higher risk estimate than the control children born to women without epilepsy (RR 4.9, 95% CI 1.3 to 18.0).
1.1.2 CBZ versus no medication (in women with epilepsy)
Pooled findings from 17 studies showed a significant outcome (RR 1.50, 95% CI 1.03 to 2.19; I2 = 0%), with children exposed to CBZ (N = 3058) experiencing more major malformations than control children (N = 1287) (Al Bunyan 1999; Australian; Barqawi 2005; Canger 1999; Delmiš 1991; D'Souza 1990;Fairgrieve 2000; Garza‐Morales 1996; Kaaja 2003; Kaneko 1999; Kerala Pregnancy Registry; Koch 1992; Lindhout 1992; Mawer 2010; Montreal Series; UK Register; Waters 1994; see Analysis 1.1). This gave a significant RD (RD 0.01, 95% CI 0.00* to 0.03; I2 = 4%).
1.2 Neural tube malformations
1.2.1 CBZ versus no medication (in women without epilepsy)
Pooled results from three studies showed a non‐significant outcome (RR 1.40, 95% CI 0.06 to 34.14; I2 = 0%), with no difference in the number of neural tube malformations in children exposed to CBZ (N = 191) and compared to control children (N = 641) (Israeli Teratogen Service; Mawer 2010; Koch 1992; see Analysis 1.2). This gave a non‐significant RD (RD −0.00, 95% CI −0.01 to 0.01, I2 = 0%).
1.2. Analysis.
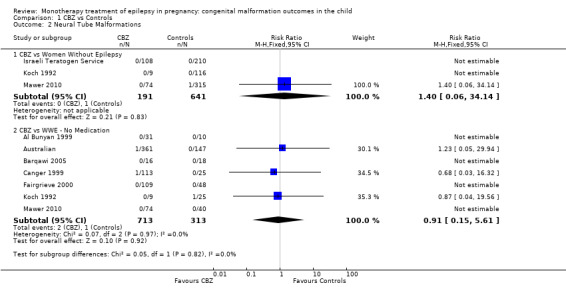
Comparison 1 CBZ vs Controls, Outcome 2 Neural Tube Malformations.
1.2.2 CBZ versus no medication (in women with epilepsy)
Pooled results from seven studies showed a non‐significant outcome (RR 0.91, 95% CI 0.15 to 5.61; I2 = 0%), with no difference in the number of neural tube malformations in children exposed to CBZ (N = 713) and in control children (N = 313) (Al Bunyan 1999; Australian; Barqawi 2005; Canger 1999; Fairgrieve 2000; Koch 1992; Mawer 2010; see Analysis 1.2). This gave a non‐significant RD (RD 0.00, 95% CI −0.01 to 0.02; I2 = 0%).
1.3 Cardiac malformations
1.3.1 CBZ versus no medication (in women without epilepsy)
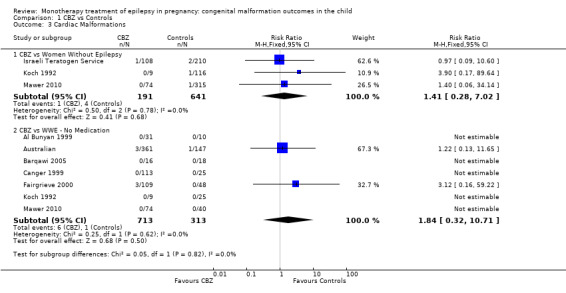
Pooled results from three studies showed a non‐significant outcome (RR 1.41, 95% CI 0.28 to 7.02; I2 = 0%), with no difference in the number of cardiac malformations in children exposed to CBZ (N = 191) and in control children (N = 641) (Israeli Teratogen Service; Koch 1992; Mawer 2010; see Analysis 1.3). This gave a non‐significant RD (RD −0.00, 95% CI −0.02 to 0.01; I2 = 0%).
1.3. Analysis.
Comparison 1 CBZ vs Controls, Outcome 3 Cardiac Malformations.
1.3.2 CBZ versus no medication (in women with epilepsy)
Pooled results from seven studies showed a non‐significant outcome (RR 1.84, 95% CI 0.32 to 10.71; I2 = 0%), with no difference in the number of cardiac malformations in children exposed to CBZ (N = 713) Cardiac malformation sand control children (N = 313) (Al Bunyan 1999; Australian; Barqawi 2005; Canger 1999; Fairgrieve 2000; Koch 1992; Mawer 2010; see Analysis 1.3). This gave a non‐significant RD (RD 0.01, 95% CI −0.01 to 0.02; I2 = 0%).
1.4 Oro‐facial cleft/craniofacial malformations
1.4.1 CBZ versus no medication (in women without epilepsy)
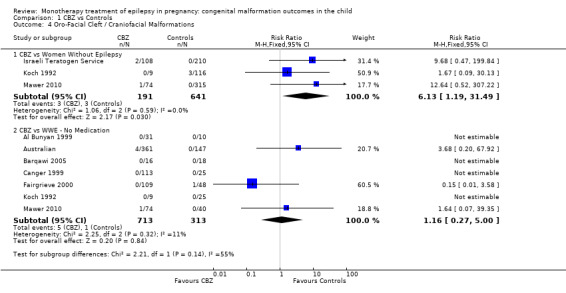
Pooled results from three studies showed a significant outcome (RR 6.13, 95% CI 1.19 to 31.49; I2 = 0%), with children exposed to CBZ (N = 191) experiencing more oro‐facial cleft/craniofacial malformations than control children (N = 641) (Israeli Teratogen Service; Koch 1992; Mawer 2010; see Analysis 1.4). This gave a non‐significant RD (RD 0.01, 95% CI −0.01 to 0.04; I2 = 0%).
1.4. Analysis.
Comparison 1 CBZ vs Controls, Outcome 4 Oro‐Facial Cleft / Craniofacial Malformations.
1.4.2 CBZ versus no medication (in women with epilepsy)
Pooled results from seven studies showed a non‐significant outcome (RR 1.16, 95% CI 0.27 to 5.00; I2 = 11%), with no difference in the number of oro‐facial cleft/craniofacial malformations in children exposed to CBZ (N = 713) and control children (N = 313) (Al Bunyan 1999; Australian; Barqawi 2005; Canger 1999; Fairgrieve 2000; Koch 1992; Mawer 2010; see Analysis 1.4). This gave a non‐significant RD (RD 0.00, 95% CI −0.01 to 0.02; I2 = 0%).
1.5 Skeletal/limb malformations
1.5.1 CBZ versus no medication (in women with epilepsy)
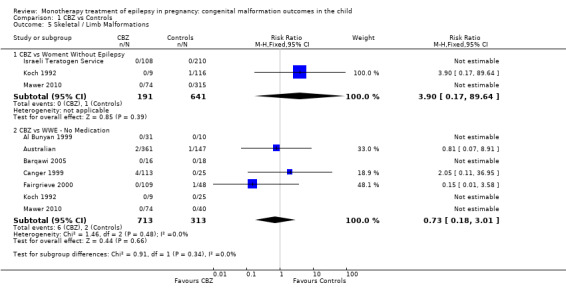
Pooled results from three studies showed a non‐significant outcome (RR 3.90, 95% CI 0.17 to 89.64, I2 = NA), with no difference in skeletal/limb malformations in children exposed to CBZ (N = 191) and control children (N = 641) (Israeli Teratogen Service; Koch 1992; Mawer 2010; see Analysis 1.5). This gave a non‐significant RD (RD −0.00, 95% CI −0.01 to 0.01, I2 = 0%).
1.5. Analysis.
Comparison 1 CBZ vs Controls, Outcome 5 Skeletal / Limb Malformations.
1.5.2 CBZ versus no medication (in women with epilepsy)
Pooled results from seven studies showed a non‐significant outcome (RR 0.73, 95% CI 0.18 to 3.01; I2 = 0%), with no difference in the number of skeletal and limb malformations in children exposed to CBZ (N = 713) and control children (N = 313) (Al Bunyan 1999; Australian; Barqawi 2005; Canger 1999;Fairgrieve 2000; Koch 1992; Mawer 2010; see Analysis 1.5). This gave a non‐significant RD (RD −0.00, 95% CI −0.02 to 0.02; I2 = 0%).
Carbamazepine dose
Most included studies did not investigate the effect of CBZ dose on malformation prevalence, and the majority of data comes from the pregnancy registries. The EURAP collaboration reported higher malformation rates with higher doses of CBZ (N = 1402). When compared to children exposed to < 300 mg/d of LTG, CBZ < 400 mg/d was not significantly different (OR 1.6 95% CI 0.56 to 4.53, P = 0.380), whilst there was a significantly higher risk with higher doses of CBZ: 400 to 1000 mg/d: OR 2.5 (95% CI 1.45 to 4.48, P = 0.0012) and > 1000 mg/d: OR 4.6 (95% CI 2.28 to 9.31, P < 0.0001). UK Register (N = 1657) found a non‐significant association in malformation outcome between doses of CBZ < 500 mg/d and doses of CBZ 500 to 1000 mg/d (P = 0.33) but a significant increase in risk from CBZ doses of < 500 mg/d, at 1.9%, in comparison to doses of > 1000 mg/d, at 5.3% (OR 2.82 95% CI 1.20 to 6.64, P = 0.01) was reported. In contrast, the North American Register (N = 1033) failed to document an association (P value not reported). A number of smaller studies did not identify a dose effect (Canger 1999; Kaaja 2003; Kaneko 1999; Motherisk Registry; Samren 1997).
Gabapentin
The prevalence of major malformations (any type) for children exposed to gabapentin (GBP) (N = 190) based on data from three studies was 1.47% (95% CI 0.26 to 3.64; I2 = 0%, P value = 0.50).
2 GBP versus controls
2.1 All major malformations
2.1.1 GBP versus no medication (in women without epilepsy)
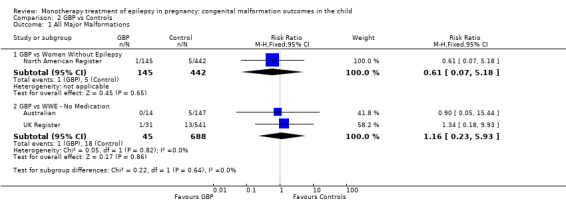
The results from North American Register showed a non‐significant outcome (RR 0.61, 95% CI 0.07 to 5.18; I2 = NA), with children exposed to GBP (N = 145) experiencing comparable rates of major malformations to control children (N = 442) (Analysis 2.1). This gave a non‐significant RD (RD −0.00, 95% CI −0.02 to 0.01; I2 = NA).
2.1. Analysis.
Comparison 2 GBP vs Controls, Outcome 1 All Major Malformations.
Fujji 2013 reported seven major malformations out of 223 (4.1%) GBP‐exposed infants (only 71 were in cases where the indication for maternal treatment was epilepsy). Caution is required, however, as the levels of concomitant medications were high in this study.
2.1.2 GBP versus no medication (in women with epilepsy)
Pooled results from two studies showed a non‐significant outcome (RR 1.16, 95% CI 0.23 to 5.93; I2 = 0%), with children exposed to GBP (N = 45) experiencing comparable rates of major malformations to control children (N = 688) (Australian; UK Register; see Analysis 2.1). This gave a non‐significant RD (RD −0.00, 95% CI −0.06 to 0.05; I2 = 0%).
2.2 Neural tube malformations
2.2.1 GBP versus no medication (in women without epilepsy)
No included studies reported data on this outcome.
2.2.2 GBP versus no medication (in women with epilepsy)
No included studies reported data on this outcome.
2.3 Cardiac malformations
2.3.1 GBP versus no medication (in women without epilepsy)
No included studies reported data on this outcome.
2.3.2 GBP versus no medication (in women with epilepsy)
No included studies reported data on this outcome.
2.4 Oro‐facial cleft/craniofacial malformations
2.4.1 GBP versus no medication (in women without epilepsy)
No included studies reported data on this outcome.
2.4.2 GBP versus no medication (in women with epilepsy)
No included studies reported data on this outcome.
2.5 Skeletal/limb malformations
2.5.1 GBP versus no medication (in women without epilepsy)
No included studies reported data on this outcome.
2.5.2 GBP versus no medication (in women with epilepsy)
No included studies reported data on this outcome.
Gabapentin dose
The investigation of GBP dose and its potential association with an increased rate of malformations is limited due to the numbers of pregnancies where data is currently available. The largest cohort of GBP‐exposed pregnancies (N = 145) failed to find an association with increasing dose and increased malformation risk (P value not reported) (North American Register). Included numbers in Australian and UK Register were too small to investigate dose (N = 14 and 31, respectively) and Fujji 2013 did not investigate dose.
Levetiracetam
The prevalence of major malformations (any type) for children exposed to levetiracetam (LEV) (N = 817) based on data from three studies was 1.77% (95% CI 0.98%‐2.79; I2 = 45.5%, P value = 0.16).
3 LEV versus controls
3.1 All major malformations
3.1.1 LEV versus no medication (in women without epilepsy)
North American Register reported a non‐significant outcome (RR 2.16, 95% CI 0.76 to 6.17; I2 = NA), with children exposed to LEV (N = 450) experiencing comparable rates of major malformations to control children (N = 442) (Analysis 3.1). This gave a non‐significant RD (RD 0.01, 95% CI −0.00 to 0.03; I2 = NA).
3.1. Analysis.
Comparison 3 LEV vs Controls, Outcome 1 All Major Malformations.
3.1.2 LEV versus no medication (in women with epilepsy)
Pooled results from two studies showed a non‐significant outcome (RR 0.32, 95% CI 0.10 to 1.07; I2 = NA), with children exposed to LEV (N = 367) experiencing comparable rates of major malformations to control children (N = 688) (Australian; UK Register; see Analysis 3.1). This gave a significant RD (RD −0.02, 95% CI −0.03 to −0.00; I2 = NA).
3.2 Neural tube malformations
3.2.1 LEV versus no medication (in women without epilepsy)
No included studies reported data on this outcome.
3.2.2 LEV versus no medication (in women with epilepsy)
No included studies reported data on this outcome.
3.3 Cardiac malformations
3.3.1 LEV versus no medication (in women without epilepsy)
No included studies reported data on this outcome.
3.3.2 LEV versus no medication (in women with epilepsy)
No included studies reported data on this outcome.
3.4 Oro‐facial cleft/craniofacial malformations
3.4.1 LEV versus no medication (in women without epilepsy)
No included studies reported data on this outcome.
3.4.2 LEV versus no medication (in women with epilepsy)
No included studies reported data on this outcome.
3.5 Skeletal/limb malformations
3.5.1 LEV versus no medication (in women without epilepsy)
No included studies reported data on this outcome.
3.5.2 LEV versus no medication (in women with epilepsy)
No included studies reported data on this outcome.
Levetiracetam dose
In 450 LEV‐exposed cases, no dose‐response association was apparent (P value not reported) (North American Register). Consistently, the UK Register also failed to find an association between increasing dose of LEV (N = 304) and malformation risk (P = 0.09). Australian did not investigate dose of LEV.
Lamotrigine
The prevalence of major malformations (any type) for children exposed to lamotrigine (LTG) (N = 4195) based on data from seven studies was 2.31% (95% CI 1.87 to 2.78; I2 = 29.2%, P value = 0.21).
4 LTG versus controls
4.1 All major malformations
4.1.1 LTG versus no medication (in women without epilepsy)
Pooled results from three studies showed a non‐significant outcome (RR 1.68, 95% CI 0.78 to 3.65; I2 = 0%), with children exposed to LTG (N = 1628) experiencing comparable rates of major malformations to control children (N = 1560) (Cassina 2013; Mawer 2010; North American Register; see Analysis 4.1). This gave a non‐significant RD (RD 0.01, 95% CI −0.00 to 0.02; I2 = 23%).
4.1. Analysis.
Comparison 4 LTG vs Controls, Outcome 1 All Major Malformations.
4.1.2 LTG versus no medication (in women with epilepsy)
Pooled results from three studies showed a non‐significant outcome (RR 1.07, 95% CI 0.64 to 1.77; I2 = 0%), with children exposed to LTG (N = 2453) experiencing comparable rates of major malformations to control children (N = 728) (Australian; Mawer 2010; UK Register; see Analysis 4.1). This gave a non‐significant RD (RD 0.00, 95% CI −0.01 to 0.02; I2 = 0%).
4.2 Neural tube malformations
4.2.1 LTG versus no medication (in women without epilepsy)
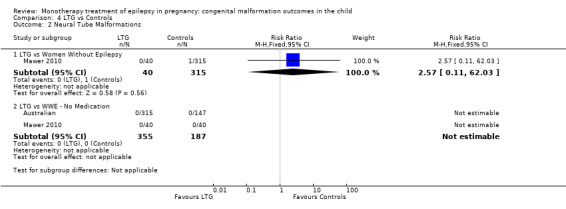
Mawer 2010 reported a non‐significant outcome (RR 2.57, 95% CI 0.11 to 62.03; I2 = NA), with no difference in the number of neural tube malformations in children exposed to LTG (N = 40) and control children (N = 315) (Analysis 4.2). This gave a non‐significant RD (RD −0.00, 95% CI −0.04 to 0.03; I2 = NA).
4.2. Analysis.
Comparison 4 LTG vs Controls, Outcome 2 Neural Tube Malformations.
4.2.2 LTG versus no medication (in women with epilepsy)
We could not estimate pooled results from two studies on LTG, as there were no reported neural tube malformations in children exposed to LTG (N = 355) or control children (N = 187) (Australian; Mawer 2010; see Analysis 4.2). The RD was calculable, and it gave a non‐significant result (RD 0.00, 95% CI −0.01 to 0.01; I2 = 0%).
4.3 Cardiac malformations
4.3.1 LTG versus no medication (in women without epilepsy)
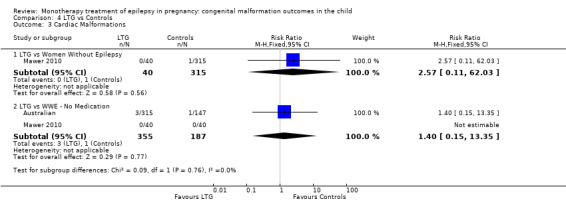
Mawer 2010 reported a non‐significant outcome (RR 2.57, 95% CI 0.11 to 62.03; I2 = NA), with no difference in the number of cardiac malformations in children exposed to LTG (N = 40) and control children (N = 315) (Analysis 4.3). This gave a non‐significant RD (RD −0.00, 95% CI −0.04 to 0.03; I2 = NA).
4.3. Analysis.
Comparison 4 LTG vs Controls, Outcome 3 Cardiac Malformations.
4.3.2 LTG versus no medication (in women with epilepsy)
Pooled results from two studies showed a non‐significant outcome (RR 1.40, 95% CI 0.15 to 13.35; I2 = NA), with no difference in the number of cardiac malformations in children exposed to LTG (N = 355) and control children (N = 187) (Australian; Mawer 2010; see Analysis 4.3). This gave a non‐significant RD (RD 0.00, 95% CI −0.01 to 0.02; I2 = NA).
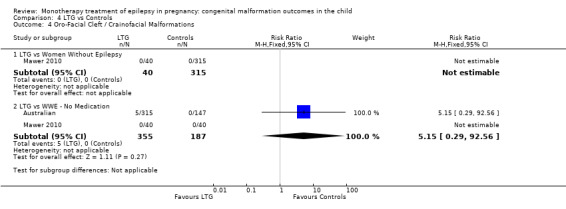
4.4 Oro‐facial cleft/craniofacial malformations
4.4.1 LTG versus no medication (in women without epilepsy)
We were unable to estimate RR in Mawer 2010 due to there being no reported oro‐facial cleft/craniofacial malformations in children exposed to LTG (N = 40) or control children (N = 315) (Analysis 4.4). RD was calculable, and this gave a non‐significant result (RD 0.00, 95% CI −0.03 to 0.03; I2 = NA).
4.4. Analysis.
Comparison 4 LTG vs Controls, Outcome 4 Oro‐Facial Cleft / Crainofacial Malformations.
4.4.2 LTG versus no medication (in women with epilepsy)
Pooled results from two studies reported a non‐significant outcome (RR 5.15, 95% CI 0.29 to 92.56; I2 = NA), with no difference in the number of oro‐facial cleft/craniofacial malformations in children exposed to LTG (N = 355) and control children (N = 187) (Australian; Mawer 2010; see Analysis 4.4). This gave a non‐significant RD (RD 0.01, 95% CI −0.00 to 0.03; I2 = NA).
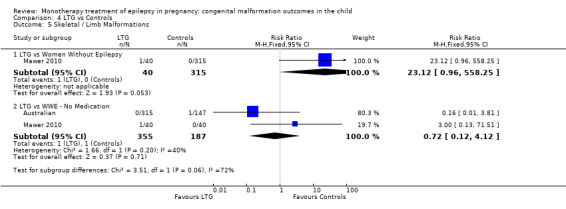
4.5 Skeletal/limb malformations
4.5.1 LTG versus no medication (in women without epilepsy)
Mawer 2010 reported a non‐significant outcome (RR 23.12, 95% CI 0.96 to 558.25; I2 = NA), with no difference in the number of skeletal/limb malformations in children exposed to LTG (N = 40) and control children (N = 315) (Analysis 4.5). This gave a non‐significant RD (RD 0.03, 95% CI −0.03 to 0.08; I2 = NA).
4.5. Analysis.
Comparison 4 LTG vs Controls, Outcome 5 Skeletal / Limb Malformations.
4.5.2 LTG versus no medication (in women with epilepsy)
Pooled results from two studies reported a non‐significant outcome (RR 0.72, 95% CI 0.12 to 4.12; I2 = 40%), with no difference in the number of skeletal/limb malformations in children exposed to LTG (N = 355) and control children (N = 187) (Australian; Mawer 2010; see Analysis 4.5). This gave a non‐significant RD (RD −0.00, 95% CI −0.02 to 0.02; I2 = 0%).
Lamotrigine dose
North American Register did not find any association between dose of LTG and malformation prevalence (N = 1562; P value not reported). The UK Register (N = 2198) found no significant risk with increasing dose (0 to 200 mg/d vs 200 to 400 mg/d, P = 0.67; 0 to 200 mg/d vs > 400 mg/d, P = 0.22). Australian also failed to find a significant dose association (N = 315; P value not reported). The frequency of malformations was too low in Cassina 2013 and Mawer 2010 to allow investigation of dose. In EURAP, exposure to higher doses of LTG (based on 1420 cases) was associated with a significantly increased rate of malformation (< 300 mg/d 2.0% vs > 300 mg/d 4.5%, OR 2.2 95% CI 1.12 to 4.35, P = 0.0221).
Oxcarbazepine
The prevalence of major malformations (any type) for children exposed to oxcarbazepine (OXC) (N = 238), based on data from four studies, was 2.39% (95% CI 0.85% to 4.68%; I2 = 0.2%, P value = 0.39).
5 OXC versus controls
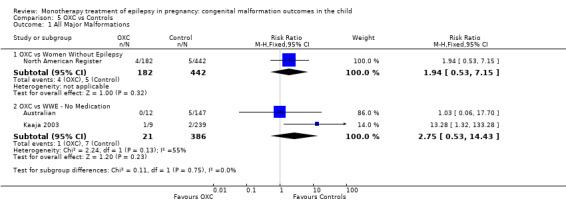
5.1 All major malformations
5.1.1 OXC versus no medication (in women without epilepsy)
North American Register reported a non‐significant outcome (RR 1.94, 95% CI 0.53 to 7.15; I2 = NA), with children exposed to OXC (N = 182) experiencing comparable rates of major malformations to control children (N = 442) (Analysis 5.1). This gave a non‐significant RD (RD 0.01, 95% CI −0.01 to 0.03; I2 = NA).
5.1. Analysis.
Comparison 5 OXC vs Controls, Outcome 1 All Major Malformations.
5.1.2 OXC versus no medication (in women with epilepsy)
Pooled results from two studies showed a non‐significant outcome (RR 2.75, 95% CI 0.53 to 14.43; I2 = 55%), with children exposed to OXC (N = 21) experiencing comparable rates of major malformations to control children (N = 386) (Australian; Kaaja 2003; see Analysis 5.1). This gave a non‐significant RD (RD 0.03, 95% CI −0.09 to 0.14; I2 = 41%).
5.2 Neural tube malformations
5.2.1 OXC versus no medication (in women without epilepsy)
No included studies reported data on this outcome.
5.2.2 OXC versus no medication (in women with epilepsy)
No included studies reported data on this outcome.
5.3 Cardiac malformations
5.3.1 OXC versus no medication (in women without epilepsy)
No included studies reported data on this outcome.
5.3.2 OXC versus no medication (in women with epilepsy)
No included studies reported data on this outcome.
5.4 Oro‐facial cleft/craniofacial malformations
5.4.1 OXC versus no medication (in women without epilepsy)
No included studies reported data on this outcome.
5.4.2 OXC versus no medication (in women with epilepsy)
No included studies reported data on this outcome.
5.5 Skeletal/limb malformations
5.5.1 OXC versus no medication (in women without epilepsy)
No included studies reported data on this outcome.
5.5.2 OXC versus no medication (in women with epilepsy)
No included studies reported data on this outcome.
Oxcarbazpine dose
No included studies reported on the relationship between OXC dose and malformation rates.
Phenobarbital
The prevalence of major malformations (any type) for children exposed to phenobarbital (PB) (N = 709), based on data from 23 studies, was 7.10% (95% CI 5.36 to 9.08; I2 = 0%, P value = 0.74).
6 PB versus controls
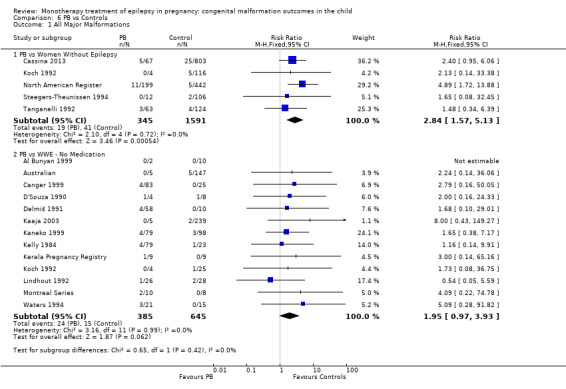
6.1 All major malformations
6.1.1 PB versus no medication (in women without epilepsy)
Pooled results from five studies showed a significant outcome (RR 2.84, 95% CI 1.57 to 5.13; I2 = 0%), with children exposed to PB (N = 345) experiencing more major malformations than control children (N = 1591) (Cassina 2013; Koch 1992; North American Register; Steegers‐Theunissen 1994; Tanganelli 1992; see Analysis 6.1). This gave a significant RD (RD 0.04, 95% CI 0.01 to 0.06; I2 = 0%).
6.1. Analysis.
Comparison 6 PB vs Controls, Outcome 1 All Major Malformations.
Samren 1997 reported five cases of major malformation out of 48 exposed infants (10%). Numbers were more limited in the comparison to control children (as not all centres in the study included control children), with just one malformation case out of six PB‐exposed children; analysis produced a non‐significant difference between the groups (RR 2.4, 95% CI 0.3 to 23.0).
6.1.2 PB versus no medication (in women with epilepsy)
Pooled results from 13 studies showed a non‐significant outcome (RR 1.95, 95% CI 0.97 to 3.93; I2 = 0%), with no difference in the number of major malformations in children exposed to PB (N = 385) and control children (N = 645) (Al Bunyan 1999; Australian; Canger 1999; Delmiš 1991; D'Souza 1990; Kaaja 2003; Kaneko 1999; Kelly 1984; Kerala Pregnancy Registry; Koch 1992; Lindhout 1992; Montreal Series; Waters 1994; see Analysis 6.1). This gave a non‐significant RD (RD 0.03, 95% CI −0.01 to 0.07; I2 = 0%).
6.2 Neural tube malformations
6.2.1 PB versus no medication (in women without epilepsy)
We could not estimate data from Koch 1992 due to there being no reported neural tube malformations in children exposed to PB (N = 4) or control children (N = 116) (Analysis 6.2). RD was calculable and this gave a non‐significant result (RD 0.00, 95% CI −0.26 to 0.26; I2 = NA).
6.2. Analysis.
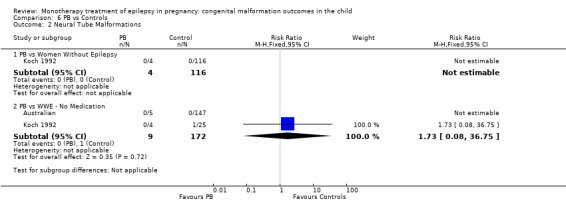
Comparison 6 PB vs Controls, Outcome 2 Neural Tube Malformations.
6.2.2 PB versus no medication (in women with epilepsy)
Pooled results from two studies showed a non‐significant outcome (RR 1.73, 95% CI 0.08 to 36.75, I2 = 0%), with no difference in the number of neural tube malformations in children exposed to PB (N = 5) and control children (N = 147) (Australian; Koch 1992; see Analysis 6.2). This gave a non‐significant RD (RD −0.02, 95% CI −0.23 to 0.19; I2 = 0%).
6.3 Cardiac malformations
6.3.1 PB versus no medication (in women without epilepsy)
Koch 1992 reported a non‐significant outcome (RR 7.80, 95% CI 0.36 to 168.52; I2 = NA), with children exposed to PB (N = 4) no more likely to experience cardiac malformations than control children (N = 116) (Analysis 6.3). This gave a non‐significant RD (RD −0.01, 95% CI −0.27 to 0.26; I2 = NA).
6.3. Analysis.
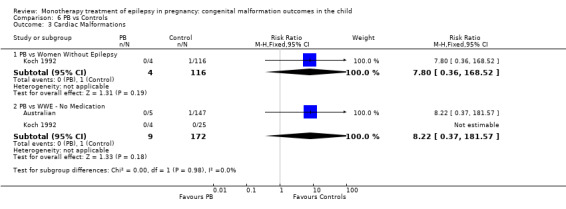
Comparison 6 PB vs Controls, Outcome 3 Cardiac Malformations.
6.3.2 PB versus no medication (in women with epilepsy)
Pooled results from two studies reported a non‐significant outcome (RR 8.22, 95% CI 0.37 to 181.57, I2 = NA), with no difference in the number of cardiac malformations in children exposed to PB (N = 9) and control children (N = 172) (Australian; Koch 1992; see Analysis 6.3). This gave a non‐significant RD (RD −0.00, 95% CI −0.21 to 0.20; I2 = NA).
6.4 Oro‐facial cleft/craniofacial malformations
6.4.1 PB versus no medication (in women without epilepsy)
Koch 1992 reported a non‐significant outcome (RR 3.34, 95% CI 0.20 to 56.35; I2 = NA), with no difference in the number of oro‐facial cleft/craniofacial malformations in children exposed to PB (N = 4) and control children (N = 116) (Analysis 6.4). This gave a non‐significant RD (RD −0.03, 95% CI −0.29 to 0.24; I2 = NA).
6.4. Analysis.
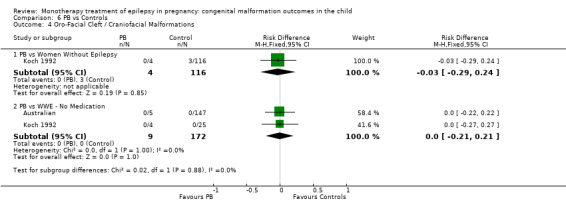
Comparison 6 PB vs Controls, Outcome 4 Oro‐Facial Cleft / Craniofacial Malformations.
6.4.2 PB versus no medication (in women with epilepsy)
We could not estimate the pooled results from two studies due to there being no reported oro‐facial cleft/craniofacial malformations in children exposed to PB (N = 9) or control children (N = 172) (Australian; Koch 1992; see Analysis 6.4). RD was calculable, and this gave a non‐significant result (RD 0.00, 95% CI −0.21 to 0.21, I2 = 0%).
6.5 Skeletal/limb malformations
6.5.1 PB versus no medication (in women without epilepsy)
Koch 1992 reported a non‐significant outcome (RR 7.80, 95% CI 0.36 to 168.52; I2 = NA), with no difference in number of skeletal/limb malformations in children exposed to PB (N = 4) and control children (N = 116) (Analysis 6.5). This gave a non‐significant RD (RD −0.01, 95% CI −0.27 to 0.26; I2 = NA).
6.5. Analysis.
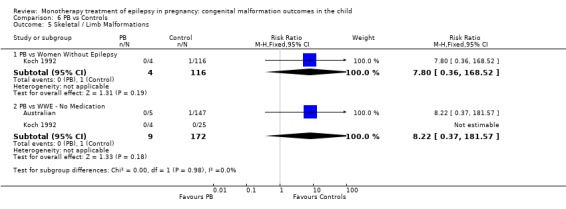
Comparison 6 PB vs Controls, Outcome 5 Skeletal / Limb Malformations.
6.5.2 PB versus no medication (in women with epilepsy)
Pooled results from two studies showed a non‐significant outcome (RR 8.22, 95% CI 0.37 to 181.57; I2 = NA), with no difference in number of skeletal/limb malformations in children exposed to PB (N = 9) and control children (N = 172) (Australian; Koch 1992; see Analysis 6.5). This gave a non‐significant RD (RD −0.00, 95% CI −0.21 to 0.20; I2 = 0%).
Phenobarbital dose
Most studies did not investigate dose or report the results of analyses of PB dose with regards to malformation risk (Al Bunyan 1999; Australian; Canger 1999; Cassina 2013; D'Souza 1990; Kaaja 2003; Kerala Pregnancy Registry; Koch 1992; Lindhout 1992; Montreal Series; Steegers‐Theunissen 1994; Tanganelli 1992; Waters 1994), and many were too limited in terms of numbers of included pregnancies to be able to do this. North American Register included 199 PB‐exposed pregnancies and did not find an association with dose (P value not reported). Samren 1997 found a non‐significant trend for an association with dose (N = 48, P value not reported). Kaneko 1999 did find a an association between PB exposure (N = 79) or increased malformation rate; however, the study did not report the statistical analysis. Finally, EURAP reported a significant increase in malformation rate with increasing doses of PB (N = 217), with the prevalence of malformation increasing from 5.4% for doses < 150 mg/d to 13.7% for doses > 150 mg/d (OR 3.2 95% CI 1.11 to 9.45, P = 0.0316).
Phenytoin
The prevalence of major malformations (any type) for children exposed to phenytoin (PHT) (N = 1279), based on data from 25 studies, was 5.38% (95% CI 4.22 to 6.67; I2 = 41.1%, P value = 0.02). Due to significant variance, we undertook random‐effects modelling, generating a prevalence of 6.26% (95% CI 4.37 to 8.47; I2 =41.1 %, P value = 0.02).
7 PHT versus controls
7.1 All major malformations
7.1.1 PHT versus no medication (in women without epilepsy)
Pooled results from five studies showed a significant outcome (RR 2.38, 95% CI 1.12 to 5.03; I2 = 0%), with children exposed to PHT (N = 477) experiencing more major malformations than control children (N = 987) (D'Souza 1990; Koch 1992; Mawer 2010; North American Register; Steegers‐Theunissen 1994; see Analysis 7.1). However, this gave a non‐significant RD (RD 0.02, 95% CI −0.00 to 0.04; I2 = 0%).
7.1. Analysis.
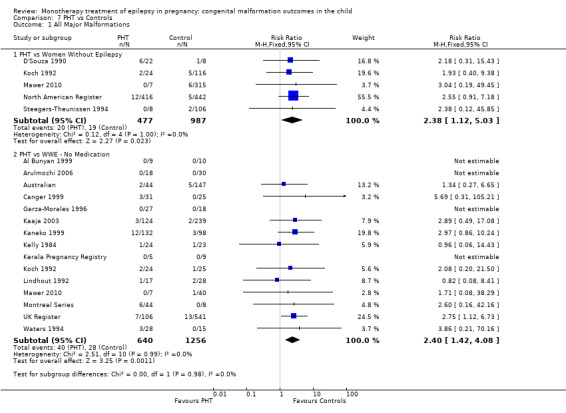
Comparison 7 PHT vs Controls, Outcome 1 All Major Malformations.
In our meta‐analysis, we did not include data from the Motherisk Registry, which included women treated with PHT for epilepsy and other conditions. Investigators reported the prevalence of MCM to be 3/34 (8.8%) for those exposed to PHT and 2/34 (6%) for control children. Samren 1997 reported nine cases of major malformation in 141 (6%) PHT‐exposed children. Outcomes at centres with a control group in this study were limited to five cases from 33 exposed children, which gave a non‐significant difference (RR 2.2, 95% CI 0.7 to 6.7).
7.1.2 PHT versus no medication (in women with epilepsy)
Pooled results from 15 studies showed a significant outcome (RR 2.40, 95% CI 1.42 to 4.08; I2 = 0%), with children exposed to PHT (N = 640) experiencing more major malformations than control children (N = 1256) (Al Bunyan 1999; Arulmozhi 2006; Australian; Canger 1999; Garza‐Morales 1996; Kaaja 2003; Kaneko 1999; Kelly 1984; Kerala Pregnancy Registry; Koch 1992; Lindhout 1992; Mawer 2010; Montreal Series; UK Register; Waters 1994; see Analysis 7.1). This gave a significant RD (RD 0.03, 95% CI 0.01 to 0.06; I2 = 0%).
7.2 Neural tube malformations
7.2.1 PHT versus no medication (in women without epilepsy)
Pooled results from two studies showed a non‐significant outcome (RR 13.17, 95% CI 0.58 to 299.00, I2 = NA), with children exposed to PHT (N = 31) experiencing no more neural tube malformations than control children (N = 431) (Koch 1992; Mawer 2010; see Analysis 7.2). This gave a non‐significant RD (RD −0.00, 95% CI −0.07 to 0.06, I2 = 0%).
7.2. Analysis.
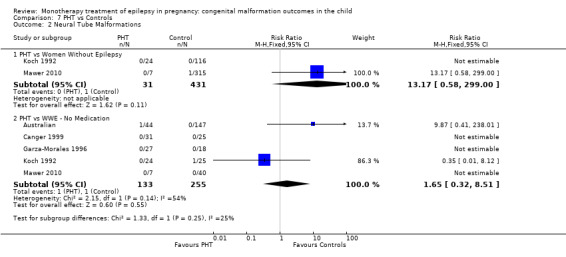
Comparison 7 PHT vs Controls, Outcome 2 Neural Tube Malformations.
7.2.2 PHT versus no medication (in women with epilepsy)
Pooled results from five studies showed a non‐significant outcome (RR 1.65, 95% CI 0.32 to 8.51; I2 = 54%), with no difference in the number of neural tube malformations in children exposed to PHT (N = 133) and control children (N = 255) (Australian; Canger 1999; Garza‐Morales 1996; Koch 1992; Mawer 2010; see Analysis 7.2). This gave a non‐significant RD (RD 0.00, 95% CI −0.03 to 0.04; I2 = 0%).
7.3 Cardiac malformations
7.3.1 PHT versus no medication (in women without epilepsy)
Pooled results from two studies reported a non‐significant outcome (RR 6.31, 95% CI 0.75 to 52.91, I2 = 0%), with no difference in the number of cardiac malformations in children exposed to PHT (N = 31) and control children (N = 431) (Koch 1992; Mawer 2010; see Analysis 7.3). This gave a non‐significant RD (RD 0.02, 95% CI −0.05 to 0.10; I2 = 0%).
7.3. Analysis.
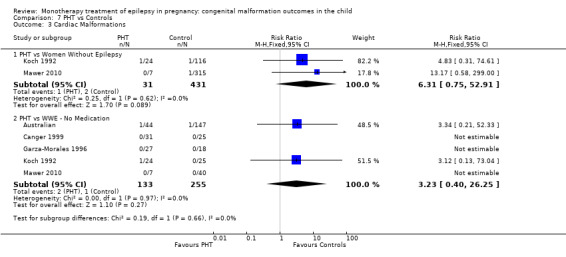
Comparison 7 PHT vs Controls, Outcome 3 Cardiac Malformations.
7.3.2 PHT versus no medication (in women with epilepsy)
Pooled results from five studies showed a non‐significant outcome (RR 3.23, 95% CI 0.40 to 26.25; I2 = 0%), with no difference in the number of cardiac malformations in children exposed to PHT (N = 133) and control children (N = 255) (Australian; Canger 1999; Garza‐Morales 1996; Koch 1992; Mawer 2010; see Analysis 7.3). This gave a non‐significant RD (RD 0.01, 95% CI −0.02 to 0.05; I2 = 0%).
7.4 Oro‐facial cleft/craniofacial malformations
7.4.1 PHT versus no medication (in women without epilepsy)
Pooled results from two studies showed a non‐significant outcome (RR 0.67, 95% CI 0.04 to 12.54, I2 = NA), with no difference in the number of oro‐facial cleft/craniofacial malformations between children exposed to PHT (N = 31) and control children (N = 431) (Koch 1992; Mawer 2010; see Analysis 7.4). This gave a non‐significant RD (RD −0.02, 95% CI −0.09 to 0.05; I2 = 0%).
7.4. Analysis.
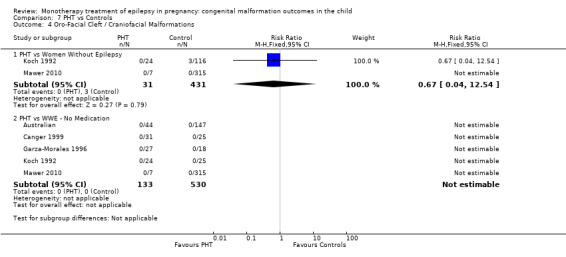
Comparison 7 PHT vs Controls, Outcome 4 Oro‐Facial Cleft / Craniofacial Malformations.
7.4.2 PHT versus no medication (in women with epilepsy)
We could not estimate the pooled results from five studies due to the lack of reported oro‐facial cleft/craniofacial malformations in children exposed to PHT (N = 133) and control children (N = 530) (Australian; Canger 1999; Garza‐Morales 1996; Koch 1992; Mawer 2010; see Analysis 7.4). RD was calculable, and this gave a non‐significant result (RD 0.00, 95% CI −0.03 to 0.03; I2 = 0%).
7.5 Skeletal/limb malformations
7.5.1 PHT versus no medication (in women without epilepsy)
Pooled results from two studies showed a non‐significant outcome (RR 1.56, 95% CI 0.07 to 37.19; I2 = NA), with no difference in the number of skeletal and limb malformations in children exposed to PHT (N = 31) and control children (N = 431) (Koch 1992; Mawer 2010; see Analysis 7.4). This gave a non‐significant RD (RD −0.01, 95% CI −0.07 to 0.06; I2 = 0%).
7.5.2 PHT versus no medication (in women with epilepsy)
Pooled results from five studies showed a non‐significant outcome (RR 1.69, 95% CI 0.19 to 15.30; I2 = 0%), with no difference in the number of skeletal/limb malformations in children exposed to PHT (N = 133) and control children (N = 255) (Australian; Canger 1999; Garza‐Morales 1996; Koch 1992; Mawer 2010; see Analysis 7.5). This gave a non‐significant RD (RD 0.00, 95% CI −0.03 to 0.04; I2 = 0%).
7.5. Analysis.
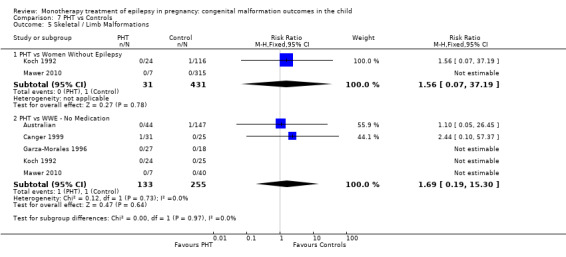
Comparison 7 PHT vs Controls, Outcome 5 Skeletal / Limb Malformations.
Phenytoin dose
The majority of included studies did not investigate or formally report on the relationship between dose of PHT and malformation outcome (Al Bunyan 1999; Arulmozhi 2006, Australian, Koch 1992, Canger 1999, Garza‐Morales 1996, Steegers‐Theunissen 1994, Mawer 2010,D'Souza 1990, Kelly 1984, UK Register, Waters 1994), with many being limited by included numbers of PHT‐exposed pregnancies. Kaaja 2003 reported no association with dose of PHT and increased malformation rate based on 124 monotherapy exposed children (P value not reported). Similarly, Motherisk Registry also failed to find an association (N = 36; P value not reported) as did North American Register, based on 416 exposed children (P value not reported). In contrast, Kaneko 1999 reported a significant association between PHT dose and malformation prevalence (P = 0.015), based on 132 children exposed to monotherapy PHT (no further details given). Samren 1997 also found an increase in malformation risk from 2.0% to 4.1% for doses < 200 mg/d and doses > 300 to 500 mg/d (N = 33; P value not reported).
Primidone
The prevalence of major malformations (any type) for children exposed to PRM (N = 110) based on data from six studies was 8.49% (95% CI 4.13 to 14.22; I2 = 23.1%, P value = 0.26).
8 PRM versus controls
8.1 All major malformations
8.1.1 PRM versus no medication (in women without epilepsy)
Koch 1992 reported a non‐significant outcome (RR 0.48, 95% CI 0.03 to 8.43; I2 = NA) for major malformations in children exposed to PRM (N = 21) in comparison to control children (N = 116) (Analysis 8.1). This gave a significant RD (RD −0.04, 95% CI −0.12 to 0.03; I2 = NA).
8.1. Analysis.
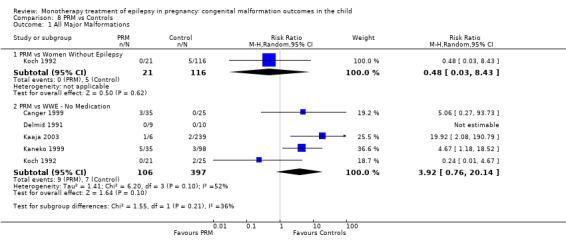
Comparison 8 PRM vs Controls, Outcome 1 All Major Malformations.
Samren 1997 reported four cases of major malformations out of 43 PRM‐exposed children (9%). When limited to centres with control children, there were three cases out of 39 exposed children, which was not significantly different from control children (RR 1.0, 95% CI 0.3 to 3.8).
8.1.2 PRM versus no medication (in women with epilepsy)
Pooled results from four studies showed a significant outcome (RR 2.81, 95% CI 1.13 to 7.02; I2 = 52%), with children exposed to PRM (N = 106) experiencing more major malformations than control children (N = 397) (Canger 1999; Kaaja 2003; Kaneko 1999; Koch 1992; see Analysis 8.1). Due to high heterogeneity, we undertook a random‐effects (RE) analysis, which changed the result to non‐significant (RR (RE) 3.92, 95% CI 0.76 to 20.14; I2 = 52%). This gave a non‐significant RD (RD 0.07, 95% CI −0.00 to 0.14; I2 = 38%).
8.2 Neural tube malformations
8.2.1 PRM versus no medication (in women without epilepsy)
No included studies reported data on this outcome.
8.2.2 PRM versus no medication (in women with epilepsy)
No included studies reported data on this outcome.
8.3 Cardiac malformations
8.3.1 PRM versus no medication (in women without epilepsy)
No included studies reported data on this outcome.
8.3.2 PRM versus no medication (in women with epilepsy)
No included studies reported data on this outcome.
8.4 Oro‐facial cleft/craniofacial malformations
8.4.1 PRM versus no medication (in women without epilepsy)
No included studies reported data on this outcome.
8.4.2 PRM versus no medication (in women with epilepsy)
No included studies reported data on this outcome.
8.5 Skeletal/limb malformations
8.5.1 PRM versus no medication (in women without epilepsy)
No included studies reported data on this outcome.
8.5.2 PRM versus no medication (in women with epilepsy)
No included studies reported data on this outcome.
Primidone dose
No included studies investigated dose of PRM and malformation risk.
Topiramate
The prevalence of major malformations (any type) for children exposed to TPM (N = 473) based on data from three studies was 4.28% (95% CI 2.65 to 6.29; I2 = 0%, P value = 0.91).
9 TPM versus controls
9.1 All major malformations
9.1.1 TPM versus no medication (in women without epilepsy)
North American Register reported a significant outcome (RR 3.69, 95% CI 1.36 to 10.07; I2 = NA), with children exposed to TPM (N = 359) experiencing more major malformations than control children (N = 442) (Analysis 9.1). This gave a significant RD (RD 0.03, 95% CI 0.01 to 0.05; I2 = NA).
9.1. Analysis.
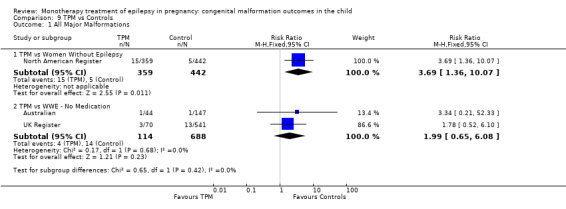
Comparison 9 TPM vs Controls, Outcome 1 All Major Malformations.
In 41 cases described by Israeli Teratogen Service, there were two non‐genetic linked malformations, which gave a prevalence of 4.9%, which was not significantly higher than control children (3.4%, P value not reported).
9.1.2 TPM versus no medication (in women with epilepsy)
Pooled results from two studies showed a non‐significant outcome (RR 1.99, 95% CI 0.65 to 6.08; I2 = 0%), with no difference in the number of major malformations in children exposed to TPM (N = 114) and control children (N = 688) (Australian; UK Register; see Analysis 9.1). This gave a non‐significant RD (RD 0.02, 95% CI −0.02 to 0.05; I2 = 0%).
9.2 Neural tube malformations
9.2.1 TPM versus no medication (in women without epilepsy)
No included studies reported data on this outcome.
9.2.2 TPM versus no medication (in women with epilepsy)
We could not estimate data from one study due to the lack of reported neural tube malformations in children exposed to TPM (N = 44) and control children (N = 147) (Australian; see Analysis 9.2). RD was calculable, and this gave a non‐significant result (RD 0.00, 95% CI −0.03 to 0.03; I2 = NA).
9.2. Analysis.
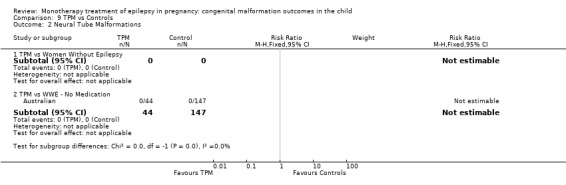
Comparison 9 TPM vs Controls, Outcome 2 Neural Tube Malformations.
9.3 Cardiac malformations
9.3.1 TPM versus no medication (in women without epilepsy)
No included studies reported data on this outcome.
9.3.2 TPM versus no medication (in women with epilepsy)
Data from Australian showed a non‐significant outcome (RR 1.10, 95% CI 0.05 to 26.45; I2 = NA), with no difference in the number of cardiac malformations in children exposed to TPM (N = 44) and control children (N = 147) (Analysis 9.3). This gave a non‐significant RD (RD −0.01, 95% CI −0.04 to 0.03; I2 = NA).
9.3. Analysis.
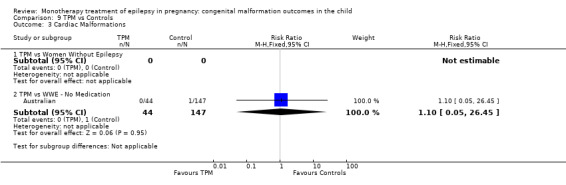
Comparison 9 TPM vs Controls, Outcome 3 Cardiac Malformations.
9.4 Oro‐facial cleft/craniofacial malformations
9.4.1 TPM versus no medication (in women without epilepsy)
No included studies reported data on this outcome.
9.4.2 TPM versus no medication (in women with epilepsy)
We could not estimate data from one study due to the lack of reported oro‐facial cleft/craniofacial malformations in children exposed to TPM (N = 44) and control children (N = 147) (Australian; see Analysis 9.4). RD was calculable, and this gave a non‐significant result (RD 0.00, 95% CI −0.03 to 0.03; I2 = NA).
9.4. Analysis.
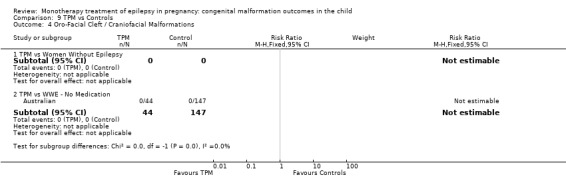
Comparison 9 TPM vs Controls, Outcome 4 Oro‐Facial Cleft / Craniofacial Malformations.
9.5 Skeletal/limb malformations
9.5.1 TPM versus no medication (in women without epilepsy)
No included studies reported data on this outcome.
9.5.2 TPM versus no medication (in women with epilepsy)
Australian reported a non‐significant outcome (RR 1.10, 95% CI 0.05 to 26.45; I2 = NA), with no difference in the number of skeletal/limb malformations in children exposed to TPM (N = 44) and control children (N = 147) (Analysis 9.5). This gave a non‐significant RD (RD −0.01, 95% CI −0.04 to 0.03; I2 = NA).
9.5. Analysis.
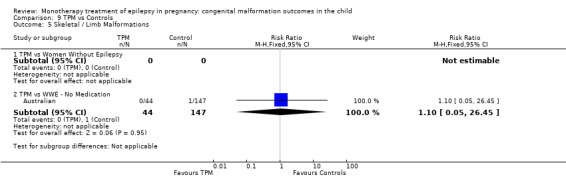
Comparison 9 TPM vs Controls, Outcome 5 Skeletal / Limb Malformations.
Topiramate dose
North American Register found no significant difference in median doses between TPM‐exposed children (N = 359) who had malformations versus those who did not (P value not reported). Consistently, but with smaller numbers, Australian (N = 44; P value not reported) and UK Register cohorts (N = 70; P value not reported) also failed to find an association between dose of TPM and risk of overall malformations.
Valproate
The prevalence of major malformations (any type) for children exposed to valproate (VPA) (N = 2565), based on data from 26 studies, was 9.09% (95% CI 8.02 to 10.23; I2 = 37.8%, P value = 0.03). Due to significant variance, we undertook random‐effects modelling, giving a prevalence of 10.93% (95% CI 8.91 to 13.13; I2 = 37.8%, P value = 0.03).
10 VPA versus controls
10.1. All major malformations
10.1.1 VPA versus no medication (in women without epilepsy)
Pooled results from seven studies showed a significant outcome (RR 5.69, 95% CI 3.33 to 9.73; I2 = 0%), with children exposed to VPA (N = 467) experiencing more major malformations than control children (N = 1936) (Arulmozhi 2006; Cassina 2013; Koch 1992; Mawer 2010; North American Register; Steegers‐Theunissen 1994; Tanganelli 1992; see Analysis 10.1). This gave a significant RD (RD 0.08, 95% CI 0.05 to 0.11; I2 = 0%).
10.1. Analysis.
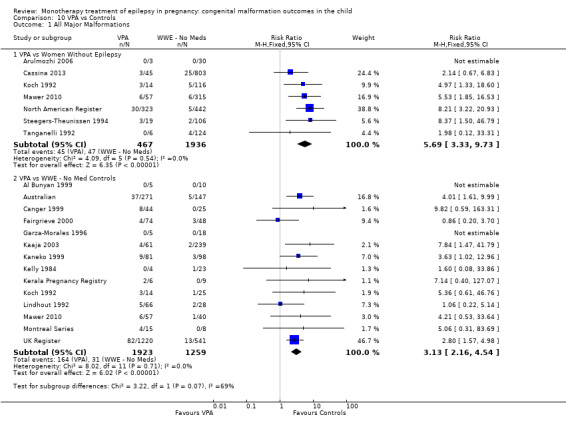
Comparison 10 VPA vs Controls, Outcome 1 All Major Malformations.
Data from the Israeli Teratogen Service study, including women treated with VPA for epilepsy and other indications (restricted to monotherapy), reported major congenital malformations (MCM) in 3/89 (3.4%) VPA‐treated cases compared with 31/1236 (2.5%) of control children. Samren 1997 reported 16 cases of major malformations out of 184 (9%) VPA‐exposed children. When limited to the two sites with control children, investigators reported six cases with malformation out of 21 children exposed to VPA, which was significantly higher than control children (RR 4.9, 95% CI 1.6 to 15.0).
10.1.2 VPA versus no medication (in women with epilepsy)
Pooled results from 14 studies showed a significant outcome (RR 3.13, 95% CI 2.16 to 4.54; I2 = 0%), with children exposed to VPA (N = 1923) experiencing more major malformations than control children (N = 1259) (Al Bunyan 1999; Australian; Canger 1999; Fairgrieve 2000; Garza‐Morales 1996; Kaaja 2003; Kaneko 1999; Kelly 1984; Kerala Pregnancy Registry; Koch 1992; Lindhout 1992; Mawer 2010; Montreal Series; UK Register; see Analysis 10.1). This gave a significant RD (RD 0.06, 95% CI 0.04 to 0.08; I2 = 33%). Due to high heterogeneity, we undertook a random‐effects analysis (RD (RE) 0.07, 95% CI 0.03 to 0.10; I2 = 33%), but this did not change the significance of the result.
10.2 Neural tube malformations
10.2.1 VPA versus no medication (in women without epilepsy)
Pooled results from two studies showed a non‐significant outcome (RR 6.05, 95% CI 0.94 to 38.81; I2 = 20%), with no difference in the number of neural tube malformations in children exposed to VPA (N = 71, 1.4%) and control children (N = 431, 0.2%) (Koch 1992; Mawer 2010; see Analysis 10.2). This gave a non‐significant RD (RD 0.01, 95% CI −0.03 to 0.05; I2 = 51%).
10.2. Analysis.
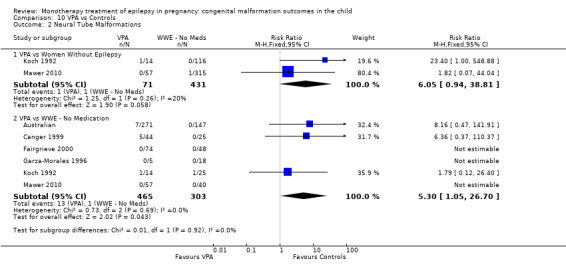
Comparison 10 VPA vs Controls, Outcome 2 Neural Tube Malformations.
10.2.2 VPA versus no medication (in women with epilepsy)
Pooled results from six studies showed a significant outcome (RR 5.30, 95% CI 1.05 to 26.70; I2 = 0%), with more children exposed to VPA (N = 465) experiencing neural tube malformations than control children (N = 303) (Australian; Canger 1999; Fairgrieve 2000;Garza‐Morales 1996; Koch 1992; Mawer 2010; see Analysis 10.2). This gave a significant RD (RD 0.03, 95% CI 0.01 to 0.05; I2 = 21%).
10.3 Cardiac malformations
10.3.1 VPA versus no medication (in women without epilepsy)
Pooled results from two studies showed a significant outcome (RR 16.40, 95% CI 3.05 to 88.19; I2 = 0%), with children exposed to VPA (N = 71) experiencing more cardiac malformations than control children (N = 431) (Koch 1992; Mawer 2010; see Analysis 10.3). This gave a significant RD (RD 0.07, 95% CI 0.01 to 0.13; I2 = 0%).
10.3. Analysis.
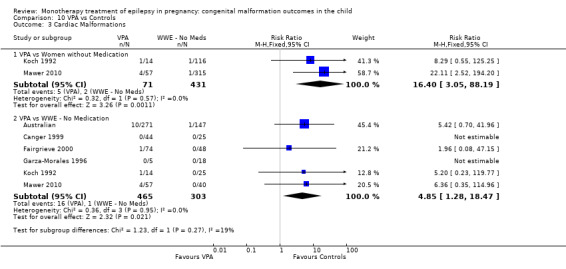
Comparison 10 VPA vs Controls, Outcome 3 Cardiac Malformations.
10.3.2 VPA versus no medication (in women with epilepsy)
Pooled results from six studies showed a significant outcome (RR 4.85, 95% CI 1.28 to 18.47; I2 = 0%), with no difference in the number of cardiac malformations in children exposed to VPA (N = 465) and control children (N = 303) (Australian; Canger 1999; Fairgrieve 2000; Garza‐Morales 1996; Koch 1992; Mawer 2010; see Analysis 10.3). This gave a significant RD (RD 0.03, 95% CI 0.01 to 0.05; I2 = 0%).
10.4 Oro‐facial cleft/craniofacial malformations
10.4.1 VPA versus no medication (in women without epilepsy)
Pooled results from two studies showed a non‐significant outcome (RR 2.76, 95% CI 0.31 to 24.78; I2 = NA), with no difference in the number of oro‐facial cleft/craniofacial malformations in children exposed to VPA (N = 71) and control children (N = 431) (Koch 1992; Mawer 2010; see Analysis 10.3). This gave a non‐significant RD (RD 0.01, 95% CI −0.03 to 0.04; I2 = 0%).
10.4.2 VPA versus no medication (in women with epilepsy)
Pooled results from six studies showed a significant outcome (RR 5.16, 95% CI 1.13 to 23.69; I2 = 24%), with more children exposed to VPA (N = 465) experiencing oro‐facial cleft/craniofacial malformations than control children (N = 303) (Australian; Canger 1999; Fairgrieve 2000; Garza‐Morales 1996; Koch 1992; Mawer 2010; see Analysis 10.4). This gave a significant RD (RD 0.03, 95% CI 0.01 to 0.05; I2 = 20%).
10.4. Analysis.
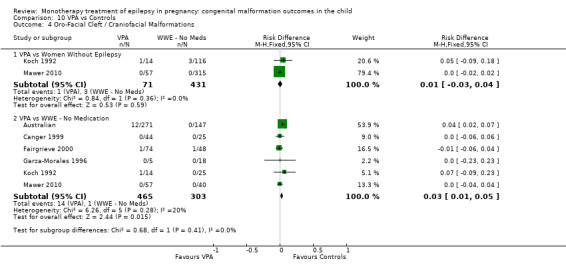
Comparison 10 VPA vs Controls, Outcome 4 Oro‐Facial Cleft / Craniofacial Malformations.
10.5 Skeletal/limb malformations
10.5.1 VPA versus no medication (in women without epilepsy)
Pooled results from two studies showed a significant outcome (RR 16.48, 95% CI 2.46 to 110.49; I2 = 0%), with children exposed to VPA (N = 71) experiencing more skeletal/limb malformations than control children (N = 431) (Koch 1992; Mawer 2010; see Analysis 10.5). This gave a non‐significant RD (RD 0.04, 95% CI −0.01 to 0.09; I2 = 56%).
10.5. Analysis.
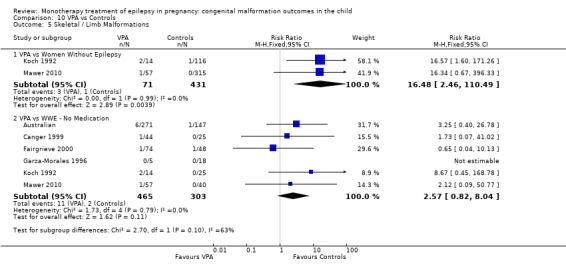
Comparison 10 VPA vs Controls, Outcome 5 Skeletal / Limb Malformations.
10.5.2 VPA versus no medication (in women with epilepsy)
Pooled results from six studies showed a non‐significant outcome (RR 2.57, 95% CI 0.82 to 8.04; I2 = 0), with no difference in the number of skeletal/limb malformations in children exposed to VPA (N = 465) and control children (N = 303) (Australian; Canger 1999; Fairgrieve 2000; Garza‐Morales 1996; Koch 1992; Mawer 2010; see Analysis 10.5). This gave a non‐significant RD (RD 0.02, 95% CI −0.00 to 0.04; I2 = 0%).
Valproate dose
In contrast to the results on dosage for the other AEDs, for VPA there appears to be a consistently documented association between increased dose and the risk for malformation in the exposed child. In the largest group of children exposed to VPA included (N = 1220), UK Register documented an increase in malformation from 5.0% at doses < 600 mg/d to 10.4% for doses > 1000 mg/d (OR 2.20 95% CI 1.26 to 3.82, P = 0.0045). Consistently, the large cohort followed by the EURAP collaboration (N = 1010) notes a significantly lower malformation rate (6.7%) at doses < 600 mg/d compared with doses of > 700 mg/d to 1500 mg/d (10.4%, OR 3.8, 95% CI 3.27 to 10.13, P < 0.0001) and doses of > 1500 mg/d (24.2%, OR 16.1, 95% CI 8.22 to 31.54, P < 0.0001). The Australian cohort also demonstrated an association with VPA (N = 271) (P value not reported) as did the North American Register (N = 323; P value not reported), where investigators reported the median daily dose in VPA‐exposed children with a malformation to be 1000 mg/d compared with children exposed to VPA without a malformation (750 mg/d). Studies with smaller numbers of VPA‐exposed children also reported data showing an association between VPA dose or serum levels and increased malformation rate (Canger 1999; Israeli Teratogen Service; Kaneko 1999; Lindhout 1992; Mawer 2010; Meador 2006; Samren 1997).
A number of studies did not investigate the dose of VPA and malformation outcome (Al Bunyan 1999; Arulmozhi 2006; Cassina 2013; Fairgrieve 2000; Garza‐Morales 1996; Koch 1992; Montreal Series; Steegers‐Theunissen 1994; Tanganelli 1992). Kaaja 2003 was the only study that investigated a dose‐response association without finding a positive correlation (N = 61 VPA exposed pregnancies).
Zonisamide
The prevalence of major malformations (any type) for children exposed to zonisamide (ZNS) (N = 90), based on data from one study, was 0.28% (95% CI 0.25 to 2.39; I2 = NA, P value = NA).
11 ZNS versus controls
11.1. All major malformations
11.1.1 ZNS versus no medication (in women without epilepsy)
North American Register reported a non‐significant outcome (RR 0.44, 95% CI 0.02 to 7.93; I2 = NA), with no difference in the number of major malformations in children exposed to ZNS (N = 90) and control children (N = 442) (Analysis 11.1). This gave a non‐significant RD (RD −0.01, 95% CI −0.03 to 0.01; I2 = NA).
11.1. Analysis.
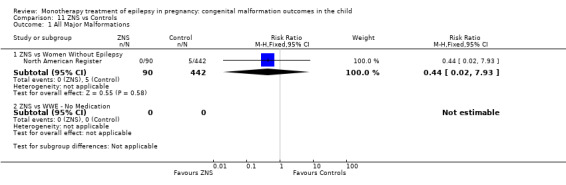
Comparison 11 ZNS vs Controls, Outcome 1 All Major Malformations.
11.1.2 ZNS versus no medication (in women with epilepsy)
No included studies reported data on this outcome.
11.2. Neural tube malformations
11.2.1 ZNS versus no medication (in women without epilepsy)
No included studies reported data on this outcome.
11.2.2 ZNS versus no medication (in women with epilepsy)
No included studies reported data on this outcome.
11.3 Cardiac malformations
11.3.1 ZNS versus no medication (in women without epilepsy)
No included studies reported data on this outcome.
11.3.2 ZNS versus no medication (in women with epilepsy)
No included studies reported data on this outcome.
11.4 Oro‐facial cleft/craniofacial malformations
11.4.1 ZNS versus no medication (in women without epilepsy)
No included studies reported data on this outcome.
11.4.2 ZNS versus no medication (in women with epilepsy)
No included studies reported data on this outcome.
11.5 Skeletal/limb malformations
11.5.1 ZNS versus no medication (in women without epilepsy)
No included studies reported data on this outcome.
11.5.2 ZNS versus no medication (in women with epilepsy)
No included studies reported data on this outcome.
Zonisamide dose
No included study investigated a potential association between ZNS and malformation risk.
AED versus AED comparisons
12 CBZ versus GBP
12.1. All major malformations
Pooled results from three studies showed a non‐significant outcome (RR 2.28, 95% CI 0.67 to 7.79; I2 = 0%), with no difference in the number of major malformations in children exposed to CBZ (N = 3051) and children exposed to GBP (N = 190) (Australian; North American Register; UK Register; see Analysis 12.1). This gave a significant RD (RD 0.02, 95% CI 0.00* to 0.04; I2 = 0%).
12.1. Analysis.

Comparison 12 CBZ vs GBP, Outcome 1 All Major Malformations.
12.2 Neural tube malformations
Data from Australian showed a non‐significant outcome (RR 0.12, 95% CI 0.01 to 2.93; I2 = NA), with no difference in the number of neural tube malformations in children exposed to CBZ (N = 361) and children exposed to GBP (N = 14) (Analysis 12.2). This gave a non‐significant RD (RD 0.00, 95% CI −0.09 to 0.09; I2 = NA).
12.2. Analysis.
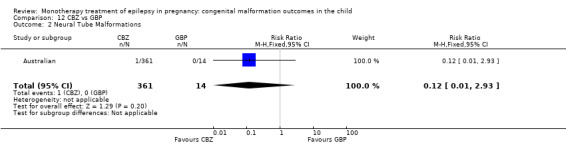
Comparison 12 CBZ vs GBP, Outcome 2 Neural Tube Malformations.
12.3 Cardiac malformations
Data from Australian showed a non‐significant outcome (RR 0.29, 95% CI 0.02 to 5.37; I2 = NA), with no difference in the number of cardiac malformations in children exposed to CBZ (N = 361) and children exposed to GBP (N = 14) (Analysis 12.3). This gave a non‐significant RD (RD 0.01, 95% CI −0.08 to 0.10; I2 = NA).
12.3. Analysis.

Comparison 12 CBZ vs GBP, Outcome 3 Cardiac Malformations.
12.4 Oro‐facial cleft/craniofacial malformations
Data from Australian showed a non‐significant outcome (RR 0.37, 95% CI 0.02 to 6.62; I2 = NA), with no difference in the number of oro‐facial cleft/craniofacial malformations in children exposed to CBZ (N = 361) and children exposed to GBP (N = 14) (Analysis 12.4). This gave a non‐significant RD (RD 0.01, 95% CI −0.08 to 0.10; I2 = NA).
12.4. Analysis.
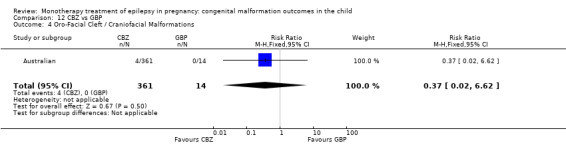
Comparison 12 CBZ vs GBP, Outcome 4 Oro‐Facial Cleft / Craniofacial Malformations.
12.5 Skeletal/limb malformations
Data from Australian showed a non‐significant outcome (RR 0.21, 95% CI 0.01 to 4.13; I2 = NA), with no difference in the number of skeletal/limb malformations in children exposed to CBZ (N = 361) and children exposed to GBP (N = 14) (Analysis 12.5). This gave a non‐significant RD (RD 0.01, 95% CI −0.09 to 0.10; I2 = NA).
12.5. Analysis.
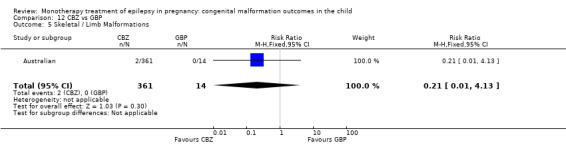
Comparison 12 CBZ vs GBP, Outcome 5 Skeletal / Limb Malformations.
13 CBZ versus LEV
13.1. All major malformations
Pooled results from three studies showed a significant outcome (RR 1.84, 95% CI 1.03 to 3.29; I2 = 27%), with more children exposed to CBZ (N = 3051) experiencing major malformations than children exposed to LEV (N = 817) (Australian; North American Register; UK Register; see Analysis 13.1). This gave a significant RD (RD 0.01, 95% CI 0.00* to 0.02; I2 = 28%).
13.1. Analysis.
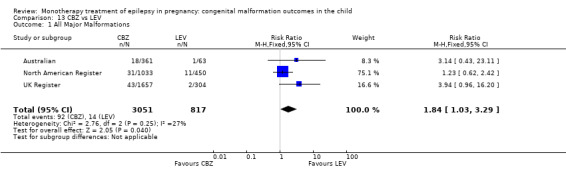
Comparison 13 CBZ vs LEV, Outcome 1 All Major Malformations.
13.2 Neural tube malformations
Pooled results from three studies showed a non‐significant outcome (RR 1.19, 95% CI 0.25 to 5.55; I2 = 0%), with no difference in the number of neural tube malformations in children exposed to CBZ (N = 3051) and children exposed to LEV (N = 817) (Australian; North American Register; UK Register; see Analysis 13.2). This gave a non‐significant RD (RD 0.00, 95% CI −0.00 to 0.01; I2 = 0%).
13.2. Analysis.
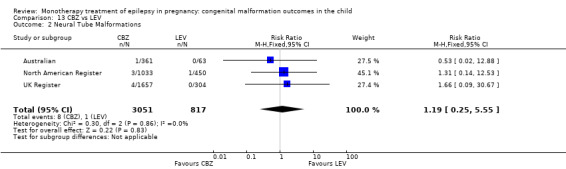
Comparison 13 CBZ vs LEV, Outcome 2 Neural Tube Malformations.
13.3 Cardiac malformations
Pooled results from three studies showed a non‐significant outcome (RR 1.83, 95% CI 0.48 to 6.97; I2 = 0%), with no difference in the number of cardiac malformations in children exposed to CBZ (N = 3051) and children exposed to LEV (N = 817) (Australian; North American Register; UK Register; see Analysis 13.3). This gave a non‐significant RD (RD 0.00, 95% CI −0.00 to 0.01; I2 = 48%).
13.3. Analysis.
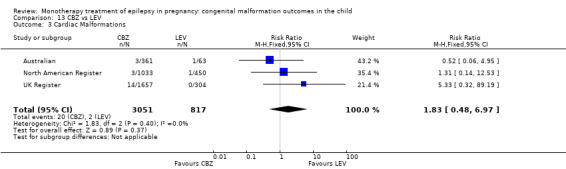
Comparison 13 CBZ vs LEV, Outcome 3 Cardiac Malformations.
13.4 Oro‐facial cleft/craniofacial malformations
Pooled results from three studies showed a non‐significant outcome (RR 1.83, 95% CI 0.44 to 7.61; I2 = 0%), with no difference in the number of oro‐facial cleft/craniofacial malformations in children exposed to CBZ (N = 3051) and children exposed to LEV (N = 817) (Australian; North American Register; UK Register; see Analysis 13.4). This gave a non‐significant RD (RD 0.00, 95% CI −0.00 to 0.01; I2 = 0%).
13.4. Analysis.
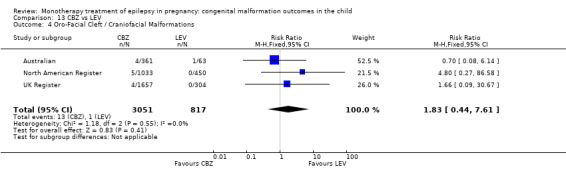
Comparison 13 CBZ vs LEV, Outcome 4 Oro‐Facial Cleft / Craniofacial Malformations.
13.5 Skeletal/limb malformations
Pooled results from three studies showed a non‐significant outcome (RR 2.30, 95% CI 0.44 to 11.86; I2 = 0%), with no difference in the number of skeletal/limb malformations in children exposed to CBZ (N = 3051) and children exposed to LEV (N = 817) (Australian; North American Register; UK Register; see Analysis 13.5). This gave a non‐significant RD (RD 0.00, 95% CI −0.00 to 0.01; I2 = 0%).
13.5. Analysis.
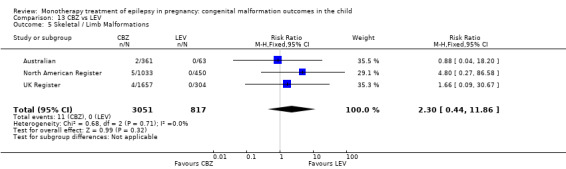
Comparison 13 CBZ vs LEV, Outcome 5 Skeletal / Limb Malformations.
14 CBZ versus LTG
14.1. All major malformations
Pooled results from seven studies showed a significant outcome (RR 1.34, 95% CI 1.01 to 1.76; I2 = 0%), with children exposed to CBZ (N = 3385) experiencing more major malformations than children exposed to LTG (N = 4164) (Australian; Cassina 2013; Martinez Ferri 2009; Mawer 2010; Meador 2006; North American Register; UK Register; see Analysis 14.1). This gave a significant RD (RD 0.01, 95% CI 0.00* to 0.02; I2 = 10%).
14.1. Analysis.
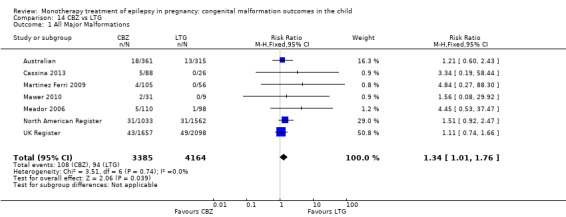
Comparison 14 CBZ vs LTG, Outcome 1 All Major Malformations.
In the EURAP data, rates of malformation in children exposed to CBZ were: 5/148 (3.4%) for exposures < 400 mg/d, 56/1047 (5.3%) for exposures > 400 to 1000 mg/d and 18/207 (8.7%) for exposures > 1000 mg/d. In comparison, the rates of MCM for children exposed to LTG were: 17/836 (2.0%) for exposures < 300 mg/d and 20/444 (4.5%) for exposures > 300 mg/d. We did not find a significant difference between children exposed to CBZ < 400 mg/d compared with children exposed to LTG < 300 mg/d. However, children exposed to > 400 to 1000 mg/d of CBZ were significantly more likely to have a MCM than children exposed to < 300 mg of LTG (P = 0.0012), as were children exposed to > 1000 mg/d of CBZ (< 0.0001). We did not compare higher levels of CBZ versus higher levels of LTG.
14.2. Neural tube malformations
Pooled results from six studies showed a non‐significant outcome (RR 2.32, 95% CI 0.79 to 6.82; I2 = 0%), with no difference in the number of neural tube malformations in children exposed to CBZ (N = 3354) and children exposed to LTG (N = 4155) (Australian; Cassina 2013; Martinez Ferri 2009; Meador 2006; North American Register; UK Register; see Analysis 14.2). This gave a non‐significant RD (RD 0.00, 95% CI −0.00 to 0.00; I2 = 0%).
14.2. Analysis.
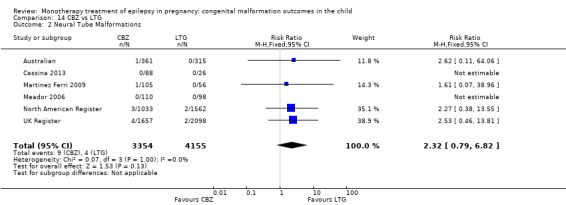
Comparison 14 CBZ vs LTG, Outcome 2 Neural Tube Malformations.
In the EURAP data, the prevalence of neural tube malformations in those exposed to CBZ and LTG was: CBZ < 400 mg/d, 0/148 (0%); CBZ > 400 to 1000 mg/d, 1/1047 (0%); CBZ > 1000 mg/d, 4/207 (2%); LTG < 300 mg/d, 0/836 (0%); LTG > 300 mg/d, 0/444 (0%).
14.3 Cardiac malformations
Pooled results from six studies showed a non‐significant outcome (RR 1.57, 95% CI 0.85 to 2.89; I2 = 0%), with no difference in the number of cardiac malformations in children exposed to CBZ (N = 3354) and children exposed to LTG (N = 4155) (Australian; Cassina 2013; Martinez Ferri 2009; Meador 2006; North American Register; UK Register; see Analysis 14.3). This gave a non‐significant RD (RD 0.00, 95% CI −0.00 to 0.01; I2 = 0%).
14.3. Analysis.
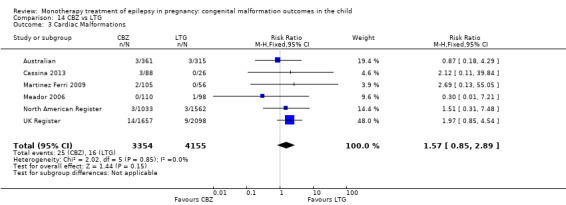
Comparison 14 CBZ vs LTG, Outcome 3 Cardiac Malformations.
In the EURAP data, the prevalence of cardiac malformations in those exposed to CBZ and LTG was: CBZ < 400 mg/d, 2/148 (1%); CBZ > 400 to 1000 mg/d, 16/1047 (2%); CBZ > 1000 mg/d, 4/207 (2%); LTG < 300, 3/836 (0%); LTG > 300 mg/d, 5/444 (1%).
14.4 Oro‐facial cleft/craniofacial malformations
Pooled results from six studies showed a non‐significant outcome (RR 1.12, 95% CI 0.53 to 2.37; I2 = 0%), with no difference in the number of oro‐facial cleft/craniofacial malformations in children exposed to CBZ (N = 3354) and children exposed to LTG (N = 4155) (Australian; Cassina 2013; Martinez Ferri 2009; Meador 2006; North American Register; UK Register; see Analysis 14.4). This gave a non‐significant RD (RD 0.00, 95% CI −0.00 to 0.00; I2 = 0%).
14.4. Analysis.
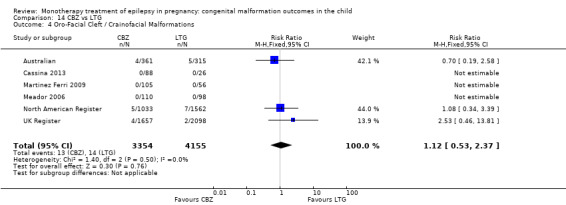
Comparison 14 CBZ vs LTG, Outcome 4 Oro‐Facial Cleft / Crainofacial Malformations.
In the EURAP data, the prevalence of oro‐facial cleft malformations in those exposed to CBZ and LTG was: CBZ < 400 mg/d, 0/148 (0%); CBZ > 400 to 1000 mg/d, 2/1047 (0%); CBZ > 1000 mg/d, 0/207 (0%); LTG < 300, 0/836 (0%); LTG > 300 mg/d, 2/444 (1%).
14.5 Skeletal/limb malformations
Pooled results from six studies showed a non‐significant outcome (RR 2.56, 95% CI 0.97 to 6.73; I2 = 0%), with no difference in the number of skeletal/limb malformations in children exposed to CBZ (N = 3354) and children exposed to LTG (N = 4155) (Australian; Cassina 2013; Martinez Ferri 2009; Meador 2006; North American Register; UK Register; see Analysis 14.5). This gave a non‐significant RD (RD 0.00, 95% CI −0.00 to 0.00; I2 = 0%).
14.5. Analysis.
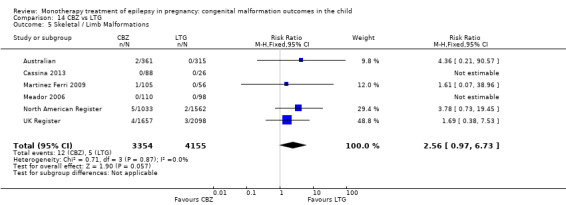
Comparison 14 CBZ vs LTG, Outcome 5 Skeletal / Limb Malformations.
15 CBZ versus OXC
15.1. All major malformations
Pooled results from four studies showed a non‐significant outcome (RR 1.44, 95% CI 0.66 to 3.16; I2 = 38%), with no difference in the number of major malformations in children exposed to CBZ (N = 1773) and children exposed to OXC (N = 238) (Australian; Kaaja 2003; Meischenguiser 2004; North American Register; see Analysis 15.1). This gave a non‐significant RD (RD 0.01, 95% CI −0.01 to 0.04; I2 = 3%).
15.1. Analysis.
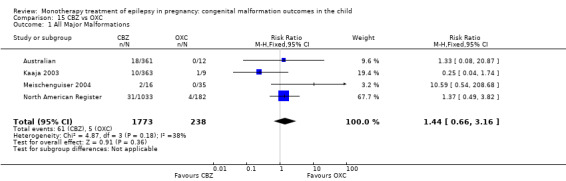
Comparison 15 CBZ vs OXC, Outcome 1 All Major Malformations.
15.2 Neural tube malformations
Pooled results from four studies showed a non‐significant outcome (RR 0.48, 95% CI 0.09 to 2.54; I2 = 0%), with no difference in the number of neural tube malformations in children exposed to CBZ (N = 1773) and children exposed to OXC (N = 238) (Australian; Kaaja 2003; Meischenguiser 2004; North American Register; see Analysis 15.2). This gave a non‐significant RD (RD 0.00, 95% CI −0.01 to 0.02; I2 = 0%).
15.2. Analysis.
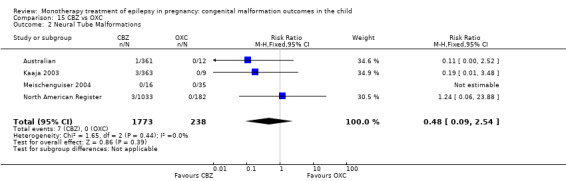
Comparison 15 CBZ vs OXC, Outcome 2 Neural Tube Malformations.
15.3 Cardiac malformations
Pooled results from four studies showed a non‐significant outcome (RR 0.51, 95% CI 0.10 to 2.69; I2 = 0%), with no difference in the number of cardiac malformations in children exposed to CBZ (N = 1773) and children exposed to OXC (N = 238) (Australian; Kaaja 2003; Meischenguiser 2004; North American Register; see Analysis 15.3). This gave a non‐significant RD (RD 0.00, 95% CI −0.01 to 0.02; I2 = 0%)
15.3. Analysis.
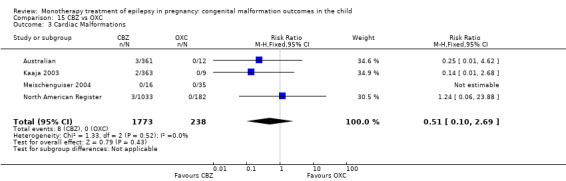
Comparison 15 CBZ vs OXC, Outcome 3 Cardiac Malformations.
15.4 Oro‐facial cleft/craniofacial malformations
Pooled results from four studies showed a non‐significant outcome (RR 0.53, 95% CI 0.12 to 2.33; I2 = 0%), with no difference in the number of oro‐facial cleft/craniofacial malformations in children exposed to CBZ (N = 1773) and children exposed to OXC (N = 238) (Australian; Kaaja 2003; Meischenguiser 2004; North American Register; see Analysis 15.4). This gave a non‐significant RD (RD 0.00, 95% CI −0.01 to 0.02; I2 = 0%).
15.4. Analysis.
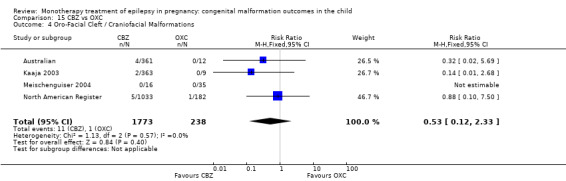
Comparison 15 CBZ vs OXC, Outcome 4 Oro‐Facial Cleft / Craniofacial Malformations.
15.5 Skeletal/limb malformations
Pooled results from four studies showed a non‐significant outcome (RR 0.48, 95% CI 0.11 to 2.11; I2 = 0%), with no difference in the number of skeletal/limb malformations in children exposed to CBZ (N = 1773) and children exposed to OXC (N = 238) (Australian; Kaaja 2003; Meischenguiser 2004; North American Register; see Analysis 15.5). This gave a non‐significant RD (RD −0.00, 95% CI −0.01 to 0.01; I2 = 0%).
15.5. Analysis.
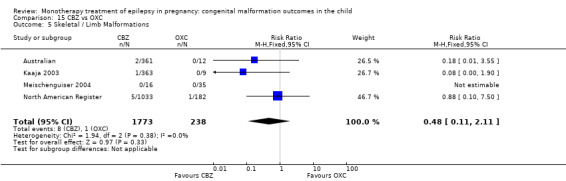
Comparison 15 CBZ vs OXC, Outcome 5 Skeletal / Limb Malformations.
16 CBZ versus PB
16.1 All major malformations
Pooled results from 22 studies showed a non‐significant outcome (RR 0.84, 95% CI 0.60 to 1.16; I2 = 0%), with no difference in the number of major malformations in children exposed to CBZ (N = 2665) and children exposed to PB (N = 703) (Al Bunyan 1999; Australian; Canger 1999; Cassina 2013; Delmiš 1991; D'Souza 1990; Eroglu 2008; Martinez Ferri 2009; Froscher 1991; Kaaja 2003; Kaneko 1999; Kerala Pregnancy Registry; Koch 1992; Lindhout 1992; Meischenguiser 2004; Montreal Series; North American Register; Omtzigt 1992; Pardi 1982; Steegers‐Theunissen 1994; Tanganelli 1992; Waters 1994; see Analysis 16.1). This gave a non‐significant RD (RD −0.01, 95% CI −0.03 to 0.02; I2 = 0%).
16.1. Analysis.
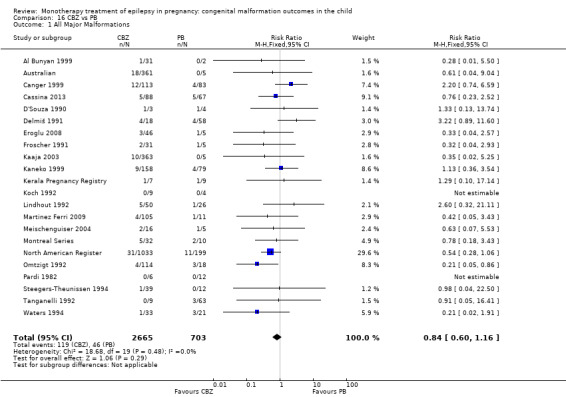
Comparison 16 CBZ vs PB, Outcome 1 All Major Malformations.
In the EURAP, data the prevalence of MCM between these two groups for children exposed to CBZ was: 5/148 (3.4%) for exposures < 400 mg/d, 56/1047 (5.3%) for exposures 400 to 1000 mg/d and 18/207 (8.7%) for exposures > 1000 mg/d. In comparison, the rates of MCM for children exposed to PB were: 9/166 (5.4%) for exposures < 150 mg/d and 7/51 (13.7%) for exposures > 150 mg/d. Samren 1997 reported 22 major malformation cases in 280 (8%) CBZ‐exposed children and five cases from 48 (10%) PB exposed children.
16.2 Neural tube malformations
Pooled results from 12 studies showed a non‐significant outcome (RR 1.02, 95% CI 0.19 to 5.39; I2 = 49%), with no difference in the number of neural tube malformations in children exposed to CBZ (N = 1830) and children exposed to PB (N = 416) (Australian; Canger 1999; Cassina 2013; D'Souza 1990; Eroglu 2008; Froscher 1991; Kerala Pregnancy Registry; Koch 1992; Meischenguiser 2004; North American Register; Omtzigt 1992; Pardi 1982; see Analysis 16.2). This gave a non‐significant RD (RD 0.00, 95% CI −0.01 to 0.02; I2 = 0%).
16.2. Analysis.
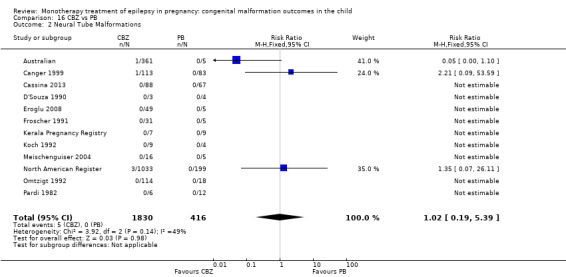
Comparison 16 CBZ vs PB, Outcome 2 Neural Tube Malformations.
In the EURAP data, the prevalence of neural tube malformations in those exposed to CBZ and PB was: CBZ < 400 mg/d, 0/148 (0%); CBZ 400 to 1000 mg/d, 1/1047 (0%); CBZ > 1000 mg/d, 4/207 (2%); PB < 150 mg/d, 1/166 (1%); PB > 150 mg/d, 0/51 (0%).
16.3 Cardiac malformations
Pooled results from 12 studies showed a significant outcome (RR 0.34, 95% CI 0.18 to 0.62; I2 = 19%), with children exposed to CBZ (N = 1935) experiencing fewer cardiac malformations than children exposed to PB (N = 450) (Australian; Canger 1999; Cassina 2013; D'Souza 1990; Eroglu 2008; Froscher 1991; Kerala Pregnancy Registry; Koch 1992; Meischenguiser 2004; North American Register; Omtzigt 1992; Pardi 1982; see Analysis 16.5). This gave a significant RD (RD −0.02, 95% CI −0.05 to −0.00; I2 = 0%).
16.5. Analysis.
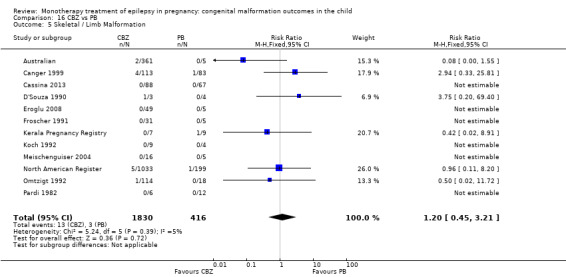
Comparison 16 CBZ vs PB, Outcome 5 Skeletal / Limb Malformation.
In the EURAP data, the prevalence of cardiac malformations in those exposed to CBZ and PB was: CBZ < 400 mg/d, 2/148 (1%); CBZ 400 to 1000 mg/d, 16/1047 (2%); CBZ > 1000 mg/d, 4/207 (2%); PB < 150 mg/d, 2/166 (1%); PB > 150 mg/d, 4/51 (8%).
16.4 Oro‐facial cleft/craniofacial malformations
Pooled results from 12 studies showed a significant outcome (RR 0.18, 95% CI 0.07 to 0.48; I2 = 0%), with children exposed to CBZ (N = 1830) experiencing fewer oro‐facial cleft/craniofacial malformations than children exposed to PB (N = 416) (Australian; Canger 1999; Cassina 2013; D'Souza 1990; Eroglu 2008; Froscher 1991; Kerala Pregnancy Registry; Koch 1992; Meischenguiser 2004; North American Register; Omtzigt 1992; Pardi 1982; see Analysis 16.4). However, this gave a non‐significant RD (RD −0.01, 95% CI −0.03 to 0.00; I2 = 0%).
16.4. Analysis.
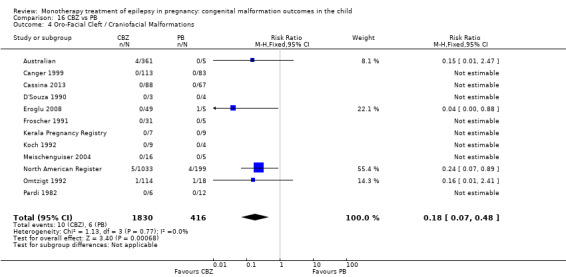
Comparison 16 CBZ vs PB, Outcome 4 Oro‐Facial Cleft / Craniofacial Malformations.
In the EURAP data, the prevalence of oro‐facial cleft malformations in those exposed to CBZ and PB was: CBZ < 400 mg/d, 0/148 (0%); CBZ 400 to 1000 mg/d, 2/1047 (0%); CBZ > 1000 mg/d, 0/207 (0%); PB < 150 mg/d, 0/166 (0%); PB > 150 mg/d, 1/51 (2%).
16.5 Skeletal/limb malformations
Pooled results from 12 studies showed a non‐significant outcome (RR 1.20, 95% CI 0.45 to 3.21; I2 = 5%), with no difference in the number of skeletal/limb malformations in children exposed to CBZ (N = 1830) and children exposed to PB (N = 416) (Australian; Canger 1999; Cassina 2013; D'Souza 1990; Eroglu 2008; Froscher 1991; Kerala Pregnancy Registry; Koch 1992; Meischenguiser 2004; North American Register; Omtzigt 1992; Pardi 1982; see Analysis 16.5). This gave a non‐significant RD (RD 0.00, 95% CI −0.01 to 0.02; I2 = 0%).
17 CBZ versus PHT
17.1 All major malformations
Pooled results from 23 studies showed a non‐significant outcome (RR 0.82, 95% CI 0.61 to 1.11; I2 = 0%), with no difference in the number of major malformations in children exposed to CBZ (N = 4262) and children exposed to PHT (N = 1183) (Al Bunyan 1999; Arulmozhi 2006; Australian; Bag 1989; Canger 1999; D'Souza 1990; Eroglu 2008; Froscher 1991; Garza‐Morales 1996; Kaaja 2003; Kaneko 1999; Kerala Pregnancy Registry; Koch 1992; Lindhout 1992; Mawer 2010; Meador 2006; Montreal Series; North American Register; Omtzigt 1992; Pardi 1982; Steegers‐Theunissen 1994; UK Register; Waters 1994; see Analysis 17.1). This gave a non‐significant RD (RD −0.01, 95% CI −0.02 to 0.01; I2 = 0%).
17.1. Analysis.
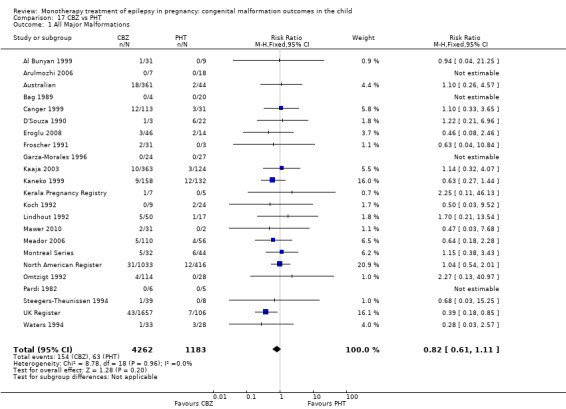
Comparison 17 CBZ vs PHT, Outcome 1 All Major Malformations.
Data from the Motherisk Registry, including women treated with CBZ for epilepsy and other conditions, showed a prevalence of MCM to be 3/34 (8.8%) for children exposed to PHT and 2/35 (5.7%) for those exposed to CBZ. Samren 1997 reported 22 cases of major malformation out of 280 (8%) CBZ‐exposed children and 9 cases from 141 PHT exposed children (9%).
17.2 Neural tube malformations
Pooled results from 14 studies showed a non‐significant outcome (RR 1.03, 95% CI 0.31 to 3.37; I2 = 0%), with no difference in the number of neural tube malformations in children exposed to CBZ (N = 3860) and children exposed to PHT (N = 874) (Australian; Bag 1989; Canger 1999; D'Souza 1990; Eroglu 2008; Froscher 1991; Kaaja 2003; Kerala Pregnancy Registry; Koch 1992; Meador 2006; North American Register; Omtzigt 1992; Pardi 1982; UK Register; see Analysis 17.2). This gave a non‐significant RD (RD 0.00, 95% CI −0.01 to 0.01; I2 = 0%).
17.2. Analysis.
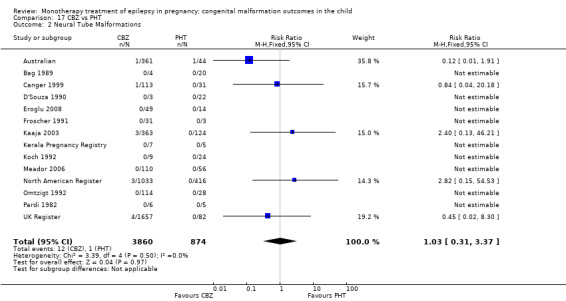
Comparison 17 CBZ vs PHT, Outcome 2 Neural Tube Malformations.
17.3 Cardiac malformations
Pooled results from 14 studies showed a non‐significant outcome (RR 0.92, 95% CI 0.47 to 1.78; I2 = 8%), with no difference in the number of cardiac malformations in children exposed to CBZ (N = 3965) and children exposed to PHT (N = 969) (Australian; Bag 1989; Canger 1999; D'Souza 1990; Eroglu 2008; Froscher 1991; Kaaja 2003; Kerala Pregnancy Registry; Koch 1992; Meador 2006; North American Register; Omtzigt 1992; Pardi 1982; UK Register; see Analysis 17.3). This gave a non‐significant RD (RD −0.00, 95% CI −0.01 to 0.01; I2 = 0%).
17.3. Analysis.
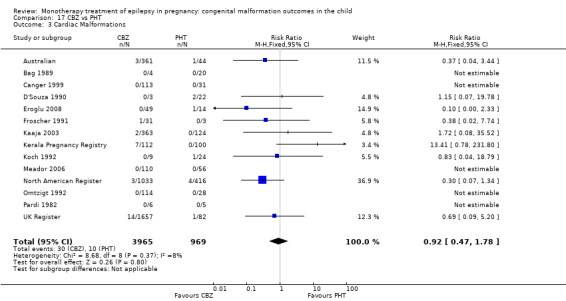
Comparison 17 CBZ vs PHT, Outcome 3 Cardiac Malformations.
17.4 Oro‐facial cleft/craniofacial malformations
Pooled results from 14 studies showed a non‐significant outcome (RR 0.80, 95% CI 0.31 to 2.05; I2 = 0%), with no difference in the number of oro‐facial cleft/craniofacial malformations in children exposed to CBZ (N = 3860) and children exposed to PHT (N = 874) (Australian; Bag 1989; Canger 1999; D'Souza 1990; Eroglu 2008; Froscher 1991; Kaaja 2003; Kerala Pregnancy Registry; Koch 1992; Meador 2006; North American Register; Omtzigt 1992; Pardi 1982; UK Register; see Analysis 17.4). This gave a non‐significant RD (RD −0.00, 95% CI −0.01 to 0.01; I2 = 0%).
17.4. Analysis.
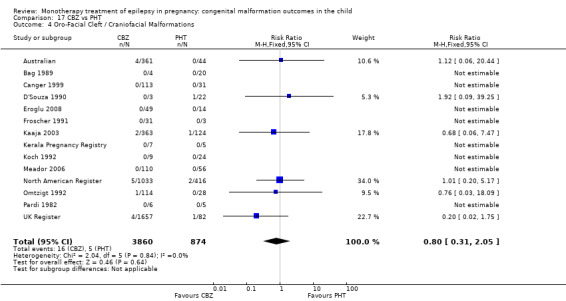
Comparison 17 CBZ vs PHT, Outcome 4 Oro‐Facial Cleft / Craniofacial Malformations.
17.5 Skeletal/limb malformations
Pooled results from 14 studies showed a non‐significant outcome (RR 0.78, 95% CI 0.35 to 1.75; I2 = 0%), with no difference in the number of skeletal/limb malformations in children exposed to CBZ (N = 3860) and children exposed to PHT (N = 874) (Australian; Bag 1989; Canger 1999; D'Souza 1990; Eroglu 2008; Froscher 1991; Kaaja 2003; Kerala Pregnancy Registry; Koch 1992; Meador 2006; North American Register; Omtzigt 1992; Pardi 1982; UK Register; see Analysis 17.5). This gave a non‐significant RD (RD 0.00, 95% CI −0.01 to 0.01; I2 = 0%).
17.5. Analysis.
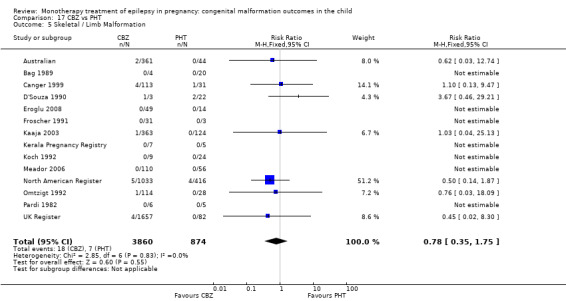
Comparison 17 CBZ vs PHT, Outcome 5 Skeletal / Limb Malformation.
18 CBZ versus PRM
18.1 All major malformations
Pooled results from six studies showed a non‐significant outcome (RR 0.80, 95% CI 0.41 to 1.57; I2 = 54%), with no difference in the number of major malformations in children exposed to CBZ (N = 667) and children with PRM (N = 110) (Canger 1999; Delmiš 1991; Kaaja 2003; Kaneko 1999; Koch 1992; Pardi 1982; see Analysis 18.1). Due to high heterogeneity, we undertook a random‐effects analysis (RR (RE) 0.64, 95% CI 0.21 to 2.01; I2 = 54%), but this did not change the significance of the result. The RD was also non‐significant (RD −0.02, 95% CI −0.09 to 0.05; I2 = 22%).
18.1. Analysis.
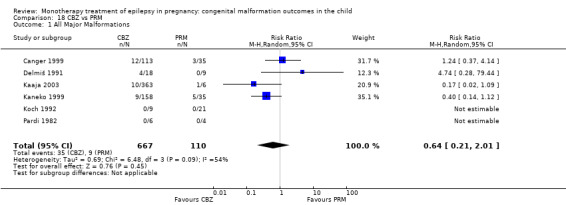
Comparison 18 CBZ vs PRM, Outcome 1 All Major Malformations.
Samren 1997 reported 22 cases of major malformation out of 280 (8%) CBZ‐exposed children and 4 cases out of 43 (9%) PRM‐exposed children.
18.2 Neural tube malformations
Pooled results from two studies showed a non‐significant outcome (RR 0.95, 95% CI 0.04 to 22.75; I2 = NA), with no difference in the number of neural tube malformations in children exposed to CBZ (N = 119) and children exposed to PRM (N = 39) (Canger 1999; Pardi 1982; see Analysis 18.2). This gave a non‐significant RD (RD 0.01, 95% CI −0.04 to 0.06; I2 = 0%).
18.2. Analysis.
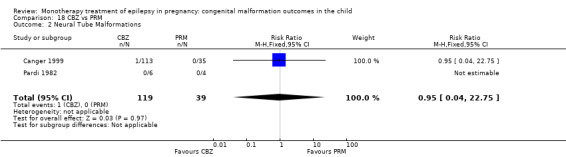
Comparison 18 CBZ vs PRM, Outcome 2 Neural Tube Malformations.
18.3 Cardiac malformations
Pooled results from two studies showed a non‐significant outcome (RR 0.11, 95% CI 0.00* to 2.53; I2 = 0%), with no difference in the number of cardiac malformations in children exposed to CBZ (N = 119) and children exposed to PRM (N = 39) (Canger 1999; Pardi 1982; see Analysis 18.3). This gave a non‐significant RD (RD −0.03, 95% CI −0.10 to 0.04; I2 = 0%).
18.3. Analysis.
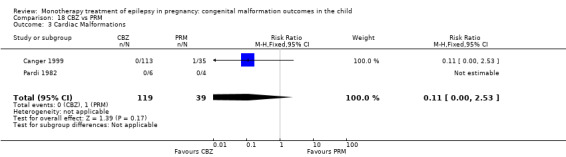
Comparison 18 CBZ vs PRM, Outcome 3 Cardiac Malformations.
18.4 Oro‐facial cleft/craniofacial malformations
We were unable to estimate pooled results from two studies due to there being no reported oro‐facial cleft/craniofacial malformations in children exposed to CBZ (N = 119) and children exposed to PRM (N = 39) (Canger 1999; Pardi 1982; see Analysis 18.4). RD was calculable, and this gave a non‐significant RD (RD 0.00, 95% CI −0.05 to 0.05; I2 = 0%).
18.4. Analysis.
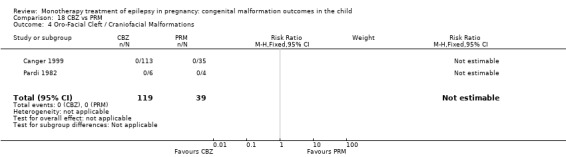
Comparison 18 CBZ vs PRM, Outcome 4 Oro‐Facial Cleft / Craniofacial Malformations.
18.5 Skeletal/limb malformations
Pooled results from two studies showed a non‐significant outcome (RR 2.84, 95% CI 0.16 to 51.53; I2 = NA), with no difference in the number of skeletal/limb malformations in children exposed to CBZ (N = 119) and children exposed to PRM (N = 39) (Canger 1999; Pardi 1982; see Analysis 18.5). This gave a non‐significant RD (RD 0.03, 95% CI −0.03 to 0.09; I2 = 0%).
18.5. Analysis.

Comparison 18 CBZ vs PRM, Outcome 5 Skeletal / Limb Malformations.
19 CBZ versus TPM
19.1 All major malformations
Pooled results from three studies showed a non‐significant result (RR 0.78, 95% CI 0.47 to 1.31; I2 = 0%), with no difference in the number of major malformations in children exposed to CBZ (N = 3051) and children exposed to TPM (N = 473) (Australian; North American Register; UK Register; see Analysis 19.1). This gave a non‐significant RD (RD −0.01, 95% CI −0.03 to 0.01; I2 = 9%).
19.1. Analysis.
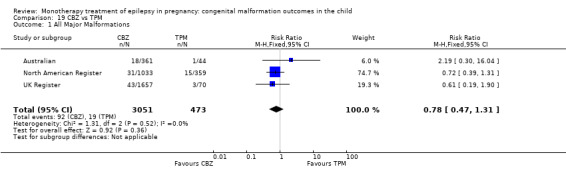
Comparison 19 CBZ vs TPM, Outcome 1 All Major Malformations.
19.2 Neural tube malformations
Pooled results from three studies showed a non‐significant result (RR 0.97, 95% CI 0.19 to 5.06; I2 = 0%), with no difference in the number of neural tube malformations in children exposed to CBZ (N = 3051) and children exposed to TPM (N = 473) (Australian; North American Register; UK Register; see Analysis 19.2). This gave a non‐significant RD (RD 0.00, 95% CI −0.00 to 0.01; I2 = 0%).
19.2. Analysis.
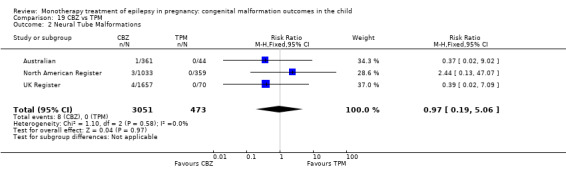
Comparison 19 CBZ vs TPM, Outcome 2 Neural Tube Malformations.
19.3 Cardiac malformations
Pooled results from three studies showed a non‐significant result (RR 1.05, 95% CI 0.23 to 4.78; I2 = 0%), with no difference in the number of cardiac malformations in children exposed to CBZ (N = 3051) and children exposed to TPM (N = 473) (Australian; North American Register; UK Register; see Analysis 19.3). This gave a non‐significant RD (RD 0.00, 95% CI −0.00 to 0.01; I2 = 0%).
19.3. Analysis.
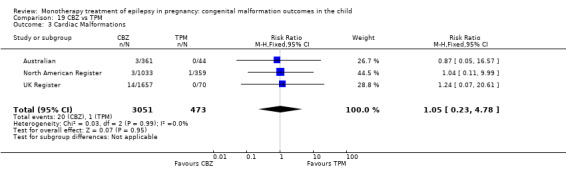
Comparison 19 CBZ vs TPM, Outcome 3 Cardiac Malformations.
19.4 Oro‐facial cleft/craniofacial malformations
Pooled results from three studies showed a significant result (RR 0.32, 95% CI 0.13 to 0.81; I2 = 36%), with children exposed to CBZ (N = 3051) experiencing fewer oro‐facial cleft/craniofacial malformations than children exposed to TPM (N = 473) (Australian; North American Register; UK Register; see Analysis 19.4). This gave a non‐significant RD (RD −0.01, 95% CI −0.02 to 0.00; I2 = 12%)
19.4. Analysis.
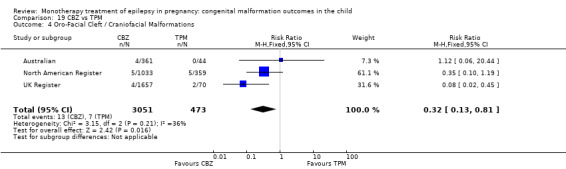
Comparison 19 CBZ vs TPM, Outcome 4 Oro‐Facial Cleft / Craniofacial Malformations.
19.5 Skeletal/limb malformations
Pooled results from three studies showed a non‐significant result (RR 0.38, 95% CI 0.13 to 1.09; I2 = 0%), with no difference in the number of skeletal/limb malformations in children exposed to CBZ (N = 3051) and children exposed to TPM (N = 473) (Australian; North American Register; UK Register; see Analysis 19.5). This gave a non‐significant RD (RD −0.01, 95% CI −0.02 to 0.00; I2 = 0%).
19.5. Analysis.
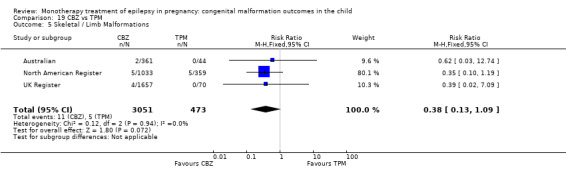
Comparison 19 CBZ vs TPM, Outcome 5 Skeletal / Limb Malformations.
20 CBZ versus VPA
20.1. All major malformations
Pooled results from 25 studies showed a significant outcome (RR 0.41, 95% CI 0.34 to 0.50; I2 = 0%), with children exposed to CBZ (N = 4549) experiencing fewer major malformations than children exposed to VPA (N = 2529) (Al Bunyan 1999; Arulmozhi 2006; Australian; Canger 1999; Cassina 2013; Eroglu 2008; Fairgrieve 2000; Martinez Ferri 2009; Froscher 1991; Garza‐Morales 1996; Kaaja 2003; Kaneko 1999; Kerala Pregnancy Registry; Koch 1992; Lindhout 1992; Mawer 2010; Meador 2006; Meischenguiser 2004; Montreal Series; North American Register; Omtzigt 1992; Pardi 1982; Steegers‐Theunissen 1994; Tanganelli 1992; UK Register; see Analysis 20.1). This gave a significant RD (RD −0.05, 95% CI −0.07 to −0.04; I2 = 0%).
20.1. Analysis.
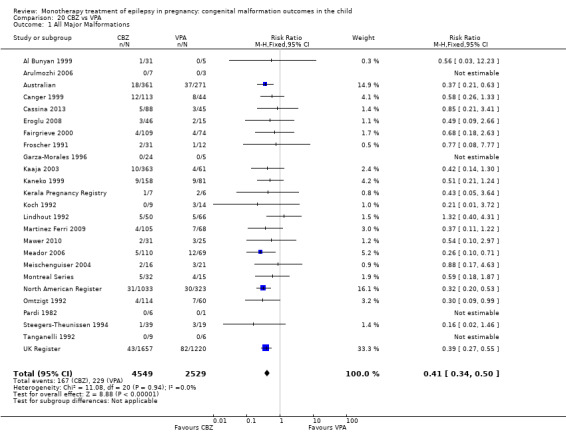
Comparison 20 CBZ vs VPA, Outcome 1 All Major Malformations.
In the EURAP data, the prevalence of MCM between these two groups for children exposed to CBZ were: 5/148 (3.4%) for exposures < 400 mg/d, 56/1047 (5.3%) for exposures of 400 to 1000 mg/d and 18/207 (8.7%) for exposures > 1000 mg/d. In comparison, the rates of MCM for children exposed to VPA were: 24/431 (5.6%) for exposures < 700 mg/d, 50/480 (10.4%) for exposures > 700 and < 1500 mg/d, and 24/99 (24.2%) for exposures > 1500 mg/d. Samren 1997 reported 22 cases of major malformation out of 280 (8%) CBZ‐exposed children and six cases out of 184 (9%) VPA‐exposed children.
20.2 Neural tube malformations
Pooled results from 16 studies showed a significant outcome (RR 0.17, 95% CI 0.09 to 0.31; I2 = 0%), with children exposed to CBZ (N = 4171) experiencing fewer neural tube malformations than children exposed to VPA (N = 2305) (Australian; Canger 1999; Cassina 2013; Eroglu 2008; Fairgrieve 2000; Martinez Ferri 2009; Froscher 1991; Kaaja 2003; Kerala Pregnancy Registry; Koch 1992; Meador 2006; Meischenguiser 2004; North American Register; Omtzigt 1992; Pardi 1982; UK Register; Analysis 20.2). This gave a significant RD (RD −0.02, 95% CI −0.02 to −0.01; I2 = 35%).
20.2. Analysis.
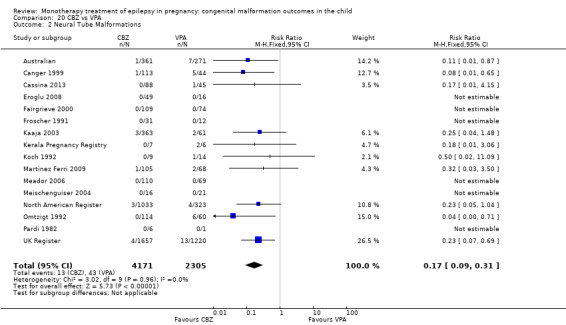
Comparison 20 CBZ vs VPA, Outcome 2 Neural Tube Malformations.
In the EURAP data, the prevalence of neural tube malformations in those exposed to CBZ and VPA was: CBZ < 400 mg/d, 0/148 (0%); CBZ 400 to 1000 mg/d, 1/1047 (0%); CBZ > 1000 mg/d, 4/207 (2%); VPA < 700 mg/d, 2/431 (1%); VPA 700 to < 1500 mg/d, 7/480 (2%) and VPA > 1500 mg/d, 2/99 (2%).
20.3 Cardiac malformations
Pooled results from 16 studies showed a significant outcome (RR 0.45, 95% CI 0.31 to 0.68; I2 = 12%), with children exposed to CBZ (N = 4276) experiencing fewer cardiac malformations than children exposed to VPA (N = 2370) (Australian; Canger 1999; Cassina 2013; Eroglu 2008; Fairgrieve 2000; Martinez Ferri 2009; Froscher 1991; Kaaja 2003; Kerala Pregnancy Registry; Koch 1992; Meador 2006; Meischenguiser 2004; North American Register; Omtzigt 1992; Pardi 1982; UK Register; see Analysis 20.3). This gave a significant RD (RD −0.01, 95% CI −0.02 to −0.01; I2 = 7%).
20.3. Analysis.
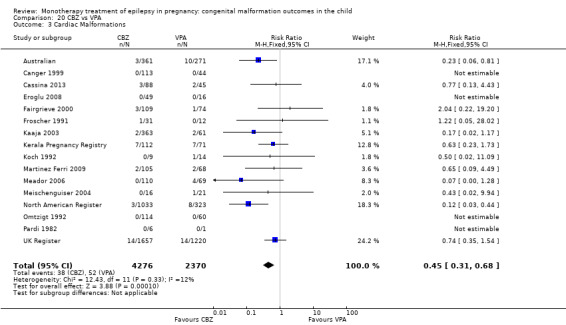
Comparison 20 CBZ vs VPA, Outcome 3 Cardiac Malformations.
In the EURAP data, the prevalence of cardiac malformations in those exposed to CBZ and VPA was: CBZ < 400 mg/d, 2/148 (1%); CBZ > 400 to 1000 mg/d, 16/1047 (2%); CBZ > 1000 mg/d, 4/207 (2%); VPA < 700 mg/d, 5/431 (1%); VPA 700 to < 1500 mg/d, 10/480 (2%) and VPA > 1500 mg/d, 7/99 (7%).
20.4 Oro‐facial cleft/craniofacial malformations
Pooled results from 16 studies (Australian; Canger 1999; Cassina 2013; Eroglu 2008; Fairgrieve 2000; Martinez Ferri 2009; Froscher 1991; Kaaja 2003; Kerala Pregnancy Registry; Koch 1992; Meador 2006; Meischenguiser 2004; North American Register; Omtzigt 1992; Pardi 1982; UK Register) reported a significant outcome (RR 0.28, 95% CI 0.16 to 0.49; I2 = 0%), with children exposed to CBZ (N = 4171) experiencing fewer oro‐facial cleft/craniofacial malformations than children exposed to VPA (N = 2305) (Analysis 20.4). This gave a significant RD (RD −0.01, 95% CI −0.02 to −0.01; I2 = 0%).
20.4. Analysis.
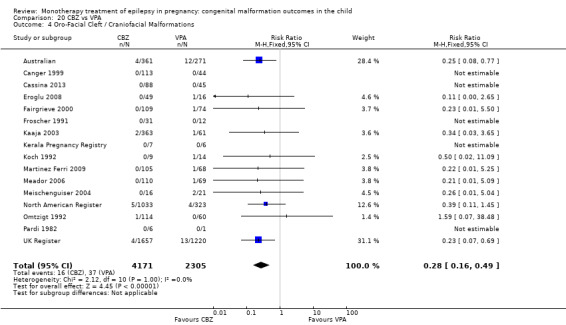
Comparison 20 CBZ vs VPA, Outcome 4 Oro‐Facial Cleft / Craniofacial Malformations.
In the EURAP data the prevalence of oro‐facial cleft malformations in those exposed to CBZ and VPA were: CBZ < 400 mg/d 0/148, 0%; CBZ > 400 to 1000 mg/d 2/1047, 0%; CBZ > 1000 mg/d 0/207, 0%; VPA < 700 mg/d 3/431, 1%; VPA > 700 to < 1500 mg/d 1/480, 0% and VPA > 1500 mg/d 0/99, 0%.
20.5 Skeletal/limb malformations
Pooled results from 16 studies showed a significant outcome (RR 0.33, 95% CI 0.19 to 0.57; I2 = 0%), with children exposed to CBZ (N = 4171) experiencing fewer skeletal/limb malformations than children exposed to VPA (N = 2305) (Australian; Canger 1999; Cassina 2013; Eroglu 2008; Fairgrieve 2000; Martinez Ferri 2009; Froscher 1991; Kaaja 2003; Kerala Pregnancy Registry; Koch 1992; Meador 2006; Meischenguiser 2004; North American Register; Omtzigt 1992; Pardi 1982; UK Register; see Analysis 20.5). This gave a significant RD (RD −0.01, 95% CI −0.02 to −0.00; I2 = 0%).
20.5. Analysis.
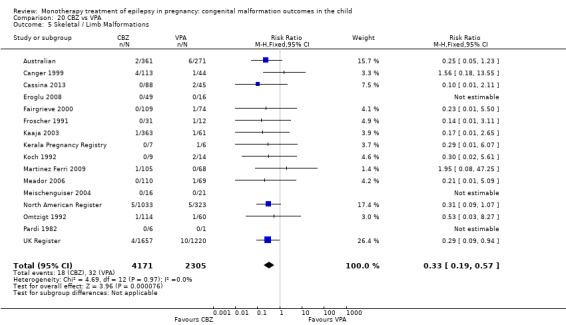
Comparison 20 CBZ vs VPA, Outcome 5 Skeletal / Limb Malformations.
21 CBZ versus ZNS
21.1 All major malformations
North American Register reported a non‐significant outcome (RR 5.54, 95% CI 0.34 to 89.86; I2 = NA), with no difference in the number of major malformations in children exposed to CBZ (N = 1033) and children exposed to ZNS (N = 90) (Analysis 21.1). This gave a non‐significant RD (RD 0.03, 95% CI 0.01 to 0.05; I2 = NA).
21.1. Analysis.

Comparison 21 CBZ vs ZNS, Outcome 1 All Major Malformations.
21.2 Neural tube malformations
No included studies reported data on this outcome.
21.3 Cardiac malformations
No included studies reported data on this outcome.
21.4 Oro‐facial cleft/craniofacial malformations
No included studies reported data on this outcome.
21.5 Skeletal/limb malformations
No included studies reported data on this outcome.
22 GBP versus LTG
22.1 All major malformations
Pooled results from three studies showed a non‐significant outcome (RR 0.60, 95% CI 0.17 to 2.07; I2 = 0%), with no difference in the number of major malformations in children exposed to GBP (N = 190) and children exposed to LTG (N = 3975) (Australian; North American Register; UK Register; see Analysis 22.1). This gave a non‐significant RD (RD −0.01, 95% CI −0.03 to 0.01; I2 = 0%).
22.1. Analysis.
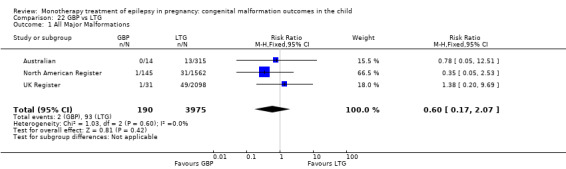
Comparison 22 GBP vs LTG, Outcome 1 All Major Malformations.
22.2 Neural tube malformations
We could not estimate data from Australiandue to there being no neural tube malformations in children exposed to GBP (N = 14) or children exposed to LTG (N = 315) (see Analysis 22.2). RD was calculable, and this gave a non‐significant result (RD 0.00, 95% CI −0.09 to 0.09; I2 = NA).
22.2. Analysis.

Comparison 22 GBP vs LTG, Outcome 2 Neural Tube Malformations.
22.3 Cardiac malformations
Data from Australianshowed a non‐significant outcome (RR 3.01, 95% CI 0.16 to 55.67; I2 = NA), with no difference in the number of cardiac malformations in children exposed to GBP (N = 14) and children exposed to LTG (N = 315) (Analysis 22.3). This gave a non‐significant RD (RD −0.01, 95% CI −0.10 to 0.08; I2 = NA).
22.3. Analysis.
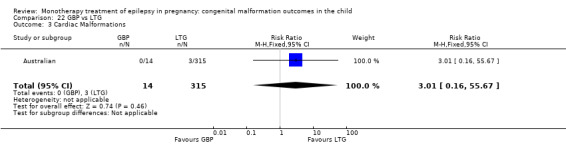
Comparison 22 GBP vs LTG, Outcome 3 Cardiac Malformations.
22.4 Oro‐facial cleft/craniofacial malformations
Data from Australianshowed a non‐significant outcome (RR 1.92, 95% CI 0.11 to 33.05; I2 = NA), with no difference in the number of oro‐facial/craniofacial malformations in children exposed to GBP (N = 14) and children exposed to LTG (N = 315) (Analysis 22.4). This gave a non‐significant RD (RD −0.02, 95% CI −0.11 to 0.08; I2 = NA).
22.4. Analysis.

Comparison 22 GBP vs LTG, Outcome 4 Oro‐Facial Cleft / Craniofacial Malformations.
22.5 Skeletal/limb malformations
We could not estimate data from one study due to there being no skeletal/limb malformations in children exposed to GBP (N = 14) or children exposed to LTG (N = 315) (Australian; see Analysis 22.5). RD was calculable, and this gave a non‐significant result (RD 0.00, 95% CI −0.09 to 0.09; I2 = NA).
22.5. Analysis.

Comparison 22 GBP vs LTG, Outcome 5 Skeletal / Limb Malformations.
23 GBP versus OXC
23.1 All major malformations
Pooled results from two studies showed a non‐significant outcome (RR 0.31, 95% CI 0.04 to 2.78; I2 = NA), with no difference in the number of major malformations in children exposed to GBP (N = 159) and children exposed to OXC (N = 194) (Australian; North American Register; see Analysis 23.1). This gave a non‐significant RD (RD −0.01, 95% CI −0.04 to 0.01; I2 = 0%).
23.1. Analysis.
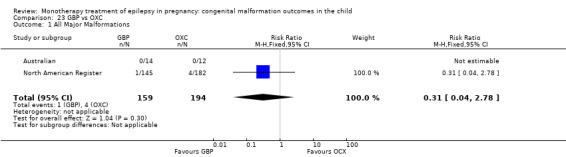
Comparison 23 GBP vs OXC, Outcome 1 All Major Malformations.
23.2 Neural tube malformations
We could not estimate data from one study due to there being no neural tube malformations in children exposed to GBP (N = 14) or children exposed to OXC (N = 12) (Australian; se Analysis 23.2). RD was calculable, and this gave a non‐significant result (RD 0.00, 95% CI −0.14 to 0.14; I2 = NA).
23.2. Analysis.

Comparison 23 GBP vs OXC, Outcome 2 Neural Tube Malformations.
23.3 Cardiac malformations
We could not estimate data from one study due to there being no cardiac malformations in children exposed to GBP (N = 14) or children exposed to OXC (N = 12) (Australian; see Analysis 23.3). RD was calculable, and this gave a non‐significant result (RD 0.00, 95% CI −0.14 to 0.14; I2 = NA).
23.3. Analysis.

Comparison 23 GBP vs OXC, Outcome 3 Cardiac Malformations.
23.4 Oro‐facial cleft/craniofacial malformations
We could not estimate data from one study due to there being no oro‐facial cleft/craniofacial malformations in children exposed to GBP (N = 14) or children exposed to OXC (N = 12) (Australian; see Analysis 23.4). RD was calculable, and this gave a non‐significant RD (RD 0.00, 95% CI −0.14 to 0.14; I2 = NA).
23.4. Analysis.
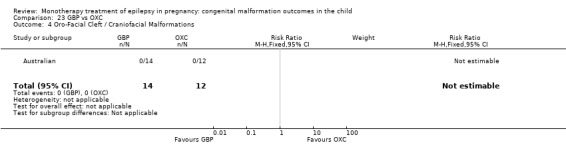
Comparison 23 GBP vs OXC, Outcome 4 Oro‐Facial Cleft / Craniofacial Malformations.
23.5 Skeletal/limb malformations
We could not estimate data from one study due to there being no skeletal/limb malformations in children exposed to GBP (N = 14) or children exposed to OXC (N = 12) (Australian; see Analysis 23.5). RD was calculable, and this gave a non‐significant result (RD 0.00, 95% CI −0.14 to 0.14; I2 = NA).
23.5. Analysis.

Comparison 23 GBP vs OXC, Outcome 5 Skeletal / Limb Malformations.
24 GBP versus PB
24.1 All major malformations
Pooled results from two studies showed a significant outcome (RR 0.12, 95% CI 0.02 to 0.96; I2 = 0%), with children exposed to GBP (N = 159) experiencing fewer major malformations than children exposed to PB (N = 204) (Australian; North American Register; see Analysis 24.1). This gave a significant RD (RD −0.05, 95% CI −0.08 to −0.01; I2 = 0%).
24.1. Analysis.
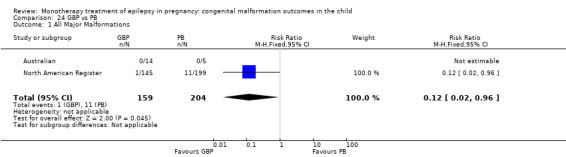
Comparison 24 GBP vs PB, Outcome 1 All Major Malformations.
24.2 Neural tube malformations
We could not estimate data from one study due to there being no neural tube malformations in children exposed to GBP (N = 14) or children exposed to PB (N = 5) (Australian; see Analysis 24.2). RD was calculable, and this gave a non‐significant result (RD 0.00, 95% CI −0.24 to 0.24; I2 = NA).
24.2. Analysis.

Comparison 24 GBP vs PB, Outcome 2 Neural Tube Malformations.
24.3 Cardiac malformations
We could not estimate data from one study due to there being no cardiac malformations in children exposed to GBP (N = 14) or children exposed to PB (N = 5) (Australian; see Analysis 24.3). RD was calculable, and this gave a non‐significant result (RD 0.00, 95% CI −0.24 to 0.24; I2 = NA).
24.3. Analysis.
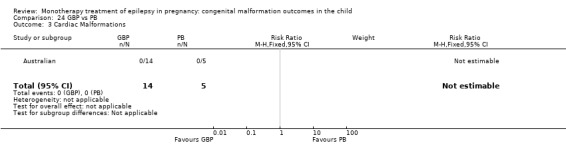
Comparison 24 GBP vs PB, Outcome 3 Cardiac Malformations.
24.4 Oro‐facial cleft/craniofacial malformations
We could not estimate data from one study due to there being no oro‐facial cleft/craniofacial malformations in children exposed to GBP (N = 14) or children exposed to PB (N = 5) (Australian; see Analysis 24.4). RD was calculable, and this gave a non‐significant result (RD 0.00, 95% CI −0.24 to 0.24; I2 = NA).
24.4. Analysis.
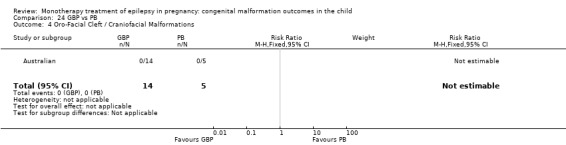
Comparison 24 GBP vs PB, Outcome 4 Oro‐Facial Cleft / Craniofacial Malformations.
24.5 Skeletal/limb malformations
We were unable to estimate data from one study due to there being no skeletal/limb malformations in children exposed to GBP (N = 14) or children exposed to PB (N = 5) (Australian; see Analysis 24.5). RD was calculable, and this gave a non‐significant result (RD 0.00, 95% CI −0.24 to 0.24; I2 = NA).
24.5. Analysis.

Comparison 24 GBP vs PB, Outcome 5 Skeletal / Limb Malformations.
25 GBP versus PRM
25.1 All major malformations
No included studies reported data on this outcome.
25.2 Neural tube malformations
No included studies reported data on this outcome.
25.3 Cardiac malformations
No included studies reported data on this outcome.
25.4 Oro‐facial cleft/craniofacial malformations
No included studies reported data on this outcome.
25.5 Skeletal/limb malformations
No included studies reported data on this outcome.
26 GBP versus TPM
26.1 All major malformations
Pooled results from three studies showed a non‐significant outcome (RR 0.32, 95% CI 0.09 to 1.17; I2 = 0%), with no difference in the number of major malformations in children exposed to GBP (N = 190) and children exposed to TPM (N = 473) (Australian; North American Register; UK Register; see Analysis 26.1). However, this gave a significant RD (RD −0.03, 95% CI −0.05 to −0.01; I2 = 0%).
26.1. Analysis.
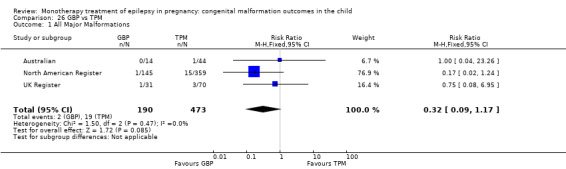
Comparison 26 GBP vs TPM, Outcome 1 All Major Malformations.
26.2 Neural tube malformations
We were unable to estimate data from one study due to there being no neural tube malformations in children exposed to GBP (N = 14) or children exposed to TPM (N = 44) (Australian; see Analysis 26.2). RD was calculable, and this gave a non‐significant result (RD 0.00, 95% CI −0.10 to 0.10; I2 = NA).
26.2. Analysis.

Comparison 26 GBP vs TPM, Outcome 2 Neural Tube Malformations.
26.3 Cardiac malformations
We were unable to estimate data from one study due to there being no cardiac malformations in children exposed to GBP (N = 14) or children exposed to TPM (N = 44) (Australian; see Analysis 26.3). RD was calculable, and this gave a non‐significant result (RD 0.00, 95% CI −0.10 to 0.10; I2 = NA).
26.3. Analysis.

Comparison 26 GBP vs TPM, Outcome 3 Cardiac Malformations.
26.4 Oro‐facial cleft/craniofacial malformations
We were unable to estimate data from one study due to there being no oro‐facial cleft/craniofacial malformations in children exposed to GBP (N = 14) or children exposed to TPM (N = 44) (Australian; see Analysis 26.4). RD was calculable, and this gave a non‐significant result (RD 0.00, 95% CI −0.10 to 0.10; I2 = NA).
26.4. Analysis.

Comparison 26 GBP vs TPM, Outcome 4 Oro‐Facial Cleft / Craniofacial Malformations.
26.5 Skeletal/limb malformations
We were unable to estimate data from one study due to there being no skeletal/limb malformations in children exposed to GBP (N = 14) or children exposed to TPM (N = 44) (Australian; see Analysis 26.5). RD was calculable, and this gave a non‐significant result (RD 0.00, 95% CI −0.10 to 0.10; I2 = NA).
26.5. Analysis.
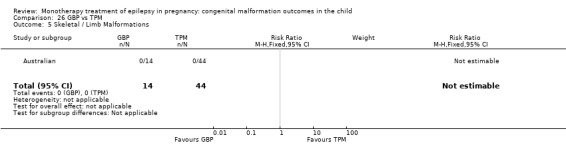
Comparison 26 GBP vs TPM, Outcome 5 Skeletal / Limb Malformations.
27 GBP versus ZNS
27.1 All major malformations
Data from one study showed a non‐significant outcome (RR 1.87, 95% CI 0.08 to 45.41; I2 = NA), with no difference in the number of major malformations in children exposed to GBP (N = 145) and children exposed to ZNS (N = 90) (North American Register; see Analysis 27.1). This gave a non‐significant RD (RD 0.01, 95% CI −0.02 to 0.03; I2 = NA).
27.1. Analysis.

Comparison 27 GBP vs ZNS, Outcome 1 All Major Malformations.
27.2 Neural tube malformations
No included studies reported data on this outcome.
27.3 Cardiac malformations
No included studies reported data on this outcome.
27.4 Oro‐facial cleft/craniofacial malformations
No included studies reported data on this outcome.
27.5 Skeletal/limb malformations
No included studies reported data on this outcome.
28 LEV versus GBP
28.1 All major malformations
Pooled results from three studies showed a non‐significant outcome (RR 1.52, 95% CI 0.43 to 5.42; I2 = 45%), with no difference in the number of major malformations in children exposed to LEV (N = 817) and children exposed to GBP (N = 190) (Australian; North American Register; UK Register; see Analysis 28.1). This gave a non‐significant RD (RD 0.01, 95% CI −0.01 to 0.03; I2 = 0%).
28.1. Analysis.
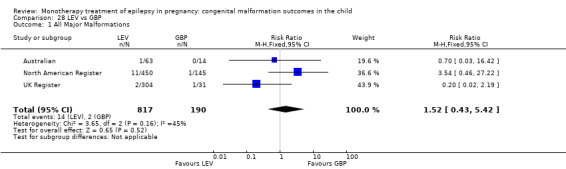
Comparison 28 LEV vs GBP, Outcome 1 All Major Malformations.
28.2 Neural tube malformations
We were unable to estimate data from one study due to there being no reported neural tube malformations in children exposed to LEV (N = 63) or children exposed to GBP (N = 14) (Australian; see Analysis 28.2). RD was calculable, and this gave a non‐significant result (RD 0.00, 95% CI −0.09 to 0.09; I2 = NA).
28.2. Analysis.

Comparison 28 LEV vs GBP, Outcome 2 Neural Tube Malformations.
28.3 Cardiac malformations
Data from one study showed a non‐significant outcome (RR 0.70, 95% CI 0.03 to 16.42; I2 = NA), with no difference in the number of cardiac malformations in children exposed to LEV (N = 63) and children exposed to GBP (N = 14) (Australian; see Analysis 28.3). This gave a non‐significant RD (RD 0.02, 95% CI −0.08 to 0.11; I2 = NA).
28.3. Analysis.

Comparison 28 LEV vs GBP, Outcome 3 Cardiac Malformations.
28.4 Oro‐facial cleft/craniofacial malformations
Data from one study showed a non‐significant outcome (RR 0.70, 95% CI 0.03 to 16.42; I2 = NA), with no difference in the number of oro‐facial cleft/craniofacial malformations in children exposed to LEV (N = 63) and children exposed to GBP (N = 14) (Australian; see Analysis 28.4). This gave a non‐significant RD (RD 0.02, 95% CI −0.08 to 0.11; I2 = NA).
28.4. Analysis.
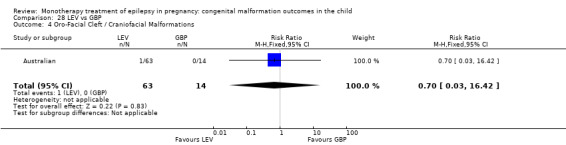
Comparison 28 LEV vs GBP, Outcome 4 Oro‐Facial Cleft / Craniofacial Malformations.
28.5 Skeletal/limb malformations
We were unable to estimate data from one study due to there being no reported skeletal/limb malformations in children exposed to LEV (N = 63) and children exposed to GBP (N = 14) (Australian; see Analysis 28.3). RD was calculable, and this gave a non‐significant result (RD 0.00, 95% CI −0.09 to 0.09; I2 = NA).
29 LEV versus LTG
29.1. All major malformations
Pooled results from three studies showed a non‐significant outcome (RR 0.73, 95% CI 0.41 to 1.29; I2 = 55%), with no difference in the number of major malformations in children exposed to LEV (N = 817) and children exposed to LTG (N = 3975) (Australian; North American Register; UK Register; see Analysis 29.1). Due to high heterogeneity, we undertook a random‐effects analysis was undertaken, which upheld the non‐significant result (RR (RE) 0.62, 95% CI 0.20 to 1.88; I2 = 55%). The RD was also non‐significant (RD −0.01, 95% CI −0.02 to 0.00; I2 = 68%).
29.1. Analysis.
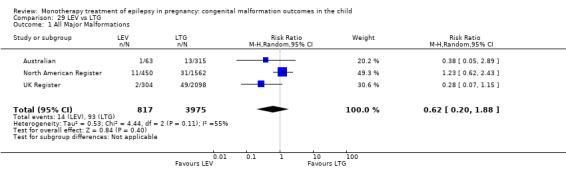
Comparison 29 LEV vs LTG, Outcome 1 All Major Malformations.
29.2 Neural tube malformations
Pooled results from three studies showed a non‐significant outcome (RR 1.59, 95% CI 0.24 to 10.38; I2 = 0%), with no difference in the number of neural tube malformations in children exposed to LEV (N = 817) and children exposed to LTG (N = 3975) (Australian; North American Register; UK Register; see Analysis 29.2). This gave a non‐significant RD (RD 0.00, 95% CI −0.00 to 0.00; I2 = 0%).
29.2. Analysis.
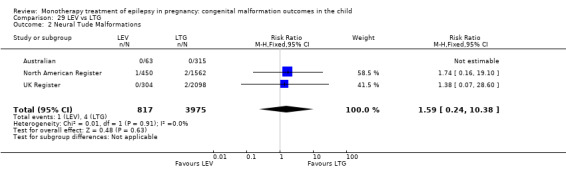
Comparison 29 LEV vs LTG, Outcome 2 Neural Tude Malformations.
29.3 Cardiac malformations
Pooled results from three studies showed a non‐significant outcome (RR 0.86, 95% CI 0.22 to 3.36; I2 = 0%), with no difference in the number of cardiac malformations in children exposed to LEV (N = 817) and children exposed to LTG (N = 3975) (Australian; North American Register; UK Register; see Analysis 29.3). This gave a non‐significant RD (RD −0.00, 95% CI −0.01 to 0.00; I2 = 0%).
29.3. Analysis.
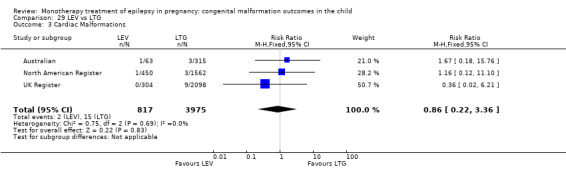
Comparison 29 LEV vs LTG, Outcome 3 Cardiac Malformations.
29.4 Oro‐facial cleft/craniofacial malformations
Pooled results from three studies showed a non‐significant outcome (RR 0.59, 95% CI 0.14 to 2.48; I2 = 0%), with no difference in the number of oro‐facial cleft/craniofacial malformations in children exposed to LEV (N = 817) and children exposed to LTG (N = 3975) (Australian; North American Register; UK Register; see Analysis 29.4). This gave a non‐significant RD (RD −0.00, 95% CI −0.01 to 0.00; I2 = 0%).
29.4. Analysis.
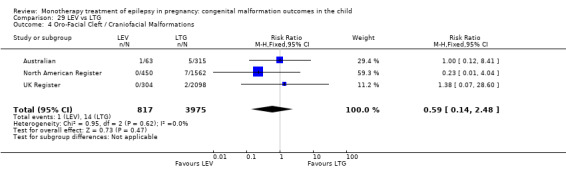
Comparison 29 LEV vs LTG, Outcome 4 Oro‐Facial Cleft / Craniofacial Malformations.
29.5 Skeletal/limb malformations
Pooled results from three studies showed a non‐significant outcome (RR 0.82, 95% CI 0.10 to 6.80; I2 = 0%), with no difference in the number of skeletal/limb malformations in children exposed to LEV (N = 817) and children exposed to LTG (N = 3975) (Australian; North American Register; UK Register; see Analysis 29.5). This gave a non‐significant RD (RD −0.00, 95% CI −0.00 to 0.00; I2 = 0%).
29.5. Analysis.
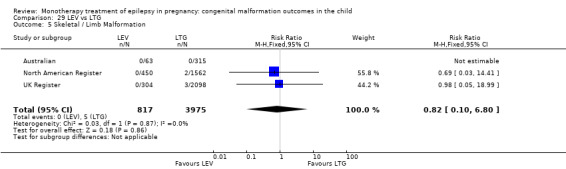
Comparison 29 LEV vs LTG, Outcome 5 Skeletal / Limb Malformation.
30 LEV versus OXC
30.1 All major malformations
Pooled results from two studies showed a non‐significant outcome (RR 1.05, 95% CI 0.36 to 3.03; I2 = 0%), with no difference in the number of major malformations in children exposed to LEV (N = 513) and children exposed to OXC (N = 194) (Australian; North American Register; see Analysis 30.1). This gave a non‐significant RD (RD 0.00, 95% CI −0.02 to 0.03; I2 = 0%).
30.1. Analysis.
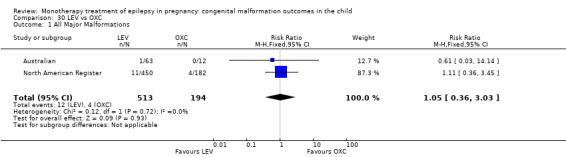
Comparison 30 LEV vs OXC, Outcome 1 All Major Malformations.
30.2 Neural tube malformations
Pooled results from two studies showed a non‐significant outcome (RR 1.22, 95% CI 0.05 to 29.74; I2 = NA), with no difference in the number of neural tube malformations in children exposed to LEV (N = 513) and children exposed to OXC (N = 194) (Australian; North American Register; see Analysis 30.2). This gave a non‐significant RD (RD 0.00, 95% CI −0.01 to 0.01; I2 = 0%).
30.2. Analysis.
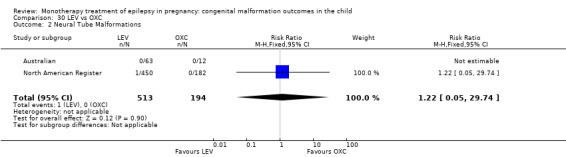
Comparison 30 LEV vs OXC, Outcome 2 Neural Tube Malformations.
30.3 Cardiac malformations
Pooled results from two studies showed a non‐significant outcome (RR 0.89, 95% CI 0.10 to 8.21; I2 = 0%), with no difference in the number of cardiac malformations in children exposed to LEV (N = 513) and children exposed to OXC (N = 194) (Australian; North American Register; see ). This gave a non‐significant RD (RD 0.00, 95% CI −0.01 to 0.02; I2 = 0%).
30.4 Oro‐facial cleft/craniofacial malformations
Pooled results from two studies showed a non‐significant outcome (RR 0.27, 95% CI 0.03 to 2.20; I2 = 0%), with no difference in the number of oro‐facial cleft/craniofacial malformations in children exposed to LEV (N = 513) and children exposed to OXC (N = 194) (Australian; North American Register; see Analysis 30.4). This gave a non‐significant RD (RD −0.00, 95% CI −0.02 to 0.01; I2 = 0%).
30.4. Analysis.
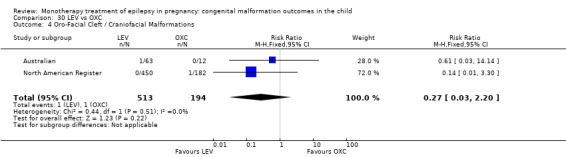
Comparison 30 LEV vs OXC, Outcome 4 Oro‐Facial Cleft / Craniofacial Malformations.
30.5 Skeletal/limb malformations
Pooled results from two studies showed a non‐significant outcome (RR 0.14, 95% CI 0.01 to 3.30; I2 = 0%), with no difference in the number of skeletal/limb malformations in children exposed to LEV (N = 513) children exposed to OXC (N = 194) (Australian; North American Register; see Analysis 30.5). This gave a non‐significant RD (RD −0.01, 95% CI −0.02 to 0.01; I2 = 0%).
30.5. Analysis.

Comparison 30 LEV vs OXC, Outcome 5 Skeletal / Limb Malformations.
31 LEV versus PB
31.1 All major malformations
Results from two studies showed a significant outcome (RR 0.43, 95% CI 0.20 to 0.96; I2 = 0%), with children exposed to LEV (N = 513) experiencing fewer major malformations than children exposed to PB (N = 204) (Australian; North American Register; see Analysis 31.1). This gave a non‐significant RD (RD −0.03, 95% CI −0.06 to 0.01; I2 = 0%).
31.1. Analysis.
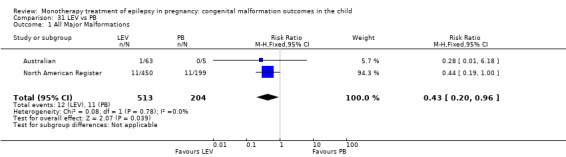
Comparison 31 LEV vs PB, Outcome 1 All Major Malformations.
31.2 Neural tube malformations
Results from two studies showed a non‐significant outcome (RR 1.33, 95% CI 0.05 to 32.52; I2 = NA), with no difference in the number of neural tube malformations in children exposed to LEV (N = 513) and children exposed to PB (N = 204) (Australian; North American Register; see Analysis 31.2). This gave a non‐significant RD (RD 0.00, 95% CI −0.01 to 0.01; I2 = 0%).
31.2. Analysis.
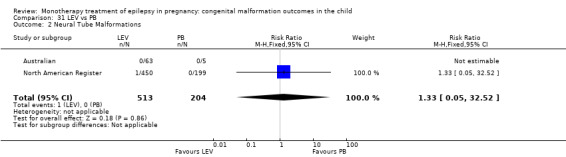
Comparison 31 LEV vs PB, Outcome 2 Neural Tube Malformations.
31.3 Cardiac malformations
Results from two studies showed a significant outcome (RR 0.11, 95% CI 0.02 to 0.66; I2 = 0%), with children exposed to LEV (N = 513) experiencing fewer cardiac malformations than children exposed to PB (N = 204) (Australian; North American Register; see Analysis 31.3). However, this gave a non‐significant RD (RD −0.02, 95% CI −0.04 to 0.00; I2 = 0%).
31.3. Analysis.
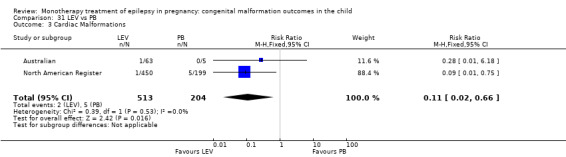
Comparison 31 LEV vs PB, Outcome 3 Cardiac Malformations.
31.4 Oro‐facial cleft/craniofacial malformations
Results from two studies showed a significant outcome (RR 0.08, 95% CI 0.01 to 0.67; I2 = 0%), with children exposed to LEV (N = 513) experiencing fewer oro‐facial cleft/craniofacial malformations than children exposed to PB (N = 204) (Australian; North American Register; see Analysis 31.4). However, this gave a non‐significant RD (RD −0.02, 95% CI −0.04 to 0.00; I2 = 0%).
31.4. Analysis.
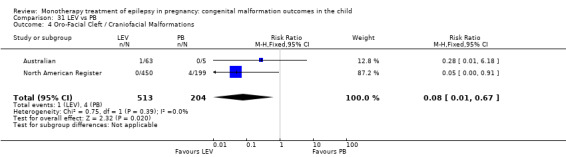
Comparison 31 LEV vs PB, Outcome 4 Oro‐Facial Cleft / Craniofacial Malformations.
31.5 Skeletal/limb malformations
Results from two studies showed a non‐significant outcome (RR 0.15, 95% CI 0.01 to 3.61; I2 = NA), with no difference in the number of skeletal/limb malformations in children exposed to LEV (N = 513) and children exposed to PB (N = 204) (Australian; North American Register; see Analysis 31.5). This gave a non‐significant RD (RD −0.00, 95% CI −0.02 to 0.01; I2 = 0%).
31.5. Analysis.
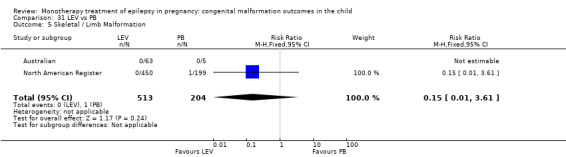
Comparison 31 LEV vs PB, Outcome 5 Skeletal / Limb Malformation.
32 LEV versus PHT
32.1 All major malformations
Pooled results from three studies showed a non‐significant outcome (RR 0.49, 95% CI 0.26 to 0.92; I2 = 66%), with no difference in the number of major malformations in children exposed to LEV (N = 817) and children exposed to PHT (N = 566) (Australian; North American Register; UK Register; see Analysis 32.1). Due to high heterogeneity, we undertook a random‐effects analysis, which changed the significance of the result (RR (RE) 0.34, 95% CI 0.08 to 1.50; I2 = 66%). The RD however was significant (RD −0.02, 95% CI −0.04 to −0.00; I2 = 57%). Due to high heterogeneity, we undertook a random‐effects analysis, which upheld the non‐significant result (RD (RE) −0.03, 95% CI −0.06 to 0.01; I2 = 57%).
32.1. Analysis.
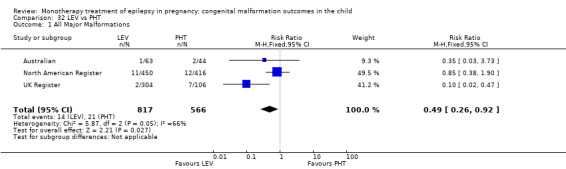
Comparison 32 LEV vs PHT, Outcome 1 All Major Malformations.
32.2 Neural tube malformations
Pooled results from three studies showed a non‐significant outcome (RR 0.81, 95% CI 0.12 to 5.34; I2 = 13%), with no difference in the number of neural tube malformations in children exposed to LEV (N = 817) and children exposed to PHT (N = 542) (Australian; North American Register; UK Register; see Analysis 32.2). This gave a non‐significant RD (RD −0.00, 95% CI −0.01 to 0.01; I2 = 0%).
32.2. Analysis.
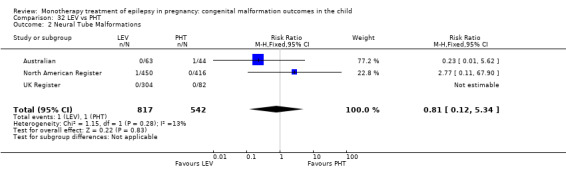
Comparison 32 LEV vs PHT, Outcome 2 Neural Tube Malformations.
32.3 Cardiac malformations
Pooled results from three studies showed a non‐significant outcome (RR 0.26, 95% CI 0.06 to 1.09; I2 = 0%), with no difference in the number of cardiac malformations in children exposed to LEV (N = 817) and children exposed to PHT (N = 542) (Australian; North American Register; UK Register; see Analysis 32.3). This gave a non‐significant RD (RD −0.01, 95% CI −0.02 to 0.00; I2 = 0%).
32.3. Analysis.
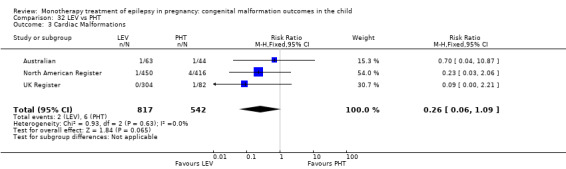
Comparison 32 LEV vs PHT, Outcome 3 Cardiac Malformations.
32.4 Oro‐facial cleft/craniofacial malformations
Pooled results from three studies showed a non‐significant outcome (RR 0.35, 95% CI 0.08 to 1.56; I2 = 4%), with no difference in the number of oro‐facial cleft/craniofacial malformations in children exposed to LEV (N = 817) and children exposed to PHT (N = 542) (Australian; North American Register; UK Register; see Analysis 32.4). This gave a non‐significant RD (RD −0.00, 95% CI −0.01 to 0.00; I2 = 0%).
32.4. Analysis.
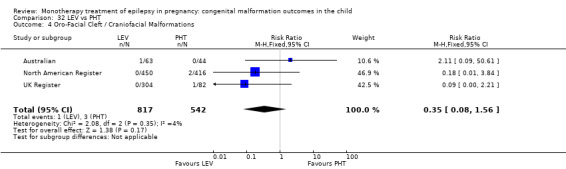
Comparison 32 LEV vs PHT, Outcome 4 Oro‐Facial Cleft / Craniofacial Malformations.
32.5 Skeletal/limb malformations
Pooled results from three studies showed a non‐significant outcome (RR 0.10, 95% CI 0.01 to 1.90; I2 = NA), with no difference in the number of skeletal/limb malformations in children exposed to LEV (N = 817) and children exposed to PHT (N = 542) (Australian; North American Register; UK Register; see Analysis 32.5). This gave a non‐significant RD (RD −0.01, 95% CI −0.02 to 0.00; I2 = 0%).
32.5. Analysis.
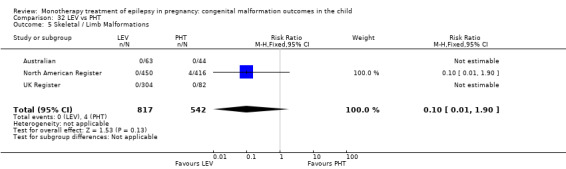
Comparison 32 LEV vs PHT, Outcome 5 Skeletal / Limb Malformations.
33 LEV versus PRM
33.1 All major malformations
No included studies reported data on this outcome.
33.2 Neural tube malformations
No included studies reported data on this outcome.
33.3 Cardiac malformations
No included studies reported data on this outcome.
33.4 Oro‐facial cleft/craniofacial malformations
No included studies reported data on this outcome.
33.5 Skeletal/limb malformations
No included studies reported data on this outcome.
34 LEV versus TPM
34.1 All major malformations
Pooled results from three studies showed a significant outcome (RR 0.50, 95% CI 0.26 to 0.97; I2 = 0%), with children exposed to LEV (N = 817) experiencing fewer major malformations than children exposed to TPM (N = 473) (Australian; North American Register; UK Register; see Analysis 34.1). However, this gave a non‐significant RD (RD −0.02, 95% CI −0.04 to 0.00; I2 = 0%).
34.1. Analysis.
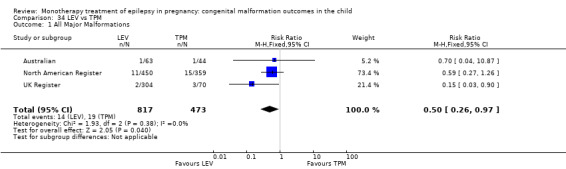
Comparison 34 LEV vs TPM, Outcome 1 All Major Malformations.
34.2 Neural tube malformations
Pooled results from three studies showed a non‐significant outcome (RR 2.39, 95% CI 0.10 to 58.61; I2 = NA), with no difference in the number of neural tube malformations in children exposed to LEV (N = 817) and children exposed to TPM (N = 473) (Australian; North American Register; UK Register; see Analysis 34.2). This gave a non‐significant RD (RD 0.00, 95% CI −0.01 to 0.01; I2 = 0%).
34.2. Analysis.
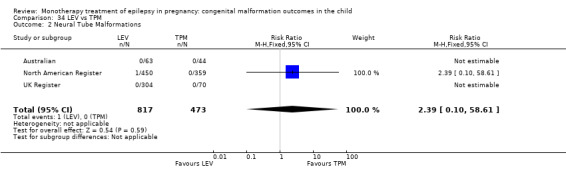
Comparison 34 LEV vs TPM, Outcome 2 Neural Tube Malformations.
34.3 Cardiac malformations
Pooled results from three studies showed a non‐significant outcome (RR 1.25, 95% CI 0.16 to 9.54; I2 = 0%), with no difference in the number of cardiac malformations in children exposed to LEV (N = 817) and children exposed to TPM (N = 473) (Australian; North American Register; UK Register; see Analysis 34.2). This gave a non‐significant RD (RD 0.00, 95% CI −0.01 to 0.01; I2 = 0%).
34.4 Oro‐facial cleft/craniofacial malformations
Pooled results from three studies showed a significant outcome (RR 0.17, 95% CI 0.04 to 0.68; I2 = 42%), with children exposed to LEV (N = 817) experiencing fewer oro‐facial/craniofacial malformations than children exposed to TPM (N = 473) (Australian; North American Register; UK Register; see Analysis 34.4). This gave a significant RD (RD −0.01, 95% CI −0.03 to −0.00; I2 = 0%).
34.4. Analysis.
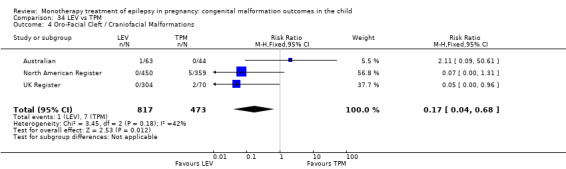
Comparison 34 LEV vs TPM, Outcome 4 Oro‐Facial Cleft / Craniofacial Malformations.
34.5 Skeletal/limb malformations
Pooled results from three studies showed a non‐significant outcome (RR 0.07, 95% CI 0.00* to 1.31; I2 = NA), with no difference in the number of skeletal/limb malformations in children exposed to LEV (N = 817) and children exposed to TPM (N = 473) (Australian; North American Register; UK Register; see Analysis 34.5). This gave a non‐significant RD (RD −0.01, 95% CI −0.02 to 0.00; I2 = 0%).
34.5. Analysis.
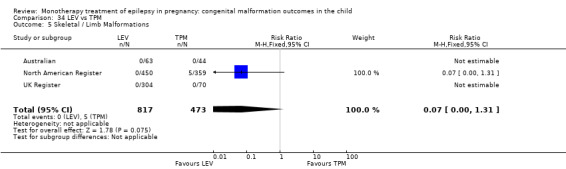
Comparison 34 LEV vs TPM, Outcome 5 Skeletal / Limb Malformations.
35 LEV versus ZNS
35.1 All major malformations
One study reported a non‐significant outcome (RR 4.64, 95% CI 0.28 to 78.05; I2 = NA), with no difference in the number of major malformations in children exposed to LEV (N = 450) and children exposed to ZNS (N = 90) (North American Register; see Analysis 35.1). However, this gave a significant RD (RD 0.02, 95% CI 0.00* to 0.05; I2 = NA).
35.1. Analysis.
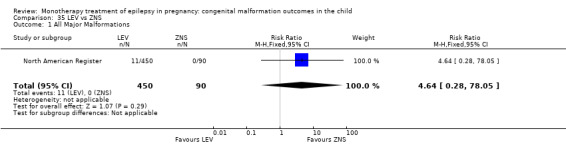
Comparison 35 LEV vs ZNS, Outcome 1 All Major Malformations.
35.2 Neural tube malformations
No included studies reported data on this outcome.
35.3 Cardiac malformations
No included studies reported data on this outcome.
35.4 Oro‐facial cleft/craniofacial malformations
No included studies reported data on this outcome.
35.5 Skeletal/limb malformations
No included studies reported data on this outcome.
36 LTG versus OXC
36.1 All major malformations
Pooled results from two studies showed a non‐significant outcome (RR 0.93, 95% CI 0.35 to 2.43; I2 = 0%), with no difference in the number of major malformations in children exposed to LTG (N = 1877) and children exposed to OXC (N = 194) (Australian; North American Register; see Analysis 36.1). This gave a non‐significant RD (RD 0.00, 95% CI −0.02 to 0.02; I2 = 0%).
36.1. Analysis.
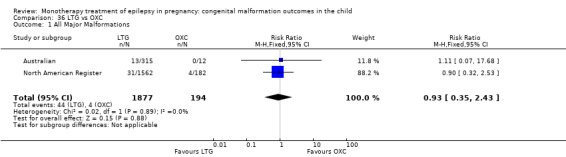
Comparison 36 LTG vs OXC, Outcome 1 All Major Malformations.
36.2 Neural tube malformations
Pooled results from two studies showed a non‐significant outcome (RR 0.59, 95% CI 0.03 to 12.15; I2 = NA), with no difference in the number of neural tube malformations in children exposed to LTG (N = 1877) and children exposed to OXC (N = 194) (Australian; North American Register; see Analysis 36.2). This gave a non‐significant RD (RD 0.00, 95% CI −0.01 to 0.01; I2 = 0%).
36.2. Analysis.
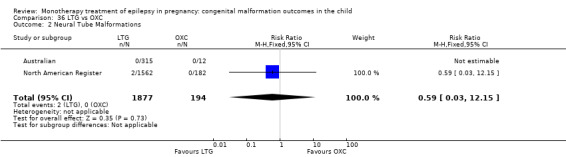
Comparison 36 LTG vs OXC, Outcome 2 Neural Tube Malformations.
36.3 Cardiac malformations
Pooled results from two studies showed a non‐significant outcome (RR 0.54, 95% CI 0.07 to 4.30; I2 = 0%), with no difference in the number of cardiac malformations in children exposed to LTG (N = 1877) and children exposed to OXC (N = 194) (Australian; North American Register; see Analysis 36.3). This gave a non‐significant RD (RD 0.00, 95% CI −0.01 to 0.01; I2 = 0%).
36.3. Analysis.
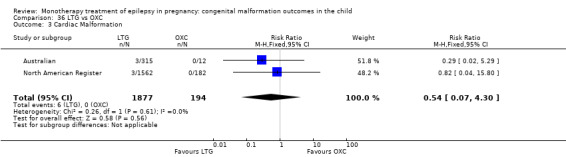
Comparison 36 LTG vs OXC, Outcome 3 Cardiac Malformation.
36.4 Oro‐facial cleft/craniofacial malformations
Pooled results from two studies showed a non‐significant outcome (RR 0.69, 95% CI 0.13 to 3.71; I2 = 0%), with no difference in the number of oro‐facial cleft/craniofacial malformations in children exposed to LTG (N = 1877) and children exposed to OXC (N = 194) (Australian; North American Register; see Analysis 36.4). This gave a non‐significant RD (RD 0.00, 95% CI −0.01 to 0.01; I2 = 0%).
36.4. Analysis.
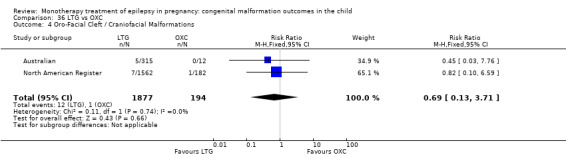
Comparison 36 LTG vs OXC, Outcome 4 Oro‐Facial Cleft / Craniofacial Malformations.
36.5 Skeletal/limb malformations
Pooled results from two studies showed a non‐significant outcome (RR 0.23, 95% CI 0.02 to 2.56; I2 = NA), with no difference in the number of skeletal/limb malformations in children exposed to LTG (N = 1877) and children exposed to OXC (N = 194) (Australian; North American Register; see Analysis 36.5). This gave a non‐significant RD (RD −0.00, 95% CI −0.02 to 0.01; I2 = 0%).
36.5. Analysis.
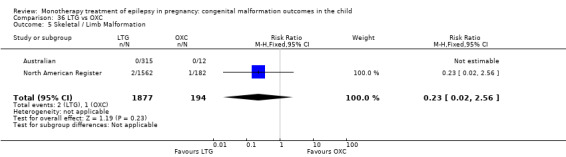
Comparison 36 LTG vs OXC, Outcome 5 Skeletal / Limb Malformation.
37 LTG versus PB
37.1 All major malformations
Pooled results from four studies showed a significant outcome (RR 0.32, 95% CI 0.17 to 0.61; I2 = 0%), with children exposed to LTG (N = 1959) experiencing fewer major malformations than children exposed to PB (N = 282) (Australian; Cassina 2013; Martinez Ferri 2009; North American Register; see Analysis 37.1). This gave a significant RD (RD −0.04, 95% CI −0.07 to −0.01; I2 = 0%).
37.1. Analysis.
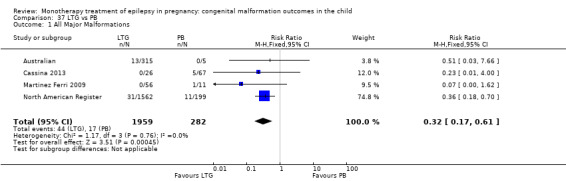
Comparison 37 LTG vs PB, Outcome 1 All Major Malformations.
In the EURAP data, rates of MCM for children exposed to LTG were: 17/836 (2.0%) for exposures < 300 mg/d and 20/444 (4.5%) for exposures > 300 mg/d. In comparison, the rates of MCM for children exposed to PB were: 9/166 (5.4%) for exposures < 150 mg/d and 7/51 (13.7%) for exposures > 150 mg/d. Children exposed to < 150 mg/d of PB were not at an increased risk for MCM (P = 0.0275); however, we did find a significant increase in risk for PB exposures > 150 mg/d (P < 0.0001). There was no comparison to higher doses of LTG.
37.2 Neural tube malformations
Pooled results from three studies showed a non‐significant outcome (RR 0.64, 95% CI 0.03 to 13.28; I2 = NA), with no difference in the number of neural tube malformations in children exposed to LTG (N = 1903) and children exposed to PB (N = 271) (Australian; Cassina 2013; North American Register; see Analysis 37.2). This gave a non‐significant RD (RD 0.00, 95% CI −0.01 to 0.01; I2 = 0%).
37.2. Analysis.
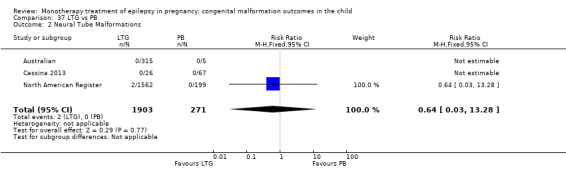
Comparison 37 LTG vs PB, Outcome 2 Neural Tube Malformations.
In the EURAP data, there was no direct statistical comparison between the prevalence of neural tube malformations in those exposed to LTG and PB; however, the rates were: LTG < 300 mg/d, 0/836 (0%); LTG > 300 mg/d, 0/444 (0%) and PB < 150 mg/d, 1/166 (0.6%); PB > 150 mg/d, 0/51 (0%).
37.3 Cardiac malformations
Pooled results from three studies showed a significant outcome (RR 0.14, 95% CI 0.04 to 0.42; I2 = 0%), with children exposed to LTG (N = 1903) experiencing fewer cardiac malformations than children exposed to PB (N = 271) (Australian; Cassina 2013; North American Register; see Analysis 37.3). This gave a significant RD (RD −0.02, 95% CI −0.04 to −0.00; I2 = 0%).
37.3. Analysis.
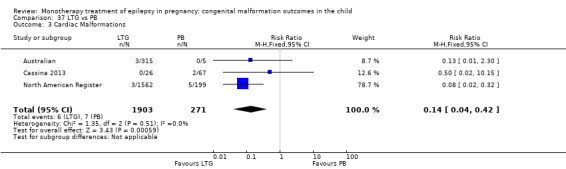
Comparison 37 LTG vs PB, Outcome 3 Cardiac Malformations.
In the EURAP data the prevalence of cardiac malformations in those exposed to LTG and PB was: LTG < 300, 3/836 (0%); LTG > 300 mg/d, 5/444 (1%) and PB < 150 mg/d, 2/166 (1.2%); PB > 150 mg/d, 4/51 (7.8%).
37.4 Oro‐facial cleft/craniofacial malformations
Pooled results from three studies showed a significant outcome (RR 0.22, 95% CI 0.07 to 0.68; I2 = 0%), with children exposed to LTG (N = 1903) experiencing fewer oro‐facial cleft/craniofacial malformations than children exposed to PB (N = 271) (Australian; Cassina 2013; North American Register; see Analysis 37.4). However, this gave a non‐significant RD (RD −0.01, 95% CI −0.03 to 0.01; I2 = 0%).
37.4. Analysis.
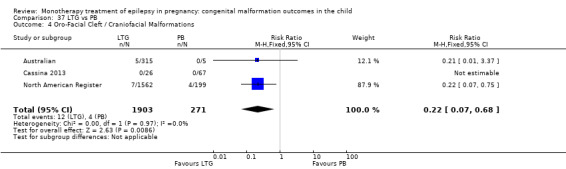
Comparison 37 LTG vs PB, Outcome 4 Oro‐Facial Cleft / Craniofacial Malformations.
In the EURAP data, the prevalence of oro‐facial cleft malformations in those exposed to VPA and PB was: LTG < 300 mg/d, 0/836 (0%); LTG > 300 mg/d, 2/444 (1%) and PB < 150 mg/d, 0/166 (0%); PB > 150 mg/d, 1/51 (2%).
37.5 Skeletal/limb malformations
Pooled results from three studies showed a non‐significant outcome (RR 0.25, 95% CI 0.02 to 2.80; I2 = 0%), with no difference in the number of skeletal/limb malformations in children exposed to LTG (N = 1903) and children exposed to PB (N = 271) (Australian; Cassina 2013; North American Register; see Analysis 37.5). This gave a non‐significant RD (RD −0.00, 95% CI −0.02 to 0.01; I2 = 0%).
37.5. Analysis.
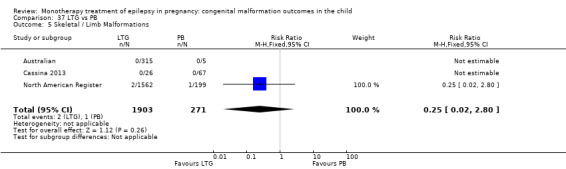
Comparison 37 LTG vs PB, Outcome 5 Skeletal / Limb Malformations.
38 LTG versus PHT
38.1 All major malformations
Pooled results from five studies showed a significant outcome (RR 0.53, 95% CI 0.34 to 0.84; I2 = 17%), with children exposed to LTG (N = 4082) experiencing fewer major malformations than children exposed to PHT (N = 624) (Australian; Mawer 2010; Meador 2006; North American Register; UK Register; see Analysis 38.1). This gave a significant RD (RD −0.02, 95% CI −0.04 to −0.00; I2 = 0%).
38.1. Analysis.
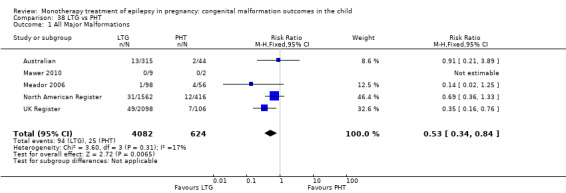
Comparison 38 LTG vs PHT, Outcome 1 All Major Malformations.
38.2 Neural tube malformations
Pooled results from four studies showed a non‐significant outcome (RR 0.31, 95% CI 0.07 to 1.34; I2 = 13%), with no difference in the number of neural tube malformations in children exposed to LTG (N = 4073) and children exposed to PHT (N = 598) (Australian; Meador 2006; North American Register; UK Register; see Analysis 38.2). This gave a non‐significant RD (RD −0.00, 95% CI −0.01 to 0.01; I2 = 0%).
38.2. Analysis.
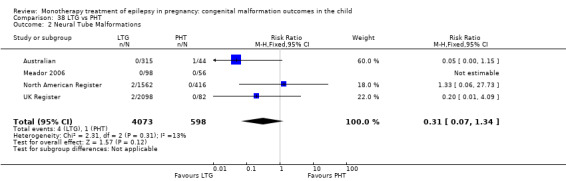
Comparison 38 LTG vs PHT, Outcome 2 Neural Tube Malformations.
38.3 Cardiac malformations
Pooled results from four studies showed a significant outcome (RR 0.35, 95% CI 0.14 to 0.92; I2 = 0%), with children exposed to LTG (N = 4073) experiencing fewer cardiac malformations than children exposed to PHT (N = 598) (Australian; Meador 2006; North American Register; UK Register; see Analysis 38.3). This gave a non‐significant RD (RD −0.01, 95% CI −0.02 to 0.00; I2 = 0%).
38.3. Analysis.
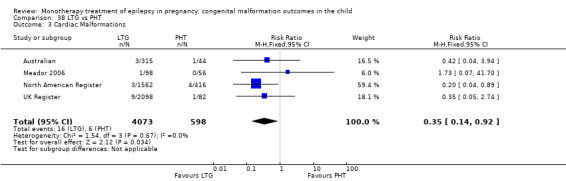
Comparison 38 LTG vs PHT, Outcome 3 Cardiac Malformations.
38.4 Oro‐facial cleft/craniofacial malformations
Pooled results from four studies showed a non‐significant outcome (RR 0.75, 95% CI 0.24 to 2.34; I2 = 47%), with no difference in the number of oro‐facial cleft/craniofacial malformations in children exposed to LTG (N = 4073) and children exposed to PHT (N = 598) (Australian; Meador 2006; North American Register; UK Register; see Analysis 38.4). This gave a non‐significant RD (RD −0.00, 95% CI −0.01 to 0.01; I2 = 0%).
38.4. Analysis.
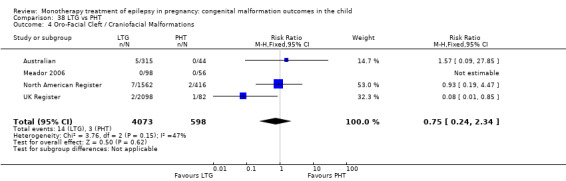
Comparison 38 LTG vs PHT, Outcome 4 Oro‐Facial Cleft / Craniofacial Malformations.
38.5 Skeletal/limb malformations
Pooled results from four studies showed a significant outcome (RR 0.15, 95% CI 0.03 to 0.66; I2 = 0%), with children exposed to LTG (N = 4073) experiencing fewer skeletal/limb malformations than children exposed to PHT (N = 598) (Australian; Meador 2006; North American Register; UK Register; see Analysis 38.5). This gave a non‐significant RD (RD −0.01, 95% CI −0.01 to 0.00; I2 = 0%).
38.5. Analysis.
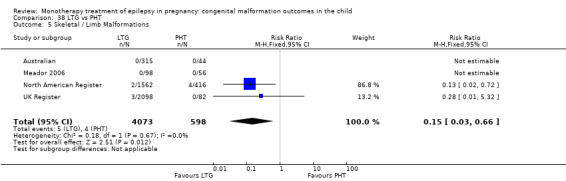
Comparison 38 LTG vs PHT, Outcome 5 Skeletal / Limb Malformations.
39 LTG versus TPM
39.1 All major malformations
Pooled results from three studies showed a significant outcome (RR 0.56, 95% CI 0.34 to 0.94; I2 = 0%), with children exposed to LTG (N = 3975) experiencing fewer major malformations than children exposed to TPM (N = 473) (Australian; North American Register; UK Register; see Analysis 39.1). However, this gave a non‐significant RD (RD −0.02, 95% CI −0.04 to 0.00; I2 = 10%).
39.1. Analysis.
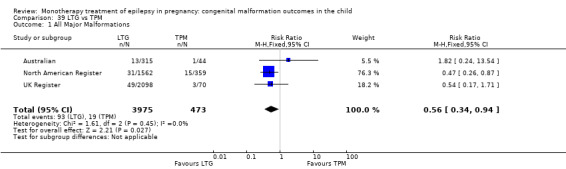
Comparison 39 LTG vs TPM, Outcome 1 All Major Malformations.
39.2 Neural tube malformations
Pooled results from three studies showed a non‐significant outcome (RR 0.62, 95% CI 0.08 to 4.94; I2 = 0%), with no difference in the number of neural tube malformations in children exposed to LTG (N = 3975) and children exposed to TPM (N = 473) (Australian; North American Register; UK Register; see Analysis 39.2). This gave a non‐significant RD (RD 0.00, 95% CI −0.00 to 0.01; I2 = 0%).
39.2. Analysis.
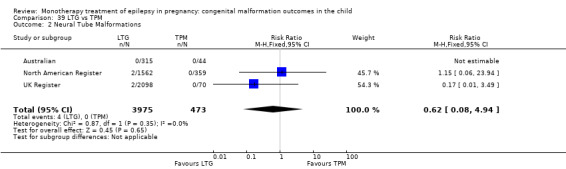
Comparison 39 LTG vs TPM, Outcome 2 Neural Tube Malformations.
39.3 Cardiac malformations
Pooled results from three studies showed a non‐significant outcome (RR 0.75, 95% CI 0.17 to 3.42; I2 = 0%), with no difference in the number of cardiac malformations in children exposed to LTG (N = 3975) and children exposed to TPM (N = 473) (Australian; North American Register; UK Register; see Analysis 39.3). This gave a non‐significant RD (RD 0.00, 95% CI −0.01 to 0.01; I2 = 0%).
39.3. Analysis.
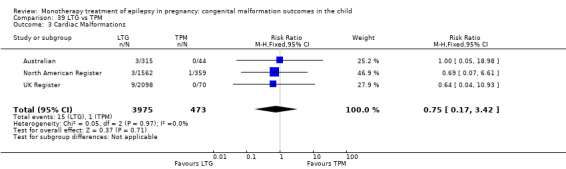
Comparison 39 LTG vs TPM, Outcome 3 Cardiac Malformations.
39.4 Oro‐facial cleft/craniofacial malformations
Pooled results from three studies showed a significant outcome (RR 0.32, 95% CI 0.13 to 0.76; I2 = 69%), with children exposed to LTG (N = 3975) experiencing fewer of oro‐facial cleft/craniofacial malformations than children exposed to TPM (N = 473) (Australian; North American Register; UK Register; see Analysis 39.4). Due to high heterogeneity, we undertook a random‐effects analysis, which changed the result to non‐significant (RR (RE) 0.22, 95% CI 0.03 to 1.56; I2 = 69%). The RD was also non‐significant (RD −0.01, 95% CI −0.02 to 0.00; I2 = 34%).
39.4. Analysis.
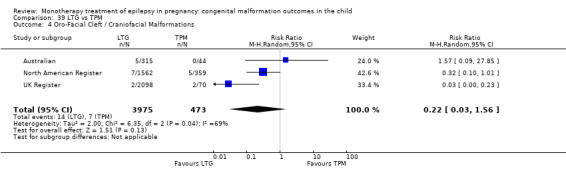
Comparison 39 LTG vs TPM, Outcome 4 Oro‐Facial Cleft / Craniofacial Malformations.
39.5 Skeletal/limb malformations
Pooled results from three studies showed a significant outcome (RR 0.11, 95% CI 0.03 to 0.45; I2 = 0%), with children exposed to LTG (N = 3975) experiencing fewer skeletal/limb malformations than children exposed to TPM (N = 473) (Australian; North American Register; UK Register; see Analysis 39.5). This gave a non‐significant RD (RD −0.01, 95% CI −0.02 to 0.00; I2 = 0%).
39.5. Analysis.
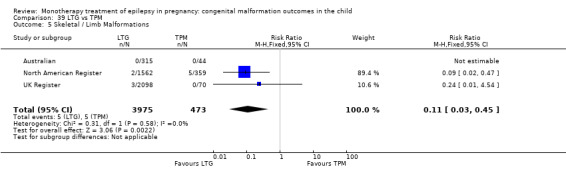
Comparison 39 LTG vs TPM, Outcome 5 Skeletal / Limb Malformations.
40 PHT versus GBP
40.1 All major malformations
Pooled results from three studies showed a non‐significant outcome (RR 2.81, 95% CI 0.77 to 10.23; I2 = 0%), with no difference in the number of major malformations in children exposed to PHT (N = 566) and children exposed to GBP (N = 190) (Australian; North American Register; UK Register; see Analysis 40.1). This gave a significant RD (RD 0.03, 95% CI 0.00* to 0.05; I2 = 0%).
40.1. Analysis.
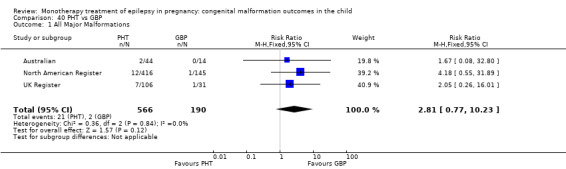
Comparison 40 PHT vs GBP, Outcome 1 All Major Malformations.
40.2 Neural tube malformations
Data from one study showed a non‐significant outcome (RR 1.00, 95% CI 0.04 to 23.26; I2 = NA), with no difference in the number of neural tube malformations in children exposed to PHT (N = 44) and children exposed to GBP (N = 14) (Australian; see Analysis 40.2). This gave a non‐significant RD (RD 0.02, 95% CI −0.08 to 0.13; I2 = NA).
40.2. Analysis.

Comparison 40 PHT vs GBP, Outcome 2 Neural Tube Malformations.
40.3 Cardiac malformations
Data from one study showed a non‐significant outcome (RR 1.00, 95% CI 0.04 to 23.26), with no difference in the number of cardiac malformations in children exposed to PHT (N = 44) and children exposed to GBP (N = 14) (Australian; see Analysis 40.3). This gave a non‐significant RD (RD 0.02, 95% CI −0.08 to 0.13; I2 = NA).
40.3. Analysis.
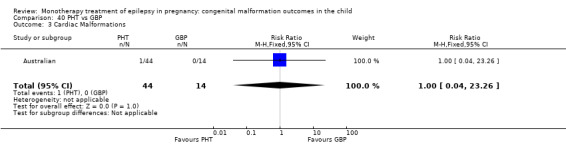
Comparison 40 PHT vs GBP, Outcome 3 Cardiac Malformations.
40.4 Oro‐facial cleft/craniofacial malformations
We could not estimate data from one study due to there being no reported oro‐facial cleft/craniofacial malformations in children exposed to PHT (N = 44) or children exposed to GBP (N = 14) (Analysis 40.4). RD was calculable, and this gave a non‐significant result (RD 0.00, 95% CI −0.10 to 0.10; I2 = NA).
40.4. Analysis.

Comparison 40 PHT vs GBP, Outcome 4 Oro‐Facial Cleft / Craniofacial Malformations.
40.5 Skeletal/limb malformations
We could not estimate data from one study due to there being no reported skeletal/limb malformations in children exposed to PHT (N = 44) or children exposed to GBP (N = 14) (Australian; see Analysis 40.5). RD was calculable, and this gave a non‐significant result (RD 0.00, 95% CI −0.10 to 0.10; I2 = NA).
40.5. Analysis.

Comparison 40 PHT vs GBP, Outcome 5 Skeletal / Limb Malformations.
41 PHT versus OXC
41.1 All major malformations
Pooled results from three studies showed a non‐significant outcome (RR 1.08, 95% CI 0.43 to 2.71; I2 = 12%), with no difference in the number of major malformations in children exposed to PHT (N = 584) and children exposed to OXC (N = 203) (Australian; Kaaja 2003; North American Register; see Analysis 41.1). This gave a non‐significant RD (RD 0.00, 95% CI −0.02 to 0.03; I2 = 0%).
41.1. Analysis.
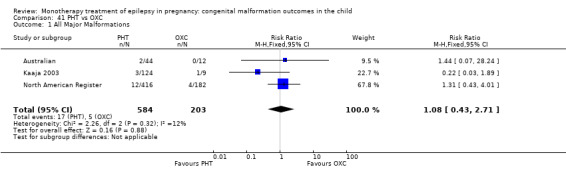
Comparison 41 PHT vs OXC, Outcome 1 All Major Malformations.
41.2 Neural tube malformations
Pooled results from three studies showed a non‐significant outcome (RR 0.87, 95% CI 0.04 to 20.03; I2 = NA), with no difference in the number of neural tube malformations in children exposed to PHT (N = 584) and children exposed to OXC (N = 203) (Australian; Kaaja 2003; North American Register; see Analysis 41.2). This gave a non‐significant RD (RD 0.00, 95% CI −0.01 to 0.02; I2 = 0%).
41.2. Analysis.
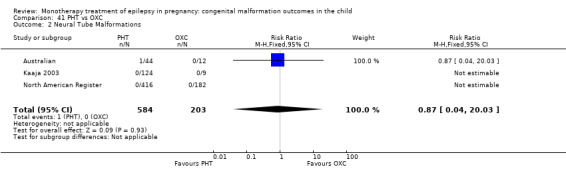
Comparison 41 PHT vs OXC, Outcome 2 Neural Tube Malformations.
41.3 Cardiac malformations
Pooled results from three studies showed a non‐significant outcome (RR 2.32, 95% CI 0.30 to 18.27; I2 = 0%), with no difference in the number of cardiac malformations in children exposed to PHT (N = 584) and children exposed to OXC (N = 203) (Australian; Kaaja 2003; North American Register; see Analysis 41.3). This gave a non‐significant RD (RD 0.01, 95% CI −0.01 to 0.03; I2 = 0%).
41.3. Analysis.
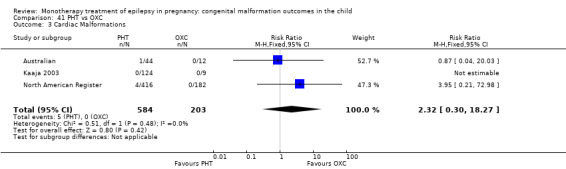
Comparison 41 PHT vs OXC, Outcome 3 Cardiac Malformations.
41.4 Oro‐facial cleft/craniofacial malformations
Pooled results from three studies showed a non‐significant outcome (RR 0.62, 95% CI 0.10 to 4.05; I2 = 0%), with no difference in the number of oro‐facial cleft/craniofacial malformations in children exposed to PHT (N = 584) and children exposed to OXC (N = 203) (Australian; Kaaja 2003; North American Register; see Analysis 41.4). This gave a non‐significant RD (RD −0.00, 95% CI −0.02 to 0.02; I2 = 0%).
41.4. Analysis.
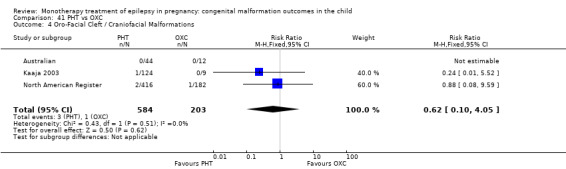
Comparison 41 PHT vs OXC, Outcome 4 Oro‐Facial Cleft / Craniofacial Malformations.
41.5 Skeletal/limb malformations
Pooled results from three studies showed a non‐significant outcome (RR 1.75, 95% CI 0.20 to 15.55; I2 = NA), with no difference in the number of skeletal/limb malformations in children exposed to PHT (N = 584) and children exposed to OXC (N = 203) (Australian; Kaaja 2003; North American Register; see Analysis 41.5). This gave a non‐significant RD (RD 0.00, 95% CI −0.01 to 0.02; I2 = 0%).
41.5. Analysis.
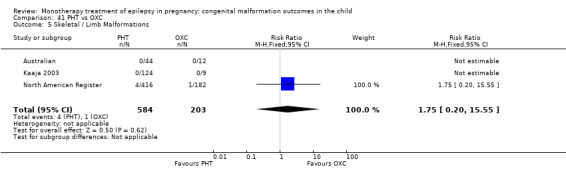
Comparison 41 PHT vs OXC, Outcome 5 Skeletal / Limb Malformations.
42 PHT versus PB
42.1 All major malformations
Pooled results from 19 studies showed a non‐significant outcome (RR 0.80, 95% CI 0.53 to 1.21; I2 = 0%), with no difference in the number of major malformations in children exposed to PHT (N = 978) and children exposed to PB (N = 505) (Al Bunyan 1999; Australian; Canger 1999; D'Souza 1990; Eroglu 2008; Fairgrieve 2000; Froscher 1991; Kaaja 2003; Kaneko 1999; Kelly 1984; Kerala Pregnancy Registry; Koch 1992; Lindhout 1992; Montreal Series; North American Register; Omtzigt 1992; Pardi 1982; Steegers‐Theunissen 1994; Waters 1994; see Analysis 42.1). This gave a non‐significant RD (RD −0.01, 95% CI −0.04 to 0.02; I2 = 0%).
42.1. Analysis.
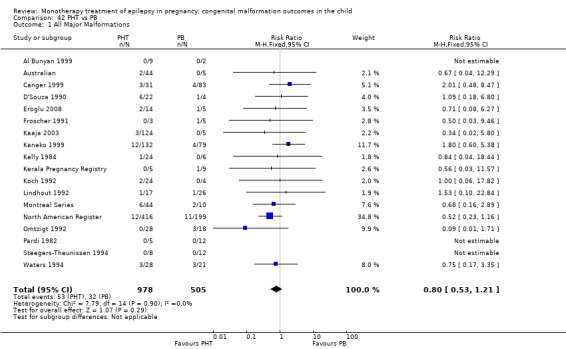
Comparison 42 PHT vs PB, Outcome 1 All Major Malformations.
Samren 1997 reported nine case of major malformation in 141 (6%) PHT cases and five cases in 48 (10%) PB‐exposed children.
42.2 Neural tube malformations
Pooled results from 10 studies showed a non‐significant outcome (RR 0.40, 95% CI 0.02 to 8.75; I2 = NA), with no difference in the number of neural tube malformations in children exposed to PHT (N = 592) and children exposed to PB (N = 344) (Australian; Canger 1999; D'Souza 1990; Eroglu 2008; Froscher 1991; Kerala Pregnancy Registry; Koch 1992; North American Register; Omtzigt 1992; Pardi 1982; see Analysis 42.2). This gave a non‐significant RD (RD 0.00, 95% CI −0.02 to 0.02; I2 = 0%).
42.2. Analysis.
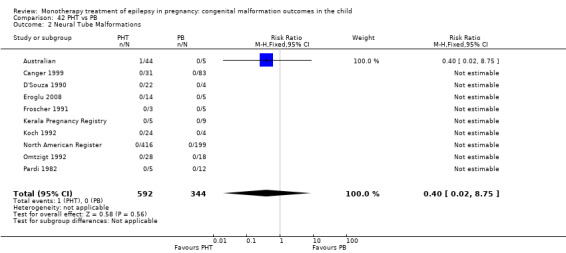
Comparison 42 PHT vs PB, Outcome 2 Neural Tube Malformations.
42.3 Cardiac malformations
Pooled results from 10 studies showed a significant outcome (RR 0.33, 95% CI 0.16 to 0.71; I2 = 0%), with children exposed to PHT (N = 687) experiencing fewer cardiac malformations than children exposed to PB (N = 378) (Australian; Canger 1999; D'Souza 1990; Eroglu 2008; Froscher 1991; Kerala Pregnancy Registry; Koch 1992; North American Register; Omtzigt 1992; Pardi 1982; see Analysis 42.3). This gave a significant RD (RD −0.03, 95% CI −0.05 to −0.00; I2 = 0%).
42.3. Analysis.
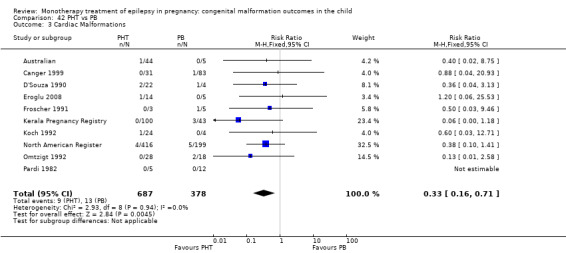
Comparison 42 PHT vs PB, Outcome 3 Cardiac Malformations.
42.4 Oro‐facial cleft/craniofacial malformations
Pooled results from 10 studies showed a significant outcome (RR 0.25, 95% CI 0.07 to 0.82; I2 = 0%), with children exposed to PHT (N = 592) experiencing fewer oro‐facial cleft/craniofacial malformations than children exposed to PB (N = 344) (Australian; Canger 1999; D'Souza 1990; Eroglu 2008; Froscher 1991; Kerala Pregnancy Registry; Koch 1992; North American Register; Omtzigt 1992; Pardi 1982; see Analysis 42.4). This gave a non‐significant RD (RD −0.02, 95% CI −0.04 to 0.01; I2 = 0%).
42.4. Analysis.
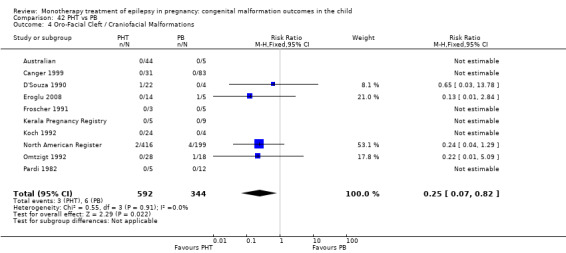
Comparison 42 PHT vs PB, Outcome 4 Oro‐Facial Cleft / Craniofacial Malformations.
42.5 Skeletal/limb malformations
Pooled results from 10 studies showed a non‐significant outcome (RR 1.45, 95% CI 0.40 to 5.22; I2 = 0%), with no difference in the number of skeletal/limb malformations in children exposed to PHT (N = 592) and children exposed to PB (N = 344) (Australian; Canger 1999; D'Souza 1990; Eroglu 2008; Froscher 1991; Kerala Pregnancy Registry; Koch 1992; North American Register; Omtzigt 1992; Pardi 1982; see Analysis 42.5). This gave a non‐significant RD (RD 0.01, 95% CI −0.01 to 0.03; I2 = 0%).
42.5. Analysis.
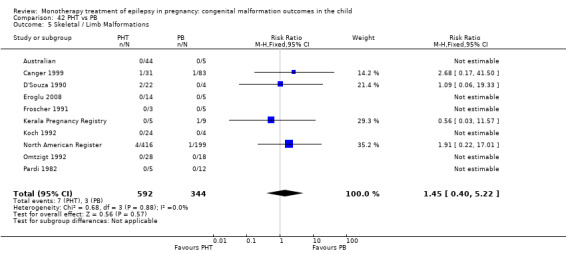
Comparison 42 PHT vs PB, Outcome 5 Skeletal / Limb Malformations.
43 PHT versus TPM
43.1 All major malformations
Pooled results from three studies showed a non‐significant outcome (RR 0.90, 95% CI 0.49 to 1.67; I2 = 0%), with no difference in the number of major malformations in children exposed to PHT (N = 566) and children exposed to TPM (N = 473) (Australian; North American Register; UK Register; see Analysis 43.1). This gave a non‐significant RD (RD −0.00, 95% CI −0.03 to 0.02; I2 = 0%).
43.1. Analysis.
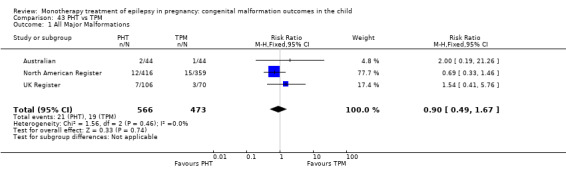
Comparison 43 PHT vs TPM, Outcome 1 All Major Malformations.
43.2 Neural tube malformations
Pooled results from three studies showed a non‐significant outcome (RR 3.00, 95% CI 0.13 to 71.70; I2 = NA), with no difference in the number of neural tube malformations in children exposed to PHT (N = 542) and children exposed to TPM (N = 473) (Australian; North American Register; UK Register; see Analysis 43.2). This gave a non‐significant RD (RD 0.00, 95% CI −0.01 to 0.01; I2 = 0%).
43.2. Analysis.
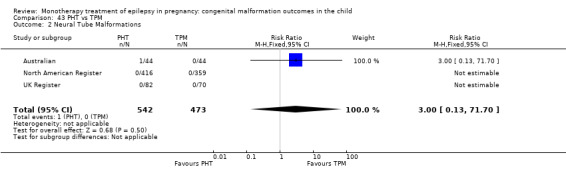
Comparison 43 PHT vs TPM, Outcome 2 Neural Tube Malformations.
43.3 Cardiac malformations
Pooled results from three studies showed a non‐significant outcome (RR 3.12, 95% CI 0.65 to 14.93; I2 = 0%), with no difference in the number of cardiac malformations in children exposed to PHT (N = 542) and children exposed to TPM (N = 473) (Australian; North American Register; UK Register; see Analysis 43.3). This gave a non‐significant RD (RD 0.01, 95% CI −0.00 to 0.02; I2 = 0%).
43.3. Analysis.
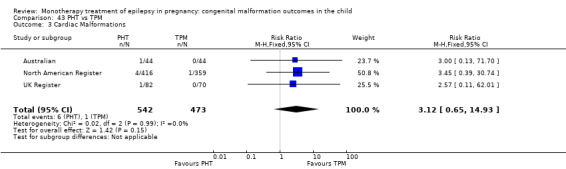
Comparison 43 PHT vs TPM, Outcome 3 Cardiac Malformations.
43.4 Oro‐facial cleft/craniofacial malformations
Pooled results from three studies showed a non‐significant outcome (RR 0.37, 95% CI 0.10 to 1.42; I2 = 0%), with no difference in the number of oro‐facial cleft/craniofacial malformations in children exposed to PHT (N = 542) and children exposed to TPM (N = 473) (Australian; North American Register; UK Register; see Analysis 43.4). This gave a non‐significant RD (RD −0.01, 95% CI −0.02 to 0.00; I2 = 0%).
43.4. Analysis.
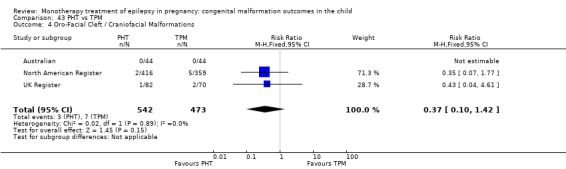
Comparison 43 PHT vs TPM, Outcome 4 Oro‐Facial Cleft / Craniofacial Malformations.
43.5 Skeletal/limb malformations
Pooled results from three studies showed a non‐significant outcome (RR 0.69, 95% CI 0.19 to 2.55; I2 = NA), with no difference in the number of skeletal/limb malformations in children exposed to PHT (N = 542) and children exposed to TPM (N = 473) (Australian; North American Register; UK Register; see Analysis 43.5). This gave a non‐significant RD (RD −0.00, 95% CI −0.02 to 0.01; I2 = 0%).
43.5. Analysis.
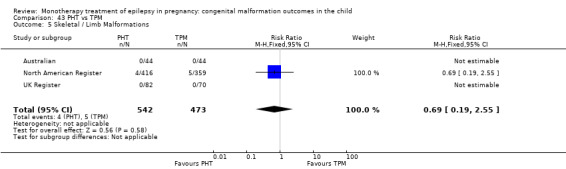
Comparison 43 PHT vs TPM, Outcome 5 Skeletal / Limb Malformations.
44 PB versus OXC
44.1 All major malformations
Pooled results from four studies showed a non‐significant outcome (RR 2.52, 95% CI 0.98 to 6.43; I2 = 21%), with no difference in the number of major malformations in children exposed to PB (N = 214) and children exposed to OXC (N = 238) (Australian; Kaaja 2003; Meischenguiser 2004; North American Register; see Analysis 44.1). This gave a non‐significant RD (RD 0.03, 95% CI −0.01 to 0.08; I2 = 0%).
44.1. Analysis.
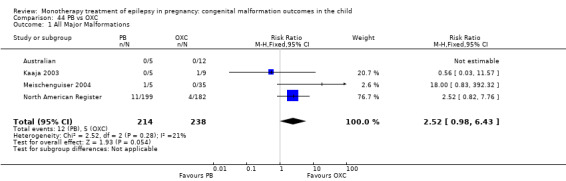
Comparison 44 PB vs OXC, Outcome 1 All Major Malformations.
44.2 Neural tube malformations
We we unable to estimate pooled results from three studies due to there being no reported neural tube malformations in children exposed to PB (N = 209) or children exposed to OXC (N = 229) (Australian; Meischenguiser 2004; North American Register; see Analysis 44.2). RD was calculable, and this gave a non‐significant result (RD 0.00, 95% CI −0.02 to 0.02; I2 = 0%).
44.2. Analysis.
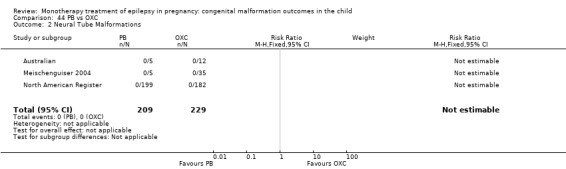
Comparison 44 PB vs OXC, Outcome 2 Neural Tube Malformations.
44.3 Cardiac malformations
Pooled results from three studies showed a significant outcome (RR 11.77, 95% CI 1.24 to 111.80; I2 = 0%), with children exposed to PB (N = 209) experiencing more cardiac malformations than children exposed to OXC (N = 229) (Australian; Meischenguiser 2004; North American Register; see Analysis 44.3). This gave a significant RD (RD 0.03, 95% CI 0.00* to 0.06; I2 = 0%).
44.3. Analysis.
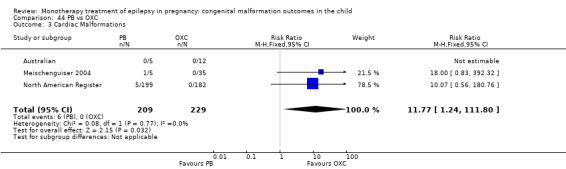
Comparison 44 PB vs OXC, Outcome 3 Cardiac Malformations.
44.4 Oro‐facial cleft/craniofacial malformations
Pooled results from three studies showed a non‐significant outcome (RR 3.66, 95% CI 0.41 to 32.43; I2 = NA), with no difference in the number of oro‐facial cleft/craniofacial malformations in children exposed to PB (N = 209) and children exposed to OXC (N = 229) (Australian; Meischenguiser 2004; North American Register; see Analysis 44.4). This gave a non‐significant RD (RD 0.01, 95% CI −0.01 to 0.04; I2 = 0%).
44.4. Analysis.
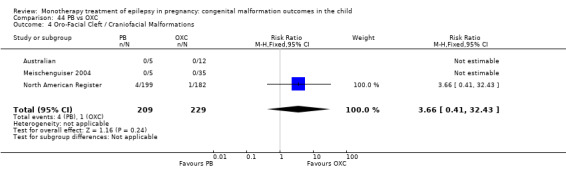
Comparison 44 PB vs OXC, Outcome 4 Oro‐Facial Cleft / Craniofacial Malformations.
44.5 Skeletal/limb malformations
Pooled results from three studies showed a non‐significant outcome (RR 0.91, 95% CI 0.06 to 14.52; I2 = NA), with no difference in the number of skeletal/limb malformations in children exposed to PB (N = 209) and children exposed to OXC (N = 229) (Australian; Meischenguiser 2004; North American Register; see Analysis 44.5). This gave a non‐significant RD (RD −0.00, 95% CI −0.02 to 0.02; I2 = 0%).
44.5. Analysis.
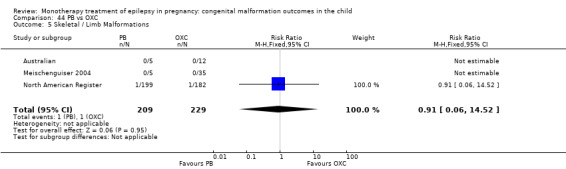
Comparison 44 PB vs OXC, Outcome 5 Skeletal / Limb Malformations.
45 PB versus TPM
45.1 All major malformations
Pooled results from two studies showed a non‐significant outcome (RR 1.36, 95% CI 0.65 to 2.84; I2 = 0%), with no difference in the number of major malformations in children exposed to PB (N = 204) and children exposed to TPM (N = 403) (Australian; North American Register; see Analysis 45.1). This gave a non‐significant RD (RD 0.01, 95% CI −0.03 to 0.05; I2 = 0%).
45.1. Analysis.
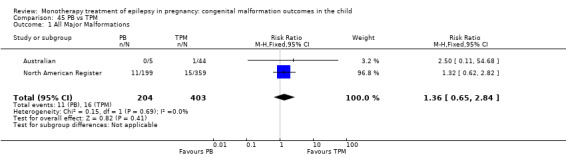
Comparison 45 PB vs TPM, Outcome 1 All Major Malformations.
45.2 Neural tube malformations
We could not estimate pooled results from two studies due to there being no reported neural tube malformations in children exposed to PB (N = 204) and children exposed to TPM (N = 403) (Australian; North American Register; see Analysis 45.2). This gave a non‐significant RD (RD 0.00, 95% CI −0.01 to 0.01; I2 = 0%).
45.2. Analysis.
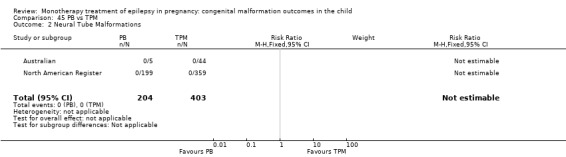
Comparison 45 PB vs TPM, Outcome 2 Neural Tube Malformations.
45.3 Cardiac malformations
Pooled results from two studies showed a significant outcome (RR 9.02, 95% CI 1.06 to 76.67; I2 = NA), with children exposed to PB (N = 204) experiencing more cardiac malformations than children exposed to TPM (N = 403) (Australian; North American Register; see Analysis 45.3). This gave a non‐significant RD (RD 0.02, 95% CI −0.00 to 0.05; I2 = 0%).
45.3. Analysis.
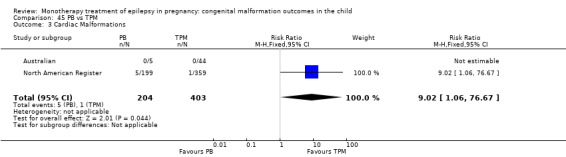
Comparison 45 PB vs TPM, Outcome 3 Cardiac Malformations.
45.4 Oro‐facial cleft/craniofacial malformations
Pooled results from two studies showed a non‐significant outcome (RR 1.44, 95% CI 0.39 to 5.31; I2 = NA), with no difference in the number of oro‐facial cleft/craniofacial malformations in children exposed to PB (N = 204) and children exposed to TPM (N = 403) (Australian; North American Register; see Analysis 45.4). This gave a non‐significant RD (RD 0.01, 95% CI −0.02 to 0.03; I2 = 0%).
45.4. Analysis.
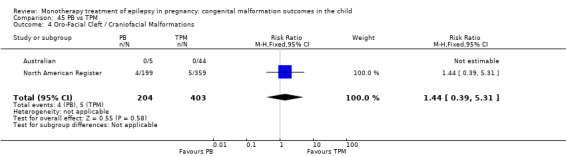
Comparison 45 PB vs TPM, Outcome 4 Oro‐Facial Cleft / Craniofacial Malformations.
45.5 Skeletal/limb malformations
Pooled results from two studies showed a non‐significant outcome (RR 0.36, 95% CI 0.04 to 3.07; I2 = NA), with no difference in the number of skeletal/limb malformations in children exposed to PB (N = 204) and children exposed to TPM (N = 403) (Australian; North American Register; see Analysis 45.5). This gave a non‐significant RD (RD −0.01, 95% CI −0.03 to 0.01; I2 = 0%).
45.5. Analysis.
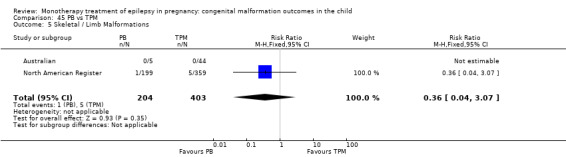
Comparison 45 PB vs TPM, Outcome 5 Skeletal / Limb Malformations.
46 VPA versus GBP
46.1 All major malformations
Pooled results from three studies showed a significant outcome (RR 6.21, 95% CI 1.91 to 20.23; I2 = 0%), with children exposed to VPA (N = 1814) experiencing more major malformations than children exposed to GBP (N = 190) (Australian; North American Register; UK Register; see Analysis 46.1). This gave a significant RD (RD 0.08, 95% CI 0.05 to 0.11; I2 = 39%).
46.1. Analysis.

Comparison 46 VPA vs GBP, Outcome 1 All Major Malformations.
46.2 Neural tube malformations
Data from one study showed a non‐significant outcome (RR 0.83, 95% CI 0.05 to 13.81; I2 = NA), with no difference in the number of neural tube malformations in children exposed to VPA (N = 271) and children exposed to GBP (N = 14) (Australian; see Analysis 46.2). This gave a non‐significant RD (RD 0.03, 95% CI −0.07 to 0.12; I2 = NA).
46.2. Analysis.
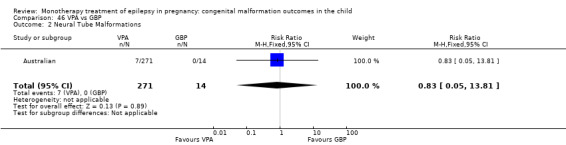
Comparison 46 VPA vs GBP, Outcome 2 Neural Tube Malformations.
46.3 Cardiac malformations
Results from one study showed a non‐significant outcome (RR 1.16, 95% CI 0.07 to 18.84; I2 = NA), with no difference in the number of cardiac malformations in children exposed to VPA (N = 271) and children exposed to GBP (N = 14) (Australian; see Analysis 46.3). This gave a non‐significant RD (RD 0.04, 95% CI −0.06 to 0.13; I2 = NA).
46.3. Analysis.
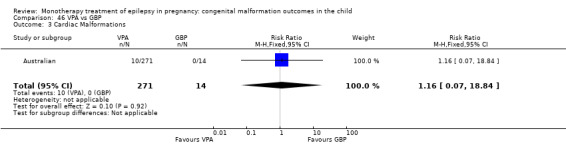
Comparison 46 VPA vs GBP, Outcome 3 Cardiac Malformations.
46.4 Oro‐facial cleft/craniofacial malformations
Data from one study showed a non‐significant outcome (RR 1.38, 95% CI 0.09 to 22.19; I2 = NA), with no difference in the number of oro‐facial cleft/craniofacial malformations in children exposed to VPA (N = 271) and children exposed to GBP (N = 14) (Australian; see Analysis 46.4). This gave a non‐significant RD (RD 0.04, 95% CI −0.05 to 0.14; I2 = NA).
46.4. Analysis.
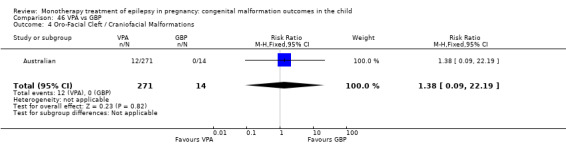
Comparison 46 VPA vs GBP, Outcome 4 Oro‐Facial Cleft / Craniofacial Malformations.
46.5 Skeletal/limb malformations
One study reported a non‐significant outcome (RR 0.72, 95% CI 0.04 to 12.14; I2 = NA), with no difference in the number of skeletal/limb malformations in children exposed to VPA (N = 271) and children exposed to GBP (N = 14) (Australian; see Analysis 46.5). This gave a non‐significant RD (RD 0.02, 95% CI −0.07 to 0.11; I2 = NA).
46.5. Analysis.

Comparison 46 VPA vs GBP, Outcome 5 Skeletal / Limb Malformations.
47 VPA versus LEV
47.1 All major malformations
Pooled results from three studies showed a significant outcome (RR 5.82, 95% CI 3.13 to 10.81; I2 = 13%), with children exposed to VPA (N = 1814) experiencing more major malformations than children exposed to LEV (N = 817) (Australian; North American Register; UK Register; see Analysis 47.1). This gave a significant RD (RD 0.07, 95% CI 0.05 to 0.09; I2 = 60%). Due to high heterogeneity, we undertook a random‐effects analysis, which upheld the significant result (RD (RE) 0.08, 95% CI 0.05 to 0.10; I2 = 60%).
47.1. Analysis.
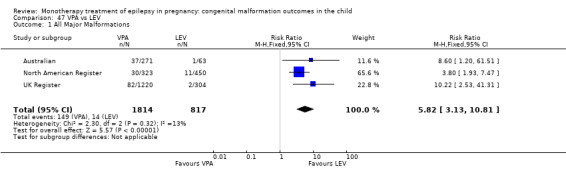
Comparison 47 VPA vs LEV, Outcome 1 All Major Malformations.
47.2 Neural tube malformations
Pooled results from three studies showed a significant outcome (RR 5.28, 95% CI 1.17 to 23.83; I2 = 0%), with children exposed to VPA (N = 1814) experiencing more neural tube malformations than children exposed to LEV (N = 817) (Australian; North American Register; UK Register; see Analysis 47.2). This gave a significant RD (RD 0.01, 95% CI 0.01 to 0.02; I2 = 0%).
47.2. Analysis.

Comparison 47 VPA vs LEV, Outcome 2 Neural Tube Malformations.
47.3 Cardiac malformations
Pooled results from three studies showed a significant outcome (RR 5.79, 95% CI 1.67 to 20.16; I2 = 0%), with children exposed to VPA (N = 1814) experiencing more cardiac malformations than children exposed to LEV (N = 817) (Australian; North American Register; UK Register; see Analysis 47.3). This gave a significant RD (RD 0.02, 95% CI 0.01 to 0.03; I2 = 15%).
47.3. Analysis.
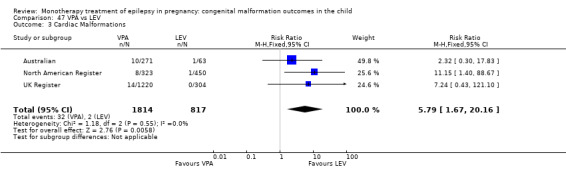
Comparison 47 VPA vs LEV, Outcome 3 Cardiac Malformations.
47.4 Oro‐facial cleft/craniofacial malformations
Pooled results from three studies showed a significant outcome (RR 5.34, 95% CI 1.33 to 21.39; I2 = 0%), with children exposed to VPA (N = 1814) experiencing more oro‐facial cleft/craniofacial malformations than children exposed to LEV (N = 817) (Australian; North American Register; UK Register; see Analysis 47.4). This gave a significant RD (RD 0.01, 95% CI 0.01 to 0.02; I2 = 0%).
47.4. Analysis.
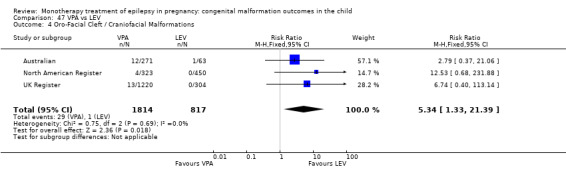
Comparison 47 VPA vs LEV, Outcome 4 Oro‐Facial Cleft / Craniofacial Malformations.
47.5 Skeletal/limb malformations
Pooled results from three studies showed a significant outcome (RR 6.45, 95% CI 1.33 to 31.16; I2 = 0%), with children exposed to VPA (N = 1814) experiencing more skeletal/limb malformations than children exposed to LEV (N = 817) (Australian; North American Register; UK Register; see Analysis 47.5). This gave a significant RD (RD 0.01, 95% CI 0.01 to 0.02; I2 = 6%).
47.5. Analysis.

Comparison 47 VPA vs LEV, Outcome 5 Skeletal / Limb Malformations.
48 VPA versus LTG
48.1 All major malformations
Pooled results from seven studies showed a significant outcome (RR 3.56, 95% CI 2.77 to 4.58; I2 = 0%), with children exposed to VPA (N = 2021) experiencing more major malformations than children exposed to LTG (N = 4164) (Australian; Cassina 2013; Martinez Ferri 2009; Mawer 2010; Meador 2006; North American Register; UK Register; see Analysis 48.1). This gave a significant RD (RD 0.06, 95% CI 0.05 to 0.07; I2 = 57%). Due to high heterogeneity, we undertook a random‐effects analysis, which upheld the significant result (RD (RE) 0.08, 95% CI 0.05 to 0.11; I2 = 57%).
48.1. Analysis.
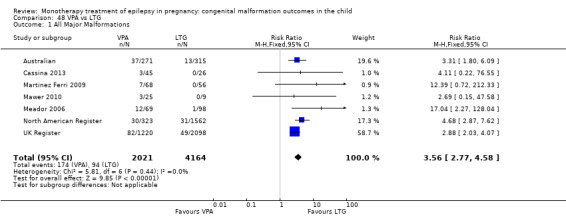
Comparison 48 VPA vs LTG, Outcome 1 All Major Malformations.
In the EURAP data, rates of MCM for children exposed to VPA were: 24/431 (5.6%) for exposures < 700 mg/d, 50/480 (10.4%) for exposures of 700 to < 1500 mg/d and 24/99 (24.2%) for exposures > 1500 mg/d. In comparison, the rates of MCM for children exposed to LTG were: 17/836 (2.0%) for exposures < 300 mg/d and 20/444 (4.5%) for exposures > 300 mg/d. Children exposed to < 700 mg/d (P = 0.0019), 700 to < 1500 mg/d (P < 0.0001) and those at doses > 1500 mg/d all were at an increased risk of having a MCM compared with children exposed to < 300 mg of LTG (P = 0.0012). There was no comparison to higher doses of LTG.
48.2 Neural tube malformations
Pooled results from six studies showed a significant outcome (RR 9.09, 95% CI 3.56 to 23.22; I2 = 0%), with children exposed to VPA (N = 1996) experiencing more neural tube malformations than children exposed to LTG (N = 4155) (Australian; Cassina 2013; Martinez Ferri 2009; Meador 2006; North American Register; UK Register; see Analysis 48.2). This gave a significant RD (RD 0.01, 95% CI 0.01 to 0.02; I2 = 0%).
48.2. Analysis.
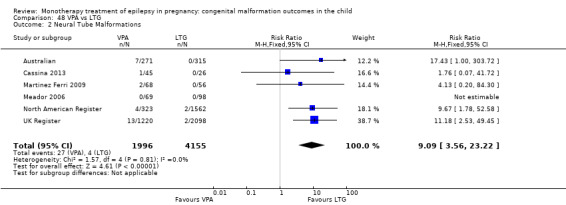
Comparison 48 VPA vs LTG, Outcome 2 Neural Tube Malformations.
In the EURAP data, the prevalence of neural tube malformations in those exposed to VPA and LTG was: VPA < 700 mg/d, 2/431 (1%); VPA 700 to < 1500 mg/d, 7/480 (2%) and VPA > 1500 mg/d, 2/99 (2%); LTG < 300, 0/836 (0%); LTG > 300 mg/d, 0/444 (0%).
48.3 Cardiac malformations
Pooled results from six studies showed a significant outcome (RR 4.07, 95% CI 2.33 to 7.09; I2 = 0%), with children exposed to VPA (N = 1996) experiencing more cardiac malformations than children exposed to LTG (N = 4155) (Australian; Cassina 2013; Martinez Ferri 2009; Meador 2006; North American Register; UK Register; see Analysis 48.3). This gave a significant RD (RD 0.02, 95% CI 0.01 to 0.02; I2 = 46%).
48.3. Analysis.
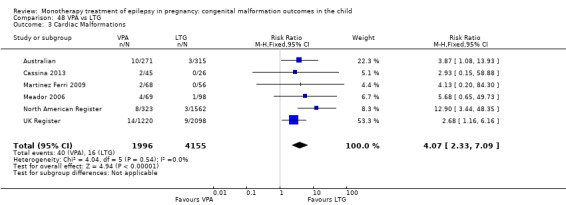
Comparison 48 VPA vs LTG, Outcome 3 Cardiac Malformations.
In the EURAP data, the prevalence of cardiac malformations in those exposed to VPA and LTG was: VPA < 700 mg/d, 5/431 (1%); VPA 700 to < 1500 mg/d, 10/480 (2%) and VPA > 1500 mg/d, 7/99 (7%); LTG < 300, 3/836 (0%); LTG > 300 mg/d, 5/444 (1%).
48.4 Oro‐facial cleft/craniofacial malformations
Pooled results from six studies showed a significant outcome (RR 4.13, 95% CI 2.16 to 7.91; I2 = 0%), with children exposed to VPA (N = 1996) experiencing more oro‐facial cleft/craniofacial malformations than children exposed to LTG (N = 4155) (Australian; Cassina 2013; Martinez Ferri 2009; Meador 2006; North American Register; UK Register; see Analysis 48.4). This gave a significant RD (RD 0.01, 95% CI 0.01 to 0.02; I2 = 0%).
48.4. Analysis.
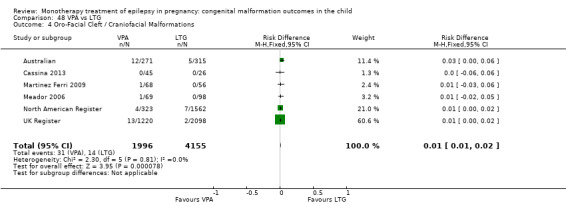
Comparison 48 VPA vs LTG, Outcome 4 Oro‐Facial Cleft / Craniofacial Malformations.
In the EURAP data, the prevalence of oro‐facial cleft malformations in those exposed to VPA and LTG was: VPA < 700 mg/d, 3/431 (1%); VPA 700 to < 1500 mg/d, 1/480 (0%) and VPA > 1500 mg/d, 0/99 (0%); LTG < 300, 0/836 (0%); LTG > 300 mg/d, 2/444 (1%).
48.5 Skeletal/limb malformations
Pooled results from six studies showed a significant outcome (RR 7.17, 95% CI 2.99 to 17.18; I2 = 0%), with children exposed to VPA (N = 1996) experiencing more skeletal/limb malformations than children exposed to LTG (N = 4155) (Australian; Cassina 2013; Martinez Ferri 2009; Meador 2006; North American Register; UK Register; see Analysis 48.5). This gave a significant RD (RD 0.01, 95% CI 0.01 to 0.02; I2 = 0%).
48.5. Analysis.
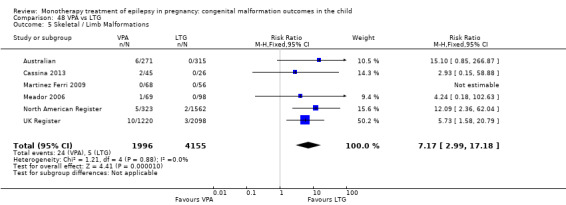
Comparison 48 VPA vs LTG, Outcome 5 Skeletal / Limb Malformations.
49 VPA versus TPM
49.1 All major malformations
Pooled results from three studies showed a significant outcome (RR 2.35, 95% CI 1.40 to 3.95; I2 = 0%), with children exposed to VPA (N = 1814) experiencing more major malformations than children exposed to TPM (N = 473) (Australian; North American Register; UK Register; see Analysis 49.1). This gave a significant RD (RD 0.05, 95% CI 0.03 to 0.08; I2 = 62%). Due to high heterogeneity, we undertook a random‐effects analysis, which upheld the significant result (RD (RE) 0.06, 95% CI 0.01 to 0.10; I2 = 62%).
49.1. Analysis.
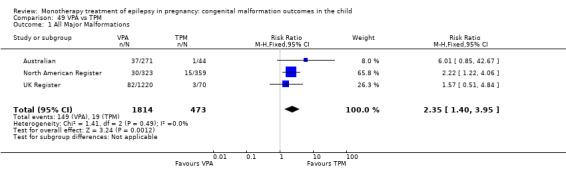
Comparison 49 VPA vs TPM, Outcome 1 All Major Malformations.
49.2 Neural tube malformations
Pooled results from three studies showed a non‐significant outcome (RR 3.67, 95% CI 0.79 to 17.08; I2 = 0%), with no difference in the number of neural tube malformations in children exposed to VPA (N = 1814) and children exposed to TPM (N = 473) (Australian; North American Register; UK Register; see Analysis 49.2). However, this gave a significant RD (RD 0.01, 95% CI 0.00* to 0.02; I2 = 0%).
49.2. Analysis.
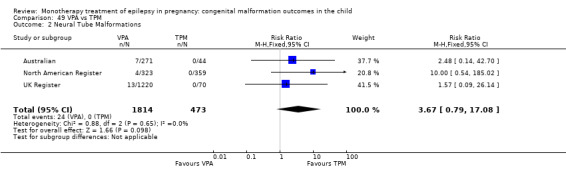
Comparison 49 VPA vs TPM, Outcome 2 Neural Tube Malformations.
49.3 Cardiac malformations
Pooled results from three studies showed a significant outcome (RR 4.73, 95% CI 1.21 to 18.49; I2 = 0%), with children exposed to VPA (N = 1814) experiencing more cardiac malformations than children exposed to TPM (N = 473) (Australian; North American Register; UK Register; see Analysis 49.3). This gave a significant RD (RD 0.02, 95% CI 0.01 to 0.03; I2 = 0%).
49.3. Analysis.
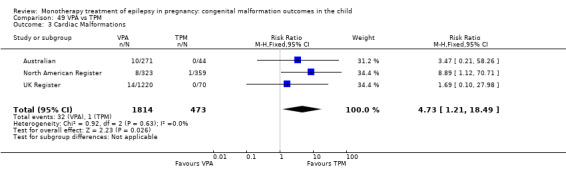
Comparison 49 VPA vs TPM, Outcome 3 Cardiac Malformations.
49.4 Oro‐facial cleft/craniofacial malformations
Pooled results from three studies showed a non‐significant outcome (RR 0.98, 95% CI 0.40 to 2.40; I2 = 26%), with no difference in the number of oro‐facial cleft/craniofacial malformations in children exposed to VPA (N = 1814) and children exposed to TPM (N = 473) (Australian; North American Register; UK Register; see Analysis 49.4). This gave a non‐significant RD (RD 0.00, 95% CI −0.01 to 0.02; I2 = 64%). Due to high heterogeneity, we undertook a random‐effects analysis, which upheld the non‐significant result (RD (RE) 0.01, 95% CI −0.02 to 0.04)
49.4. Analysis.
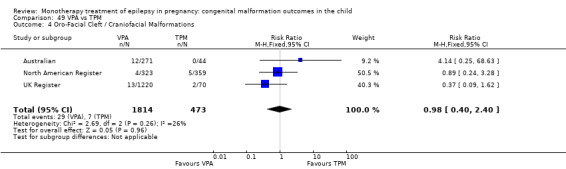
Comparison 49 VPA vs TPM, Outcome 4 Oro‐Facial Cleft / Craniofacial Malformations.
49.5 Skeletal/limb malformations
Pooled results from three studies showed a non‐significant outcome (RR 1.26, 95% CI 0.44 to 3.61; I2 = 0%), with no difference in the number of skeletal/limb malformations in children exposed to VPA (N = 1814) and children exposed to TPM (N = 473) (Australian; North American Register; UK Register; see Analysis 49.5). This gave a non‐significant RD (RD 0.01, 95% CI −0.01 to 0.02; I2 = 0%).
49.5. Analysis.
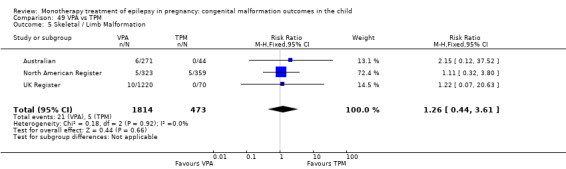
Comparison 49 VPA vs TPM, Outcome 5 Skeletal / Limb Malformation.
50 VPA versus OXC
50.1 All major malformations
Pooled results from four studies showed a significant outcome (RR 3.71, 95% CI 1.65 to 8.33; I2 = 18%), with children exposed to VPA (N = 676) experiencing more major malformations than children exposed to OXC (N = 238) (Australian; Kaaja 2003; Meischenguiser 2004; North American Register; see Analysis 50.1). This gave a significant RD (RD 0.08, 95% CI 0.04 to 0.11; I2 = 3%).
50.1. Analysis.
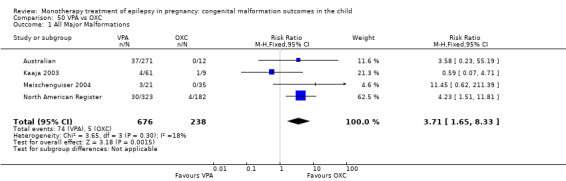
Comparison 50 VPA vs OXC, Outcome 1 All Major Malformations.
50.2 Neural tube malformations
Pooled results from four studies showed a non‐significant outcome (RR 1.89, 95% CI 0.39 to 9.07; I2 = 0%), with no difference in the number of neural tube malformations in children exposed to VPA (N = 676) and children exposed to OXC (N = 238) (Australian; Kaaja 2003; Meischenguiser 2004; North American Register; see Analysis 50.2). This gave a non‐significant RD (RD 0.01, 95% CI −0.00 to 0.03; I2 = 0%).
50.2. Analysis.
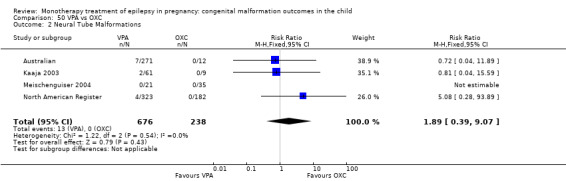
Comparison 50 VPA vs OXC, Outcome 2 Neural Tube Malformations.
50.3 Cardiac malformations
Pooled results from four studies showed a non‐significant outcome (RR 3.41, 95% CI 0.87 to 13.37; I2 = 0%), with no difference in the number of cardiac malformations in children exposed to VPA (N = 676) and children exposed to OXC (N = 238) (Australian; Kaaja 2003; Meischenguiser 2004; North American Register; see Analysis 50.3). However, this gave a significant RD (RD 0.03, 95% CI 0.01 to 0.05; I2 = 0%).
50.3. Analysis.
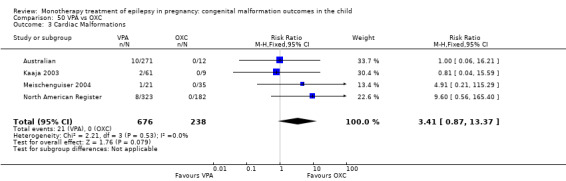
Comparison 50 VPA vs OXC, Outcome 3 Cardiac Malformations.
50.4 Oro‐facial cleft/craniofacial malformations
Pooled results from four studies showed a non‐significant outcome (RR 2.17, 95% CI 0.63 to 7.47; I2 = 0%), with no difference in the number of oro‐facial cleft/craniofacial malformations in children exposed to VPA (N = 676) and children exposed to OXC (N = 238) (Australian; Kaaja 2003; Meischenguiser 2004; North American Register; see Analysis 50.4). This gave a non‐significant RD (RD 0.02, 95% CI −0.00 to 0.04; I2 = 8%).
50.4. Analysis.
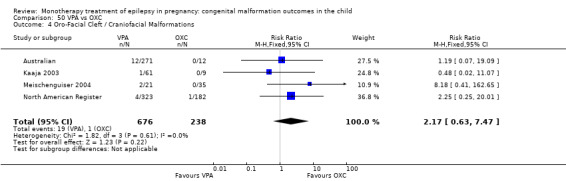
Comparison 50 VPA vs OXC, Outcome 4 Oro‐Facial Cleft / Craniofacial Malformations.
50.5 Skeletal/limb malformations
Pooled results from four studies showed a non‐significant outcome (RR 1.49, 95% CI 0.36 to 6.22; I2 = 0%), with no difference in the number of skeletal/limb malformations in children exposed to VPA (N = 676) and children exposed to OXC (N = 238) (Australian; Kaaja 2003; Meischenguiser 2004; North American Register; see Analysis 50.5). This gave a non‐significant RD (RD 0.01, 95% CI −0.01 to 0.03; I2 = 0%).
50.5. Analysis.
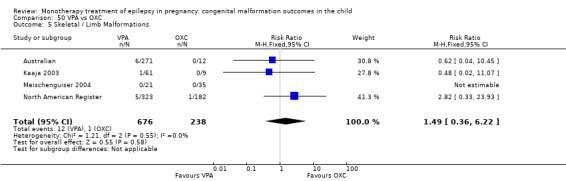
Comparison 50 VPA vs OXC, Outcome 5 Skeletal / Limb Malformations.
51 VPA versus PB
51.1 All major malformations
Pooled results from 20 studies showed a significant outcome (RR 1.59, 95% CI 1.11 to 2.29; I2 = 0%), with children exposed to VPA (N = 1137) experiencing more major malformations than children exposed to PB (N = 626) (Al Bunyan 1999; Australian; Canger 1999; Cassina 2013; Eroglu 2008; Froscher 1991; Kaaja 2003; Kaneko 1999; Kelly 1984; Kerala Pregnancy Registry; Koch 1992; Lindhout 1992; Martinez Ferri 2009; Meischenguiser 2004; Montreal Series; North American Register; Omtzigt 1992; Pardi 1982; Steegers‐Theunissen 1994; Tanganelli 1992; see Analysis 51.1). This gave a significant RD (RD 0.04, 95% CI 0.01 to 0.08; I2 = 0%).
51.1. Analysis.
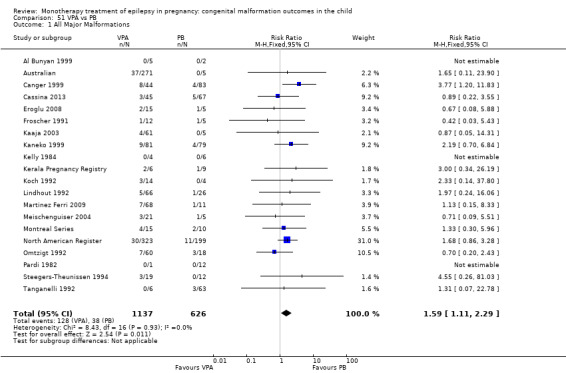
Comparison 51 VPA vs PB, Outcome 1 All Major Malformations.
In the EURAP data, the prevalence of major malformation between these two groups for children exposed to VPA were: 24/431 (5.6%) for exposures < 700 mg/d, 50/480 (10.4%) for exposures of 700 to <1500 mg/d and 24/99 (24.2%) for exposures > 1500 mg/d. In comparison, the rates for children exposed to PB were: 9/166 (5.4%) for exposures < 150 mg/d and 7/51 (13.7%) for exposures > 150 mg/d. Samren 1997 reported six cases of major malformation out of 184 (9%) VPA‐exposed children and five cases from 48 (10%) PB exposed children.
51.2 Neural tube malformations
Pooled results from 11 studies showed a significant outcome (RR 4.56, 95% CI 1.69 to 12.33; I2 = 0%), with children exposed to VPA (N = 813) experiencing more neural tube malformations than children exposed to PB (N = 412) (Australian; Canger 1999; Cassina 2013; Eroglu 2008; Froscher 1991; Kerala Pregnancy Registry; Koch 1992; Meischenguiser 2004; North American Register; Omtzigt 1992; Pardi 1982; see Analysis 51.2). This gave a significant RD (RD 0.04, 95% CI 0.01 to 0.06; I2 = 47%).
51.2. Analysis.
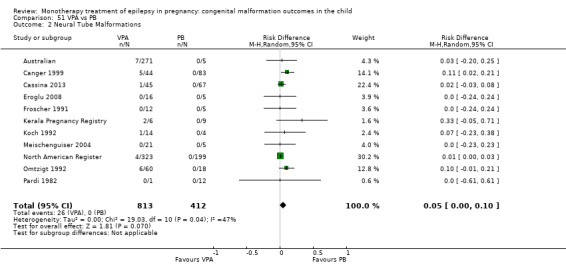
Comparison 51 VPA vs PB, Outcome 2 Neural Tube Malformations.
In the EURAP data, the prevalence of neural tube malformations in those exposed to VPA and PB were: VPA < 700 mg/d, 2/431 (1%); VPA 700 to < 1500 mg/d, 7/480 (2%) and VPA > 1500 mg/d, 2/99 (2%); PB < 150 mg/d, 1/166 (1%); PB > 150 mg/d, 0/51 (0%).
51.3 Cardiac malformations
Pooled results from 11 studies showed a non‐significant outcome (RR 0.76, 95% CI 0.42 to 1.38; I2 = 0%), with no difference in the number of cardiac malformations in children exposed to VPA (N = 878) and children exposed to PB (N = 446) (Australian; Canger 1999; Cassina 2013; Eroglu 2008; Froscher 1991; Kerala Pregnancy Registry; Koch 1992; Meischenguiser 2004; North American Register; Omtzigt 1992; Pardi 1982; see Analysis 51.3). This gave a non‐significant RD (RD −0.01, 95% CI −0.03 to 0.02; I2 = 0%).
51.3. Analysis.
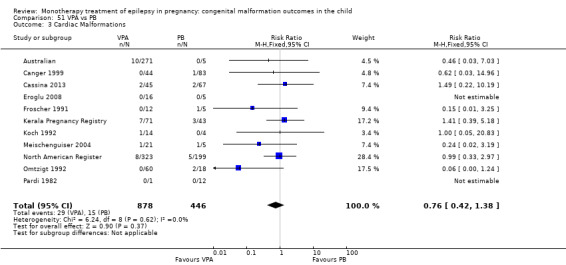
Comparison 51 VPA vs PB, Outcome 3 Cardiac Malformations.
In the EURAP data, the prevalence of cardiac malformations in those exposed to VPA and PB were: VPA < 700 mg/d, 5/431 (1%); VPA 700 to < 1500 mg/d, 10/480 (2%) and VPA > 1500 mg/d, 7/99 (7%); PB < 150 mg/d, 2/166 (1%); PB > 150 mg/d, 4/51 (8%).
51.4 Oro‐facial cleft/craniofacial malformations
Pooled results from 11 studies showed a non‐significant outcome (RR 0.54, 95% CI 0.22 to 1.33; I2 = 0%), with no difference in the number of oro‐facial cleft/craniofacial malformations in children exposed to VPA (N = 813) and children exposed to PB (N = 412) (Australian; Canger 1999; Cassina 2013; Eroglu 2008; Froscher 1991; Kerala Pregnancy Registry; Koch 1992; Meischenguiser 2004; North American Register; Omtzigt 1992; Pardi 1982; see Analysis 51.4). This gave a non‐significant RD (RD −0.03, 95% CI −0.03 to 0.02; I2 = 0%).
51.4. Analysis.
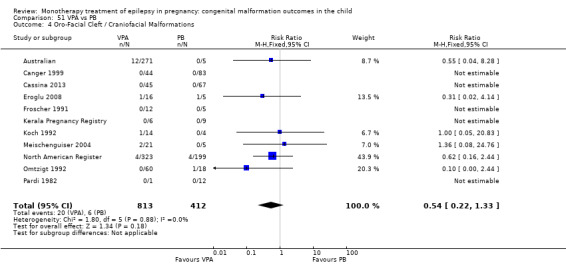
Comparison 51 VPA vs PB, Outcome 4 Oro‐Facial Cleft / Craniofacial Malformations.
In the EURAP data, the prevalence of oro‐facial cleft malformations in those exposed to VPA and PB was: VPA < 700 mg/d, 3/431 (1%); VPA 700 to <1500 mg/d, 1/480 (0%) and VPA > 1500 mg/d, 0/99 (0%); PB < 150 mg/d, 0/166 (0%); PB > 150 mg/d, 1/51 (2%).
51.5 Skeletal/limb malformations
Pooled results from 11 studies showed a non‐significant outcome (RR 1.98, 95% CI 0.79 to 4.98; I2 = 0%), with no difference in the number of skeletal/limb malformations in children exposed to VPA (N = 813) and children exposed to PB (N = 412) (Australian; Canger 1999; Cassina 2013; Eroglu 2008; Froscher 1991; Kerala Pregnancy Registry; Koch 1992; Meischenguiser 2004; North American Register; Omtzigt 1992; Pardi 1982; see Analysis 51.5). This gave a non‐significant RD (RD 0.02, 95% CI −0.00 to 0.04; I2 = 0%).
51.5. Analysis.
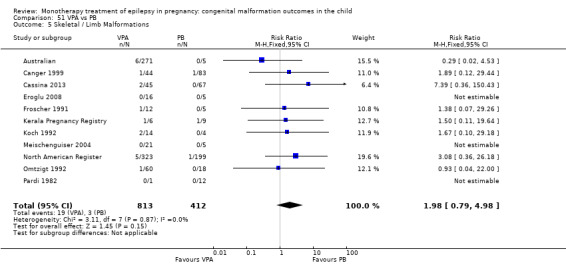
Comparison 51 VPA vs PB, Outcome 5 Skeletal / Limb Malformations.
52 VPA versus PHT
52.1 All major malformations
Pooled results from 21 studies showed a significant outcome (RR 2.00, 95% CI 1.48 to 2.71; I2 = 0%), with children exposed to VPA (N = 2319) experiencing more major malformations than children exposed to PHT (N = 1137) (Al Bunyan 1999; Arulmozhi 2006; Australian; Canger 1999; Eroglu 2008; Fairgrieve 2000; Froscher 1991; Garza‐Morales 1996; Kaaja 2003; Kaneko 1999; Kelly 1984; Kerala Pregnancy Registry; Koch 1992; Lindhout 1992; Mawer 2010; Meador 2006; Montreal Series; North American Register; Omtzigt 1992; Pardi 1982; Steegers‐Theunissen 1994; UK Register; see Analysis 52.1). This gave a significant RD (RD 0.05, 95% CI 0.03 to 0.08; I2 = 0%).
52.1. Analysis.
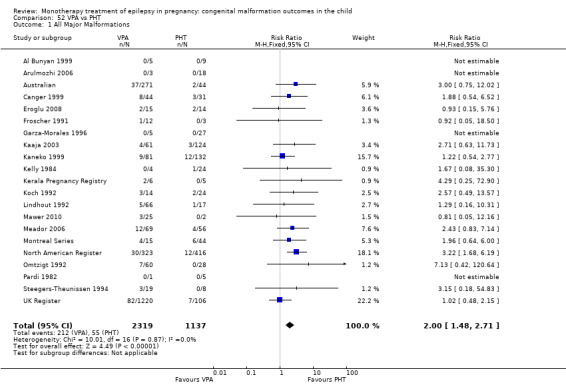
Comparison 52 VPA vs PHT, Outcome 1 All Major Malformations.
Samren 1997 reported six cases of major malformation in 184 (9%) children exposed to VPA and nine in 141 (6%) PHT‐exposed children.
52.2 Neural tube malformations
Pooled results from 13 studies showed a significant outcome (RR 4.47, 95% CI 1.79 to 11.17; I2 = 0%), with children exposed to VPA (N = 2102) experiencing more neural tube malformations than children exposed to PHT (N = 859) (Australian; Canger 1999; Eroglu 2008; Froscher 1991; Garza‐Morales 1996; Kaaja 2003; Kerala Pregnancy Registry; Koch 1992; Meador 2006; North American Register; Omtzigt 1992; Pardi 1982; UK Register; see Analysis 52.2). This gave a significant RD (RD 0.02, 95% CI 0.01 to 0.04; I2 = 24%).
52.2. Analysis.
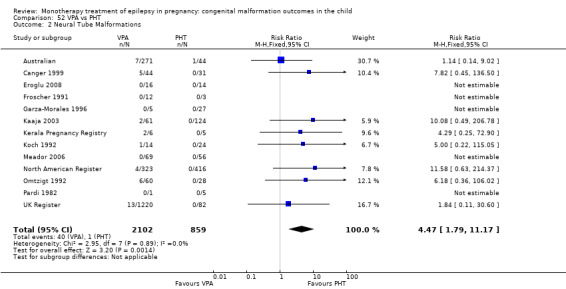
Comparison 52 VPA vs PHT, Outcome 2 Neural Tube Malformations.
52.3 Cardiac malformations
Pooled results from 13 studies showed a significant outcome (RR 2.93, 95% CI 1.50 to 5.72; I2 = 0%), with children exposed to VPA (N = 2167) experiencing more cardiac malformations than children exposed to PHT (N = 954) (Australian; Canger 1999; Eroglu 2008; Froscher 1991; Garza‐Morales 1996; Kaaja 2003; Kerala Pregnancy Registry; Koch 1992; Meador 2006; North American Register; Omtzigt 1992; Pardi 1982; UK Register; see Analysis 52.3). This gave a significant RD (RD 0.02, 95% CI 0.01 to 0.04; I2 = 1%).
52.3. Analysis.
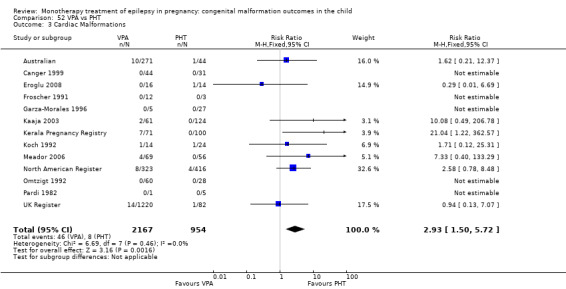
Comparison 52 VPA vs PHT, Outcome 3 Cardiac Malformations.
52.4 Oro‐facial cleft/craniofacial malformations
Pooled results from 13 studies showed a non‐significant outcome (RR 2.37, 95% CI 0.95 to 5.96; I2 = 0%), with no difference in the number of oro‐facial cleft/craniofacial malformations in children exposed to VPA (N = 2102) and children exposed to PHT (N = 859) (Australian; Canger 1999; Eroglu 2008; Froscher 1991; Garza‐Morales 1996; Kaaja 2003; Kerala Pregnancy Registry; Koch 1992; Meador 2006; North American Register; Omtzigt 1992; Pardi 1982; UK Register; see Analysis 52.4). This gave a non‐significant RD (RD 0.01, 95% CI −0.00 to 0.02; I2 = 0%).
52.4. Analysis.
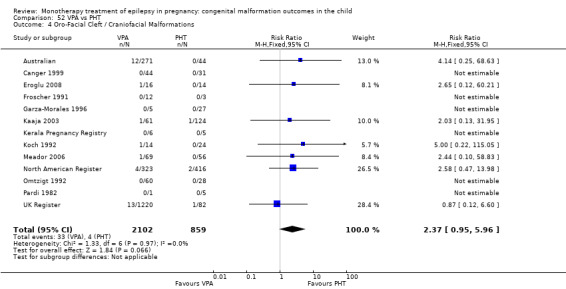
Comparison 52 VPA vs PHT, Outcome 4 Oro‐Facial Cleft / Craniofacial Malformations.
52.5 Skeletal/limb malformations
Pooled results from 13 studies showed a non‐significant outcome (RR 1.98, 95% CI 0.93 to 4.21; I2 = 0%), with no difference in the number of skeletal/limb malformations in children exposed to VPA (N = 2102) and children exposed to PHT (N = 859) (Australian; Canger 1999; Eroglu 2008; Froscher 1991; Garza‐Morales 1996; Kaaja 2003; Kerala Pregnancy Registry; Koch 1992; Meador 2006; North American Register; Omtzigt 1992; Pardi 1982; UK Register; see Analysis 52.5). This gave a significant RD (RD 0.01, 95% CI 0.00* to 0.03; I2 = 0%).
52.5. Analysis.
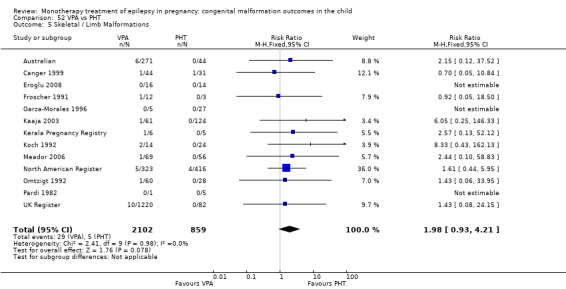
Comparison 52 VPA vs PHT, Outcome 5 Skeletal / Limb Malformations.
53 LTG versus PRM
53.1 All major malformations
No included studies reported data on this outcome.
53.2 Neural tube malformations
No included studies reported data on this outcome.
53.3 Cardiac malformations
No included studies reported data on this outcome.
53.4 Oro‐facial cleft/craniofacial malformations
No included studies reported data on this outcome.
53.5 Skeletal/limb malformations
No included studies reported data on this outcome.
54 PHT versus PRM
54.1 All major malformations
Pooled results from five studies showed a non‐significant outcome (RR 0.82, 95% CI 0.40 to 1.68; I2 = 29%), with no difference in the number of major malformations in children exposed to PHT (N = 316) and children exposed to PRM (N = 101) (Canger 1999; Kaaja 2003; Kaneko 1999; Koch 1992; Pardi 1982; see Analysis 54.1). This gave a non‐significant RD (RD −0.02, 95% CI −0.09 to 0.06; I2 = 0%).
54.1. Analysis.
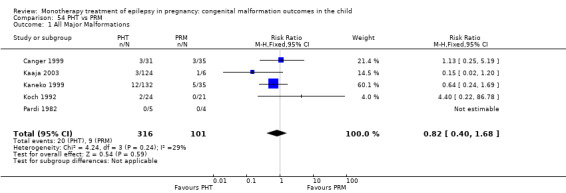
Comparison 54 PHT vs PRM, Outcome 1 All Major Malformations.
Samren 1997 showed nine cases of major malformation in 141 PHT (6%) exposed children and four cases in 43 (9%) PRM‐exposed children.
54.2 Neural tube malformations
We could not estimate pooled results from two studies due to there being no reported neural tube malformations in children exposed to PHT (N = 36) or children exposed to PRM (N = 39) (Canger 1999; Pardi 1982; see Analysis 54.2). RD was calculable, and this gave a non‐significant result (RD 0.00, 95% CI −0.07 to 0.07; I2 = 0%).
54.2. Analysis.
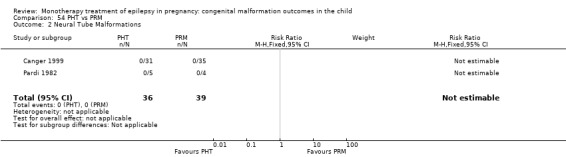
Comparison 54 PHT vs PRM, Outcome 2 Neural Tube Malformations.
54.3 Cardiac malformations
Pooled results from two studies showed a non‐significant outcome (RR 0.38, 95% CI 0.02 to 8.88; I2 = NA), with no difference in the number of cardiac malformations in children exposed to PHT (N = 36) and children exposed to PRM (N = 39) (Canger 1999; Pardi 1982; see Analysis 54.3). This gave a non‐significant RD (RD −0.03, 95% CI −0.11 to 0.06; I2 = 0%).
54.3. Analysis.
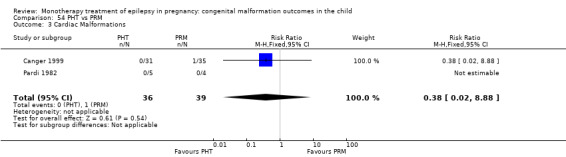
Comparison 54 PHT vs PRM, Outcome 3 Cardiac Malformations.
54.4 Oro‐facial cleft/craniofacial malformations
We could not estimate pooled results from two studies due to there being no reported oro‐facial cleft/craniofacial malformations in children exposed to PHT (N = 36) or children exposed to PRM (N = 39) (Canger 1999; Pardi 1982; see Analysis 54.4). RD was calculable, and this gave a non‐significant result (RD 0.00, 95% CI −0.07 to 0.07; I2 = 0%).
54.4. Analysis.
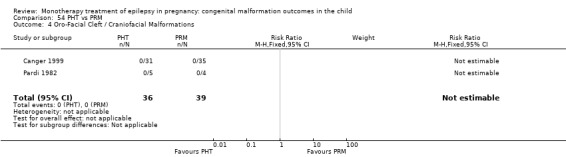
Comparison 54 PHT vs PRM, Outcome 4 Oro‐Facial Cleft / Craniofacial Malformations.
54.5 Skeletal/limb malformations
Pooled results from two studies showed a non‐significant outcome (RR 3.38, 95% CI 0.14 to 79.95; I2 = NA), with no difference in the number of skeletal/limb malformations in children exposed to PHT (N = 36) and children exposed to PRM (N = 39) (Canger 1999; Pardi 1982; see Analysis 54.5). This gave a non‐significant RD (RD 0.03, 95% CI −0.06 to 0.12; I2 = 0%).
54.5. Analysis.
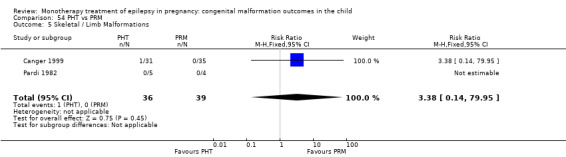
Comparison 54 PHT vs PRM, Outcome 5 Skeletal / Limb Malformations.
55 PB versus PRM
55.1 All major malformations
Pooled results from six studies showed a non‐significant outcome (RR 0.50, 95% CI 0.21 to 1.16; I2 = 0%), with no difference in the number of major malformations in children exposed to PB (N = 241) and children exposed to PRM (N = 110) (Canger 1999; Delmiš 1991; Kaaja 2003; Kaneko 1999; Koch 1992; Pardi 1982; see Analysis 55.1). This gave a non‐significant RD (RD −0.05, 95% CI −0.12 to 0.02; I2 = 0%).
55.1. Analysis.
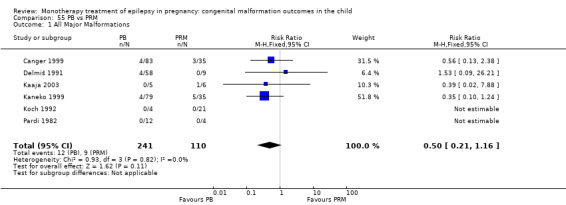
Comparison 55 PB vs PRM, Outcome 1 All Major Malformations.
55.2 Neural tube malformations
We could not estimate pooled results from two studies due to there being no reported neural tube malformations in children exposed to PB (N = 95) or children exposed to PRM (N = 39) (Canger 1999; Pardi 1982; see Analysis 55.2). RD was calculable, and this gave a non‐significant result (RD 0.00, 95% CI −0.05 to 0.05; I2 = 0%).
55.2. Analysis.

Comparison 55 PB vs PRM, Outcome 2 Neural Tube Malformations.
55.3 Cardiac malformations
Pooled results from two studies showed a non‐significant outcome (RR 0.42, 95% CI 0.03 to 6.55; I2 = NA), with no difference in the number of cardiac malformations in children exposed to PB (N = 95) and children exposed to PRM (N = 39) (Canger 1999; Pardi 1982; see Analysis 55.3). This gave a non‐significant RD (RD −0.01, 95% CI −0.08 to 0.05; I2 = 0%).
55.3. Analysis.
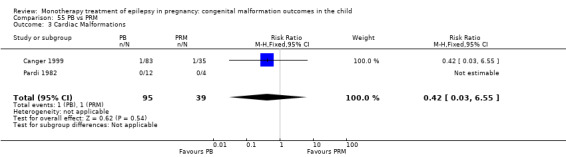
Comparison 55 PB vs PRM, Outcome 3 Cardiac Malformations.
55.4 Oro‐facial cleft/craniofacial malformations
We could not estimate pooled results from two studies due to there being no reported oro‐facial cleft/craniofacial malformations in children exposed to PB (N = 95) or children exposed to PRM (N = 39) (Canger 1999; Pardi 1982; see Analysis 55.4). RD was calculable, and this gave a non‐significant result (RD 0.00, 95% CI −0.05 to 0.05; I2 = 0%).
55.4. Analysis.

Comparison 55 PB vs PRM, Outcome 4 Oro‐Facial Cleft / Craniofacial Malformations.
55.5 Skeletal/limb malformations
Pooled results from two studies showed a non‐significant outcome (RR 1.29, 95% CI 0.05 to 30.82; I2 = NA), with no difference in the number of cardiac malformations in children exposed to PB (N = 95) and children exposed to PRM (N = 39) (Canger 1999; Pardi 1982; see Analysis 55.5). This gave a non‐significant RD (RD 0.01, 95% CI −0.05 to 0.07; I2 = 0%).
55.5. Analysis.
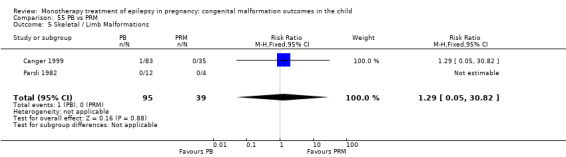
Comparison 55 PB vs PRM, Outcome 5 Skeletal / Limb Malformations.
56 LTG versus ZNS
56.1 All major malformations
Data from one study showed a non‐significant outcome (RR 3.67, 95% CI 0.23 to 59.46; I2 = NA), with no difference in the number of major malformations in children exposed to LTG (N = 1562) and children exposed to ZNS (N = 90) (North American Register; see Analysis 56.1). This gave a significant RD (RD 0.02, 95% CI 0.00* to 0.04; I2 = NA).
56.1. Analysis.

Comparison 56 LTG vs ZNS, Outcome 1 All Major Malformations.
56.2 Neural tube malformations
No included studies reported data on this outcome.
56.3 Cardiac malformations
No included studies reported data on this outcome.
56.4 Oro‐facial cleft/craniofacial malformations
No included studies reported data on this outcome.
56.5 Skeletal/limb malformations
No included studies reported data on this outcome.
57 OXC versus PRM
57.1 All major malformations
One study reported a non‐significant outcome (RR 0.67, 95% CI 0.05 to 8.73; I2 = NA), with no difference in the number of major malformations in children exposed to OXC (N = 9) and children exposed to PRM (N = 6) (Kaaja 2003; see Analysis 57.1). This gave a non‐significant RD (RD −0.06, 95% CI −0.42 to 0.31; I2 = NA).
57.1. Analysis.
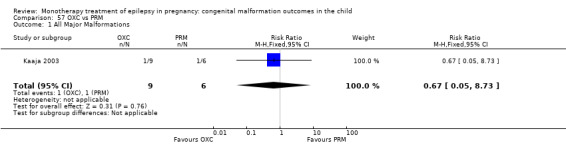
Comparison 57 OXC vs PRM, Outcome 1 All Major Malformations.
57.2 Neural tube malformations
No included studies reported data on this outcome.
57.3 Cardiac malformations
No included studies reported data on this outcome.
57.4 Oro‐facial cleft/craniofacial malformations
No included studies reported data on this outcome.
57.5 Skeletal/limb malformations
No included studies reported data on this outcome.
58 OXC versus TPM
58.1 All major malformations
Pooled results from two studies showed a non‐significant outcome (RR 0.57, 95% CI 0.20 to 1.57; I2 = 0%), with no difference in the number of major malformations in children exposed to OXC (N = 194) and children exposed to TPM (N = 403) (Australian; North American Register; see Analysis 58.1). This gave a non‐significant RD (RD −0.02, 95% CI −0.05 to 0.01; I2 = 0%).
58.1. Analysis.
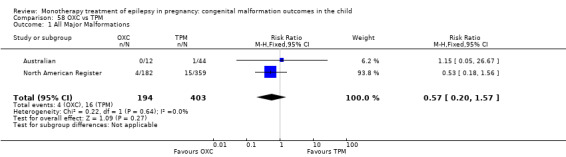
Comparison 58 OXC vs TPM, Outcome 1 All Major Malformations.
58.2 Neural tube malformations
We could not estimate pooled results from two studies due to there being no reported neural tube malformations in children exposed to OXC (N = 194) or children exposed to TPM (N = 403) (Australian; North American Register; see Analysis 58.2). RD was calculable, and this gave a non‐significant result (RD 0.00, 95% CI −0.01 to 0.01; I2 = 0%).
58.2. Analysis.
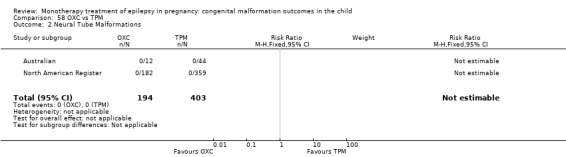
Comparison 58 OXC vs TPM, Outcome 2 Neural Tube Malformations.
58.3 Cardiac malformations
Pooled results from two studies showed a non‐significant outcome (RR 0.66, 95% CI 0.03 to 16.02; I2 = NA), with no difference in the number of cardiac malformations in children exposed to OXC (N = 194) and children exposed to TPM (N = 403) (Australian; North American Register; see Analysis 58.3). This gave a non‐significant RD (RD −0.00, 95% CI −0.02 to 0.01; I2 = 0%).
58.3. Analysis.
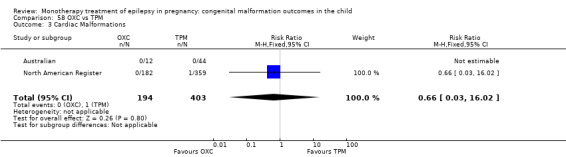
Comparison 58 OXC vs TPM, Outcome 3 Cardiac Malformations.
58.4 Oro‐facial cleft/craniofacial malformations
Pooled results from two studies showed a non‐significant outcome (RR 0.39, 95% CI 0.05 to 3.35, I2 = NA), with no difference in the number of oro‐facial cleft/craniofacial malformations in children exposed to OXC (N = 194) and children exposed to TPM (N = 403) (Australian; North American Register; see Analysis 58.4). This gave a non‐significant RD (RD −0.01, 95% CI −0.03 to 0.01; I2 = 0%).
58.4. Analysis.
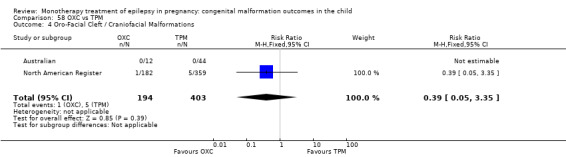
Comparison 58 OXC vs TPM, Outcome 4 Oro‐Facial Cleft / Craniofacial Malformations.
58.5 Skeletal/limb malformations
Pooled results from two studies (Australian; North American Register) showed a non‐significant outcome (RR 0.39, 95% CI 0.05 to 3.35; I2 = NA), with no difference in the number of skeletal/limb malformations in children exposed to OXC (N = 194) and children exposed to TPM (N = 403) (Australian; North American Register; see Analysis 58.5). This gave a non‐significant RD (RD −0.01, 95% CI −0.03 to 0.01; I2 = 0%).
58.5. Analysis.

Comparison 58 OXC vs TPM, Outcome 5 Skeletal / Limb Malformations.
59 OXC versus ZNS
59.1 All major malformations
Data from one study showed a non‐significant outcome (RR 4.48, 95% CI 0.24 to 82.23; I2 = NA), with no difference in the number of major malformations in children exposed to OXC (N = 182) and children exposed to ZNS (N = 90) (North American Register; see Analysis 59.1). This gave a non‐significant RD (RD 0.02, 95% CI −0.01 to 0.05; I2 = NA).
59.1. Analysis.

Comparison 59 OXC vs ZNS, Outcome 1 All Major Malformations.
59.2 Neural tube malformations
No included studies reported data on this outcome.
59.3 Cardiac malformations
No included studies reported data on this outcome.
59.4 Oro‐facial cleft/craniofacial malformations
No included studies reported data on this outcome.
59.5 Skeletal/limb malformations
No included studies reported data on this outcome.
60 PB versus ZNS
60.1 All major malformations
Data from one study showed a non‐significant outcome (RR 10.46, 95% CI 0.62 to 175.67; I2 = NA), with no difference in the number of major malformations in children exposed to PB (N = 199) and children exposed to ZNS (N = 90) (North American Register; see Analysis 60.1). This gave a significant RD (RD 0.06, 95% CI 0.02 to 0.09; I2 = NA).
60.1. Analysis.

Comparison 60 PB vs ZNS, Outcome 1 All Major Malformations.
60.2 Neural tube malformations
No included studies reported data on this outcome.
60.3 Cardiac malformations
No included studies reported data on this outcome.
60.4 Oro‐facial cleft/craniofacial malformations
No included studies reported data on this outcome.
60.5 Skeletal/limb malformations
No included studies reported data on this outcome.
61 PHT versus ZNS
61.1 All major malformations
Data from one study showed a non‐significant outcome (RR 5.46, 95% CI 0.33 to 91.31; I2 = NA), with no difference in the number of major malformations in children exposed to PHT (N = 416) and children exposed to ZNS (N = 90) (North American Register; see Analysis 61.1). However, this gave a significant RD (RD 0.03, 95% CI 0.01 to 0.05; I2 = NA).
61.1. Analysis.

Comparison 61 PHT vs ZNS, Outcome 1 All Major Malformations.
61.2 Neural tube malformations
No included studies reported data on this outcome.
61.3 Cardiac malformations
No included studies reported data on this outcome.
61.4 Oro‐facial cleft/craniofacial malformations
No included studies reported data on this outcome.
61.5 Skeletal/limb malformations
No included studies reported data on this outcome.
62 PRM versus TPM
62.1 All major malformations
No included studies reported data on this outcome.
62.2 Neural tube malformations
No included studies reported data on this outcome.
62.3 Cardiac malformations
No included studies reported data on this outcome.
62.4 Oro‐facial cleft/craniofacial malformations
No included studies reported data on this outcome.
62.5 Skeletal/limb malformations
No included studies reported data on this outcome.
63 PRM versus VPA
63.1 All major malformations
Pooled results from five studies showed a non‐significant outcome (RR 0.72, 95% CI 0.37 to 1.40; I2 = 40%), with no difference in the number of major malformations in children exposed to PRM (N = 101) and children exposed to VPA (N = 201) (Canger 1999; Kaaja 2003; Kaneko 1999; Koch 1992; Pardi 1982; see Analysis 63.1). This gave a non‐significant RD (RD −0.04, 95% CI −0.13 to 0.05; I2 = 17%).
63.1. Analysis.
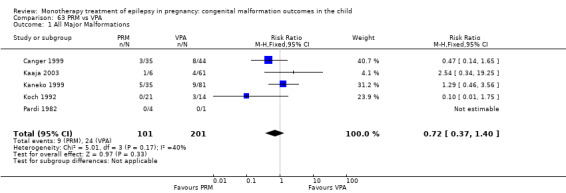
Comparison 63 PRM vs VPA, Outcome 1 All Major Malformations.
63.2 Neural tube malformations
Pooled results from two studies showed a non‐significant outcome (RR 0.11, 95% CI 0.01 to 1.99; I2 = NA), with no difference in the number of neural tube malformations in children exposed to PRM (N = 39) and children exposed to VPA (N = 45) (Canger 1999; Pardi 1982; see Analysis 63.2). This gave a non‐significant RD (RD −0.11, 95% CI −0.22 to 0.00; I2 = 0%).
63.2. Analysis.
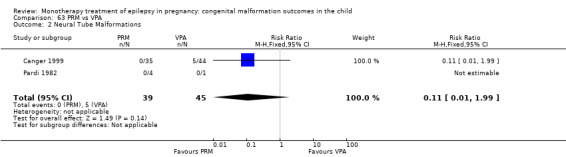
Comparison 63 PRM vs VPA, Outcome 2 Neural Tube Malformations.
63.3 Cardiac malformations
Pooled results from two studies showed a non‐significant outcome (RR 3.75, 95% CI 0.16 to 89.32; I2 = NA), with no difference in the number of cardiac malformations in children exposed to PRM (N = 39) and children exposed to VPA (N = 45) (Canger 1999; Pardi 1982; see Analysis 63.3). This gave a non‐significant RD (RD 0.03, 95% CI −0.06 to 0.11; I2 = 0%).
63.3. Analysis.

Comparison 63 PRM vs VPA, Outcome 3 Cardiac Malformations.
63.4 Oro‐facial cleft/craniofacial malformations
We could not estimate pooled results from two studies due to there being no reported oro‐facial cleft/craniofacial malformations in children exposed to PRM (N = 39) or children exposed to VPA (N = 45) (Canger 1999; Pardi 1982; see Analysis 63.4). RD was calculable, and this gave a non‐significant result (RD 0.00, 95% CI −0.07 to 0.07; I2 = 0%).
63.4. Analysis.

Comparison 63 PRM vs VPA, Outcome 4 Oro‐Facial Cleft / Craniofacial Malformations.
63.5 Skeletal/limb malformations
Pooled results from two studies showed a non‐significant outcome (RR 0.42, 95% CI 0.02 to 9.92; I2 = NA), with no difference in the number of skeletal/limb malformations in children exposed to PRM (N = 39) and children exposed to VPA (N = 45) (Canger 1999; Pardi 1982; see Analysis 63.5). This gave a non‐significant RD (RD −0.02, 95% CI −0.10 to 0.06; I2 = 0%).
63.5. Analysis.

Comparison 63 PRM vs VPA, Outcome 5 Skeletal / Limb Malformations.
64 PRM versus ZNS
64.1 All major malformations
No included studies reported data on this outcome.
64.2 Neural tube malformations
No included studies reported data on this outcome.
64.3 Cardiac malformations
No included studies reported data on this outcome.
64.4 Oro‐facial cleft/craniofacial malformations
No included studies reported data on this outcome.
64.5 Skeletal/limb malformations
No included studies reported data on this outcome.
65 TPM versus ZNS
65.1 All major malformations
Data from one study showed a non‐significant outcome (RR 7.84, 95% CI 0.47 to 129.74; I2 = NA), with no difference in the number of major malformations in children exposed to TPM (N = 359) and children exposed to ZNS (N = 90) (North American Register; see Analysis 65.1). However, this gave a non‐significant RD (RD 0.04, 95% CI 0.02 to 0.07; I2 = NA).
65.1. Analysis.

Comparison 65 TPM vs ZNS, Outcome 1 All Major Malformations.
65.2 Neural tube malformations
No included studies reported data on this outcome.
65.3 Cardiac malformations
No included studies reported data on this outcome.
65.4 Oro‐facial cleft/craniofacial malformations
No included studies reported data on this outcome.
65.5 Skeletal/limb malformations
No included studies reported data on this outcome.
66 VPA versus ZNS
66.1 All major malformations
Data from one study showed a significant outcome (RR 17.13, 95% CI 1.06 to 277.48; I2 = NA), with children exposed to VPA (N = 323) experiencing more major malformations than children exposed to ZNS (N = 90) (North American Register; see Analysis 66.1). This gave a significant RD (RD 0.09, 95% CI 0.06 to 0.13; I2 = NA).
66.1. Analysis.

Comparison 66 VPA vs ZNS, Outcome 1 All Major Malformations.
66.2 Neural tube malformations
No included studies reported data on this outcome.
66.3 Cardiac malformationsCardiac malformations
No included studies reported data on this outcome.
66.4 Oro‐facial cleft/craniofacial malformations
No included studies reported data on this outcome.
66.5 Skeletal/limb malformations
No included studies reported data on this outcome.
Random effects meta‐analysis
In the protocol we planned to undertake a random‐effects meta‐analysis when there was evidence of heterogeneity. However, many of the studies had zero events in one or both arms or had low event rates, and they were often substantially imbalanced. In such cases, it is best to avoid the DerSimonian and Laird random‐effects meta‐analysis (Higgins 2011). Nevertheless, there were only three comparisons where there was evidence of heterogeneity in the meta‐analysis of risk ratios for which a corresponding random‐effects meta‐analysis suggested a change in conclusion to a more conservative estimate of effect. These were:
PRM versus no medication (in women with epilepsy), all major malformations: fixed‐effect (FE): 2.81 (95% CI 1.13 to 7.02, P = 0.03); random‐effects (RE): 3.92 (95% CI 0.76 to 20.14, P = 0.10);
LEV versus PHT, all major malformations: FE: 0.49 (95% CI 0.26 to 0.92, P = 0.03; RE: 0.34 (95% CI 0.08 to 1.50, P = 0.16);
LTG versus TPM, facial cleft/craniofacial malformations: FE: 0.32 (95% CI 0.13 to 0.76, P = 0.010); RE: 0.22 (95% CI 0.03 to 1.56, P = 0.13).
There were only two comparisons where there was evidence of heterogeneity in the meta‐analysis of risk differences for which a corresponding random‐effects meta‐analysis suggested a change in conclusion, with a more conservative estimate of effect under a random effects model. These were:
LEV versus PHT, all major malformations: FE: −0.02 (95% CI −0.04 to −0.00, P = 0.05); RE: −0.03 (95% CI −0.06 to 0.01, P = 0.18) – also for risk ratio shown above;
VPA versus PB, neural tube malformations: FE: 0.04 (95% CI 0.01 to 0.06, P = 0.001); RE: 0.05 (95% CI −0.00 to 0.10), P = 0.07).
Studies not included in the meta‐analysis and not narratively reported
The publications of the Bozhinova 2009, Diaz‐Romero 1990, Dravet 1992, Gaily 1988, Goujard 1974; Hill 1974, Jones 1989, Laskowska 2002, Richmond 2004, Shapiro 1976, Sabers 2004, Torres 1995 and Wide 2000 did not report either the total number of exposed cases separating out monotherapy or polytherapy use for a particular AED, they did not provide a malformation rate for monotherapy treatments in isolation, or the number of children with malformations by AED monotherapy group was unclear. Therefore we could not include these studies in meta‐analysis, and they could not be reliably reported in a narrative format either. Israeli Teratogen Service showed variability in its reporting. Its paper on CBZ could be included in the meta‐analysis as the number of monotherapy cases in women with epilepsy were reported, whilst in this group's reports on valproate and topiramate, authors did not give details as to the number of monotherapy exposures to women with epilepsy and therefore required narrative reporting.
Minor congenital malformations
Thirteen studies collected data on minor anomalies (Hill 1974, Jones 1989, Steegers‐Theunissen 1994, Koch 1992, Garza‐Morales 1996, Froscher 1991, D'Souza 1990, Delmiš 1991, Yerby 1992, Gaily 1988, Diaz‐Romero 1990, Wide 2000, Barqawi 2005). However, in the publications of Hill 1974, Jones 1989, Steegers‐Theunissen 1994, Garza‐Morales 1996, D'Souza 1990, Delmiš 1991,Yerby 1992, Gaily 1988, Diaz‐Romero 1990, authors either did not report the monotherapy and polytherapy results separately, or the prevalence of minor malformations in isolation was unclear.
We report the limited available information pertaining to minor malformations below.
CBZ versus controls
Wide 2000 reported minor anomalies in 15/39 (38%) CBZ‐exposed infants, with the rate within the general population of control infants being 5/32 (16%), giving a significant OR of 11.0 (95% CI 1.42 to 85.2, P value not reported). Frequent minor anomalies within the CBZ‐exposed group included oro‐facial anomalies, digital anomalies, genital anomalies and skin anomalies. Barqawi 2005 reported a 25% prevalence of minor anomalies in their cohort exposed to CBZ (N = 16) compared with 0% in the control group (N = 18), with common anomalies including distal digital hypoplasia and ear flap abnormalities. Koch 1992 reported a mean rate of minor anomalies in the CBZ group (N = 9) to be 3.0 compared with 2.0 for the control group (N = 116).
PHT versus controls
Wide 2000 reported minor anomalies in 5/21 (24%) PHT exposed infants compared with 6/13 (46%) in controls, giving a non‐significant OR of 0.80 (95% CI 0.22 to 2.98, P value not reported). Koch 1992 reported a mean of 3.6 minor anomalies for the PHT exposed infants (N = 24) compared with control children (mean 1.91, N = 116).
VPA versus controls
Koch 1992 reported a higher mean number of minor anomalies (8.0) in the VPA exposed children (N = 14) compared with the control children (N = 116), whose mean was 2. Koch 1992 noted a pattern of minor anomalies in the VPA group, which included minor craniofacial, skeletal and genital anomalies.
CBZ versus PHT
Although not directly compared, the rates of minor anomalies in the study by Wide 2000 were 15/39 (38%) for children exposed to CBZ and 5/21 (24%) in PHT‐exposed children. Froscher 1991 reported a 12% prevalence rate of minor anomalies for children exposed to CBZ (N = 31) compared with 0% in five children exposed to PHT. Similar means for minor anomalies were reported by Koch 1992 for the children exposed to CBZ (N = 9) and those exposed to PHT (N = 24): 3.0 and 3.6, respectively.
CBZ versus VPA
Froscher 1991 reported a 12% prevalence of minor anomalies in children exposed to CBZ (N = 31) compared with 25% of children exposed to VPA (N = 12). Although investigators did not report the statistical significance, Koch 1992 reported a higher mean rate of minor malformations (8%) for the children exposed to VPA (N=14) compared with those exposed to CBZ (N = 9), where the rate was 3%.
Discussion
Summary of main results
Table 2 provides a summary of the meta‐analysis for all comparisons for risk of major congenital malformation.
Carbamazepine
CBZ was the most frequently investigated AED both in terms of the number of publications and the number of included pregnancies. The pooled major malformation prevalence was 4.93%, once variation between the studies had been taken into consideration. In comparison to both children born to women without epilepsy and children born to women with untreated epilepsy, children exposed to CBZ in utero had an increased risk of having a major malformation, with the difference in risk ranging from 1% to 2%. The level of increased risk compared with control children is consistent with the findings of a case‐control study that reported a similar increase in risk of major malformation following exposure to CBZ in utero (Jentink 2010b), but it is inconsistent with the result of another linking electronic healthcare datasets (Artama 2005). however, there were only 805 carbamazepine monotherapy‐exposed participants in the Artama study, and this could account for the difference in findings.
Data were limited in terms of the specific malformation risk in comparison to control children, mainly due to the absence of control data from some of the large registry studies (e.g. North American Register; UK Register). This limitation likely contributed to the non‐significant outcomes across the specific malformation types of neural tube, cardiac and skeletal/limb. There was a significant association between CBZ and oro‐facial malformations when compared to children born to women without epilepsy, but this finding did not hold when we calculated the RD. Reports have associated CBZ with an increased risk of neural tube malformations (Jentink 2010b), but analysis here is too limited to support or refute this compared with control children.
In comparison to the other AEDs, CBZ led to a 1% higher rate of major malformation in exposed children than LEV or LTG. No significant levels of difference were found in terms of the risk estimates compared with OXC, PB , GBP, PRM, TPM, PHT or ZNS for overall malformation risk. Finally, children exposed to CBZ had a significantly lower risk of overall malformation than the children exposed to VPA, with the risk being 5% lower if exposed to CBZ rather than VPA.
In terms of specific malformation risk, we did not find any difference between the children exposed to CBZ and those exposed to LEV or LTG, despite the increased overall major malformation rate. This may be due to the limited amount of data available currently pertaining to specific malformation types. Children exposed to CBZ had a 2% lower risk for cardiac malformations than the children exposed to PB, but there was no difference in risk for other types of malformation. Children exposed to CBZ had a lower risk of oro‐facial cleft and craniofacial malformation compared with the children exposed to TPM, but this finding did not hold when we analysed data as an RD, which takes into account data with no reported events. In comparison to children exposed to VPA, the children exposed to CBZ were at a lower risk of neural tube malformations. Interestingly, both of these medications have been associated with an increased prevalence of neural tube malformations (Jentink 2010; Jentink 2010b); however, data here highlight that the risk with VPA is 2% higher than it is with CBZ. Children exposed to CBZ also had a 1% a lower risk of cardiac malformations, oro‐facial cleft and craniofacial and skeletal or limb malformations in comparison to VPA‐exposed children. Finally, we found no difference in terms of specific malformation rate between children exposed to GBP, PRM, OXC, PHT or ZNS, but caution is warranted due to the small numbers in these comparisons.
A large number of included studies did not investigate dose of CBZ and its relationship with malformation prevalence, despite dose being a key feature of a teratogen (Brent 2004). Data from EURAP and the UK Register reported an association between CBZ and malformation risk with the prevalence increasing from 1.9% up to 8.7% at doses greater than 1000 mg daily. Other studies failed to find an association with dose (e.g. Australian, North American Register as well as a number of smaller studies); however, it is worth noting that EURAP and the UK Register both scored relatively well on the 'Risk of bias' assessment and included larger numbers of CBZ‐exposed pregnancies than other studies.
Gabapentin
Experience with GBP exposure in pregnancy was limited to fewer than 200 reported pregnancies. The pooled prevalence of major malformation was 1.47%. We found no difference between the children exposed to GBP compared with either type of control group, but caution is warranted to due to limited numbers. There were no data available in terms of specific malformation risk compared with either control group.
We found no difference in overall malformation rate or in the specific malformations investigated for the children exposed to GBP compared to CBZ, LTG, LEV, OXC, PHT, TPM and ZNS, but there were very limited data. In comparison to the older medications such as PB, data were limited to a single study; it found that children exposed to GBP had a lower risk of overall malformation compared with the children exposed to PB. Data were too limited to investigate specific malformation type between these two medications. In comparison to the children exposed to VPA, children exposed to GBP in utero had a significant, six‐fold lower risk of having a malformation than children exposed to VPA, with the risk difference of 8%. No differences were found between these two medications in terms of specific malformation type; however, only one study contributed data.
Only North American Register investigated a possible association between dose of GBP and malformation rate, and the study failed to find an association. Numbers were small, however, so it is unclear whether increasing doses of GBP are associated with an increased rate of malformations.
Lamotrigine
Use of LTG has increased over the last decade in women of childbearing age (Ackers 2009; Man 2012; Meador 2009; Wen 2015). The majority of evidence indicated no difference in the overall malformation rate between the children exposed to LTG and either type of control group, with the majority of evidence coming from pregnancy registries. A finding of no association is consistent with other studies using population‐based electronic health records (Mølgaard‐Nielsen 2011). Further, we found no increase in any of the specific malformation types investigated in the LTG‐exposed groups; however, data were limited within the specific malformation analyses. North American Register had reported an association between LTG and oro‐facial clefts, but updated data from that register and pooled data here do not support this association in comparison to control children.
In comparison to LEV, which has also seen a significant increase in use in women of childbearing age (Meador 2009; Wen 2015), there were no significant differences for either overall malformation rate or the specific malformation types investigated. Children exposed to LTG also did not differ either in terms of overall malformation rate or in terms of specific malformations compared with children exposed to OXC, GBP and ZNS, although data were limited for all of these AEDs.
The children exposed to LTG were at a significantly lower risk of overall malformation compared with children exposed to CBZ, with a significant risk difference of 1%. Analyses at the specific malformation level, however, revealed no significant differences between the children exposed to LTG and CBZ for each of the specific malformations investigated. This is possibly due to reduced sensitivity to detect such rare outcomes, as numbers of included children were relatively small. In comparison to TPM, the children exposed to LTG were at a lower risk of overall malformation and specifically skeletal and limb malformations; however, the risk difference was not significant and further data is needed to confirm this possible association. Data were limited compared with children exposed to PB, but the children exposed to LTG were at a significantly lower risk for overall malformation risk; with the risk being 4% lower. Children exposed to LTG had a 2% lower risk of cardiac malformations compared with the children exposed to PB. Children exposed to LTG were also at a significantly lower risk of oro‐facial cleft or craniofacial malformations compared with children exposed to PB, but the risk differences were not significant. The prevalence of malformations of any type was lower for the children exposed to LTG compared with children exposed to PHT, with the risk being 2% lower. Cardiac malformations and skeletal or limb malformations were also significantly less likely in the children exposed to LTG compared with those exposed to PHT; however, the risk differences were not significant for these comparisons. Finally, children exposed to LTG had a three‐fold lower risk of overall malformation when compared to the children exposed to VPA, with a risk difference showing that the significant reduction in risk was 6% for children exposed to LTG. Neural tube, cardiac, oro‐facial cleft and craniofacial and skeletal and limb malformations were all significantly lower for the LTG‐exposed children, with the reduction in risk ranging from 1% to 2%.
The large, well‐designed EURAP study has demonstrated a dose relationship between LTG treatment and malformation risk, with exposures to LTG under 300 mg/d associated with a malformation prevalence of 2.0%, whilst daily doses above this level were associated with a prevalence of 4.5%. Other studies did not find a dose relationship, however (Australian; North American Register; UK Register), and therefore further work is required before drawing conclusions regarding an association with dose.
Levetriacetam
Despite the now widespread use of LEV in women of childbearing age (Meador 2009; Wen 2015), the frequency of data and the number of included pregnancies exposed to LEV were limited. This delay is likely due in part to the time it takes for adequate numbers of women taking newer AEDs to accumulate, and it is of note that all the data on LEV comes from the national and international registries; indicating that collection on a national or international scale may speed up the availability of information on newer AEDs. The limited experience with this drug in pregnancies is also seen in the large population‐based electronic health record studies (Mølgaard‐Nielsen 2011).
The pooled prevalence for malformations following LEV exposure was 1.77%. There was no significant difference between the children exposed to LEV and control children in the meta‐analysis for overall malformation rate, which is consistent with the findings of others (Mølgaard‐Nielsen 2011). Data pertaining to specific malformation types in comparison to control children were extremely limited, and it is not possible to draw conclusions until more data is available.
In comparison to other AED treatments, children exposed to LEV were not significantly different from children exposed to LTG in terms of overall malformation prevalence or the specific malformation types investigated. In addition, we found no significant difference between children exposed to LEV compared with those exposed to GBP, OXC, PHT or ZNS, although data within these comparisons were limited. Children exposed to LEV had a lower overall malformation rate than the children exposed to CBZ, but there was no difference in terms of the specific malformation types investigated. There was also a significantly lower malformation risk in comparison to children exposed to TPM; however, the risk difference for this overall comparison was not significant. Children exposed to LEV had around a 1% lower risk, however, of having an oro‐facial cleft or craniofacial malformation in comparison to the TPM‐exposed children. Children exposed to LEV had a significant, four‐fold lower risk of overall malformation than the children exposed to PB, but the risk difference was not significant. Finally, children exposed to LEV had a 7% lower risk of overall malformations compared with the children exposed to VPA.
Investigation between dose of LEV and malformation outcome was limited by numbers included within the individual studies (i.e. North American Register; UK Register); to date no study has reported evidence of a dose effect for LEV, but further data is required before drawing conclusions.
Oxcarbazepine
Data for pregnancy outcomes following exposure to OXC were limited to just over 200 pregnancies; we calculated the prevalence of major malformation to be 2.39%. There was no significant difference in malformation risk compared with control children; however, outcome data were limited, and no information was available about the risk of specific malformations. Mølgaard‐Nielsen 2011 also failed to find a significant association between OXC exposure (N = 393) and increased malformation rate in comparison to controls using a population‐based electronic health record study design.
In limited comparisons to other AEDs, there was no significant difference or no available data between the overall malformation rate or the specific malformations investigated compared with children exposed to CBZ, LEV, LTG, PHT, PRM, TPM, and ZNS. Children exposed to OXC were at a significantly lower risk of having a major congenital malformation of any type compared with children exposed to VPA, with the risk difference being 8%.
There were very limited data pertaining to specific malformation types, and caution is required. Children exposed to OXC had a significantly lower rate of cardiac malformation compared with the children exposed to PB, with the risk difference indicating that risk was 3% lower for the children exposed to OXC. Limited data pertaining to specific malformation types did not show a significant difference, however, between the children exposed to OXC and those exposed to VPA.
None of the included studies investigated dose of OXC and malformation rate; therefore it remains unknown whether higher doses of OXC are associated with an increased rate of malformation.
Phenobarbital
Despite years of PB use, data from prospective studies investigating PB as monotherapy were surprisingly limited. Data pooled from included studies generated a major malformation prevalence of 7.10%. We found a significantly increased risk of overall malformation compared with children born to women without epilepsy, with a risk difference of 4%. We found no significant difference compared with children born to women without epilepsy. Data pertaining to specific malformations were extremely limited or missing and likely contributed to the non‐significant differences found. This is certainly the case for cardiac malformations where, as noted below, rates compared with other AEDs indicate a specific increased risk of cardiac malformations in PB‐exposed children across comparisons, which was not documented within the limited data compared with control children.
In comparison to other AEDs, children exposed to PB were not at a significantly increased rate of overall malformation compared with children exposed to CBZ, PHT, OXC, TPM, PRM and ZNS. There was a significant increase in the prevalence of malformations between the children exposed to PB and the children exposed to LEV and GBP; however, the risk differences were not significant, and further investigation is required. Finally, a significantly increased risk of malformations was found for the PB‐exposed children compared with the children exposed to LTG, with the level of risk being increased by 4%. In contrast, the rate of malformations was significantly lower for the children exposed to PB compared with the children exposed to VPA, with the risk being 4% lower.
PB was associated with an increased risk of cardiac malformations compared to CBZ, LTG, PHT and OXC, with the increase in risk falling between 2% and 3%. There was also an increased risk in comparison to children exposed to LEV or TPM, but the RDs were not significant, and further data are required. PB was also significantly associated with an increased risk of oro‐facial clefts and craniofacial malformations when compared to LEV or PHT, but again, the RD analyses were not significant and further data are required to draw conclusions. Finally, children exposed to PB were at a significantly lower risk of neural tube malformations compared with children exposed to VPA, with the risk being reduced by 4%. There was no difference in terms of cardiac malformations in comparison to VPA, a drug also associated with an increased risk of cardiac malformations.
The majority of studies did not investigate or report on a potential relationship between dose to PB and malformation risk. However, EURAP found an increased rate of overall malformations in children exposed to PB (5.4% for exposures < 150 mg/d versus 13.7% for exposures > 150 mg/d). A dose‐mediated risk was also apparent for cardiac malformations, with the prevalence increasing from 1% to 8% for doses < 150 mg/d and those > 150 mg/d, respectively. Kaneko 1999 also found a dose effect for PB; however, North American Register and Samren 1997 did not. Dose is a key principle of teratogenic risk (Brent 2004), and although a dose effect is unclear, it should be considered a possible factor to PB‐associated malformations.
Phenytoin
The pooled prevalence of major malformation in the PHT‐exposed children was 6.26% once variation between the studies had been taken into consideration, which is consistent with that reported by other studies (Wide 2004). The children exposed to PHT were at a significantly increased risk in comparison with both types of control group, with the difference in risk ranging from 2% to 4% depending on the nature of the control group. However, we found no association between PHT and specific malformation types, although data were limited in these comparisons due to the limited control data.
In comparison to other AEDs, children exposed to PHT were not at an increased risk of overall malformation or the specific malformation types investigated compared with children exposed to CBZ, GBP, OXC, TPM, PRM, PB or ZNS; however, data comparing PHT with the 'newer' AEDs were limited. Children exposed to PHT were at an increased risk of overall malformation compared with children exposed to LTG, with the risk difference indicating a 2% increase in malformation. The children exposed to PHT were at a greater risk of malformation in comparison to children exposed to LEV; however, there were high levels of heterogeneity between the included studies, and the random‐effects modelling failed to uphold the significance of this result. In contrast, the children exposed to PHT were half as likely to have a malformation than the children exposed to VPA, with the difference in risk being 5%.
In terms of specific malformations, children exposed to PHT were less likely than those exposed to PB to be born with a cardiac malformation, with risk differences indicating that the risk was 3% lower. We found a significant RR favouring PHT when comparing PHT and PB in terms of oro‐facial malformations; however, the RD was not significant and more data are required. There was no difference between these two medications in terms of skeletal or limb malformations or neural tube malformations. There was a noted increase in cardiac and skeletal and limb malformations for the PHT exposed children compared with those exposed to LTG when measured as an RR; however, the RD was not significant. Rates of neural tube and cardiac malformations were significantly lower for the children exposed to PHT in comparison the to VPA‐exposed children, with the risk found to be 2% lower for the PHT exposed children.
The majority of studies did not report on whether the risk of being born with a major malformation was associated with dose of PHT; however, those that did investigate such an association do not show a consistent pattern. Kaaja 2003, Motherisk Registry and North American Register all failed to find an association between dose and outcome; however, Kaneko 1999 and Samren 1997 did, therefore the conclusion around dose effects is uncertain.
Primidone
Evidence pertaining to PRM was extremely limited to under 200 pregnancies and caution is warranted when interpreting results. Pooled data from included studies gave a malformation prevalence of 8.49%. There was no difference in the malformation rate compared with either control group once the significant levels of heterogeneity had been taken into account.
There were no data comparing malformation outcomes in children exposed to PRM compared with GBP, LEV, LTG, TPM, OXC and ZNS. In comparison to the children exposed to CBZ, PHT, PB or VPA, there was no difference in overall malformation rate or in terms of specific malformations, but data were limited.
Only the study of Kaneko 1999 investigated dose of PRM and outcome, and it only included 19 PRM cases. Therefore it remains unknown as to whether there is an association between PRM dose and increased malformation risk.
Topiramate
Experience with TPM was limited to fewer than 500 pregnancies, therefore caution is required when considering our results. The prevalence of malformation within included studies was 4.28%. In comparison to children born to women without epilepsy, children exposed to TPM had a three‐fold higher rate of being born with a malformation with the risk difference being 3%. We found no significant difference compared with the no medication control group, but this comparison had even fewer TPM cases (N = 115). The Mølgaard‐Nielsen 2011 database study failed to find a significant difference in the malformation rate of 108 TPM exposed infants in comparison to control children. Data were too limited here to allow for the investigation of specific malformation outcomes in comparison to control children, mainly due to a lack of data pertaining to controls from two of the main pregnancy registers (North American Register; UK Register).
We found no significant level of difference in rate of malformation compared with children exposed to CBZ, GBP, PHT, PB, PRM, OXC and ZNS. We found a significant increase in the rate of malformation for the children exposed to TPM compared with the children exposed to LTG or LEV; however, the risk differences failed to reach significance, so caution is required. The children exposed to TPM were less likely to have a malformation of any type compared with the children exposed to VPA, with the difference in risk being 5%.
In terms of specific malformation types, children exposed to TPM were at a significantly increased risk for an oro‐facial cleft or craniofacial malformation compared with children exposed to CBZ or LEV; however, only the comparison to LEV yielded a significant risk difference of 1%, and data were limited. There is evidence of an association between topiramate and oral clefts from insurance database studies (Mines 2014), in a case‐control study (Margulis 2012), and in a previous meta‐analysis (Alsaad 2015), so the failure to obtain a consistent finding here may be due to the limited data currently available from prospective observational studies in isolation. In comparison to children exposed to LTG, those exposed to TPM were at an increased risk of skeletal and limb malformations, although the risk difference was not significant, and further data are required. In contrast, children exposed to TPM had a significantly lower risk of cardiac malformations than the children exposed to PB, although again the risk difference was not significant. Consistently, the risk of cardiac malformations was also significantly lower in the TPM‐exposed children compared with the children exposed to VPA, with a difference in risk of 2%.
No evidence of a dose association was found; however, date were limited and further experience with TPM exposure in utero is required.
Valproate
In utero exposure to VPA and its possible association with an increased teratological risk has been discussed in the literature since the 1980s, when the first case reports emerged documenting children with a specific constellation of malformations following exposure to VPA (Ardinger 1988; DiLiberti 1983). Larger cohorts such as EURAP and data from population‐based electronic healthcare records (e.g. Artama 2005; Wide 2004) as well as the pregnancy registries and observational studies included here, have all provided evidence to confirm that VPA is a human teratogen.
In the meta‐analyses reported here a consistent pattern emerged: children exposed to VPA were at an increased risk of both a higher overall malformation risk and risk of a specific malformations including neural tube, cardiac, oro‐facial cleft and craniofacial and skeletal and limb malformations. The prevalence of major malformation following exposure to VPA in the womb was 10.93%, once variation between the studies had been taken into consideration. Children exposed to VPA were at an increased risk of being born with a malformation compared with both the children of women without epilepsy and the children of women with untreated epilepsy, with the risk difference being 8% and 6% compared with the respective control groups. Analysis of the risks associated with VPA treatment at the specific malformation level was limited by a lack of control data; however, children exposed to VPA remained at a significantly increased risk for neural tube, cardiac and skeletal malformations compared with control children.
In comparison to other AEDs in the meta‐analyses reported here, children exposed to VPA were at an increased risk of malformations compared with children exposed to CBZ, GBP, LEV, LTG, TPM, OXC, PB and PHT, with risk estimates ranging from a two‐fold to six‐fold increase. The risk differences ranged from 4% to 8% depending on the comparator AED.
At the specific malformation level, children exposed to VPA were at an increased risk of neural tube malformation compared with the children exposed to CBZ, LEV, LTG, PB and PHT, with the increases in risk ranging from 1% to 4%. We did not note any increase compared to children exposed to GBP, OXC or TPM, but this could be due to limited data. Similarly, we found an increased rate of cardiac malformation compared to CBZ, LEV, LTG, TPM, PHT, with the risk difference ranging from 1% to 2% depending on the comparator AED. We found no difference in the risk of cardiac malformations for VPA compared to PB; however, as noted above, this AED also appears to be associated with an increased risk of cardiac malformations. Oro‐facial cleft and craniofacial malformations were also significantly more common in the children exposed to VPA compared with children exposed to CBZ, LEV and LTG, with risk differences being 1%. There was no difference in the rate of oro‐facial cleft or craniofacial malformations compared with TPM, PB or PHT. Finally, skeletal or limb malformations in children exposed to VPA compared with children exposed to CBZ, LEV or LTG were significantly higher. All specific malformation comparisons the data compared with GBP, ZNS and OXC were too limited for conclusions to be made.
Data reported in the meta‐analysis were consistent with the reports reviewed narratively and the findings of studies not eligible for inclusion in the review due to their design (Artama 2005; Jentink 2010; Wide 2004). We therefore conclude that prenatal exposure to VPA is associated with a significant increase in risk for a wide range of malformations. Further, when weighing up the risks and benefits of VPA treatment, the effects of VPA on the developing brain should also be considered, as VPA is now also recognised as a neurobehavioural teratogen, with implications for the future cognitive functioning of the exposed child (Bromley 2014).
More than any other AED, studies have reported dose associations with level of risk for VPA (Australian; Canger 1999; Fairgrieve 2000; Israeli Teratogen Service; Kaneko 1999; Lindhout 1992; Mawer 2010; North American Register; Samren 1997; UK Register). The largest data set with clear dose comparisons is the EURAP collaboration, which finds that the prevalence of major congenital malformations increases from 5.6% at doses < 700 mg daily to 24.2% for doses > 1500 mg daily. Interestingly, Australian reports a decrease in the mean dose for new registrations and have noted that this is associated with a reduction in the number of observed cases of neural tube malformations.
Zonisamide
Expereince with ZNS exposure was limited to 90 cases described in a single publication (North American Register), therefore it is not possible to draw conclusions at this time. Further efforts are needed to develop experience with this medication in pregnancy.
Other antiepileptic drugs
No data were found pertaining to AEDs such as ethosuximide, sulthiame, lacosamide or vigabatrin.
Overall completeness and applicability of evidence
Data were limited for the risk of specific types of malformations, due in a large part to the failure of included studies to publish specific malformation outcomes. Whilst this is undoubtedly due to publication space, providing such information is critical for understanding the risks associated with specific malformation types. As demonstrated in the case of PB, an AED may be associated with a constellation of specific malformations, so reporting only an overall malformation figure may mask important associations. The completeness of data was further challenged due to authors not reporting data for rarer malformation types, for less commonly used AEDs and by the larger registers not reporting specific malformation data for control children (North American Register; UK Register); these factors limited the analysis that we could undertake. Further, unclear reporting also meant that we could not investigate hypospadias, which has been linked to certain AED exposures (Wide 2004), as it was unclear if the included studies had limited their data specifically to males.
A few points of heterogeneity were found between included studies, which may limit the completeness of the evidence. Studies varied in how they dealt with the inclusion of foetal deaths (with and without malformations) and in whether they counted genetic causes of malformation in their overall prevalence. At the outset of this review, we decided to use the author‐defined malformation rate, as the review authors would be unlikely to have all the data required to determine information about reported malformations. Considering this however, we cannot confirm that all the studies applied the same criteria for classifying a major congential malformation. Further, there were differences between studies in the time at which the outcome was reported. For example, the UK Register has a malformation reporting time before three months of age, whilst others included malformation presence at birth (e.g. Bozhinova 2009). Data from the EURAP collaboration demonstrates that the reviewing of malformation outcome at 12 months of age leads to an increased detection and therefore higher prevalence. Thus data reported from some studies may in fact be an underestimation of the prevalence of major malformations if the assessment of the child occurs prior to 12 months of age. A further challenge to the completeness of the evidence was that the use of data in meta‐analysis was limited in a number of cases by reporting issues. One of the most common limitations came in the form of studies not reporting specific monotherapy outcomes or reporting monotherapy and polytherapy outcomes for a particular AED together (e.g. Sabers 2004). In certain cases, we were able to extrapolate prevalence of malformations for specific monotherapy treatments, but in others this was not possible.
The way in which some ongoing pregnancy registries update their results meant that we often had to take outcomes for different AEDs from a number of different papers, or that authors investigated malformation types separately over different papers. For example, Kerala Pregnancy Registry had published more recently on cardiac malformations in isolation and therefore substantially larger numbers were available for investigations into cardiac malformations than for overall malformation rates or rates of other specific malformation types. Similarly, UK Register recently published outcomes pertaining to LTG, VPA, CBZ and in a separate publication LEV, without updating malformation prevalences for other AEDs such as PHT or TPM.
The completeness of data is also limited by the significant lack of data pertaining to the secondary outcome of minor malformations. Few included studies reported such outcomes, and the major pregnancy registries in particular limit their outcomes to major malformations only. Minor malformations are an important part of the diagnostic criteria for teratogens generally and foetal anticonvulsant syndromes in particular (Dean 2000). A constellation of minor anomalies associated with specific exposures provide clinicians with key diagnostic markers, and their presence may lead to a more detailed physical examination to check for more severe physical symptoms of exposure or neurodevelopmental impairment.
In addition to the limitations with the data, this review has a number of limitations itself. One important limitation is the exclusion of studies using large population‐based electronic healthcare datasets (e.g. the Swedish Birth Register) and the exclusion of malformation registers (e.g.Artama 2005; Wide 2004). We decided to exclude these study designs from our review due to the potential difficulties in combining the data from these methods with those from the observational studies included. In particular, there are problems ascertaining timing of exposure and dose with these studies (Charlton 2014; Wide 2004), and there is a suggestion that they may be at risk of underreporting the malformation rate (Charlton 2008). We also excluded case‐control malformation registers that record children with and without malformations . In these registers, children are enrolled once the outcome when the presence or absence of a malformation is known, and therefore we classified recruitment as retrospective (e.g. Jentink 2010; Jentink 2010b). Further, the nature of this data meant that it could not be directly combined into meta‐analysis with the data from the prospective observational studies.
Strengths of this review include, the creation and advance publication of the review protocol, the clear inclusion criteria, extensive searches, the acquisition of unpublished data, the inclusion of articles not written in English, meta‐analysis for all possible comparisons, the consideration of specific as well as overall malformation risk, the balance of both systematic reviewing and content expertise and the assessment of risk of bias and quality in the non‐randomised evidence. Under the Cochrane guidelines this review will be updated every two years, or following the publication of a significant amount of new data, to ensure it remains up to date which adds further strength.
Quality of the evidence
Randomised controlled trials are thought to be unethical in this area due to the permanence of potential adverse effects for the foetus. Gold standard evidence for this area would therefore comprise of data coming from a prospective, blinded cohort studies using statistical methods to limit the influence of confounding variables. The methodological quality for each study is displayed in the Characteristics of included studies tables. Only one study was an RCT, which contained no information on the randomisation process. All other included studies were non‐randomised observational studies, and hence were rated as high risk on the randomisation sequence and allocation concealment domains. The included studies varied in their approach to controlling confounding variables, a key issue in non‐ randomised studies. Blinding rarely occurred in the larger register based studies due to their reliance on family doctors to report the outcomes over large populations. Whilst the size of the populations which registers can recruit should be considered their strength the failure to blind should be considered a potential source of bias. Concerningly, a larger number of the included studies did not mention whether or not outcome assessors were blinded. The majority of studies scored low risk in terms of selective reporting but few were able to provide protocols to the review team to ensure this. Attrition was rated as low risk for the majority of studies. The majority of studies were found to have one or more aspects of additional bias. For example, many of the studies did not indicate the upper level of gestational age for recruitment or whether children with genetic syndromes had been excluded from the malformation prevalence; things which may have been deduced if protocols had been made available. A comprehensive understanding of how the majority of studies were designed and undertaken was not possible due to the limited number of protocols received. This undoubtedly impacted on the risk of bias judgements.
In conclusion, our risk of bias review indicates that across the included studies there are number of important biases assessed as high risk which should be taken into account when interpreting the results. The biases however, were balanced across the AEDs investigated and therefore it is not felt that the finding that VPA is associated with a higher risk of major congenital malformation in comparison to other AEDs is due to these biases.
Potential biases in the review process
Review authors RB and JCS were authors on two included studies (Mawer 2010; Meador 2006). This potential bias was reduced by delegating data extraction and risk of bias assessments to two other review authors.
Agreements and disagreements with other studies or reviews
Despite a large number of review articles in this area there are few systematic reviews where meta‐analysis has been conducted and, where they have been completed, the inclusion criteria have varied, particularly with respect to study methodology. The review by Meador 2008 for example, included both prospective and retrospective studies, studies using population‐based electronic healthcare records as well as data from case‐control studies. Whilst this lead to increased numbers of included pregnancies within the meta analysis, the comparability of data from these different methodological types is unclear and caution is warranted over including data from such diverse methodologies as Charlton 2008 found lower rates of malformation reporting from the UK Clinical Practice Research Database in comparison to the UK Epilepsy and Pregnancy Register. In total the Meador 2008 review included 59 studies involving 65,533 pregnancies to women with epilepsy. Despite differences in methodologies the findings of the review here are consistent with this previous review in that VPA was associated with the largest risk for major congenital malformation with the prevalence being 10.7% (95% CI 8.16 to 13.29). Consistent with data here, the prevalence for malformation following exposure to CBZ was lower (4.62%, 95% CI 3.48 to 5.76), as was that for PHT (7.36%, 95% CI 3.60 to 11.11), PB (4.91%, 95% CI 3.22 to 6.59) and finally for LTG (2.91%, 95% CI 2.00 to 3.82). Further consistent findings were reported by Jentink 2010b who found the prevalence of malformation following CBZ to be 3.3% based on 2680 CBZ children from eight studies. In contrast to the review here, Jentink 2010b found a significant associated between CBZ exposure and spina bifida, however this is not replicated here compared with control children or children exposed to other AEDs, with current available data. Similarly, Jentink 2010 found, based on eight studies and 1565 VPA exposed pregnancies, the prevalence to be 7.5% (95% CI 6.3 to 9.0) for pregnancies exposed to VPA and noted an increase in terms of specific malformations which is also found here.
The data reported here pertaining to LEV is consistent with a previous systematic review (Chaudhry 2014) who included the three prospective studies reported here (Australian; North American Register; UK Register) as well as studies utilising other methodologies and reported a prevalence rate of 2.2% (27/1213, 95% CI 1.53 to 3.22).
Analysis here did not however consistently replicate the reported association between TPM exposure and oral clefts. In a previously completed meta‐analysis Alsaad 2015 had a wider inclusion criteria which included 3420 patients taking TPM (mixed etiologies) and 1,204,981 controls and reported a significant odds ratio (OR 6.26, 95% confidence interval: 3.13 to 12.51). As noted throughout this discussion, data were limited pertaining to the newer AEDs and by the reporting of specific malformations in included studies and therefore it is possible that limited data contributed to this meta‐analysis not consistently upholding this association across all comparisons.
Finally, it is now also known that VPA exposure is associated with neurodevelopmental delays which may have lifelong implications for the exposed child; a topic covered in a linked Cochrane review (Bromley 2014). The findings of this review in partnership with the Bromley 2014 review highlight the wide range of risk associated with exposure to VPA in the womb.
Authors' conclusions
Implications for practice.
There is consistent evidence that prenatal exposure to VPA increases the risk of having a child with a major congenital malformation with the increase in risk covering neural tube, cardiac, skeletal and limb and oro‐facial cleft and craniofacial malformations.
Exposure to CBZ is associated with an increased risk of malformations but to a lesser extent than VPA. The risk with PB appears to be related specifically to cardiac malformations in comparison to other AEDs. Finally, no increase risk of malformation is found for LTG or LEV compared with controls and more favourable outcomes are found for the child compared with VPA and other AEDs. Whilst the RDs for comparisons not including VPA may appear relatively small at around1‐2%, the importance of a cardiac or neural tube defect on the individual child and family should be considered. Also, at a societal level a 1% increase in malformation rate will result in significantly more affected children born each year which represents a significant cost to health and educational services.
Given the variance in outcome data pertaining to the malformation risk associated with a individual treatment the primary implication for practice is that counselling should be tailored to the individual treatment and its dose. Although traditional counselling has been that 90% of children born to women with epilepsy have healthy children, this simplifies a complex set of data. The dose of AED and considerations regarding specific malformation types should also be central to counselling. It is also important to highlight that whilst major malformations are likely to represent the more severe end of a continuum of effect, minor malformations can still result in health problems and impact on quality of life. Finally, the limited data about the newer AEDs should be discussed with women planning a pregnancy or who are in the childbearing years. Absence of risk data should not imply lack of risk.
Implications for research.
The role of the clinician and women with epilepsy working together to improve the evidence base should be considered and the collection of data should be embedded in routine practice enabling pregnancy registers and other study designs.
Whilst research methodologies have become more refined over the years there are still a number of limitations in the data which could be addressed in future research. Firstly, the reporting of an overall malformation figure is, as demonstrated above for PB, unlikely to be the most reliable measure of risk and where data is large enough to allow, prevalences pertaining to specific malformation types should be investigated and reported. To facilitate this, all studies however large or small should provide information on specific malformation types to aid future meta‐analyses and generation of risk estimates. Secondly, registries and reporting clinicians should be encouraged to use the standardised phenotypic terms which are now used in recognised phenotype ontologies such as the Human Phenotype Ontology (HPO) (http://human‐phenotype‐ontology.github.io/about.html). This will not only allow more accurate comparison across studies but analysis of the computational codes attached to HPO terms can also indicate similarities in underlying genomic pathways involved in aetiology and direct further investigation. Thirdly, treatment dose should also be considered a central aspect of reporting given its key feature of human teratogens (Brent 2004) and as highlighted by the dose mediated risk documented for VPA. The advice which may be given to an individual female on VPA would likely be very different depending on her dose. The studies which did investigate the relationship between dose and outcome used varying cut offs and therefore comparisons across studies was difficult. In the future research groups should look to standardise dose categories to enable uniform reporting. Fourthly, all data should be reported for the control groups, even if just in tabular format to aid future meta‐analysis.
The fifth recommendation would be that observations have shown that some women who take AEDs, even at a very low dose, appear to be at higher risk of having a child with an AED‐associated malformation. Further research focusing on identification of genomic variants which might modify how different women metabolise AEDs is crucial so that those who may be at higher risk of having a child with a malformation, even taking a lower dose of a specific AED, can be identified. Whilst this has proven difficult in the past, whole exome/genome sequencing, with careful selection of individuals for testing is likely to make this more achievable (Ku 2011).
Finally, there is a clear trend that data for newer drugs is coming from the large national registers. This is not surprising given the time it can take for cases in individual hospitals to accumulate. The continued existence of these registers are of central importance to the generation of information to inform preconceptual counselling and efforts to increase reporting to such registers should be undertaken at a clinician and regulatory level.
What's new
| Date | Event | Description |
|---|---|---|
| 26 April 2017 | Amended | Declarations of interest section updated. |
Acknowledgements
The authors would like to thank Rachael Kelly, Barbara Kreilkamp, Sarah Nolan, Silviya Balabanova, William Nevitt, Gabriela Czanner, Sandra Peternel, Esther van Zuuren, Krzysztof Lach, Mariangela Pannebianco, Asaf Achiron, Kiyomi Shinohara, Masi Perez, Antione Wolff and Dora Lozsadi for their help with the translation of articles. The authors would also like to thank Alexandra Rigby for author support and the authors who provided additional clarification or unpublished data.
Funding
•National Institute for Health Research, UK. This review was supported by the National Institute for Health Research, via Cochrane Infrastructure funding to the Epilepsy Group. The views and opinions expressed therein are those of the authors and do not necessarily reflect those of the Systematic Reviews Programme, NIHR, NHS or the Department of Health.
• National Institute for Health Research, UK. This report is independent research supported by the National Institute for Health Research (Post Doctoral Fellowship, Dr Rebecca Bromley, PDF‐2013−06−041). The views expressed in this publication are those of the author(s) and not necessarily those of the NHS, the National Institute for Health Research or the Department of Health.
Appendices
Appendix 1. Search strategy for Cochrane Epilepsy Group's Specialized Register
#1 MeSH DESCRIPTOR Pregnancy Explode All
#2 MeSH DESCRIPTOR Pregnancy Complications Explode All
#3 MeSH DESCRIPTOR Prenatal Exposure Delayed Effects Explode All
#4 fetal or foetal or fetus or foetus or prenatal or pregnant or pregnanc*
#5 newborn or infant
#6 MeSH DESCRIPTOR Teratogens Explode All
#7 teratogen*
#8 in NEXT utero
#9 "intra uterine" or intrauterine
#10 MeSH DESCRIPTOR Fetal Development Explode All
#11 MeSH DESCRIPTOR Infant, Newborn Explode All
#12 birth maternal
#13 #1 OR #2 OR #3 OR #4 OR #5 OR #6 OR #7 OR #8 OR #9 OR #10 OR #11 OR #12
Appendix 2. Search strategy for CENTRAL (The Cochrane Library)
#1 MeSH descriptor Pregnancy explode all trees
#2 MeSH descriptor Pregnancy Complications explode all trees
#3 MeSH descriptor Prenatal Exposure Delayed Effects explode all trees
#4 (fetal OR foetal OR fetus OR foetus OR prenatal)
#5 (newborn OR infant)
#6 MeSH descriptor Teratogens explode all trees
#7 (teratogen*)
#8 (in NEXT utero)
#9 (intra uterine) or (intrauterine)
#10 MeSH descriptor Fetal Development explode all trees
#11 MeSH descriptor Infant, Newborn explode all trees
#12 (#1 OR #2 OR #3 OR #4 OR #5 OR #6 OR #7 OR #8 OR #9 OR #10 OR #11)
#13 MeSH descriptor Fetal Diseases explode all trees
#14 MeSH descriptor Fetal Death explode all trees
#15 MeSH descriptor Infant Mortality explode all trees
#16 MeSH descriptor Birth Weight explode all trees
#17 MeSH descriptor Abnormalities, Drug‐Induced explode all trees
#18 MeSH descriptor Congenital Abnormalities explode all trees
#19 (congenital NEXT defec*)
#20 (congenital NEXT malformation*)
#21 (congenital NEXT anomal*)
#22 (birth NEXT defec*)
#23 (minor NEXT anomal*)
#24 (dysmorph*)
#25 (maternal NEXT mortality)
#26 MeSH descriptor Intellectual Disability explode all trees
#27 (intellectual* NEXT impair*)
#28 (IQ)
#29 (intellectual NEXT ability)
#30 neurodevelopment
#31 (mental* NEXT retard*)
#32 "educational needs"
#33 "longer term outcome"
#34 MeSH descriptor Child Development explode all trees
#35 "child development"
#36 MeSH descriptor Autistic Disorder explode all trees
#37 (autism OR autistic)
#38 MeSH descriptor Attention Deficit Disorder with Hyperactivity explode all trees
#39 "attention deficit"
#40 MeSH descriptor Apraxias explode all trees
#41 dyspraxia
#42 MeSH descriptor Memory explode all trees
#43 (memory)
#44 MeSH descriptor Language Disorders explode all trees
#45 language
#46 MeSH descriptor Executive Function explode all trees
#47 (executive NEXT function*)
#48 cognitive
#49 MeSH descriptor Neuropsychology explode all trees
#50 neuropsycholog*
#51 (#13 OR #14 OR #15 OR #16 OR #17 OR #18 OR #19 OR #20 OR #21 OR #22 OR #23 OR #24 OR #25 OR #26 OR #27 OR #28 OR #29 OR #30 OR #31 OR #32 OR #33 OR #34 OR #35 OR #36 OR #37 OR #38 OR #39 OR #40 OR #41 OR #42 OR #43 OR #44 OR #45 OR #46 OR #47 OR #48 OR #49 OR #50)
#52 MeSH descriptor Phenytoin explode all trees
#53 MeSH descriptor Carbamazepine explode all trees
#54 MeSH descriptor Valproic Acid explode all trees
#55 MeSH descriptor Phenobarbital explode all trees
#56 MeSH descriptor Ethosuximide explode all trees
#57 MeSH descriptor Clonazepam explode all trees
#58 MeSH descriptor Anticonvulsants explode all trees
#59 (phenytoin) or (carbamazepine) or (valproate) or (valproic) or (phenobarb*)
#60 (lamotrigine) or (gabapentin) or (vigabatrin) or (levetiracetam) or (topiramate)
#61 (tiagabine) or (zonisamide) or (pregabalin) or (lacosamide) or (rufinamide)
#62 (retigabine) or (ezogabine) or (oxcarbazepine) or (ethosuximide) or (sulthiame)
#63 (clonazepam) or (clobazam) or (anti‐epilep*) or (antiepilep*)
#64 MeSH descriptor Epilepsy explode all trees
#65 MeSH descriptor Seizures explode all trees
#66 (seizure*) or (epilep*) or (convuls*)
#67 (#52 OR #53 OR #54 OR #55 OR #56 OR #57 OR #58 OR #59 OR #60 OR #61 OR #62 OR #63 OR #64 OR #65 OR #66)
#68 (#12 AND #51 AND #67) in Trials
Appendix 3. Search strategy for MEDLINE (Ovid)
1. exp Pregnancy/
2. exp Pregnancy Complications/
3. exp Prenatal Exposure Delayed Effects/
4. (fetal or foetal or fetus or foetus or prenatal).tw.
5. (newborn or infant).tw.
6. exp Teratogens/
7. teratogen$.tw.
8. (in adj utero).tw.
9. (intra uterine or intrauterine).tw.
10. exp Fetal Development/
11. exp Infant, Newborn/
12. or/1‐11
13. exp Fetal Diseases/
14. exp Fetal Death/
15. exp Infant Mortality/
16. exp Birth Weight/
17. exp Abnormalities, Drug‐Induced/ or exp Congenital Abnormalities/
18. (congenital adj defec$).tw.
19. (congenital adj malformation$).tw.
20. (congenital adj anomal$).tw.
21. (birth adj defec$).tw.
22. (minor adj anomal$).tw.
23. dysmorph$.tw.
24. (maternal adj mortality).tw.
25. exp Intellectual Disability/
26. (intellectual$ adj impair$).tw.
27. IQ.tw.
28. (intellectual adj ability).tw.
29. neurodevelopment.tw.
30. (mental$ adj retard$).tw.
31. educational needs.tw.
32. longer term outcome.tw.
33. exp Child Development/
34. child development.tw.
35. exp Autistic Disorder/
36. (autism or autistic).tw.
37. exp Attention Deficit Disorder with Hyperactivity/
38. attention deficit.tw.
39. exp Apraxias/
40. dyspraxia.tw.
41. exp Memory/
42. memory.tw.
43. exp Language Disorders/
44. language.tw.
45. exp Executive Function/
46. executive function$.tw.
47. cognitive.tw.
48. exp Neuropsychology/
49. neuropsycholog$.tw.
50. or/13‐49
51. phenytoin.tw.
52. exp Carbamazepine/
53. carbamazepine.tw.
54. exp Valproic Acid/
55. (valproic or valproate).tw.
56. exp Phenobarbital/
57. phenobarb$.tw.
58. lamotrigine.tw.
59. gabapentin.tw.
60. vigabatrin.tw.
61. levetiracetam.tw.
62. topiramate.tw.
63. tiagabine.tw.
64. zonisamide.tw.
65. pregabalin.tw.
66. lacosamide.tw.
67. (retigabine or ezogabine).tw.
68. rufinamide.tw.
69. oxcarbazepine.tw.
70. exp Ethosuximide/
71. ethosuximide.tw.
72. sulthiame.tw.
73. exp Clonazepam/
74. clonazepam.tw.
75. clobazam.tw.
76. antiepilep$.tw.
77. anti‐epilep$.tw.
78. exp Anticonvulsants/
79. exp Epilepsy/
80. exp Seizures/
81. (seizure$ or epilep$ or convuls$).tw.
82. or/51‐81
83. 12 and 50 and 82
84. exp animals/ not humans.sh.
85. 83 not 84
Appendix 4. Extended risk of bias tool for non‐randomised studies
Studies for which the risk of bias tool is intended
Only suitable for 'cohort‐like' studies, individually or cluster‐allocated. This can include secondary analyses of clinical databases providing the analysis is clearly structured as a comparison of control and intervention participants (Higgins 2011):
Individually allocated study designs
Randomised controlled trial
Quasi randomised controlled trial
Non‐randomised controlled trial
Controlled before and after study (not common use of this label, see controlled cohort before and after study below)
Prospective cohort study
Retrospective cohort study
Cluster allocated study designs
Cluster randomised controlled trial
Cluster quasi randomised controlled trial
Cluster non‐randomised controlled trial
Controlled interrupted time series
Controlled cohort before and after study
Assessment of risk of bias
Issues when using modified risk of bias tool to assess cohort‐like non‐randomised studies:
follow principle for existing Cochrane Collaboration's tool for assessing risk of bias: score judgement and provide information (preferably direct quote) to support judgement
modified risk of bias tool include an additional item on confounding.
five‐point scale for some items (distinguish "unclear" from intermediate risk of bias).
keep in mind the general philosophy–assessment is not about whether researchers could have done better but about risk of bias; the assessment tool must be used in a standard way whatever the difficulty / circumstances of investigating the research question of interest and whatever study design features were used.
use of a five‐point scale is uncharted territory; very interested to know whether this makes things easier or more difficult for reviewers.
anchors for five‐point scale: "1/No/low risk' of bias should correspond to a high quality RCT. "5/high risk" of bias should correspond to a risk of bias that means the findings should not be considered (too risky, too much bias, more likely to mislead than inform).
Sequence generation
Low/high/unclear risk of bias item
Always high risk of bias (not random) for a non‐randomised study
Might argue that this item redundant for non‐randomised studies since always high risk of bias ‐ but important to include in risk of bias table ('level playing field' argument)
Allocation concealment
Low/high/unclear risk of bias item
Potentially low risk of bias for a non‐randomised study, e.g. quasi‐randomised (high risk of bias to sequence generation) but concealed (reviewer judges that the people making decisions about including participants didn't know how allocation was being done, e.g. odd/even date of birth/hospital number)
Risk of bias from confounding (additional item for non‐randomised studies; assess for each outcome)
Assumes a prespecified list of potential confounders defined in the protocol for the systematic review
Low(1) / 2 / 3 / 4 / high(5) / unclear risk of bias item
-
Judgement needs to factor in (see 'worksheet'):
proportion of confounders (from prespecified list) that were considered;
whether most important confounders (from prespecified list) were considered;
resolution / precision with which confounders were measured;
extent of imbalance between groups at baseline;
care with which adjustment was done (typically a judgement about the statistical modelling carried out by authors).
-
Low risk of bias requires that all important confounders are balanced at baseline, i.e.
not primarily/not only a statistical judgement; or
measured 'well' and 'carefully' controlled for in the analysis.
We have provided an optional 'worksheet' to help reviewers to focus on the task (rows = confounders and columns = factors to consider). Reviewers should make a risk of bias judgement about each factor first and then combine these (by eyeballing rather than quantitatively) to make the judgement in the main risk of bias table.
Risk of bias from lack of blinding (assess for each outcome, as per existing risk of bias tool)
Low(1) / 2 / 3 / 4 / high(5) / unclear risk of bias item
-
Judgement needs to factor in:
nature of outcome (subjective/objective; source of information);
who was / was not blinded and the risk that those who were not blinded could introduce performance or detection bias.
Risk of bias from incomplete outcome data (assess for each outcome, as per existing risk of bias tool)
Low(1) / 2 / 3 / 4 / high(5) / unclear risk of bias item
-
Judgement needs to factor in:
reasons for missing data;
whether amount of missing data balanced across groups, with similar reasons;
whether group comparison appropriate (e.g. 'analysed in allocated group' issue).
Risk of bias from selective reporting (assess for each outcome)
More wide ranging than existing recommendation; key issue is whether outcomes were clearly defined, and methods of analysis were pre‐specified and adhered to
Low(1) / 2 / 3 / 4 / high(5) /unclear risk of bias item
-
Judgement needs to factor in:
existing risk of bias guidance on selective outcome reporting;
also, extent to which analyses (and potentially other choices) could have been manipulated to bias the findings reported, e.g. choice of method of model fitting, potential confounders considered/included;
look for evidence that there was a protocol in advance of doing any analysis or obtaining the data (difficult unless explicitly reported); non‐randomised studies very different from RCTs. RCTs must have a protocol in advance of starting to recruit (for research ethics committee/institutional review board/other regulatory approval); non‐randomised studies need not (especially older studies);
Hence, separate yes/no items asking reviewers whether they think the researchers had a prespecified protocol and analysis plan.
Appendix 5. Assessment of confounding variables
| Assessment of how researchers dealt with confounding |
| Method for identifying relevant confounders described by researchers: Yes/No If yes, describe the method used: |
| Relevant confounders described: Yes/No List confounders described below |
| Method used for controlling for confounding At design stage: matching by characteristics of subjects (see below for matching by propensity score) Variables on which subjects matched: …………………………………. …………………………………. ............................................... At analysis stage: stratification multivariable regression propensity scores (matching) propensity scores (multivariable regression) Describe confounders controlled for below Confounders described by researchers Enter / preprint prespecified list of confounders (rank order in importance? Important in bold?) Tick (yes/no judgement) if confounder considered by the researchers [Cons'd?] Score (1 to 5) precision with which confounder measured Score (1 to 5) imbalance between groups Score (1 to 5) care with which adjustment for confounder was carried out |
| Confounder | Considered | Precision | Imbalance | Adjustment |
| o | o | o | o | |
| o | o | o | o | |
| o | o | o | o |
Data and analyses
Comparison 1. CBZ vs Controls.
| Outcome or subgroup title | No. of studies | No. of participants | Statistical method | Effect size |
|---|---|---|---|---|
| 1 All Major Malformations | 23 | Risk Ratio (M‐H, Fixed, 95% CI) | Subtotals only | |
| 1.1 CBZ vs Women Without Epilepsy | 8 | 3513 | Risk Ratio (M‐H, Fixed, 95% CI) | 2.01 [1.20, 3.36] |
| 1.2 CBZ vs WWE ‐ No Medication | 17 | 4345 | Risk Ratio (M‐H, Fixed, 95% CI) | 1.50 [1.03, 2.19] |
| 2 Neural Tube Malformations | 8 | Risk Ratio (M‐H, Fixed, 95% CI) | Subtotals only | |
| 2.1 CBZ vs Women Without Epilepsy | 3 | 832 | Risk Ratio (M‐H, Fixed, 95% CI) | 1.40 [0.06, 34.14] |
| 2.2 CBZ vs WWE ‐ No Medication | 7 | 1026 | Risk Ratio (M‐H, Fixed, 95% CI) | 0.91 [0.15, 5.61] |
| 3 Cardiac Malformations | 8 | Risk Ratio (M‐H, Fixed, 95% CI) | Subtotals only | |
| 3.1 CBZ vs Women Without Epilepsy | 3 | 832 | Risk Ratio (M‐H, Fixed, 95% CI) | 1.41 [0.28, 7.02] |
| 3.2 CBZ vs WWE ‐ No Medication | 7 | 1026 | Risk Ratio (M‐H, Fixed, 95% CI) | 1.84 [0.32, 10.71] |
| 4 Oro‐Facial Cleft / Craniofacial Malformations | 8 | Risk Ratio (M‐H, Fixed, 95% CI) | Subtotals only | |
| 4.1 CBZ vs Women Without Epilepsy | 3 | 832 | Risk Ratio (M‐H, Fixed, 95% CI) | 6.13 [1.19, 31.49] |
| 4.2 CBZ vs WWE ‐ No Medication | 7 | 1026 | Risk Ratio (M‐H, Fixed, 95% CI) | 1.16 [0.27, 5.00] |
| 5 Skeletal / Limb Malformations | 8 | Risk Ratio (M‐H, Fixed, 95% CI) | Subtotals only | |
| 5.1 CBZ vs Woment Without Epilepsy | 3 | 832 | Risk Ratio (M‐H, Fixed, 95% CI) | 3.9 [0.17, 89.64] |
| 5.2 CBZ vs WWE ‐ No Medication | 7 | 1026 | Risk Ratio (M‐H, Fixed, 95% CI) | 0.73 [0.18, 3.01] |
Comparison 2. GBP vs Controls.
| Outcome or subgroup title | No. of studies | No. of participants | Statistical method | Effect size |
|---|---|---|---|---|
| 1 All Major Malformations | 3 | Risk Ratio (M‐H, Fixed, 95% CI) | Subtotals only | |
| 1.1 GBP vs Women Without Epilepsy | 1 | 587 | Risk Ratio (M‐H, Fixed, 95% CI) | 0.61 [0.07, 5.18] |
| 1.2 GBP vs WWE ‐ No Medication | 2 | 733 | Risk Ratio (M‐H, Fixed, 95% CI) | 1.16 [0.23, 5.93] |
| 2 Neural Tube Malformations | 0 | Risk Ratio (M‐H, Fixed, 95% CI) | Subtotals only | |
| 2.1 GBP vs Women Without Epilepsy | 0 | 0 | Risk Ratio (M‐H, Fixed, 95% CI) | 0.0 [0.0, 0.0] |
| 2.2 GBP vs WWE ‐ No Medication | 0 | 0 | Risk Ratio (M‐H, Fixed, 95% CI) | 0.0 [0.0, 0.0] |
| 3 Cardiac Malformations | 0 | Risk Ratio (M‐H, Fixed, 95% CI) | Subtotals only | |
| 3.1 GBP vs Women Without Epilepsy | 0 | 0 | Risk Ratio (M‐H, Fixed, 95% CI) | 0.0 [0.0, 0.0] |
| 3.2 GBP vs WWE ‐ No Medication | 0 | 0 | Risk Ratio (M‐H, Fixed, 95% CI) | 0.0 [0.0, 0.0] |
| 4 Oro‐Facial Cleft / Craniofacial Malformations | 0 | Risk Ratio (M‐H, Fixed, 95% CI) | Subtotals only | |
| 4.1 GBP vs Women Without Epilepsy | 0 | 0 | Risk Ratio (M‐H, Fixed, 95% CI) | 0.0 [0.0, 0.0] |
| 4.2 GBP vs WWE ‐ No Medication | 0 | 0 | Risk Ratio (M‐H, Fixed, 95% CI) | 0.0 [0.0, 0.0] |
| 5 Skeletal / Limb Malformations | 0 | Risk Ratio (M‐H, Fixed, 95% CI) | Subtotals only | |
| 5.1 GBP vs Women Without Epilepsy | 0 | 0 | Risk Ratio (M‐H, Fixed, 95% CI) | 0.0 [0.0, 0.0] |
| 5.2 GBP vs WWE ‐ No Medication | 0 | 0 | Risk Ratio (M‐H, Fixed, 95% CI) | 0.0 [0.0, 0.0] |
Comparison 3. LEV vs Controls.
| Outcome or subgroup title | No. of studies | No. of participants | Statistical method | Effect size |
|---|---|---|---|---|
| 1 All Major Malformations | 3 | Risk Ratio (M‐H, Fixed, 95% CI) | Subtotals only | |
| 1.1 LEV vs Women Without Epilepsy | 1 | 892 | Risk Ratio (M‐H, Fixed, 95% CI) | 2.16 [0.76, 6.17] |
| 1.2 LEV vs WWE ‐ No Medication | 2 | 1055 | Risk Ratio (M‐H, Fixed, 95% CI) | 0.32 [0.10, 1.07] |
| 2 Neural Tube Malformations | 0 | Risk Ratio (M‐H, Fixed, 95% CI) | Subtotals only | |
| 2.1 LEV vs Women Without Epilepsy | 0 | 0 | Risk Ratio (M‐H, Fixed, 95% CI) | 0.0 [0.0, 0.0] |
| 2.2 LEV vs WWE ‐ No Medication | 0 | 0 | Risk Ratio (M‐H, Fixed, 95% CI) | 0.0 [0.0, 0.0] |
| 3 Cardiac Malformations | 0 | Risk Ratio (M‐H, Fixed, 95% CI) | Subtotals only | |
| 3.1 LEV vs Women Without Epilepsy | 0 | 0 | Risk Ratio (M‐H, Fixed, 95% CI) | 0.0 [0.0, 0.0] |
| 3.2 LEV vs WWE ‐ No Medication | 0 | 0 | Risk Ratio (M‐H, Fixed, 95% CI) | 0.0 [0.0, 0.0] |
| 4 Oro‐Facial Cleft / Craniofacial Malformations | 0 | Risk Ratio (M‐H, Fixed, 95% CI) | Subtotals only | |
| 4.1 LEV vs Women Without Epilepsy | 0 | 0 | Risk Ratio (M‐H, Fixed, 95% CI) | 0.0 [0.0, 0.0] |
| 4.2 LEV vs WWE ‐ No Medication | 0 | 0 | Risk Ratio (M‐H, Fixed, 95% CI) | 0.0 [0.0, 0.0] |
| 5 Skeletal / Limb Malformations | 0 | Risk Ratio (M‐H, Fixed, 95% CI) | Subtotals only | |
| 5.1 LEV vs Women Without Epilepsy | 0 | 0 | Risk Ratio (M‐H, Fixed, 95% CI) | 0.0 [0.0, 0.0] |
| 5.2 LEV vs WWE ‐ No Medication | 0 | 0 | Risk Ratio (M‐H, Fixed, 95% CI) | 0.0 [0.0, 0.0] |
Comparison 4. LTG vs Controls.
| Outcome or subgroup title | No. of studies | No. of participants | Statistical method | Effect size |
|---|---|---|---|---|
| 1 All Major Malformations | 5 | Risk Ratio (M‐H, Fixed, 95% CI) | Subtotals only | |
| 1.1 LTG vs Women Without Epilepsy | 3 | 3188 | Risk Ratio (M‐H, Fixed, 95% CI) | 1.68 [0.78, 3.65] |
| 1.2 LTG vs WWE ‐ No Medication | 3 | 3181 | Risk Ratio (M‐H, Fixed, 95% CI) | 1.07 [0.64, 1.77] |
| 2 Neural Tube Malformations | 2 | Risk Ratio (M‐H, Fixed, 95% CI) | Subtotals only | |
| 2.1 LTG vs Women Without Epilepsy | 1 | 355 | Risk Ratio (M‐H, Fixed, 95% CI) | 2.57 [0.11, 62.03] |
| 2.2 LTG vs WWE ‐ No Medication | 2 | 542 | Risk Ratio (M‐H, Fixed, 95% CI) | 0.0 [0.0, 0.0] |
| 3 Cardiac Malformations | 2 | Risk Ratio (M‐H, Fixed, 95% CI) | Subtotals only | |
| 3.1 LTG vs Women Without Epilepsy | 1 | 355 | Risk Ratio (M‐H, Fixed, 95% CI) | 2.57 [0.11, 62.03] |
| 3.2 LTG vs WWE ‐ No Medication | 2 | 542 | Risk Ratio (M‐H, Fixed, 95% CI) | 1.4 [0.15, 13.35] |
| 4 Oro‐Facial Cleft / Crainofacial Malformations | 2 | Risk Ratio (M‐H, Fixed, 95% CI) | Subtotals only | |
| 4.1 LTG vs Women Without Epilepsy | 1 | 355 | Risk Ratio (M‐H, Fixed, 95% CI) | 0.0 [0.0, 0.0] |
| 4.2 LTG vs WWE ‐ No Medication | 2 | 542 | Risk Ratio (M‐H, Fixed, 95% CI) | 5.15 [0.29, 92.56] |
| 5 Skeletal / Limb Malformations | 2 | Risk Ratio (M‐H, Fixed, 95% CI) | Subtotals only | |
| 5.1 LTG vs Women Without Epilepsy | 1 | 355 | Risk Ratio (M‐H, Fixed, 95% CI) | 23.12 [0.96, 558.25] |
| 5.2 LTG vs WWE ‐ No Medication | 2 | 542 | Risk Ratio (M‐H, Fixed, 95% CI) | 0.72 [0.12, 4.12] |
Comparison 5. OXC vs Controls.
| Outcome or subgroup title | No. of studies | No. of participants | Statistical method | Effect size |
|---|---|---|---|---|
| 1 All Major Malformations | 3 | Risk Ratio (M‐H, Fixed, 95% CI) | Subtotals only | |
| 1.1 OXC vs Women Without Epilepsy | 1 | 624 | Risk Ratio (M‐H, Fixed, 95% CI) | 1.94 [0.53, 7.15] |
| 1.2 OXC vs WWE ‐ No Medication | 2 | 407 | Risk Ratio (M‐H, Fixed, 95% CI) | 2.75 [0.53, 14.43] |
| 2 Neural Tube Malformations | 0 | Risk Ratio (M‐H, Fixed, 95% CI) | Subtotals only | |
| 2.1 OXC vs Women Without Epilepsy | 0 | 0 | Risk Ratio (M‐H, Fixed, 95% CI) | 0.0 [0.0, 0.0] |
| 2.3 OXC vs WWE ‐ No Medication | 0 | 0 | Risk Ratio (M‐H, Fixed, 95% CI) | 0.0 [0.0, 0.0] |
| 3 Cardiac Malformations | 0 | Risk Ratio (M‐H, Fixed, 95% CI) | Subtotals only | |
| 3.1 OXC vs Women Without Epilepsy | 0 | 0 | Risk Ratio (M‐H, Fixed, 95% CI) | 0.0 [0.0, 0.0] |
| 3.2 OXC vs WWE ‐ No Medication | 0 | 0 | Risk Ratio (M‐H, Fixed, 95% CI) | 0.0 [0.0, 0.0] |
| 4 Oro‐Facial Cleft / Craniofacial Malformations | 0 | Risk Ratio (M‐H, Fixed, 95% CI) | Subtotals only | |
| 4.1 OXC vs Women Without Epilepsy | 0 | 0 | Risk Ratio (M‐H, Fixed, 95% CI) | 0.0 [0.0, 0.0] |
| 4.2 OXC vs WWE ‐ No Medication | 0 | 0 | Risk Ratio (M‐H, Fixed, 95% CI) | 0.0 [0.0, 0.0] |
| 5 Skeletal / Limb Malformations | 0 | Risk Ratio (M‐H, Fixed, 95% CI) | Subtotals only | |
| 5.1 OXC vs Women Without Epilepsy | 0 | 0 | Risk Ratio (M‐H, Fixed, 95% CI) | 0.0 [0.0, 0.0] |
| 5.2 OXC vs WWE ‐ No Medication | 0 | 0 | Risk Ratio (M‐H, Fixed, 95% CI) | 0.0 [0.0, 0.0] |
Comparison 6. PB vs Controls.
| Outcome or subgroup title | No. of studies | No. of participants | Statistical method | Effect size |
|---|---|---|---|---|
| 1 All Major Malformations | 17 | Risk Ratio (M‐H, Fixed, 95% CI) | Subtotals only | |
| 1.1 PB vs Women Without Epilepsy | 5 | 1936 | Risk Ratio (M‐H, Fixed, 95% CI) | 2.84 [1.57, 5.13] |
| 1.2 PB vs WWE ‐ No Medication | 13 | 1030 | Risk Ratio (M‐H, Fixed, 95% CI) | 1.95 [0.97, 3.93] |
| 2 Neural Tube Malformations | 2 | Risk Ratio (M‐H, Fixed, 95% CI) | Subtotals only | |
| 2.1 PB vs Women Without Epilepsy | 1 | 120 | Risk Ratio (M‐H, Fixed, 95% CI) | 0.0 [0.0, 0.0] |
| 2.2 PB vs WWE ‐ No Medication | 2 | 181 | Risk Ratio (M‐H, Fixed, 95% CI) | 1.73 [0.08, 36.75] |
| 3 Cardiac Malformations | 2 | Risk Ratio (M‐H, Fixed, 95% CI) | Subtotals only | |
| 3.1 PB vs Women Without Epilepsy | 1 | 120 | Risk Ratio (M‐H, Fixed, 95% CI) | 7.8 [0.36, 168.52] |
| 3.2 PB vs WWE ‐ No Medication | 2 | 181 | Risk Ratio (M‐H, Fixed, 95% CI) | 8.22 [0.37, 181.57] |
| 4 Oro‐Facial Cleft / Craniofacial Malformations | 2 | Risk Difference (M‐H, Fixed, 95% CI) | Subtotals only | |
| 4.1 PB vs Women Without Epilepsy | 1 | 120 | Risk Difference (M‐H, Fixed, 95% CI) | ‐0.03 [‐0.29, 0.24] |
| 4.2 PB vs WWE ‐ No Medication | 2 | 181 | Risk Difference (M‐H, Fixed, 95% CI) | 0.0 [‐0.21, 0.21] |
| 5 Skeletal / Limb Malformations | 2 | Risk Ratio (M‐H, Fixed, 95% CI) | Subtotals only | |
| 5.1 PB vs Women Without Epilepsy | 1 | 120 | Risk Ratio (M‐H, Fixed, 95% CI) | 7.8 [0.36, 168.52] |
| 5.2 PB vs WWE ‐ No Medication | 2 | 181 | Risk Ratio (M‐H, Fixed, 95% CI) | 8.22 [0.37, 181.57] |
Comparison 7. PHT vs Controls.
| Outcome or subgroup title | No. of studies | No. of participants | Statistical method | Effect size |
|---|---|---|---|---|
| 1 All Major Malformations | 18 | Risk Ratio (M‐H, Fixed, 95% CI) | Subtotals only | |
| 1.1 PHT vs Women Without Epilepsy | 5 | 1464 | Risk Ratio (M‐H, Fixed, 95% CI) | 2.38 [1.12, 5.03] |
| 1.2 PHT vs WWE ‐ No Medication | 15 | 1896 | Risk Ratio (M‐H, Fixed, 95% CI) | 2.40 [1.42, 4.08] |
| 2 Neural Tube Malformations | 5 | Risk Ratio (M‐H, Fixed, 95% CI) | Subtotals only | |
| 2.1 PHT vs Women Without Epilepsy | 2 | 462 | Risk Ratio (M‐H, Fixed, 95% CI) | 13.17 [0.58, 299.00] |
| 2.2 PHT vs WWE ‐ No Medication | 5 | 388 | Risk Ratio (M‐H, Fixed, 95% CI) | 1.65 [0.32, 8.51] |
| 3 Cardiac Malformations | 5 | Risk Ratio (M‐H, Fixed, 95% CI) | Subtotals only | |
| 3.1 PHT vs Women Without Epilepsy | 2 | 462 | Risk Ratio (M‐H, Fixed, 95% CI) | 6.31 [0.75, 52.91] |
| 3.2 PHT vs WWE ‐ No Medication | 5 | 388 | Risk Ratio (M‐H, Fixed, 95% CI) | 3.23 [0.40, 26.25] |
| 4 Oro‐Facial Cleft / Craniofacial Malformations | 5 | Risk Ratio (M‐H, Fixed, 95% CI) | Subtotals only | |
| 4.1 PHT vs Women Without Epilepsy | 2 | 462 | Risk Ratio (M‐H, Fixed, 95% CI) | 0.67 [0.04, 12.54] |
| 4.2 PHT vs WWE ‐ No Medication | 5 | 663 | Risk Ratio (M‐H, Fixed, 95% CI) | 0.0 [0.0, 0.0] |
| 5 Skeletal / Limb Malformations | 5 | Risk Ratio (M‐H, Fixed, 95% CI) | Subtotals only | |
| 5.1 PHT vs Women Without Epilepsy | 2 | 462 | Risk Ratio (M‐H, Fixed, 95% CI) | 1.56 [0.07, 37.19] |
| 5.2 PHT vs WWE ‐ No Medication | 5 | 388 | Risk Ratio (M‐H, Fixed, 95% CI) | 1.69 [0.19, 15.30] |
Comparison 8. PRM vs Controls.
| Outcome or subgroup title | No. of studies | No. of participants | Statistical method | Effect size |
|---|---|---|---|---|
| 1 All Major Malformations | 5 | Risk Ratio (M‐H, Random, 95% CI) | Subtotals only | |
| 1.1 PRM vs Women Without Epilepsy | 1 | 137 | Risk Ratio (M‐H, Random, 95% CI) | 0.48 [0.03, 8.43] |
| 1.2 PRM vs WWE ‐ No Medication | 5 | 503 | Risk Ratio (M‐H, Random, 95% CI) | 3.92 [0.76, 20.14] |
| 2 Neural Tube Malformations | 0 | Risk Ratio (M‐H, Fixed, 95% CI) | Subtotals only | |
| 2.1 PRM vs Women Without Epilepsy | 0 | 0 | Risk Ratio (M‐H, Fixed, 95% CI) | 0.0 [0.0, 0.0] |
| 2.2 PRM vs WWE ‐ No Medication | 0 | 0 | Risk Ratio (M‐H, Fixed, 95% CI) | 0.0 [0.0, 0.0] |
| 3 Cardiac Malformations | 0 | Risk Ratio (M‐H, Fixed, 95% CI) | Subtotals only | |
| 3.1 PRM vs Women Without Epilepsy | 0 | 0 | Risk Ratio (M‐H, Fixed, 95% CI) | 0.0 [0.0, 0.0] |
| 3.2 PRM vs WWE ‐ No Medication | 0 | 0 | Risk Ratio (M‐H, Fixed, 95% CI) | 0.0 [0.0, 0.0] |
| 4 Oro‐Facial Cleft / Craniofacial Malformations | 0 | Risk Ratio (M‐H, Fixed, 95% CI) | Subtotals only | |
| 4.1 PRM vs Women Without Epilepsy | 0 | 0 | Risk Ratio (M‐H, Fixed, 95% CI) | 0.0 [0.0, 0.0] |
| 4.2 PRM vs WWE ‐ No Medication | 0 | 0 | Risk Ratio (M‐H, Fixed, 95% CI) | 0.0 [0.0, 0.0] |
| 5 Skeletal / Limb Malformations | 0 | Risk Ratio (M‐H, Fixed, 95% CI) | Subtotals only | |
| 5.1 PRM vs Women Without Epilepsy | 0 | 0 | Risk Ratio (M‐H, Fixed, 95% CI) | 0.0 [0.0, 0.0] |
| 5.2 PRM vs WWE ‐ No Medication | 0 | 0 | Risk Ratio (M‐H, Fixed, 95% CI) | 0.0 [0.0, 0.0] |
Comparison 9. TPM vs Controls.
| Outcome or subgroup title | No. of studies | No. of participants | Statistical method | Effect size |
|---|---|---|---|---|
| 1 All Major Malformations | 3 | Risk Ratio (M‐H, Fixed, 95% CI) | Subtotals only | |
| 1.1 TPM vs Women Without Epilepsy | 1 | 801 | Risk Ratio (M‐H, Fixed, 95% CI) | 3.69 [1.36, 10.07] |
| 1.2 TPM vs WWE ‐ No Medication | 2 | 802 | Risk Ratio (M‐H, Fixed, 95% CI) | 1.99 [0.65, 6.08] |
| 2 Neural Tube Malformations | 1 | Risk Ratio (M‐H, Fixed, 95% CI) | Subtotals only | |
| 2.1 TPM vs Women Without Epilepsy | 0 | 0 | Risk Ratio (M‐H, Fixed, 95% CI) | 0.0 [0.0, 0.0] |
| 2.2 TPM vs WWE ‐ No Medication | 1 | 191 | Risk Ratio (M‐H, Fixed, 95% CI) | 0.0 [0.0, 0.0] |
| 3 Cardiac Malformations | 1 | Risk Ratio (M‐H, Fixed, 95% CI) | Subtotals only | |
| 3.1 TPM vs Women Without Epilepsy | 0 | 0 | Risk Ratio (M‐H, Fixed, 95% CI) | 0.0 [0.0, 0.0] |
| 3.2 TPM vs WWE ‐ No Medication | 1 | 191 | Risk Ratio (M‐H, Fixed, 95% CI) | 1.10 [0.05, 26.45] |
| 4 Oro‐Facial Cleft / Craniofacial Malformations | 1 | Risk Ratio (M‐H, Fixed, 95% CI) | Subtotals only | |
| 4.1 TPM vs Women Without Epilepsy | 0 | 0 | Risk Ratio (M‐H, Fixed, 95% CI) | 0.0 [0.0, 0.0] |
| 4.2 TPM vs WWE ‐ No Medication | 1 | 191 | Risk Ratio (M‐H, Fixed, 95% CI) | 0.0 [0.0, 0.0] |
| 5 Skeletal / Limb Malformations | 1 | Risk Ratio (M‐H, Fixed, 95% CI) | Subtotals only | |
| 5.1 TPM vs Women Without Epilepsy | 0 | 0 | Risk Ratio (M‐H, Fixed, 95% CI) | 0.0 [0.0, 0.0] |
| 5.2 TPM vs WWE ‐ No Medication | 1 | 191 | Risk Ratio (M‐H, Fixed, 95% CI) | 1.10 [0.05, 26.45] |
Comparison 10. VPA vs Controls.
| Outcome or subgroup title | No. of studies | No. of participants | Statistical method | Effect size |
|---|---|---|---|---|
| 1 All Major Malformations | 19 | Risk Ratio (M‐H, Fixed, 95% CI) | Subtotals only | |
| 1.1 VPA vs Women Without Epilepsy | 7 | 2403 | Risk Ratio (M‐H, Fixed, 95% CI) | 5.69 [3.33, 9.73] |
| 1.2 VPA vs WWE ‐ No Med Controls | 14 | 3182 | Risk Ratio (M‐H, Fixed, 95% CI) | 3.13 [2.16, 4.54] |
| 2 Neural Tube Malformations | 6 | Risk Ratio (M‐H, Fixed, 95% CI) | Subtotals only | |
| 2.1 VPA vs Women Without Epilepsy | 2 | 502 | Risk Ratio (M‐H, Fixed, 95% CI) | 6.05 [0.94, 38.81] |
| 2.2 VPA vs WWE ‐ No Medication | 6 | 768 | Risk Ratio (M‐H, Fixed, 95% CI) | 5.30 [1.05, 26.70] |
| 3 Cardiac Malformations | 6 | Risk Ratio (M‐H, Fixed, 95% CI) | Subtotals only | |
| 3.1 VPA vs Women without Medication | 2 | 502 | Risk Ratio (M‐H, Fixed, 95% CI) | 16.40 [3.05, 88.19] |
| 3.2 VPA vs WWE ‐ No Medication | 6 | 768 | Risk Ratio (M‐H, Fixed, 95% CI) | 4.85 [1.28, 18.47] |
| 4 Oro‐Facial Cleft / Craniofacial Malformations | 6 | Risk Difference (M‐H, Fixed, 95% CI) | Subtotals only | |
| 4.1 VPA vs Women Without Epilepsy | 2 | 502 | Risk Difference (M‐H, Fixed, 95% CI) | 0.01 [‐0.03, 0.04] |
| 4.2 VPA vs WWE ‐ No Medication | 6 | 768 | Risk Difference (M‐H, Fixed, 95% CI) | 0.03 [0.01, 0.05] |
| 5 Skeletal / Limb Malformations | 6 | Risk Ratio (M‐H, Fixed, 95% CI) | Subtotals only | |
| 5.1 VPA vs Women Without Epilepsy | 2 | 502 | Risk Ratio (M‐H, Fixed, 95% CI) | 16.48 [2.46, 110.49] |
| 5.2 VPA vs WWE ‐ No Medication | 6 | 768 | Risk Ratio (M‐H, Fixed, 95% CI) | 2.57 [0.82, 8.04] |
Comparison 11. ZNS vs Controls.
| Outcome or subgroup title | No. of studies | No. of participants | Statistical method | Effect size |
|---|---|---|---|---|
| 1 All Major Malformations | 1 | Risk Ratio (M‐H, Fixed, 95% CI) | Subtotals only | |
| 1.1 ZNS vs Women Without Epilepsy | 1 | 532 | Risk Ratio (M‐H, Fixed, 95% CI) | 0.44 [0.02, 7.93] |
| 1.2 ZNS vs WWE ‐ No Medication | 0 | 0 | Risk Ratio (M‐H, Fixed, 95% CI) | 0.0 [0.0, 0.0] |
| 2 Neural Tube Malformations | 0 | Risk Ratio (M‐H, Fixed, 95% CI) | Subtotals only | |
| 2.1 ZNS vs Women Without Epilepsy | 0 | 0 | Risk Ratio (M‐H, Fixed, 95% CI) | 0.0 [0.0, 0.0] |
| 2.2 ZNS vs WWE ‐ No Medication | 0 | 0 | Risk Ratio (M‐H, Fixed, 95% CI) | 0.0 [0.0, 0.0] |
| 3 Cardiac Malformations | 0 | Risk Ratio (M‐H, Fixed, 95% CI) | Subtotals only | |
| 3.1 ZNS vs Women Without Epilepsy | 0 | 0 | Risk Ratio (M‐H, Fixed, 95% CI) | 0.0 [0.0, 0.0] |
| 3.2 ZNS vs WWE ‐ No Medication | 0 | 0 | Risk Ratio (M‐H, Fixed, 95% CI) | 0.0 [0.0, 0.0] |
| 4 Oro‐Facial Cleft / Craniofacial Malformations | 0 | Risk Ratio (M‐H, Fixed, 95% CI) | Subtotals only | |
| 4.1 ZNS vs Women Without Epilepsy | 0 | 0 | Risk Ratio (M‐H, Fixed, 95% CI) | 0.0 [0.0, 0.0] |
| 4.2 ZNS vs WWE ‐ No Medication | 0 | 0 | Risk Ratio (M‐H, Fixed, 95% CI) | 0.0 [0.0, 0.0] |
| 5 Skeletal / Limb Malformations | 0 | Risk Ratio (M‐H, Fixed, 95% CI) | Subtotals only | |
| 5.1 ZNS vs Women without Epilepsy | 0 | 0 | Risk Ratio (M‐H, Fixed, 95% CI) | 0.0 [0.0, 0.0] |
| 5.2 ZNS vs WWE ‐ No Medication | 0 | 0 | Risk Ratio (M‐H, Fixed, 95% CI) | 0.0 [0.0, 0.0] |
Comparison 12. CBZ vs GBP.
| Outcome or subgroup title | No. of studies | No. of participants | Statistical method | Effect size |
|---|---|---|---|---|
| 1 All Major Malformations | 3 | 3241 | Risk Ratio (M‐H, Fixed, 95% CI) | 2.28 [0.67, 7.79] |
| 2 Neural Tube Malformations | 1 | 375 | Risk Ratio (M‐H, Fixed, 95% CI) | 0.12 [0.01, 2.93] |
| 3 Cardiac Malformations | 1 | 375 | Risk Ratio (M‐H, Fixed, 95% CI) | 0.29 [0.02, 5.37] |
| 4 Oro‐Facial Cleft / Craniofacial Malformations | 1 | 375 | Risk Ratio (M‐H, Fixed, 95% CI) | 0.37 [0.02, 6.62] |
| 5 Skeletal / Limb Malformations | 1 | 375 | Risk Ratio (M‐H, Fixed, 95% CI) | 0.21 [0.01, 4.13] |
Comparison 13. CBZ vs LEV.
| Outcome or subgroup title | No. of studies | No. of participants | Statistical method | Effect size |
|---|---|---|---|---|
| 1 All Major Malformations | 3 | 3868 | Risk Ratio (M‐H, Fixed, 95% CI) | 1.84 [1.03, 3.29] |
| 2 Neural Tube Malformations | 3 | 3868 | Risk Ratio (M‐H, Fixed, 95% CI) | 1.19 [0.25, 5.55] |
| 3 Cardiac Malformations | 3 | 3868 | Risk Ratio (M‐H, Fixed, 95% CI) | 1.83 [0.48, 6.97] |
| 4 Oro‐Facial Cleft / Craniofacial Malformations | 3 | 3868 | Risk Ratio (M‐H, Fixed, 95% CI) | 1.83 [0.44, 7.61] |
| 5 Skeletal / Limb Malformations | 3 | 3868 | Risk Ratio (M‐H, Fixed, 95% CI) | 2.30 [0.44, 11.86] |
Comparison 14. CBZ vs LTG.
| Outcome or subgroup title | No. of studies | No. of participants | Statistical method | Effect size |
|---|---|---|---|---|
| 1 All Major Malformations | 7 | 7549 | Risk Ratio (M‐H, Fixed, 95% CI) | 1.34 [1.01, 1.76] |
| 2 Neural Tube Malformations | 6 | 7509 | Risk Ratio (M‐H, Fixed, 95% CI) | 2.32 [0.79, 6.82] |
| 3 Cardiac Malformations | 6 | 7509 | Risk Ratio (M‐H, Fixed, 95% CI) | 1.57 [0.85, 2.89] |
| 4 Oro‐Facial Cleft / Crainofacial Malformations | 6 | 7509 | Risk Ratio (M‐H, Fixed, 95% CI) | 1.12 [0.53, 2.37] |
| 5 Skeletal / Limb Malformations | 6 | 7509 | Risk Ratio (M‐H, Fixed, 95% CI) | 2.56 [0.97, 6.73] |
Comparison 15. CBZ vs OXC.
| Outcome or subgroup title | No. of studies | No. of participants | Statistical method | Effect size |
|---|---|---|---|---|
| 1 All Major Malformations | 4 | 2011 | Risk Ratio (M‐H, Fixed, 95% CI) | 1.44 [0.66, 3.16] |
| 2 Neural Tube Malformations | 4 | 2011 | Risk Ratio (M‐H, Fixed, 95% CI) | 0.48 [0.09, 2.54] |
| 3 Cardiac Malformations | 4 | 2011 | Risk Ratio (M‐H, Fixed, 95% CI) | 0.51 [0.10, 2.69] |
| 4 Oro‐Facial Cleft / Craniofacial Malformations | 4 | 2011 | Risk Ratio (M‐H, Fixed, 95% CI) | 0.53 [0.12, 2.33] |
| 5 Skeletal / Limb Malformations | 4 | 2011 | Risk Ratio (M‐H, Fixed, 95% CI) | 0.48 [0.11, 2.11] |
Comparison 16. CBZ vs PB.
| Outcome or subgroup title | No. of studies | No. of participants | Statistical method | Effect size |
|---|---|---|---|---|
| 1 All Major Malformations | 22 | 3368 | Risk Ratio (M‐H, Fixed, 95% CI) | 0.84 [0.60, 1.16] |
| 2 Neural Tube Malformations | 12 | 2246 | Risk Ratio (M‐H, Fixed, 95% CI) | 1.02 [0.19, 5.39] |
| 3 Cardiac Malformations | 12 | 2385 | Risk Ratio (M‐H, Fixed, 95% CI) | 0.34 [0.18, 0.62] |
| 4 Oro‐Facial Cleft / Craniofacial Malformations | 12 | 2246 | Risk Ratio (M‐H, Fixed, 95% CI) | 0.18 [0.07, 0.48] |
| 5 Skeletal / Limb Malformation | 12 | 2246 | Risk Ratio (M‐H, Fixed, 95% CI) | 1.20 [0.45, 3.21] |
16.3. Analysis.
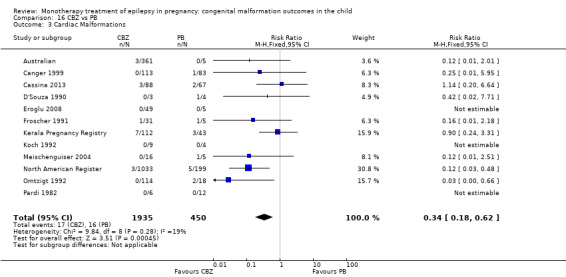
Comparison 16 CBZ vs PB, Outcome 3 Cardiac Malformations.
Comparison 17. CBZ vs PHT.
| Outcome or subgroup title | No. of studies | No. of participants | Statistical method | Effect size |
|---|---|---|---|---|
| 1 All Major Malformations | 23 | 5445 | Risk Ratio (M‐H, Fixed, 95% CI) | 0.82 [0.61, 1.11] |
| 2 Neural Tube Malformations | 14 | 4734 | Risk Ratio (M‐H, Fixed, 95% CI) | 1.03 [0.31, 3.37] |
| 3 Cardiac Malformations | 14 | 4934 | Risk Ratio (M‐H, Fixed, 95% CI) | 0.92 [0.47, 1.78] |
| 4 Oro‐Facial Cleft / Craniofacial Malformations | 14 | 4734 | Risk Ratio (M‐H, Fixed, 95% CI) | 0.80 [0.31, 2.05] |
| 5 Skeletal / Limb Malformation | 14 | 4734 | Risk Ratio (M‐H, Fixed, 95% CI) | 0.78 [0.35, 1.75] |
Comparison 18. CBZ vs PRM.
| Outcome or subgroup title | No. of studies | No. of participants | Statistical method | Effect size |
|---|---|---|---|---|
| 1 All Major Malformations | 6 | 777 | Risk Ratio (M‐H, Random, 95% CI) | 0.64 [0.21, 2.01] |
| 2 Neural Tube Malformations | 2 | 158 | Risk Ratio (M‐H, Fixed, 95% CI) | 0.95 [0.04, 22.75] |
| 3 Cardiac Malformations | 2 | 158 | Risk Ratio (M‐H, Fixed, 95% CI) | 0.11 [0.00, 2.53] |
| 4 Oro‐Facial Cleft / Craniofacial Malformations | 2 | 158 | Risk Ratio (M‐H, Fixed, 95% CI) | 0.0 [0.0, 0.0] |
| 5 Skeletal / Limb Malformations | 2 | 158 | Risk Ratio (M‐H, Fixed, 95% CI) | 2.84 [0.16, 51.53] |
Comparison 19. CBZ vs TPM.
| Outcome or subgroup title | No. of studies | No. of participants | Statistical method | Effect size |
|---|---|---|---|---|
| 1 All Major Malformations | 3 | 3524 | Risk Ratio (M‐H, Fixed, 95% CI) | 0.78 [0.47, 1.31] |
| 2 Neural Tube Malformations | 3 | 3524 | Risk Ratio (M‐H, Fixed, 95% CI) | 0.97 [0.19, 5.06] |
| 3 Cardiac Malformations | 3 | 3524 | Risk Ratio (M‐H, Fixed, 95% CI) | 1.05 [0.23, 4.78] |
| 4 Oro‐Facial Cleft / Craniofacial Malformations | 3 | 3524 | Risk Ratio (M‐H, Fixed, 95% CI) | 0.32 [0.13, 0.81] |
| 5 Skeletal / Limb Malformations | 3 | 3524 | Risk Ratio (M‐H, Fixed, 95% CI) | 0.38 [0.13, 1.09] |
Comparison 20. CBZ vs VPA.
| Outcome or subgroup title | No. of studies | No. of participants | Statistical method | Effect size |
|---|---|---|---|---|
| 1 All Major Malformations | 25 | 7078 | Risk Ratio (M‐H, Fixed, 95% CI) | 0.41 [0.34, 0.50] |
| 2 Neural Tube Malformations | 16 | 6476 | Risk Ratio (M‐H, Fixed, 95% CI) | 0.17 [0.09, 0.31] |
| 3 Cardiac Malformations | 16 | 6646 | Risk Ratio (M‐H, Fixed, 95% CI) | 0.45 [0.31, 0.68] |
| 4 Oro‐Facial Cleft / Craniofacial Malformations | 16 | 6476 | Risk Ratio (M‐H, Fixed, 95% CI) | 0.28 [0.16, 0.49] |
| 5 Skeletal / Limb Malformations | 16 | 6476 | Risk Ratio (M‐H, Fixed, 95% CI) | 0.33 [0.19, 0.57] |
Comparison 21. CBZ vs ZNS.
| Outcome or subgroup title | No. of studies | No. of participants | Statistical method | Effect size |
|---|---|---|---|---|
| 1 All Major Malformations | 1 | 1123 | Risk Ratio (M‐H, Fixed, 95% CI) | 5.54 [0.34, 89.86] |
| 2 Neural Tube Malformations | 0 | 0 | Risk Ratio (M‐H, Fixed, 95% CI) | 0.0 [0.0, 0.0] |
| 3 Cardiac Malformations | 0 | 0 | Risk Ratio (M‐H, Fixed, 95% CI) | 0.0 [0.0, 0.0] |
| 4 Oro‐Facial Cleft / Craniofacial Malformations | 0 | 0 | Risk Ratio (M‐H, Fixed, 95% CI) | 0.0 [0.0, 0.0] |
| 5 Skeletal / Limb Malformations | 0 | 0 | Risk Ratio (M‐H, Fixed, 95% CI) | 0.0 [0.0, 0.0] |
Comparison 22. GBP vs LTG.
| Outcome or subgroup title | No. of studies | No. of participants | Statistical method | Effect size |
|---|---|---|---|---|
| 1 All Major Malformations | 3 | 4165 | Risk Ratio (M‐H, Fixed, 95% CI) | 0.60 [0.17, 2.07] |
| 2 Neural Tube Malformations | 1 | 329 | Risk Ratio (M‐H, Fixed, 95% CI) | 0.0 [0.0, 0.0] |
| 3 Cardiac Malformations | 1 | 329 | Risk Ratio (M‐H, Fixed, 95% CI) | 3.01 [0.16, 55.67] |
| 4 Oro‐Facial Cleft / Craniofacial Malformations | 1 | 329 | Risk Ratio (M‐H, Fixed, 95% CI) | 1.92 [0.11, 33.05] |
| 5 Skeletal / Limb Malformations | 1 | 329 | Risk Ratio (M‐H, Fixed, 95% CI) | 0.0 [0.0, 0.0] |
Comparison 23. GBP vs OXC.
| Outcome or subgroup title | No. of studies | No. of participants | Statistical method | Effect size |
|---|---|---|---|---|
| 1 All Major Malformations | 2 | 353 | Risk Ratio (M‐H, Fixed, 95% CI) | 0.31 [0.04, 2.78] |
| 2 Neural Tube Malformations | 1 | 26 | Risk Ratio (M‐H, Fixed, 95% CI) | 0.0 [0.0, 0.0] |
| 3 Cardiac Malformations | 1 | 26 | Risk Ratio (M‐H, Fixed, 95% CI) | 0.0 [0.0, 0.0] |
| 4 Oro‐Facial Cleft / Craniofacial Malformations | 1 | 26 | Risk Ratio (M‐H, Fixed, 95% CI) | 0.0 [0.0, 0.0] |
| 5 Skeletal / Limb Malformations | 1 | 26 | Risk Ratio (M‐H, Fixed, 95% CI) | 0.0 [0.0, 0.0] |
Comparison 24. GBP vs PB.
| Outcome or subgroup title | No. of studies | No. of participants | Statistical method | Effect size |
|---|---|---|---|---|
| 1 All Major Malformations | 2 | 363 | Risk Ratio (M‐H, Fixed, 95% CI) | 0.12 [0.02, 0.96] |
| 2 Neural Tube Malformations | 1 | 19 | Risk Ratio (M‐H, Fixed, 95% CI) | 0.0 [0.0, 0.0] |
| 3 Cardiac Malformations | 1 | 19 | Risk Ratio (M‐H, Fixed, 95% CI) | 0.0 [0.0, 0.0] |
| 4 Oro‐Facial Cleft / Craniofacial Malformations | 1 | 19 | Risk Ratio (M‐H, Fixed, 95% CI) | 0.0 [0.0, 0.0] |
| 5 Skeletal / Limb Malformations | 1 | 19 | Risk Ratio (M‐H, Fixed, 95% CI) | 0.0 [0.0, 0.0] |
Comparison 25. GBP vs PRM.
| Outcome or subgroup title | No. of studies | No. of participants | Statistical method | Effect size |
|---|---|---|---|---|
| 1 All Major Malformations | 0 | 0 | Risk Ratio (M‐H, Fixed, 95% CI) | 0.0 [0.0, 0.0] |
| 2 Neural Tube Malformations | 0 | 0 | Risk Ratio (M‐H, Fixed, 95% CI) | 0.0 [0.0, 0.0] |
| 3 Cardiac Malformations | 0 | 0 | Risk Ratio (M‐H, Fixed, 95% CI) | 0.0 [0.0, 0.0] |
| 4 Oro‐Facial Cleft / Craniofacial Malformations | 0 | 0 | Risk Ratio (M‐H, Fixed, 95% CI) | 0.0 [0.0, 0.0] |
| 5 Skeletal / Limb Malformations | 0 | 0 | Risk Ratio (M‐H, Fixed, 95% CI) | 0.0 [0.0, 0.0] |
Comparison 26. GBP vs TPM.
| Outcome or subgroup title | No. of studies | No. of participants | Statistical method | Effect size |
|---|---|---|---|---|
| 1 All Major Malformations | 3 | 663 | Risk Ratio (M‐H, Fixed, 95% CI) | 0.32 [0.09, 1.17] |
| 2 Neural Tube Malformations | 1 | 58 | Risk Ratio (M‐H, Fixed, 95% CI) | 0.0 [0.0, 0.0] |
| 3 Cardiac Malformations | 1 | 58 | Risk Ratio (M‐H, Fixed, 95% CI) | 0.0 [0.0, 0.0] |
| 4 Oro‐Facial Cleft / Craniofacial Malformations | 1 | 58 | Risk Ratio (M‐H, Fixed, 95% CI) | 0.0 [0.0, 0.0] |
| 5 Skeletal / Limb Malformations | 1 | 58 | Risk Ratio (M‐H, Fixed, 95% CI) | 0.0 [0.0, 0.0] |
Comparison 27. GBP vs ZNS.
| Outcome or subgroup title | No. of studies | No. of participants | Statistical method | Effect size |
|---|---|---|---|---|
| 1 All Major Malformations | 1 | 235 | Risk Ratio (M‐H, Fixed, 95% CI) | 1.87 [0.08, 45.41] |
| 2 Neural Tube Malformations | 0 | 0 | Risk Ratio (M‐H, Fixed, 95% CI) | 0.0 [0.0, 0.0] |
| 3 Cardiac Malformations | 0 | 0 | Risk Ratio (M‐H, Fixed, 95% CI) | 0.0 [0.0, 0.0] |
| 4 Oro‐Facial Cleft / Craniofacial Malformations | 0 | 0 | Risk Ratio (M‐H, Fixed, 95% CI) | 0.0 [0.0, 0.0] |
| 5 Skeletal / Limb Malformations | 0 | 0 | Risk Ratio (M‐H, Fixed, 95% CI) | 0.0 [0.0, 0.0] |
Comparison 28. LEV vs GBP.
| Outcome or subgroup title | No. of studies | No. of participants | Statistical method | Effect size |
|---|---|---|---|---|
| 1 All Major Malformations | 3 | 1007 | Risk Ratio (M‐H, Fixed, 95% CI) | 1.52 [0.43, 5.42] |
| 2 Neural Tube Malformations | 1 | 77 | Risk Ratio (M‐H, Fixed, 95% CI) | 0.0 [0.0, 0.0] |
| 3 Cardiac Malformations | 1 | 77 | Risk Ratio (M‐H, Fixed, 95% CI) | 0.70 [0.03, 16.42] |
| 4 Oro‐Facial Cleft / Craniofacial Malformations | 1 | 77 | Risk Ratio (M‐H, Fixed, 95% CI) | 0.70 [0.03, 16.42] |
| 5 Skeletal / Limb Malformation | 1 | 77 | Risk Ratio (M‐H, Fixed, 95% CI) | 0.0 [0.0, 0.0] |
28.5. Analysis.

Comparison 28 LEV vs GBP, Outcome 5 Skeletal / Limb Malformation.
Comparison 29. LEV vs LTG.
| Outcome or subgroup title | No. of studies | No. of participants | Statistical method | Effect size |
|---|---|---|---|---|
| 1 All Major Malformations | 3 | 4792 | Risk Ratio (M‐H, Random, 95% CI) | 0.62 [0.20, 1.88] |
| 2 Neural Tude Malformations | 3 | 4792 | Risk Ratio (M‐H, Fixed, 95% CI) | 1.59 [0.24, 10.38] |
| 3 Cardiac Malformations | 3 | 4792 | Risk Ratio (M‐H, Fixed, 95% CI) | 0.86 [0.22, 3.36] |
| 4 Oro‐Facial Cleft / Craniofacial Malformations | 3 | 4792 | Risk Ratio (M‐H, Fixed, 95% CI) | 0.59 [0.14, 2.48] |
| 5 Skeletal / Limb Malformation | 3 | 4792 | Risk Ratio (M‐H, Fixed, 95% CI) | 0.82 [0.10, 6.80] |
Comparison 30. LEV vs OXC.
| Outcome or subgroup title | No. of studies | No. of participants | Statistical method | Effect size |
|---|---|---|---|---|
| 1 All Major Malformations | 2 | 707 | Risk Ratio (M‐H, Fixed, 95% CI) | 1.05 [0.36, 3.03] |
| 2 Neural Tube Malformations | 2 | 707 | Risk Ratio (M‐H, Fixed, 95% CI) | 1.22 [0.05, 29.74] |
| 3 Cardiac Malformations | 2 | 707 | Risk Ratio (M‐H, Fixed, 95% CI) | 0.89 [0.10, 8.21] |
| 4 Oro‐Facial Cleft / Craniofacial Malformations | 2 | 707 | Risk Ratio (M‐H, Fixed, 95% CI) | 0.27 [0.03, 2.20] |
| 5 Skeletal / Limb Malformations | 2 | 707 | Risk Ratio (M‐H, Fixed, 95% CI) | 0.14 [0.01, 3.30] |
30.3. Analysis.
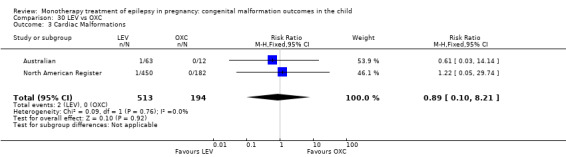
Comparison 30 LEV vs OXC, Outcome 3 Cardiac Malformations.
Comparison 31. LEV vs PB.
| Outcome or subgroup title | No. of studies | No. of participants | Statistical method | Effect size |
|---|---|---|---|---|
| 1 All Major Malformations | 2 | 717 | Risk Ratio (M‐H, Fixed, 95% CI) | 0.43 [0.20, 0.96] |
| 2 Neural Tube Malformations | 2 | 717 | Risk Ratio (M‐H, Fixed, 95% CI) | 1.33 [0.05, 32.52] |
| 3 Cardiac Malformations | 2 | 717 | Risk Ratio (M‐H, Fixed, 95% CI) | 0.11 [0.02, 0.66] |
| 4 Oro‐Facial Cleft / Craniofacial Malformations | 2 | 717 | Risk Ratio (M‐H, Fixed, 95% CI) | 0.08 [0.01, 0.67] |
| 5 Skeletal / Limb Malformation | 2 | 717 | Risk Ratio (M‐H, Fixed, 95% CI) | 0.15 [0.01, 3.61] |
Comparison 32. LEV vs PHT.
| Outcome or subgroup title | No. of studies | No. of participants | Statistical method | Effect size |
|---|---|---|---|---|
| 1 All Major Malformations | 3 | 1383 | Risk Ratio (M‐H, Fixed, 95% CI) | 0.49 [0.26, 0.92] |
| 2 Neural Tube Malformations | 3 | 1359 | Risk Ratio (M‐H, Fixed, 95% CI) | 0.81 [0.12, 5.34] |
| 3 Cardiac Malformations | 3 | 1359 | Risk Ratio (M‐H, Fixed, 95% CI) | 0.26 [0.06, 1.09] |
| 4 Oro‐Facial Cleft / Craniofacial Malformations | 3 | 1359 | Risk Ratio (M‐H, Fixed, 95% CI) | 0.35 [0.08, 1.56] |
| 5 Skeletal / Limb Malformations | 3 | 1359 | Risk Ratio (M‐H, Fixed, 95% CI) | 0.10 [0.01, 1.90] |
Comparison 33. LEV vs PRM.
| Outcome or subgroup title | No. of studies | No. of participants | Statistical method | Effect size |
|---|---|---|---|---|
| 1 All Major Malformations | 0 | 0 | Risk Ratio (M‐H, Fixed, 95% CI) | 0.0 [0.0, 0.0] |
| 2 Neural Tube Malformations | 0 | 0 | Risk Ratio (M‐H, Fixed, 95% CI) | 0.0 [0.0, 0.0] |
| 3 Cardiac Malformations | 0 | 0 | Risk Ratio (M‐H, Fixed, 95% CI) | 0.0 [0.0, 0.0] |
| 4 Oro‐Facial Cleft / Craniofacial Malformations | 0 | 0 | Risk Ratio (M‐H, Fixed, 95% CI) | 0.0 [0.0, 0.0] |
| 5 Skeletal / Limb Malformations | 0 | 0 | Risk Ratio (M‐H, Fixed, 95% CI) | 0.0 [0.0, 0.0] |
Comparison 34. LEV vs TPM.
| Outcome or subgroup title | No. of studies | No. of participants | Statistical method | Effect size |
|---|---|---|---|---|
| 1 All Major Malformations | 3 | 1290 | Risk Ratio (M‐H, Fixed, 95% CI) | 0.50 [0.26, 0.97] |
| 2 Neural Tube Malformations | 3 | 1290 | Risk Ratio (M‐H, Fixed, 95% CI) | 2.39 [0.10, 58.61] |
| 3 Cardiac Malformations | 3 | 1290 | Risk Ratio (M‐H, Fixed, 95% CI) | 1.25 [0.16, 9.54] |
| 4 Oro‐Facial Cleft / Craniofacial Malformations | 3 | 1290 | Risk Ratio (M‐H, Fixed, 95% CI) | 0.17 [0.04, 0.68] |
| 5 Skeletal / Limb Malformations | 3 | 1290 | Risk Ratio (M‐H, Fixed, 95% CI) | 0.07 [0.00, 1.31] |
34.3. Analysis.
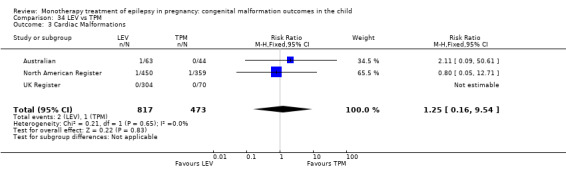
Comparison 34 LEV vs TPM, Outcome 3 Cardiac Malformations.
Comparison 35. LEV vs ZNS.
| Outcome or subgroup title | No. of studies | No. of participants | Statistical method | Effect size |
|---|---|---|---|---|
| 1 All Major Malformations | 1 | 540 | Risk Ratio (M‐H, Fixed, 95% CI) | 4.64 [0.28, 78.05] |
| 2 Neural Tube Malformations | 0 | 0 | Risk Ratio (M‐H, Fixed, 95% CI) | 0.0 [0.0, 0.0] |
| 3 Cardiac Malformations | 0 | 0 | Risk Ratio (M‐H, Fixed, 95% CI) | 0.0 [0.0, 0.0] |
| 4 Oro‐Facial Cleft / Craniofacial Malformations | 0 | 0 | Risk Ratio (M‐H, Fixed, 95% CI) | 0.0 [0.0, 0.0] |
| 5 Skeletal / Limb Malformations | 0 | 0 | Risk Ratio (M‐H, Fixed, 95% CI) | 0.0 [0.0, 0.0] |
Comparison 36. LTG vs OXC.
| Outcome or subgroup title | No. of studies | No. of participants | Statistical method | Effect size |
|---|---|---|---|---|
| 1 All Major Malformations | 2 | 2071 | Risk Ratio (M‐H, Fixed, 95% CI) | 0.93 [0.35, 2.43] |
| 2 Neural Tube Malformations | 2 | 2071 | Risk Ratio (M‐H, Fixed, 95% CI) | 0.59 [0.03, 12.15] |
| 3 Cardiac Malformation | 2 | 2071 | Risk Ratio (M‐H, Fixed, 95% CI) | 0.54 [0.07, 4.30] |
| 4 Oro‐Facial Cleft / Craniofacial Malformations | 2 | 2071 | Risk Ratio (M‐H, Fixed, 95% CI) | 0.69 [0.13, 3.71] |
| 5 Skeletal / Limb Malformation | 2 | 2071 | Risk Ratio (M‐H, Fixed, 95% CI) | 0.23 [0.02, 2.56] |
Comparison 37. LTG vs PB.
| Outcome or subgroup title | No. of studies | No. of participants | Statistical method | Effect size |
|---|---|---|---|---|
| 1 All Major Malformations | 4 | 2241 | Risk Ratio (M‐H, Fixed, 95% CI) | 0.32 [0.17, 0.61] |
| 2 Neural Tube Malformations | 3 | 2174 | Risk Ratio (M‐H, Fixed, 95% CI) | 0.64 [0.03, 13.28] |
| 3 Cardiac Malformations | 3 | 2174 | Risk Ratio (M‐H, Fixed, 95% CI) | 0.14 [0.04, 0.42] |
| 4 Oro‐Facial Cleft / Craniofacial Malformations | 3 | 2174 | Risk Ratio (M‐H, Fixed, 95% CI) | 0.22 [0.07, 0.68] |
| 5 Skeletal / Limb Malformations | 3 | 2174 | Risk Ratio (M‐H, Fixed, 95% CI) | 0.25 [0.02, 2.80] |
Comparison 38. LTG vs PHT.
| Outcome or subgroup title | No. of studies | No. of participants | Statistical method | Effect size |
|---|---|---|---|---|
| 1 All Major Malformations | 5 | 4706 | Risk Ratio (M‐H, Fixed, 95% CI) | 0.53 [0.34, 0.84] |
| 2 Neural Tube Malformations | 4 | 4671 | Risk Ratio (M‐H, Fixed, 95% CI) | 0.31 [0.07, 1.34] |
| 3 Cardiac Malformations | 4 | 4671 | Risk Ratio (M‐H, Fixed, 95% CI) | 0.35 [0.14, 0.92] |
| 4 Oro‐Facial Cleft / Craniofacial Malformations | 4 | 4671 | Risk Ratio (M‐H, Fixed, 95% CI) | 0.75 [0.24, 2.34] |
| 5 Skeletal / Limb Malformations | 4 | 4671 | Risk Ratio (M‐H, Fixed, 95% CI) | 0.15 [0.03, 0.66] |
Comparison 39. LTG vs TPM.
| Outcome or subgroup title | No. of studies | No. of participants | Statistical method | Effect size |
|---|---|---|---|---|
| 1 All Major Malformations | 3 | 4448 | Risk Ratio (M‐H, Fixed, 95% CI) | 0.56 [0.34, 0.94] |
| 2 Neural Tube Malformations | 3 | 4448 | Risk Ratio (M‐H, Fixed, 95% CI) | 0.62 [0.08, 4.94] |
| 3 Cardiac Malformations | 3 | 4448 | Risk Ratio (M‐H, Fixed, 95% CI) | 0.75 [0.17, 3.42] |
| 4 Oro‐Facial Cleft / Craniofacial Malformations | 3 | 4448 | Risk Ratio (M‐H, Random, 95% CI) | 0.22 [0.03, 1.56] |
| 5 Skeletal / Limb Malformations | 3 | 4448 | Risk Ratio (M‐H, Fixed, 95% CI) | 0.11 [0.03, 0.45] |
Comparison 40. PHT vs GBP.
| Outcome or subgroup title | No. of studies | No. of participants | Statistical method | Effect size |
|---|---|---|---|---|
| 1 All Major Malformations | 3 | 756 | Risk Ratio (M‐H, Fixed, 95% CI) | 2.81 [0.77, 10.23] |
| 2 Neural Tube Malformations | 1 | 58 | Risk Ratio (M‐H, Fixed, 95% CI) | 1.0 [0.04, 23.26] |
| 3 Cardiac Malformations | 1 | 58 | Risk Ratio (M‐H, Fixed, 95% CI) | 1.0 [0.04, 23.26] |
| 4 Oro‐Facial Cleft / Craniofacial Malformations | 1 | 58 | Risk Ratio (M‐H, Fixed, 95% CI) | 0.0 [0.0, 0.0] |
| 5 Skeletal / Limb Malformations | 1 | 58 | Risk Ratio (M‐H, Fixed, 95% CI) | 0.0 [0.0, 0.0] |
Comparison 41. PHT vs OXC.
| Outcome or subgroup title | No. of studies | No. of participants | Statistical method | Effect size |
|---|---|---|---|---|
| 1 All Major Malformations | 3 | 787 | Risk Ratio (M‐H, Fixed, 95% CI) | 1.08 [0.43, 2.71] |
| 2 Neural Tube Malformations | 3 | 787 | Risk Ratio (M‐H, Fixed, 95% CI) | 0.87 [0.04, 20.03] |
| 3 Cardiac Malformations | 3 | 787 | Risk Ratio (M‐H, Fixed, 95% CI) | 2.32 [0.30, 18.27] |
| 4 Oro‐Facial Cleft / Craniofacial Malformations | 3 | 787 | Risk Ratio (M‐H, Fixed, 95% CI) | 0.62 [0.10, 4.05] |
| 5 Skeletal / Limb Malformations | 3 | 787 | Risk Ratio (M‐H, Fixed, 95% CI) | 1.75 [0.20, 15.55] |
Comparison 42. PHT vs PB.
| Outcome or subgroup title | No. of studies | No. of participants | Statistical method | Effect size |
|---|---|---|---|---|
| 1 All Major Malformations | 18 | 1483 | Risk Ratio (M‐H, Fixed, 95% CI) | 0.80 [0.53, 1.21] |
| 2 Neural Tube Malformations | 10 | 936 | Risk Ratio (M‐H, Fixed, 95% CI) | 0.4 [0.02, 8.75] |
| 3 Cardiac Malformations | 10 | 1065 | Risk Ratio (M‐H, Fixed, 95% CI) | 0.33 [0.16, 0.71] |
| 4 Oro‐Facial Cleft / Craniofacial Malformations | 10 | 936 | Risk Ratio (M‐H, Fixed, 95% CI) | 0.25 [0.07, 0.82] |
| 5 Skeletal / Limb Malformations | 10 | 936 | Risk Ratio (M‐H, Fixed, 95% CI) | 1.45 [0.40, 5.22] |
Comparison 43. PHT vs TPM.
| Outcome or subgroup title | No. of studies | No. of participants | Statistical method | Effect size |
|---|---|---|---|---|
| 1 All Major Malformations | 3 | 1039 | Risk Ratio (M‐H, Fixed, 95% CI) | 0.90 [0.49, 1.67] |
| 2 Neural Tube Malformations | 3 | 1015 | Risk Ratio (M‐H, Fixed, 95% CI) | 3.0 [0.13, 71.70] |
| 3 Cardiac Malformations | 3 | 1015 | Risk Ratio (M‐H, Fixed, 95% CI) | 3.12 [0.65, 14.93] |
| 4 Oro‐Facial Cleft / Craniofacial Malformations | 3 | 1015 | Risk Ratio (M‐H, Fixed, 95% CI) | 0.37 [0.10, 1.42] |
| 5 Skeletal / Limb Malformations | 3 | 1015 | Risk Ratio (M‐H, Fixed, 95% CI) | 0.69 [0.19, 2.55] |
Comparison 44. PB vs OXC.
| Outcome or subgroup title | No. of studies | No. of participants | Statistical method | Effect size |
|---|---|---|---|---|
| 1 All Major Malformations | 4 | 452 | Risk Ratio (M‐H, Fixed, 95% CI) | 2.52 [0.98, 6.43] |
| 2 Neural Tube Malformations | 3 | 438 | Risk Ratio (M‐H, Fixed, 95% CI) | 0.0 [0.0, 0.0] |
| 3 Cardiac Malformations | 3 | 438 | Risk Ratio (M‐H, Fixed, 95% CI) | 11.77 [1.24, 111.80] |
| 4 Oro‐Facial Cleft / Craniofacial Malformations | 3 | 438 | Risk Ratio (M‐H, Fixed, 95% CI) | 3.66 [0.41, 32.43] |
| 5 Skeletal / Limb Malformations | 3 | 438 | Risk Ratio (M‐H, Fixed, 95% CI) | 0.91 [0.06, 14.52] |
Comparison 45. PB vs TPM.
| Outcome or subgroup title | No. of studies | No. of participants | Statistical method | Effect size |
|---|---|---|---|---|
| 1 All Major Malformations | 2 | 607 | Risk Ratio (M‐H, Fixed, 95% CI) | 1.36 [0.65, 2.84] |
| 2 Neural Tube Malformations | 2 | 607 | Risk Ratio (M‐H, Fixed, 95% CI) | 0.0 [0.0, 0.0] |
| 3 Cardiac Malformations | 2 | 607 | Risk Ratio (M‐H, Fixed, 95% CI) | 9.02 [1.06, 76.67] |
| 4 Oro‐Facial Cleft / Craniofacial Malformations | 2 | 607 | Risk Ratio (M‐H, Fixed, 95% CI) | 1.44 [0.39, 5.31] |
| 5 Skeletal / Limb Malformations | 2 | 607 | Risk Ratio (M‐H, Fixed, 95% CI) | 0.36 [0.04, 3.07] |
Comparison 46. VPA vs GBP.
| Outcome or subgroup title | No. of studies | No. of participants | Statistical method | Effect size |
|---|---|---|---|---|
| 1 All Major Malformations | 3 | 2004 | Risk Ratio (M‐H, Fixed, 95% CI) | 6.21 [1.91, 20.23] |
| 2 Neural Tube Malformations | 1 | 285 | Risk Ratio (M‐H, Fixed, 95% CI) | 0.83 [0.05, 13.81] |
| 3 Cardiac Malformations | 1 | 285 | Risk Ratio (M‐H, Fixed, 95% CI) | 1.16 [0.07, 18.84] |
| 4 Oro‐Facial Cleft / Craniofacial Malformations | 1 | 285 | Risk Ratio (M‐H, Fixed, 95% CI) | 1.38 [0.09, 22.19] |
| 5 Skeletal / Limb Malformations | 1 | 285 | Risk Ratio (M‐H, Fixed, 95% CI) | 0.72 [0.04, 12.14] |
Comparison 47. VPA vs LEV.
| Outcome or subgroup title | No. of studies | No. of participants | Statistical method | Effect size |
|---|---|---|---|---|
| 1 All Major Malformations | 3 | 2631 | Risk Ratio (M‐H, Fixed, 95% CI) | 5.82 [3.13, 10.81] |
| 2 Neural Tube Malformations | 3 | 2631 | Risk Ratio (M‐H, Fixed, 95% CI) | 5.28 [1.17, 23.83] |
| 3 Cardiac Malformations | 3 | 2631 | Risk Ratio (M‐H, Fixed, 95% CI) | 5.79 [1.67, 20.16] |
| 4 Oro‐Facial Cleft / Craniofacial Malformations | 3 | 2631 | Risk Ratio (M‐H, Fixed, 95% CI) | 5.34 [1.33, 21.39] |
| 5 Skeletal / Limb Malformations | 3 | 2631 | Risk Ratio (M‐H, Fixed, 95% CI) | 6.45 [1.33, 31.16] |
Comparison 48. VPA vs LTG.
| Outcome or subgroup title | No. of studies | No. of participants | Statistical method | Effect size |
|---|---|---|---|---|
| 1 All Major Malformations | 7 | 6185 | Risk Ratio (M‐H, Fixed, 95% CI) | 3.56 [2.77, 4.58] |
| 2 Neural Tube Malformations | 6 | 6151 | Risk Ratio (M‐H, Fixed, 95% CI) | 9.09 [3.56, 23.22] |
| 3 Cardiac Malformations | 6 | 6151 | Risk Ratio (M‐H, Fixed, 95% CI) | 4.07 [2.33, 7.09] |
| 4 Oro‐Facial Cleft / Craniofacial Malformations | 6 | 6151 | Risk Difference (M‐H, Fixed, 95% CI) | 0.01 [0.01, 0.02] |
| 5 Skeletal / Limb Malformations | 6 | 6151 | Risk Ratio (M‐H, Fixed, 95% CI) | 7.17 [2.99, 17.18] |
Comparison 49. VPA vs TPM.
| Outcome or subgroup title | No. of studies | No. of participants | Statistical method | Effect size |
|---|---|---|---|---|
| 1 All Major Malformations | 3 | 2287 | Risk Ratio (M‐H, Fixed, 95% CI) | 2.35 [1.40, 3.95] |
| 2 Neural Tube Malformations | 3 | 2287 | Risk Ratio (M‐H, Fixed, 95% CI) | 3.67 [0.79, 17.08] |
| 3 Cardiac Malformations | 3 | 2287 | Risk Ratio (M‐H, Fixed, 95% CI) | 4.73 [1.21, 18.49] |
| 4 Oro‐Facial Cleft / Craniofacial Malformations | 3 | 2287 | Risk Ratio (M‐H, Fixed, 95% CI) | 0.98 [0.40, 2.40] |
| 5 Skeletal / Limb Malformation | 3 | 2287 | Risk Ratio (M‐H, Fixed, 95% CI) | 1.26 [0.44, 3.61] |
Comparison 50. VPA vs OXC.
| Outcome or subgroup title | No. of studies | No. of participants | Statistical method | Effect size |
|---|---|---|---|---|
| 1 All Major Malformations | 4 | 914 | Risk Ratio (M‐H, Fixed, 95% CI) | 3.71 [1.65, 8.33] |
| 2 Neural Tube Malformations | 4 | 914 | Risk Ratio (M‐H, Fixed, 95% CI) | 1.89 [0.39, 9.07] |
| 3 Cardiac Malformations | 4 | 914 | Risk Ratio (M‐H, Fixed, 95% CI) | 3.41 [0.87, 13.37] |
| 4 Oro‐Facial Cleft / Craniofacial Malformations | 4 | 914 | Risk Ratio (M‐H, Fixed, 95% CI) | 2.17 [0.63, 7.47] |
| 5 Skeletal / Limb Malformations | 4 | 914 | Risk Ratio (M‐H, Fixed, 95% CI) | 1.49 [0.36, 6.22] |
Comparison 51. VPA vs PB.
| Outcome or subgroup title | No. of studies | No. of participants | Statistical method | Effect size |
|---|---|---|---|---|
| 1 All Major Malformations | 20 | 1763 | Risk Ratio (M‐H, Fixed, 95% CI) | 1.59 [1.11, 2.29] |
| 2 Neural Tube Malformations | 11 | 1225 | Risk Difference (M‐H, Random, 95% CI) | 0.05 [‐0.00, 0.10] |
| 3 Cardiac Malformations | 11 | 1324 | Risk Ratio (M‐H, Fixed, 95% CI) | 0.76 [0.42, 1.38] |
| 4 Oro‐Facial Cleft / Craniofacial Malformations | 11 | 1225 | Risk Ratio (M‐H, Fixed, 95% CI) | 0.54 [0.22, 1.33] |
| 5 Skeletal / Limb Malformations | 11 | 1225 | Risk Ratio (M‐H, Fixed, 95% CI) | 1.98 [0.79, 4.98] |
Comparison 52. VPA vs PHT.
| Outcome or subgroup title | No. of studies | No. of participants | Statistical method | Effect size |
|---|---|---|---|---|
| 1 All Major Malformations | 21 | 3456 | Risk Ratio (M‐H, Fixed, 95% CI) | 2.00 [1.48, 2.71] |
| 2 Neural Tube Malformations | 13 | 2961 | Risk Ratio (M‐H, Fixed, 95% CI) | 4.47 [1.79, 11.17] |
| 3 Cardiac Malformations | 13 | 3121 | Risk Ratio (M‐H, Fixed, 95% CI) | 2.93 [1.50, 5.72] |
| 4 Oro‐Facial Cleft / Craniofacial Malformations | 13 | 2961 | Risk Ratio (M‐H, Fixed, 95% CI) | 2.37 [0.95, 5.96] |
| 5 Skeletal / Limb Malformations | 13 | 2961 | Risk Ratio (M‐H, Fixed, 95% CI) | 1.98 [0.93, 4.21] |
Comparison 53. LTG vs PRM.
| Outcome or subgroup title | No. of studies | No. of participants | Statistical method | Effect size |
|---|---|---|---|---|
| 1 All Major Malformations | 0 | 0 | Risk Ratio (M‐H, Fixed, 95% CI) | 0.0 [0.0, 0.0] |
| 2 Neural Tube Malformations | 0 | 0 | Risk Ratio (M‐H, Fixed, 95% CI) | 0.0 [0.0, 0.0] |
| 3 Cardiac Malformations | 0 | 0 | Risk Ratio (M‐H, Fixed, 95% CI) | 0.0 [0.0, 0.0] |
| 4 Oro‐Facial Cleft / Craniofacial Malformations | 0 | 0 | Risk Ratio (M‐H, Fixed, 95% CI) | 0.0 [0.0, 0.0] |
| 5 Skeletal / Limb Malformations | 0 | 0 | Risk Ratio (M‐H, Fixed, 95% CI) | 0.0 [0.0, 0.0] |
Comparison 54. PHT vs PRM.
| Outcome or subgroup title | No. of studies | No. of participants | Statistical method | Effect size |
|---|---|---|---|---|
| 1 All Major Malformations | 5 | 417 | Risk Ratio (M‐H, Fixed, 95% CI) | 0.82 [0.40, 1.68] |
| 2 Neural Tube Malformations | 2 | 75 | Risk Ratio (M‐H, Fixed, 95% CI) | 0.0 [0.0, 0.0] |
| 3 Cardiac Malformations | 2 | 75 | Risk Ratio (M‐H, Fixed, 95% CI) | 0.38 [0.02, 8.88] |
| 4 Oro‐Facial Cleft / Craniofacial Malformations | 2 | 75 | Risk Ratio (M‐H, Fixed, 95% CI) | 0.0 [0.0, 0.0] |
| 5 Skeletal / Limb Malformations | 2 | 75 | Risk Ratio (M‐H, Fixed, 95% CI) | 3.38 [0.14, 79.95] |
Comparison 55. PB vs PRM.
| Outcome or subgroup title | No. of studies | No. of participants | Statistical method | Effect size |
|---|---|---|---|---|
| 1 All Major Malformations | 6 | 351 | Risk Ratio (M‐H, Fixed, 95% CI) | 0.50 [0.21, 1.16] |
| 2 Neural Tube Malformations | 2 | 134 | Risk Ratio (M‐H, Fixed, 95% CI) | 0.0 [0.0, 0.0] |
| 3 Cardiac Malformations | 2 | 134 | Risk Ratio (M‐H, Fixed, 95% CI) | 0.42 [0.03, 6.55] |
| 4 Oro‐Facial Cleft / Craniofacial Malformations | 2 | 134 | Risk Ratio (M‐H, Fixed, 95% CI) | 0.0 [0.0, 0.0] |
| 5 Skeletal / Limb Malformations | 2 | 134 | Risk Ratio (M‐H, Fixed, 95% CI) | 1.29 [0.05, 30.82] |
Comparison 56. LTG vs ZNS.
| Outcome or subgroup title | No. of studies | No. of participants | Statistical method | Effect size |
|---|---|---|---|---|
| 1 All Major Malformations | 1 | 1652 | Risk Ratio (M‐H, Fixed, 95% CI) | 3.67 [0.23, 59.46] |
| 2 Neural Tube Malformations | 0 | 0 | Risk Ratio (M‐H, Fixed, 95% CI) | 0.0 [0.0, 0.0] |
| 3 Cardiac Malformations | 0 | 0 | Risk Ratio (M‐H, Fixed, 95% CI) | 0.0 [0.0, 0.0] |
| 4 Oro‐Facial Cleft / Craniofacial Malformations | 0 | 0 | Risk Ratio (M‐H, Fixed, 95% CI) | 0.0 [0.0, 0.0] |
| 5 Skeletal / Limb Malformations | 0 | 0 | Risk Ratio (M‐H, Fixed, 95% CI) | 0.0 [0.0, 0.0] |
Comparison 57. OXC vs PRM.
| Outcome or subgroup title | No. of studies | No. of participants | Statistical method | Effect size |
|---|---|---|---|---|
| 1 All Major Malformations | 1 | 15 | Risk Ratio (M‐H, Fixed, 95% CI) | 0.67 [0.05, 8.73] |
| 2 Neural Tube Malformations | 0 | 0 | Risk Ratio (M‐H, Fixed, 95% CI) | 0.0 [0.0, 0.0] |
| 3 Cardiac Malformations | 0 | 0 | Risk Ratio (M‐H, Fixed, 95% CI) | 0.0 [0.0, 0.0] |
| 4 Oro‐Facial Cleft / Craniofacial Malformations | 0 | 0 | Risk Ratio (M‐H, Fixed, 95% CI) | 0.0 [0.0, 0.0] |
| 5 Skeletal / Limb Malformations | 0 | 0 | Risk Ratio (M‐H, Fixed, 95% CI) | 0.0 [0.0, 0.0] |
Comparison 58. OXC vs TPM.
| Outcome or subgroup title | No. of studies | No. of participants | Statistical method | Effect size |
|---|---|---|---|---|
| 1 All Major Malformations | 2 | 597 | Risk Ratio (M‐H, Fixed, 95% CI) | 0.57 [0.20, 1.57] |
| 2 Neural Tube Malformations | 2 | 597 | Risk Ratio (M‐H, Fixed, 95% CI) | 0.0 [0.0, 0.0] |
| 3 Cardiac Malformations | 2 | 597 | Risk Ratio (M‐H, Fixed, 95% CI) | 0.66 [0.03, 16.02] |
| 4 Oro‐Facial Cleft / Craniofacial Malformations | 2 | 597 | Risk Ratio (M‐H, Fixed, 95% CI) | 0.39 [0.05, 3.35] |
| 5 Skeletal / Limb Malformations | 2 | 597 | Risk Ratio (M‐H, Fixed, 95% CI) | 0.39 [0.05, 3.35] |
Comparison 59. OXC vs ZNS.
| Outcome or subgroup title | No. of studies | No. of participants | Statistical method | Effect size |
|---|---|---|---|---|
| 1 All Major Malformations | 1 | 272 | Risk Ratio (M‐H, Fixed, 95% CI) | 4.48 [0.24, 82.23] |
| 2 Neural Tube Malformations | 0 | 0 | Risk Ratio (M‐H, Fixed, 95% CI) | 0.0 [0.0, 0.0] |
| 3 Cardiac Malformations | 0 | 0 | Risk Ratio (M‐H, Fixed, 95% CI) | 0.0 [0.0, 0.0] |
| 4 Oro‐Facial Cleft / Craniofacial Malformations | 0 | 0 | Risk Ratio (M‐H, Fixed, 95% CI) | 0.0 [0.0, 0.0] |
| 5 Skeletal / Limb Malformations | 0 | 0 | Risk Ratio (M‐H, Fixed, 95% CI) | 0.0 [0.0, 0.0] |
Comparison 60. PB vs ZNS.
| Outcome or subgroup title | No. of studies | No. of participants | Statistical method | Effect size |
|---|---|---|---|---|
| 1 All Major Malformations | 1 | 289 | Risk Ratio (M‐H, Fixed, 95% CI) | 10.47 [0.62, 175.67] |
| 2 Neural Tube Malformations | 0 | 0 | Risk Ratio (M‐H, Fixed, 95% CI) | 0.0 [0.0, 0.0] |
| 3 Cardiac Malformations | 0 | 0 | Risk Ratio (M‐H, Fixed, 95% CI) | 0.0 [0.0, 0.0] |
| 4 Oro‐Facial Cleft / Craniofacial Malformations | 0 | 0 | Risk Ratio (M‐H, Fixed, 95% CI) | 0.0 [0.0, 0.0] |
| 5 Skeletal / Limb Malformations | 0 | 0 | Risk Ratio (M‐H, Fixed, 95% CI) | 0.0 [0.0, 0.0] |
Comparison 61. PHT vs ZNS.
| Outcome or subgroup title | No. of studies | No. of participants | Statistical method | Effect size |
|---|---|---|---|---|
| 1 All Major Malformations | 1 | 506 | Risk Ratio (M‐H, Fixed, 95% CI) | 5.46 [0.33, 91.31] |
| 2 Neural Tube Malformations | 0 | 0 | Risk Ratio (M‐H, Fixed, 95% CI) | 0.0 [0.0, 0.0] |
| 3 Cardiac Malformations | 0 | 0 | Risk Ratio (M‐H, Fixed, 95% CI) | 0.0 [0.0, 0.0] |
| 4 Oro‐Facial Cleft / Craniofacial Malformations | 0 | 0 | Risk Ratio (M‐H, Fixed, 95% CI) | 0.0 [0.0, 0.0] |
| 5 Skeletal / Limb Malformations | 0 | 0 | Risk Ratio (M‐H, Fixed, 95% CI) | 0.0 [0.0, 0.0] |
Comparison 62. PRM vs TPM.
| Outcome or subgroup title | No. of studies | No. of participants | Statistical method | Effect size |
|---|---|---|---|---|
| 1 All Major Malformations | 0 | 0 | Risk Ratio (M‐H, Fixed, 95% CI) | 0.0 [0.0, 0.0] |
| 2 Neural Tube Malformations | 0 | 0 | Risk Ratio (M‐H, Fixed, 95% CI) | 0.0 [0.0, 0.0] |
| 3 Cardiac Malformations | 0 | 0 | Risk Ratio (M‐H, Fixed, 95% CI) | 0.0 [0.0, 0.0] |
| 4 Oro‐Facial Cleft / Craniofacial Malformations | 0 | 0 | Risk Ratio (M‐H, Fixed, 95% CI) | 0.0 [0.0, 0.0] |
| 5 Skeletal / Limb Malformations | 0 | 0 | Risk Ratio (M‐H, Fixed, 95% CI) | 0.0 [0.0, 0.0] |
Comparison 63. PRM vs VPA.
| Outcome or subgroup title | No. of studies | No. of participants | Statistical method | Effect size |
|---|---|---|---|---|
| 1 All Major Malformations | 5 | 302 | Risk Ratio (M‐H, Fixed, 95% CI) | 0.72 [0.37, 1.40] |
| 2 Neural Tube Malformations | 2 | 84 | Risk Ratio (M‐H, Fixed, 95% CI) | 0.11 [0.01, 1.99] |
| 3 Cardiac Malformations | 2 | 84 | Risk Ratio (M‐H, Fixed, 95% CI) | 3.75 [0.16, 89.32] |
| 4 Oro‐Facial Cleft / Craniofacial Malformations | 2 | 84 | Risk Ratio (M‐H, Fixed, 95% CI) | 0.0 [0.0, 0.0] |
| 5 Skeletal / Limb Malformations | 2 | 84 | Risk Ratio (M‐H, Fixed, 95% CI) | 0.42 [0.02, 9.92] |
Comparison 64. PRM vs ZNS.
| Outcome or subgroup title | No. of studies | No. of participants | Statistical method | Effect size |
|---|---|---|---|---|
| 1 All Major Malformations | 0 | 0 | Risk Ratio (M‐H, Fixed, 95% CI) | 0.0 [0.0, 0.0] |
| 2 Neural Tube Malformations | 0 | 0 | Risk Ratio (M‐H, Fixed, 95% CI) | 0.0 [0.0, 0.0] |
| 3 Cardiac Malformations | 0 | 0 | Risk Ratio (M‐H, Fixed, 95% CI) | 0.0 [0.0, 0.0] |
| 4 Oro‐Facial Cleft / Craniofacial Malformations | 0 | 0 | Risk Ratio (M‐H, Fixed, 95% CI) | 0.0 [0.0, 0.0] |
| 5 Skeletal / Limb Malformations | 0 | 0 | Risk Ratio (M‐H, Fixed, 95% CI) | 0.0 [0.0, 0.0] |
Comparison 65. TPM vs ZNS.
| Outcome or subgroup title | No. of studies | No. of participants | Statistical method | Effect size |
|---|---|---|---|---|
| 1 All Major Malformations | 1 | 449 | Risk Ratio (M‐H, Fixed, 95% CI) | 7.84 [0.47, 129.74] |
| 2 Neural Tube Malformations | 0 | 0 | Risk Ratio (M‐H, Fixed, 95% CI) | 0.0 [0.0, 0.0] |
| 3 Cardiac Malformations | 0 | 0 | Risk Ratio (M‐H, Fixed, 95% CI) | 0.0 [0.0, 0.0] |
| 4 Oro‐Facial Cleft / Craniofacial Malformations | 0 | 0 | Risk Ratio (M‐H, Fixed, 95% CI) | 0.0 [0.0, 0.0] |
| 5 Skeletal / Limb Malformations | 0 | 0 | Risk Ratio (M‐H, Fixed, 95% CI) | 0.0 [0.0, 0.0] |
Comparison 66. VPA vs ZNS.
| Outcome or subgroup title | No. of studies | No. of participants | Statistical method | Effect size |
|---|---|---|---|---|
| 1 All Major Malformations | 1 | 413 | Risk Ratio (M‐H, Fixed, 95% CI) | 17.13 [1.06, 277.48] |
| 2 Neural Tube Malformations | 0 | 0 | Risk Ratio (M‐H, Fixed, 95% CI) | 0.0 [0.0, 0.0] |
| 3 Cardiac Malformations | 0 | 0 | Risk Ratio (M‐H, Fixed, 95% CI) | 0.0 [0.0, 0.0] |
| 4 Oro‐Facial Cleft / Craniofacial Malformations | 0 | 0 | Risk Ratio (M‐H, Fixed, 95% CI) | 0.0 [0.0, 0.0] |
| 5 Skeletal / Limb Malformations | 0 | 0 | Risk Ratio (M‐H, Fixed, 95% CI) | 0.0 [0.0, 0.0] |
Characteristics of studies
Characteristics of included studies [ordered by study ID]
Al Bunyan 1999.
| Methods | A single‐centre prospective registry study (Saudi Arabia) | |
| Participants | 79 children enrolled, all were analysed. | |
| Interventions | Intervention group (monotherapy): 1) CBZ (N = 31) 2) PHT (N = 9) 3) VPA (N = 5) 4) PB (N = 2) Control group: 1) Women with epilepsy not taking any AEDs (N = 10) |
|
| Outcomes | 1) Apgar score 2) Birth weight 3) Birth length 4) Head circumference 5) Congenital malformations 6) Pregnancy outcome AEDs were analysed together. |
|
| Notes | Protocol requested ‐ no response received | |
| Risk of bias | ||
| Bias | Authors' judgement | Support for judgement |
| Random sequence generation (selection bias) | Unclear risk | High in bias due to non‐randomised design |
| Allocation concealment (selection bias) | Unclear risk | High in bias due to non‐randomised design |
| Confounding variables | High risk | Rated 4 as some confounders were considered but not adjusted for |
| Blinding | High risk | Rated 5 as no methods of blinding employed |
| Incomplete outcome data (attrition bias) All outcomes | Low risk | Rated 1 as no missing data |
| Selective reporting (reporting bias) | Low risk | Rated 2 as no evidence of selective reporting, no protocol available |
| Other bias | High risk | Rated 5 as dose not investigated, unclear gestational age at enrolment, unclear if children with genetic syndromes were excluded. |
Arulmozhi 2006.
| Methods | A prospective study (India) | |
| Participants | 63 children enrolled in the study. 60 children reviewed and analysed: 1) Offspring of women taking AEDs‐ 30 children 2) Offspring of women without epilepsy |
|
| Interventions | Intervention group: 1) CBZ (N = 7) 2) PHT (N = 18) 3) VPA (N = 3) Control group: 1) no medication (in women without epilepsy) (N = 30) |
|
| Outcomes | 1) Physical growth 2) Psychomotor development 3) Congenital malformations AEDs were analysed together. |
|
| Notes | Of the 3 children not analysed, 2 were lost to follow‐up after delivery and 1 was aborted. Protocol requested ‐ no response received. |
|
| Risk of bias | ||
| Bias | Authors' judgement | Support for judgement |
| Random sequence generation (selection bias) | High risk | High in bias due to non‐randomised design |
| Allocation concealment (selection bias) | High risk | High in bias due to non‐randomised design |
| Confounding variables | High risk | Rated 4 as some confounders were considered but not adjusted for |
| Blinding | Unclear risk | No details of blinding in text |
| Incomplete outcome data (attrition bias) All outcomes | Low risk | Rated 2 as small amount of missing data, unlikely to affect outcome |
| Selective reporting (reporting bias) | Unclear risk | Rated 3 as malformation data reported in narrative form, it was not stipulated in the methods section that the outcomes would be reported, only birthweight and head circumference etc. |
| Other bias | High risk | Rated 5 as AEDs not analysed separately, no consideration of dose of AED, unclear if children with genetic syndromes were excluded |
Australian.
| Methods | A prospective study (Australia) | |
| Participants | 1317 pregnancies were examined including:‐ 1) Women with epilepsy treated with AED 2) Women in whom AED was prescribed for other non‐epilepsy indications 3) Women untreated at least in the first half of their pregnancy |
|
| Interventions | Intervention groups (monotherapy): 1) CBZ (N = 361) 2) VPA (N = 271) 3) LTG (N = 315) 4) TPM (N = 44) 5) PHT (N = 44) 6) LEV (N = 63) 7) OXC (N = 12) 8) PB (N = 5) 9) GBP (N = 14) Control group: 1) Women with epilepsy not taking any AEDs (N = 147) |
|
| Outcomes | 1) Incidence of malformations‐ AEDs were analysed separately. | |
| Notes | Protocol received. Personal communication received regarding number of specific malformation by monotherapy | |
| Risk of bias | ||
| Bias | Authors' judgement | Support for judgement |
| Random sequence generation (selection bias) | High risk | High in bias due to non‐randomised design |
| Allocation concealment (selection bias) | High risk | High in bias due to non‐randomised design |
| Confounding variables | Low risk | Rated 2 as most important confounders considers and adjusted for appropriately in analyses |
| Blinding | High risk | Rated 5 as outcome assessors unblinded as assessments completed by family physician |
| Incomplete outcome data (attrition bias) All outcomes | Low risk | Rated 2 as small amount of missing data reported over 3 key papers |
| Selective reporting (reporting bias) | Low risk | Rated 1 as no evidence of selective reporting, protocol available |
| Other bias | High risk | Rated 5 as some cases enrolled following a scan (outcome maybe known) and no information reported as to whether they exclude children with genetic syndromes. |
Bag 1989.
| Methods | A prospective study (India) | |
| Participants | 30 pregnant epileptic patients were enrolled. All 30 were taking AED treatment, and all were analysed | |
| Interventions | Intervention group (monotherapy): 1) PHT (N = 20) 2) CBZ (N = 4) |
|
| Outcomes | 1) Seizure frequency 2) Serum drug and hormone (oestrogen and progesterone) levels 3) Congenital abnormalities 4) Pregnancy outcome AEDs were analysed separately. |
|
| Notes | There were 2 spontaneous abortions. Study authors' contact details could not be found |
|
| Risk of bias | ||
| Bias | Authors' judgement | Support for judgement |
| Random sequence generation (selection bias) | High risk | High in bias due to non‐randomised design |
| Allocation concealment (selection bias) | High risk | High in bias due to non‐randomised design |
| Confounding variables | High risk | Rated 4 as some confounders were considered but not adjusted for |
| Blinding | Unclear risk | No details of blinding in text |
| Incomplete outcome data (attrition bias) All outcomes | Low risk | Rated 2 as only small amount of missing data, unlikely to affect outcome |
| Selective reporting (reporting bias) | Unclear risk | Rated as 3 Limited information regarding a priori outcomes and protocol not available |
| Other bias | High risk | Rated 5 unclear of gestational age at enrolment, unclear if children with genetic syndromes were excluded. |
Barqawi 2005.
| Methods | A prospective study (Jordan) | |
| Participants | 50 women with epilepsy were enrolled. All were receiving various drug therapies for epilepsy management. The offspring of all women were analysed. | |
| Interventions | Intervention group (monotherapy): 1) Carbamazepine (N = 16) Control group: 1) Women with epilepsy not taking any AEDs (N = 18) |
|
| Outcomes | 1) Seizure frequency 2) Pregnancy outcome 3) Minor congenital abnormalities 4) Major congenital abnormalities AEDs were analysed separately. |
|
| Notes | Control group were not randomised but intervention group were. Protocol requested ‐ no response received. |
|
| Risk of bias | ||
| Bias | Authors' judgement | Support for judgement |
| Random sequence generation (selection bias) | Unclear risk | No details in text regarding randomisation method |
| Allocation concealment (selection bias) | Unclear risk | No details in text regarding methods of allocation concealment |
| Confounding variables | Unclear risk | Rated Unclear as intervention group were randomised but control group were not |
| Blinding | Unclear risk | Rated unclear no details in text |
| Incomplete outcome data (attrition bias) All outcomes | Low risk | Rated 1 as no missing data |
| Selective reporting (reporting bias) | High risk | Rated 3 limited information regarding a priori outcomes. No protocol available. |
| Other bias | High risk | Rated 5 as dose not investigated, unclear gestational age at enrolment, unclear whether children with genetic conditions were excluded |
Bozhinova 2009.
| Methods | A prospective study (Bulgaria) | |
| Participants | Pregnancies and deliveries of 107 women with epilepsy were monitored between 1996 and 2007; 5 women reported malformations of the foetus and baby. | |
| Interventions | Intervention group (monotherapy): 1) VPA (N = 2) 2) CBZ (N = 1) Control Group: 3) Women with epilepsy not taking AED |
|
| Outcomes | 1) Major malformations 2) Death |
|
| Notes | Study authors' contact details could not be found. Reported in narrative form only as details of outcome by individual AED are not given. | |
| Risk of bias | ||
| Bias | Authors' judgement | Support for judgement |
| Random sequence generation (selection bias) | High risk | High in bias due to non‐randomised design |
| Allocation concealment (selection bias) | High risk | High in bias due to non‐randomised design |
| Confounding variables | High risk | Rated 5 as no confounding variables considered or adjusted for |
| Blinding | Unclear risk | Rated unclear no details in text |
| Incomplete outcome data (attrition bias) All outcomes | High risk | Rated 5 as no information provided regarding missing data |
| Selective reporting (reporting bias) | Unclear risk | Rated 3 as limited information regarding a priori outcomes, no protocol available. |
| Other bias | High risk | Rated 5 as AEDs not reported separately, no figures reported for individual drug groups, no investigation of dose, unclear gestational age at enrolment, unclear if children with genetic conditions were excluded. |
Canger 1999.
| Methods | A prospective study (Italy) | |
| Participants | 517 women were enrolled, totaling an overall 628 pregnancies. Only the first pregnancies of each of the 517 women were included in analysis. | |
| Interventions | Intervention group (monotherapy): 1) PB (N = 83) 2) CBZ (N = 113) 3) PRM (N = 35) 4) PHT (N = 31) 5) VPA (N = 44) Control group: 1) Women with epilepsy not taking any AEDs (N = 25) |
|
| Outcomes | 1) Pregnancy outcome 2) Birth weight 3) Head circumference 4) Severe malformations 5) Mild malformations 6) Deformities 7) Malformations specific to a) Cardiac, b) Gastrointestinal, c) Neural tube defects 8) Perinatal deaths AEDs were analysed separately |
|
| Notes | 58 pregnancies that had ended with early spontaneous (N = 38) or early voluntary (N = 20) abortions were excluded from the analysis. Linked to Battino 1992 and Battino 1999 Study authors' contact details count not be found |
|
| Risk of bias | ||
| Bias | Authors' judgement | Support for judgement |
| Random sequence generation (selection bias) | High risk | High in bias due to non‐randomised design |
| Allocation concealment (selection bias) | High risk | High in bias due to non‐randomised design |
| Confounding variables | High risk | Rated 4 as many important confounding variables were considered however none were adjusted for in analysis |
| Blinding | Unclear risk | Rated unclear no details in text |
| Incomplete outcome data (attrition bias) All outcomes | Low risk | Rated 2 as small amount of missing data with reasons given, unlikely to affect outcome |
| Selective reporting (reporting bias) | Low risk | Rated 2 as no evidence of selective reporting, no protocol available but clear outcomes outlined in methods |
| Other bias | Low risk | Rated 1 as no other bias identified |
Cassina 2013.
| Methods | A prospective study (Italy) | |
| Participants | 1562 pregnant women were recruited to the study:‐ 1) Pregnant women with epilepsy taking AEDs (N = 385) 2) Pregnant no medication (in women without epilepsy) taking AEDs therapy (310) 3) no medication (in women without epilepsy) (N = 867) |
|
| Interventions | Intervention group (monotherapy, with known malformation outcomes, limited to women with epilepsy): 1) VPA (N = 45) 2) CBZ (N = 88) 3) PB (N = 67) 4) LTG (N = 26) Control group: 1) no medication (in women without epilepsy) (N = 803) |
|
| Outcomes | 1) Major congenital malformation 2) Twin gestation 3) Foetus born with chromosomal abnormalities 4) Spontaneous abortion 5) Elective termination of pregnancy 7) Foetal death or still birth AEDs were analysed separately |
|
| Notes | Protocol requested ‐ protocol received. | |
| Risk of bias | ||
| Bias | Authors' judgement | Support for judgement |
| Random sequence generation (selection bias) | High risk | High in bias due to non‐randomised design |
| Allocation concealment (selection bias) | High risk | High in bias due to non‐randomised design |
| Confounding variables | Unclear risk | Rated 3 as some confounders considered and adjusted for appropriately in analyses |
| Blinding | High risk | Rated 5 as outcome assessors unblinded as assessments completed by family physician |
| Incomplete outcome data (attrition bias) All outcomes | Low risk | Rated 2 as small amount of missing data with reasons given |
| Selective reporting (reporting bias) | Low risk | Rated 1 as no evidence of selective reporting, protocol available |
| Other bias | High risk | Rated 5 unclear gestational age at enrolment, unclear if children with genetic conditions were excluded |
D'Souza 1990.
| Methods | A prospective study (UK). | |
| Participants | 61 infants born to mothers with epilepsy. Non‐epileptic mothers were selected as matched controls (N = 62):‐ 1) Offspring of women with epilepsy exposed to AEDs throughout pregnancy (N = 49) 2) Offspring of women with epilepsy exposed to AEDs only in first trimester (N = 4) 3) Offspring of women with epilepsy not exposed to AEDs (N = 8) 4) Offspring of no medication (in women without epilepsy) (N = 62) |
|
| Interventions | Intervention group (monotherapy): 1) PHT (N = 22) 2) CBZ (N = 3) 3) PB (N = 4) Control group: 1) Women with epilepsy not taking any AEDs (N = 8) 2) no medication (in women without epilepsy) (N = 62) |
|
| Outcomes | 1) Congenital abnormalities 2) Incidence of hypoplastic nails 3) Neonatal conditions (specifically "jitteriness") AEDs were analysed separately. |
|
| Notes | Protocol requested ‐ authors unable to provide protocol but description of study plan given. | |
| Risk of bias | ||
| Bias | Authors' judgement | Support for judgement |
| Random sequence generation (selection bias) | High risk | High in bias due to non‐randomised design |
| Allocation concealment (selection bias) | High risk | High in bias due to non‐randomised design |
| Confounding variables | Unclear risk | Rated 3 as some confounders considered but several important confounders not considered and adjusted for |
| Blinding | Low risk | Rated 2 as outcome assessor blinded |
| Incomplete outcome data (attrition bias) All outcomes | Low risk | Rated 1 as no missing data |
| Selective reporting (reporting bias) | Low risk | Rated 2 as no evidence of selective reporting, no protocol available |
| Other bias | High risk | Rated 5 did not investigate dose, unclear if child with genetic syndrome was excluded |
Delmiš 1991.
| Methods | A prospective study (Croatia) | |
| Participants | 134 infants born to women with epilepsy (N = 132). Although 7 women with epilepsy were excluded from this review as they were receiving polytherapy. Therefore 127 infants born to pregnant women with epilepsy. 503 infants born to no medication (in women without epilepsy) (N = 499) |
|
| Interventions | Intervention group (monotherapy): 1) PB (N = 58) 2) CBZ (N = 18) 3) PRM (N = 9) Control group: 1) Women with epilepsy not taking any AEDs (N = 10) |
|
| Outcomes | 1) Major congenital malformation 2) Specific malformations (heart, skeletal, urogenital, cleft lip and palate and cleft spine) 2) Neonatal complications 3) Complication during pregnancy and delivery AEDs were analysed separately. |
|
| Notes | Study authors' contact details could not be found. | |
| Risk of bias | ||
| Bias | Authors' judgement | Support for judgement |
| Random sequence generation (selection bias) | High risk | High in bias due to non‐randomised design |
| Allocation concealment (selection bias) | High risk | High in bias due to non‐randomised design |
| Confounding variables | Unclear risk | Rated 3 as some confounders considered but no adjustment employed |
| Blinding | Unclear risk | Rated unclear no details in text |
| Incomplete outcome data (attrition bias) All outcomes | Low risk | Rated 1 as no reported missing data |
| Selective reporting (reporting bias) | Unclear risk | Rated 3 as limited information regarding a priori outcomes, protocol not available |
| Other bias | High risk | Rated 5 as no investigation of dose, gestational age at enrolment is unclear, unclear if excluded genetic syndromes |
Diaz‐Romero 1990.
| Methods | A prospective study (Mexico) | |
| Participants | 72 full‐term newborns of epileptic mothers were studied. These were compared with a control group of offspring of mothers without epilepsy. | |
| Interventions | Intervention group (monotherapy): 1) CBZ (N = 26) 2) PHT (N = 21) 3) VPA (N = 10) 4) PHT (N = 2) Control group: 1) Women with epilepsy not taking any AEDs (N = 8) |
|
| Outcomes | 1) Facial anthropometric measurements AEDs were analysed separately. |
|
| Notes | All newborns in the intensive care unit, and those with congenital malformations with a different specific recognisable aetiology were excluded. Study authors' contact details could not be found. |
|
| Risk of bias | ||
| Bias | Authors' judgement | Support for judgement |
| Random sequence generation (selection bias) | High risk | High in bias due to non‐randomised design |
| Allocation concealment (selection bias) | High risk | High in bias due to non‐randomised design |
| Confounding variables | Unclear risk | Rated 3 as limited confounding variables adjusted for |
| Blinding | Unclear risk | Rated unclear as no details of blinding in text |
| Incomplete outcome data (attrition bias) All outcomes | High risk | Rated 5 as no details given regarding the number recruited |
| Selective reporting (reporting bias) | Low risk | Rated 2 as no evidence of selective reporting, no protocol available |
| Other bias | High risk | Rated 5 as dose not investigated, unclear gestational age at enrolment, unclear if children with genetic syndromes were excluded. |
Dravet 1992.
| Methods | A prospective study (France). | |
| Participants | 281 pregnant women with epilepsy treated or not treated with AEDs were included in the study. Out of these, some were lost to follow‐up (N = 35), some miscarried (N = 12), and some terminated pregnancy (N = 7). 227 outcomes of pregnancy were evaluated overall (229 infants). | |
| Interventions | Intervention groups (monotherapy): 1) 1 AED (N = 128) Control group: 3) No AED (N = 14) |
|
| Outcomes | 1) Malformations (broken down into specific malformations) 2) Change in seizure frequency during first trimester (in 50 women) 3) Relationship between type of epilepsy and malformations 4) Relationship between treatment and malformations |
|
| Notes | Protocol requested ‐ author unable to provide protocol. Not included in meta‐analysis or narrative reporting as numbers of individual AEDs not available. | |
| Risk of bias | ||
| Bias | Authors' judgement | Support for judgement |
| Random sequence generation (selection bias) | High risk | High in bias due to non‐randomised design |
| Allocation concealment (selection bias) | High risk | High in bias due to non‐randomised design |
| Confounding variables | Unclear risk | Rated 3 as several considered and adjusted for appropriately |
| Blinding | Unclear risk | Rated unclear as no details of blinding in text |
| Incomplete outcome data (attrition bias) All outcomes | Low risk | Rated 2 as only small amount of missing data, unlikely to affect outcome |
| Selective reporting (reporting bias) | Low risk | Rated 2 as no evidence of selective reporting, no protocol available |
| Other bias | High risk | Rated 5 as drug data were separated but not clear on numbers, no examination of dose, unclear gestational age at enrolment, unclear whether children with genetic syndromes were excluded |
Eroglu 2008.
| Methods | A prospective study (Turkey) | |
| Participants | 84 pregnant women with epilepsy were enrolled; the 80 pregnancies that were full‐term were all analysed. | |
| Interventions | Intervention group (monotherapy): 1) CBZ (N = 46) 2) PHT (N = 14) 3) VPA (N = 15) 4) PB (N = 5) |
|
| Outcomes | 1) Seizure frequency 2) Congenital malformations AEDs were analysed separately. |
|
| Notes | Protocol requested ‐ no response received | |
| Risk of bias | ||
| Bias | Authors' judgement | Support for judgement |
| Random sequence generation (selection bias) | High risk | High in bias due to non‐randomised design |
| Allocation concealment (selection bias) | High risk | High in bias due to non‐randomised design |
| Confounding variables | High risk | Rated 5 as no confounding variables adjusted for in analysis |
| Blinding | Unclear risk | Rated unclear as no details of blinding in text |
| Incomplete outcome data (attrition bias) All outcomes | Low risk | Rated 2 as only small amount of missing data, unlikely to affect outcome |
| Selective reporting (reporting bias) | Low risk | Rated 2 as no evidence of selective reporting, no protocol available |
| Other bias | High risk | Rated 5 as unclear gestational age at enrolment, unclear as to whether children with genetic syndromes were excluded |
EURAP.
| Methods | A prospective registry study (42 countries) | |
| Participants | 4540 pregnant women with epilepsy were included in this study | |
| Interventions | The pregnant women with epilepsy were taking:‐ 1) CBZ (N = 1402) 2) LTG (N = 1280) 3) PB (N = 217) 4) VPA (N = 1010) |
|
| Outcomes | 1) Congenital malformations | |
| Notes | Protocol requested ‐ no response received. Not included in meta‐analysis due to overlap with other studies (e.g. UK Epilepsy and Pregnancy Register). | |
| Risk of bias | ||
| Bias | Authors' judgement | Support for judgement |
| Random sequence generation (selection bias) | High risk | High in bias due to non‐randomised design |
| Allocation concealment (selection bias) | High risk | High in bias due to non‐randomised design |
| Confounding variables | Low risk | Rated 2 as most important confounders considered and adjusted for appropriately in analyses |
| Blinding | High risk | Rated 5 as outcome assessors unblinded as assessments completed by family physician |
| Incomplete outcome data (attrition bias) All outcomes | Low risk | Rated 2 as small amount of missing data with reasons given |
| Selective reporting (reporting bias) | Low risk | Rated 2 as no evidence of selective reporting, no protocol available |
| Other bias | Low risk | Rated 1 as no further bias identified |
Fairgrieve 2000.
| Methods | A prospective study (UK) | |
| Participants | 400 pregnant women with epilepsy were identified, 300 of which took part in the study. | |
| Interventions | Intervention group (monotherapy): 1) CBZ (N = 109) 2) VPA (N = 74) Control group: 1) Women with epilepsy not taking any AEDs (N = 48) |
|
| Outcomes | 1) Major malformations 2) Still births 3) Miscarriages 4) Medical terminations 5) Terminations |
|
| Notes | Protocol requested ‐ protocol unavailable. | |
| Risk of bias | ||
| Bias | Authors' judgement | Support for judgement |
| Random sequence generation (selection bias) | Unclear risk | High in bias due to non‐randomised design |
| Allocation concealment (selection bias) | Unclear risk | High in bias due to non‐randomised design |
| Confounding variables | High risk | Rated 5 as no important confounders considered and no adjustment employed |
| Blinding | Unclear risk | Rated unclear as no details in text |
| Incomplete outcome data (attrition bias) All outcomes | Low risk | Rated 2 as small amount of missing data |
| Selective reporting (reporting bias) | Unclear risk | Rated 3 as limited information regarding a priori outcomes, protocol not available |
| Other bias | High risk | Rated 5 as unclear gestational age at enrolment, unclear as to whether children with genetic syndromes were excluded |
Froscher 1991.
| Methods | A prospective study (Gemany) | |
| Participants | 66 pregnant women with epilepsy were included in this study; there were 79 pregnancies in total. | |
| Interventions | Intervention group (monotherapy): 1) CBZ (N = 31) 2) VPA (N = 12) 3) PB (N = 5) 4) PHT (N = 3) |
|
| Outcomes | 1) Seizure frequency 2) Miscarriage and perinatal mortality 3) Major congenital malformations 4) Minor congenital malformations |
|
| Notes | Protocol requested ‐ author could not provide protocol but summarised the aims of the study. | |
| Risk of bias | ||
| Bias | Authors' judgement | Support for judgement |
| Random sequence generation (selection bias) | High risk | High in bias due to non‐randomised design |
| Allocation concealment (selection bias) | High risk | High in bias due to non‐randomised design |
| Confounding variables | High risk | Rated 5 as no confounders considered or adjusted for |
| Blinding | Unclear risk | No details on text regarding methods of blinding |
| Incomplete outcome data (attrition bias) All outcomes | Low risk | Rated 2 as small amount of missing data |
| Selective reporting (reporting bias) | Unclear risk | Rated 3 as limited information regarding outcomes in methods section, no protocol available |
| Other bias | High risk | Rated 5 as dose not investigated, unclear gestational age at enrolment, unclear whether children with genetic syndromes were excluded. |
Fujji 2013.
| Methods | A prospective study (several countries including Canada, France, England, Italy and Korea) | |
| Participants | 446 pregnant women with epilepsy were included in this study. | |
| Interventions | Intervention group (monotherapy) GBP (N = 223) Control group: Women with epilepsy not exposed to GBP (N = 223) |
|
| Outcomes | 1) Major malformations 2) Live births 3) Spontaneous abortions 4) Therapeutic abortions 5) Still births 6) Preterm births 7) Neonatal intensive care unit (NICU)/ special care nursery (SCN) 8) Low birth weight 9) Intrauterine growth retardation 10) Mean birth weight 11) Mean gestational age at birth |
|
| Notes | Protocol requested ‐ protocol received. Not included in meta‐analysis due to inclusion of non‐epilepsy cases >10%. This study was reviewed narratively. | |
| Risk of bias | ||
| Bias | Authors' judgement | Support for judgement |
| Random sequence generation (selection bias) | High risk | High in bias due to non‐randomised design |
| Allocation concealment (selection bias) | High risk | High in bias due to non‐randomised design |
| Confounding variables | Unclear risk | Rated 3 as some confounders considered and partial adjustments made |
| Blinding | High risk | Rated 5 as outcome assessors unblinded as assessments completed by family physician |
| Incomplete outcome data (attrition bias) All outcomes | Unclear risk | Rated unclear as only report numbers with complete data |
| Selective reporting (reporting bias) | Low risk | Rated 1 as no evidence of selective reporting, protocol available |
| Other bias | High risk | Rated 5 unclear gestational age at enrolment, unclear as to whether children with genetic syndromes were excluded |
Gaily 1988.
| Methods | A prospective cohort‐controlled study. Duration: 4 years. Follow‐up: 5.5 years | |
| Participants | 153 children of epileptic mothers were enrolled in the study, but 5 died in the perinatal period. 120 of the surviving 148 were seen at 5.5 ± 0.25 years, and 1 at 8 years. | |
| Interventions | Intervention group (monotherapy): 1) PHT (N = 46) Control group: 1) Children born to women with untreated epilepsy (N = 15) 2) Children born to no medication (in women without epilepsy) (N = 105) |
|
| Outcomes | 1) Minor physical anomalies | |
| Notes | Protocol requested ‐ no response received. Out of the AEDs, only phenytoin was analysed separately. | |
| Risk of bias | ||
| Bias | Authors' judgement | Support for judgement |
| Random sequence generation (selection bias) | High risk | High in bias due to non‐randomised design |
| Allocation concealment (selection bias) | High risk | High in bias due to non‐randomised design |
| Confounding variables | High risk | Rated 4 as some confounders were considered |
| Blinding | Low risk | Rated 2 as outcome assessor blinded |
| Incomplete outcome data (attrition bias) All outcomes | Low risk | Rated 2 as small amount of missing data with reasons given |
| Selective reporting (reporting bias) | Low risk | Rated 2 as no evidence of selective reporting, no protocol available |
| Other bias | High risk | Rated 5 as control group recruited at a later time point, unclear whether children with genetic conditions were excluded, unclear gestational age at enrolment |
Garza‐Morales 1996.
| Methods | Prospective observational study (Spain) | |
| Participants | 61 pregnant women with epilepsy | |
| Interventions | Intervention group (monotherapy): 1) PHT (N = 27) 2) CBZ (N = 24) 3) VPA (N = 5) Control group 1) Women with epilepsy not taking any AEDs (N = 18) |
|
| Outcomes | 1) Major malformations 2) Minor malformations 3) Complications during pregnancy |
|
| Notes | Study authors' contact details could not be found. | |
| Risk of bias | ||
| Bias | Authors' judgement | Support for judgement |
| Random sequence generation (selection bias) | High risk | High in bias due to non‐randomised design |
| Allocation concealment (selection bias) | High risk | High in bias due to non‐randomised design |
| Confounding variables | High risk | Rated 5 as consideration or adjustment for confounders |
| Blinding | Unclear risk | Rated unclear as no details in text |
| Incomplete outcome data (attrition bias) All outcomes | High risk | Rated 5 as no information given about attrition |
| Selective reporting (reporting bias) | Unclear risk | Rated 3 as limited information regarding a priori outcomes, protocol not available |
| Other bias | High risk | Rated 5 as unclear gestational age at enrolment, no investigation of dose, unclear whether children with genetic syndromes were excluded |
Goujard 1974.
| Methods | A prospective study (France). | |
| Participants | 42 pregnant women with epilepsy were included in this study. | |
| Interventions | Intervention group (monotherapy): 1) AEDs (N = 39) Control group: 1) Women with epilepsy not taking any AEDs (N = 3) |
|
| Outcomes | 1) Major malformations 2) Minor malformations |
|
| Notes | Study authors' contact details could not be found. Not included in meta‐analysis due to unclear numbers of malformations for specific monotherapy groups. | |
| Risk of bias | ||
| Bias | Authors' judgement | Support for judgement |
| Random sequence generation (selection bias) | High risk | High in bias due to non‐randomised design |
| Allocation concealment (selection bias) | High risk | High in bias due to non‐randomised design |
| Confounding variables | High risk | Rated 5 as no consideration of adjustment undertaken |
| Blinding | Unclear risk | Rated unclear as no details in text |
| Incomplete outcome data (attrition bias) All outcomes | Unclear risk | Rated unclear as no details in text |
| Selective reporting (reporting bias) | Unclear risk | Rated 3 as limited information regarding a priori outcomes, protocol not available |
| Other bias | High risk | Rated 5 no investigation of dose, unclear whether children with genetic syndromes were excluded, no clear information given about monotherapy cases given |
Hill 1974.
| Methods | A prospective, cohort‐controlled, multicentre study (USA). Duration: 4 years (plus 3 years follow‐up). | |
| Participants | 28 newly born infants were recruited between January 1969 and November 1972 and examined. All infants were the offspring of women who had required AED treatment during their pregnancy. The control group was made up of 165 infants not exposed to AEDs. |
|
| Interventions | Intervention group (monotherapy): 1) PHT (N = 9) 2) PB (N = 1) Control group: 1) Women who were not taking any AEDs (N = 165) |
|
| Outcomes | 1) Minor malformations 2) Major malformations 3) Apgar score 4) Birth weight and length of infant 5) Gross motor index 6) Fine motor index 7) Adaptive index 8) Language index 9) Personal‐social index |
|
| Notes | Study authors' contact details could not be found. Not included in meta‐analysis due to unclear numbers of malformations for specific monotherapy groups. | |
| Risk of bias | ||
| Bias | Authors' judgement | Support for judgement |
| Random sequence generation (selection bias) | High risk | High in bias due to non‐randomised design |
| Allocation concealment (selection bias) | High risk | High in bias due to non‐randomised design |
| Confounding variables | High risk | Rated 4 as many variables where data has been collected but not adjusted for |
| Blinding | Low risk | Rated 2 as outcome assessor was blinded |
| Incomplete outcome data (attrition bias) All outcomes | Low risk | Rated 2 as only small amount of missing data, unlikely to affect outcome |
| Selective reporting (reporting bias) | Low risk | Rated 2 as data presented in tables shows overall AED group versus controls however in the text many the cases of malformations are described and drug exposure is stated |
| Other bias | High risk | Rated 5 as AEDs not analysed separately, unclear gestational age at enrolment, unclear as to whether children with genetic syndromes were excluded |
Israeli Teratogen Service.
| Methods | A prospective study (Israel) | |
| Participants | Data reported across four papers. | |
| Interventions | Intervention group (monotherapy): 1) VPA (N = 89) 2) CBZ (N = 108) 3) TPM (N = 57) Control group: 1) Pregnant women not exposed to teratogenic substances (N = 1315) |
|
| Outcomes | 1) Rate of major congenital anomalies 2) Pregnancy outcome 3) Gestational age at delivery 4) Rate of preterm deliveries 5) Birth weight |
|
| Notes | Protocol requested ‐ protocol received. Data could not be included in the meta‐analysis for VPA and TPM as number of women taking these AED for non‐epilepsy conditions was >10%. In the paper on CBZ data were specifically reported for the women with epilepsy on CBZ and therefore this data could contribute to the meta‐analysis. | |
| Risk of bias | ||
| Bias | Authors' judgement | Support for judgement |
| Random sequence generation (selection bias) | High risk | High in bias due to non‐randomised design |
| Allocation concealment (selection bias) | High risk | High in bias due to non‐randomised design |
| Confounding variables | Unclear risk | Rated 3 as some confounders considered and adjusted for |
| Blinding | High risk | Rated 5 as outcome assessors unblinded as assessments completed by family physician |
| Incomplete outcome data (attrition bias) All outcomes | Unclear risk | Rated 3 as larger amount of missing data with reasons given, possible implication on outcome. |
| Selective reporting (reporting bias) | Low risk | Rated 1 as no evidence of selective reporting, protocol available |
| Other bias | High risk | Rated 5 as reported monotherapy and polytherapy cases together in some papers, unclear gestational age at enrolment, unclear whether children with genetic conditions were excluded |
Jones 1989.
| Methods | A prospective and retrospective study (USA). Only participants who were prospectively recruited were included in this review. | |
| Participants | The offspring of 145 women were enrolled:‐ 1) Offspring of women, taking some combination of AEDs including carbamazepine (all but 1 woman were taking for seizure control) (N = 54) 2) Offspring of women not taking any AEDs, or any other drug known or suspected to be a teratogen (N = 70) |
|
| Interventions | Intervention group (monotherapy): 1) Carbamazepine alone (N = 50) Control group: 1) Women with epilepsy not taking any AEDs (N = 73) |
|
| Outcomes | 1) Incidence of major malformations 2) Incidence of minor malformations 3) Birth weight 4) Birth length 5) Head circumference at birth |
|
| Notes | Protocol requested ‐ no response received. Data was not included in meta‐analysis as outcomes pertaining to specific monotherapy exposures were not reported. | |
| Risk of bias | ||
| Bias | Authors' judgement | Support for judgement |
| Random sequence generation (selection bias) | High risk | High in bias due to non‐randomised design |
| Allocation concealment (selection bias) | High risk | High in bias due to non‐randomised design |
| Confounding variables | Unclear risk | Rated 3 as some confounders considered and partially adjusted for but several important confounders not considered and adjusted for |
| Blinding | Low risk | Rated 2 as outcome assessor blinded |
| Incomplete outcome data (attrition bias) All outcomes | High risk | Rated 4 as 33% missing data from original recruitment, unclear about the balance of dropouts |
| Selective reporting (reporting bias) | Low risk | Rated 2 as no evidence of selective reporting, no protocol available |
| Other bias | High risk | Rated 5 as monotherapy and polytherapy reported together, dose not investigated, unclear if children with genetic syndromes were excluded |
Kaaja 2003.
| Methods | A prospective study (Finland) | |
| Participants | The 970 pregnancies of the 641 epileptic women enrolled, resulted in 979 offspring which were included in the study:‐ 1) Offspring of women with epilepsy, taking 1 or more AED during the first trimester (N = 733) 2) Offspring of women with epilepsy, not exposed to AEDs (N = 237) |
|
| Interventions | Intervention group (monotherapy): 1) CBZ (N = 363) 2) PHT (N = 124) 3) VPA (N = 61) 4) PB (N = 5) 5) PRM (N = 6) 6) OXC (N = 9) Control group: 1) Women with epilepsy who were not taking any AEDs (N = 237) |
|
| Outcomes | 1) Major malformations 2) Birth weight 3) Apgar score 4) Pregnancy outcome AEDs were analysed separately. |
|
| Notes | Study authors' contact details could not be found | |
| Risk of bias | ||
| Bias | Authors' judgement | Support for judgement |
| Random sequence generation (selection bias) | High risk | High in bias due to non‐randomised design |
| Allocation concealment (selection bias) | High risk | High in bias due to non‐randomised design |
| Confounding variables | Unclear risk | Rated 3 as some confounders considered and adjusted for |
| Blinding | Unclear risk | Rated unclear as no details in text regarding methods of blinding |
| Incomplete outcome data (attrition bias) All outcomes | Low risk | Rated 2 as small amount of missing data with reasons given |
| Selective reporting (reporting bias) | Low risk | Rated 2 as no evidence of selective reporting, no protocol available |
| Other bias | High risk | Rated 5 as no investigation of dose, unclear as to whether children with genetic syndromes were excluded, unclear gestational age at enrolment |
Kaneko 1999.
| Methods | A prospective study (Japan, Italy, Canada) | |
| Participants | 145 infants born to AED‐treated mothers between 1985‐1989, and a previous group of 172 infants of AED‐treated mothers and 20 infants of non‐AED‐treated mothers selected between 1978‐1984, were included in the study group. | |
| Interventions | Intervention group (monotherapy): 1) VPA (N = 81) 2) CBZ (N = 158) 3) PRM (N = 35) 4) PB (N = 79) 5) PHT (N = 132) Control group: 1) Women with epilepsy who were not taking any AEDs (N = 98). |
|
| Outcomes | 1) Incidence of congenital malformations AEDs were analysed separately. |
|
| Notes | Study authors' contact details could not be found. | |
| Risk of bias | ||
| Bias | Authors' judgement | Support for judgement |
| Random sequence generation (selection bias) | High risk | High in bias due to non‐randomised design |
| Allocation concealment (selection bias) | High risk | High in bias due to non‐randomised design |
| Confounding variables | High risk | Rated 5 as no confounders considered or adjusted for |
| Blinding | Unclear risk | Rated unclear as not details in text regarding methods of blinding |
| Incomplete outcome data (attrition bias) All outcomes | Low risk | Rated 2 as small amount of missing data with reasons given |
| Selective reporting (reporting bias) | Low risk | Rated 2 as no evidence of selective reporting, no protocol available |
| Other bias | High risk | Rated 5 as no investigation of dose, unclear gestational age at enrolment, unclear whether children with genetic conditions were excluded |
Kelly 1984.
| Methods | A prospective study (USA). | |
| Participants | 171 children were evaluated from 468 women with epilepsy enrolled. | |
| Interventions | Intervention group (monotherapy): 1) PHT (N = 24) 2) PB (N = 6) 3) VPA (N = 4) Control group: 1) Women with untreated epilepsy (N = 23) |
|
| Outcomes | 1) Major abnormality 2) Microcephaly 3) Distal digital hypoplasia 4) Craniofacial abnormality 5) Delayed development |
|
| Notes | Study authors' contact details could not be found. | |
| Risk of bias | ||
| Bias | Authors' judgement | Support for judgement |
| Random sequence generation (selection bias) | High risk | High in bias due to non‐randomised design |
| Allocation concealment (selection bias) | High risk | High in bias due to non‐randomised design |
| Confounding variables | High risk | Rated 5 as no confounding variables considered or adjusted for in analysis |
| Blinding | Unclear risk | Rated unclear as no details of blinding in text |
| Incomplete outcome data (attrition bias) All outcomes | Low risk | Rated 2 as small amount of missing data with reasons given |
| Selective reporting (reporting bias) | Low risk | Rated 2 as no evidence of selective reporting, no protocol available |
| Other bias | High risk | Rated 5 as dose not investigated, unclear as to whether children with genetic conditions were excluded, unclear gestational age at enrolment |
Kerala Pregnancy Registry.
| Methods | A prospective registry study (India). Data reported across two papers. | |
| Participants | 85 women with epilepsy were enrolled, but only 32 had completed their current pregnancy. Only these 32 are analysed and included in the review:‐ 1) Women taking AED/s (N = 23) 2) Women not taking any AEDs (N = 9) |
|
| Interventions | Study 1. Overall malformation risk Interevntion group (monotherapy): 1) PB (N = 9) 2) CBZ (N = 7) 3) VPA (N = 6) 4) PHT (N = 5) Control group: 1) Women with epilepsy not taking any AEDs (N = 9). Study 2. Heart defects risk Interevntion group (monotherapy): 1) PB (N = 43) 2) CBZ (N = 112) 3) VPA (N = 71) 4) PHT (N = 100) Control group: 1) Women with epilepsy not taking any AEDs (N = 10). |
|
| Outcomes | 1) Pregnancy outcome 2) Seizure frequency 3) Congenital malformations 4) Infant head circumference 5) Birth weight |
|
| Notes | Protocol requested ‐ no response received. Data reported across two papers. The more recent paper reported outcomes pertaining to heart defects only and therefore the numbers available for meta‐analysis for heart defects is substantially higher than that for overall malformation risk and other specific malformation types. | |
| Risk of bias | ||
| Bias | Authors' judgement | Support for judgement |
| Random sequence generation (selection bias) | High risk | High in bias due to non‐randomised design |
| Allocation concealment (selection bias) | High risk | High in bias due to non‐randomised design |
| Confounding variables | High risk | Rated 4 as many variables where data has been collected but not adjusted for in the analysis |
| Blinding | High risk | Rated 4 as partial or no blinding involved in study. |
| Incomplete outcome data (attrition bias) All outcomes | Low risk | Rated 2 as smaller amount of missing data, unlikely to affect outcome. |
| Selective reporting (reporting bias) | Low risk | Rated 2 as no evidence of selective reporting, no protocol available |
| Other bias | High risk | Rated 5 as no investigation of dose, unclear whether children with genetic conditions were excluded, recruitment into the third trimester |
Koch 1992.
| Methods | A prospective study (Germany). | |
| Participants | 1) Women with epilepsy treated with AEDs (N = 116) 2) Women with epilepsy without AED treatment (N = 25) Each of these study groups had a corresponding matched control group with an identical number of mother‐child pairs. Total number of control pairs (N = 163). |
|
| Interventions | Intervention group (monotherapy): 1) PB (N = 4) 2) PRM (N = 21) 3) PHT (N = 24) 4) CBZ (N = 9) 5) VPA (N = 14) Control group: 1) no medication (in women without epilepsy) (N = 116) |
|
| Outcomes | 1) Major malformations 2) Minor anomalies |
|
| Notes | Study authors' contact details could not be found. | |
| Risk of bias | ||
| Bias | Authors' judgement | Support for judgement |
| Random sequence generation (selection bias) | High risk | High in bias due to non‐randomised design |
| Allocation concealment (selection bias) | High risk | High in bias due to non‐randomised design |
| Confounding variables | Unclear risk | Rated 3 as some confounders considered and partial adjustment employed |
| Blinding | High risk | Rated 5 as no methods of blinding were employed |
| Incomplete outcome data (attrition bias) All outcomes | Unclear risk | Rated unclear as no details of numbers recruited versus those analysed |
| Selective reporting (reporting bias) | Low risk | Rated 2 as no evidence of selective reporting, no protocol available |
| Other bias | High risk | Rated 5 as dose not investigated, unclear gestational age at enrolment, unclear whether children with genetic syndromes were excluded |
Laskowska 2002.
| Methods | A prospective study (Poland) | |
| Participants | 53 pregnant women with epilepsy and 53 pregnant no medication (in women without epilepsy) were involved in this study. | |
| Interventions | Intervention group (monotherapy): 1) AED (N = 39) Control group: 1) Women with epilepsy not taking any AEDs (N = 5) 2) no medication (in women without epilepsy) (N = 53) |
|
| Outcomes | 1) Seizure frequency 2) Complications during pregnancy 3) Congenital malformations 4) Birth weight/height |
|
| Notes | Protocol requested ‐ no response received. Study was not included in meta‐analysis as outcomes for specific monotherapy groups were not clear. | |
| Risk of bias | ||
| Bias | Authors' judgement | Support for judgement |
| Random sequence generation (selection bias) | High risk | High in bias due to non‐randomised design |
| Allocation concealment (selection bias) | High risk | High in bias due to non‐randomised design |
| Confounding variables | High risk | Rated 5 as no confounders considered or adjusted for |
| Blinding | Unclear risk | Rated unclear as no details in text |
| Incomplete outcome data (attrition bias) All outcomes | High risk | Rated 5 as no information given |
| Selective reporting (reporting bias) | Unclear risk | Rated 3 as limited information regarding a priori outcomes |
| Other bias | High risk | Rated 5 as did not analysis AEDs separately, unclear gestational age at enrolment, unclear if excluded children with genetic syndromes |
Lindhout 1992.
| Methods | A prospective study (Germany) | |
| Participants | 172 live infants born to women taking AEDs | |
| Interventions | Intervention group (monotherapy): 1) VPA (N = 66) 2) PB (N = 26) 3) CBZ (N = 50) 4) PHT (N = 17) Control group: 1) Women with epilepsy who were not taking any AEDs (N = 28) |
|
| Outcomes | 1) Congenital malformations | |
| Notes | Study authors' details could not be found. | |
| Risk of bias | ||
| Bias | Authors' judgement | Support for judgement |
| Random sequence generation (selection bias) | High risk | High in bias due to non‐randomised design |
| Allocation concealment (selection bias) | High risk | High in bias due to non‐randomised design |
| Confounding variables | High risk | Rated 4 as some variables where data has been collected but not adjusted for in the analysis |
| Blinding | Unclear risk | Rated unclear as no details of blinding methods employed |
| Incomplete outcome data (attrition bias) All outcomes | Low risk | Rated 2 as small amount of missing data, unlikely to affect outcome |
| Selective reporting (reporting bias) | Low risk | Rated 2 as no evidence of selective reporting, no protocol available |
| Other bias | High risk | Rated 5 unclear gestational age at enrolment, individual malformation data unclearly reported across number of data tables |
Martinez Ferri 2009.
| Methods | A prospective study (Spain) | |
| Participants | 269 women with epilepsy being treated with monotherapy were included in this study. | |
| Interventions | Intervention group (monotherapy): 1) CBZ (N = 105) 2) VPA (N = 68) 3) LTG (N = 56) 4) PB (N = 11) |
|
| Outcomes | 1) Major malformations 2) Perinatal death |
|
| Notes | Protocol requested ‐ no response received | |
| Risk of bias | ||
| Bias | Authors' judgement | Support for judgement |
| Random sequence generation (selection bias) | High risk | High in bias due to non‐randomised design |
| Allocation concealment (selection bias) | High risk | High in bias due to non‐randomised design |
| Confounding variables | Unclear risk | Rated 3 as some confounders considered and full or partial adjustment employed |
| Blinding | Unclear risk | Rated unclear as details not given in text |
| Incomplete outcome data (attrition bias) All outcomes | Low risk | Rated 2 as small amount of missing data, reasons given |
| Selective reporting (reporting bias) | Low risk | Rated 2 as no evidence of selective reporting, protocol not available |
| Other bias | High risk | Rated 5 as dose not investigated, unclear if children with genetic syndromes were excluded |
Mawer 2010.
| Methods | A prospective study (UK) | |
| Participants | 277 women with epilepsy were recruited but three were excluded and 315 no medication (in women without epilepsy) were recruited as control participants. | |
| Interventions | Intervention group (monotherapy): 1) CBZ (N = 74) 2) VPA (N = 57) 3) LTG (N = 40) 4) PHT (N = 7) Control group: 1) no medication (in women without epilepsy) (N = 315) 2) Women with untreated epilepsy (N = 40) |
|
| Outcomes | 1) Major congenital malformations 2) Birth weight |
|
| Notes | Protocol requested ‐ protocol received. Overlap in data with NEAD study. Data combined in meta‐analysis along with NEAD data were non‐NEAD data from this study. | |
| Risk of bias | ||
| Bias | Authors' judgement | Support for judgement |
| Random sequence generation (selection bias) | High risk | High in bias due to non‐randomised design |
| Allocation concealment (selection bias) | High risk | High in bias due to non‐randomised design |
| Confounding variables | Low risk | Rated 2 as the majority of important confounders considered and appropriately adjusted for |
| Blinding | High risk | Rated 5 as no methods of blinding were employed |
| Incomplete outcome data (attrition bias) All outcomes | Low risk | Rated 2 as smaller amount of missing data with reasons given, balanced across groups |
| Selective reporting (reporting bias) | Low risk | Rated 1 as no evidence of selective reporting, protocol available |
| Other bias | High risk | Rated 5 as recruitment continued into the third trimester. Dose not investigated. |
Meador 2006.
| Methods | A prospective study (USA and UK) | |
| Participants | 354 mother/child pairs were enrolled. 323 mothers and 333 children were included in the analysis. All mothers were being treated for epilepsy with AED monotherapy. | |
| Interventions | Intervention group (monotherapy): 1) CBZ (N = 110) 2) LTG (N = 98) 3) PHT (N = 56) 4) VPA (N = 69) |
|
| Outcomes | 1) Major congenital malformations 2) Fetal death |
|
| Notes | Protocol requested ‐ protocol received | |
| Risk of bias | ||
| Bias | Authors' judgement | Support for judgement |
| Random sequence generation (selection bias) | High risk | High in bias due to non‐randomised design |
| Allocation concealment (selection bias) | High risk | High in bias due to non‐randomised design |
| Confounding variables | Low risk | Rated 2 as the majority of important confounders considered and appropriately adjusted for |
| Blinding | Low risk | Rated 2 as some methods of blinding were employed |
| Incomplete outcome data (attrition bias) All outcomes | Low risk | Rated 2 as smaller amount of missing data with reasons given, balanced across groups |
| Selective reporting (reporting bias) | Low risk | Rated 1 as no evidence of selective reporting, protocol available |
| Other bias | High risk | Rated 5 as no investigation of dose of individual AED, unclear gestational age at recruitment |
Meischenguiser 2004.
| Methods | A prospective registry study (Argentina). | |
| Participants | 114 women being treated with AEDs for epilepsy, who were pregnant or intending to become pregnant. | |
| Interventions | Intervention group (monotherapy): 1) OXC (N = 35) 2) VPA (N = 21) 3) CBZ (N = 16) 4) PB (N = 5) |
|
| Outcomes | 1) Major malformations 2) Minor malformations 3) Pregnancy and delivery complications AEDs were analysed separately. |
|
| Notes | Protocol requested ‐ no response received | |
| Risk of bias | ||
| Bias | Authors' judgement | Support for judgement |
| Random sequence generation (selection bias) | High risk | High in bias due to non‐randomised design |
| Allocation concealment (selection bias) | High risk | High in bias due to non‐randomised design |
| Confounding variables | High risk | Rated 4 as some confounders collected but no adjustment in the analysis |
| Blinding | Unclear risk | Rated unclear as no details of blinding in text |
| Incomplete outcome data (attrition bias) All outcomes | Low risk | Rated 2 as small amount of missing data, unlikely to affect outcome |
| Selective reporting (reporting bias) | Low risk | Rated 2 as no evidence of selective reporting, no protocol available |
| Other bias | High risk | Rated 5 as dose not investigated, unclear gestational age at enrolment, unclear whether children with genetic syndromes excluded |
Montreal Series.
| Methods | A prospective study (Canada) | |
| Participants | 82173 births were analysed between 1978 and 2000 of:‐ 1) Women with epilepsy receiving AEDs (N = 335) 2) Women with epilepsy not receiving AEDs (N = 66) 3) no medication (in women without epilepsy) (N = 81759) |
|
| Interventions | Intervention group (monotherapy): 1) CBZ (N = 32) 2) PHT (N = 44) 3) VPA (N = 15) 4) PB (N = 10) Control group: 1) Women with epilepsy not taking any AEDs (N = 8) |
|
| Outcomes | 1) Neonatal outcome (including Stillbirths, Apgar score, birth weight) 2) Congenital malformations AEDs were analysed together |
|
| Notes | Protocol requested ‐ no response received | |
| Risk of bias | ||
| Bias | Authors' judgement | Support for judgement |
| Random sequence generation (selection bias) | High risk | High in bias due to non‐randomised design |
| Allocation concealment (selection bias) | High risk | High in bias due to non‐randomised design |
| Confounding variables | Unclear risk | Rated 3 as some confounders considered and full or partial adjustment employed |
| Blinding | Unclear risk | Rated unclear as no details in text |
| Incomplete outcome data (attrition bias) All outcomes | Low risk | Rated 2 as small amount of missing data, unlikely to affect outcome |
| Selective reporting (reporting bias) | Low risk | Rated 2 as no evidence of selective reporting, no protocol available |
| Other bias | High risk | Rated 5 as dose not investigated, unclear whether children with genetic syndromes, unclear gestational age at recruitment |
Motherisk Registry.
| Methods | A prospective study (Canada) | |
| Participants | 118 women were enrolled between 1987 and 1992, and 70 mother‐child pairs analysed. (+9 non‐medicated). | |
| Interventions | Intervention group (monotherapy): 1) PHT (N = 34) 2) CBZ (N = 36) Control group: 1) Women with epilepsy not taking any AEDs (N = 9) 2) no medication (in women without epilepsy) (N = 79) |
|
| Outcomes | 1) Major malformations 2) Minor anomalies |
|
| Notes | Protocol requested ‐ no response received. Data not included in meta‐analysis as non‐epilepsy cases >10%. | |
| Risk of bias | ||
| Bias | Authors' judgement | Support for judgement |
| Random sequence generation (selection bias) | High risk | High in bias due to non‐randomised design |
| Allocation concealment (selection bias) | High risk | High in bias due to non‐randomised design |
| Confounding variables | High risk | Rated 4 as some confounders considered and no adjustment employed |
| Blinding | Unclear risk | Rated 3 as partial blinding involved in study as some outcomes were blindly assessed, others were not |
| Incomplete outcome data (attrition bias) All outcomes | Low risk | Rated 2 as small amount of missing data pertaining to minor anomalies |
| Selective reporting (reporting bias) | Low risk | Rated 2 as no evidence of selective reporting, no protocol available |
| Other bias | High risk | Rated 5 as dose not investigated, unclear of gestational age at enrolment, unclear if children with genetic conditions were included. |
North American Register.
| Methods | A prospective, cohort‐controlled study (USA). Duration: 14 years. Follow‐up: Up to 12 weeks | |
| Participants | 5265 women were enrolled and analysed in the study:‐ | |
| Interventions | Intervention group (monotherapy): 1) CBZ (N = 1033) 2) LTG (N = 1562) 3) PHT (N = 416) 4) LEV (N = 450) 5) TPM (N = 359) 6) VPA (N = 323) 7) PB (N = 199) 8) OXC (N = 182) 9) GBP (N = 145) 10) ZNS (N = 90) Control group: 1) no medication (in women without epilepsy) (N = 442) |
|
| Outcomes | 1) Major congenital malformations, most commonly: hypospadias, neural tube defects, cardiovascular anomalies and oral clefts | |
| Notes | Protocol requested ‐ no response received. Data not available for specific malformations for GBP or ZNS. | |
| Risk of bias | ||
| Bias | Authors' judgement | Support for judgement |
| Random sequence generation (selection bias) | High risk | High in bias due to non‐randomised design |
| Allocation concealment (selection bias) | High risk | High in bias due to non‐randomised design |
| Confounding variables | Low risk | Rated 2 as most important confounders considered and suitable method of adjustment employed |
| Blinding | High risk | Rated 5 as no methods of blinding were employed, reviewed by family physician |
| Incomplete outcome data (attrition bias) All outcomes | Low risk | Rated 2 as small amount of missing data, unlikely to affect outcome |
| Selective reporting (reporting bias) | Low risk | Rated 2 as no evidence of selective reporting, no protocol available |
| Other bias | High risk | Rated 5 as women recruited at any stage of pregnancy |
Omtzigt 1992.
| Methods | A prospective study (Netherlands) | |
| Participants | 261 women enrolled, 297 children of women with epilepsy examined. | |
| Interventions | Intervention group (monotherapy): 1) VPA (N = 60) 2) CBZ (114) 3) PHT (N = 28) 4) PB (N = 18) |
|
| Outcomes | 1) Levels of maternal serum alpha fetoprotein 2) Foetus death 3) Malformations |
|
| Notes | Study authors' contact details could not be found. | |
| Risk of bias | ||
| Bias | Authors' judgement | Support for judgement |
| Random sequence generation (selection bias) | High risk | High in bias due to non‐randomised design |
| Allocation concealment (selection bias) | High risk | High in bias due to non‐randomised design |
| Confounding variables | High risk | Rated 4 as some confounders considered and no adjustment employed |
| Blinding | High risk | Rated 5 as no methods of blinding were employed |
| Incomplete outcome data (attrition bias) All outcomes | Unclear risk | Rated 2 as small amount of missing data, unlikely to affect outcome |
| Selective reporting (reporting bias) | Low risk | Rated 2 as no evidence of selective reporting, no protocol available |
| Other bias | Low risk | Rated 1 as no other bias identified |
Pardi 1982.
| Methods | A prospective study (Italy) | |
| Participants | 59 pregnant women with epilepsy were included in this study. | |
| Interventions | Intervention group (monotherapy): 1) CBZ (N = 2) 2) PB (N = 12) 3) PHT (N = 5) 4) PRM (N = 4) 5) VPA (N = 1) |
|
| Outcomes | 1) Seizure frequency 2) Major malformations 3) Minor malformations |
|
| Notes | Study authors' contact details could not be found. | |
| Risk of bias | ||
| Bias | Authors' judgement | Support for judgement |
| Random sequence generation (selection bias) | High risk | High in bias due to non‐randomised design |
| Allocation concealment (selection bias) | High risk | High in bias due to non‐randomised design |
| Confounding variables | High risk | Rated 5 as no confounding variables considered or adjusted for in analysis |
| Blinding | Unclear risk | Rated unclear as no details on methods of blinding |
| Incomplete outcome data (attrition bias) All outcomes | Low risk | Rated 2 as small amount of missing data, unlikely to affect outcome |
| Selective reporting (reporting bias) | Unclear risk | Rated 3 as limited information regarding a priori outcomes and measures |
| Other bias | High risk | Rated 5 as AEDs not reported separately, unclear whether children with genetic syndromes were excluded, no investigation of dose, unclear gestational age at enrolment |
Richmond 2004.
| Methods | A prospective study (Canada) | |
| Participants | 82173 foetuses were evaluated in this study; 414 births were to 313 women with epilepsy. Therefore 414 foetuses were included in the intervention group and 81759 were included in the control group. | |
| Interventions | The women were taking:‐ 1) PB 2) VPA 3) CBZ 4) PHT The number of pregnant women with epilepsy taking each AED was unclear. |
|
| Outcomes | 1) Congenital malformations 2) Neonatal deaths 3) Still births 4) Mean Apgar at 1 minute 5) Mean Apgar at 2 minutes 6) Mean birth weight |
|
| Notes | The number of pregnant women with epilepsy taking each AED was unclear. Protocol requested ‐ no response received. Data not included in meta‐analysis as outcomes by specific AED group were not reported. |
|
| Risk of bias | ||
| Bias | Authors' judgement | Support for judgement |
| Random sequence generation (selection bias) | High risk | High in bias due to non‐randomised design |
| Allocation concealment (selection bias) | High risk | High in bias due to non‐randomised design |
| Confounding variables | High risk | Rated 4 as some confounders considered and no adjustment employed |
| Blinding | Unclear risk | Rated unclear as no details on methods of blinding |
| Incomplete outcome data (attrition bias) All outcomes | Low risk | Rated 1 as no missing data |
| Selective reporting (reporting bias) | Low risk | Rated 2 as no evidence of selective reporting, no protocol available |
| Other bias | High risk | Rated 5 as AEDs not analysed separately, no investigation of dose, unclear whether children with genetic syndromes excluded, unclear gestational age at enrolment/recording |
Sabers 2004.
| Methods | A prospective study (Denmark) | |
| Participants | 151 women were enrolled in the study. Of these, 147 pregnancies were analysed (including 137 living newborns). All women involved had epilepsy. Monotherapy and Polytherapy outcomes were not reported separately. | |
| Interventions | The women were taking either:‐ 1) LTG 2) OXC 3) VPA 4) CBZ 5) GBP 6) PRM 7) TPM 8) PB 9) PHT Monotherapy numbers were unclear. Control group: 1) Women with epilepsy who were not taking any AEDs (N = 9) |
|
| Outcomes | 1) Neonatal outcome 2) Congenital malformations 3) Birth weight |
|
| Notes | The number of pregnant women with epilepsy taking each AED in monotherapy was unclear. Protocol requested ‐ no response received. Data was not included in meta‐analysis as outcomes pertaining to specific monotherapy groups was not reported. |
|
| Risk of bias | ||
| Bias | Authors' judgement | Support for judgement |
| Random sequence generation (selection bias) | High risk | High in bias due to non‐randomised design |
| Allocation concealment (selection bias) | High risk | High in bias due to non‐randomised design |
| Confounding variables | High risk | Rated 5 as no important confounders considered and no adjustment employed |
| Blinding | Unclear risk | Rated unclear as no details on methods of blinding |
| Incomplete outcome data (attrition bias) All outcomes | Low risk | Rated 2 as small amount of missing data, unlikely to affect outcome |
| Selective reporting (reporting bias) | Low risk | Rated 2 as no evidence of selective reporting, no protocol available |
| Other bias | High risk | Rated 5 as monotherapy and polytherapy reported together, unclear whether children with genetic syndromes were excluded, unclear gestational age at enrolment |
Samren 1997.
| Methods | A prospective study (Finland, Germany, Netherlands) | |
| Participants | 1221 pregnant women with epilepsy and 158 no medication (in women without epilepsy) were included in this study. | |
| Interventions | Intervention group (monotherapy): 1) CBZ (N = 280) 2) PB (N = 48) 3) PHT (N = 141) 4) PRM (N = 43) 5) VPA (N = 184) Control group: 1) no medication (in women without epilepsy) (N = 158)` |
|
| Outcomes | 1) Major malformations | |
| Notes | Study authors' contact details could not be found. Not included in meta analysis due to overlap with other included studies; reviewed narratively. |
|
| Risk of bias | ||
| Bias | Authors' judgement | Support for judgement |
| Random sequence generation (selection bias) | High risk | High in bias due to non‐randomised design |
| Allocation concealment (selection bias) | Unclear risk | High in bias due to non‐randomised design |
| Confounding variables | Unclear risk | Rated 3 as some confounders considered and full or partial adjustment employed |
| Blinding | High risk | Rated 5 as no blinding employed |
| Incomplete outcome data (attrition bias) All outcomes | Unclear risk | Rated unclear as no information provided |
| Selective reporting (reporting bias) | Unclear risk | Rated 2 as no evidence of selective reporting, protocol not available |
| Other bias | High risk | Rated 5 as unclear gestational age at recruitment, unclear is genetic syndromes were excluded |
Shapiro 1976.
| Methods | Two prospective registry studies (Finland and USA). Only the USA study meets inclusion criteria. | |
| Participants | 305 women with epilepsy in USA study. | |
| Interventions | Intervention group: 1) PHT (N = 102) Unclear if this is monotherapy in isolation. |
|
| Outcomes | 1) Major and minor malformations | |
| Notes | Protocol requested ‐ Study author declined request. Limited data available on methodology. Not included in meta‐analysis due to it being unclear if cases were exposed to monotherapy PHT. | |
| Risk of bias | ||
| Bias | Authors' judgement | Support for judgement |
| Random sequence generation (selection bias) | High risk | High in bias due to non‐randomised design |
| Allocation concealment (selection bias) | High risk | High in bias due to non‐randomised design |
| Confounding variables | High risk | Rated 5 as no important confounders considered and no adjustment employed. |
| Blinding | Unclear risk | Rated as unclear as no details in text |
| Incomplete outcome data (attrition bias) All outcomes | High risk | Rated 5 as no information provided regarding missing data |
| Selective reporting (reporting bias) | Unclear risk | Rated 3 as limited information regarding a priori outcomes; protocol not available |
| Other bias | High risk | Rated 5 as no investigation of dose, unclear gestational age at recruitment, inclusion of malformations linked to genetic syndrome |
Steegers‐Theunissen 1994.
| Methods | A prospective study (Netherlands). | |
| Participants | 119 pregnant women with epilepsy and 106 pregnant women were included in this study. | |
| Interventions | Intervention group (monotherapy): 1) CBZ (N = 39) 2) VPA (N = 19) 3) PB (N = 12) 4) PHT (N = 8) Control group: 1) Women with epilepsy not taking any AEDs (N = 126) 2) no medication (in women without epilepsy) (N = 106) |
|
| Outcomes | 1) Major congenital malformations 2) Minor congenital malformations 3) Ectopic pregnancies 4) Abortions 5) Neonatal head circumference 6) Birth weight 7) Birth length AEDs analysed together. |
|
| Notes | Protocol requested ‐ no response received | |
| Risk of bias | ||
| Bias | Authors' judgement | Support for judgement |
| Random sequence generation (selection bias) | High risk | High in bias due to non‐randomised design |
| Allocation concealment (selection bias) | High risk | High in bias due to non‐randomised design |
| Confounding variables | Low risk | Rated 2 as most important confounders considered and suitable method of adjustment employed |
| Blinding | Unclear risk | Rated unclear as no details on methods of blinding |
| Incomplete outcome data (attrition bias) All outcomes | Unclear risk | Rated unclear as no details of numbers recruited versus those analysed |
| Selective reporting (reporting bias) | Low risk | Rated 2 as no evidence of selective reporting, no protocol available |
| Other bias | High risk | Rated 5 as no investigation of dose, unclear whether children with genetic syndromes excluded, unclear gestational age at enrolment. |
Tanganelli 1992.
| Methods | A prospective study (Italy) | |
| Participants | 97 women with epilepsy (138 pregnancies) and 88 no medication (in women without epilepsy) (140 pregnancies) were included in this study. 278 pregnancies were analysed. | |
| Interventions | Intervention group (monotherapy): 1) PB (N = 63) 2) CBZ (N = 9) 3) VPA (N = 6) Control group 1) no medication (in women without epilepsy) (N = 124). |
|
| Outcomes | 1) Seizure frequency 2) Pregnancy outcome 3) Presence of major congenital malformations AEDs were analysed together. |
|
| Notes | Study authors' contact details could not be found | |
| Risk of bias | ||
| Bias | Authors' judgement | Support for judgement |
| Random sequence generation (selection bias) | High risk | High in bias due to non‐randomised design |
| Allocation concealment (selection bias) | High risk | High in bias due to non‐randomised design |
| Confounding variables | High risk | Rated 5 as no important confounders considered and no adjustment employed |
| Blinding | Unclear risk | Rated unclear as no details on methods of blinding |
| Incomplete outcome data (attrition bias) All outcomes | Unclear risk | Rated unclear as no details of numbers recruited versus those analysed |
| Selective reporting (reporting bias) | Unclear risk | Rated 3 as limited information regarding a priori outcomes and measures |
| Other bias | High risk | Rated 5 as no investigation of dose, unclear gestational age at enrolment, unclear if children with genetic syndromes excluded |
Torres 1995.
| Methods | A prospective study (Spain) | |
| Participants | 61 pregnant women with epilepsy were included in this study. | |
| Interventions | Intervention group (monotherapy): CBZ PHT VPA PRM CLO Number of participants in each monotherapy group are unclear. |
|
| Outcomes | 1) Complications during pregnancy 2) Congenital malformations |
|
| Notes | Study authors contact details could not be found. Not included in meta‐analysis due to outcomes not being reported for specific monotherapy groups. Numbers in each monotherapy group are unclear. | |
| Risk of bias | ||
| Bias | Authors' judgement | Support for judgement |
| Random sequence generation (selection bias) | High risk | High in bias due to non‐randomised design |
| Allocation concealment (selection bias) | High risk | High in bias due to non‐randomised design |
| Confounding variables | High risk | Rated 5 as no consideration or adjustment for confounders |
| Blinding | Unclear risk | Rated unclear as no details in text |
| Incomplete outcome data (attrition bias) All outcomes | Low risk | Rated 2 as small amount of missing data, reasons given |
| Selective reporting (reporting bias) | Unclear risk | Rated as 3 as limited information regarding a priori outcomes; protocol not available |
| Other bias | High risk | Rated 5 numbers of monotherapy unclear, no investigation of dose, unclear gestational age at enrolment, unclear if children with genetic syndromes were excluded |
UK Register.
| Methods | A prospective registry study (UK). | |
| Participants | 4414 pregnancies of women with epilepsy were included in this study, 3607 were analysed. | |
| Interventions | Intervention group (monotherapy): 1) CBZ (N = 1657) 2) VPZ (N = 1220) 3) LTG (N = 2098) 4) PHT (N = 106) 5) GBP (N = 31) 6) TPM (N = 70) 7) LEV (N = 304) Control group: 1) Women with epilepsy who were not taking any AEDs (N = 541) |
|
| Outcomes | 1) Congenital malformations 2) Pregnancy outcome |
|
| Notes | Personal communication from the authors provided up to date figures for PHT and controls. Protocol requested ‐ protocol received. |
|
| Risk of bias | ||
| Bias | Authors' judgement | Support for judgement |
| Random sequence generation (selection bias) | High risk | High in bias due to non‐randomised design |
| Allocation concealment (selection bias) | High risk | High in bias due to non‐randomised design |
| Confounding variables | Unclear risk | Rated 3 as some confounders considered and fully adjusted for |
| Blinding | High risk | Rated 5 as no methods of blinding were employed, reviewed by family physician |
| Incomplete outcome data (attrition bias) All outcomes | Low risk | Rated 2 a small amount of missing data, unlikely to affect outcome |
| Selective reporting (reporting bias) | Low risk | Rated 1 as no evidence of selective reporting, protocol provided |
| Other bias | High risk | Rated 5 as unclear gestational age at enrolment, unclear whether children with genetic syndromes were excluded |
Waters 1994.
| Methods | A prospective study (USA) | |
| Participants | Of the 211 women with epilepsy enrolled, data from 174 pregnancies was available for analysis. | |
| Interventions | Intervention group (monotherapy): 1) CBZ (N = 33) 2) PHT (N = 28) 3) PB (N = 21) Control group: 1) Women with epilepsy who were not taking any AEDS (N = 15) |
|
| Outcomes | 1) Major malformations 2) Fetal death |
|
| Notes | Protocol requested ‐ author unable to provide protocol. | |
| Risk of bias | ||
| Bias | Authors' judgement | Support for judgement |
| Random sequence generation (selection bias) | High risk | High in bias due to non‐randomised design |
| Allocation concealment (selection bias) | High risk | High in bias due to non‐randomised design |
| Confounding variables | Unclear risk | Rated 3 as some confounders considered but several important confounders not considered and adjusted for |
| Blinding | Unclear risk | Rated unclear as no details on methods of blinding |
| Incomplete outcome data (attrition bias) All outcomes | Low risk | Rated 2 as only small amount of missing data, unlikely to affect outcome |
| Selective reporting (reporting bias) | Unclear risk | Rated 3 as limited information regarding a priori outcomes and measures |
| Other bias | High risk | Rated 5 as AEDs were reported together, no investigation of dose, unclear gestational age at enrolment, unclear if children with genetic syndromes were excluded |
Wide 2000.
| Methods | A prospective, controlled study (Sweden). Duration: 10 years. Follow‐up: 9 months | |
| Participants | 167 infants born to women with epilepsy and no medication (in women without epilepsy) between 1985 and 1995 were included in this study. | |
| Interventions | Intervention group (monotherapy): 1) CBZ (N = 39) 2) PHT (N = 22) Control group: 1) Women with epilepsy who were not taking any AEDs (N = 8). 2) no medication (in women without epilepsy) (N = 83) |
|
| Outcomes | 1) Griffiths test results (psychomotor development) 2) Minor anomalies Some AEDs were analysed separately. |
|
| Notes | Protocol requested ‐ protocol received. | |
| Risk of bias | ||
| Bias | Authors' judgement | Support for judgement |
| Random sequence generation (selection bias) | High risk | High in bias due to non‐randomised design |
| Allocation concealment (selection bias) | High risk | High in bias due to non‐randomised design |
| Confounding variables | High risk | Rated 4 as some confounders were considered but not adjusted for |
| Blinding | Low risk | Rated 2 as assessors blinded to participants drug regimen |
| Incomplete outcome data (attrition bias) All outcomes | Low risk | Rated 2 as small amount of missing data, unlikely to affect outcome |
| Selective reporting (reporting bias) | Low risk | Rated 1 as no evidence of selective reporting, protocol available |
| Other bias | High risk | Rated 5 as unclear whether children with genetic syndromes were excluded, no investigation of dose |
Yerby 1992.
| Methods | A prospective study (USA) | |
| Participants | 145 women were enrolled in the study. 64 children born to women with epilepsy and 46 children born to no medication (in women without epilepsy) were included in this study. | |
| Interventions | Intervention group (monotherapy): 1) CBZ (N = 20) 2) PB (N = 8) 3) PHT (N = 12) 4) PRM (N = 1) 5) VPA (N = 3) Control group: 1) Women with epilepsy who were not taking AEDs 2) no medication (in women without epilepsy) (N = 46) |
|
| Outcomes | 1) Birth weight 2) Birth length 3) Gestational age 4) Head circumference 5) Apgar score 6) Feeding difficulties 7) Neonatal irritability 8) Major malformations 9) Congenital anomalies |
|
| Notes | Protocol requested ‐ no response received | |
| Risk of bias | ||
| Bias | Authors' judgement | Support for judgement |
| Random sequence generation (selection bias) | High risk | High in bias due to non‐randomised design |
| Allocation concealment (selection bias) | High risk | High in bias due to non‐randomised design |
| Confounding variables | High risk | Rated 4 as some confounders were considered but not adjusted for |
| Blinding | Low risk | Rated 2 as assessors blinded to participants drug regimen |
| Incomplete outcome data (attrition bias) All outcomes | Low risk | Rated 2 as small amount of missing data, unlikely to affect outcome |
| Selective reporting (reporting bias) | Low risk | Rated 2 as no evidence of selective reporting, no protocol available |
| Other bias | High risk | Rated 5 as women recruited up to 26 weeks therefore presence malformations may already be known, unclear if children with genetic syndromes were excluded, no investigation of dose |
Characteristics of excluded studies [ordered by study ID]
| Study | Reason for exclusion |
|---|---|
| Annegers 1974 | Retrospective methodology |
| Artama 2013 | Record linkage study |
| Arteaga‐Vazques 2012 | Case control study |
| Baermig 1973 | Retrospective methodology |
| Canun‐Serrano 1986 | Retrospective methodology |
| Castilla‐Puentes 2014 | Pharmaceutical post‐marketing report with no control group |
| Dobos 1985 | Retrospective methodology |
| Elshove 1971 | Mixed prospective and retrospective methodology |
| Holmes 1994 | Retrospective methodology |
| Jacobsen 2014 | Record linkage study |
| Knight 1975 | No control group |
| Lamotrigine Pregnancy Register | No control group |
| Miskov 2009 | No control group |
| Monson 1973 | Record linkage study |
| Montouris 2003 | Mixed prospective and retrospective methodology |
| Mostacci 2014 | Record linkage study |
| Nakane 1980 | Mixed prospective and retrospective methodology |
| Pearse 1992 | No control group |
| Robert 1983 | Case control study |
| Starveld‐Zimmerman 1975 | Retrospective methodology |
| Veiby 2014 | Record linkage |
Characteristics of studies awaiting assessment [ordered by study ID]
Babic 2014.
| Methods | Prospective, observational, single‐centre study (Serbia) |
| Participants | 21 women with juvenile myoclonic epilepsy (25 pregnancies, mean age 26.4, ranged 22‐34 years) |
| Interventions | 1) Valproate (N = 6) 2) Lamotrigine (N = 8) 3) Topiramate (N = 2) 4) Levetiracetam (N = 4) 5) Polytherapy (N = 5) |
| Outcomes | 1) Congenital malformations 2) Miscarriage 3) Mode of delivery 4) APGAR score |
| Notes |
Idriz‐Oglu 2014.
| Methods | Prospective cohort study (Turkey) |
| Participants | 35 pregnant women with epilepsy being treated with either monotherapy or polytherapy |
| Interventions | 1) Lamotrigine (N = 12) 2) Carbamazepine (N = 11) 3) Valproic Acid (N = 9) 4) Other (N = 3) |
| Outcomes | 1) Spontaneous abortion 2) Medical termination 3) Birthweight 4) Respiratory distress 5) Intensive care |
| Notes |
Jones 1992.
| Methods | |
| Participants | |
| Interventions | |
| Outcomes | |
| Notes |
Kaabi 2013.
| Methods | Retrospective cohort study (Tunisia) |
| Participants | 19 women exposed to AEDs during pregnancy were involved in the study |
| Interventions | 1) Valproic acid (N = 7) 2) Carbamazepine (N = 5) 3) Phenobarbital (N = 2) 4) Phenytoin (N = 1) |
| Outcomes | 1) Birthweight 2) Malformations |
| Notes |
Kutlu 2013.
| Methods | Prospective cohort study (Canada). Duration: 10 years |
| Participants | 87 pregnancies from 83 women with epilepsy: 1) focal onset with secondary generalised seizures (N = 52) 2) generalised seizures (N = 31) |
| Interventions | AEDs |
| Outcomes | 1) Spontaneous abortions 2) Major malformations |
| Notes |
Lazzaroni Fossati 1986.
| Methods | Cohort study (Italy) |
| Participants | 36 women with epilepsy |
| Interventions | 1) Phenobarbital 2) Benzodiazepines 3) Diphenylhydantoin 4) Sodium valproate 5) Primidone 6) Carbamazepine 7) Sultiame |
| Outcomes | 1) Congenital malformations |
| Notes |
Midi 2014.
| Methods | Prospective cohort study (Canada). Duration: 1 year |
| Participants | 43 pregnant women with epilepsy |
| Interventions | 1) Lamotrigine 2) Carbamazepine |
| Outcomes | 1) Malformations 2) Spontaneous abortion |
| Notes |
Shvartzman 1986.
| Methods | Cohort study (Hebrew paper) |
| Participants | 14 women with epilepsy |
| Interventions | 1) Hydantoin + Phenobarbitone 2) Phenobarbitone 3) Hydantoin 4) Primidone 5) Methosuximide 6) Carbamazepine 7) Diazepam 8) No treatment |
| Outcomes | 1) Congenital malformations 2) Development |
| Notes |
Vlasov 2014.
| Methods | Cohort study (Russia) |
| Participants | 162 pregnant women (49 in 1998 and 113 in 2013) with: 1) Focal epilepsy (N = 124; 38 in 1998 and 86 in 2013) 2) Ideopathic generalised epilepsy (N = 31; 6 in 1998 and 25 in 2013) 3) Undetermined epilepsy (N = 7; 5 in 1998 and 2 in 2013) |
| Interventions | 1) Carbamazepine (N = 48) 2) Valproate (N = 26) 3) Barbiturates (N = 8) 4) Levetiracetam (N = 13) 5) Other drugs (N = 34) |
| Outcomes | 1) Mode of delivery |
| Notes |
Differences between protocol and review
In the protocol it stated that, where possible, we would conduct meta‐analysis at the monotherapy and polytherapy group level. However, given the bias likely to be included in any analysis including polytherapy combinations and on recommendation of one of the peer reviewers we have not included these comparisons. The authors feel that given the heterogenous nature of the results across the included medications that this was the best course of action to ensure reliable results.
In the protocol it was stated that we would look at the specific malformations of genitourinary and gastrointestinal nature, however at the point of data extraction it became apparent that there was too little data reported from the included studies to be able to do this. Therefore the included studies were consulted and the four most commonly reported specific malformation types were selected and reported on.
Due to the small amount of data pertaining to minor malformations meta‐analysis was not possible and therefore outcomes pertaining to this secondary outcome are reviewed narratively.
Within the protocol it was stated that, if appropriate, summary of findings tables using the GRADE approach would be presented. However, due to the inclusion of more than one AED across a number of outcomes, the creating and presenting of all data would be difficult to produce in a manner that could be understood and used appropriately.
In the protocol it was also stated that both fixed‐effect and random‐effects model analyses would be implemented, however the authors did not state exactly how these would be utilised and therefore we have elaborated on the methods here to clarify the situation. It was always the intention that fixed‐effect models would be carried out primarily, with random‐effects model analysis to explore potential heterogeneity. In addition, due to data being sparse in some comparisons, and with some studies reporting zero events in one or both groups, the risk difference (RD) was calculated and this was not stipulated within the protocol as we were not expecting to find such sparse data.
Contributions of authors
JW and RB wrote this review with input from CJ, NA, JG, AJM, CT, JCS and AM. Data extraction and risk of bias assessments were undertaken by RB, JW, JH, CJ, NA, JCS and AJM. JCS assisted extensively with the classification of malformations within this review.
Sources of support
Internal sources
No sources of support supplied
External sources
-
National Institute for Health Research, UK.
This review was supported by the National Institute for Health Research, via Cochrane Infrastructure funding to the Epilepsy Group. The views and opinions expressed therein are those of the authors and do not necessarily reflect those of the Systematic Reviews Programme, NIHR, NHS or the Department of Health.
-
National Institute for Health Research, UK.
This report is independent research supported by the National Institute for Health Research (Post Doctoral Fellowship, Dr Rebecca Bromley, PDF‐2013‐06‐041). The views expressed in this publication are those of the author(s) and not necessarily those of the NHS, the National Institute for Health Research or the Department of Health.
Declarations of interest
RB and JCS have provided expert testimony regarding child outcomes following prenatal exposure to AEDs and has worked on research projects funded by Sanofi Aventis and UCB Pharma with the funds going to their employing institutions. RB has also received consultancy fees from UCB Pharma on one occasion for a matter unrelated to this subject area.
NA has been sponsored to attend educational meetings and conferences in epilepsy over the last five years by UCB Pharma, GSK and Boehringer Ingelheim, and has participated in regional advisory Board meetings for Eisai on their product Eslicarbazepine and Zonisamide.
AM has been sponsored to attend a conference and has had research funding from Pfizer Ltd. Also a consortium of pharmaceutical companies (GSK, EISAI, UCB Pharma) funded the National Audit of Seizure Management in Hospitals (NASH) through grants paid to University of Liverpool. Professor Tony Marson is Theme Leader for Managing Complex Needs at NIHR CLAHRC NWC.
No other conflicts of interest declared.
Edited (no change to conclusions)
References
References to studies included in this review
Al Bunyan 1999 {published data only}
- Al Bunyan M, Abo‐Talib Z. Outcome of pregnancies in epileptic women: a study in Saudi Arabia. Seizure 1999;8:26‐29. [DOI] [PubMed] [Google Scholar]
Arulmozhi 2006 {published data only}
- Arulmozhi T, Dhanaraj M, Rangaraj R, Vengatesan A. Physical growth and psychomotor development of infants exposed to antiepileptic drugs in utero. Neurology India 2006;54(1):42‐46. [DOI] [PubMed] [Google Scholar]
Australian {published data only}
- Vajda F, Lander C, O'Brien T, et al. Australian Pregnancy Registry of Women Taking Antiepileptic Drugs. Epilepsia 2004;45(11):1466. [DOI] [PubMed] [Google Scholar]
- Vajda F, O'Brien T, Graham J, Lander C, Eadie M. Dose dependence of fetal malformations associated with valproate. Neurology 2013;81:999‐1003. [DOI] [PubMed] [Google Scholar]
- Vajda F, O'Brien T, Lander C, Graham J, Roten A, Eadie M. Teratogenesis in repeated pregnancies in antiepileptic drug‐treated women. Epilepsia 2013c;54(1):181‐186. [DOI] [PubMed] [Google Scholar]
- Vajda FJ, O'Brien TJ, Hitchcock A, Graham J, Lander C. The Australian registry of anti‐epileptic drugs in pregnancy: experience after 30 months. Journal of Clinical Neuroscience 2003;10(5):543‐549. [DOI] [PubMed] [Google Scholar]
- Vajda FJ, O'Brien TJ, Hitchcock A, et al. Critical relationship between sodium valproate dose and human teratogenicity: results of the Australian register of anti‐epileptic drugs in pregnancy. Journal of Clinical Neuroscience 2004;11(8):854‐858. [DOI] [PubMed] [Google Scholar]
- Vajda FJE, Eadie MJ. Maternal valproate dosage and foetal malformations. Acta Neurol Scand 2005;112:137‐143. [DOI] [PubMed] [Google Scholar]
- Vajda FJE, Graham J, Lander CM, O'Brien TJ, Eadie M. Teratogenicity of the newer antiepileptic drugs‐ the Australian experience. Journal of Clinical Neuroscience 2012;19:57‐59. [DOI] [PubMed] [Google Scholar]
- Vajda FJE, Graham JE, Hitchcock AA, O'Brien TJ, Lander CM, Eadie MJ. Is lamotrigine a significant human teratogen? Observations from the Australian Pregnancy Register. Seizure 2010;19:558‐561. [DOI] [PubMed] [Google Scholar]
- Vajda FJE, Hitchcock A, Graham J, O'Brien T, Lander C, Eadie M. The Australian Register of Antiepileptic Drugs in Pregnanacy: The first 1002 pregnancies. Australian and New Zealand Journal of Obstetrics and Gynaecology 2007;47:468‐474. [DOI] [PubMed] [Google Scholar]
- Vajda FJE, Lander CM, Hitchcock A, et al. Changing Australian prescribing patterns for antiepileptic drugs in pregnancy and their possible consequences. Journal of Clinical Neuroscience 2007;14:611‐617. [DOI] [PubMed] [Google Scholar]
- Vajda FJE, O'Brien TJ, Graham J, Lander CM, Eadie MJ. Prediction of the hazard of foetal malformation in pregnant women with epilepsy. Epilepsy Research 2014;108(6):1013‐1017. [DOI] [PubMed] [Google Scholar]
- Vajda FJE, O'Brien TJ, Lander CM, Eadie MJ. Associations between particular types of fetal malformation and antiepileptic drug exposure in utero. Acta Neurol Scand 2013b;128:228‐234. [DOI] [PubMed] [Google Scholar]
Bag 1989 {published data only}
- Bag S, Behari M, Ahuja GK, Karmarkar MG. Pregnancy and epilepsy. Journal of Neurology 1989;236:311‐313. [DOI] [PubMed] [Google Scholar]
Barqawi 2005 {published data only}
- Barqawi R. Evaluation of antiepileptic drugs in pregnancy in a Jordanian army hospital. Eastern Mediterranean Health Journal 2005;11(4):601‐605. [PubMed] [Google Scholar]
Bozhinova 2009 {published data only}
- Bozhinov P, Bozhinova S, Markova C. Fetal malformations in women with epilepsy. Akusherstvo i Ginekologiia 2009;48(1):16‐21. [PubMed] [Google Scholar]
Canger 1999 {published data only}
- Battino D, Binelli S, Caccamo ML, et al. Malformations in offspring of 305 epileptic women: a prospective study. Acta Neurol Scand 1992;85:204‐207. [DOI] [PubMed] [Google Scholar]
- Battino D, Kaneco S, Andermann E, et al. Intrauterine growth in the offspring of epileptic women: a prospective multicentre study. Epilepsy Research 1999;36:53‐60. [DOI] [PubMed] [Google Scholar]
- Canger R, Battino D, Canevini MP, et al. Malformations in Offspring of Women with Epilepsy: A Prospective Study. Epilepsia 1999;40(9):1231‐1236. [DOI] [PubMed] [Google Scholar]
Cassina 2013 {published data only}
- Cassina M, Dilaghi A, Gianantonio E, et al. Pregnancy outcome in women exposed to antiepileptic drugs: teratogenic role of maternal epilepsy and its pharmacologic treatment. Reproductive Toxicology 2013;39:50‐57. [DOI] [PubMed] [Google Scholar]
D'Souza 1990 {published data only}
- D'Souza SW, Robertson IG, Donnai D, Mawer G. Fetal phenytoin exposure, hypoplastic nails, and jitteriness. Archives of Disease in Childhood 1990;65:320‐324. [DOI] [PMC free article] [PubMed] [Google Scholar]
Delmiš 1991 {published data only}
- Đelmiš J, Dražančić A, Tkalčević T, Ivanišević M. Epilepsy in Pregnancy [Epilepsija I Trudnoća]. Jugosl ginekol perinatal 1991;31(1‐2):23‐26. [PubMed] [Google Scholar]
Diaz‐Romero 1990 {published data only}
- Diaz‐Romero RM, Garza‐Morales S, Mayen‐Molina DG, Ibarra‐Puig J, Avila‐Rosas H. Facial Anthropometric Measurements in Offspring of Epileptic Mothers. Archives of Medical Research 1999;30:186‐189. [DOI] [PubMed] [Google Scholar]
Dravet 1992 {published data only}
- Dravet C, Julian C, Legras C, et al. Epilepsy, antiepileptic drugs, and malformations in children of women with epilepsy: A French prospective cohort study. Neurology 1992;42 (suppl 5):75‐82. [PubMed] [Google Scholar]
Eroglu 2008 {published data only}
- Eroglu E, Gokcil Z, Bek S, Hidir Ulas U, Odabasi Z. Pregnancy and teratogenicity of antiepileptic drugs. Acta Neurol. Belg. 2008;108:53‐57. [PubMed] [Google Scholar]
EURAP {published data only}
- Tomson T, Battino D, Bonizzoni E, Craig J, Lindhout D, Sabers A, Perucca E, Vajda F, for the EURAP study group. Dose‐dependent risk of malformations with antiepileptic drugs: an analysis of data from the EURAP epilepsy and pregnancy registry. Lancet Neurology 2011;10:609‐17. [DOI] [PubMed] [Google Scholar]
- Tomson T, Battino D, Bonizzoni E, Craig JJ, Lindhout D, Perucca E, et al. Antiepileptic drugs and intrauterine death. Neurology 2015;85(7):580‐8. [DOI] [PubMed] [Google Scholar]
Fairgrieve 2000 {published data only}
- Fairgrieve SD, Jackson M, Jonas P, Walshaw D, White K, Montgomery M, Burn J, Lynch SA. Population based, prospective study of the care of women with epilepsy in pregnancy. British Medical Journal 2000;321:674‐675. [DOI] [PMC free article] [PubMed] [Google Scholar]
Froscher 1991 {published data only}
- Froescher W, Herrmann R, Neisen M, Buelau P, Penin H, Hildenbrand G. The course of pregnancy and teratogenicity of antiepileptic agents in 66 patients with epilepsy [Untersuchungen zum schwangerschaftsverlauf und zer teratogenitat der antiepileptika bei 66 epilepsie‐patientinnen]. Schweizer Archiv fur neurologie und psychiatrie 1991;142(5):389‐407. [PubMed] [Google Scholar]
Fujji 2013 {published data only}
- Fujji H, Goel A, Bernard N, Pistelli A, Yates L, Stephens S, Han J, Matsui D, Etwell F, Einarson T, Koren G, Einarson A. Pregnancy outcomes following gabapentin use: results of a prospective comparative cohort study. Neurology 2013;80(1):565‐1570. [DOI] [PMC free article] [PubMed] [Google Scholar]
Gaily 1988 {published data only}
- Gaily E. Distal Phalangeal Hypoplasia in Children With Prenatal Phenytoin Exposure: Results of a Controlled Anthropometric Study. American Journal of Medical Genetics 1990;35:574‐578. [DOI] [PubMed] [Google Scholar]
- Gaily E, Granstrom M‐L, Hiilesmaa V, Bardy A. Head circumference in children of epileptic mothers: contributions of drug exposure and genetic background. Epilepsy Research 1990;5:217‐222. [DOI] [PubMed] [Google Scholar]
- Gaily E, Granstrom M‐L, Hiilesmaa V, Bardy A. Minor anomalies in offspring of epileptic mothers. Journal of Pediatrics 1988;112(4):520‐529. [DOI] [PubMed] [Google Scholar]
- Hilemsmaa V, Bardy AH, Teramo K. Obstetric outcome in women with epilepsy. American Journal of Obstetrics and Gynecology 1985;152(5):499‐504. [DOI] [PubMed] [Google Scholar]
- Hilemsmaa V, Teramo K, Granstrom ML, Bardy AH. Serun folate concentrations during pregnancy in women with epilepsy: relation to antiepileptic drug concentrations, number of seizures and fetal outcome. British Medical Journal 1988;287:577‐578. [DOI] [PMC free article] [PubMed] [Google Scholar]
Garza‐Morales 1996 {published data only}
- Garza‐Morales S, Ibarra‐Puig JM, Poblano‐Luna A, Mayen‐Molina G, Cordova‐Lopez S. Epilepsy and pregnancy: prospective study of 100 cases [Epilepsia y embarazo. Estudio prospectivo 100 casos]. Ginecologia U Obstetricia de Mexico 1996;64:449‐454. [PubMed] [Google Scholar]
Goujard 1974 {published data only}
- Goujard J, Huel G, Rumeau‐Rouquette C. Antiepileptics and congenital malformations [Antiepileptiques et malformations congenitales]. Journal of Gynecology Obstetrics and Biological Reproduction 1974;3:831‐842. [PubMed] [Google Scholar]
Hill 1974 {published data only}
- Hill RM, Verniaud WM, Horning MG, McCulley LB, Morgan NF. Infants Exposed in Utero to Antiepileptic Drugs. American Journal of Diseases of Children 1974;127:645‐653. [DOI] [PubMed] [Google Scholar]
Israeli Teratogen Service {published data only}
- Diav‐Citrin O, Shechtman S, Arnon J, et al. Is carbamazepine teratogenic? A prospective controlled study of 210 pregnancies. Neurology 2001;57:321‐324. [DOI] [PubMed] [Google Scholar]
- Diav‐Citrin O, Shechtman S, Bar‐Oz B, Cantrell D, Arnon J, Ornoy A. Pregnancy Outcome after in utero Exposure to Valproate. CNS Drugs 2008;22(4):325‐334. [DOI] [PubMed] [Google Scholar]
- Ornoy A, Cohen E. Outcome of children born to epileptic mothers treated with carbamazepine during pregnancy. Archives of Disease in Childhood 1996;75:517‐520. [DOI] [PMC free article] [PubMed] [Google Scholar]
- Ornoy A, Zvi N, Arnon J, Wajnberg R, Shechtman S, Diav‐Citrin O. The outcome of pregnancy following topiramate treatment: A study on 52 pregnancies. Reproductive Toxicology 2008;25:388‐389. [DOI] [PubMed] [Google Scholar]
Jones 1989 {published data only}
- Jones KL, Lacro RV, Johnson KA, Adams J. Pattern of malformations in the children of women treated with carbamazepine during pregnancy. The New England Journal of Medicine 1989;320(25):1661‐1666. [DOI] [PubMed] [Google Scholar]
Kaaja 2003 {published data only}
- Kaaja E, Kaaja R, Hiilesmaa V. Major malformations in offspring of women with epilepsy. Neurology 2003;60:575‐579. [DOI] [PubMed] [Google Scholar]
Kaneko 1999 {published data only}
- Kaneko S, Battino D, Andermann E, et al. Congenital malformations due to antiepileptic drugs. Epilepsy Research 1999;33:141‐158. [DOI] [PubMed] [Google Scholar]
- Kaneko S, Otani K, Fukushima Y, et al. Teratogenicity of antiepileptic drugs: analysis of possible risk factors. Epilepsia 1988;29(4):459‐467. [DOI] [PubMed] [Google Scholar]
- Kaneko S, Otani K, Hirano T, Kondo T, Fukushima Y, Nakamura Y, Ogawa Y, Saito Y, Kan R, Kumashiro H, Takeda A, Nakane Y, Tsuiki H, Tsurusaki M, Teranishi T, Goto M. Teratogenicity of antiepileptic drugs: is prevention possible. The Japanese Journal of Psychiatry and Neurology 1991;45(2):478‐481. [DOI] [PubMed] [Google Scholar]
- Kaneko S, Otani K, Kondo T, Fukushima Y, Kan R, Takeada A, Nakane Y. Teratogenicity of antiepileptic drugs and drug specific malformations. The Japanese Journal of Psychiatry and Neurology 1993;47(2):306‐309. [DOI] [PubMed] [Google Scholar]
- Kaneko S, Otani K, Kondo T, Fukushima Y, Ogawa Y, Kan R, Takeada A, Nakene Y, Teranishi T. Malformations in infants of mothers with epilepsy. Neurology 1992;42(supp 5):68‐74. [PubMed] [Google Scholar]
Kelly 1984 {published data only}
- Kelly T, Edwards P, Rein M, Miller JQ, Dreifuss FE. Teratogenicity of Anticonvulsant Drugs. II: A Prospective Study. American Journal of Medical Genetics 1984;19:435‐443. [DOI] [PubMed] [Google Scholar]
Kerala Pregnancy Registry {published data only}
- Begum S, Sarma S, Thomas S. Malformation in index pregnancy in women with epilepsy is not followed by recurrence in subsequent pregnancy. Epilepsia 2013;54(12):163‐167. [DOI] [PubMed] [Google Scholar]
- Thomas SV, Ajaykumar B, Sindhu K, et al. Cardiac Malformations Are Increased in Infants of Mothers with Epilepsy. Pediatr Cardiol 2008;29:604‐608. [DOI] [PubMed] [Google Scholar]
- Thomas SV, Indrani L, Devi GC, et al. Pregnancy in women with epilepsy: preliminary results of Kerala registry of epilepsy and pregnancy. Neurology India 2001;49(1):60‐66. [PubMed] [Google Scholar]
Koch 1992 {published data only}
- Jager‐Roman E, Deichi A, Jakob S, et al. Fetal growth, major malformations, and minor anomalies in infants born to women receiving valproic acid. Pediatric Pharmacology and Therapeutics 1986;108:997‐1004. [DOI] [PubMed] [Google Scholar]
- Koch S, Gopfert‐Geyer I, Jager‐Roman E, et al. [Antiepileptika wahrend der Schwangerschaft]. Dtsch. Med. Wochenschr 1983;108(7):250‐257. [DOI] [PubMed] [Google Scholar]
- Koch S, Losche G, Jager‐Roman E, et al. Major and minor birth malformations and antiepileptic drugs. Neurology 1992;42(5):83‐88. [PubMed] [Google Scholar]
- Kuhnz W, Jager‐Roman E, Rating D, et al. Carbamazepine and Carbamazepine‐10,11‐Epoxide During Pregnancy and Postnatal Period in Epileptic Mothers and Their Nursed Infants: Pharmacokinetics and Clinical Effects. Pediatric Pharmacology 1983;3:199‐208. [PubMed] [Google Scholar]
- Kuhnz W, Koch S, Jakob S, Hartmann A, Helge H, Nau H. Ethosuximide in epileptic women during pregnancy and lactation period. Placental transfer, serum concentrations in nursed infants and clinical status. British Journal of Clinical Pharmacology 1984;18:671‐677. [DOI] [PMC free article] [PubMed] [Google Scholar]
- Rating D, Jager‐Roman E, Koch S, et al. Major malformations and minor anomalies in the offspring of epileptic parents: The role of antiepileptic drugs. Pharmacokinetics in Teratogenesis 1987;1:205‐223. [Google Scholar]
- Rating D, Nau H, Jager‐Roman E, Gopfert‐Geyer I, Koch S, Beck‐Mannagetta G, Schmidt D, Helge H. Teratogenic and pharmacokinetic studies of primidone during pregnancy and in the offspring of epileptic women. Acta Paediatrica Scandinavia 1982;71:301‐311. [DOI] [PubMed] [Google Scholar]
Laskowska 2002 {published data only}
- Laskowska M, Leszczynska‐Gorzelak B, Oleszczuk J. Evaluation of the antiepileptic therapy during pregnancy [Ocena terapii przeciwpadaczkowej w okresie ciazy]. Gin Pol. 2002;73(1):35‐42. [PubMed] [Google Scholar]
Lindhout 1992 {published data only}
- Lindhout D, Hoppener RJEA, Meinardi H. Teratogenicity of Antiepileptci Drug Combinations with Special Emphasis on Epoxidation (of Carbamazepine). Epilepsia 1984;25(1):77‐83. [DOI] [PubMed] [Google Scholar]
- Lindhout D, Meinardi H, Meijer JWA, Nau H. Antiepileptic drugs and teratogenesis in two consecutive cohorts: Changes in prescription policy paralleled by changes in pattern of malformations. Neurology 1992;42(5):94‐110. [PubMed] [Google Scholar]
Martinez Ferri 2009 {published data only}
- Martinez Ferri M, Pena Mayor P, Perez Loppez‐Fraile, Castro Vilanova C, Escartin Siquier E, Martin Moro M, Forcadas Berdusan F. [Malformaciones y muerte fetal en el registro espanol de farmacos antiepilepticos y embarazo: resultados a los 6 anos]. Neurologia 2009;24(6):360‐365. [PubMed] [Google Scholar]
Mawer 2010 {published data only}
- Mawer G, Briggs M, Baker GA, et al. Pregnancy with epilepsy: Obstetric and neonatal outcome of a controlled study. Seizure 2010;19:112‐119. [DOI] [PMC free article] [PubMed] [Google Scholar]
Meador 2006 {published data only}
- Meador KJ, Baker GA, Finnell RH, et al. In utero antiepileptic drug exposure: Fetal death and malformations. Neurology 2006;67:407‐412. [DOI] [PMC free article] [PubMed] [Google Scholar]
Meischenguiser 2004 {published data only}
- Meischenguiser R, D'Giano CH, Ferraro SM. Oxcarbazepine in pregnancy: clinical experience in Argentina. Epilepsy & Behaviour 2004;5:163‐167. [DOI] [PubMed] [Google Scholar]
Montreal Series {published data only}
- Dansky LV, Andermann E, Rosenblatt D, Sherwin AL, Andermann F. Anticonvulsants, Folate Levels, and Pregnancy Outcome: A Prospective Study. Annals of Neurology 1987;21:176‐182. [DOI] [PubMed] [Google Scholar]
- Oguni M, Dansky L, Andermann E, Sherwin A, Andermann F. Improved Pregnancy Outcome in Epileptic Women in the Last Decade: Relationship to Maternal Anticonvulsant Therapy. Brain & Development 1992;14:371‐380. [DOI] [PubMed] [Google Scholar]
Motherisk Registry {published data only}
- Gladstone DJ, Bologa M, Maguire C, Pastuszak A, Koren G. Course of pregnancy and fetal outcome following maternal exposure to carbamazepine and phenytoin: A prospective study. Reproductive Toxicology 1992;6:257‐261. [DOI] [PubMed] [Google Scholar]
- Nulman I, Scolnik D, Chitayat D, Farkas LD, Koren G. Findings in Children Exposed In Utero to Phenytoin and Carbamazepine Monotherapy: Independent Effects of Epilepsy and Medications. American Journal of Medical Genetics 1997;68:18‐24. [PubMed] [Google Scholar]
North American Register {published data only}
- Bokhari A, Coull BA, Holmes LB. Effect of Prenatal Exposure to Anticonvulant Drugs on Dermal Ridge Patterns of Fingers. Teratology 2002;66:19‐23. [DOI] [PubMed] [Google Scholar]
- Bromfield EB, Dworetzky BA, Wyszynski DF, Smith CR, Baldwin EJ, Holmes LB. Valproate teratogenicity and epilepsy syndrome. Epilepsia 2008;49(12):2122‐2124. [DOI] [PubMed] [Google Scholar]
- Hernandez‐Diaz S, Mittendorf R, Smith C, Hauser W, Yerby M, Holmes L. Association between topiramate and zonisamide use during pregnancy and low birth weight. Obstetrics & Gynecology 2014;123(1):21‐28. [DOI] [PubMed] [Google Scholar]
- Hernandez‐Diaz S, Smith CR, Shen A, et al. Comparative safety of antiepileptic drugs during pregnancy. Neurology 2012;78:1692‐1699. [DOI] [PubMed] [Google Scholar]
- Holmes LB, Baldwin EJ, Smith CR, et al. Increased frequency of isolated cleft palate in infants exposed to lamotrigine during pregnancy. Neurology 2008;70:2152‐2158. [DOI] [PubMed] [Google Scholar]
- Holmes LB, Coull BA, Dorfman J, Rosenberger PB. The correlation of deficits in IQ with midface and digit hypoplasia in children exposed in utero to anticonvulsant drugs. The Journal of Paediatrics 2005;146:118‐122. [DOI] [PubMed] [Google Scholar]
- Holmes LB, Mittendorf R, Shen A, Smith CR, Hernandez‐Diaz S. Fetal Effects of Anticonvulsant Polytherapies. Archives of Neurology 2011;68(10):1275‐1281. [DOI] [PubMed] [Google Scholar]
- Holmes LB, Rosenberger PB, Harvey EA, Khoshbin S, Ryan L. Intelligence and Physical Features of Children of Women With Epilepsy. Teratology 2000;61:196‐202. [DOI] [PubMed] [Google Scholar]
- Holmes LB, Wyszynski DF. North American Antiepileptic Drug Pregnancy Registry. Epilepsia 2004;45(11):1465. [DOI] [PubMed] [Google Scholar]
- Wyszynski DF, Nambisan M, Surve T, et al. Increase rate of major malformations in offspring exposed to valproate during pregnancy. Neurology 2005;64:961‐965. [DOI] [PubMed] [Google Scholar]
Omtzigt 1992 {published data only}
- Omtzigt JGC, Los FJ, Grobbee DE, Pijpers L, Jahoda MGJ, Brandonburg H, Stewart P, Gaillard HLJ, Sachs ES, Wladimiroff JW, Lindhout D. The risk of spina bifida aperta after first trimester exposure to valproate in a prenatal cohort. Neurology 1992;42(supp 5):119‐125. [PubMed] [Google Scholar]
- Omtzigt JGC, Los FJ, Hagenaars AM, Stewart PA, Sachs ES, Lindhout D. Prenatal diagnosis of spina bifida aperta after first‐trimester valproate exposure. Prenatal diagnosis 1992;12:893‐897. [DOI] [PubMed] [Google Scholar]
Pardi 1982 {published data only}
- Pardi G, Como ML, Giambattista MDE, Oldrini A, Pifarotti G. Epilepsy in pregnancy: obstetric aspects of a multidisciplinary study [Epilessia e gravidanza: aspetti ostrtrici di uno studio prospettico multidisciplinare]. Ann Ost Gin Med Perin 1982;CIII:254‐263. [PubMed] [Google Scholar]
Richmond 2004 {published data only}
- Richmond JR, Krishnamoorthy P, Andermann E, Benjamin A. Epilepsy and pregnancy: An obstetric perspective. American Journal of Obstetrics and Gynecology 2004;190:371‐379. [DOI] [PubMed] [Google Scholar]
Sabers 2004 {published data only}
- Sabers A, Dam M, a‐Rogvi‐Hansen B, et al. Epilepsy and pregnancy: lamotrigine as main drug used. Acta Neurologica Scandinavica 2004;109:9‐13. [DOI] [PubMed] [Google Scholar]
Samren 1997 {published data only}
- Samren EB, Duijn CN, Koch S, Hiilesmaa VK, Klepel H, Vardy AH, Beck Mannagettta G, Deichl AW, Gaily E, Granstrom ML, Meinardi H, Grobbe DE, Hofman A, Janz D, Lindhout D. Maternal use of antiepileptic drugs and the risk of major congenital malformations: A joint European prospective study of human teratogenesis associated with maternal epilepsy. Epilepsia 1997;38(9):981‐990. [DOI] [PubMed] [Google Scholar]
Shapiro 1976 {published data only}
- Shapiro S, Hartz S, Siskind V, et al. Anticonvulsants and parental epilepsy in the development of birth defects. The Lancet 1976;1(7954):272‐275. [DOI] [PubMed] [Google Scholar]
Steegers‐Theunissen 1994 {published data only}
- Steergers‐Theunissen RPM, Renier WO, Borm GF, et al. Factors influencing the risk of abnormal pregnancy outcome in epileptic women: A multi‐centre prospective study. Epilepsy Research 1994;18:261‐269. [DOI] [PubMed] [Google Scholar]
Tanganelli 1992 {published data only}
- Regesta G, Tanganelli P. The risk of malformations and developmental disturbances in children exposed to antiepileptic drugs: a prospective controlled study. Boll Lega It Epil 1996;95/96:351‐354. [Google Scholar]
- Tanganelli P, Regesta G. Epilepsy, pregnancy, and major birth anomalies: An Italian prospective, controlled study. Neurology 1992;42(5):89‐93. [PubMed] [Google Scholar]
Torres 1995 {published data only}
- Torres LC, Felix R, Canun S, Mazon JJ. Epilepsy and pregnancy. Risks and benefits of anticonvulsant treatments [Epilepsia y embarazo. Riegos y beneficios del tratamiento anticonvulsivo]. Ginecologia y obstetricia de mexico 1995;68:282‐286. [PubMed] [Google Scholar]
UK Register {published data only}
- Campbell E, Devenney E, Morrow J, et al. Recurrence risk of congenital malformations in infants exposed to antiepileptic drugs in utero. Epilepsia 2013;54(1):165‐171. [DOI] [PubMed] [Google Scholar]
- Campbell E, Kennedy F, Russell A, et al. Malformation risks of antiepileptic drug monotherapies in pregnancy: updated results from the UK and Ireland epilepsy and pregnancy registers. J Neurol Neurosurg Psychiatry 2014;0:1‐6. [DOI] [PubMed] [Google Scholar]
- Hunt S, Craig J, Russell A, et al. Levetiracetam in pregnancy: Preliminary experience from the UK Epilepsy and Pregnancy Register. Neurology 2006;67:1876‐1879. [DOI] [PubMed] [Google Scholar]
- Hunt S, Russell A, Smithson WH, et al. Topiramate in pregnancy. Neurology 2008;71:272‐276. [DOI] [PubMed] [Google Scholar]
- Mawhinney E, Campbell J, Craig J, et al. Valproate and the risk for congenital malformations: Is formulation and dosage regime important?. Seizure 2012;21:215‐218. [DOI] [PubMed] [Google Scholar]
- Mawhinney E, Craig J, Morrow J, et al. Levetiracetam in pregnancy: Results from the UK and Ireland epilepsy and pregnancy registers. Neurology 2013;80:400‐405. [DOI] [PubMed] [Google Scholar]
- Morrow J, Russell A, Guthrie E, et al. Malformation risks of antiepileptic drugs in pregnancy: a prospective study from the UK Epilepsy and Pregnancy Register. J Neurol Neurosurg Psychiatry 2006;77:193‐198. [DOI] [PMC free article] [PubMed] [Google Scholar]
Waters 1994 {published data only}
- Waters CH, Belai Y, Gott PS, Shen P, DeGiorgio CM. Outcomes of Pregnancy Associated With Antiepileptic Drugs. Arch Neurol 1994;51:250‐253. [DOI] [PubMed] [Google Scholar]
Wide 2000 {published data only}
- Wide K, Winbladh B, Tomson T, Sars‐Zimmer K, Berggren E. Psychomotor development and minor anomalies in children exposed to antiepileptic drugs in utero: a prospective population‐based study. Developmental Medicine & Child Neurology 2000;42:87‐92. [DOI] [PubMed] [Google Scholar]
Yerby 1992 {published data only}
- Yerby MS, Leavitt A, Erickson DM, et al. Antiepileptics and the development of congenital anomalies. Neurology 1992;42(5):132‐140. [PubMed] [Google Scholar]
References to studies excluded from this review
Annegers 1974 {published data only}
- Annegers J, Elveback L, Hauser W, Kurland L. Do anticonvulsants have a teratogenic effect?. Archives of Neurology 1974;31:364‐373. [DOI] [PubMed] [Google Scholar]
- Annegers J, Elveback L, Hauser W, Kurland L. Epilepsy anticonvulsants and malformations. Birth defects original article series 1975;11(5):157‐160. [PubMed] [Google Scholar]
Artama 2013 {published data only}
- Artama M, Gissler M, Malm H, Ritvanen A, The Drug and Pregnancy Group. Effects of Maternal Epilepsy and Antiepileptic Drug Useduring Pregnancy on Perinatal Health in Offspring:Nationwide, Retrospective Cohort Study in Finland. Drug Safety 2013;36:359‐369. [DOI] [PubMed] [Google Scholar]
Arteaga‐Vazques 2012 {published data only}
- Arteaga‐Vazquez J, Luna‐Munoz L, Mutchinick OM. Congenital malformations in the offspring of epileptic mothers with and without anticonvulsant treatment [Malformaciones congenitas en hijos de madres epilepticas con y sin tratmiento con anticonvulsivantes]. Salud Publica Mexico 2012;54:579‐86. [DOI] [PubMed] [Google Scholar]
Baermig 1973 {published data only}
- Baermig H. Epilepsy and pregnancy. Geburtshilfe und Frauenheilkunde 1973;33:203‐204. [PubMed] [Google Scholar]
Canun‐Serrano 1986 {published data only}
- Canun‐Serrano S, Zafra‐De La Rosa G, Landeros‐Velazquez G, Givaudan‐Moreno M. Anticonvulsants in pregnancy [Anticonvulsivos y embarazo]. Bol Med Hol Infant Mex 1986;43(4):219‐227. [PubMed] [Google Scholar]
Castilla‐Puentes 2014 {published data only}
- Castilla‐Puentes R, Ford L, Manera L, Kwarta R, Ascher S, Li Q. Topiramate monotherapy use in women with and without epilepsy: Pregnancy and neonatal outcomes. Epilepsy Research 2014;108:717‐724. [DOI] [PubMed] [Google Scholar]
Dobos 1985 {published data only}
- Dobos M, Schuler D, Marosfi S, Bogathy B. Congenital malformations reported in children born to women with epilepsy [Veleszuletett fejlodesi rendellenessegek visagalata epilepszias anyak utodaiban]. Orvosi Hetilap 1985;126(37):2267‐72. [PubMed] [Google Scholar]
Elshove 1971 {published data only}
- Elshove J, van Eck, J. Congenital abnormalities, cleft lip and cleft palate in particular, in children of epileptic mothers [Aangeboren misvormingen, met name gespleten lip met of zonder gespleten verhemelte, bij kinderen van moeders met epilepsie]. Nederlands Tijdschrift voor Geneeskunde 1971;115(33):1371‐5. [PubMed] [Google Scholar]
Holmes 1994 {published data only}
- Holmes L, Harvey E, Brown K, Hayes A, Khoshbin S. Anticonvulsant teratogenesis: 1. A study design for newborn infants. Teratology 1994;49:202‐207. [DOI] [PubMed] [Google Scholar]
Jacobsen 2014 {published data only}
- Jacobsen P, Henriksen T, Haubek D, Ostergaard J. Developmental Enamel Defects in Children Prenatally Exposed to Anti‐Epileptic Drugs. PLos One 2013;8(3):e58213. [DOI] [PMC free article] [PubMed] [Google Scholar]
- Jacobsen P, Henriksen T, Haubek D, Ostergaard J. Prenatal Exposure to Antiepileptic Drugs and Dental Agenesis. PLos ONE 2014;9(1):e84420. [DOI] [PMC free article] [PubMed] [Google Scholar]
Knight 1975 {published data only}
- Knight A, Rhind E. Epilepsy and pregnancy: A study of 153 pregnancies in 59 patients. Epilepsia 1975;16:99‐110. [DOI] [PubMed] [Google Scholar]
Lamotrigine Pregnancy Register {published data only}
- Cunnington M. The International Lamotrigine Pregnancy Registry Update for the Epilepsy Foundation. Epilepsia 2004;45(11):1468. [DOI] [PubMed] [Google Scholar]
- Cunnington M, Ferber S, Quartey G, International LamotriginePregnancy Registry Scientific Advisory Committee. Effect of Dose on the Frequency of Major Birth Defects Following Fetal Exposure to Lamotrigine Monotherapy in an International Observational Study. Epilepsia 2007;48(6):1207‐1210. [DOI] [PubMed] [Google Scholar]
- Lamotrigine Pregnancy Registry. Final report. http://pregnancyregistry.gsk.com/documents/lam_spring_2010_final_report.pdf 2010.
- Tennis P, Eldridge R, International Lamotrigine Pregnancy Registry Scientific Advisory Committee. Preliminary Results on Pregnancy Outcomes in Women Using Lamotrigine. Epilepsia 2002;43(10):1161‐1167. [DOI] [PubMed] [Google Scholar]
Miskov 2009 {published data only}
- Miskov S, Gjergja‐Juraski R, Cvitanovic‐Sojat L, et al. Prospective surveillance of Croatian pregnant women on lamotrigine monotherapy ‐ Aspects of pre‐pregnancy counseling and drug monitoring. Acta Clinica Croatica 2009;48(3):271‐281. [PubMed] [Google Scholar]
Monson 1973 {published data only}
- Monson R, Rosenberg L, Hartz S, et al. Diphenylhydantoin and selected congenital malformations. The New England Journal of Medicine 1973;289(20):1049‐1052. [DOI] [PubMed] [Google Scholar]
Montouris 2003 {published data only}
- Montouris G. Gabapentin exposure in human pregnancy: results from the Gabapentin pregnancy registry. Epilepsy and Behavior 2003;4:310‐317. [DOI] [PubMed] [Google Scholar]
Mostacci 2014 {published data only}
- Mostacci B, Piccinni C, Bisulli F, et al. Prevalence of antiepileptic drugs exposure in pregnant women in the emilia romagna region (Italy): Results from the espea (emilia romagna study on pregnancy and exposure to antiepileptic drugs). Epilepsia. 2014; Vol. 555:131‐132.
Nakane 1980 {published data only}
- Murasaki O, Yoshitake K, Tachiki H, Nakane Y, Kaneko S. Reexamination of the teratological effect of antiepileptic drugs. The Japanese Journal of Psychiatry and Neurology 1988;42(3):592‐593. [DOI] [PubMed] [Google Scholar]
- Nakane Y, Okuma T, Takahashi R, Sato Y, Wada T, Sato T, Fukushima Y, Kumashiro H, Ono T, Takahasi T, Aoki Y, Kazamatsuri H, Masaaki I, Komai S, Seino M, Miyakoshi, Tanimura T, Hazama H, Kawahara R, Otsuki S, Hosokawa K, Inanaga, Nakazawa, Yamamoto K. Multi‐institutional study on the teratogenicity and fetal toxicity of antiepileptic drugs: a report of a collaborative study group in Japan. Epilepsia 1980;21:663‐680. [DOI] [PubMed] [Google Scholar]
- Nakane Y. Congenital malformation among infants of epileptic mothers treated during pregnancy: the report of a collaborative study group in Japan. Folia Psychiatrica et Neurologica Japonica 1979;33(3):363‐369. [DOI] [PubMed] [Google Scholar]
Pearse 1992 {published data only}
- Pearse SB, Garcia Rodriguez LA, Hartwell C, Russell G. A Pregnancy Register of Patients Receiving Carbamazepine in the UK. Pharmacoepidemiology and Drug Safety 1992;1:321‐325. [Google Scholar]
Robert 1983 {published data only}
- Robert E, Robert J, Lapras C. Is valproic acid teratogenic? [L'acide valproique est‐il teratogene?]. Revue Neurologique 1983;139(6‐7):445‐447. [PubMed] [Google Scholar]
Starveld‐Zimmerman 1975 {published data only}
- Starveld‐Zimmerman A, Kolk W, Elshove J, Meinardi H. Teratogenicity of antiepileptic drugs. Clinical Neurology and Neurosurgery 1975;77(2):81‐95. [DOI] [PubMed] [Google Scholar]
Veiby 2014 {published data only}
- Veiby G, Daltveit A, Engelsen B, Gilhus N. Fetal growth restriction and birth defects with newer and older antiepileptic drugs during pregnancy. Journal of Neurology 2014;261:579‐588. [DOI] [PubMed] [Google Scholar]
References to studies awaiting assessment
Babic 2014 {published data only}
- Babic N, Jovic N. Postnatal concerns in children born to women with juvenile myoclonic epilepsy. Epilepsia. 2014; Vol. 55:128.
Idriz‐Oglu 2014 {published data only}
- Idriz Oglu Gulcebi M, Kucukibrahimoglu E, Demirkapi M, Gulhan R, Karaalp A, Goren Z, Onat F. Evaluation of antiepileptic drug use in the pregnant patients with epilepsy in a university hospital in Istanbul. Epilepsia. 2014; Vol. 55:116‐117.
Jones 1992 {published data only}
- Jones KL, Johnson KA, Chambers CC. Pregnancy outcome in women treated with phenobarbital monotherapy. Teratology 1992;45:452‐453. [Google Scholar]
Kaabi 2013 {published data only}
- Kaabi W, Aidli S, Kastalli S, Lakhoua G, Zaiem A, Srairi S, Daghfous R. Pregnancy outcomes in women using antiepileptic drugs. Drug Safety. 2013; Vol. 36:9.
Kutlu 2013 {published data only}
- Kutlu G, Erdal A, Aydogan S, Gomceli Y, Inan L. Follow up and treatment of women with epilepsy during pregnancy. Epilepsia. 2013; Vol. 54:127‐128.
Lazzaroni Fossati 1986 {published data only}
- Lazzaroni‐Fossati F, Toni T, Magnani M, Repetto E, Calvi A, Siena G. Intrauterine exposure to drugs. Analysis of a sample of newborn infants pretreated with anticonvulsants [ESPOSIZIONE IN UTERO A FARMACI]. Minerva pediatrica 1986;38(3‐4):75‐81. [PubMed] [Google Scholar]
Midi 2014 {published data only}
- Midi I, Bulut B, Ozbek D, Ozden H, Agan K. Antiepileptic drug usage and the effects of them on the foetus in epileptic pregnant woman. Epilepsia. 2014; Vol. 55:132.
- Midi I, Cetinkaya D, Ozden H, Agan K. Pregnant women with epilepsy: 43 patients results in 1 year period. Epilepsia. 2013; Vol. 54:131.
Shvartzman 1986 {published data only}
- Shvartzman P, Oren B, Keinan A, Adar H. Congenital malformations and anticonvulsant therapy in pregnancy. Harefuah 1986;110(8):377‐80. [PubMed] [Google Scholar]
Vlasov 2014 {published data only}
- Vlasov P, Petrukhin V, Karlov V, Krasnopolski V, Melnikov A, Tsivtsivadze E. Antiepileptic drug therapy during pregnancy and obstetric outcomes in Moscow region: Comparing of 1998 and 2013 years. Epilepsia. 2014; Vol. 55:130.
Additional references
Ackers 2009
- Ackers R, Besag FMC, Wade A, Murray ML, Wong ICK. Changing trends in antiepileptic drug prescribing in girls of child‐bearing potential. Archives of Disease in Childhood 2009;94:443–447. [DOI] [PubMed] [Google Scholar]
Adab 2004
- Adab N, Tudur Smith C, Vinten J, Williamson PR, Winterbottom JB. Common antiepileptic drugs in pregnancy in women with epilepsy. Cochrane Database of Systematic Reviews 2004, Issue 4. [DOI: 10.1002/14651858.CD004848] [DOI] [PubMed] [Google Scholar]
Alsaad 2015
- Alsaada AMS, Chaudhry SA, Koren G. First trimester exposure to topiramate and the risk of oral clefts in the offspring: A systematic review and meta‐analysis.. Reproductive Toxicology 2015;53:45‐50. [DOI] [PubMed] [Google Scholar]
Ardinger 1988
- Ardinger HH, Atkin JF, Blackston RD, Elsas LJ, Clarren SK, Livingstone S, Flannery DB, Pellock JM, Harrod MJ, Lammer EJ, Majewska F, Schinzel A, Tonello HV, Hanson JW. Verification of the fetal valproate syndrome phenotype. American Journal of Medical Genetics 1988;29:171‐185. [DOI] [PubMed] [Google Scholar]
Artama 2005
- Artama M, Auvinen A, Raudaskoski T, Isojärvi I, Isojärvi J. Antiepileptic drug use of women with epilepsy and congenital malformations in offspring. Neurology 2005;64:1874‐1878. [DOI] [PubMed] [Google Scholar]
Bossi 1982
- Bossi L. Neonatal period including drug disposition in new borns: review of the literature. In: Janz D, Dam M, Richens A, Bossi L, Helge H, Schmidt D editor(s). Epilepsy, Pregnancy and the Child. New York: Ravens Press, 1982:327‐42. [Google Scholar]
Brent 2004
- Brent RL. Environmental Causes of Human Congenital Malformations: The Pediatrician’s Role in Dealing With These Complex Clinical Problems Caused by a Multiplicity of Environmental and Genetic Factors. Pediatrics 2004;113(4):957‐968. [PubMed] [Google Scholar]
Bromley 2014
- Bromley R, Weston J, Adab N, Greenhalgh J, Sanniti A, McKay AJ, Tudur Smith C, Marson AG. Treatment for epilepsy in pregnancy: neurodevelopmental outcomes in the child. Cochrane Database of Systematic Reviews 2014, Issue 10. [DOI: 10.1002/14651858.CD010236.pub2] [DOI] [PMC free article] [PubMed] [Google Scholar]
Charlton 2008
- Charlton RA, Cunnington MC, Vries CS, Weil JG. Data resources for investigating drug exposure during pregnancy and associated outcomes: the general practice research database (GPRD) as an alternative to pregnancy registries. Drug Safety 2008;31(1):39‐51. [DOI] [PubMed] [Google Scholar]
Charlton 2014
- Charlton RA, Neville AJ, Jordan S, Pierini P, Damase‐Michel C, Klungsøyr K, Nybo Andersen A‐M, Vinkel Hansen A, Gini R, Bos JHJ, Puccini A, Hurault‐Delarue C, Brooks CJ, Jong‐van den Berg LTW, Vries CS. Healthcare databases in Europe for studying medicine use and safety during pregnancy. Pharmacoepidemiology and drug safety 2014;23(6):586‐94. [DOI] [PubMed] [Google Scholar]
Chaudhry 2014
- Chaudhry SA, Jong Gt, Koren G. The fetal safety of Levetiracetam: a systematic review. Reproductive Toxicology 2014;46:40‐45. [DOI] [PubMed] [Google Scholar]
Dean 2000
- Dean JCS, Moore SJ, Turnpenny PD. Developing diagnostic criteria for the fetal anticonvulsant syndromes. Seizure 2000;9:233–234. [DOI] [PubMed] [Google Scholar]
DiLiberti 1983
- DiLiberti JH. Fetal valproate syndrome: consistent facial changes in infants exposed to sodium valproate. Clinical Research 1983;31(1):127A. [Google Scholar]
EURAP STUDY GROUP 2006
- The EURAP STUDY GROUP. Seizure control and treatment in pregnancy: Observations from the EURAP Epilepsy Pregnancy Registry. Neurology 2006;66:354‐360. [DOI] [PubMed] [Google Scholar]
EUROCAT
- EUROCAT Working Group. EUROCAT Surveillance of Congenital Anomalies. EUROCAT guide 1.3 and reference documents instructions for the registration and surveillance of congenital anomalies. http://www.eurocat‐network.eu/content/EUROCAT‐Guide‐1.3.pdf Accessed August 2015.
Guyatt 2008
- Guyatt GH, Oxman AD, Vist G, Kunz R, Falck‐Ytter Y, Alonso‐Coello P, et al. for the GRADE Working Group. Rating quality of evidence and strength of recommendations GRADE: an emerging consensus on rating quality of evidence and strength of recommendations. BMJ 2008;336:924‐6. [DOI] [PMC free article] [PubMed] [Google Scholar]
Hauser 1990
- Hauser W, Hesdorffer D. Epilepsy: Frequency, causes and consequences. New York: Demos Publications, 1990. [Google Scholar]
Higgins 2011
- Higgins JPT, Green S (editors). Cochrane Handbook for Systematic Reviews of Interventions Version 5.1.0 [updated March 2011]. The Cochrane Collaboration, 2011. Available from www.cochrane‐handbook.org.
Jentink 2010
- Jentink J, Loane MA, Dolk H, Barisic I, Garne E, Morris JK, et al. Valproic acid monotherapy in pregnancy and major congenital malformations. New England Journal of Medicine 2010;362:2185‐93. [DOI] [PubMed] [Google Scholar]
Jentink 2010b
- Jentink J, Dolk H, Loane MA, Morris JK, Wellesley D, Garne E, Jong‐van den Berg L, for the EUROCAT Antiepileptic Study Working Group. Intrauterine exposure to carbamazepine and specific congenital malformations: systematic review and case‐control study. British Medical Journal 2010;341:c6581. [DOI] [PMC free article] [PubMed] [Google Scholar]
Ku 2011
- Ku CS, Naidoo N, Wu M, Soong R. Studying the epigenome using next generation sequencing. Journal of Medical Genetics 2011;48(11):721‐730. [DOI] [PubMed] [Google Scholar]
Man 2012
- Man S‐L, Petersen I, Thompson M, Nazareth I. Antiepileptic Drugs during Pregnancy in Primary Care: A UK Population Based Study. PLoS One 2012;7:e52339. [DOI] [PMC free article] [PubMed] [Google Scholar]
Margulis 2012
- Margulis AV, Mitchell AA, Gilboa SM, Werler MM, Mittleman MA, Glynn RJ, Hernandez‐Diaz S and National Birth Defects Prevention Study. Use of topiramate in pregnancy and risk of oral clefts. American Journal of Obstetrics and Gynecology 2012;207(5):405.e1–405.e7. [DOI] [PMC free article] [PubMed] [Google Scholar]
Meador 2008
- Meador K, Reynolds MW, Crean S, Fahrbach K, Probst C. Pregnancy outcomes in women with epilepsy: A systematic review and meta‐analysis of published pregnancy registries and cohorts. Epilepsy Research 2008;81:1‐13. [DOI] [PMC free article] [PubMed] [Google Scholar]
Meador 2009
- Meador KJ, Penovich P, Baker GA, Pennell PB, Bromfield E, Pack A, Liporace JD, Sam M, Kalayjian LA, Thurman DJ, Moore E, Loring DW, for the NEAD Study Group. Antiepileptic drug use in women of childbearing age. Epilepsy and Behaviour 2009;15:339‐43. [DOI] [PMC free article] [PubMed] [Google Scholar]
Mines 2014
- D Mines, Tennis P, Curkendall SM, Li D, Peterson C, Andrews EB, Calingaert B, Chen H, Deshpande G, Esposito DB, Everage N, Holick CN, Meyer NM, Nkhoma ET, Quinn S, Rothman KJ, Chan KA. Topiramate use in pregnancy and the birth prevalence of oral clefts. Pharmacoepidemiology and drug safety 2014;23:1017–1025. [DOI] [PubMed] [Google Scholar]
Mølgaard‐Nielsen 2011
- Mølgaard‐Nielsen D, Hviid A. Newer‐Generation Antiepileptic Drugsand the Risk of Major Birth Defects. JAMA 2011;305(19):1996‐2002. [DOI] [PubMed] [Google Scholar]
Tomson 2011
- Tomson T, Battino D, Bonizzoni E, Craig J, Lindhout D, Sabers A, et al. Dose‐dependent risk of malformation with antiepileptic drugs: An analysis of data from the EURAP epilepsy and pregnancy registry. Lancet Neurology 2011;10(7):609‐17. [DOI] [PubMed] [Google Scholar]
Wen 2015
- Wen X, Meador K, Hartzema A. Antiepileptic drug use by pregnant women enrolled in Florida Medicaid. Antiepileptic drug use by pregnant women enrolled in Florida Medicaid 2015;84:1‐7. [DOI] [PMC free article] [PubMed] [Google Scholar]
Wide 2004
- Wide K, Winbladh B, Kallen B. Major malformations in infants exposed to antiepileptic drugs in utero, with emphasis on carbamazepine and valproic acid: a nation‐wide, population‐based register study. Acta Paediatrica 2004;93:174‐176. [DOI] [PubMed] [Google Scholar]
Yerby 1994
- Yerby MS. Pregnancy, teratogenesis and epilepsy. Neurological Clinics 1994;12(4):749‐71. [PubMed] [Google Scholar]
References to other published versions of this review
Pulman 2012
- Pulman J, Bromley R, Adab N, Greenhalgh J, McKay AJ, Tudur Smith C, Dickson RC, Marson AG. Treatment for epilepsy in pregnancy: congenital malformation outcomes in the child. Cochrane Database of Systematic Reviews 2012, Issue 11. [DOI: 10.1002/14651858.CD010224] [DOI] [PMC free article] [PubMed] [Google Scholar]