

Abstract
The Black Sea is the world’s largest anoxic basin and a model system for studying processes across redox gradients. In between the oxic surface and the deeper sulfidic waters there is an unusually broad layer of 10–40 m, where neither oxygen nor sulfide are detectable. In this suboxic zone, dissolved phosphate profiles display a pronounced minimum at the upper and a maximum at the lower boundary, with a peak of particulate phosphorus in between, which was suggested to be caused by the sorption of phosphate on sinking particles of metal oxides. Here we show that bacterial polyphosphate inclusions within large magnetotactic bacteria related to the genus Magnetococcus contribute substantially to the observed phosphorus peak, as they contain 26–34% phosphorus compared to only 1–5% in metal-rich particles. Furthermore, we found increased gene expression for polyphosphate kinases by several groups of bacteria including Magnetococcaceae at the phosphate maximum, indicating active bacterial polyphosphate degradation. We propose that large magnetotactic bacteria shuttle up and down within the suboxic zone, scavenging phosphate at the upper and releasing it at the lower boundary. In contrast to a passive transport via metal oxides, this bacterial transport can quantitatively explain the observed phosphate profiles.
Subject terms: Ecology, Microbiology, Biogeochemistry
Introduction
The Black Sea is a deep (>2000 m) and permanently sulfidic basin with a layer (ca. 100 m) of oxygenated water at the surface. This unique geochemical environment is the result of pronounced density gradients between salty Mediterranean waters of high density, interleaving in the lower water column of the Black Sea when entering through the narrow Bosporus, and lighter, freshwater from rivers, maintaining a lower salinity at the surface. Due to this particular oceanographic situation, the water column of the Black Sea is permanently stratified, resulting in remarkably stable geochemical profiles. Here, redox driven processes, which typically occur in sediments within milli- or centimetres, are spread out over several tens of metres in the open water column, which greatly enhances the possibility to differentiate between different chemical or biological reactions occurring due to a slight gradient in redox potential.
In the late 1980s, a suboxic water mass, where neither oxygen, nitrate nor sulfide occurs in detectable concentrations, was discovered in the Black Sea, extending 10–40 m between the lower limit of the oxic zone and the deeper sulfidic water layers [1, 2]. In this zone the dissolved phosphate concentration profile displays a conspicuous minimum at the upper and a maximum at the lower boundary [3]. Over the last decades, this phosphate distribution has been repeatedly reported [4], suggesting that it is the result of continuous processes, which are at steady state and do not result from temporal variations. In contrast to phosphate, other dissolved chemical species released by degradation of organic material, such as ammonium and silica, increase gradually towards the bottom. In 1986, Shaffer [3] suggested that the only plausible explanation for this shape of the phosphate profile would be a process which selectively removes phosphate at the upper boundary of the suboxic zone, and releases it at the lower boundary. He proposed a phosphate shuttle driven by the sorption of phosphate onto iron oxides formed at the upper boundary of the suboxic zone, where dissolved iron gets into contact with oxygen and precipitates. Phosphate would than be released again at the lower boundary, where iron oxides dissolve in the presence of sulfide. Even though this concept in itself is plausible, already Shaffer himself stated that it could explain only up to 40% of the observed phosphate transport.
In November 2013 we obtained new data and samples for reinvestigating the nature of the phosphate anomaly in the Black Sea onboard of the R/V “Maria S. Merian” in the center of the western gyre. Our study addressed the question, whether bacterial transport of phosphate in the form of polyphosphate (polyP) could contribute to the persisting phosphate anomaly observed in the suboxic zone of the Black Sea and whether such a bacterial phosphate shuttle could quantitatively explain the observed phosphate displacement. PolyP is a linear polymer of tens to hundreds of phosphate residues linked by anhydride bonds, which some microorganisms accumulate in high amounts and may degrade and release again as phosphate, when triggered by a specific environmental stimulus [5]. For large benthic bacteria this trigger was shown to be elevated sulfide concentrations in combination with anoxia [6], but so far a similar bacterial response to sulfide with consequences to phosphorus cycling was not reported for pelagic environments.
Materials and methods
Sampling
Samples were taken during cruise MSM33 of the German R/V “Maria S. Merian” in November/December 2013. All data presented here originated from Station M1 in the western central gyre of the Black Sea (43° 31.922′ N, 32°30.909′ E; water depth 2070 m). Temperature, pH and salinity were measured automatically using a continuous pump-CTD-system [7]. Particulate species were measured in discrete filtered samples from free-flow bottles (Hydrobios) at selected depths. Water samples for microbial community analyses and cell numbers were collected by using free-flow bottles (Hydrobios) and, for metatranscriptomic samples, by an automatic flow injection sampler (AFIS) attached to a conductivity-temperature-depth (CTD)-rosette, respectively. The in situ fixation by the AFIS system has been shown to provide relatively unbiased gene expression data from oxygen-deficient water layers [8].
Dissolved oxygen, sulfide, phosphate, nitrate, nitrite, ammonium, and silica
Oxygen and sulfide concentrations were measured with custom-made microelectrodes (Unisense, Denmark), within glass tubes, which were directly connected to the outflow of the pump-CTD. Total sulfide was calculated according to pH measured by a pH/ORP-sensor (SBE27, Seabird Electronics) at the lower end of the pump-CTD. Inorganic nutrient concentrations (phosphate, nitrite, nitrate, ammonium) were measured online with an auto-analyzer (QuAAtro, Seal analytical) employing standard colorimetric methods [9].
Particulate phosphorus, manganese, and iron, total dissolved phosphorus
For the determination of particulate Fe, Mn, and P, 2 l of seawater were filtered directly on board ship through 0.4 µm polycarbonate filters (Millipore) and rinsed with 100 ml Milli-Q water to remove salt. The filters were dried at 40 °C for 48 h, digested in closed Teflon vessels via a HClO4 and HF mixture, and measured for Fe, Mn, and P contents by ICP-OES (iCAP 6300 Duo, Thermo Fisher Scientific). Precision and accuracy were checked with the international reference material SGR-1 (US Geological Survey) and in-house standards and were 2.0 and 3.2%, respectively. For the analysis of total dissolved P, 2 ml of seawater was stored at 4 °C in pre-cleaned 2-ml reaction tubes after adding 20 µl of suprapure HNO3. Acidified water column samples were measured after 2-fold dilution with 2 vol% HNO3 for total dissolved P by ICP-OES (iCAP 6300 Duo, Thermo Fisher Scientific). Precision and accuracy were checked with the international reference material Cass-5 (National Research Council Canada). To assure similar salinity and concentration levels, 3-fold diluted Cass-5 solutions were spiked with P. Precision and accuracy were 6.1 and 3.0%, respectively.
Scanning electron microscopy (SEM) and energy dispersive x-ray micro analysis (EDX)
Particles were analyzed by SEM (Zeiss Merlin Compact) combined with EDX (Oxford Instruments; Aztec and Inca software). A large number of particles (700–5000) was analyzed at each depth by automated particle analysis for their individual element composition (O, Na, Mg, Al, Si, P, S, Cl, K, Ca, Ti, Mn, Fe, Ba). The chemical composition of the particles is the base for a mineral/particle identification program (INCA feature 5:04, Oxford Instruments), which allows assigning the particle to minerals and particle groups. Further details are given in Supplementary Materials and Methods.
Number of polyP-accumulating and total microorganisms
Samples from Hydrobios bottles were fixed with 10 vol% P + G solution containing 5 vol% paraformaldehyde and 5 vol% glutaraldehyde. Samples were frozen in liquid nitrogen and stored at −80 °C until further processing. One ml of the fixed sample was stained with SYBR Green I and measured with flow cytometry (FACSARIA III, Becton Dickinson, Heidelberg, Germany) following the protocol of Marie et al. [10]. A bead suspension with known concentration was used to determine the exact number of counts per volume. SYBR Green stained samples were measured with an excitation of 488 nm and detection from 502–560 nm. Polyphosphate staining was accomplished following the protocol of Koch et al. [11]. In order to wash the cells prior to staining, 2 ml samples were transferred into Eppendorf cups and centrifuged (3200×g, 14 °C, 10 min); supernatants were discarded. The pellets were dissolved in 2 ml 1xPBS (phosphate buffered saline, neutral pH) and centrifuged (3200×g, 14 °C, 10 min). This step was repeated 3 times, and the final pellets were stained with tetracycline. The pellets were treated with 100 µl tetracycline (Carl Roth GmbH, Karlsruhe, Deutschland) staining solution (4.16 mM, dissolved in Milli-Q), vortexed and incubated for 10 min in the dark at room temperature. After addition of 900 µl PBS, samples were ultrasonicated for 1 min to break up aggregates. Subsamples were measured with flow cytometry. Additional subsamples were stained with SYBR Green I to determine a factor for the loss of cells during the washing steps. Tetracycline-stained samples were measured with an excitation of 405 nm and detection from 502–560 nm.
Nucleic acid extractions
For metagenome analysis, from 4 depths, 6 l of water were filtered on Sterivex-GV 0.22 µm, PVDF and stored at −80 °C. DNA from frozen Sterivex-filters was extracted using a QIAmp DNA Mini kit (Qiagen, Hilden, Germany) after removing the filter from the plastic support. The extracted DNA was sent for library preparation and Illumina HiSeq sequencing to the SciLife Lab (Stockholm, Sweden). For metatranscriptomic analyses from six selected depths, 1.5 l of fixed water samples from the AFIS system were filtered on 0.2 µm polycarbonate filter and stored at −80 °C. RNA from frozen filters was extracted as described elsewhere [12]. For downstream absolute quantification of RNA transcripts, standards were added to the lysis buffer before the start of RNA extraction [13]. Due to a lysis buffer spill during the extraction of the sample from 111 m water depth, absolute transcript numbers will be slightly overestimated in this sample. The purified RNA was sent to Fasteris (Plan-les-Ouates, Switzerland) for Illumina-HiSeq sequencing after rRNA depletion with the RiboZero kit for bacteria (Epicentre, Madison, WI, USA) (further details in Supplementary Materials and Methods):
Bioinformatic processing of Illumina sequence data
Quality-trimmed, paired Illumina reads from 4 individual metagenome libraries were combined and assembled using idba_ud 1.1.1 [14]. CDSs from the Prodigal output were functionally and taxonomically annotated using NCBI’s blastp [15] against KEGG and NCBI’s NR. Genes of special interest were identified using IHAT as described by Temperton et al. [16]. Single-end-quality-trimmed metatranscriptome reads were mapped onto the previously generated metagenome using bowtie2 2.2.4 [17] and were summarized using featureCounts 1.4.6 [18].The number of transcripts l−1 for Ppk1, Ppk2 and Ppx was estimated based on the fraction of recovered reads coding for the internal standards as outlined in Satinsky et al. [13] (further details in Supplementary Materials and Methods).
Analysis of bacterial community composition, probe design, and catalysed reporter deposition-fluorescence in situ hybridization
For 16S rRNA analysis 1 l of water was filtered on 0.2 µm Durapore polyvinylidene fluoride filter and stored at −80 °C. DNA/RNA was extracted from the frozen filter samples according to Weinbauer et al. [12] using the DNA/RNA Mini Kit (Qiagen; Hilden, Germany). Only the RNA was further transcribed to cDNA and amplified by the bacterial 16 S rRNA gene primers Bakt_341F and Bakt_805R [19]. The Amplicons were sequenced at Eurofins MWG Operon using Roche GS FLX Titanium series chemistry and analyzed using the SILVA next generation sequencing (NGS) pipeline [20] version SILVA 115.
Short 16 S rRNA gene sequences received from the SILVA NGS analysis pipeline with >100 dereplicated reads and a taxonomic assignment to the Magnetococcaceae were added to the SILVA database SSU NR 123 [21] in the ARB software [22]. Full length sequences from the database with a pintail score > 75 that were related to short Black Sea 16 S rRNA gene sequences were used to calculate a maximum-likelihood tree (PHYML) based on 1274 unambiguously aligned sequence positions and short sequences from our study were added. Full-length sequences forming a phylogenetic cluster (see Fig. S5) with the magnetococcal sequences from the Black Sea were used to determine a probe using the “Find_Probe” tool implemented in ARB. The probe MaCo983 (5′-CGC AGG ATG TCA AAA GCA GGT-3′), covering most of the full-length 16 S rRNA gene sequences within the phylogenetic Black Sea cluster, and the competitor probe comMaCo983 (5′-CGC AGG ATG TCA AGA GCA GGT-3′) were designed. Catalyzed reporter deposition-fluorescence in situ hybridization (CARD-FISH) was performed at a formamide concentration of 35%, using the protocol of Pernthaler et al. [23] with the modification described in Bergen et al. [24] (further details in Supplementary Materials and Methods).
Modeling
In the modeling approach following Schulz [19] the differential equation for diffusive transport (Fick’s second law):
| 1 |
(D = diffusion coefficient, c = concentration, t = time; x = distance-coordinate), is solved by using the explicit numerical solution:
| 2 |
where CPO4 is the concentration of phosphate at a given place x and time t, Dx is the diapycnal diffusivity at the depth x, as determined by Gregg and Yakushev [25], x is the depth and Prodx is a change of concentration at a given depth per time step, caused by the release of phosphate from the particulate phosphorus pool, or vice verse. According to the depth-dependent rates Prodx, the concentration of PartP (cells H12-H172 in the excel spreadsheet, supplementary material) changes with each time step, which is expressed by:
| 3 |
For removing particulate phosphorus by sinking of particles, a certain amount of PartP in each cell of H12-H172 is moved to the cell below with a sinking velocity, sinkvel (entered in cell B17 in m s−1) by adding the term:
| 4 |
Further details are given in Supplementary Materials and Methods.
Data availability
Sequences of the 16 S rRNA gene used for the phylogenetic analysis are deposited in the European Nucleotide Archive (ENA) under accession numbers LT960764-LT960776. The data sheets of the flow cytometry analyses are deposited under 10.12754/data-2017-0003.
Results and discussion
In November 2013, we observed a very similar phosphate anomaly (Fig. 1a) as first described by Shaffer in 1986 [3] and repeatedly reported since after [4], indicating that the responsible processes are continuing with similar rates and are basically at steady state. At the upper boundary of the suboxic layer, phosphate concentrations approach zero (Fig. 1a), which has to be the result of high removal rates (up to 70 nmol/l*d according to a numerical model provided as supplementary information). A substantial incorporation of phosphate into the dissolved organic phosphorus (DOP) pool can be excluded, because in that case a corresponding peak in DOP would have to occur at the same depth where phosphate disappears. Our measurements of total dissolved phosphorus and dissolved inorganic phosphate concentrations resulted in similar concentrations (Supplementary Table 1), indicating no major formation of DOP. Therefore, the particulate phosphorus pool remains the only possible fraction, into which phosphate can be incorporated at this depth. Nevertheless, in this (Fig. 1b) and earlier studies [26, 27] the concentrations of particulate phosphorus were about two orders of magnitude lower than the dissolved phosphate concentrations and showed a maximum below the zone of phosphate removal. A plausible explanation for this is, that the particulate pool is not only transported by turbulence, as the dissolved pool, but is also constantly transported downwards by gravity on a much shorter time scale. For the profiles observed in this study a sinking velocity of 6.5 m/d has to be assumed, to reproduce the observed concentrations and depth distribution of particulate phosphorus (numerical model provided as Supplementary information).
Fig. 1.

The suboxic zone of the Black Sea. Concentration profiles in the suboxic zone, as defined by the absence of both oxygen (blue dots) and sulfide (greenish-brown dots) between 90 and 106 m water depth. a Dissolved phosphate concentration profile (red) with a pronounced minimum at the upper and a maximum at the lower boundary of the suboxic zone. b Concentrations of total particulate phosphorus (red squares), total particulate iron (redish-brown circles) and total particulate manganese (grey triangels). c Average abundance of particles rich in phosphorus (red bars), iron (redish-brown bars) and manganese (grey bars)
The role of iron and manganese
Already in the 1930s, observations in lakes concluded, that precipitates of iron oxides, which form after the oxygenation of reduced water bodies, can quantitatively remove phosphate from the dissolved phase by adsorption on iron oxides [28, 29]. A transport of phosphate by iron and manganese oxides certainly also occurs in the Black Sea [3, 26]. Nevertheless, a complete scavenging of all phosphate by newly formed metal oxides seems unlikely, as the concentration of particulate iron and manganese is in the same range as the particulate phosphorus concentration (Fig. 1b). Thus, the metal oxides would have to contain equivalent large amounts of phosphorus to completely remove it from the dissolved pool.
To evaluate the quantitative importance of metal oxides as vehicles for phosphorus transport, we analyzed particles using SEM with EDX microanalysis. This technique revealed the relative abundance and average phosphorus content of iron-rich (>15% Fe) and manganese-rich (>10% Mn) particles compared to all identifiable particles. The analysis confirmed the high abundances of metal-rich particles in the suboxic zone (Fig. 1c, Supplementary Table 2). Nevertheless, within the suboxic zone the average phosphorus content of these particles was only 1.1−2.8% P for iron-rich, and 2.3−5.0% P for manganese-rich particles (Table 1). With average molar Fe:P ratios between 11 and 25 in iron-rich particles in the suboxic zone (Table 1) and particulate iron concentrations between 25 and 32 nmol/l (Fig. 1b, Supplementary Table 3) only 3−6% of the particulate phosphorus pool could be incorporated into iron-rich particles. Likewise, manganese-rich particles with molar Mn:P ratios of 4−14 (Table 1) and particulate manganese concentrations between 5 and 47 nmol/l may occasionally incorporate up to 11% of the particulate phosphorus pool, but mostly account for 3−5%. Therefore, only a minor fraction (<15%) of the particulate phosphorus can be transported via metal-rich particles.
Table 1.
Characterization of the three types of particles containing on average more than 1.5% phosphorus, (1) particles only rich in phosphorus (>20%) and low in iron (<15%) and manganese (<10%), (2) particles rich in iron (>15%), and (3) particles rich in manganese (>10%)
| P-rich particles | Fe-rich particles | Mn-rich particles | |||||||||||||
|---|---|---|---|---|---|---|---|---|---|---|---|---|---|---|---|
| Depth (m) | P (%) | ± | n | P (%) | ± | Fe (%) | ± | n | Fe:P | P (%) | ± | Mn (%) | ± | n | Mn:P |
| 72 | 0 | 0.5 | 1.0 | 48.3 | 19.8 | 119 | 54 | 0.7 | 0.6 | 41.2 | 7.5 | 2057 | 31 | ||
| 87 | 27.2 | 3.5 | 34 | 0.9 | 2.4 | 44.2 | 21.3 | 218 | 27 | 1.6 | 1.2 | 48.9 | 8.1 | 1347 | 17 |
| 90 | 26.5 | 1 | 1.1 | 1.5 | 50.2 | 18.9 | 20 | 25 | 2.0 | 0.9 | 48.3 | 6.6 | 366 | 14 | |
| 95 | 29.6 | 2.4 | 331 | 2.8 | 4.1 | 54.2 | 17.7 | 436 | 11 | 5.0 | 2.0 | 45.4 | 8.3 | 718 | 5 |
| 100 | 29.4 | 3.5 | 36 | 1.4 | 2.9 | 57.1 | 15.8 | 351 | 22 | 4.9 | 2.9 | 33.2 | 11.3 | 83 | 4 |
| 103 | 29.7 | 3.6 | 8 | 2.6 | 4.4 | 60.3 | 16.3 | 459 | 13 | 2.3 | 1.2 | 46.6 | 8.3 | 736 | 12 |
| 110 | 29.3–33.8 | 2 | 0.8 | 1.2 | 60.9 | 16.2 | 405 | 42 | 3.0 | 1.5 | 33.7 | 10.1 | 8 | 6 | |
| 118 | 26.0 | 1 | 0.7 | 1.3 | 45.8 | 20.3 | 200 | 35 | 4.1–4.7 | 18.6–33.7 | 2 | ||||
For each depth the average mass percentage of phosphorus and iron or manganese, if applicable, are given together with the standard deviation and the total number of particles observed. For iron and manganese-rich particles also the molar ratio of iron or manganese to phosphorus is given
In addition, however, we detected a third type of particles that were abundant and had an order of magnitude higher phosphorus proportions (27−30% P) (Table 1). As the phosphorus-rich particles contained only small amounts of metals and less than 15% Ca, we considered them likely to be polyP of biological origin. A direct observation of these particles showed that phosphorus-rich particles were located within spherical cells of 4.6–6.8 µm (Fig. 2a–d, Supplementary Fig. 1). In addition to several voids and polyP-rich inclusions, each of these cells contained long chains of magnetosomes (Fig. 2, Supplementary Figs. 1, 2), which are typical for magnetotactic bacteria [30]. Therefore, we concluded that the round phosphorus-rich cells were large magnetotactic bacteria with polyP inclusions and vacuoles.
Fig. 2.

Micrographs of large spherical cells from the suboxic zone. a-d Electron micrographs of spherical cells, each containing two double strings of iron-rich crystals, phosphorus-rich inclusions and several hollow structures resembling vacuoles. e Fluorescent micrograph of a cell stained with a probe specific for an unclassified lineage of the Magentococcaceae. f Fluorescent micrograph of a cell stained with DAPI showing polyP inclusions in yellow. Bars = 1 µm
Magnetotactic bacteria with polyphosphate
Magnetotactic bacteria produce chains of small magnets, which enable them to align passively in parallel to the magnetic field of the Earth. As they are generally very motile (up to 300 µm/s; [31]) this can lead to a directed movement over comparatively large distances. Magnetotactic bacteria seem to prefer environments with low or zero oxygen concentrations and are typically inhabiting environments at the oxic-anoxic interface in sediments, and stagnant coastal waters and lakes [32, 33]. In general, as there are few pure cultures of magnetotactic bacteria, the details of their physiological capacities remain somewhat speculative. Most of the marine magnetotactic bacteria are suspected to live by the oxidation of reduced sulfur compounds and use their motility to shuttle between more reduced and more oxidized environments [32].
16 S rRNA gene analyses revealed active populations of bacteria related to the genera Magnetospira and Magnetococcus within the suboxic zone of the Black Sea. We therefore developed specific fluorescent probes for these two populations and showed by fluorescent in situ hybridization, that the large spherical cells with polyP inclusions are related to the genus Magnetococcus (Fig. 2e, Supplementary Figs. 4, 5). In a recent, independent study intensive polyP accumulation by Magnetococcus related bacteria was also reported from the permanently stratified Lake Pavin [33]. Morphologically, these limnic bacteria resemble the magnetotactic bacteria in our Black Sea samples, although they are somewhat smaller and do not create a pronounced phosphate minimum and maximum in the water column as observed in the Black Sea. In general magnetotactic bacteria may be widespread within anoxic basins, as we also observed chains of magnetites at the pelagic redoxcline and in samples from sediment traps in the central Baltic Sea (Supplementary Fig. 3).
The role of bacterial polyphosphate
As additional confirmation for the presence of large polyP-rich bacteria in the suboxic zone, we quantified the number of cells or particles containing polyP (Fig. 3b) by flow cytometry. The distribution of polyP inclusions, which were stainable with tetracycline and large enough to be detected by flow cytometry (Fig. 3b), was very similar to the distribution of total particulate phosphorus (Fig. 1b). A microscopic inspection of these samples after staining polyP with DAPI confirmed that large polyP inclusions were found within round cells of approximately 5 µm diameter (Fig. 2f). About 5% (1–9%) of all prokaryotic cells contained these large polyP inclusions (Fig. 3).
Fig. 3.

Bacteria containing polyP within the suboxic zone. a Abundance of prokaryotic cells determined by flow-cytometry after staining with SYBR Green I (black circles). b Abundance of microorganisms with larger polyphosphate inclusions determined by flow-cytometry after staining with tetracycline (orange circles)
In order to proof a bacterial involvement in phosphorus transport via polyP, we studied the general pattern of gene expressions for polyP kinases (Ppk1 and Ppk2) and exophosphatases (Ppx) of the entire bacterial population. The polyP kinase Ppk1 reversibly catalyzes the formation of polyP [34], whereas both Ppk2 and Ppx are involved in the degradation of polyP to ATP or phosphate, respectively [5, 35]. Genes for all of these enzymes showed a distinct peak in expression at the lower boundary of the suboxic zone (Fig. 4a) at a depth similar to the peak in dissolved phosphate (Fig. 1a), suggesting a relation between phosphate release and polyP degradation.
Fig. 4.

Transcription of genes related to polyP (a) Gene transcripts for known polyphosphate kinases in transcripts l−1. All three kinases, polyphosphate kinase 1 (light green circles), polyphosphate kinase 2 (orange circles) and exopolyphosphatase (violet circles) show the highest transcription in the zone of phosphate release. b Transcription of polyphosphate kinases by different groups of bacteria showing the five most important groups: Sulfurimonas spp. (red), Competibacter spp. (pink), sulfur oxidizing symbionts (blue), Zetaproteobacteria (yellow) and Magnetococaceae (green)
Genes for polyphosphate kinases were most frequently expressed by members of the genus Sulfurimonas, followed by Competibacter, sulfur oxidizing symbionts, Zetaproteobacteria and Magnetocoacacea (Fig. 4b). Earlier studies have shown the dominance of the sulfide oxidizing bacterium Sulfurimonas spp. at the lower suboxic zone of the Black Sea with 10–30% of the total bacterial number [36]. In a recent study, polyP accumulating cells of Sulfurimonas gotlandica were shown to contain up to 66 amol P/cell [37]. If we assume that approximately 50 nmol/l particulate phosphorus (Fig. 1b) is distributed in around 10,000 particles or cells per ml rich in polyphosphate (Fig. 3b), each of these cells or particles would have to contain about 5 fmol P, which is two orders of magnitude more than measured in S. gotlandica. Even if we assume that 30% of all bacterial cells (200,000 cells/ml, Fig. 3a) were Sulfurimonas cells with 66 amol P/cell, they would add up to only 4 nmol of particulate P/l, which is not even 10% of the total pool (Fig. 1b). Thus, in spite of their high abundance and activity, polyP storage and transport by Sufurimonas spp. cannot quantitatively explain the displacement of phosphate from the upper to the lower boundary of the suboxic zone.
The rod-shaped bacterium S. gotlandica has an approximate cell volume of 0.5 µm3 (0.5 µm diameter; 2.5 µm length) [38]. Compared to this, the cell volume of a spherical cell with a diameter of 5 µm is more than a hundred times larger (65 µm3). Like most rod-shaped bacteria, Sulfurimonas cells typically contain two spherical polyP inclusions at each end of the cell. The diameter of these inclusions is restricted by the smallest cell diameter, which is around 0.5 µm for S. gotlandica [38]. Consequently, the polyP inclusions of S. gotlandica are typically not larger than 0.4 µm (M. Labrenz and L. Möller, pers. com.). Thus, the maximal total volume for polyP storage in S. gotlandica is approximately 0.07 µm3 per cell, containing a maximum of 66 amol P. For a conservative estimate of the storage capacity of large magnetotactic bacteria, we could assume two spherical polyP inclusions with a diameter of 2 µm per cell, as shown in Fig. 2f, which would result again in a more than a hundred times larger storage capacity (8 µm3) and likely a more than a hundred times larger P content (>6 fmol) per cell. Thus, in contrast to ordinary sized bacteria like Sulfurimonas spp., magnetotactic bacteria with a diameter of 5 µm could accumulate sufficient amounts of phosphorus to quantitatively explain phosphorus cycling in the suboxic zone.
A bacterial phosphate shuttle
More than thirty years ago Shaffer proposed an explanation for what he called “the large phosphate anomaly dipole” of the Black Sea by suggesting the existence of a phosphate shuttle [3] driven by rapidly sinking metal oxides. Nevertheless, Shaffer concluded that this mechanism alone could not quantitatively transport enough phosphate from the upper to the lower boundary of the suboxic zone, as we also clearly confirmed by quantifying the phosphorus content of metal rich particles (Table 1). In addition to this fundamental discrepancy, sinking rates of natural manganese-rich particles were experimentally determined to be only around 0.8 m d−1 [39], which is much lower than the sinking rate of 6.5 m d−1, which is required to maintain the concentration differences between dissolved phosphate and particulate phosphorus, as we assessed by numerical modeling (Supplementary information). Magnetotactic bacteria have been reported to move at 300 µm s−1 [31], or 26 m d−1. In addition, because of their magnetosomes, they can move in a more or less vertically directed manner even in the absence of a detectable environmental gradient. Thus, a vertical displacement of phosphorus at a speed of 6.5 m d−1 is certainly achievable for magnetotactic bacteria. In contrast to sinking particles, after releasing their phosphate they could even return and swim upwards again to refill their polyP storage. This new bacterial phosphate shuttle, which we find evidence for in the Black Sea and hints of in the Baltic Sea, has important implications for the retention of phosphate in anoxic basins. By transporting phosphate from surface waters into deeper layers, this shuttle could protect marginal seas against excessive phosphorus eutrophication at the surface and thereby prevent harmful algae blooms, e.g., by cyanobacteria. Independent from a geochemical shuttle, this bacterial phosphate shuttle could proceed as long as the bacteria find a suitable environment.
A more detailed look at the phosphate minimum zone revealed that phosphate disappeared at the same water depth where oxygen concentrations approached zero (Fig. 5). Moreover, in the middle of the phosphate minimum zone, we observed a small peak of nitrite (Fig. 5), which typically appears at the upper boundary of anoxic water bodies, indicating the ultimate absence of oxygen and subsequent onset of nitrate reduction [40]. It seems therefore reasonable to suggest that in the zone of active phosphate uptake, nitrate respiration is a dominant process. In accordance with this, Magnetococcus marinus MC1, the closest cultivated relative to the population in the Black Sea, has been reported to contain genes for periplasmatic nitrate reduction [41]. Furthermore, the presence of large vacuoles (Fig. 4a–d) could indicate a storage and transport of redox partners (e.g., nitrate or nitrite) over a larger physical distance, as known from benthic bacteria with vacuoles [42]. As previously reported for large, benthic sulfur bacteria [6], sulfide seems to trigger the degradation of polyphosphate and release of phosphate. The reason for this could be a short term mobilization of energy to increase motility [37], which could enhance the possibility to escape a hostile environment. In addition polyP might also act as a chelator for iron and other toxic metal ions [5], which are released under sulfidic conditions. Similar to the giant sulfur bacterium Thiomargarita namibiensis in Namibian sediments [43], which contributes to the formation of phosphorus-rich precipitates [43, 44], magnetotactic bacteria in the suboxic zone of the Black Sea can only have a pronounced effect on phosphorus cycling because they are much larger than average sized bacteria and thus contain and transport more polyP. This shows that, even for bacteria, size can be a crucial parameter determining the effect an organism can have on its environment.
Fig. 5.
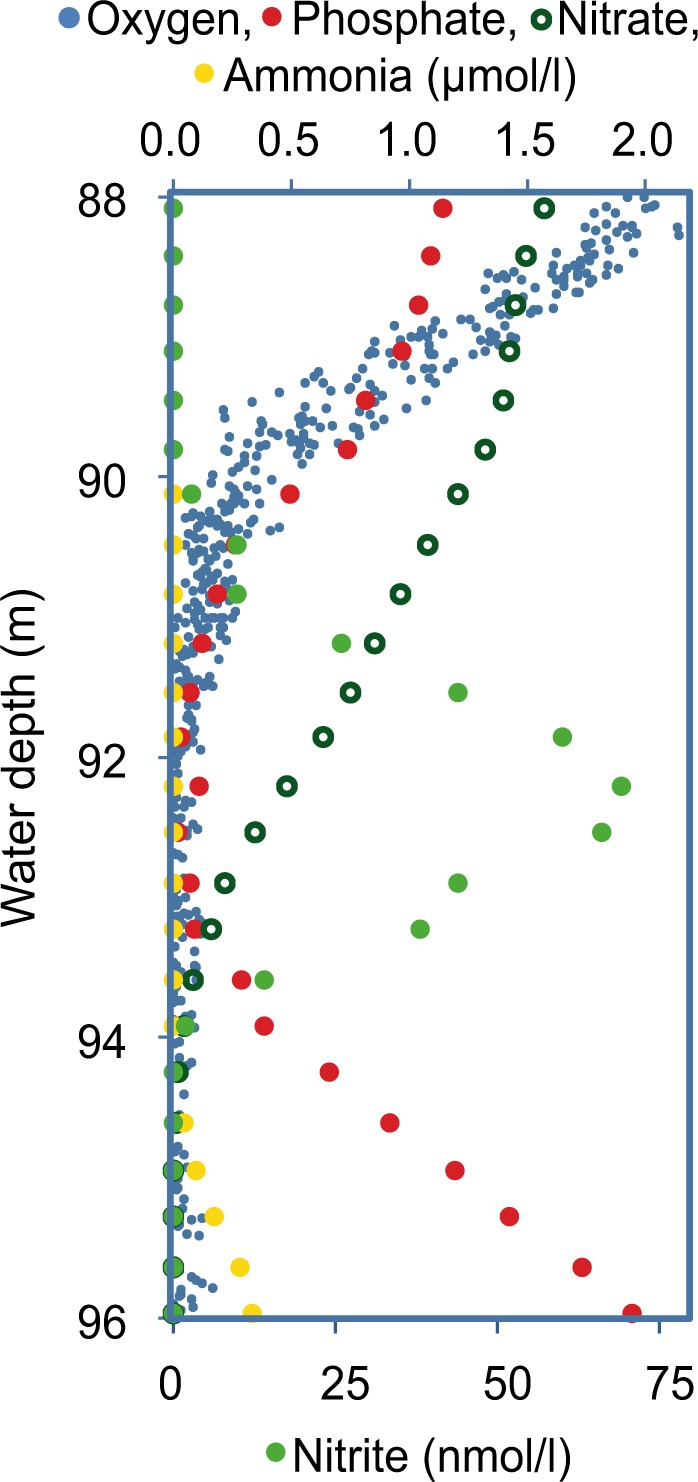
Zone of phosphate uptake. Zooming into the zone of phosphate uptake shows in high resolution the distribution of oxygen (small blue circles), phosphate (red circles), nitrate (open black circles), ammonium (yellow circles) and nitrite (green circles). Phosphate is taken up at the same depth were oxygen concentrations reach zero as indicated by a distinct nitrite peak
Electronic supplementary material
Acknowledgements
We are grateful for the competent technical assistance of Ronny Baaske, Christian Burmeister, Christin Laudan and Christian Meeske. We are greatly indebted to Cindy Lee and Bo Barker Jørgensen for providing extremely helpful comments on an earlier version of the manuscript. Horst D. Schulz and René Friedland are acknowledged for stimulating discussions on the modeling approach. We thank the captain and the crew of the R/V “Maria S. Merian” for the excellent support on board and the DFG (MSM33) and BMBF (01DK12043) for financing the cruise. The particle analysis was funded by the BMBF (03F0663A). S.B. was funded by a BONUS BLUEPRINT project (03F0679A awarded to KJ; http://blueprint-project.org), supported by BONUS (Art 185), funded jointly by the EU and the German Federal Ministry of Education and Research (BMBF). T. S. was funded by the German research foundation (DFG) (awarded to K.J., JU 367/16-1). Metagenome sequencing was done at the Swedish National Genomics Infrastructure (NGI) at SciLifeLab (Sweden).
Conflict of interest
The authors declare that they have no conflict of interest.
Supplementary information
The online version of this article (10.1038/s41396-018-0315-6) contains supplementary material, which is available to authorized users.
References
- 1.Jørgensen BB, Fossing H, Wirsen CO, Jannasch HW. Sulfide oxidation in the anoxic Black Sea chemocline. Deep Sea Res I. 1991;38:S1083–S103. doi: 10.1016/S0198-0149(10)80025-1. [DOI] [Google Scholar]
- 2.Murray JW, Jannasch HW, Honjo S, Anderson RF, Reeburgh W, Top Z, et al. Unexpected changes in the oxic/anoxic interface in the Black Sea. Nature. 1989;338:411–3. doi: 10.1038/338411a0. [DOI] [Google Scholar]
- 3.Shaffer G. Phosphate pumps and shuttles in the Black Sea. Nature. 1986;321:515–7. doi: 10.1038/321515a0. [DOI] [Google Scholar]
- 4.Yakushev EV, Pakhomova S, Sørensen K, Skei J. Importance of the different manganese species in the formation of water column redox zones: Observation and modeling. Mar Chem. 2009;117:59–70. doi: 10.1016/j.marchem.2009.09.007. [DOI] [Google Scholar]
- 5.Kornberg A, Rao NN, Ault-Riché D. Inorganic polyphosphate: a molecule of many functions. Annu Rev Biochem. 1999;68:89–125. doi: 10.1146/annurev.biochem.68.1.89. [DOI] [PubMed] [Google Scholar]
- 6.Brock J, Schulz-Vogt HN. Sulfide induces phosphate release from polyphosphate in cultures of a marine Beggiatoa strain. ISME J. 2011;5:497–506. doi: 10.1038/ismej.2010.135. [DOI] [PMC free article] [PubMed] [Google Scholar]
- 7.Strady E, Pohl C, Yakushev EV, Krüger S, Hennings U. PUMP-CTD-system for trace metal sampling with a high vertical resolution. A test in the Gotland Basin, Baltic Sea. Chemosphere. 2008;70:1309–19. doi: 10.1016/j.chemosphere.2007.07.051. [DOI] [PubMed] [Google Scholar]
- 8.Feike J, Jürgens K, Hollibaugh JT, Krüger S, Jost G, Labrenz M. Measuring unbiased metatranscriptomics in pelagic aerobic ammonium oxidation zones of the central Baltic Sea based on a new in situ fixation system. ISME J. 2012;6:461–70. doi: 10.1038/ismej.2011.94. [DOI] [PMC free article] [PubMed] [Google Scholar]
- 9.Grasshoff K, Ehrhardt M, Kremling K, editors. Methods of seawater analysis. Weinheim: Verlag Chemie; 1983. [Google Scholar]
- 10.Marie D, Jaquet F, Vaulot D. Enummeration and cell cycle analysis of natural populsations of marine picoplankton by flow cytometry using the nucleic acid stain SYBR Green I. Appl Environ Microbiol. 1997;63:186–93. doi: 10.1128/aem.63.1.186-193.1997. [DOI] [PMC free article] [PubMed] [Google Scholar]
- 11.Koch C, Günther S, Desta AF, Hübschmann T, Müller S. Cytometric fingerprinting for analyzing microbial intracommunity structure variation and identifying subcommunity function. Nat Protoc. 2013;8:190–202. doi: 10.1038/nprot.2012.149. [DOI] [PubMed] [Google Scholar]
- 12.Weinbauer MG, Fritz I, Wenderoth DF, Höfle MG. Simultaneous extraction from bacterioplankton of total RNA and DNA suitable for quantitative structure and function analyses. Appl Environ Microbiol. 2002;68:1082–7. doi: 10.1128/AEM.68.3.1082-1087.2002. [DOI] [PMC free article] [PubMed] [Google Scholar]
- 13.Satinsky BM, Gifford SM, Crump BC, Moran MA. Use of internal standards for quantitative metatranscriptome and metagenome analysis. Methods Enzymol. 2013;531:237–50. doi: 10.1016/B978-0-12-407863-5.00012-5. [DOI] [PubMed] [Google Scholar]
- 14.Peng Y, Leung HC, Yiu SM, Chin FY. IDBA-UD: a de novo assembler for single-cell and metagenomic sequencing data with highly uneven depth. Bioinformatics. 2012;28:1420–8. doi: 10.1093/bioinformatics/bts174. [DOI] [PubMed] [Google Scholar]
- 15.Camacho C, Coulouris G, Avagyen V, Ma N, Papadopoulos J, Bealer K, et al. BLAST + : architecture and application. BMC Bioinforma. 2009;10:421. doi: 10.1186/1471-2105-10-421. [DOI] [PMC free article] [PubMed] [Google Scholar]
- 16.Temperton B, Gilbert JA, Quinn JP, McGrath JW. Novel analysis of oceanic surface water metagenomes suggests importance of polyphosphate metabolism in oligotrophic environments. PLoS One. 2011;6:e16499. doi: 10.1371/journal.pone.0016499. [DOI] [PMC free article] [PubMed] [Google Scholar]
- 17.Langmead Ben, Trapnell Cole, Pop Mihai, Salzberg Steven L. Ultrafast and memory-efficient alignment of short DNA sequences to the human genome. Genome Biology. 2009;10(3):R25. doi: 10.1186/gb-2009-10-3-r25. [DOI] [PMC free article] [PubMed] [Google Scholar]
- 18.Liao Y, Smyth GK, Shi W. FeatureCounts: an efficient general purpose program for assigning sequence reads to genomic features. Bioinformatics. 2014;30:923–30. doi: 10.1093/bioinformatics/btt656. [DOI] [PubMed] [Google Scholar]
- 19.Schulz HD. Conceptual models and computer models. In: Schulz HD, Zabel M, editors. Marine geochemistry. Berlin: Springer; 2006. pp. 513–47. [Google Scholar]
- 20.Glöckner FO, Yilmaz P, Quast C, Gerken J, Beccati A, Ciuprina A, et al. 25 years of serving the community with ribosomal RNA gene reference databases and tools. J Biotechnol. 2017;261:169–76. doi: 10.1016/j.jbiotec.2017.06.1198. [DOI] [PubMed] [Google Scholar]
- 21.Quast C, Pruesse E, Yilmaz P, Gerken J, Schweer T, Yarza P, et al. The SILVA ribosomal RNA gene database project: improved data processing and web-based tools. Nucleic Acids Res. 2013;41:D590–D6. doi: 10.1093/nar/gks1219. [DOI] [PMC free article] [PubMed] [Google Scholar]
- 22.Ludwig W, Strunk O, Westram R, Richter L, Meier H, Yadhukumar, et al. ARB: a software environment for sequence data. Nucleic Acids Res. 2004;32:1363–71. doi: 10.1093/nar/gkh293. [DOI] [PMC free article] [PubMed] [Google Scholar]
- 23.Pernthaler A, Pernthaler J, Amann R. Fluorescence in situ hybridization and catalyzed reporter deposition for the identification of marine bacteria. Appl Environ Microbiol. 2002;68:3094–101. doi: 10.1128/AEM.68.6.3094-3101.2002. [DOI] [PMC free article] [PubMed] [Google Scholar]
- 24.Bergen B, Herlemann DPR, Labrenz M, Jürgens K. Distribution of the verrucomicrobial clade Spartobacteria along a salinity gradient in the Baltic Sea. Env Microbiol Rep. 2014;6:625–30. doi: 10.1111/1758-2229.12178. [DOI] [PubMed] [Google Scholar]
- 25.Gregg MC, Yakushev E. Surface ventilation of the Black Sea’s cold intermediate layer in the middle of the western gyre. Geophys Res Lett. 2005;32:L03604. [Google Scholar]
- 26.Dellwig O, Leipe T, März C, Glockzin M, Pollehne F, Schnetger B, et al. A new particulate Mn-Fe-P-shuttle at the redoxcline of anoxic basins. Geochchim Cosmochim Acta. 2010;74:7100–15. doi: 10.1016/j.gca.2010.09.017. [DOI] [Google Scholar]
- 27.Yiğiterhan O, Murray JW, Truğul S. Trace metal composition of suspended particulate matter in the water column of the Black Sea. Mar Chem. 2011;126:207–28. doi: 10.1016/j.marchem.2011.05.006. [DOI] [Google Scholar]
- 28.Einsele W. Über chemische und kolloidchemische Vorgänge in Eisen-Phosphat-Systemen unter limnochemischen und limnogeologischen Gesichtspunkten. Arch Hydrobiol. 1938;33:361–87. [Google Scholar]
- 29.Mortimer CH. The exchange of dissolved substances between mud and water in lakes. J Ecol. 1941;29:280–329. doi: 10.2307/2256395. [DOI] [Google Scholar]
- 30.Blakemore R. Magnetotactic bacteria. Science. 1975;190:377–9. doi: 10.1126/science.170679. [DOI] [PubMed] [Google Scholar]
- 31.Lefèvre CT, Bernadac A, Yu-Zhang K, Pradel N, Wu LF. Isolation and characterization of a magnetotactic bacterial culture from the Mediterranean Sea. Environ Microbiol. 2009;11:1646–57. doi: 10.1111/j.1462-2920.2009.01887.x. [DOI] [PubMed] [Google Scholar]
- 32.Lefèvre CT, Bazylinski DA. Ecology, diversity, and evolution of magnetotactic bacteria. Microbiol Mol Biol Rev. 2013;77:497–526. doi: 10.1128/MMBR.00021-13. [DOI] [PMC free article] [PubMed] [Google Scholar]
- 33.Rivas-Lamelo S, Benzerara K, Lefèvre CT, Monteil CL, Jézéquel D, Menguy N, et al. Magnetotactic bacteria as a new model for P sequestration in the Ferruginous Lake Pavin. Geochem Persp Let. 2017;5:35–41. doi: 10.7185/geochemlet.1743. [DOI] [Google Scholar]
- 34.Ahn K, Kornberg A. Polyphosphate kinase from Escherichia coli. J Biol Chem. 1990;265:11734–9. [PubMed] [Google Scholar]
- 35.Nocek B, Kochinyan S, Proudfoot M, Brown G, Evdokimova E, Osipiuk J, et al. Polyphosphate-dependent synthesis of ATP and ADP by the family-2 polyphosphate kinases in bacteria. Proc Natl Acad Sci U. 2008;105:17730–5. doi: 10.1073/pnas.0807563105. [DOI] [PMC free article] [PubMed] [Google Scholar]
- 36.Grote J, Jost G, Labrenz M, Herndl GJ, Jürgens K. Epsilonproteobacteria represent the major portion of chemoautotrophic bacteria in sulfidic waters of pelagic redoxclines of the Baltic and Black Seas. Appl Environ Microbiol. 2008;74:7546–51. doi: 10.1128/AEM.01186-08. [DOI] [PMC free article] [PubMed] [Google Scholar]
- 37.Möller Lars, Laas Peeter, Rogge Andreas, Goetz Florian, Bahlo Rainer, Leipe Thomas, Labrenz Matthias. Sulfurimonas subgroup GD17 cells accumulate polyphosphate under fluctuating redox conditions in the Baltic Sea: possible implications for their ecology. The ISME Journal. 2018;13(2):482–493. doi: 10.1038/s41396-018-0267-x. [DOI] [PMC free article] [PubMed] [Google Scholar]
- 38.Labrenz M, Grote J, Mammitsch K, Boschker HTS, Laue M, Jost G, et al. Sulfurimonas gotlandica sp. nov., a chemoautotrophic and psychrotolerant epsilonproteobacterium isolated from a pelagic redoxcline, and an emended description of the genus Sulfurimonas. Int J Syst Evol Micr. 2013;63:4141–8. doi: 10.1099/ijs.0.048827-0. [DOI] [PMC free article] [PubMed] [Google Scholar]
- 39.Glockzin M, Pollehne F, Dellwig O. Stationary sinking velocity of authigenic manganese oxides at pelagic redoxclines. Mar Chem. 2014;160:67–74. doi: 10.1016/j.marchem.2014.01.008. [DOI] [Google Scholar]
- 40.Thamdrup B, Dalsgaard T, Revsbech NP. Widespread functional anoxia in the oxygen minimum zone of the Eastern South Pacific. Deep-Sea Res I. 2012;65:36–45. doi: 10.1016/j.dsr.2012.03.001. [DOI] [Google Scholar]
- 41.Philippot L. Denitrifying genes in bacterial and Archaeal genomes. Biochim Biophys Acta. 2002;1577:355–76. doi: 10.1016/S0167-4781(02)00420-7. [DOI] [PubMed] [Google Scholar]
- 42.Fossing H, Gallardo VA, Jørgensen BB, Huettel M, Nielsen LP, Schulz H, et al. Concentration and transport of nitrate by the mat-forming sulphur bacterium Thioploca. Nature. 1995;374(6524):713–5. doi: 10.1038/374713a0. [DOI] [Google Scholar]
- 43.Schulz HN, Schulz HD. Large sulfur bacteria and the formation of phosphorite. Science. 2005;307:416–8. doi: 10.1126/science.1103096. [DOI] [PubMed] [Google Scholar]
- 44.Goldhammer T, Brüchert V, Ferdelman TG, Zabel M. Microbial sequestration of phosphorus in anoxic upwelling sediments. Nat Geosci. 2010;3:557–61. doi: 10.1038/ngeo913. [DOI] [Google Scholar]
Associated Data
This section collects any data citations, data availability statements, or supplementary materials included in this article.
Supplementary Materials
Data Availability Statement
Sequences of the 16 S rRNA gene used for the phylogenetic analysis are deposited in the European Nucleotide Archive (ENA) under accession numbers LT960764-LT960776. The data sheets of the flow cytometry analyses are deposited under 10.12754/data-2017-0003.