Abstract.
A glioma grading method using conventional structural magnetic resonance image (MRI) and molecular data from patients is proposed. The noninvasive grading of glioma tumors is obtained using multiple radiomic texture features including dynamic texture analysis, multifractal detrended fluctuation analysis, and multiresolution fractal Brownian motion in structural MRI. The proposed method is evaluated using two multicenter MRI datasets: (1) the brain tumor segmentation (BRATS-2017) challenge for high-grade versus low-grade (LG) and (2) the cancer imaging archive (TCIA) repository for glioblastoma (GBM) versus LG glioma grading. The grading performance using MRI is compared with that of digital pathology (DP) images in the cancer genome atlas (TCGA) data repository. The results show that the mean area under the receiver operating characteristic curve (AUC) is 0.88 for the BRATS dataset. The classification of tumor grades using MRI and DP images in TCIA/TCGA yields mean AUC of 0.90 and 0.93, respectively. This work further proposes and compares tumor grading performance using molecular alterations (IDH1/2 mutations) along with MRI and DP data, following the most recent World Health Organization grading criteria, respectively. The overall grading performance demonstrates the efficacy of the proposed noninvasive glioma grading approach using structural MRI.
Keywords: glioma grading, dynamic texture, multiresolution fractal, histopathology image, IDH1/2 mutant, magnetic resonance image
1. Introduction
Gliomas are the most common forms of primary neoplasm in the central nervous system (CNS) that originate from resident glial cells. Recently, molecular alterations have been incorporated in the 2016 World Health Organization (WHO)1 grading system, which has led to a major restructuring of glioma classification. The important molecular alterations include the isocitrate dehydrogenase (IDH1/2), ATRX, and/or TP53 genes, and chromosomal 1p/19p codeletion.1 IDH mutations occurring in either the IDH1 or IDH2 genes are very significant and well-described in gliomas. Classifying gliomas based on their IDH status (mutated versus wildtype) creates clinically distinct survival groups. IDH-wildtype gliomas behave more aggressively when compared with their IDH-mutant counterparts.2 The alpha thalassemia/mental retardation syndrome -linked gene, known as ATRX, can also be mutated in IDH-mutant gliomas and is likewise associated with a significantly better prognosis.3 The scale redefines the four grades (I–IV) of gliomas depending on recurrence rate, aggressiveness, infiltration, and molecular alterations. The stratification of glioblastoma (GBM)/low grade (LG) or a more general high grade (HG)/LG classification at the time of initial radiologic examination may facilitate an early and effective treatment planning. LG gliomas (grades I and II), such as LG astrocytomas and oligodendrogliomas, account for 10%4 of primary brain tumors and are usually slow growing but infiltrative. HG gliomas (grades III and IV) show increased cell proliferation and account for to 75%4 of the glioma cohorts. Specifically, GBM (grade IV) is the most malignant and rapidly growing primary CNS neoplasm. In practice, tumor biopsy or resection is carried out to accurately classify and grade these gliomas in order to determine treatment strategies and predict overall prognosis. However, standard clinical practice of biopsy/resection and then pathologic assessment and classification of tumors involve subjectivity, interobserver variability, and may not extract adequate tissue samples within the tumor vicinity.5 These limitations may be lessened by an objective, noninvasive, and comprehensive imaging of the tumor area followed by an automatic stratification of the tumor grading.
Few noninvasive and computer-aided techniques have been proposed in the literature for glioma grading and the assessment of tumor malignancy. Among the recent studies, Weber et al.6 have used spectroscopy and perfusion images to capture the heterogeneous property of brain neoplasms for classifying GBMs from metastases and CNS lymphomas. In a similar study, Provenzale et al.7 have used apparent diffusion coefficients from the diffusion tensor imaging to classify brain primary neoplasms from abscesses and lymphomas. Furthermore, Wang et al.8 have classified malignant and benign brain neoplasms using spectroscopy images with conventional MRI. Researchers9 have also used conventional MRI and perfusion imaging derived relative cerebral blood volume (rCBV) for HG/LG classification. Zacharaki et al.5 have extracted shape-based and Gabor-like texton10 features from perfusion and conventional MRI for tumor grading. Caulo et al.11 have accounted the heterogeneity of lesions in conventional and advanced (perfusion, diffusion, and spectroscopy) MRI for glioma grading, such as HG/LG. Although previous studies are useful, the large-scale application of these methods may not be feasible due to limited availability of advanced MRI modalities (e.g., perfusion, diffusion, spectroscopy, and others) for tumor grading.
We propose a noninvasive glioma grading method using structural MRI that is commonly acquired in clinical practice. The grading performance of the proposed method using structural MRI is compared with that of digital pathology (DP) images. The contributions of this work are as follows. First, we propose one of the first methods in the literature using conventional structural MRI-based radiomics that shows potential for noninvasive tumor grading. The proposed method alleviates a few limitations of our prior studies,12,13 such as the method is fully automated, and feature extraction is performed from the whole 3-D tumor volume rather than from a single MRI slice. Second, we introduce methods for glioma grading using both radiomics and molecular information following the recent WHO grading criteria. Finally, in order to understand the efficacy of different patient data types in grading, tumor classification is compared across radiomic, histopathology, and molecular data, respectively.
The rest of the article is organized as follows: complete methodology, datasets, mathematical models of different texture analysis and feature extraction techniques, classification are discussed in Sec. 2. Section 3 discusses the implementation details and experiments performed at different steps in this grading work. Section 4 shows the grading results using different datasets. Discussion on the grading results is discussed in Sec. 5. Finally, Sec. 6 provides the concluding remarks and future work.
2. Methodology
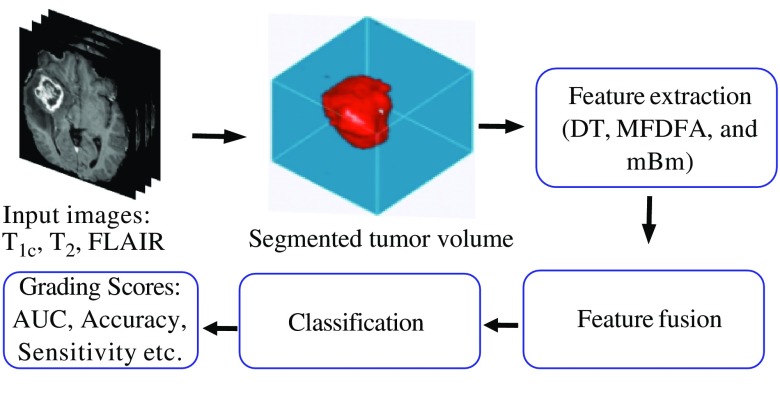
The overall flow diagram of the proposed method for grading in MRI, DP with a combination of the molecular information, is shown in Fig. 1. A detailed description of each step of Fig. 1 is given.
Fig. 1.
Simplified flow diagram of our proposed method for grading in MRI, DP images with a combination of the molecular information.
2.1. Data
MR images are collected from two separate multicenter datasets: 285 patients from the BRATS-201714,15 and 58 patients from the TCIA for HG/LG and GBM/LG grading, respectively. Histopathology images are collected from the TCGA DP database. Note that the 58 patients from the TCIA are selected such that they have corresponding histopathology images and molecular information in the TCGA dataset. Since MR images in the BRATS dataset are already skull-stripped and coregistered, we perform these preprocessing steps only on the TCIA dataset. The inhomogeneity in MRI intensity is corrected through channel-wise histogram matching with the images of a randomly selected patient as reference. In this study, three MRI modalities: , , and FLAIR images are used as they are commonly available in both datasets. Finally, additional MR images from another 30 patients in the BRATS-2013 dataset are used to train the tumor segmentation classifier. The available grading labels (HG/LG) for the BRATS-2017 dataset and (GBM/LG) for the TCIA dataset are used for training and evaluating the classifier models.
2.2. Tumor Segmentation and Texture Feature Extraction in MRI
The method uses three commonly available MRI modalities: , , and FLAIR. Following standard steps of MRI preprocessing, an automatic segmentation13 method is employed to segment the tumors. The proposed features are then extracted from MRI slices of the segmented tumor region. A complete flow diagram for MRI grading is shown in Fig. 2.
Fig. 2.
Automatic segmentation and classification steps for classifying tumor grades using structural MRI with texture-based radiomic features.
2.2.1. Automatic tumor segmentation
In the first step, we employ our texture feature-based automatic brain tumor segmentation (BTS) technique,13 which has demonstrated excellent performance in multiple global tissue segmentation challenges (e.g., ranked third in BRATS-2013,16 ranked fourth in both BRATS-2014 and ISLES-201517 competitions, respectively). In this work, we perform a multiclass (necrosis, edema, active tumor, and nontumor) abnormal tissue segmentation task. The segmented 3-D tumor volume is used as the region of interest (RoI) for extracting the proposed grading features.
2.2.2. Feature extraction from segmented tumor RoI
Several texture features, including multiresolution fractal Brownian motion (mBm), multifractal detrended fluctuation analysis (MFDFA), and 3-D dynamic texture (DT) features, are extracted from the bounded region of segmented tumor. The underlying mathematical model and algorithm for extracting these texture features are described below.
Multiresolution mBm texture feature extraction: The multiresolution fractal features are derived from the analysis of mBm process and have been effectively used in the detection and segmentation of brain lesions16–18 and then adapted to this study on tumor grading. The mBm process is a nonstationary zero-mean Gaussian random process and is defined as , where is the mBm process with a scaling factor and the time varying Hurst index, . In the mBm process, effectively captures the spatially varying heterogeneous texture of brain tissues by multiresolution wavelet decomposition. The covariance function for a 2-D mBm process of an image is given as follows:
| (1) |
where is the mBm process, denotes the vector position of a point in the process, is the variance, and is the Hurst index for a 2-D signal. After a series of mathematical derivations, the expectation of the squared magnitude of wavelet coefficients is given by
| (2) |
Here, is the scaling factor and is the 2-D translation vector of the wavelet basis. Also, and are the dimensions of the image. The Hurst index for 2-D image is calculated as follows:
| (3) |
Finally, the fractal dimension (FD) is obtained as follows:
| (4) |
where is the Euclidean dimension ( for 2-D images). The detailed mathematical derivations of the mBm process and FD feature extraction algorithm for segmentation can be found in Refs. 18 and 19. However, unlike in the segmentation task,18–20 the feature is extracted without dividing the input images into subimages. The FD feature is extracted from each 2-D slice images in the RoI and the maximum value is used for grading. Arguably, the maximum, minimum, mean, and median may be potential feature values, however, the minimum texture feature values mostly come from the peripheral slices that carry small tumor areas. The mean value, on the other hand, introduces averaging artifact and reduces the discriminating attributes among the tumor grades. Both minimum and mean features too have shown insignificant attributes for tumor grading classification. In comparison with maximum and median values, we find that the maximum values offer the most discriminating properties as the maximum values appear in the middle slices, where the tumor cross-section appears larger.
MFDFA feature extraction: The MFDFA is a multifractal process that is used to investigate the long-range dependency in a random sequence or image. The method is successfully used in time-series analysis,21 predicting gold price fluctuations22 and detecting microcalcification in mammogram images.23 In this study, we introduce MFDFA in an application of grading tumor in structural MRI. MFDFA is the multifractal process of the detrended fluctuation analysis (DFA). For a given subimage of size -by-, the DFA is defined by the equation below:
| (5) |
where is the detrended fluctuation of the subimage, which is indexed by of the original image. denotes the cumulative sum and is the fitted surface of the cumulative sum and . The ’th order fluctuation of each subimage is given by Eq. (6) and is determined for values of . Based on the L’ Hospital’s rule, Eq. (7) is used for . The sum of all fluctuations is averaged over total number of subimages as follows:
| (6) |
and
| (7) |
where is the total number of subimages. The Hurst index, , is given by the slope of the log–log plot of versus in Eq. (8). An image has self-similarity, if the log–log plot of versus indicates the power law scaling with a linear relation:
| (8) |
The dependence of on the scaling exponents and in Eq. (9) is the necessary condition for multifractal images:
| (9) |
where is the Euclidean dimension of 2-D image. The Hölder exponent, ,4 is used to find the singularity spectrum,24 and is defined as the Hölder function as below:
| (10) |
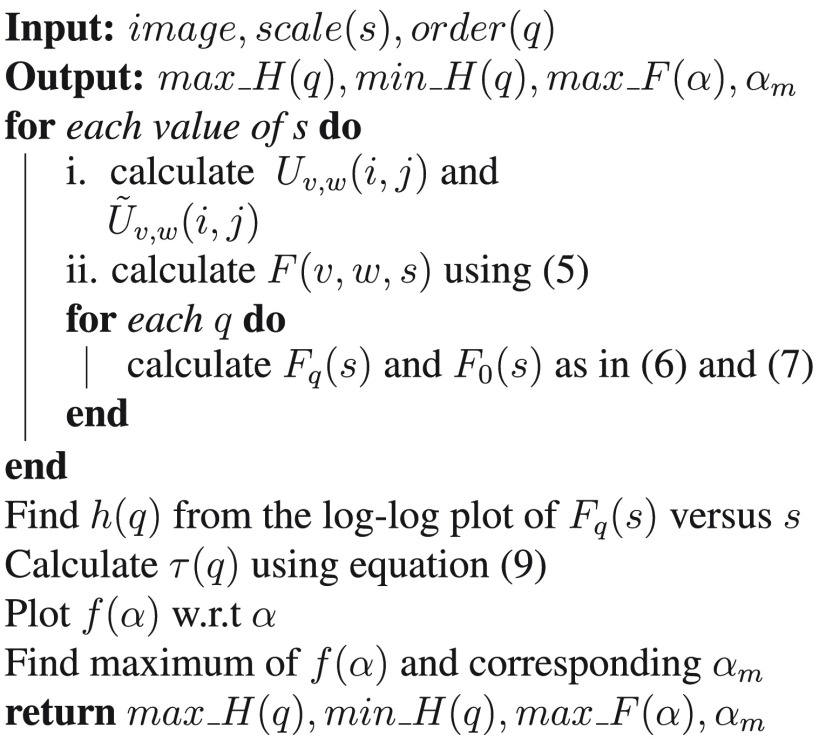
In this work, the MFDFA process measures the fluctuations (roughness of the surface) in an image at multiple ranges (scales) to estimate the Hurst index at different resolutions. Finally, the maximum and minimum values of the Hurst index, , maximum of Hölder function , and the corresponding values are used as the features following the above analysis. Figure 3 shows the algorithm for feature extraction using MFDFA.
Fig. 3.
Algorithm of feature extraction using MFDFA.
DT feature extraction: The DT, also known as the temporal texture, can be viewed as a continuously varying stream of images, which has resemblance with a fountain with continuous gushing water or a chimney with slowly puffing smoke. The study of DT is an active research area in the field of DT editing,25 pattern recognition,26 segmentation, and image registration. This DT analysis for conventional MRI is an application. Our proposed model assumes that the 2-D images of a MR sequence in the tumor volume or RoI inherit continuously varying properties of a DT. Since tumors of different grades vary in their aggressiveness, the rate of continuously varying characteristics of MR image sequences may exhibit useful attributes for tumor grading. We adopt the linear dynamic system (LDS) method,27 where the parameters of state equations are used as the DT descriptor. In this work, we adopt an open loop LDS28 system for DT analysis. In the DT analysis, the mean value of a sequence of input images is subtracted and then the subtracted images are concatenated to column vectors as observation vectors, . The singular value decomposition (SVD) is performed to map the observation vectors to the hidden states, following Eq. (11). These hidden states are actually the principal components of the observation vectors:
| (11) |
where the observation matrix is of size and , , are of size , , and , respectively. We have empirically found that the top 50% of the principal components optimize the grading performance for both MRI datasets. Hence, the reduced hidden states are used to fit a LDS through the mapping function, . The system parameters are estimated using Eq. (12):
| (12) |
Equation (12) suggests that a hidden vector corresponding to the hidden states can be mapped linearly to its next hidden vector if the system is a dynamic process. The state parameter is found through as below:
| (13) |
The Eigen values of matrix describe the pole location of the dynamic system and are used as discriminating features for tumor grading.
2.3. Cell Nuclei Segmentation and Shape Feature Extraction in Digital Pathology Images
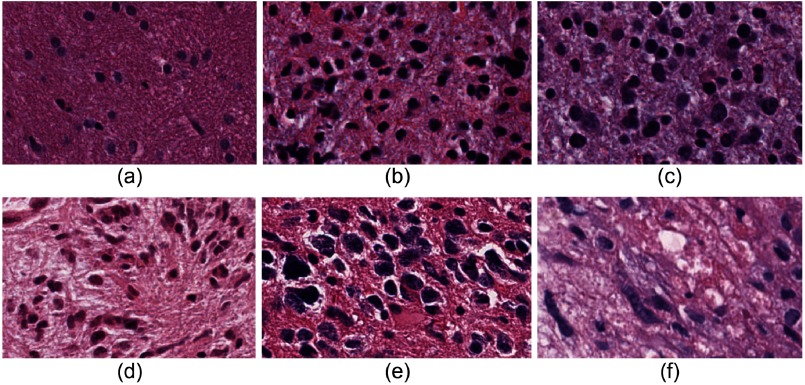
The method outlined in Ref. 29 is used for automatic glioma grading from DP images. A simplified block diagram for grading using DP images is shown in Fig. 4. In this paper, we use all available tissue slide images instead of using a single image per patient as in Ref. 29. Further, a pathologist has outlined the RoI that includes the active tumor region in each image for subsequent processing. The steps of the grading method are briefly discussed here while the details can be found in Ref. 29. The geometric features, including area, major axis length, and perimeter, are subsequently extracted from each nucleus. The shape features of cell nuclei are extracted from the DP images, which are different from the texture features obtained from the MR images. The nuclei in LG are predominantly circular with smaller morphologic characteristics, whereas nuclei in GBM are mostly elongated with irregular size. The prevalence of these irregular shaped nuclei (see Fig. 5) is different in GBM (WHO grade IV) and LG (WHO grades I and II) images and can be used as one of the grading characteristics. Note that similar grading criteria can be applied for HG (WHO grades III and IV) and LG classification. Intuitively, the classification of HG versus LG is more challenging than GBM versus LG as grade-III (HG) and grade-II (LG) often appear similar in images. In this work, we collected all the features from each nucleus for individual patients and clustered them into five classes using the k-means algorithm. The cluster centroids are sorted according to the Euclidean distance from the origin and are used in the subsequent classification steps.
Fig. 4.
Framework for grading using DP images.
Fig. 5.
Presence of irregular shaped nuclei with different proportion in (a)–(c) LG and (d)–(f) GBM images.
2.4. Molecular Alterations Features
The molecular distribution of IDH1/2 and ATRX mutations is obtained from the TCGA data portal. However, the ATRX information is not available for all our target 58 patients. Hence, we use only the IDH1/2 mutant information as a feature in the grading classification models developed using MRI and DP image features.
2.5. Feature Selection and Classification
The extracted image features are used to design four grading experiments: (1) MRI only, (2) MRI with the molecular information, (3) DP only, and (4) DP with the molecular information. A feature selection step is useful to optimize a classification performance and to understand the importance of individual features. A 10-fold cross-validation scheme is used to evaluate the classifier models for the grading experiments by reporting the mean area under the receiver operating characteristic (AUC) curve. In a 10-fold cross-validation, the classifier model is first trained using ninefold data, which additionally yields weights or importance scores for individual features. The feature importance score is used to rank the features and subsequently select top most important features. The trained model is then rebuilt using the top features and then tested using the left-out fold of data. The value of is varied from one to maximum number of features to investigate the effect of feature dimension on classification accuracy. The final feature ranking is obtained after averaging the importance scores over 10 folds. We use four of the most successful classifier models: linear support vector machine (linear SVM), SVM with radial basis function (SVM-RBF), gradient boost, and random forest (RF). The classifier performances are statistically compared using paired -tests between the 10-fold AUC scores. An -value of 0.05 is used to determine the level of significance.
2.6. Algorithm Implementation
We use MATLAB for the tumor segmentation in MRI, cell nuclei segmentation DP images, and grading feature extractions (texture feature in MRI and cell-nuclei morphological feature in DP). The classifier models, cross-validation and feature selection pipeline, and statistical experiments are developed using Python’s machine learning and statistics packages: sci-kit learn and sci-py.
3. Experiments
3.1. Tumor RoI Segmentation in MRI
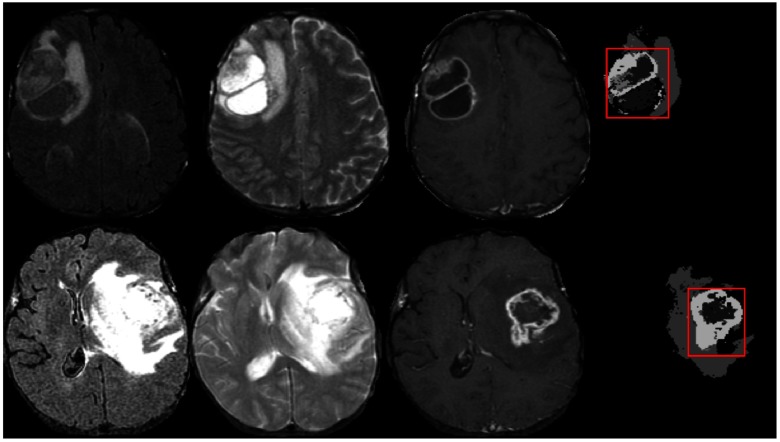
For tumor region segmentation, the BTS17 method is trained with the MRI from 30 patients in the BRATS-2013 training dataset and tested on both the TCIA and BRATS-2017 datasets. We consider the core tumor region (necrosis, enhanced, and nonenhanced tumor) as it retains the maximum clinical significance and disregard the infiltrating edematous region as this tissue does not show significant texture variations in any of the MRI modalities. The bounding box of the tumor core region represents the RoI. The RoI ensures sufficient image features that are necessary for the grading step. Hence, pixel-level accuracy of the segmentation task is not necessary as long as the tumor region has been identified. Figure 6 shows example images of the segmented tumor and corresponding RoI in two representative slices. Although the tumor segmentation is performed in 3-D, but 2-D images are shown for better visualization.
Fig. 6.
Example images of tumor segmentation using BTS. Each row shows the corresponding input MR channels (FLAIR, , and ) and the segmented tumor with the RoI indicated in red.
For DT feature extraction, we consider all tumor bearing slices of the RoI in a volume. The number of hidden states, as per Eq. (12), is set as the half of total slices in the RoI. Based on the LDS pole locations, only the absolute of maximum Eigen values from all three modalities are considered, and these Eigen values are then averaged to obtain the final dynamic feature for the grading task.
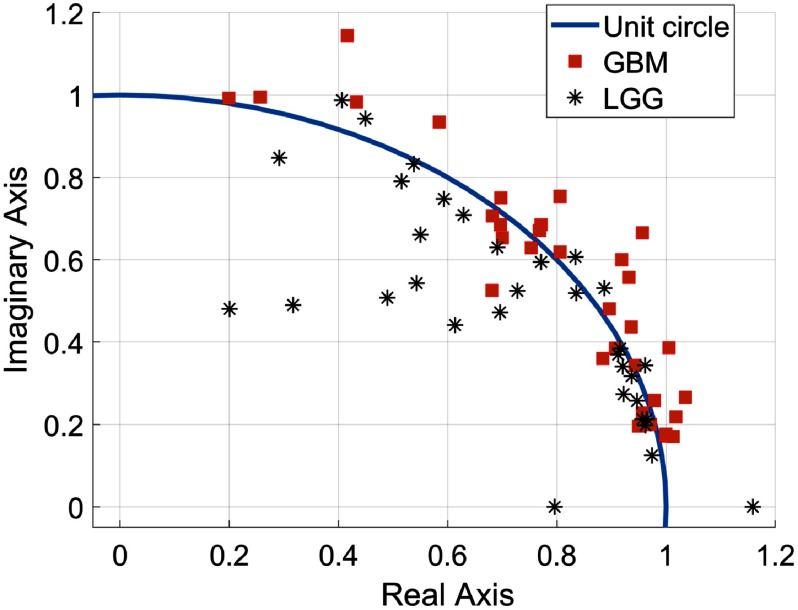
Figure 7 shows that final features of GBM tumors mostly lie outside of the unit circle as GBM tumors usually represent significantly varying textures in MRI slices than that of the LG tumors. Similarly, the MFDFA and mBm features are extracted for each MRI slices in the RoI and only the maximum of the extracted feature values is selected as the final feature for grading. A total of 16 features are extracted from three MRI modalities as follows: () mBm, () MFDFA, and the DT feature ().
Fig. 7.
Pole locations () of GBM and LG patients.
3.2. Cell Nuclei Segmentation and Micro-Anatomical Feature Extraction in DP Images
A key contribution of this study is to demonstrate the efficacy of MR-based noninvasive tumor grading in comparison with invasive grading using DP images. A direct comparison may be possible for the GBM/LG classification between the TCIA dataset and DP images only since the histopathology images are unavailable in the BRATS dataset. Figure 8 shows an example image of the segmented nuclei and the five cluster centroids, which are used as features for tumor grade classification. Although the RoI outlined in the whole slide images is used in this study, only a small part is cropped from the original image for better visualization (see Fig. 8).
Fig. 8.
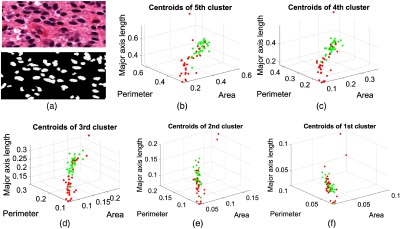
Example images of segmented nuclei and the five cluster centroids of the extracted shape features are used for grading in pathology images. (a) The original pathology image and segmented nuclei, and (b)–(f) five cluster centroids in descending order of the two tumor grades: GBM (red) and LG (green).
4. Results
4.1. Feature Selection and Importance
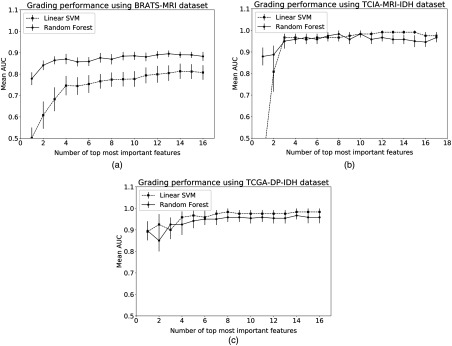
Following the steps in Sec. 2.5, the performance of top most important features is shown in Fig. 9 for three representative experiments and two best performing classifier models. Figure 9 also shows the effect of feature dimension on classifier model performance. The RF model outperforms the linear-SVM for the BRATS dataset, however, the improvement in AUC is not statistically significant () when all radiomics features are included [Fig. 9(a)]. Both MRI-TCIA and DP-TCGA datasets have yielded similar performance with linear-SVM and RF models with no significant difference (). This result can be further explained by individual feature weights or importance scores produced by the classifier models. The classifier model performance reaches a plateau in Fig. 9 after a certain feature dimension indicating that weights of additional features are not adding further value to the classification performance. Table 1 shows the importance scores and rank ordering of MRI radiomics and molecular features using the superior RF classifier model. The overall best molecular feature weight is three times as much as the second best MRI radiomics features (minimum Hurst index and statistically most significant holder, ) from images. Table 2 shows that the perimeter and area of the fourth cluster’s centroids of DP images have high importance scores. Since classifier models show the maximum possible accuracy with all features (Fig. 9), we subsequently consider all-inclusive feature models to statistically compare the classifier performances.
Fig. 9.
Effect of feature dimension on classifier accuracy for (a) the BRATS dataset, (b) the TCIA MRI and IDH datasets, and (c) the TCGA DP-IDH dataset.
Table 1.
Feature importance of proposed MRI radiomics and molecular features obtained using the MRI-TCIA dataset and RF classifier.
| maxHq | minHq | maxHF | SMSH | mBm | ||
|---|---|---|---|---|---|---|
| MRI | Rank | 11 | 11 | 15 | 7 | 7 |
| () | Score | 0.03 | 0.03 | 0.02 | 0.04 | 0.04 |
| MRI | Rank | 5 | 5 | 15 | 7 | 11 |
| (FLAIR) | Score | 0.05 | 0.05 | 0.02 | 0.04 | 0.03 |
| MRI | Rank | 15 | 2 | 11 | 2 | 7 |
| () | Score | 0.02 | 0.09 | 0.03 | 0.09 | 0.04 |
| DT | ||||||
| + FLAIR + | Rank | 4 | ||||
| Score | 0.07 | |||||
| Mutation of IDH | ||||||
| Molecular | Rank | 1 | ||||
| Score | 0.3 | |||||
Note: Hq, Hurst index (min, max); HF, holder function; (max); SMSH, statistically most significant holder; that maximizes .
Table 2.
Feature importance of proposed DP image and molecular features obtained using the DP-TCGA dataset and RF classifier.
| CoC 1 | CoC 2 | CoC 3 | CoC 4 | CoC 5 | ||
|---|---|---|---|---|---|---|
| Area | Rank | 10 | 12 | 6 | 3 | 4 |
| Score | 0.04 | 0.03 | 0.06 | 0.10 | 0.09 | |
| Perimeter | Rank | 10 | 16 | 6 | 1 | 5 |
| Score | 0.04 | 0.02 | 0.06 | 0.18 | 0.07 | |
| Major axis | Rank | 9 | 12 | 12 | 6 | 12 |
| Score | 0.05 | 0.03 | 0.03 | 0.06 | 0.03 | |
| Mutation of IDH | ||||||
| Molecular | Rank | 2 | ||||
| Score | 0.11 | |||||
Note: CoC, centroids of cluster.
4.2. Performance Comparison of Classifier Models
In this study, the datasets have notable imbalance in class ratio. Therefore, there is increased possibility of overfitting the data due to limited sample size. These limitations pose challenge to find a suitable classifier model. Figure 10 shows mean AUC following 10-fold cross-validation for five experiments and four classifier models with all available features. The RF model is clearly the classifier of choice for the BRATS dataset with larger sample size (Fig. 10). Figure 10 also shows that nonlinear classifier models such as SVM-RBF and gradient boost result in poorer classification performance for the MRI-TCIA and DP-TCGA datasets than that of the linear model (linear-SVM). Statistical tests reveal that linear-SVM significantly outperforms () gradient boost and RF classifiers for the MRI-TCIA dataset and the significance of linear-SVM over RF model is at a borderline () for the DP-TCGA-IDH dataset.
Fig. 10.
Performance comparison of different classifier models.
4.3. HG/LG Grading Using BRATS Images
The proposed MRI radiomic features, extracted from BRATS images, yield a mean AUC of in HG versus LG classification using RF classifier model. Additional performance metrics, such as accuracy, sensitivity, specificity, are presented in the first row of Table 3. The quantitative scores in Table 3 are shown using RF classifier for the BRATS dataset and linear-SVM for the other datasets.
Table 3.
Classification performance in grading tumors using datasets of MRI, DP images, and molecular alteration.
| Dataset | No. of patients | Classifiers | Features extracted from | AUC | Accuracy | Sensitivity | Specificity |
|---|---|---|---|---|---|---|---|
| BRATS | HG (210) | RF | MRI | ||||
| LG (75) | |||||||
| TCIA | GBM (24) | Linear-SVM | MRI | ||||
| LG (34) | Linear-SVM | MRI + molecular | |||||
| TCGA | GBM (24) | Linear-SVM | DP | ||||
| LG (34) | Linear-SVM | DP + molecular |
4.4. GBM/LG Grading in MRI and Comparison with DP Grading
The classification of GBM versus LG groups using MR images (TCIA dataset) and DP images (TCGA dataset) of the same 58 patients yields mean AUCs of and , respectively. All other quantitative scores, such as accuracy, sensitivity, and specificity, are shown in the second and fourth rows of Table 3 for MR and DP grading, respectively. The results in Table 3 show that the performance of the proposed MRI radiomics feature-based noninvasive glioma grading is comparable with that of the invasive DP-based classification of GBM versus LG tumors. Additionally, the molecular alteration is also separately added to the MRI and DP pathology image features to perform classification with MRI + molecular and DP + molecular data, respectively (Table 3). The inclusion of molecular information substantially improves the classification performance of MRI and DP image features by yielding mean AUCs of and , respectively.
5. Discussion
This work investigates the efficacy of structural MRI and texture-based radiomic features in tumor grading in comparison with histopathology image and molecular alteration information. The findings of this paper can be summarized as follows. First, the proposed radiomic features extracted from conventional structural MRI have shown competitive tumor grade classification performance for both the BRATS-2017 (AUC: 0.88) and TCIA (AUC: 0.90) datasets. Second, our automatic classification of tumor grades demonstrates that using noninvasive structural MRI (AUC: 0.88 for BRATS-2017, and 0.90 for TCIA) may offer comparable tumor grading performance using the DP images (AUC: 0.93), for the available patient data in this study. Therefore, in case of frequent follow-up procedures, noninvasive structural MRI may be useful for tumor grading before the biopsy is recommended. Third, following the most recent WHO criteria for tumor grading, additional information with molecular alteration along with DP and MRI has yielded 5% and 7% increase for the same TCIA dataset, as shown in Table 3 and Fig. 10, respectively. The accuracy gains suggest that molecular information adds useful complementary information to MR or DP image-based grading.
The importance of molecular feature is further supported by the rank ordering of features in Tables 1 and 2. Notably, the molecular feature ranks as one of the most important features, which is used in the recent WHO grading criteria. In the feature ranking, radiomics features from T1C images have shown higher importance than other features. This observation is intuitive as T1C images show significant texture variation due to the enhancement of the tumor tissues. The high importance of several parameters of the fourth cluster’s centroids suggests that the k-mean clustering group the irregular shaped nuclei in a single cluster that is well suited to characterize the tumor grades. Note that the prevalence of the irregular shaped nuclei in HG/LG is one of the key characteristics for the grading.
We have compared the classification performance of MRI and DP image features using similar patient cohorts from TCIA and TCGA datasets, respectively. However, direct comparisons between our study and previous studies are not possible without having access to advanced MRI data of similar patient cohort, as reported in these studies. Nevertheless, we show the state-of-the-art studies on tumor grading in Table 4 that have used either advanced MRI modalities along with conventional structural MRIs and/or pathology images unlike our study. There is a large variability in the reported accuracy due to small sample size, difference in grading classes, datasets and imaging modalities, and performance metrics. Based on the results obtained in this study, we summarize the limitations of our work below. First, DP images and molecular alteration status are not available for the BRATS-2017 dataset, which does not allow direct comparisons within the same patient cohort. Second, our smaller sample size for DP grading and molecular information, and unbalanced data in the BRATS 2017 dataset may have compromised sensitivity, specificity, and consistency in classifier performance. Limited samples in the dataset may have overfitted with nonlinear classifier models, which are usually known to be superior to linear models. Hence, linear classifier model is recommended for smaller datasets since such model is not flexible enough to overfit the data. The availability of more patient samples with both DP and MR images would help harness the benefits of nonlinear models more efficiently as it is seen with the BRATS dataset. However, the AUC result reported as above is a reliable metric that takes both sensitivity and specificity into account and reports an unbiased result when compared to a simple accuracy metric.
Table 4.
List of state-of-the art glioma grading methods using MRI and DP images.
| Grading using | Study | Classified grades | Dataset | Images used | Reported scores |
|---|---|---|---|---|---|
| MRI | Zacharaki et al.5 | Metastasis/grade-IV, grade II/III/IV | 98 patients | Conventional MR, perfusion | Accuracy (91.2%) |
| Higano et al.9 | GBM/anaplastic astrocytoma | 37 patients | Conventional MR, ADCa | Sensitivity (79%) | |
| Specificity (81%) | |||||
| Emblem et al.30 | HGG/LGM | 29 HGG | Conventional | Sensitivity (90%) | |
| 23 LGG | MR, CBVb | Specificity (83%) | |||
| DP | Barker et al.31 | GBM/LG | 182 GBM, 120 LG | Whole slide | Accuracy (93.1%) |
| Mousavi et al.32 | GBM/LG | 51 GBM, 87 LG | Whole slide | Accuracy (84.7%) |
ADC, apparent diffusion coefficient.
CBV, cerebral blood volume.
6. Conclusions and Future Work
In this study, for the first time in the literature, a fully automatic noninvasive tumor grading method using conventional MRI has been proposed. The proposed noninvasive method has shown efficacy of conventional MR images across multiple datasets in classifying both HG/LG and GBM/LG grades. The conventional MRI and its sophisticated radiomic and DT features have achieved tumor classification performance comparable to that of the advanced MRI in the literature. This suggests that the MRI-based method may be useful in diagnosing the tumor grades before the biopsy is recommended. Further, following the most recent WHO criteria, we demonstrate radiomic and molecular-based glioma grading with the molecular alterations. While the gold standard DP images and molecular information are still superior, the proposed method with structural MRI combined with molecular alterations may offer a logical option in classifying the tumor grades. Finally, the availability of large and balanced dataset of structural MRI may help to develop better classifier models that may be more competitive to DP and molecular patient data for tumor grading in a clinical setting.
Acknowledgments
This work is partially supported through grants funding from HHS | NIH | National Institute of Biomedical Imaging and Bioengineering (NIBIB), Award no. R01EB020683. The work also uses the brain tumor MR image data obtained from the TCIA, BRATS-2013, and BRATS-2017 challenges. Pathology images were collected from TCGA data repository.
Biographies
Syed M. S. Reza is a postdoctoral fellow at CNRM/HJF, National Institute of Health. He earned his BS degree from the Bangladesh University of Engineering and Technology, Dhaka, Bangladesh and his PhD in the area of medical image analysis from Old Dominion University, Virginia, USA. His research focuses on machine learning driven computational modeling for medical image analysis such as segmentation, classification, tracking, and growth prediction of brain lesions, tumors, and traumatic brain injury.
Manar D. Samad received his BS degree from the Bangladesh University of Engineering and Technology, Dhaka, Bangladesh, his MS degree in computer engineering from the University of Calgary, Calgary, Alberta, Canada, and his PhD from Old Dominion University, Norfolk, Virginia, USA. Currently, he is an assistant professor in the Department of Computer Science at Tennessee State University, Nashville, Tennessee, USA. His research interests include machine learning, health informatics, computer vision, and human computer interactions.
Zeina A. Shboul is working on her PhD in electrical and computer engineering at Old Dominion University in Norfolk, Virginia. She received her master’s degree in electrical engineering from Jordan University of Science and Technology in Irbid, Jordan, in 2011 and her bachelor’s degree in electronics engineering from Yarmouk University in Irbid, Jordan, in 2007. Her research interests include tumor segmentation, survival prediction, glioma grading and molecular classification, and gene expression analysis.
Karra A. Jones is a clinical assistant professor of pathology at the University of Iowa. At the University of Kansas School of Medicine, she received both her PhD in anatomic and cell biology and medical degree. She completed an anatomic pathology residency and neuropathology fellowship at the University of California, San Diego and is board certified in AP/Neuropathology from the American Board of Pathology. She practices clinical neuropathology and engages in glioma and neuromuscular disease research.
Khan M. Iftekharuddin is a professor of electrical and computer engineering and an associate dean for research in the Batten College of Engineering at Old Dominion University (ODU). He serves as the director of ODU Vision Lab. His research interests include machine learning and computational modeling, stochastic medical image analysis, automatic target recognition and biologically inspired human and machine centric learning. He is a fellow of SPIE and a senior member of both IEEE and OSA.
Disclosures
No conflicts of interests, financial or otherwise, are declared by the authors.
References
- 1.Louis D. N., et al. , “The 2016 world health organization classification of tumors of the central nervous system: a summary,” Acta Neuropathol. 131(6), 803–820 (2016). 10.1007/s00401-016-1545-1 [DOI] [PubMed] [Google Scholar]
- 2.Hartmann C., et al. , “Patients with IDH1 wild type anaplastic astrocytomas exhibit worse prognosis than IDH1-mutated glioblastomas, and IDH1 mutation status accounts for the unfavorable prognostic effect of higher age: implications for classification of gliomas,” Acta Neuropathol. 120(6), 707–718 (2010). 10.1007/s00401-010-0781-z [DOI] [PubMed] [Google Scholar]
- 3.Leeper H. E., et al. , “IDH mutation, 1p19q codeletion and ATRX loss in who grade ii gliomas,” Oncotarget 6(30), 30295 (2015). 10.18632/oncotarget.v6i30 [DOI] [PMC free article] [PubMed] [Google Scholar]
- 4.Hadziahmetovic M., Shirai K., Chakravarti A., “Recent advancements in multimodality treatment of gliomas,” Future Oncol. (Lond., Engl.) 7(10), 1169–1183 (2011). 10.2217/fon.11.102 [DOI] [PMC free article] [PubMed] [Google Scholar]
- 5.Zacharaki E. I., et al. , “Classification of brain tumor type and grade using MRI texture and shape in a machine learning scheme,” Magn. Reson. Med. 62(6), 1609–1618 (2009). 10.1002/mrm.v62:6 [DOI] [PMC free article] [PubMed] [Google Scholar]
- 6.Weber M. A., et al. , “Diagnostic performance of spectroscopic and perfusion MRI for distinction of brain tumors,” Neurology 66(12), 1899–1906 (2006). 10.1212/01.wnl.0000219767.49705.9c [DOI] [PubMed] [Google Scholar]
- 7.Provenzale J. M., Mukundan S., Barboriak D. P., “Diffusion-weighted and perfusion MR imaging for brain tumor characterization and assessment of treatment response,” Radiology 239(3), 632–649 (2006). 10.1148/radiol.2393042031 [DOI] [PubMed] [Google Scholar]
- 8.Wang Q., et al. , “Classification of brain tumors using MRI and MRS data,” Proc. SPIE 6514(Pt 1), 65140S (2007). 10.1117/12.713544 [DOI] [Google Scholar]
- 9.Higano S., et al. , “Malignant astrocytic tumors: clinical importance of apparent diffusion coefficient in prediction of grade and prognosis,” Radiology 241(3), 839–846 (2006). 10.1148/radiol.2413051276 [DOI] [PubMed] [Google Scholar]
- 10.Leung T., Malik J., “Representing and recognizing the visual appearance of materials using three-dimensional textons,” Int. J. Comput. Vision 43(1), 29–44 (2001). 10.1023/A:1011126920638 [DOI] [Google Scholar]
- 11.Caulo M., et al. , “Data-driven grading of brain gliomas: a multiparametric MR imaging study,” Radiology 272(2), 494–503 (2014). 10.1148/radiol.14132040 [DOI] [PubMed] [Google Scholar]
- 12.Reza S. M. S., Mays R., Iftekharuddin K. M., “Multi-fractal detrended texture feature for brain tumor classification,” Proc. SPIE, 9414, 941410 (2015). 10.1117/12.2083596 [DOI] [PMC free article] [PubMed] [Google Scholar]
- 13.Reza S. M. S., Iftekharuddin K. M., “Multi-class abnormal brain tissue segmentation using texture features,” in Proc. MICCAI-BRATS, pp. 38–42 (2013). [Google Scholar]
- 14.Menze B. H., et al. , “The multimodal brain tumor image segmentation benchmark (BRATS),” IEEE Trans. Med. Imaging 34(10), 1993–2024 (2015). 10.1109/TMI.2014.2377694 [DOI] [PMC free article] [PubMed] [Google Scholar]
- 15.Bakas S., et al. , “Advancing the cancer genome atlas glioma MRI collections with expert segmentation labels and radiomic features,” Sci. Data 4, 170117 (2017). 10.1038/sdata.2017.117 [DOI] [PMC free article] [PubMed] [Google Scholar]
- 16.Menze, et al. , “BRATS-SICAS medical image repository,” https://www.smir.ch/BRATS/StaticResults2013 (07 April 2019).
- 17.Maier O., et al. , “ISLES 2015-A public evaluation benchmark for ischemic stroke lesion segmentation from multispectral MRI,” Med. Image Anal. 35, 250–269 (2017). 10.1016/j.media.2016.07.009 [DOI] [PMC free article] [PubMed] [Google Scholar]
- 18.Islam A., Reza S. M. S., Iftekharuddin K. M., “Multifractal texture estimation for detection and segmentation of brain tumors,” IEEE Trans. Biomed. Eng. 60(11), 3204–3215 (2013). 10.1109/TBME.2013.2271383 [DOI] [PMC free article] [PubMed] [Google Scholar]
- 19.Reza S. M. S., Islam A., Iftekharuddin K. M., Texture Estimation for Abnormal Tissue Segmentation in Brain MRI, Springer New York, New York, pp. 333–349 (2016). [DOI] [PubMed] [Google Scholar]
- 20.Reza S. M., Pei L., Iftekharuddin K., “Ischemic stroke lesion segmentation using local gradient and texture features,” in Ischemic Stroke Lesion Segmentation, Munich, Germany: (2015). [Google Scholar]
- 21.Gu G.-F., Zhou W.-X., “Detrended fluctuation analysis for fractals and multifractals in higher dimensions,” Phys. Rev. E 74, 061104 (2006). 10.1103/PhysRevE.74.061104 [DOI] [PubMed] [Google Scholar]
- 22.Kantelhardt J. W., et al. , “Multifractal detrended fluctuation analysis of nonstationary time series,” Phys. A: Stat. Mech. Appl. 316(1–4), 87–114 (2002). 10.1016/S0378-4371(02)01383-3 [DOI] [Google Scholar]
- 23.Soares F., et al. , “Self-similarity analysis applied to 2D breast cancer imaging,” in 2nd Int. Conf. Syst. and Networks Commun., ICSNC 2007 (2007). [Google Scholar]
- 24.“The cancer imaging archive (TCIA)–A growing archive of medical images of cancer,” https://www.cancerimagingarchive.net/ (07 April 2019).
- 25.Doretto G., Soatto S., “Editable dynamic textures,” in Proc. IEEE Comput. Soc. Conf. Comput. Vision and Pattern Recognit., Vol. 2, p. II–137–42 (2003). 10.1109/CVPR.2003.1211463 [DOI] [Google Scholar]
- 26.Saisan P., Doretto G., Soatto S., “Dynamic texture recognition,” in Proc. 2001 IEEE Comput. Soc. Conf. Comput. Vision and Pattern Recognit., CVPR 2001, Vol. 2, pp. II–58–II–63 (2001). [Google Scholar]
- 27.Doretto G., et al. , “Dynamic textures,” Int. J. Comput. Vision 51(2), 91–109 (2003). 10.1023/A:1021669406132 [DOI] [Google Scholar]
- 28.Yuan L., et al. , “Synthesizing dynamic texture with closed-loop linear dynamic system,” Lect. Notes Comput. Sci. 3022, 603–616 (2004). 10.1007/b97866 [DOI] [Google Scholar]
- 29.Reza S. M. S., Iftekharuddin K. M., “Glioma grading using cell nuclei morphologic features in digital pathology images,” Proc. SPIE 9785, 97852U (2016). 10.1117/12.2217559 [DOI] [PMC free article] [PubMed] [Google Scholar]
- 30.Emblem K. E., et al. , “Glioma grading by using histogram analysis of blood volume heterogeneity from mr-derived cerebral blood volume maps,” Radiology 247(3), 808–817 (2008). 10.1148/radiol.2473070571 [DOI] [PubMed] [Google Scholar]
- 31.Barker J., et al. , “Automated classification of brain tumor type in whole-slide digital pathology images using local representative tiles,” Med. Image Anal. 30, 60–71 (2016). 10.1016/j.media.2015.12.002 [DOI] [PubMed] [Google Scholar]
- 32.Mousavi H. S., et al. , “Automated discrimination of lower and higher grade gliomas based on histopathological image analysis,” J. Pathol. Inf. 6, 15 (2015). 10.4103/2153-3539.153914 [DOI] [PMC free article] [PubMed] [Google Scholar]


