

Abstract
Background
The prevalence of disease‐related malnutrition in Western European hospitals is estimated to be about 30%. There is no consensus whether poor nutritional status causes poorer clinical outcome or if it is merely associated with it. The intention with all forms of nutrition support is to increase uptake of essential nutrients and improve clinical outcome. Previous reviews have shown conflicting results with regard to the effects of nutrition support.
Objectives
To assess the benefits and harms of nutrition support versus no intervention, treatment as usual, or placebo in hospitalised adults at nutritional risk.
Search methods
We searched Cochrane Central Register of Controlled Trials (CENTRAL) in the Cochrane Library, MEDLINE (Ovid SP), Embase (Ovid SP), LILACS (BIREME), and Science Citation Index Expanded (Web of Science). We also searched the World Health Organization International Clinical Trials Registry Platform (www.who.int/ictrp); ClinicalTrials.gov; Turning Research Into Practice (TRIP); Google Scholar; and BIOSIS, as well as relevant bibliographies of review articles and personal files. All searches are current to February 2016.
Selection criteria
We include randomised clinical trials, irrespective of publication type, publication date, and language, comparing nutrition support versus control in hospitalised adults at nutritional risk. We exclude trials assessing non‐standard nutrition support.
Data collection and analysis
We used standard methodological procedures expected by Cochrane and the Cochrane Hepato‐Biliary Group. We used trial domains to assess the risks of systematic error (bias). We conducted Trial Sequential Analyses to control for the risks of random errors. We considered a P value of 0.025 or less as statistically significant. We used GRADE methodology. Our primary outcomes were all‐cause mortality, serious adverse events, and health‐related quality of life.
Main results
We included 244 randomised clinical trials with 28,619 participants that met our inclusion criteria. We considered all trials to be at high risk of bias. Two trials accounted for one‐third of all included participants. The included participants were heterogenous with regard to disease (20 different medical specialties). The experimental interventions were parenteral nutrition (86 trials); enteral nutrition (tube‐feeding) (80 trials); oral nutrition support (55 trials); mixed experimental intervention (12 trials); general nutrition support (9 trials); and fortified food (2 trials). The control interventions were treatment as usual (122 trials); no intervention (107 trials); and placebo (15 trials). In 204/244 trials, the intervention lasted three days or more.
We found no evidence of a difference between nutrition support and control for short‐term mortality (end of intervention). The absolute risk was 8.3% across the control groups compared with 7.8% (7.1% to 8.5%) in the intervention groups, based on the risk ratio (RR) of 0.94 (95% confidence interval (CI) 0.86 to 1.03, P = 0.16, 21,758 participants, 114 trials, low quality of evidence). We found no evidence of a difference between nutrition support and control for long‐term mortality (maximum follow‐up). The absolute risk was 13.2% in the control group compared with 12.2% (11.6% to 13%) following nutritional interventions based on a RR of 0.93 (95% CI 0.88 to 0.99, P = 0.03, 23,170 participants, 127 trials, low quality of evidence). Trial Sequential Analysis showed we only had enough information to assess a risk ratio reduction of approximately 10% or more. A risk ratio reduction of 10% or more could be rejected.
We found no evidence of a difference between nutrition support and control for short‐term serious adverse events. The absolute risk was 9.9% in the control groups versus 9.2% (8.5% to 10%), with nutrition based on the RR of 0.93 (95% CI 0.86 to 1.01, P = 0.07, 22,087 participants, 123 trials, low quality of evidence). At long‐term follow‐up, the reduction in the risk of serious adverse events was 1.5%, from 15.2% in control groups to 13.8% (12.9% to 14.7%) following nutritional support (RR 0.91, 95% CI 0.85 to 0.97, P = 0.004, 23,413 participants, 137 trials, low quality of evidence). However, the Trial Sequential Analysis showed we only had enough information to assess a risk ratio reduction of approximately 10% or more. A risk ratio reduction of 10% or more could be rejected.
Trial Sequential Analysis of enteral nutrition alone showed that enteral nutrition might reduce serious adverse events at maximum follow‐up in people with different diseases. We could find no beneficial effect of oral nutrition support or parenteral nutrition support on all‐cause mortality and serious adverse events in any subgroup.
Only 16 trials assessed health‐related quality of life. We performed a meta‐analysis of two trials reporting EuroQoL utility score at long‐term follow‐up and found very low quality of evidence for effects of nutritional support on quality of life (mean difference (MD) ‐0.01, 95% CI ‐0.03 to 0.01; 3961 participants, two trials). Trial Sequential Analyses showed that we did not have enough information to confirm or reject clinically relevant intervention effects on quality of life.
Nutrition support may increase weight at short‐term follow‐up (MD 1.32 kg, 95% CI 0.65 to 2.00, 5445 participants, 68 trials, very low quality of evidence).
Authors' conclusions
There is low‐quality evidence for the effects of nutrition support on mortality and serious adverse events. Based on the results of our review, it does not appear to lead to a risk ratio reduction of approximately 10% or more in either all‐cause mortality or serious adverse events at short‐term and long‐term follow‐up.
There is very low‐quality evidence for an increase in weight with nutrition support at the end of treatment in hospitalised adults determined to be at nutritional risk. The effects of nutrition support on all remaining outcomes are unclear.
Despite the clinically heterogenous population and the high risk of bias of all included trials, our analyses showed limited signs of statistical heterogeneity. Further trials may be warranted, assessing enteral nutrition (tube‐feeding) for different patient groups. Future trials ought to be conducted with low risks of systematic errors and low risks of random errors, and they also ought to assess health‐related quality of life.
Plain language summary
Feeding support in hospitalised adults at risk of undernourishment
Review question
We reviewed the benefits and harms of feeding support given to adults in hospital at risk of undernourishment based on different methods, ranging from the formally‐validated to ‘according to the opinion' of the trial investigators.
Background
People who are malnourished when they are admitted to hospital might be at increased risk of death or are more likely to experience a serous complication. Delivering feeding support might help them, although being malnourished may be associated with a severe underlying disease. In this case, specific interventions aimed at improving their nutritional status would not help, as it would not be the poor nutritional status in itself that caused the increased risk of death or of experiencing a serious harm.
Date of search Feburary 2016.
Study characteristics
We included 244 trials, with 28,619 participants. The included trials assessed the effects of different kinds of nutrition support (i.e. dietary advice, enriching regular food with extra protein and calories, protein shakes, feeding through a catheter directly into a vein or through a tube directly into the stomach or gut). The nutrition support was provided to people in the trial who were ill with many different types of diseases and undergoing different procedures. What they all had in common was that they were at risk by at least one measure, including the trialists' clinical opinion.
Key results
We found no evidence of a difference between nutrition support and control for risk of death. We found that 8.3% people died at short‐term follow‐up in the control groups compared with 7.8% in those who had been given nutritional support (low quality of evidence). At the longest point of follow‐up 13.2% people in the control groups died compared with 12.2% in those who had been given nutritional support (low quality of evidence). We found no evidence of a difference between nutrition support and control for risk of a serious complications in the short term. People in the control groups had a serious complication rate of 9.9% at short‐term follow‐up compared with 9.2% with nutrition (low quality of evidence). At long‐term follow‐up 15.2% of people in the control groups had a serious complication compared with 13.8% in the nutrition groups (low quality of evidence). These results are based on just over 21,000 participants. Nutrition may increase weight by about 1.32 kg compared with people in the control groups. The increase in weight of 1.32 kg on average is of uncertain benefit. We could not reliably assess the effects on quality of life due to the variation in the reporting of this information. When we looked at the different types of nutrition support, a secondary analysis suggested that tube‐feeding might be beneficial, reducing serious complications at maximum follow‐up, but the strength of this finding is low.
Quality of the evidence
The evidence for our conclusions is of low quality for death and serious complications, and very low quality for weight. All trials had a high risk of bias (i.e. the trials were all conducted in a way that may overestimate the benefits and underestimate the harms of nutrition support). The results were consistent for death and serious complications, but there was a high level of variation in the effects on weight across the studies.
Summary of findings
Summary of findings for the main comparison. Nutrition support versus no intervention, placebo, or treatment as usual in hospitalised adults at nutritional risk.
| Nutrition support versus no intervention, placebo, or treatment as usual in hospitalised adults at nutritional risk | ||||||
| Patient or population: hospitalised adults at nutritional risk Setting: hospital Intervention: nutrition support Comparison: no intervention, placebo, or treatment as usual | ||||||
| Outcomes | Anticipated absolute effects* (95% CI) | Relative effect (95% CI) | № of participants (studies) | Quality of the evidence (GRADE) | Comments | |
| Risk with no intervention, placebo, or treatment‐as‐usual | Risk with nutrition support | |||||
| All‐cause mortality | ||||||
| ‐ at end of intervention | Study population | RR 0.94 (0.86 to 1.03) | 21,758 (114 RCTs) | ⊕⊕⊝⊝ LOW 1 | Trial Sequential Analysis of all nutrition support trials shows that the futility area is reached. This leads us to conclude that the possible intervention effect, if any, is less than 11%. Multiple eligible treatments were used in 9 trials generating a further 13 comparisons (= 127 studies). | |
| 83 per 1.000 | 78 per 1.000 (71 to 85) | |||||
| ‐ at maximum follow‐up | Study population | RR 0.93 (0.88 to 0.99) | 23170 (127 RCTs) | ⊕⊕⊝⊝ LOW 1 | Trial Sequential Analysis of all nutrition support trials shows that the futility area is reached. This leads us to conclude that any possible intervention effect, if any, is less than 10%. Multiple eligible treatments were used in 10 trials generating a further 14 comparisons (= 141 studies). | |
| 132 per 1.000 | 122 per 1.000 (116 to 130) | |||||
| Serious adverse events | ||||||
| ‐ at end of intervention | Study population | RR 0.93 (0.86 to 1.01) | 22,087 (123 RCTs) | ⊕⊕⊝⊝ LOW 1 | Trial Sequential Analysis of all nutrition support trials shows that the futility area is reached. This leads us to conclude that any possible intervention effect, if any, is less than 11%. Multiple eligible treatments were used in 10 trials generating a further 14 comparisons (= 137 studies). | |
| 99 per 1.000 | 92 per 1.000 (85 to 100) | |||||
| at maximum follow‐up | Study population | RR 0.91 (0.85 to 0.97) | 23,413 (137 RCTs) | ⊕⊕⊝⊝ LOW 1 | Trial Sequential Analysis of all nutrition support trials shows that the futility area is reached. This leads us to conclude that any possible intervention effect, if any, is less than 10%. Multiple eligible treatments were used in 11 trials generating a further 15 comparisons (= 152 studies). | |
| 152 per 1.000 | 138 per 1.000 (129 to 147) | |||||
| Health‐related quality of life | ||||||
| ‐at end of intervention | We found that nutrition support of any type for participants at nutritional risk (defined by our inclusion criteria, including as defined by the trial investigators) did not show any benefit or harm with regard to quality of life at end of intervention or at maximum follow‐up. Few trials used similar quality‐of‐life questionnaires, and only data from EuroQoL utility score and SF‐36 could be used in a meta‐analysis. Whichever score was used, we found no beneficial or harmful effects. While most trials found no beneficial or harmful effect of nutrition support, only a few trials found a beneficial effect on specific parameters. All included trials assessing health‐related quality of life were at high risk of bias. | ‐ | (16 RCTs) | ‐ | ||
| at maximum follow‐up ((EuroQol) ) | Control group mean quality of life scores were 0.486 and 0.175. | Quality of life was on average 0.01 units lower (0.03 lower to 0.01 higher) | ‐ | 3961 (2 RCTs) | ⊕⊝⊝⊝ VERY LOW 2 | |
| Weight at the end of intervention | Control group weight ranged from 45.9 to 73.03 kg | MD 1.32 kg higher (0.65 higher to 2 higher) | ‐ | 5445 (68 RCTs) | ⊕⊝⊝⊝ VERY LOW 3 | |
| *The risk in the intervention group (and its 95% confidence interval) is based on the assumed risk in the comparison group and the relative effect of the intervention (and its 95% CI). CI: Confidence interval; RR: Risk ratio; MD: mean difference | ||||||
| GRADE Working Group grades of evidence High quality: We are very confident that the true effect lies close to that of the estimate of the effect Moderate quality: We are moderately confident in the effect estimate: The true effect is likely to be close to the estimate of the effect, but there is a possibility that it is substantially different Low quality: Our confidence in the effect estimate is limited: The true effect may be substantially different from the estimate of the effect Very low quality: We have very little confidence in the effect estimate: The true effect is likely to be substantially different from the estimate of effect | ||||||
1Downgraded by 2 levels because of a very serious risk of bias. 2Downgraded by 4 levels because of a very serious risk of bias (2 levels), and serious inconsistency of the evidence (2 levels). 3Downgraded by 3 levels because of a very serious risk of bias and serious inconsistency.
Background
Description of the condition
The prevalence of disease‐related malnutrition in Western European hospitals is estimated to be about 30% (Norman 2008a). To date, there is no consensus whether poor nutritional status causes poorer clinical outcome or if it is merely associated with it. A poor nutritional status might be a consequence of the underlying disease rather than a cause of poor clinical outcome.
The aetiology of malnutrition may be divided into three entities: 1. insufficient delivery of nutrients that may be due to low consumption, low absorption of nutrients through the gastrointestinal tract, failure to use the absorbed nutrients, or an increase in excretion of nutrients which may be termed starvation‐related malnutrition; 2. increased catabolism that may be due to an underlying chronic disease or a consequent treatment which may be termed chronic disease‐related malnutrition; 3. acute disease or injury states with marked inflammatory response (such as major infections, burn, and trauma) (Jensen 2010). It may be that provision of nutrition support may benefit people with starvation‐related malnutrition and not benefit adults with chronic disease‐related malnutrition. The many adverse outcomes associated with malnutrition include malfunctioning of the immune system, impaired wound healing, muscle wasting, longer lengths of hospital stay, higher treatment costs, and increased mortality (Barker 2011).
Many screening tools, anthropometric measurements, biomarkers, and conditions have been proposed to identify people at nutritional risk. Three of the main screening tools devised are the Nutritional Risk Screening 2002 (NRS 2002) (Kondrup 2003), the Malnutrition Universal Screening Tool (MUST) (Elia 2003), and the Mini Nutritional Assessment (MNA) (Vellas 1999). The Subjective Global Assessment (SGA) (Detsky 1987) is an assessment tool that aims at predicting clinical outcome (Van Bokhorst 2014). The NRS, MUST, and MNA screening tools do not distinguish between being at risk of malnutrition and being malnourished, whereas the SGA aims only at identifying people who are malnourished. Although not entirely similar, the screening tools, including the SGA, use many of the same questions and focus on identifying 'people at nutritional risk'.
The screening tools look at two aspects of being at nutritional risk. The first aspect is whether the person is currently malnourished, and the second is whether the person might become malnourished in the future. Body mass index (BMI), weight loss during the last three or six months, and food intake during the last week are all variables assessed when determining if a person is currently malnourished. The assumption that a person might become malnourished in the future is based on an association between certain conditions and nutritional requirements. The mechanism of action is thought to be a high rate of catabolism either directly associated with the condition or the consequent treatment leading to an increased protein requirement. A low intake of food might contribute. Examples of such conditions and interventions are open major abdominal surgery (Morlion 1998); stroke (Chalela 2004); severe infections, defined as sepsis with organ dysfunction (Shaw 1987); people in intensive care units with organ failure (Larsson 1990b); and sick elderly people (Hickson 2006; Norman 2008a). In these conditions, the protein requirement to maintain nitrogen balance, if possible at all, is approximately 1.2 g/kg a day or more.
Biomarkers and anthropometric measures have also been used to define nutritional risk (Van Bokhorst 2014). The biomarkers include low levels of albumin, low levels of other plasma proteins, and low lymphocyte counts (Van Bokhorst 2014). It is questionable if the biomarkers are directly related to being at nutritional risk (Van Bokhorst 2014). The anthropometric measures include, in addition to body weight and height or BMI, triceps skinfold and arm muscle circumference.
Description of the intervention
The intention with all forms of nutrition support is to increase uptake of essential nutrients. The nutrition support can come in many different forms.
The five main ways of administration may be classified as 'general nutrition support', 'fortified foods', 'oral nutrition supplements', 'enteral nutrition', and 'parenteral nutrition' (Lochs 2006). 'General nutrition support' aims at increasing normal food consumption. It includes, but is not limited to, dietary counselling and usually involves an estimation of the person's requirements and guidance of the person as to which food items might be suitable. 'Fortified foods' are normal food enriched with specific nutrients, in particular with energy and proteins with or without additional vitamins, minerals, and trace elements (Lochs 2006). 'Oral nutrition supplements' are supplementary oral intake of food for special medical purposes in addition to the normal food, but may replace normal oral intake entirely. Oral nutrition supplements are usually liquid, but they are also available in other forms such as powder, dessert‐style, or bars (Lochs 2006). 'Enteral nutrition' is the infusion of a standard liquid formulation through a tube into either the stomach or the small intestine. 'Parenteral nutrition' is intravenous fluids containing both a source of nitrogen and a non‐protein calorie source as well as all essential nutrients.
One special type of nutrition support is immuno‐nutrition which contains nutrients believed to possess specific properties (e.g. immune‐modulating). Examples of such nutrients are enhanced amounts of glutamine, arginine, fish oil, and branched chain amino acids‐enriched formulas (Calder 2003; Tan 2014).
How the intervention might work
Being nutritionally at risk consists of two complex components (see Description of the condition). The result is that the cells and organs of the body are thought to function sub‐optimally. The main focus of nutrition support is to provide essential nutrients in order to preserve or restore normal functions of a variety of cells and organs, which might improve clinical outcomes (i.e. fewer complications, fewer infections, earlier mobilisation), and improved quality of life (Stratton 2003).
Why it is important to do this review
The prevalence of disease‐related malnutrition in hospitals is considerable. A substantial disease burden and healthcare cost can be alleviated by nutrition support if it is effective and, reciprocally, a considerable cost and a number of complications associated with nutrition support may occur if it is ineffective or even harmful.
One meta‐analysis from 2003 analysing randomised clinical trials of enteral nutrition (tube‐feeding or oral supplements) found a 50% reduction in complications when trials including diverse participant groups were aggregated in a single analysis (Stratton 2003). However, this analysis did not assess the risks of bias in the included trials. One systematic review assessing the effect of enteral or oral nutrition support versus untreated controls assessed risk of bias in the included trials in terms of allocation concealment and blinding (Koretz 2007). However, this review did not assess incomplete outcome data, selective outcome reporting, or for‐profit bias (Chan 2004; Higgins 2011; Lundh 2017). In spite of these caveats, this systematic review showed that oral nutrition support did not seem to benefit any subgroup of people except geriatric participants (Koretz 2007). There was no aggregated analysis of all the trials (Higgins 2011). Another meta‐analysis looked at adults having abdominal surgery (Stratton 2007). Despite the fact that both Koretz 2007 and Stratton 2007 included people having abdominal surgery they reached opposing conclusions. The first meta‐analysis showed no benefit of enteral nutrition in people having abdominal surgery for total complications nor for mortality. The second meta‐analysis showed benefit of both oral and enteral nutrition support. Yet another systematic review assessed the effects of parenteral nutrition support versus no nutrient intake (Koretz 2001). This review concluded that there were not enough data to assess whether parenteral nutrition had any effect in people being either severely malnourished or with a high rate of catabolism (i.e. in people at nutritional risk). The overall results showed no significant beneficial effect of parenteral nutrition, except in a subgroup assessing preoperative participants (Koretz 2001). One more recent systematic review and meta‐analysis looking at enteral nutrition for people in intensive care units concluded that only trials with a high risk of bias showed reduced mortality (Koretz 2014). A meta‐analysis including malnourished medical inpatients found no effect on clinical outcomes such as mortality or infection, but found that nutrition support increased weight (Bally 2016).
Nutrition support might have beneficial effects in adults at risk of malnutrition, but previous meta‐analyses have shown conflicting results (Stratton 2003; Koretz 2007; Stratton 2007; Koretz 2014; Bally 2016) and they have not exclusively included participants with an indication for nutrition support (Koretz 2007). No prior systematic review has been conducted that fully takes into account the risk of systematic errors due to bias, the risks of design errors, and risks of random errors ('play of chance') (Keus 2010; Garattini 2016). We chose to focus on hospitalised adults with malnutrition or at risk of malnutrition because this population seemed to have the largest potential to benefit from nutrition support.
Objectives
To assess the benefits and harms of nutrition support versus no intervention, treatment as usual, or placebo in hospitalised adults at nutritional risk.
Methods
Criteria for considering studies for this review
Types of studies
We included all randomised clinical trials, irrespective of publication type, publication status, publication date, and language. We excluded cluster‐randomised and quasi‐randomised studies. In line with our protocol, we plan to assess observational data of harms in a separate review.
Types of participants
Adult participants, defined as people of 18 or more years of age, hospitalised at the beginning of the intervention period, and fulfilling one or more of the following inclusion criteria and none of the exclusion criteria:
Inclusion criteria
Participants characterised as at nutritional risk according to the NRS 2002, MUST, MNA, or SGA criteria (see Background).
Participants characterised as at least moderately at risk of malnutrition according to the screening tool NRS 2002 (i.e. BMI less than 20.5 kg/m2, weight loss of at least 5% during the last three months, weight loss of at least 10% during the last six months, or insufficient food intake during the last week (50% of requirement or less) (Kondrup 2003)).
Participants theoretically known to be at nutritional risk either due to increased nutritional requirements or decreased food intake. We accepted the following conditions and procedures: major surgery such as open abdominal (liver, pancreas, gastro‐oesophageal, small intestine, colorectal) surgery; stroke; adults in intensive care units; adults with severe infections, and frail elderly people (defined by trialists) with pulmonary disease, oncology, or minor surgery (e.g. hip fracture) (Shaw 1987; Larsson 1990b; Morlion 1998; Chalela 2004; Norman 2008a).
Participants characterised as nutritionally at risk due to surrogate biomarkers such as low levels of albumin, low levels of other plasma proteins, or low lymphocyte counts or anthropometric markers (BMI, triceps skinfold, arm muscle circumference).
Participants characterised by the trialists as malnourished, undernourished, at nutritional risk, or similar terms, using a classification not mentioned above.
Participants characterised by the trialists as malnourished, undernourished, at nutritional risk, or similar terms, without specifying how this classification was made.
Exclusion criteria
Children or adolescents.
Pregnant or lactating women.
People receiving dialysis.
Traditionally, trials with participants below 18 years old, pregnant and lactating women, and participants receiving dialysis are investigated in separate reviews. We therefore did not include trials with such participants in this systematic review. If trials contained a mix of participants planned by our protocol to be excluded and included, we contacted authors for specific data for the participants we planned to include. We excluded trials when we did not receive data on the relevant trial participants, noting the reason for our exclusion.
Types of interventions
Nutrition support (experimental group)
We accepted any intervention that the trialists defined as nutrition support or similar terms. As mentioned in the Description of the intervention (Background), nutrition support may include general nutrition support, fortified foods, oral supplements, enteral nutrition, and parenteral nutrition.
We did not include the following interventions: immuno‐nutrition, elemental diets, glutamine only as the primary intervention, micronutrients only, or similar non‐standard nutrition support interventions (i.e. modified in a way intended to provide other properties than the purely nutritional).
Control group
We defined 'no intervention', placebo, or 'treatment as usual' as control interventions. We classified the control intervention as 'no intervention' if the control group received no intervention other than a co‐intervention, planned to be delivered similarly to both the experimental and control groups. 'Treatment as usual' referred to any type of non‐specific supportive intervention such as 'treatment as usual', 'standard care', or 'clinical management' as control interventions (Jakobsen 2011). We did not accept enteral nutrition and parenteral nutrition (unless the parenteral nutrition was standard fluids 5% to 10% glucose/dextrose) as control interventions.
Co‐interventions
We allowed co‐interventions, but only if a co‐intervention was intended to be delivered similarly to both the experimental group and the control group (Jakobsen 2013).
Types of outcome measures
Primary outcomes
All‐cause mortality.
Serious adverse events. We used the International Conference on Harmonisation (ICH) Guidelines for Good Clinical Practice's definition of a serious adverse event (ICH‐GCP 1997), that is, any untoward medical occurrence that results in death, is life‐threatening, requires hospitalisation or prolongation of existing hospitalisation, or results in persistent or significant disability or incapacity, or is a congenital anomaly or birth defect. In contrast to the term 'adverse reaction', the serious adverse events do not have to be related to the intervention.
Health‐related quality of life measured on any validated scale, such as the 36‐item Short Form (SF‐36) (Ware 1992) (continuous outcome).
Secondary outcomes
Time to death (survival data).
Morbidity (as defined by the trialists) (dichotomous outcome). If trial investigators did not use the term 'morbidity', we did not include these data within our analysis outcome.
BMI (continuous outcome).
Weight (continuous outcome).
Hand‐grip strength (continuous outcome).
Six‐minute walking distance (continuous outcome).
We estimated all continuous and dichotomous outcomes at two time points: at the end of the trial intervention period as defined by the trialists (the most important outcome measure time point in this review) and at maximum follow‐up.
Search methods for identification of studies
Electronic searches
We searched Cochrane Central Register of Controlled Trials (CENTRAL) in the Cochrane Library, MEDLINE (Ovid SP), Embase (Ovid SP), LILACS (BIREME), BIOSIS (Web of Science) and Science Citation Index Expanded (Web of Science) (Royle 2003), from conception till February 2016, in order to identify relevant trials. The search strategies with the time spans of the searches are given in Appendix 1. We also searched the World Health Organization International Clinical Trials Registry Platform (www.who.int/ictrp); clinicaltrials.gov; Turning Research Into Practice (TRIP); and Google Scholar.
Searching other resources
We identified and included where relevant the bibliographies of review articles and identified trials by searching personal files. We also looked through conference proceedings from the American Society for Parenteral and Enteral Nutrition and the European Society for Parenteral and Enteral Nutrition meetings. We also contacted pharmaceutical companies (Abbott Nutrition, Nutricia Research, Fresenius Kabi, Bioscrip, Novartis, Nestlé, GlaxoSmithKline plc, Bristol‐Meyer‐Squibb, Ross Laboratories, ThriveRx, and New England Life Care) as well as national nutrition industry collaborations (please see Appendix 2).
Data collection and analysis
We performed the review following the Cochrane Handbook for Systematic Reviews of Interventions (Higgins 2011) and the Cochrane Hepato‐Biliary Group Module (Gluud 2016). We performed the analyses using Review Manager 5 (RevMan 2014), STATA 13 (Stata 2013), and Trial Sequential Analysis (Thorlund 2011; TSA 2011).
Selection of studies
We divided the work of evaluating the identified trials among 16 review authors. Two independent review authors evaluated each trial. If one identified the trial as relevant but the other did not, the two review authors discussed the reasoning behind their decision. If they still disagreed, a third review author (JCJ) resolved the issue.
Data extraction and management
Two review authors independently extracted and validated data using data extraction forms that were designed for the purpose. The two review authors discussed any disagreement concerning the extracted data. If they still disagreed, a third review author (JCJ) resolved the issue. In case of relevant data not being available, we attempted to contact the trial authors. All articles were data‐extracted by review authors who spoke the language fluently.
Assessment of risk of bias in included studies
Because of the risk of overestimation of beneficial intervention effects in randomised clinical trials with unclear or inadequate methodological quality (Schulz 1995; Moher 1998; Sutton 2000; Kjaergard 2001; Gluud 2006; Wood 2008; Hrobjartsson 2012; Lundh 2017; Savović 2012a; Savović 2012b; Hrobjartsson 2013; Hrobjartsson 2014a; Hrobjartsson 2014b), two review authors independently assessed the risks of bias for each trial and outcome. We used the following domains: allocation sequence generation, allocation concealment, blinding, incomplete outcome data, selective outcome reporting, industry bias, and other apparent biases (Higgins 2011; Gluud 2015), using the following definitions:
Allocation sequence generation
Low risk of bias: sequence generation was achieved using computer random‐number generation or a random‐number table. Drawing lots, tossing a coin, shuffling cards, and throwing dice were adequate if performed by an independent person not otherwise involved in the trial.
Unclear risk of bias: the method of sequence generation was not specified.
High risk of bias: the sequence generation method was not random or only quasi‐randomised. We will only use these studies for the assessments of harms and not for benefits.
Allocation concealment
Low risk of bias: the participant allocations could not have been foreseen in advance of, or during, enrolment. Allocation was controlled by a central and independent randomisation unit, on‐site locked computer, identical‐looking numbered sealed opaque envelopes, drug bottles or containers prepared by an independent pharmacist or investigator. The allocation sequence was unknown to the investigators.
Unclear risk of bias: the method used to conceal the allocation was not described so that intervention allocations may have been foreseen in advance of or during enrolment.
High risk of bias: the allocation sequence was likely to be known to the investigators who assigned the participants. We will only use these studies for the assessments of harms and not for benefits.
Blinding of participants and treatment providers
Low risk of bias: it was mentioned that both participants and personnel providing the interventions were blinded and this was described.
Uncertain risk of bias: it was not mentioned if the trial was blinded, or the extent of blinding was insufficiently described.
High risk of bias: no blinding or incomplete blinding was performed.
Blinding of outcome assessment
Low risk of bias: it was mentioned that outcome assessors were blinded and this was described.
Uncertain risk of bias: it was not mentioned if the trial was blinded, or the extent of blinding was insufficiently described.
High risk of bias: no blinding or incomplete blinding was performed.
Incomplete outcome data
Low risk of bias: missing data were unlikely to make treatment effects depart from plausible values. This could either be that there were no dropouts or withdrawals for all outcomes, or the numbers and reasons for the withdrawals and dropouts for all outcomes were clearly stated, could be described as being similar in both groups, and the trial handled missing data appropriately in an intention‐to‐treat analysis using proper methods (e.g. multiple imputations)*. Generally, we judged the trial to be at a low risk of bias due to incomplete outcome data if dropouts are less than 5%. However, the 5% cut‐off is not definitive.
Unclear risk of bias: there was insufficient information to assess whether missing data were likely to introduce bias into the results.
High risk of bias: the results were likely to be biased due to missing data, either because the pattern of dropouts could be described as being different in the two intervention groups or the trial used improper methods to deal with the missing data (e.g. last observation carried forward).
* "Multiple imputation is a general approach to the problem of missing data. It aims to allow for the uncertainty about the missing data by creating several different plausible imputed data sets and appropriately combining results obtained from each of them. The first stage is to create multiple copies of the data set, with the missing values replaced by imputed values. These are sampled from their predictive distribution based on the observed data ‐ thus multiple imputation is based on a Bayesian approach. The imputation procedure must fully account for all uncertainty in predicting the missing values by injecting appropriate variability into the multiple imputed values. The second stage is to use standard statistical methods to fit the model of interest to each of the imputed data sets. The estimated associations from the imputed data sets will differ and are only useful when a mean is used to give overall estimated associations. Valid inferences are obtained because we obtain a mean over the distribution of the missing data given the observed data" (Sterne 2009).
Selective outcome reporting
Low risk of bias: a protocol was published before or at the start of the trial, and the outcomes set out in the protocol were reported. If there is no protocol or the protocol was published after the trial had begun, reporting of all‐cause mortality and serious adverse events gives the trial a grade of low risk of bias.
Unclear risk of bias: no protocol was published and the outcomes all‐cause mortality and serious adverse events were not reported.
High risk of bias: the outcomes in the protocol were not reported.
For‐profit bias
Low risk of bias: the trial appeared to be free of industry sponsorship or other type of for‐profit support that may lead to manipulation of the trial design, conduct, or results.
Unclear risk of bias: it was unclear whether the trial was free of for‐profit bias as no information on clinical trial support or sponsorship was provided.
High risk of bias: the trial was sponsored by industry or received other type of for‐profit support.
Other bias
Low risk of bias: the trial appeared to be free of other bias domains (e.g. academic) that could put it at risk of bias.
Unclear risk of bias: the trial may or may not have been free of other domains that could put it at risk of bias.
High risk of bias: there were other factors in the trial that could put it at risk of bias (e.g. authors have conducted trials on the same topic).
Overall risk of bias
We judged trials to be at a low risk of bias if we rated them at a low risk of bias in all the above domains. We judged trials to be at a high risk of bias if we assessed them as having an unclear risk of bias or a high risk of bias in one or more of the above domains.
We assessed the domains 'blinding of outcome assessment' and 'incomplete outcome data' for each outcome. Thus, we were able to assess the bias risk for each outcome in addition to each trial.
We planned to consider outcome analysis of trials at low risk of bias as our primary analyses on which to base our review conclusions; however, we found no trials at low overall risk of bias.
Measures of treatment effect
Dichotomous outcomes
We calculated risk ratios (RRs) with 95% confidence intervals (CI) for dichotomous outcomes. We, however, considered 97.5% CI as the significance level for our primary outcomes, but this is not possible using the review manager software, see Data synthesis for details.
Continuous outcomes
We included both follow‐up values and change values in the analyses. We used follow‐up values in our analyses if both were reported. We calculated the mean difference (MD) and the standardised mean difference (SMD) with CI for continuous outcomes.
Survival data
We planned to analyse survival data using estimates of log hazard ratios and standard errors; however, no trials reported data suitable for survival analysis. We planned to calculate the log hazard ratios and standard error from any Kaplan‐Meier graph if possible (Higgins 2011). We intended to use the generic inverse‐variance method to meta‐analyse survival data in Review Manager 5.
Unit of analysis issues
Where multiple trial arms were reported in a single trial, we only included the relevant arms. If two comparisons (e.g. parenteral nutrition and enteral nutrition versus standard care) were included in the same trial, we halved the control group to avoid double‐counting.
We included trials with a factorial design. In case of, e.g. a 2 X 2 factorially‐designed trial, we considered the two groups receiving nutrition support as experimental groups and the two groups receiving no nutrition support as control groups.
Dealing with missing data
Dichotomous outcomes
If the trialists used proper methodology (e.g. multiple imputation) to deal with missing data and we judged the dropouts in the groups to be equal, we conducted our primary analysis using these data. We only imputed data for outcomes in our sensitivity analyses.
Continuous outcomes
If trialists used proper methodology (e.g. multiple imputation) to deal with missing data and we judged the dropouts in the groups to be equal, we conducted our primary analysis using these data. We used follow‐up values for all continuous outcomes. If only change values were reported, we analysed the results together with follow‐up values (Higgins 2011). If standard deviations (SDs) were not reported, we calculated the SDs using data from the trial whenever possible. We only used imputed data in our sensitivity analyses.
Sensitivity analysis
To assess the potential impact of missing dichotomous outcomes data, we performed the following two sensitivity analyses (also see Effects of interventions):
'Best‐worst‐case' scenario: we assumed that all participants lost to follow‐up in the experimental group survived and had no serious adverse event; and all those participants with missing outcomes in the control group did not survive and had a serious adverse event;
'Worst‐best‐case' scenario: we assumed that all participants lost to follow‐up in the experimental group did not survive and had a serious adverse event; and that all those participants lost to follow‐up in the control group survived and had no serious adverse event.
We present results from both scenarios in our review.
To assess the potential impact of missing SDs for continuous outcomes, we performed the following sensitivity analysis (also see Effects of interventions):
Where SDs were missing and it was not possible to calculate them, we planned to impute SDs from trials with similar populations and low risk of bias. If we found no trials at low risk of bias, we imputed SDs from trials with a similar population. As the final option, we imputed SDs from all trials.
Assessment of heterogeneity
We assessed the presence of statistical heterogeneity using the Chi2 test with significance set at P value < 0.10 and measured the quantities of heterogeneity using the I2 statistic (Higgins 2002; Higgins 2003). We also produced a forest plot to illustrate any heterogeneity visually.
Assessment of reporting biases
We used a funnel plot to assess reporting bias if 10 or more trials were included in the analysis. Using the asymmetry of the funnel plot, we assessed the risk of bias. For dichotomous outcomes, we used Harbord's test (Harbord 2006) using STATA. For continuous outcomes, we planned to use the regression asymmetry test (Egger 1997) and the adjusted rank correlation (Begg 1994) using STATA (Stata 2013).
Data synthesis
We based our primary conclusions on the results of the primary outcomes with a low risk of bias at the end of intervention. As there are currently no such trials, we considered the results of our primary outcomes with high risk of bias, results of secondary outcomes, results of outcomes at maximum follow‐up, sensitivity analyses, and subgroup analyses as hypothesis‐generating analyses (Jakobsen 2014).
Meta‐analysis
We undertook this meta‐analysis according to the recommendations stated in the Cochrane Handbook for Systematic Reviews of Interventions (Higgins 2011) and the Cochrane Hepato‐Biliary Group web site (hbg.cochrane.org). We used the statistical software Review Manager 5 provided by Cochrane to analyse data (RevMan 2014).
Where data were only available from one trial, we used Fisher's exact test for dichotomous data (Fisher 1922) and Student's t‐test for continuous data (Student 1908).
Assessment of significance
We assessed our intervention effects with both random‐effects model meta‐analyses (DerSimonian 1986) and fixed‐effect model meta‐analyses (DeMets 1987). We used the more conservative point estimate of the two (Jakobsen 2014). We considered as 'the more conservative point estimate', the estimate closest to zero effect (Jakobsen 2014). If the two estimates were equal, we used the estimate with the widest CI (Jakobsen 2014). We used three primary outcomes, and therefore considered a P value of 0.025 or less as statistically significant (Jakobsen 2014). We used the eight‐step procedure to assess whether the thresholds for significance were crossed (Jakobsen 2014).
Secondary outcomes were not adjusted, as we viewed these as hypothesis‐generating.
Trial Sequential Analysis
Traditional meta‐analysis runs the risk of random errors due to sparse data and repetitive testing of accumulating data when updating reviews. Therefore, we performed Trial Sequential Analyses on the primary outcomes in order to calculate the required information size and the breach of the cumulative Z‐curve of the relevant trial sequential monitoring boundaries (www.ctu.dk/tsa/); (TSA 2011; Thorlund 2011; Brok 2008; Wetterslev 2008; Brok 2009; Thorlund 2009; Wetterslev 2009; Thorlund 2010). Hereby, we wished to control the risks of type I errors and type II errors (Thorlund 2011).
For dichotomous outcomes, we estimated the required information size based on the proportion of participants with an event in the control group, a risk ratio reduction of 20%, an alpha of 2.5% because of three primary outcomes (Jakobsen 2014), a beta of 20% (power of 80%), and the diversity calculated from the included trials in the meta‐analysis. A 20% risk ratio reduction would yield a number needed to treat of 50 people at nutritional risk if the mortality in the control group is about 10%. As we could reject a risk ratio reduction of 20% we also performed a post‐hoc TSA for a risk ratio reduction of 10%, to see how small a risk ratio reduction we could reject (see also Effects of interventions). For continuous outcomes, we planned to estimate the required information size, based on the SD observed in the control group of trials at low risk of bias and a minimal relevant difference of 50% of this SD, an alpha of 2.5%, a beta of 20%, and the diversity suggested by the trials in the meta‐analysis.
Zero events were handled in all Trial Sequential Analyses by replacing any zeros with a value of 0.001.
Bayes factor
Bayes factor is the ratio between the probability of the meta‐analysis result, given the null hypothesis (H0) is true, divided by the probability of the meta‐analysis result, given the alternative hypothesis (HA) is true (Jakobsen 2014). We calculated Bayes factor using the Excel sheet provided at the website of the Copenhagen Trial Unit (ctu.dk/tools‐and‐links/bayes‐factor‐calculation.aspx). We calculated Bayes factor using an anticipated risk ratio of 80%. A further explanation of Bayes factor is given in Jakobsen 2014.
Subgroup analysis and investigation of heterogeneity
Below, we list our very large number of preplanned subgroup analyses. Such a large number creates risks for type I errors. Accordingly, we interpreted our subgroup findings conservatively (see 'Data synthesis' for details). We tested for subgroup differences using the formal test for subgroup differences in Review Manager 5 (Borenstein 2009; RevMan 2014).
Outcomes at a low risk of bias compared with outcomes at a high risk of bias.
-
Comparison of trials assessing the effects of the following interventions:
general nutrition support;
fortified foods;
oral nutrition support;
enteral nutrition;
parenteral nutrition.
-
Comparison of trials assessing the effects of nutrition support in the following medical specialties:
cardiology;
medical gastroenterology and hepatology;
geriatrics;
pulmonary disease;
endocrinology;
infectious diseases;
rheumatology;
haematology;
nephrology;
gastro‐enterological surgery;
trauma surgery;
orthopaedics;
plastic, reconstructive, and aesthetic surgery;
vascular surgery;
transplant surgery;
urology;
thoracic surgery;
neurological surgery;
oro‐maxillo‐facial surgery;
anaesthesiology;
emergency medicine (for intensive care unit (ICU) participants, see subgroup conditions known to increase nutritional demands);
psychiatry;
neurology;
oncology;
dermatology;
gynaecology;
mixed.
-
Comparison of trials where the experimental and control groups received the following (see definitions of 'adequate' and 'inadequate' in the paragraphs below):
trials where the experimental group received clearly adequate nutrition and the control group received clearly inadequate nutrition;
trials where the experimental group did not receive an inadequate amount of nutrition or the control group received an adequate amount of nutrition, or both;
trials where the experimental group was overfed;
trials where the calorie and protein intake in the experimental and the control groups could not be obtained from the publications or the study authors.
We defined 'adequate intake' in experimental groups to be 80% to 140% of estimated energy expenditure (i.e. adequate range then is 20 to 35 kcal/kg a day in bedridden participants (including participants in intensive care units)).
We defined 'inadequate intake' as less than 80% of the resting energy expenditure (i.e. inadequate intake is less than 20 kcal/kg a day in bedridden participants).
We defined 'overfeeding' as intakes greater than 35 kcal/kg a day except in trials where participants have a known extraordinary energy requirement (e.g. participants with a temperature of 40 °C, participants with extensive burns, participants with unusually high physical activity, etc.).
The resting energy expenditure could either have been given in the trial or calculated by us, using the Harris‐Benedict equation, based on data in the randomised clinical trial (height, weight, age, sex) (Harris 1918).
-
Comparison of trials where the participants were characterised as 'at nutritional risk' by the following screening tools:
NRS 2002;
MUST;
MNA;
SGA;
participants characterised as 'at nutritional risk' by other means.
-
Comparison of trials where the participants were characterised as 'at nutritional risk' due to the following conditions:
major surgery such as open abdominal (liver, pancreas, gastro‐oesophageal, small intestine, colorectal) surgery;
stroke;
people in intensive care units including trauma;
people with severe infections;
frail elderly people (aged 65 years or over, as mean age of participants) with less severe conditions that were known to increase protein requirements moderately;
participants who do not fall into one of the above categories.
-
Comparison of trials where the participants were characterised as 'at nutritional risk' due to the following criteria:
BMI less than 20.5 kg/m2;
weight loss of at least 5% during the last three months;
weight loss of at least 10% during the last six months;
insufficient food intake during the last week (50% of requirement or less);
participants characterised as 'at nutritional risk' by other means.
-
Comparison of trials where the participants were characterised as 'at nutritional risk' due to biomarkers or anthropometric measures:
biomarkers;
anthropometric measures;
participants characterised as 'at nutritional risk' by other means.
-
Comparison of trials published in the following time periods (using the date when randomisation began if this was reported):
before 1960;
1960 to 1979;
1980 to 1999;
after 1999.
Comparison of trials where the interventions lasted fewer than three days compared to trials where the interventions lasted three days or more.
'Summary of findings' table
We used the GRADE system (Guyatt 2008) to assess the quality of the body of evidence associated with each of the major outcomes in our review. GRADE may show the extent to which one can be confident that an estimate of effect or association reflects the outcome assessed in a systematic review. The quality measure of a body of evidence considers within‐study risk of bias, indirectness of evidence, heterogeneity of data, imprecision of effect estimates, and risk of publication bias. We assessed the precision of the effect estimates according to Jakobsen 2014. We constructed a 'Summary of findings' table (tech.cochrane.org/revman/other‐resources/gradepro/download) presenting the analysis results of the following outcomes: all‐cause mortality, serious adverse events, quality of life, and weight .
Results
Description of studies
Results of the search
We identified 126,594 potentially relevant references through searching the Cochrane Central Register of Controlled Trials (CENTRAL) (n = 39,150), MEDLINE (n = 36,321), Embase (n = 17,201), LILACS (n = 547), BIOSIS (n = 8,197), and Science Citation Index Expanded (n = 25,178). We also found 20 trials by searching Google Scholar, clinicaltrials.gov, and references identified in previous meta‐analyses. We excluded 39,492 reference duplicates. Accordingly, we screened 87,122 records, and excluded 86,36 references based on titles and abstracts. We assessed 786 full‐text articles for eligibility. Of these, we excluded 447 references according to our inclusion and exclusion criteria. We could not find 33 publications, most of which were conducted in China, and it was not possible to access them. We list reasons for exclusion in the table 'Characteristics of excluded studies'. This resulted in 306 publications reporting results of 252 trials that could be included. Eight of these trials are ongoing. Accordingly, we have included 244 trials in our analyses. Figure 1 represents the study flow.
1.
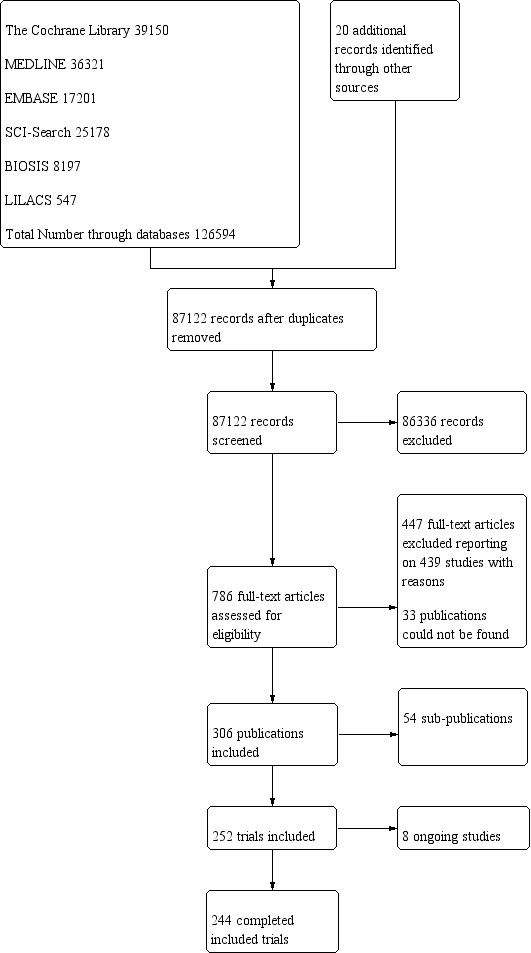
Study flow diagram.
Included studies
We included 306 references for 252 trials, of which eight are ongoing. The trials were conducted all over the world, with 49 from China, 39 from the USA, 31 from the UK, 10 from Germany, nine from Sweden, eight from Australia, seven each from Italy, Spain, Netherlands and Canada, six each from Denmark, France and India, four from Switzerland, three each from Belgium, Croatia, Japan and Turkey, two each from Norway, Taiwan, Hong Kong, South Korea, Ireland, Latvia and Thailand, and one each from New Zealand, Poland, Portugal, Iran, Finland, Greece, Wales, Israel, Russia, Uruguay and Chile. Eleven trials did not report the trial location. For further details on included trials, see 'Characteristics of included studies'.
Participants The 244 trials randomised 28,619 participants. The number of participants in each trial ranged from eight to 4640. Two trials accounted for one‐third of all included participants (Dennis 2005; Casaer 2011). The mean age was 64.2 years in the 184 trials reporting mean age. The mean proportion of women was 43.6% in the 173 trials reporting sex. We included participants from 20 medical specialties: emergency medicine (n = 12); endocrinology (n = 1); gastro‐enterological surgery (n = 99); medical gastroenterology and hepatology (n = 19); general surgery (n = 2); geriatrics (n = 16); gynaecology (n = 1); infectious disease (n = 2); nephrology (n = 1); neurology (n = 10); neurological surgery (n = 1); oncology (n = 20); oro‐maxillo‐facial surgery (n = 2); orthopaedics (n = 14); pulmonary disease (n = 9); thoracic surgery (n = 4); trauma surgery (n = 11); transplant surgery (n = 4); vascular surgery (n = 4); haematology (n = 1); and mixed medical specialties (n = 11) (Table 2).
1. Interventions by medical specialty.
| Medical speciality | Experimental group | Control group |
| Emergency medicine | 3 trials used enteral nutrition 8 trials used parenteral nutrition |
7 trials used no intervention 4 trials used treatment as usual |
| Endocrinology | 1 trial used parenteral nutrition | 1 trial used no intervention |
| Gastroenterological surgery | 36 trials used enteral nutrition 13 trials used oral nutrition 40 trials used parenteral nutrition 3 trials used mixed nutrition |
32 trials used no intervention 4 trials used placebo 56 trials used treatment as usual |
| General surgery | 2 trials used parenteral nutrition | 1 trial used no intervention 1 trial used treatment as usual |
| Geriatrics | 1 trial used fortified foods 2 trials used general nutrition support 13 trials used oral nutrition |
9 trials used no intervention 2 trials used placebo 5 trials used treatment as usual |
| Gynaecology | 1 trial used parenteral nutrition | 1 trial used treatment as usual |
| Haematology | 1 trial used parenteral nutrition | 1 trial used placebo |
| Infectious diseases | 2 trials used enteral nutrition | 2 trials used treatment as usual |
| Medical gastroenterology and hepatology | 9 trials used enteral nutrition 3 trials used oral nutrition 5 trials used parenteral nutrition 1 trial used mixed nutrition |
9 trials used no intervention 9 trials used treatment as usual |
| Mixed medical speciality | 2 trials used enteral nutrition 1 trial used fortified foods 1 trial used general nutrition 4 trials used oral nutrition 1 trial used mixed nutrition |
5 trials used no intervention 1 trial used placebo 3 trials used treatment as usual |
| Neprohology | 1 trial used general nutrition | 1 trial used treatment as usual |
| Neurological surgery | 1 trial used parenteral nutrition | 1 trial used treatment as usual |
| Neurology | 3 trials used enteral nutrition 1 trial used general nutrition 5 trials used oral nutrition 1 trial used mixed nutrition |
4 trials used no intervention 6 trials used treatment as usual |
| Oncology | 3 trials used enteral nutrition 1 trial used general nutrition 11 trials used parenteral nutrition 1 trial used mixed nutrition |
9 trials used no intervention 7 trials used treatment as usual |
| Oro‐maxillo‐facial surgery | 1 trial used enteral nutrition 1 trial used oral nutrition |
2 trials used no intervention |
| Orthopaedics | 5 trials used enteral nutrition 4 trials used oral nutrition 1 trial used general nutrition 1 trial used parenteral nutrition 3 trials used mixed nutrition |
7 trials used no intervention 2 trials used placebo 5 trials used treatment as usual |
| Pulmonary diseases | 2 trials used enteral nutrition 3 trials used oral nutrition 3 trials used parenteral nutrition |
1 trial used no intervention 3 trials used placebo 4 trials used treatment as usual |
| Thoracic surgery | 2 enteral nutrition 1 parenteral nutrition 1 mixed nutrition |
1 trial used placebo 3 trials used treatment as usual |
| Trauma surgery | 8 trials used enteral nutrition 3 trials used parenteral nutrition |
6 trial used no intervention 5 trial used treatment as usual |
| Transplant surgery | 1 trial used enteral nutrition 1 trial used oral nutrition 2 trials used parenteral nutrition |
4 trials used treatment as usual |
| Vascular surgery | 1 trial used enteral nutrition 3 trials used parenteral nutrition |
4 trials used treatment as usual |
Experimental interventions
We included 86 trials where the experimental group received parenteral nutrition, 80 trials with enteral nutrition, 55 with oral nutrition support, 12 with a mixed experimental intervention(e.g. oral nutrition and parenteral nutrition were given together), nine trials with general nutrition support, and two trials with fortified food. Two hundred and three trials had an intervention that lasted three days or more and 25 trials had an intervention that lasted two days or less. The duration of the intervention was unknown in 16 trials. Most intervention periods were until hospital discharge, but in the 79 trials reporting a specific intervention length, the mean in‐hospital intervention length was 10.4 days (range 1 to 32 days).
Table 2 gives a list of the experimental interventions according to medical specialty.
Control interventions
We include 122 trials with 'treatment as usual' as the control intervention, 107 trials with no intervention as control intervention, and 15 trials with placebo as intervention. It is important to note that the control group was often given a co‐intervention consisting of standard care, and therefore often received a measure of nutrition support.
Table 2 gives a list of the control interventions according to medical specialty.
Co‐interventions
Many trials had co‐interventions. We included trials with co‐interventions, but only if the co‐interventions were intended to be delivered similarly to all experimental and control groups of a trial (Jakobsen 2014). The majority of trials with an intervention period longer than three days used 'standard hospital food' as a co‐intervention. Co‐interventions, whenever used, were in general disease‐specific, such as anaesthetics and chemotherapy.
Excluded studies
We excluded 447 references after full‐text assessment reporting on 439 studies. One hundred studies were not a randomised clinical trial (review, observational study, comment); 137 studies had a control group receiving an intervention not fulfilling our inclusion criteria; 93 studies included a mixture of outpatients and hospitalised patients, or only outpatients; 56 studies assessed the effects of interventions not fulfilling our inclusion criteria; 19 studies had multiple interventions; 14 studies did not randomise adults; 10 studies did not include participants at nutritional risk; three studies were cluster‐randomised; three studies assessed pregnant women; three studies were retracted; and one study included participants who received dialysis. The reasons for the exclusion of studies are given in the table 'Characteristics of excluded studies'.
Risk of bias in included studies
Based on the information that we collected from the published reports and information from authors, we rated all 244 trials as being at high risk of bias. We judged many trials to have an unclear risk of bias in several domains, and we could not obtain additional information from the authors when we contacted them. Only one trial had a low risk of bias in six out of seven domains (Lidder 2013a). Additional information can be found in the 'Risk of bias' summary (Figure 2), and the 'Risk of bias' graph (Figure 3).
2.

Risk of bias summary: review authors' judgements about each risk of bias item for each included study.
3.
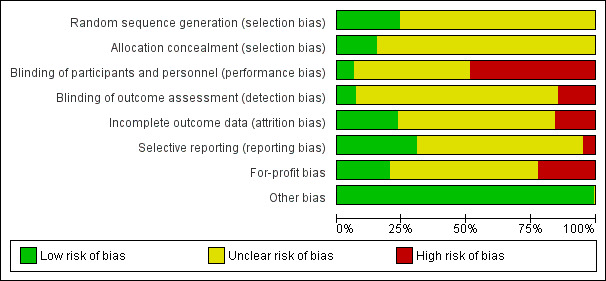
Risk of bias graph: review authors' judgements about each risk of bias item presented as percentages across all included studies.
Allocation
The generation of the allocation sequence was low risk of bias in only 62 trials. The remaining 182 trials were described as being randomised, but without explaining the method used for sequence generation.
The method used to conceal allocation was adequate in only 39 trials. The remaining 205 trials were described as being randomised, but the method used for allocation concealment was either not described or insufficiently described.
Blinding
The blinding of participants and personnel was performed and adequately described in only 15 trials. One hundred and seventeen trials did not blind the participants and personnel. The method for blinding of participants and personnel for the remaining 112 trials was either not described or insufficiently described. The blinding of outcome assessors was performed and adequately described in 17 trials. Thirty‐six trials did not blind the outcome assessors. The method for blinding of outcome assessors for the remaining 191 trials was either not described or was insufficiently described.
Incomplete outcome data
Only 49 trials adequately addressed incomplete outcome data. Forty‐one trials did not properly deal with incomplete outcome data. In 154 trials, incomplete outcome data were either not described or were insufficiently described.
Selective reporting
Seventy‐five trials reported the outcomes stated in their respective protocols, or reported serious adverse events (including reporting complications, morbidity, or similar terms) and mortality, resulting in our assessment of a 'low risk of bias'. Twelve trials did not report the same outcomes they had stated in the protocol. In 157 trials, no protocol was available and the trial did not report mortality or serious adverse events.
Other potential sources of bias
Fifty‐three trials reported how they were funded and appeared to be free of industry sponsorship or other type of for‐profit support that may bias the results of the trial (Lundh 2017). Fifty‐two trials were funded by industry sponsorship or other type of for‐profit support. In 139 trials it was unclear how the trial was funded.
We did not identify any clear signs of academic bias or other potential sources of bias in any of the included trials. Therefore, we rated all 244 trials as 'low risk of bias' in the 'Other potential bias' domain.
Effects of interventions
See: Table 1
Primary outcomes
All‐cause mortality
End of intervention
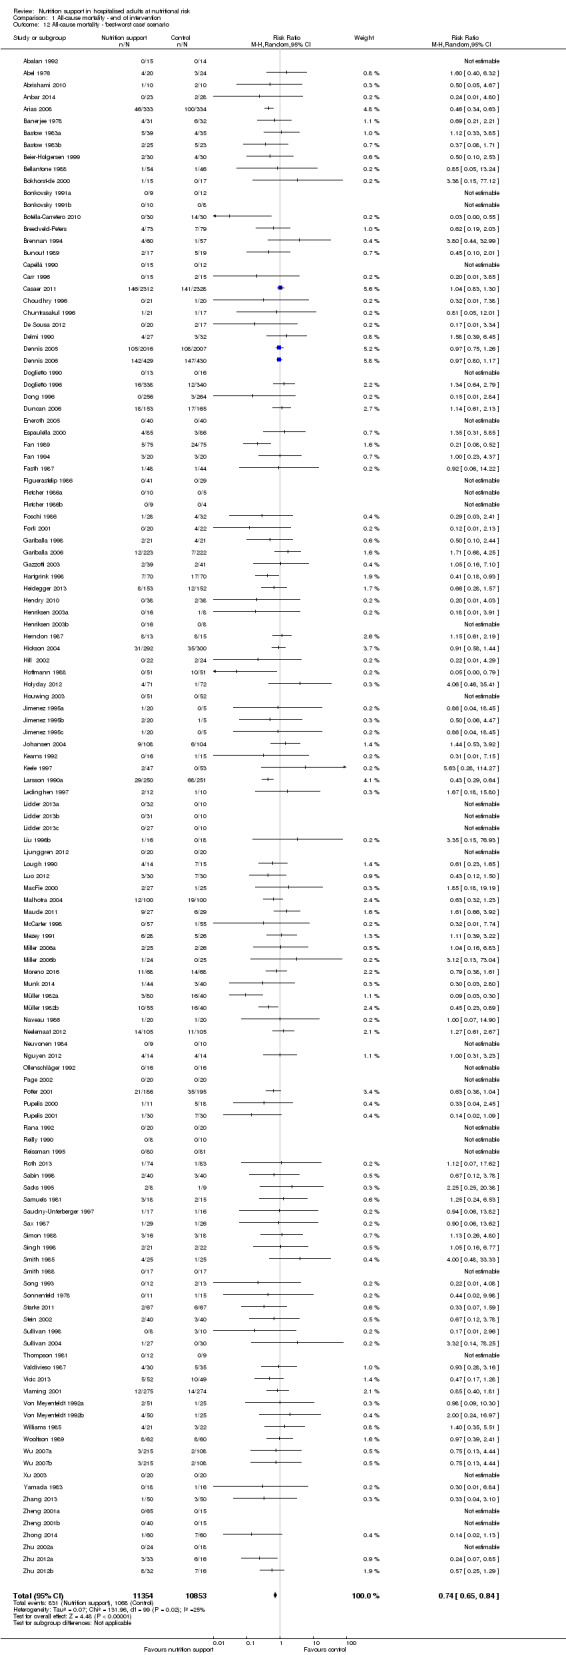
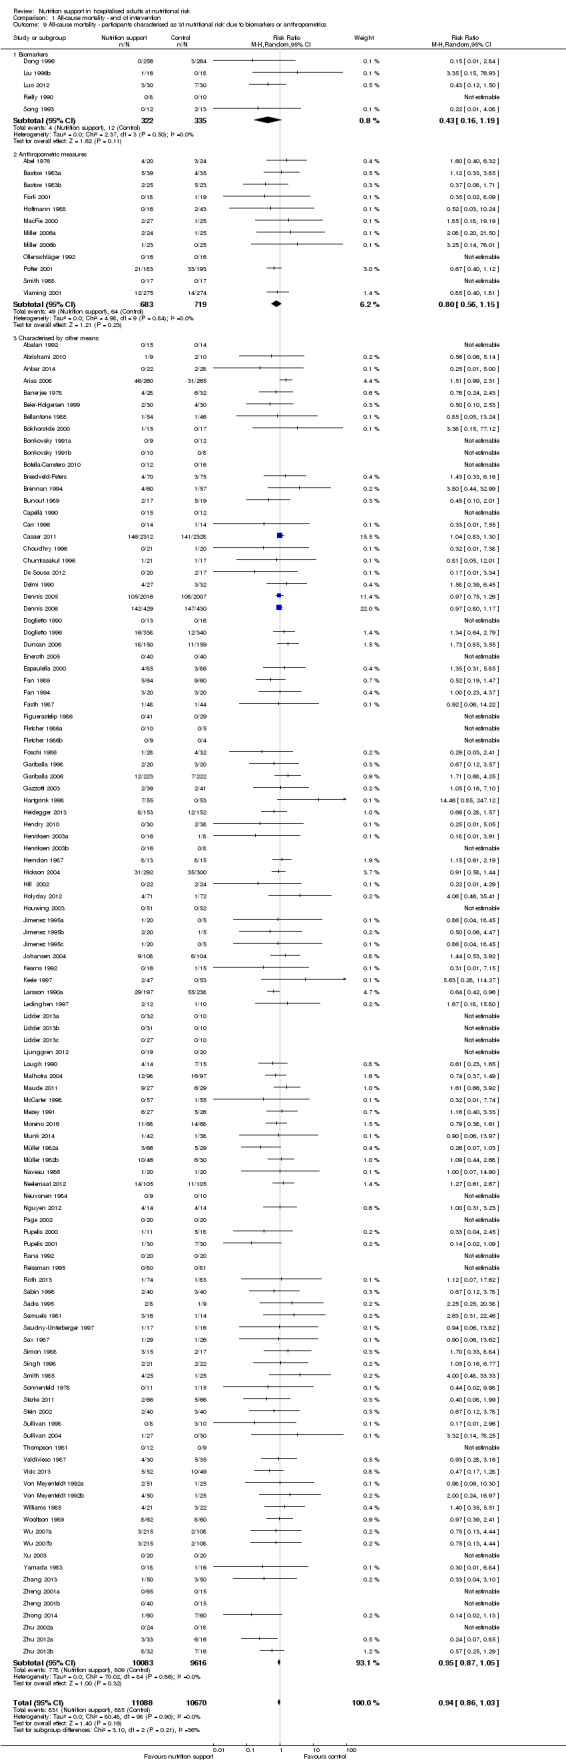
One hundred and fourteen of 244 trials (46.7%), covering 21,758 participants, reported mortality at end of intervention. Eight hundred and thirty‐one of 11,088 nutrition‐support participants (7.49%) died versus 885 of 10,670 control participants (8.3%). Random‐effects meta‐analysis showed that nutrition support did not significantly affect the risk of all‐cause mortality at end of intervention (RR 0.94, 95% CI 0.86 to 1.03, P = 0.16, I2 = 0%, 21,758 participants, 114 trials, low quality of evidence, Analysis 1.1). The point estimate of absolute risk for short‐term mortality was non‐significantly 0.5% lower (8.3% in the control group compared with 7.8% (7.1% to 9.5%) following nutritional interventions.
1.1. Analysis.
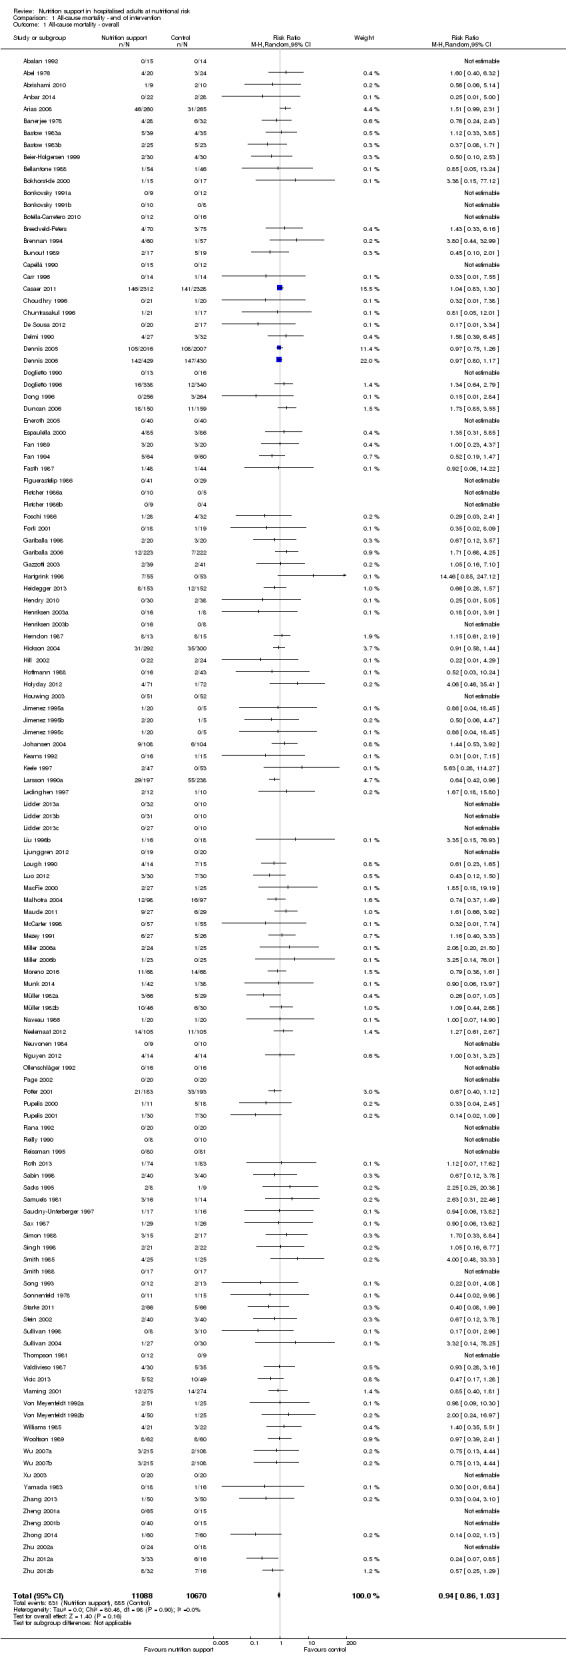
Comparison 1 All‐cause mortality ‐ end of intervention, Outcome 1 All‐cause mortality ‐ overall.
Heterogeneity
Neither visual inspection of the forest plots nor tests for statistical heterogeneity (I2 = 0%; P = 0.90) indicated significant heterogeneity.
Trial Sequential Analysis
The Trial Sequential Analysis showed that the Z‐curve crossed the boundary for futility. Hence, there is firm evidence that nutrition support versus control does not reduce the risk ratio for all‐cause mortality by 20% at end of intervention (Figure 4). A post hoc Trial Sequential Analysis showed that the acquired information was large enough to rule out that nutrition support versus control reduces the risk ratio of all‐cause mortality by 11% or more (Supplementary online material). It should be noted that Trial Sequential Analysis only assessed the risk of random error and did not consider the risk of bias.
4.
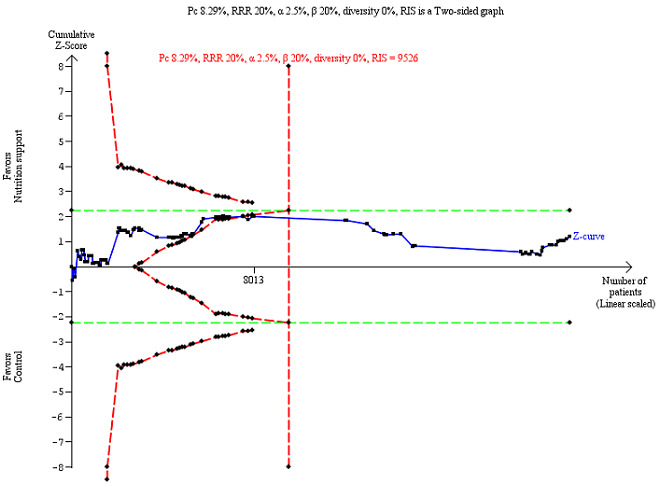
Trial Sequential Analysis on all‐cause mortality (end of intervention) in 114 high risk of bias trials. The diversity‐adjusted required information size (RIS) was calculated based on mortality in the control group of 8.29%; risk ratio reduction of 20% in the experimental group; type I error of 2.5%; and type II error of 20% (80% power). No diversity was noted. The required information size was 9526 participants. The cumulative Z‐curve (blue line) did not cross the trial sequential monitoring boundaries for benefit or harm (red inward sloping lines). The cumulative Z‐curve crossed the inner‐wedge futility line (red outward sloping lines). Additionally the cumulative Z‐score crossed the RIS. The green dotted line shows conventional boundaries (2.5%).
Bayes factor
We calculated the Bayes factor based on a RR of 20% and the meta‐analysis result (RR 0.94). Bayes factor (92.92) was above the Bayes factor threshold for significance of 0.1, supporting that there seems to be no significant effect of nutrition support on all‐cause mortality at end of treatment.
Risk of bias and sensitivity analyses
We rated the risk of bias of the outcome result as high.
The 'best‐worst' and 'worst‐best' case meta‐analyses showed that incomplete outcome data bias has the potential to influence the results ('best‐worst' random‐effects meta‐analysis: RR 0.74, 95% CI 0.65 to 0.84, P < 0.001, 22,207 participants, 114 trials, low‐quality evidence Analysis 1.12; 'worst‐best' random‐effects meta‐analysis: RR 1.13, 95% CI 0.97 to 1.31, P = 0.12, 22,207 participants, 114 trials, low‐quality evidence, Analysis 1.13.). Data were imputed for 22 trials.
1.12. Analysis.
Comparison 1 All‐cause mortality ‐ end of intervention, Outcome 12 All‐cause mortality ‐ 'best‐worst case' scenario.
1.13. Analysis.
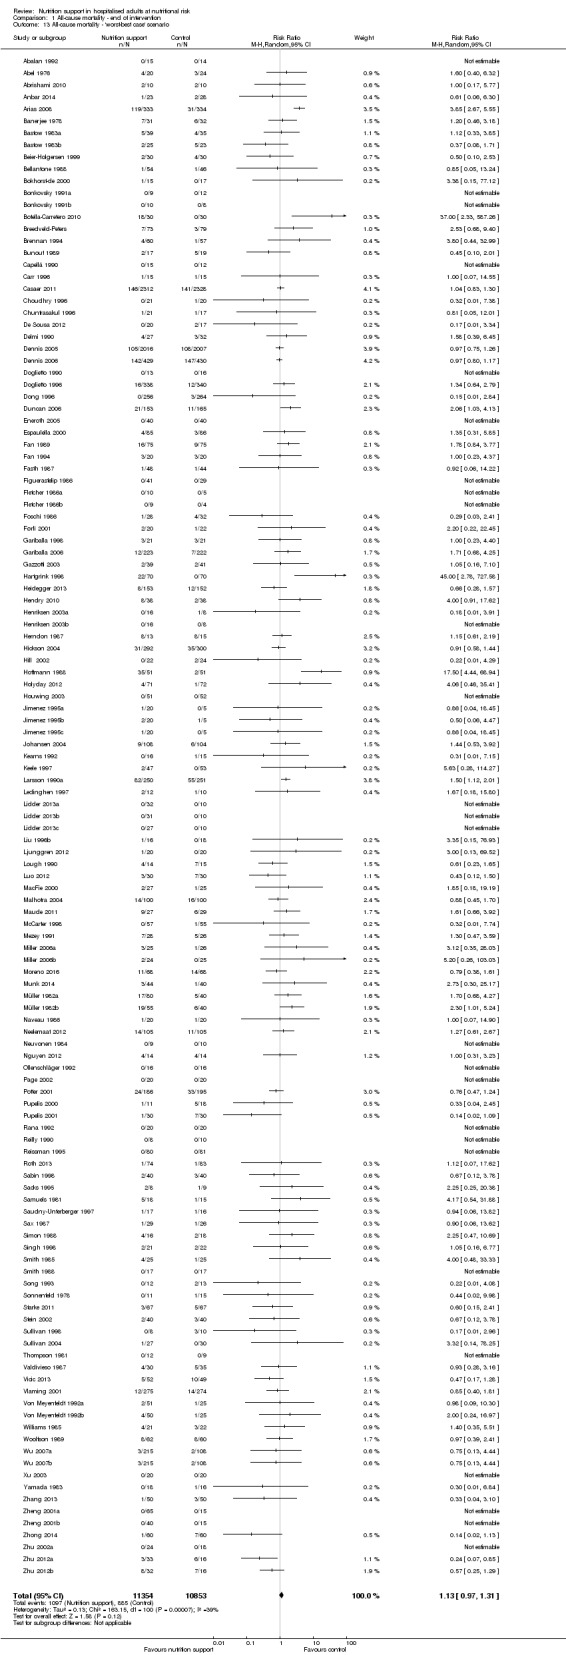
Comparison 1 All‐cause mortality ‐ end of intervention, Outcome 13 All‐cause mortality ‐ 'worst‐best case' scenario.
Visual inspection of the funnel plots showed signs of asymmetry (Supplementary online material). Harbord's test showed no small‐study effect (P = 0.095). Based on visual inspection of the funnel plot, we assessed the risk of publication bias as high.
Subgroup analyses
Analysis 1.3, comparing trials with different modes of delivery: test of interaction showed no statistically significant difference (subgroup difference P = 0.69).
1.3. Analysis.
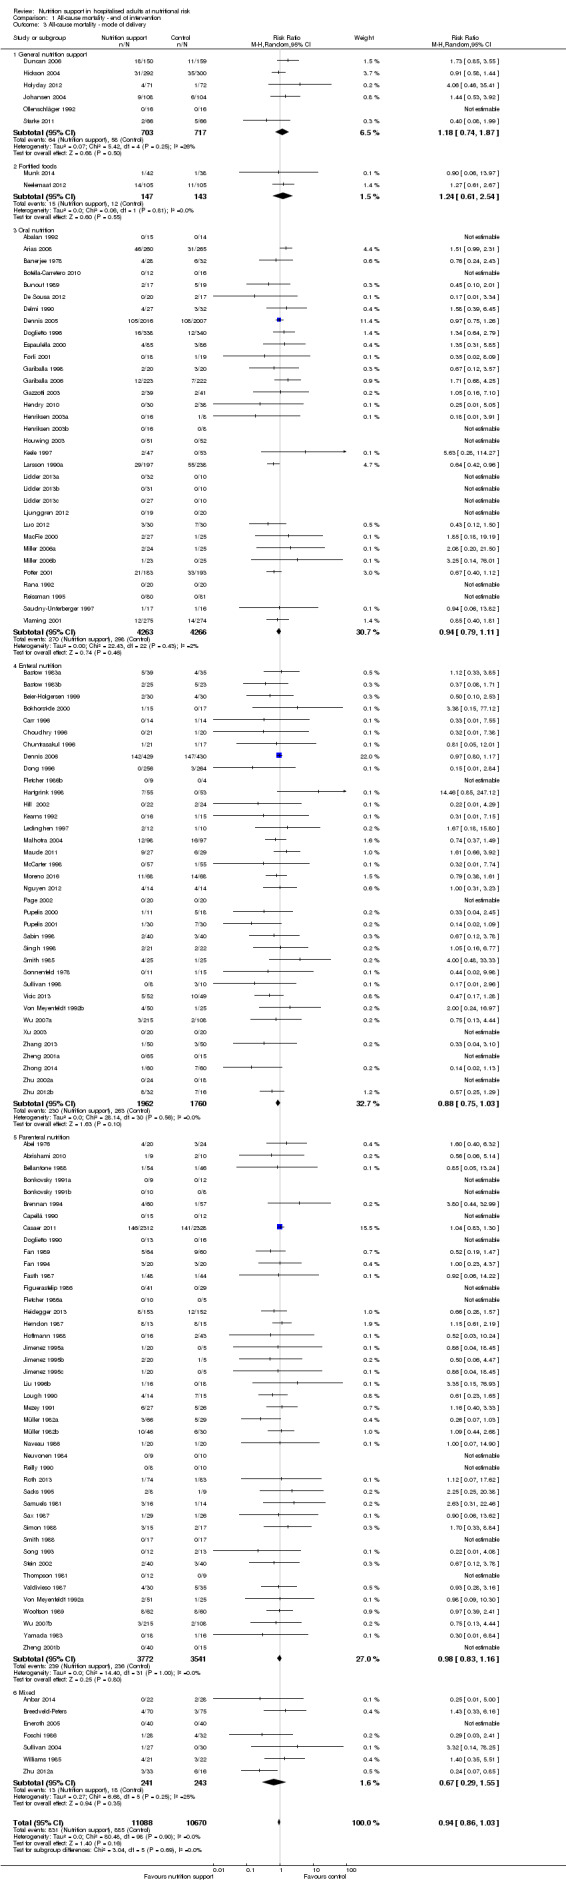
Comparison 1 All‐cause mortality ‐ end of intervention, Outcome 3 All‐cause mortality ‐ mode of delivery.
Analysis 1.4, comparing trials with participants from different medical specialties: test for subgroup difference showed no statistically significant difference (subgroup difference P = 0.44).
1.4. Analysis.
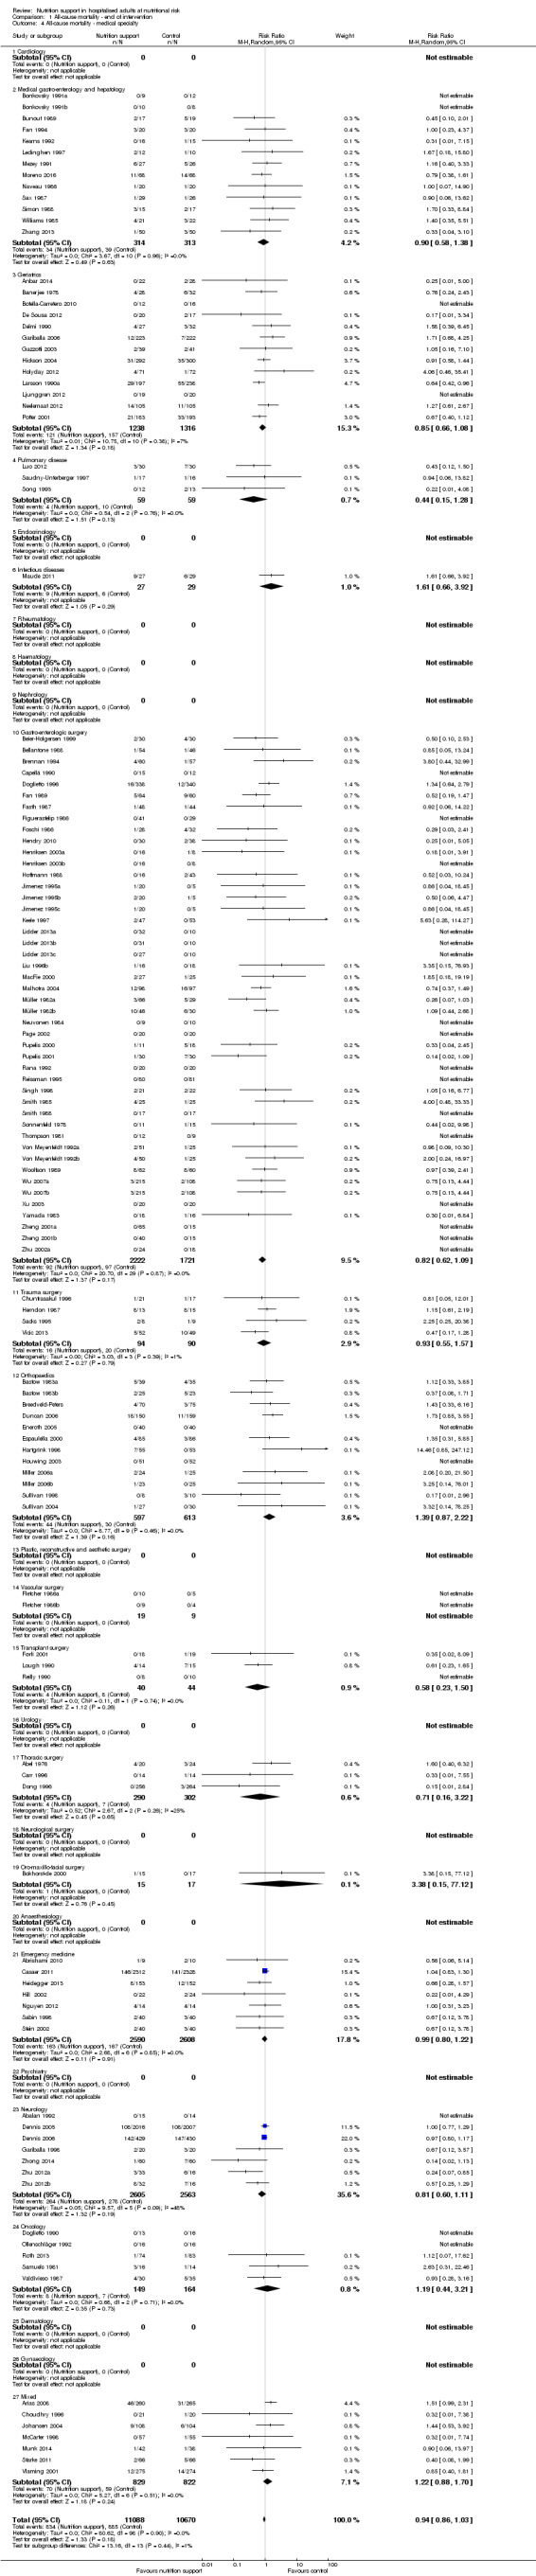
Comparison 1 All‐cause mortality ‐ end of intervention, Outcome 4 All‐cause mortality ‐ medical specialty.
Analysis 1.5, comparing trials where the adequacy of the amount of calories received was different: test for subgroup difference showed no statistically significant difference (subgroup difference P = 0.45).
1.5. Analysis.
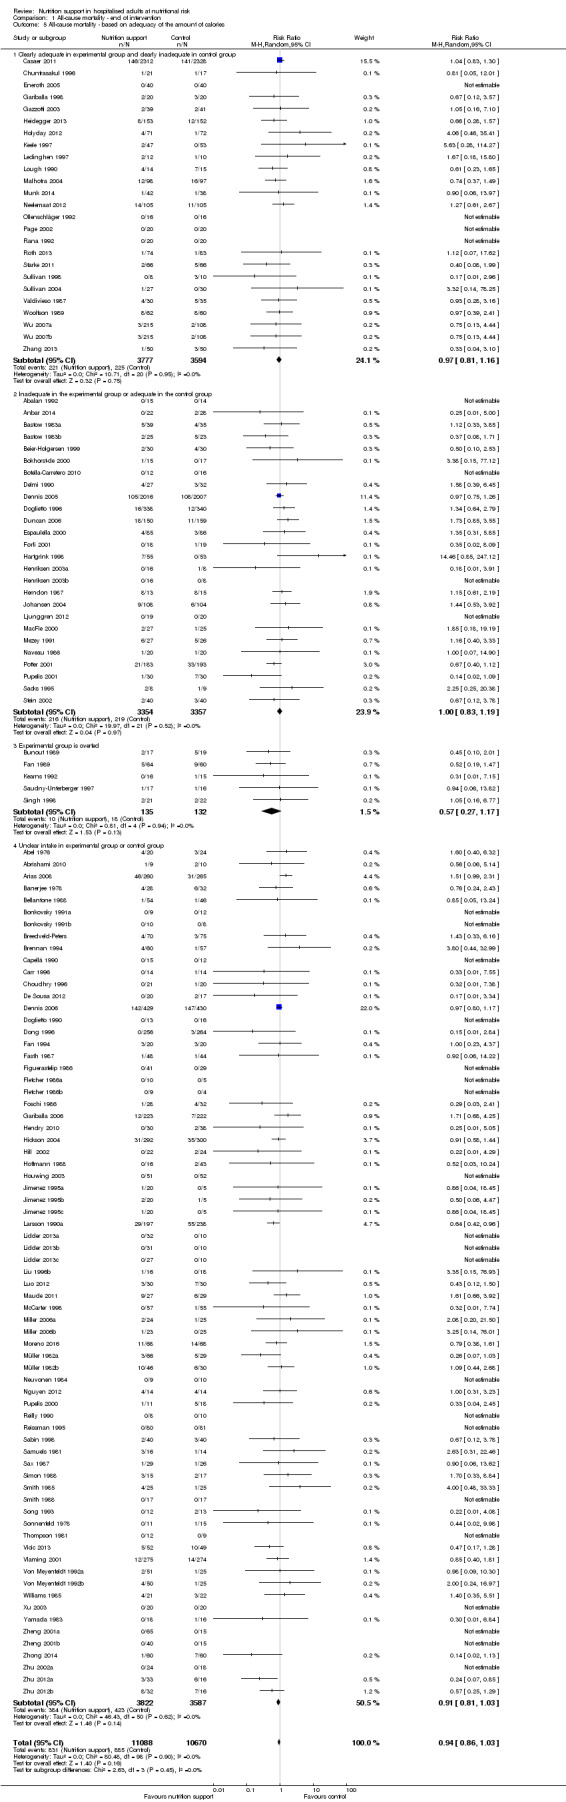
Comparison 1 All‐cause mortality ‐ end of intervention, Outcome 5 All‐cause mortality ‐ based on adequacy of the amount of calories.
Analysis 1.6, comparing trials with different screening tools: test for subgroup difference showed no statistically significant difference (subgroup difference P = 0.12).
1.6. Analysis.
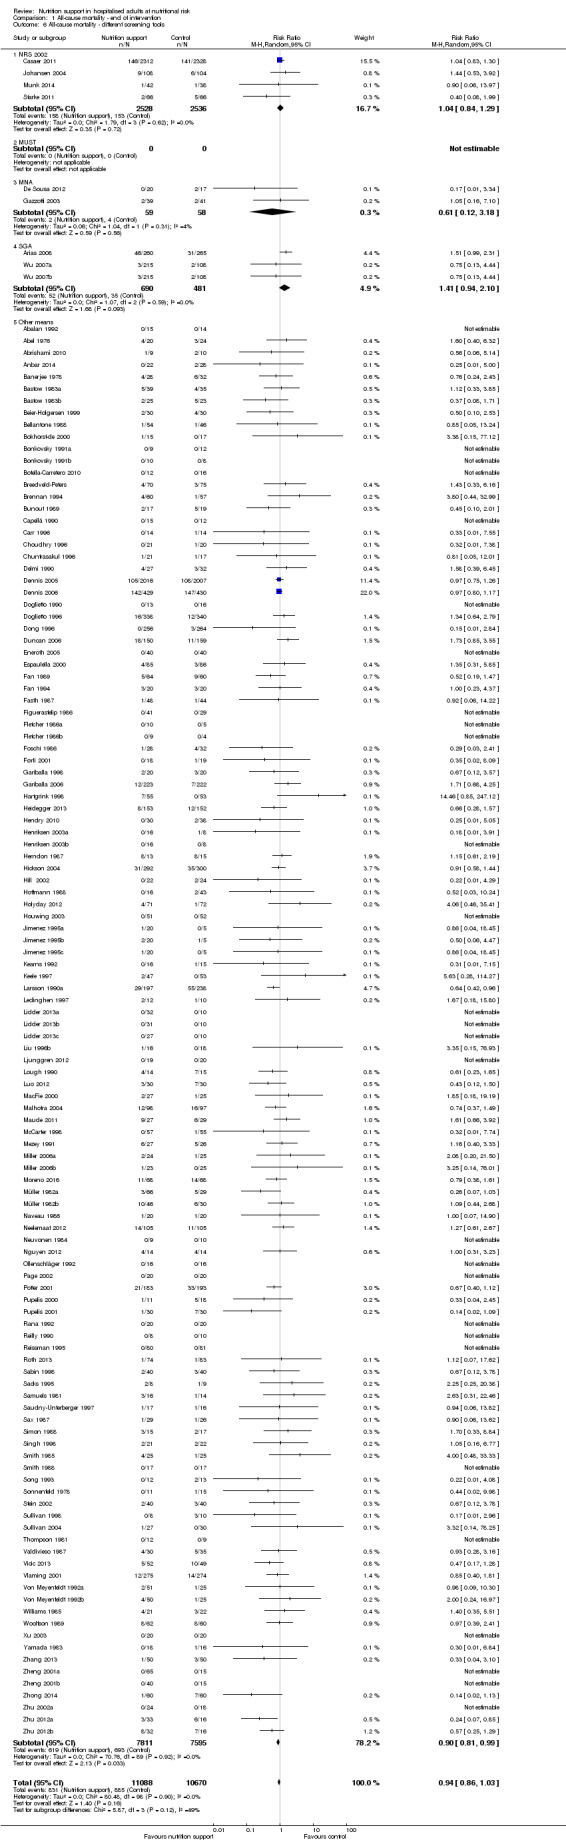
Comparison 1 All‐cause mortality ‐ end of intervention, Outcome 6 All‐cause mortality ‐ different screening tools.
Analysis 1.7, comparing trials where participants at nutritional risk according to specific condition: test for subgroup difference showed no statistically significant difference (subgroup difference P = 0.62).
1.7. Analysis.
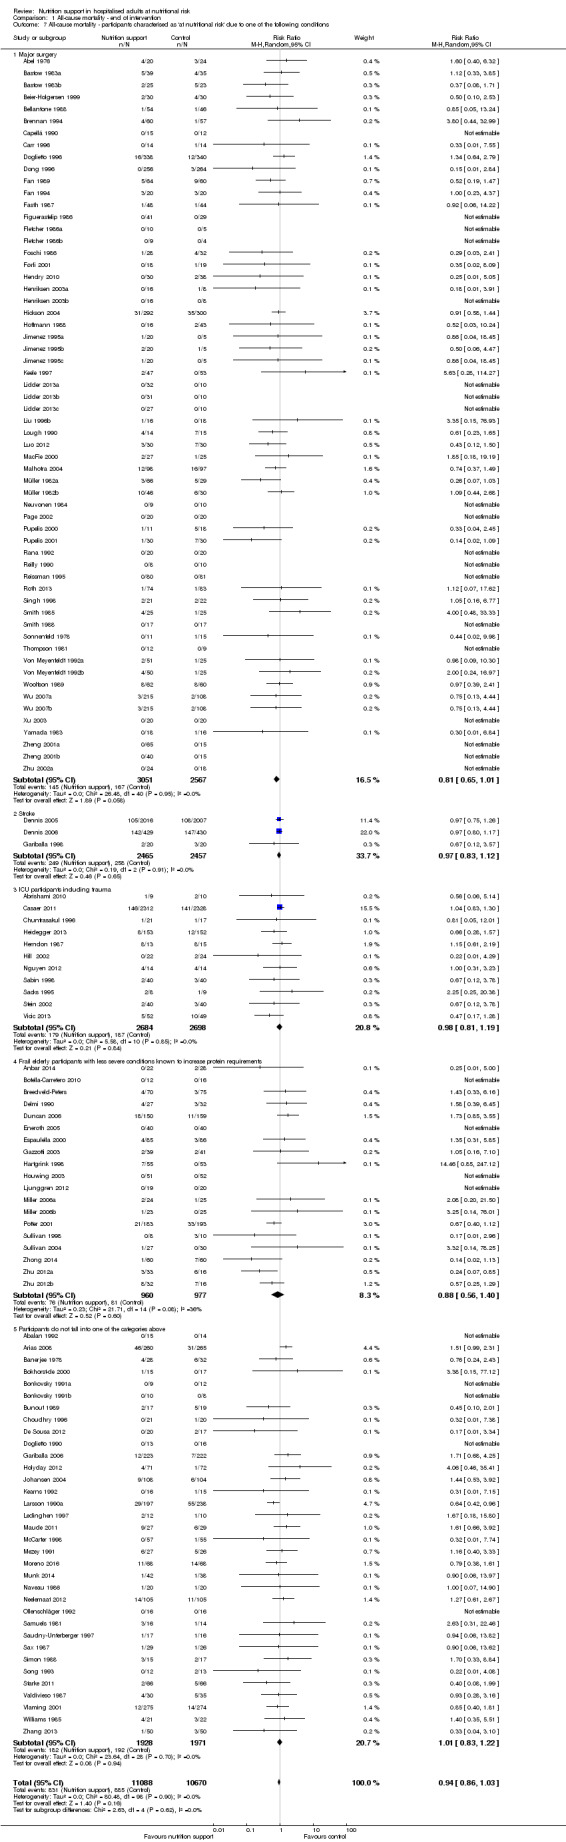
Comparison 1 All‐cause mortality ‐ end of intervention, Outcome 7 All‐cause mortality ‐ participants characterised as 'at nutritional risk' due to one of the following conditions.
Analysis 1.8, comparing trials where participants were at nutritional risk according to specific criteria (BMI, weight, insufficient food intake): test for subgroup difference showed no statistically significant difference (subgroup difference P = 0.59).
1.8. Analysis.
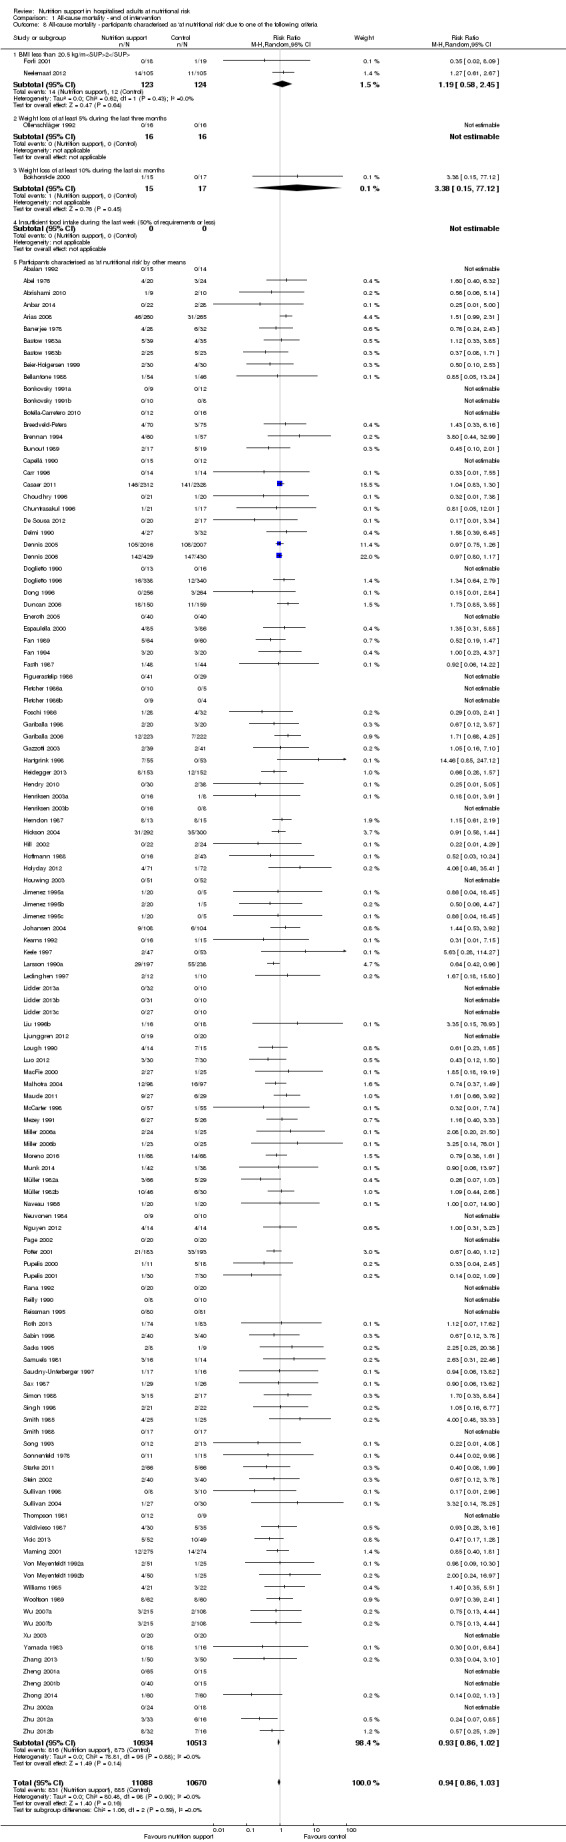
Comparison 1 All‐cause mortality ‐ end of intervention, Outcome 8 All‐cause mortality ‐ participants characterised as 'at nutritional risk' due to one of the following criteria.
Analysis 1.9, comparing trials where the participants were classified as at nutritional risk according to biomarkers or anthropometrics: test for subgroup difference showed no statistically significant difference (subgroup difference P = 0.21).
1.9. Analysis.
Comparison 1 All‐cause mortality ‐ end of intervention, Outcome 9 All‐cause mortality ‐ participants characterised as 'at nutritional risk' due to biomarkers or anthropometrics.
Analysis 1.10, comparing trials according to publication year: test for subgroup difference showed no statistically significant difference (subgroup difference P = 0.83).
1.10. Analysis.
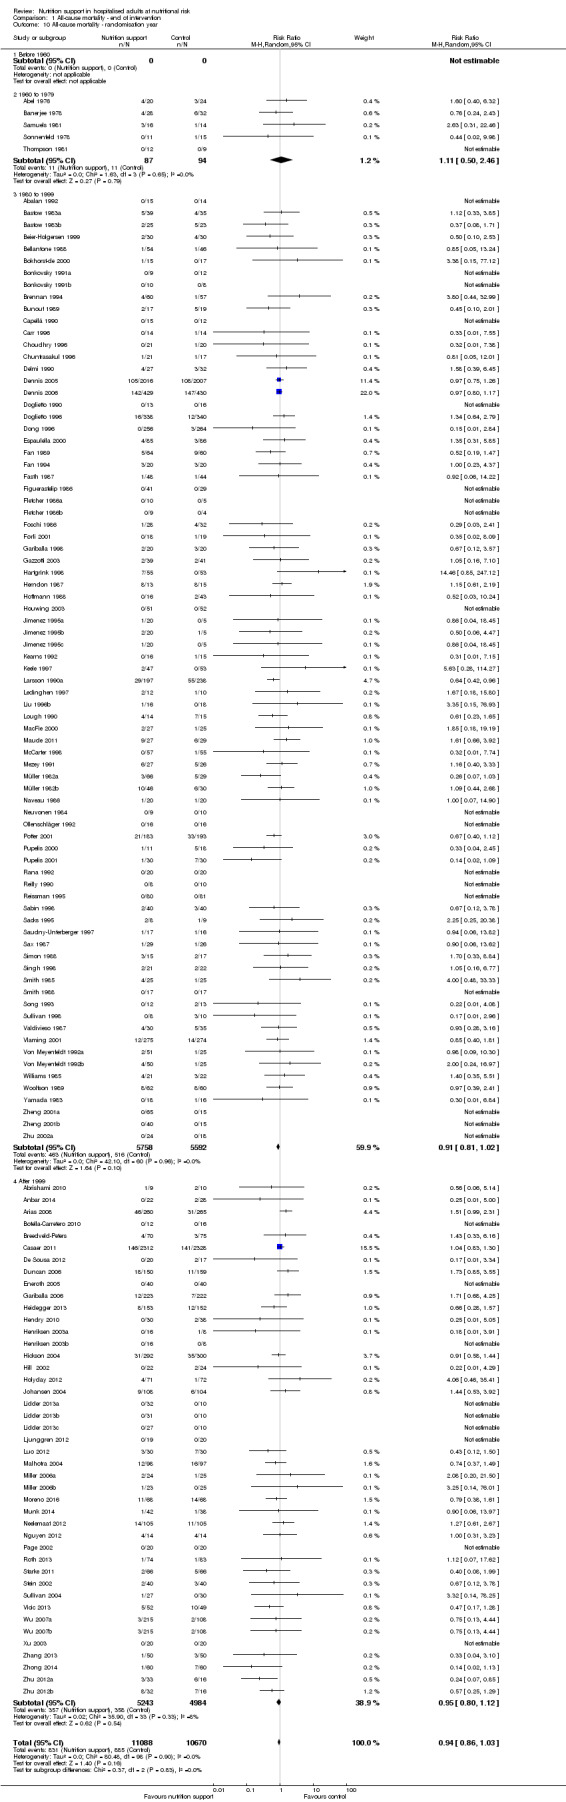
Comparison 1 All‐cause mortality ‐ end of intervention, Outcome 10 All‐cause mortality ‐ randomisation year.
Analysis 1.11, comparing the length of the intervention: test for subgroup difference showed no statistically significant difference (subgroup difference P = 0.78).
1.11. Analysis.
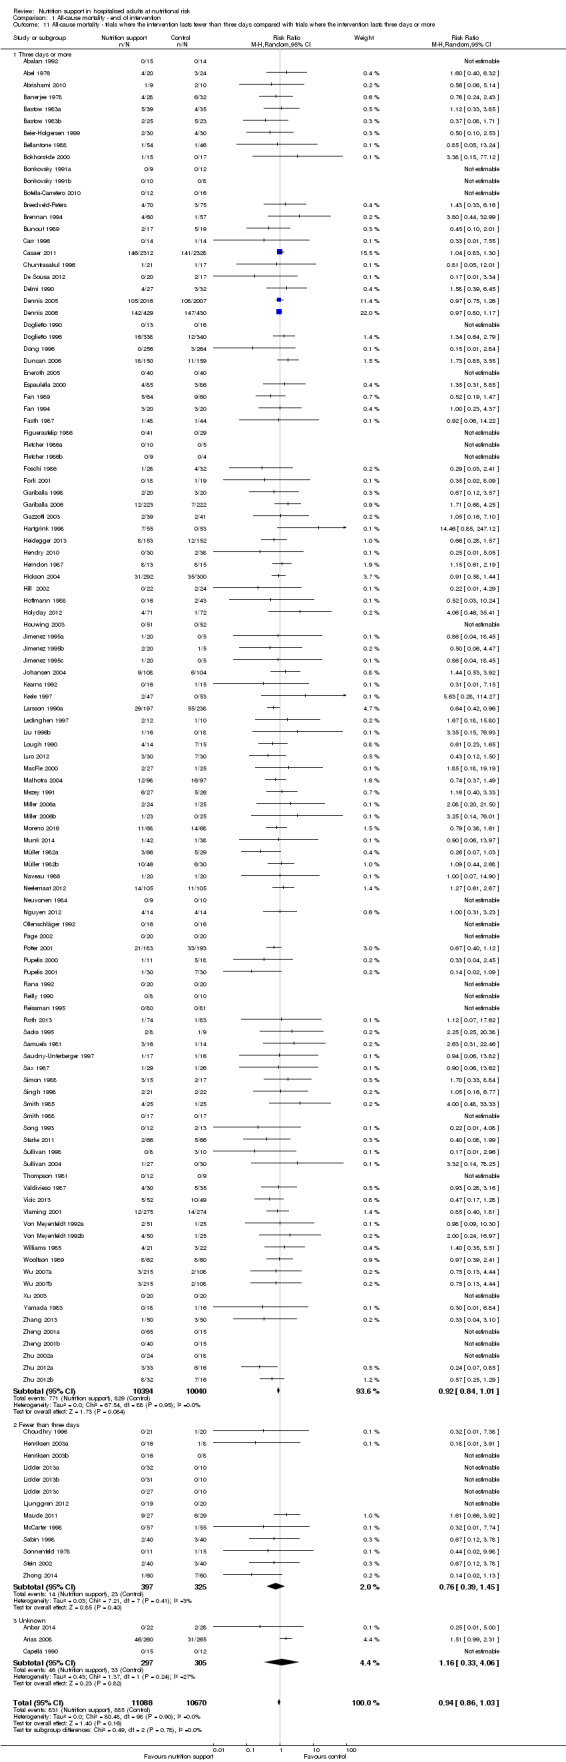
Comparison 1 All‐cause mortality ‐ end of intervention, Outcome 11 All‐cause mortality ‐ trials where the intervention lasts fewer than three days compared with trials where the intervention lasts three days or more.
Zero‐event handling
To test the robustness of our results according to the type of zero‐event handling, we conducted our meta‐analysis using the Trial Sequential Analysis software. We performed our meta‐analysis using both the 'reciprocal of opposite intervention group' continuity correction, a constant continuity correction using both 0.5, 0.01 and 0.001, and an empirical continuity correction using 0.5, 0.01 and 0.001. None of the meta‐analyses produced a P value under 0.025.
Maximum follow‐up
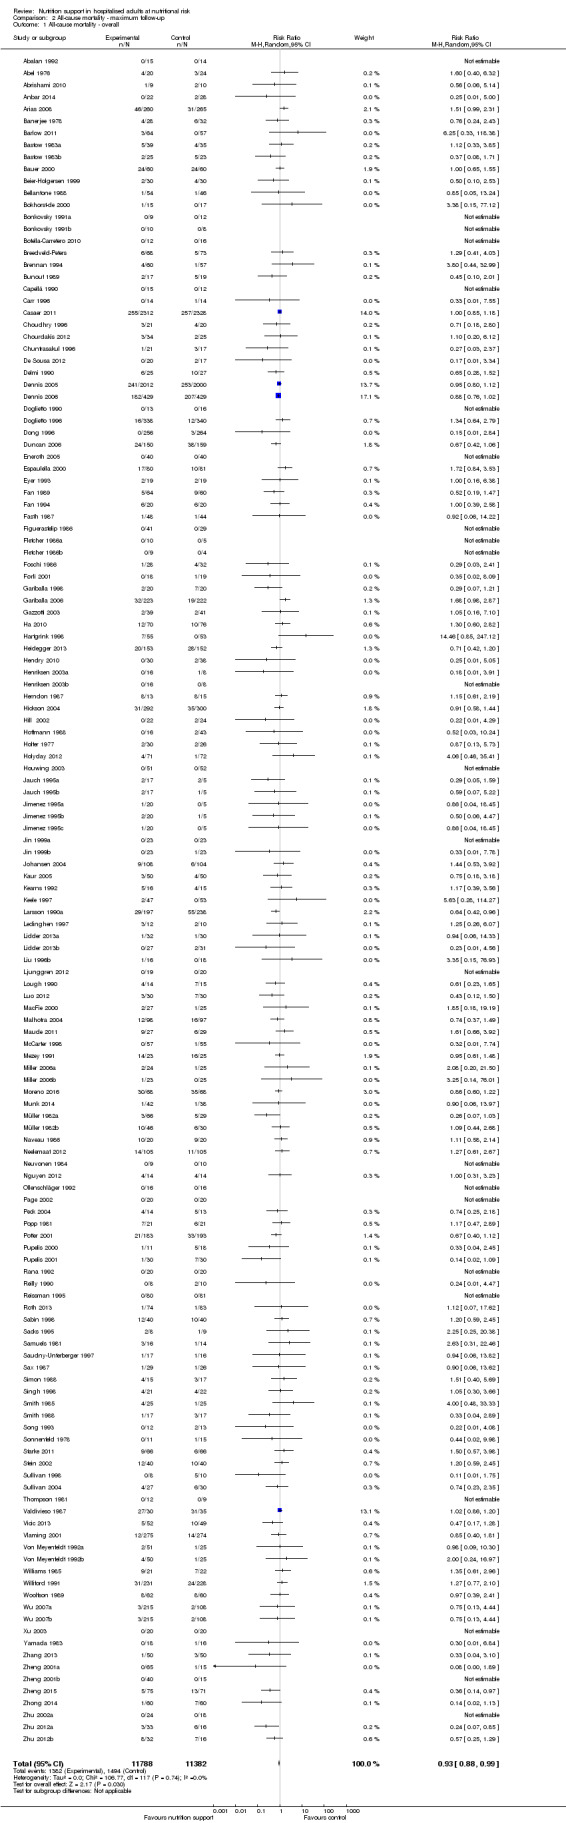
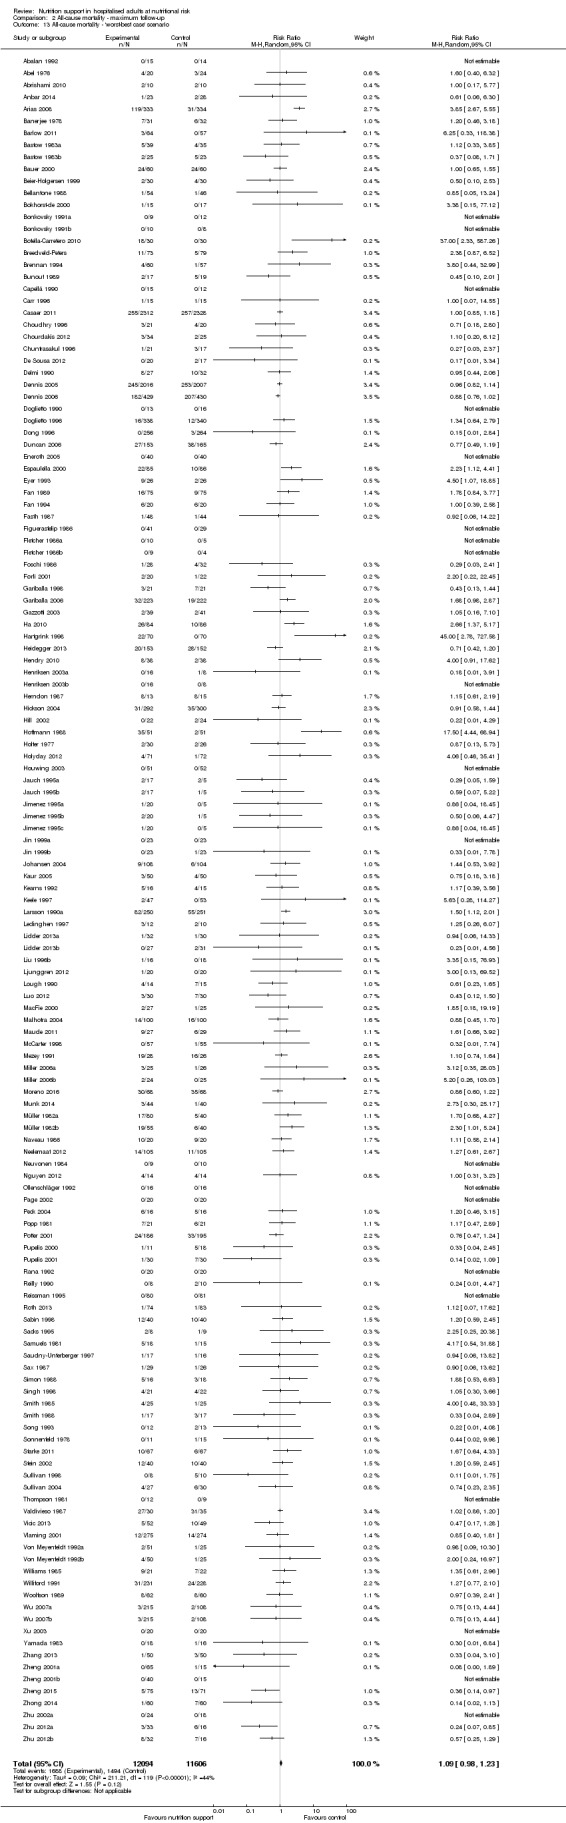
Only 127 of 244 trials (52%), covering 23,170 participants, reported all‐cause mortality at maximum follow‐up (often months and in some cases years after). All trials were at high risk of bias. One thousand three hundred and eighty‐two of 11,788 nutrition support participants (11.67%) died versus 1494 of 11,382 control participants (13.1%). Overall, we found no statistically significant benefit or harm on all‐cause mortality at maximum follow‐up, considering a P value of less than 0.025 significant (Jakobsen 2014) (random‐effects model meta‐analysis: RR 0.93, 95% CI 0.88 to 0.99, P = 0.03, I2 = 0%, 23,170 participants, 127 trials, low quality of evidence, Analysis 2.1).
2.1. Analysis.
Comparison 2 All‐cause mortality ‐ maximum follow‐up, Outcome 1 All‐cause mortality ‐ overall.
The point estimate of absolute risk for long‐term mortality was non‐significantly 1% lower (13.2% in the control group compared with 12.2% (11.6% to 13%) following nutritional interventions.
Heterogeneity
Neither visual inspection of the forest plots nor tests for statistical heterogeneity (I2 = 0%; P = 0.74) indicated significant heterogeneity.
Trial Sequential Analysis
The Trial Sequential Analysis showed that the Z‐curve crossed the boundary for futility. Hence, there is firm evidence that nutrition support versus control does not reduce the risk ratio for all‐cause mortality by 20% at maximum follow‐up (Supplementary online material). A post hoc Trial Sequential Analysis showed that the information size was large enough also to rule out that nutrition support versus control reduces the risk ratio of all‐cause mortality by 10% or more (Supplementary online material). It should be noted that Trial Sequential Analysis only assessed the risk of random error and did not consider the risk of bias.
Bayes factor
We calculated the Bayes factor based on a RR of 20%, and the meta‐analysis result (RR 0.93). Bayes factor (374.86) was above the Bayes factor threshold for significance of 0.1, supporting that there is no significant effect of nutrition support on all‐cause mortality at maximum follow‐up.
Risk of bias and sensitivity analyses
We rated the risk of bias of the outcome result as high.
The 'best‐worst' and 'worst‐best' case meta‐analyses showed that incomplete outcome data bias has the potential to influence the results ('best‐worst' random‐effects meta‐analysis: RR 0.77, 95% CI 0.69 to 0.85, P < 0.001, 23,700 participants, 127 trials, low quality of evidence, Analysis 2.12; 'worst‐best' random‐effects meta‐analysis: RR 1.09, 95% CI 0.98 to 1.23, P = 0.12, 23,700 participants, 127 trials, low quality of evidence, Analysis 2.13). Data were imputed for 25 trials.
2.12. Analysis.

Comparison 2 All‐cause mortality ‐ maximum follow‐up, Outcome 12 All‐cause mortality ‐ 'best‐worst case' scenario.
2.13. Analysis.
Comparison 2 All‐cause mortality ‐ maximum follow‐up, Outcome 13 All‐cause mortality ‐ 'worst‐best case' scenario.
Visual inspection of the funnel plots showed signs of asymmetry (Supplementary online material). Harbord's test showed a small study effect (P = 0.024). Hence, we assessed the risk of publication bias as high.
Subgroup analyses
Analysis 2.3, comparing trials with different modes of delivery: test for subgroup difference showed no statistically significant difference (subgroup difference P = 0.35).
2.3. Analysis.
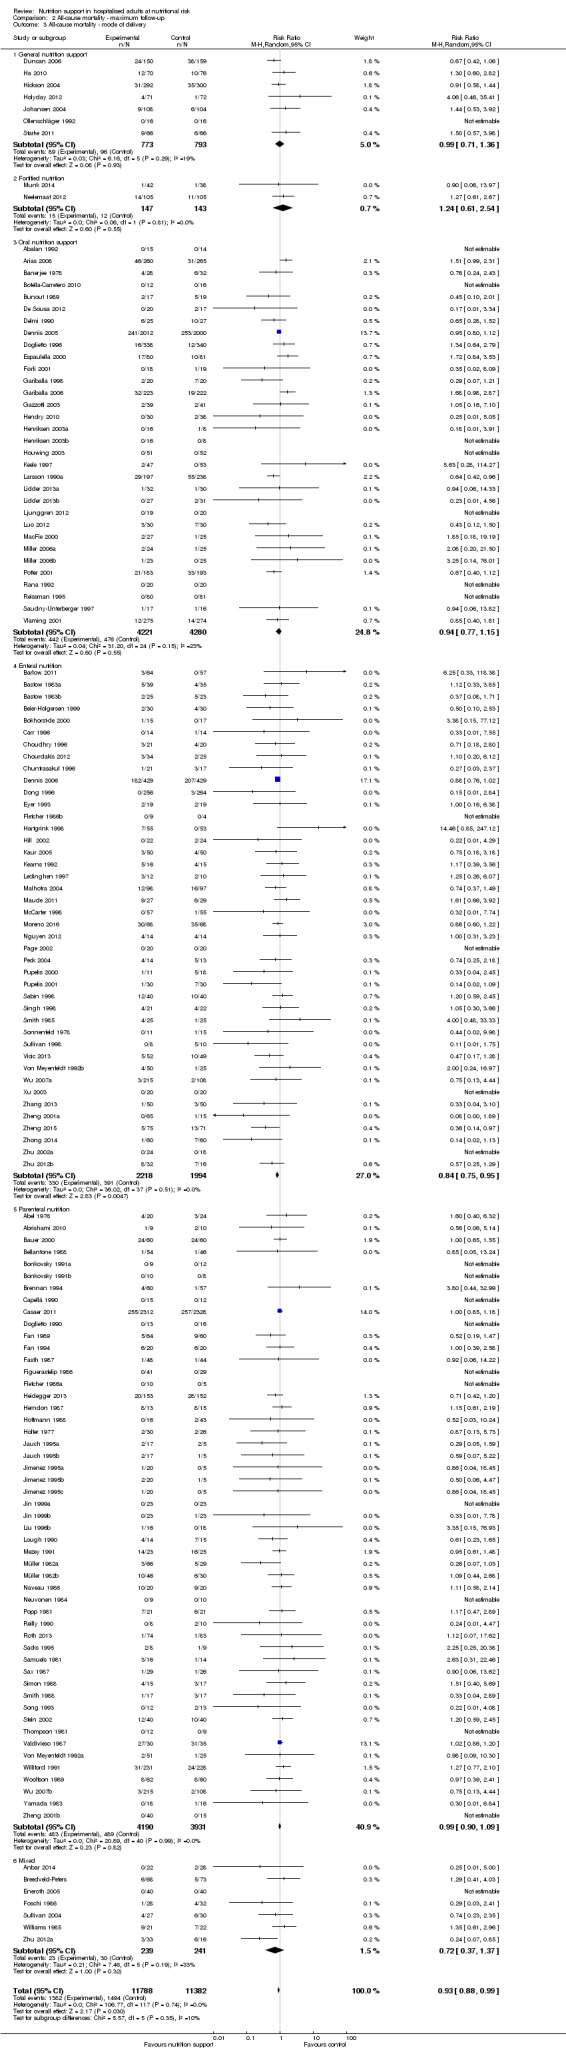
Comparison 2 All‐cause mortality ‐ maximum follow‐up, Outcome 3 All‐cause mortality ‐ mode of delivery.
Analysis 2.4, comparing trials with participants from different medical specialties: test for subgroup difference showed no statistically significant difference (subgroup difference P = 0.40).
2.4. Analysis.
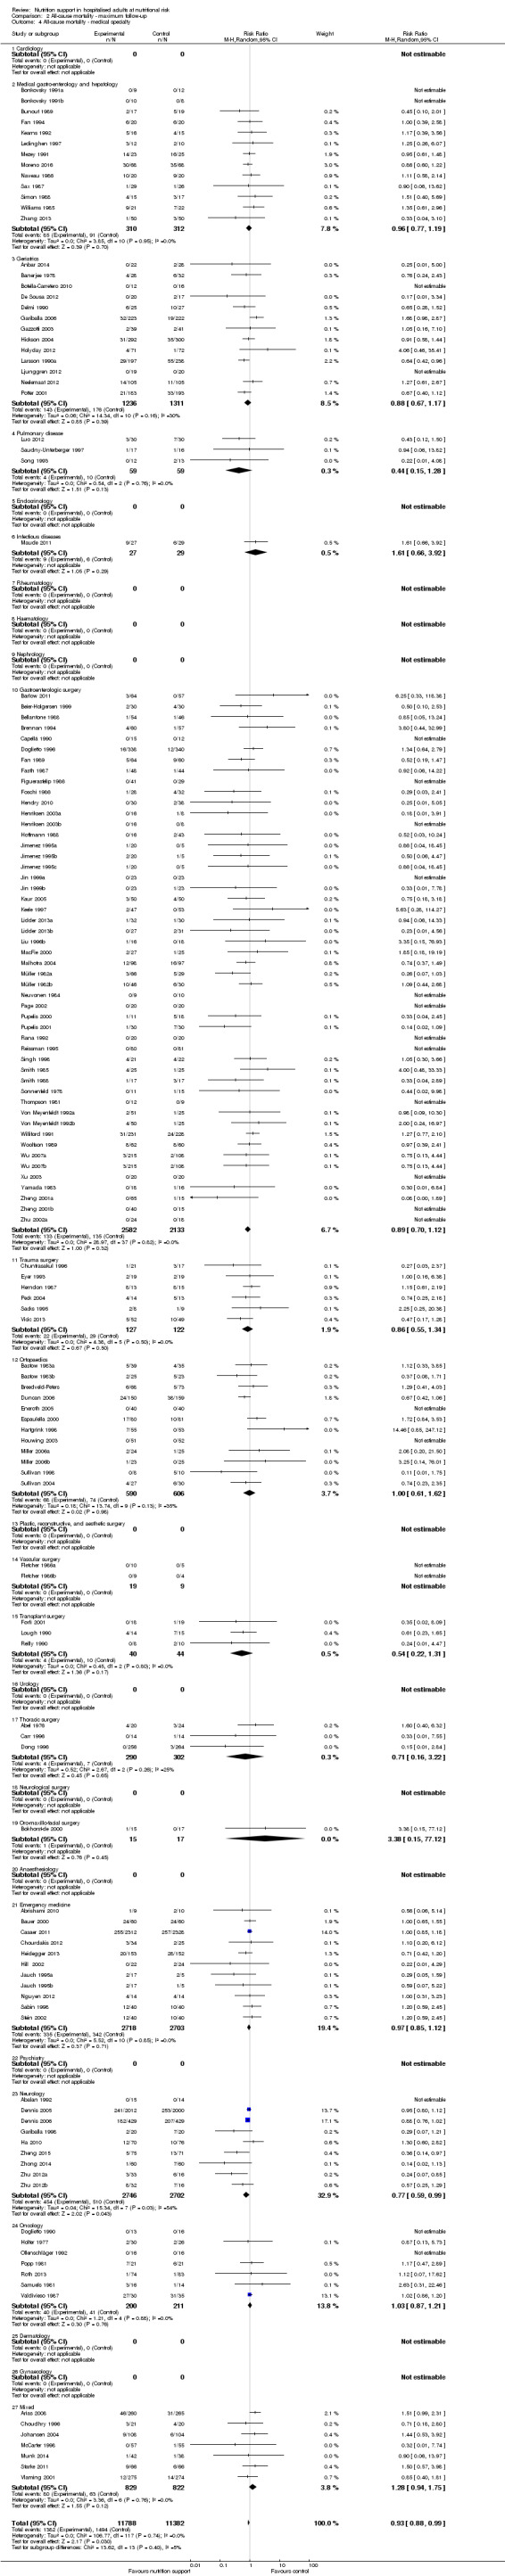
Comparison 2 All‐cause mortality ‐ maximum follow‐up, Outcome 4 All‐cause mortality ‐ medical specialty.
Analysis 2.5, comparing trials where the adequacy of the amount of calories received was different: test for subgroup difference showed no statistically significant difference (subgroup difference P = 0.61).
2.5. Analysis.
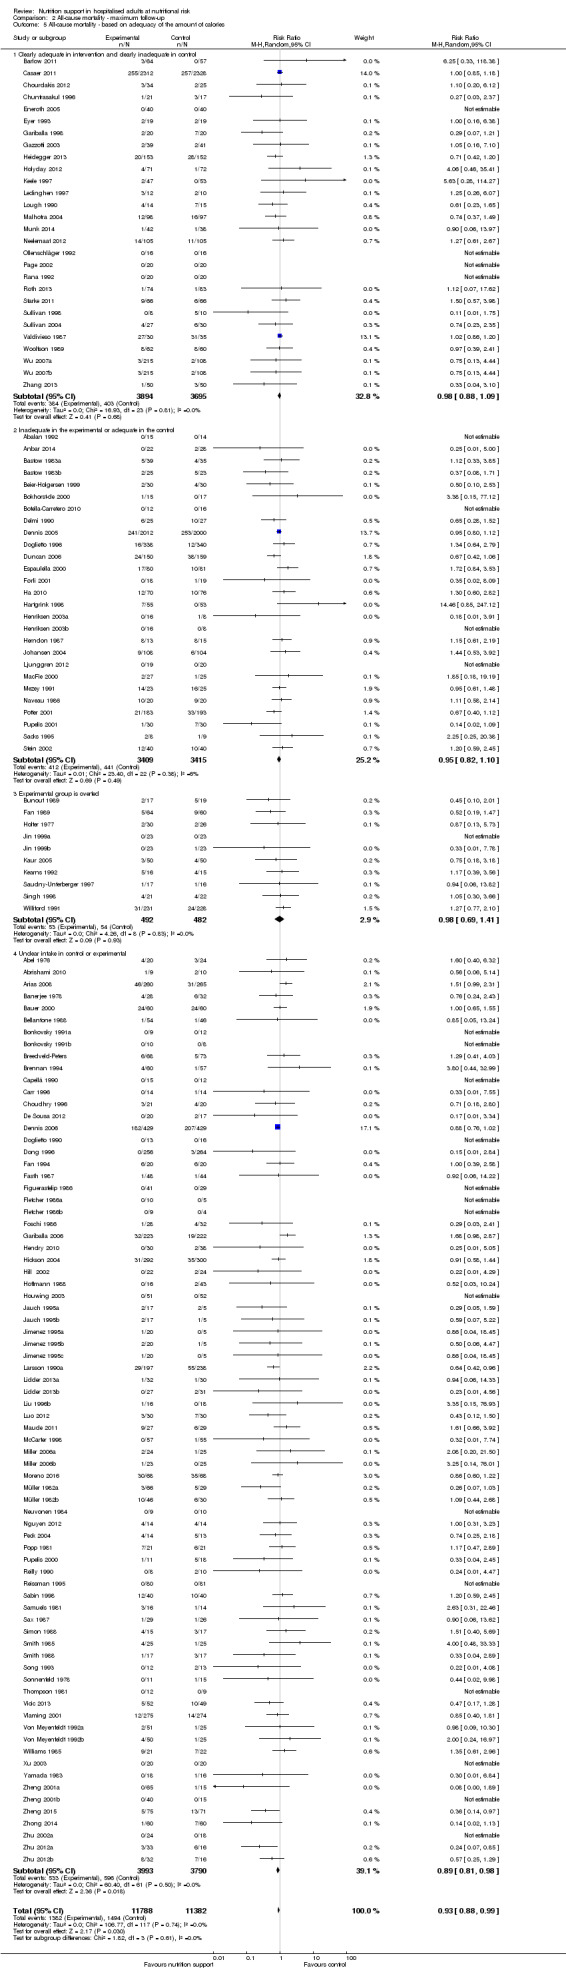
Comparison 2 All‐cause mortality ‐ maximum follow‐up, Outcome 5 All‐cause mortality ‐ based on adequacy of the amount of calories.
Analysis 2.6, comparing trials with different screening tools: test for subgroup difference showed no statistically significant difference (subgroup difference P = 0.14).
2.6. Analysis.
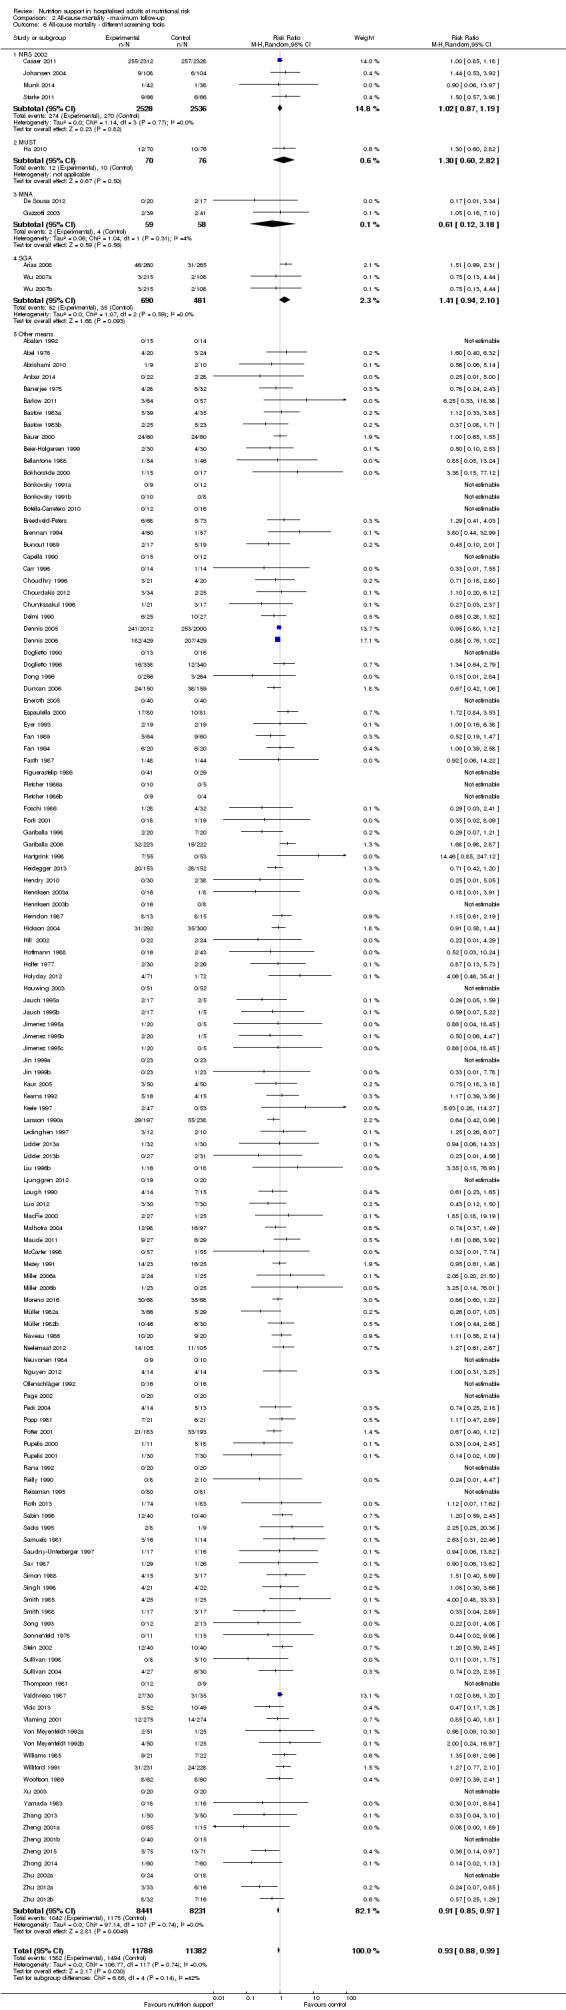
Comparison 2 All‐cause mortality ‐ maximum follow‐up, Outcome 6 All‐cause mortality ‐ different screening tools.
Analysis 2.7, comparing trials where participants were at nutritional risk according to specific condition: test for subgroup difference showed no statistically significant difference (subgroup difference P = 0.67).
2.7. Analysis.
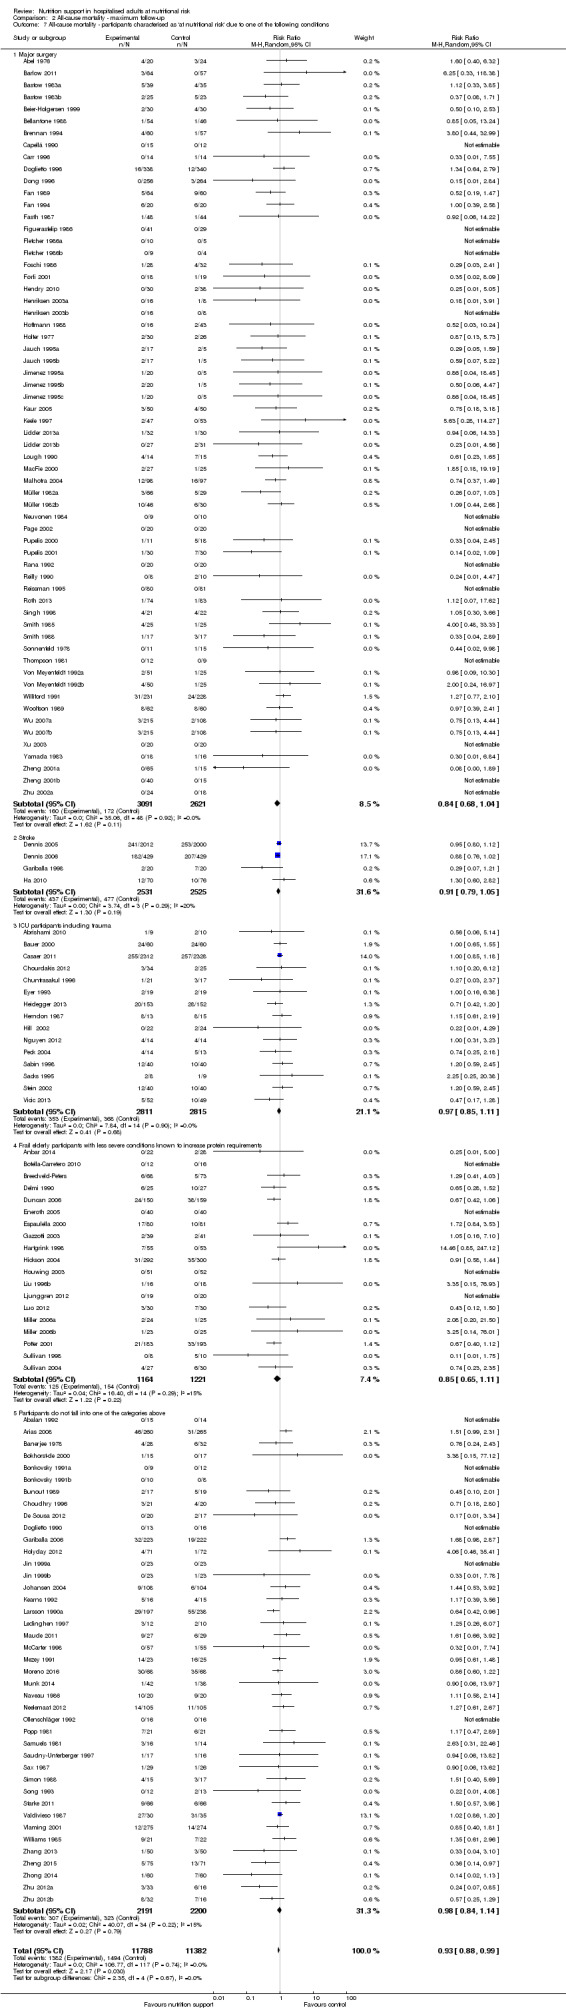
Comparison 2 All‐cause mortality ‐ maximum follow‐up, Outcome 7 All‐cause mortality ‐ participants characterised as 'at nutritional risk' due to one of the following conditions.
Analysis 2.8, comparing trials where participants were at nutritional risk according to specific criteria (BMI, weight, insufficient food intake): test for subgroup difference showed no statistically significant difference (subgroup difference P = 0.80).
2.8. Analysis.
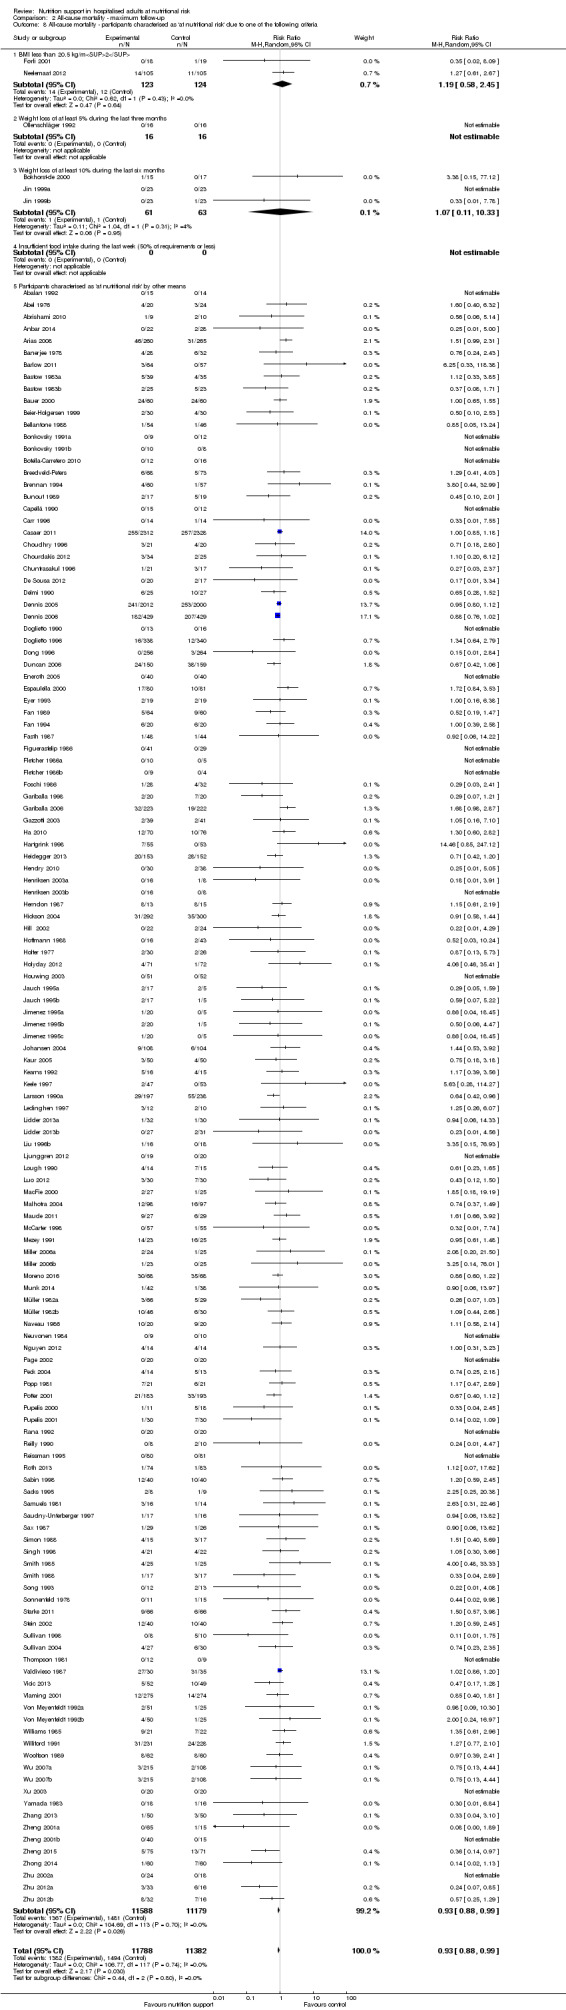
Comparison 2 All‐cause mortality ‐ maximum follow‐up, Outcome 8 All‐cause mortality ‐ participants characterised as 'at nutritional risk' due to one of the following criteria.
Analysis 2.9, comparing trials where the participants were classified as at nutritional risk according to biomarkers or anthropometrics: test for subgroup difference showed no statistically significant difference (subgroup difference P = 0.21).
2.9. Analysis.
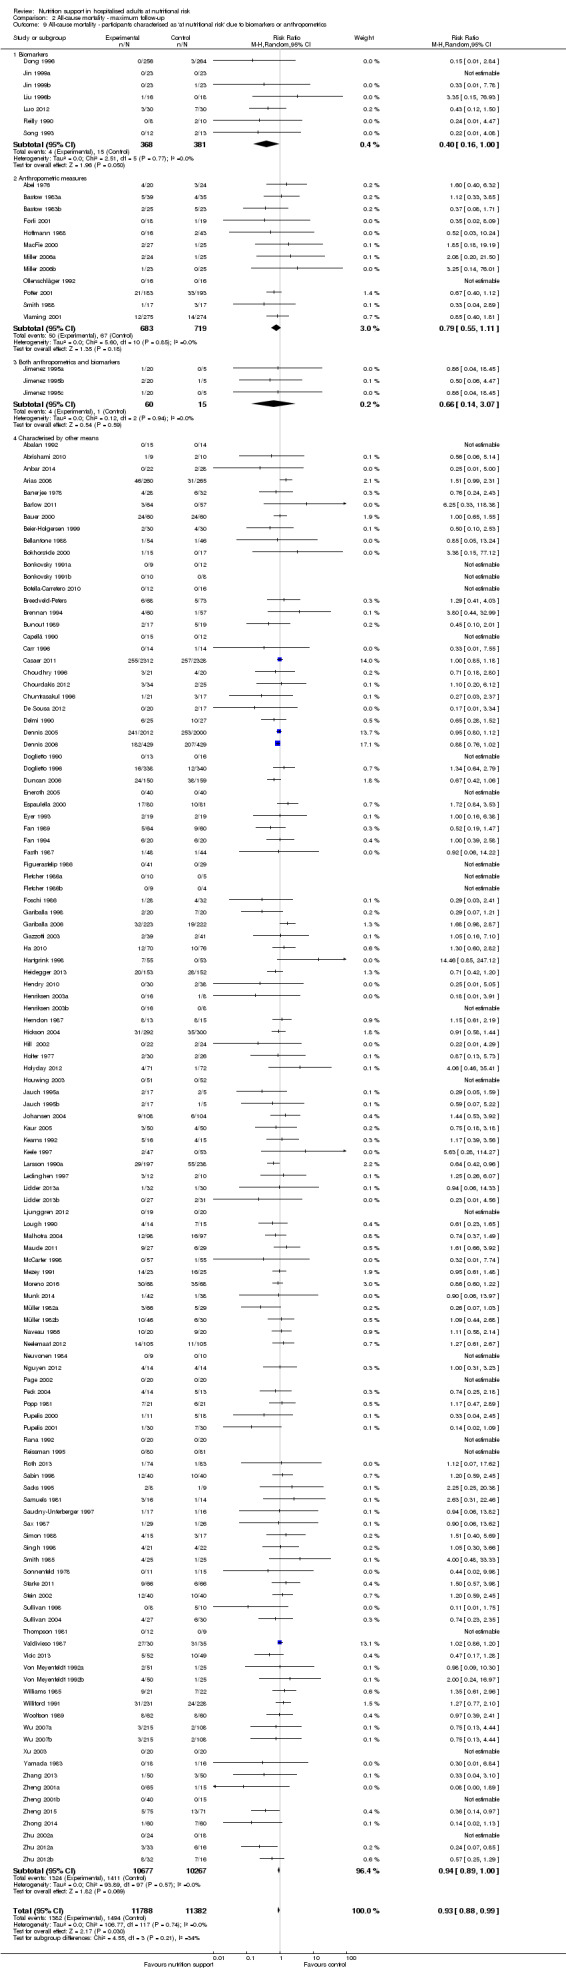
Comparison 2 All‐cause mortality ‐ maximum follow‐up, Outcome 9 All‐cause mortality ‐ participants characterised as 'at nutritional risk' due to biomarkers or anthropometrics.
Analysis 2.10, comparing trials according to publication year: test for subgroup difference showed no statistically significant difference (subgroup difference P = 0.92).
2.10. Analysis.
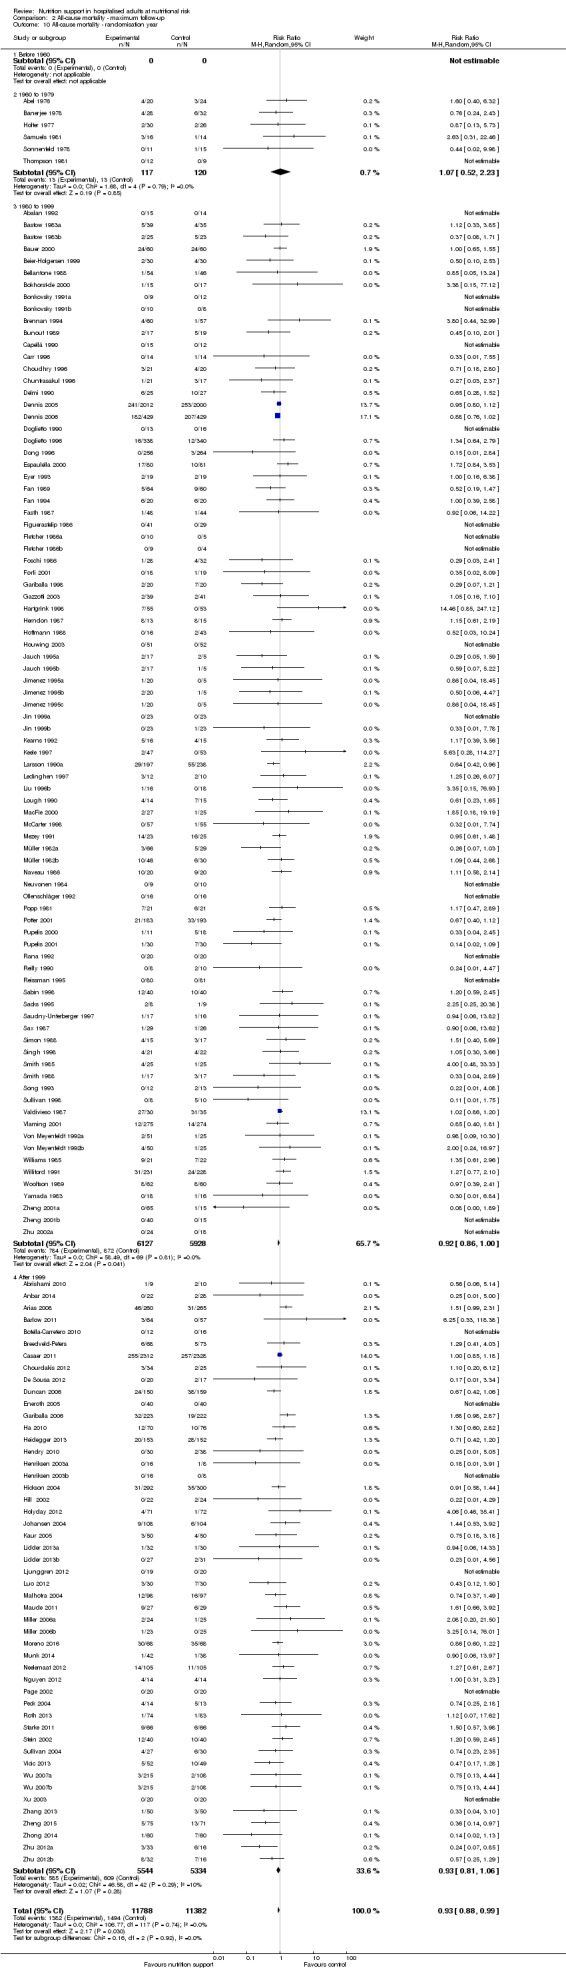
Comparison 2 All‐cause mortality ‐ maximum follow‐up, Outcome 10 All‐cause mortality ‐ randomisation year.
Analysis 2.11, comparing the length of the intervention: test for subgroup difference showed no statistically significant difference (subgroup difference P = 0.58).
2.11. Analysis.
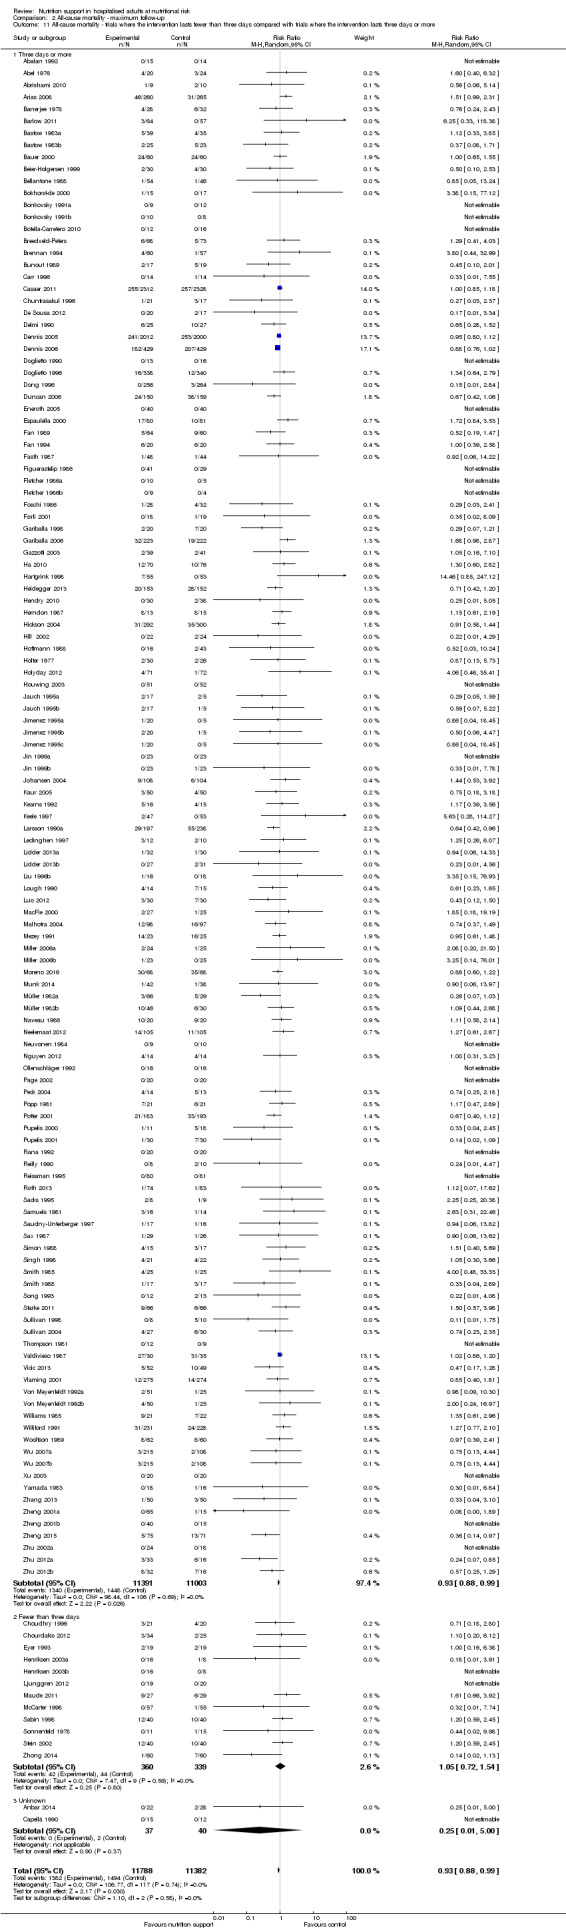
Comparison 2 All‐cause mortality ‐ maximum follow‐up, Outcome 11 All‐cause mortality ‐ trials where the intervention lasts fewer than three days compared with trials where the intervention lasts three days or more.
Zero‐event handling
To test the robustness of our results according to the type of zero‐event handling, we conducted our meta‐analysis using the Trial Sequential Analysis software. We performed our meta‐analysis using both the 'reciprocal of opposite intervention group' continuity correction, a constant continuity correction using both 0.5, 0.01 and 0.001, and an empirical continuity correction using 0.5, 0.01 and 0.001. None of the meta‐analyses produced a P value under 0.025.
Serious adverse events
End of intervention
One hundred and twenty‐three of 244 trials (50.4%), covering 22,087 participants, reported serious adverse events at end of intervention. All trials were at high risk of bias. Nine hundred and ninety‐six of 11,260 nutrition support participants (8.8%) experienced one or more serious adverse events versus 1067 of 10,827 control participants (9.9%). Overall, we found no statistically significant benefit or harm of nutrition support at the end of intervention, considering a P value of less than 0.025 as significant (Jakobsen 2014) (random‐effects model meta‐analysis: RR 0.93, 95% CI 0.86 to 1.01, P = 0.07, I2 = 0%, 22,087 participants, 123 trials, low quality of evidence, Analysis 3.1). We present an overview of serious adverse events in specific trials in Table 3. The point estimate of absolute risk for short‐term serious adverse events was non‐significantly 0.7% lower following nutrition support compared with control (9.9% versus 9.2% (8.5% to 10%)).
3.1. Analysis.
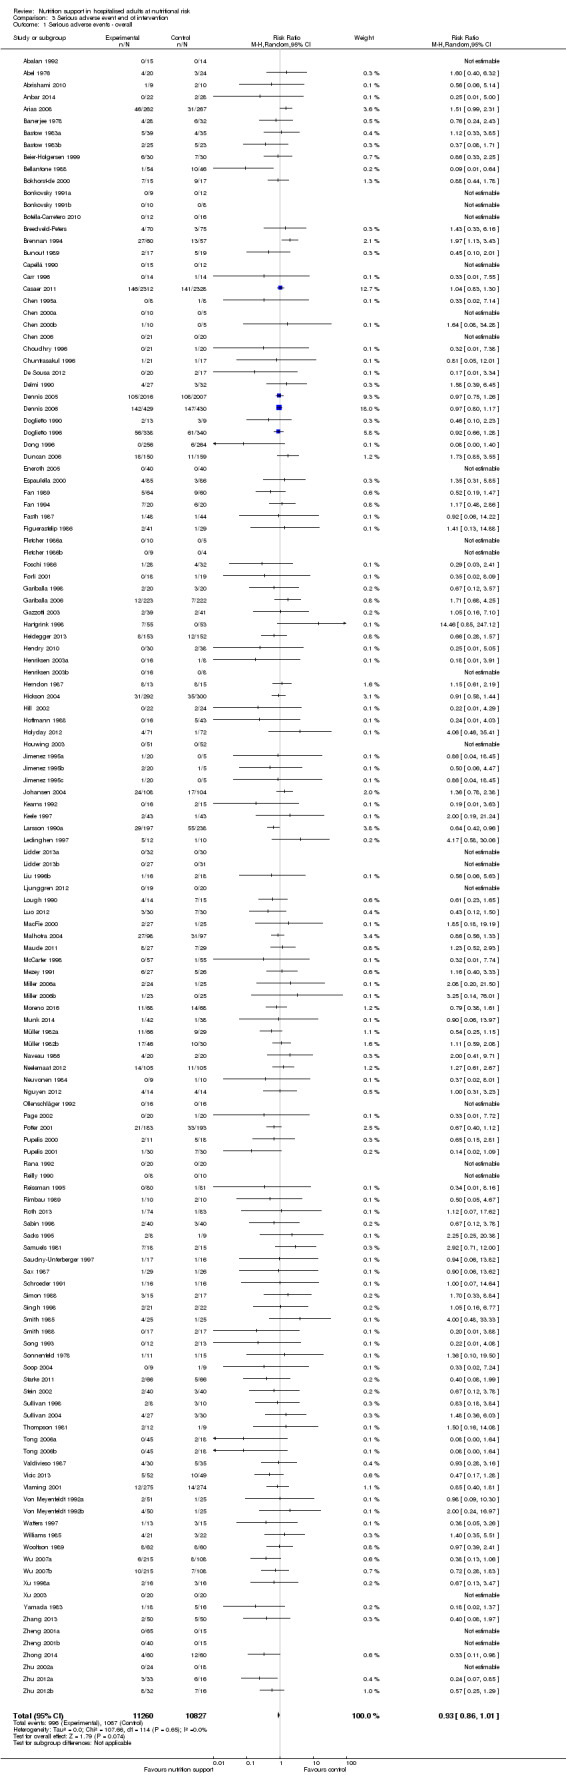
Comparison 3 Serious adverse event end of intervention, Outcome 1 Serious adverse events ‐ overall.
2. Serious adverse events (end of intervention).
| Trial | Experimental intervention | Type and number of participants with a serious adverse events (Experimental group) | Proportion of participants with a serious adverse event (Experimental group) | Type and number of participants with a serious adverse events (Control group) | Proportion of participants with a serious adverse event (Control group) |
| Bellantone 1988 | Parenteral nutrition | 1 sepsis | 1 out of 54 | 10 sepsis | 10 out of 46 |
| Bozzetti 2000 | Parenteral nutrition | 1 anastomotic leak, 3 respiratory infections, 2 respiratory insufficiency | 6 out of 43 | 2 anastomotic leaks, 1 renal failure, 2 abdominal abscesses, 4 respiratory infections, 3 respiratory insufficieny | 12 out of 47 |
| Brennan 1994 | Parenteral nutrition | 7 anastomotic leaks, 5 pneumonias, 1 GI haemorrhages, 8 GI fistula, 4 ileus, 2 myocardial infarction, 12 abscess, 4 deep infection, 7 peritonitis | 50 out of 60 | 3 anastomotic leaks, 6 pneumonias, 1 pulmonary embolism, 2 GI haemorrhages, 5 GI fistula, 1 myocardial infarction, 2 abscess, 4 deep infection, 2 peritonitis | 26 out of 57 |
| Chen 1995a | Enteral nutrition | no serious adverse events reported | 0 out of 16 | 1 anastomotic leak | 1 out of 8 |
| Chen 2000a | Enteral nutrition | 1 anastomotic leak | 1 out of 10 | no serious adverse events reported | 0 out of 10 |
| Chen 2006 | Enteral nutrition | no serious adverse events reported | 0 out of 21 | 1 septic complication | 1 out of 20 |
| Dennis 2005 | Oral nutrition | 50 strokes, 23 pulmonary embolisms, 43 DVTs, 28 GI haemorrhages, 28 ACS' | 172 out of 2012 | 43 strokes, 18 pulmonary embolism, 29 DVTs, 18 GI haemorrhage, 22 ACS | 130 out of 2000 |
| Dennis 2006 | Enteral nutrition | 15 strokes, 6 pulmonary embolisms, 11 DVTs, 22 GI haemorrhages, 7 ACS' | 61 out of 429 | 23 strokes, 8 pulmonary embolisms, 13 DVTs, 11 GI haemorrhages, 13 ACS' | 68 out of 428 |
| Doglietto 1990 | Parenteral nutrition | 3 sepsis | 3 out of 9 | 7 sepsis | 7 out of 12 |
| Doglietto 1996 | Oral nutrition | 20 anastomotic leaks, 14 pneumonias, 2 pulmonary embolisms, 2 renal failure, 6 abdominal abscess, 3 unspecific infection, 10 wound dehiscences, 1 pulmonary failure, 11 gastrointestinal complications, 6 cardiovascular complications, 4 haemoperitoneum | 79 out of 338 | 18 anastomotic leaks, 9 pneumonias, 1 pulmonary embolisms, 3 renal failure, 1 abdominal abscess, 2 unspecific infection, 3 wound dehiscences, 2 pulmonary failure, 6 bacteraemia, 23 gastrointestinal complications, 6 cardiovascular complications, 5 haemoperitoneum | 79 out of 340 |
| Ding 2009 | Parenteral nutrition | 1 respiratory infection | 1 out of 21 | 2 respiratory infection | 2 out of 21 |
| Dong 1996 | Enteral nutrition | no serious adverse events reported | 0 out of 256 | 6 anastomotic leaks | 6 out of 264 |
| Fan 1994 | Parenteral nutrition | 4 GI haemorrhages, 4 GI fistulas, 4 hepatic comas | 12 out of 64 | 1 GI haemorrhages, 5 GI fistulas, 4 hepatic comas | 10 out of 60 |
| Hartgrink 1998 | Enteral nutrition | 25 pressure sores | 25 out of 48 | 30 pressure sores | 30 out of 53 |
| Hoffmann 1988 | Enteral nutrition | no serious adverse events reported | 0 out of 43 | 3 anastomotic leaks, 2 myocardial infarction | 5 out of 16 |
| Ji 1999 | Enteral nutrition | 2 abdominal abscess | 2 out of 20 | no serious adverse events reported | 0 out of 10 |
| Johansen 2004 | General nutrition | 4 pneumonia, 1 DVTs, 4 sepsis, 2 empyemas, 0 gastroenteritis, 1 GI complications, | 12 out of 108 | 4 pneumonia, 1 stroke, 2 sepsis, 1 gastroenteritis, 2 GI complications | 10 out of 104 |
| Kearns 1992 | Enteral nutrition | 2 renal failures | 2 out of 16 | 2 renal failures | 2 out of 15 |
| Keele 1997 | Oral nutrition | no serious adverse events reported | 0 out of 43 | 1 GI perforation | 1 out of 43 |
| Larsson 1990a | Oral nutrition | 20 pressure sores | 20 out of 197 | 29 pressure sores | 29 out of 328 |
| Ledinghen 1997 | Enteral nutrition | 4 variceal bleedings, 1 peritonitis | 5 out of 12 | 1 peritonitis | 1 out of 10 |
| Liu 1996 | Parenteral nutrition | no serious adverse events reported | 0 out of 14 | 1 anastomotic leak, 1 GI fistula | 2 out of 15 |
| Malhotra 2004 | Enteral nutrition | 21 Pneumonia, Wound infection 27, Wound dehiscence 4, anastomotic Leak 7, Septicaemia 20 | 27 out of 98 | Pneumonia 30, Wound infection 31, Wound dehiscence 9, Leak 13, Septicaemia 30. | 31 out of 97 |
| Maude 2011 | Enteral nutrition | 8 sepsis | 8 out of 27 | 7 sepsis | 7 out of 29 |
| Neuvonen 1984 | Parenteral nutrition | no serious adverse events reported | 0 out of 9 | 1 sepsis | 1 out of 12 |
| Page 2002 | Enteral nutrition | no serious adverse events reported | 0 out of 20 | 1 pulmonary embolism | 1 out of 20 |
| Pupelis 2000 | Enteral nutrition | 2 peritonitis | 2 out of 11 | 5 peritonitis | 5 out of 18 |
| Pupelis 2001 | Enteral nutrition | no serious adverse events reported | 0 out of 30 | 4 GI fistulas | 4 out of 30 |
| Reissman 1995 | Oral nutrition | no serious adverse events reported | 0 out of 80 | 1 anastomotic leak | 1 out of 81 |
| Rimbau 1989 | Parenteral nutrition | 1 pneumonia | 1 out of 10 | 2 pneumonias | 2 out of 10 |
| Sabin 1998 | Parenteral nutrition | 2 pneumoperitoneum's | 2 out of 40 | 2 anastomotic leaks, 2 pneumoperitoneum's | 4 out of 40 |
| Samuels 1981 | Parenteral nutrition | 2 pneumonias, 5 sepsis | 7 out of 16 | 2 sepsis | 2 out of 14 |
| Schroeder 1991 | Enteral nutrition | 1 myocardial infarction | 1 out of 16 | 1 myocardial infarction | 1 out of 16 |
| Simon 1988 | Parenteral nutrition | no serious adverse events reported | 0 out of 15 | 2 hepatic encephalopathies | 2 out of 17 |
| Smith 1988 | Parenteral nutrition | no serious adverse events reported | 0 out of 17 | 2 respiratory infection | 2 out of 17 |
| Starke 2011 | General nutrition | no serious adverse events reported | 0 out of 66 | 1 stroke, 1 DVT, 1 septic arthritis, 2 myocardial infarction | 5 out of 66 |
| Thompson 1981 | Parenteral nutrition | 1 empyema, 1 pelvic abscess | 2 out of 12 | 1 intraabdominal abscess | 1 out of 9 |
| Tong 2006a | Mixed nutrition | 1 hepatic encephalopathy | 1 out of 90 | 4 anastomotic leak, 5 hepatic encephalopathies | 9 out of 36 |
| Vicic 2013 | Enteral nutrition | 2 sepsis, 2 multi organ failure, | 4 out of 52 | 6 sepsis, 3 multi organ failure | 9 out of 49 |
| Watters 1997 | Enteral nutrition | 1 anastomotic leak | 1 out of 13 | 3 anastomotic leaks | 3 out of 15 |
| Wu 2007a | Mixed nutrition | 11 anastomotic leaks, 6 DVT, 15 sepsis | 32 out of 430 | 10 anastomotic leaks, 15 sepsis | 25 out of 216 |
| Yamada 1983 | Parenteral nutrition | 1 wound dehiscence | 1 out of 18 | 1 anastomotic leak, 2 pneumonias, 1 sepsis, 1 ileus | 5 out of 16 |
| Zhang 2013 | Enteral nutrition | 2 GI haemorrhage | 2 out of 50 | 4 GI haemorrhage | 4 out of 50 |
Heterogeneity
Neither visual inspection of the forest plots nor tests for statistical heterogeneity (I2 = 0%; P = 0.65) indicated significant heterogeneity.
Trial Sequential Analysis
The Trial Sequential Analysis showed that the Z‐curve crossed the boundary for futility. Hence, there is firm evidence that nutrition support versus control does not reduce the risk ratio for serious adverse events by 20% at end of intervention (Supplementary online material). A post hoc Trial Sequential Analysis showed that the information size was also large enough to rule out that nutrition support versus control reduces the risk ratio of serious adverse events by 11% or more (Supplementary online material). It should be noted that Trial Sequential Analysis only assessed the risk of random error and did not consider the risk of bias.
Bayes factor
We calculated the Bayes factor based on a RR of 20%, and the meta‐analysis result (RR 0.93). Bayes factor (2.0) was above the Bayes factor threshold for significance of 0.1, supporting that there is no significant effect of nutrition support on serious adverse events at end of intervention.
Risk of bias and sensitivity analyses
We rated the risk of bias of the outcome result as high.
The 'best‐worst' and 'worst‐best' case meta‐analyses showed that incomplete outcome data bias has the potential to influence the results ('best‐worst' random‐effects meta‐analysis: RR 0.74, 95% CI 0.65 to 0.83, P < 0.001, 22,557 participants, 123 trials, low quality of evidence, Analysis 3.12; 'worst‐best' random‐effects meta‐analysis: RR 1.06, 95% CI 0.92 to 1.21, P = 0.53, 22,557 participants, 123 trials, low quality of evidence, Analysis 3.13). Data were imputed for 25 trials.
3.12. Analysis.
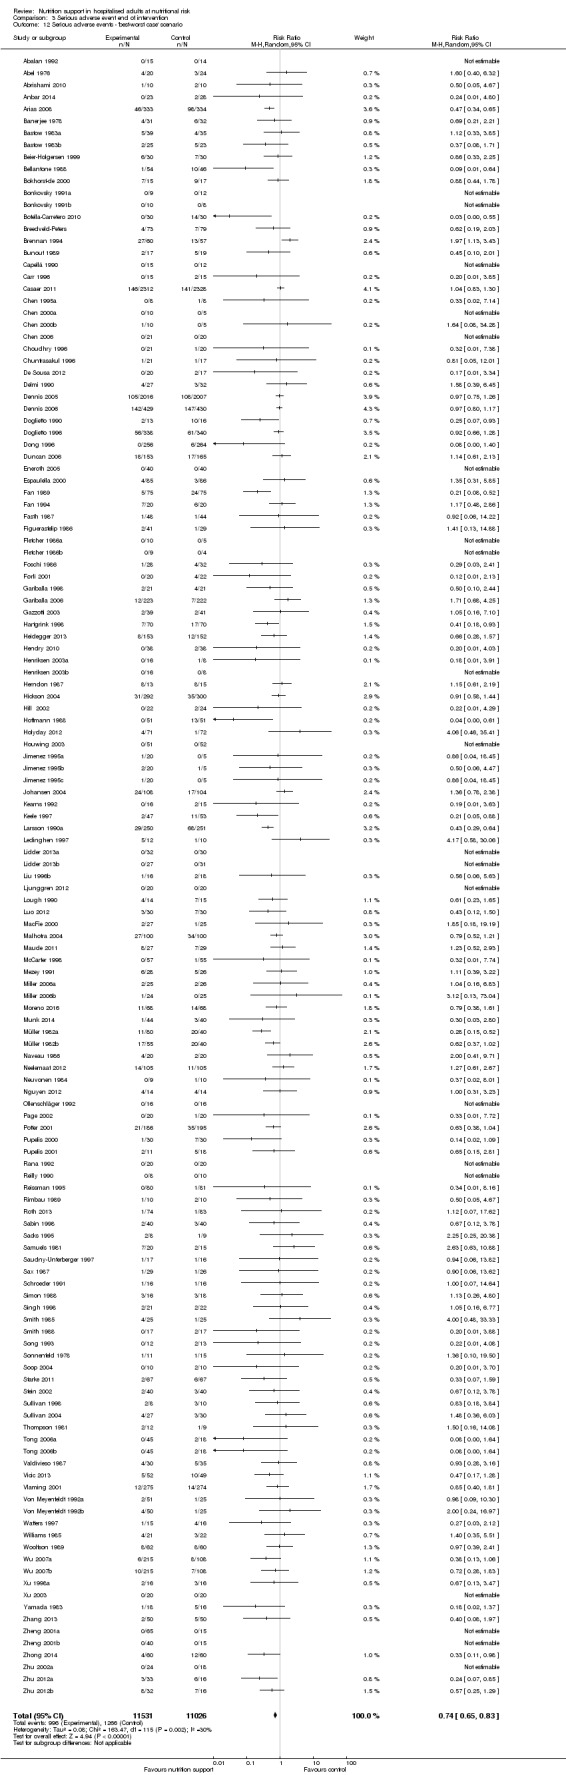
Comparison 3 Serious adverse event end of intervention, Outcome 12 Serious adverse events ‐ 'best‐worst case' scenario.
3.13. Analysis.
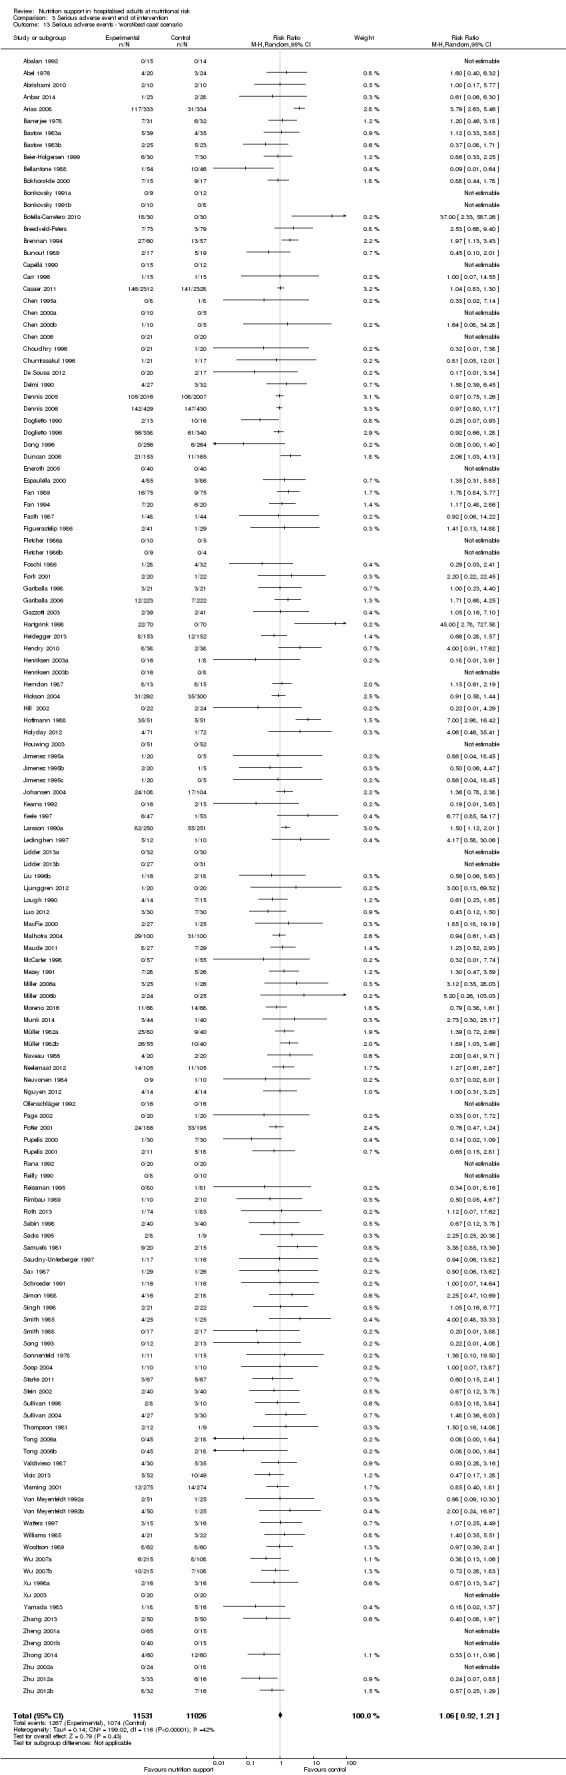
Comparison 3 Serious adverse event end of intervention, Outcome 13 Serious adverse events ‐ 'worst‐best case' scenario.
Visual inspection of the funnel plots showed signs of asymmetry (Supplementary online material). Harbord's test showed small‐study effects (P = 0.003). Hence, we assessed the risk of publication bias as high.
Subgroup analyses
Analysis 3.3, comparing trials with different modes of delivery: test for subgroup difference showed no statistically significant difference (subgroup difference P = 0.51).
3.3. Analysis.
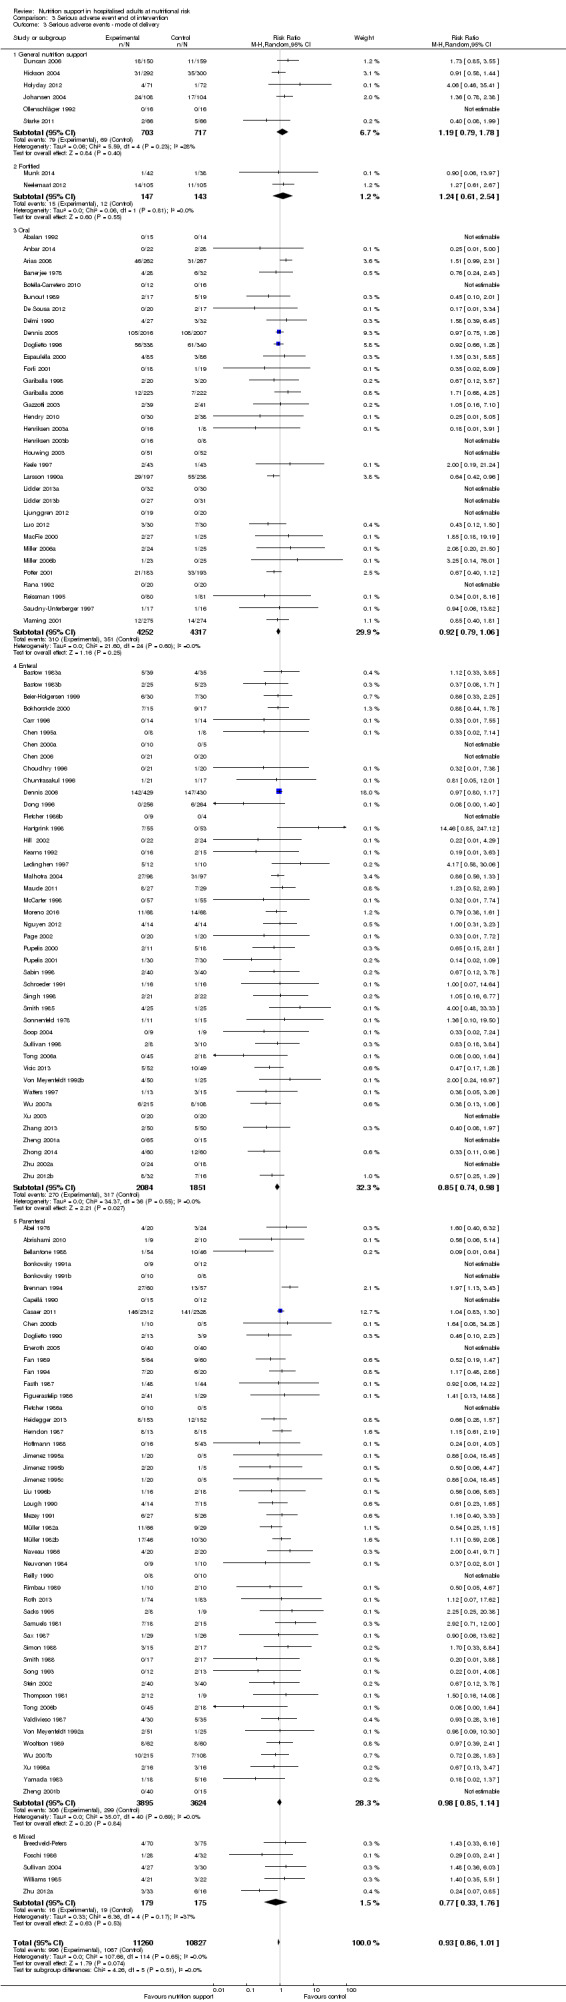
Comparison 3 Serious adverse event end of intervention, Outcome 3 Serious adverse events ‐ mode of delivery.
Analysis 3.4, comparing trials with participants from different medical specialties: test for subgroup difference showed no statistically significant difference (subgroup difference P = 0.45).
3.4. Analysis.
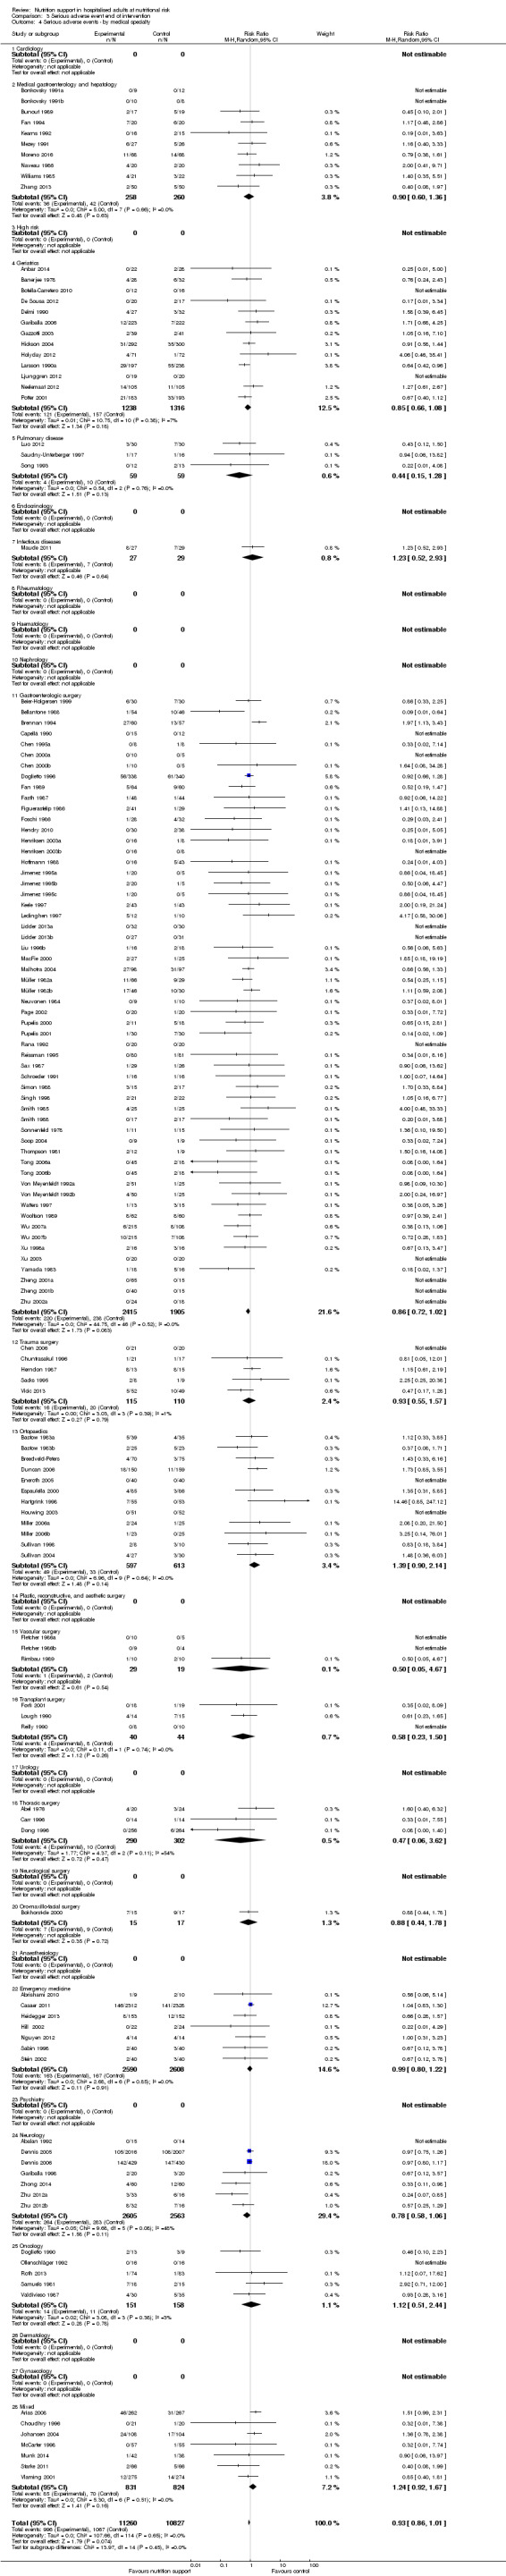
Comparison 3 Serious adverse event end of intervention, Outcome 4 Serious adverse events ‐ by medical specialty.
Analysis 3.5, comparing trials where the adequacy of the amount of calories received was different: test for subgroup difference showed no statistically significant difference (subgroup difference P = 0.52).
3.5. Analysis.
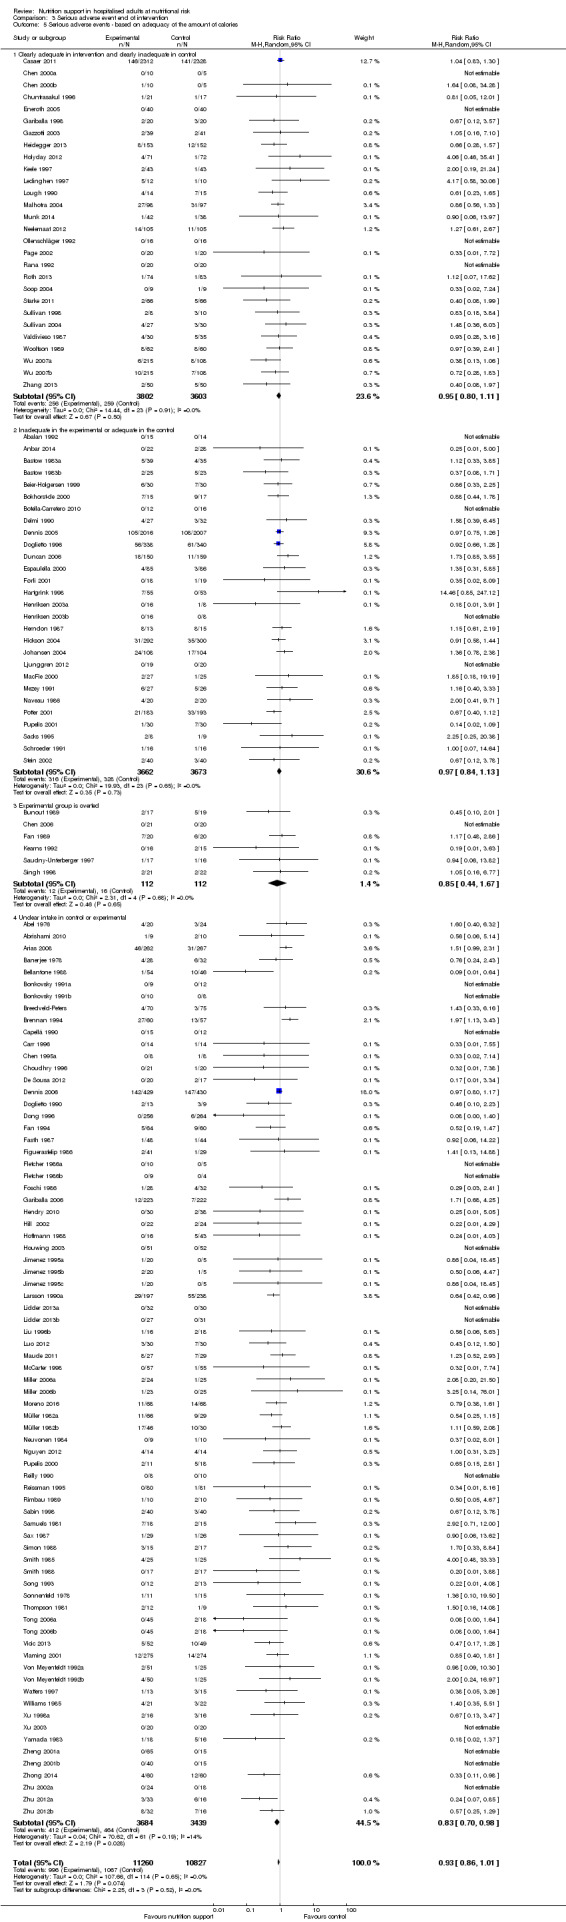
Comparison 3 Serious adverse event end of intervention, Outcome 5 Serious adverse events ‐ based on adequacy of the amount of calories.
Analysis 3.6, comparing trials with different screening tools: test for subgroup difference showed no statistically significant difference (subgroup difference P = 0.47).
3.6. Analysis.
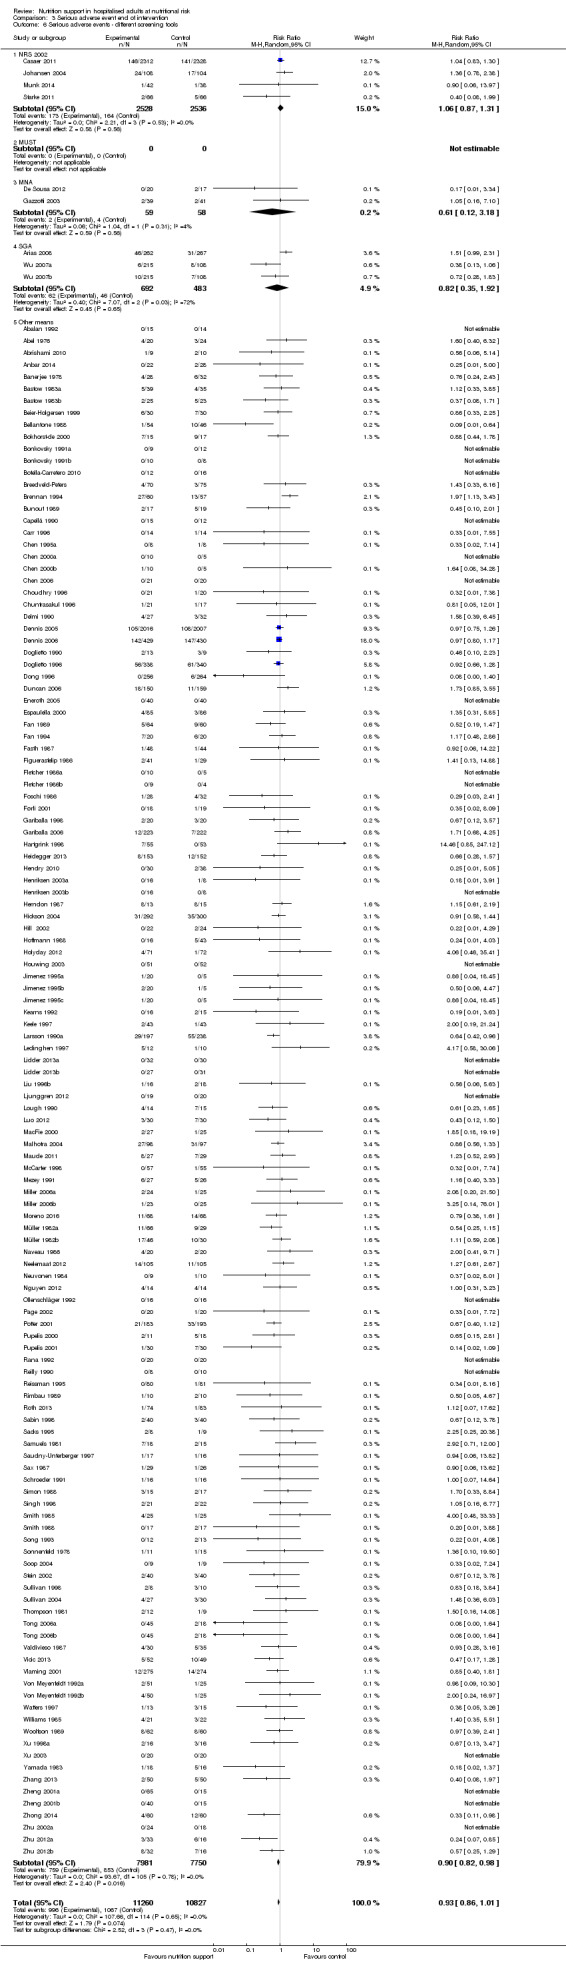
Comparison 3 Serious adverse event end of intervention, Outcome 6 Serious adverse events ‐ different screening tools.
Analysis 3.7, comparing trials where participants were at nutritional risk according to specific condition: test for subgroup difference showed no statistically significant difference (subgroup difference P = 0.40).
3.7. Analysis.
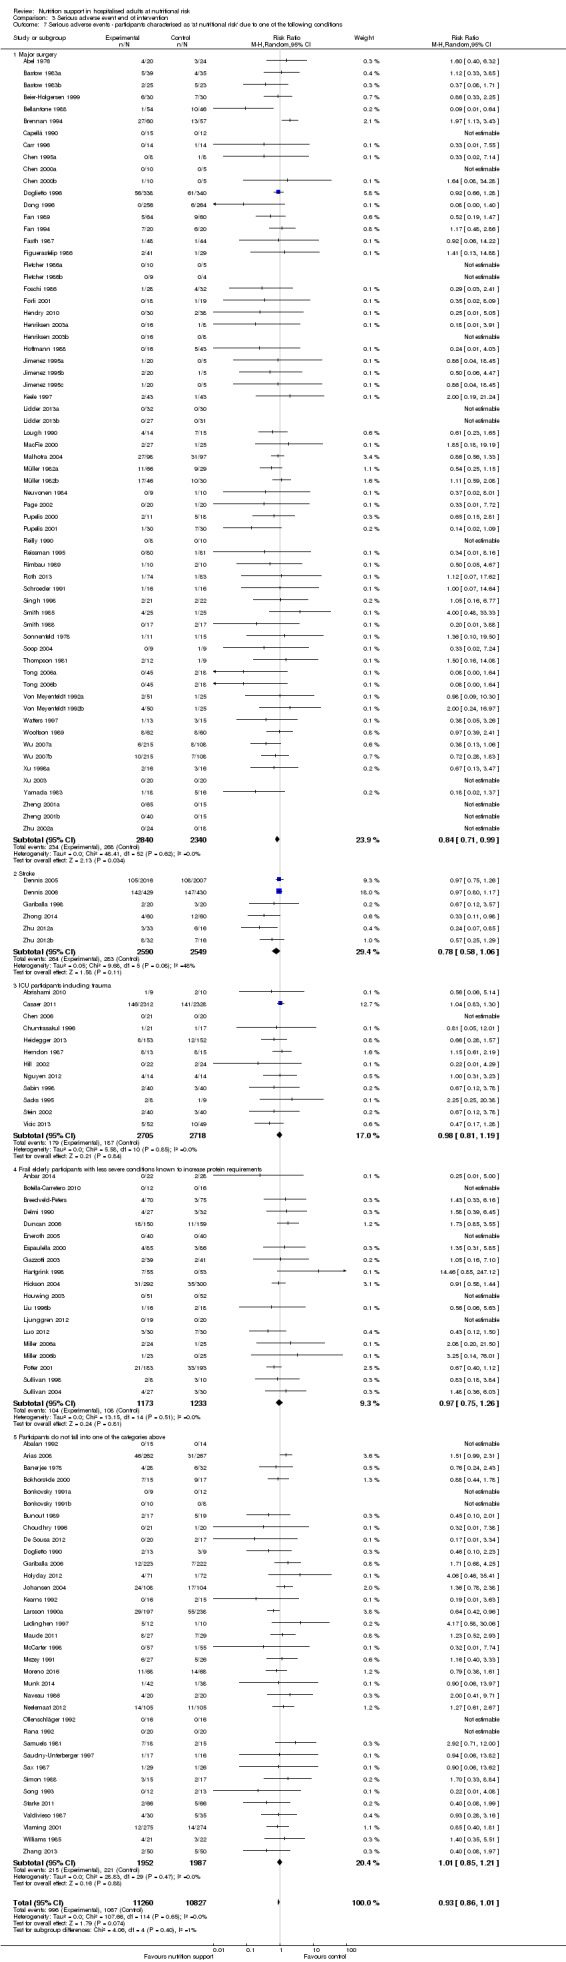
Comparison 3 Serious adverse event end of intervention, Outcome 7 Serious adverse events ‐ participants characterised as 'at nutritional risk' due to one of the following conditions.
Analysis 3.8, comparing trials where participants were at nutritional risk according to specific criteria (BMI, weight, insufficient food intake): test for subgroup difference showed no statistically significant difference (subgroup difference P = 0.79).
3.8. Analysis.
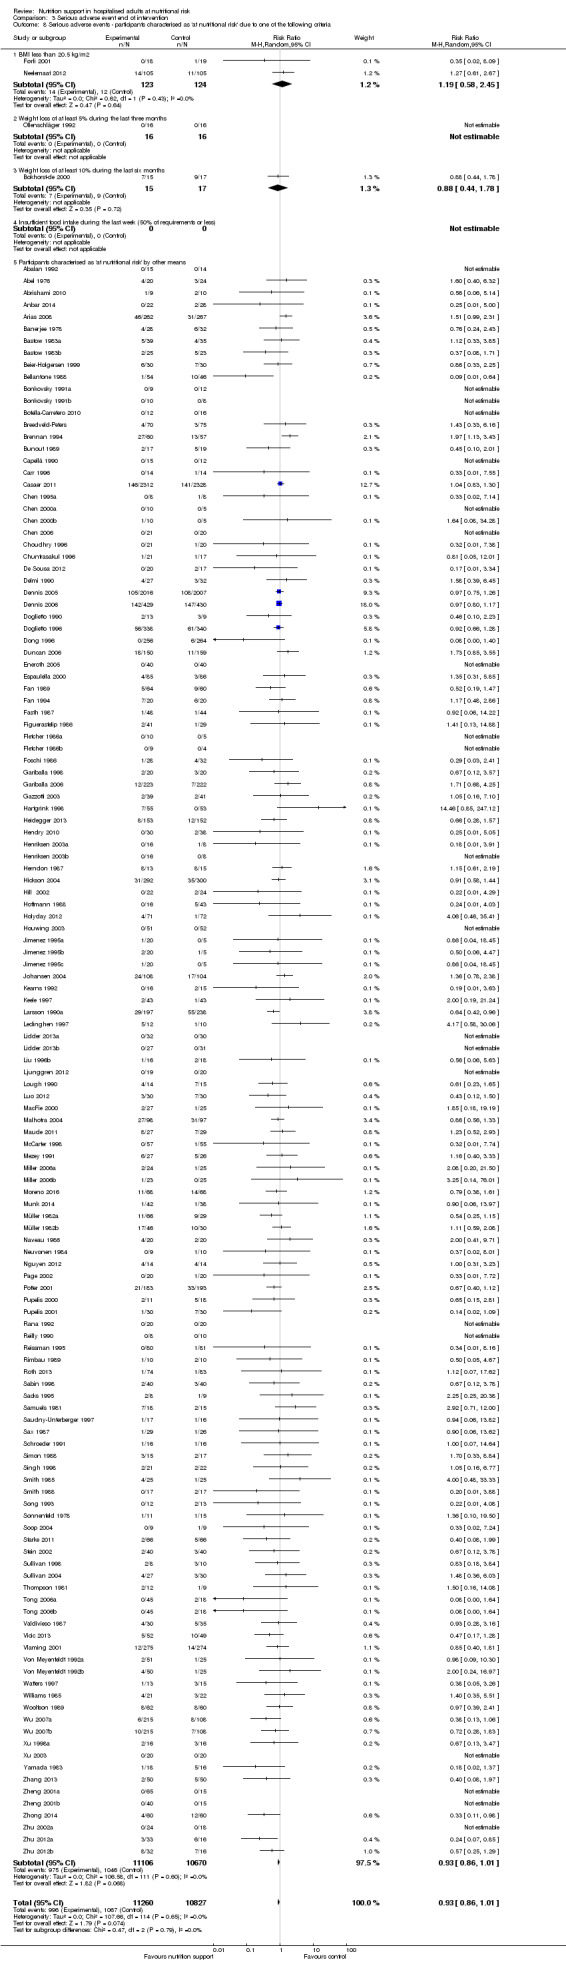
Comparison 3 Serious adverse event end of intervention, Outcome 8 Serious adverse events ‐ participants characterised as 'at nutritional risk' due to one of the following criteria.
Analysis 3.9, comparing trials where the participants were classified as at nutritional risk according to biomarkers or anthropometrics: test for subgroup difference showed no statistically significant difference (subgroup difference P = 0.15).
3.9. Analysis.
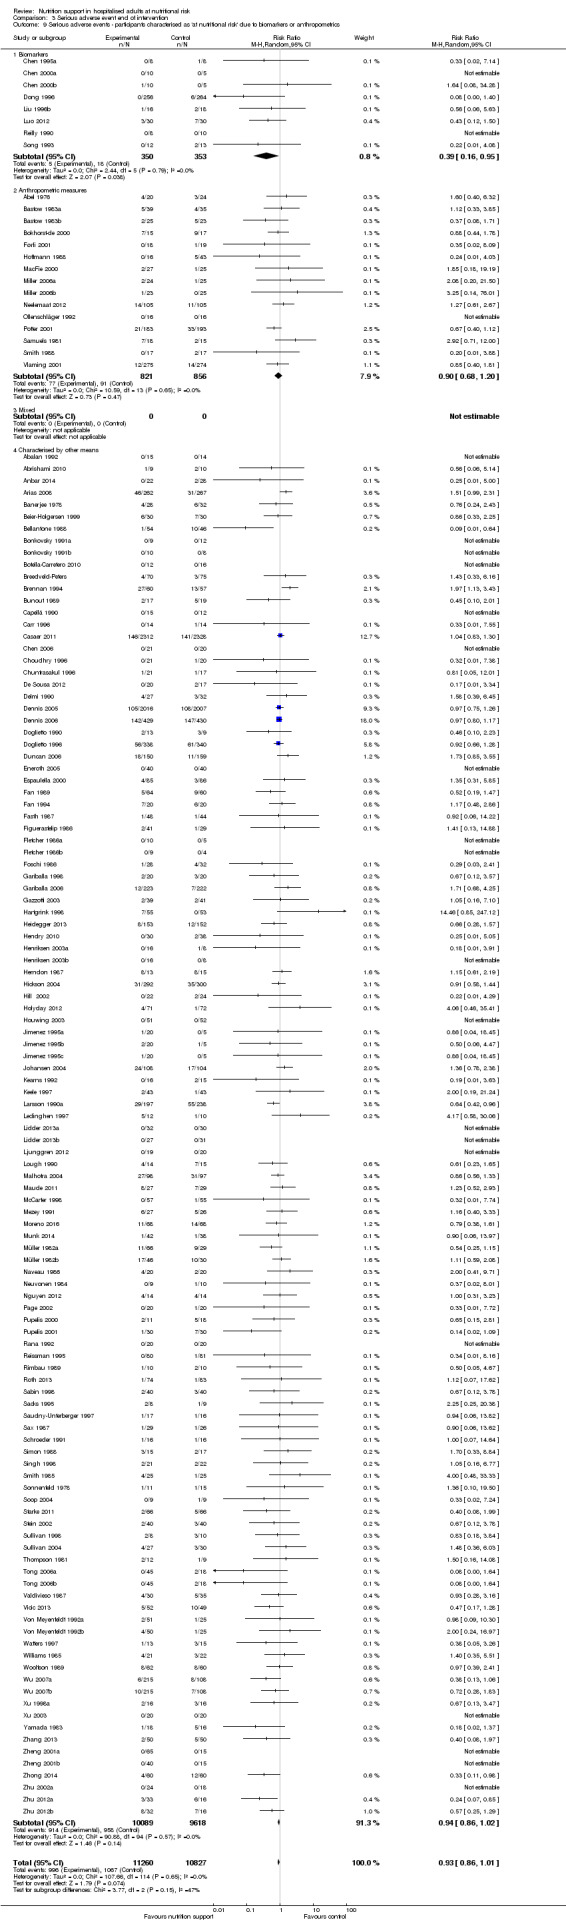
Comparison 3 Serious adverse event end of intervention, Outcome 9 Serious adverse events ‐ participants characterised as 'at nutritional risk' due to biomarkers or anthropometrics.
Analysis 3.10, comparing trials according to publication year: test for subgroup difference showed no statistically significant difference (subgroup difference P = 0.46).
3.10. Analysis.
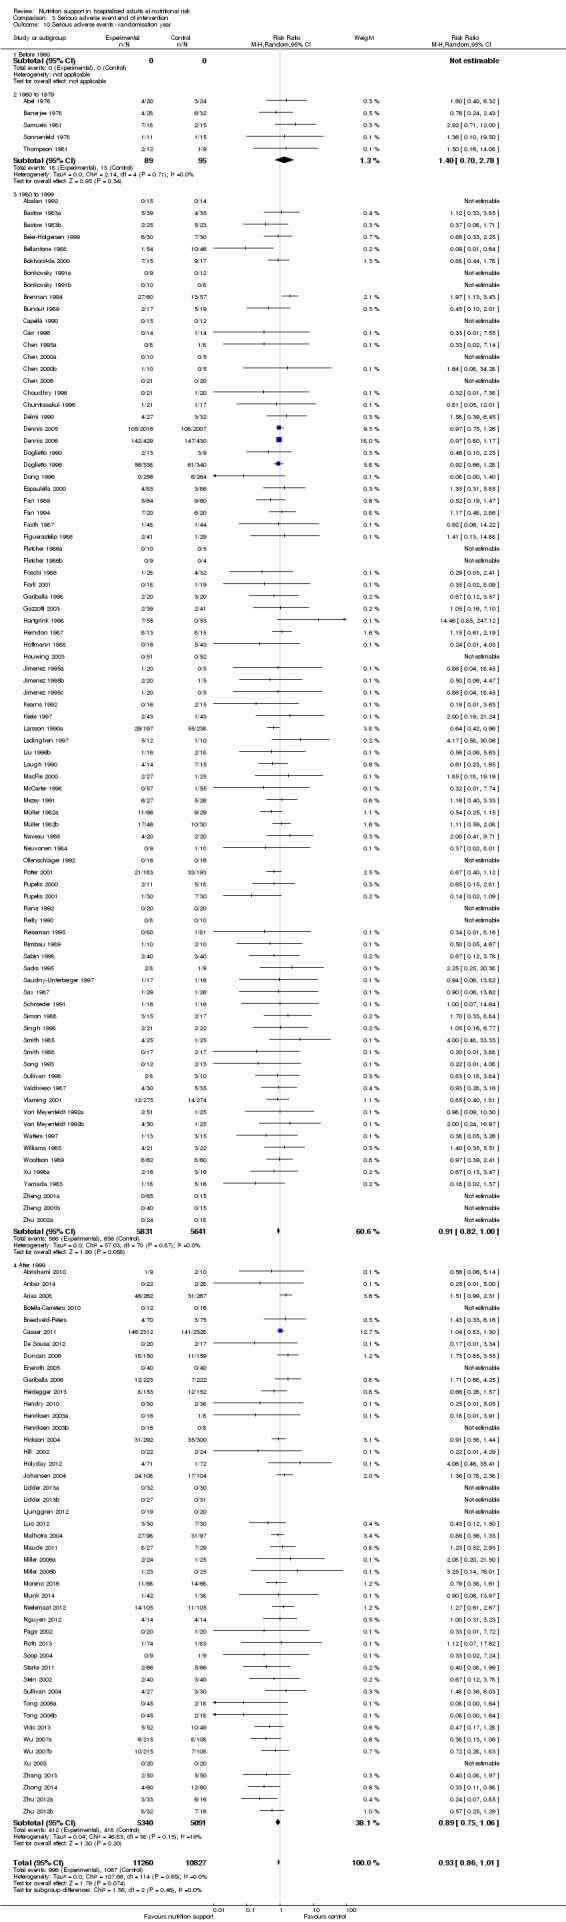
Comparison 3 Serious adverse event end of intervention, Outcome 10 Serious adverse events ‐ randomisation year.
Analysis 3.11, comparing the length of the intervention: test for subgroup difference showed no statistically significant difference (subgroup difference P = 0.35).
3.11. Analysis.
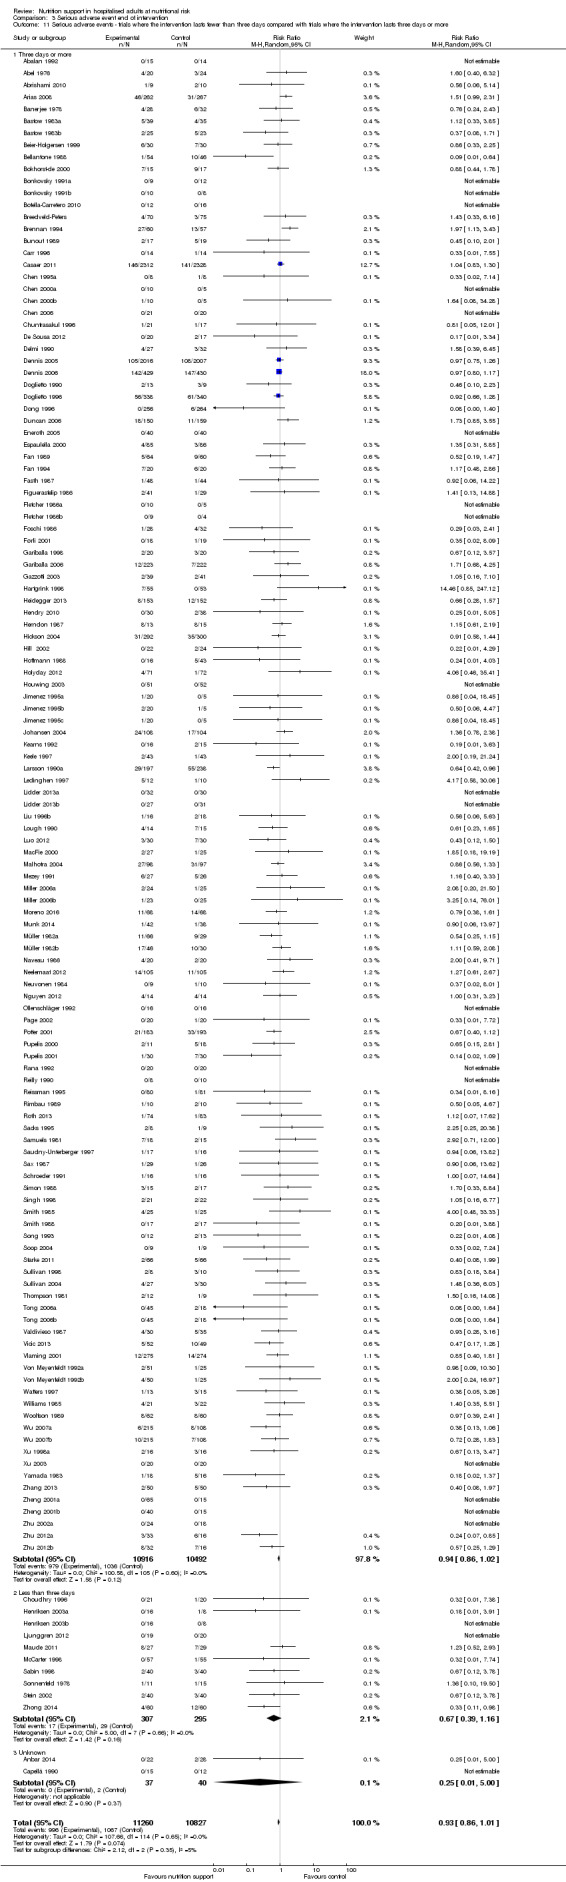
Comparison 3 Serious adverse event end of intervention, Outcome 11 Serious adverse events ‐ trials where the intervention lasts fewer than three days compared with trials where the intervention lasts three days or more.
Zero‐event handling
To test the robustness of our results according to the type of zero‐event handling, we conducted our meta‐analysis using the Trial Sequential Analysis software. We performed our meta‐analysis using both the 'reciprocal of opposite intervention group' continuity correction, a constant continuity correction using both 0.5, 0.01 and 0.001, and an empirical continuity correction using 0.5, 0.01 and 0.001. None of the meta‐analyses produced a P value under 0.025.
Maximum follow‐up
One hundred and thirty‐seven of 244 trials (56.14%), covering 23,413 participants, reported serious adverse events at maximum follow‐up. All trials were at high risk of bias. One thousand five hundred and eighty of 11,940 nutrition support participants (13.2%) experienced one or more serious adverse events versus 1741 of 11,473 control participants (15.2%). Overall, we found a statistically significant effect of nutrition support at maximum follow‐up, considering a P value of less than 0.025% significant (Jakobsen 2014) (random‐effects model meta‐analysis: RR 0.91, 95% CI 0.85 to 0.97, P = 0.004, I2 = 3%, 23,413 participants, 137 trials, low quality of evidence, Analysis 4.1). For an overview of the serious adverse events in specific trials please see Table 4. At maximum follow‐up the reduction in the absolute risk of serious adverse events was 1.5%, from 15.2% in control groups to 13.8% (12.9% to 14.7%) following nutritional support.
4.1. Analysis.
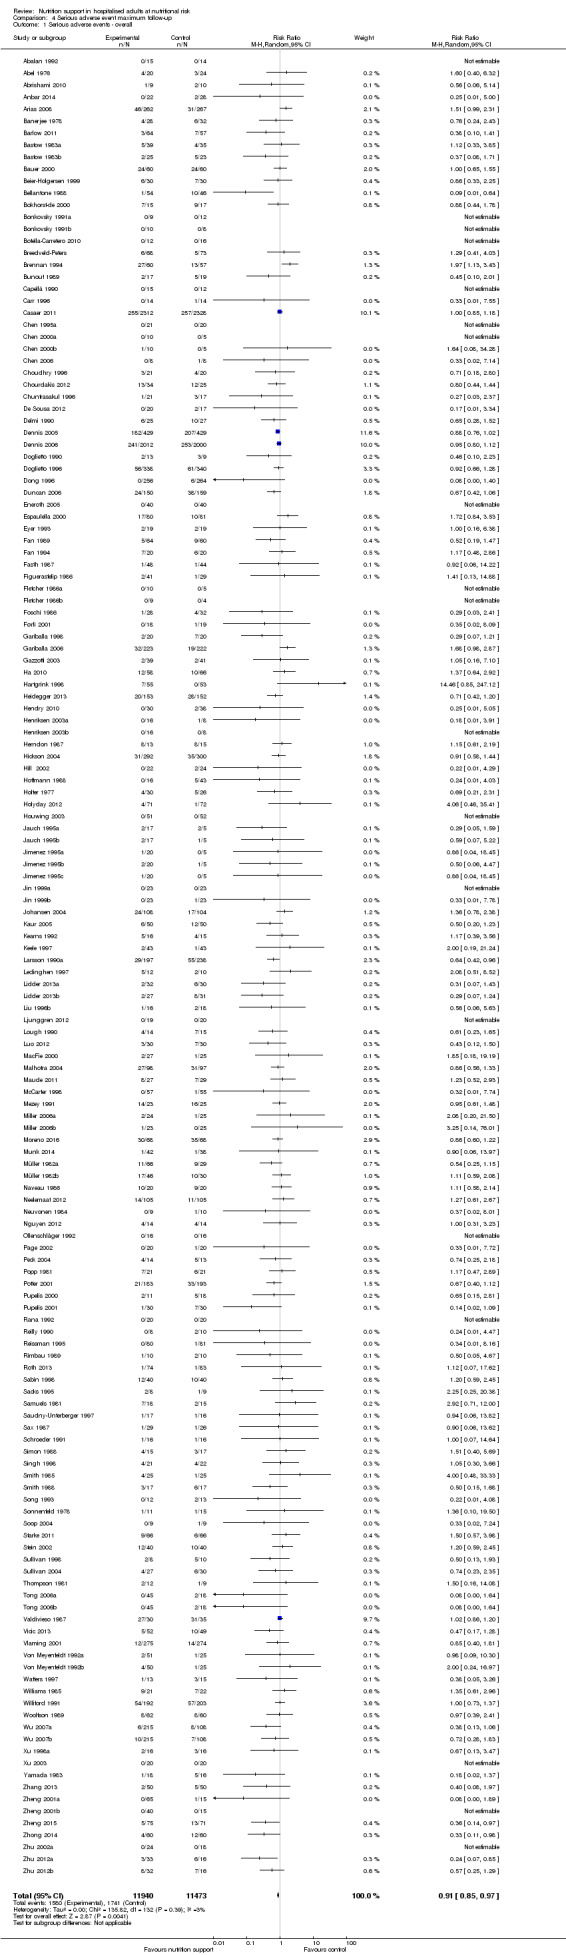
Comparison 4 Serious adverse event maximum follow‐up, Outcome 1 Serious adverse events ‐ overall.
3. Serious adverse events (maximum follow‐up).
| Trial | Experimental intervention | Type and number of participants with a serious adverse events (Experimental group) | Proportion of participants with a serious adverse event (Experimental group) | Type and number of participants with a serious adverse events (Control group) | Proportion of participants with a serious adverse event (Control group) |
| Barlow 2011 | Enteral nutrition | 2 anastomotic leaks | 2 out of 64 | 7 anastomotic leaks, 2 GI haemorrhage, 1 myocardial infarction | 10 out of 57 |
| Beier‐Holgersen 1999 | Enteral nutrition | 2 anastomotic leak, 3 wound dehiscence, 1 myocardial infarction, | 6 out of 30 | 4 anastomotic leak, 1 pulmonary failure | 5 out of 30 |
| Bellantone 1988 | Parenteral nutrition | 1 sepsis | 1 out of 54 | 10 sepsis | 10 out of 46 |
| Bozzetti 2000 | Parenteral nutrition | 1 anastomotic leak, 3 respiratory infections, 2 respiratory insufficiencies | 6 out of 43 | 2 anastomotic leaks, 1 renal failure, 2 abdominal abscesses, 4 respiratory infections, 3 respiratory insufficiencies | 12 out of 47 |
| Brennan 1994 | Parenteral nutrition | 7 anastomotic leaks, 5 pneumonias, 1 GI haemorrhages, 8 GI fistula, 4 ileus, 2 myocardial infarction, 12 abscess, 4 deep infection, 7 peritonitis | 50 out of 60 | 3 anastomotic leaks, 6 pneumonias, 1 pulmonary embolism, 2 GI haemorrhages, 5 GI fistula, 1 myocardial infarction, 2 abscess, 4 deep infection, 2 peritonitis | 26 out of 57 |
| Chen 1995a | Enteral nutrition | no serious adverse events reported | 0 out of 16 | 1 anastomotic leak | 1 out of 8 |
| Chen 2000a | Enteral nutrition | 1 anastomotic leak | 1 out of 10 | no serious adverse events reported | 0 out of 10 |
| Chen 2006 | Enteral nutrition | no serious adverse events reported | 0 out of 21 | 1 septic complication | 1 out of 20 |
| Chourdakis 2012 | Enteral nutrition | 2 CNS infections, 13 ventilator associated pneumonias | 15 out of 34 | 2 CNS infections, 12 ventilator associated pneumonias | 14 out of 25 |
| Dennis 2005 | Oral nutrition | 50 strokes, 23 pulmonary embolisms, 43 DVTs, 28 GI haemorrhages, 28 ACS' | 172 out of 2012 | 43 strokes, 18 pulmonary embolism, 29 DVTs, 18 GI haemorrhage, 22 ACS' | 130 out of 2000 |
| Dennis 2006 | Enteral nutrition | 15 strokes, 6 pulmonary embolisms, 11 DVTs, 22 GI haemorrhages, 7 ACS' | 61 out of 429 | 23 strokes, 8 pulmonary embolisms, 13 DVTs, 11 GI haemorrhages, 13 ACS' | 68 out of 428 |
| Ding 2009 | Parenteral nutrition | 1 respiratory infection | 1 out of 21 | 2 respiratory infection | 2 out of 21 |
| Doglietto 1990 | Parenteral nutrition | 3 sepsis | 3 out of 9 | 7 sepsis | 7 out of 12 |
| Doglietto 1996 | Oral nutrition | 20 anastomotic leaks, 14 pneumonias, 2 pulmonary embolisms, 2 renal failure, 6 abdominal abscess, 3 unspecific infection, 10 wound dehiscences, 1 pulmonary failure, 11 gastrointestinal complications, 6 cardiovascular complications, 4 haemoperitoneum | 79 out of 338 | 18 anastomotic leaks, 9 pneumonias, 1 pulmonary embolisms, 3 renal failure, 1 abdominal abscess, 2 unspecific infection, 3 wound dehiscences, 2 pulmonary failure, 6 bacteraemia, 23 gastrointestinal complications, 6 cardiovascular complications, 5 haemoperitoneum | 79 out of 340 |
| Dong 1996 | Enteral nutrition | no serious adverse events reported | 0 out of 256 | 6 anastomotic leaks | 6 out of 264 |
| Fan 1994 | Parenteral nutrition | 4 GI haemorrhages, 4 GI fistulas, 4 hepatic comas | 12 out of 64 | 1 GI haemorrhages, 5 GI fistulas, 4 hepatic comas | 10 out of 60 |
| Hartgrink 1998 | Enteral nutrition | 25 pressure sores | 25 out of 48 | 30 pressure sores | 30 out of 53 |
| Henriksen 2003a | Oral nutrition | 1 anastomotic leak, 2 wound infections, 1 pulmonary embolism | 4 out of 16 | 1 anastomotic leak, | 1 out of 8 |
| Hoffmann 1988 | Enteral nutrition | no serious adverse events reported | 0 out of 43 | 3 anastomotic leaks, 2 myocardial infarction | 5 out of 16 |
| Ji 1999 | Enteral nutrition | 2 abdominal abscess | 2 out of 20 | no serious adverse events reported | 0 out of 10 |
| Johansen 2004 | General nutrition | 4 pneumonia, 1 DVTs, 4 sepsis, 2 empyemas, 0 gastroenteritis, 1 GI complications, | 12 out of 108 | 4 pneumonia, 1 stroke, 2 sepsis, 1 gastroenteritis, 2 GI complications | 10 out of 104 |
| Kaur 2005 | Enteral nutrition | 3 septic complications, 3 wound dehiscence | 6 out of 50 | 8 septic complications, 4 wound dehiscence | 12 out of 50 |
| Kearns 1992 | Enteral nutrition | 2 renal failures | 2 out of 16 | 2 renal failures | 2 out of 15 |
| Keele 1997 | Oral nutrition | no serious adverse events reported | 0 out of 43 | 1 GI perforation | 1 out of 43 |
| Larsson 1990a | Oral nutrition | 20 pressure sores | 20 out of 197 | 29 pressure sores | 29 out of 328 |
| Ledinghen 1997 | Enteral nutrition | 4 variceal bleedings, 1 peritonitis | 5 out of 12 | 1 peritonitis | 1 out of 10 |
| Lidder 2013a | Oral nutrition | 2 anastomotic leaks, 2 sepsis | 4 out of 59 | 7 anastomotic leaks, 1 stroke, 1 DVT, 3 sepsis, 3 myocardial infarctions | 15 out of 61 |
| Liu 1996 | Parenteral nutrition | no serious adverse events reported | 0 out of 14 | 1 anastomotic leak, 1 GI fistula | 2 out of 15 |
| Maude 2011 | Enteral nutrition | 8 sepsis | 8 out of 27 | 7 sepsis | 7 out of 29 |
| Neuvonen 1984 | Parenteral nutrition | no serious adverse events reported | 0 out of 9 | 1 sepsis | 1 out of 12 |
| Page 2002 | Enteral nutrition | no serious adverse events reported | 0 out of 20 | 1 pulmonary embolism | 1 out of 20 |
| Pupelis 2000 | Enteral nutrition | 2 peritonitis | 2 out of 11 | 5 peritonitis | 5 out of 18 |
| Pupelis 2001 | Enteral nutrition | no serious adverse events reported | 0 out of 30 | 4 GI fistulas | 4 out of 30 |
| Reissman 1995 | Oral nutrition | no serious adverse events reported | 0 out of 80 | 1 anastomotic leak | 1 out of 81 |
| Rimbau 1989 | Parenteral nutrition | 1 pneumonia | 1 out of 10 | 2 pneumonias | 2 out of 10 |
| Sabin 1998 | Parenteral nutrition | 2 pneumoperitoneums | 2 out of 40 | 2 anastomotic leaks, 2 pneumoperitoneums | 4 out of 40 |
| Samuels 1981 | Parenteral nutrition | 2 pneumonias, 5 sepsis | 7 out of 16 | 2 sepsis | 2 out of 14 |
| Schroeder 1991 | Enteral nutrition | 1 myocardial infarction | 1 out of 16 | 1 myocardial infarction | 1 out of 16 |
| Simon 1988 | Parenteral nutrition | no serious adverse events reported | 0 out of 15 | 2 hepatic encephalopathies | 2 out of 17 |
| Smith 1988 | Parenteral nutrition | 1 anastomotic leak, 1 respiratory infection, 1 pancreatitis | 3 out of 17 | 2 pulmonary embolisms, 1 septic complication, 4 respiratory infections, | 7 out of 17 |
| Soop 2004 | Enteral nutrition | 2 wound infections, 1 pneumonia | 3 out of 9 | 1 anastomotic leak, 2 wound infections, 1 pneumonia, 1 peptic ulcer, 1 wound dehiscence, | 6 out of 9 |
| Starke 2011 | General nutrition | no serious adverse events reported | 0 out of 66 | 1 stroke, 1 DVT, 1 septic arthritis, 2 myocardial infarction | 5 out of 66 |
| Thompson 1981 | Parenteral nutrition | 1 empyema, 1 pelvic abscess | 2 out of 12 | 1 intraabdominal abscess | 1 out of 9 |
| Tong 2006a | Mixed nutrition | 1 hepatic encephalopathy | 1 out of 90 | 4 anastomotic leak, 5 hepatic encephalopathies | 9 out of 36 |
| Vicic 2013 | Enteral nutrition | 2 sepsis, 2 multi organ failure, | 4 out of 52 | 6 sepsis, 3 multi organ failure | 9 out of 49 |
| Watters 1997 | Enteral nutrition | 1 anastomotic leak | 1 out of 13 | 3 anastomotic leaks | 3 out of 15 |
| Williford 1991 | Parenteral nutrition | 6 anastomotic leaks, 16 pneumonias, 1 pressure sore, 2 abdominal abscess, 1 wound dehiscence, 13 pulmonary failure, 7 bacteraemia, 10 GI complications, 15 cardiac complications, 3 bronchopleurocutaneous fistulas | 74 out of 231 | 6 anastomotic leaks, 9 pneumonias, 1 pulmonary embolism, 1 pressure sore, 3 renal failure, 2 abdominal abscess, 1 septic complication, 1 wound dehiscence, 11 pulmonary failure, 5 bacteraemia, 10 GI complications, 15 cardiac complications, 6 bronchopleurocutaneous fistulas | 80 out of 228 |
| Wu 2007a | Mixed nutrition | 11 anastomotic leaks, 6 DVT, 15 sepsis | 32 out of 430 | 10 anastomotic leaks, 15 sepsis | 25 out of 216 |
| Yamada 1983 | Parenteral nutrition | 1 wound dehiscence | 1 out of 18 | 1 anastomotic leak, 2 pneumonias, 1 sepsis, 1 ileus | 5 out of 16 |
| Zhang 2013 | Enteral nutrition | 2 GI haemorrhage | 2 out of 50 | 4 GI haemorrhage | 4 out of 50 |
Heterogeneity
Neither visual inspection of the forest plots nor tests for statistical heterogeneity (I2 = 3%; P = 0.39) indicated significant heterogeneity.
Trial Sequential Analysis
The Trial Sequential Analysis showed that the Z‐curve crossed the boundary for futility. Hence, there is firm evidence that nutrition support versus control does not reduce the risk ratio for serious adverse events by 20% at maximum follow‐up (Supplementary online material). A post hoc Trial Sequential Analysis showed that the information size was large enough to rule out that nutrition support versus control reduces the risk ratio of serious adverse events by 10% or more (Figure 5). It should be noted that Trial Sequential Analysis only assessed the risk of random error and did not consider the risk of bias.
5.
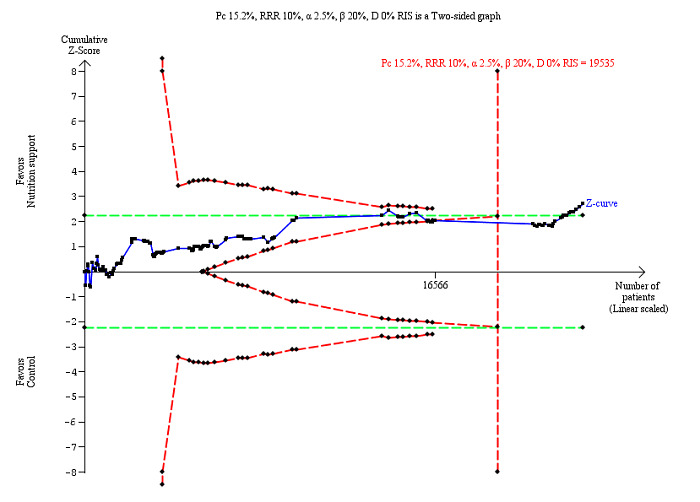
Trial Sequential Analysis on serious adverse events (maximum follow‐up) in 137 high risk of bias trials. The diversity‐adjusted required information size (RIS) was calculated based on an incidence rate of serious adverse event in the control group of 15.2%; risk ratio reduction of 10% in the experimental group; type I error of 2.5%; and type II error of 20% (80% power). No diversity was noted. The required information size was 19535 participants. The cumulative Z‐curve (blue line) did not cross the trial sequential monitoring boundaries for benefit or harm (red inward sloping lines). The cumulative Z‐curve crossed the inner‐wedge futility line (red outward sloping lines) indicating that sufficient information is provided. Additionally the cumulative Z‐score crossed the RIS. The green dotted line shows conventional boundaries (2.5%). The cumulative Z‐curve later crosses the green line, indicating a possible significant effect, but one that is smaller than a 10% risk ratio reduction.
Bayes factor
We calculated the Bayes factor based on a RR of 20% and the meta‐analysis result (RR 0.91). Bayes factor (0.056) was below the Bayes factor threshold for significance of 0.1, supporting that the alternative hypothesis was more likely than the null hypothesis.
Risk of bias and sensitivity analyses
We rated the risk of bias of the outcome result as high.
The 'best‐worst' and 'worst‐best' case meta‐analyses showed that incomplete outcome data bias has the potential to influence the results ('best‐worst' random‐effects meta‐analysis: RR 0.72, 95% CI 0.65 to 0.79, P < 0.001, 24,315 participants, 137 trials, low quality of evidence, Analysis 4.12; random‐effects meta‐analysis: RR 1.05, 95% CI 0.94 to 1.17, P = 0.38, 24,082 participants, 137 trials, low quality of evidence, Analysis 4.13). Data were imputed for 31 trials.
4.12. Analysis.
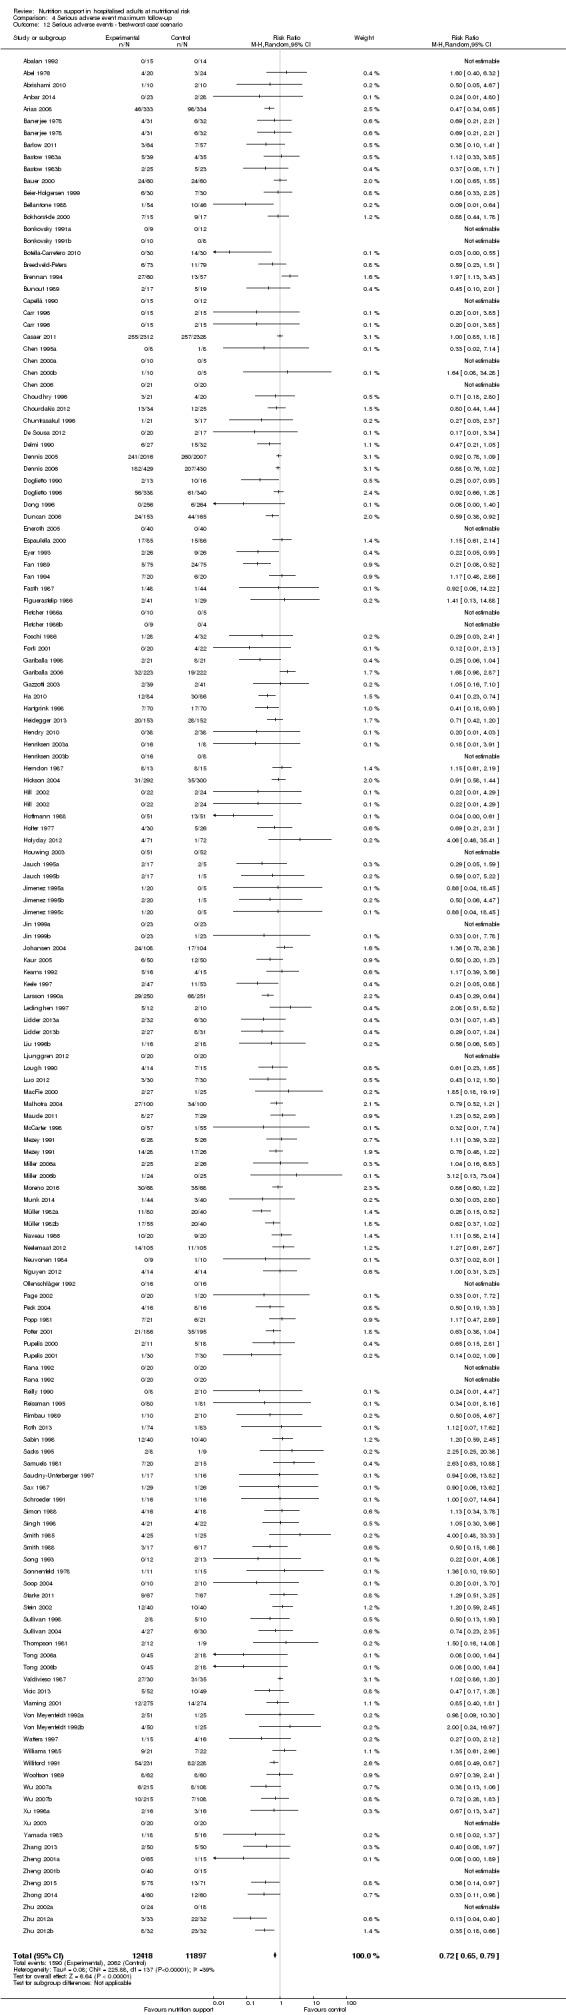
Comparison 4 Serious adverse event maximum follow‐up, Outcome 12 Serious adverse events ‐ 'best‐worst case' scenario.
4.13. Analysis.
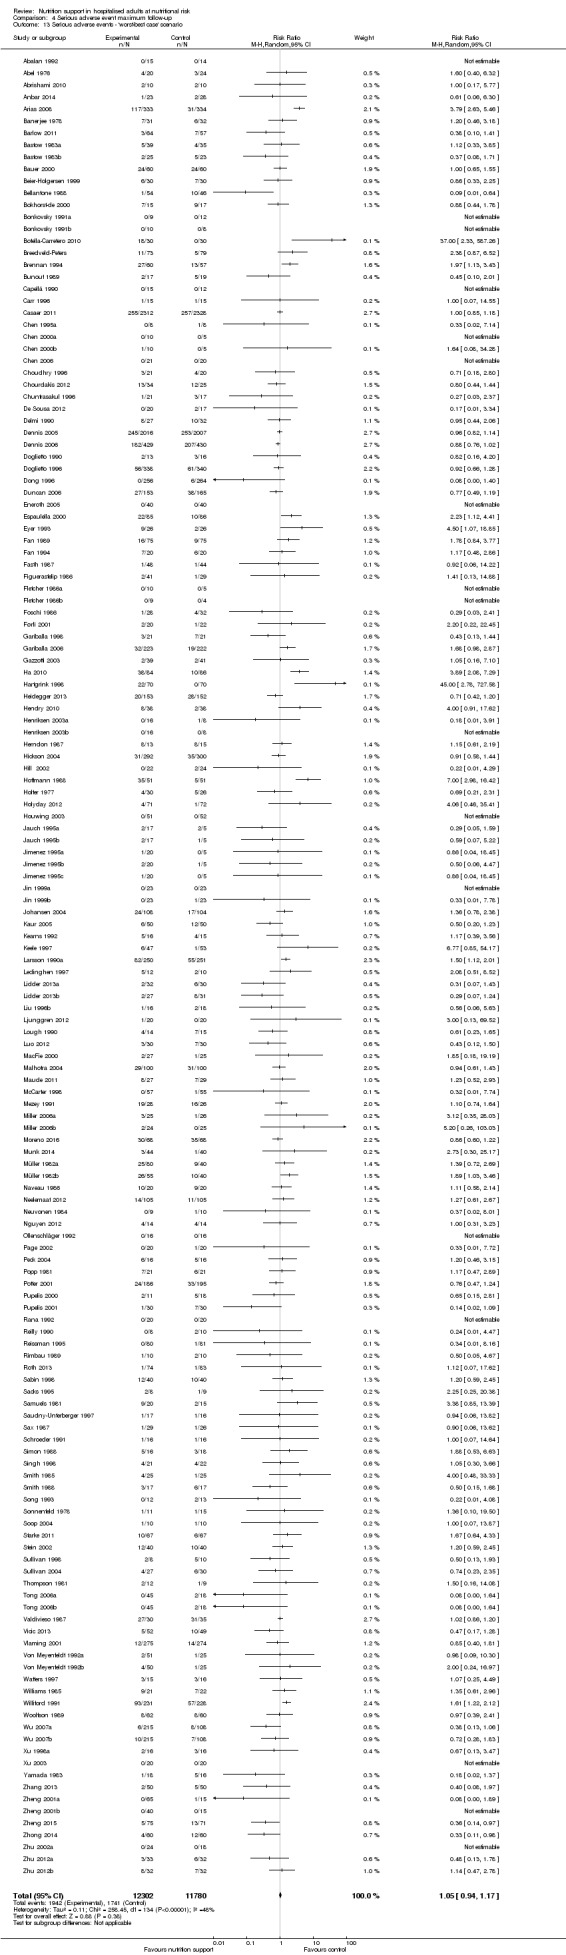
Comparison 4 Serious adverse event maximum follow‐up, Outcome 13 Serious adverse events ‐ 'worst‐best case' scenario.
Visual inspection of the funnel plots showed signs of asymmetry (Supplementary online material). Harbord's test showed small‐study effects (P = 0.000). Hence, we assessed the risk of publication bias as high.
Subgroup analyses
Analysis 4.3, comparing trials with different modes of delivery: test for subgroup difference showed no statistically significant difference (subgroup difference P = 0.14).
4.3. Analysis.
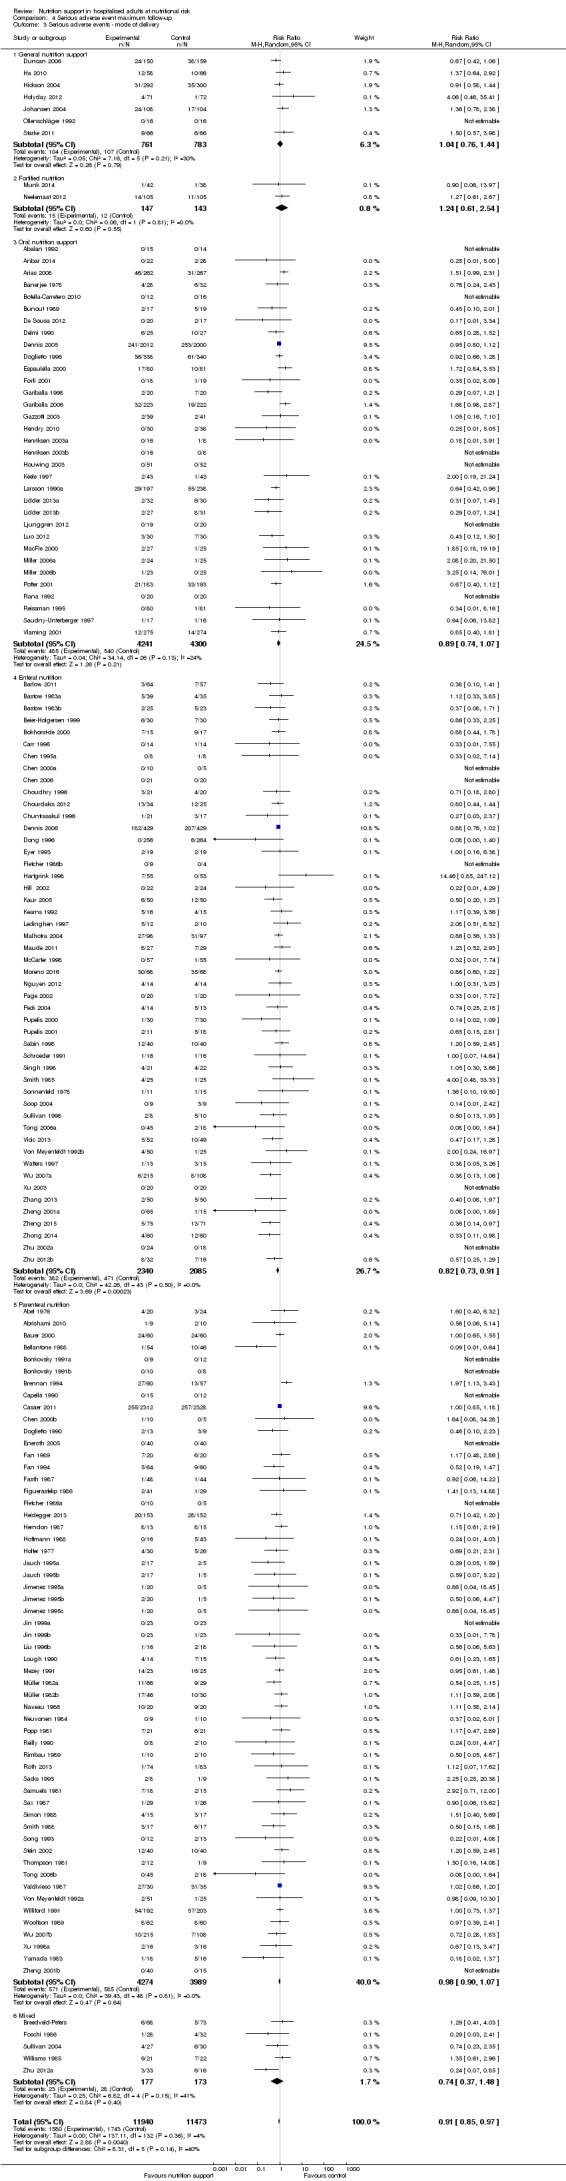
Comparison 4 Serious adverse event maximum follow‐up, Outcome 3 Serious adverse events ‐ mode of delivery.
Analysis 4.4, comparing trials with participants from different medical specialties: test for subgroup difference showed no statistically significant difference (subgroup difference P = 0.31).
4.4. Analysis.
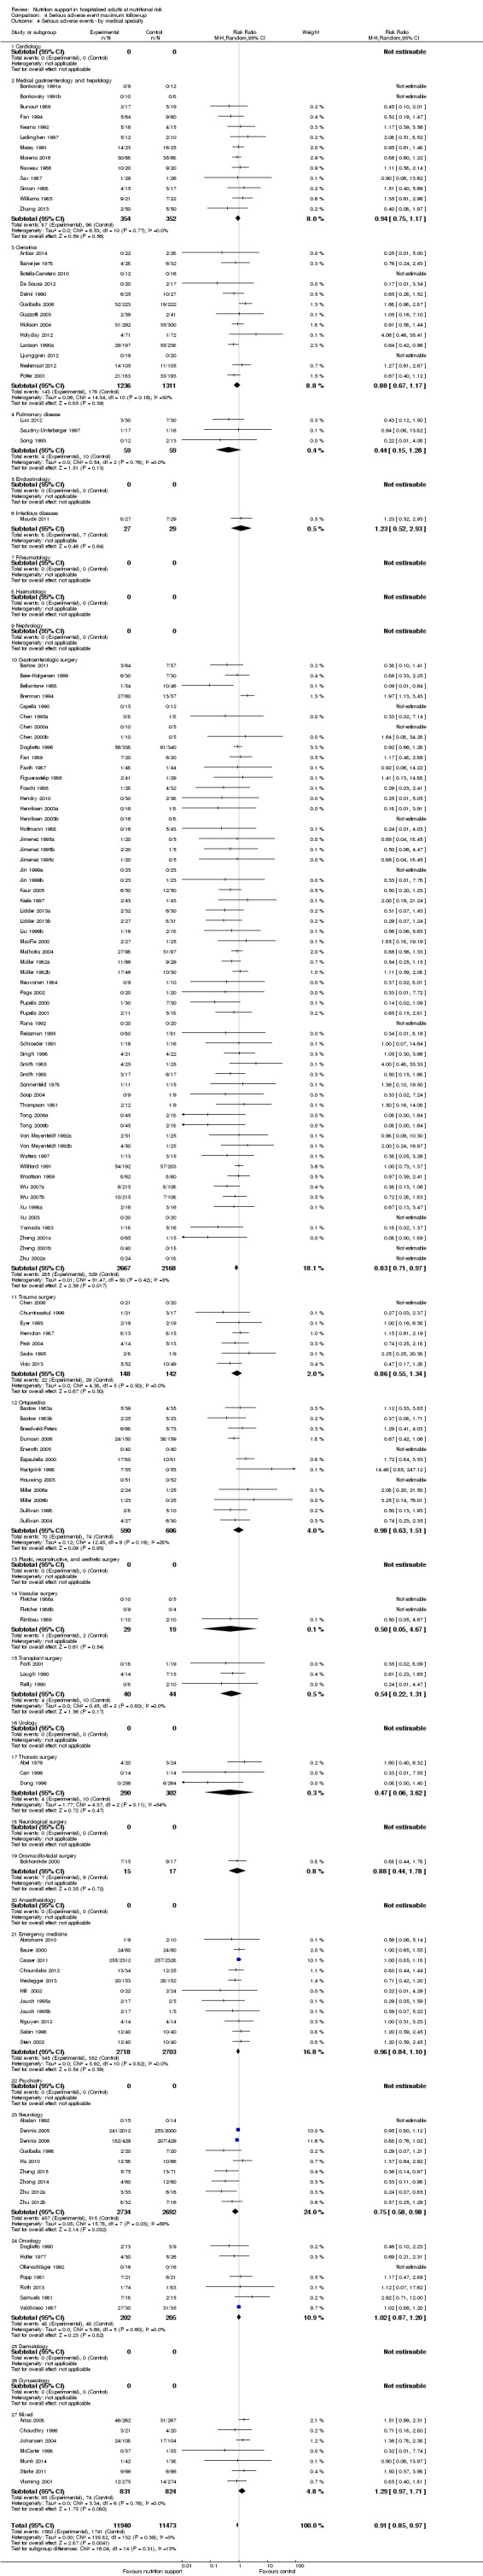
Comparison 4 Serious adverse event maximum follow‐up, Outcome 4 Serious adverse events ‐ by medical specialty.
Analysis 4.5, comparing trials where the adequacy of the amount of calories received was different: test for subgroup difference showed no statistically significant difference (subgroup difference P = 0.36).
4.5. Analysis.
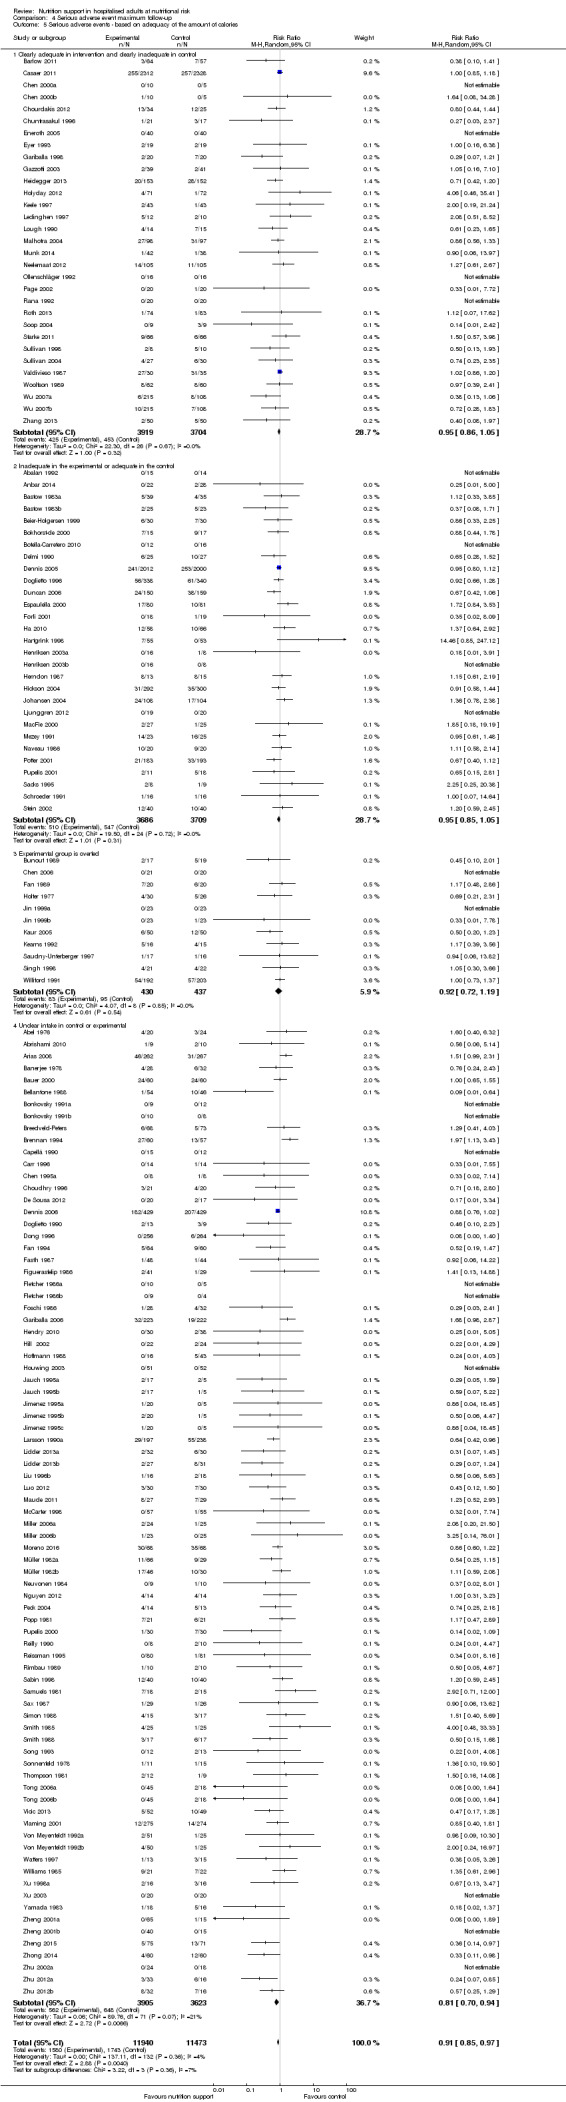
Comparison 4 Serious adverse event maximum follow‐up, Outcome 5 Serious adverse events ‐ based on adequacy of the amount of calories.
Analysis 4.6, comparing trials with different screening tools: test for subgroup difference showed no statistically significant difference (subgroup difference P = 0.22).
4.6. Analysis.
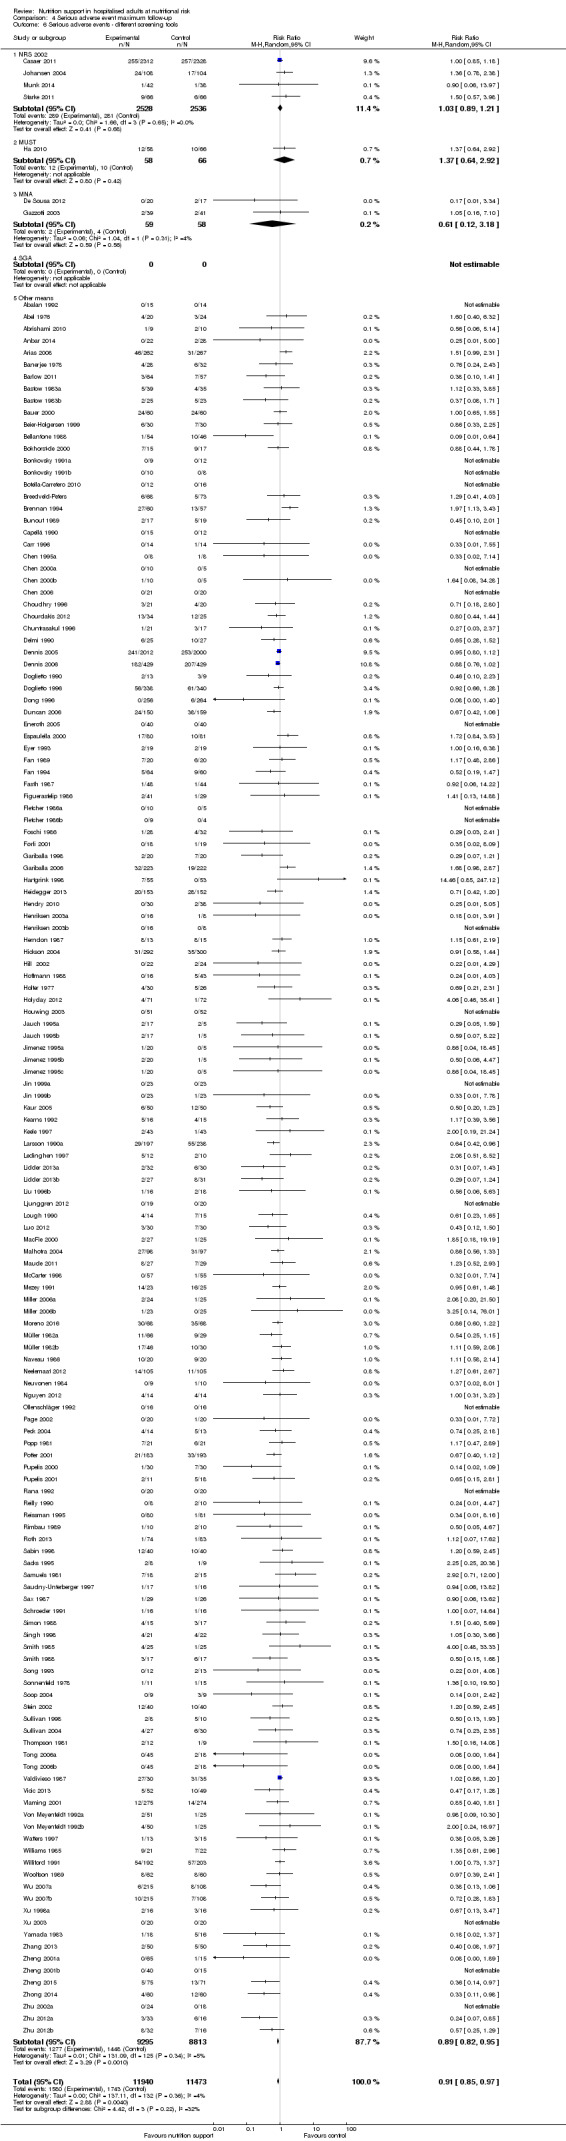
Comparison 4 Serious adverse event maximum follow‐up, Outcome 6 Serious adverse events ‐ different screening tools.
Analysis 4.7, comparing trials where participants were at nutritional risk according to specific condition: test for subgroup difference showed a statistically significant difference (subgroup difference P = 0.03).
4.7. Analysis.
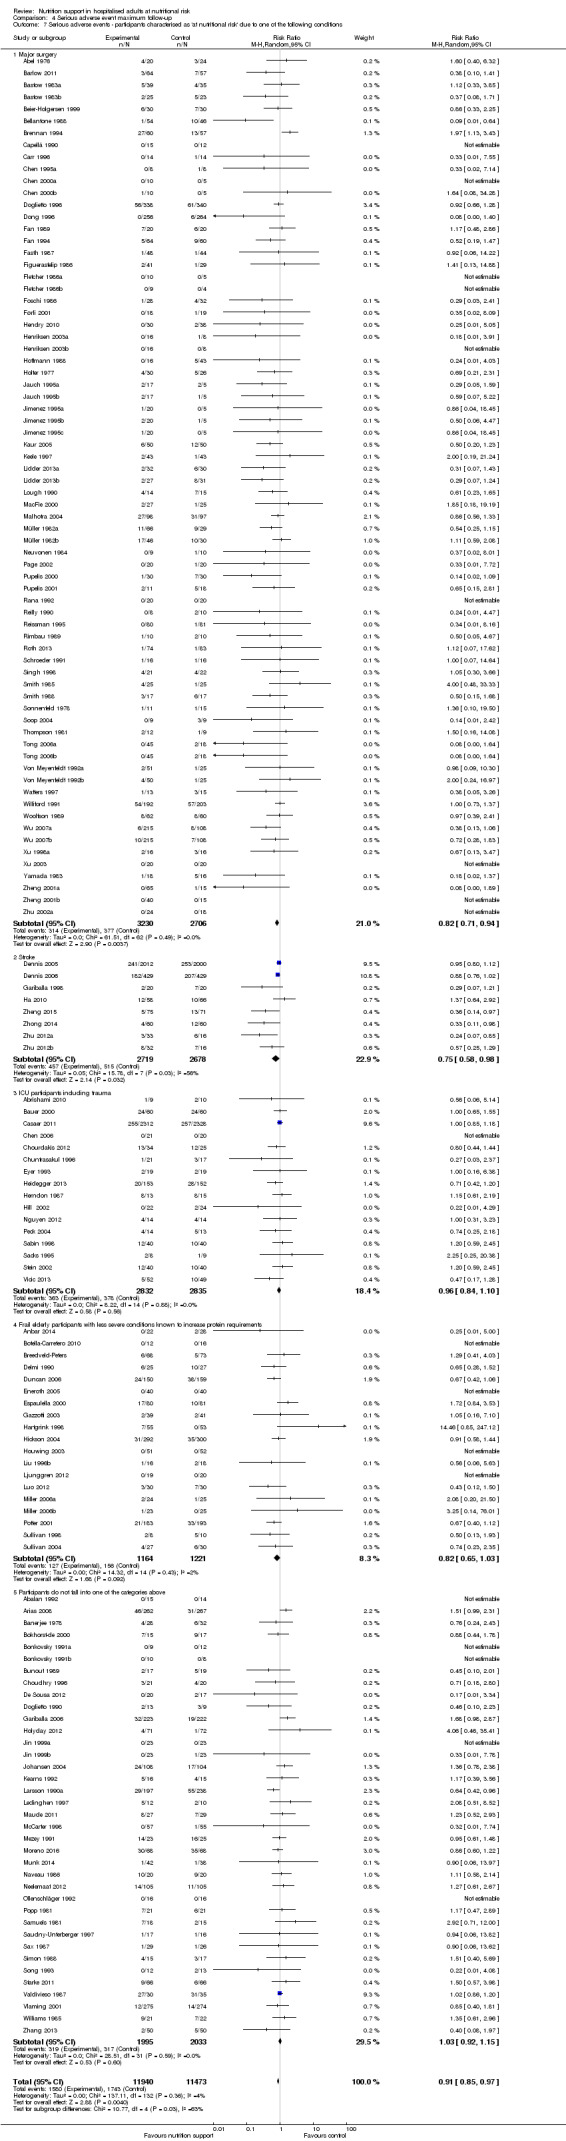
Comparison 4 Serious adverse event maximum follow‐up, Outcome 7 Serious adverse events ‐ participants characterised as 'at nutritional risk' due to one of the following conditions.
Analysis 4.8, comparing trials where participants were at nutritional risk according to specific criteria (BMI, weight, insufficient food intake): test for subgroup difference showed no statistically significant difference (subgroup difference P = 0.74).
4.8. Analysis.
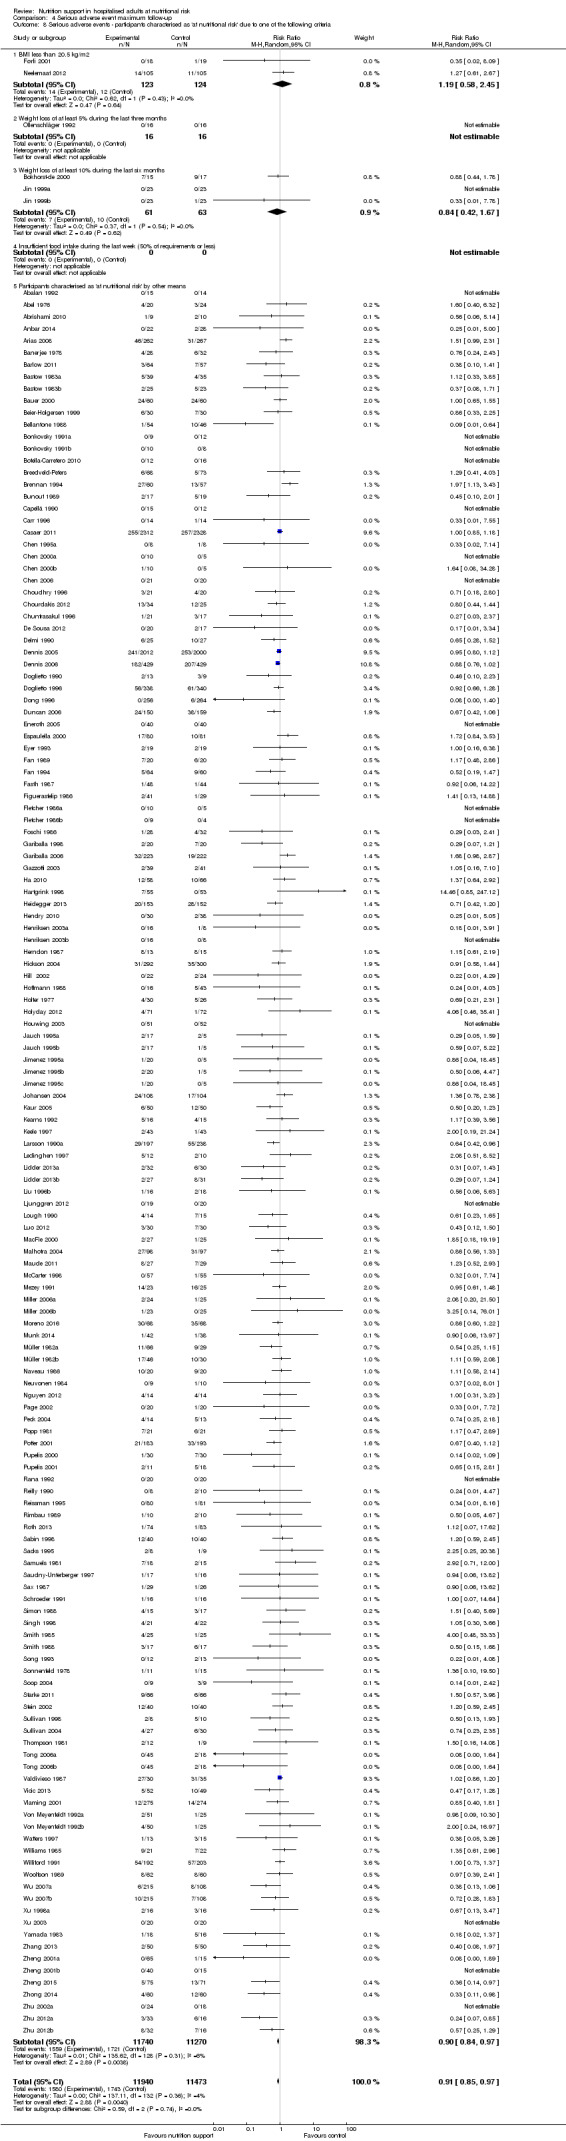
Comparison 4 Serious adverse event maximum follow‐up, Outcome 8 Serious adverse events ‐ participants characterised as 'at nutritional risk' due to one of the following criteria.
Analysis 4.9, comparing trials where the participants were classified as at nutritional risk according to biomarkers or anthropometrics: test for subgroup difference showed no statistically significant difference (subgroup difference P = 0.13).
4.9. Analysis.
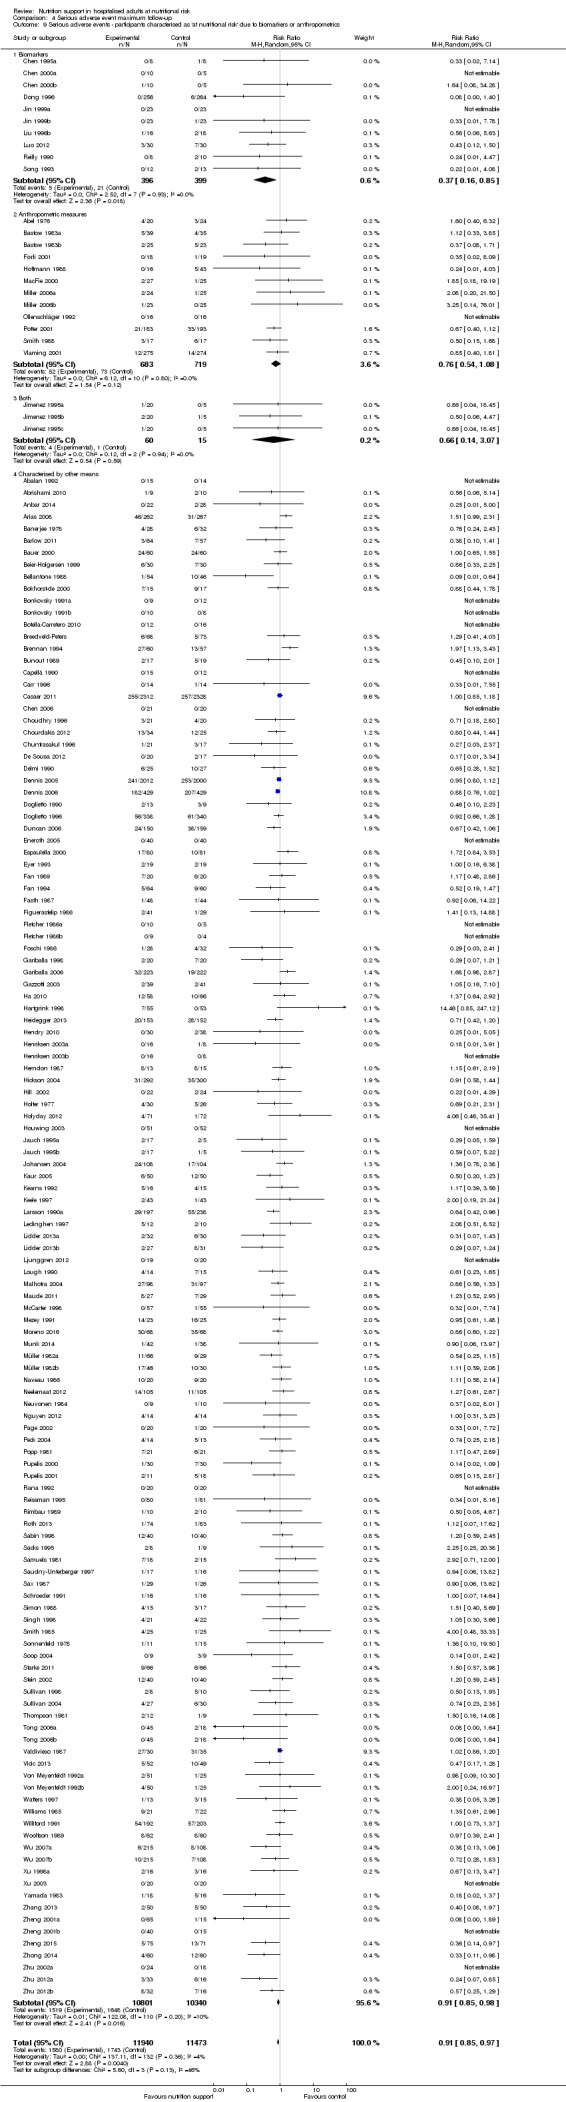
Comparison 4 Serious adverse event maximum follow‐up, Outcome 9 Serious adverse events ‐ participants characterised as 'at nutritional risk' due to biomarkers or anthropometrics.
Analysis 4.10, comparing trials according to publication year: test for subgroup difference showed no statistically significant difference (subgroup difference P = 0.34).
4.10. Analysis.
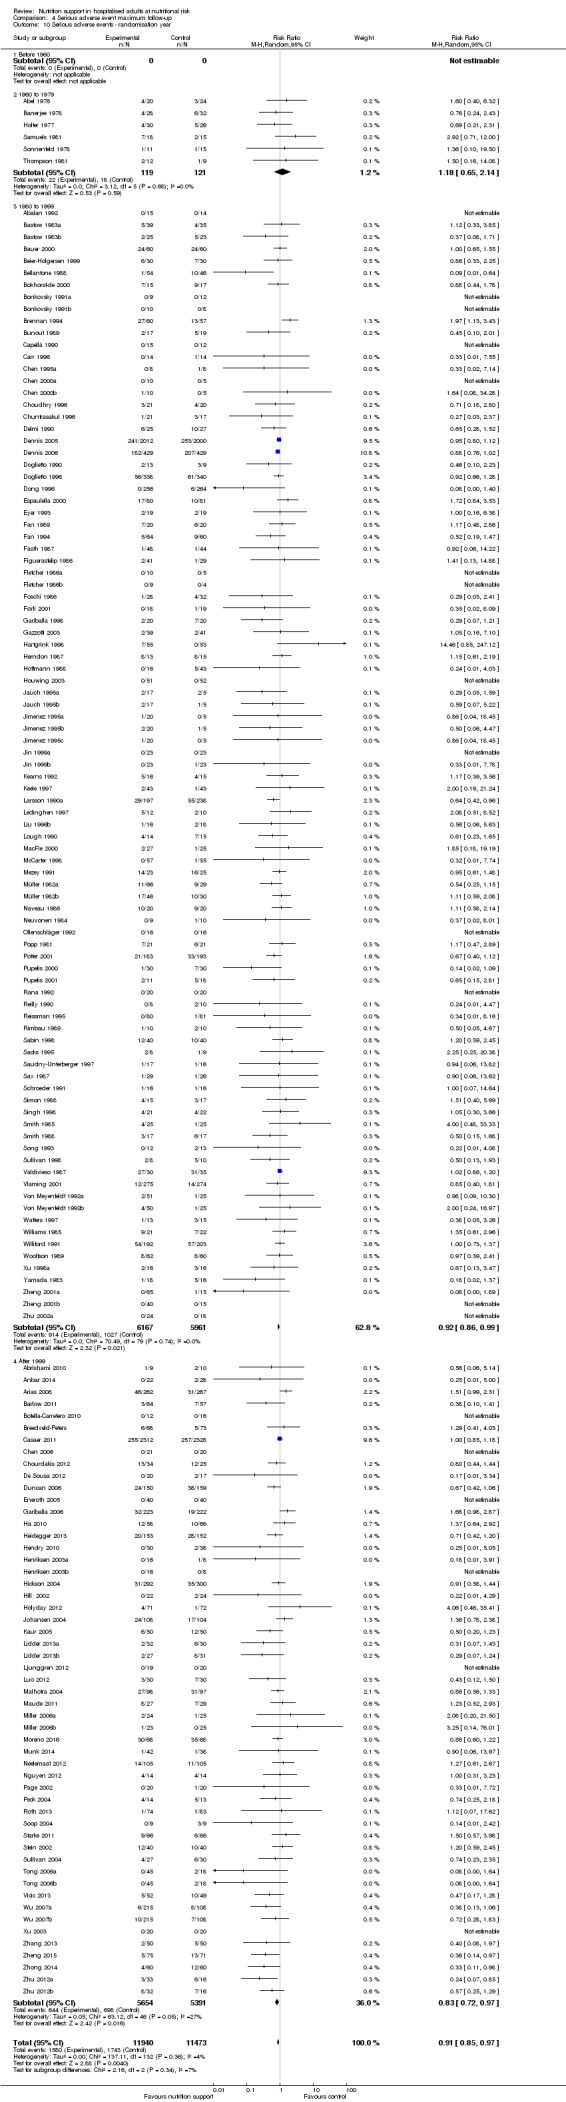
Comparison 4 Serious adverse event maximum follow‐up, Outcome 10 Serious adverse events ‐ randomisation year.
Analysis 4.11, comparing the length of the intervention: test for subgroup difference showed no statistically significant difference (subgroup difference P = 0.70).
4.11. Analysis.
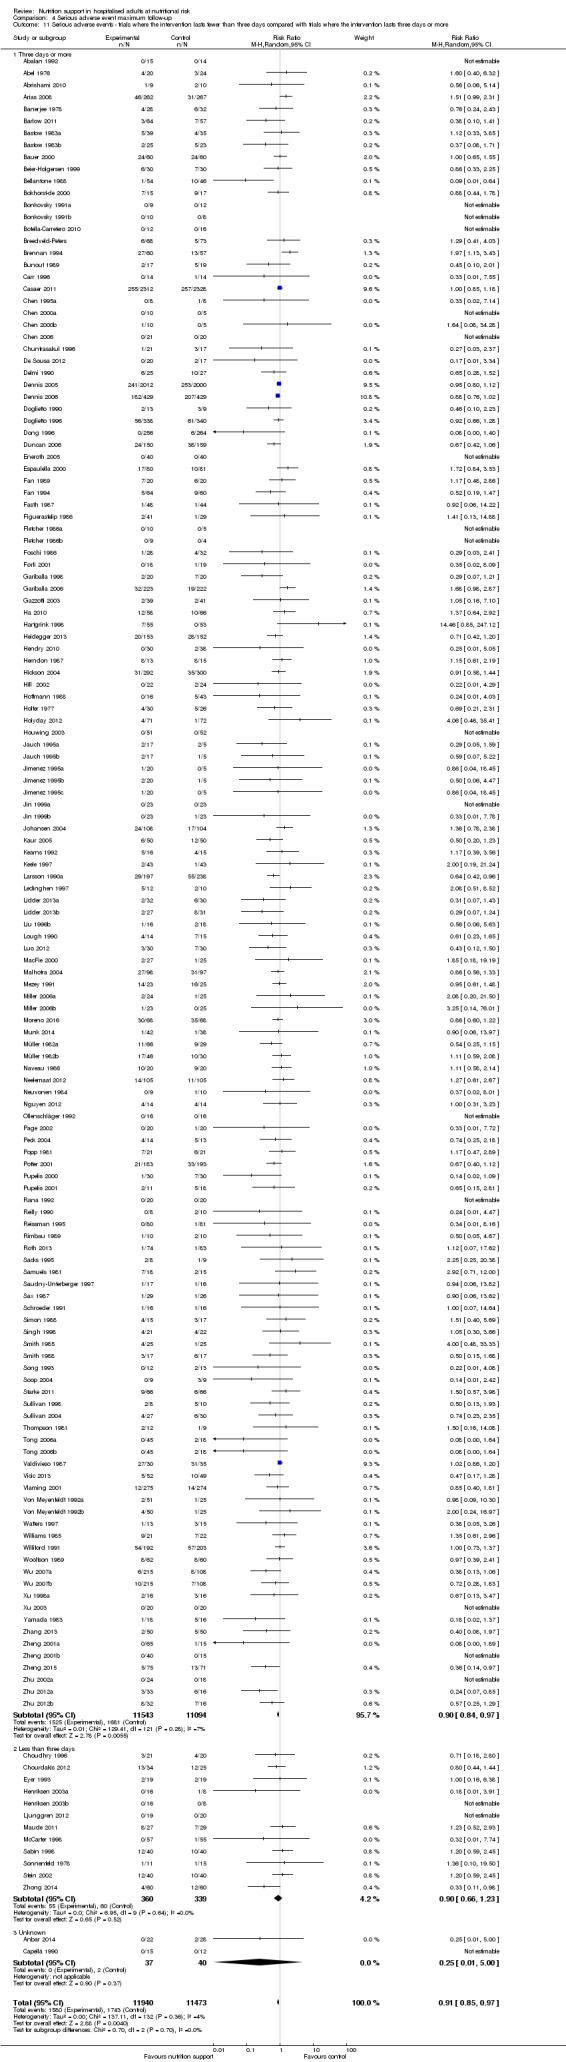
Comparison 4 Serious adverse event maximum follow‐up, Outcome 11 Serious adverse events ‐ trials where the intervention lasts fewer than three days compared with trials where the intervention lasts three days or more.
Zero‐event handling
To test the robustness of our results according to the type of zero‐event handling, we conducted our meta‐analysis using the Trial Sequential Analysis software. We performed our meta‐analysis using both the 'reciprocal of opposite intervention group' continuity correction, a constant continuity correction using both 0.5, 0.01 and 0.001, and an empirical continuity correction using 0.5, 0.01 and 0.001. All of the meta‐analyses produced a P value under 0.025.
Quality of life
Only 16 of 244 trials reported quality of life (Saudny‐Unterberger 1997; Bokhorst‐de 2000; Liu 2000a; MacFie 2000; Johansen 2004; Smedley 2004a; Dennis 2005; Dennis 2006; Miller 2006a; Campbell 2008; Kawaguchi 2008; Ha 2010; Starke 2011; Ljunggren 2012; Neelemaat 2012; Breedveld‐Peters). Few trials used similar quality‐of‐life questionnaires and only data from EuroQoL utility score and SF‐36 could be used in a meta‐analysis. All trials were at high risk of bias.
Two trials reported quality of life at end of intervention using the SF‐36 questionnaire (Johansen 2004; Starke 2011). A meta‐analysis of the trials found no effect for physical performance (random‐effects MD 2.35, 95% CI ‐2.94 to 7.65, P = 0.65, 242 participants, 2 trials, very low quality of evidence; Analysis 5.1) or mental performance (random‐effects MD ‐0.90, 95% CI ‐3.92 to 2.13, P = 0.56, 242 participants, 2 trials, very low quality of evidence; Analysis 7.1). Three trials at high risk of bias reported quality of life at maximum follow‐up using the SF‐36 questionnaire (Johansen 2004; Campbell 2008; Starke 2011). A meta‐analysis of the trials found no effect for physical performance (random‐effects MD 1.54, 95% CI ‐2.47 to 5.55, P = 0.45, 289 participants, 3 trials, very low quality of evidence; Analysis 6.1) or mental performance (random‐effects MD ‐0.25, 95% CI ‐3.02 to 2.53, P = 0.86, 289 participants, 3 trials, very low quality of evidence; Analysis 8.1).
5.1. Analysis.
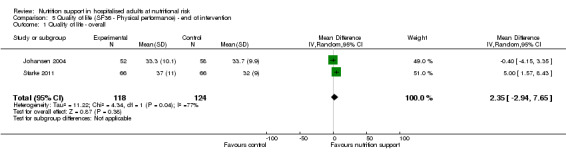
Comparison 5 Quality of life (SF36 ‐ Physical performance) ‐ end of intervention, Outcome 1 Quality of life ‐ overall.
7.1. Analysis.
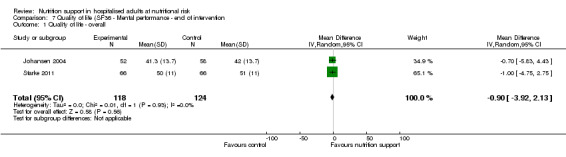
Comparison 7 Quality of life (SF36 ‐ Mental performance ‐ end of intervention, Outcome 1 Quality of life ‐ overall.
6.1. Analysis.
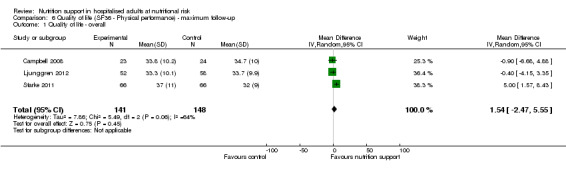
Comparison 6 Quality of life (SF36 ‐ Physical performance) ‐ maximum follow‐up, Outcome 1 Quality of life ‐ overall.
8.1. Analysis.
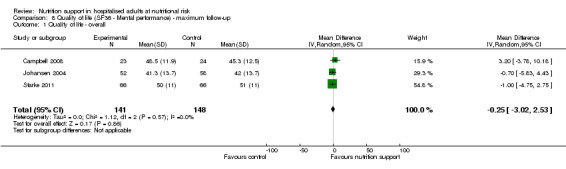
Comparison 8 Quality of life (SF36 ‐ Mental performance) ‐ maximum follow‐up, Outcome 1 Quality of life ‐ overall.
Two trials reported quality of life at end of intervention using EuroQoL utility score (Dennis 2005; Dennis 2006). A meta‐analysis of the trials found no significant effect (random‐effects MD ‐0.01, 95% CI ‐0.03 to 0.01, P = 0.45, 2 trials, 3961 participants, very low quality of evidence; Analysis 9.1).
9.1. Analysis.
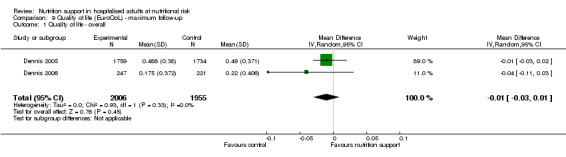
Comparison 9 Quality of life (EuroQoL) ‐ maximum follow‐up, Outcome 1 Quality of life ‐ overall.
One trial reported quality of life using the EORTC QLQ‐C30 questionnaire (Bokhorst‐de 2000). The trial of 21 participants found no effect of nutrition support on quality of life in head and neck cancer patients undergoing surgery using the end‐score. Using change‐score, nutrition support also did not show a beneficial effect on physical functioning when considering a P value of 0.025 significant (P = 0.05).
Four trials reported quality of life using the EQ‐5D (VAS) questionnaire (Ha 2010; Ljunggren 2012; Neelemaat 2012; Breedveld‐Peters). However, we could not obtain data for a meta‐analysis. Ha 2010 reported within‐group improvement and worsening of quality of life parameters. This trial randomised 78 participants and found a beneficial effect of nutrition support on quality of life in change score between the study groups (P = 0.009). Ljunggren 2012 (57 participants), Neelemaat 2012 (185 participants) and Breedveld‐Peters (131 participants), found no beneficial effect of nutrition support on quality of life.
One trial reported quality of life using a self‐rating questionnaire involving physical and mental symptoms (Kawaguchi 2008). The trial, with 29 participants, found a beneficial effect of nutrition support on thirst (P = 0.01), fatigue (P = 0.01), and hunger (P = 0.003), but no combined score was reported or available.
One trial at high risk of bias reported quality of life using a general well‐being score (Saudny‐Unterberger 1997). The trial, with 20 participants, found no effect of nutrition support on quality of life.
One trial reported quality of life using the Hospital Anxiety and Depression scale (MacFie 2000). The trial randomised 52 participants and found no effect of nutrition support on anxiety and depression.
One trial reported quality of life using the SF‐12 questionnaire (Miller 2006a). The trial randomised 100 participants and found no effect of nutrition support on quality of life.
Two trials described quality of life as an outcome (Liu 2000a; Smedley 2004a). However, we failed to obtain any data from the trial or by contacting the authors.
Post hoc Trial Sequential Analyses of the different modes of delivery for serious adverse events at maximum follow‐up
A Trial Sequential Analysis for enteral nutrition showed that the Z‐curve crossed the boundary for benefit. This Trial Sequential Analysis was based on a risk ratio reduction of 20%, an event rate in the control group of 17.2%, a two‐sided alpha of 2.5%, a beta of 20%, a diversity of 0%. This indicates that enteral nutrition versus control may result in a 20% or greater risk ratio reduction of serious adverse events at maximum follow‐up (Figure 6).
6.
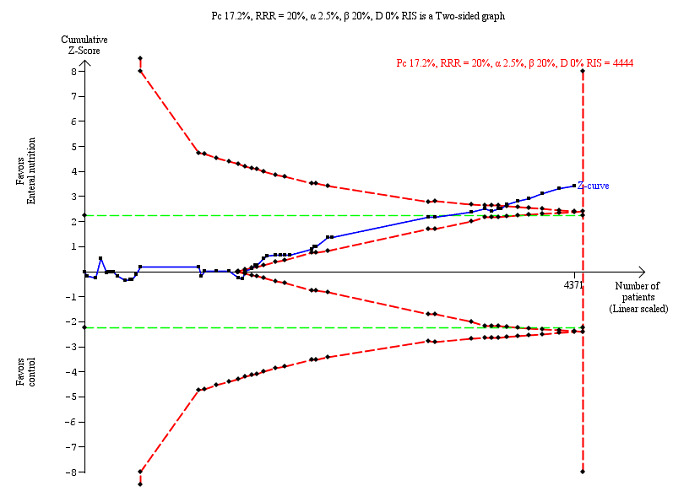
Trial Sequential Analysis on serious adverse events (maximum follow‐up) with participants receiving enteral nutrition in 49 high risk of bias trials. The diversity‐adjusted required information size (RIS) was calculated based on an incidence rate of serious adverse event in the control group of 17.2%; risk ratio reduction of 20% in the experimental group; type I error of 2.5%; and type II error of 20% (80% power). No diversity was noted. The required information size was 4444 participants. The cumulative Z‐curve (blue line) did cross the trial sequential monitoring boundaries for benefit (red inward sloping lines) indicating that enteral nutrition may result in a 20% or greater risk ratio reduction of serious adverse events at maximum follow‐up. The cumulative Z‐curve did not cross the inner‐wedge futility line (red outward sloping lines). The green dotted line shows conventional boundaries (2.5%).
A Trial Sequential Analysis for oral nutrition support showed that the Z‐curve crossed the futility boundary as well as the diversity‐adjusted required information size. This Trial Sequential Analysis was based on a risk ratio reduction of 20%, an event rate in the control group of 12.6%, a two‐sided alpha of 2.5%, a beta of 20%, and the observed diversity of 0%. This indicates that there is firm evidence that oral nutrition support versus control does not result in a 20% or greater risk ratio reduction or increase in serious adverse events at maximum follow‐up (Supplementary online material).
A Trial Sequential Analysis for parenteral nutrition showed that the Z‐curve crossed the futility boundary as well as the diversity‐adjusted required information size. This Trial Sequential Analysis was based on a risk ratio reduction of 20%, an event rate in the control group of 14.5%, a two‐sided alpha of 2.5%, a beta of 20%, and the observed diversity of 0%. This indicates that there is firm evidence that parenteral nutrition versus control does not result in a 20% or greater risk ratio reduction or increase of serious adverse events at maximum follow‐up (Supplementary online material).
For general nutrition support, fortified foods, and mixed nutrition support, there was not enough information available to produce Trial Sequential Analyses.
Subgroup analyses of the effect of oral nutrition support on all‐cause mortality and serious adverse events
Post hoc subgroup analyses of oral nutrition support found no subgroup difference of nutrition support compared with control in any subgroup (Analyses 29 through 32).
Subgroup analyses of the effect of enteral nutrition support on all‐cause mortality and serious adverse events
Post hoc subgroup analyses of enteral support found no subgroup difference of nutrition support compared with control in any subgroup (Analyses 33 through 36)
Subgroup analyses of the effect of parenteral nutrition support on all‐cause mortality and serious adverse events
Post hoc subgroup analyses of parenteral nutrition support found no subgroup difference of nutrition support compared with control in any subgroup (Analyses 37 through 40).
Post hoc analyses of major surgery
A Trial Sequential Analysis for major surgery participants on serious adverse events at maximum follow‐up using a risk ratio reduction of 20%, an event rate in the control group of 15.2%, a two‐sided alpha of 2.5%, a beta of 20%, a diversity of 0%, showed that nutrition support did not reduce serious adverse events at maximum follow‐up for major surgery participants of 20% or more (Supplementary online material).
Post hoc analyses of participants admitted with stroke
A Trial Sequential Analysis for stroke participants on serious adverse events at maximum follow‐up using a risk ratio reduction of 20%, an event rate in the control group of 19.2%, a two‐sided alpha of 2.5%, a beta of 20%, a diversity of 83%, showed that nutrition support did not reduce serious adverse events at maximum follow‐up in stroke participants of 20% or more (Supplementary online material). The Trial Sequential Analyses did not break the boundary for futility or reach the required information size (Supplementary online material).
Post hoc analyses of the adverse events with uncertain diagnostic criteria and seriousness
In a number of trials the adverse events were not reported adequately. Multiple trialists only reported a proportion of participants experiencing, e.g. 'cardiac failure' or 'pneumonia', but did not report how the diagnosis was made or how 'serious' the event was, and the total number of observed participants was also often missing. We therefore did not include these poorly‐reported outcome results in the 'serious adverse event outcome', based on our predefined criteria (see Primary outcomes). Appendix 3 lists the adverse events/complications always considered as a serious adverse event even without a detailed description. We assessed the following outcomes post hoc: pneumonia, wound dehiscence, renal failure, wound infection, and heart failure.
Pneumonia
We included 28 trials reporting on 12,443 participants. All trials were at high risk of bias. Eight hundred and forty‐nine of 6342 participants (13.4%) randomly assigned to nutrition support versus 766 of 6101 participants (12.5%) randomly assigned to no intervention, placebo, or treatment as usual experienced pneumonia. Overall, we found no statistically significant benefit or harm of nutrition support at maximum follow‐up (random‐effects meta‐analyses RR 1.06, 95% CI 0.96 to 1.16, P = 0.28, I2 = 2%, 12,443 participants, 28 trials, low quality of evidence, Analysis 10.1).
10.1. Analysis.
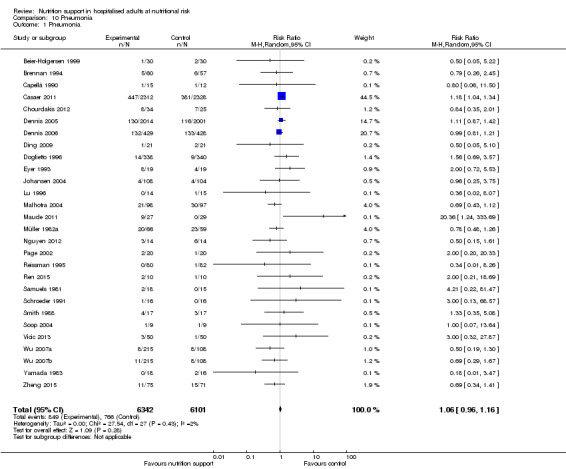
Comparison 10 Pneumonia, Outcome 1 Pneumonia.
Wound dehiscence
We included 12 trials reporting on 2280 participants. All trials were at high risk of bias. Thirty‐seven of 1237 (3.0%) nutrition support participants experienced wound dehiscence, compared with 43 of 1043 control participants (4.1%). Overall, we found no statistically significant benefit or harm of nutrition support at maximum follow‐up (random‐effects meta‐analyses RR 0.71, 95% CI 0.40 to 1.24, P = 0.22, I2 = 22%, 2280 participants, 12 trials, low quality of evidence, Analysis 11.1).
11.1. Analysis.
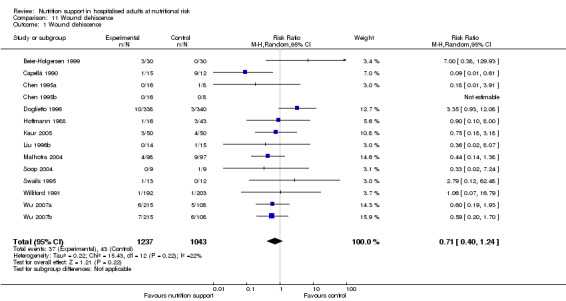
Comparison 11 Wound dehiscence, Outcome 1 Wound dehiscence.
Renal failure
We included four trials reporting on 6359 participants. All trials were at high risk of bias. Two hundred and sixteen of 3272 (6.6%) nutrition support participants experienced renal failure versus 214 of 3087 control participants (6.9%). Overall, we found no statistically significant benefit or harm of nutrition support at maximum follow‐up (random‐effects meta‐analyses RR 1.00, 95% CI 0.83 to 1.20, P = 0.99, I2 = 0%, 6649 participants, 4 trials, low quality of evidence, Analysis 12.1).
12.1. Analysis.
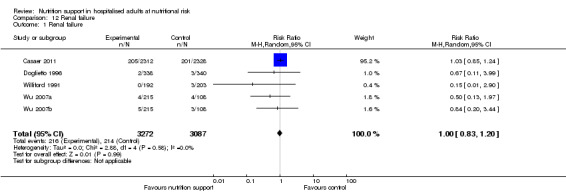
Comparison 12 Renal failure, Outcome 1 Renal failure.
Wound infection
We included 26 trials reporting on 8324 participants. All trials were at high risk of bias. Two hundred and sixteen of 4263 (5.1%) nutrition support participants experienced wound infection versus 211 of 4061 control participants (5.2%). Overall, we found no statistically significant benefit or harm of nutrition support at maximum follow‐up (random‐effects meta‐analyses RR 0.81, 95% CI 0.60 to 1.10, P = 0.18, I2 = 36%, 8324 participants, 26 trials, low quality of evidence, Analysis 13.1).
13.1. Analysis.
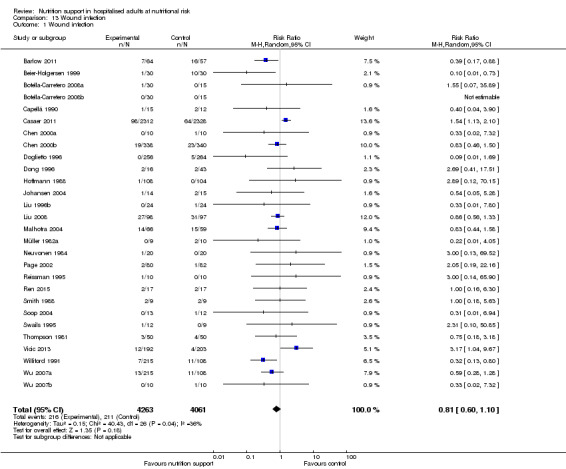
Comparison 13 Wound infection, Outcome 1 Wound infection.
Heart failure
We included three trials reporting on 1041 participants. All trials were at high risk of bias. Thirteen out of 520 (2.5%) randomly assigned to nutrition support versus 11 out of 521 participants (2.1%) randomly assigned to no intervention, placebo, or treatment as usual experienced heart failure. Overall, we found no statistically significant benefit or harm of nutrition support at maximum follow‐up (random‐effects meta‐analyses RR 1.11, 95% CI 0.34 to 3.61, P = 0.87, I2 = 20%, 1041 participants, 3 trials, low quality of evidence, Analysis 14.1).
14.1. Analysis.
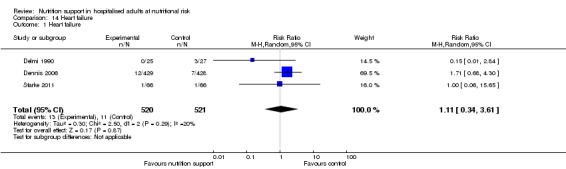
Comparison 14 Heart failure, Outcome 1 Heart failure.
Post hoc analyses combining subgroups to assess the effect of following the nutritional guidelines on mortality and serious adverse events
Guidelines today focus on screening patients that are presumably at nutritional risk using screening tools designed for the purpose and providing adequate nutrition support for nutritionally at‐risk adults that are not likely to achieve adequate intake through spontaneous food intake. As a further post hoc analysis, we combined trials that included participants using screening tools (NRS 2002, MUST, SGA and MNA) which also provided the experimental group with clearly adequate nutrition and the control group with clearly inadequate nutrition (Analysis 15.1; Analysis 15.2; Analysis 15.3; Analysis 15.4). We also did a post hoc analysis of trials that included participants either with impaired nutritional status/decreased food intake (Analysis 1.8; Analysis 2.8; Analysis 3.8; Analysis 4.8) and/or increased nutritional requirements (ICU patients, major surgery, stroke and frail elderly patients) (Analysis 1.7; Analysis 2.7; Analysis 3.7; Analysis 4.7) and had a clearly adequate intake in the experimental group and had clearly inadequate intake in the control group (Analysis 1.5; Analysis 2.5; Analysis 3.5; Analysis 4.5). The results are presented in Analysis 16.1; Analysis 16.2; Analysis 16.3; Analysis 16.4. None of the analyses found any significant effect of nutrition support on mortality or serious adverse events.
15.1. Analysis.

Comparison 15 Clearly adequate and screening tool, Outcome 1 AcM ‐ EoI.
15.2. Analysis.
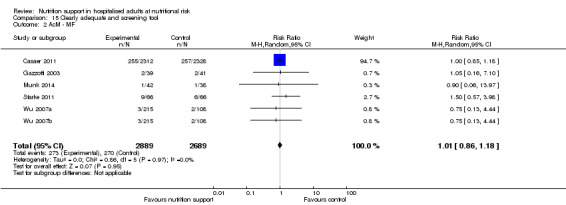
Comparison 15 Clearly adequate and screening tool, Outcome 2 AcM ‐ MF.
15.3. Analysis.
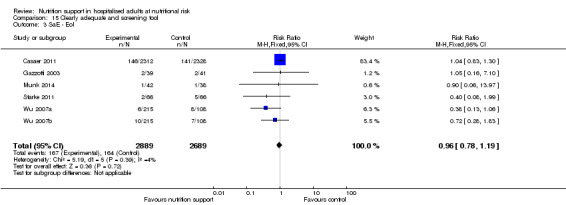
Comparison 15 Clearly adequate and screening tool, Outcome 3 SaE ‐ EoI.
15.4. Analysis.
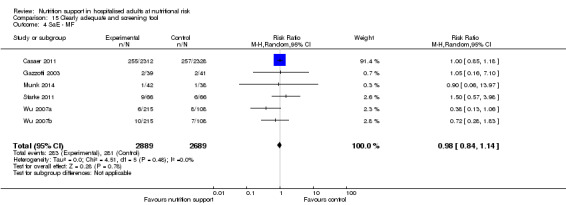
Comparison 15 Clearly adequate and screening tool, Outcome 4 SaE ‐ MF.
16.1. Analysis.
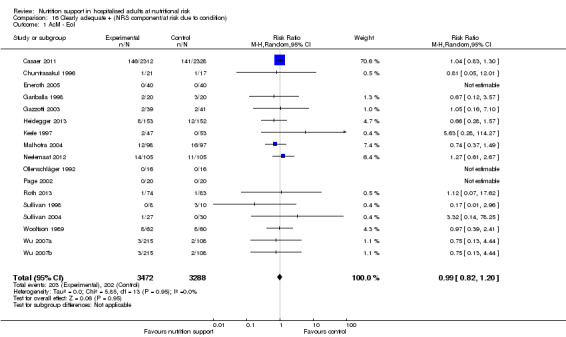
Comparison 16 Clearly adequate + (NRS component/at risk due to condition), Outcome 1 AcM ‐ EoI.
16.2. Analysis.
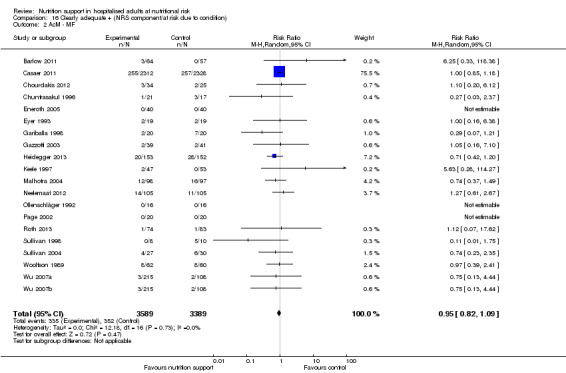
Comparison 16 Clearly adequate + (NRS component/at risk due to condition), Outcome 2 AcM ‐ MF.
16.3. Analysis.
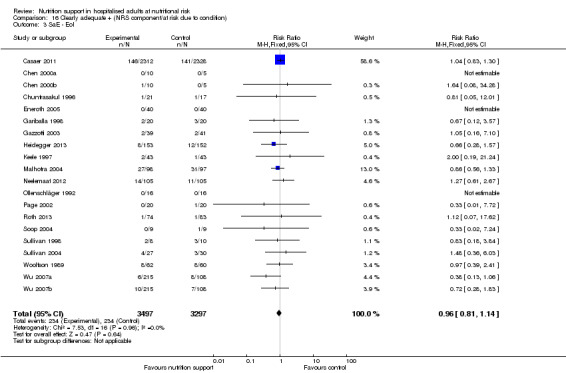
Comparison 16 Clearly adequate + (NRS component/at risk due to condition), Outcome 3 SaE ‐ EoI.
16.4. Analysis.
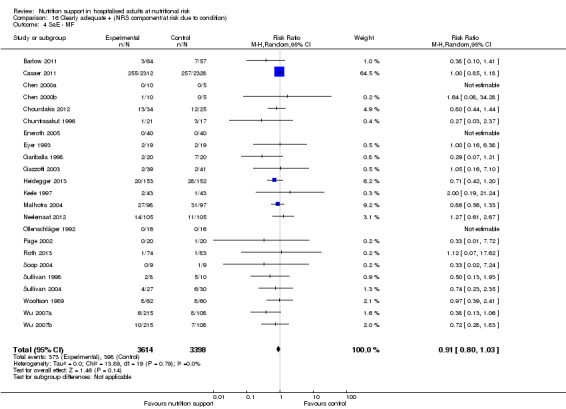
Comparison 16 Clearly adequate + (NRS component/at risk due to condition), Outcome 4 SaE ‐ MF.
Secondary outcomes
Time to death (survival data)
We included 11 trials reporting survival data (Nixon 1981; Valdivieso 1987; Kearns 1992; Brennan 1994; Bauer 2000; Bokhorst‐de 2000; Espaulella 2000; Dennis 2005; Dennis 2006; Oh 2014; Moreno 2016). All trials reported Kaplan‐Meier survival curves, but it was not possible to calculate log hazard ratios and standard errors based on these curves. No trial reported hazard ratios and standard errors. Therefor, we were unable to perform any meta‐analyses. None of the trials found significant effects of nutritional support on survival.
Morbidity
End of intervention
Only one trial reported 'morbidity' at end of intervention (Fan 1994). This trial included 124 participants and found a statistically significant benefit of nutrition support on morbidity at end of intervention using the random‐effects model (RR 0.63, 95% CI 0.42 to 0.94, P = 0.02, 124 participants, very low quality of evidence, Analysis 29.1). Fisher's exact test gave a P value of 0.0293.
29.1. Analysis.
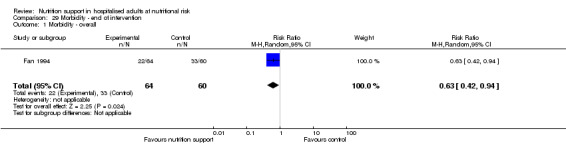
Comparison 29 Morbidity ‐ end of intervention, Outcome 1 Morbidity ‐ overall.
Maximum follow‐up
Two trials reported morbidity at maximum follow‐up (Fan 1994; Barlow 2011), including 245 participants, and found a statistically significant benefit of nutrition support on morbidity at maximum follow‐up using the random‐effects model (RR 0.71, 95% CI 0.53 to 0.95, P = 0.02, I2 = 0%, 2 trials, 245 participants, very low quality of evidence, Analysis 30.1).
30.1. Analysis.
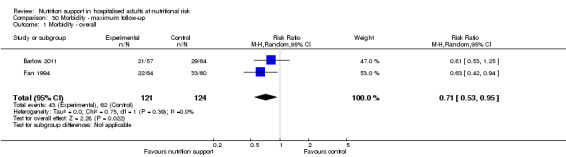
Comparison 30 Morbidity ‐ maximum follow‐up, Outcome 1 Morbidity ‐ overall.
BMI
End of intervention
Fourteen trials (1008 participants) reported BMI at end of intervention. Overall, we found a statistically significant effect of nutrition support on BMI at end of intervention using the random‐effects model (MD 0.57 kg/m2, 95% CI 0.38 to 0.77, P < 0.001, I2 = 0%, 1008 participants, 14 trials, very low quality of evidence, Analysis 31.1). The test for subgroup difference found no significant difference in any analysis (Analysis 31.2; Analysis 31.3; Analysis 31.4; Analysis 31.5; Analysis 31.6; Analysis 31.7; Analysis 31.8; Analysis 31.9; Analysis 31.10; Analysis 31.11).
31.1. Analysis.
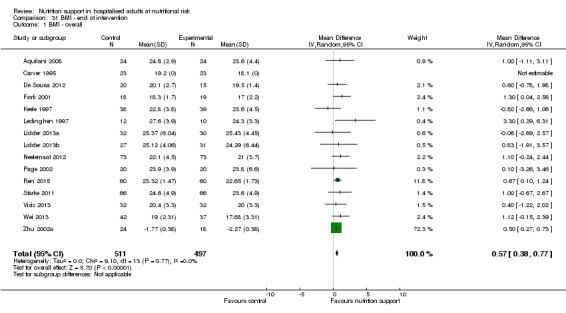
Comparison 31 BMI ‐ end of intervention, Outcome 1 BMI ‐ overall.
31.2. Analysis.
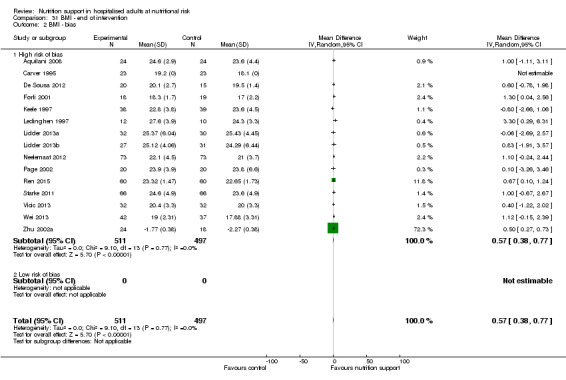
Comparison 31 BMI ‐ end of intervention, Outcome 2 BMI ‐ bias.
31.3. Analysis.
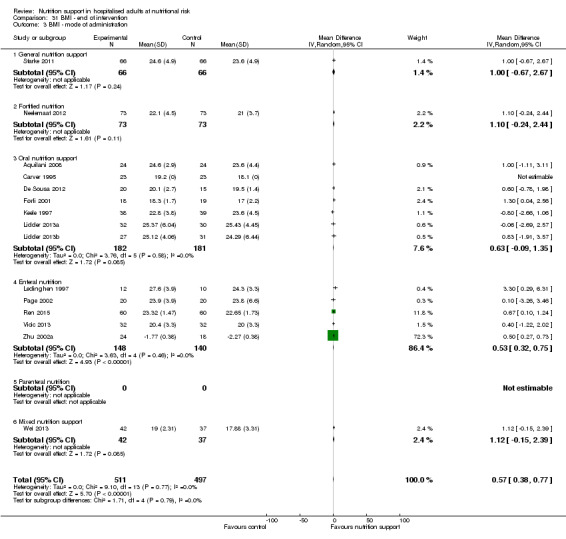
Comparison 31 BMI ‐ end of intervention, Outcome 3 BMI ‐ mode of administration.
31.4. Analysis.
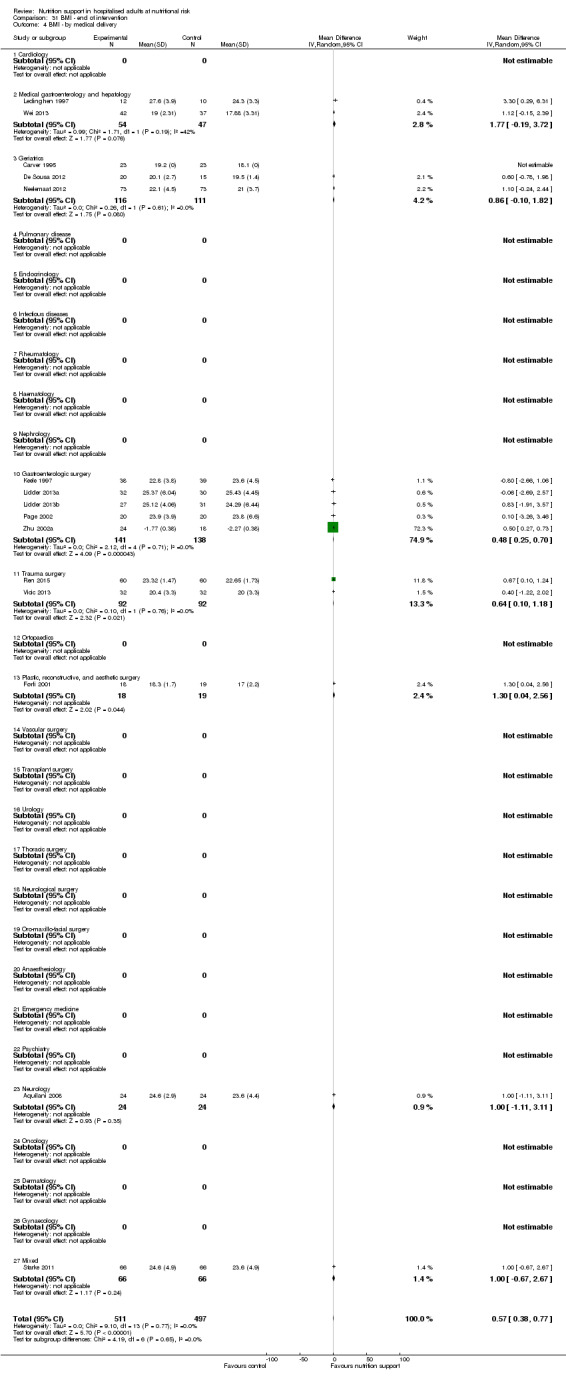
Comparison 31 BMI ‐ end of intervention, Outcome 4 BMI ‐ by medical delivery.
31.5. Analysis.
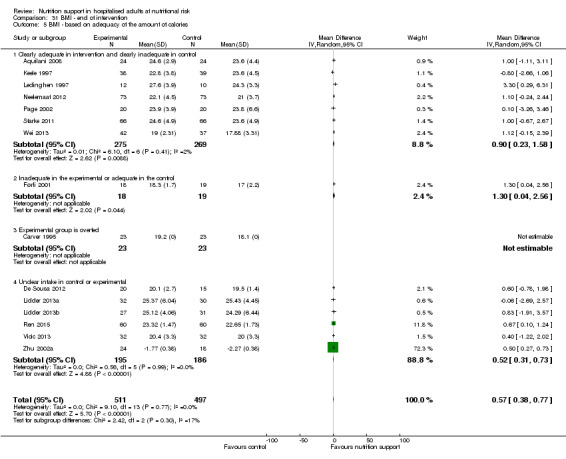
Comparison 31 BMI ‐ end of intervention, Outcome 5 BMI ‐ based on adequacy of the amount of calories.
31.6. Analysis.
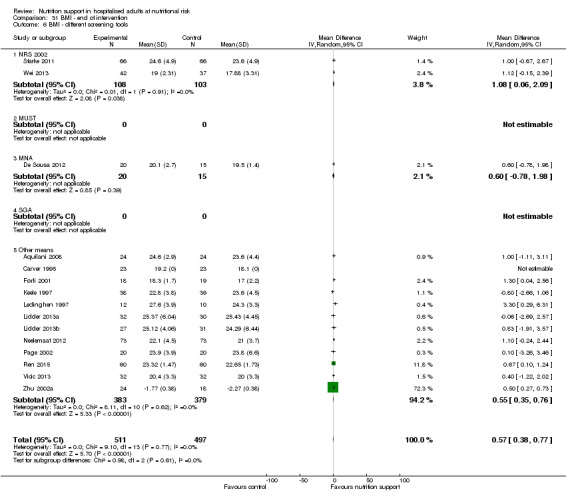
Comparison 31 BMI ‐ end of intervention, Outcome 6 BMI ‐ different screening tools.
31.7. Analysis.
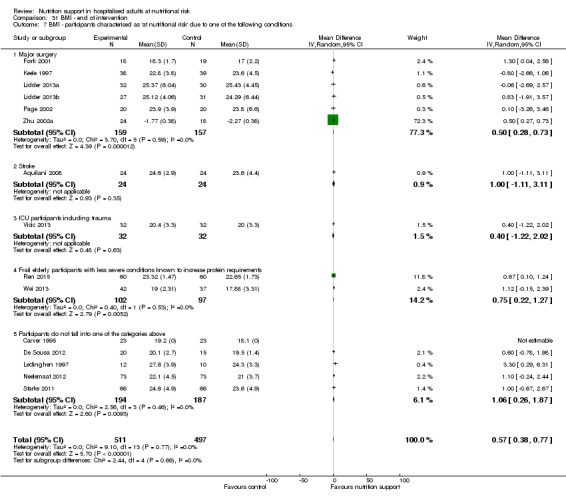
Comparison 31 BMI ‐ end of intervention, Outcome 7 BMI ‐ participants characterised as 'at nutritional risk' due to one of the following conditions.
31.8. Analysis.
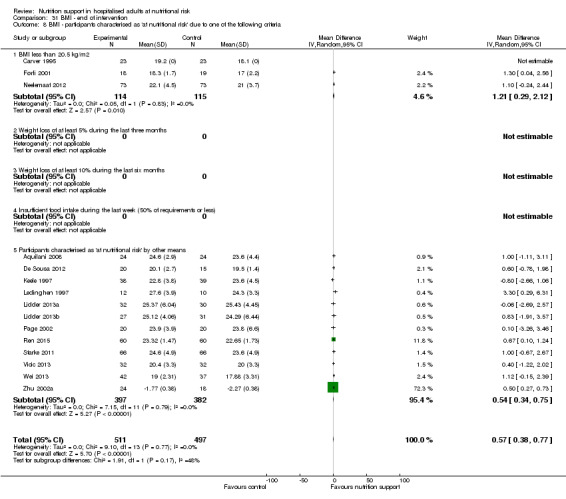
Comparison 31 BMI ‐ end of intervention, Outcome 8 BMI ‐ participants characterised as 'at nutritional risk' due to one of the following criteria.
31.9. Analysis.
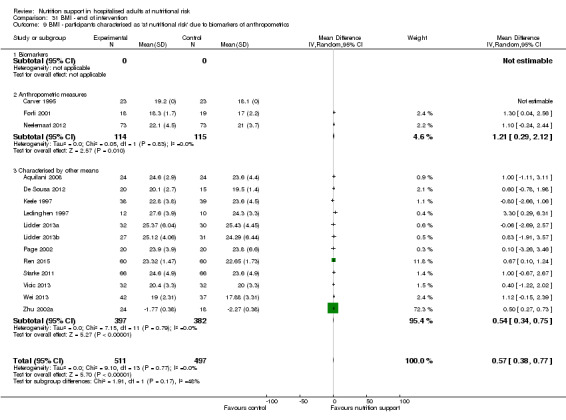
Comparison 31 BMI ‐ end of intervention, Outcome 9 BMI ‐ participants characterised as 'at nutritional risk' due to biomarkers of anthropometrics.
31.10. Analysis.

Comparison 31 BMI ‐ end of intervention, Outcome 10 BMI ‐ randomisation year.
31.11. Analysis.
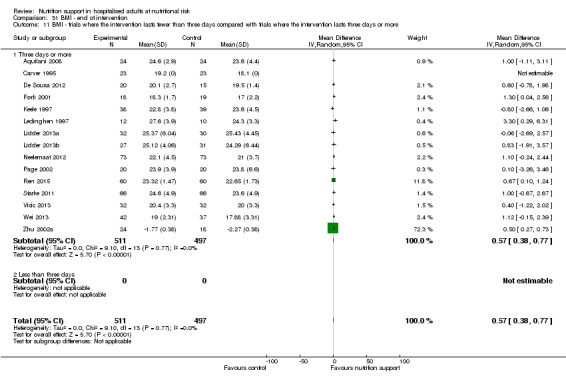
Comparison 31 BMI ‐ end of intervention, Outcome 11 BMI ‐ trials where the intervention lasts fewer than three days compared with trials where the intervention lasts three days or more.
Egger's test for funnel plot asymmetry was not significant (P = 0.222). Begg's test was also not significant (P = 0.547).
Maximum follow‐up
Nineteen trials (1528 participants) reported BMI at maximum follow‐up. Overall, we found no statistically significant effect of nutrition support on BMI at maximum follow‐up using the random‐effects model (MD 0.40 kg/m2 95% CI ‐0.02 to 0.83, P = 0.06, I2 = 61%, 1528 participants, 19 trials, very low quality of evidence, Analysis 32.1). The test for subgroup differences found no significant difference in any analysis (Analysis 32.2; Analysis 32.3; Analysis 32.4; Analysis 32.5; Analysis 32.6; Analysis 32.7; Analysis 32.8; Analysis 32.9; Analysis 32.10; Analysis 32.11).
32.1. Analysis.
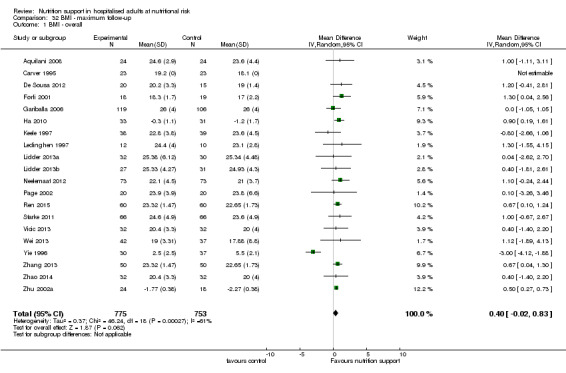
Comparison 32 BMI ‐ maximum follow‐up, Outcome 1 BMI ‐ overall.
32.2. Analysis.
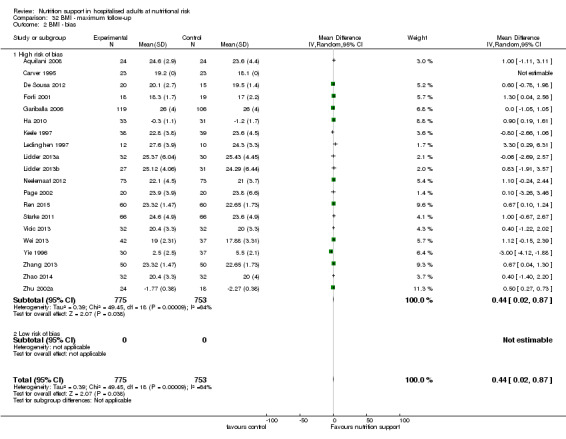
Comparison 32 BMI ‐ maximum follow‐up, Outcome 2 BMI ‐ bias.
32.3. Analysis.
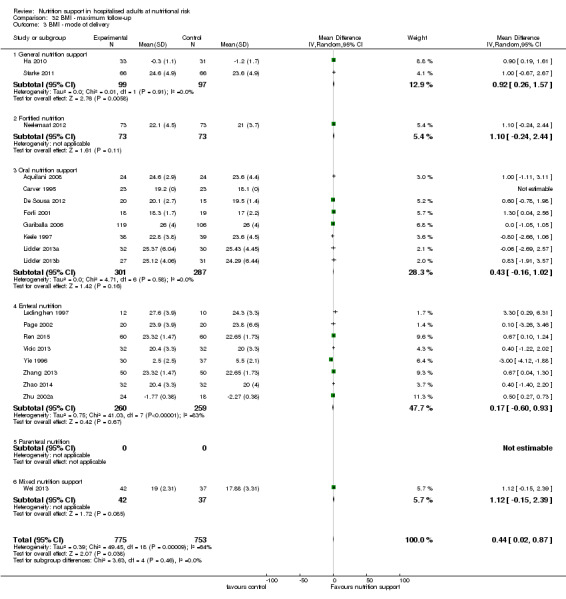
Comparison 32 BMI ‐ maximum follow‐up, Outcome 3 BMI ‐ mode of delivery.
32.4. Analysis.
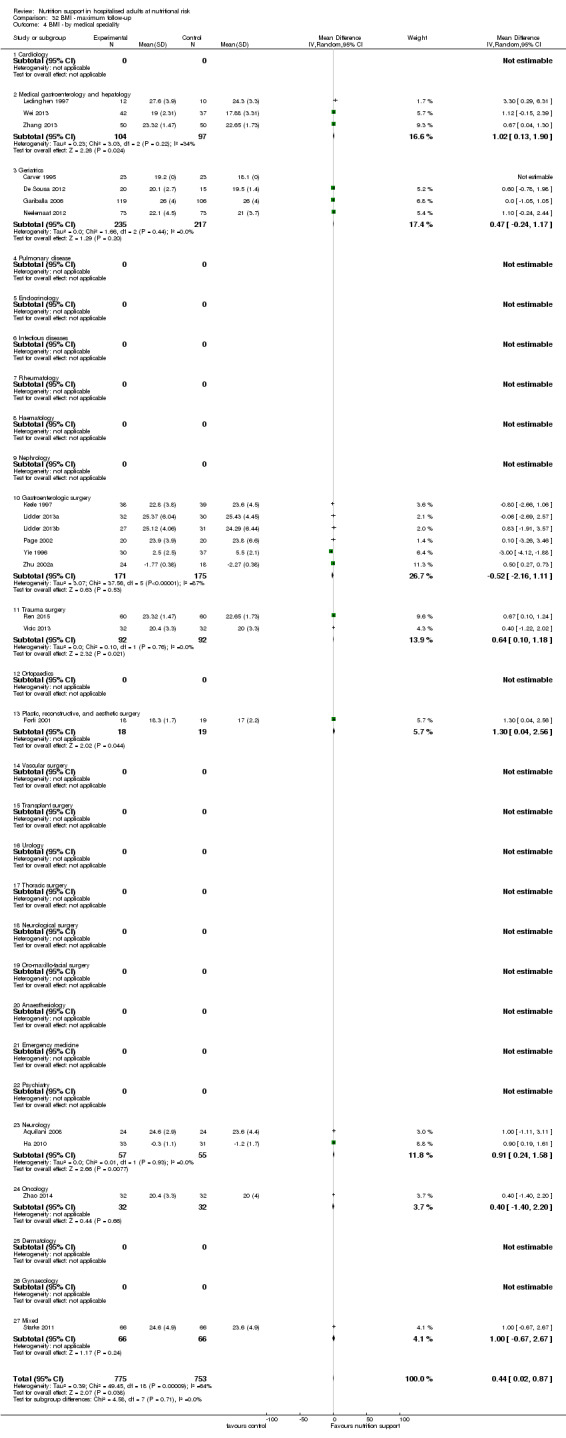
Comparison 32 BMI ‐ maximum follow‐up, Outcome 4 BMI ‐ by medical speciality.
32.5. Analysis.
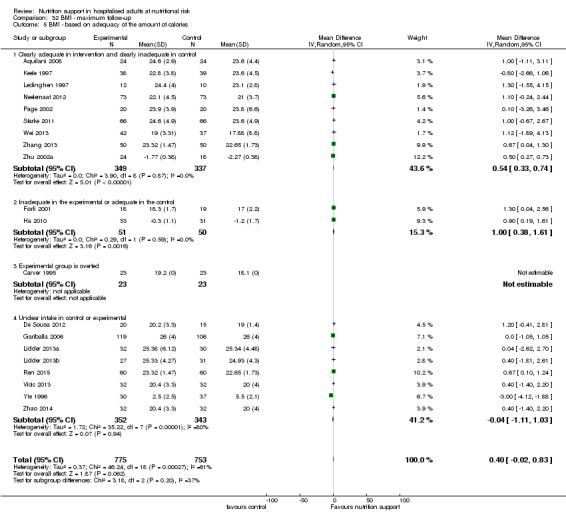
Comparison 32 BMI ‐ maximum follow‐up, Outcome 5 BMI ‐ based on adequacy of the amount of calories.
32.6. Analysis.
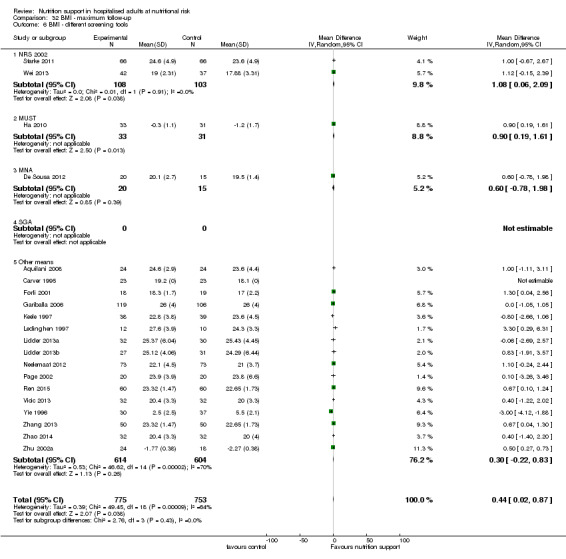
Comparison 32 BMI ‐ maximum follow‐up, Outcome 6 BMI ‐ different screening tools.
32.7. Analysis.
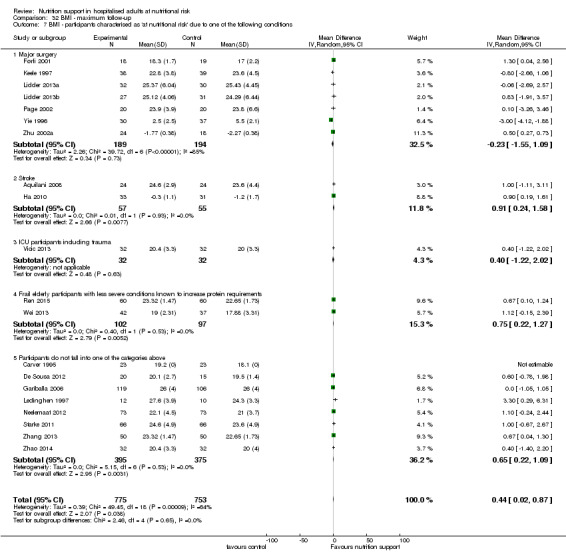
Comparison 32 BMI ‐ maximum follow‐up, Outcome 7 BMI ‐ participants characterised as 'at nutritional risk' due to one of the following conditions.
32.8. Analysis.
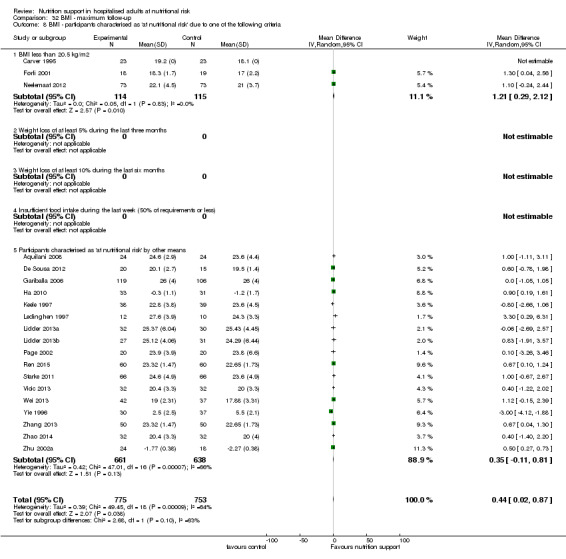
Comparison 32 BMI ‐ maximum follow‐up, Outcome 8 BMI ‐ participants characterised as 'at nutritional risk' due to one of the following criteria.
32.9. Analysis.
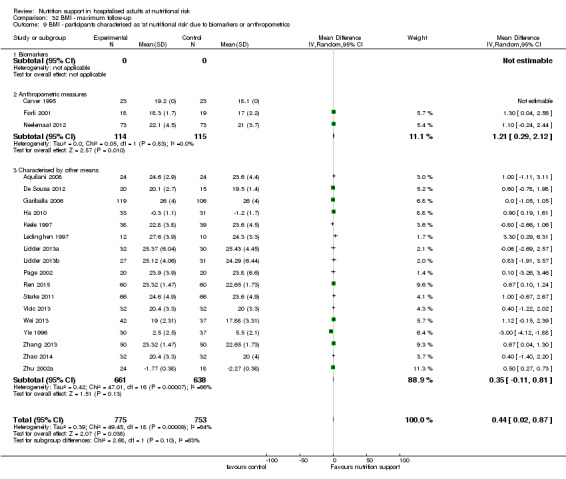
Comparison 32 BMI ‐ maximum follow‐up, Outcome 9 BMI ‐ participants characterised as 'at nutritional risk' due to biomarkers or anthropometrics.
32.10. Analysis.
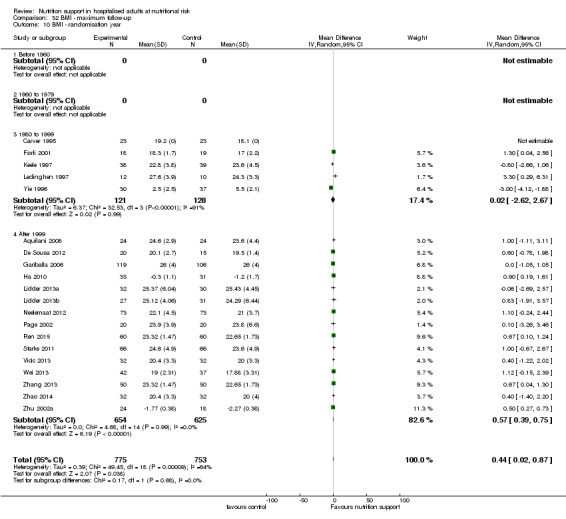
Comparison 32 BMI ‐ maximum follow‐up, Outcome 10 BMI ‐ randomisation year.
32.11. Analysis.
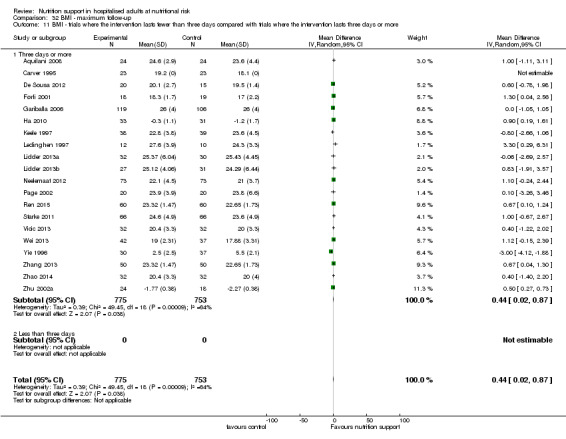
Comparison 32 BMI ‐ maximum follow‐up, Outcome 11 BMI ‐ trials where the intervention lasts fewer than three days compared with trials where the intervention lasts three days or more.
Egger's test for funnel plot asymmetry was not significant (P = 0.756). Begg's test was also not significant (P = 0.162).
Weight
End of intervention
Sixty‐eight trials (5445 participants) reported weight. Overall, we found a statistically significant benefit of nutrition support on weight at the end of intervention using the random‐effects model (MD 1.32 kg, 95% CI 0.65 to 2.00, P < 0.001, I2 = 98%, 5445 participants, 68 trials, very low quality of evidence, Analysis 33.1).
33.1. Analysis.
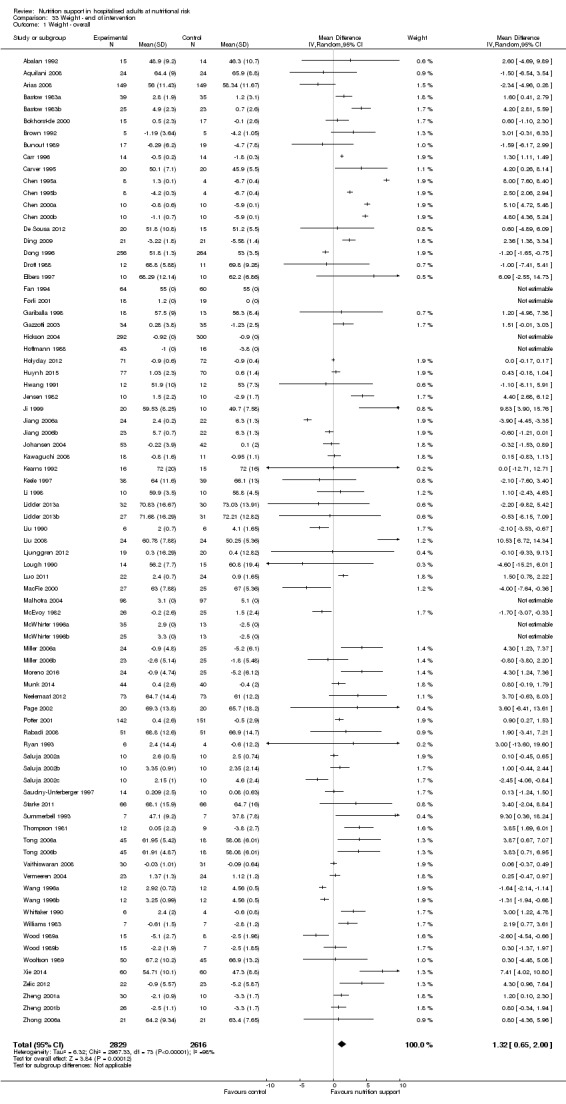
Comparison 33 Weight ‐ end of intervention, Outcome 1 Weight ‐ overall.
Subgroup analysis
In subgroup analyses we found the following: the test for subgroup difference could not be performed for the subgroup comparing high risk of bias outcomes with low risk of bias outcomes as we found no outcome results with low risk of bias (Analysis 33.2).
33.2. Analysis.
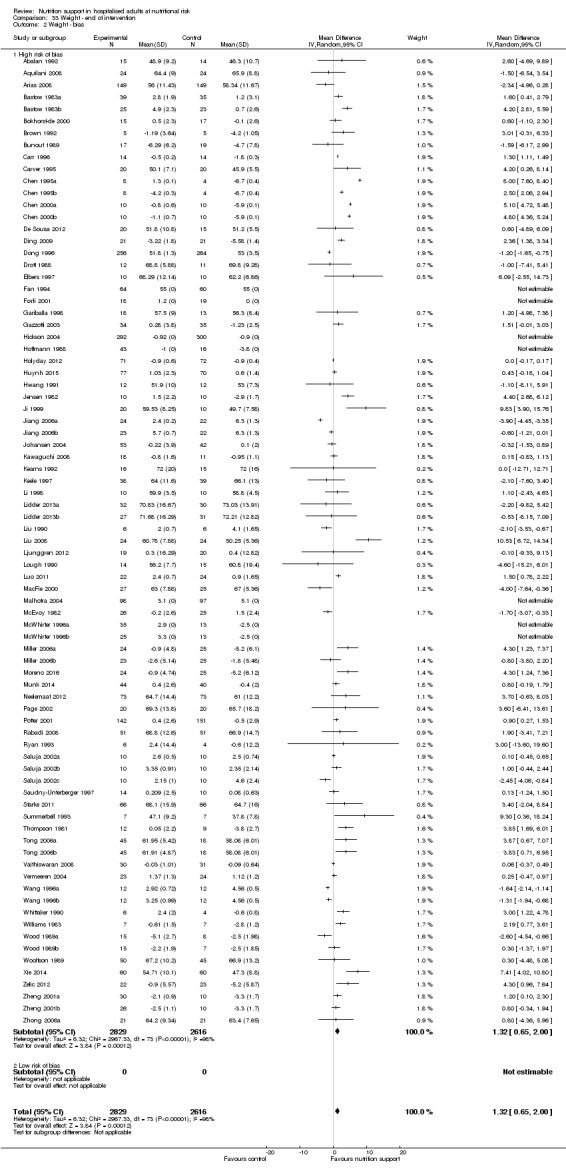
Comparison 33 Weight ‐ end of intervention, Outcome 2 Weight ‐ bias.
Analysis 33.3, comparing different modes of delivery: we found a statistically significant subgroup difference (subgroup difference: P ˂ 0.001).
33.3. Analysis.
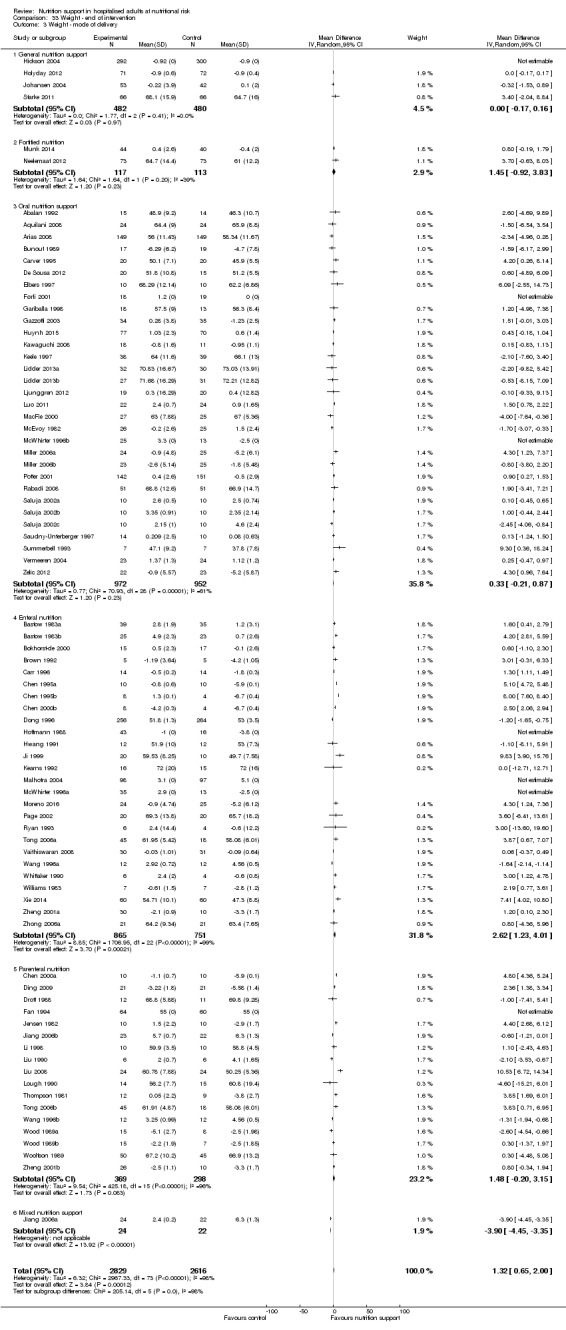
Comparison 33 Weight ‐ end of intervention, Outcome 3 Weight ‐ mode of delivery.
Analysis 33.4, comparing trials with participants from different medical specialties: we found a statistically significant subgroup difference (subgroup difference: P < 0.001).
33.4. Analysis.
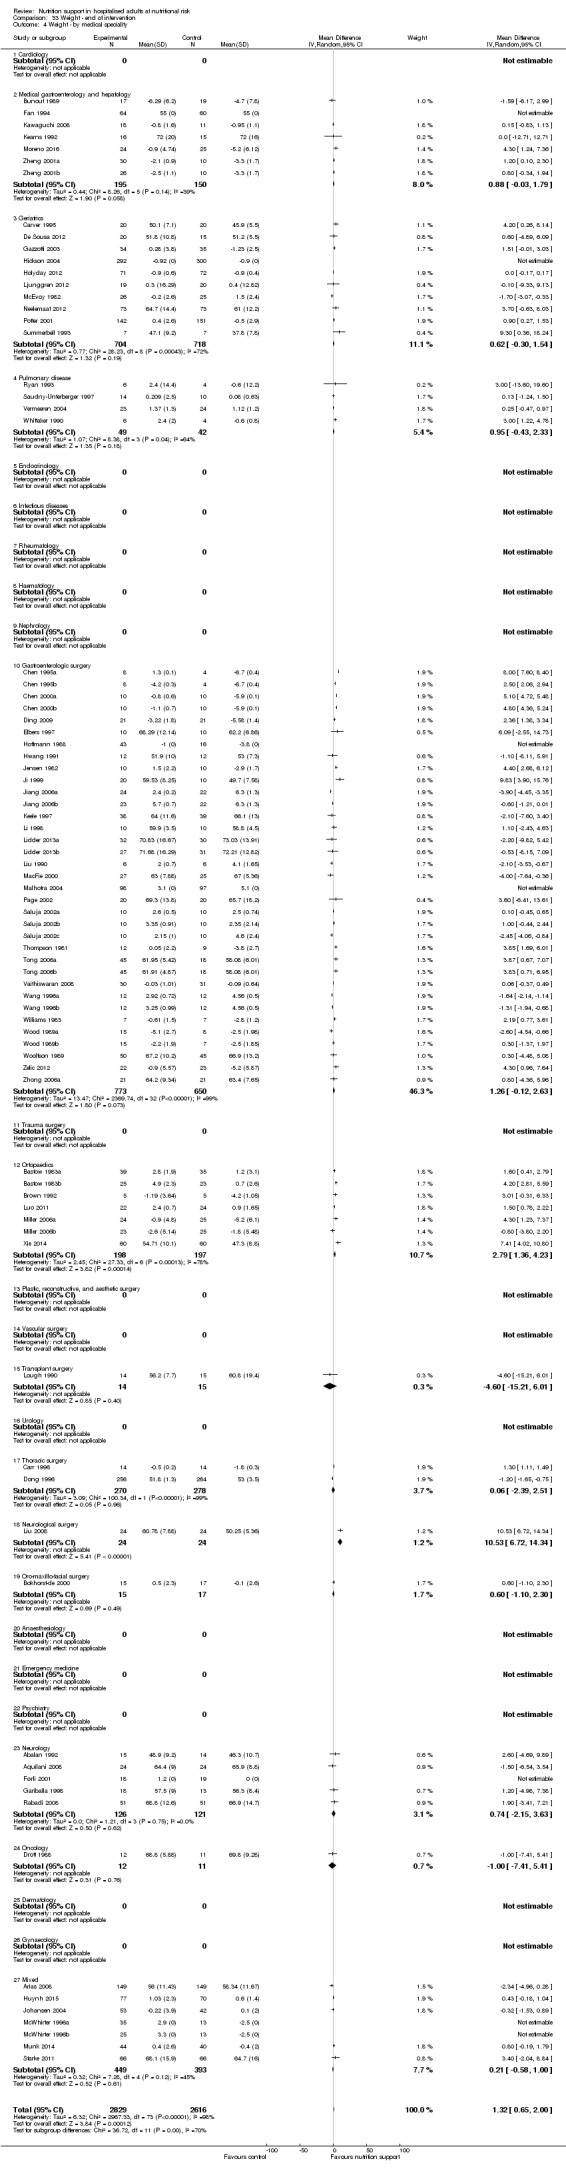
Comparison 33 Weight ‐ end of intervention, Outcome 4 Weight ‐ by medical speciality.
Analysis 33.5, comparing adequacy of the amount of nutrition: no statistically significant subgroup difference was found (subgroup difference: P = 0.57).
33.5. Analysis.
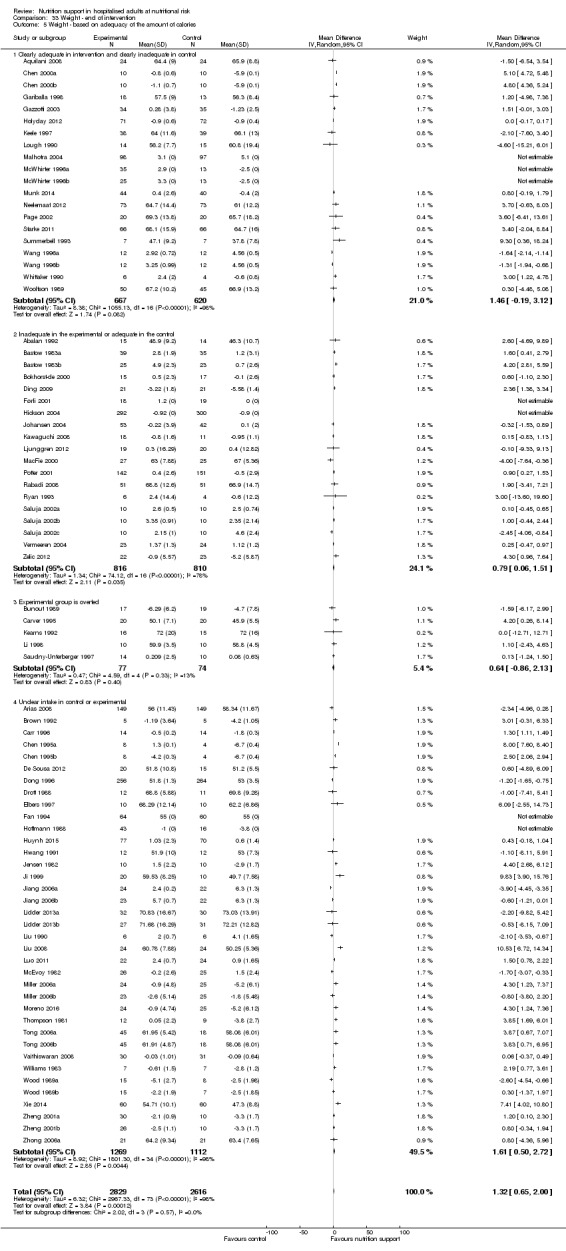
Comparison 33 Weight ‐ end of intervention, Outcome 5 Weight ‐ based on adequacy of the amount of calories.
Analysis 33.6, comparing different screening tools: we found no statistically significant subgroup difference (subgroup difference P = 0.52).
33.6. Analysis.
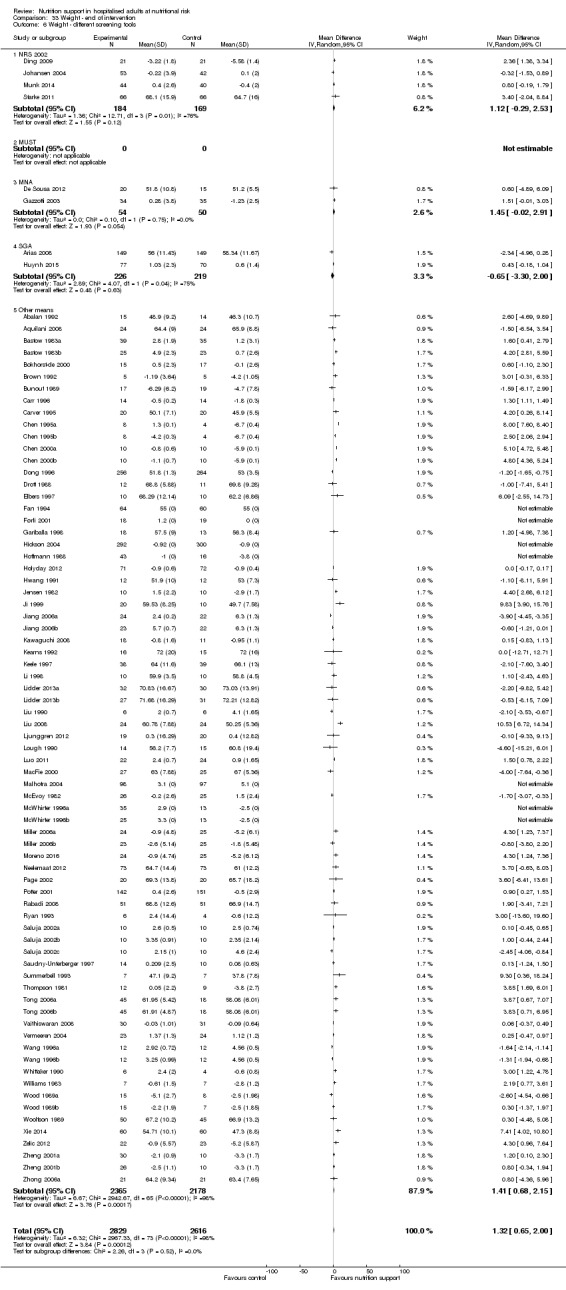
Comparison 33 Weight ‐ end of intervention, Outcome 6 Weight ‐ different screening tools.
Analysis 33.7, comparing different conditions known to be associated with malnutrition: we found no statistically significant subgroup difference (subgroup difference P = 0.52).
33.7. Analysis.
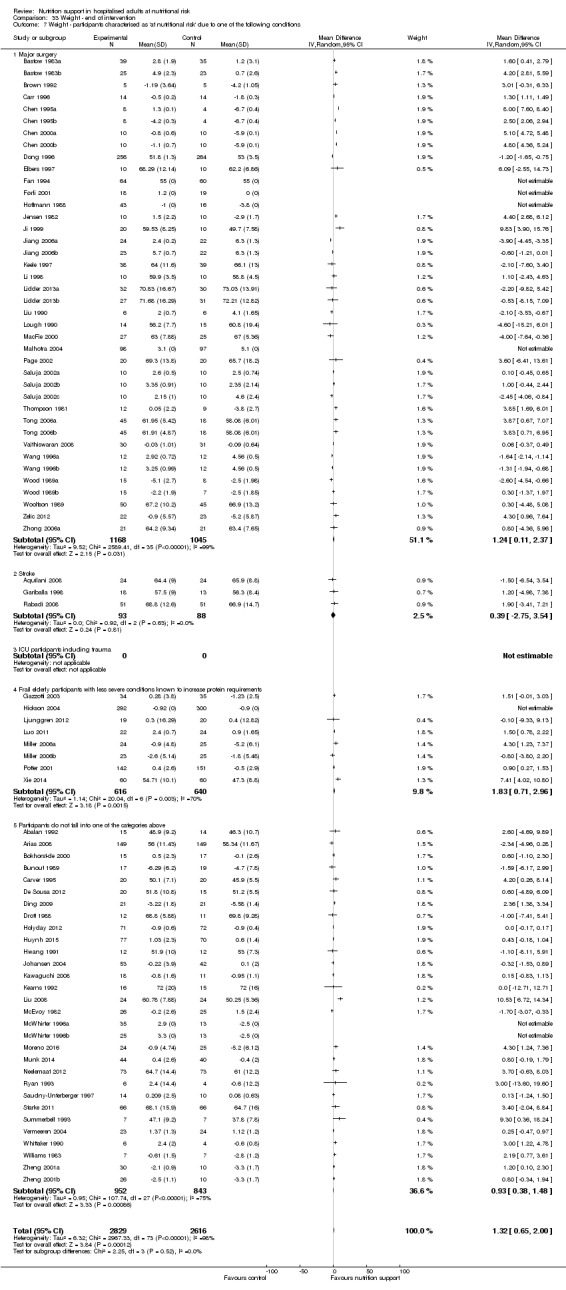
Comparison 33 Weight ‐ end of intervention, Outcome 7 Weight ‐ participants characterised as 'at nutritional risk' due to one of the following conditions.
Analysis 33.8, participants classified as at nutritional risk according to specific criteria concerning BMI, weight, insufficient food intake: we found a statistically significant subgroup difference (subgroup difference P = 0.01).
33.8. Analysis.
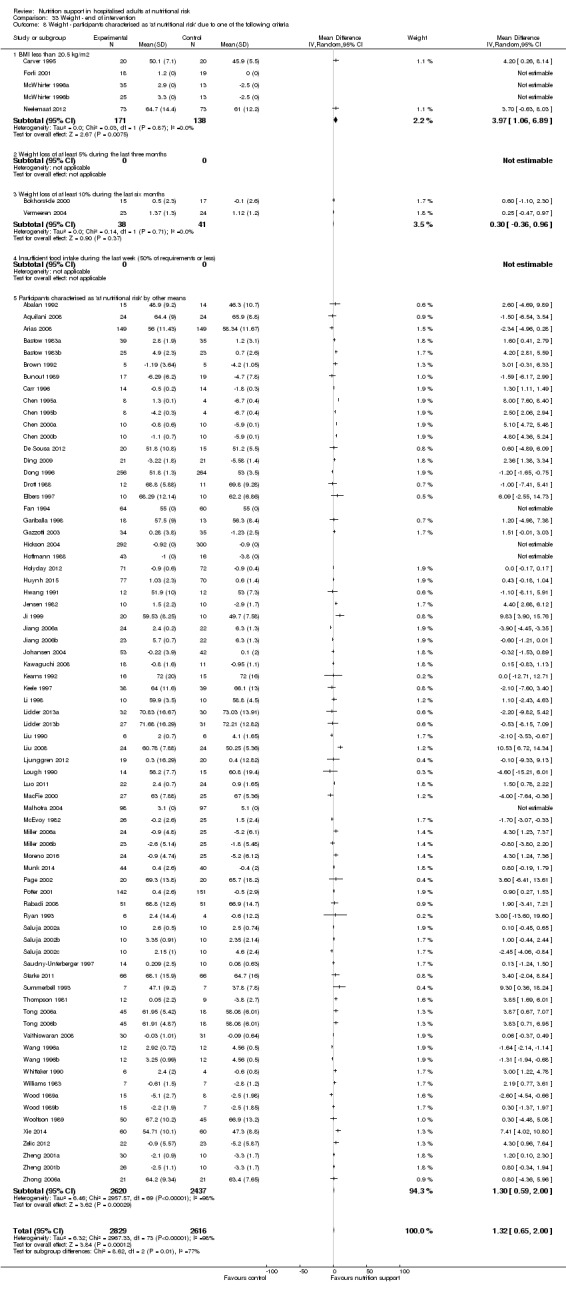
Comparison 33 Weight ‐ end of intervention, Outcome 8 Weight ‐ participants characterised as 'at nutritional risk' due to one of the following criteria.
Analysis 33.9, comparing participants classified as at nutritional risk according to biomarkers or anthropometric: we found a statistically significant subgroup difference (subgroup difference P = 0.006).
33.9. Analysis.
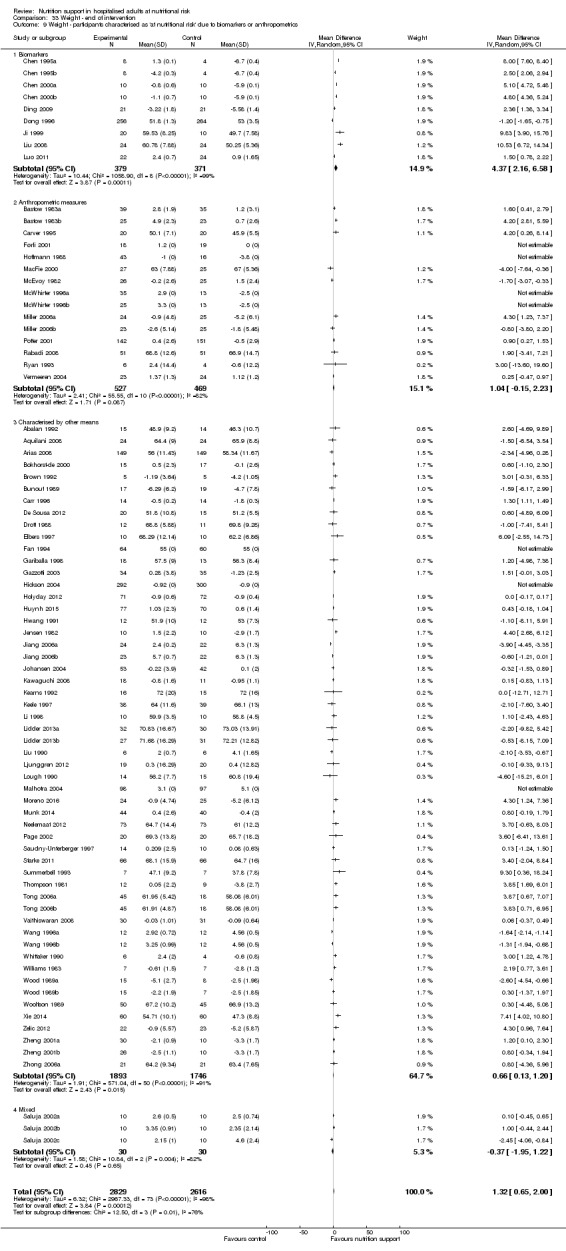
Comparison 33 Weight ‐ end of intervention, Outcome 9 Weight ‐ participants characterised as 'at nutritional risk' due to biomarkers or anthropometrics.
Analysis 33.10, comparing year of publication: we found no statistically significant subgroup difference (subgroup difference P = 0.06).
33.10. Analysis.
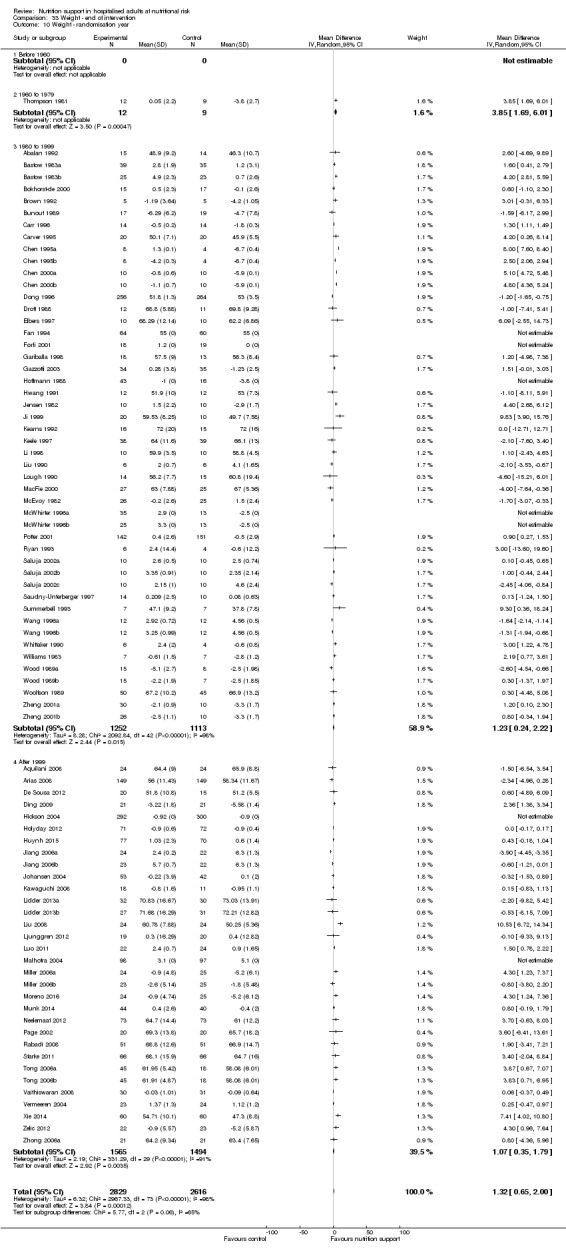
Comparison 33 Weight ‐ end of intervention, Outcome 10 Weight ‐ randomisation year.
Analysis 33.11, comparing different interventions lengths of intervention: we found no statistically significant subgroup difference (subgroup difference P = 0.20).
33.11. Analysis.
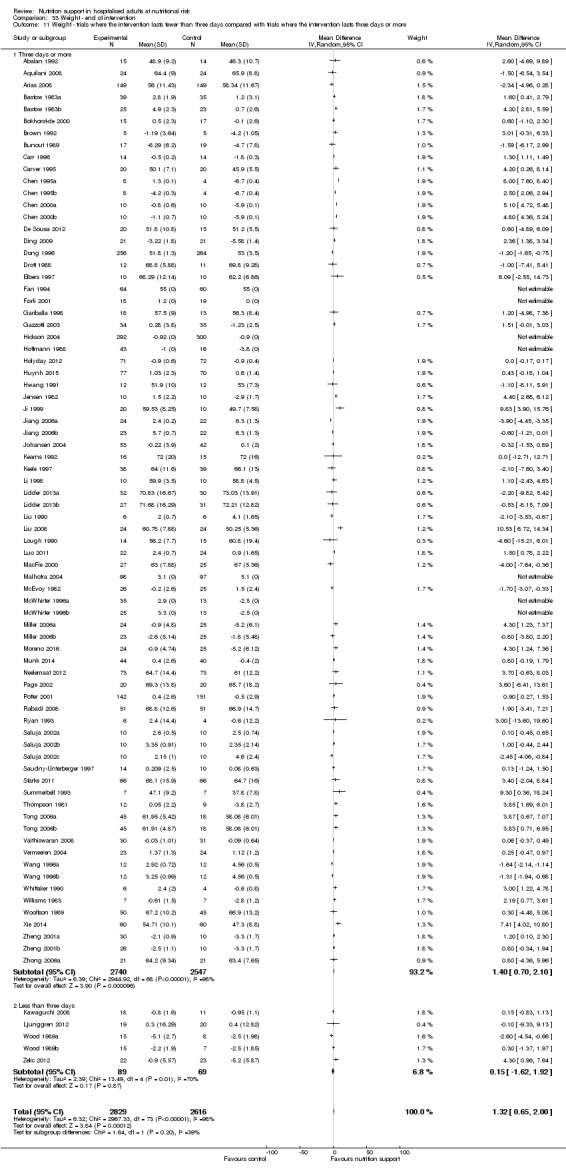
Comparison 33 Weight ‐ end of intervention, Outcome 11 Weight ‐ trials where the intervention lasts fewer than three days compared with trials where the intervention lasts three days or more.
Sensitivity analysis
For trials with missing SDs, we imputed SDs from trials with a similar number of participants. For Fan 1994 we used the SD from Starke 2011, for Førli 2001 from Kawaguchi 2008, for Hickson 2004 from Dong 1996, for Hoffmann 1988 from Munk 2014, for Malhotra 2004 from Johansen 2004, for McWhirter 1996a; McWhirter 1996b from Zheng 2001a; Zheng 2001b. This exploratory analysis still resulted in a small statistically significant benefit using the random‐effects model (MD 1.40 kg, 95% CI 0.76 to 2.03, P ˂ 0.001, I2 = 98%, 5445 participants, 68 trials, very low quality of evidence, Analysis 33.12).
33.12. Analysis.
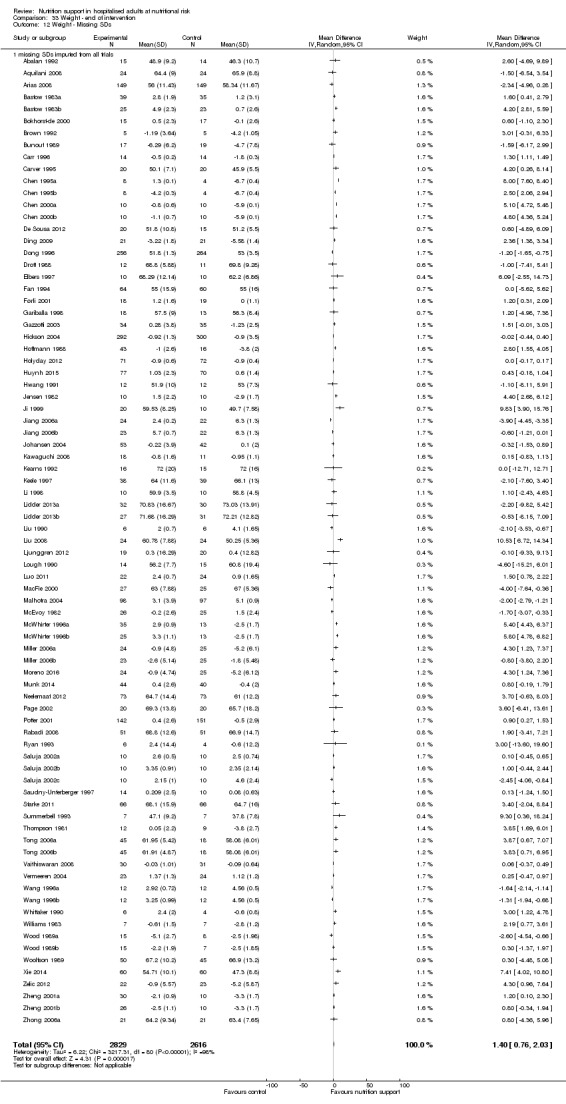
Comparison 33 Weight ‐ end of intervention, Outcome 12 Weight ‐ Missing SDs.
Egger's test for funnel plot asymmetry was not significant (P = 0.823). Begg's test was also not significant (P = 0.149).
Maximum follow‐up
Seventy‐eight of 244 trials (29.91%), with 6865 participants, reported weight. Overall, we found a statistically significant benefit of nutrition support on weight at maximum follow‐up using the random‐effects model (MD 1.13, 95% CI 0.50 to 1.75, P < 0.001, I2 = 98%, 6916 participants, 78 trials, very low quality of evidence, Analysis 34.1).
34.1. Analysis.

Comparison 34 Weight ‐ maximum follow‐up, Outcome 1 Weight ‐ overall.
Subgroup analysis
In subgroup analyses we found the following: we could not perform the test for subgroup difference for the subgroup comparing high risk of bias outcomes with low risk of bias outcomes, because we found no outcome results with low risk of bias (Analysis 33.2).
Analysis 34.3, comparing different modes of delivery: we found a statistically significant subgroup difference : P ˂ 0.001).
34.3. Analysis.
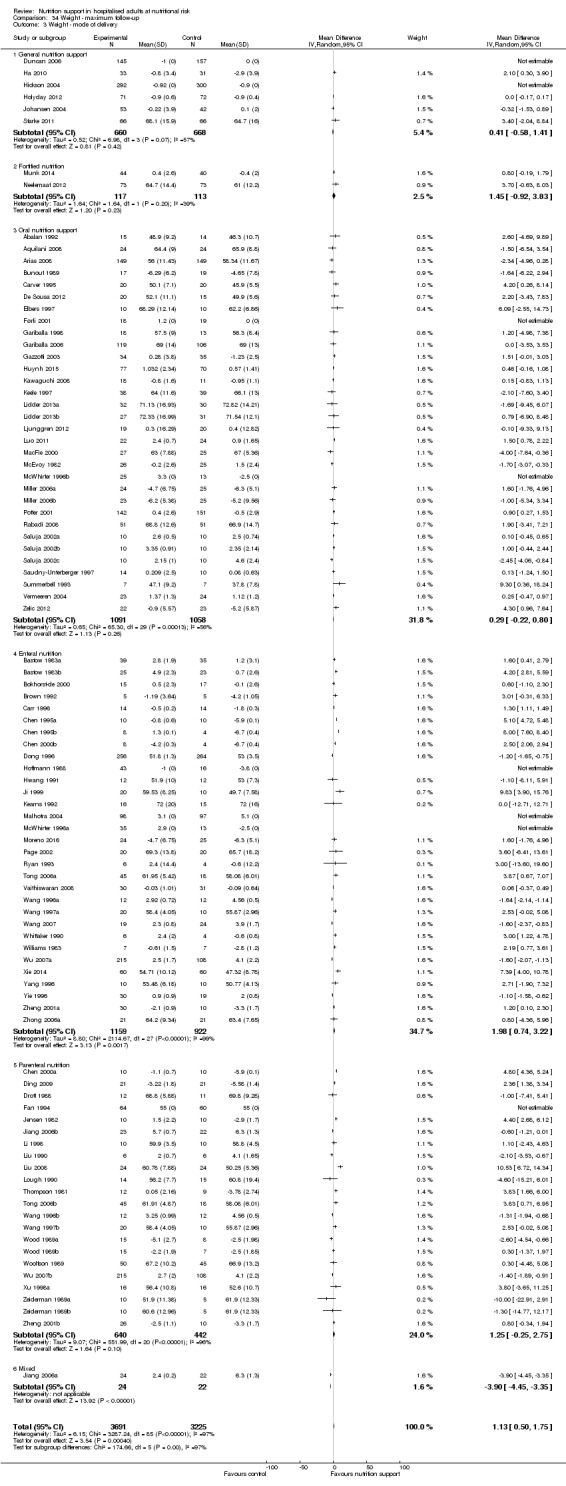
Comparison 34 Weight ‐ maximum follow‐up, Outcome 3 Weight ‐ mode of delivery.
Analysis 34.4, comparing trials with participants from different medical specialties: we found a statistically significant subgroup difference (subgroup difference: P ˂ 0.001).
34.4. Analysis.
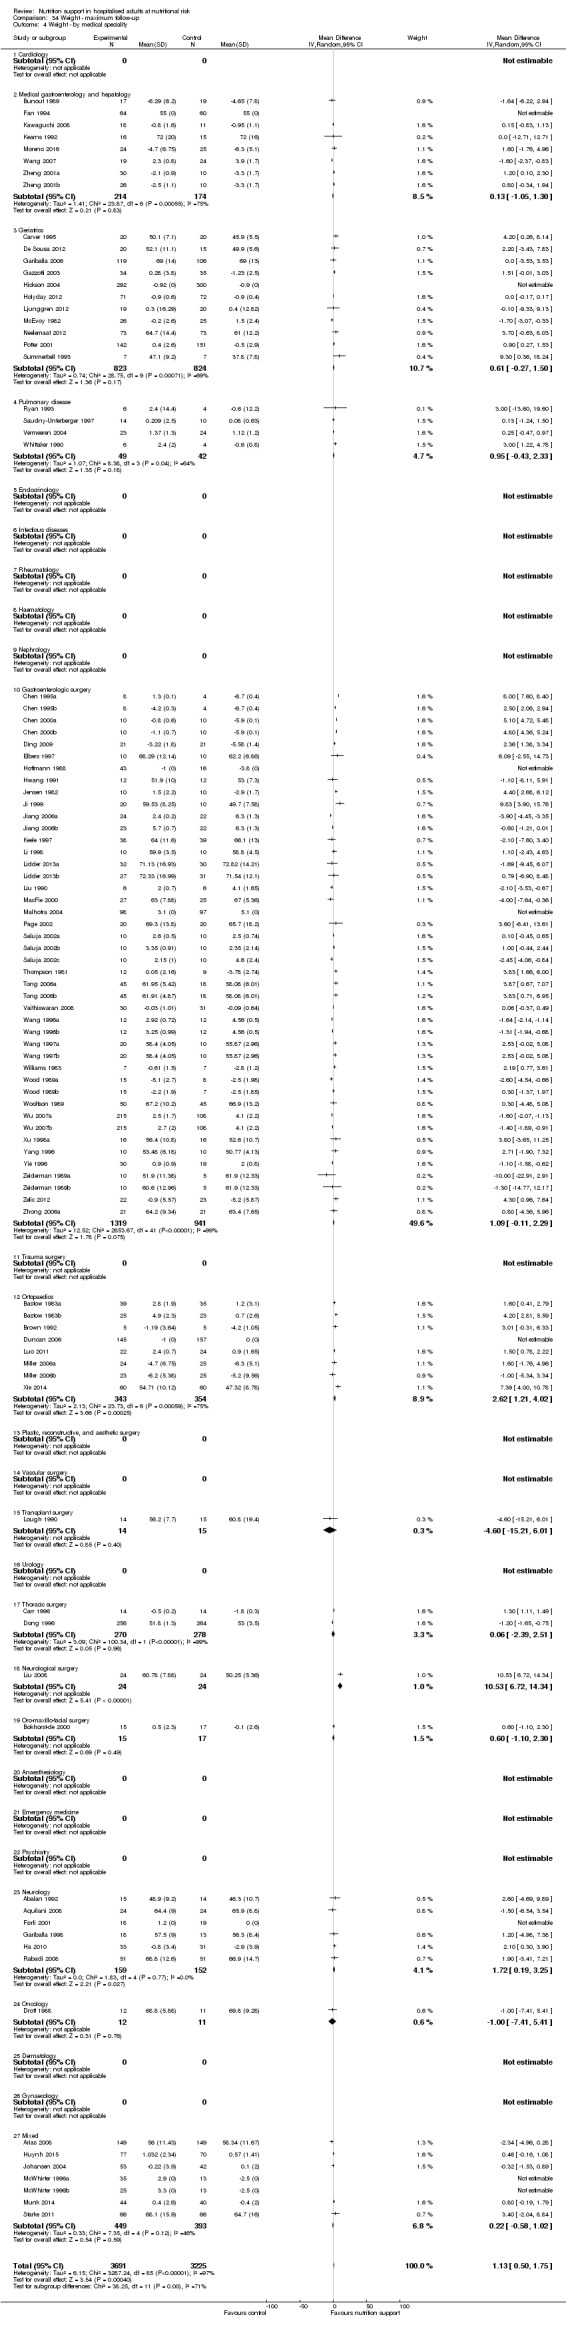
Comparison 34 Weight ‐ maximum follow‐up, Outcome 4 Weight ‐ by medical speciality.
Analysis 34.5, comparing adequacy of the amount of nutrition: we found no statistically significant subgroup difference (subgroup difference: P = 0.85).
34.5. Analysis.
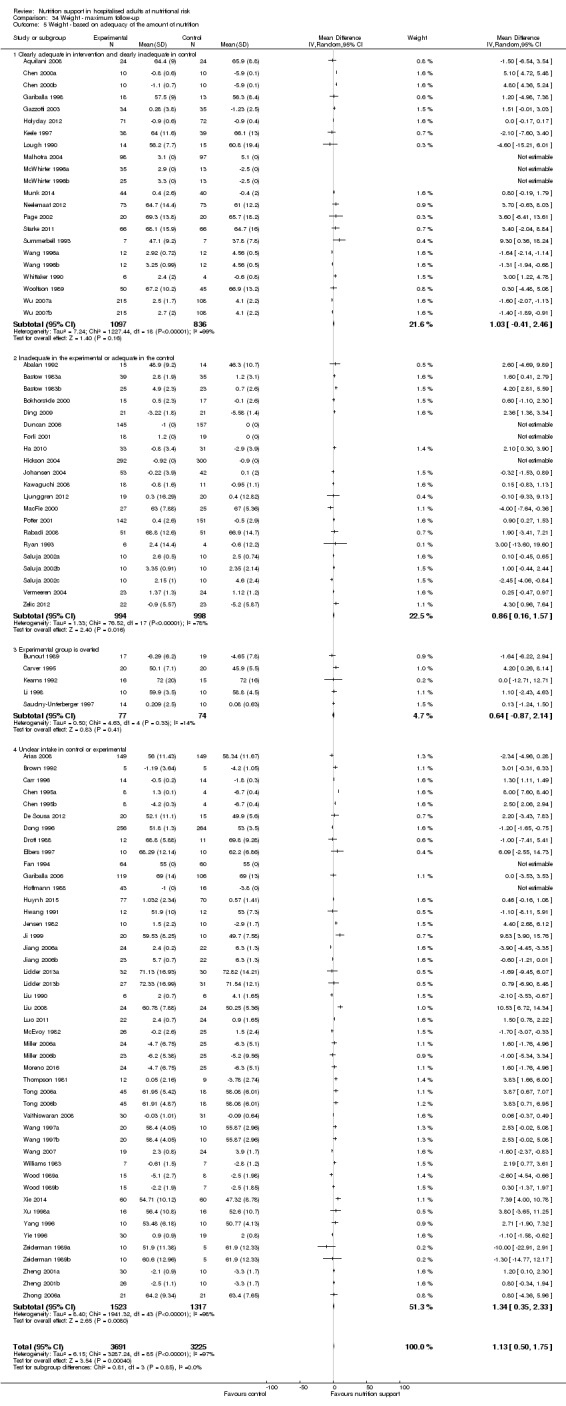
Comparison 34 Weight ‐ maximum follow‐up, Outcome 5 Weight ‐ based on adequacy of the amount of nutrition.
Analysis 34.6, comparing different screening tool: we found a statistically significant subgroup difference (subgroup difference P = 0.004).
34.6. Analysis.
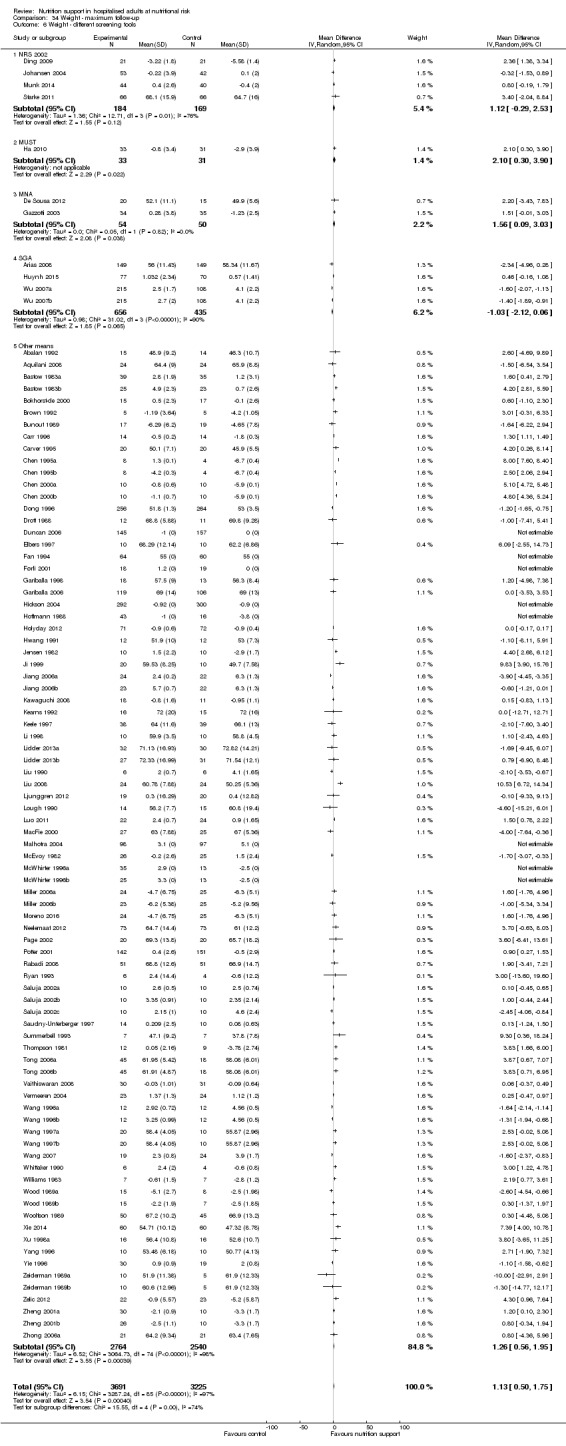
Comparison 34 Weight ‐ maximum follow‐up, Outcome 6 Weight ‐ different screening tools.
Analysis 34.7, comparing different conditions known to be associated with malnutrition: we found a statistically significant subgroup difference (subgroup difference P ˂ 0.001).
34.7. Analysis.
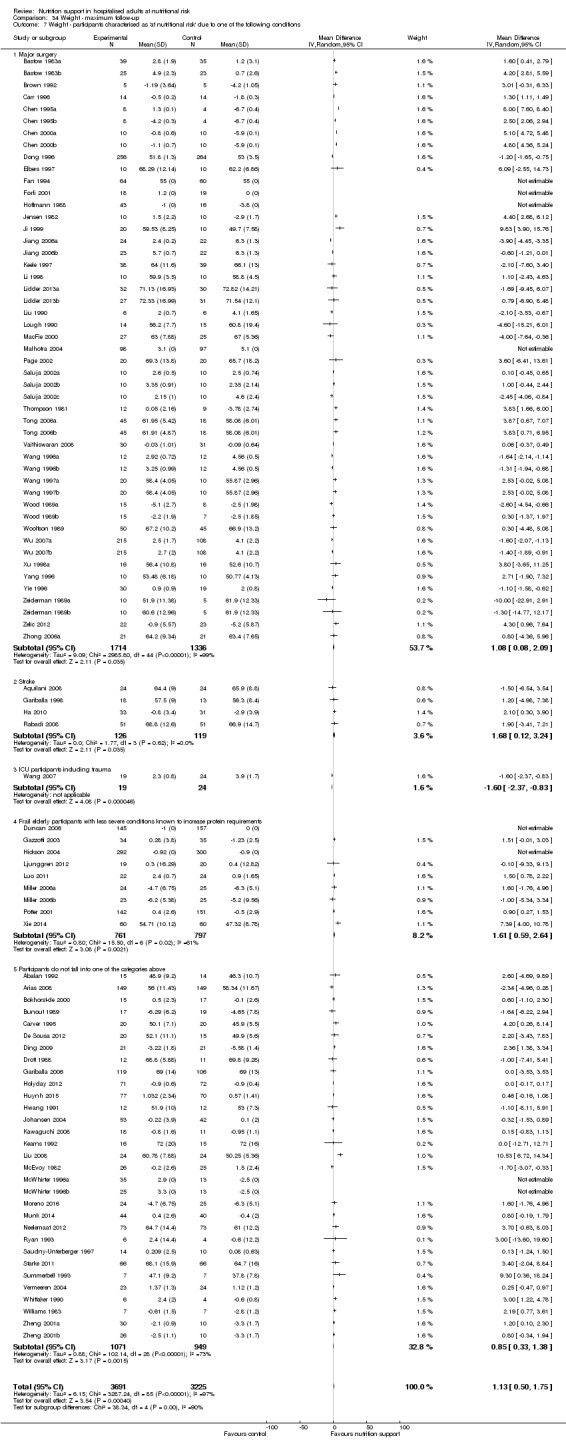
Comparison 34 Weight ‐ maximum follow‐up, Outcome 7 Weight ‐ participants characterised as 'at nutritional risk' due to one of the following conditions.
Analysis 34.8, participants classified as at nutritional risk according to specific criteria concerning BMI, weight, insufficient food intake: we found a statistically significant subgroup difference (subgroup difference P = 0.02).
34.8. Analysis.
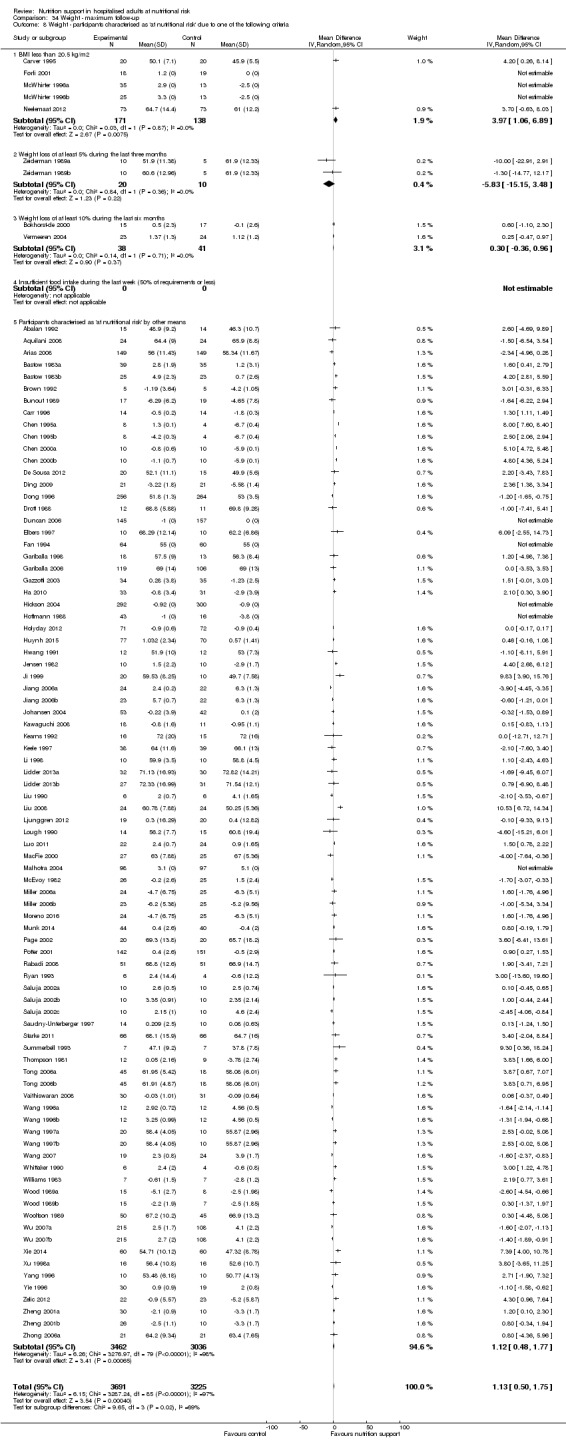
Comparison 34 Weight ‐ maximum follow‐up, Outcome 8 Weight ‐ participants characterised as 'at nutritional risk' due to one of the following criteria.
Analysis 34.9, comparing participants classified as at nutritional risk according to biomarkers or anthropometric: we found a statistically significant subgroup difference (subgroup difference P = 0.005).
34.9. Analysis.
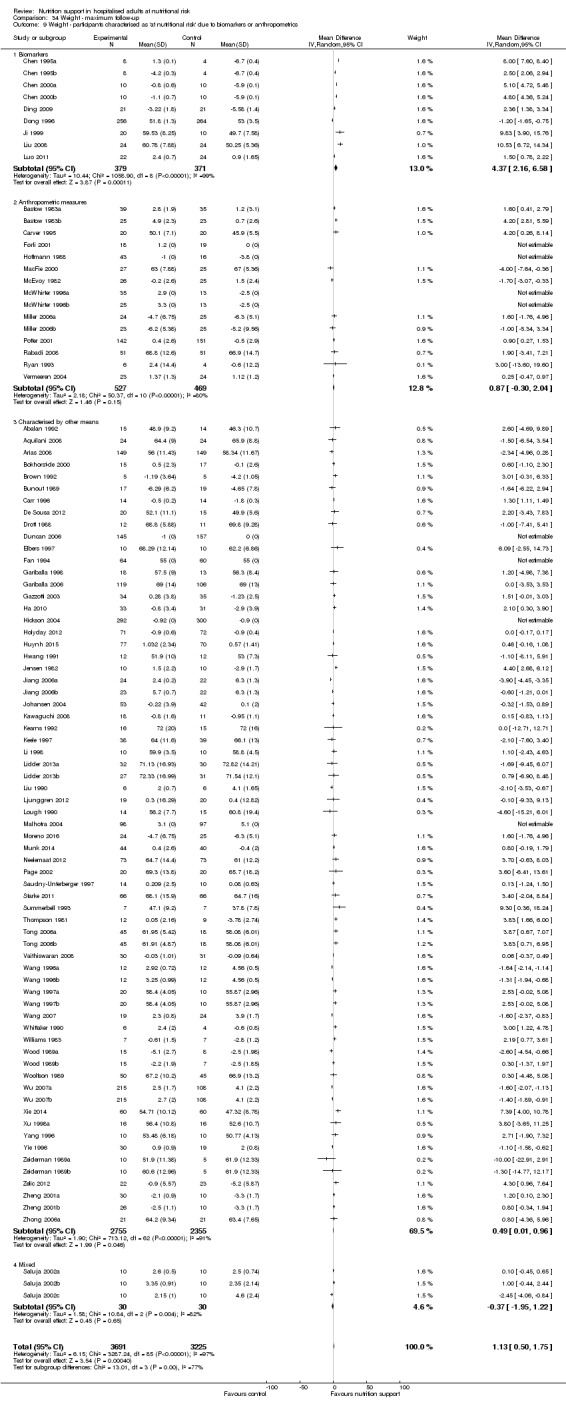
Comparison 34 Weight ‐ maximum follow‐up, Outcome 9 Weight ‐ participants characterised as 'at nutritional risk' due to biomarkers or anthropometrics.
Analysis 34.10, comparing year of publication: we found a statistically significant subgroup difference (subgroup difference P = 0.008).
34.10. Analysis.
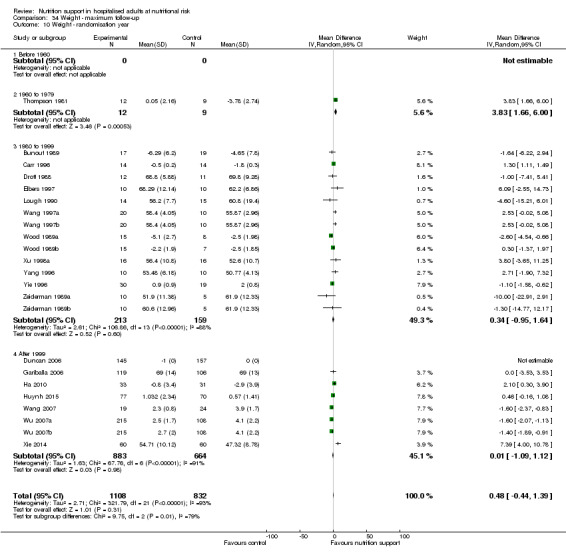
Comparison 34 Weight ‐ maximum follow‐up, Outcome 10 Weight ‐ randomisation year.
Analysis 34.11, comparing different lengths of intervention: we found no statistically significant subgroup difference (subgroup difference P = 0.29).
34.11. Analysis.
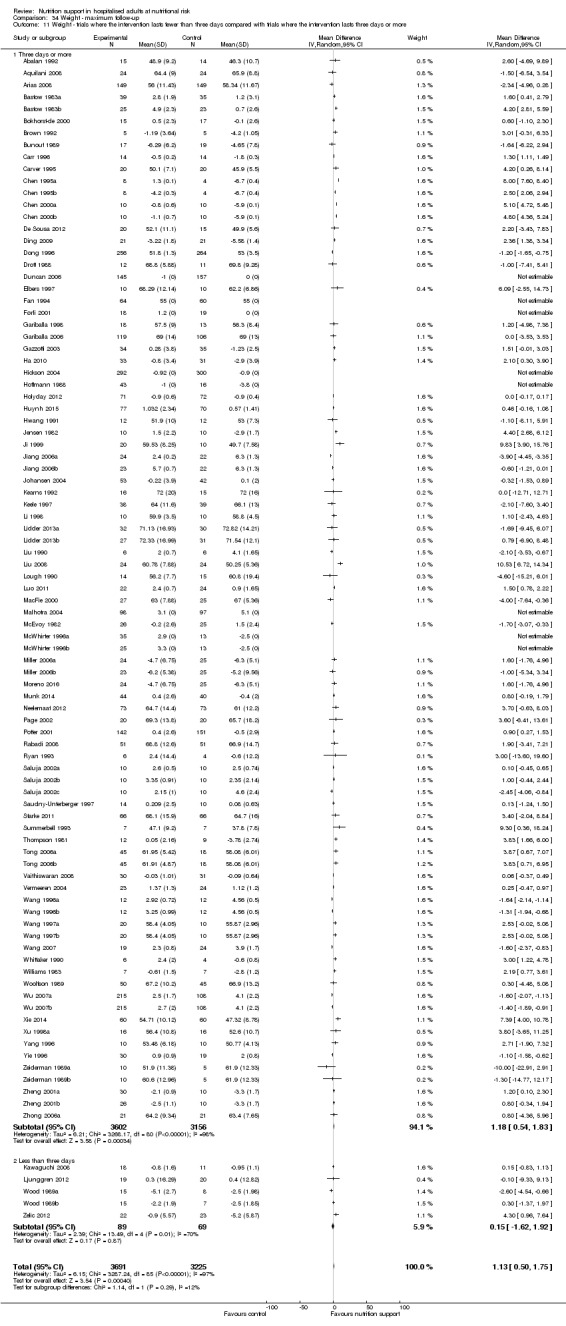
Comparison 34 Weight ‐ maximum follow‐up, Outcome 11 Weight ‐ trials where the intervention lasts fewer than three days compared with trials where the intervention lasts three days or more.
Egger's test for funnel plot asymmetry was not significant (P = 0.887). Begg's test was also not significant (P = 0.145).
Hand‐grip strength
End of intervention
Eleven trials (783 participants) reported hand‐grip strength at end of intervention. Overall, we found a statistically significant benefit of nutrition support on hand‐grip strength using the random‐effects model (MD 1.47 kg, 95% CI 0.58 to 2.37, P = 0.001, I2 = 48%, 783 participants, 11 trials, very low quality of evidence, Analysis 35.1). Two trials reported hand‐grip strength in kilo pascal (Keele 1997; MacFie 2000). These were not part of the meta‐analysis.
35.1. Analysis.
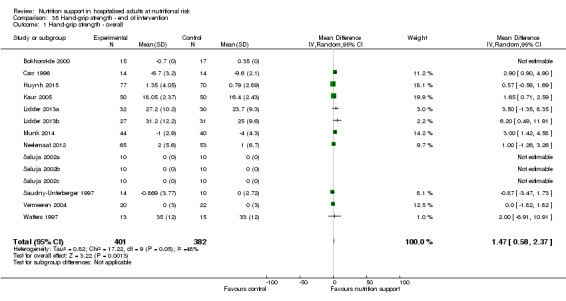
Comparison 35 Hand‐grip strength ‐ end of intervention, Outcome 1 Hand‐grip strength ‐ overall.
Egger's test for funnel plot asymmetry was not significant (P = 0.546). Begg's test was also not significant (P = 0.788).
Maximum follow‐up
Fourteen trials (1240 participants) reported hand‐grip strength at maximum follow‐up. Overall, we found no statistically significant benefit of nutrition support on hand‐grip strength using the random‐effects model (MD 0.96 kg, 95% CI 0.15 to 1.76, P = 0.02, I2 = 40%, 14 trials, 1240 participants, very low quality of evidence, Analysis 36.1). Two trials reported hand‐grip strength in kilo pascal (Keele 1997; MacFie 2000). These were not part of the meta‐analysis.
36.1. Analysis.
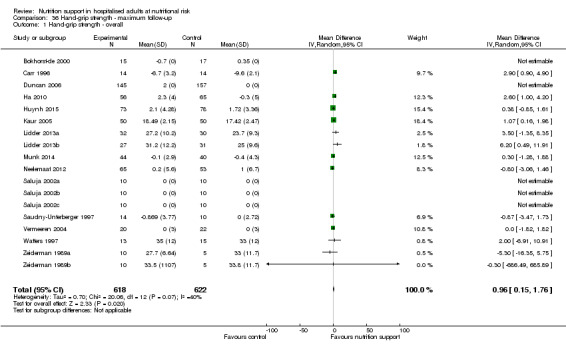
Comparison 36 Hand‐grip strength ‐ maximum follow‐up, Outcome 1 Hand‐grip strength ‐ overall.
Egger's test for funnel plot asymmetry was not significant (P = 0.834). Begg's test was also not significant (P = 0.625).
Six‐minute walking distance
One trial reported six‐minute walking distance (Rabadi 2008). It found a statistically significant benefit of nutrition support on six‐minute walking distance (MD 133.27 feet, 95% CI 24.32 to 242.22, P = 0.02, very low quality of evidence, Analysis 37.1).
37.1. Analysis.
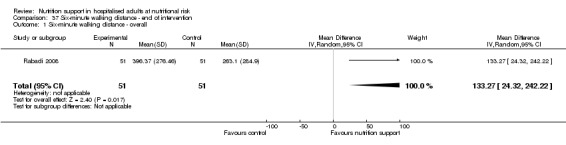
Comparison 37 Six‐minute walking distance ‐ end of intervention, Outcome 1 Six‐minute walking distance ‐ overall.
Summary of findings table
Our main results are summarised in the 'Table 1'.
Discussion
Summary of main results
We included 244 trials randomising 28,619 participants. The trials included a heterogenous group of participants, the settings varied, and the experimental and control interventions differed. All trials were at high risk of bias and the level of evidence was low for all‐cause mortality and serious adverse events, and very low for health‐related quality of life. Despite these limitations, overall we saw small or no effects of nutrition support on all outcomes, and our findings had surprisingly low heterogeneity. These limited signs of statistical heterogeneity support the decision to conduct the meta‐analysis by pooling all types of nutrition support interventions in one meta‐analysis, as we did (see Overall completeness and applicability of evidence for a detailed discussion).
Our meta‐analyses showed that nutrition support versus control did not have a statistically significantly effect on all‐cause mortality at end of intervention. The result of our Trial Sequential Analyses implied firm evidence of nutrition support not reducing or increasing the risk ratio of all‐cause mortality by 20% or more at end of intervention (Figure 4; Effects of interventions). Post hoc Trial Sequential Analysis showed we had enough power to reject a risk ratio of 11% or more reduction in all‐cause mortality at end of intervention (Supplementary online material). All‐cause mortality at maximum follow‐up also showed no statistically significant effect of nutrition support when considered against a predefined threshold for statistical significance of 0.025. The result of our Trial Sequential Analyses implied firm evidence of nutrition support not reducing or increasing the risk ratio for all‐cause mortality by 20% or more at maximum follow‐up (Supplementary online material; Effects of interventions). Post hoc Trial Sequential Analysis showed we had enough power to reject a 10% or more reduction in all‐cause mortality at maximum follow‐up Supplementary online material).
Our meta‐analyses showed that nutrition support versus control did not have a statistically significant effect on serious adverse events at end of intervention. The result of our Trial Sequential Analysis implied firm evidence of nutrition support not reducing or increasing the risk ratio of serious adverse events by 20% or more at end of intervention (Supplementary online material; Effects of interventions). Post hoc Trial Sequential Analysis showed we had enough power to reject a risk ratio of 11% or more reduction in serious adverse events at end of intervention (Supplementary online material). Serious adverse events at maximum follow‐up were statistically significantly reduced with nutrition support, but this was not seen at end of intervention and therefore the finding may be a result of multiplicity or risk of bias or both (Jakobsen 2014; Jakobsen 2016). The outcome results were at high risk of bias and the result of our Trial Sequential Analysis analysis implied firm evidence of nutrition support not reducing or increasing serious adverse events by 20% or more at maximum follow‐up (Supplementary online material; Effects of interventions). Post hoc Trial Sequential Analysis showed we had enough power to reject a risk ratio of 10% or more reduction in serious adverse events at maximum follow‐up (Figure 5).
Quality of life in participants receiving nutrition support was not statistically significantly affected at maximum follow‐up. Few trials used similar quality‐of‐life questionnaires, and only data from EuroQoL utility score and SF‐36 could be used in a meta‐analysis. In both meta‐analyses we found no beneficial or harmful effects. While most of the trials found no beneficial or harmful effect of nutrition support, a few trials found a beneficial effect on specific quality‐of‐life variables.
BMI at end of intervention showed a statistically significant improvement when participants received nutrition support (Analysis 31.1). The clinical relevance of this increase is unknown. BMI at maximum follow‐up did not show a statistically significant increase (Analysis 32.1).
Weight at end of intervention and at maximum follow‐up showed a statistically significant increase when participants received nutrition support. The clinical relevance of this increase is unknown (Analysis 33.1; Analysis 34.1).
Hand‐grip strength at end of intervention showed a statistically significant improvement when participants received nutrition support, but the increase was not statistically significant at maximum follow‐up. The clinical relevance of this increase is unknown.
Nutrition support analysed by route of administration
We assessed individually the different modes of delivery of nutrition support. Trial Sequential Analysis for enteral nutrition for serious adverse events at maximum follow‐up broke the threshold for significant benefit (Analysis 4.3; Figure 6; Effects of interventions). There are, however, many important considerations when interpreting this result: all trials were at high risk of bias and the funnel plot was highly suggestive of publication bias (Supplementary online material). Furthermore, it is important to note that, given the amount of subgroup analyses, outcomes, time points, and our threshold for significance, one might expect that by chance alone a type I error would occur (Jakobsen 2016). Despite the significant meta‐analysis result and confirmed 20% risk ratio reduction in the Trial Sequential analysis, trials at low risk of bias will need to assess the effects of enteral nutrition before we can draw any conclusions.
Standard parenteral and oral nutrition broke the threshold for futility, indicating no beneficial or harmful effects despite the high risk of bias (Supplementary online material).
We also performed our subgroup analyses according to the different kinds of nutrition support (not for general and fortified foods, since we identified very few trials that used these kinds of nutrition support) at the suggestion of the editor and one of the peer reviewers. The results of the new subgroup analyses are in agreement with the subgroup analyses of our overall analyses: we found no benefit of oral nutrition support or parenteral nutrition support in any subgroup. Enteral nutrition may be beneficial for different subgroups of patients and may be tested in future trials with low risk of bias and with adequate power.
Exploratory subgroup analyses
Tests for subgroup differences found a significant difference in the subgroup comparing different conditions, theoretically known to increase the nutritional requirements on serious adverse events at maximum follow‐up (Analysis 4.7). Trial Sequential Analysis for major surgery did not pass through the boundary for benefit, implying that nutrition support does not result in a risk ratio reduction of 20% in the risk of a serious adverse event at maximum follow‐up, especially when considering the fact that the trials were at high risk of bias (Supplementary online material).
Trial Sequential Analysis for stroke participants did not pass through the boundary for benefit, implying that nutrition support does not reduce the risk ratio of serious adverse events at maximum follow‐up of 20%. The Trial Sequential Analysis did not reach the required information size (Supplementary online material).
Using the test for subgroup differences, no other subgroups showed significant benefit or harm. For a discussion of the limitations in the way we have handled subgroups and the review in general, see Overall completeness and applicability of evidence.
Overall completeness and applicability of evidence
We searched for published and unpublished trials irrespective of publication type, publication date, and language. We also searched bibliographies of both Cochrane and non‐Cochrane Reviews on nutrition support for any trials we missed. Overall, we have included more trials than any nutrition review ever before, due to our broader inclusion criteria as well as our extensive searches.
A number of the funnel plots suggest that we are still missing data from trials favouring the control group compared with nutrition support (Supplementary online material). This may be due to publication bias, but other types of bias might also cause the asymmetries. The high risks of bias suggest that our results may possibly be due to an overestimate of the benefit and an underestimate of the harm of nutrition support.
Discussion of heterogeneity (clinical and statistical) regarding our overall analysis
We included a very clinically heterogenous participant population assessed in various settings examining various types of nutrition support administered through different routes. Different inclusion criteria exist regarding how to assess whether or not a participant is at nutritional risk and we therefore chose to include various definitions. We chose to focus primarily on the overall analysis, with all types of nutrition support pooled in one analysis for three reasons: 1) we wanted to assess the overall effects of nutrition support in hospitalised adults at nutritional risk; 2) this pooled analysis would have the largest statistical power as well as precision; and 3) pooling all types of nutrition support makes it possible to use subgroup analyses to compare the effects of the different nutrition support interventions. If by pooling all the trials we saw very large heterogeneity, we would not have conducted the overall analyses and instead would have explored (as we still do) any possible explanation for the heterogeneity seen.
We found no signs of statistical heterogeneity in the meta‐analyses, using both visual inspection of the forest plots as well as the statistical tests for heterogeneity for our primary outcomes. For our secondary outcomes, we found no heterogeneity when visually inspecting the forest plots, but the I2 for the outcomes results of weight was high. Our many subgroup analyses also found few subgroups of participants that may benefit from nutrition support, the potential exception being major surgery and stroke participants (Analysis 4.7). The latter subgroup analysis was only significant at maximum follow‐up for serious adverse events. It is important to make the distinction between clinical heterogeneity (which is very large in this review) and statistical heterogeneity (of which there is little indication of in this review). In case of large statistical heterogeneity, we would have had to split up the review perhaps into different modes of administration or concluded that no overall conclusion for nutrition support could be made. However, we found no signs of statistical heterogeneity and the pooling of the different nutritional interventions seems to be appropriate. The overall agreement between our review and the other Cochrane Reviews assessing nutrition support for hospitalised adults makes it even more plausible that our conclusions on nutrition support appy to participants regardless of how they were included in our review (see Agreements and disagreements with other studies or reviews for further details).
Applicability of results for specific subgroups
Mode of delivery
We found no subgroup differences between the different types of nutrition support . Our exploratory Trial Sequential Analyses indicated that enteral nutrition may be beneficial in the settings tested, whereas parenteral nutrition and oral nutrition do not seem to offer any benefit in the settings tested. Performing the same subgroups analyses as for the overall analyses, but only looking at parenteral nutrition support or oral nutrition support, we found no benefit in any subgroup. There was insufficient statistical power for general nutrition support and fortified foods. We therefore primarily recommend future research assessing the effects of enteral nutrition, because this intervention seems to be the only potentially promising nutritional intervention.
Other subgroup analyses (including specific patient populations)
The main objective of this review was to assess the effects of nutrition support in adults at nutritional risk. As described in the Background section, malnutrition can be divided into starvation‐related malnutrition and disease‐related malnutrition. If a common pathway exists from disease to malnutrition to poorer clinical outcome, we expected that our approach would show that nutrition support benefits the participants across medical specialties as they would share a common feature, i.e. malnutrition. This was the rationale for looking at nutrition support broadly instead of assessing participants according to medical specialty as has previously been done in most reviews. As noted above, this has introduced large clinical heterogeneity. However, across most of our subgroups, there was no difference in the effect of nutrition support and a noticeable absence of heterogeneity. Guideline developers may wish to look at the overall analyses as well as the subgroup analyses.
In future updates, we plan to include secondary publications looking at the different participant populations as well as exploring possible areas of benefit of the different types of nutrition support.
It is very important when exploring possible areas of benefit, as we intend in subsequent updates, that we pay attention to the risk of multiplicity as well as assessing the limitations of the amount of information. Subgroup analyses should be confirmed in new trials at low risk of bias. Our results indicate that in most cases there will be too little information to conclude whether nutrition support is beneficial or harmful for specific subgroups of participant, using a specific nutrition support intervention.
Limation of the external validity of our review
We only included hospitalised adults and it is possible that nutrition support administered in an outpatient setting may be beneficial.
We did not include interventions assessing immuno‐nutrition, elemental diets, glutamine only as the primary intervention, micronutrients only, or similar non‐standard nutrition support interventions. Neither does our review provide any evidence on the effect of nutrition support in children.
The co‐interventions/standard care also varied across the included trials, due to the diverse participant population, the difference in practices, as well as the different time periods in which the included trials were conducted. Even though our results did not indicate any significant statistical heterogeneity, the clinical heterogeneity is a limitation of our systematic review, because the subsequent generalisation of the review results might be limited.
It is also important to note that our results only apply to participants who were randomised to nutrition support versus ‘no nutrition support’, i.e. it was judged to be ethically acceptable that the control participants could receive ‘no nutrition support’. Hence, our results do not apply to hospitalised adults who were not able to eat, were unconscious, or unable to absorb nutrients, e.g. due to short bowl syndrome. The benefits and harms of the different forms of nutritional support in such participant groups need further specific scrutiny in systematic reviews.
In our review, we have not specifically assessed the effects on non‐serious adverse events/non‐serious complications. We only assessed adverse events if they were 'serious'. The reason for this was that we expected to identify a large number of trials from all medical specialties, with different types of participants, different types of interventions, etc. We expected that assessing the effects of nutrition support on non‐serious adverse events across these different types of trials would have limited validity, as the events would be very heterogenous as well as differing in their clinical significance. Additionally, we did not assess the risk of serious adverse events and non‐serious adverse events in quasi‐randomised and observational studies. Specific systematic reviews of these types of studies are needed. Moreover, we did not assess cluster‐randomised clinical trials.
We identified three cluster‐randomised trials. Two reported no effect of nutrition support on mortality (Bourdel‐Marchasson 2000; Martin 2004) and one trial had not reported data at the time of writing (Britton 2012). Bourdel‐Marchasson 2000 also found a reduction in pressure sores. Martin 2004 did not report adverse events.
Quality of the evidence
We downgraded the quality of evidence to low due to very serious risk of bias for all‐cause mortality and serious adverse events outcomes. Quality of life was downgraded to very low quality of evidence due to a very serious risk of bias, and a serious inconsistency of the evidence. Weight was downgraded to very low quality of evidence because of very serious risk of bias and inconsistency (see Table 1).
We found no trials or outcome results with a low risk of bias (see Risk of bias in included studies). There is a high risk of our results showing an overestimation of benefit and underestimation of harm of nutrition support (Hrobjartsson 2012; Hrobjartsson 2013; Hrobjartsson 2014a; Hrobjartsson 2014b; Savović 2012a; Schulz 1995; Sutton 2000; Wood 2008).
Visual inspection of a number of funnel plots suggested asymmetry, including the few outcome results that indicated benefit for nutrition support. We then used the trim‐and‐fill method in an attempt to assess the impact of publication bias on our results. The trim‐and‐fill method showed us that the possible publication bias did not appear to have a strong influence on our results.
Despite the variation in the participant populations recruited to the studies, we observed very little statistical heterogeneity in our primary results.
Trial Sequential Analyses of both all‐cause mortality and serious adverse events showed that we had enough information to confirm or reject our anticipated intervention effects. Given we have met the required information size forrisk ratio reductions (RRR) of 10% or more, and we a priori considered a RRR of 20% clinically significant, we do not regard the confidence intervals as wide enough to downgrade further to very low quality due to serious imprecision. The Trial Sequential Analyses of the third primary outcome, quality of life, showed we did not have enough information to confirm or reject our anticipated intervention effect. The Trial Sequential Analysis for enteral nutrition showed that we had enough information to confirm or reject our anticipated intervention effect. Despite this, much consideration must still be given when interpreting this result, see 'Potential biases in the review process'.
The average non‐significant reduction at end of intervention in absolute all‐cause mortality following any type of nutrition support when compared with control was around 0.5%, from 8.3% to 7.8%. For serious adverse events, the non‐significant reduction in risk was 0.7%, from 9.9% to 9.2%. The point estimate from maximum follow‐up was slightly larger (1% for all‐cause mortality and 1.5% for serious adverse events). However, the Trial Sequential Analysis showed that we had enough information to rule out 11% or more relative risk reductions for both outcomes at end of intervention and at maximum follow‐up, but not enough information to confirm or reject risk ratios of 10% or below. Whether RRRs below 10% are clinically relevant is debatable. Consideration should perhaps be given to critically‐ill populations with very high underlying risk of death or serious adverse events.
Potential biases in the review process
Strengths
We included trials regardless of language of publication and whether they reported data on the outcomes we needed. We contacted relevant authors for additional information. We included more participants than previous systematic reviews (Koretz 2001; Perel 2006; Koretz 2007; Milne 2009; Burden 2012; Koretz 2012; Koretz 2014; Avenell 2016), giving us increased power and precision to detect any significant differences between the intervention and control groups.
We followed our peer‐reviewed Cochrane protocol which was published before the literature search began (Feinberg 2015). We conducted the review using the methods recommended by Cochrane and findings of additional methodological studies (Higgins 2011). We also performed Trial Sequential Analyses and used an eight‐step procedure to assess whether the thresholds for statistical and clinical significance were crossed (Jakobsen 2014). This adds further robustness to our results and conclusions. We also tested the robustness of our results with sensitivity analyses ('best‐worst', 'worst‐best', no‐event trials and for missing SDs).
Our meta‐analyses had little statistical heterogeneity, strengthening the validity of our results.
Limitations
Our systematic review has several limitations. Our findings, interpretations, and conclusions are affected by the quality and quantity of the trials we included. We included both different participant populations and different forms of nutrition support, which introduced some possible interpretative limitations to our review (see 'Overall completeness and applicability of evidence' for a discussion).
A potential methodological limitation is our definition of a serious adverse event. In line with the protocol (Feinberg 2015), we included the trial result as a serious adverse event if the event or complications was described as any untoward medical occurrence that resulted in death, was life‐threatening, required hospitalisation or prolongation of existing hospitalisation, or resulted in persistent or significant disability or incapacity. Using this definition, we created a list early in the review process of the events we considered serious and would therefore include, even if the trialist did not classify the adverse events as a 'serious adverse event'. We also included the event as a serious adverse event if the trialists used the term 'serious' or 'major' when reporting the adverse event or complication. If there was doubt if the event should be included then we contacted the trial authors in order to clarify whether we should include the event in our analyses. Most of the trials were not adequately blinded and the assessment of the adverse events in these trials might have been influenced by knowledge of treatment allocation. It is therefore likely that our results overestimate the beneficial effect and underestimate the possible harmful effects of nutrition support. Furthermore, It is always problematic to use composite outcomes, because the different elements of the composite outcome will often have different degrees of severity. It is therefore possible that even with a neutral result there is in reality a significant difference in the severity of symptoms between the compared groups. Nevertheless, using composite outcomes increases power and is therefore often a valid technique, but the limitations must be considered when interpreting results on, for example, serious adverse events.
Another possible limitation of our review is that we do not require a minimum amount of nutrition support. We did this in order to avoid arbitrary cut‐offs. We have instead analysed this in subgroup analyses (Analysis 1.5; Analysis 2.5; Analysis 3.5; Analysis 4.5). The analyses found no difference between the 'adequate' and 'inadequate' nutrition‐support trials. The subgroups were based on our a priori definitions including our predefined cut‐offs. Our cut‐offs may be questionable. It may also be that indirect calorimetry to assess individual nutritional requirement is necessary. We should perhaps have included a definition of 'adequate protein' in our review.
We also made some changes from the protocol stage and added some post hoc analyses, which is also a limitation of our review, see 'Differences between protocol and review' for details.
Our review does not specifically address international guidelines. According to recent international guidelines (Jensen 2010), being nutritionally at‐risk includes both the aspect of nutritional status and the aspect of an elevated rate of catabolism caused by inflammation in participants, who are unlikely to eat adequately and who are treated with an adequate intake. The post hoc Analysis 16.4 results in a statistically significant effect of nutrition support on serious adverse events at maximum follow‐up (RR 0.76, 95% CI 0.61 to 0.95, P = 0.02, I2 = 0%, 2372 participants, 21 trials, low quality of evidence) when removing Casaer 2011. The reason for omitting Casaer 2011 is the controversy surrounding the validity of Casaer 2011 (Bistrian 2011; Felbinger 2011; Marik 2011; O'Leary 2011; McClave 2012). It must be noted that Analysis 16.4 is not significant with Casaer 2011 included. Given the large consensus among clinical societies around the approach of identifying nutritionally at‐risk participants based on specific criteria and providing adequate nutrition to these people despite the lack of documented effect, future trials should be conducted to test this approach.
We also included a very large number of subgroup analyses and numerous outcomes. Although we have adjusted our threshold for significance for our three primary outcomes, there is still a substantial risk of a type 1 error (i.e. falsely rejecting the null hypothesis), given that we have assessed three primary outcomes, seven secondary outcomes, two time points of interest, and have 10 subgroup analyses. This leads to problems with multiplicity (Jakobsen 2014; Jakobsen 2016). It is plausible that the few significant effects of nutrition we have found may be due to 'random error'. We therefore consider the subgroup analyses results as exploratory and hypothesis‐generating. We accept a P value of 0.05 or below as statistically significant in these analyses, i.e. we do not adjust our P values for subgroup analyses. It is obvious to most that when you collect a large amount of data as we have done here, you also want to explore any possible interactions, and we therefore caution the reader to interpret our findings with respect to the substantial risk of a type 1 error.
Our 'worst‐best' and 'best‐worst' analyses showed that there is a high risk of incomplete outcome data bias (Analysis 1.12; Analysis 1.13; Analysis 2.12; Analysis 2.13; Analysis 3.13; Analysis 3.12; Analysis 4.12; Analysis 4.13). Incomplete outcome data bias might alone have caused the few significant results of nutrition. Most of the trials did not report exactly how all‐cause mortality or serious adverse events were assessed. It was often only reported that a certain number of participants died or experienced a serious adverse event, without reporting how many participants were analysed (and hence, how many had incomplete outcome data). One hundred and ninety‐four of 244 trials were assessed as being at unclear or high risk of bias on the incomplete outcome data bias domain, illustrating the high risk of missing data potentially biasing our review results. If insufficient data were reported by the trialists then we tried to contact the authors, but they seldom replied, so we often had insufficient information to assess whether the reported number of deaths or serious adverse events were out of the intention‐to‐treat population or out of an unclearly‐defined observed‐cases population. This might bias our sensitivity meta‐analyses because we used only the data on the reported population if no other information was available. Incomplete outcome data bias might potentially have an even greater impact than our 'best‐worst'/'worst‐best' case scenarios show, i.e. the ’true’ difference between the observed cases and the intention‐to‐treat population might be larger than our data suggest.
We were unable to obtain 34 publications: (Wenzel 1968; Serrou 1982a; Cardona 1986; Liu 1989; Rovera 1989; Huang 1990; Eckart 1992; Mori 1992; Dai 1993; Kolacinski 1993; Li 1993; Driver 1994; Cao 1995; Lv 1995; Wu 1995; Yu 1995; Hu 1996; Liu 1996; Liu 1996a; Volkert 1996; Wu 1996a; Xue 1996; Yoichi 1996; Yu 1996; Lu 1997; Zeng 1997; Zhen 1997; Chai 1998; Guo 1998; Huo 1998; Jin 2000; Anonymous 2003; Nutrition 2003; Li 2013). Most of these seem to have been conducted in China.
We also only assessed academic bias as an 'other potential bias', as well as any obvious bias we encountered, i.e. not in a systematic way. As such, we have not taken systematic account of other potential sources of bias.
We did not search the database CINAHL, which is a limitation of our systematic review.
Agreements and disagreements with other studies or reviews
Below we have compared our results with the results of other reviews on nutrition.
Reviews that lacked estimations of required information sample sizes calculations but reached similar conclusions as our review:
Perel 2006 found no statistically significant benefit on mortality of early versus delayed nutrition support for head‐injured participants.
Milne 2009 found no effect on mortality of oral nutrition support in hospitalised elderly participants at nutritional risk (fixed‐effect meta‐analysis RR 0.91, 95% CI 0.80 to 1.04). The authors did, however, conclude that there was a small increase in weight for elderly participants (both hospitalised and community dwellers) (fixed‐effect meta‐analysis MD 2.15 kg, 95% CI 1.80 to 2.49, P < 0.001).
Avenell 2016 found no statistically significant effect on mortality or 'unfavourable outcomes' of nutrition support as after‐care for hip fracture participants.
Koretz 2012 found no effect on mortality of enteral, parenteral, and oral nutrition supplements for liver patients, both medical and surgical. One trial at low risk of bias showed increased mortality.
Koretz 2014 found a beneficial effect of enteral nutrition on mortality in critically‐ill adults (RR 0.61, 95% CI 0.41 to 0.89). However, the benefit of nutrition support on mortality was only present in trials with high risk of bias and the review concluded that there was currently not enough evidence to conclude that enteral nutrition for critically‐ill adults is beneficial, and that randomised clinical trials at low risk of bias are needed.
Bally 2016 found no effect on mortality in hospitalised medical participants. The systematic review included 22 trials covering 3726 participants. As a secondary outcome, the authors found a statistically significant increase in weight (MD 0.72 kg, 95% CI 0.23 to 1.21). The findings are in agreement with our review, with nutrition only showing a small benefit on weight but no effect on mortality.
Reviews that lacked estimations of required information sizes and found benefit of nutrition support:
Burden 2012 (preoperative gastro‐intestinal surgery) did not assess mortality. They did, however, show a reduction in major complications when using preoperative parenteral nutrition but no effect of oral nutrition supplements nor of enteral nutrition. Our overall conclusions differ from Burden 2012 but our subgroup of adults undergoing gastro‐intestinal surgery showed that this group may have more benefit of nutrition support than other participant groups.
Reviews that lacked estimations of required information sizes and concluded more trials were needed:
Murray 2017 found that there was not enough information to conclude whether providing standard parenteral nutrition over intravenous hydration was beneficial for bone marrow transplant patients. The review included three trials.
Wasiak 2006 found no statistically significant effect on mortality of early versus delayed nutrition support in burn patients but only included one trial (Peck 2004), and concluded that more trials were needed.
Authors' conclusions
Implications for practice.
In populations identified as being at nutritional risk by any of our predefined inclusion criteria, we found that risk ratio reductions of approximately 10% or more from nutrition support can be rejected in both the short term (at end of intervention) and long term (maximum follow‐up) for death and serious adverse events. We do not regard the confidence interval for either effect as wide enough to warrant downgrading for imprecision, even though neither result showed a statistically significant increase or reduction of mortality or serious adverse events.
Our overall meta‐analysis result might guide hospital‐based decision‐makers who are considering whether or not to implement nutrition support interventions across medical specialties for nutritionally at‐risk patients compared with standard care (typically a standard hospital diet providing 1800 to 2000 kcal). Prior to making a decision on whether or not to administer nutrition support,a valid assessment should be made of a given patient's capacity to receive standard nutritional support. If this is not obvious, i.e. the patient eats without any problem, such an assessment might be done by specially‐trained personnel. This practice should also be tested in a randomised clinical trial. Our results apply only to patients whom it was ethical to randomise.
Oral nutrition support and parenteral nutrition support did not reduce or increase mortality or serious adverse events across any subgroup of participants. Our results indicate that enteral nutrition may reduce the risk of serious adverse events at maximum follow‐up. However, there is a high risk that this significant result is attributable to bias. There was not enough information to assess general nutrition support, fortified nutrition support, or mixed nutrition support.
Our meta‐analyses do not rule out that a specific nutrition support intervention for a specific patient population has larger beneficial or harmful effects than the average effects we have estimated.
One subgroup (major surgery and stroke participants) demonstrated a significant subgroup difference, but this did not break the threshold for significance in post hoc Trial Sequential Analyses. No other test for subgroup differences found any other differences, including different medical specialties.
Implications for research.
We do not recommend further research on nutrition support as an overall intervention in hospitalised adults at nutritional risk according to our criteria (see 'Types of participants'). Our subgroup analyses and exploratory Trial Sequential Analyses suggest that future trials may assess the benefits and harms of enteral nutrition across different participant populations. Such trials ought to be designed and reported according to the SPIRIT (www.spirit‐statement.org/) and CONSORT (www.consort‐statement.org/) guidelines. Furthermore, such trials should be conducted with low risk of systematic error and low risk of random errors, and should assess quality of life. They should also be powered to detect a risk ratio reduction of under 10% on all‐cause mortality and serious adverse events.
Future trials may assess the effects of nutrition support in 'well‐defined' at‐risk adults, especially given that this is the recommendation of clinical societies today. Future trials may wish to assess nutrition support in specific subpopulations where there are currently very few trials.
There is a need for systematic reviews assessing serious adverse events in quasi‐randomised and observational studies. There is also a need for systematic reviews assessing benefits and harms of specialised nutrition support such as immuno‐nutrition. Moreover, we need individual patient data systematic reviews as well as network meta‐analyses on nutrition support (Cipriani 2013; Tudur Smith 2016).
Acknowledgements
We thank Ronald Koretz for his thorough reading of our review and spotting several oversights on our part. We would also like to thank the copy editor Kate Cahill for her very thorough read of this very large review.
Cochrane Review Group funding acknowledgement: The Danish State is the largest single funder of The Cochrane Hepato‐Biliary Group through its investment in The Copenhagen Trial Unit, Centre for Clinical Intervention Research, Rigshospitalet, Copenhagen University Hospital, Denmark. Disclaimer: The views and opinions expressed in this review are those of the authors and do not necessarily reflect those of the Danish State or The Copenhagen Trial Unit.
Peer reviewers: Tina Munk, Denmark; Iván D. Flórez, Colombia. Contact editors: Ronald L Koretz, USA; Goran Bjelakovic, Serbia; Agostino Colli, Italy.
Appendices
Appendix 1. Search strategies
| Database | Time span | Search strategy |
| Cochrane Central Register of Controlled Trials (CENTRAL) in the Cochrane Library | 2016, issue 1 | #1 MeSH descriptor: [Feeding Methods] explode all trees #2 MeSH descriptor: [Nutrition Therapy] explode all trees #3 MeSH descriptor: [Enterostomy] explode all trees #4 MeSH descriptor: [Fat Emulsions, Intravenous] explode all trees #5 MeSH descriptor: [Food, Formulated] explode all trees #6 MeSH descriptor: [Gastrostomy] explode all trees #7 MeSH descriptor: [Nutrition Disorders] explode all trees #8 MeSH descriptor: [Protein Hydrolysates] explode all trees #9 alimentation or branched chain amino acids or BCAA or Dietary disorder* or Enteral nutrition or Enterostom* or Fat emulsion or formulated food* or Gastrostom* or Hyperalimentation* or Hypocaloric alimentation* or Hypocaloric nutrition or Intragastric feed* or Intragastric nutrition or Nutrition or Nutrition diseases or Nutrition disorders or Nutrition supplement* or Parenteral nutrition or Percutaneous endoscopic gastrostom* or Peripheral parenteral nutrition or Permissive underfeeding or Post‐pyloric feeding or Post‐pyloric nutrition or Protein hydrolysate or Supplemental feed* or Total parenteral nutrition #10 #1 or #2 or #3 or #4 or #5 or #6 or #7 or #8 or #9 |
| MEDLINE (Ovid SP) | 1946 to February 2016. | 1. exp Feeding Methods/ 2. exp Nutrition Therapy/ 3. exp Enterostomy/ 4. exp Fat Emulsions, Intravenous/ 5. exp Food, Formulated/ 6. exp Gastrostomy/ 7. exp Nutrition Disorders/ 8. exp Protein Hydrolysates/ 9. (alimentation or branched chain amino acids or BCAA or Dietary disorder$ or Enteral nutrition or Enterostom$ or Fat emulsion or formulated food$ or Gastrostom$ or Hyperalimentation$ or Hypocaloric alimentation$ or Hypocaloric nutrition or Intragastric feed$ or Intragastric nutrition or Nutrition or Nutrition diseases or Nutrition disorders or Nutrition supplement$ or Parenteral nutrition or Percutaneous endoscopic gastrostom$ or Peripheral parenteral nutrition or Permissive underfeeding or Post‐pyloric feeding or Post‐pyloric nutrition or Protein hydrolysate or Supplemental feed$ or Total parenteral nutrition).mp. [mp=title, abstract, original title, name of substance word, subject heading word, protocol supplementary concept, rare disease supplementary concept, unique identifier] 10. 1 or 2 or 3 or 4 or 5 or 6 or 7 or 8 or 9 11. (random$ or blind$ or placebo$).mp. [mp=title, abstract, original title, name of substance word, subject heading word, protocol supplementary concept, rare disease supplementary concept, unique identifier] 12. 10 and 11 13. (animals not (humans and animals)).mp. [mp=title, abstract, original title, name of substance word, subject heading word, protocol supplementary concept, rare disease supplementary concept, unique identifier] 14. 12 not 13 |
| Embase (Ovid SP) | 1974 to February 2016 | 1. exp Diet Therapy/ 2. exp Artificial Feeding/ 3. exp Enterostomy/ 4. exp Lipid Emulsion/ 5. exp Gastrostomy/ 6. exp Nutrition/ 7. exp Nutritional Disorder/ 8. exp Diet Supplementation/ 9. exp Percutaneous Endoscopic Gastrostomy/ 10. exp Protein Hydrolysate/ 11. (alimentation or branched chain amino acids or BCAA or Dietary disorder$ or Enteral nutrition or Enterostom$ or Fat emulsion or formulated food$ or Gastrostom$ or Hyperalimentation$ or Hypocaloric alimentation$ or Hypocaloric nutrition or Intragastric feed$ or Intragastric nutrition or Nutrition or Nutrition diseases or Nutrition disorders or Nutrition supplement$ or Parenteral nutrition or Percutaneous endoscopic gastrostom$ or Peripheral parenteral nutrition or Permissive underfeeding or Post‐pyloric feeding or Post‐pyloric nutrition or Protein hydrolysate or Supplemental feed$ or Total parenteral nutrition).mp. [mp=title, abstract, subject headings, heading word, drug trade name, original title, device manufacturer, drug manufacturer, device trade name, keyword] 12. 1 or 2 or 3 or 4 or 5 or 6 or 7 or 8 or 9 or 10 or 11 13. limit 12 to human 14. (random$ or blind$ or placebo$).mp. [mp=title, abstract, subject headings, heading word, drug trade name, original title, device manufacturer, drug manufacturer, device trade name, keyword] 15. 13 and 14 16. limit 15 to exclude medline journals |
| Science Citation Index Expanded (Web of Science) | 1900 to February 2016 | #3 #2 AND #1 #2 TS=(random* OR blind* OR placebo* OR meta‐analysis) #1 TS=(alimentation OR 'branched chain amino acids' OR BCAA OR 'Dietary disorder*' OR 'Enteral nutrition' OR Enterostom* OR 'Fat emulsion' or 'formulated food*' OR Gastrostom* OR Hyperalimentation* OR 'Hypocaloric alimentation*' OR 'Hypocaloric nutrition' OR 'Intragastric feed*' OR 'Intragastric nutrition' OR Nutrition OR 'Nutrition diseases' OR 'Nutrition disorders' OR 'Nutrition supplement*' OR 'Parenteral nutrition' OR 'Percutaneous endoscopic gastrostom*' OR 'Peripheral parenteral nutrition' OR 'Permissive underfeeding' OR 'Post‐pyloric feeding' OR 'Post‐pyloric nutrition' OR 'Protein hydrolysate' OR 'Supplemental feed*' OR 'Total parenteral nutrition') |
| BIOSIS (Web of Science) | 2012 to February 2016 | #3 #2 AND #1 Indexes=BIOSIS Previews Timespan=2012‐2016 #2 (TS=(random* OR blind* OR placebo*)) AND TAXA NOTES: (Humans) Indexes=BIOSIS Previews Timespan=2012‐2016 #1 (TS=(alimentation OR 'branched chain amino acids' OR BCAA OR 'Dietary disorder*' OR 'Enteral nutrition' OR Enterostom* OR 'Fat emulsion' or 'formulated food*' OR Gastrostom* OR Hyperalimentation* OR 'Hypocaloric alimentation*' OR 'Hypocaloric nutrition' OR 'Intragastric feed*' OR 'Intragastric nutrition' OR Nutrition OR 'Nutrition diseases' OR 'Nutrition disorders' OR 'Nutrition supplement*' OR 'Parenteral nutrition' OR 'Percutaneous endoscopic gastrostom*' OR 'Peripheral parenteral nutrition' OR 'Permissive underfeeding' OR 'Post‐pyloric feeding' OR 'Post‐pyloric nutrition' OR 'Protein hydrolysate' OR 'Supplemental feed*' OR 'Total parenteral nutrition')) AND TAXA NOTES: (Humans) Indexes=BIOSIS Previews Timespan=2012‐2016 |
| LILACS (Bireme) | 1982 to February 2016 | (alimentation or branched chain amino acids or BCAA or Dietary disorder$ or Enteral nutrition or Enterostom$ or Fat emulsion or formulated food$ or Gastrostom$ or Hyperalimentation$ or Hypocaloric alimentation$ or Hypocaloric nutrition or Intragastric feed$ or Intragastric nutrition or Nutrition or Nutrition diseases or Nutrition disorders or Nutrition supplement$ or Parenteral nutrition or Percutaneous endoscopic gastrostom$ or Peripheral parenteral nutrition or Permissive underfeeding or Post‐pyloric feeding or Post‐pyloric nutrition or Protein hydrolysate or Supplemental feed$ or Total parenteral nutrition) [Words] and (random$ or blind$ or placebo$) [Words] |
Appendix 2. List of nutrition collaborations inquired for additional trials
Council for Responsible Nutrition (CRN) Website: http://www.crnusa.org
Email: nweindruch@crnusa.org
National Association of Food Supplements Industry (ANAISA) Website: http://www.anaisa.mx
Email: gerencia@anaisa.mx
Federation of Israeli Chambers of Commerce (Food Supplement sector)
Email: yonatk@chamber.org.il
Health Product Association of Southern Africa (HPASA)
Website: http://www.hpasa.co.za
Email: hpasa@hpasa.co.za
Council for Responsible Nutrition (CRN) Website: http://www.crnuk.org
Email: crnsecretariat@crnuk.org
Integratori Italia ‐ AIIPA Website: http://www.integratoriitalia.it
Email: integratoriitalia@aiipa.it
Bundesverband der Industrie‐ und Handelsunternehmen für Arzneimittel, Reformwaren , Nahrungsergänzungsmittel und kosmetische Mittel e.V. (BDIH) Website: http://www.bdih.de
Email: bdih@bdih.de
Nutraceutisk Industri, Dansk Industri (DI) Website: http://www.di.dk
Email: mist@di.dk
Health Foods and Dietary Supplements Association (HADSA) Website: http://www.hadsa.com/
Association of Indonesian Health Supplement Company (APSKI)
Email: apskiasosiasi@yahoo.co.id
Japan Health & Nutrition Food Association (JHNFA)
Email: shogaikouho@jhnfa.org
Malaysian Dietary Supplement Association (MADSA) Website: http://madsa.org.my
Email: secretariat@madsa.org.my
Natural Products New Zealand Inc Website: http://www.naturalproducts.nz
Email: info@naturalproducts.nz
Food Supplements Europe (FSE)
Website: http://www.foodsupplementseurope.org
Email: secretariat@foodsupplementseurope.org
Appendix 3. List of events considered for the composite outcome "serious adverse events"
Death Anastomotic leak Sepsis Pneumoperitoneum Stroke Hepatic coma Multiorgan failure
Deep vein thrombosis Gastrointesitnal perforation Pulmonary failure Gastrointestinal haemorrhage
Septic arthritis Peritonitis Acute coronary syndrome Pneumothorax Ventilator associated pneumonia
Gastrointestinal fistula Severe bleeding Bronchopleurocutanous fistula
Toxic hepatitis Hepatic encephalopathy Pancreatitis
Data and analyses
Comparison 1. All‐cause mortality ‐ end of intervention.
| Outcome or subgroup title | No. of studies | No. of participants | Statistical method | Effect size |
|---|---|---|---|---|
| 1 All‐cause mortality ‐ overall | 127 | 21758 | Risk Ratio (M‐H, Random, 95% CI) | 0.94 [0.86, 1.03] |
| 2 All‐cause mortality ‐ bias | 127 | 21758 | Risk Ratio (M‐H, Random, 95% CI) | 0.94 [0.86, 1.03] |
| 2.1 High risk of bias | 127 | 21758 | Risk Ratio (M‐H, Random, 95% CI) | 0.94 [0.86, 1.03] |
| 2.2 Low risk of bias | 0 | 0 | Risk Ratio (M‐H, Random, 95% CI) | 0.0 [0.0, 0.0] |
| 3 All‐cause mortality ‐ mode of delivery | 127 | 21758 | Risk Ratio (M‐H, Random, 95% CI) | 0.94 [0.86, 1.03] |
| 3.1 General nutrition support | 6 | 1420 | Risk Ratio (M‐H, Random, 95% CI) | 1.18 [0.74, 1.87] |
| 3.2 Fortified foods | 2 | 290 | Risk Ratio (M‐H, Random, 95% CI) | 1.24 [0.61, 2.54] |
| 3.3 Oral nutrition | 33 | 8529 | Risk Ratio (M‐H, Random, 95% CI) | 0.94 [0.79, 1.11] |
| 3.4 Enteral nutrition | 36 | 3722 | Risk Ratio (M‐H, Random, 95% CI) | 0.88 [0.75, 1.03] |
| 3.5 Parenteral nutrition | 43 | 7313 | Risk Ratio (M‐H, Random, 95% CI) | 0.98 [0.83, 1.16] |
| 3.6 Mixed | 7 | 484 | Risk Ratio (M‐H, Random, 95% CI) | 0.67 [0.29, 1.55] |
| 4 All‐cause mortality ‐ medical specialty | 127 | 21758 | Risk Ratio (M‐H, Random, 95% CI) | 0.94 [0.86, 1.03] |
| 4.1 Cardiology | 0 | 0 | Risk Ratio (M‐H, Random, 95% CI) | 0.0 [0.0, 0.0] |
| 4.2 Medical gastro‐enterology and hepatology | 13 | 627 | Risk Ratio (M‐H, Random, 95% CI) | 0.90 [0.58, 1.38] |
| 4.3 Geriatrics | 13 | 2554 | Risk Ratio (M‐H, Random, 95% CI) | 0.85 [0.66, 1.08] |
| 4.4 Pulmonary disease | 3 | 118 | Risk Ratio (M‐H, Random, 95% CI) | 0.44 [0.15, 1.28] |
| 4.5 Endocrinology | 0 | 0 | Risk Ratio (M‐H, Random, 95% CI) | 0.0 [0.0, 0.0] |
| 4.6 Infectious diseases | 1 | 56 | Risk Ratio (M‐H, Random, 95% CI) | 1.61 [0.66, 3.92] |
| 4.7 Rheumatology | 0 | 0 | Risk Ratio (M‐H, Random, 95% CI) | 0.0 [0.0, 0.0] |
| 4.8 Haematology | 0 | 0 | Risk Ratio (M‐H, Random, 95% CI) | 0.0 [0.0, 0.0] |
| 4.9 Nephrology | 0 | 0 | Risk Ratio (M‐H, Random, 95% CI) | 0.0 [0.0, 0.0] |
| 4.10 Gastro‐enterologic surgery | 46 | 3943 | Risk Ratio (M‐H, Random, 95% CI) | 0.82 [0.62, 1.09] |
| 4.11 Trauma surgery | 4 | 184 | Risk Ratio (M‐H, Random, 95% CI) | 0.93 [0.55, 1.57] |
| 4.12 Orthopaedics | 12 | 1210 | Risk Ratio (M‐H, Random, 95% CI) | 1.39 [0.87, 2.22] |
| 4.13 Plastic, reconstructive and aesthetic surgery | 0 | 0 | Risk Ratio (M‐H, Random, 95% CI) | 0.0 [0.0, 0.0] |
| 4.14 Vascular surgery | 2 | 28 | Risk Ratio (M‐H, Random, 95% CI) | 0.0 [0.0, 0.0] |
| 4.15 Transplant surgery | 3 | 84 | Risk Ratio (M‐H, Random, 95% CI) | 0.58 [0.23, 1.50] |
| 4.16 Urology | 0 | 0 | Risk Ratio (M‐H, Random, 95% CI) | 0.0 [0.0, 0.0] |
| 4.17 Thoracic surgery | 3 | 592 | Risk Ratio (M‐H, Random, 95% CI) | 0.71 [0.16, 3.22] |
| 4.18 Neurological surgery | 0 | 0 | Risk Ratio (M‐H, Random, 95% CI) | 0.0 [0.0, 0.0] |
| 4.19 Oro‐maxillo‐facial surgery | 1 | 32 | Risk Ratio (M‐H, Random, 95% CI) | 3.38 [0.15, 77.12] |
| 4.20 Anaesthesiology | 0 | 0 | Risk Ratio (M‐H, Random, 95% CI) | 0.0 [0.0, 0.0] |
| 4.21 Emergency medicine | 7 | 5198 | Risk Ratio (M‐H, Random, 95% CI) | 0.99 [0.80, 1.22] |
| 4.22 Psychiatry | 0 | 0 | Risk Ratio (M‐H, Random, 95% CI) | 0.0 [0.0, 0.0] |
| 4.23 Neurology | 7 | 5168 | Risk Ratio (M‐H, Random, 95% CI) | 0.81 [0.60, 1.11] |
| 4.24 Oncology | 5 | 313 | Risk Ratio (M‐H, Random, 95% CI) | 1.19 [0.44, 3.21] |
| 4.25 Dermatology | 0 | 0 | Risk Ratio (M‐H, Random, 95% CI) | 0.0 [0.0, 0.0] |
| 4.26 Gynaecology | 0 | 0 | Risk Ratio (M‐H, Random, 95% CI) | 0.0 [0.0, 0.0] |
| 4.27 Mixed | 7 | 1651 | Risk Ratio (M‐H, Random, 95% CI) | 1.22 [0.88, 1.70] |
| 5 All‐cause mortality ‐ based on adequacy of the amount of calories | 127 | 21758 | Risk Ratio (M‐H, Random, 95% CI) | 0.94 [0.86, 1.03] |
| 5.1 Clearly adequate in experimental group and clearly inadequate in control group | 25 | 7371 | Risk Ratio (M‐H, Random, 95% CI) | 0.97 [0.81, 1.16] |
| 5.2 Inadequate in the experimental group or adequate in the control group | 26 | 6711 | Risk Ratio (M‐H, Random, 95% CI) | 1.00 [0.83, 1.19] |
| 5.3 Experimental group is overfed | 5 | 267 | Risk Ratio (M‐H, Random, 95% CI) | 0.57 [0.27, 1.17] |
| 5.4 Unclear intake in experimental group or control group | 71 | 7409 | Risk Ratio (M‐H, Random, 95% CI) | 0.91 [0.81, 1.03] |
| 6 All‐cause mortality ‐ different screening tools | 127 | 21758 | Risk Ratio (M‐H, Random, 95% CI) | 0.94 [0.86, 1.03] |
| 6.1 NRS 2002 | 4 | 5064 | Risk Ratio (M‐H, Random, 95% CI) | 1.04 [0.84, 1.29] |
| 6.2 MUST | 0 | 0 | Risk Ratio (M‐H, Random, 95% CI) | 0.0 [0.0, 0.0] |
| 6.3 MNA | 2 | 117 | Risk Ratio (M‐H, Random, 95% CI) | 0.61 [0.12, 3.18] |
| 6.4 SGA | 3 | 1171 | Risk Ratio (M‐H, Random, 95% CI) | 1.41 [0.94, 2.10] |
| 6.5 Other means | 118 | 15406 | Risk Ratio (M‐H, Random, 95% CI) | 0.90 [0.81, 0.99] |
| 7 All‐cause mortality ‐ participants characterised as 'at nutritional risk' due to one of the following conditions | 127 | 21758 | Risk Ratio (M‐H, Random, 95% CI) | 0.94 [0.86, 1.03] |
| 7.1 Major surgery | 60 | 5618 | Risk Ratio (M‐H, Random, 95% CI) | 0.81 [0.65, 1.01] |
| 7.2 Stroke | 3 | 4922 | Risk Ratio (M‐H, Random, 95% CI) | 0.97 [0.83, 1.12] |
| 7.3 ICU participants including trauma | 11 | 5382 | Risk Ratio (M‐H, Random, 95% CI) | 0.98 [0.81, 1.19] |
| 7.4 Frail elderly participants with less severe conditions known to increase protein requirements | 19 | 1937 | Risk Ratio (M‐H, Random, 95% CI) | 0.88 [0.56, 1.40] |
| 7.5 Participants do not fall into one of the categories above | 34 | 3899 | Risk Ratio (M‐H, Random, 95% CI) | 1.01 [0.83, 1.22] |
| 8 All‐cause mortality ‐ participants characterised as 'at nutritional risk' due to one of the following criteria | 127 | 21758 | Risk Ratio (M‐H, Random, 95% CI) | 0.94 [0.86, 1.03] |
| 8.1 BMI less than 20.5 kg/m2 | 2 | 247 | Risk Ratio (M‐H, Random, 95% CI) | 1.19 [0.58, 2.45] |
| 8.2 Weight loss of at least 5% during the last three months | 1 | 32 | Risk Ratio (M‐H, Random, 95% CI) | 0.0 [0.0, 0.0] |
| 8.3 Weight loss of at least 10% during the last six months | 1 | 32 | Risk Ratio (M‐H, Random, 95% CI) | 3.38 [0.15, 77.12] |
| 8.4 Insufficient food intake during the last week (50% of requirements or less) | 0 | 0 | Risk Ratio (M‐H, Random, 95% CI) | 0.0 [0.0, 0.0] |
| 8.5 Participants characterised as 'at nutritional risk' by other means | 123 | 21447 | Risk Ratio (M‐H, Random, 95% CI) | 0.93 [0.86, 1.02] |
| 9 All‐cause mortality ‐ participants characterised as 'at nutritional risk' due to biomarkers or anthropometrics | 127 | 21758 | Risk Ratio (M‐H, Random, 95% CI) | 0.94 [0.86, 1.03] |
| 9.1 Biomarkers | 5 | 657 | Risk Ratio (M‐H, Random, 95% CI) | 0.43 [0.16, 1.19] |
| 9.2 Anthropometric measures | 12 | 1402 | Risk Ratio (M‐H, Random, 95% CI) | 0.80 [0.56, 1.15] |
| 9.3 Characterised by other means | 110 | 19699 | Risk Ratio (M‐H, Random, 95% CI) | 0.95 [0.87, 1.05] |
| 10 All‐cause mortality ‐ randomisation year | 127 | 21758 | Risk Ratio (M‐H, Random, 95% CI) | 0.94 [0.86, 1.03] |
| 10.1 Before 1960 | 0 | 0 | Risk Ratio (M‐H, Random, 95% CI) | 0.0 [0.0, 0.0] |
| 10.2 1960 to 1979 | 5 | 181 | Risk Ratio (M‐H, Random, 95% CI) | 1.11 [0.50, 2.46] |
| 10.3 1980 to 1999 | 79 | 11350 | Risk Ratio (M‐H, Random, 95% CI) | 0.91 [0.81, 1.02] |
| 10.4 After 1999 | 43 | 10227 | Risk Ratio (M‐H, Random, 95% CI) | 0.95 [0.80, 1.12] |
| 11 All‐cause mortality ‐ trials where the intervention lasts fewer than three days compared with trials where the intervention lasts three days or more | 127 | 21758 | Risk Ratio (M‐H, Random, 95% CI) | 0.94 [0.86, 1.03] |
| 11.1 Three days or more | 111 | 20434 | Risk Ratio (M‐H, Random, 95% CI) | 0.92 [0.84, 1.01] |
| 11.2 Fewer than three days | 13 | 722 | Risk Ratio (M‐H, Random, 95% CI) | 0.76 [0.39, 1.45] |
| 11.3 Unknown | 3 | 602 | Risk Ratio (M‐H, Random, 95% CI) | 1.16 [0.33, 4.06] |
| 12 All‐cause mortality ‐ 'best‐worst case' scenario | 127 | 22207 | Risk Ratio (M‐H, Random, 95% CI) | 0.74 [0.65, 0.84] |
| 13 All‐cause mortality ‐ 'worst‐best case' scenario | 127 | 22207 | Risk Ratio (M‐H, Random, 95% CI) | 1.13 [0.97, 1.31] |
| 14 All‐cause mortality co‐interventions | 127 | 21758 | Risk Ratio (M‐H, Fixed, 95% CI) | 0.93 [0.86, 1.02] |
| 14.1 received nutrition support as co‐intervention | 12 | 5361 | Risk Ratio (M‐H, Fixed, 95% CI) | 0.94 [0.78, 1.14] |
| 14.2 did not receive nutrition support as co‐intervention | 108 | 15974 | Risk Ratio (M‐H, Fixed, 95% CI) | 0.93 [0.84, 1.03] |
| 14.3 delayed versus early nutrition support | 7 | 423 | Risk Ratio (M‐H, Fixed, 95% CI) | 0.94 [0.53, 1.66] |
1.2. Analysis.
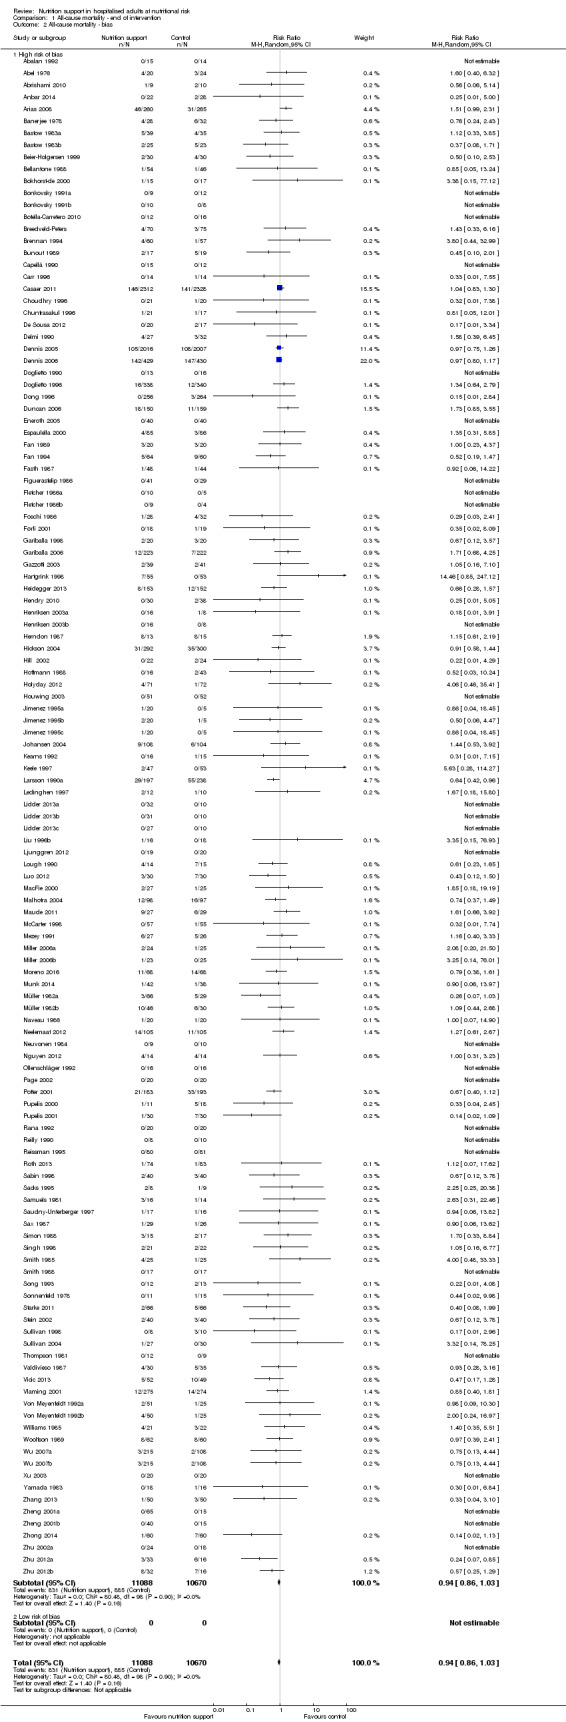
Comparison 1 All‐cause mortality ‐ end of intervention, Outcome 2 All‐cause mortality ‐ bias.
1.14. Analysis.
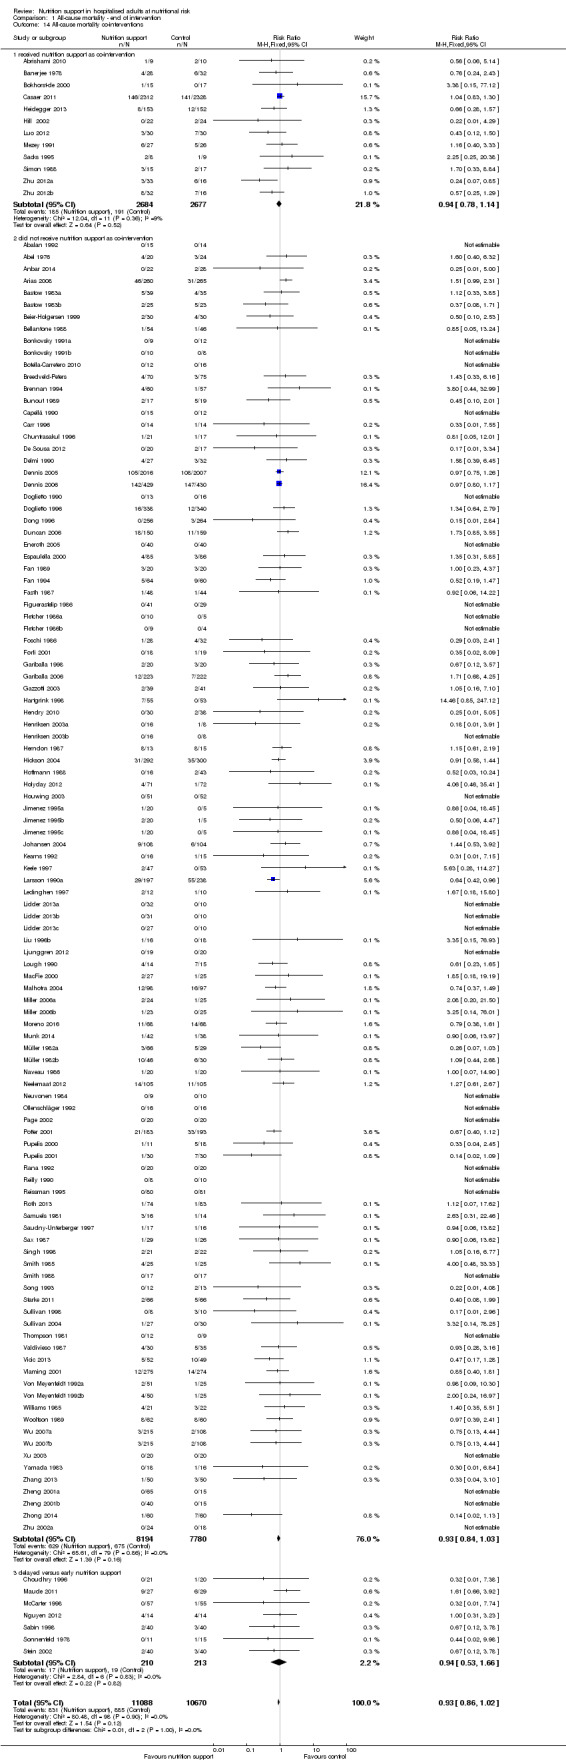
Comparison 1 All‐cause mortality ‐ end of intervention, Outcome 14 All‐cause mortality co‐interventions.
Comparison 2. All‐cause mortality ‐ maximum follow‐up.
| Outcome or subgroup title | No. of studies | No. of participants | Statistical method | Effect size |
|---|---|---|---|---|
| 1 All‐cause mortality ‐ overall | 141 | 23170 | Risk Ratio (M‐H, Random, 95% CI) | 0.93 [0.88, 0.99] |
| 2 All‐cause mortality ‐ bias | 141 | 23170 | Risk Ratio (M‐H, Random, 95% CI) | 0.93 [0.88, 0.99] |
| 2.1 High risk of bias | 141 | 23170 | Risk Ratio (M‐H, Random, 95% CI) | 0.93 [0.88, 0.99] |
| 2.2 Low risk of bias | 0 | 0 | Risk Ratio (M‐H, Random, 95% CI) | 0.0 [0.0, 0.0] |
| 3 All‐cause mortality ‐ mode of delivery | 141 | 23170 | Risk Ratio (M‐H, Random, 95% CI) | 0.93 [0.88, 0.99] |
| 3.1 General nutrition support | 7 | 1566 | Risk Ratio (M‐H, Random, 95% CI) | 0.99 [0.71, 1.36] |
| 3.2 Fortified nutrition | 2 | 290 | Risk Ratio (M‐H, Random, 95% CI) | 1.24 [0.61, 2.54] |
| 3.3 Oral nutrition support | 32 | 8501 | Risk Ratio (M‐H, Random, 95% CI) | 0.94 [0.77, 1.15] |
| 3.4 Enteral nutrition | 42 | 4212 | Risk Ratio (M‐H, Random, 95% CI) | 0.84 [0.75, 0.95] |
| 3.5 Parenteral nutrition | 51 | 8121 | Risk Ratio (M‐H, Random, 95% CI) | 0.99 [0.90, 1.09] |
| 3.6 Mixed | 7 | 480 | Risk Ratio (M‐H, Random, 95% CI) | 0.72 [0.37, 1.37] |
| 4 All‐cause mortality ‐ medical specialty | 141 | 23170 | Risk Ratio (M‐H, Random, 95% CI) | 0.93 [0.88, 0.99] |
| 4.1 Cardiology | 0 | 0 | Risk Ratio (M‐H, Random, 95% CI) | 0.0 [0.0, 0.0] |
| 4.2 Medical gastro‐enterology and hepatology | 13 | 622 | Risk Ratio (M‐H, Random, 95% CI) | 0.96 [0.77, 1.19] |
| 4.3 Geriatrics | 13 | 2547 | Risk Ratio (M‐H, Random, 95% CI) | 0.88 [0.67, 1.17] |
| 4.4 Pulmonary disease | 3 | 118 | Risk Ratio (M‐H, Random, 95% CI) | 0.44 [0.15, 1.28] |
| 4.5 Endocrinology | 0 | 0 | Risk Ratio (M‐H, Random, 95% CI) | 0.0 [0.0, 0.0] |
| 4.6 Infectious diseases | 1 | 56 | Risk Ratio (M‐H, Random, 95% CI) | 1.61 [0.66, 3.92] |
| 4.7 Rheumatology | 0 | 0 | Risk Ratio (M‐H, Random, 95% CI) | 0.0 [0.0, 0.0] |
| 4.8 Haematology | 0 | 0 | Risk Ratio (M‐H, Random, 95% CI) | 0.0 [0.0, 0.0] |
| 4.9 Nephrology | 0 | 0 | Risk Ratio (M‐H, Random, 95% CI) | 0.0 [0.0, 0.0] |
| 4.10 Gastroenterologic surgery | 50 | 4715 | Risk Ratio (M‐H, Random, 95% CI) | 0.89 [0.70, 1.12] |
| 4.11 Trauma surgery | 6 | 249 | Risk Ratio (M‐H, Random, 95% CI) | 0.86 [0.55, 1.34] |
| 4.12 Ortopaedics | 12 | 1196 | Risk Ratio (M‐H, Random, 95% CI) | 1.00 [0.61, 1.62] |
| 4.13 Plastic, reconstructive, and aesthetic surgery | 0 | 0 | Risk Ratio (M‐H, Random, 95% CI) | 0.0 [0.0, 0.0] |
| 4.14 Vascular surgery | 2 | 28 | Risk Ratio (M‐H, Random, 95% CI) | 0.0 [0.0, 0.0] |
| 4.15 Transplant surgery | 3 | 84 | Risk Ratio (M‐H, Random, 95% CI) | 0.54 [0.22, 1.31] |
| 4.16 Urology | 0 | 0 | Risk Ratio (M‐H, Random, 95% CI) | 0.0 [0.0, 0.0] |
| 4.17 Thoracic surgery | 3 | 592 | Risk Ratio (M‐H, Random, 95% CI) | 0.71 [0.16, 3.22] |
| 4.18 Neurological surgery | 0 | 0 | Risk Ratio (M‐H, Random, 95% CI) | 0.0 [0.0, 0.0] |
| 4.19 Oro‐maxillo‐facial surgery | 1 | 32 | Risk Ratio (M‐H, Random, 95% CI) | 3.38 [0.15, 77.12] |
| 4.20 Anaesthesiology | 0 | 0 | Risk Ratio (M‐H, Random, 95% CI) | 0.0 [0.0, 0.0] |
| 4.21 Emergency medicine | 11 | 5421 | Risk Ratio (M‐H, Random, 95% CI) | 0.97 [0.85, 1.12] |
| 4.22 Psychiatry | 0 | 0 | Risk Ratio (M‐H, Random, 95% CI) | 0.0 [0.0, 0.0] |
| 4.23 Neurology | 9 | 5448 | Risk Ratio (M‐H, Random, 95% CI) | 0.77 [0.59, 0.99] |
| 4.24 Oncology | 7 | 411 | Risk Ratio (M‐H, Random, 95% CI) | 1.03 [0.87, 1.21] |
| 4.25 Dermatology | 0 | 0 | Risk Ratio (M‐H, Random, 95% CI) | 0.0 [0.0, 0.0] |
| 4.26 Gynaecology | 0 | 0 | Risk Ratio (M‐H, Random, 95% CI) | 0.0 [0.0, 0.0] |
| 4.27 Mixed | 7 | 1651 | Risk Ratio (M‐H, Random, 95% CI) | 1.28 [0.94, 1.75] |
| 5 All‐cause mortality ‐ based on adequacy of the amount of calories | 141 | 23170 | Risk Ratio (M‐H, Random, 95% CI) | 0.93 [0.88, 0.99] |
| 5.1 Clearly adequate in intervention and clearly inadequate in control | 28 | 7589 | Risk Ratio (M‐H, Random, 95% CI) | 0.98 [0.88, 1.09] |
| 5.2 Inadequate in the experimental or adequate in the control | 27 | 6824 | Risk Ratio (M‐H, Random, 95% CI) | 0.95 [0.82, 1.10] |
| 5.3 Experimental group is overfed | 10 | 974 | Risk Ratio (M‐H, Random, 95% CI) | 0.98 [0.69, 1.41] |
| 5.4 Unclear intake in control or experimental | 76 | 7783 | Risk Ratio (M‐H, Random, 95% CI) | 0.89 [0.81, 0.98] |
| 6 All‐cause mortality ‐ different screening tools | 141 | 23170 | Risk Ratio (M‐H, Random, 95% CI) | 0.93 [0.88, 0.99] |
| 6.1 NRS 2002 | 4 | 5064 | Risk Ratio (M‐H, Random, 95% CI) | 1.02 [0.87, 1.19] |
| 6.2 MUST | 1 | 146 | Risk Ratio (M‐H, Random, 95% CI) | 1.30 [0.60, 2.82] |
| 6.3 MNA | 2 | 117 | Risk Ratio (M‐H, Random, 95% CI) | 0.61 [0.12, 3.18] |
| 6.4 SGA | 3 | 1171 | Risk Ratio (M‐H, Random, 95% CI) | 1.41 [0.94, 2.10] |
| 6.5 Other means | 131 | 16672 | Risk Ratio (M‐H, Random, 95% CI) | 0.91 [0.85, 0.97] |
| 7 All‐cause mortality ‐ participants characterised as 'at nutritional risk' due to one of the following conditions | 141 | 23170 | Risk Ratio (M‐H, Random, 95% CI) | 0.93 [0.88, 0.99] |
| 7.1 Major surgery | 62 | 5712 | Risk Ratio (M‐H, Random, 95% CI) | 0.84 [0.68, 1.04] |
| 7.2 Stroke | 4 | 5056 | Risk Ratio (M‐H, Random, 95% CI) | 0.91 [0.79, 1.05] |
| 7.3 ICU participants including trauma | 15 | 5626 | Risk Ratio (M‐H, Random, 95% CI) | 0.97 [0.85, 1.11] |
| 7.4 Frail elderly participants with less severe conditions known to increase protein requirements | 19 | 2385 | Risk Ratio (M‐H, Random, 95% CI) | 0.85 [0.65, 1.11] |
| 7.5 Participants do not fall into one of the categories above | 41 | 4391 | Risk Ratio (M‐H, Random, 95% CI) | 0.98 [0.84, 1.14] |
| 8 All‐cause mortality ‐ participants characterised as 'at nutritional risk' due to one of the following criteria | 141 | 23170 | Risk Ratio (M‐H, Random, 95% CI) | 0.93 [0.88, 0.99] |
| 8.1 BMI less than 20.5 kg/m2 | 2 | 247 | Risk Ratio (M‐H, Random, 95% CI) | 1.19 [0.58, 2.45] |
| 8.2 Weight loss of at least 5% during the last three months | 1 | 32 | Risk Ratio (M‐H, Random, 95% CI) | 0.0 [0.0, 0.0] |
| 8.3 Weight loss of at least 10% during the last six months | 3 | 124 | Risk Ratio (M‐H, Random, 95% CI) | 1.07 [0.11, 10.33] |
| 8.4 Insufficient food intake during the last week (50% of requirements or less) | 0 | 0 | Risk Ratio (M‐H, Random, 95% CI) | 0.0 [0.0, 0.0] |
| 8.5 Participants characterised as 'at nutritional risk' by other means | 135 | 22767 | Risk Ratio (M‐H, Random, 95% CI) | 0.93 [0.88, 0.99] |
| 9 All‐cause mortality ‐ participants characterised as 'at nutritional risk' due to biomarkers or anthropometrics | 141 | 23170 | Risk Ratio (M‐H, Random, 95% CI) | 0.93 [0.88, 0.99] |
| 9.1 Biomarkers | 7 | 749 | Risk Ratio (M‐H, Random, 95% CI) | 0.40 [0.16, 1.00] |
| 9.2 Anthropometric measures | 12 | 1402 | Risk Ratio (M‐H, Random, 95% CI) | 0.79 [0.55, 1.11] |
| 9.3 Both anthropometrics and biomarkers | 3 | 75 | Risk Ratio (M‐H, Random, 95% CI) | 0.66 [0.14, 3.07] |
| 9.4 Characterised by other means | 119 | 20944 | Risk Ratio (M‐H, Random, 95% CI) | 0.94 [0.89, 1.00] |
| 10 All‐cause mortality ‐ randomisation year | 141 | 23170 | Risk Ratio (M‐H, Random, 95% CI) | 0.93 [0.88, 0.99] |
| 10.1 Before 1960 | 0 | 0 | Risk Ratio (M‐H, Random, 95% CI) | 0.0 [0.0, 0.0] |
| 10.2 1960 to 1979 | 6 | 237 | Risk Ratio (M‐H, Random, 95% CI) | 1.07 [0.52, 2.23] |
| 10.3 1980 to 1999 | 86 | 12055 | Risk Ratio (M‐H, Random, 95% CI) | 0.92 [0.86, 1.00] |
| 10.4 After 1999 | 49 | 10878 | Risk Ratio (M‐H, Random, 95% CI) | 0.93 [0.81, 1.06] |
| 11 All‐cause mortality ‐ trials where the intervention lasts fewer than three days compared with trials where the intervention lasts three days or more | 141 | 23170 | Risk Ratio (M‐H, Random, 95% CI) | 0.93 [0.88, 0.99] |
| 11.1 Three days or more | 127 | 22394 | Risk Ratio (M‐H, Random, 95% CI) | 0.93 [0.88, 0.99] |
| 11.2 Fewer than three days | 12 | 699 | Risk Ratio (M‐H, Random, 95% CI) | 1.05 [0.72, 1.54] |
| 11.3 Unknown | 2 | 77 | Risk Ratio (M‐H, Random, 95% CI) | 0.25 [0.01, 5.00] |
| 12 All‐cause mortality ‐ 'best‐worst case' scenario | 141 | 23700 | Risk Ratio (M‐H, Random, 95% CI) | 0.77 [0.69, 0.85] |
| 13 All‐cause mortality ‐ 'worst‐best case' scenario | 141 | 23700 | Risk Ratio (M‐H, Random, 95% CI) | 1.09 [0.98, 1.23] |
| 14 All‐cause mortality co‐interventions | 141 | 23170 | Risk Ratio (M‐H, Fixed, 95% CI) | 0.92 [0.86, 0.98] |
| 14.1 received nutrition support as co‐intervention | 13 | 5475 | Risk Ratio (M‐H, Fixed, 95% CI) | 0.95 [0.82, 1.08] |
| 14.2 did not receive nutrition support as co‐intervention | 125 | 17462 | Risk Ratio (M‐H, Fixed, 95% CI) | 0.91 [0.85, 0.98] |
| 14.3 delayed versus early nutrition support | 3 | 233 | Risk Ratio (M‐H, Fixed, 95% CI) | 0.99 [0.53, 1.83] |
2.2. Analysis.
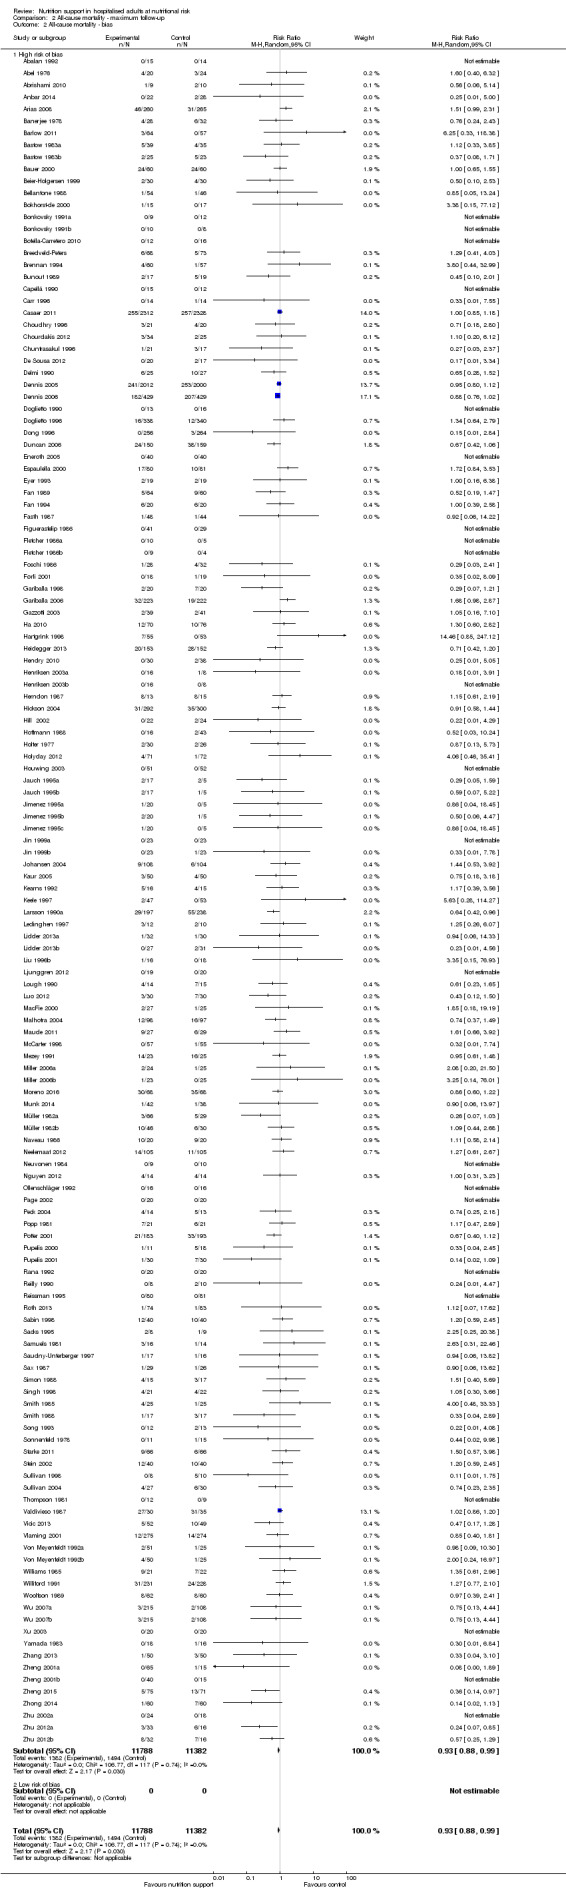
Comparison 2 All‐cause mortality ‐ maximum follow‐up, Outcome 2 All‐cause mortality ‐ bias.
2.14. Analysis.
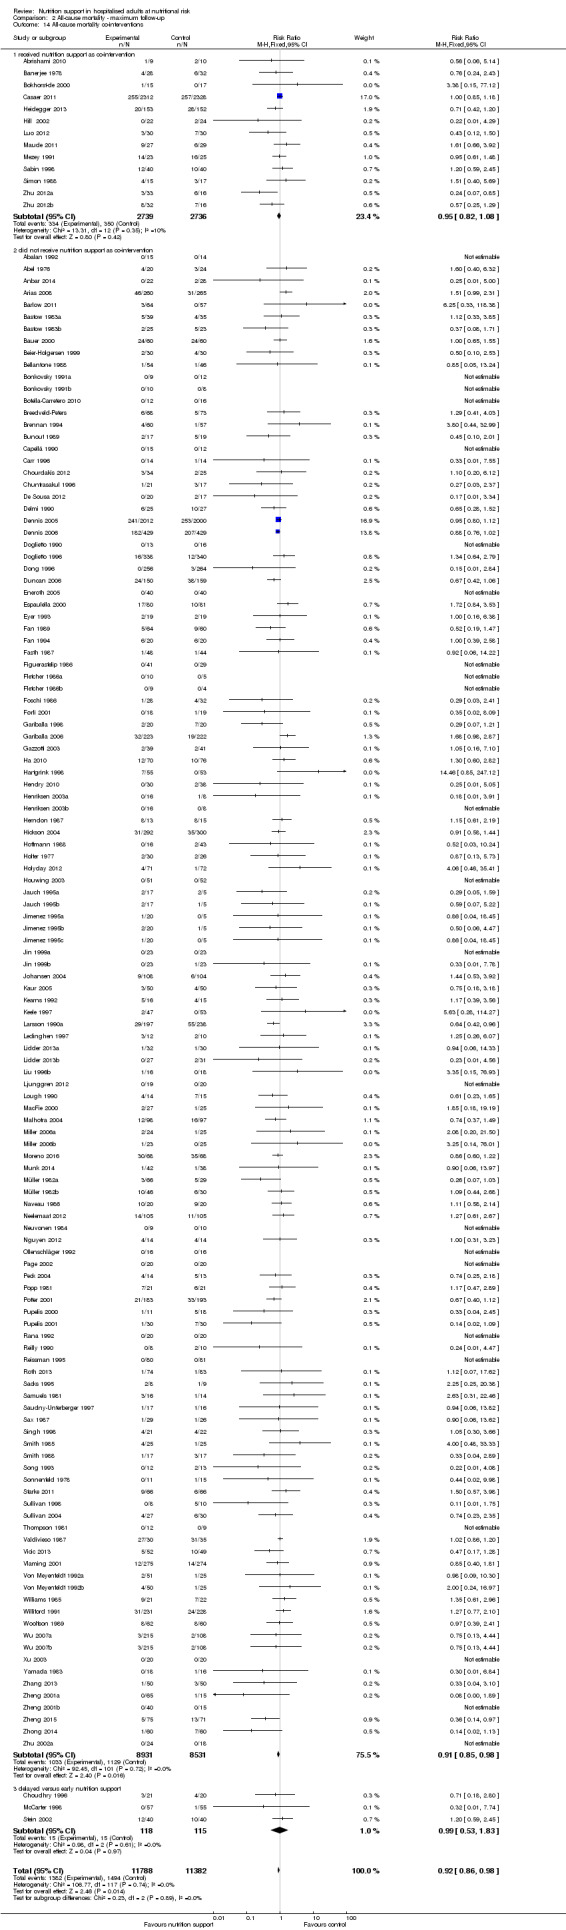
Comparison 2 All‐cause mortality ‐ maximum follow‐up, Outcome 14 All‐cause mortality co‐interventions.
Comparison 3. Serious adverse event end of intervention.
| Outcome or subgroup title | No. of studies | No. of participants | Statistical method | Effect size |
|---|---|---|---|---|
| 1 Serious adverse events ‐ overall | 137 | 22087 | Risk Ratio (M‐H, Random, 95% CI) | 0.93 [0.86, 1.01] |
| 2 Serious adverse events ‐ bias | 137 | 22087 | Risk Ratio (M‐H, Random, 95% CI) | 0.93 [0.86, 1.01] |
| 2.1 High risk of bias | 137 | 22087 | Risk Ratio (M‐H, Random, 95% CI) | 0.93 [0.86, 1.01] |
| 2.2 Low risk of bias | 0 | 0 | Risk Ratio (M‐H, Random, 95% CI) | 0.0 [0.0, 0.0] |
| 3 Serious adverse events ‐ mode of delivery | 137 | 22087 | Risk Ratio (M‐H, Random, 95% CI) | 0.93 [0.86, 1.01] |
| 3.1 General nutrition support | 6 | 1420 | Risk Ratio (M‐H, Random, 95% CI) | 1.19 [0.79, 1.78] |
| 3.2 Fortified | 2 | 290 | Risk Ratio (M‐H, Random, 95% CI) | 1.24 [0.61, 2.54] |
| 3.3 Oral | 33 | 8569 | Risk Ratio (M‐H, Random, 95% CI) | 0.92 [0.79, 1.06] |
| 3.4 Enteral | 43 | 3935 | Risk Ratio (M‐H, Random, 95% CI) | 0.85 [0.74, 0.98] |
| 3.5 Parenteral | 48 | 7519 | Risk Ratio (M‐H, Random, 95% CI) | 0.98 [0.85, 1.14] |
| 3.6 Mixed | 5 | 354 | Risk Ratio (M‐H, Random, 95% CI) | 0.77 [0.33, 1.76] |
| 4 Serious adverse events ‐ by medical specialty | 137 | 22087 | Risk Ratio (M‐H, Random, 95% CI) | 0.93 [0.86, 1.01] |
| 4.1 Cardiology | 0 | 0 | Risk Ratio (M‐H, Random, 95% CI) | 0.0 [0.0, 0.0] |
| 4.2 Medical gastroenterology and hepatology | 10 | 518 | Risk Ratio (M‐H, Random, 95% CI) | 0.90 [0.60, 1.36] |
| 4.3 High risk | 0 | 0 | Risk Ratio (M‐H, Random, 95% CI) | 0.0 [0.0, 0.0] |
| 4.4 Geriatrics | 13 | 2554 | Risk Ratio (M‐H, Random, 95% CI) | 0.85 [0.66, 1.08] |
| 4.5 Pulmonary disease | 3 | 118 | Risk Ratio (M‐H, Random, 95% CI) | 0.44 [0.15, 1.28] |
| 4.6 Endocrinology | 0 | 0 | Risk Ratio (M‐H, Random, 95% CI) | 0.0 [0.0, 0.0] |
| 4.7 Infectious diseases | 1 | 56 | Risk Ratio (M‐H, Random, 95% CI) | 1.23 [0.52, 2.93] |
| 4.8 Rheumatology | 0 | 0 | Risk Ratio (M‐H, Random, 95% CI) | 0.0 [0.0, 0.0] |
| 4.9 Haematology | 0 | 0 | Risk Ratio (M‐H, Random, 95% CI) | 0.0 [0.0, 0.0] |
| 4.10 Nephrology | 0 | 0 | Risk Ratio (M‐H, Random, 95% CI) | 0.0 [0.0, 0.0] |
| 4.11 Gastroenterologic surgery | 57 | 4320 | Risk Ratio (M‐H, Random, 95% CI) | 0.86 [0.72, 1.02] |
| 4.12 Trauma surgery | 5 | 225 | Risk Ratio (M‐H, Random, 95% CI) | 0.93 [0.55, 1.57] |
| 4.13 Ortopaedics | 12 | 1210 | Risk Ratio (M‐H, Random, 95% CI) | 1.39 [0.90, 2.14] |
| 4.14 Plastic, reconstructive, and aesthetic surgery | 0 | 0 | Risk Ratio (M‐H, Random, 95% CI) | 0.0 [0.0, 0.0] |
| 4.15 Vascular surgery | 3 | 48 | Risk Ratio (M‐H, Random, 95% CI) | 0.5 [0.05, 4.67] |
| 4.16 Transplant surgery | 3 | 84 | Risk Ratio (M‐H, Random, 95% CI) | 0.58 [0.23, 1.50] |
| 4.17 Urology | 0 | 0 | Risk Ratio (M‐H, Random, 95% CI) | 0.0 [0.0, 0.0] |
| 4.18 Thoracic surgery | 3 | 592 | Risk Ratio (M‐H, Random, 95% CI) | 0.47 [0.06, 3.62] |
| 4.19 Neurological surgery | 0 | 0 | Risk Ratio (M‐H, Random, 95% CI) | 0.0 [0.0, 0.0] |
| 4.20 Oro‐maxillo‐facial surgery | 1 | 32 | Risk Ratio (M‐H, Random, 95% CI) | 0.88 [0.44, 1.78] |
| 4.21 Anaesthesiology | 0 | 0 | Risk Ratio (M‐H, Random, 95% CI) | 0.0 [0.0, 0.0] |
| 4.22 Emergency medicine | 7 | 5198 | Risk Ratio (M‐H, Random, 95% CI) | 0.99 [0.80, 1.22] |
| 4.23 Psychiatry | 0 | 0 | Risk Ratio (M‐H, Random, 95% CI) | 0.0 [0.0, 0.0] |
| 4.24 Neurology | 7 | 5168 | Risk Ratio (M‐H, Random, 95% CI) | 0.78 [0.58, 1.06] |
| 4.25 Oncology | 5 | 309 | Risk Ratio (M‐H, Random, 95% CI) | 1.12 [0.51, 2.44] |
| 4.26 Dermatology | 0 | 0 | Risk Ratio (M‐H, Random, 95% CI) | 0.0 [0.0, 0.0] |
| 4.27 Gynaecology | 0 | 0 | Risk Ratio (M‐H, Random, 95% CI) | 0.0 [0.0, 0.0] |
| 4.28 Mixed | 7 | 1655 | Risk Ratio (M‐H, Random, 95% CI) | 1.24 [0.92, 1.67] |
| 5 Serious adverse events ‐ based on adequacy of the amount of calories | 137 | 22087 | Risk Ratio (M‐H, Random, 95% CI) | 0.93 [0.86, 1.01] |
| 5.1 Clearly adequate in intervention and clearly inadequate in control | 28 | 7405 | Risk Ratio (M‐H, Random, 95% CI) | 0.95 [0.80, 1.11] |
| 5.2 Inadequate in the experimental or adequate in the control | 28 | 7335 | Risk Ratio (M‐H, Random, 95% CI) | 0.97 [0.84, 1.13] |
| 5.3 Experimental group is overfed | 6 | 224 | Risk Ratio (M‐H, Random, 95% CI) | 0.85 [0.44, 1.67] |
| 5.4 Unclear intake in control or experimental | 75 | 7123 | Risk Ratio (M‐H, Random, 95% CI) | 0.83 [0.70, 0.98] |
| 6 Serious adverse events ‐ different screening tools | 137 | 22087 | Risk Ratio (M‐H, Random, 95% CI) | 0.93 [0.86, 1.01] |
| 6.1 NRS 2002 | 4 | 5064 | Risk Ratio (M‐H, Random, 95% CI) | 1.06 [0.87, 1.31] |
| 6.2 MUST | 0 | 0 | Risk Ratio (M‐H, Random, 95% CI) | 0.0 [0.0, 0.0] |
| 6.3 MNA | 2 | 117 | Risk Ratio (M‐H, Random, 95% CI) | 0.61 [0.12, 3.18] |
| 6.4 SGA | 3 | 1175 | Risk Ratio (M‐H, Random, 95% CI) | 0.82 [0.35, 1.92] |
| 6.5 Other means | 128 | 15731 | Risk Ratio (M‐H, Random, 95% CI) | 0.90 [0.82, 0.98] |
| 7 Serious adverse events ‐ participants characterised as 'at nutritional risk' due to one of the following conditions | 137 | 22087 | Risk Ratio (M‐H, Random, 95% CI) | 0.93 [0.86, 1.01] |
| 7.1 Major surgery | 65 | 5180 | Risk Ratio (M‐H, Random, 95% CI) | 0.84 [0.71, 0.99] |
| 7.2 Stroke | 6 | 5139 | Risk Ratio (M‐H, Random, 95% CI) | 0.78 [0.58, 1.06] |
| 7.3 ICU participants including trauma | 12 | 5423 | Risk Ratio (M‐H, Random, 95% CI) | 0.98 [0.81, 1.19] |
| 7.4 Frail elderly participants with less severe conditions known to increase protein requirements | 19 | 2406 | Risk Ratio (M‐H, Random, 95% CI) | 0.97 [0.75, 1.26] |
| 7.5 Participants do not fall into one of the categories above | 35 | 3939 | Risk Ratio (M‐H, Random, 95% CI) | 1.01 [0.85, 1.21] |
| 8 Serious adverse events ‐ participants characterised as 'at nutritional risk' due to one of the following criteria | 137 | 22087 | Risk Ratio (M‐H, Random, 95% CI) | 0.93 [0.86, 1.01] |
| 8.1 BMI less than 20.5 kg/m2 | 2 | 247 | Risk Ratio (M‐H, Random, 95% CI) | 1.19 [0.58, 2.45] |
| 8.2 Weight loss of at least 5% during the last three months | 1 | 32 | Risk Ratio (M‐H, Random, 95% CI) | 0.0 [0.0, 0.0] |
| 8.3 Weight loss of at least 10% during the last six months | 1 | 32 | Risk Ratio (M‐H, Random, 95% CI) | 0.88 [0.44, 1.78] |
| 8.4 Insufficient food intake during the last week (50% of requirements or less) | 0 | 0 | Risk Ratio (M‐H, Random, 95% CI) | 0.0 [0.0, 0.0] |
| 8.5 Participants characterised as 'at nutritional risk' by other means | 133 | 21776 | Risk Ratio (M‐H, Random, 95% CI) | 0.93 [0.86, 1.01] |
| 9 Serious adverse events ‐ participants characterised as 'at nutritional risk' due to biomarkers or anthropometrics | 137 | 22087 | Risk Ratio (M‐H, Random, 95% CI) | 0.93 [0.86, 1.01] |
| 9.1 Biomarkers | 8 | 703 | Risk Ratio (M‐H, Random, 95% CI) | 0.39 [0.16, 0.95] |
| 9.2 Anthropometric measures | 15 | 1677 | Risk Ratio (M‐H, Random, 95% CI) | 0.90 [0.68, 1.20] |
| 9.3 Mixed | 0 | 0 | Risk Ratio (M‐H, Random, 95% CI) | 0.0 [0.0, 0.0] |
| 9.4 Characterised by other means | 114 | 19707 | Risk Ratio (M‐H, Random, 95% CI) | 0.94 [0.86, 1.02] |
| 10 Serious adverse events ‐ randomisation year | 137 | 22087 | Risk Ratio (M‐H, Random, 95% CI) | 0.93 [0.86, 1.01] |
| 10.1 Before 1960 | 0 | 0 | Risk Ratio (M‐H, Random, 95% CI) | 0.0 [0.0, 0.0] |
| 10.2 1960 to 1979 | 5 | 184 | Risk Ratio (M‐H, Random, 95% CI) | 1.40 [0.70, 2.78] |
| 10.3 1980 to 1999 | 86 | 11472 | Risk Ratio (M‐H, Random, 95% CI) | 0.91 [0.82, 1.00] |
| 10.4 After 1999 | 46 | 10431 | Risk Ratio (M‐H, Random, 95% CI) | 0.89 [0.75, 1.06] |
| 11 Serious adverse events ‐ trials where the intervention lasts fewer than three days compared with trials where the intervention lasts three days or more | 137 | 22087 | Risk Ratio (M‐H, Random, 95% CI) | 0.93 [0.86, 1.01] |
| 11.1 Three days or more | 125 | 21408 | Risk Ratio (M‐H, Random, 95% CI) | 0.94 [0.86, 1.02] |
| 11.2 Less than three days | 10 | 602 | Risk Ratio (M‐H, Random, 95% CI) | 0.67 [0.39, 1.16] |
| 11.3 Unknown | 2 | 77 | Risk Ratio (M‐H, Random, 95% CI) | 0.25 [0.01, 5.00] |
| 12 Serious adverse events ‐ 'best‐worst case' scenario | 137 | 22557 | Risk Ratio (M‐H, Random, 95% CI) | 0.74 [0.65, 0.83] |
| 13 Serious adverse events ‐ 'worst‐best case' scenario | 137 | 22557 | Risk Ratio (M‐H, Random, 95% CI) | 1.06 [0.92, 1.21] |
| 14 Serious adverse events co‐interventions | 137 | 22087 | Risk Ratio (M‐H, Fixed, 95% CI) | 0.91 [0.84, 0.99] |
| 14.1 received nutrition support as co‐intervention | 11 | 5337 | Risk Ratio (M‐H, Fixed, 95% CI) | 0.95 [0.79, 1.15] |
| 14.2 did not receive nutrition support as co‐intervention | 119 | 16327 | Risk Ratio (M‐H, Fixed, 95% CI) | 0.90 [0.83, 0.99] |
| 14.3 delayed versus early nutrition support | 7 | 423 | Risk Ratio (M‐H, Fixed, 95% CI) | 0.89 [0.51, 1.57] |
3.2. Analysis.
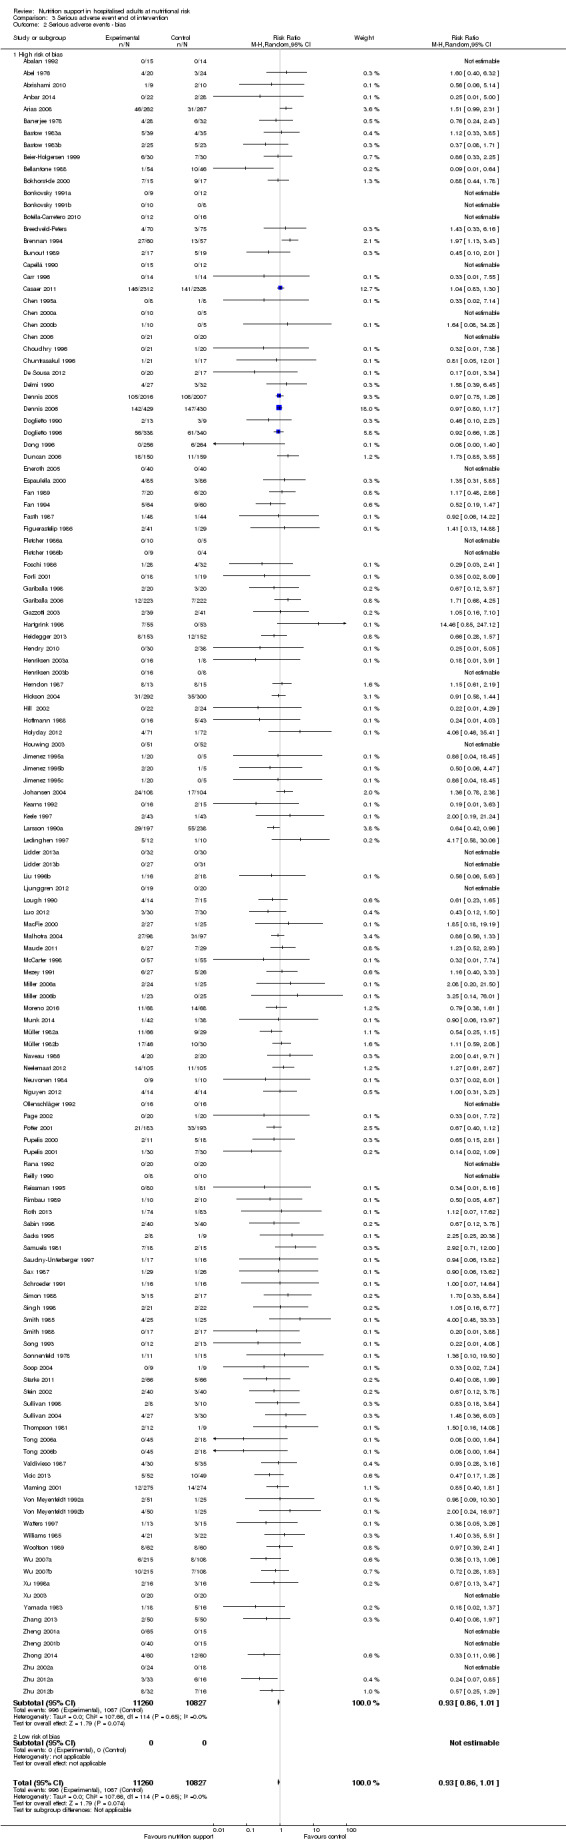
Comparison 3 Serious adverse event end of intervention, Outcome 2 Serious adverse events ‐ bias.
3.14. Analysis.

Comparison 3 Serious adverse event end of intervention, Outcome 14 Serious adverse events co‐interventions.
Comparison 4. Serious adverse event maximum follow‐up.
| Outcome or subgroup title | No. of studies | No. of participants | Statistical method | Effect size |
|---|---|---|---|---|
| 1 Serious adverse events ‐ overall | 152 | 23413 | Risk Ratio (M‐H, Random, 95% CI) | 0.91 [0.85, 0.97] |
| 2 Serious adverse events ‐ bias | 152 | 23413 | Risk Ratio (M‐H, Random, 95% CI) | 0.91 [0.85, 0.97] |
| 2.1 High risk of bias | 152 | 23413 | Risk Ratio (M‐H, Random, 95% CI) | 0.91 [0.85, 0.97] |
| 2.2 Low risk of bias | 0 | 0 | Risk Ratio (M‐H, Random, 95% CI) | 0.0 [0.0, 0.0] |
| 3 Serious adverse events ‐ mode of delivery | 152 | 23413 | Risk Ratio (M‐H, Random, 95% CI) | 0.91 [0.85, 0.97] |
| 3.1 General nutrition support | 7 | 1544 | Risk Ratio (M‐H, Random, 95% CI) | 1.04 [0.76, 1.44] |
| 3.2 Fortified nutrition | 2 | 290 | Risk Ratio (M‐H, Random, 95% CI) | 1.24 [0.61, 2.54] |
| 3.3 Oral nutrition support | 33 | 8541 | Risk Ratio (M‐H, Random, 95% CI) | 0.89 [0.74, 1.07] |
| 3.4 Enteral nutrition | 49 | 4425 | Risk Ratio (M‐H, Random, 95% CI) | 0.82 [0.73, 0.91] |
| 3.5 Parenteral nutrition | 56 | 8263 | Risk Ratio (M‐H, Random, 95% CI) | 0.98 [0.90, 1.07] |
| 3.6 Mixed | 5 | 350 | Risk Ratio (M‐H, Random, 95% CI) | 0.74 [0.37, 1.48] |
| 4 Serious adverse events ‐ by medical specialty | 152 | 23413 | Risk Ratio (M‐H, Random, 95% CI) | 0.91 [0.85, 0.97] |
| 4.1 Cardiology | 0 | 0 | Risk Ratio (M‐H, Random, 95% CI) | 0.0 [0.0, 0.0] |
| 4.2 Medical gastroenterology and hepatology | 13 | 706 | Risk Ratio (M‐H, Random, 95% CI) | 0.94 [0.75, 1.17] |
| 4.3 Geriatrics | 13 | 2547 | Risk Ratio (M‐H, Random, 95% CI) | 0.88 [0.67, 1.17] |
| 4.4 Pulmonary disease | 3 | 118 | Risk Ratio (M‐H, Random, 95% CI) | 0.44 [0.15, 1.28] |
| 4.5 Endocrinology | 0 | 0 | Risk Ratio (M‐H, Random, 95% CI) | 0.0 [0.0, 0.0] |
| 4.6 Infectious diseases | 1 | 56 | Risk Ratio (M‐H, Random, 95% CI) | 1.23 [0.52, 2.93] |
| 4.7 Rheumatology | 0 | 0 | Risk Ratio (M‐H, Random, 95% CI) | 0.0 [0.0, 0.0] |
| 4.8 Haematology | 0 | 0 | Risk Ratio (M‐H, Random, 95% CI) | 0.0 [0.0, 0.0] |
| 4.9 Nephrology | 0 | 0 | Risk Ratio (M‐H, Random, 95% CI) | 0.0 [0.0, 0.0] |
| 4.10 Gastroenterologic surgery | 59 | 4835 | Risk Ratio (M‐H, Random, 95% CI) | 0.83 [0.71, 0.97] |
| 4.11 Trauma surgery | 7 | 290 | Risk Ratio (M‐H, Random, 95% CI) | 0.86 [0.55, 1.34] |
| 4.12 Ortopaedics | 12 | 1196 | Risk Ratio (M‐H, Random, 95% CI) | 0.98 [0.63, 1.51] |
| 4.13 Plastic, reconstructive, and aesthetic surgery | 0 | 0 | Risk Ratio (M‐H, Random, 95% CI) | 0.0 [0.0, 0.0] |
| 4.14 Vascular surgery | 3 | 48 | Risk Ratio (M‐H, Random, 95% CI) | 0.5 [0.05, 4.67] |
| 4.15 Transplant surgery | 3 | 84 | Risk Ratio (M‐H, Random, 95% CI) | 0.54 [0.22, 1.31] |
| 4.16 Urology | 0 | 0 | Risk Ratio (M‐H, Random, 95% CI) | 0.0 [0.0, 0.0] |
| 4.17 Thoracic surgery | 3 | 592 | Risk Ratio (M‐H, Random, 95% CI) | 0.47 [0.06, 3.62] |
| 4.18 Neurological surgery | 0 | 0 | Risk Ratio (M‐H, Random, 95% CI) | 0.0 [0.0, 0.0] |
| 4.19 Oro‐maxillo‐facial surgery | 1 | 32 | Risk Ratio (M‐H, Random, 95% CI) | 0.88 [0.44, 1.78] |
| 4.20 Anaesthesiology | 0 | 0 | Risk Ratio (M‐H, Random, 95% CI) | 0.0 [0.0, 0.0] |
| 4.21 Emergency medicine | 11 | 5421 | Risk Ratio (M‐H, Random, 95% CI) | 0.96 [0.84, 1.10] |
| 4.22 Psychiatry | 0 | 0 | Risk Ratio (M‐H, Random, 95% CI) | 0.0 [0.0, 0.0] |
| 4.23 Neurology | 9 | 5426 | Risk Ratio (M‐H, Random, 95% CI) | 0.75 [0.58, 0.98] |
| 4.24 Oncology | 7 | 407 | Risk Ratio (M‐H, Random, 95% CI) | 1.02 [0.87, 1.20] |
| 4.25 Dermatology | 0 | 0 | Risk Ratio (M‐H, Random, 95% CI) | 0.0 [0.0, 0.0] |
| 4.26 Gynaecology | 0 | 0 | Risk Ratio (M‐H, Random, 95% CI) | 0.0 [0.0, 0.0] |
| 4.27 Mixed | 7 | 1655 | Risk Ratio (M‐H, Random, 95% CI) | 1.29 [0.97, 1.71] |
| 5 Serious adverse events ‐ based on adequacy of the amount of calories | 152 | 23413 | Risk Ratio (M‐H, Random, 95% CI) | 0.91 [0.85, 0.97] |
| 5.1 Clearly adequate in intervention and clearly inadequate in control | 31 | 7623 | Risk Ratio (M‐H, Random, 95% CI) | 0.95 [0.86, 1.05] |
| 5.2 Inadequate in the experimental or adequate in the control | 29 | 7395 | Risk Ratio (M‐H, Random, 95% CI) | 0.95 [0.85, 1.05] |
| 5.3 Experimental group is overfed | 11 | 867 | Risk Ratio (M‐H, Random, 95% CI) | 0.92 [0.72, 1.19] |
| 5.4 Unclear intake in control or experimental | 81 | 7528 | Risk Ratio (M‐H, Random, 95% CI) | 0.81 [0.70, 0.94] |
| 6 Serious adverse events ‐ different screening tools | 152 | 23413 | Risk Ratio (M‐H, Random, 95% CI) | 0.91 [0.85, 0.97] |
| 6.1 NRS 2002 | 4 | 5064 | Risk Ratio (M‐H, Random, 95% CI) | 1.03 [0.89, 1.21] |
| 6.2 MUST | 1 | 124 | Risk Ratio (M‐H, Random, 95% CI) | 1.37 [0.64, 2.92] |
| 6.3 MNA | 2 | 117 | Risk Ratio (M‐H, Random, 95% CI) | 0.61 [0.12, 3.18] |
| 6.4 SGA | 0 | 0 | Risk Ratio (M‐H, Random, 95% CI) | 0.0 [0.0, 0.0] |
| 6.5 Other means | 145 | 18108 | Risk Ratio (M‐H, Random, 95% CI) | 0.89 [0.82, 0.95] |
| 7 Serious adverse events ‐ participants characterised as 'at nutritional risk' due to one of the following conditions | 152 | 23413 | Risk Ratio (M‐H, Random, 95% CI) | 0.91 [0.85, 0.97] |
| 7.1 Major surgery | 72 | 5936 | Risk Ratio (M‐H, Random, 95% CI) | 0.82 [0.71, 0.94] |
| 7.2 Stroke | 8 | 5397 | Risk Ratio (M‐H, Random, 95% CI) | 0.75 [0.58, 0.98] |
| 7.3 ICU participants including trauma | 16 | 5667 | Risk Ratio (M‐H, Random, 95% CI) | 0.96 [0.84, 1.10] |
| 7.4 Frail elderly participants with less severe conditions known to increase protein requirements | 19 | 2385 | Risk Ratio (M‐H, Random, 95% CI) | 0.82 [0.65, 1.03] |
| 7.5 Participants do not fall into one of the categories above | 37 | 4028 | Risk Ratio (M‐H, Random, 95% CI) | 1.03 [0.92, 1.15] |
| 8 Serious adverse events ‐ participants characterised as 'at nutritional risk' due to one of the following criteria | 152 | 23413 | Risk Ratio (M‐H, Random, 95% CI) | 0.91 [0.85, 0.97] |
| 8.1 BMI less than 20.5 kg/m2 | 2 | 247 | Risk Ratio (M‐H, Random, 95% CI) | 1.19 [0.58, 2.45] |
| 8.2 Weight loss of at least 5% during the last three months | 1 | 32 | Risk Ratio (M‐H, Random, 95% CI) | 0.0 [0.0, 0.0] |
| 8.3 Weight loss of at least 10% during the last six months | 3 | 124 | Risk Ratio (M‐H, Random, 95% CI) | 0.84 [0.42, 1.67] |
| 8.4 Insufficient food intake during the last week (50% of requirements or less) | 0 | 0 | Risk Ratio (M‐H, Random, 95% CI) | 0.0 [0.0, 0.0] |
| 8.5 Participants characterised as 'at nutritional risk' by other means | 146 | 23010 | Risk Ratio (M‐H, Random, 95% CI) | 0.90 [0.84, 0.97] |
| 9 Serious adverse events ‐ participants characterised as 'at nutritional risk' due to biomarkers or anthropometrics | 152 | 23413 | Risk Ratio (M‐H, Random, 95% CI) | 0.91 [0.85, 0.97] |
| 9.1 Biomarkers | 10 | 795 | Risk Ratio (M‐H, Random, 95% CI) | 0.37 [0.16, 0.85] |
| 9.2 Anthropometric measures | 12 | 1402 | Risk Ratio (M‐H, Random, 95% CI) | 0.76 [0.54, 1.08] |
| 9.3 Both | 3 | 75 | Risk Ratio (M‐H, Random, 95% CI) | 0.66 [0.14, 3.07] |
| 9.4 Characterised by other means | 127 | 21141 | Risk Ratio (M‐H, Random, 95% CI) | 0.91 [0.85, 0.98] |
| 10 Serious adverse events ‐ randomisation year | 152 | 23413 | Risk Ratio (M‐H, Random, 95% CI) | 0.91 [0.85, 0.97] |
| 10.1 Before 1960 | 0 | 0 | Risk Ratio (M‐H, Random, 95% CI) | 0.0 [0.0, 0.0] |
| 10.2 1960 to 1979 | 6 | 240 | Risk Ratio (M‐H, Random, 95% CI) | 1.18 [0.65, 2.14] |
| 10.3 1980 to 1999 | 93 | 12128 | Risk Ratio (M‐H, Random, 95% CI) | 0.92 [0.86, 0.99] |
| 10.4 After 1999 | 53 | 11045 | Risk Ratio (M‐H, Random, 95% CI) | 0.83 [0.72, 0.97] |
| 11 Serious adverse events ‐ trials where the intervention lasts fewer than three days compared with trials where the intervention lasts three days or more | 152 | 23413 | Risk Ratio (M‐H, Random, 95% CI) | 0.91 [0.85, 0.97] |
| 11.1 Three days or more | 138 | 22637 | Risk Ratio (M‐H, Random, 95% CI) | 0.90 [0.84, 0.97] |
| 11.2 Less than three days | 12 | 699 | Risk Ratio (M‐H, Random, 95% CI) | 0.90 [0.66, 1.23] |
| 11.3 Unknown | 2 | 77 | Risk Ratio (M‐H, Random, 95% CI) | 0.25 [0.01, 5.00] |
| 12 Serious adverse events ‐ 'best‐worst case' scenario | 152 | 24315 | Risk Ratio (M‐H, Random, 95% CI) | 0.72 [0.65, 0.79] |
| 13 Serious adverse events ‐ 'worst‐best case' scenario | 152 | 24082 | Risk Ratio (M‐H, Random, 95% CI) | 1.05 [0.94, 1.17] |
| 14 Serious adverse events co‐interventions | 152 | 23413 | Risk Ratio (M‐H, Fixed, 95% CI) | 0.89 [0.84, 0.95] |
| 14.1 Received nutrition support as co‐intervention | 12 | 5459 | Risk Ratio (M‐H, Fixed, 95% CI) | 0.93 [0.81, 1.06] |
| 14.2 did not receive nutrition support as co‐intervention | 132 | 17493 | Risk Ratio (M‐H, Fixed, 95% CI) | 0.88 [0.82, 0.94] |
| 14.3 delayed versus early nutrition support | 8 | 461 | Risk Ratio (M‐H, Fixed, 95% CI) | 1.09 [0.75, 1.59] |
| 15 Serious adverse events ‐ 'best‐worse case' scenario (enteral nutrition) | 46 | 4415 | Risk Ratio (M‐H, Random, 95% CI) | 0.62 [0.51, 0.75] |
| 16 Serious adverse events ‐ 'worst‐best case' scenario (enteral nutrition) | 46 | 4415 | Risk Ratio (M‐H, Random, 95% CI) | 0.81 [0.69, 0.96] |
4.2. Analysis.
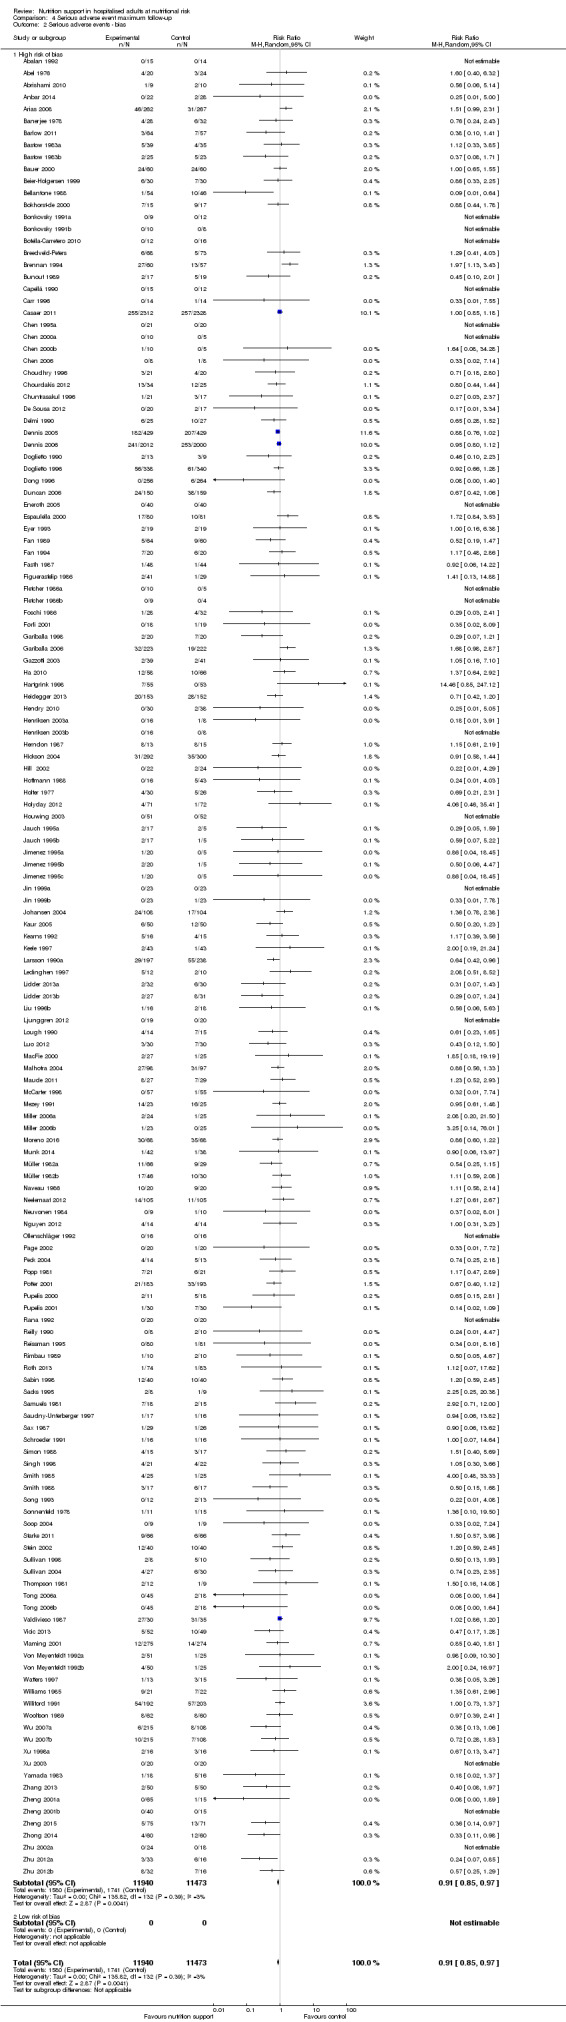
Comparison 4 Serious adverse event maximum follow‐up, Outcome 2 Serious adverse events ‐ bias.
4.14. Analysis.
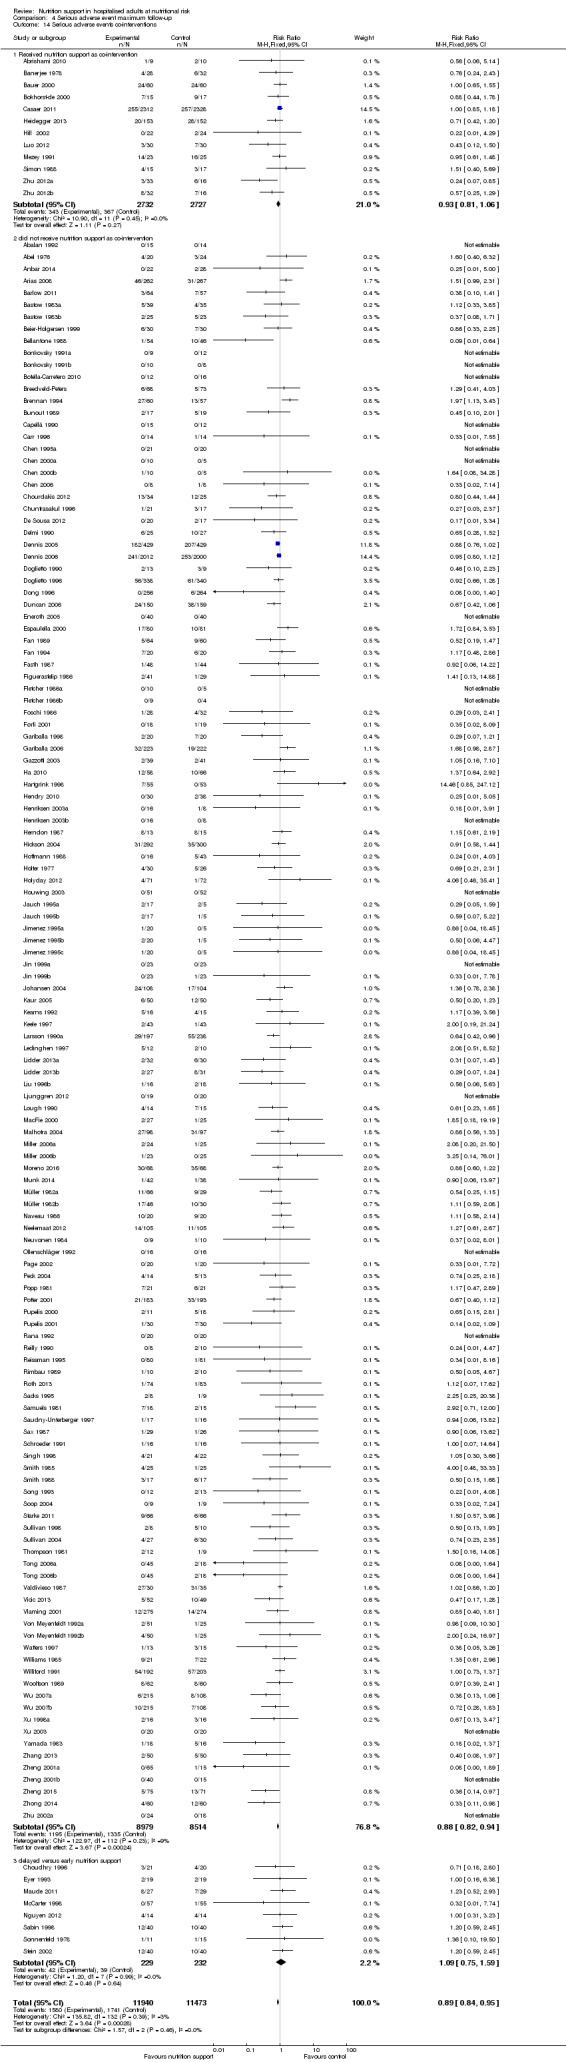
Comparison 4 Serious adverse event maximum follow‐up, Outcome 14 Serious adverse events co‐interventions.
4.15. Analysis.
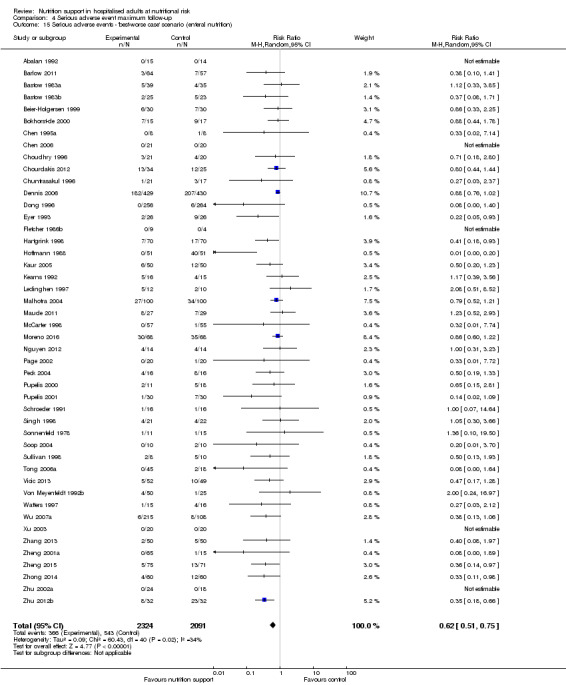
Comparison 4 Serious adverse event maximum follow‐up, Outcome 15 Serious adverse events ‐ 'best‐worse case' scenario (enteral nutrition).
4.16. Analysis.
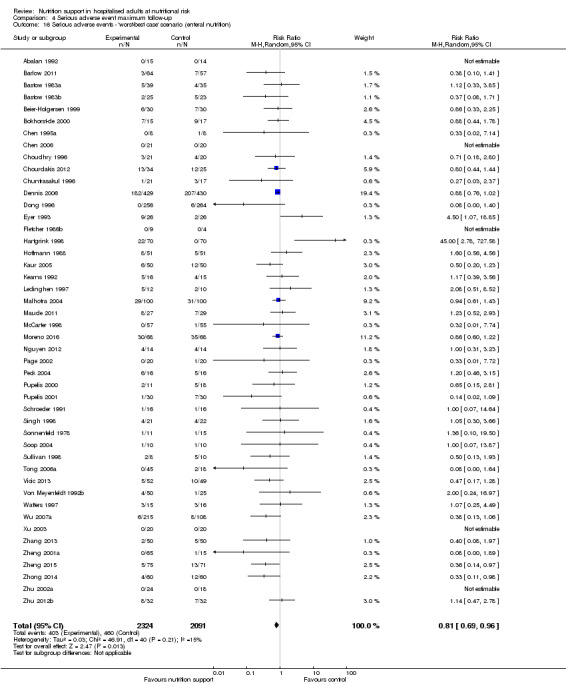
Comparison 4 Serious adverse event maximum follow‐up, Outcome 16 Serious adverse events ‐ 'worst‐best case' scenario (enteral nutrition).
Comparison 5. Quality of life (SF36 ‐ Physical performance) ‐ end of intervention.
| Outcome or subgroup title | No. of studies | No. of participants | Statistical method | Effect size |
|---|---|---|---|---|
| 1 Quality of life ‐ overall | 2 | 242 | Mean Difference (IV, Random, 95% CI) | 2.35 [‐2.94, 7.65] |
Comparison 6. Quality of life (SF36 ‐ Physical performance) ‐ maximum follow‐up.
| Outcome or subgroup title | No. of studies | No. of participants | Statistical method | Effect size |
|---|---|---|---|---|
| 1 Quality of life ‐ overall | 3 | 289 | Mean Difference (IV, Random, 95% CI) | 1.54 [‐2.47, 5.55] |
Comparison 7. Quality of life (SF36 ‐ Mental performance ‐ end of intervention.
| Outcome or subgroup title | No. of studies | No. of participants | Statistical method | Effect size |
|---|---|---|---|---|
| 1 Quality of life ‐ overall | 2 | 242 | Mean Difference (IV, Random, 95% CI) | ‐0.90 [‐3.92, 2.13] |
Comparison 8. Quality of life (SF36 ‐ Mental performance) ‐ maximum follow‐up.
| Outcome or subgroup title | No. of studies | No. of participants | Statistical method | Effect size |
|---|---|---|---|---|
| 1 Quality of life ‐ overall | 3 | 289 | Mean Difference (IV, Random, 95% CI) | ‐0.25 [‐3.02, 2.53] |
Comparison 9. Quality of life (EuroQoL) ‐ maximum follow‐up.
| Outcome or subgroup title | No. of studies | No. of participants | Statistical method | Effect size |
|---|---|---|---|---|
| 1 Quality of life ‐ overall | 2 | 3961 | Mean Difference (IV, Random, 95% CI) | ‐0.01 [‐0.03, 0.01] |
Comparison 10. Pneumonia.
| Outcome or subgroup title | No. of studies | No. of participants | Statistical method | Effect size |
|---|---|---|---|---|
| 1 Pneumonia | 28 | 12443 | Risk Ratio (M‐H, Random, 95% CI) | 1.06 [0.96, 1.16] |
Comparison 11. Wound dehiscence.
| Outcome or subgroup title | No. of studies | No. of participants | Statistical method | Effect size |
|---|---|---|---|---|
| 1 Wound dehiscence | 14 | 2280 | Risk Ratio (M‐H, Random, 95% CI) | 0.71 [0.40, 1.24] |
Comparison 12. Renal failure.
| Outcome or subgroup title | No. of studies | No. of participants | Statistical method | Effect size |
|---|---|---|---|---|
| 1 Renal failure | 5 | 6359 | Risk Ratio (M‐H, Random, 95% CI) | 1.00 [0.83, 1.20] |
Comparison 13. Wound infection.
| Outcome or subgroup title | No. of studies | No. of participants | Statistical method | Effect size |
|---|---|---|---|---|
| 1 Wound infection | 28 | 8324 | Risk Ratio (M‐H, Random, 95% CI) | 0.81 [0.60, 1.10] |
Comparison 14. Heart failure.
| Outcome or subgroup title | No. of studies | No. of participants | Statistical method | Effect size |
|---|---|---|---|---|
| 1 Heart failure | 3 | 1041 | Risk Ratio (M‐H, Random, 95% CI) | 1.11 [0.34, 3.61] |
Comparison 15. Clearly adequate and screening tool.
| Outcome or subgroup title | No. of studies | No. of participants | Statistical method | Effect size |
|---|---|---|---|---|
| 1 AcM ‐ EoI | 6 | 5578 | Risk Ratio (M‐H, Fixed, 95% CI) | 1.01 [0.81, 1.25] |
| 2 AcM ‐ MF | 6 | 5578 | Risk Ratio (M‐H, Random, 95% CI) | 1.01 [0.86, 1.18] |
| 3 SaE ‐ EoI | 6 | 5578 | Risk Ratio (M‐H, Fixed, 95% CI) | 0.96 [0.78, 1.19] |
| 4 SaE ‐ MF | 6 | 5578 | Risk Ratio (M‐H, Random, 95% CI) | 0.98 [0.84, 1.14] |
Comparison 16. Clearly adequate + (NRS component/at risk due to condition).
| Outcome or subgroup title | No. of studies | No. of participants | Statistical method | Effect size |
|---|---|---|---|---|
| 1 AcM ‐ EoI | 17 | 6760 | Risk Ratio (M‐H, Random, 95% CI) | 0.99 [0.82, 1.20] |
| 2 AcM ‐ MF | 20 | 6978 | Risk Ratio (M‐H, Random, 95% CI) | 0.95 [0.82, 1.09] |
| 3 SaE ‐ EoI | 20 | 6794 | Risk Ratio (M‐H, Fixed, 95% CI) | 0.96 [0.81, 1.14] |
| 4 SaE ‐ MF | 23 | 7012 | Risk Ratio (M‐H, Random, 95% CI) | 0.91 [0.80, 1.03] |
Comparison 17. Oral ‐ All cause mortality ‐ end of intervention.
| Outcome or subgroup title | No. of studies | No. of participants | Statistical method | Effect size |
|---|---|---|---|---|
| 1 All‐cause mortality ‐ overall | 33 | 8529 | Risk Ratio (M‐H, Random, 95% CI) | 0.94 [0.79, 1.11] |
| 2 All‐cause mortality ‐ bias | 33 | 8529 | Risk Ratio (M‐H, Random, 95% CI) | 0.94 [0.79, 1.11] |
| 2.1 High risk of bias | 33 | 8529 | Risk Ratio (M‐H, Random, 95% CI) | 0.94 [0.79, 1.11] |
| 2.2 Low risk of bias | 0 | 0 | Risk Ratio (M‐H, Random, 95% CI) | 0.0 [0.0, 0.0] |
| 3 All‐cause mortality ‐ medical speciality | 33 | 8529 | Risk Ratio (M‐H, Random, 95% CI) | 0.95 [0.80, 1.12] |
| 3.1 Cardiology | 0 | 0 | Risk Ratio (M‐H, Random, 95% CI) | 0.0 [0.0, 0.0] |
| 3.2 Medical gastroenterology and hepatology | 1 | 36 | Risk Ratio (M‐H, Random, 95% CI) | 0.45 [0.10, 2.01] |
| 3.3 Geriatrics | 9 | 1559 | Risk Ratio (M‐H, Random, 95% CI) | 0.75 [0.56, 0.99] |
| 3.4 Pulmonary disease | 2 | 93 | Risk Ratio (M‐H, Random, 95% CI) | 0.49 [0.16, 1.54] |
| 3.5 Endocrinology | 0 | 0 | Risk Ratio (M‐H, Random, 95% CI) | 0.0 [0.0, 0.0] |
| 3.6 Infectious diseases | 0 | 0 | Risk Ratio (M‐H, Random, 95% CI) | 0.0 [0.0, 0.0] |
| 3.7 Rheumatology | 0 | 0 | Risk Ratio (M‐H, Random, 95% CI) | 0.0 [0.0, 0.0] |
| 3.8 Haematology | 0 | 0 | Risk Ratio (M‐H, Random, 95% CI) | 0.0 [0.0, 0.0] |
| 3.9 Nephrology | 0 | 0 | Risk Ratio (M‐H, Random, 95% CI) | 0.0 [0.0, 0.0] |
| 3.10 Gastroenterologic surgery | 11 | 1267 | Risk Ratio (M‐H, Random, 95% CI) | 1.24 [0.65, 2.38] |
| 3.11 Trauma surgery | 0 | 0 | Risk Ratio (M‐H, Random, 95% CI) | 0.0 [0.0, 0.0] |
| 3.12 Orthopaedics | 4 | 371 | Risk Ratio (M‐H, Random, 95% CI) | 1.69 [0.53, 5.36] |
| 3.13 Plastic, reconstructive and aesthetic surgery | 0 | 0 | Risk Ratio (M‐H, Random, 95% CI) | 0.0 [0.0, 0.0] |
| 3.14 Vascular surgery | 0 | 0 | Risk Ratio (M‐H, Random, 95% CI) | 0.0 [0.0, 0.0] |
| 3.15 Transplant surgery | 1 | 37 | Risk Ratio (M‐H, Random, 95% CI) | 0.35 [0.02, 8.09] |
| 3.16 Urology | 0 | 0 | Risk Ratio (M‐H, Random, 95% CI) | 0.0 [0.0, 0.0] |
| 3.17 Thoracic surgery | 0 | 0 | Risk Ratio (M‐H, Random, 95% CI) | 0.0 [0.0, 0.0] |
| 3.18 Neurological surgery | 0 | 0 | Risk Ratio (M‐H, Random, 95% CI) | 0.0 [0.0, 0.0] |
| 3.19 Oro‐maxillo‐facial surgery | 0 | 0 | Risk Ratio (M‐H, Random, 95% CI) | 0.0 [0.0, 0.0] |
| 3.20 Anaesthesiology | 0 | 0 | Risk Ratio (M‐H, Random, 95% CI) | 0.0 [0.0, 0.0] |
| 3.21 Emergency medicine | 0 | 0 | Risk Ratio (M‐H, Random, 95% CI) | 0.0 [0.0, 0.0] |
| 3.22 Psychiatry | 0 | 0 | Risk Ratio (M‐H, Random, 95% CI) | 0.0 [0.0, 0.0] |
| 3.23 Neurology | 3 | 4092 | Risk Ratio (M‐H, Random, 95% CI) | 0.99 [0.76, 1.27] |
| 3.24 Oncology | 0 | 0 | Risk Ratio (M‐H, Random, 95% CI) | 0.0 [0.0, 0.0] |
| 3.25 Dermatology | 0 | 0 | Risk Ratio (M‐H, Random, 95% CI) | 0.0 [0.0, 0.0] |
| 3.26 Gynaecology | 0 | 0 | Risk Ratio (M‐H, Random, 95% CI) | 0.0 [0.0, 0.0] |
| 3.27 Mixed | 2 | 1074 | Risk Ratio (M‐H, Random, 95% CI) | 1.24 [0.73, 2.12] |
| 4 All‐cause mortality ‐ based on adequacy of the amount of calories | 33 | 8529 | Risk Ratio (M‐H, Random, 95% CI) | 0.94 [0.79, 1.11] |
| 4.1 Clearly adequate in experimental group and clearly inadequate in control group | 4 | 260 | Risk Ratio (M‐H, Random, 95% CI) | 1.08 [0.34, 3.47] |
| 4.2 Inadequate in the experimental group or adequate in the control group | 12 | 5540 | Risk Ratio (M‐H, Random, 95% CI) | 0.94 [0.76, 1.17] |
| 4.3 Experimental group is overfed | 2 | 69 | Risk Ratio (M‐H, Random, 95% CI) | 0.53 [0.14, 1.98] |
| 4.4 Unclear intake in experimental group or control group | 15 | 2660 | Risk Ratio (M‐H, Random, 95% CI) | 0.93 [0.62, 1.38] |
| 5 All‐cause mortality ‐ different screening tools | 33 | 8529 | Risk Ratio (M‐H, Random, 95% CI) | 0.94 [0.79, 1.11] |
| 5.1 NRS 2002 | 0 | 0 | Risk Ratio (M‐H, Random, 95% CI) | 0.0 [0.0, 0.0] |
| 5.2 MUST | 0 | 0 | Risk Ratio (M‐H, Random, 95% CI) | 0.0 [0.0, 0.0] |
| 5.3 MNA | 2 | 117 | Risk Ratio (M‐H, Random, 95% CI) | 0.61 [0.12, 3.18] |
| 5.4 SGA | 1 | 525 | Risk Ratio (M‐H, Random, 95% CI) | 1.51 [0.99, 2.31] |
| 5.5 Other means | 30 | 7887 | Risk Ratio (M‐H, Random, 95% CI) | 0.87 [0.73, 1.04] |
| 6 All‐cause mortality ‐ participants characterised as 'at nutritional risk' due to one of the following conditions | 33 | 8529 | Risk Ratio (M‐H, Random, 95% CI) | 0.94 [0.79, 1.11] |
| 6.1 Major surgery | 13 | 1364 | Risk Ratio (M‐H, Random, 95% CI) | 0.92 [0.49, 1.72] |
| 6.2 Stroke | 2 | 4063 | Risk Ratio (M‐H, Random, 95% CI) | 0.96 [0.74, 1.24] |
| 6.3 ICU participants including trauma | 0 | 0 | Risk Ratio (M‐H, Random, 95% CI) | 0.0 [0.0, 0.0] |
| 6.4 Frail elderly participants with less severe conditions known to increase protein requirements | 9 | 953 | Risk Ratio (M‐H, Random, 95% CI) | 0.85 [0.55, 1.30] |
| 6.5 Participants do not fall into one of the categories above | 9 | 2149 | Risk Ratio (M‐H, Random, 95% CI) | 0.93 [0.62, 1.39] |
| 7 All‐cause mortality ‐ participants characterised as 'at nutritional risk' due to one of the following criteria | 33 | 8529 | Risk Ratio (M‐H, Random, 95% CI) | 0.94 [0.79, 1.11] |
| 7.1 BMI less than 20.5 kg/m2 | 1 | 37 | Risk Ratio (M‐H, Random, 95% CI) | 0.35 [0.02, 8.09] |
| 7.2 Weight loss of at least 5% during the last three months | 0 | 0 | Risk Ratio (M‐H, Random, 95% CI) | 0.0 [0.0, 0.0] |
| 7.3 Weight loss of at least 10% during the last six months | 0 | 0 | Risk Ratio (M‐H, Random, 95% CI) | 0.0 [0.0, 0.0] |
| 7.4 Insufficient food intake during the last week (50% of requirements or less) | 0 | 0 | Risk Ratio (M‐H, Random, 95% CI) | 0.0 [0.0, 0.0] |
| 7.5 Participants characterised as 'at nutritional risk' by other means | 32 | 8492 | Risk Ratio (M‐H, Random, 95% CI) | 0.94 [0.79, 1.12] |
| 8 All‐cause mortality ‐ participants characterised as 'at nutritional risk' due to biomarkers or anthropometrics | 33 | 8529 | Risk Ratio (M‐H, Random, 95% CI) | 0.94 [0.79, 1.11] |
| 8.1 Biomarkers | 1 | 60 | Risk Ratio (M‐H, Random, 95% CI) | 0.43 [0.12, 1.50] |
| 8.2 Anthropometric measures | 6 | 1111 | Risk Ratio (M‐H, Random, 95% CI) | 0.78 [0.52, 1.16] |
| 8.3 Characterised by other means | 26 | 7358 | Risk Ratio (M‐H, Random, 95% CI) | 1.00 [0.80, 1.25] |
| 9 All‐cause mortality ‐ randomisation year | 33 | 8529 | Risk Ratio (M‐H, Random, 95% CI) | 0.94 [0.79, 1.11] |
| 9.1 Before 1960 | 0 | 0 | Risk Ratio (M‐H, Random, 95% CI) | 0.0 [0.0, 0.0] |
| 9.2 1960‐1979 | 1 | 60 | Risk Ratio (M‐H, Random, 95% CI) | 0.76 [0.24, 2.43] |
| 9.3 1980‐1999 | 18 | 7002 | Risk Ratio (M‐H, Random, 95% CI) | 0.87 [0.72, 1.04] |
| 9.4 After 1999 | 14 | 1467 | Risk Ratio (M‐H, Random, 95% CI) | 1.11 [0.64, 1.92] |
| 10 All‐cause mortality ‐ trials where the intervention lasts fewer than three days compared with trials where the intervention lasts three days or more | 33 | 8529 | Risk Ratio (M‐H, Random, 95% CI) | 0.94 [0.79, 1.11] |
| 10.1 Three days or more | 26 | 7797 | Risk Ratio (M‐H, Random, 95% CI) | 0.87 [0.74, 1.04] |
| 10.2 Less than three days | 6 | 207 | Risk Ratio (M‐H, Random, 95% CI) | 0.18 [0.01, 3.91] |
| 10.3 Unknown | 1 | 525 | Risk Ratio (M‐H, Random, 95% CI) | 1.51 [0.99, 2.31] |
| 11 All‐cause mortality ‐ 'best‐worst case' scenario | 33 | 8793 | Risk Ratio (M‐H, Random, 95% CI) | 0.72 [0.55, 0.95] |
| 12 All‐cause mortality ‐ 'worst‐best case' scenario | 33 | 8793 | Risk Ratio (M‐H, Random, 95% CI) | 1.33 [0.95, 1.86] |
| 13 All‐cause mortality co‐interventions | 33 | 8529 | Risk Ratio (M‐H, Random, 95% CI) | 0.94 [0.79, 1.11] |
| 13.1 received nutrition support as co‐intervention | 1 | 60 | Risk Ratio (M‐H, Random, 95% CI) | 0.43 [0.12, 1.50] |
| 13.2 did not receive nutrition support as co‐intervention | 32 | 8469 | Risk Ratio (M‐H, Random, 95% CI) | 0.95 [0.81, 1.12] |
| 13.3 delayed versus early nutrition support | 0 | 0 | Risk Ratio (M‐H, Random, 95% CI) | 0.0 [0.0, 0.0] |
17.1. Analysis.
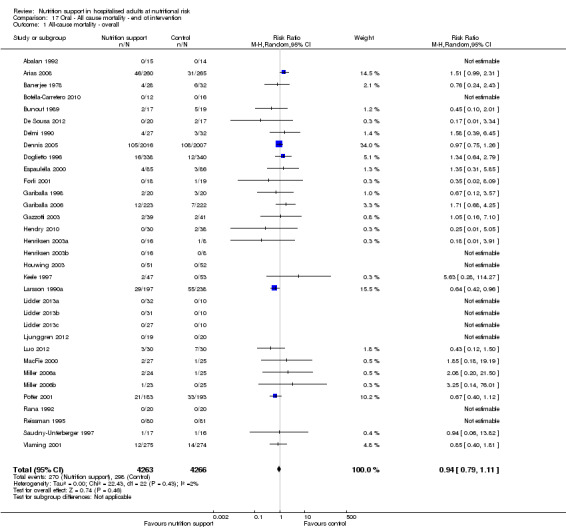
Comparison 17 Oral ‐ All cause mortality ‐ end of intervention, Outcome 1 All‐cause mortality ‐ overall.
17.2. Analysis.
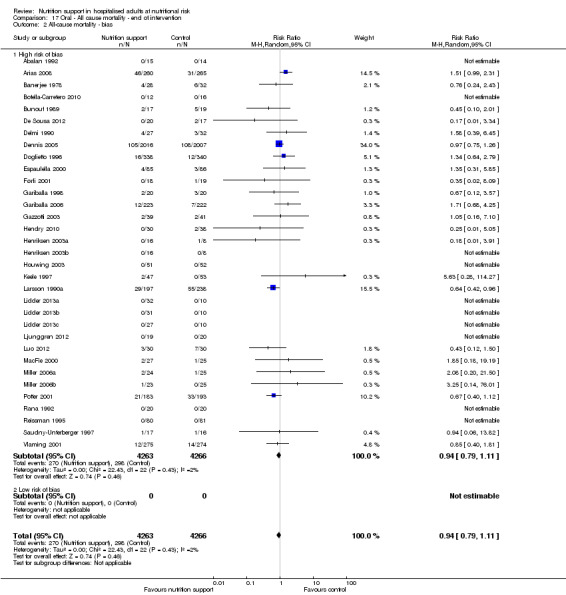
Comparison 17 Oral ‐ All cause mortality ‐ end of intervention, Outcome 2 All‐cause mortality ‐ bias.
17.3. Analysis.
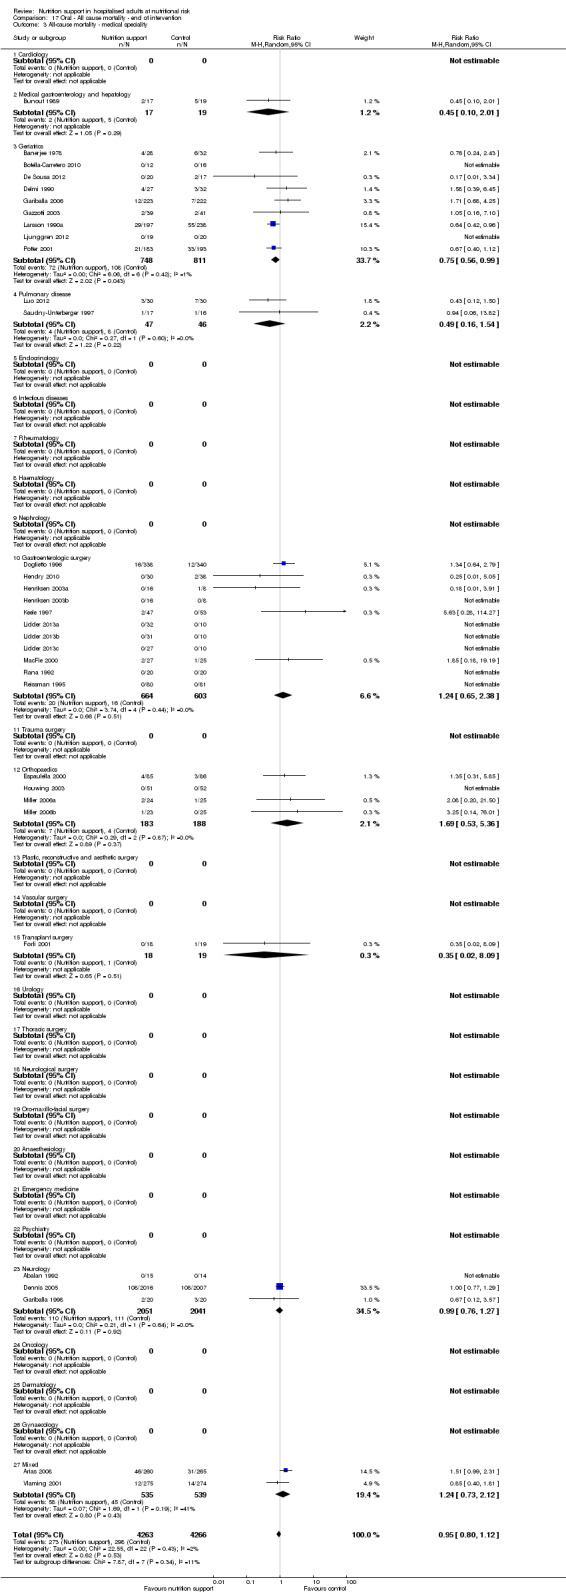
Comparison 17 Oral ‐ All cause mortality ‐ end of intervention, Outcome 3 All‐cause mortality ‐ medical speciality.
17.4. Analysis.
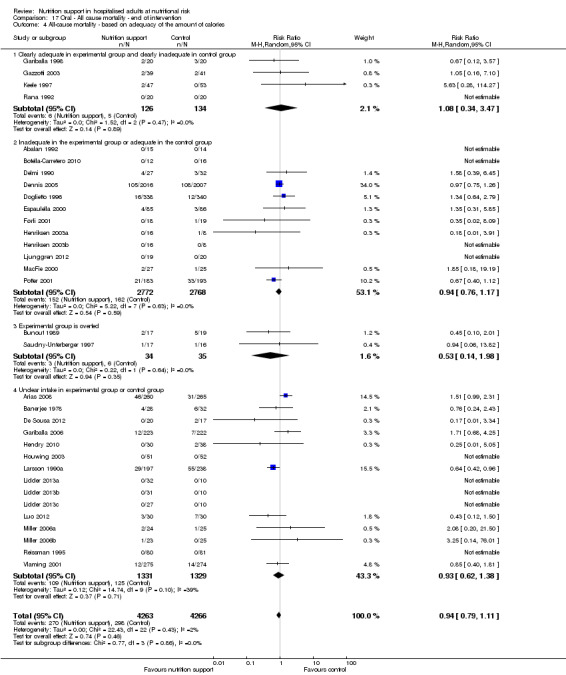
Comparison 17 Oral ‐ All cause mortality ‐ end of intervention, Outcome 4 All‐cause mortality ‐ based on adequacy of the amount of calories.
17.5. Analysis.
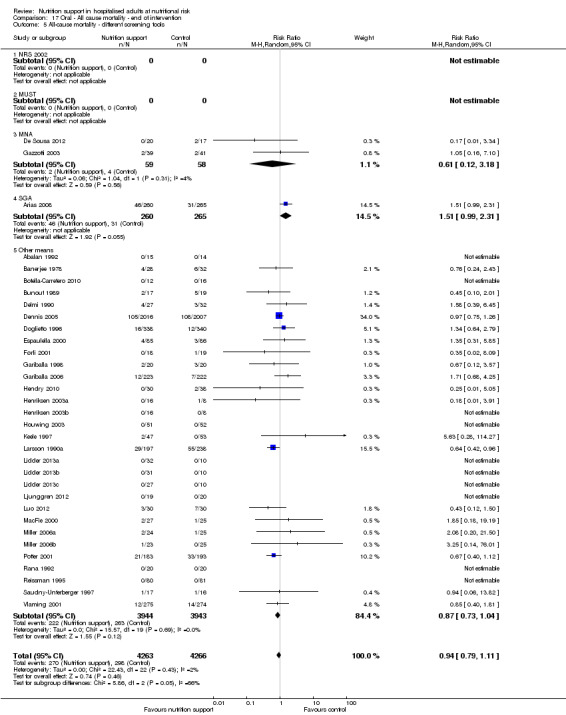
Comparison 17 Oral ‐ All cause mortality ‐ end of intervention, Outcome 5 All‐cause mortality ‐ different screening tools.
17.6. Analysis.
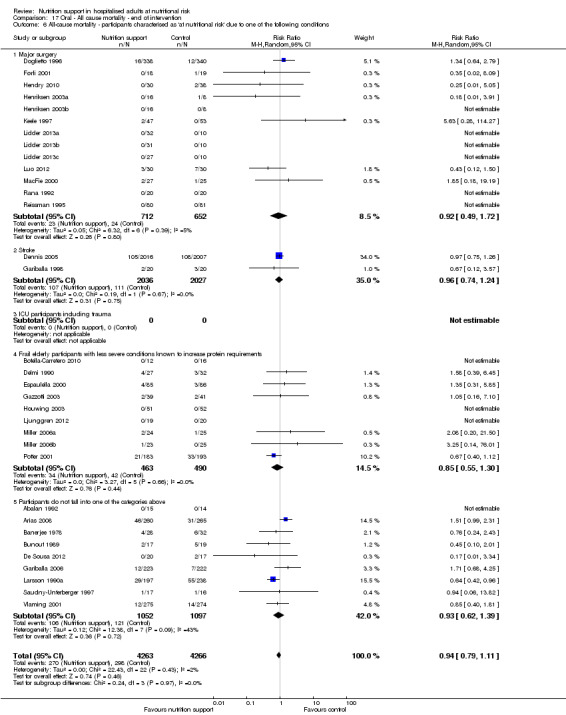
Comparison 17 Oral ‐ All cause mortality ‐ end of intervention, Outcome 6 All‐cause mortality ‐ participants characterised as 'at nutritional risk' due to one of the following conditions.
17.7. Analysis.
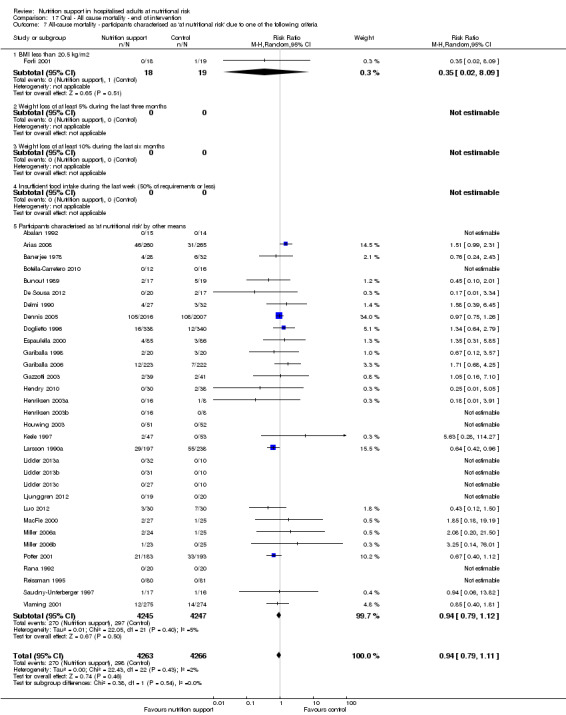
Comparison 17 Oral ‐ All cause mortality ‐ end of intervention, Outcome 7 All‐cause mortality ‐ participants characterised as 'at nutritional risk' due to one of the following criteria.
17.8. Analysis.
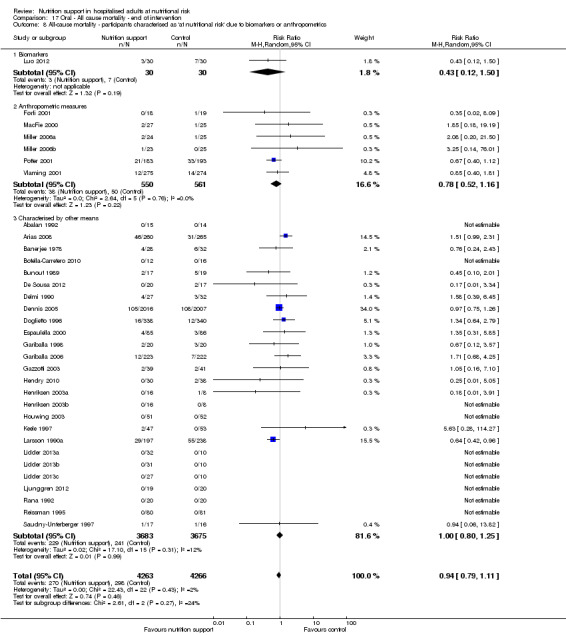
Comparison 17 Oral ‐ All cause mortality ‐ end of intervention, Outcome 8 All‐cause mortality ‐ participants characterised as 'at nutritional risk' due to biomarkers or anthropometrics.
17.9. Analysis.
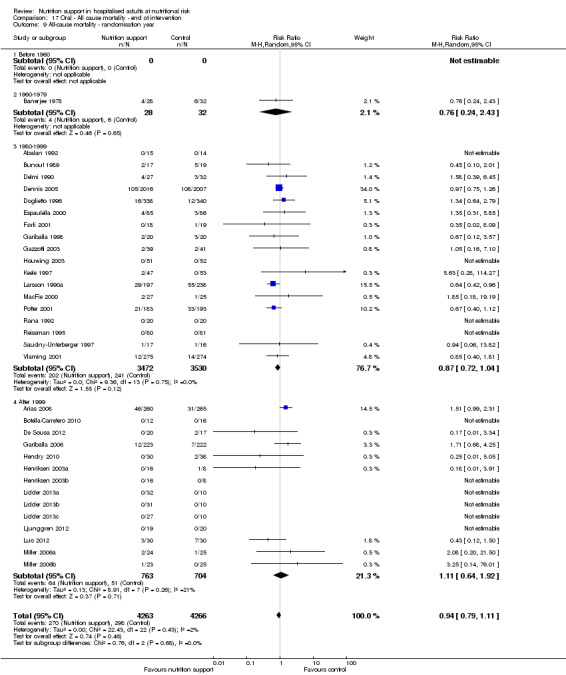
Comparison 17 Oral ‐ All cause mortality ‐ end of intervention, Outcome 9 All‐cause mortality ‐ randomisation year.
17.10. Analysis.
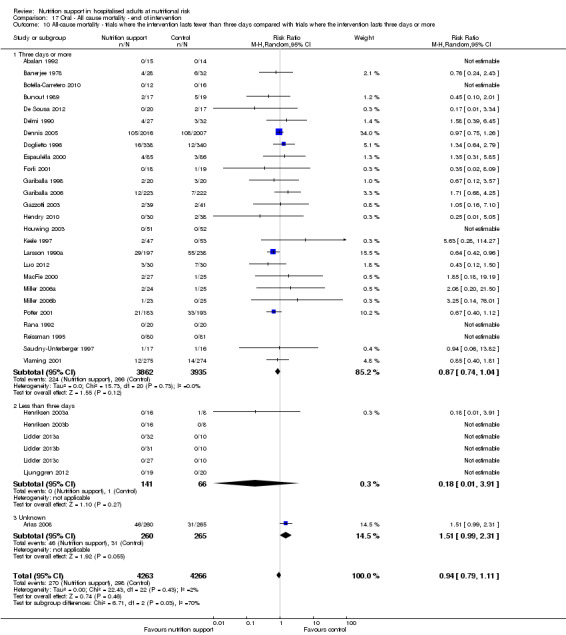
Comparison 17 Oral ‐ All cause mortality ‐ end of intervention, Outcome 10 All‐cause mortality ‐ trials where the intervention lasts fewer than three days compared with trials where the intervention lasts three days or more.
17.11. Analysis.
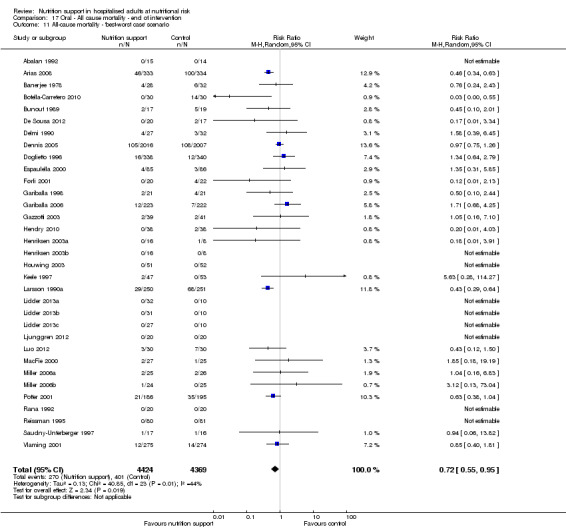
Comparison 17 Oral ‐ All cause mortality ‐ end of intervention, Outcome 11 All‐cause mortality ‐ 'best‐worst case' scenario.
17.12. Analysis.
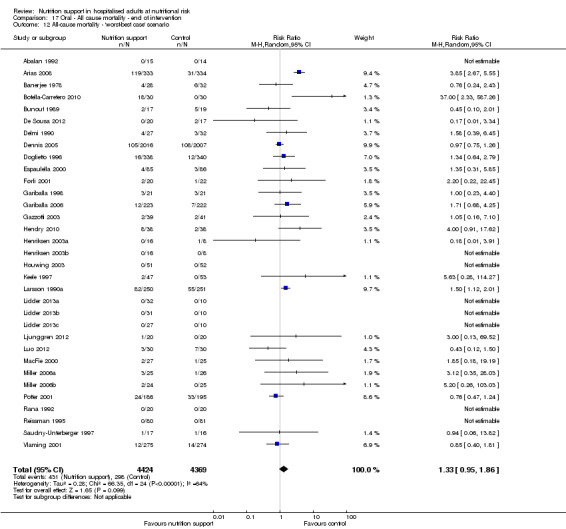
Comparison 17 Oral ‐ All cause mortality ‐ end of intervention, Outcome 12 All‐cause mortality ‐ 'worst‐best case' scenario.
17.13. Analysis.
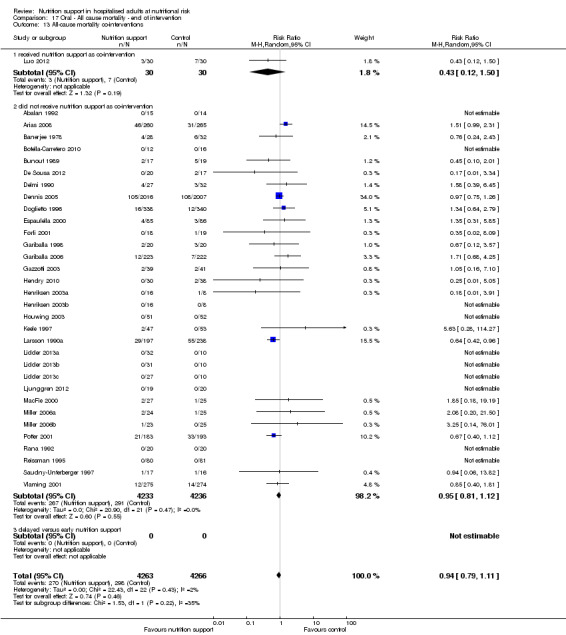
Comparison 17 Oral ‐ All cause mortality ‐ end of intervention, Outcome 13 All‐cause mortality co‐interventions.
Comparison 18. Oral ‐ All cause mortality ‐ maximum follow‐up.
| Outcome or subgroup title | No. of studies | No. of participants | Statistical method | Effect size |
|---|---|---|---|---|
| 1 All‐cause mortality ‐ overall | 32 | 8501 | Risk Ratio (M‐H, Random, 95% CI) | 0.94 [0.77, 1.15] |
| 2 All‐cause mortality ‐ bias | 32 | 8501 | Risk Ratio (M‐H, Random, 95% CI) | 0.94 [0.77, 1.15] |
| 2.1 High risk of bias | 32 | 8501 | Risk Ratio (M‐H, Random, 95% CI) | 0.94 [0.77, 1.15] |
| 2.2 Low risk of bias | 0 | 0 | Risk Ratio (M‐H, Random, 95% CI) | 0.0 [0.0, 0.0] |
| 3 All‐cause mortality ‐ medical speciality | 32 | 8501 | Risk Ratio (M‐H, Random, 95% CI) | 0.94 [0.77, 1.15] |
| 3.1 Cardiology | 0 | 0 | Risk Ratio (M‐H, Random, 95% CI) | 0.0 [0.0, 0.0] |
| 3.2 Medical gastroenterology and hepatology | 1 | 36 | Risk Ratio (M‐H, Random, 95% CI) | 0.45 [0.10, 2.01] |
| 3.3 Geriatrics | 9 | 1552 | Risk Ratio (M‐H, Random, 95% CI) | 0.81 [0.55, 1.19] |
| 3.4 Pulmonary disease | 2 | 93 | Risk Ratio (M‐H, Random, 95% CI) | 0.49 [0.16, 1.54] |
| 3.5 Endocrinology | 0 | 0 | Risk Ratio (M‐H, Random, 95% CI) | 0.0 [0.0, 0.0] |
| 3.6 Infectious diseases | 0 | 0 | Risk Ratio (M‐H, Random, 95% CI) | 0.0 [0.0, 0.0] |
| 3.7 Rheumatology | 0 | 0 | Risk Ratio (M‐H, Random, 95% CI) | 0.0 [0.0, 0.0] |
| 3.8 Haematology | 0 | 0 | Risk Ratio (M‐H, Random, 95% CI) | 0.0 [0.0, 0.0] |
| 3.9 Nephrology | 0 | 0 | Risk Ratio (M‐H, Random, 95% CI) | 0.0 [0.0, 0.0] |
| 3.10 Gastroenterologic surgery | 10 | 1267 | Risk Ratio (M‐H, Random, 95% CI) | 1.14 [0.61, 2.12] |
| 3.11 Trauma surgery | 0 | 0 | Risk Ratio (M‐H, Random, 95% CI) | 0.0 [0.0, 0.0] |
| 3.12 Ortopaedics | 4 | 361 | Risk Ratio (M‐H, Random, 95% CI) | 1.80 [0.92, 3.52] |
| 3.13 Plastic, reconstructive, and aesthetic surgery | 0 | 0 | Risk Ratio (M‐H, Random, 95% CI) | 0.0 [0.0, 0.0] |
| 3.14 Vascular surgery | 0 | 0 | Risk Ratio (M‐H, Random, 95% CI) | 0.0 [0.0, 0.0] |
| 3.15 Transplant surgery | 1 | 37 | Risk Ratio (M‐H, Random, 95% CI) | 0.35 [0.02, 8.09] |
| 3.16 Urology | 0 | 0 | Risk Ratio (M‐H, Random, 95% CI) | 0.0 [0.0, 0.0] |
| 3.17 Thoracic surgery | 0 | 0 | Risk Ratio (M‐H, Random, 95% CI) | 0.0 [0.0, 0.0] |
| 3.18 Neurological surgery | 0 | 0 | Risk Ratio (M‐H, Random, 95% CI) | 0.0 [0.0, 0.0] |
| 3.19 Oro‐maxillo‐facial surgery | 0 | 0 | Risk Ratio (M‐H, Random, 95% CI) | 0.0 [0.0, 0.0] |
| 3.20 Anaesthesiology | 0 | 0 | Risk Ratio (M‐H, Random, 95% CI) | 0.0 [0.0, 0.0] |
| 3.21 Emergency medicine | 0 | 0 | Risk Ratio (M‐H, Random, 95% CI) | 0.0 [0.0, 0.0] |
| 3.22 Psychiatry | 0 | 0 | Risk Ratio (M‐H, Random, 95% CI) | 0.0 [0.0, 0.0] |
| 3.23 Neurology | 3 | 4081 | Risk Ratio (M‐H, Random, 95% CI) | 0.65 [0.22, 1.93] |
| 3.24 Oncology | 0 | 0 | Risk Ratio (M‐H, Random, 95% CI) | 0.0 [0.0, 0.0] |
| 3.25 Dermatology | 0 | 0 | Risk Ratio (M‐H, Random, 95% CI) | 0.0 [0.0, 0.0] |
| 3.26 Gynaecology | 0 | 0 | Risk Ratio (M‐H, Random, 95% CI) | 0.0 [0.0, 0.0] |
| 3.27 Mixed | 2 | 1074 | Risk Ratio (M‐H, Random, 95% CI) | 1.24 [0.73, 2.12] |
| 4 All‐cause mortality ‐ based on adequacy of the amount of calories | 32 | 8501 | Risk Ratio (M‐H, Random, 95% CI) | 0.94 [0.77, 1.15] |
| 4.1 Clearly adequate in intervention and clearly inadequate in control | 4 | 260 | Risk Ratio (M‐H, Random, 95% CI) | 0.80 [0.17, 3.70] |
| 4.2 Inadequate in the experimental or adequate in the control | 12 | 5512 | Risk Ratio (M‐H, Random, 95% CI) | 0.94 [0.76, 1.17] |
| 4.3 Experimental group is overfed | 2 | 69 | Risk Ratio (M‐H, Random, 95% CI) | 0.53 [0.14, 1.98] |
| 4.4 Unclear intake in control or experimental | 14 | 2660 | Risk Ratio (M‐H, Random, 95% CI) | 0.95 [0.65, 1.38] |
| 5 All‐cause mortality ‐ different screening tools | 32 | 8501 | Risk Ratio (M‐H, Random, 95% CI) | 0.94 [0.77, 1.15] |
| 5.1 NRS 2002 | 0 | 0 | Risk Ratio (M‐H, Random, 95% CI) | 0.0 [0.0, 0.0] |
| 5.2 MUST | 0 | 0 | Risk Ratio (M‐H, Random, 95% CI) | 0.0 [0.0, 0.0] |
| 5.3 MNA | 2 | 117 | Risk Ratio (M‐H, Random, 95% CI) | 0.61 [0.12, 3.18] |
| 5.4 SGA | 1 | 525 | Risk Ratio (M‐H, Random, 95% CI) | 1.51 [0.99, 2.31] |
| 5.5 Other means | 29 | 7859 | Risk Ratio (M‐H, Random, 95% CI) | 0.89 [0.73, 1.09] |
| 6 All‐cause mortality ‐ participants characterised as 'at nutritional risk' due to one of the following conditions | 32 | 8501 | Risk Ratio (M‐H, Random, 95% CI) | 0.94 [0.77, 1.15] |
| 6.1 Major surgery | 11 | 1304 | Risk Ratio (M‐H, Random, 95% CI) | 1.09 [0.59, 2.00] |
| 6.2 Stroke | 2 | 4052 | Risk Ratio (M‐H, Random, 95% CI) | 0.65 [0.22, 1.93] |
| 6.3 ICU participants including trauma | 0 | 0 | Risk Ratio (M‐H, Random, 95% CI) | 0.0 [0.0, 0.0] |
| 6.4 Frail elderly participants with less severe conditions known to increase protein requirements | 10 | 996 | Risk Ratio (M‐H, Random, 95% CI) | 0.87 [0.57, 1.34] |
| 6.5 Participants do not fall into one of the categories above | 9 | 2149 | Risk Ratio (M‐H, Random, 95% CI) | 0.96 [0.64, 1.46] |
| 7 All‐cause mortality ‐ participants characterised as 'at nutritional risk' due to one of the following criteria | 32 | 8501 | Risk Ratio (M‐H, Random, 95% CI) | 0.94 [0.77, 1.15] |
| 7.1 BMI less than 20.5 kg/m2 | 1 | 37 | Risk Ratio (M‐H, Random, 95% CI) | 0.35 [0.02, 8.09] |
| 7.2 Weight loss of at least 5% during the last three months | 0 | 0 | Risk Ratio (M‐H, Random, 95% CI) | 0.0 [0.0, 0.0] |
| 7.3 Weight loss of at least 10% during the last six months | 0 | 0 | Risk Ratio (M‐H, Random, 95% CI) | 0.0 [0.0, 0.0] |
| 7.4 Insufficient food intake during the last week (50% of requirements or less) | 0 | 0 | Risk Ratio (M‐H, Random, 95% CI) | 0.0 [0.0, 0.0] |
| 7.5 Participants characterised as 'at nutritional risk' by other means | 31 | 8464 | Risk Ratio (M‐H, Random, 95% CI) | 0.94 [0.77, 1.16] |
| 8 All‐cause mortality ‐ participants characterised as 'at nutritional risk' due to biomarkers or anthropometrics | 32 | 8501 | Risk Ratio (M‐H, Random, 95% CI) | 0.94 [0.77, 1.15] |
| 8.1 Biomarkers | 1 | 60 | Risk Ratio (M‐H, Random, 95% CI) | 0.43 [0.12, 1.50] |
| 8.2 Anthropometric measures | 6 | 1111 | Risk Ratio (M‐H, Random, 95% CI) | 0.78 [0.52, 1.16] |
| 8.3 Both anthropometrics and biomarkers | 0 | 0 | Risk Ratio (M‐H, Random, 95% CI) | 0.0 [0.0, 0.0] |
| 8.4 Characterised by other means | 25 | 7330 | Risk Ratio (M‐H, Random, 95% CI) | 0.99 [0.77, 1.26] |
| 9 All‐cause mortality ‐ randomisation year | 32 | 8501 | Risk Ratio (M‐H, Random, 95% CI) | 0.94 [0.77, 1.15] |
| 9.1 Before 1960 | 0 | 0 | Risk Ratio (M‐H, Random, 95% CI) | 0.0 [0.0, 0.0] |
| 9.2 1960 to 1979 | 1 | 60 | Risk Ratio (M‐H, Random, 95% CI) | 0.76 [0.24, 2.43] |
| 9.3 1980 to 1999 | 18 | 6974 | Risk Ratio (M‐H, Random, 95% CI) | 0.86 [0.71, 1.05] |
| 9.4 After 1999 | 13 | 1467 | Risk Ratio (M‐H, Random, 95% CI) | 1.19 [0.77, 1.83] |
| 10 All‐cause mortality ‐ trials where the intervention lasts fewer than three days compared with trials where the intervention lasts three days or more | 32 | 8501 | Risk Ratio (M‐H, Random, 95% CI) | 0.94 [0.77, 1.15] |
| 10.1 Three days or more | 31 | 8462 | Risk Ratio (M‐H, Random, 95% CI) | 0.94 [0.77, 1.15] |
| 10.2 Less than three days | 1 | 39 | Risk Ratio (M‐H, Random, 95% CI) | 0.0 [0.0, 0.0] |
| 10.3 Unknown | 0 | 0 | Risk Ratio (M‐H, Random, 95% CI) | 0.0 [0.0, 0.0] |
| 11 All‐cause mortality ‐ 'best‐worst case' scenario | 32 | 8793 | Risk Ratio (M‐H, Random, 95% CI) | 0.70 [0.54, 0.91] |
| 12 All‐cause mortality ‐ 'worst‐best case' scenario | 32 | 8793 | Risk Ratio (M‐H, Random, 95% CI) | 1.27 [0.93, 1.73] |
| 13 All‐cause mortality co‐interventions | 131 | 22435 | Risk Ratio (M‐H, Fixed, 95% CI) | 0.91 [0.86, 0.98] |
| 13.1 received nutrition support as co‐intervention | 8 | 5185 | Risk Ratio (M‐H, Fixed, 95% CI) | 0.93 [0.80, 1.08] |
| 13.2 did not receive nutrition support as co‐intervention | 120 | 17017 | Risk Ratio (M‐H, Fixed, 95% CI) | 0.91 [0.84, 0.98] |
| 13.3 delayed versus early nutrition support | 3 | 233 | Risk Ratio (M‐H, Fixed, 95% CI) | 0.99 [0.53, 1.83] |
18.1. Analysis.
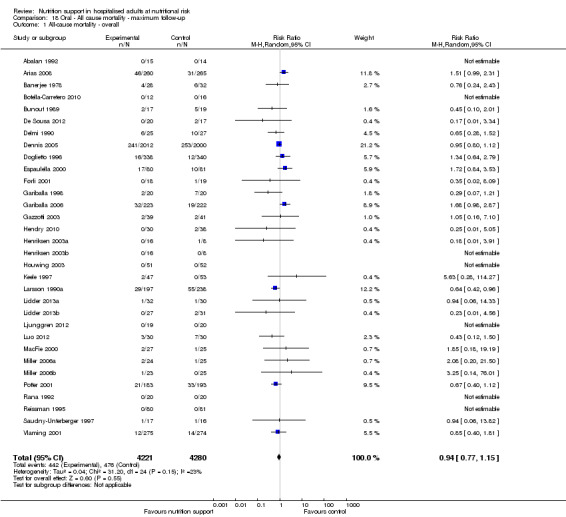
Comparison 18 Oral ‐ All cause mortality ‐ maximum follow‐up, Outcome 1 All‐cause mortality ‐ overall.
18.2. Analysis.
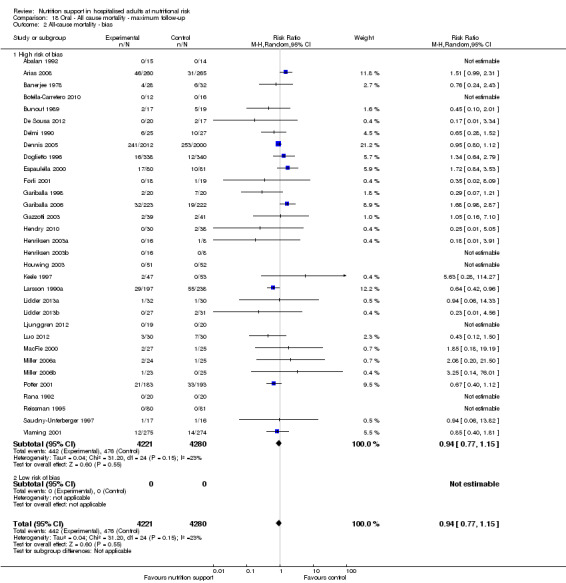
Comparison 18 Oral ‐ All cause mortality ‐ maximum follow‐up, Outcome 2 All‐cause mortality ‐ bias.
18.3. Analysis.
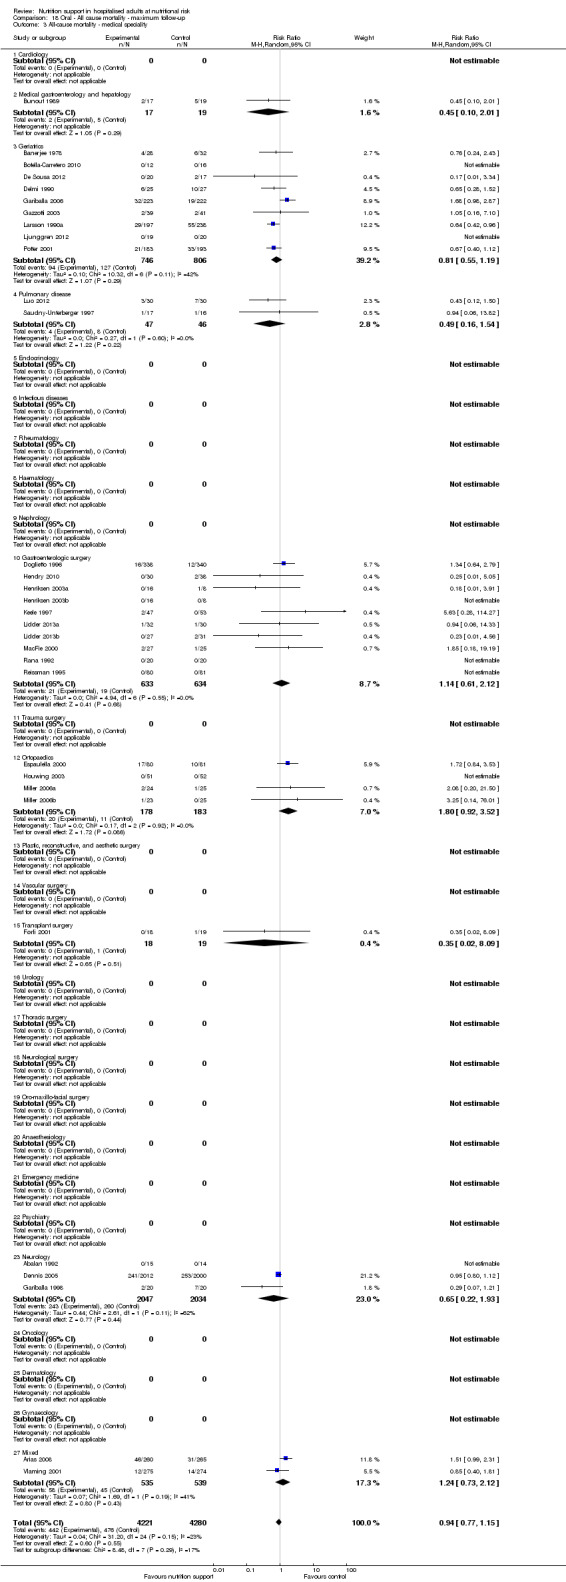
Comparison 18 Oral ‐ All cause mortality ‐ maximum follow‐up, Outcome 3 All‐cause mortality ‐ medical speciality.
18.4. Analysis.
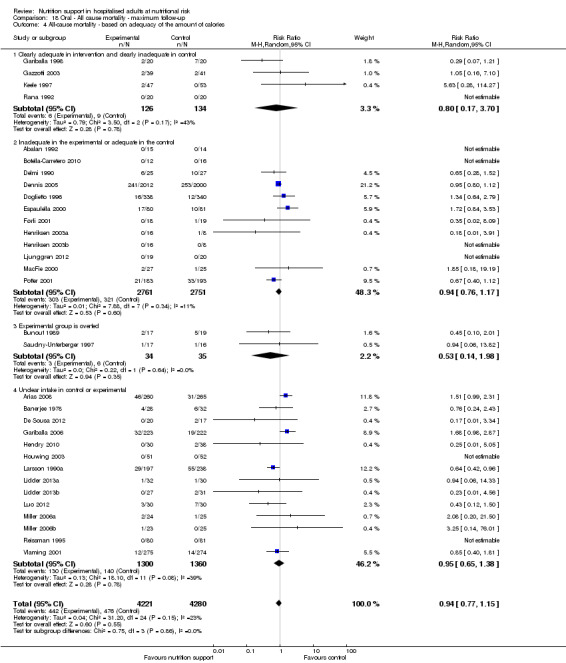
Comparison 18 Oral ‐ All cause mortality ‐ maximum follow‐up, Outcome 4 All‐cause mortality ‐ based on adequacy of the amount of calories.
18.5. Analysis.
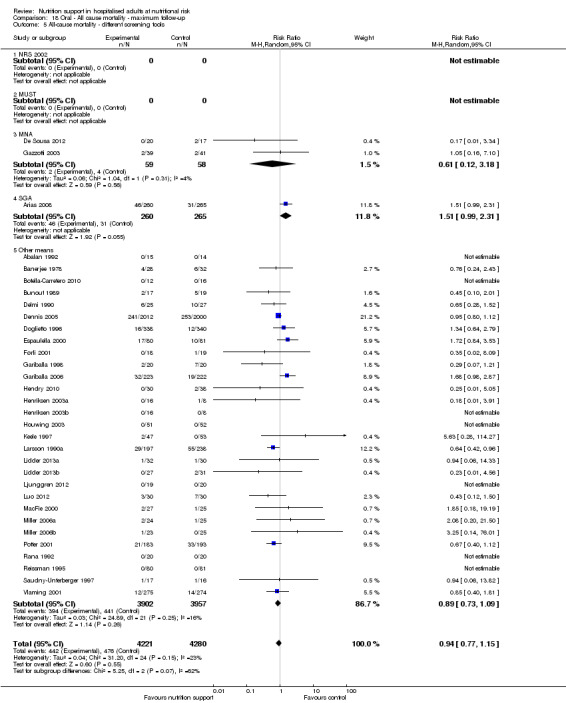
Comparison 18 Oral ‐ All cause mortality ‐ maximum follow‐up, Outcome 5 All‐cause mortality ‐ different screening tools.
18.6. Analysis.
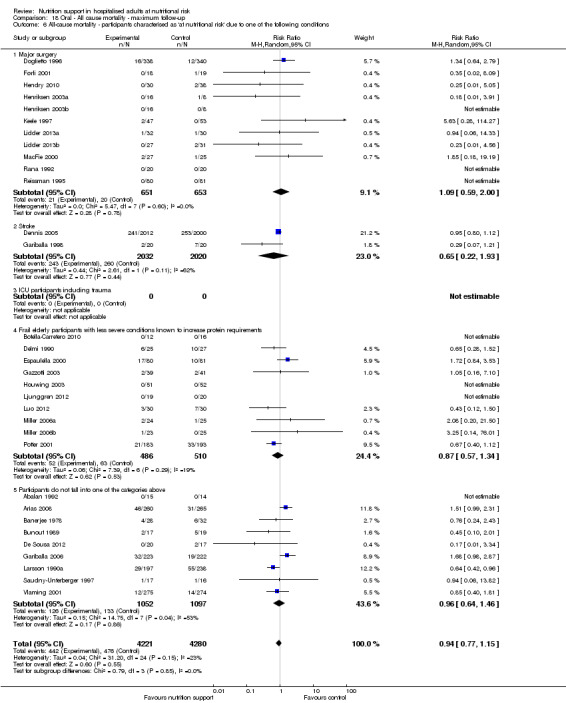
Comparison 18 Oral ‐ All cause mortality ‐ maximum follow‐up, Outcome 6 All‐cause mortality ‐ participants characterised as 'at nutritional risk' due to one of the following conditions.
18.7. Analysis.
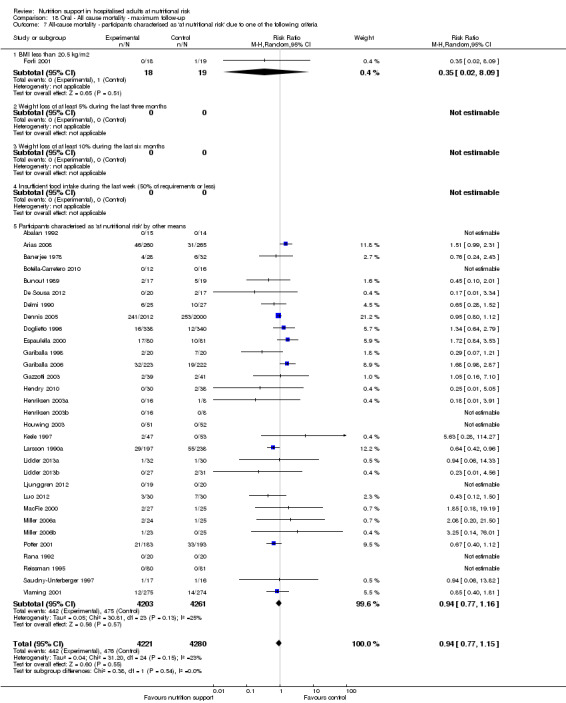
Comparison 18 Oral ‐ All cause mortality ‐ maximum follow‐up, Outcome 7 All‐cause mortality ‐ participants characterised as 'at nutritional risk' due to one of the following criteria.
18.8. Analysis.
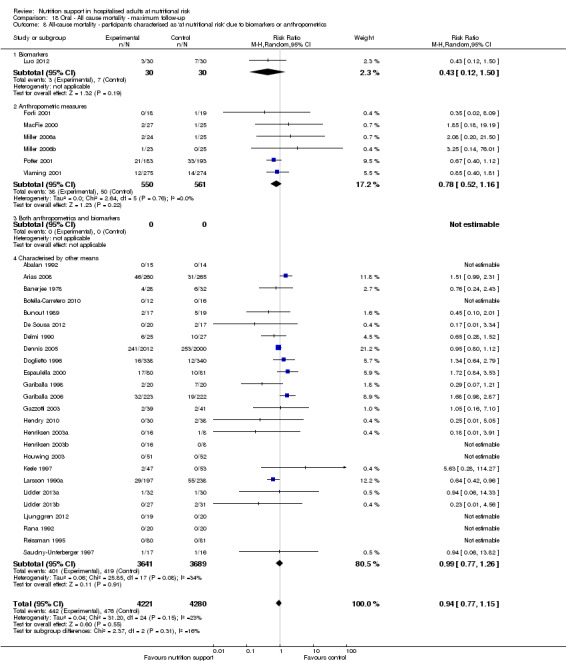
Comparison 18 Oral ‐ All cause mortality ‐ maximum follow‐up, Outcome 8 All‐cause mortality ‐ participants characterised as 'at nutritional risk' due to biomarkers or anthropometrics.
18.9. Analysis.

Comparison 18 Oral ‐ All cause mortality ‐ maximum follow‐up, Outcome 9 All‐cause mortality ‐ randomisation year.
18.10. Analysis.
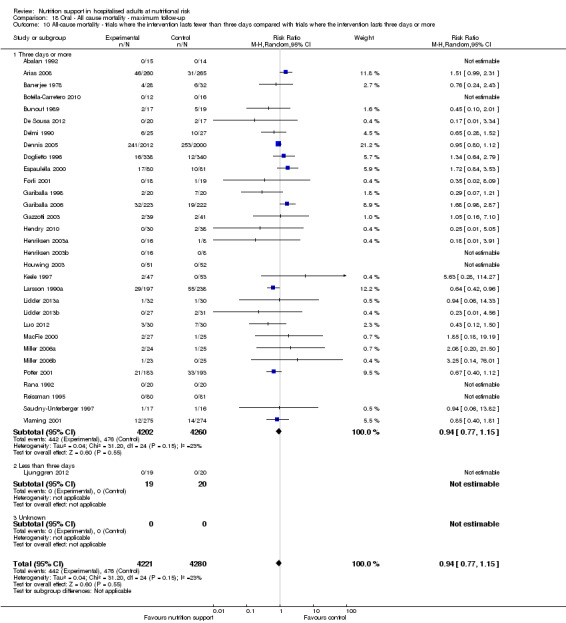
Comparison 18 Oral ‐ All cause mortality ‐ maximum follow‐up, Outcome 10 All‐cause mortality ‐ trials where the intervention lasts fewer than three days compared with trials where the intervention lasts three days or more.
18.11. Analysis.
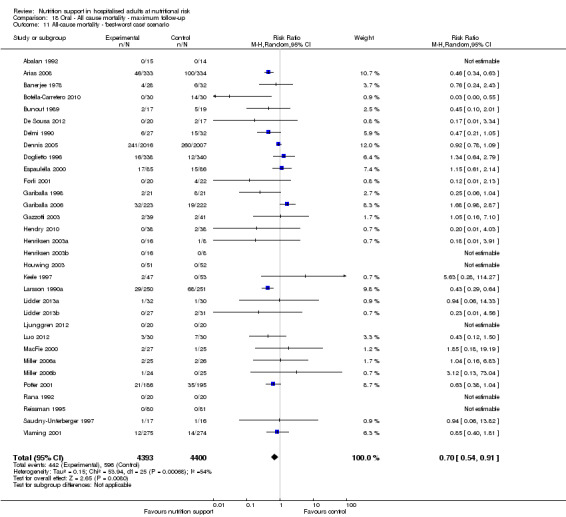
Comparison 18 Oral ‐ All cause mortality ‐ maximum follow‐up, Outcome 11 All‐cause mortality ‐ 'best‐worst case' scenario.
18.12. Analysis.
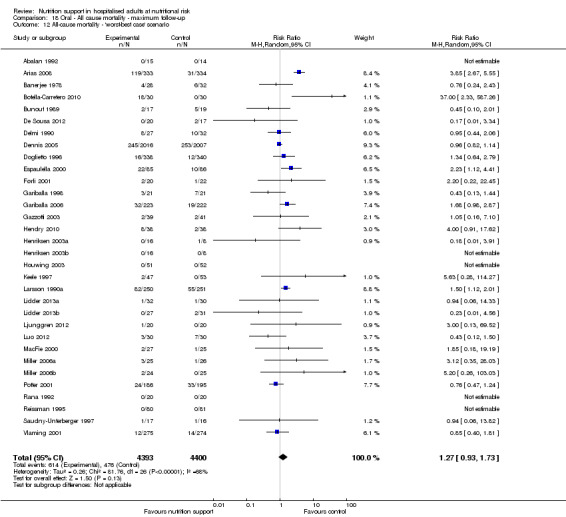
Comparison 18 Oral ‐ All cause mortality ‐ maximum follow‐up, Outcome 12 All‐cause mortality ‐ 'worst‐best case' scenario.
18.13. Analysis.
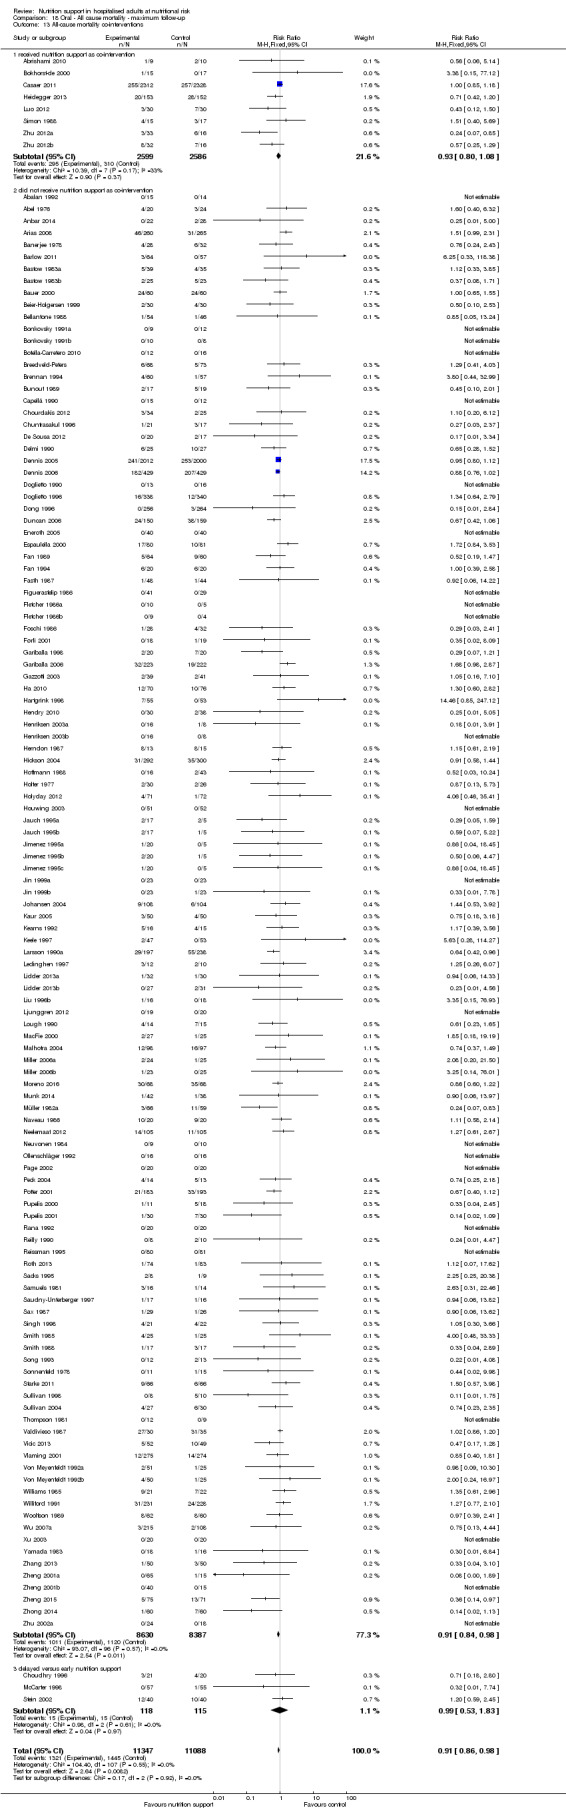
Comparison 18 Oral ‐ All cause mortality ‐ maximum follow‐up, Outcome 13 All‐cause mortality co‐interventions.
Comparison 19. Oral ‐ Serious adverse event end of intervention.
| Outcome or subgroup title | No. of studies | No. of participants | Statistical method | Effect size |
|---|---|---|---|---|
| 1 Serious adverse events ‐ overall | 33 | 8569 | Risk Ratio (M‐H, Random, 95% CI) | 0.92 [0.79, 1.06] |
| 2 Serious adverse events ‐ bias | 33 | 8569 | Risk Ratio (M‐H, Random, 95% CI) | 0.92 [0.79, 1.06] |
| 2.1 High risk of bias | 33 | 8569 | Risk Ratio (M‐H, Random, 95% CI) | 0.92 [0.79, 1.06] |
| 2.2 Low risk of bias | 0 | 0 | Risk Ratio (M‐H, Random, 95% CI) | 0.0 [0.0, 0.0] |
| 3 Serious adverse events ‐ by medical specialty | 33 | 8569 | Risk Ratio (M‐H, Random, 95% CI) | 0.92 [0.79, 1.06] |
| 3.1 Cardiology | 0 | 0 | Risk Ratio (M‐H, Random, 95% CI) | 0.0 [0.0, 0.0] |
| 3.2 Medical gastroenterology and hepatology | 1 | 36 | Risk Ratio (M‐H, Random, 95% CI) | 0.45 [0.10, 2.01] |
| 3.3 Geriatrics | 10 | 1609 | Risk Ratio (M‐H, Random, 95% CI) | 0.74 [0.56, 0.97] |
| 3.4 Pulmonary disease | 2 | 93 | Risk Ratio (M‐H, Random, 95% CI) | 0.49 [0.16, 1.54] |
| 3.5 Endocrinology | 0 | 0 | Risk Ratio (M‐H, Random, 95% CI) | 0.0 [0.0, 0.0] |
| 3.6 Infectious diseases | 0 | 0 | Risk Ratio (M‐H, Random, 95% CI) | 0.0 [0.0, 0.0] |
| 3.7 Rheumatology | 0 | 0 | Risk Ratio (M‐H, Random, 95% CI) | 0.0 [0.0, 0.0] |
| 3.8 Haematology | 0 | 0 | Risk Ratio (M‐H, Random, 95% CI) | 0.0 [0.0, 0.0] |
| 3.9 Nephrology | 0 | 0 | Risk Ratio (M‐H, Random, 95% CI) | 0.0 [0.0, 0.0] |
| 3.10 Gastroenterologic surgery | 10 | 1253 | Risk Ratio (M‐H, Random, 95% CI) | 0.91 [0.66, 1.25] |
| 3.11 Trauma surgery | 0 | 0 | Risk Ratio (M‐H, Random, 95% CI) | 0.0 [0.0, 0.0] |
| 3.12 Ortopaedics | 4 | 371 | Risk Ratio (M‐H, Random, 95% CI) | 1.69 [0.53, 5.36] |
| 3.13 Plastic, reconstructive, and aesthetic surgery | 0 | 0 | Risk Ratio (M‐H, Random, 95% CI) | 0.0 [0.0, 0.0] |
| 3.14 Vascular surgery | 0 | 0 | Risk Ratio (M‐H, Random, 95% CI) | 0.0 [0.0, 0.0] |
| 3.15 Transplant surgery | 1 | 37 | Risk Ratio (M‐H, Random, 95% CI) | 0.35 [0.02, 8.09] |
| 3.16 Urology | 0 | 0 | Risk Ratio (M‐H, Random, 95% CI) | 0.0 [0.0, 0.0] |
| 3.17 Thoracic surgery | 0 | 0 | Risk Ratio (M‐H, Random, 95% CI) | 0.0 [0.0, 0.0] |
| 3.18 Neurological surgery | 0 | 0 | Risk Ratio (M‐H, Random, 95% CI) | 0.0 [0.0, 0.0] |
| 3.19 Oro‐maxillo‐facial surgery | 0 | 0 | Risk Ratio (M‐H, Random, 95% CI) | 0.0 [0.0, 0.0] |
| 3.20 Anaesthesiology | 0 | 0 | Risk Ratio (M‐H, Random, 95% CI) | 0.0 [0.0, 0.0] |
| 3.21 Emergency medicine | 0 | 0 | Risk Ratio (M‐H, Random, 95% CI) | 0.0 [0.0, 0.0] |
| 3.22 Psychiatry | 0 | 0 | Risk Ratio (M‐H, Random, 95% CI) | 0.0 [0.0, 0.0] |
| 3.23 Neurology | 3 | 4092 | Risk Ratio (M‐H, Random, 95% CI) | 0.96 [0.74, 1.24] |
| 3.24 Oncology | 0 | 0 | Risk Ratio (M‐H, Random, 95% CI) | 0.0 [0.0, 0.0] |
| 3.25 Dermatology | 0 | 0 | Risk Ratio (M‐H, Random, 95% CI) | 0.0 [0.0, 0.0] |
| 3.26 Gynaecology | 0 | 0 | Risk Ratio (M‐H, Random, 95% CI) | 0.0 [0.0, 0.0] |
| 3.27 Mixed | 2 | 1078 | Risk Ratio (M‐H, Random, 95% CI) | 1.24 [0.73, 2.12] |
| 4 Serious adverse events ‐ based on adequacy of the amount of calories | 33 | 8569 | Risk Ratio (M‐H, Random, 95% CI) | 0.92 [0.79, 1.06] |
| 4.1 Clearly adequate in intervention and clearly inadequate in control | 4 | 246 | Risk Ratio (M‐H, Random, 95% CI) | 0.99 [0.33, 3.02] |
| 4.2 Inadequate in the experimental or adequate in the control | 13 | 5590 | Risk Ratio (M‐H, Random, 95% CI) | 0.91 [0.76, 1.10] |
| 4.3 Experimental group is overfed | 2 | 69 | Risk Ratio (M‐H, Random, 95% CI) | 0.53 [0.14, 1.98] |
| 4.4 Unclear intake in control or experimental | 14 | 2664 | Risk Ratio (M‐H, Random, 95% CI) | 0.92 [0.63, 1.34] |
| 5 Serious adverse events ‐ different screening tools | 33 | 8569 | Risk Ratio (M‐H, Random, 95% CI) | 0.92 [0.79, 1.06] |
| 5.1 NRS 2002 | 0 | 0 | Risk Ratio (M‐H, Random, 95% CI) | 0.0 [0.0, 0.0] |
| 5.2 MUST | 0 | 0 | Risk Ratio (M‐H, Random, 95% CI) | 0.0 [0.0, 0.0] |
| 5.3 MNA | 2 | 117 | Risk Ratio (M‐H, Random, 95% CI) | 0.61 [0.12, 3.18] |
| 5.4 SGA | 1 | 529 | Risk Ratio (M‐H, Random, 95% CI) | 1.51 [0.99, 2.31] |
| 5.5 Other means | 30 | 7923 | Risk Ratio (M‐H, Random, 95% CI) | 0.86 [0.74, 1.01] |
| 6 Serious adverse events ‐ participants characterised as 'at nutritional risk' due to one of the following conditions | 33 | 8569 | Risk Ratio (M‐H, Random, 95% CI) | 0.92 [0.79, 1.06] |
| 6.1 Major surgery | 10 | 612 | Risk Ratio (M‐H, Random, 95% CI) | 0.67 [0.22, 2.08] |
| 6.2 Stroke | 2 | 4063 | Risk Ratio (M‐H, Random, 95% CI) | 0.96 [0.74, 1.24] |
| 6.3 ICU participants including trauma | 0 | 0 | Risk Ratio (M‐H, Random, 95% CI) | 0.0 [0.0, 0.0] |
| 6.4 Frail elderly participants with less severe conditions known to increase protein requirements | 11 | 1063 | Risk Ratio (M‐H, Random, 95% CI) | 0.77 [0.52, 1.15] |
| 6.5 Participants do not fall into one of the categories above | 10 | 2831 | Risk Ratio (M‐H, Random, 95% CI) | 0.94 [0.70, 1.26] |
| 7 Serious adverse events ‐ participants characterised as 'at nutritional risk' due to one of the following criteria | 33 | 8569 | Risk Ratio (M‐H, Random, 95% CI) | 0.92 [0.79, 1.06] |
| 7.1 BMI less than 20.5 kg/m2 | 1 | 37 | Risk Ratio (M‐H, Random, 95% CI) | 0.35 [0.02, 8.09] |
| 7.2 Weight loss of at least 5% during the last three months | 0 | 0 | Risk Ratio (M‐H, Random, 95% CI) | 0.0 [0.0, 0.0] |
| 7.3 Weight loss of at least 10% during the last six months | 0 | 0 | Risk Ratio (M‐H, Random, 95% CI) | 0.0 [0.0, 0.0] |
| 7.4 Insufficient food intake during the last week (50% of requirements or less) | 0 | 0 | Risk Ratio (M‐H, Random, 95% CI) | 0.0 [0.0, 0.0] |
| 7.5 Participants characterised as 'at nutritional risk' by other means | 32 | 8532 | Risk Ratio (M‐H, Random, 95% CI) | 0.92 [0.79, 1.06] |
| 8 Serious adverse events ‐ participants characterised as 'at nutritional risk' due to biomarkers or anthropometrics | 33 | 8569 | Risk Ratio (M‐H, Random, 95% CI) | 0.92 [0.79, 1.06] |
| 8.1 Biomarkers | 1 | 60 | Risk Ratio (M‐H, Random, 95% CI) | 0.43 [0.12, 1.50] |
| 8.2 Anthropometric measures | 6 | 1111 | Risk Ratio (M‐H, Random, 95% CI) | 0.78 [0.52, 1.16] |
| 8.3 Mixed | 0 | 0 | Risk Ratio (M‐H, Random, 95% CI) | 0.0 [0.0, 0.0] |
| 8.4 Characterised by other means | 26 | 7398 | Risk Ratio (M‐H, Random, 95% CI) | 0.95 [0.81, 1.12] |
| 9 Serious adverse events ‐ randomisation year | 33 | 8569 | Risk Ratio (M‐H, Random, 95% CI) | 0.92 [0.79, 1.06] |
| 9.1 Before 1960 | 0 | 0 | Risk Ratio (M‐H, Random, 95% CI) | 0.0 [0.0, 0.0] |
| 9.2 1960 to 1979 | 1 | 60 | Risk Ratio (M‐H, Random, 95% CI) | 0.76 [0.24, 2.43] |
| 9.3 1980 to 1999 | 18 | 6988 | Risk Ratio (M‐H, Random, 95% CI) | 0.86 [0.73, 1.01] |
| 9.4 After 1999 | 14 | 1521 | Risk Ratio (M‐H, Random, 95% CI) | 1.05 [0.61, 1.82] |
| 10 Serious adverse events ‐ trials where the intervention lasts fewer than three days compared with trials where the intervention lasts three days or more | 33 | 8569 | Risk Ratio (M‐H, Random, 95% CI) | 0.92 [0.79, 1.06] |
| 10.1 Three days or more | 31 | 8480 | Risk Ratio (M‐H, Random, 95% CI) | 0.92 [0.80, 1.06] |
| 10.2 Less than three days | 1 | 39 | Risk Ratio (M‐H, Random, 95% CI) | 0.0 [0.0, 0.0] |
| 10.3 Unknown | 1 | 50 | Risk Ratio (M‐H, Random, 95% CI) | 0.25 [0.01, 5.00] |
| 11 Serious adverse events ‐ 'best‐worst case' scenario | 33 | 8844 | Risk Ratio (M‐H, Random, 95% CI) | 0.67 [0.52, 0.86] |
| 12 Serious adverse events ‐ 'worst‐best case' scenario | 33 | 8844 | Risk Ratio (M‐H, Random, 95% CI) | 1.27 [0.92, 1.75] |
| 13 Serious adverse events co‐interventions | 134 | 21960 | Risk Ratio (M‐H, Fixed, 95% CI) | 0.91 [0.84, 0.99] |
| 13.1 received nutrition support as co‐intervention | 8 | 5178 | Risk Ratio (M‐H, Fixed, 95% CI) | 0.96 [0.79, 1.17] |
| 13.2 did not receive nutrition support as co‐intervention | 119 | 16359 | Risk Ratio (M‐H, Fixed, 95% CI) | 0.90 [0.83, 0.99] |
| 13.3 delayed versus early nutrition support | 7 | 423 | Risk Ratio (M‐H, Fixed, 95% CI) | 0.89 [0.51, 1.57] |
19.1. Analysis.

Comparison 19 Oral ‐ Serious adverse event end of intervention, Outcome 1 Serious adverse events ‐ overall.
19.2. Analysis.
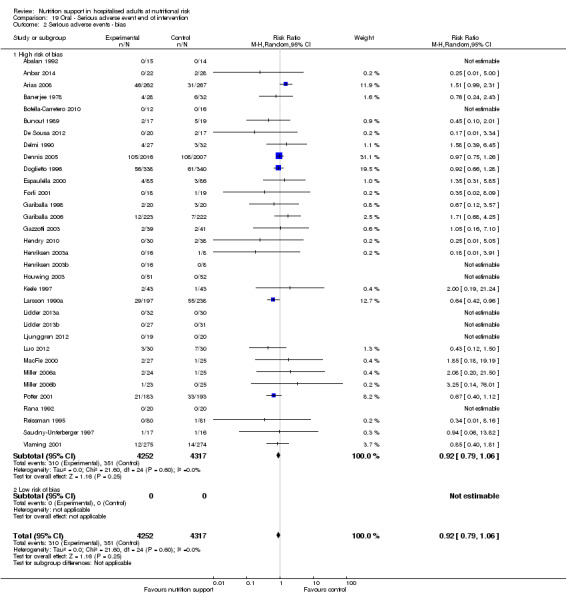
Comparison 19 Oral ‐ Serious adverse event end of intervention, Outcome 2 Serious adverse events ‐ bias.
19.3. Analysis.
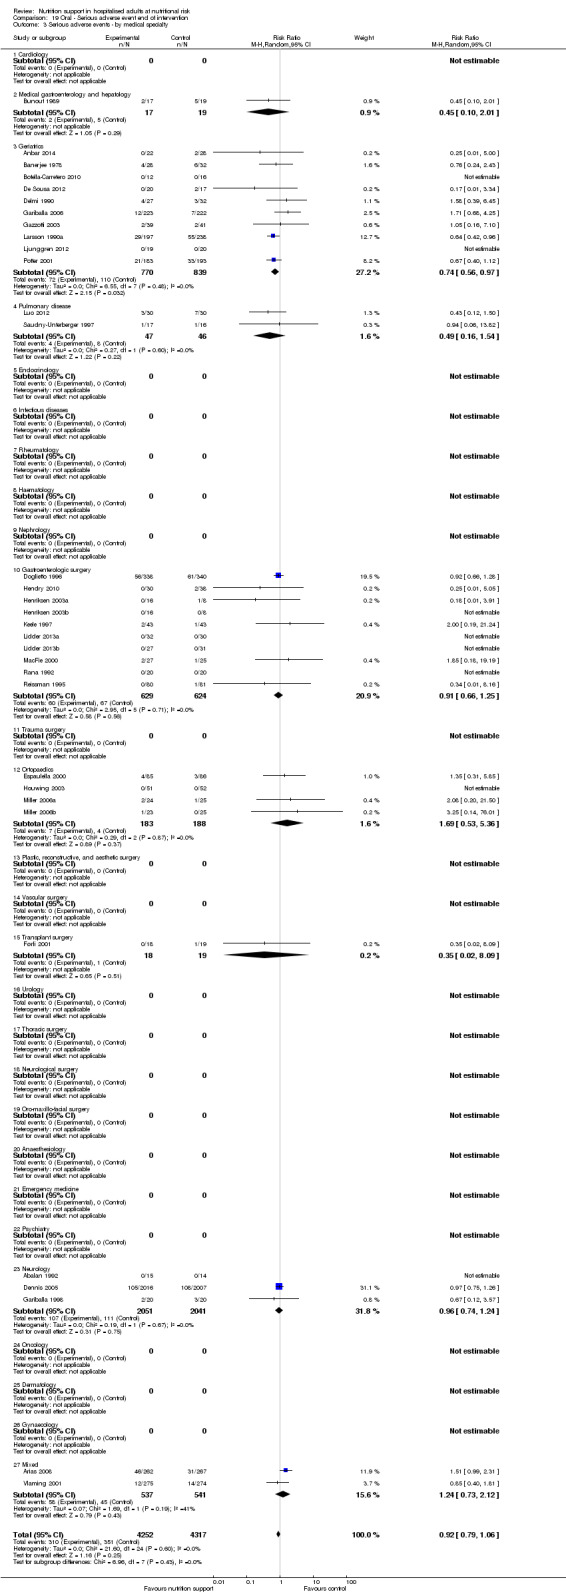
Comparison 19 Oral ‐ Serious adverse event end of intervention, Outcome 3 Serious adverse events ‐ by medical specialty.
19.4. Analysis.
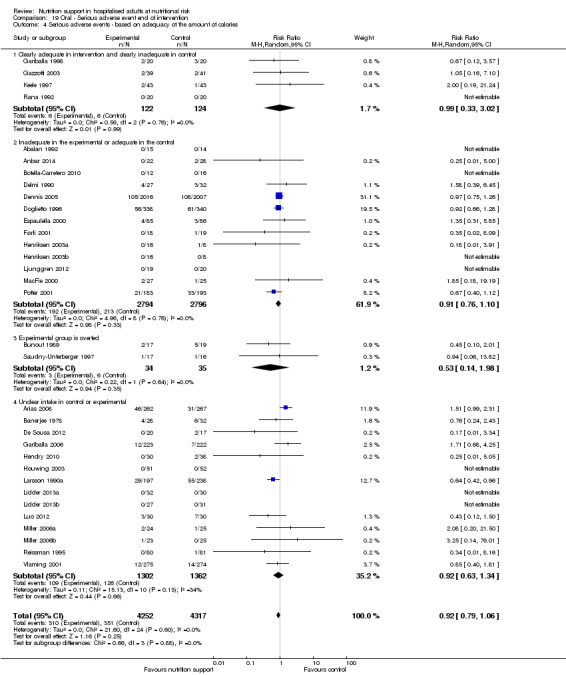
Comparison 19 Oral ‐ Serious adverse event end of intervention, Outcome 4 Serious adverse events ‐ based on adequacy of the amount of calories.
19.5. Analysis.
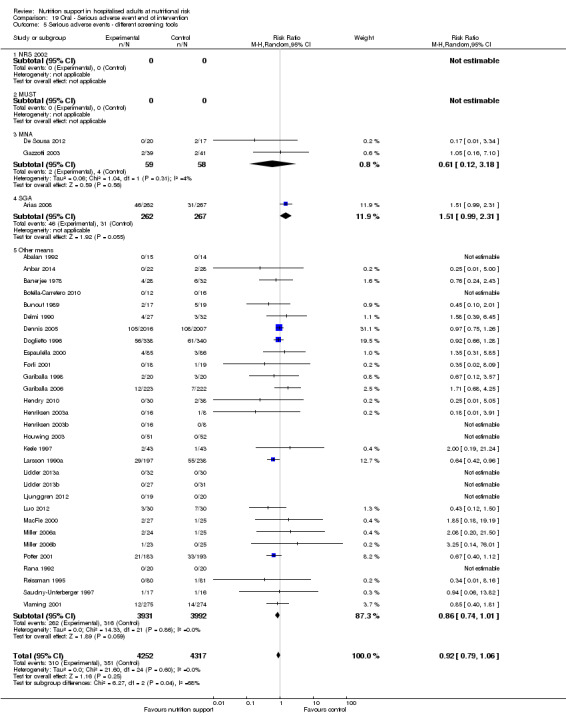
Comparison 19 Oral ‐ Serious adverse event end of intervention, Outcome 5 Serious adverse events ‐ different screening tools.
19.6. Analysis.
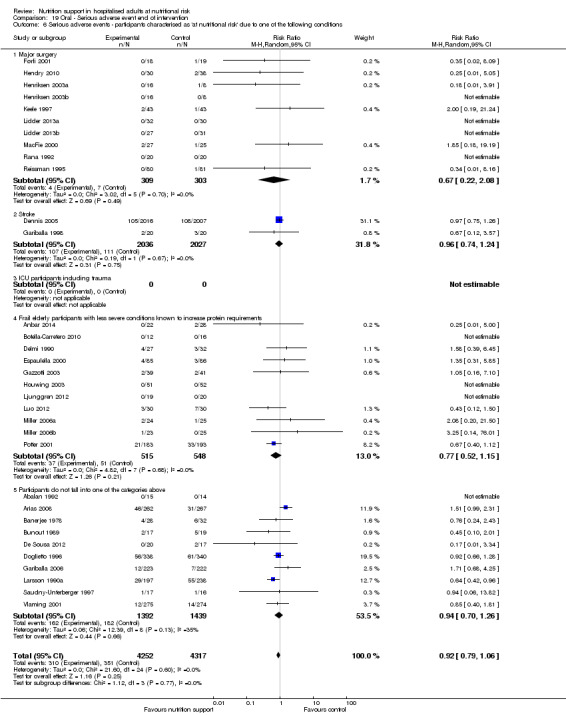
Comparison 19 Oral ‐ Serious adverse event end of intervention, Outcome 6 Serious adverse events ‐ participants characterised as 'at nutritional risk' due to one of the following conditions.
19.7. Analysis.
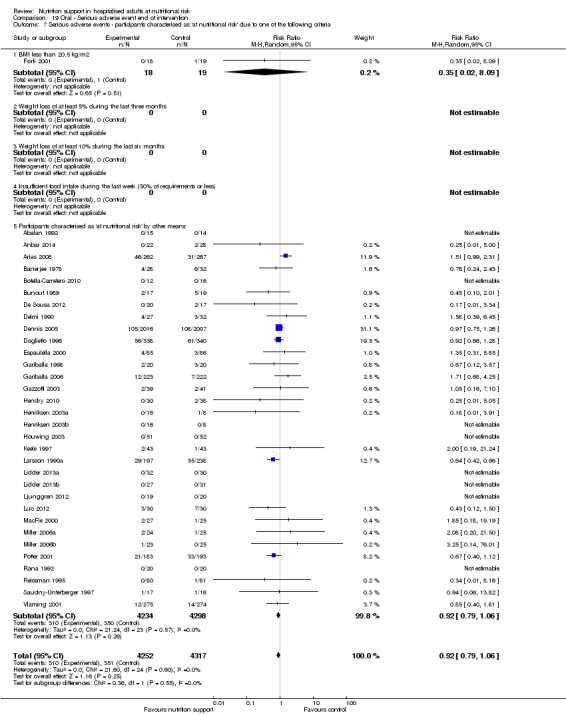
Comparison 19 Oral ‐ Serious adverse event end of intervention, Outcome 7 Serious adverse events ‐ participants characterised as 'at nutritional risk' due to one of the following criteria.
19.8. Analysis.
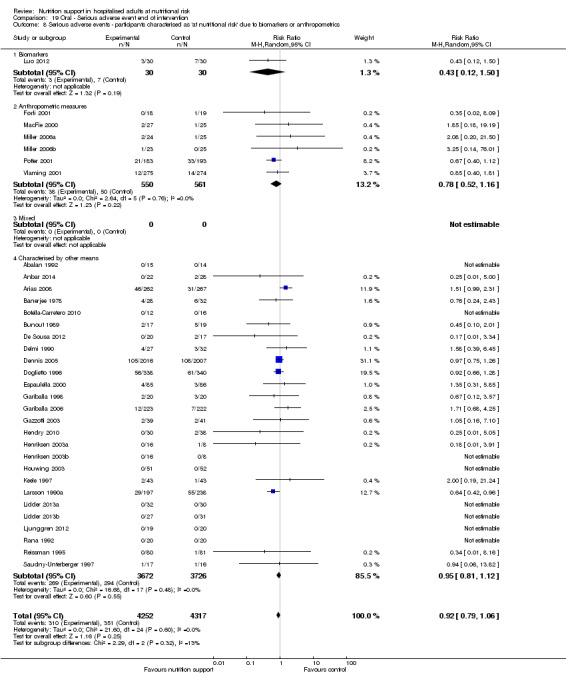
Comparison 19 Oral ‐ Serious adverse event end of intervention, Outcome 8 Serious adverse events ‐ participants characterised as 'at nutritional risk' due to biomarkers or anthropometrics.
19.9. Analysis.
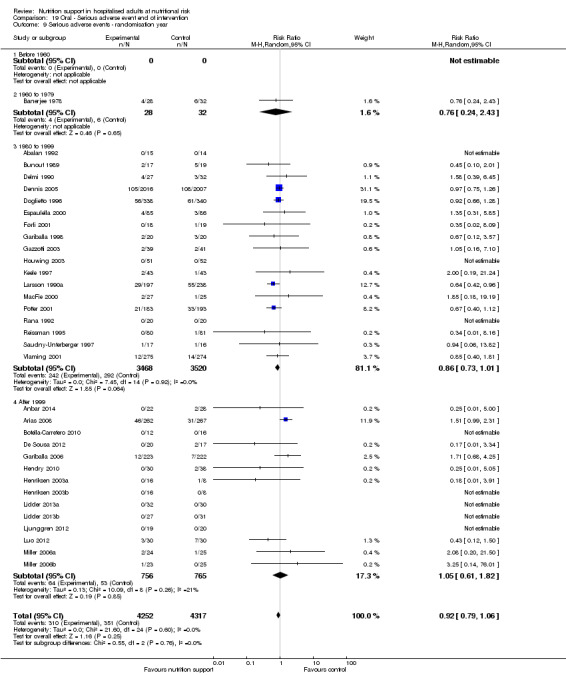
Comparison 19 Oral ‐ Serious adverse event end of intervention, Outcome 9 Serious adverse events ‐ randomisation year.
19.10. Analysis.
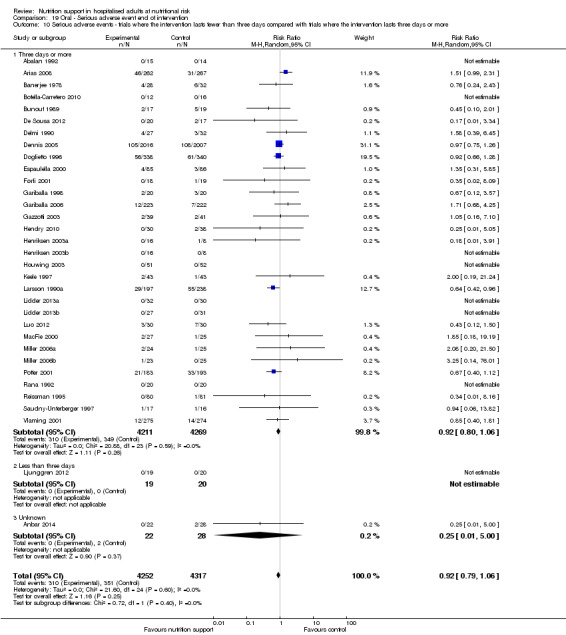
Comparison 19 Oral ‐ Serious adverse event end of intervention, Outcome 10 Serious adverse events ‐ trials where the intervention lasts fewer than three days compared with trials where the intervention lasts three days or more.
19.11. Analysis.
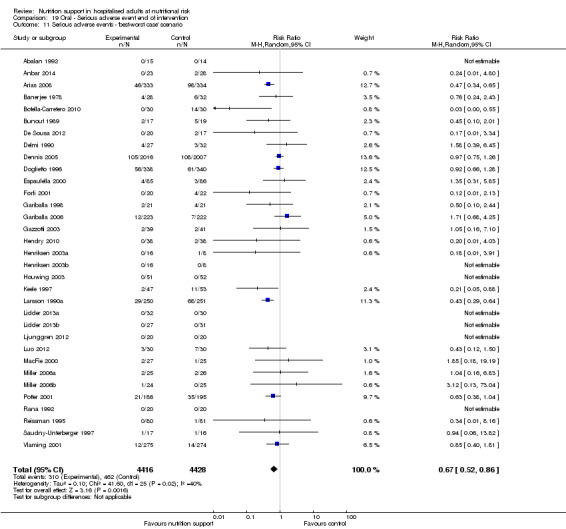
Comparison 19 Oral ‐ Serious adverse event end of intervention, Outcome 11 Serious adverse events ‐ 'best‐worst case' scenario.
19.12. Analysis.
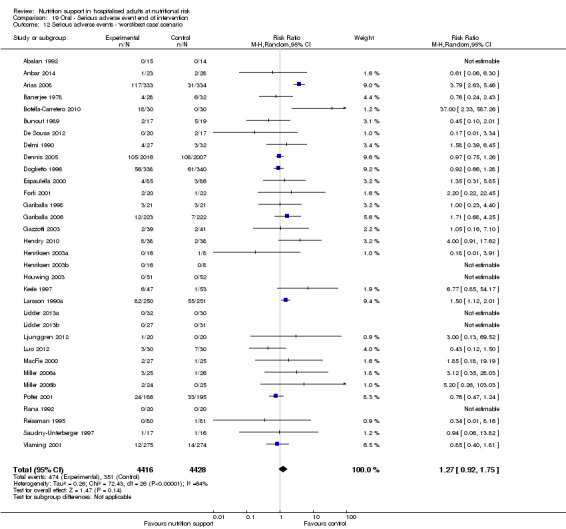
Comparison 19 Oral ‐ Serious adverse event end of intervention, Outcome 12 Serious adverse events ‐ 'worst‐best case' scenario.
19.13. Analysis.
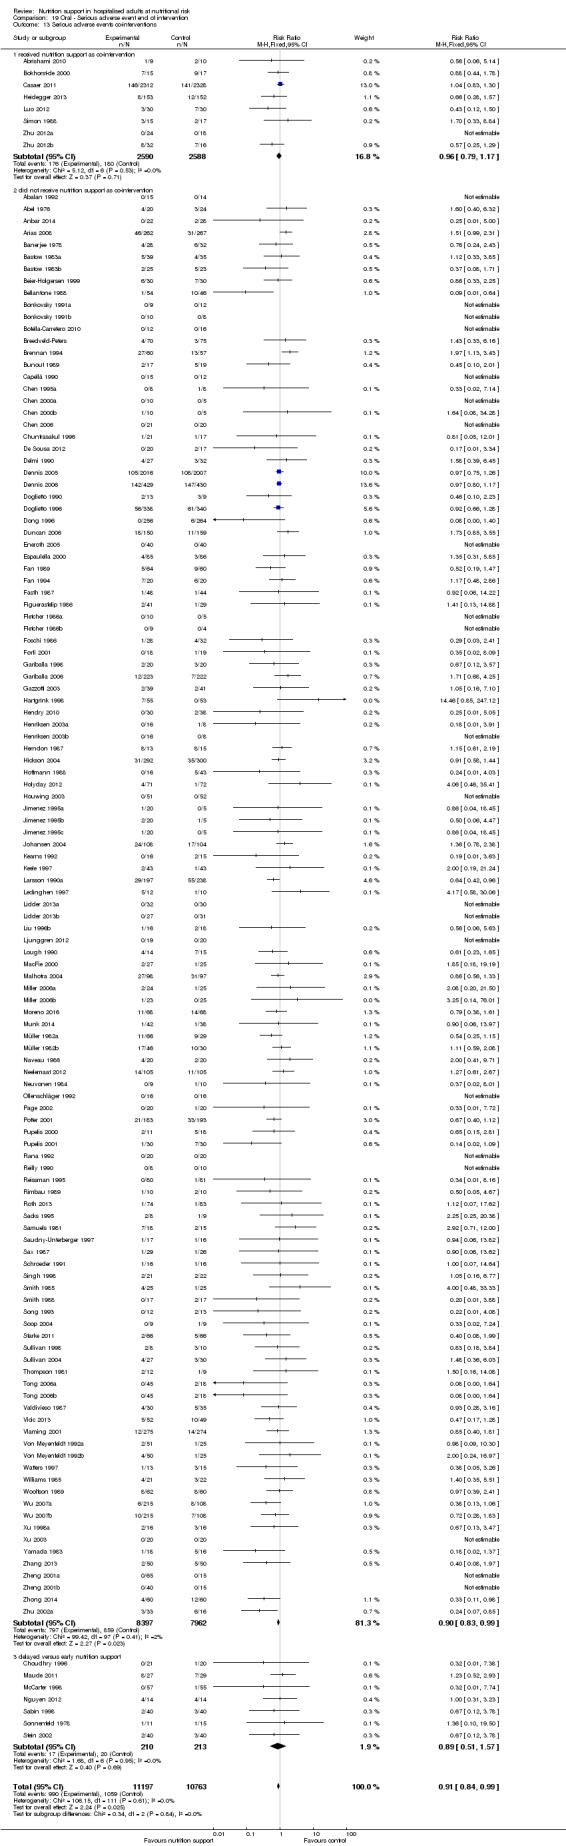
Comparison 19 Oral ‐ Serious adverse event end of intervention, Outcome 13 Serious adverse events co‐interventions.
Comparison 20. Oral ‐ Serious adverse event maximum follow‐up.
| Outcome or subgroup title | No. of studies | No. of participants | Statistical method | Effect size |
|---|---|---|---|---|
| 1 Serious adverse events ‐ overall | 33 | 8541 | Risk Ratio (M‐H, Random, 95% CI) | 0.89 [0.74, 1.07] |
| 2 Serious adverse events ‐ bias | 33 | 8541 | Risk Ratio (M‐H, Random, 95% CI) | 0.89 [0.74, 1.07] |
| 2.1 High risk of bias | 33 | 8541 | Risk Ratio (M‐H, Random, 95% CI) | 0.89 [0.74, 1.07] |
| 2.2 Low risk of bias | 0 | 0 | Risk Ratio (M‐H, Random, 95% CI) | 0.0 [0.0, 0.0] |
| 3 Serious adverse events ‐ by medical speciality | 33 | 8541 | Risk Ratio (M‐H, Random, 95% CI) | 0.89 [0.74, 1.07] |
| 3.1 Cardiology | 0 | 0 | Risk Ratio (M‐H, Random, 95% CI) | 0.0 [0.0, 0.0] |
| 3.2 Medical gastroenterology and hepatology | 1 | 36 | Risk Ratio (M‐H, Random, 95% CI) | 0.45 [0.10, 2.01] |
| 3.3 Geriatrics | 10 | 1602 | Risk Ratio (M‐H, Random, 95% CI) | 0.80 [0.55, 1.15] |
| 3.4 Pulmonary disease | 2 | 93 | Risk Ratio (M‐H, Random, 95% CI) | 0.49 [0.16, 1.54] |
| 3.5 Endocrinology | 0 | 0 | Risk Ratio (M‐H, Random, 95% CI) | 0.0 [0.0, 0.0] |
| 3.6 Infectious diseases | 0 | 0 | Risk Ratio (M‐H, Random, 95% CI) | 0.0 [0.0, 0.0] |
| 3.7 Rheumatology | 0 | 0 | Risk Ratio (M‐H, Random, 95% CI) | 0.0 [0.0, 0.0] |
| 3.8 Haematology | 0 | 0 | Risk Ratio (M‐H, Random, 95% CI) | 0.0 [0.0, 0.0] |
| 3.9 Nephrology | 0 | 0 | Risk Ratio (M‐H, Random, 95% CI) | 0.0 [0.0, 0.0] |
| 3.10 Gastroenterologic surgery | 10 | 1253 | Risk Ratio (M‐H, Random, 95% CI) | 0.83 [0.61, 1.12] |
| 3.11 Trauma surgery | 0 | 0 | Risk Ratio (M‐H, Random, 95% CI) | 0.0 [0.0, 0.0] |
| 3.12 Ortopaedics | 4 | 361 | Risk Ratio (M‐H, Random, 95% CI) | 1.80 [0.92, 3.52] |
| 3.13 Plastic, reconstructive, and aesthetic surgery | 0 | 0 | Risk Ratio (M‐H, Random, 95% CI) | 0.0 [0.0, 0.0] |
| 3.14 Vascular surgery | 0 | 0 | Risk Ratio (M‐H, Random, 95% CI) | 0.0 [0.0, 0.0] |
| 3.15 Transplant surgery | 1 | 37 | Risk Ratio (M‐H, Random, 95% CI) | 0.35 [0.02, 8.09] |
| 3.16 Urology | 0 | 0 | Risk Ratio (M‐H, Random, 95% CI) | 0.0 [0.0, 0.0] |
| 3.17 Thoracic surgery | 0 | 0 | Risk Ratio (M‐H, Random, 95% CI) | 0.0 [0.0, 0.0] |
| 3.18 Neurological surgery | 0 | 0 | Risk Ratio (M‐H, Random, 95% CI) | 0.0 [0.0, 0.0] |
| 3.19 Oro‐maxillo‐facial surgery | 0 | 0 | Risk Ratio (M‐H, Random, 95% CI) | 0.0 [0.0, 0.0] |
| 3.20 Anaesthesiology | 0 | 0 | Risk Ratio (M‐H, Random, 95% CI) | 0.0 [0.0, 0.0] |
| 3.21 Emergency medicine | 0 | 0 | Risk Ratio (M‐H, Random, 95% CI) | 0.0 [0.0, 0.0] |
| 3.22 Psychiatry | 0 | 0 | Risk Ratio (M‐H, Random, 95% CI) | 0.0 [0.0, 0.0] |
| 3.23 Neurology | 3 | 4081 | Risk Ratio (M‐H, Random, 95% CI) | 0.65 [0.22, 1.93] |
| 3.24 Oncology | 0 | 0 | Risk Ratio (M‐H, Random, 95% CI) | 0.0 [0.0, 0.0] |
| 3.25 Dermatology | 0 | 0 | Risk Ratio (M‐H, Random, 95% CI) | 0.0 [0.0, 0.0] |
| 3.26 Gynaecology | 0 | 0 | Risk Ratio (M‐H, Random, 95% CI) | 0.0 [0.0, 0.0] |
| 3.27 Mixed | 2 | 1078 | Risk Ratio (M‐H, Random, 95% CI) | 1.24 [0.73, 2.12] |
| 4 Serious adverse events ‐ based on adequacy of the amount of calories | 33 | 8541 | Risk Ratio (M‐H, Random, 95% CI) | 0.89 [0.74, 1.07] |
| 4.1 Clearly adequate in intervention and clearly inadequate in control | 4 | 246 | Risk Ratio (M‐H, Random, 95% CI) | 0.64 [0.20, 2.00] |
| 4.2 Inadequate in the experimental or adequate in the control | 13 | 5562 | Risk Ratio (M‐H, Random, 95% CI) | 0.93 [0.81, 1.06] |
| 4.3 Experimental group is overfed | 2 | 69 | Risk Ratio (M‐H, Random, 95% CI) | 0.53 [0.14, 1.98] |
| 4.4 Unclear intake in control or experimental | 14 | 2664 | Risk Ratio (M‐H, Random, 95% CI) | 0.83 [0.56, 1.23] |
| 5 Serious adverse events ‐ different screening tools | 33 | 8541 | Risk Ratio (M‐H, Random, 95% CI) | 0.89 [0.74, 1.07] |
| 5.1 NRS 2002 | 0 | 0 | Risk Ratio (M‐H, Random, 95% CI) | 0.0 [0.0, 0.0] |
| 5.2 MUST | 0 | 0 | Risk Ratio (M‐H, Random, 95% CI) | 0.0 [0.0, 0.0] |
| 5.3 MNA | 2 | 117 | Risk Ratio (M‐H, Random, 95% CI) | 0.61 [0.12, 3.18] |
| 5.4 SGA | 0 | 0 | Risk Ratio (M‐H, Random, 95% CI) | 0.0 [0.0, 0.0] |
| 5.5 Other means | 31 | 8424 | Risk Ratio (M‐H, Random, 95% CI) | 0.89 [0.74, 1.08] |
| 6 Serious adverse events ‐ participants characterised as 'at nutritional risk' due to one of the following conditions | 33 | 8541 | Risk Ratio (M‐H, Random, 95% CI) | 0.89 [0.74, 1.07] |
| 6.1 Major surgery | 11 | 1290 | Risk Ratio (M‐H, Random, 95% CI) | 0.82 [0.61, 1.11] |
| 6.2 Stroke | 2 | 4052 | Risk Ratio (M‐H, Random, 95% CI) | 0.65 [0.22, 1.93] |
| 6.3 ICU participants including trauma | 0 | 0 | Risk Ratio (M‐H, Random, 95% CI) | 0.0 [0.0, 0.0] |
| 6.4 Frail elderly participants with less severe conditions known to increase protein requirements | 11 | 1046 | Risk Ratio (M‐H, Random, 95% CI) | 0.85 [0.57, 1.27] |
| 6.5 Participants do not fall into one of the categories above | 9 | 2153 | Risk Ratio (M‐H, Random, 95% CI) | 0.96 [0.64, 1.46] |
| 7 Serious adverse events ‐ participants characterised as 'at nutritional risk' due to one of the following criteria | 33 | 8541 | Risk Ratio (M‐H, Random, 95% CI) | 0.89 [0.74, 1.07] |
| 7.1 BMI less than 20.5 kg/m2 | 1 | 37 | Risk Ratio (M‐H, Random, 95% CI) | 0.35 [0.02, 8.09] |
| 7.2 Weight loss of at least 5% during the last three months | 0 | 0 | Risk Ratio (M‐H, Random, 95% CI) | 0.0 [0.0, 0.0] |
| 7.3 Weight loss of at least 10% during the last six months | 0 | 0 | Risk Ratio (M‐H, Random, 95% CI) | 0.0 [0.0, 0.0] |
| 7.4 Insufficient food intake during the last week (50% of requirements or less) | 0 | 0 | Risk Ratio (M‐H, Random, 95% CI) | 0.0 [0.0, 0.0] |
| 7.5 Participants characterised as 'at nutritional risk' by other means | 32 | 8504 | Risk Ratio (M‐H, Random, 95% CI) | 0.89 [0.74, 1.07] |
| 8 Serious adverse events ‐ participants characterised as 'at nutritional risk' due to biomarkers or anthropometrics | 33 | 8541 | Risk Ratio (M‐H, Random, 95% CI) | 0.89 [0.74, 1.07] |
| 8.1 Biomarkers | 1 | 60 | Risk Ratio (M‐H, Random, 95% CI) | 0.43 [0.12, 1.50] |
| 8.2 Anthropometric measures | 6 | 1111 | Risk Ratio (M‐H, Random, 95% CI) | 0.78 [0.52, 1.16] |
| 8.3 Both | 0 | 0 | Risk Ratio (M‐H, Random, 95% CI) | 0.0 [0.0, 0.0] |
| 8.4 Characterised by other means | 26 | 7370 | Risk Ratio (M‐H, Random, 95% CI) | 0.91 [0.72, 1.13] |
| 9 Serious adverse events ‐ randomisation year | 33 | 8541 | Risk Ratio (M‐H, Random, 95% CI) | 0.89 [0.74, 1.07] |
| 9.1 Before 1960 | 0 | 0 | Risk Ratio (M‐H, Random, 95% CI) | 0.0 [0.0, 0.0] |
| 9.2 1960 to 1979 | 1 | 60 | Risk Ratio (M‐H, Random, 95% CI) | 0.76 [0.24, 2.43] |
| 9.3 1980 to 1999 | 18 | 6960 | Risk Ratio (M‐H, Random, 95% CI) | 0.88 [0.78, 1.00] |
| 9.4 After 1999 | 14 | 1521 | Risk Ratio (M‐H, Random, 95% CI) | 0.79 [0.45, 1.39] |
| 10 Serious adverse events ‐ trials where the intervention lasts fewer than three days compared with trials where the intervention lasts three days or more | 32 | 8501 | Risk Ratio (M‐H, Random, 95% CI) | 0.89 [0.74, 1.07] |
| 10.1 Three days or more | 30 | 8412 | Risk Ratio (M‐H, Random, 95% CI) | 0.89 [0.74, 1.07] |
| 10.2 Less than three days | 1 | 39 | Risk Ratio (M‐H, Random, 95% CI) | 0.0 [0.0, 0.0] |
| 10.3 Unknown | 1 | 50 | Risk Ratio (M‐H, Random, 95% CI) | 0.25 [0.01, 5.00] |
| 11 Serious adverse events ‐ 'best‐worst case' scenario | 33 | 8844 | Risk Ratio (M‐H, Random, 95% CI) | 0.64 [0.50, 0.81] |
| 12 Serious adverse events ‐ 'worst‐best case' scenario | 33 | 8844 | Risk Ratio (M‐H, Random, 95% CI) | 1.15 [0.86, 1.55] |
| 13 Serious adverse events co‐interventions | 33 | 8541 | Risk Ratio (M‐H, Fixed, 95% CI) | 0.92 [0.82, 1.03] |
| 13.1 Received nutrition support as co‐intervention | 1 | 60 | Risk Ratio (M‐H, Fixed, 95% CI) | 0.43 [0.12, 1.50] |
| 13.2 did not receive nutrition support as co‐intervention | 32 | 8481 | Risk Ratio (M‐H, Fixed, 95% CI) | 0.92 [0.82, 1.04] |
| 13.3 delayed versus early nutrition support | 0 | 0 | Risk Ratio (M‐H, Fixed, 95% CI) | 0.0 [0.0, 0.0] |
20.1. Analysis.
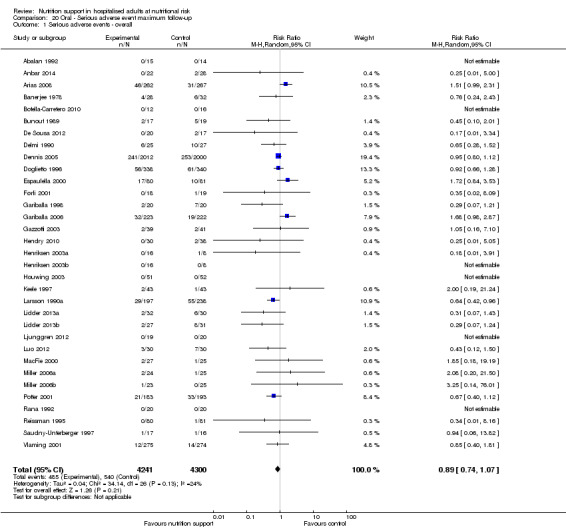
Comparison 20 Oral ‐ Serious adverse event maximum follow‐up, Outcome 1 Serious adverse events ‐ overall.
20.2. Analysis.
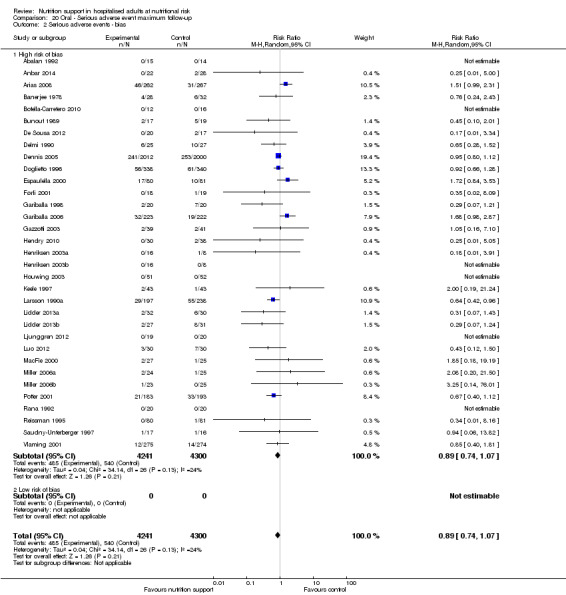
Comparison 20 Oral ‐ Serious adverse event maximum follow‐up, Outcome 2 Serious adverse events ‐ bias.
20.3. Analysis.
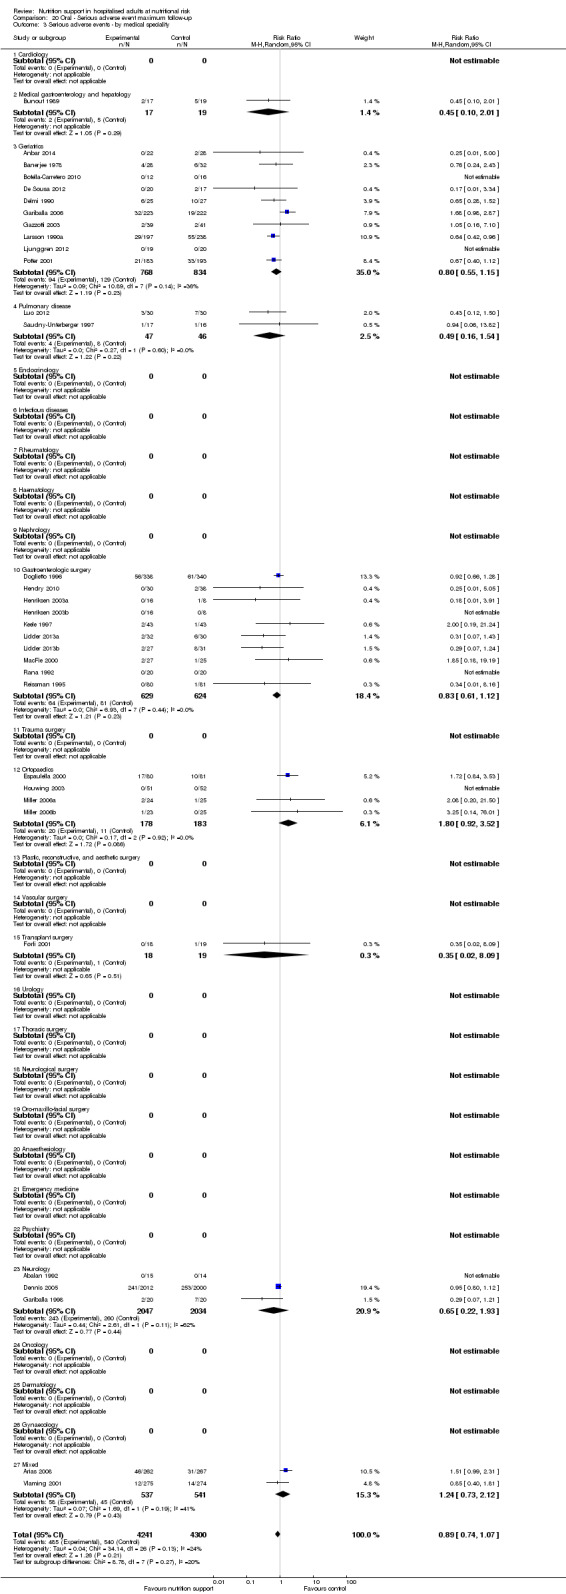
Comparison 20 Oral ‐ Serious adverse event maximum follow‐up, Outcome 3 Serious adverse events ‐ by medical speciality.
20.4. Analysis.
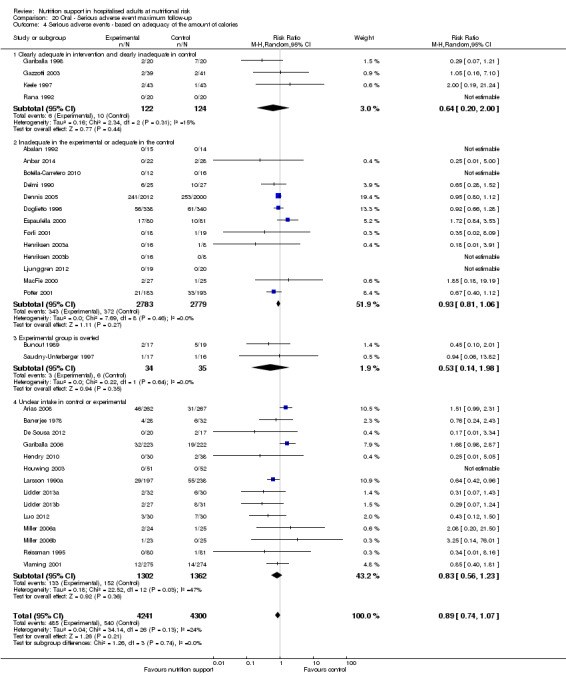
Comparison 20 Oral ‐ Serious adverse event maximum follow‐up, Outcome 4 Serious adverse events ‐ based on adequacy of the amount of calories.
20.5. Analysis.
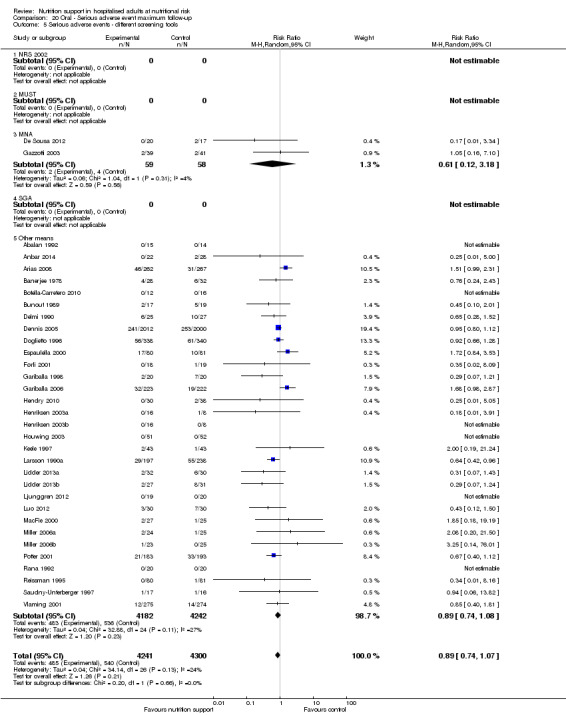
Comparison 20 Oral ‐ Serious adverse event maximum follow‐up, Outcome 5 Serious adverse events ‐ different screening tools.
20.6. Analysis.
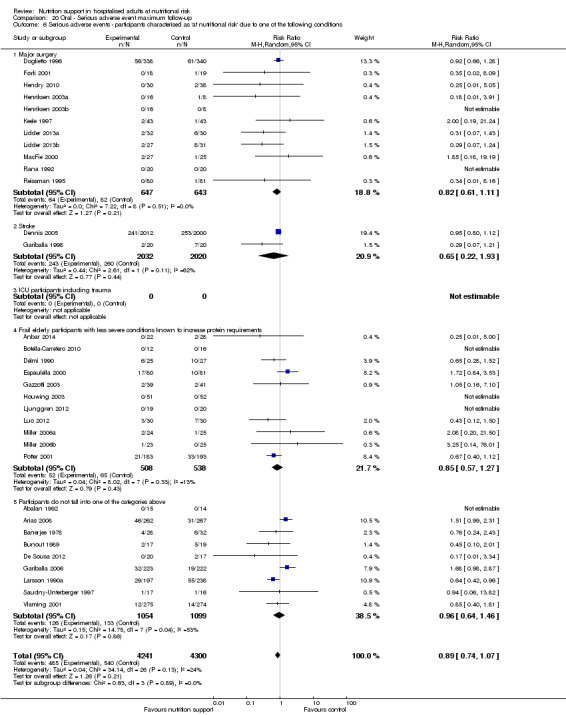
Comparison 20 Oral ‐ Serious adverse event maximum follow‐up, Outcome 6 Serious adverse events ‐ participants characterised as 'at nutritional risk' due to one of the following conditions.
20.7. Analysis.
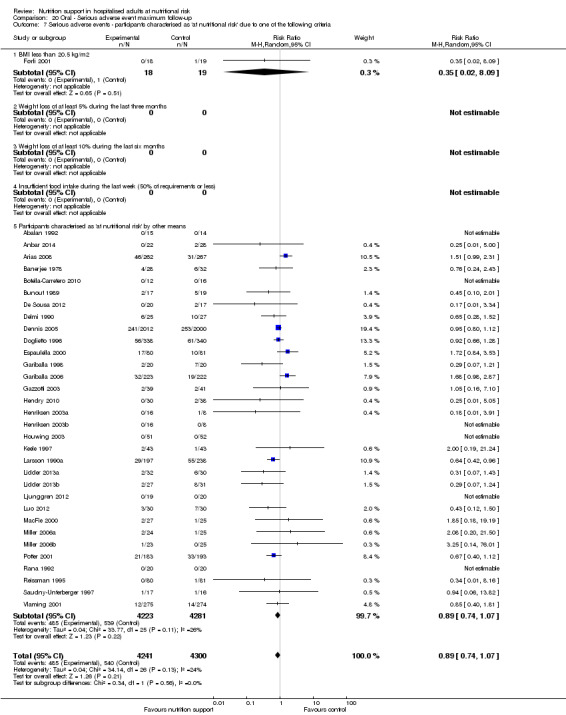
Comparison 20 Oral ‐ Serious adverse event maximum follow‐up, Outcome 7 Serious adverse events ‐ participants characterised as 'at nutritional risk' due to one of the following criteria.
20.8. Analysis.
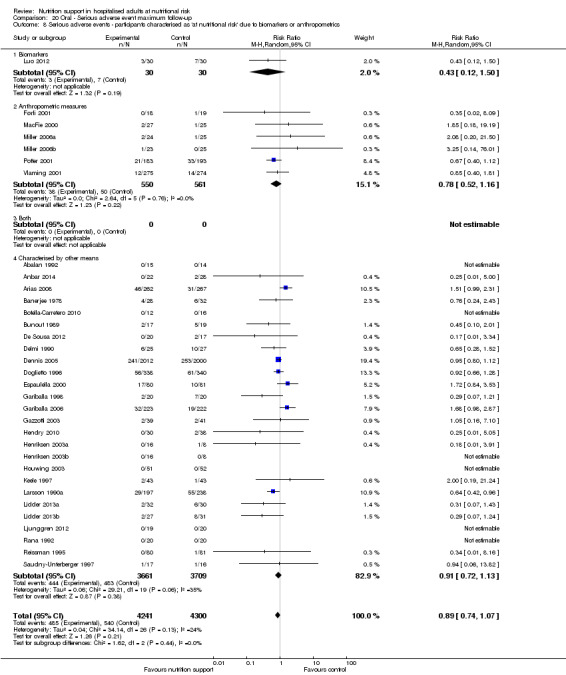
Comparison 20 Oral ‐ Serious adverse event maximum follow‐up, Outcome 8 Serious adverse events ‐ participants characterised as 'at nutritional risk' due to biomarkers or anthropometrics.
20.9. Analysis.
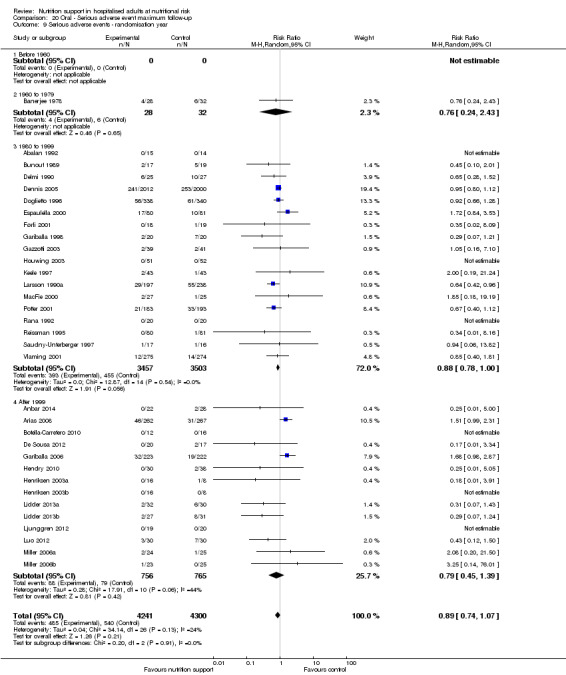
Comparison 20 Oral ‐ Serious adverse event maximum follow‐up, Outcome 9 Serious adverse events ‐ randomisation year.
20.10. Analysis.
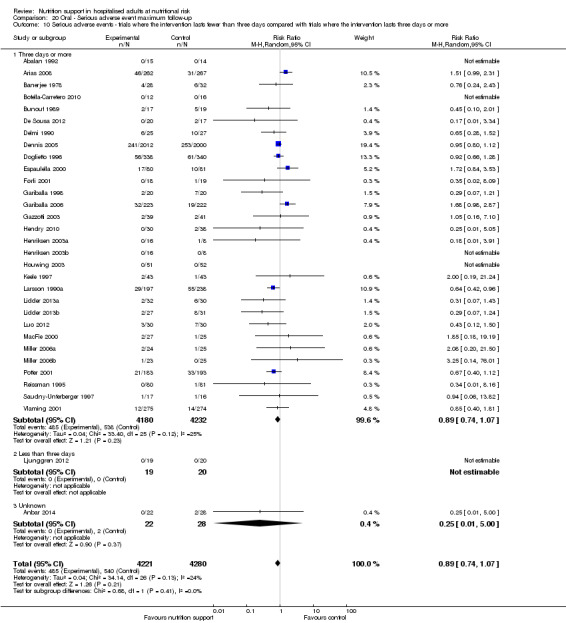
Comparison 20 Oral ‐ Serious adverse event maximum follow‐up, Outcome 10 Serious adverse events ‐ trials where the intervention lasts fewer than three days compared with trials where the intervention lasts three days or more.
20.11. Analysis.
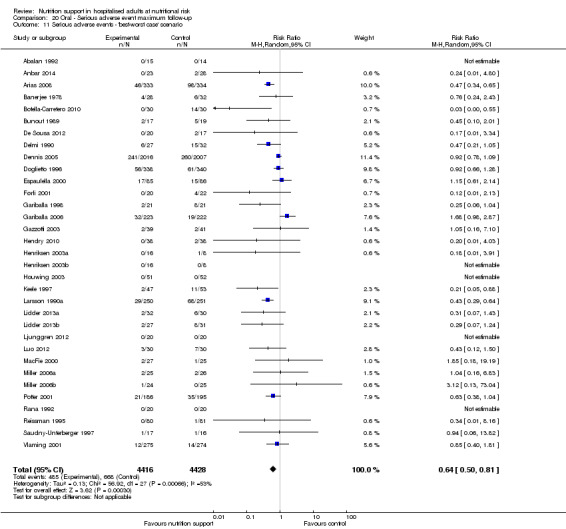
Comparison 20 Oral ‐ Serious adverse event maximum follow‐up, Outcome 11 Serious adverse events ‐ 'best‐worst case' scenario.
20.12. Analysis.
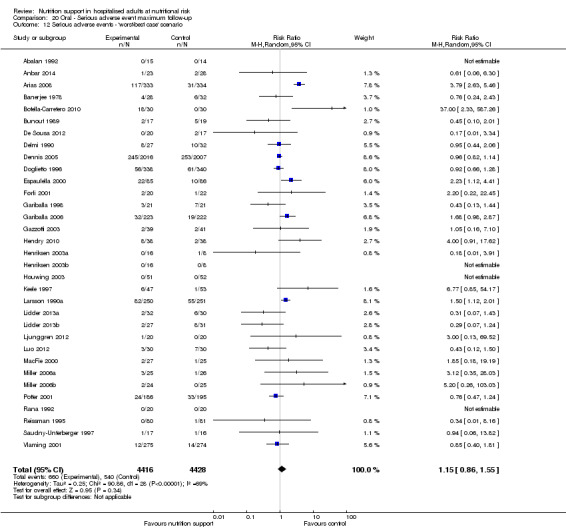
Comparison 20 Oral ‐ Serious adverse event maximum follow‐up, Outcome 12 Serious adverse events ‐ 'worst‐best case' scenario.
20.13. Analysis.
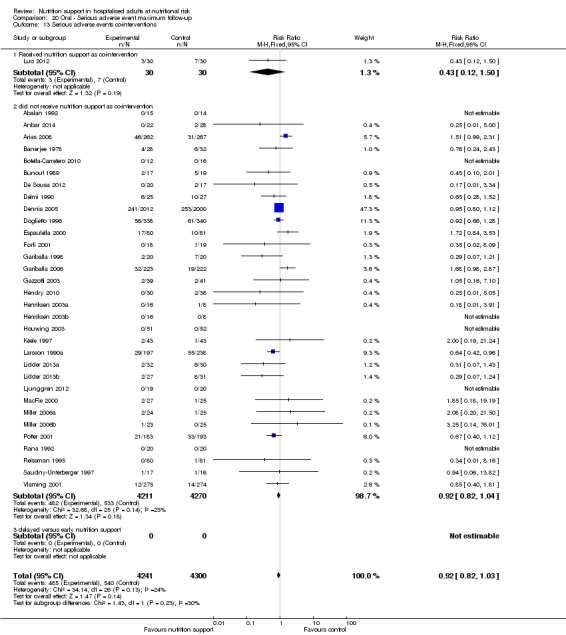
Comparison 20 Oral ‐ Serious adverse event maximum follow‐up, Outcome 13 Serious adverse events co‐interventions.
Comparison 21. Enteral ‐ All cause mortality ‐ end of intervention.
| Outcome or subgroup title | No. of studies | No. of participants | Statistical method | Effect size |
|---|---|---|---|---|
| 1 All‐cause mortality ‐ overall | 36 | 3722 | Risk Ratio (M‐H, Random, 95% CI) | 0.88 [0.75, 1.03] |
| 2 All‐cause mortality ‐ bias | 36 | 3722 | Risk Ratio (M‐H, Random, 95% CI) | 0.88 [0.75, 1.03] |
| 2.1 High risk of bias | 36 | 3722 | Risk Ratio (M‐H, Random, 95% CI) | 0.88 [0.75, 1.03] |
| 2.2 Low risk of bias | 0 | 0 | Risk Ratio (M‐H, Random, 95% CI) | 0.0 [0.0, 0.0] |
| 3 All‐cause mortality ‐ medical speciality | 36 | 3722 | Risk Ratio (M‐H, Random, 95% CI) | 0.88 [0.75, 1.03] |
| 3.1 Cardiology | 0 | 0 | Risk Ratio (M‐H, Random, 95% CI) | 0.0 [0.0, 0.0] |
| 3.2 Medical gastroenterology and hepatology | 4 | 289 | Risk Ratio (M‐H, Random, 95% CI) | 0.75 [0.40, 1.42] |
| 3.3 Geriatrics | 0 | 0 | Risk Ratio (M‐H, Random, 95% CI) | 0.0 [0.0, 0.0] |
| 3.4 Pulmonary disease | 0 | 0 | Risk Ratio (M‐H, Random, 95% CI) | 0.0 [0.0, 0.0] |
| 3.5 Endocrinology | 0 | 0 | Risk Ratio (M‐H, Random, 95% CI) | 0.0 [0.0, 0.0] |
| 3.6 Infectious diseases | 1 | 56 | Risk Ratio (M‐H, Random, 95% CI) | 1.61 [0.66, 3.92] |
| 3.7 Rheumatology | 0 | 0 | Risk Ratio (M‐H, Random, 95% CI) | 0.0 [0.0, 0.0] |
| 3.8 Haematology | 0 | 0 | Risk Ratio (M‐H, Random, 95% CI) | 0.0 [0.0, 0.0] |
| 3.9 Nephrology | 0 | 0 | Risk Ratio (M‐H, Random, 95% CI) | 0.0 [0.0, 0.0] |
| 3.10 Gastroenterologic surgery | 13 | 1063 | Risk Ratio (M‐H, Random, 95% CI) | 0.72 [0.44, 1.18] |
| 3.11 Trauma surgery | 2 | 139 | Risk Ratio (M‐H, Random, 95% CI) | 0.50 [0.20, 1.28] |
| 3.12 Orthopaedics | 4 | 248 | Risk Ratio (M‐H, Random, 95% CI) | 0.89 [0.21, 3.81] |
| 3.13 Plastic, reconstructive and aesthetic surgery | 0 | 0 | Risk Ratio (M‐H, Random, 95% CI) | 0.0 [0.0, 0.0] |
| 3.14 Vascular surgery | 1 | 13 | Risk Ratio (M‐H, Random, 95% CI) | 0.0 [0.0, 0.0] |
| 3.15 Transplant surgery | 0 | 0 | Risk Ratio (M‐H, Random, 95% CI) | 0.0 [0.0, 0.0] |
| 3.16 Urology | 0 | 0 | Risk Ratio (M‐H, Random, 95% CI) | 0.0 [0.0, 0.0] |
| 3.17 Thoracic surgery | 2 | 548 | Risk Ratio (M‐H, Random, 95% CI) | 0.22 [0.03, 1.86] |
| 3.18 Neurological surgery | 0 | 0 | Risk Ratio (M‐H, Random, 95% CI) | 0.0 [0.0, 0.0] |
| 3.19 Oro‐maxillo‐facial surgery | 1 | 32 | Risk Ratio (M‐H, Random, 95% CI) | 3.38 [0.15, 77.12] |
| 3.20 Anaesthesiology | 0 | 0 | Risk Ratio (M‐H, Random, 95% CI) | 0.0 [0.0, 0.0] |
| 3.21 Emergency medicine | 3 | 154 | Risk Ratio (M‐H, Random, 95% CI) | 0.77 [0.31, 1.94] |
| 3.22 Psychiatry | 0 | 0 | Risk Ratio (M‐H, Random, 95% CI) | 0.0 [0.0, 0.0] |
| 3.23 Neurology | 3 | 1027 | Risk Ratio (M‐H, Random, 95% CI) | 0.67 [0.33, 1.37] |
| 3.24 Oncology | 0 | 0 | Risk Ratio (M‐H, Random, 95% CI) | 0.0 [0.0, 0.0] |
| 3.25 Dermatology | 0 | 0 | Risk Ratio (M‐H, Random, 95% CI) | 0.0 [0.0, 0.0] |
| 3.26 Gynaecology | 0 | 0 | Risk Ratio (M‐H, Random, 95% CI) | 0.0 [0.0, 0.0] |
| 3.27 Mixed | 2 | 153 | Risk Ratio (M‐H, Random, 95% CI) | 0.32 [0.03, 2.99] |
| 4 All‐cause mortality ‐ based on adequacy of the amount of calories | 36 | 3722 | Risk Ratio (M‐H, Random, 95% CI) | 0.88 [0.75, 1.03] |
| 4.1 Clearly adequate in experimental group and clearly inadequate in control group | 7 | 736 | Risk Ratio (M‐H, Random, 95% CI) | 0.70 [0.40, 1.25] |
| 4.2 Inadequate in the experimental group or adequate in the control group | 7 | 410 | Risk Ratio (M‐H, Random, 95% CI) | 0.72 [0.28, 1.85] |
| 4.3 Experimental group is overfed | 2 | 74 | Risk Ratio (M‐H, Random, 95% CI) | 0.76 [0.15, 3.79] |
| 4.4 Unclear intake in experimental group or control group | 20 | 2502 | Risk Ratio (M‐H, Random, 95% CI) | 0.89 [0.73, 1.08] |
| 5 All‐cause mortality ‐ different screening tools | 36 | 3722 | Risk Ratio (M‐H, Random, 95% CI) | 0.88 [0.75, 1.03] |
| 5.1 NRS 2002 | 0 | 0 | Risk Ratio (M‐H, Random, 95% CI) | 0.0 [0.0, 0.0] |
| 5.2 MUST | 0 | 0 | Risk Ratio (M‐H, Random, 95% CI) | 0.0 [0.0, 0.0] |
| 5.3 MNA | 0 | 0 | Risk Ratio (M‐H, Random, 95% CI) | 0.0 [0.0, 0.0] |
| 5.4 SGA | 1 | 323 | Risk Ratio (M‐H, Random, 95% CI) | 0.75 [0.13, 4.44] |
| 5.5 Other means | 35 | 3399 | Risk Ratio (M‐H, Random, 95% CI) | 0.88 [0.75, 1.03] |
| 6 All‐cause mortality ‐ participants characterised as 'at nutritional risk' due to one of the following conditions | 36 | 3722 | Risk Ratio (M‐H, Random, 95% CI) | 0.88 [0.75, 1.03] |
| 6.1 Major surgery | 18 | 1746 | Risk Ratio (M‐H, Random, 95% CI) | 0.69 [0.45, 1.06] |
| 6.2 Stroke | 3 | 1027 | Risk Ratio (M‐H, Random, 95% CI) | 0.67 [0.33, 1.37] |
| 6.3 ICU participants including trauma | 5 | 293 | Risk Ratio (M‐H, Random, 95% CI) | 0.62 [0.32, 1.21] |
| 6.4 Frail elderly participants with less severe conditions known to increase protein requirements | 2 | 126 | Risk Ratio (M‐H, Random, 95% CI) | 1.59 [0.02, 125.73] |
| 6.5 Participants do not fall into one of the categories above | 8 | 530 | Risk Ratio (M‐H, Random, 95% CI) | 0.95 [0.58, 1.56] |
| 7 All‐cause mortality ‐ participants characterised as 'at nutritional risk' due to one of the following criteria | 36 | 3722 | Risk Ratio (M‐H, Random, 95% CI) | 0.88 [0.75, 1.03] |
| 7.1 BMI less than 20.5 kg/m2 | 0 | 0 | Risk Ratio (M‐H, Random, 95% CI) | 0.0 [0.0, 0.0] |
| 7.2 Weight loss of at least 5% during the last three months | 0 | 0 | Risk Ratio (M‐H, Random, 95% CI) | 0.0 [0.0, 0.0] |
| 7.3 Weight loss of at least 10% during the last six months | 1 | 32 | Risk Ratio (M‐H, Random, 95% CI) | 3.38 [0.15, 77.12] |
| 7.4 Insufficient food intake during the last week (50% of requirements or less) | 0 | 0 | Risk Ratio (M‐H, Random, 95% CI) | 0.0 [0.0, 0.0] |
| 7.5 Participants characterised as 'at nutritional risk' by other means | 35 | 3690 | Risk Ratio (M‐H, Random, 95% CI) | 0.88 [0.75, 1.02] |
| 8 All‐cause mortality ‐ participants characterised as 'at nutritional risk' due to biomarkers or anthropometrics | 36 | 3722 | Risk Ratio (M‐H, Random, 95% CI) | 0.88 [0.75, 1.03] |
| 8.1 Biomarkers | 1 | 520 | Risk Ratio (M‐H, Random, 95% CI) | 0.15 [0.01, 2.84] |
| 8.2 Anthropometric measures | 2 | 122 | Risk Ratio (M‐H, Random, 95% CI) | 0.71 [0.24, 2.08] |
| 8.3 Characterised by other means | 33 | 3080 | Risk Ratio (M‐H, Random, 95% CI) | 0.89 [0.76, 1.04] |
| 9 All‐cause mortality ‐ randomisation year | 36 | 3722 | Risk Ratio (M‐H, Random, 95% CI) | 0.88 [0.75, 1.03] |
| 9.1 Before 1960 | 0 | 0 | Risk Ratio (M‐H, Random, 95% CI) | 0.0 [0.0, 0.0] |
| 9.2 1960‐1979 | 1 | 26 | Risk Ratio (M‐H, Random, 95% CI) | 0.44 [0.02, 9.98] |
| 9.3 1980‐1999 | 23 | 2463 | Risk Ratio (M‐H, Random, 95% CI) | 0.93 [0.78, 1.11] |
| 9.4 After 1999 | 12 | 1233 | Risk Ratio (M‐H, Random, 95% CI) | 0.73 [0.52, 1.00] |
| 10 All‐cause mortality ‐ trials where the intervention lasts fewer than three days compared with trials where the intervention lasts three days or more | 36 | 3722 | Risk Ratio (M‐H, Random, 95% CI) | 0.88 [0.75, 1.03] |
| 10.1 Three days or more | 30 | 3287 | Risk Ratio (M‐H, Random, 95% CI) | 0.88 [0.75, 1.03] |
| 10.2 Less than three days | 6 | 435 | Risk Ratio (M‐H, Random, 95% CI) | 0.68 [0.28, 1.65] |
| 10.3 Unknown | 0 | 0 | Risk Ratio (M‐H, Random, 95% CI) | 0.0 [0.0, 0.0] |
| 11 All‐cause mortality ‐ 'best‐worst case' scenario | 36 | 3759 | Risk Ratio (M‐H, Random, 95% CI) | 0.84 [0.72, 0.98] |
| 12 All‐cause mortality ‐ 'worst‐best case' scenario | 36 | 3759 | Risk Ratio (M‐H, Fixed, 95% CI) | 0.92 [0.79, 1.06] |
| 13 All‐cause mortality co‐interventions | 36 | 3722 | Risk Ratio (M‐H, Random, 95% CI) | 0.88 [0.75, 1.03] |
| 13.1 received nutrition support as co‐intervention | 3 | 126 | Risk Ratio (M‐H, Random, 95% CI) | 0.60 [0.28, 1.28] |
| 13.2 did not receive nutrition support as co‐intervention | 27 | 3253 | Risk Ratio (M‐H, Random, 95% CI) | 0.79 [0.62, 1.02] |
| 13.3 delayed versus early nutrition support | 6 | 343 | Risk Ratio (M‐H, Random, 95% CI) | 1.06 [0.57, 1.97] |
21.1. Analysis.
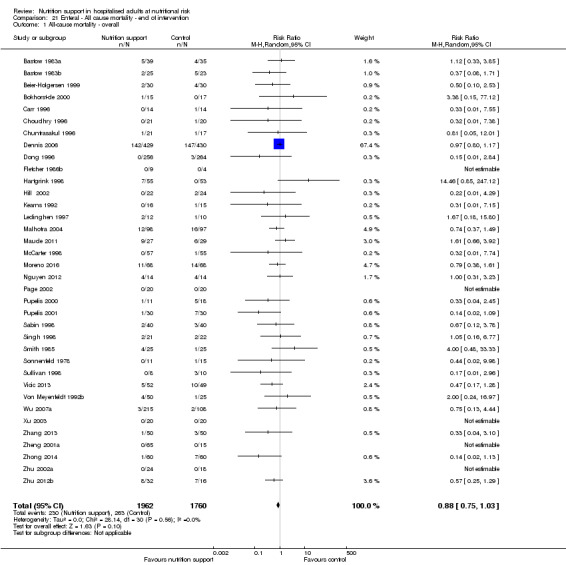
Comparison 21 Enteral ‐ All cause mortality ‐ end of intervention, Outcome 1 All‐cause mortality ‐ overall.
21.2. Analysis.
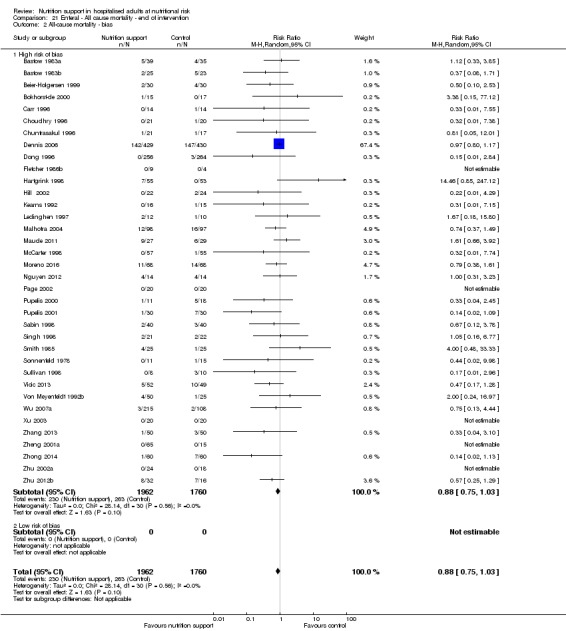
Comparison 21 Enteral ‐ All cause mortality ‐ end of intervention, Outcome 2 All‐cause mortality ‐ bias.
21.3. Analysis.
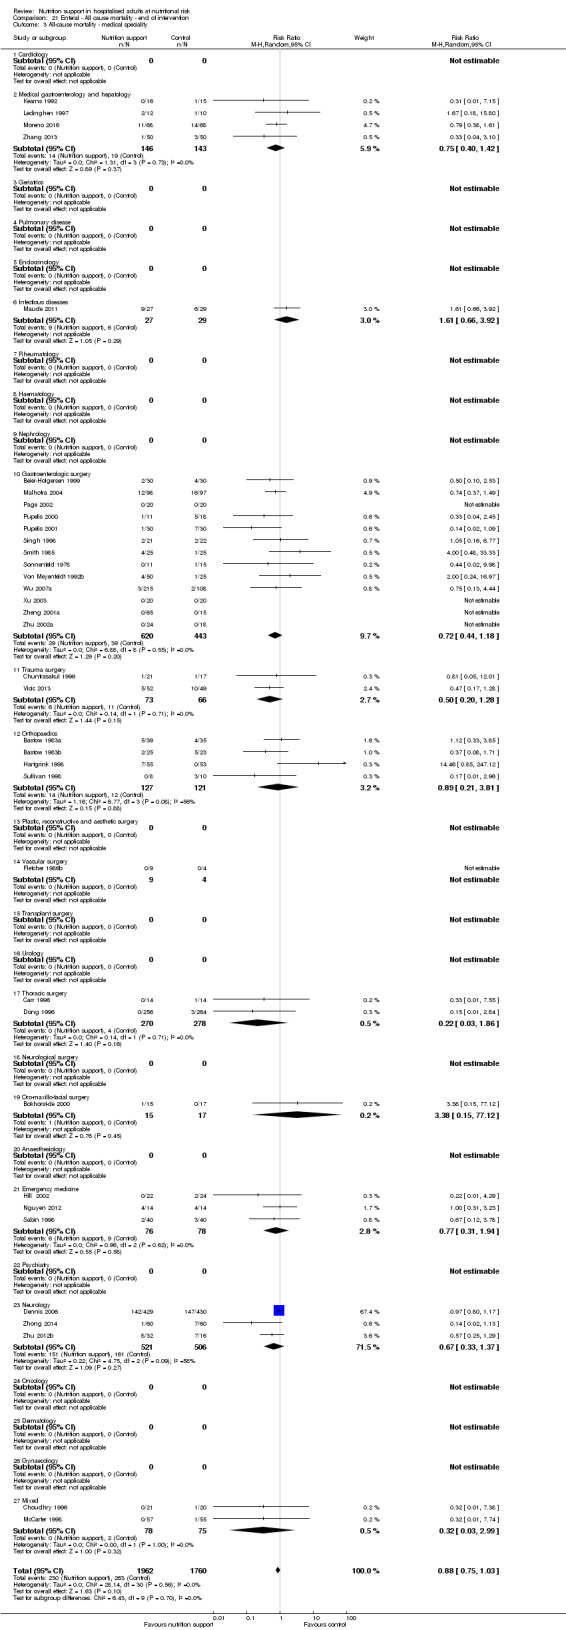
Comparison 21 Enteral ‐ All cause mortality ‐ end of intervention, Outcome 3 All‐cause mortality ‐ medical speciality.
21.4. Analysis.
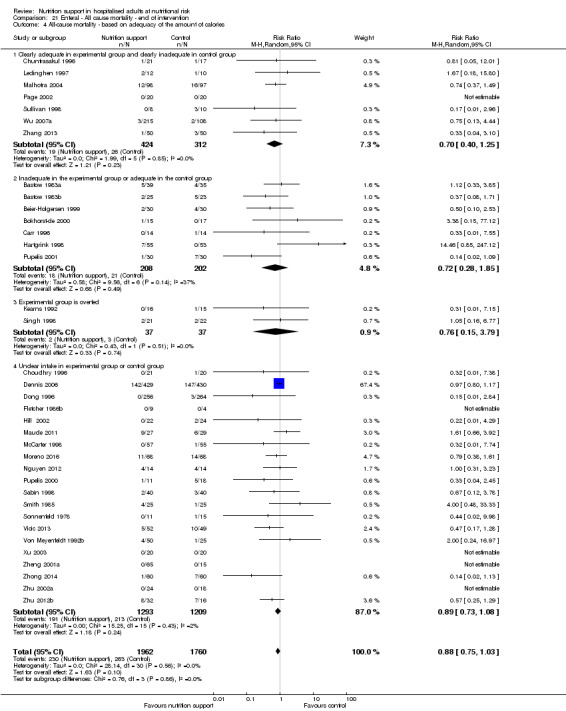
Comparison 21 Enteral ‐ All cause mortality ‐ end of intervention, Outcome 4 All‐cause mortality ‐ based on adequacy of the amount of calories.
21.5. Analysis.
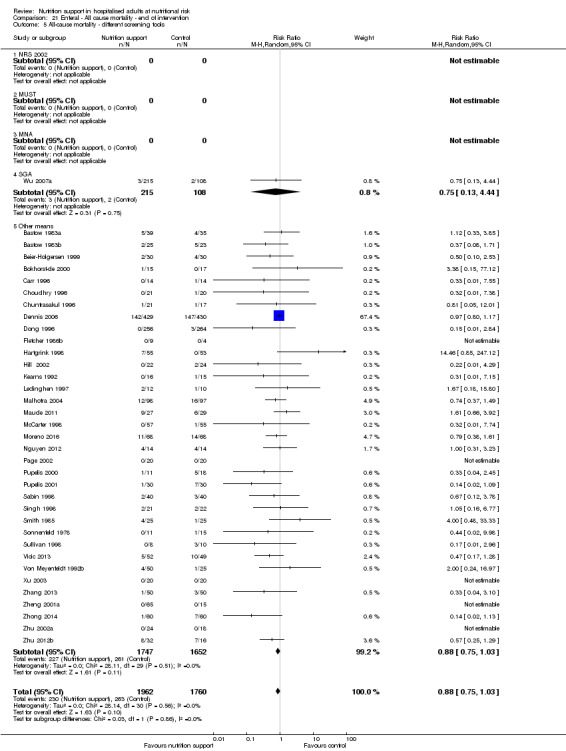
Comparison 21 Enteral ‐ All cause mortality ‐ end of intervention, Outcome 5 All‐cause mortality ‐ different screening tools.
21.6. Analysis.

Comparison 21 Enteral ‐ All cause mortality ‐ end of intervention, Outcome 6 All‐cause mortality ‐ participants characterised as 'at nutritional risk' due to one of the following conditions.
21.7. Analysis.
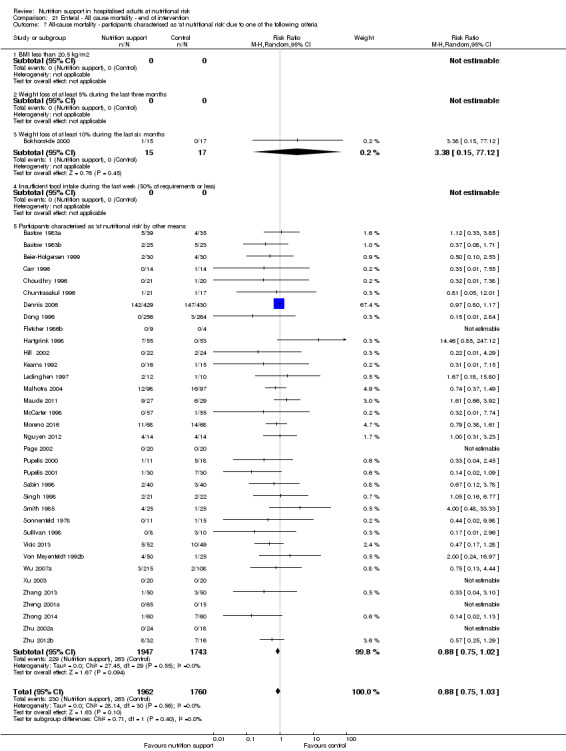
Comparison 21 Enteral ‐ All cause mortality ‐ end of intervention, Outcome 7 All‐cause mortality ‐ participants characterised as 'at nutritional risk' due to one of the following criteria.
21.8. Analysis.
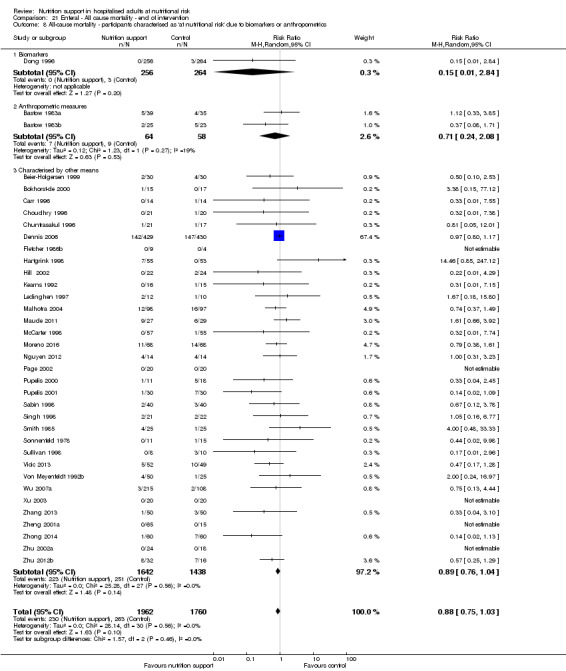
Comparison 21 Enteral ‐ All cause mortality ‐ end of intervention, Outcome 8 All‐cause mortality ‐ participants characterised as 'at nutritional risk' due to biomarkers or anthropometrics.
21.9. Analysis.
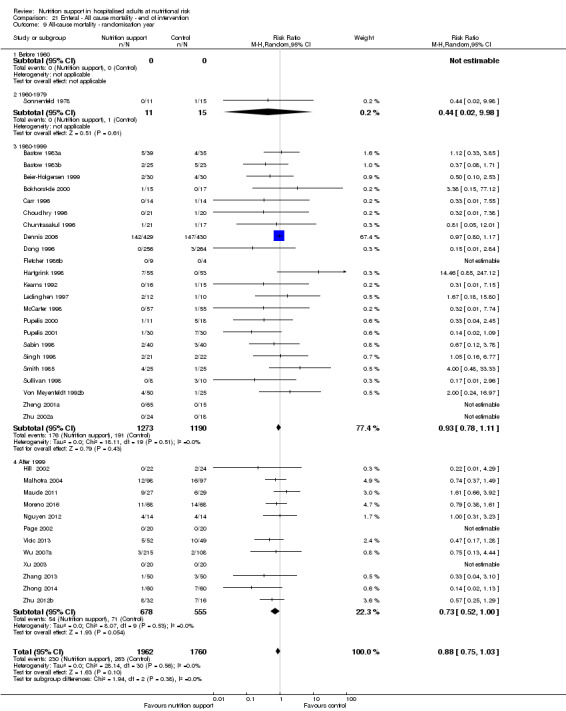
Comparison 21 Enteral ‐ All cause mortality ‐ end of intervention, Outcome 9 All‐cause mortality ‐ randomisation year.
21.10. Analysis.
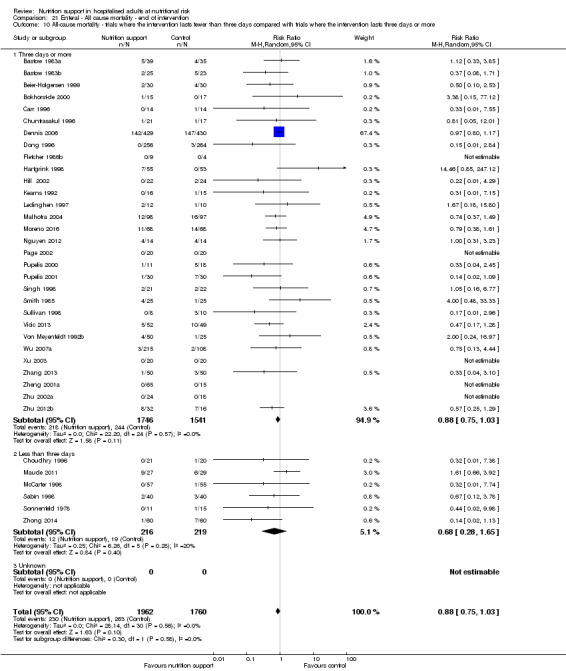
Comparison 21 Enteral ‐ All cause mortality ‐ end of intervention, Outcome 10 All‐cause mortality ‐ trials where the intervention lasts fewer than three days compared with trials where the intervention lasts three days or more.
21.11. Analysis.
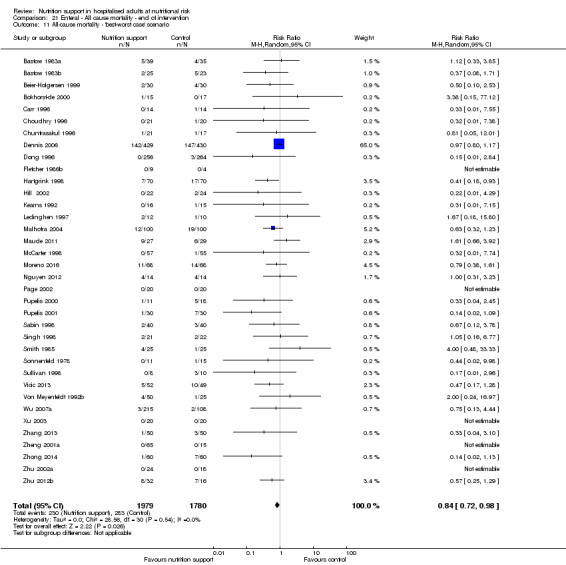
Comparison 21 Enteral ‐ All cause mortality ‐ end of intervention, Outcome 11 All‐cause mortality ‐ 'best‐worst case' scenario.
21.12. Analysis.
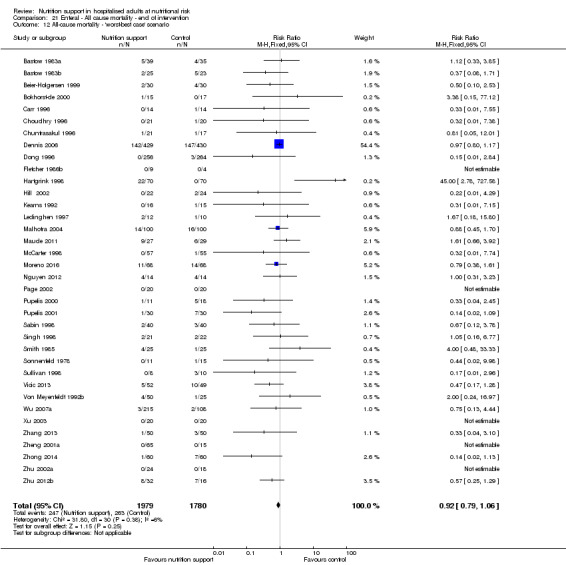
Comparison 21 Enteral ‐ All cause mortality ‐ end of intervention, Outcome 12 All‐cause mortality ‐ 'worst‐best case' scenario.
21.13. Analysis.
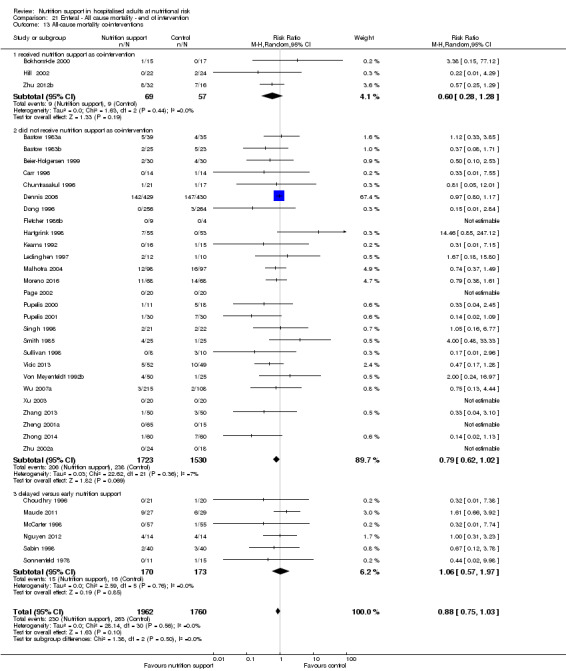
Comparison 21 Enteral ‐ All cause mortality ‐ end of intervention, Outcome 13 All‐cause mortality co‐interventions.
Comparison 22. Enteral ‐ All cause mortality ‐ maximum follow‐up.
| Outcome or subgroup title | No. of studies | No. of participants | Statistical method | Effect size |
|---|---|---|---|---|
| 1 All‐cause mortality ‐ overall | 42 | 4212 | Risk Ratio (M‐H, Random, 95% CI) | 0.84 [0.75, 0.95] |
| 2 All‐cause mortality ‐ bias | 42 | 4212 | Risk Ratio (M‐H, Random, 95% CI) | 0.84 [0.75, 0.95] |
| 2.1 High risk of bias | 42 | 4212 | Risk Ratio (M‐H, Random, 95% CI) | 0.84 [0.75, 0.95] |
| 2.2 Low risk of bias | 0 | 0 | Risk Ratio (M‐H, Random, 95% CI) | 0.0 [0.0, 0.0] |
| 3 All‐cause mortality ‐ medical speciality | 42 | 4212 | Risk Ratio (M‐H, Random, 95% CI) | 0.84 [0.75, 0.95] |
| 3.1 Cardiology | 0 | 0 | Risk Ratio (M‐H, Random, 95% CI) | 0.0 [0.0, 0.0] |
| 3.2 Medical gastroenterology and hepatology | 4 | 289 | Risk Ratio (M‐H, Random, 95% CI) | 0.88 [0.63, 1.21] |
| 3.3 Geriatrics | 0 | 0 | Risk Ratio (M‐H, Random, 95% CI) | 0.0 [0.0, 0.0] |
| 3.4 Pulmonary disease | 0 | 0 | Risk Ratio (M‐H, Random, 95% CI) | 0.0 [0.0, 0.0] |
| 3.5 Endocrinology | 0 | 0 | Risk Ratio (M‐H, Random, 95% CI) | 0.0 [0.0, 0.0] |
| 3.6 Infectious diseases | 1 | 56 | Risk Ratio (M‐H, Random, 95% CI) | 1.61 [0.66, 3.92] |
| 3.7 Rheumatology | 0 | 0 | Risk Ratio (M‐H, Random, 95% CI) | 0.0 [0.0, 0.0] |
| 3.8 Haematology | 0 | 0 | Risk Ratio (M‐H, Random, 95% CI) | 0.0 [0.0, 0.0] |
| 3.9 Nephrology | 0 | 0 | Risk Ratio (M‐H, Random, 95% CI) | 0.0 [0.0, 0.0] |
| 3.10 Gastroenterologic surgery | 15 | 1284 | Risk Ratio (M‐H, Random, 95% CI) | 0.75 [0.48, 1.16] |
| 3.11 Trauma surgery | 4 | 204 | Risk Ratio (M‐H, Random, 95% CI) | 0.58 [0.30, 1.11] |
| 3.12 Ortopaedics | 4 | 248 | Risk Ratio (M‐H, Random, 95% CI) | 0.82 [0.18, 3.75] |
| 3.13 Plastic, reconstructive, and aesthetic surgery | 0 | 0 | Risk Ratio (M‐H, Random, 95% CI) | 0.0 [0.0, 0.0] |
| 3.14 Vascular surgery | 1 | 13 | Risk Ratio (M‐H, Random, 95% CI) | 0.0 [0.0, 0.0] |
| 3.15 Transplant surgery | 0 | 0 | Risk Ratio (M‐H, Random, 95% CI) | 0.0 [0.0, 0.0] |
| 3.16 Urology | 0 | 0 | Risk Ratio (M‐H, Random, 95% CI) | 0.0 [0.0, 0.0] |
| 3.17 Thoracic surgery | 2 | 548 | Risk Ratio (M‐H, Random, 95% CI) | 0.22 [0.03, 1.86] |
| 3.18 Neurological surgery | 0 | 0 | Risk Ratio (M‐H, Random, 95% CI) | 0.0 [0.0, 0.0] |
| 3.19 Oro‐maxillo‐facial surgery | 1 | 32 | Risk Ratio (M‐H, Random, 95% CI) | 3.38 [0.15, 77.12] |
| 3.20 Anaesthesiology | 0 | 0 | Risk Ratio (M‐H, Random, 95% CI) | 0.0 [0.0, 0.0] |
| 3.21 Emergency medicine | 4 | 213 | Risk Ratio (M‐H, Random, 95% CI) | 1.07 [0.61, 1.89] |
| 3.22 Psychiatry | 0 | 0 | Risk Ratio (M‐H, Random, 95% CI) | 0.0 [0.0, 0.0] |
| 3.23 Neurology | 4 | 1172 | Risk Ratio (M‐H, Random, 95% CI) | 0.57 [0.31, 1.05] |
| 3.24 Oncology | 0 | 0 | Risk Ratio (M‐H, Random, 95% CI) | 0.0 [0.0, 0.0] |
| 3.25 Dermatology | 0 | 0 | Risk Ratio (M‐H, Random, 95% CI) | 0.0 [0.0, 0.0] |
| 3.26 Gynaecology | 0 | 0 | Risk Ratio (M‐H, Random, 95% CI) | 0.0 [0.0, 0.0] |
| 3.27 Mixed | 2 | 153 | Risk Ratio (M‐H, Random, 95% CI) | 0.63 [0.18, 2.21] |
| 4 All‐cause mortality ‐ based on adequacy of the amount of calories | 42 | 4212 | Risk Ratio (M‐H, Random, 95% CI) | 0.84 [0.75, 0.95] |
| 4.1 Clearly adequate in intervention and clearly inadequate in control | 10 | 954 | Risk Ratio (M‐H, Random, 95% CI) | 0.75 [0.46, 1.23] |
| 4.2 Inadequate in the experimental or adequate in the control | 7 | 410 | Risk Ratio (M‐H, Random, 95% CI) | 0.72 [0.28, 1.85] |
| 4.3 Experimental group is overfed | 3 | 174 | Risk Ratio (M‐H, Random, 95% CI) | 1.01 [0.49, 2.08] |
| 4.4 Unclear intake in control or experimental | 22 | 2674 | Risk Ratio (M‐H, Random, 95% CI) | 0.82 [0.67, 0.99] |
| 5 All‐cause mortality ‐ different screening tools | 42 | 4212 | Risk Ratio (M‐H, Random, 95% CI) | 0.84 [0.75, 0.95] |
| 5.1 NRS 2002 | 0 | 0 | Risk Ratio (M‐H, Random, 95% CI) | 0.0 [0.0, 0.0] |
| 5.2 MUST | 0 | 0 | Risk Ratio (M‐H, Random, 95% CI) | 0.0 [0.0, 0.0] |
| 5.3 MNA | 0 | 0 | Risk Ratio (M‐H, Random, 95% CI) | 0.0 [0.0, 0.0] |
| 5.4 SGA | 1 | 323 | Risk Ratio (M‐H, Random, 95% CI) | 0.75 [0.13, 4.44] |
| 5.5 Other means | 41 | 3889 | Risk Ratio (M‐H, Random, 95% CI) | 0.84 [0.75, 0.95] |
| 6 All‐cause mortality ‐ participants characterised as 'at nutritional risk' due to one of the following conditions | 42 | 4212 | Risk Ratio (M‐H, Random, 95% CI) | 0.84 [0.75, 0.95] |
| 6.1 Major surgery | 20 | 1967 | Risk Ratio (M‐H, Random, 95% CI) | 0.71 [0.48, 1.06] |
| 6.2 Stroke | 4 | 1172 | Risk Ratio (M‐H, Random, 95% CI) | 0.57 [0.31, 1.05] |
| 6.3 ICU participants including trauma | 8 | 417 | Risk Ratio (M‐H, Random, 95% CI) | 0.82 [0.54, 1.26] |
| 6.4 Frail elderly participants with less severe conditions known to increase protein requirements | 2 | 126 | Risk Ratio (M‐H, Random, 95% CI) | 1.25 [0.01, 150.42] |
| 6.5 Participants do not fall into one of the categories above | 8 | 530 | Risk Ratio (M‐H, Random, 95% CI) | 0.93 [0.69, 1.25] |
| 7 All‐cause mortality ‐ participants characterised as 'at nutritional risk' due to one of the following criteria | 42 | 4212 | Risk Ratio (M‐H, Random, 95% CI) | 0.84 [0.75, 0.95] |
| 7.1 BMI less than 20.5 kg/m2 | 0 | 0 | Risk Ratio (M‐H, Random, 95% CI) | 0.0 [0.0, 0.0] |
| 7.2 Weight loss of at least 5% during the last three months | 0 | 0 | Risk Ratio (M‐H, Random, 95% CI) | 0.0 [0.0, 0.0] |
| 7.3 Weight loss of at least 10% during the last six months | 1 | 32 | Risk Ratio (M‐H, Random, 95% CI) | 3.38 [0.15, 77.12] |
| 7.4 Insufficient food intake during the last week (50% of requirements or less) | 0 | 0 | Risk Ratio (M‐H, Random, 95% CI) | 0.0 [0.0, 0.0] |
| 7.5 Participants characterised as 'at nutritional risk' by other means | 41 | 4180 | Risk Ratio (M‐H, Random, 95% CI) | 0.84 [0.75, 0.95] |
| 8 All‐cause mortality ‐ participants characterised as 'at nutritional risk' due to biomarkers or anthropometrics | 42 | 4212 | Risk Ratio (M‐H, Random, 95% CI) | 0.84 [0.75, 0.95] |
| 8.1 Biomarkers | 1 | 520 | Risk Ratio (M‐H, Random, 95% CI) | 0.15 [0.01, 2.84] |
| 8.2 Anthropometric measures | 2 | 122 | Risk Ratio (M‐H, Random, 95% CI) | 0.71 [0.24, 2.08] |
| 8.3 Both anthropometrics and biomarkers | 0 | 0 | Risk Ratio (M‐H, Random, 95% CI) | 0.0 [0.0, 0.0] |
| 8.4 Characterised by other means | 39 | 3570 | Risk Ratio (M‐H, Random, 95% CI) | 0.85 [0.75, 0.96] |
| 9 All‐cause mortality ‐ randomisation year | 42 | 4212 | Risk Ratio (M‐H, Random, 95% CI) | 0.84 [0.75, 0.95] |
| 9.1 Before 1960 | 0 | 0 | Risk Ratio (M‐H, Random, 95% CI) | 0.0 [0.0, 0.0] |
| 9.2 1960 to 1979 | 1 | 26 | Risk Ratio (M‐H, Random, 95% CI) | 0.44 [0.02, 9.98] |
| 9.3 1980 to 1999 | 24 | 2500 | Risk Ratio (M‐H, Random, 95% CI) | 0.87 [0.69, 1.08] |
| 9.4 After 1999 | 17 | 1686 | Risk Ratio (M‐H, Random, 95% CI) | 0.76 [0.60, 0.96] |
| 10 All‐cause mortality ‐ trials where the intervention lasts fewer than three days compared with trials where the intervention lasts three days or more | 42 | 4212 | Risk Ratio (M‐H, Random, 95% CI) | 0.84 [0.75, 0.95] |
| 10.1 Three days or more | 34 | 3680 | Risk Ratio (M‐H, Random, 95% CI) | 0.82 [0.71, 0.94] |
| 10.2 Less than three days | 8 | 532 | Risk Ratio (M‐H, Random, 95% CI) | 1.03 [0.66, 1.63] |
| 10.3 Unknown | 0 | 0 | Risk Ratio (M‐H, Random, 95% CI) | 0.0 [0.0, 0.0] |
| 11 All‐cause mortality ‐ 'best‐worst case' scenario | 42 | 4269 | Risk Ratio (M‐H, Random, 95% CI) | 0.75 [0.63, 0.89] |
| 12 All‐cause mortality ‐ 'worst‐best case' scenario | 42 | 4269 | Risk Ratio (M‐H, Random, 95% CI) | 0.84 [0.68, 1.03] |
| 13 All‐cause mortality co‐interventions | 42 | 4212 | Risk Ratio (M‐H, Fixed, 95% CI) | 0.82 [0.73, 0.92] |
| 13.1 received nutrition support as co‐intervention | 5 | 262 | Risk Ratio (M‐H, Fixed, 95% CI) | 1.03 [0.66, 1.60] |
| 13.2 did not receive nutrition support as co‐intervention | 35 | 3797 | Risk Ratio (M‐H, Fixed, 95% CI) | 0.81 [0.71, 0.91] |
| 13.3 delayed versus early nutrition support | 2 | 153 | Risk Ratio (M‐H, Fixed, 95% CI) | 0.61 [0.17, 2.12] |
22.1. Analysis.
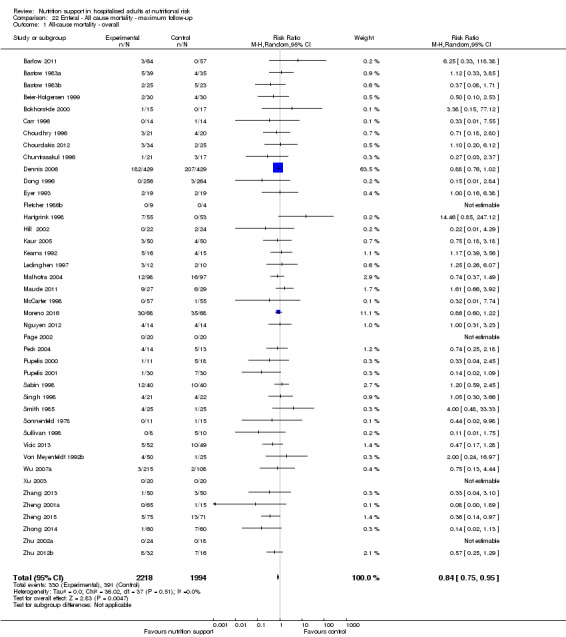
Comparison 22 Enteral ‐ All cause mortality ‐ maximum follow‐up, Outcome 1 All‐cause mortality ‐ overall.
22.2. Analysis.
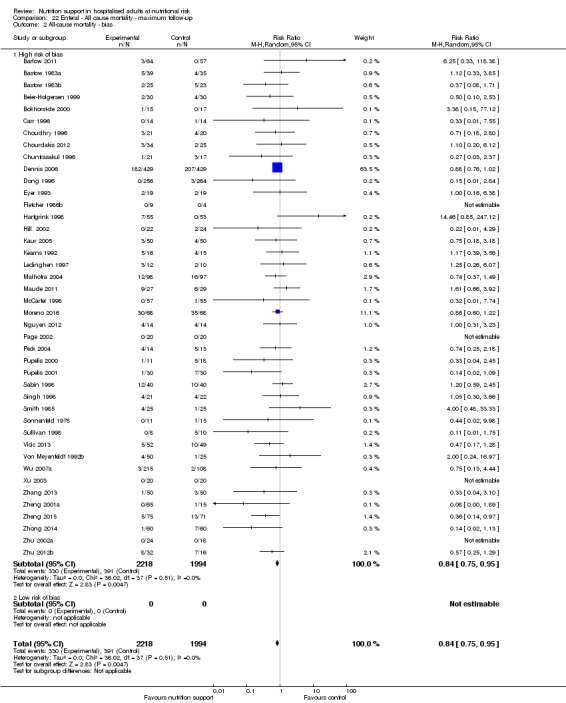
Comparison 22 Enteral ‐ All cause mortality ‐ maximum follow‐up, Outcome 2 All‐cause mortality ‐ bias.
22.3. Analysis.
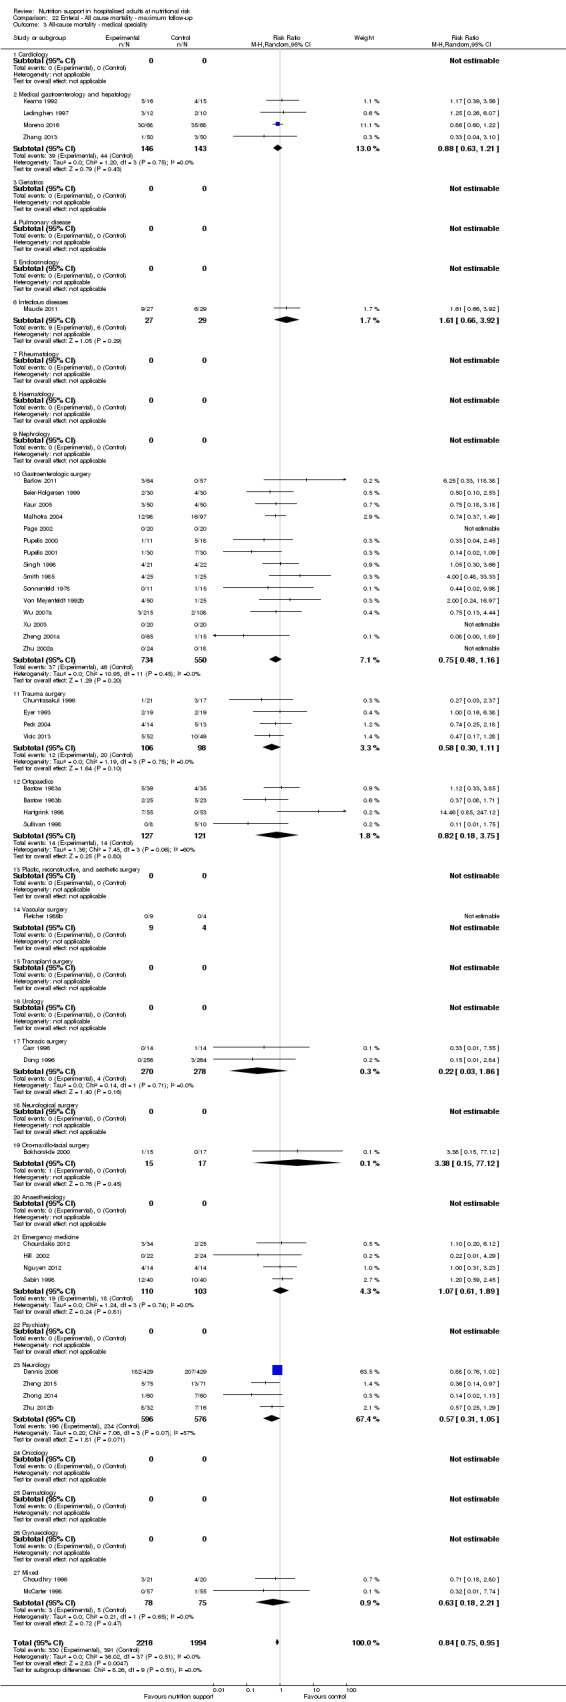
Comparison 22 Enteral ‐ All cause mortality ‐ maximum follow‐up, Outcome 3 All‐cause mortality ‐ medical speciality.
22.4. Analysis.
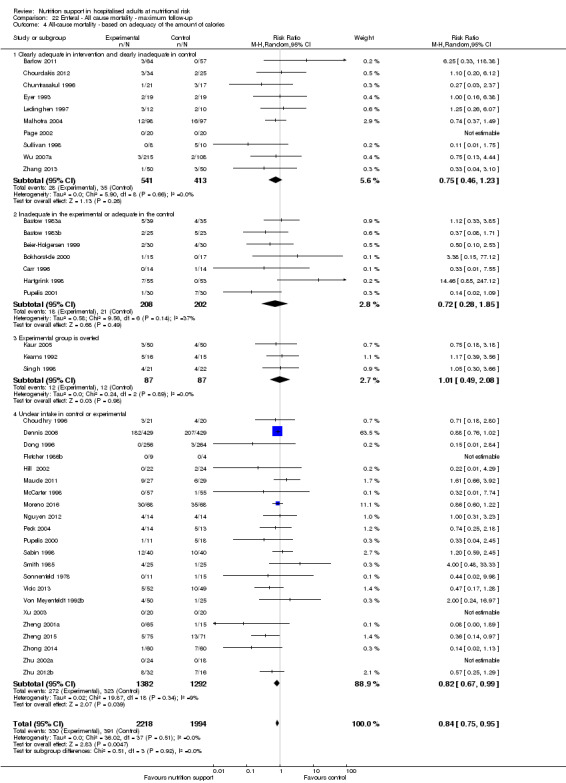
Comparison 22 Enteral ‐ All cause mortality ‐ maximum follow‐up, Outcome 4 All‐cause mortality ‐ based on adequacy of the amount of calories.
22.5. Analysis.
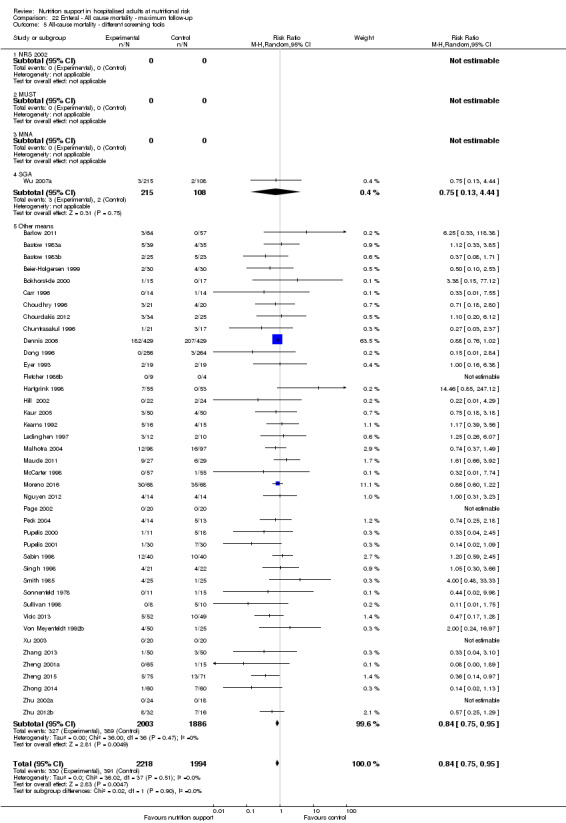
Comparison 22 Enteral ‐ All cause mortality ‐ maximum follow‐up, Outcome 5 All‐cause mortality ‐ different screening tools.
22.6. Analysis.
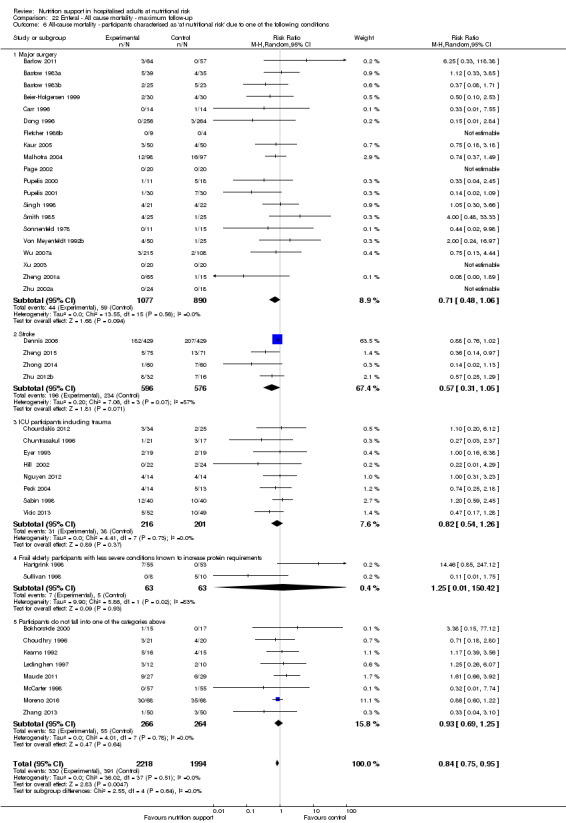
Comparison 22 Enteral ‐ All cause mortality ‐ maximum follow‐up, Outcome 6 All‐cause mortality ‐ participants characterised as 'at nutritional risk' due to one of the following conditions.
22.7. Analysis.
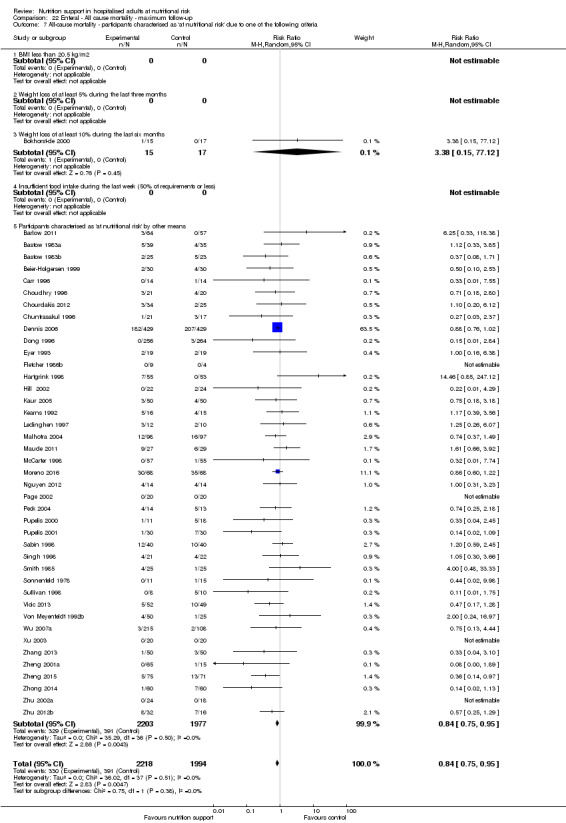
Comparison 22 Enteral ‐ All cause mortality ‐ maximum follow‐up, Outcome 7 All‐cause mortality ‐ participants characterised as 'at nutritional risk' due to one of the following criteria.
22.8. Analysis.
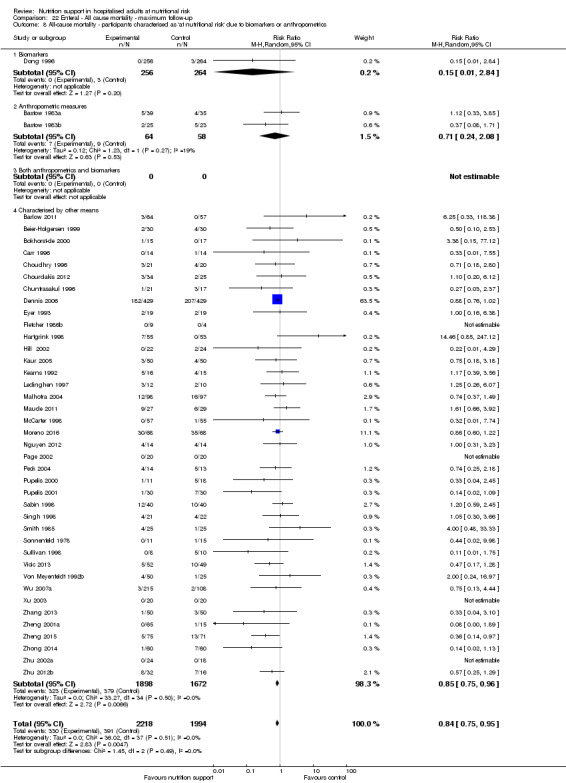
Comparison 22 Enteral ‐ All cause mortality ‐ maximum follow‐up, Outcome 8 All‐cause mortality ‐ participants characterised as 'at nutritional risk' due to biomarkers or anthropometrics.
22.9. Analysis.
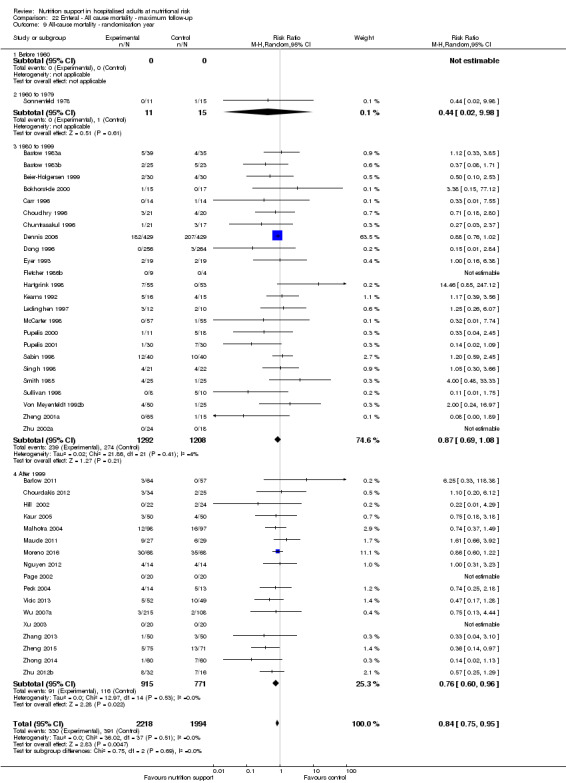
Comparison 22 Enteral ‐ All cause mortality ‐ maximum follow‐up, Outcome 9 All‐cause mortality ‐ randomisation year.
22.10. Analysis.
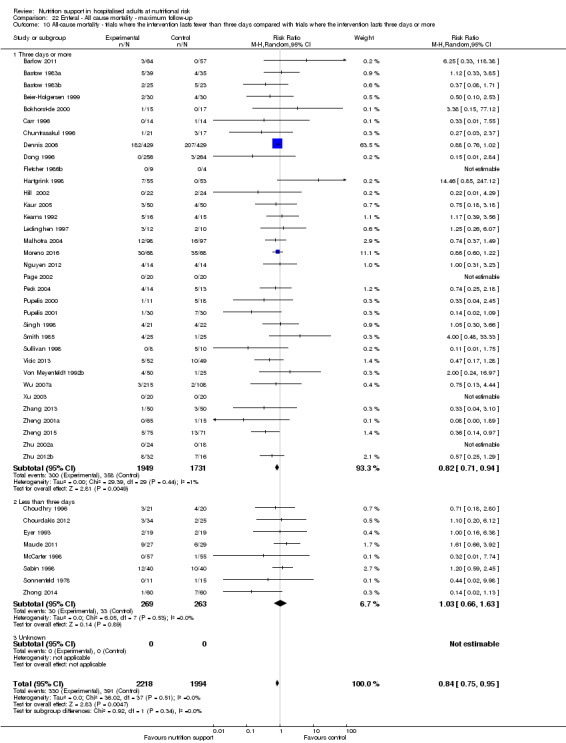
Comparison 22 Enteral ‐ All cause mortality ‐ maximum follow‐up, Outcome 10 All‐cause mortality ‐ trials where the intervention lasts fewer than three days compared with trials where the intervention lasts three days or more.
22.11. Analysis.
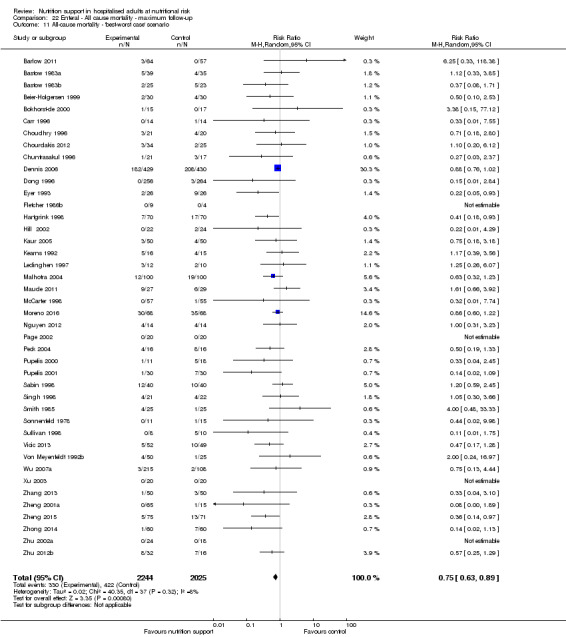
Comparison 22 Enteral ‐ All cause mortality ‐ maximum follow‐up, Outcome 11 All‐cause mortality ‐ 'best‐worst case' scenario.
22.12. Analysis.
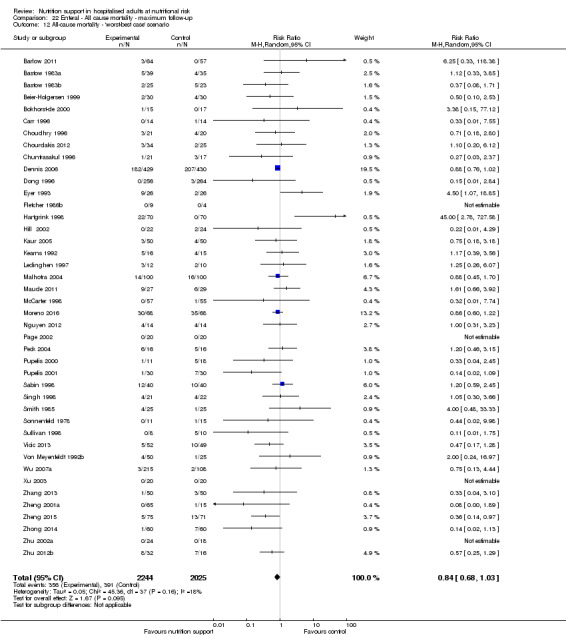
Comparison 22 Enteral ‐ All cause mortality ‐ maximum follow‐up, Outcome 12 All‐cause mortality ‐ 'worst‐best case' scenario.
22.13. Analysis.
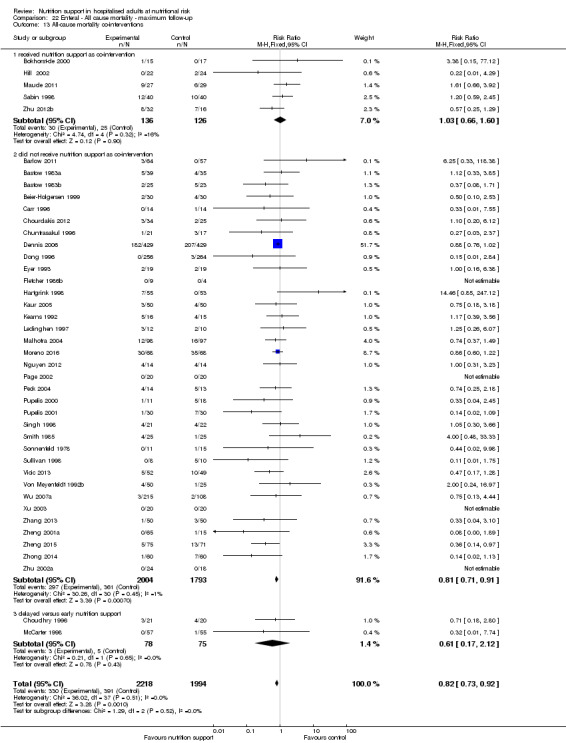
Comparison 22 Enteral ‐ All cause mortality ‐ maximum follow‐up, Outcome 13 All‐cause mortality co‐interventions.
Comparison 23. Enteral ‐ Serious adverse event end of intervention.
| Outcome or subgroup title | No. of studies | No. of participants | Statistical method | Effect size |
|---|---|---|---|---|
| 1 Serious adverse events ‐ overall | 43 | 3935 | Risk Ratio (M‐H, Random, 95% CI) | 0.85 [0.74, 0.98] |
| 2 Serious adverse events ‐ bias | 43 | 3935 | Risk Ratio (M‐H, Random, 95% CI) | 0.85 [0.74, 0.98] |
| 2.1 High risk of bias | 43 | 3935 | Risk Ratio (M‐H, Random, 95% CI) | 0.85 [0.74, 0.98] |
| 2.2 Low risk of bias | 0 | 0 | Risk Ratio (M‐H, Random, 95% CI) | 0.0 [0.0, 0.0] |
| 3 Serious adverse events ‐ by medical specialty | 43 | 3935 | Risk Ratio (M‐H, Random, 95% CI) | 0.85 [0.74, 0.98] |
| 3.1 Cardiology | 0 | 0 | Risk Ratio (M‐H, Random, 95% CI) | 0.0 [0.0, 0.0] |
| 3.2 Medical gastroenterology and hepatology | 4 | 289 | Risk Ratio (M‐H, Random, 95% CI) | 0.79 [0.32, 1.96] |
| 3.3 High risk | 0 | 0 | Risk Ratio (M‐H, Random, 95% CI) | 0.0 [0.0, 0.0] |
| 3.4 Geriatrics | 0 | 0 | Risk Ratio (M‐H, Random, 95% CI) | 0.0 [0.0, 0.0] |
| 3.5 Pulmonary disease | 0 | 0 | Risk Ratio (M‐H, Random, 95% CI) | 0.0 [0.0, 0.0] |
| 3.6 Endocrinology | 0 | 0 | Risk Ratio (M‐H, Random, 95% CI) | 0.0 [0.0, 0.0] |
| 3.7 Infectious diseases | 1 | 56 | Risk Ratio (M‐H, Random, 95% CI) | 1.23 [0.52, 2.93] |
| 3.8 Rheumatology | 0 | 0 | Risk Ratio (M‐H, Random, 95% CI) | 0.0 [0.0, 0.0] |
| 3.9 Haematology | 0 | 0 | Risk Ratio (M‐H, Random, 95% CI) | 0.0 [0.0, 0.0] |
| 3.10 Nephrology | 0 | 0 | Risk Ratio (M‐H, Random, 95% CI) | 0.0 [0.0, 0.0] |
| 3.11 Gastroenterologic surgery | 19 | 1235 | Risk Ratio (M‐H, Random, 95% CI) | 0.75 [0.54, 1.03] |
| 3.12 Trauma surgery | 3 | 180 | Risk Ratio (M‐H, Random, 95% CI) | 0.50 [0.20, 1.28] |
| 3.13 Ortopaedics | 4 | 248 | Risk Ratio (M‐H, Random, 95% CI) | 1.05 [0.34, 3.26] |
| 3.14 Plastic, reconstructive, and aesthetic surgery | 0 | 0 | Risk Ratio (M‐H, Random, 95% CI) | 0.0 [0.0, 0.0] |
| 3.15 Vascular surgery | 1 | 13 | Risk Ratio (M‐H, Random, 95% CI) | 0.0 [0.0, 0.0] |
| 3.16 Transplant surgery | 0 | 0 | Risk Ratio (M‐H, Random, 95% CI) | 0.0 [0.0, 0.0] |
| 3.17 Urology | 0 | 0 | Risk Ratio (M‐H, Random, 95% CI) | 0.0 [0.0, 0.0] |
| 3.18 Thoracic surgery | 2 | 548 | Risk Ratio (M‐H, Random, 95% CI) | 0.15 [0.02, 1.27] |
| 3.19 Neurological surgery | 0 | 0 | Risk Ratio (M‐H, Random, 95% CI) | 0.0 [0.0, 0.0] |
| 3.20 Oro‐maxillo‐facial surgery | 1 | 32 | Risk Ratio (M‐H, Random, 95% CI) | 0.88 [0.44, 1.78] |
| 3.21 Anaesthesiology | 0 | 0 | Risk Ratio (M‐H, Random, 95% CI) | 0.0 [0.0, 0.0] |
| 3.22 Emergency medicine | 3 | 154 | Risk Ratio (M‐H, Random, 95% CI) | 0.77 [0.31, 1.94] |
| 3.23 Psychiatry | 0 | 0 | Risk Ratio (M‐H, Random, 95% CI) | 0.0 [0.0, 0.0] |
| 3.24 Neurology | 3 | 1027 | Risk Ratio (M‐H, Random, 95% CI) | 0.67 [0.37, 1.24] |
| 3.25 Oncology | 0 | 0 | Risk Ratio (M‐H, Random, 95% CI) | 0.0 [0.0, 0.0] |
| 3.26 Dermatology | 0 | 0 | Risk Ratio (M‐H, Random, 95% CI) | 0.0 [0.0, 0.0] |
| 3.27 Gynaecology | 0 | 0 | Risk Ratio (M‐H, Random, 95% CI) | 0.0 [0.0, 0.0] |
| 3.28 Mixed | 2 | 153 | Risk Ratio (M‐H, Random, 95% CI) | 0.32 [0.03, 2.99] |
| 4 Serious adverse events ‐ based on adequacy of the amount of calories | 43 | 3935 | Risk Ratio (M‐H, Random, 95% CI) | 0.85 [0.74, 0.98] |
| 4.1 Clearly adequate in intervention and clearly inadequate in control | 9 | 769 | Risk Ratio (M‐H, Random, 95% CI) | 0.77 [0.54, 1.10] |
| 4.2 Inadequate in the experimental or adequate in the control | 8 | 411 | Risk Ratio (M‐H, Random, 95% CI) | 0.86 [0.55, 1.35] |
| 4.3 Experimental group is overfed | 3 | 115 | Risk Ratio (M‐H, Random, 95% CI) | 0.64 [0.13, 3.12] |
| 4.4 Unclear intake in control or experimental | 23 | 2640 | Risk Ratio (M‐H, Random, 95% CI) | 0.73 [0.55, 0.98] |
| 5 Serious adverse events ‐ different screening tools | 43 | 3935 | Risk Ratio (M‐H, Random, 95% CI) | 0.85 [0.74, 0.98] |
| 5.1 NRS 2002 | 0 | 0 | Risk Ratio (M‐H, Random, 95% CI) | 0.0 [0.0, 0.0] |
| 5.2 MUST | 0 | 0 | Risk Ratio (M‐H, Random, 95% CI) | 0.0 [0.0, 0.0] |
| 5.3 MNA | 0 | 0 | Risk Ratio (M‐H, Random, 95% CI) | 0.0 [0.0, 0.0] |
| 5.4 SGA | 1 | 323 | Risk Ratio (M‐H, Random, 95% CI) | 0.38 [0.13, 1.06] |
| 5.5 Other means | 42 | 3612 | Risk Ratio (M‐H, Random, 95% CI) | 0.87 [0.75, 1.00] |
| 6 Serious adverse events ‐ participants characterised as 'at nutritional risk' due to one of the following conditions | 43 | 3935 | Risk Ratio (M‐H, Random, 95% CI) | 0.85 [0.74, 0.98] |
| 6.1 Major surgery | 24 | 1918 | Risk Ratio (M‐H, Random, 95% CI) | 0.72 [0.53, 0.97] |
| 6.2 Stroke | 3 | 1027 | Risk Ratio (M‐H, Random, 95% CI) | 0.67 [0.37, 1.24] |
| 6.3 ICU participants including trauma | 6 | 334 | Risk Ratio (M‐H, Random, 95% CI) | 0.62 [0.32, 1.21] |
| 6.4 Frail elderly participants with less severe conditions known to increase protein requirements | 2 | 126 | Risk Ratio (M‐H, Random, 95% CI) | 2.84 [0.12, 66.14] |
| 6.5 Participants do not fall into one of the categories above | 8 | 530 | Risk Ratio (M‐H, Random, 95% CI) | 0.87 [0.58, 1.30] |
| 7 Serious adverse events ‐ participants characterised as 'at nutritional risk' due to one of the following criteria | 43 | 3935 | Risk Ratio (M‐H, Random, 95% CI) | 0.85 [0.74, 0.98] |
| 7.1 BMI less than 20.5 kg/m2 | 0 | 0 | Risk Ratio (M‐H, Random, 95% CI) | 0.0 [0.0, 0.0] |
| 7.2 Weight loss of at least 5% during the last three months | 0 | 0 | Risk Ratio (M‐H, Random, 95% CI) | 0.0 [0.0, 0.0] |
| 7.3 Weight loss of at least 10% during the last six months | 1 | 32 | Risk Ratio (M‐H, Random, 95% CI) | 0.88 [0.44, 1.78] |
| 7.4 Insufficient food intake during the last week (50% of requirements or less) | 0 | 0 | Risk Ratio (M‐H, Random, 95% CI) | 0.0 [0.0, 0.0] |
| 7.5 Participants characterised as 'at nutritional risk' by other means | 42 | 3903 | Risk Ratio (M‐H, Random, 95% CI) | 0.85 [0.74, 0.98] |
| 8 Serious adverse events ‐ participants characterised as 'at nutritional risk' due to biomarkers or anthropometrics | 43 | 3935 | Risk Ratio (M‐H, Random, 95% CI) | 0.85 [0.74, 0.98] |
| 8.1 Biomarkers | 3 | 551 | Risk Ratio (M‐H, Random, 95% CI) | 0.16 [0.02, 1.26] |
| 8.2 Anthropometric measures | 2 | 122 | Risk Ratio (M‐H, Random, 95% CI) | 0.71 [0.24, 2.08] |
| 8.3 Mixed | 0 | 0 | Risk Ratio (M‐H, Random, 95% CI) | 0.0 [0.0, 0.0] |
| 8.4 Characterised by other means | 38 | 3262 | Risk Ratio (M‐H, Random, 95% CI) | 0.86 [0.75, 1.00] |
| 9 Serious adverse events ‐ randomisation year | 43 | 3935 | Risk Ratio (M‐H, Random, 95% CI) | 0.85 [0.74, 0.98] |
| 9.1 Before 1960 | 0 | 0 | Risk Ratio (M‐H, Random, 95% CI) | 0.0 [0.0, 0.0] |
| 9.2 1960 to 1979 | 1 | 26 | Risk Ratio (M‐H, Random, 95% CI) | 1.36 [0.10, 19.50] |
| 9.3 1980 to 1999 | 28 | 2749 | Risk Ratio (M‐H, Random, 95% CI) | 0.92 [0.79, 1.08] |
| 9.4 After 1999 | 14 | 1160 | Risk Ratio (M‐H, Random, 95% CI) | 0.60 [0.43, 0.83] |
| 10 Serious adverse events ‐ trials where the intervention lasts fewer than three days compared with trials where the intervention lasts three days or more | 43 | 3935 | Risk Ratio (M‐H, Random, 95% CI) | 0.85 [0.74, 0.98] |
| 10.1 Three days or more | 37 | 3500 | Risk Ratio (M‐H, Random, 95% CI) | 0.86 [0.75, 1.00] |
| 10.2 Less than three days | 6 | 435 | Risk Ratio (M‐H, Random, 95% CI) | 0.71 [0.39, 1.27] |
| 10.3 Unknown | 0 | 0 | Risk Ratio (M‐H, Random, 95% CI) | 0.0 [0.0, 0.0] |
| 11 Serious adverse events ‐ 'best‐worst case' scenario | 43 | 3977 | Risk Ratio (M‐H, Random, 95% CI) | 0.82 [0.72, 0.94] |
| 12 Serious adverse events ‐ 'worst‐best case' scenario | 43 | 3977 | Risk Ratio (M‐H, Random, 95% CI) | 0.83 [0.70, 0.99] |
| 13 Serious adverse events co‐interventions | 43 | 3935 | Risk Ratio (M‐H, Fixed, 95% CI) | 0.83 [0.72, 0.95] |
| 13.1 received nutrition support as co‐intervention | 3 | 126 | Risk Ratio (M‐H, Fixed, 95% CI) | 0.66 [0.39, 1.12] |
| 13.2 did not receive nutrition support as co‐intervention | 34 | 3466 | Risk Ratio (M‐H, Fixed, 95% CI) | 0.83 [0.72, 0.96] |
| 13.3 delayed versus early nutrition support | 6 | 343 | Risk Ratio (M‐H, Fixed, 95% CI) | 0.93 [0.51, 1.69] |
23.1. Analysis.
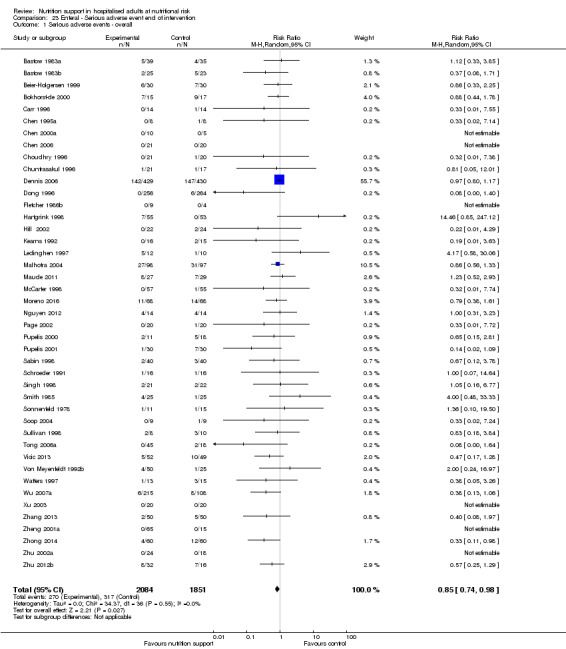
Comparison 23 Enteral ‐ Serious adverse event end of intervention, Outcome 1 Serious adverse events ‐ overall.
23.2. Analysis.
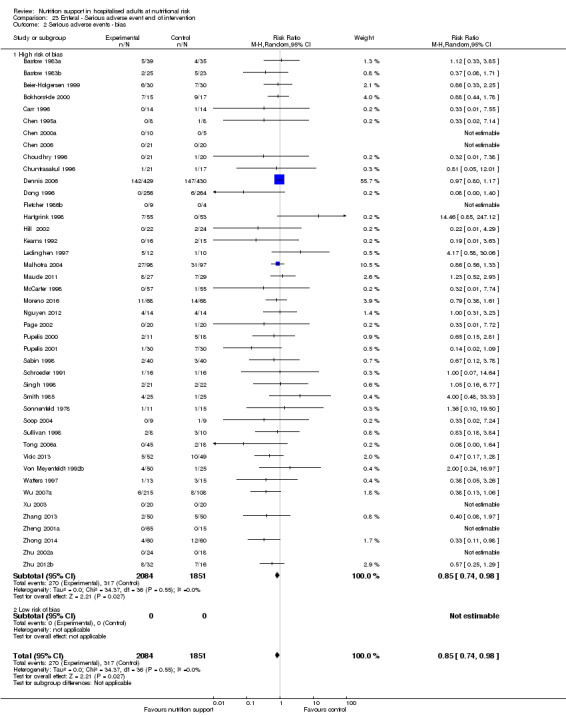
Comparison 23 Enteral ‐ Serious adverse event end of intervention, Outcome 2 Serious adverse events ‐ bias.
23.3. Analysis.
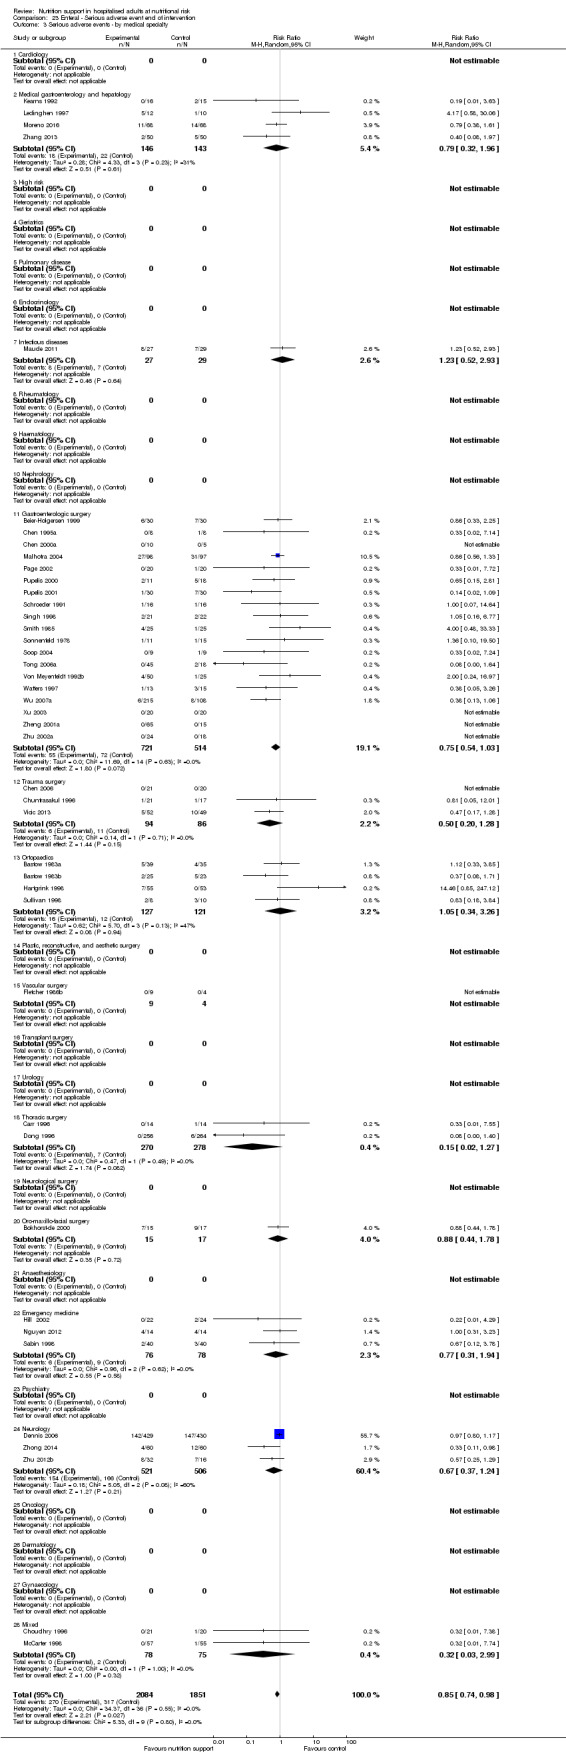
Comparison 23 Enteral ‐ Serious adverse event end of intervention, Outcome 3 Serious adverse events ‐ by medical specialty.
23.4. Analysis.
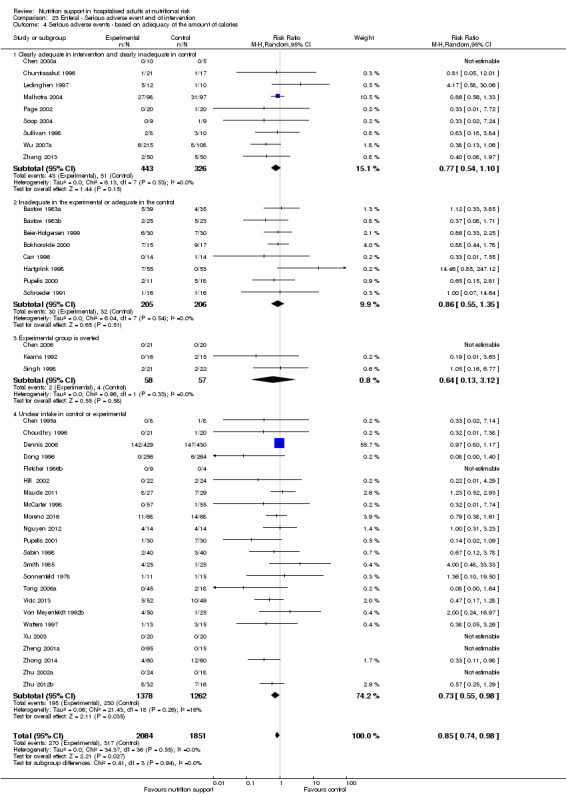
Comparison 23 Enteral ‐ Serious adverse event end of intervention, Outcome 4 Serious adverse events ‐ based on adequacy of the amount of calories.
23.5. Analysis.
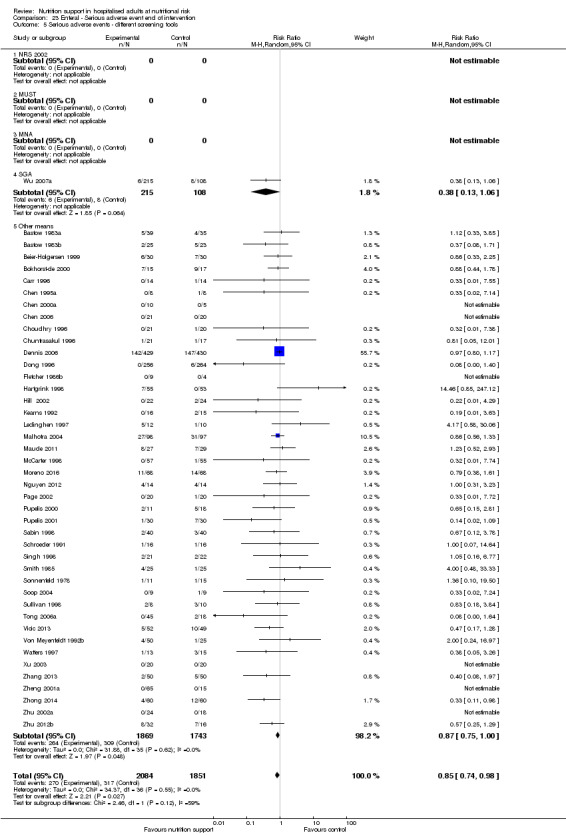
Comparison 23 Enteral ‐ Serious adverse event end of intervention, Outcome 5 Serious adverse events ‐ different screening tools.
23.6. Analysis.
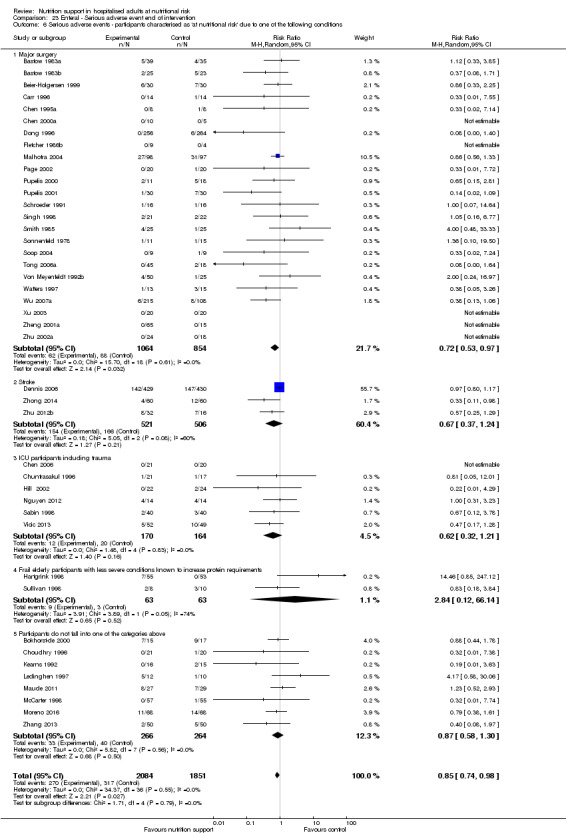
Comparison 23 Enteral ‐ Serious adverse event end of intervention, Outcome 6 Serious adverse events ‐ participants characterised as 'at nutritional risk' due to one of the following conditions.
23.7. Analysis.
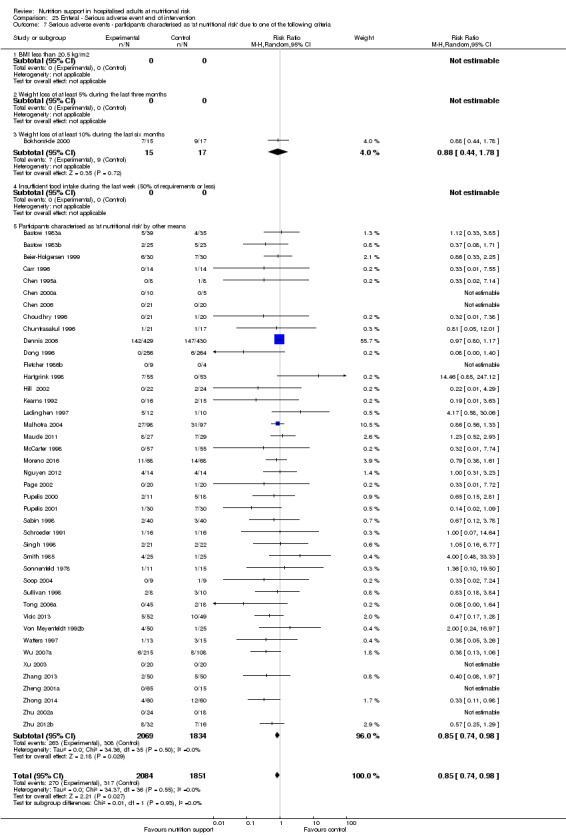
Comparison 23 Enteral ‐ Serious adverse event end of intervention, Outcome 7 Serious adverse events ‐ participants characterised as 'at nutritional risk' due to one of the following criteria.
23.8. Analysis.
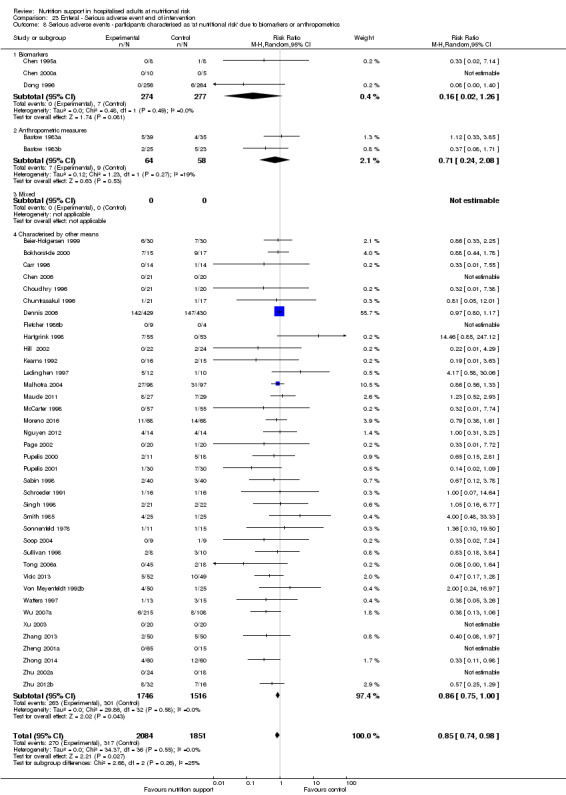
Comparison 23 Enteral ‐ Serious adverse event end of intervention, Outcome 8 Serious adverse events ‐ participants characterised as 'at nutritional risk' due to biomarkers or anthropometrics.
23.9. Analysis.
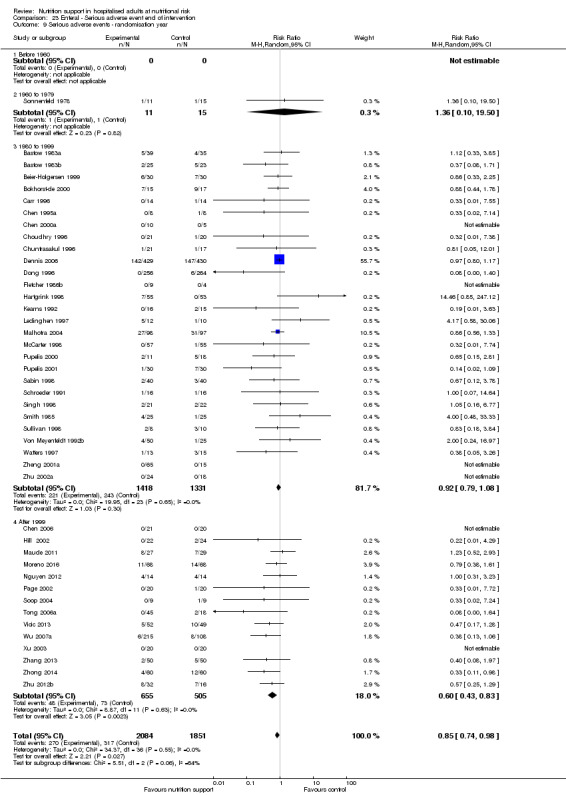
Comparison 23 Enteral ‐ Serious adverse event end of intervention, Outcome 9 Serious adverse events ‐ randomisation year.
23.10. Analysis.
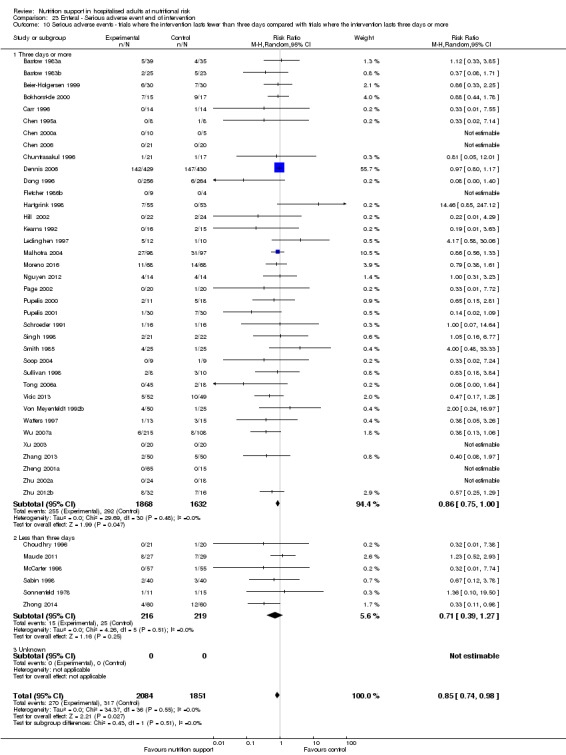
Comparison 23 Enteral ‐ Serious adverse event end of intervention, Outcome 10 Serious adverse events ‐ trials where the intervention lasts fewer than three days compared with trials where the intervention lasts three days or more.
23.11. Analysis.
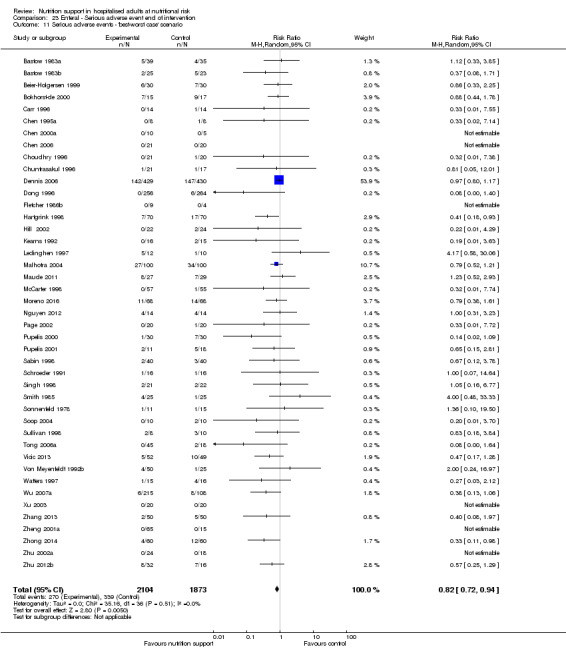
Comparison 23 Enteral ‐ Serious adverse event end of intervention, Outcome 11 Serious adverse events ‐ 'best‐worst case' scenario.
23.12. Analysis.
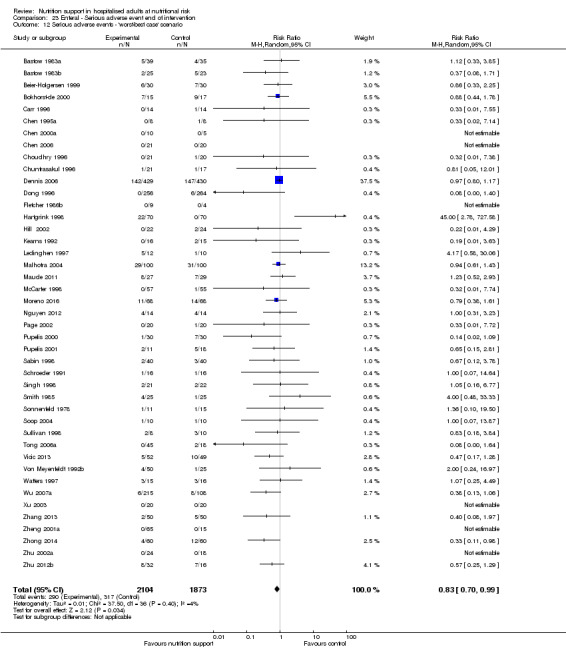
Comparison 23 Enteral ‐ Serious adverse event end of intervention, Outcome 12 Serious adverse events ‐ 'worst‐best case' scenario.
23.13. Analysis.
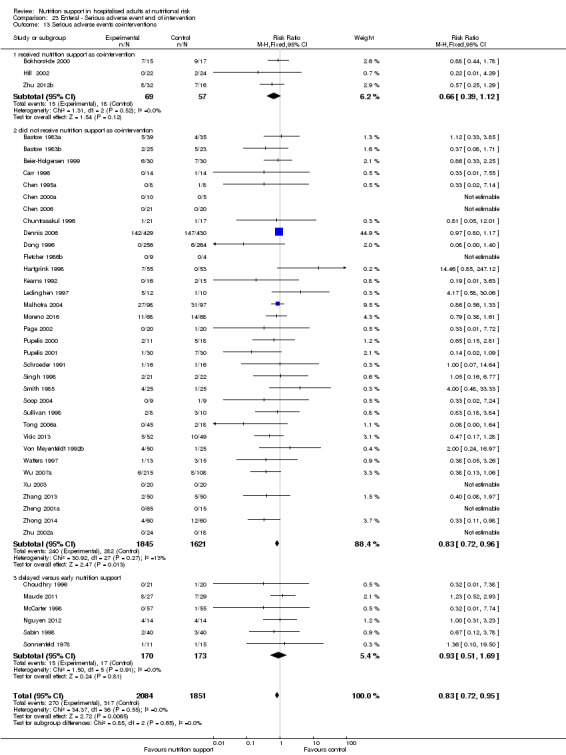
Comparison 23 Enteral ‐ Serious adverse event end of intervention, Outcome 13 Serious adverse events co‐interventions.
Comparison 24. Enteral ‐ Serious adverse event maximum follow‐up.
| Outcome or subgroup title | No. of studies | No. of participants | Statistical method | Effect size |
|---|---|---|---|---|
| 1 Serious adverse events ‐ overall | 49 | 4425 | Risk Ratio (M‐H, Random, 95% CI) | 0.82 [0.73, 0.91] |
| 2 Serious adverse events ‐ bias | 49 | 4425 | Risk Ratio (M‐H, Random, 95% CI) | 0.82 [0.73, 0.91] |
| 2.1 High risk of bias | 49 | 4425 | Risk Ratio (M‐H, Random, 95% CI) | 0.82 [0.73, 0.91] |
| 2.2 Low risk of bias | 0 | 0 | Risk Ratio (M‐H, Random, 95% CI) | 0.0 [0.0, 0.0] |
| 3 Serious adverse events ‐ by medical speciality | 49 | 4425 | Risk Ratio (M‐H, Random, 95% CI) | 0.82 [0.73, 0.91] |
| 3.1 Cardiology | 0 | 0 | Risk Ratio (M‐H, Random, 95% CI) | 0.0 [0.0, 0.0] |
| 3.2 Medical gastroenterology and hepatology | 4 | 289 | Risk Ratio (M‐H, Random, 95% CI) | 0.89 [0.65, 1.23] |
| 3.3 Geriatrics | 0 | 0 | Risk Ratio (M‐H, Random, 95% CI) | 0.0 [0.0, 0.0] |
| 3.4 Pulmonary disease | 0 | 0 | Risk Ratio (M‐H, Random, 95% CI) | 0.0 [0.0, 0.0] |
| 3.5 Endocrinology | 0 | 0 | Risk Ratio (M‐H, Random, 95% CI) | 0.0 [0.0, 0.0] |
| 3.6 Infectious diseases | 1 | 56 | Risk Ratio (M‐H, Random, 95% CI) | 1.23 [0.52, 2.93] |
| 3.7 Rheumatology | 0 | 0 | Risk Ratio (M‐H, Random, 95% CI) | 0.0 [0.0, 0.0] |
| 3.8 Haematology | 0 | 0 | Risk Ratio (M‐H, Random, 95% CI) | 0.0 [0.0, 0.0] |
| 3.9 Nephrology | 0 | 0 | Risk Ratio (M‐H, Random, 95% CI) | 0.0 [0.0, 0.0] |
| 3.10 Gastroenterologic surgery | 21 | 1456 | Risk Ratio (M‐H, Random, 95% CI) | 0.68 [0.51, 0.91] |
| 3.11 Trauma surgery | 5 | 245 | Risk Ratio (M‐H, Random, 95% CI) | 0.58 [0.30, 1.11] |
| 3.12 Ortopaedics | 4 | 248 | Risk Ratio (M‐H, Random, 95% CI) | 0.91 [0.28, 2.96] |
| 3.13 Plastic, reconstructive, and aesthetic surgery | 0 | 0 | Risk Ratio (M‐H, Random, 95% CI) | 0.0 [0.0, 0.0] |
| 3.14 Vascular surgery | 1 | 13 | Risk Ratio (M‐H, Random, 95% CI) | 0.0 [0.0, 0.0] |
| 3.15 Transplant surgery | 0 | 0 | Risk Ratio (M‐H, Random, 95% CI) | 0.0 [0.0, 0.0] |
| 3.16 Urology | 0 | 0 | Risk Ratio (M‐H, Random, 95% CI) | 0.0 [0.0, 0.0] |
| 3.17 Thoracic surgery | 2 | 548 | Risk Ratio (M‐H, Random, 95% CI) | 0.15 [0.02, 1.27] |
| 3.18 Neurological surgery | 0 | 0 | Risk Ratio (M‐H, Random, 95% CI) | 0.0 [0.0, 0.0] |
| 3.19 Oro‐maxillo‐facial surgery | 1 | 32 | Risk Ratio (M‐H, Random, 95% CI) | 0.88 [0.44, 1.78] |
| 3.20 Anaesthesiology | 0 | 0 | Risk Ratio (M‐H, Random, 95% CI) | 0.0 [0.0, 0.0] |
| 3.21 Emergency medicine | 4 | 213 | Risk Ratio (M‐H, Random, 95% CI) | 0.92 [0.60, 1.40] |
| 3.22 Psychiatry | 0 | 0 | Risk Ratio (M‐H, Random, 95% CI) | 0.0 [0.0, 0.0] |
| 3.23 Neurology | 4 | 1172 | Risk Ratio (M‐H, Random, 95% CI) | 0.58 [0.34, 1.00] |
| 3.24 Oncology | 0 | 0 | Risk Ratio (M‐H, Random, 95% CI) | 0.0 [0.0, 0.0] |
| 3.25 Dermatology | 0 | 0 | Risk Ratio (M‐H, Random, 95% CI) | 0.0 [0.0, 0.0] |
| 3.26 Gynaecology | 0 | 0 | Risk Ratio (M‐H, Random, 95% CI) | 0.0 [0.0, 0.0] |
| 3.27 Mixed | 2 | 153 | Risk Ratio (M‐H, Random, 95% CI) | 0.63 [0.18, 2.21] |
| 4 Serious adverse events ‐ based on adequacy of the amount of calories | 49 | 4425 | Risk Ratio (M‐H, Random, 95% CI) | 0.82 [0.73, 0.91] |
| 4.1 Clearly adequate in intervention and clearly inadequate in control | 12 | 987 | Risk Ratio (M‐H, Random, 95% CI) | 0.72 [0.54, 0.96] |
| 4.2 Inadequate in the experimental or adequate in the control | 8 | 411 | Risk Ratio (M‐H, Random, 95% CI) | 0.86 [0.55, 1.35] |
| 4.3 Experimental group is overfed | 4 | 215 | Risk Ratio (M‐H, Random, 95% CI) | 0.77 [0.42, 1.42] |
| 4.4 Unclear intake in control or experimental | 25 | 2812 | Risk Ratio (M‐H, Random, 95% CI) | 0.75 [0.60, 0.94] |
| 5 Serious adverse events ‐ different screening tools | 49 | 4425 | Risk Ratio (M‐H, Random, 95% CI) | 0.82 [0.73, 0.91] |
| 5.1 NRS 2002 | 0 | 0 | Risk Ratio (M‐H, Random, 95% CI) | 0.0 [0.0, 0.0] |
| 5.2 MUST | 0 | 0 | Risk Ratio (M‐H, Random, 95% CI) | 0.0 [0.0, 0.0] |
| 5.3 MNA | 0 | 0 | Risk Ratio (M‐H, Random, 95% CI) | 0.0 [0.0, 0.0] |
| 5.4 SGA | 1 | 323 | Risk Ratio (M‐H, Random, 95% CI) | 0.38 [0.13, 1.06] |
| 5.5 Other means | 48 | 4102 | Risk Ratio (M‐H, Random, 95% CI) | 0.82 [0.74, 0.92] |
| 6 Serious adverse events ‐ participants characterised as 'at nutritional risk' due to one of the following conditions | 49 | 4425 | Risk Ratio (M‐H, Random, 95% CI) | 0.82 [0.73, 0.91] |
| 6.1 Major surgery | 26 | 2139 | Risk Ratio (M‐H, Random, 95% CI) | 0.67 [0.51, 0.88] |
| 6.2 Stroke | 4 | 1172 | Risk Ratio (M‐H, Random, 95% CI) | 0.58 [0.34, 1.00] |
| 6.3 ICU participants including trauma | 9 | 458 | Risk Ratio (M‐H, Random, 95% CI) | 0.80 [0.56, 1.14] |
| 6.4 Frail elderly participants with less severe conditions known to increase protein requirements | 2 | 126 | Risk Ratio (M‐H, Random, 95% CI) | 2.24 [0.05, 95.92] |
| 6.5 Participants do not fall into one of the categories above | 8 | 530 | Risk Ratio (M‐H, Random, 95% CI) | 0.90 [0.69, 1.19] |
| 7 Serious adverse events ‐ participants characterised as 'at nutritional risk' due to one of the following criteria | 49 | 4425 | Risk Ratio (M‐H, Random, 95% CI) | 0.82 [0.73, 0.91] |
| 7.1 BMI less than 20.5 kg/m2 | 0 | 0 | Risk Ratio (M‐H, Random, 95% CI) | 0.0 [0.0, 0.0] |
| 7.2 Weight loss of at least 5% during the last three months | 0 | 0 | Risk Ratio (M‐H, Random, 95% CI) | 0.0 [0.0, 0.0] |
| 7.3 Weight loss of at least 10% during the last six months | 1 | 32 | Risk Ratio (M‐H, Random, 95% CI) | 0.88 [0.44, 1.78] |
| 7.4 Insufficient food intake during the last week (50% of requirements or less) | 0 | 0 | Risk Ratio (M‐H, Random, 95% CI) | 0.0 [0.0, 0.0] |
| 7.5 Participants characterised as 'at nutritional risk' by other means | 48 | 4393 | Risk Ratio (M‐H, Random, 95% CI) | 0.81 [0.72, 0.91] |
| 8 Serious adverse events ‐ participants characterised as 'at nutritional risk' due to biomarkers or anthropometrics | 49 | 4425 | Risk Ratio (M‐H, Random, 95% CI) | 0.82 [0.73, 0.91] |
| 8.1 Biomarkers | 3 | 551 | Risk Ratio (M‐H, Random, 95% CI) | 0.16 [0.02, 1.26] |
| 8.2 Anthropometric measures | 2 | 122 | Risk Ratio (M‐H, Random, 95% CI) | 0.71 [0.24, 2.08] |
| 8.3 Both | 0 | 0 | Risk Ratio (M‐H, Random, 95% CI) | 0.0 [0.0, 0.0] |
| 8.4 Characterised by other means | 44 | 3752 | Risk Ratio (M‐H, Random, 95% CI) | 0.82 [0.74, 0.92] |
| 9 Serious adverse events ‐ randomisation year | 49 | 4425 | Risk Ratio (M‐H, Random, 95% CI) | 0.82 [0.73, 0.91] |
| 9.1 Before 1960 | 0 | 0 | Risk Ratio (M‐H, Random, 95% CI) | 0.0 [0.0, 0.0] |
| 9.2 1960 to 1979 | 1 | 26 | Risk Ratio (M‐H, Random, 95% CI) | 1.36 [0.10, 19.50] |
| 9.3 1980 to 1999 | 28 | 2591 | Risk Ratio (M‐H, Random, 95% CI) | 0.88 [0.77, 1.00] |
| 9.4 After 1999 | 20 | 1808 | Risk Ratio (M‐H, Random, 95% CI) | 0.70 [0.58, 0.85] |
| 10 Serious adverse events ‐ trials where the intervention lasts fewer than three days compared with trials where the intervention lasts three days or more | 49 | 4425 | Risk Ratio (M‐H, Random, 95% CI) | 0.82 [0.73, 0.91] |
| 10.1 Three days or more | 41 | 3893 | Risk Ratio (M‐H, Random, 95% CI) | 0.77 [0.66, 0.89] |
| 10.2 Less than three days | 8 | 532 | Risk Ratio (M‐H, Random, 95% CI) | 0.86 [0.60, 1.22] |
| 10.3 Unknown | 0 | 0 | Risk Ratio (M‐H, Random, 95% CI) | 0.0 [0.0, 0.0] |
| 11 Serious adverse events co‐interventions | 49 | 4425 | Risk Ratio (M‐H, Fixed, 95% CI) | 0.78 [0.70, 0.87] |
| 11.1 Received nutrition support as co‐intervention | 3 | 126 | Risk Ratio (M‐H, Fixed, 95% CI) | 0.66 [0.39, 1.12] |
| 11.2 did not receive nutrition support as co‐intervention | 39 | 3918 | Risk Ratio (M‐H, Fixed, 95% CI) | 0.77 [0.68, 0.86] |
| 11.3 delayed versus early nutrition support | 7 | 381 | Risk Ratio (M‐H, Fixed, 95% CI) | 1.06 [0.68, 1.64] |
| 12 Serious adverse events ‐ 'best‐worse case' scenario (enteral nutrition) | 48 | 4489 | Risk Ratio (M‐H, Random, 95% CI) | 0.62 [0.51, 0.75] |
| 13 Serious adverse events ‐ 'worst‐best case' scenario (enteral nutrition) | 48 | 4489 | Risk Ratio (M‐H, Random, 95% CI) | 0.81 [0.69, 0.95] |
24.1. Analysis.
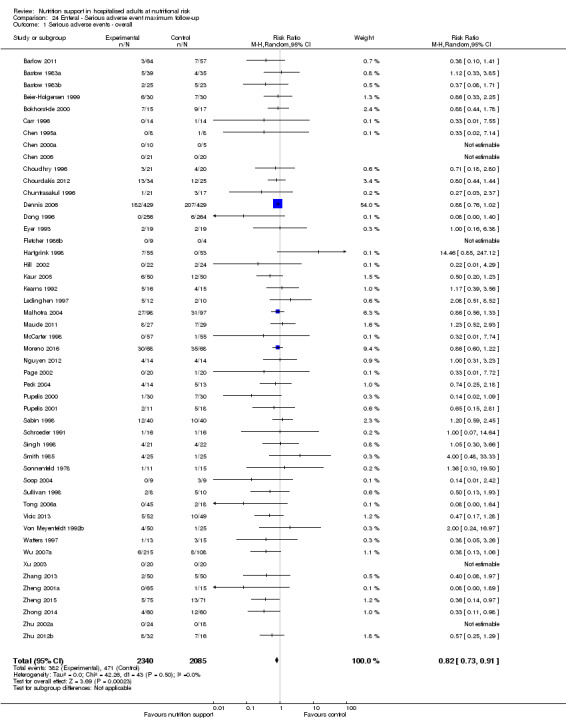
Comparison 24 Enteral ‐ Serious adverse event maximum follow‐up, Outcome 1 Serious adverse events ‐ overall.
24.2. Analysis.
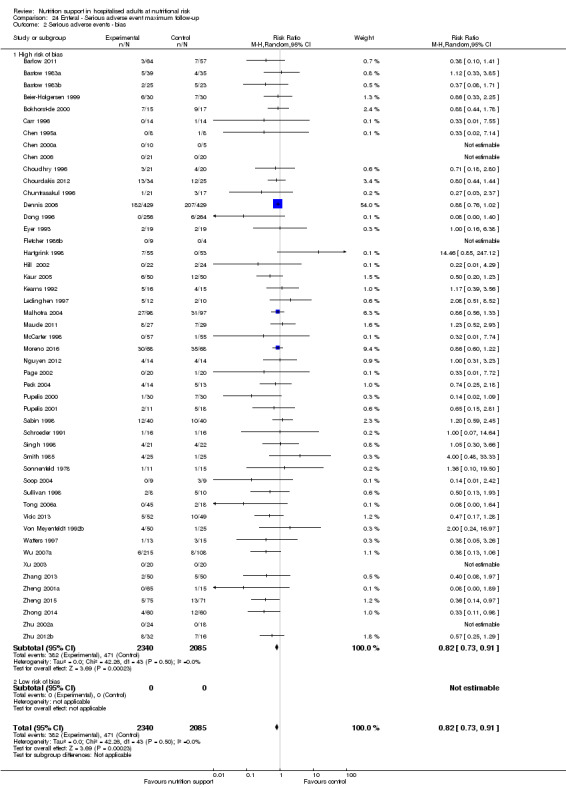
Comparison 24 Enteral ‐ Serious adverse event maximum follow‐up, Outcome 2 Serious adverse events ‐ bias.
24.3. Analysis.
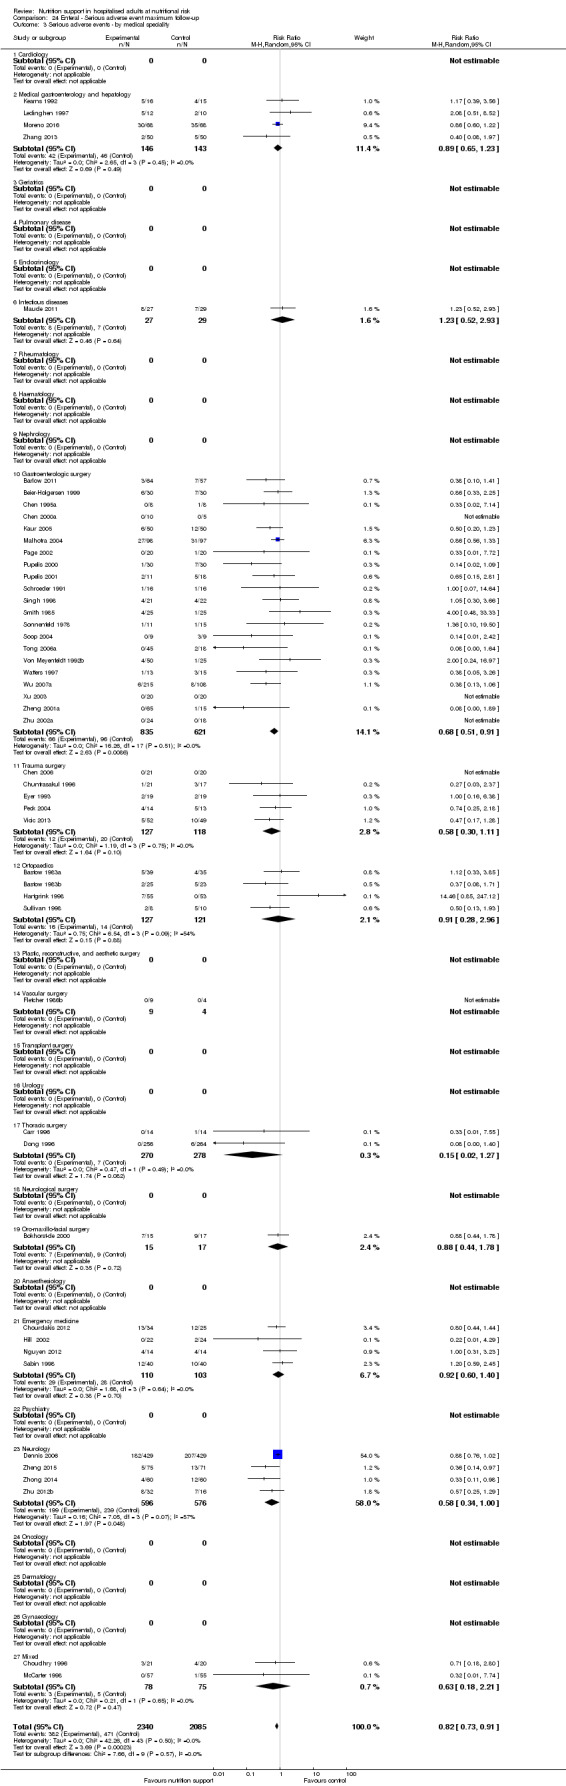
Comparison 24 Enteral ‐ Serious adverse event maximum follow‐up, Outcome 3 Serious adverse events ‐ by medical speciality.
24.4. Analysis.
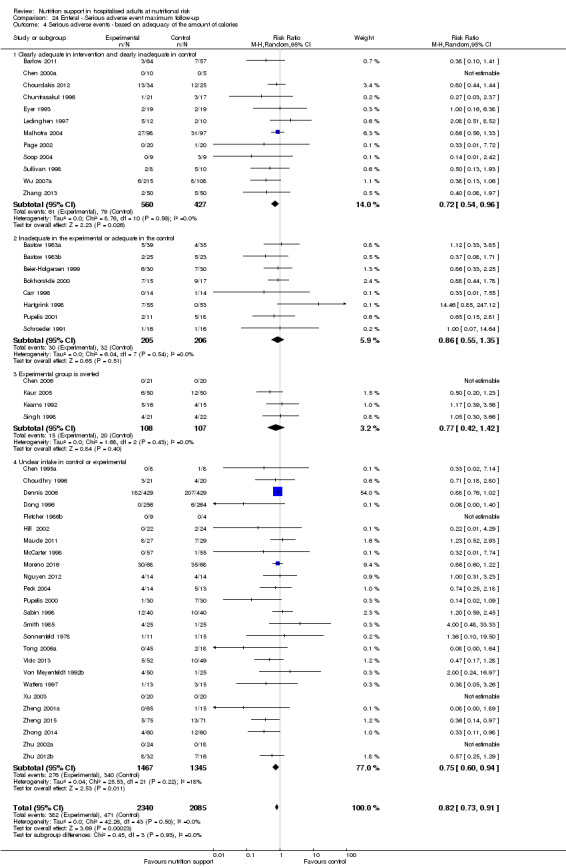
Comparison 24 Enteral ‐ Serious adverse event maximum follow‐up, Outcome 4 Serious adverse events ‐ based on adequacy of the amount of calories.
24.5. Analysis.
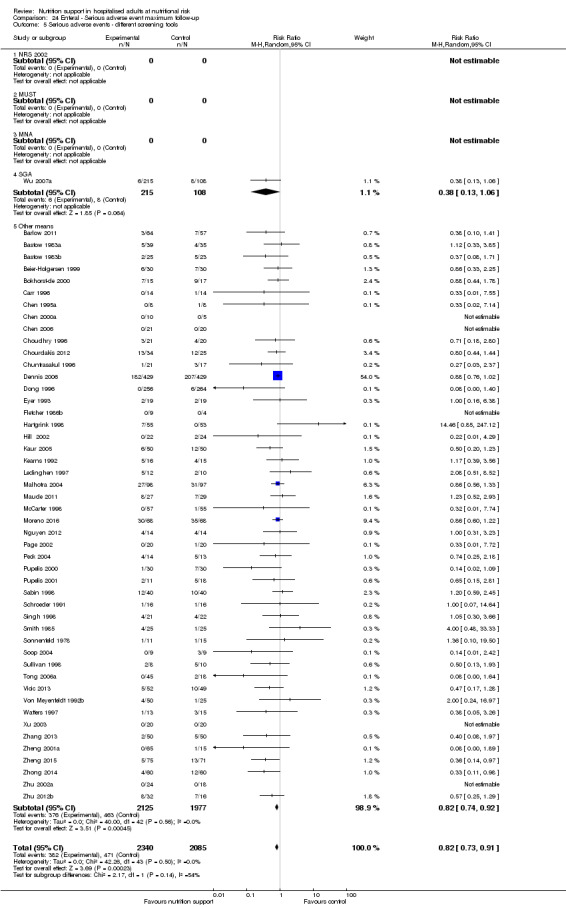
Comparison 24 Enteral ‐ Serious adverse event maximum follow‐up, Outcome 5 Serious adverse events ‐ different screening tools.
24.6. Analysis.
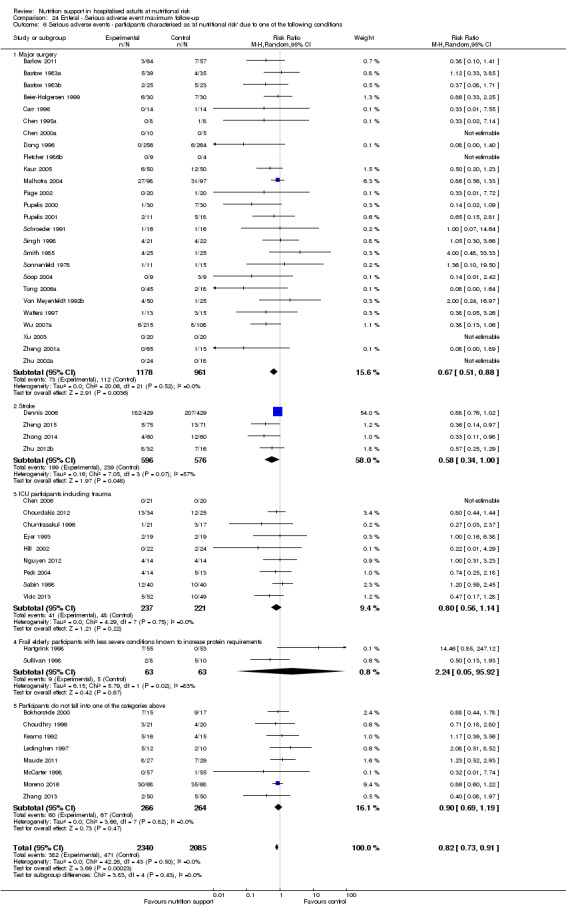
Comparison 24 Enteral ‐ Serious adverse event maximum follow‐up, Outcome 6 Serious adverse events ‐ participants characterised as 'at nutritional risk' due to one of the following conditions.
24.7. Analysis.
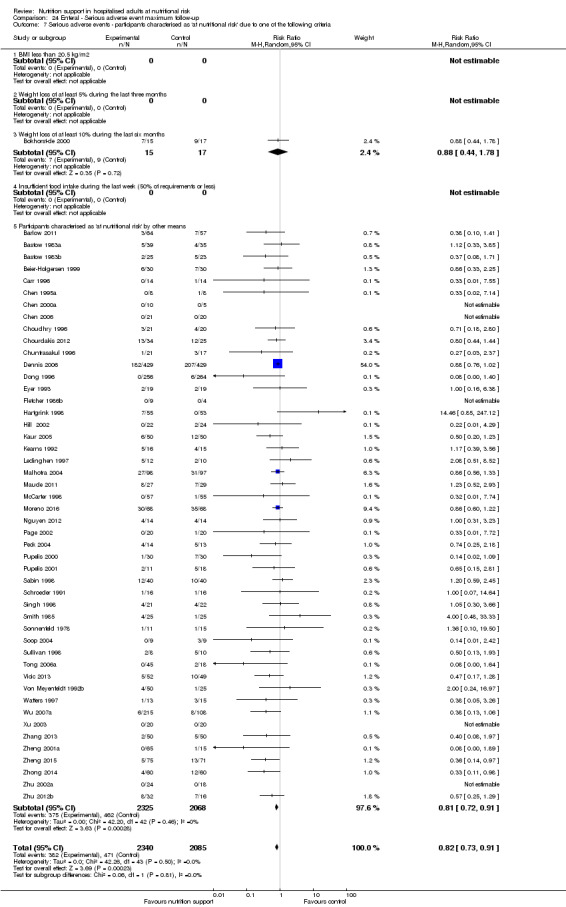
Comparison 24 Enteral ‐ Serious adverse event maximum follow‐up, Outcome 7 Serious adverse events ‐ participants characterised as 'at nutritional risk' due to one of the following criteria.
24.8. Analysis.
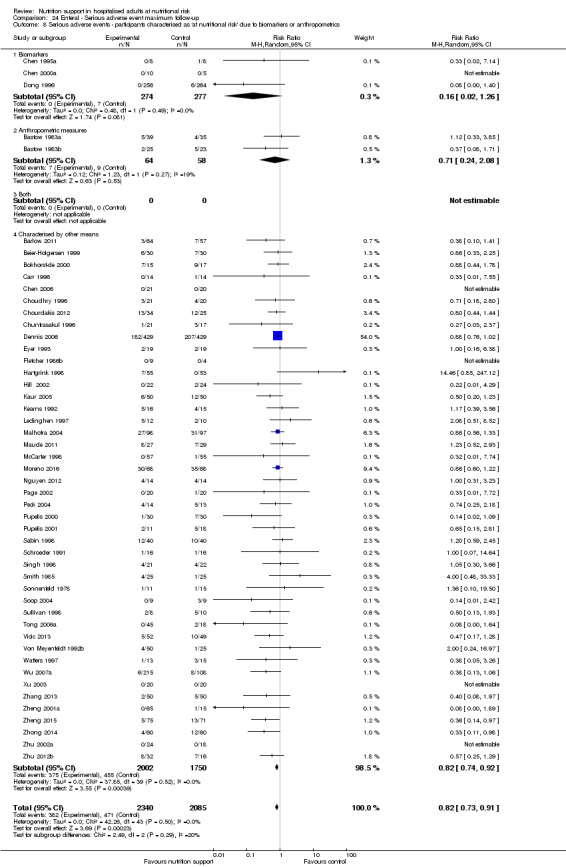
Comparison 24 Enteral ‐ Serious adverse event maximum follow‐up, Outcome 8 Serious adverse events ‐ participants characterised as 'at nutritional risk' due to biomarkers or anthropometrics.
24.9. Analysis.
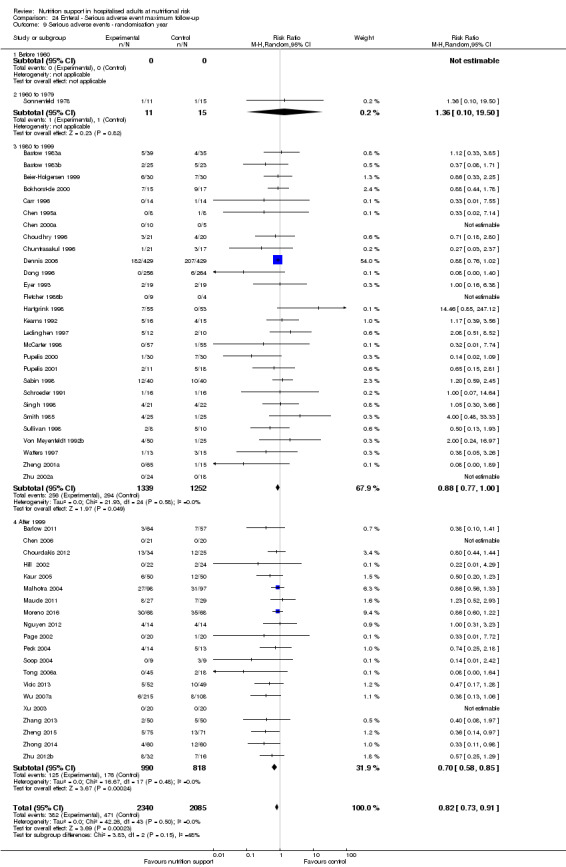
Comparison 24 Enteral ‐ Serious adverse event maximum follow‐up, Outcome 9 Serious adverse events ‐ randomisation year.
24.10. Analysis.
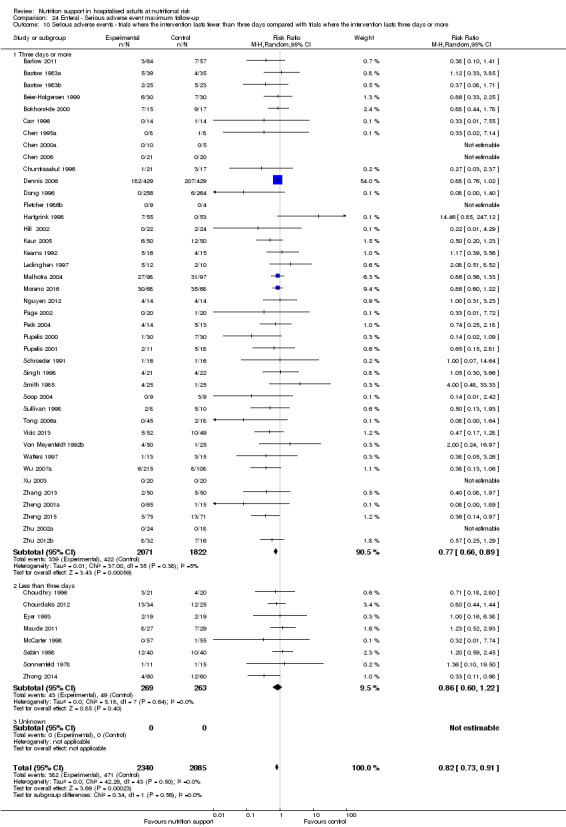
Comparison 24 Enteral ‐ Serious adverse event maximum follow‐up, Outcome 10 Serious adverse events ‐ trials where the intervention lasts fewer than three days compared with trials where the intervention lasts three days or more.
24.11. Analysis.

Comparison 24 Enteral ‐ Serious adverse event maximum follow‐up, Outcome 11 Serious adverse events co‐interventions.
24.12. Analysis.
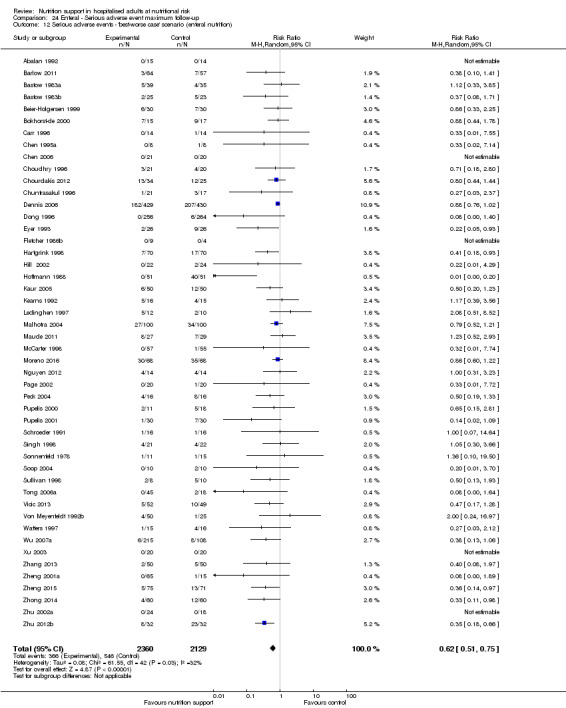
Comparison 24 Enteral ‐ Serious adverse event maximum follow‐up, Outcome 12 Serious adverse events ‐ 'best‐worse case' scenario (enteral nutrition).
24.13. Analysis.
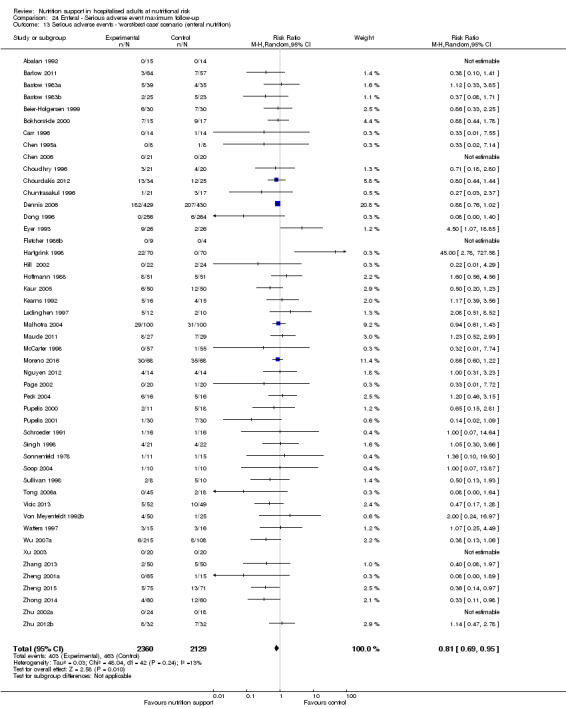
Comparison 24 Enteral ‐ Serious adverse event maximum follow‐up, Outcome 13 Serious adverse events ‐ 'worst‐best case' scenario (enteral nutrition).
Comparison 25. Parenteral ‐ All cause mortality ‐ end of intervention.
| Outcome or subgroup title | No. of studies | No. of participants | Statistical method | Effect size |
|---|---|---|---|---|
| 1 All‐cause mortality ‐ overall | 43 | 7313 | Risk Ratio (M‐H, Random, 95% CI) | 0.98 [0.83, 1.16] |
| 2 All‐cause mortality ‐ bias | 43 | 7313 | Risk Ratio (M‐H, Random, 95% CI) | 0.98 [0.83, 1.16] |
| 2.1 High risk of bias | 43 | 7313 | Risk Ratio (M‐H, Random, 95% CI) | 0.98 [0.83, 1.16] |
| 2.2 Low risk of bias | 0 | 0 | Risk Ratio (M‐H, Random, 95% CI) | 0.0 [0.0, 0.0] |
| 3 All‐cause mortality ‐ medical speciality | 43 | 7313 | Risk Ratio (M‐H, Random, 95% CI) | 0.98 [0.83, 1.16] |
| 3.1 Cardiology | 0 | 0 | Risk Ratio (M‐H, Random, 95% CI) | 0.0 [0.0, 0.0] |
| 3.2 Medical gastroenterology and hepatology | 7 | 259 | Risk Ratio (M‐H, Random, 95% CI) | 1.17 [0.58, 2.37] |
| 3.3 Geriatrics | 0 | 0 | Risk Ratio (M‐H, Random, 95% CI) | 0.0 [0.0, 0.0] |
| 3.4 Pulmonary disease | 1 | 25 | Risk Ratio (M‐H, Random, 95% CI) | 0.22 [0.01, 4.08] |
| 3.5 Endocrinology | 0 | 0 | Risk Ratio (M‐H, Random, 95% CI) | 0.0 [0.0, 0.0] |
| 3.6 Infectious diseases | 0 | 0 | Risk Ratio (M‐H, Random, 95% CI) | 0.0 [0.0, 0.0] |
| 3.7 Rheumatology | 0 | 0 | Risk Ratio (M‐H, Random, 95% CI) | 0.0 [0.0, 0.0] |
| 3.8 Haematology | 0 | 0 | Risk Ratio (M‐H, Random, 95% CI) | 0.0 [0.0, 0.0] |
| 3.9 Nephrology | 0 | 0 | Risk Ratio (M‐H, Random, 95% CI) | 0.0 [0.0, 0.0] |
| 3.10 Gastroenterologic surgery | 21 | 1553 | Risk Ratio (M‐H, Random, 95% CI) | 0.79 [0.52, 1.20] |
| 3.11 Trauma surgery | 2 | 45 | Risk Ratio (M‐H, Random, 95% CI) | 1.22 [0.66, 2.25] |
| 3.12 Orthopaedics | 0 | 0 | Risk Ratio (M‐H, Random, 95% CI) | 0.0 [0.0, 0.0] |
| 3.13 Plastic, reconstructive and aesthetic surgery | 0 | 0 | Risk Ratio (M‐H, Random, 95% CI) | 0.0 [0.0, 0.0] |
| 3.14 Vascular surgery | 1 | 15 | Risk Ratio (M‐H, Random, 95% CI) | 0.0 [0.0, 0.0] |
| 3.15 Transplant surgery | 2 | 47 | Risk Ratio (M‐H, Random, 95% CI) | 0.61 [0.23, 1.65] |
| 3.16 Urology | 0 | 0 | Risk Ratio (M‐H, Random, 95% CI) | 0.0 [0.0, 0.0] |
| 3.17 Thoracic surgery | 1 | 44 | Risk Ratio (M‐H, Random, 95% CI) | 1.6 [0.40, 6.32] |
| 3.18 Neurological surgery | 0 | 0 | Risk Ratio (M‐H, Random, 95% CI) | 0.0 [0.0, 0.0] |
| 3.19 Oro‐maxillo‐facial surgery | 0 | 0 | Risk Ratio (M‐H, Random, 95% CI) | 0.0 [0.0, 0.0] |
| 3.20 Anaesthesiology | 0 | 0 | Risk Ratio (M‐H, Random, 95% CI) | 0.0 [0.0, 0.0] |
| 3.21 Emergency medicine | 4 | 5044 | Risk Ratio (M‐H, Random, 95% CI) | 1.00 [0.81, 1.24] |
| 3.22 Psychiatry | 0 | 0 | Risk Ratio (M‐H, Random, 95% CI) | 0.0 [0.0, 0.0] |
| 3.23 Neurology | 0 | 0 | Risk Ratio (M‐H, Random, 95% CI) | 0.0 [0.0, 0.0] |
| 3.24 Oncology | 4 | 281 | Risk Ratio (M‐H, Random, 95% CI) | 1.19 [0.44, 3.21] |
| 3.25 Dermatology | 0 | 0 | Risk Ratio (M‐H, Random, 95% CI) | 0.0 [0.0, 0.0] |
| 3.26 Gynaecology | 0 | 0 | Risk Ratio (M‐H, Random, 95% CI) | 0.0 [0.0, 0.0] |
| 3.27 Mixed | 0 | 0 | Risk Ratio (M‐H, Random, 95% CI) | 0.0 [0.0, 0.0] |
| 4 All‐cause mortality ‐ based on adequacy of the amount of calories | 43 | 7313 | Risk Ratio (M‐H, Random, 95% CI) | 0.98 [0.83, 1.16] |
| 4.1 Clearly adequate in experimental group and clearly inadequate in control group | 7 | 5641 | Risk Ratio (M‐H, Random, 95% CI) | 0.98 [0.80, 1.20] |
| 4.2 Inadequate in the experimental group or adequate in the control group | 1 | 53 | Risk Ratio (M‐H, Random, 95% CI) | 1.16 [0.40, 3.33] |
| 4.3 Experimental group is overfed | 0 | 0 | Risk Ratio (M‐H, Random, 95% CI) | 0.0 [0.0, 0.0] |
| 4.4 Unclear intake in experimental group or control group | 35 | 1619 | Risk Ratio (M‐H, Random, 95% CI) | 0.95 [0.68, 1.32] |
| 5 All‐cause mortality ‐ different screening tools | 43 | 7313 | Risk Ratio (M‐H, Random, 95% CI) | 0.98 [0.83, 1.16] |
| 5.1 NRS 2002 | 1 | 4640 | Risk Ratio (M‐H, Random, 95% CI) | 1.04 [0.83, 1.30] |
| 5.2 MUST | 0 | 0 | Risk Ratio (M‐H, Random, 95% CI) | 0.0 [0.0, 0.0] |
| 5.3 MNA | 0 | 0 | Risk Ratio (M‐H, Random, 95% CI) | 0.0 [0.0, 0.0] |
| 5.4 SGA | 1 | 323 | Risk Ratio (M‐H, Random, 95% CI) | 0.75 [0.13, 4.44] |
| 5.5 Other means | 41 | 2350 | Risk Ratio (M‐H, Random, 95% CI) | 0.90 [0.69, 1.17] |
| 6 All‐cause mortality ‐ participants characterised as 'at nutritional risk' due to one of the following conditions | 43 | 7313 | Risk Ratio (M‐H, Random, 95% CI) | 0.98 [0.83, 1.16] |
| 6.1 Major surgery | 26 | 1822 | Risk Ratio (M‐H, Random, 95% CI) | 0.80 [0.56, 1.15] |
| 6.2 Stroke | 0 | 0 | Risk Ratio (M‐H, Random, 95% CI) | 0.0 [0.0, 0.0] |
| 6.3 ICU participants including trauma | 6 | 5089 | Risk Ratio (M‐H, Random, 95% CI) | 1.02 [0.84, 1.25] |
| 6.4 Frail elderly participants with less severe conditions known to increase protein requirements | 1 | 34 | Risk Ratio (M‐H, Random, 95% CI) | 3.35 [0.15, 76.93] |
| 6.5 Participants do not fall into one of the categories above | 10 | 368 | Risk Ratio (M‐H, Random, 95% CI) | 1.12 [0.60, 2.10] |
| 7 All‐cause mortality ‐ participants characterised as 'at nutritional risk' due to one of the following criteria | 43 | 7313 | Risk Ratio (M‐H, Random, 95% CI) | 0.98 [0.83, 1.16] |
| 7.1 BMI less than 20.5 kg/m2 | 0 | 0 | Risk Ratio (M‐H, Random, 95% CI) | 0.0 [0.0, 0.0] |
| 7.2 Weight loss of at least 5% during the last three months | 0 | 0 | Risk Ratio (M‐H, Random, 95% CI) | 0.0 [0.0, 0.0] |
| 7.3 Weight loss of at least 10% during the last six months | 0 | 0 | Risk Ratio (M‐H, Random, 95% CI) | 0.0 [0.0, 0.0] |
| 7.4 Insufficient food intake during the last week (50% of requirements or less) | 0 | 0 | Risk Ratio (M‐H, Random, 95% CI) | 0.0 [0.0, 0.0] |
| 7.5 Participants characterised as 'at nutritional risk' by other means | 43 | 7313 | Risk Ratio (M‐H, Random, 95% CI) | 0.98 [0.83, 1.16] |
| 8 All‐cause mortality ‐ participants characterised as 'at nutritional risk' due to biomarkers or anthropometrics | 43 | 7313 | Risk Ratio (M‐H, Random, 95% CI) | 0.98 [0.83, 1.16] |
| 8.1 Biomarkers | 2 | 43 | Risk Ratio (M‐H, Random, 95% CI) | 0.22 [0.01, 4.08] |
| 8.2 Anthropometric measures | 3 | 137 | Risk Ratio (M‐H, Random, 95% CI) | 1.31 [0.38, 4.58] |
| 8.3 Both | 3 | 75 | Risk Ratio (M‐H, Random, 95% CI) | 0.66 [0.14, 3.07] |
| 8.4 Characterised by other means | 35 | 7058 | Risk Ratio (M‐H, Random, 95% CI) | 0.98 [0.83, 1.17] |
| 9 All‐cause mortality ‐ randomisation year | 43 | 7313 | Risk Ratio (M‐H, Random, 95% CI) | 0.98 [0.83, 1.16] |
| 9.1 Before 1960 | 0 | 0 | Risk Ratio (M‐H, Random, 95% CI) | 0.0 [0.0, 0.0] |
| 9.2 1960‐1979 | 3 | 95 | Risk Ratio (M‐H, Random, 95% CI) | 1.85 [0.58, 5.88] |
| 9.3 1980‐1999 | 34 | 1694 | Risk Ratio (M‐H, Random, 95% CI) | 0.91 [0.68, 1.21] |
| 9.4 After 1999 | 6 | 5524 | Risk Ratio (M‐H, Random, 95% CI) | 1.00 [0.81, 1.23] |
| 10 All‐cause mortality ‐ trials where the intervention lasts fewer than three days compared with trials where the intervention lasts three days or more | 43 | 7313 | Risk Ratio (M‐H, Random, 95% CI) | 0.98 [0.83, 1.16] |
| 10.1 Three days or more | 41 | 7206 | Risk Ratio (M‐H, Random, 95% CI) | 0.98 [0.83, 1.16] |
| 10.2 Less than three days | 1 | 80 | Risk Ratio (M‐H, Random, 95% CI) | 0.67 [0.12, 3.78] |
| 10.3 Unknown | 1 | 27 | Risk Ratio (M‐H, Random, 95% CI) | 0.0 [0.0, 0.0] |
| 11 All‐cause mortality ‐ 'best‐worst case' scenario | 43 | 7432 | Risk Ratio (M‐H, Random, 95% CI) | 0.73 [0.56, 0.97] |
| 12 All‐cause mortality ‐ 'worst‐best case' scenario | 43 | 7432 | Risk Ratio (M‐H, Random, 95% CI) | 1.20 [0.98, 1.47] |
| 13 All‐cause mortality co‐interventions | 43 | 7313 | Risk Ratio (M‐H, Fixed, 95% CI) | 0.98 [0.82, 1.16] |
| 13.1 received nutrition support as co‐intervention | 6 | 5066 | Risk Ratio (M‐H, Fixed, 95% CI) | 1.03 [0.83, 1.26] |
| 13.2 did not receive nutrition support as co‐intervention | 36 | 2167 | Risk Ratio (M‐H, Fixed, 95% CI) | 0.88 [0.66, 1.18] |
| 13.3 delayed versus early nutrition support | 1 | 80 | Risk Ratio (M‐H, Fixed, 95% CI) | 0.67 [0.12, 3.78] |
25.1. Analysis.
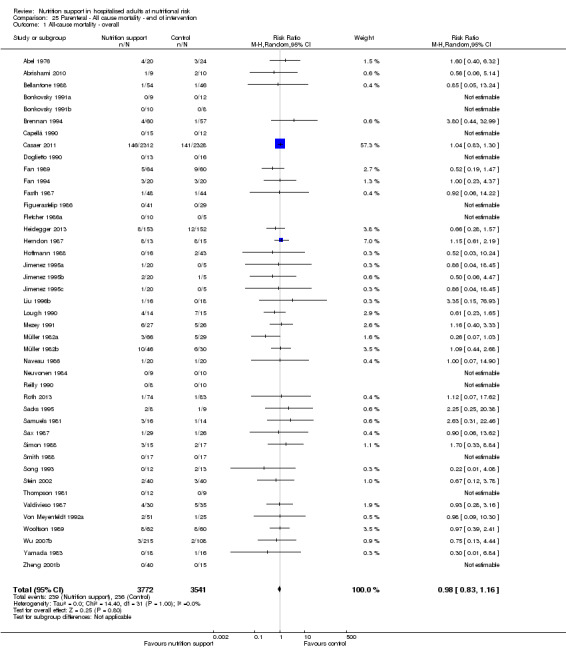
Comparison 25 Parenteral ‐ All cause mortality ‐ end of intervention, Outcome 1 All‐cause mortality ‐ overall.
25.2. Analysis.
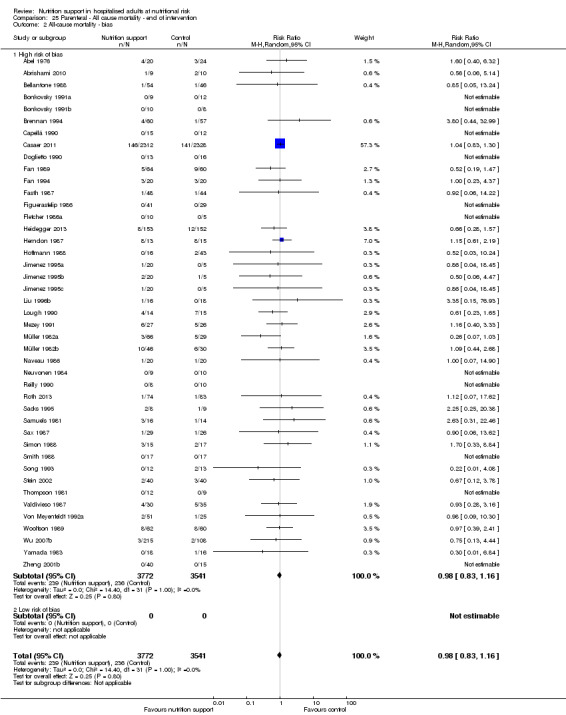
Comparison 25 Parenteral ‐ All cause mortality ‐ end of intervention, Outcome 2 All‐cause mortality ‐ bias.
25.3. Analysis.
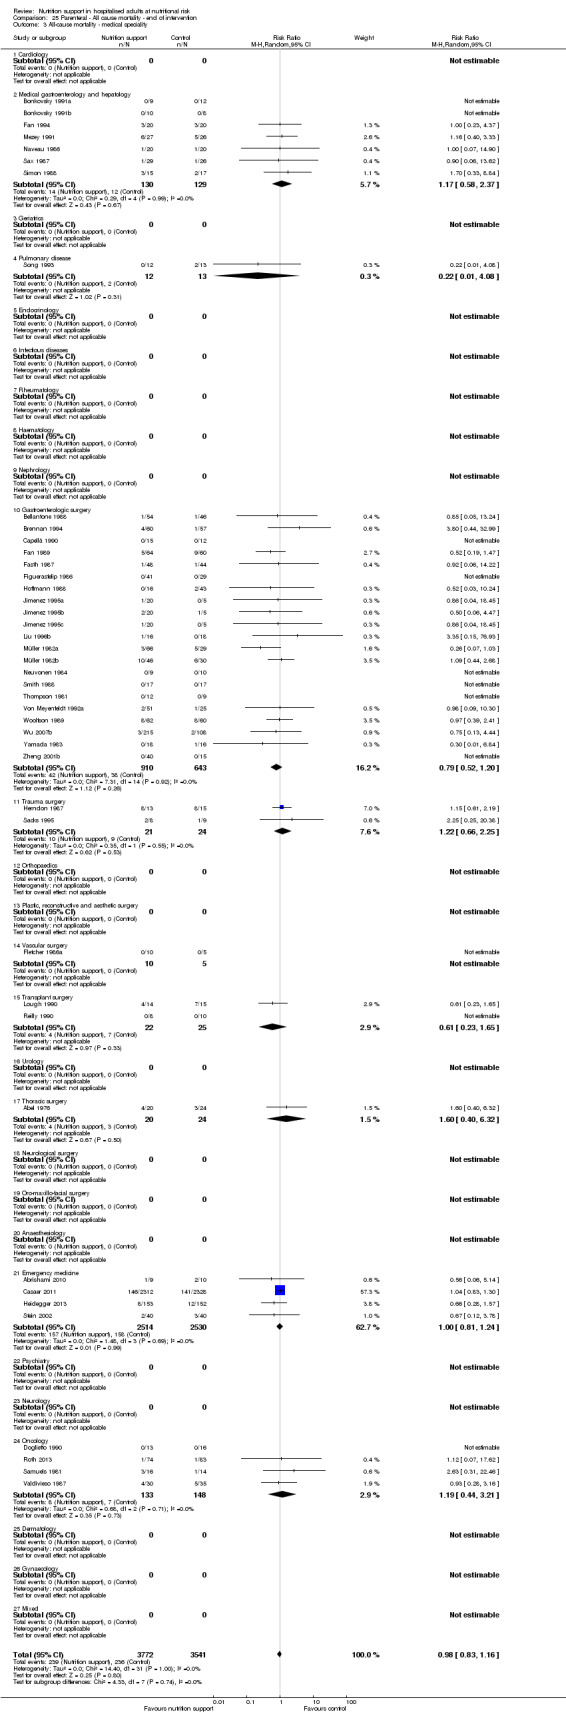
Comparison 25 Parenteral ‐ All cause mortality ‐ end of intervention, Outcome 3 All‐cause mortality ‐ medical speciality.
25.4. Analysis.
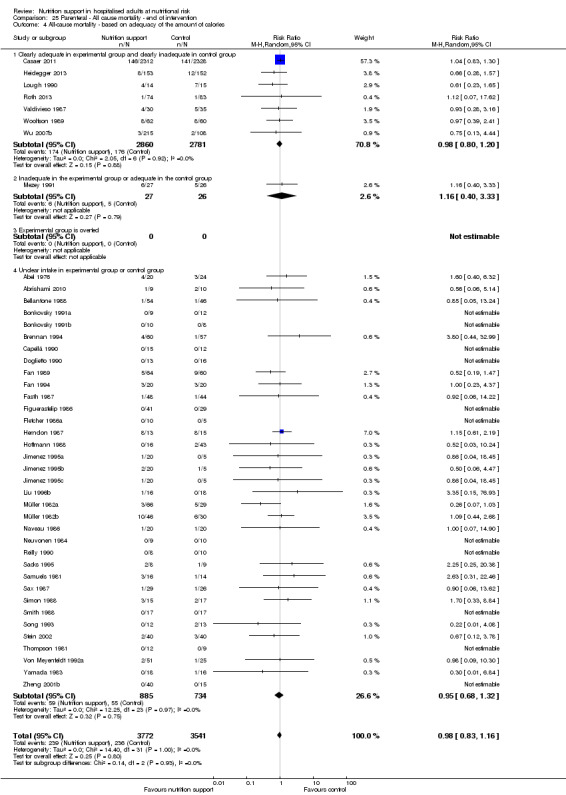
Comparison 25 Parenteral ‐ All cause mortality ‐ end of intervention, Outcome 4 All‐cause mortality ‐ based on adequacy of the amount of calories.
25.5. Analysis.
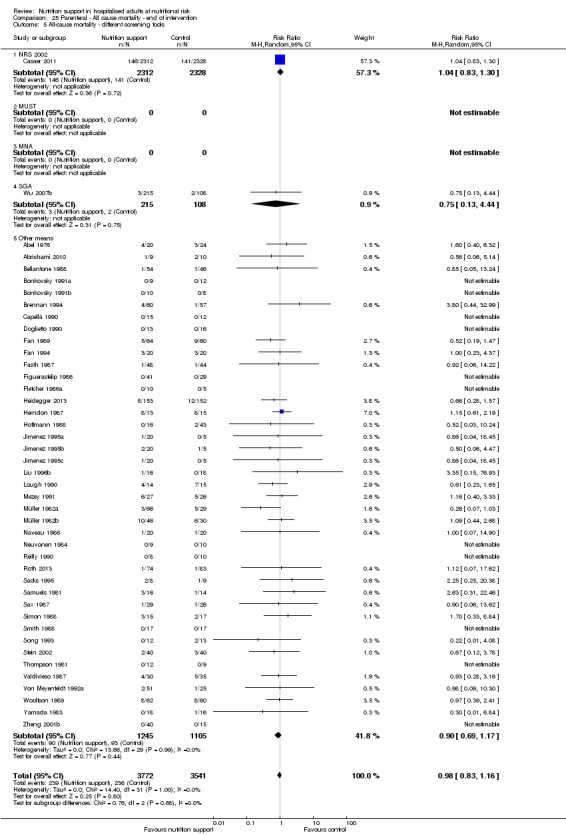
Comparison 25 Parenteral ‐ All cause mortality ‐ end of intervention, Outcome 5 All‐cause mortality ‐ different screening tools.
25.6. Analysis.
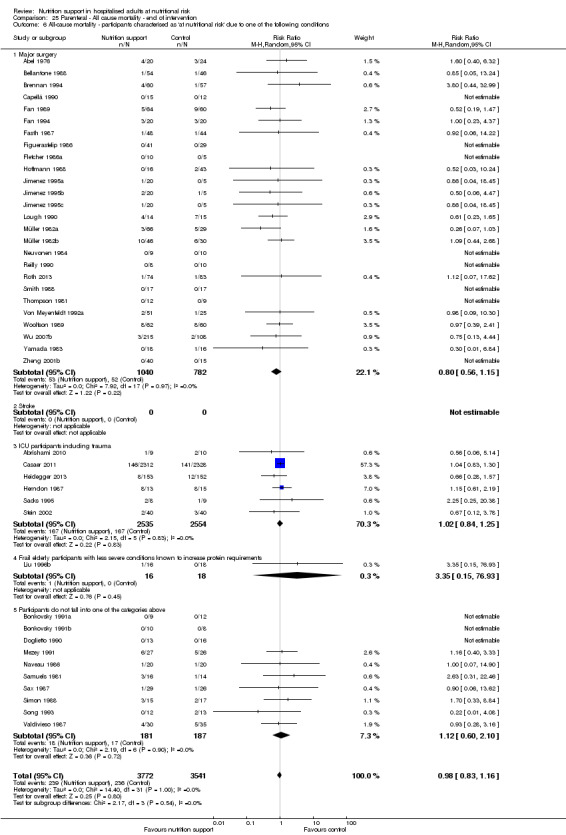
Comparison 25 Parenteral ‐ All cause mortality ‐ end of intervention, Outcome 6 All‐cause mortality ‐ participants characterised as 'at nutritional risk' due to one of the following conditions.
25.7. Analysis.
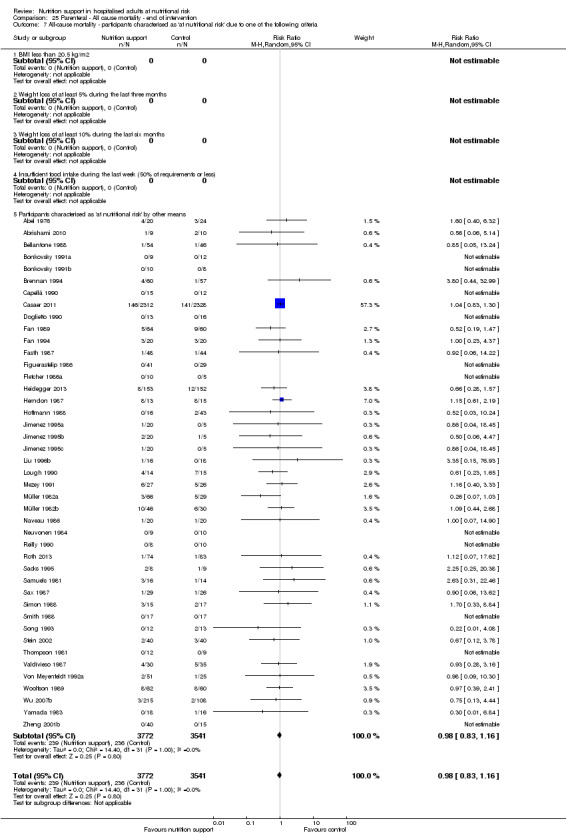
Comparison 25 Parenteral ‐ All cause mortality ‐ end of intervention, Outcome 7 All‐cause mortality ‐ participants characterised as 'at nutritional risk' due to one of the following criteria.
25.8. Analysis.
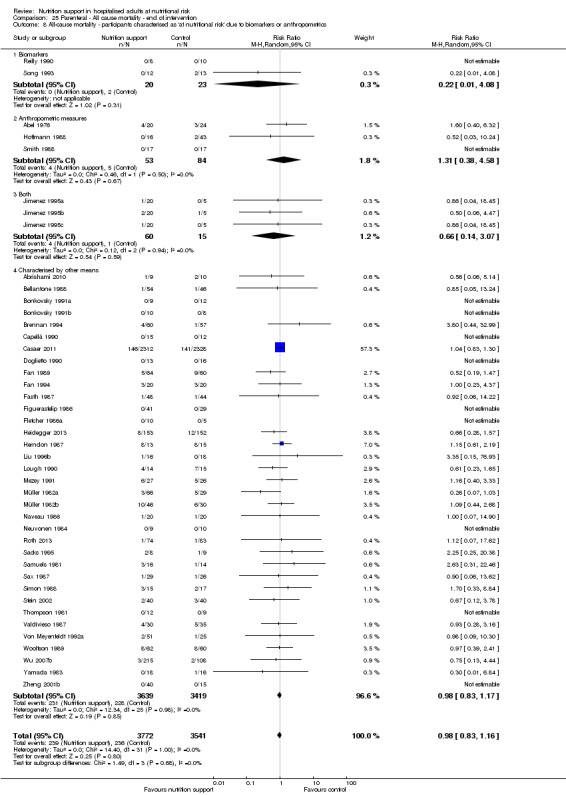
Comparison 25 Parenteral ‐ All cause mortality ‐ end of intervention, Outcome 8 All‐cause mortality ‐ participants characterised as 'at nutritional risk' due to biomarkers or anthropometrics.
25.9. Analysis.
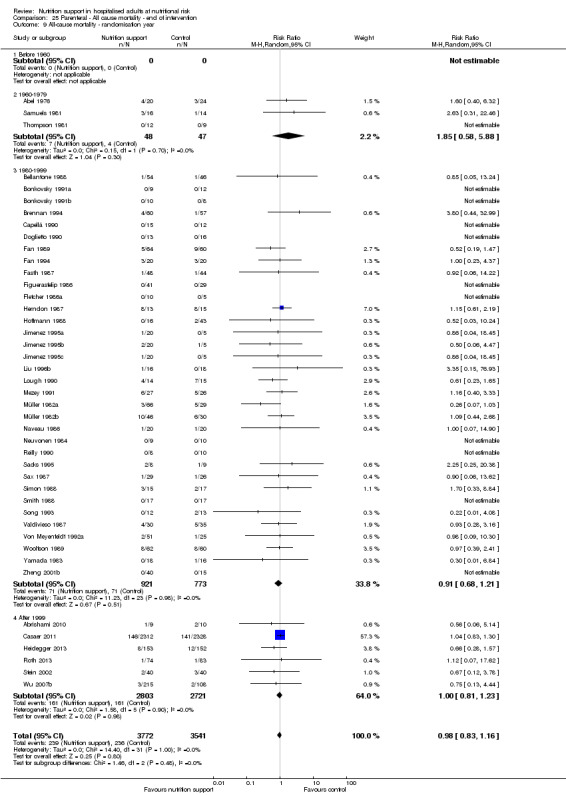
Comparison 25 Parenteral ‐ All cause mortality ‐ end of intervention, Outcome 9 All‐cause mortality ‐ randomisation year.
25.10. Analysis.
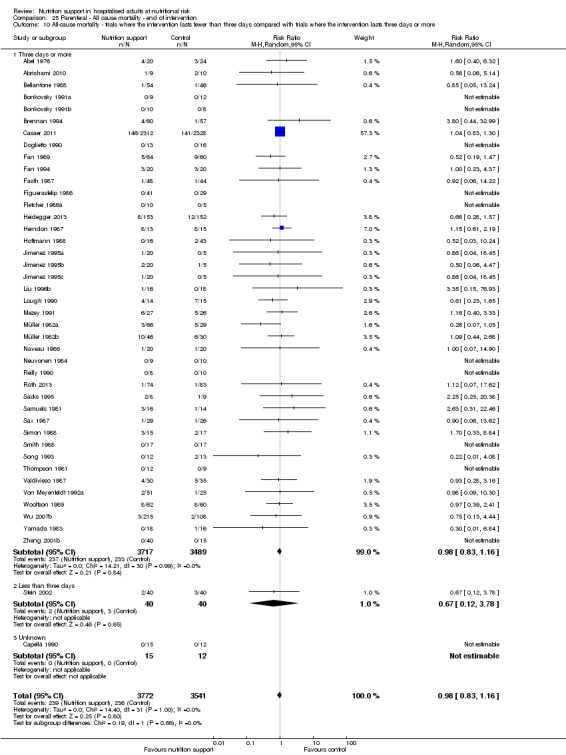
Comparison 25 Parenteral ‐ All cause mortality ‐ end of intervention, Outcome 10 All‐cause mortality ‐ trials where the intervention lasts fewer than three days compared with trials where the intervention lasts three days or more.
25.11. Analysis.
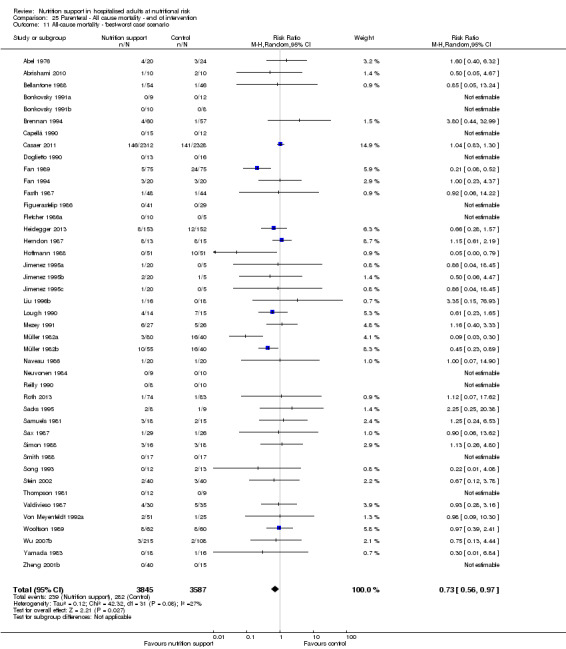
Comparison 25 Parenteral ‐ All cause mortality ‐ end of intervention, Outcome 11 All‐cause mortality ‐ 'best‐worst case' scenario.
25.12. Analysis.
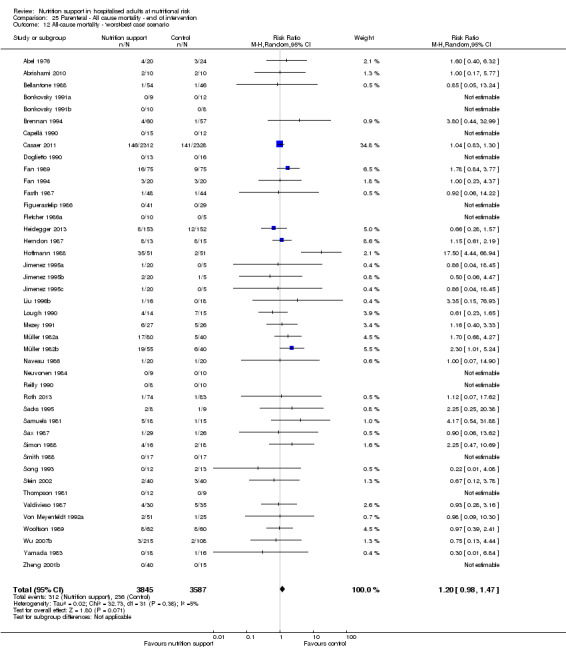
Comparison 25 Parenteral ‐ All cause mortality ‐ end of intervention, Outcome 12 All‐cause mortality ‐ 'worst‐best case' scenario.
25.13. Analysis.
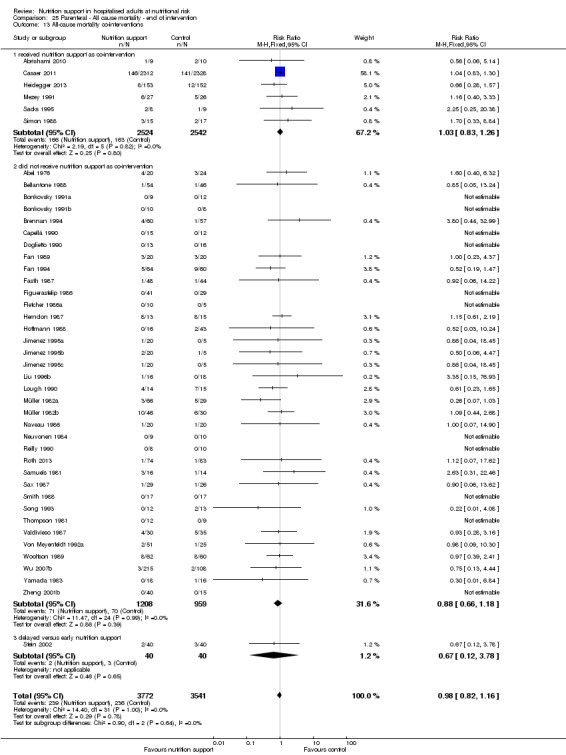
Comparison 25 Parenteral ‐ All cause mortality ‐ end of intervention, Outcome 13 All‐cause mortality co‐interventions.
Comparison 26. Parenteral ‐ All cause mortality ‐ maximum follow‐up.
| Outcome or subgroup title | No. of studies | No. of participants | Statistical method | Effect size |
|---|---|---|---|---|
| 1 All‐cause mortality ‐ overall | 51 | 8121 | Risk Ratio (M‐H, Random, 95% CI) | 0.99 [0.90, 1.09] |
| 2 All‐cause mortality ‐ bias | 51 | 8121 | Risk Ratio (M‐H, Random, 95% CI) | 0.99 [0.90, 1.09] |
| 2.1 High risk of bias | 51 | 8121 | Risk Ratio (M‐H, Random, 95% CI) | 0.99 [0.90, 1.09] |
| 2.2 Low risk of bias | 0 | 0 | Risk Ratio (M‐H, Random, 95% CI) | 0.0 [0.0, 0.0] |
| 3 All‐cause mortality ‐ medical speciality | 51 | 8121 | Risk Ratio (M‐H, Random, 95% CI) | 0.99 [0.90, 1.09] |
| 3.1 Cardiology | 0 | 0 | Risk Ratio (M‐H, Random, 95% CI) | 0.0 [0.0, 0.0] |
| 3.2 Medical gastroenterology and hepatology | 7 | 254 | Risk Ratio (M‐H, Random, 95% CI) | 1.02 [0.74, 1.42] |
| 3.3 Geriatrics | 0 | 0 | Risk Ratio (M‐H, Random, 95% CI) | 0.0 [0.0, 0.0] |
| 3.4 Pulmonary disease | 1 | 25 | Risk Ratio (M‐H, Random, 95% CI) | 0.22 [0.01, 4.08] |
| 3.5 Endocrinology | 0 | 0 | Risk Ratio (M‐H, Random, 95% CI) | 0.0 [0.0, 0.0] |
| 3.6 Infectious diseases | 0 | 0 | Risk Ratio (M‐H, Random, 95% CI) | 0.0 [0.0, 0.0] |
| 3.7 Rheumatology | 0 | 0 | Risk Ratio (M‐H, Random, 95% CI) | 0.0 [0.0, 0.0] |
| 3.8 Haematology | 0 | 0 | Risk Ratio (M‐H, Random, 95% CI) | 0.0 [0.0, 0.0] |
| 3.9 Nephrology | 0 | 0 | Risk Ratio (M‐H, Random, 95% CI) | 0.0 [0.0, 0.0] |
| 3.10 Gastroenterologic surgery | 24 | 2104 | Risk Ratio (M‐H, Random, 95% CI) | 0.93 [0.68, 1.28] |
| 3.11 Trauma surgery | 2 | 45 | Risk Ratio (M‐H, Random, 95% CI) | 1.22 [0.66, 2.25] |
| 3.12 Ortopaedics | 0 | 0 | Risk Ratio (M‐H, Random, 95% CI) | 0.0 [0.0, 0.0] |
| 3.13 Plastic, reconstructive, and aesthetic surgery | 0 | 0 | Risk Ratio (M‐H, Random, 95% CI) | 0.0 [0.0, 0.0] |
| 3.14 Vascular surgery | 1 | 15 | Risk Ratio (M‐H, Random, 95% CI) | 0.0 [0.0, 0.0] |
| 3.15 Transplant surgery | 2 | 47 | Risk Ratio (M‐H, Random, 95% CI) | 0.56 [0.22, 1.42] |
| 3.16 Urology | 0 | 0 | Risk Ratio (M‐H, Random, 95% CI) | 0.0 [0.0, 0.0] |
| 3.17 Thoracic surgery | 1 | 44 | Risk Ratio (M‐H, Random, 95% CI) | 1.6 [0.40, 6.32] |
| 3.18 Neurological surgery | 0 | 0 | Risk Ratio (M‐H, Random, 95% CI) | 0.0 [0.0, 0.0] |
| 3.19 Oro‐maxillo‐facial surgery | 0 | 0 | Risk Ratio (M‐H, Random, 95% CI) | 0.0 [0.0, 0.0] |
| 3.20 Anaesthesiology | 0 | 0 | Risk Ratio (M‐H, Random, 95% CI) | 0.0 [0.0, 0.0] |
| 3.21 Emergency medicine | 7 | 5208 | Risk Ratio (M‐H, Random, 95% CI) | 0.97 [0.84, 1.12] |
| 3.22 Psychiatry | 0 | 0 | Risk Ratio (M‐H, Random, 95% CI) | 0.0 [0.0, 0.0] |
| 3.23 Neurology | 0 | 0 | Risk Ratio (M‐H, Random, 95% CI) | 0.0 [0.0, 0.0] |
| 3.24 Oncology | 6 | 379 | Risk Ratio (M‐H, Random, 95% CI) | 1.03 [0.87, 1.21] |
| 3.25 Dermatology | 0 | 0 | Risk Ratio (M‐H, Random, 95% CI) | 0.0 [0.0, 0.0] |
| 3.26 Gynaecology | 0 | 0 | Risk Ratio (M‐H, Random, 95% CI) | 0.0 [0.0, 0.0] |
| 3.27 Mixed | 0 | 0 | Risk Ratio (M‐H, Random, 95% CI) | 0.0 [0.0, 0.0] |
| 4 All‐cause mortality ‐ based on adequacy of the amount of calories | 51 | 8121 | Risk Ratio (M‐H, Random, 95% CI) | 0.99 [0.90, 1.09] |
| 4.1 Clearly adequate in intervention and clearly inadequate in control | 7 | 5641 | Risk Ratio (M‐H, Random, 95% CI) | 0.98 [0.88, 1.10] |
| 4.2 Inadequate in the experimental or adequate in the control | 4 | 165 | Risk Ratio (M‐H, Random, 95% CI) | 1.17 [0.80, 1.72] |
| 4.3 Experimental group is overfed | 4 | 272 | Risk Ratio (M‐H, Random, 95% CI) | 0.56 [0.23, 1.34] |
| 4.4 Unclear intake in control or experimental | 36 | 2043 | Risk Ratio (M‐H, Random, 95% CI) | 0.99 [0.80, 1.22] |
| 5 All‐cause mortality ‐ different screening tools | 51 | 8121 | Risk Ratio (M‐H, Random, 95% CI) | 0.99 [0.90, 1.09] |
| 5.1 NRS 2002 | 1 | 4640 | Risk Ratio (M‐H, Random, 95% CI) | 1.00 [0.85, 1.18] |
| 5.2 MUST | 0 | 0 | Risk Ratio (M‐H, Random, 95% CI) | 0.0 [0.0, 0.0] |
| 5.3 MNA | 0 | 0 | Risk Ratio (M‐H, Random, 95% CI) | 0.0 [0.0, 0.0] |
| 5.4 SGA | 1 | 323 | Risk Ratio (M‐H, Random, 95% CI) | 0.75 [0.13, 4.44] |
| 5.5 Other means | 49 | 3158 | Risk Ratio (M‐H, Random, 95% CI) | 0.98 [0.88, 1.11] |
| 6 All‐cause mortality ‐ participants characterised as 'at nutritional risk' due to one of the following conditions | 51 | 8121 | Risk Ratio (M‐H, Random, 95% CI) | 0.99 [0.90, 1.09] |
| 6.1 Major surgery | 30 | 2381 | Risk Ratio (M‐H, Random, 95% CI) | 0.88 [0.67, 1.15] |
| 6.2 Stroke | 0 | 0 | Risk Ratio (M‐H, Random, 95% CI) | 0.0 [0.0, 0.0] |
| 6.3 ICU participants including trauma | 7 | 5209 | Risk Ratio (M‐H, Random, 95% CI) | 0.99 [0.86, 1.14] |
| 6.4 Frail elderly participants with less severe conditions known to increase protein requirements | 1 | 34 | Risk Ratio (M‐H, Random, 95% CI) | 3.35 [0.15, 76.93] |
| 6.5 Participants do not fall into one of the categories above | 13 | 497 | Risk Ratio (M‐H, Random, 95% CI) | 1.02 [0.88, 1.18] |
| 7 All‐cause mortality ‐ participants characterised as 'at nutritional risk' due to one of the following criteria | 51 | 8121 | Risk Ratio (M‐H, Random, 95% CI) | 0.99 [0.90, 1.09] |
| 7.1 BMI less than 20.5 kg/m2 | 0 | 0 | Risk Ratio (M‐H, Random, 95% CI) | 0.0 [0.0, 0.0] |
| 7.2 Weight loss of at least 5% during the last three months | 0 | 0 | Risk Ratio (M‐H, Random, 95% CI) | 0.0 [0.0, 0.0] |
| 7.3 Weight loss of at least 10% during the last six months | 2 | 92 | Risk Ratio (M‐H, Random, 95% CI) | 0.33 [0.01, 7.78] |
| 7.4 Insufficient food intake during the last week (50% of requirements or less) | 0 | 0 | Risk Ratio (M‐H, Random, 95% CI) | 0.0 [0.0, 0.0] |
| 7.5 Participants characterised as 'at nutritional risk' by other means | 49 | 8029 | Risk Ratio (M‐H, Random, 95% CI) | 0.99 [0.90, 1.09] |
| 8 All‐cause mortality ‐ participants characterised as 'at nutritional risk' due to biomarkers or anthropometrics | 51 | 8121 | Risk Ratio (M‐H, Random, 95% CI) | 0.99 [0.90, 1.09] |
| 8.1 Biomarkers | 5 | 169 | Risk Ratio (M‐H, Random, 95% CI) | 0.47 [0.10, 2.12] |
| 8.2 Anthropometric measures | 3 | 137 | Risk Ratio (M‐H, Random, 95% CI) | 0.93 [0.32, 2.75] |
| 8.3 Both anthropometrics and biomarkers | 3 | 75 | Risk Ratio (M‐H, Random, 95% CI) | 0.66 [0.14, 3.07] |
| 8.4 Characterised by other means | 40 | 7740 | Risk Ratio (M‐H, Random, 95% CI) | 0.99 [0.90, 1.09] |
| 9 All‐cause mortality ‐ randomisation year | 51 | 8121 | Risk Ratio (M‐H, Random, 95% CI) | 0.99 [0.90, 1.09] |
| 9.1 Before 1960 | 0 | 0 | Risk Ratio (M‐H, Random, 95% CI) | 0.0 [0.0, 0.0] |
| 9.2 1960 to 1979 | 4 | 151 | Risk Ratio (M‐H, Random, 95% CI) | 1.50 [0.56, 4.03] |
| 9.3 1980 to 1999 | 41 | 2446 | Risk Ratio (M‐H, Random, 95% CI) | 0.99 [0.88, 1.12] |
| 9.4 After 1999 | 6 | 5524 | Risk Ratio (M‐H, Random, 95% CI) | 0.98 [0.84, 1.13] |
| 10 All‐cause mortality ‐ trials where the intervention lasts fewer than three days compared with trials where the intervention lasts three days or more | 51 | 8121 | Risk Ratio (M‐H, Random, 95% CI) | 0.99 [0.90, 1.09] |
| 10.1 Three days or more | 49 | 8014 | Risk Ratio (M‐H, Random, 95% CI) | 0.99 [0.89, 1.08] |
| 10.2 Less than three days | 1 | 80 | Risk Ratio (M‐H, Random, 95% CI) | 1.2 [0.59, 2.45] |
| 10.3 Unknown | 1 | 27 | Risk Ratio (M‐H, Random, 95% CI) | 0.0 [0.0, 0.0] |
| 11 All‐cause mortality ‐ 'best‐worst case' scenario | 51 | 8240 | Risk Ratio (M‐H, Random, 95% CI) | 0.87 [0.74, 1.02] |
| 12 All‐cause mortality ‐ 'worst‐best case' scenario | 51 | 8240 | Risk Ratio (M‐H, Random, 95% CI) | 1.06 [0.95, 1.19] |
| 13 All‐cause mortality co‐interventions | 51 | 8121 | Risk Ratio (M‐H, Fixed, 95% CI) | 0.97 [0.87, 1.09] |
| 13.1 received nutrition support as co‐intervention | 5 | 5044 | Risk Ratio (M‐H, Fixed, 95% CI) | 0.97 [0.84, 1.13] |
| 13.2 did not receive nutrition support as co‐intervention | 45 | 2997 | Risk Ratio (M‐H, Fixed, 95% CI) | 0.96 [0.81, 1.14] |
| 13.3 delayed versus early nutrition support | 1 | 80 | Risk Ratio (M‐H, Fixed, 95% CI) | 1.2 [0.59, 2.45] |
26.1. Analysis.
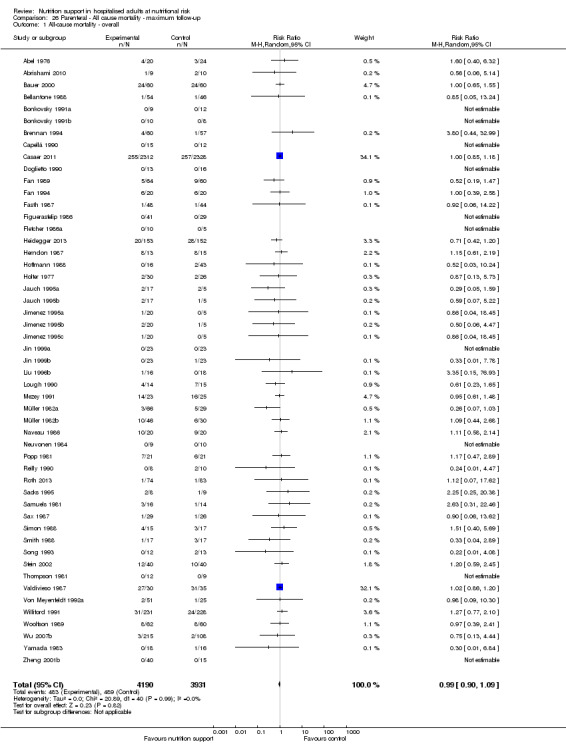
Comparison 26 Parenteral ‐ All cause mortality ‐ maximum follow‐up, Outcome 1 All‐cause mortality ‐ overall.
26.2. Analysis.
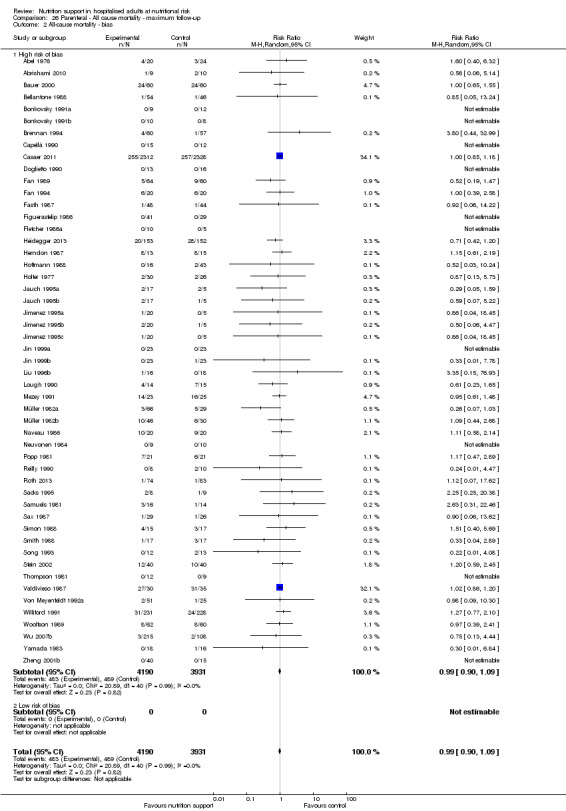
Comparison 26 Parenteral ‐ All cause mortality ‐ maximum follow‐up, Outcome 2 All‐cause mortality ‐ bias.
26.3. Analysis.
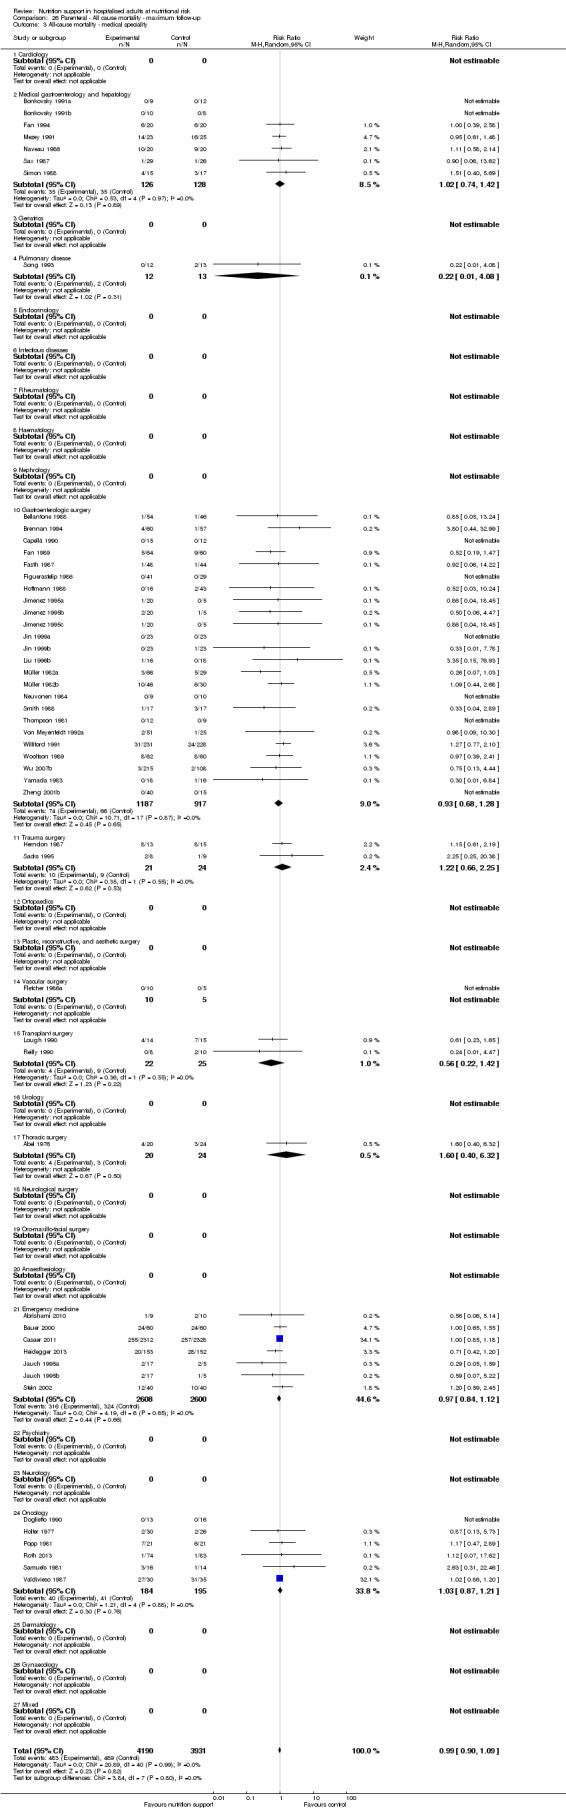
Comparison 26 Parenteral ‐ All cause mortality ‐ maximum follow‐up, Outcome 3 All‐cause mortality ‐ medical speciality.
26.4. Analysis.
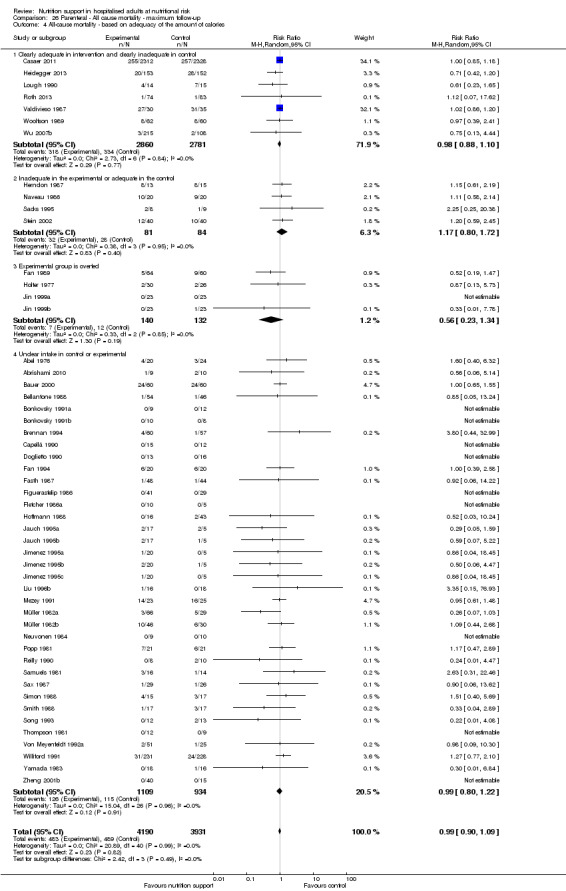
Comparison 26 Parenteral ‐ All cause mortality ‐ maximum follow‐up, Outcome 4 All‐cause mortality ‐ based on adequacy of the amount of calories.
26.5. Analysis.
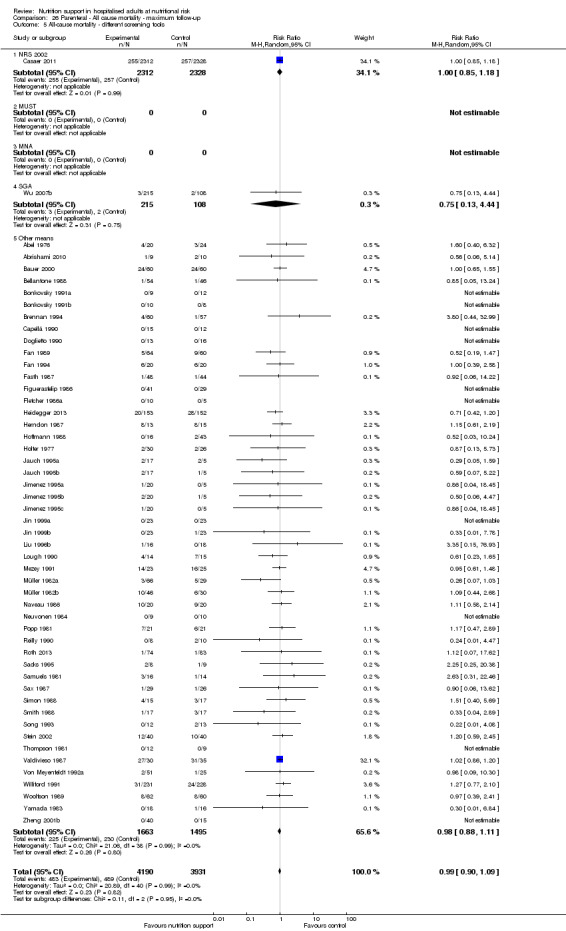
Comparison 26 Parenteral ‐ All cause mortality ‐ maximum follow‐up, Outcome 5 All‐cause mortality ‐ different screening tools.
26.6. Analysis.
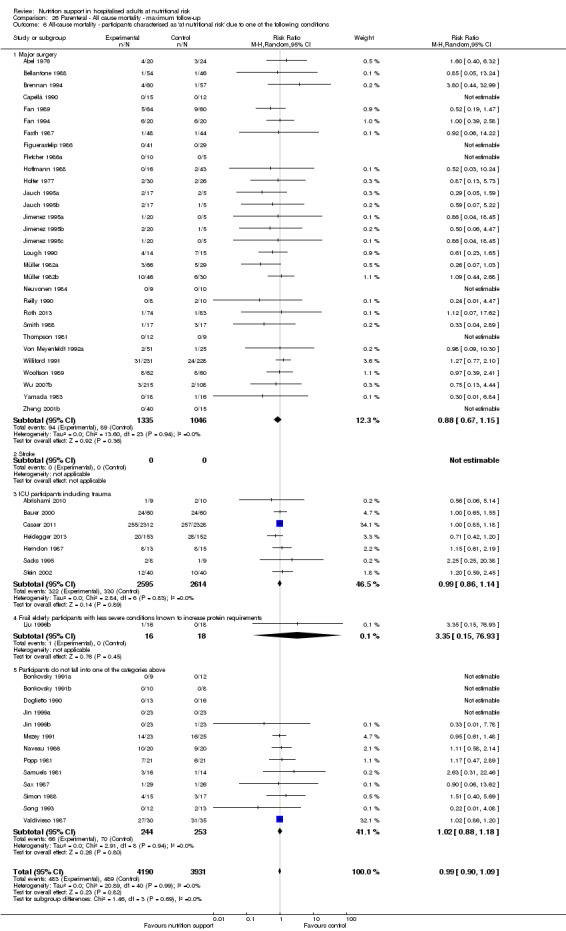
Comparison 26 Parenteral ‐ All cause mortality ‐ maximum follow‐up, Outcome 6 All‐cause mortality ‐ participants characterised as 'at nutritional risk' due to one of the following conditions.
26.7. Analysis.
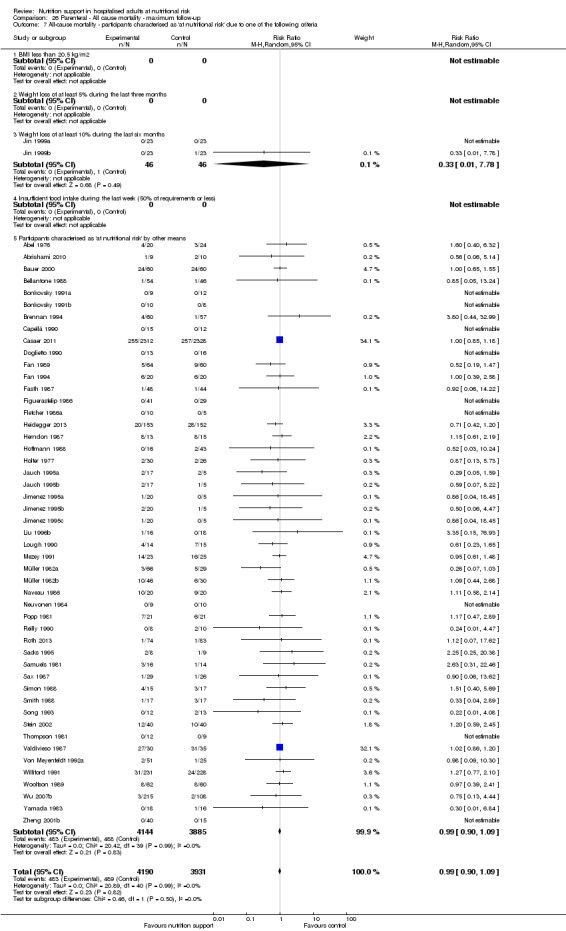
Comparison 26 Parenteral ‐ All cause mortality ‐ maximum follow‐up, Outcome 7 All‐cause mortality ‐ participants characterised as 'at nutritional risk' due to one of the following criteria.
26.8. Analysis.
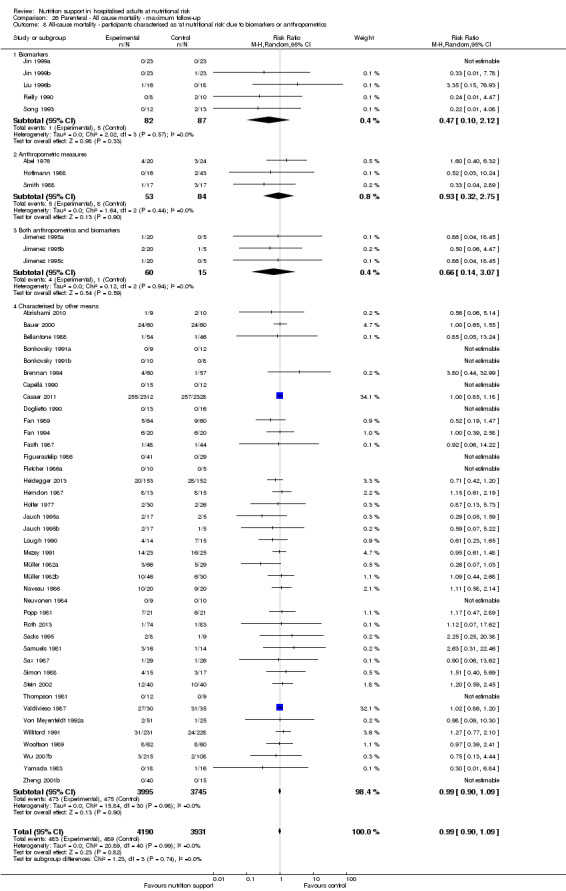
Comparison 26 Parenteral ‐ All cause mortality ‐ maximum follow‐up, Outcome 8 All‐cause mortality ‐ participants characterised as 'at nutritional risk' due to biomarkers or anthropometrics.
26.9. Analysis.
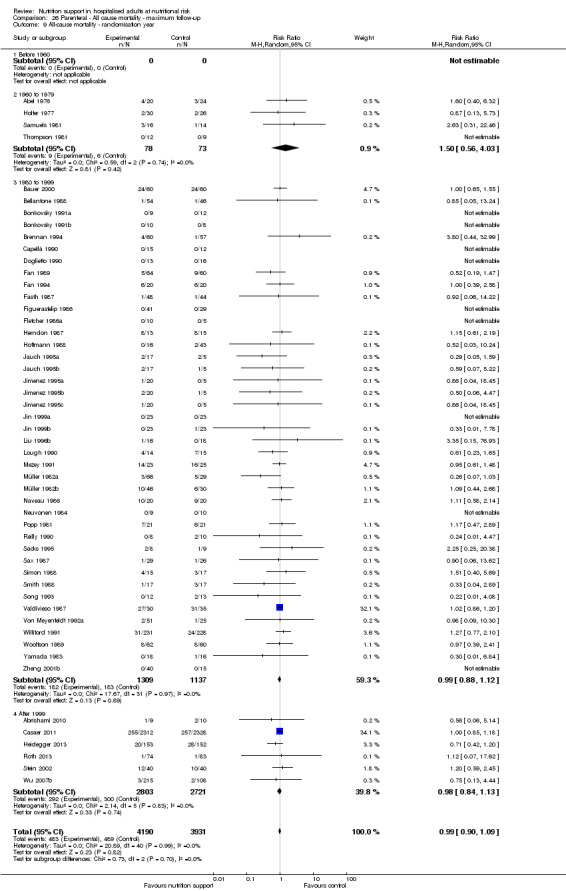
Comparison 26 Parenteral ‐ All cause mortality ‐ maximum follow‐up, Outcome 9 All‐cause mortality ‐ randomisation year.
26.10. Analysis.
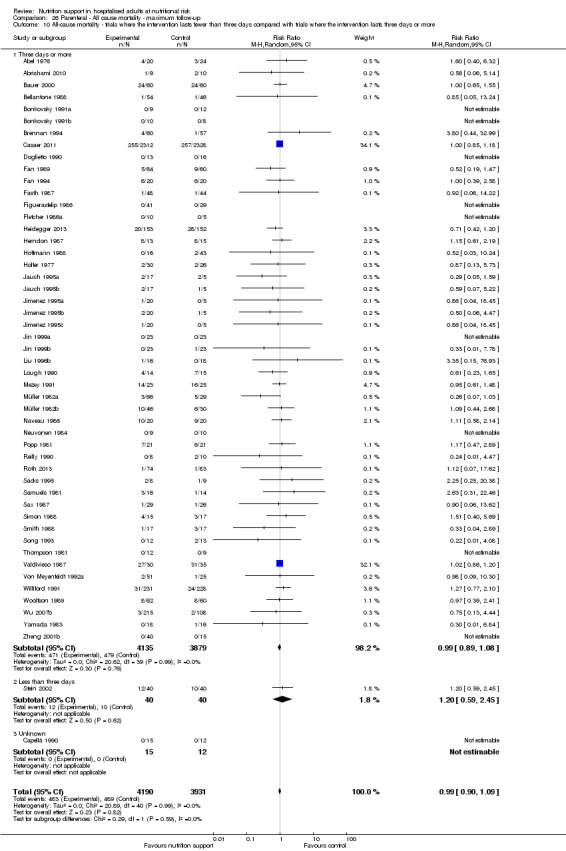
Comparison 26 Parenteral ‐ All cause mortality ‐ maximum follow‐up, Outcome 10 All‐cause mortality ‐ trials where the intervention lasts fewer than three days compared with trials where the intervention lasts three days or more.
26.11. Analysis.
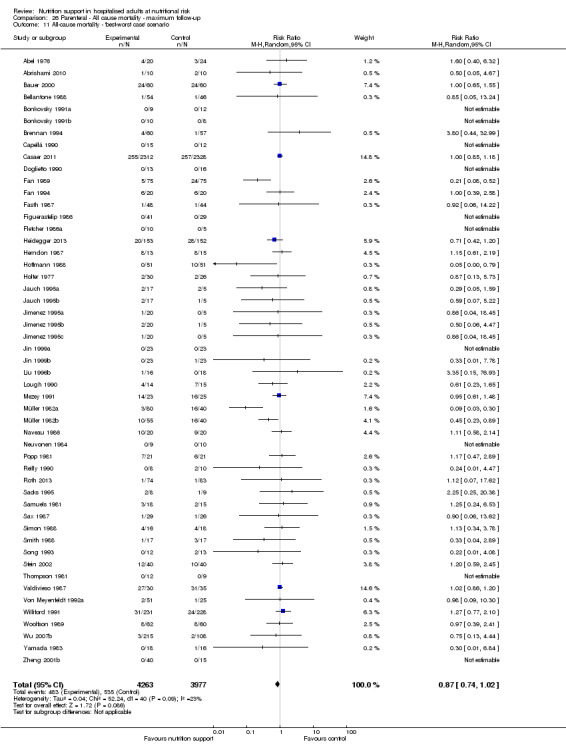
Comparison 26 Parenteral ‐ All cause mortality ‐ maximum follow‐up, Outcome 11 All‐cause mortality ‐ 'best‐worst case' scenario.
26.12. Analysis.
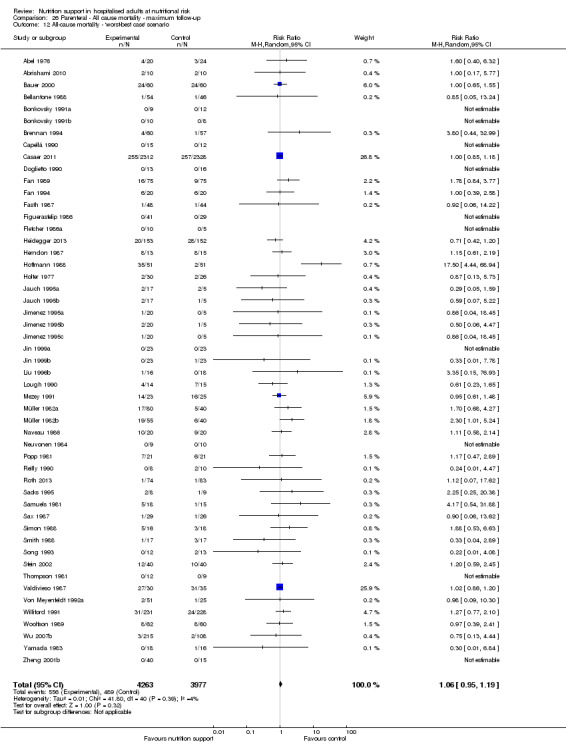
Comparison 26 Parenteral ‐ All cause mortality ‐ maximum follow‐up, Outcome 12 All‐cause mortality ‐ 'worst‐best case' scenario.
26.13. Analysis.
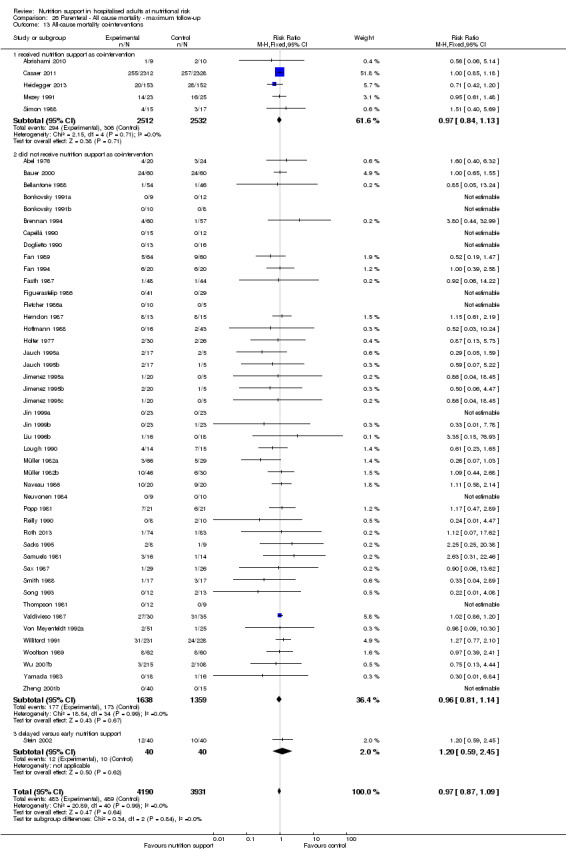
Comparison 26 Parenteral ‐ All cause mortality ‐ maximum follow‐up, Outcome 13 All‐cause mortality co‐interventions.
Comparison 27. Parenteral ‐ Serious adverse event end of intervention.
| Outcome or subgroup title | No. of studies | No. of participants | Statistical method | Effect size |
|---|---|---|---|---|
| 1 Serious adverse events ‐ overall | 48 | 7519 | Risk Ratio (M‐H, Random, 95% CI) | 0.98 [0.85, 1.14] |
| 2 Serious adverse events ‐ bias | 48 | 7519 | Risk Ratio (M‐H, Random, 95% CI) | 0.98 [0.85, 1.14] |
| 2.1 High risk of bias | 48 | 7519 | Risk Ratio (M‐H, Random, 95% CI) | 0.98 [0.85, 1.14] |
| 2.2 Low risk of bias | 0 | 0 | Risk Ratio (M‐H, Random, 95% CI) | 0.0 [0.0, 0.0] |
| 3 Serious adverse events ‐ by medical specialty | 48 | 7519 | Risk Ratio (M‐H, Random, 95% CI) | 0.98 [0.85, 1.14] |
| 3.1 Cardiology | 0 | 0 | Risk Ratio (M‐H, Random, 95% CI) | 0.0 [0.0, 0.0] |
| 3.2 Medical gastroenterology and hepatology | 7 | 259 | Risk Ratio (M‐H, Random, 95% CI) | 1.29 [0.73, 2.29] |
| 3.3 High risk | 0 | 0 | Risk Ratio (M‐H, Random, 95% CI) | 0.0 [0.0, 0.0] |
| 3.4 Geriatrics | 0 | 0 | Risk Ratio (M‐H, Random, 95% CI) | 0.0 [0.0, 0.0] |
| 3.5 Pulmonary disease | 1 | 25 | Risk Ratio (M‐H, Random, 95% CI) | 0.22 [0.01, 4.08] |
| 3.6 Endocrinology | 0 | 0 | Risk Ratio (M‐H, Random, 95% CI) | 0.0 [0.0, 0.0] |
| 3.7 Infectious diseases | 0 | 0 | Risk Ratio (M‐H, Random, 95% CI) | 0.0 [0.0, 0.0] |
| 3.8 Rheumatology | 0 | 0 | Risk Ratio (M‐H, Random, 95% CI) | 0.0 [0.0, 0.0] |
| 3.9 Haematology | 0 | 0 | Risk Ratio (M‐H, Random, 95% CI) | 0.0 [0.0, 0.0] |
| 3.10 Nephrology | 0 | 0 | Risk Ratio (M‐H, Random, 95% CI) | 0.0 [0.0, 0.0] |
| 3.11 Gastroenterologic surgery | 24 | 1663 | Risk Ratio (M‐H, Random, 95% CI) | 0.78 [0.56, 1.10] |
| 3.12 Trauma surgery | 2 | 45 | Risk Ratio (M‐H, Random, 95% CI) | 1.22 [0.66, 2.25] |
| 3.13 Ortopaedics | 1 | 80 | Risk Ratio (M‐H, Random, 95% CI) | 0.0 [0.0, 0.0] |
| 3.14 Plastic, reconstructive, and aesthetic surgery | 0 | 0 | Risk Ratio (M‐H, Random, 95% CI) | 0.0 [0.0, 0.0] |
| 3.15 Vascular surgery | 2 | 35 | Risk Ratio (M‐H, Random, 95% CI) | 0.5 [0.05, 4.67] |
| 3.16 Transplant surgery | 2 | 47 | Risk Ratio (M‐H, Random, 95% CI) | 0.61 [0.23, 1.65] |
| 3.17 Urology | 0 | 0 | Risk Ratio (M‐H, Random, 95% CI) | 0.0 [0.0, 0.0] |
| 3.18 Thoracic surgery | 1 | 44 | Risk Ratio (M‐H, Random, 95% CI) | 1.6 [0.40, 6.32] |
| 3.19 Neurological surgery | 0 | 0 | Risk Ratio (M‐H, Random, 95% CI) | 0.0 [0.0, 0.0] |
| 3.20 Oro‐maxillo‐facial surgery | 0 | 0 | Risk Ratio (M‐H, Random, 95% CI) | 0.0 [0.0, 0.0] |
| 3.21 Anaesthesiology | 0 | 0 | Risk Ratio (M‐H, Random, 95% CI) | 0.0 [0.0, 0.0] |
| 3.22 Emergency medicine | 4 | 5044 | Risk Ratio (M‐H, Random, 95% CI) | 1.00 [0.81, 1.24] |
| 3.23 Psychiatry | 0 | 0 | Risk Ratio (M‐H, Random, 95% CI) | 0.0 [0.0, 0.0] |
| 3.24 Neurology | 0 | 0 | Risk Ratio (M‐H, Random, 95% CI) | 0.0 [0.0, 0.0] |
| 3.25 Oncology | 4 | 277 | Risk Ratio (M‐H, Random, 95% CI) | 1.12 [0.51, 2.44] |
| 3.26 Dermatology | 0 | 0 | Risk Ratio (M‐H, Random, 95% CI) | 0.0 [0.0, 0.0] |
| 3.27 Gynaecology | 0 | 0 | Risk Ratio (M‐H, Random, 95% CI) | 0.0 [0.0, 0.0] |
| 3.28 Mixed | 0 | 0 | Risk Ratio (M‐H, Random, 95% CI) | 0.0 [0.0, 0.0] |
| 4 Serious adverse events ‐ based on adequacy of the amount of calories | 48 | 7519 | Risk Ratio (M‐H, Random, 95% CI) | 0.98 [0.85, 1.14] |
| 4.1 Clearly adequate in intervention and clearly inadequate in control | 9 | 5736 | Risk Ratio (M‐H, Random, 95% CI) | 0.98 [0.80, 1.19] |
| 4.2 Inadequate in the experimental or adequate in the control | 5 | 218 | Risk Ratio (M‐H, Random, 95% CI) | 1.20 [0.74, 1.95] |
| 4.3 Experimental group is overfed | 1 | 124 | Risk Ratio (M‐H, Random, 95% CI) | 0.52 [0.19, 1.47] |
| 4.4 Unclear intake in control or experimental | 33 | 1441 | Risk Ratio (M‐H, Random, 95% CI) | 0.89 [0.65, 1.23] |
| 5 Serious adverse events ‐ different screening tools | 48 | 7519 | Risk Ratio (M‐H, Random, 95% CI) | 0.98 [0.85, 1.14] |
| 5.1 NRS 2002 | 1 | 4640 | Risk Ratio (M‐H, Random, 95% CI) | 1.04 [0.83, 1.30] |
| 5.2 MUST | 0 | 0 | Risk Ratio (M‐H, Random, 95% CI) | 0.0 [0.0, 0.0] |
| 5.3 MNA | 0 | 0 | Risk Ratio (M‐H, Random, 95% CI) | 0.0 [0.0, 0.0] |
| 5.4 SGA | 1 | 323 | Risk Ratio (M‐H, Random, 95% CI) | 0.72 [0.28, 1.83] |
| 5.5 Other means | 46 | 2556 | Risk Ratio (M‐H, Random, 95% CI) | 0.95 [0.77, 1.17] |
| 6 Serious adverse events ‐ participants characterised as 'at nutritional risk' due to one of the following conditions | 48 | 7519 | Risk Ratio (M‐H, Random, 95% CI) | 0.98 [0.85, 1.14] |
| 6.1 Major surgery | 30 | 1952 | Risk Ratio (M‐H, Random, 95% CI) | 0.86 [0.66, 1.13] |
| 6.2 Stroke | 0 | 0 | Risk Ratio (M‐H, Random, 95% CI) | 0.0 [0.0, 0.0] |
| 6.3 ICU participants including trauma | 6 | 5089 | Risk Ratio (M‐H, Random, 95% CI) | 1.02 [0.84, 1.25] |
| 6.4 Frail elderly participants with less severe conditions known to increase protein requirements | 2 | 114 | Risk Ratio (M‐H, Random, 95% CI) | 0.56 [0.06, 5.63] |
| 6.5 Participants do not fall into one of the categories above | 10 | 364 | Risk Ratio (M‐H, Random, 95% CI) | 1.18 [0.69, 2.02] |
| 7 Serious adverse events ‐ participants characterised as 'at nutritional risk' due to one of the following criteria | 48 | 7519 | Risk Ratio (M‐H, Random, 95% CI) | 0.98 [0.85, 1.14] |
| 7.1 BMI less than 20.5 kg/m2 | 0 | 0 | Risk Ratio (M‐H, Random, 95% CI) | 0.0 [0.0, 0.0] |
| 7.2 Weight loss of at least 5% during the last three months | 0 | 0 | Risk Ratio (M‐H, Random, 95% CI) | 0.0 [0.0, 0.0] |
| 7.3 Weight loss of at least 10% during the last six months | 0 | 0 | Risk Ratio (M‐H, Random, 95% CI) | 0.0 [0.0, 0.0] |
| 7.4 Insufficient food intake during the last week (50% of requirements or less) | 0 | 0 | Risk Ratio (M‐H, Random, 95% CI) | 0.0 [0.0, 0.0] |
| 7.5 Participants characterised as 'at nutritional risk' by other means | 48 | 7519 | Risk Ratio (M‐H, Random, 95% CI) | 0.98 [0.85, 1.14] |
| 8 Serious adverse events ‐ participants characterised as 'at nutritional risk' due to biomarkers or anthropometrics | 48 | 7519 | Risk Ratio (M‐H, Random, 95% CI) | 0.98 [0.85, 1.14] |
| 8.1 Biomarkers | 3 | 77 | Risk Ratio (M‐H, Random, 95% CI) | 0.39 [0.06, 2.39] |
| 8.2 Anthropometric measures | 3 | 137 | Risk Ratio (M‐H, Random, 95% CI) | 0.69 [0.16, 3.01] |
| 8.3 Mixed | 3 | 75 | Risk Ratio (M‐H, Random, 95% CI) | 0.66 [0.14, 3.07] |
| 8.4 Characterised by other means | 39 | 7230 | Risk Ratio (M‐H, Random, 95% CI) | 1.00 [0.86, 1.16] |
| 9 Serious adverse events ‐ randomisation year | 48 | 7519 | Risk Ratio (M‐H, Random, 95% CI) | 0.98 [0.85, 1.14] |
| 9.1 Before 1960 | 0 | 0 | Risk Ratio (M‐H, Random, 95% CI) | 0.0 [0.0, 0.0] |
| 9.2 1960 to 1979 | 3 | 98 | Risk Ratio (M‐H, Random, 95% CI) | 2.02 [0.82, 4.98] |
| 9.3 1980 to 1999 | 37 | 1754 | Risk Ratio (M‐H, Random, 95% CI) | 0.95 [0.76, 1.19] |
| 9.4 After 1999 | 8 | 5667 | Risk Ratio (M‐H, Random, 95% CI) | 0.97 [0.79, 1.20] |
| 10 Serious adverse events ‐ trials where the intervention lasts fewer than three days compared with trials where the intervention lasts three days or more | 48 | 7519 | Risk Ratio (M‐H, Random, 95% CI) | 0.98 [0.85, 1.14] |
| 10.1 Three days or more | 46 | 7412 | Risk Ratio (M‐H, Random, 95% CI) | 0.99 [0.85, 1.15] |
| 10.2 Less than three days | 1 | 80 | Risk Ratio (M‐H, Random, 95% CI) | 0.67 [0.12, 3.78] |
| 10.3 Unknown | 1 | 27 | Risk Ratio (M‐H, Random, 95% CI) | 0.0 [0.0, 0.0] |
| 11 Serious adverse events ‐ 'best‐worst case' scenario | 48 | 8293 | Risk Ratio (M‐H, Random, 95% CI) | 0.78 [0.63, 0.98] |
| 12 Serious adverse events ‐ 'worst‐best case' scenario | 48 | 8293 | Risk Ratio (M‐H, Random, 95% CI) | 1.16 [0.95, 1.42] |
| 13 Serious adverse events co‐interventions | 48 | 7519 | Risk Ratio (M‐H, Fixed, 95% CI) | 0.94 [0.81, 1.09] |
| 13.1 received nutrition support as co‐intervention | 5 | 5049 | Risk Ratio (M‐H, Fixed, 95% CI) | 1.02 [0.83, 1.26] |
| 13.2 did not receive nutrition support as co‐intervention | 42 | 2390 | Risk Ratio (M‐H, Fixed, 95% CI) | 0.87 [0.70, 1.07] |
| 13.3 delayed versus early nutrition support | 1 | 80 | Risk Ratio (M‐H, Fixed, 95% CI) | 0.67 [0.12, 3.78] |
27.1. Analysis.
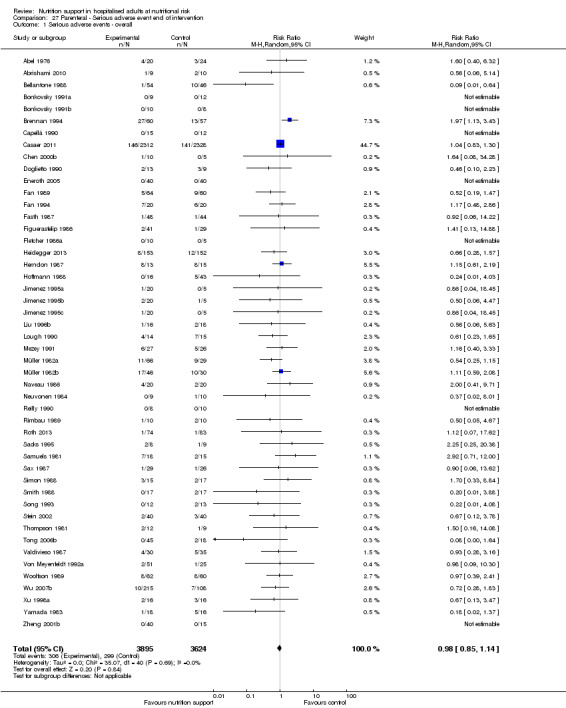
Comparison 27 Parenteral ‐ Serious adverse event end of intervention, Outcome 1 Serious adverse events ‐ overall.
27.2. Analysis.
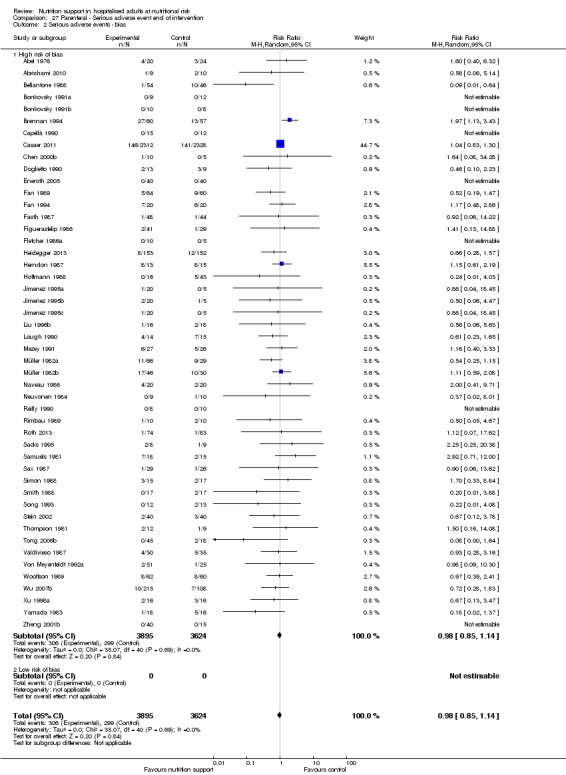
Comparison 27 Parenteral ‐ Serious adverse event end of intervention, Outcome 2 Serious adverse events ‐ bias.
27.3. Analysis.
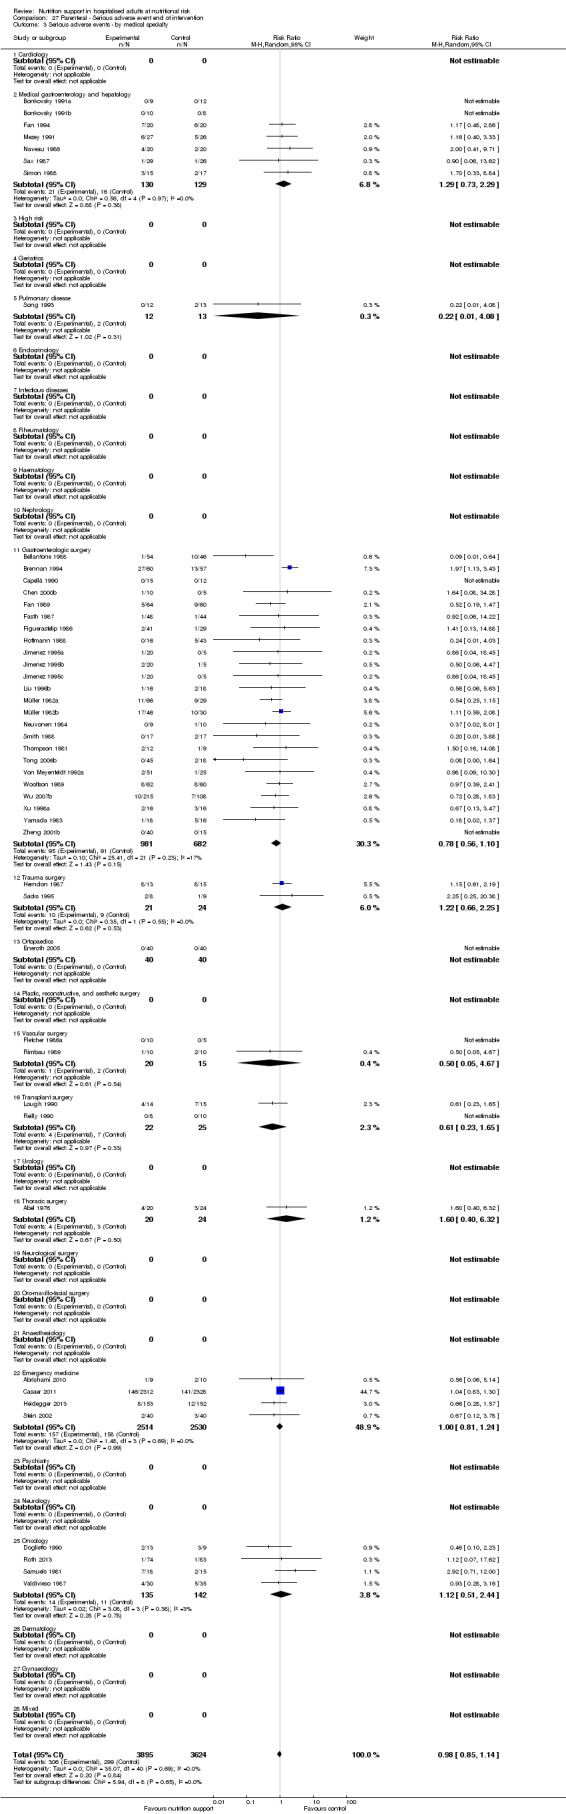
Comparison 27 Parenteral ‐ Serious adverse event end of intervention, Outcome 3 Serious adverse events ‐ by medical specialty.
27.4. Analysis.
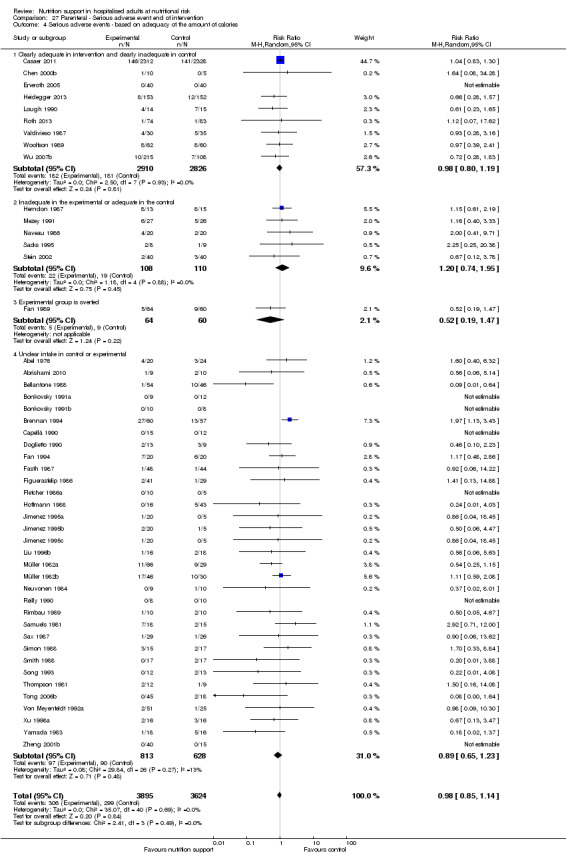
Comparison 27 Parenteral ‐ Serious adverse event end of intervention, Outcome 4 Serious adverse events ‐ based on adequacy of the amount of calories.
27.5. Analysis.
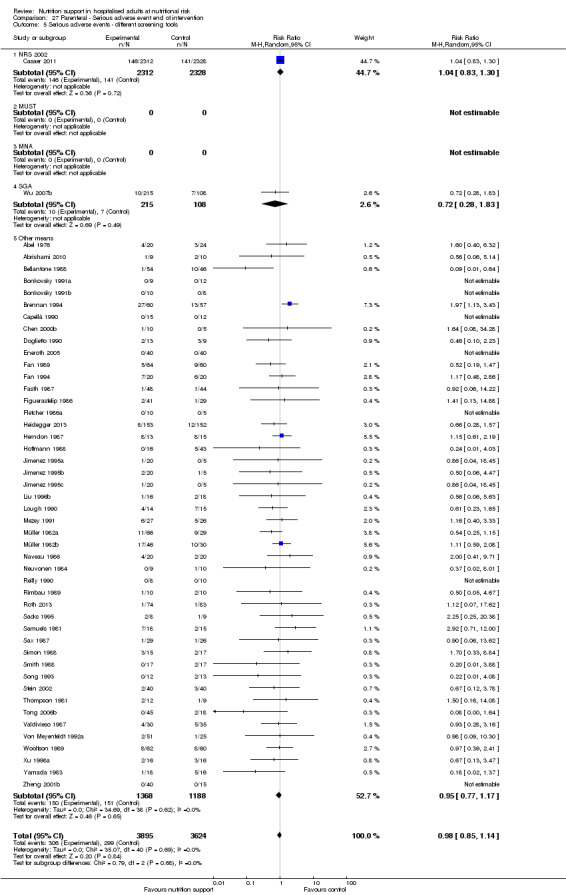
Comparison 27 Parenteral ‐ Serious adverse event end of intervention, Outcome 5 Serious adverse events ‐ different screening tools.
27.6. Analysis.
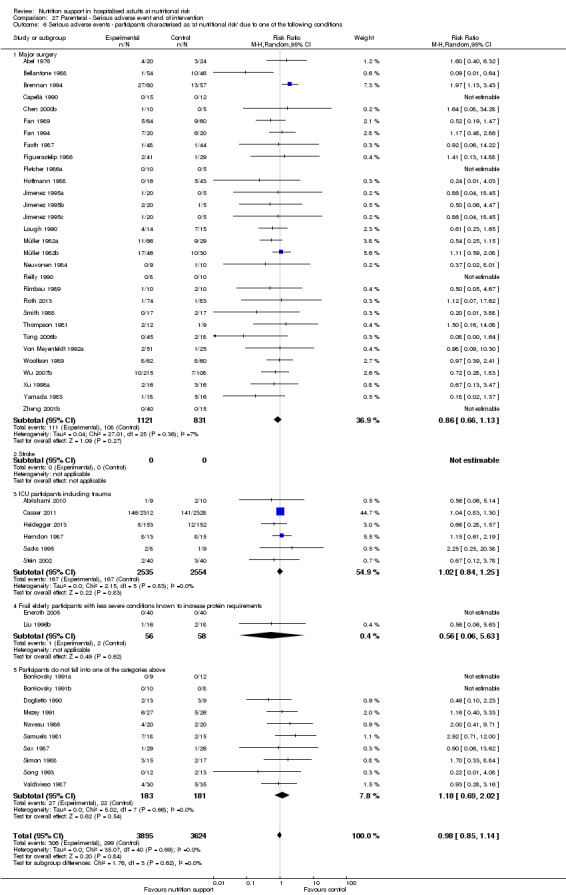
Comparison 27 Parenteral ‐ Serious adverse event end of intervention, Outcome 6 Serious adverse events ‐ participants characterised as 'at nutritional risk' due to one of the following conditions.
27.7. Analysis.
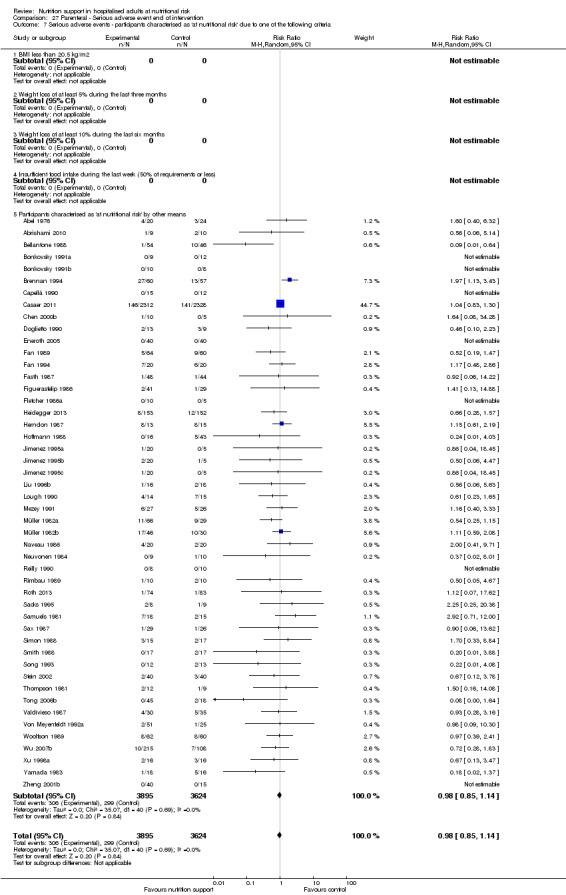
Comparison 27 Parenteral ‐ Serious adverse event end of intervention, Outcome 7 Serious adverse events ‐ participants characterised as 'at nutritional risk' due to one of the following criteria.
27.8. Analysis.
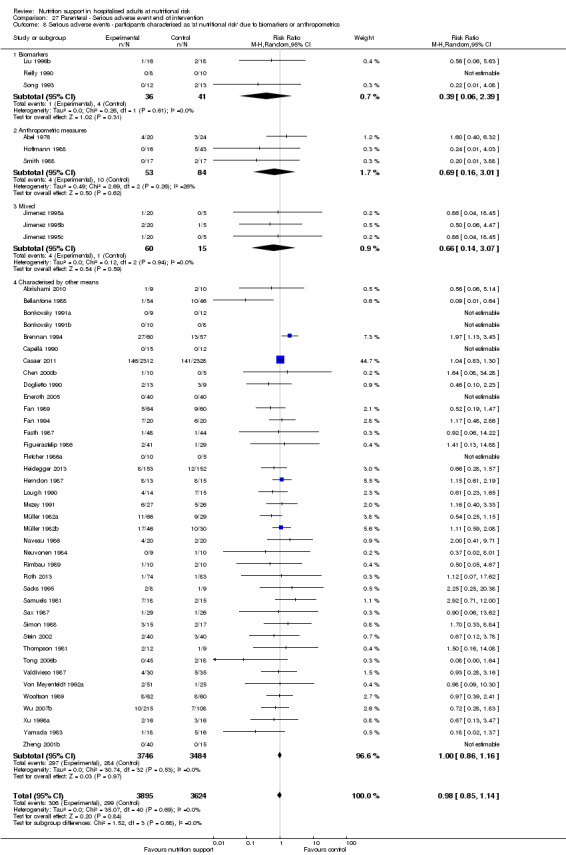
Comparison 27 Parenteral ‐ Serious adverse event end of intervention, Outcome 8 Serious adverse events ‐ participants characterised as 'at nutritional risk' due to biomarkers or anthropometrics.
27.9. Analysis.
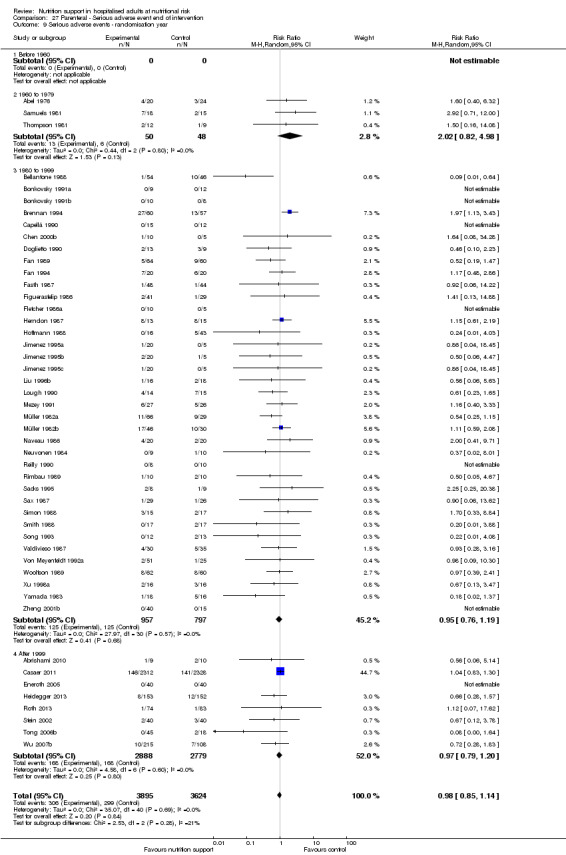
Comparison 27 Parenteral ‐ Serious adverse event end of intervention, Outcome 9 Serious adverse events ‐ randomisation year.
27.10. Analysis.
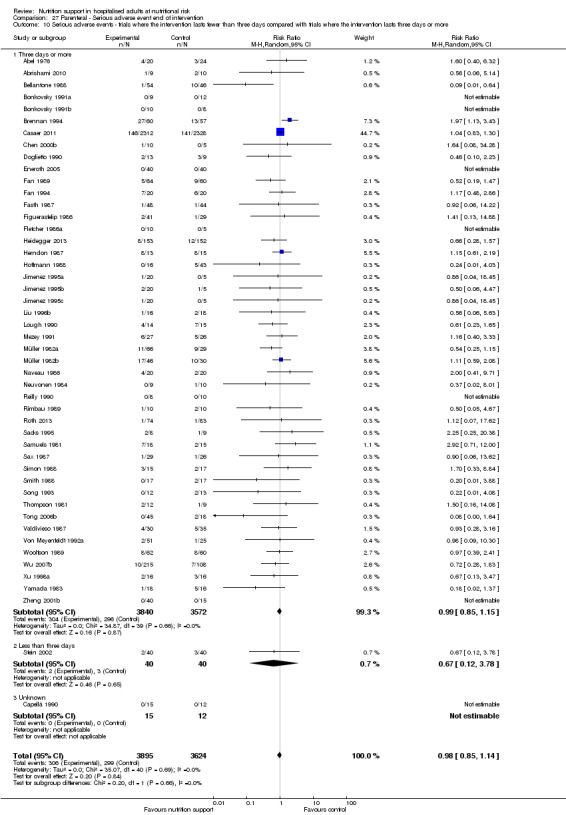
Comparison 27 Parenteral ‐ Serious adverse event end of intervention, Outcome 10 Serious adverse events ‐ trials where the intervention lasts fewer than three days compared with trials where the intervention lasts three days or more.
27.11. Analysis.
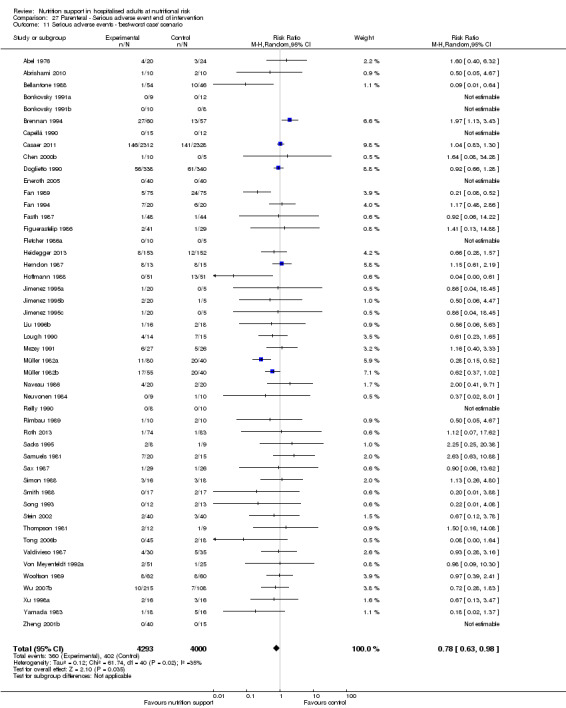
Comparison 27 Parenteral ‐ Serious adverse event end of intervention, Outcome 11 Serious adverse events ‐ 'best‐worst case' scenario.
27.12. Analysis.
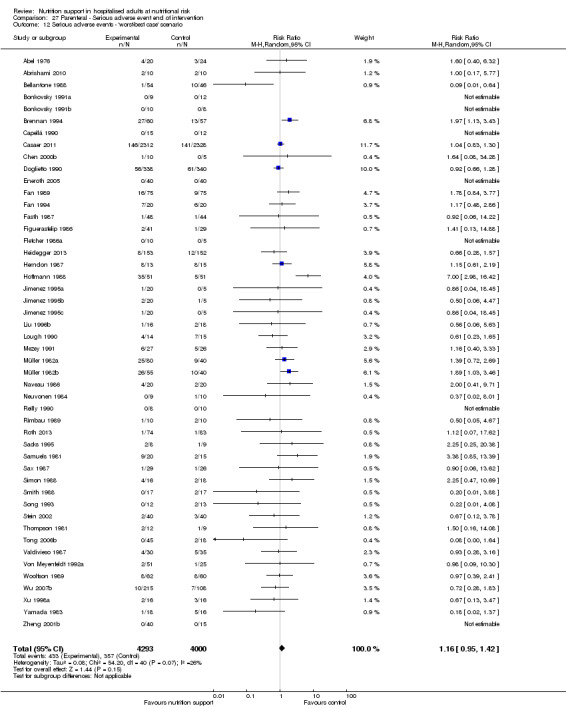
Comparison 27 Parenteral ‐ Serious adverse event end of intervention, Outcome 12 Serious adverse events ‐ 'worst‐best case' scenario.
27.13. Analysis.
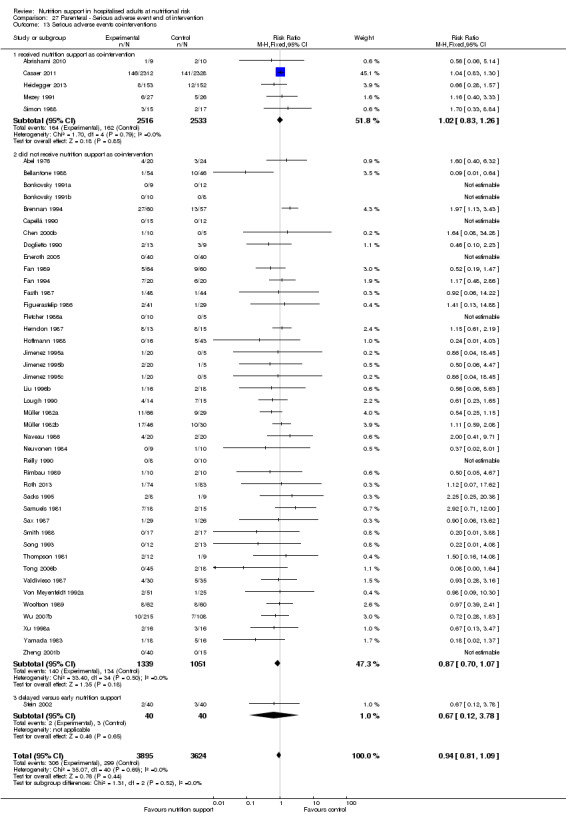
Comparison 27 Parenteral ‐ Serious adverse event end of intervention, Outcome 13 Serious adverse events co‐interventions.
Comparison 28. Parenteral ‐ Serious adverse event maximum follow‐up.
| Outcome or subgroup title | No. of studies | No. of participants | Statistical method | Effect size |
|---|---|---|---|---|
| 1 Serious adverse events ‐ overall | 56 | 8263 | Risk Ratio (M‐H, Random, 95% CI) | 0.98 [0.90, 1.07] |
| 2 Serious adverse events ‐ bias | 56 | 8263 | Risk Ratio (M‐H, Random, 95% CI) | 0.98 [0.90, 1.07] |
| 2.1 High risk of bias | 56 | 8263 | Risk Ratio (M‐H, Random, 95% CI) | 0.98 [0.90, 1.07] |
| 2.2 Low risk of bias | 0 | 0 | Risk Ratio (M‐H, Random, 95% CI) | 0.0 [0.0, 0.0] |
| 3 Serious adverse events ‐ by medical speciality | 56 | 8263 | Risk Ratio (M‐H, Random, 95% CI) | 0.98 [0.90, 1.07] |
| 3.1 Cardiology | 0 | 0 | Risk Ratio (M‐H, Random, 95% CI) | 0.0 [0.0, 0.0] |
| 3.2 Medical gastroenterology and hepatology | 7 | 338 | Risk Ratio (M‐H, Random, 95% CI) | 0.96 [0.69, 1.33] |
| 3.3 Geriatrics | 0 | 0 | Risk Ratio (M‐H, Random, 95% CI) | 0.0 [0.0, 0.0] |
| 3.4 Pulmonary disease | 1 | 25 | Risk Ratio (M‐H, Random, 95% CI) | 0.22 [0.01, 4.08] |
| 3.5 Endocrinology | 0 | 0 | Risk Ratio (M‐H, Random, 95% CI) | 0.0 [0.0, 0.0] |
| 3.6 Infectious diseases | 0 | 0 | Risk Ratio (M‐H, Random, 95% CI) | 0.0 [0.0, 0.0] |
| 3.7 Rheumatology | 0 | 0 | Risk Ratio (M‐H, Random, 95% CI) | 0.0 [0.0, 0.0] |
| 3.8 Haematology | 0 | 0 | Risk Ratio (M‐H, Random, 95% CI) | 0.0 [0.0, 0.0] |
| 3.9 Nephrology | 0 | 0 | Risk Ratio (M‐H, Random, 95% CI) | 0.0 [0.0, 0.0] |
| 3.10 Gastroenterologic surgery | 27 | 2066 | Risk Ratio (M‐H, Random, 95% CI) | 0.91 [0.72, 1.16] |
| 3.11 Trauma surgery | 2 | 45 | Risk Ratio (M‐H, Random, 95% CI) | 1.22 [0.66, 2.25] |
| 3.12 Ortopaedics | 1 | 80 | Risk Ratio (M‐H, Random, 95% CI) | 0.0 [0.0, 0.0] |
| 3.13 Plastic, reconstructive, and aesthetic surgery | 0 | 0 | Risk Ratio (M‐H, Random, 95% CI) | 0.0 [0.0, 0.0] |
| 3.14 Vascular surgery | 2 | 35 | Risk Ratio (M‐H, Random, 95% CI) | 0.5 [0.05, 4.67] |
| 3.15 Transplant surgery | 2 | 47 | Risk Ratio (M‐H, Random, 95% CI) | 0.56 [0.22, 1.42] |
| 3.16 Urology | 0 | 0 | Risk Ratio (M‐H, Random, 95% CI) | 0.0 [0.0, 0.0] |
| 3.17 Thoracic surgery | 1 | 44 | Risk Ratio (M‐H, Random, 95% CI) | 1.6 [0.40, 6.32] |
| 3.18 Neurological surgery | 0 | 0 | Risk Ratio (M‐H, Random, 95% CI) | 0.0 [0.0, 0.0] |
| 3.19 Oro‐maxillo‐facial surgery | 0 | 0 | Risk Ratio (M‐H, Random, 95% CI) | 0.0 [0.0, 0.0] |
| 3.20 Anaesthesiology | 0 | 0 | Risk Ratio (M‐H, Random, 95% CI) | 0.0 [0.0, 0.0] |
| 3.21 Emergency medicine | 7 | 5208 | Risk Ratio (M‐H, Random, 95% CI) | 0.97 [0.84, 1.12] |
| 3.22 Psychiatry | 0 | 0 | Risk Ratio (M‐H, Random, 95% CI) | 0.0 [0.0, 0.0] |
| 3.23 Neurology | 0 | 0 | Risk Ratio (M‐H, Random, 95% CI) | 0.0 [0.0, 0.0] |
| 3.24 Oncology | 6 | 375 | Risk Ratio (M‐H, Random, 95% CI) | 1.02 [0.87, 1.20] |
| 3.25 Dermatology | 0 | 0 | Risk Ratio (M‐H, Random, 95% CI) | 0.0 [0.0, 0.0] |
| 3.26 Gynaecology | 0 | 0 | Risk Ratio (M‐H, Random, 95% CI) | 0.0 [0.0, 0.0] |
| 3.27 Mixed | 0 | 0 | Risk Ratio (M‐H, Random, 95% CI) | 0.0 [0.0, 0.0] |
| 4 Serious adverse events ‐ based on adequacy of the amount of calories | 56 | 8263 | Risk Ratio (M‐H, Random, 95% CI) | 0.98 [0.90, 1.07] |
| 4.1 Clearly adequate in intervention and clearly inadequate in control | 9 | 5736 | Risk Ratio (M‐H, Random, 95% CI) | 0.98 [0.88, 1.10] |
| 4.2 Inadequate in the experimental or adequate in the control | 4 | 165 | Risk Ratio (M‐H, Random, 95% CI) | 1.17 [0.80, 1.72] |
| 4.3 Experimental group is overfed | 5 | 583 | Risk Ratio (M‐H, Random, 95% CI) | 0.99 [0.74, 1.32] |
| 4.4 Unclear intake in control or experimental | 38 | 1779 | Risk Ratio (M‐H, Random, 95% CI) | 0.90 [0.73, 1.11] |
| 5 Serious adverse events ‐ different screening tools | 56 | 8263 | Risk Ratio (M‐H, Random, 95% CI) | 0.98 [0.90, 1.07] |
| 5.1 NRS 2002 | 1 | 4640 | Risk Ratio (M‐H, Random, 95% CI) | 1.00 [0.85, 1.18] |
| 5.2 MUST | 0 | 0 | Risk Ratio (M‐H, Random, 95% CI) | 0.0 [0.0, 0.0] |
| 5.3 MNA | 0 | 0 | Risk Ratio (M‐H, Random, 95% CI) | 0.0 [0.0, 0.0] |
| 5.4 SGA | 1 | 323 | Risk Ratio (M‐H, Random, 95% CI) | 0.72 [0.28, 1.83] |
| 5.5 Other means | 54 | 3300 | Risk Ratio (M‐H, Random, 95% CI) | 0.97 [0.88, 1.08] |
| 6 Serious adverse events ‐ participants characterised as 'at nutritional risk' due to one of the following conditions | 56 | 8263 | Risk Ratio (M‐H, Random, 95% CI) | 0.98 [0.90, 1.07] |
| 6.1 Major surgery | 34 | 2447 | Risk Ratio (M‐H, Random, 95% CI) | 0.90 [0.75, 1.09] |
| 6.2 Stroke | 0 | 0 | Risk Ratio (M‐H, Random, 95% CI) | 0.0 [0.0, 0.0] |
| 6.3 ICU participants including trauma | 7 | 5209 | Risk Ratio (M‐H, Random, 95% CI) | 0.99 [0.86, 1.14] |
| 6.4 Frail elderly participants with less severe conditions known to increase protein requirements | 2 | 114 | Risk Ratio (M‐H, Random, 95% CI) | 0.56 [0.06, 5.63] |
| 6.5 Participants do not fall into one of the categories above | 13 | 493 | Risk Ratio (M‐H, Random, 95% CI) | 1.02 [0.88, 1.18] |
| 7 Serious adverse events ‐ participants characterised as 'at nutritional risk' due to one of the following criteria | 56 | 8263 | Risk Ratio (M‐H, Random, 95% CI) | 0.98 [0.90, 1.07] |
| 7.1 BMI less than 20.5 kg/m2 | 0 | 0 | Risk Ratio (M‐H, Random, 95% CI) | 0.0 [0.0, 0.0] |
| 7.2 Weight loss of at least 5% during the last three months | 0 | 0 | Risk Ratio (M‐H, Random, 95% CI) | 0.0 [0.0, 0.0] |
| 7.3 Weight loss of at least 10% during the last six months | 2 | 92 | Risk Ratio (M‐H, Random, 95% CI) | 0.33 [0.01, 7.78] |
| 7.4 Insufficient food intake during the last week (50% of requirements or less) | 0 | 0 | Risk Ratio (M‐H, Random, 95% CI) | 0.0 [0.0, 0.0] |
| 7.5 Participants characterised as 'at nutritional risk' by other means | 54 | 8171 | Risk Ratio (M‐H, Random, 95% CI) | 0.98 [0.90, 1.07] |
| 8 Serious adverse events ‐ participants characterised as 'at nutritional risk' due to biomarkers or anthropometrics | 56 | 8263 | Risk Ratio (M‐H, Random, 95% CI) | 0.98 [0.90, 1.07] |
| 8.1 Biomarkers | 6 | 184 | Risk Ratio (M‐H, Random, 95% CI) | 0.45 [0.13, 1.57] |
| 8.2 Anthropometric measures | 3 | 137 | Risk Ratio (M‐H, Random, 95% CI) | 0.74 [0.29, 1.89] |
| 8.3 Both | 3 | 75 | Risk Ratio (M‐H, Random, 95% CI) | 0.66 [0.14, 3.07] |
| 8.4 Characterised by other means | 44 | 7867 | Risk Ratio (M‐H, Random, 95% CI) | 0.99 [0.90, 1.08] |
| 9 Serious adverse events ‐ randomisation year | 56 | 8263 | Risk Ratio (M‐H, Random, 95% CI) | 0.98 [0.90, 1.07] |
| 9.1 Before 1960 | 0 | 0 | Risk Ratio (M‐H, Random, 95% CI) | 0.0 [0.0, 0.0] |
| 9.2 1960 to 1979 | 4 | 154 | Risk Ratio (M‐H, Random, 95% CI) | 1.38 [0.67, 2.83] |
| 9.3 1980 to 1999 | 44 | 2442 | Risk Ratio (M‐H, Random, 95% CI) | 0.98 [0.88, 1.10] |
| 9.4 After 1999 | 8 | 5667 | Risk Ratio (M‐H, Random, 95% CI) | 0.96 [0.83, 1.12] |
| 10 Serious adverse events ‐ trials where the intervention lasts fewer than three days compared with trials where the intervention lasts three days or more | 56 | 8263 | Risk Ratio (M‐H, Random, 95% CI) | 0.98 [0.90, 1.07] |
| 10.1 Three days or more | 54 | 8156 | Risk Ratio (M‐H, Random, 95% CI) | 0.98 [0.89, 1.07] |
| 10.2 Less than three days | 1 | 80 | Risk Ratio (M‐H, Random, 95% CI) | 1.2 [0.59, 2.45] |
| 10.3 Unknown | 1 | 27 | Risk Ratio (M‐H, Random, 95% CI) | 0.0 [0.0, 0.0] |
| 11 Serious adverse events ‐ 'best‐worst case' scenario | 56 | 8452 | Risk Ratio (M‐H, Random, 95% CI) | 0.80 [0.68, 0.94] |
| 12 Serious adverse events ‐ 'worst‐best case' scenario | 56 | 8452 | Risk Ratio (M‐H, Random, 95% CI) | 1.12 [0.96, 1.30] |
| 13 Serious adverse events co‐interventions | 56 | 8263 | Risk Ratio (M‐H, Fixed, 95% CI) | 0.94 [0.85, 1.04] |
| 13.1 Received nutrition support as co‐intervention | 6 | 5164 | Risk Ratio (M‐H, Fixed, 95% CI) | 0.97 [0.85, 1.12] |
| 13.2 did not receive nutrition support as co‐intervention | 49 | 3019 | Risk Ratio (M‐H, Fixed, 95% CI) | 0.90 [0.77, 1.04] |
| 13.3 delayed versus early nutrition support | 1 | 80 | Risk Ratio (M‐H, Fixed, 95% CI) | 1.2 [0.59, 2.45] |
28.1. Analysis.
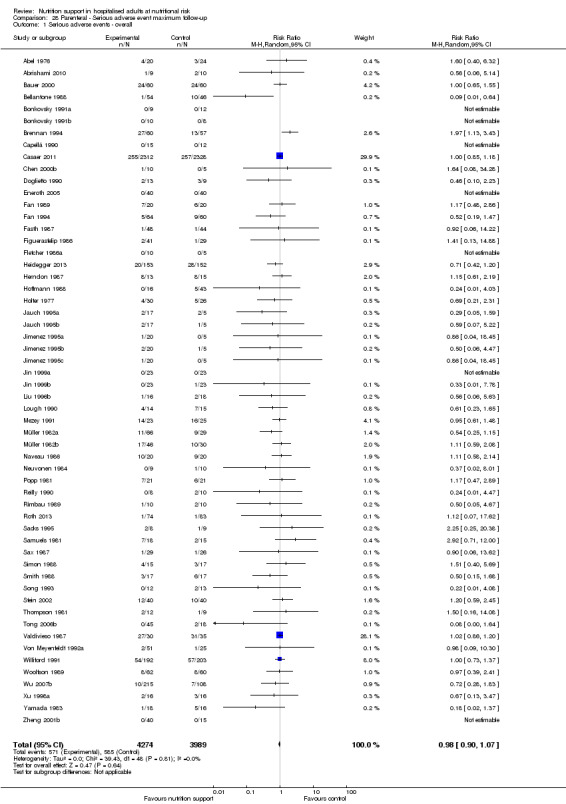
Comparison 28 Parenteral ‐ Serious adverse event maximum follow‐up, Outcome 1 Serious adverse events ‐ overall.
28.2. Analysis.
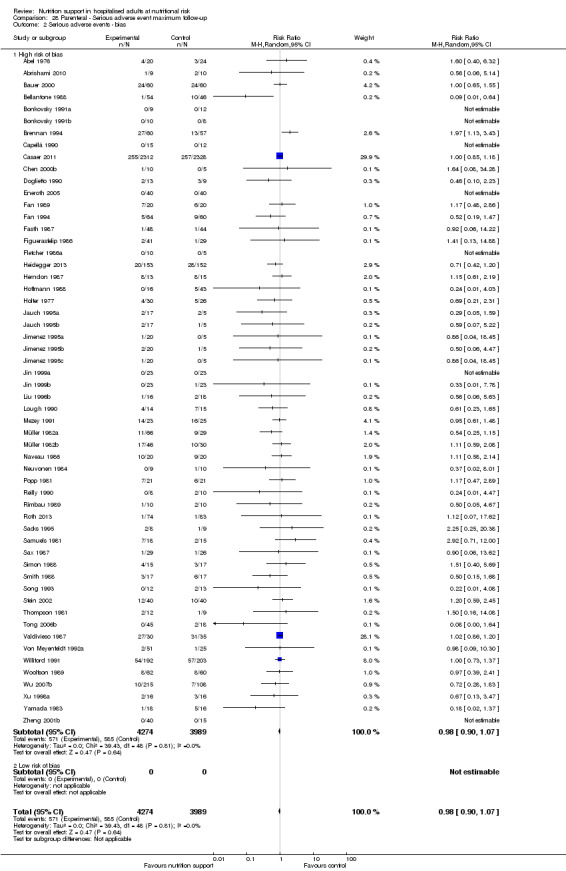
Comparison 28 Parenteral ‐ Serious adverse event maximum follow‐up, Outcome 2 Serious adverse events ‐ bias.
28.3. Analysis.
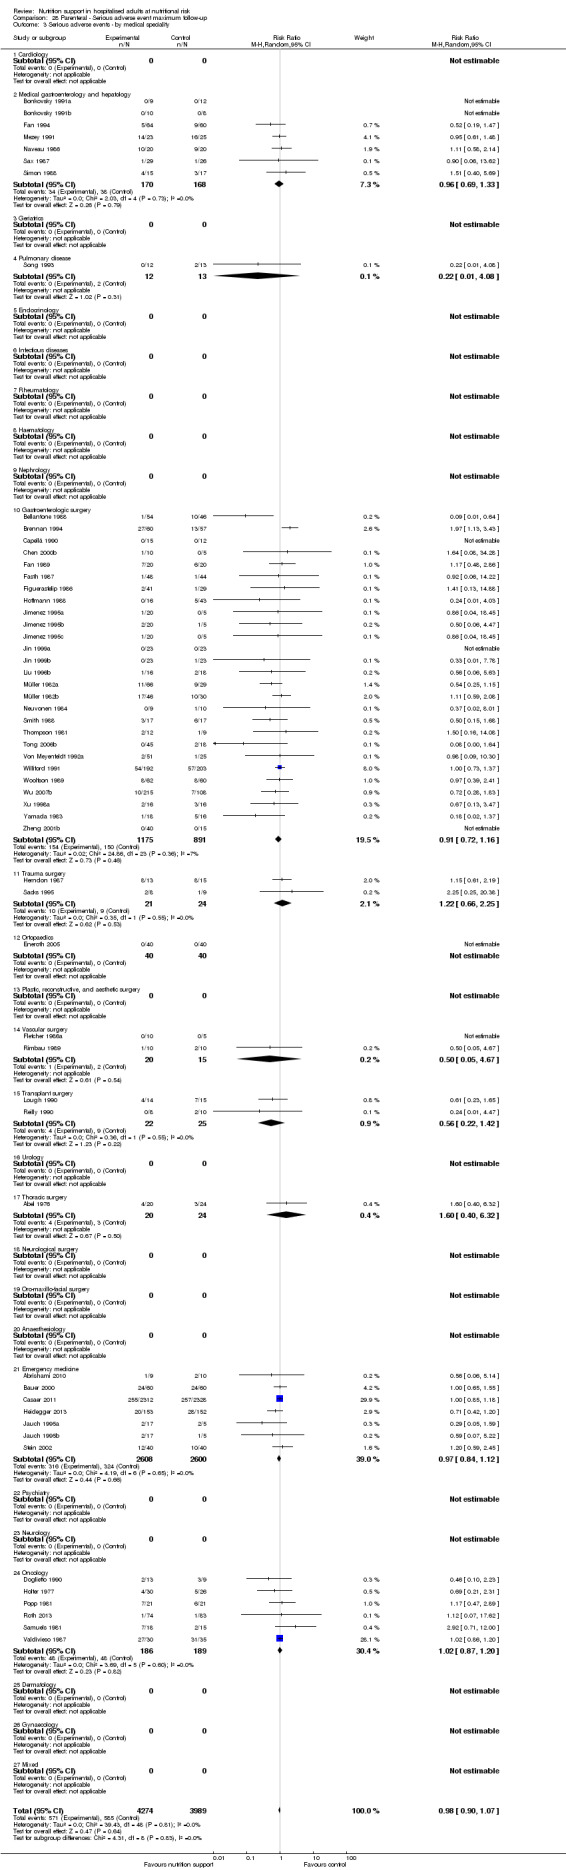
Comparison 28 Parenteral ‐ Serious adverse event maximum follow‐up, Outcome 3 Serious adverse events ‐ by medical speciality.
28.4. Analysis.
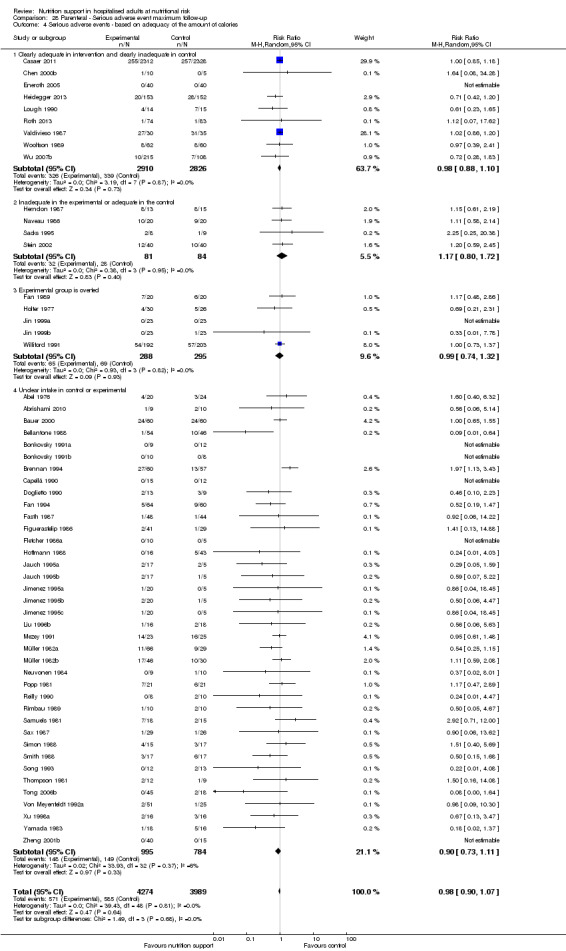
Comparison 28 Parenteral ‐ Serious adverse event maximum follow‐up, Outcome 4 Serious adverse events ‐ based on adequacy of the amount of calories.
28.5. Analysis.
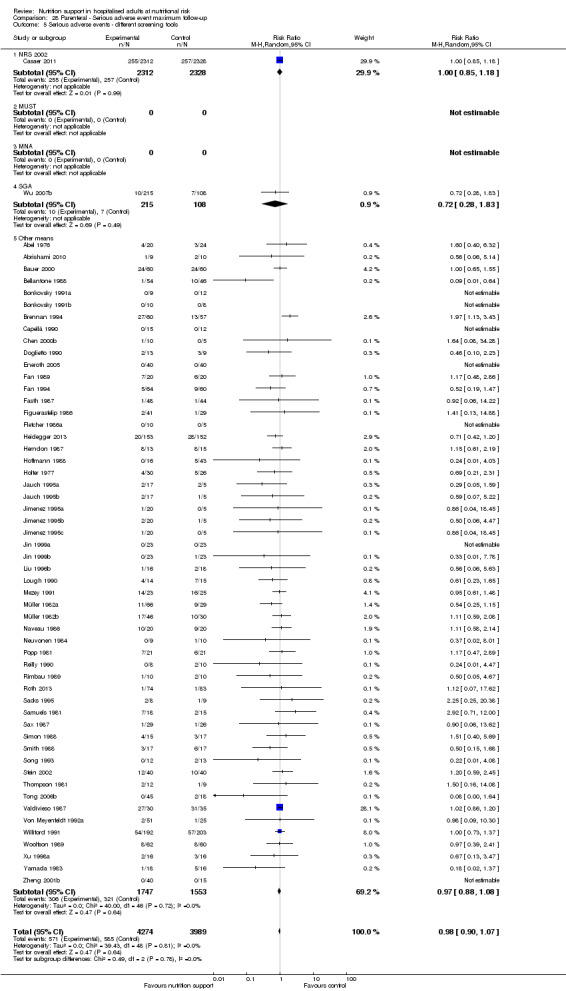
Comparison 28 Parenteral ‐ Serious adverse event maximum follow‐up, Outcome 5 Serious adverse events ‐ different screening tools.
28.6. Analysis.
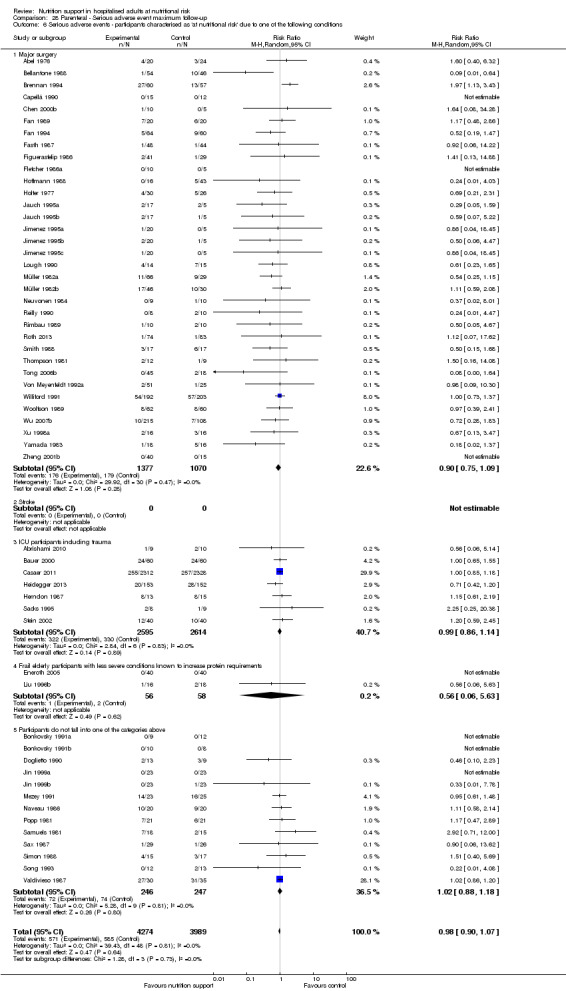
Comparison 28 Parenteral ‐ Serious adverse event maximum follow‐up, Outcome 6 Serious adverse events ‐ participants characterised as 'at nutritional risk' due to one of the following conditions.
28.7. Analysis.
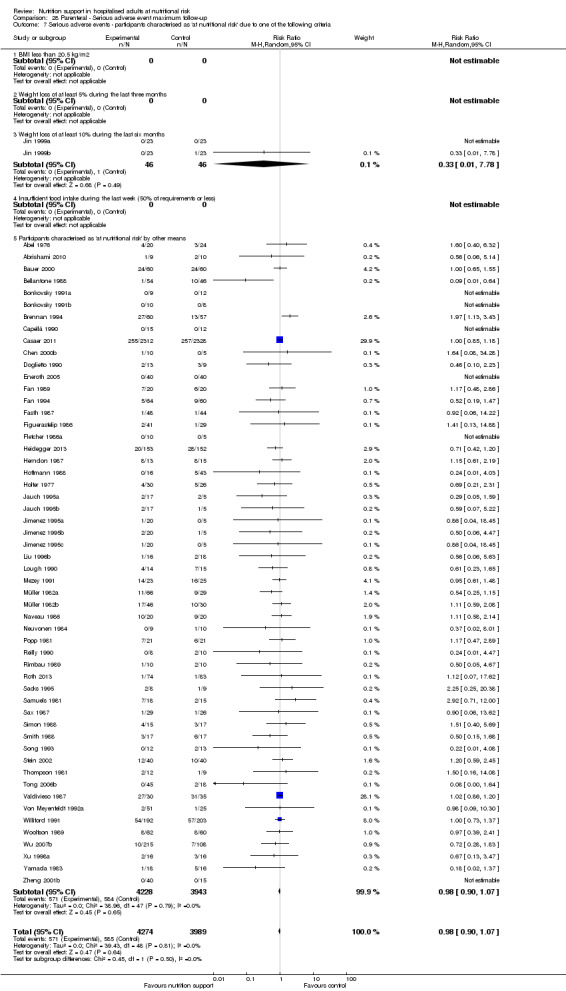
Comparison 28 Parenteral ‐ Serious adverse event maximum follow‐up, Outcome 7 Serious adverse events ‐ participants characterised as 'at nutritional risk' due to one of the following criteria.
28.8. Analysis.
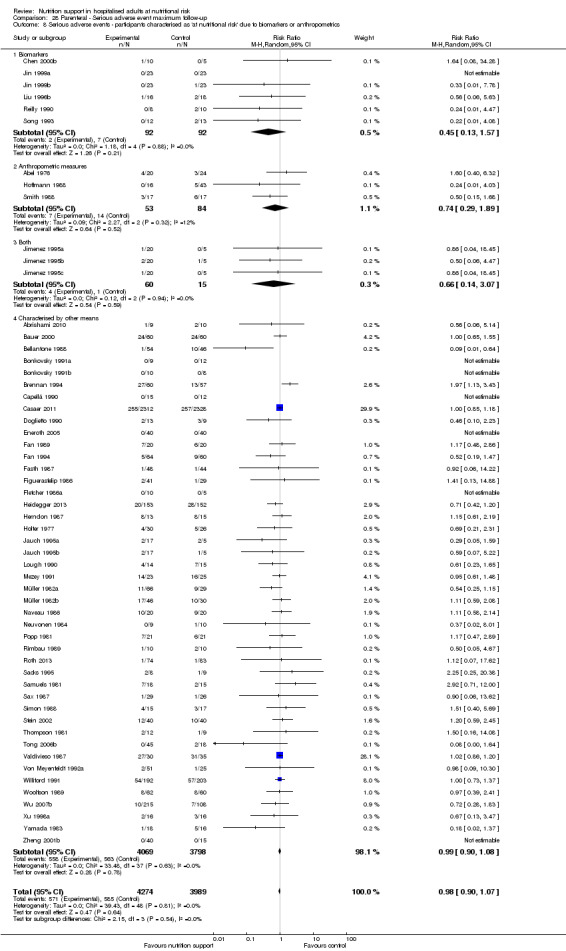
Comparison 28 Parenteral ‐ Serious adverse event maximum follow‐up, Outcome 8 Serious adverse events ‐ participants characterised as 'at nutritional risk' due to biomarkers or anthropometrics.
28.9. Analysis.
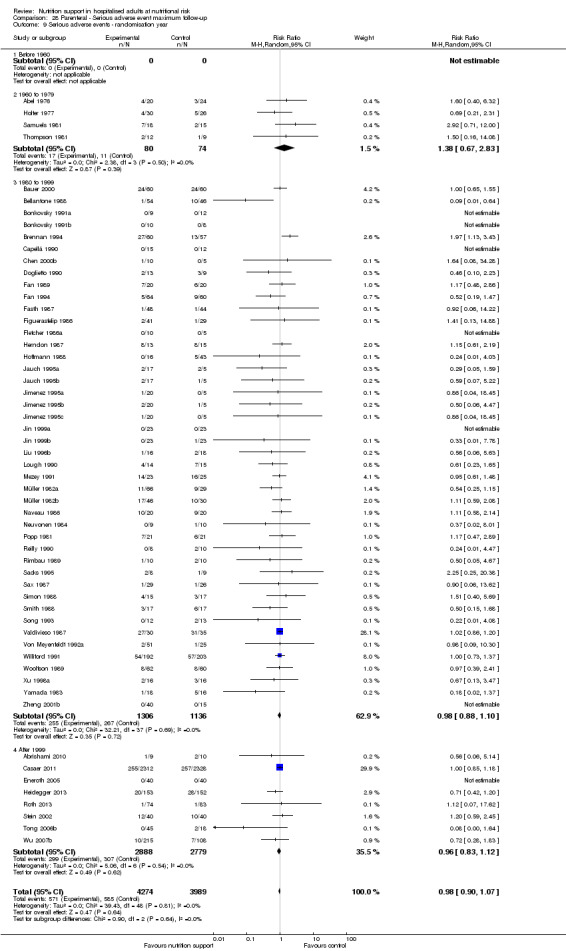
Comparison 28 Parenteral ‐ Serious adverse event maximum follow‐up, Outcome 9 Serious adverse events ‐ randomisation year.
28.10. Analysis.
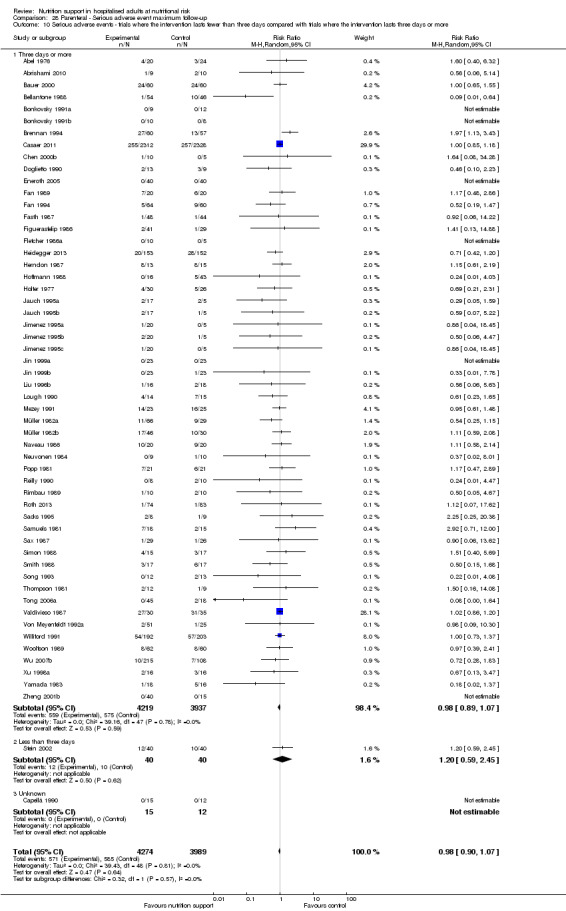
Comparison 28 Parenteral ‐ Serious adverse event maximum follow‐up, Outcome 10 Serious adverse events ‐ trials where the intervention lasts fewer than three days compared with trials where the intervention lasts three days or more.
28.11. Analysis.
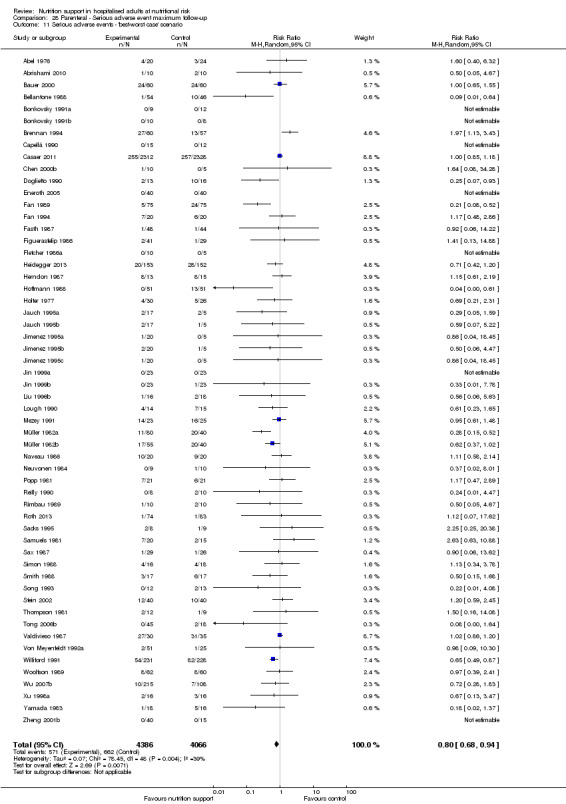
Comparison 28 Parenteral ‐ Serious adverse event maximum follow‐up, Outcome 11 Serious adverse events ‐ 'best‐worst case' scenario.
28.12. Analysis.

Comparison 28 Parenteral ‐ Serious adverse event maximum follow‐up, Outcome 12 Serious adverse events ‐ 'worst‐best case' scenario.
28.13. Analysis.
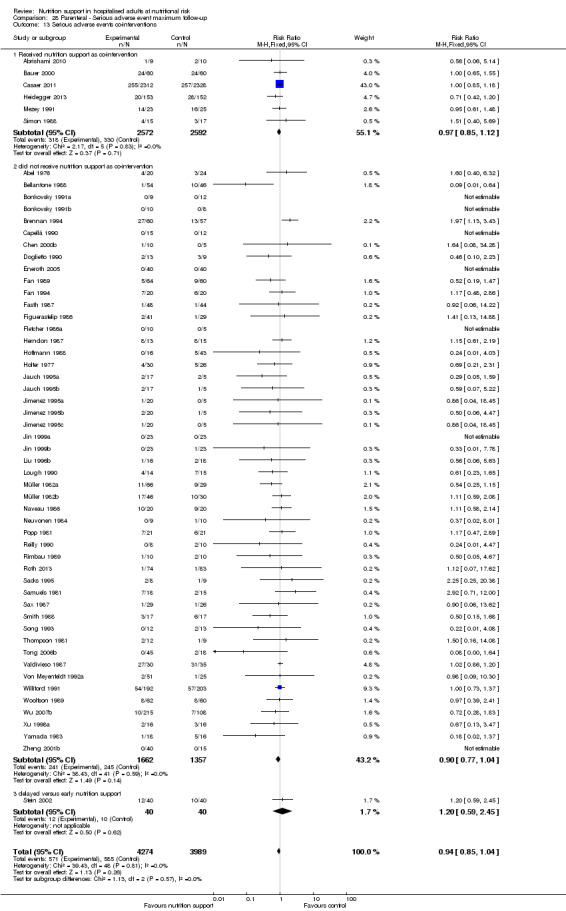
Comparison 28 Parenteral ‐ Serious adverse event maximum follow‐up, Outcome 13 Serious adverse events co‐interventions.
Comparison 29. Morbidity ‐ end of intervention.
| Outcome or subgroup title | No. of studies | No. of participants | Statistical method | Effect size |
|---|---|---|---|---|
| 1 Morbidity ‐ overall | 1 | 124 | Risk Ratio (M‐H, Random, 95% CI) | 0.63 [0.42, 0.94] |
Comparison 30. Morbidity ‐ maximum follow‐up.
| Outcome or subgroup title | No. of studies | No. of participants | Statistical method | Effect size |
|---|---|---|---|---|
| 1 Morbidity ‐ overall | 2 | 245 | Risk Ratio (M‐H, Random, 95% CI) | 0.71 [0.53, 0.95] |
Comparison 31. BMI ‐ end of intervention.
| Outcome or subgroup title | No. of studies | No. of participants | Statistical method | Effect size |
|---|---|---|---|---|
| 1 BMI ‐ overall | 15 | 1008 | Mean Difference (IV, Random, 95% CI) | 0.57 [0.38, 0.77] |
| 2 BMI ‐ bias | 15 | 1008 | Mean Difference (IV, Random, 95% CI) | 0.57 [0.38, 0.77] |
| 2.1 High risk of bias | 15 | 1008 | Mean Difference (IV, Random, 95% CI) | 0.57 [0.38, 0.77] |
| 2.2 Low risk of bias | 0 | 0 | Mean Difference (IV, Random, 95% CI) | 0.0 [0.0, 0.0] |
| 3 BMI ‐ mode of administration | 15 | 1008 | Mean Difference (IV, Random, 95% CI) | 0.57 [0.38, 0.77] |
| 3.1 General nutrition support | 1 | 132 | Mean Difference (IV, Random, 95% CI) | 1.0 [‐0.67, 2.67] |
| 3.2 Fortified nutrition | 1 | 146 | Mean Difference (IV, Random, 95% CI) | 1.10 [‐0.24, 2.44] |
| 3.3 Oral nutrition support | 7 | 363 | Mean Difference (IV, Random, 95% CI) | 0.63 [‐0.09, 1.35] |
| 3.4 Enteral nutrition | 5 | 288 | Mean Difference (IV, Random, 95% CI) | 0.53 [0.32, 0.75] |
| 3.5 Parenteral nutrition | 0 | 0 | Mean Difference (IV, Random, 95% CI) | 0.0 [0.0, 0.0] |
| 3.6 Mixed nutrition support | 1 | 79 | Mean Difference (IV, Random, 95% CI) | 1.12 [‐0.15, 2.39] |
| 4 BMI ‐ by medical delivery | 15 | 1008 | Mean Difference (IV, Random, 95% CI) | 0.57 [0.38, 0.77] |
| 4.1 Cardiology | 0 | 0 | Mean Difference (IV, Random, 95% CI) | 0.0 [0.0, 0.0] |
| 4.2 Medical gastroenterology and hepatology | 2 | 101 | Mean Difference (IV, Random, 95% CI) | 1.77 [‐0.19, 3.72] |
| 4.3 Geriatrics | 3 | 227 | Mean Difference (IV, Random, 95% CI) | 0.86 [‐0.10, 1.82] |
| 4.4 Pulmonary disease | 0 | 0 | Mean Difference (IV, Random, 95% CI) | 0.0 [0.0, 0.0] |
| 4.5 Endocrinology | 0 | 0 | Mean Difference (IV, Random, 95% CI) | 0.0 [0.0, 0.0] |
| 4.6 Infectious diseases | 0 | 0 | Mean Difference (IV, Random, 95% CI) | 0.0 [0.0, 0.0] |
| 4.7 Rheumatology | 0 | 0 | Mean Difference (IV, Random, 95% CI) | 0.0 [0.0, 0.0] |
| 4.8 Haematology | 0 | 0 | Mean Difference (IV, Random, 95% CI) | 0.0 [0.0, 0.0] |
| 4.9 Nephrology | 0 | 0 | Mean Difference (IV, Random, 95% CI) | 0.0 [0.0, 0.0] |
| 4.10 Gastroenterologic surgery | 5 | 279 | Mean Difference (IV, Random, 95% CI) | 0.48 [0.25, 0.70] |
| 4.11 Trauma surgery | 2 | 184 | Mean Difference (IV, Random, 95% CI) | 0.64 [0.10, 1.18] |
| 4.12 Ortopaedics | 0 | 0 | Mean Difference (IV, Random, 95% CI) | 0.0 [0.0, 0.0] |
| 4.13 Plastic, reconstructive, and aesthetic surgery | 1 | 37 | Mean Difference (IV, Random, 95% CI) | 1.30 [0.04, 2.56] |
| 4.14 Vascular surgery | 0 | 0 | Mean Difference (IV, Random, 95% CI) | 0.0 [0.0, 0.0] |
| 4.15 Transplant surgery | 0 | 0 | Mean Difference (IV, Random, 95% CI) | 0.0 [0.0, 0.0] |
| 4.16 Urology | 0 | 0 | Mean Difference (IV, Random, 95% CI) | 0.0 [0.0, 0.0] |
| 4.17 Thoracic surgery | 0 | 0 | Mean Difference (IV, Random, 95% CI) | 0.0 [0.0, 0.0] |
| 4.18 Neurological surgery | 0 | 0 | Mean Difference (IV, Random, 95% CI) | 0.0 [0.0, 0.0] |
| 4.19 Oro‐maxillo‐facial surgery | 0 | 0 | Mean Difference (IV, Random, 95% CI) | 0.0 [0.0, 0.0] |
| 4.20 Anaesthesiology | 0 | 0 | Mean Difference (IV, Random, 95% CI) | 0.0 [0.0, 0.0] |
| 4.21 Emergency medicine | 0 | 0 | Mean Difference (IV, Random, 95% CI) | 0.0 [0.0, 0.0] |
| 4.22 Psychiatry | 0 | 0 | Mean Difference (IV, Random, 95% CI) | 0.0 [0.0, 0.0] |
| 4.23 Neurology | 1 | 48 | Mean Difference (IV, Random, 95% CI) | 1.0 [‐1.11, 3.11] |
| 4.24 Oncology | 0 | 0 | Mean Difference (IV, Random, 95% CI) | 0.0 [0.0, 0.0] |
| 4.25 Dermatology | 0 | 0 | Mean Difference (IV, Random, 95% CI) | 0.0 [0.0, 0.0] |
| 4.26 Gynaecology | 0 | 0 | Mean Difference (IV, Random, 95% CI) | 0.0 [0.0, 0.0] |
| 4.27 Mixed | 1 | 132 | Mean Difference (IV, Random, 95% CI) | 1.0 [‐0.67, 2.67] |
| 5 BMI ‐ based on adequacy of the amount of calories | 15 | 1008 | Mean Difference (IV, Random, 95% CI) | 0.57 [0.38, 0.77] |
| 5.1 Clearly adequate in intervention and clearly inadequate in control | 7 | 544 | Mean Difference (IV, Random, 95% CI) | 0.90 [0.23, 1.58] |
| 5.2 Inadequate in the experimental or adequate in the control | 1 | 37 | Mean Difference (IV, Random, 95% CI) | 1.30 [0.04, 2.56] |
| 5.3 Experimental group is overfed | 1 | 46 | Mean Difference (IV, Random, 95% CI) | 0.0 [0.0, 0.0] |
| 5.4 Unclear intake in control or experimental | 6 | 381 | Mean Difference (IV, Random, 95% CI) | 0.52 [0.31, 0.73] |
| 6 BMI ‐ different screening tools | 15 | 1008 | Mean Difference (IV, Random, 95% CI) | 0.57 [0.38, 0.77] |
| 6.1 NRS 2002 | 2 | 211 | Mean Difference (IV, Random, 95% CI) | 1.08 [0.06, 2.09] |
| 6.2 MUST | 0 | 0 | Mean Difference (IV, Random, 95% CI) | 0.0 [0.0, 0.0] |
| 6.3 MNA | 1 | 35 | Mean Difference (IV, Random, 95% CI) | 0.60 [‐0.78, 1.98] |
| 6.4 SGA | 0 | 0 | Mean Difference (IV, Random, 95% CI) | 0.0 [0.0, 0.0] |
| 6.5 Other means | 12 | 762 | Mean Difference (IV, Random, 95% CI) | 0.55 [0.35, 0.76] |
| 7 BMI ‐ participants characterised as 'at nutritional risk' due to one of the following conditions | 15 | 1008 | Mean Difference (IV, Random, 95% CI) | 0.57 [0.38, 0.77] |
| 7.1 Major surgery | 6 | 316 | Mean Difference (IV, Random, 95% CI) | 0.50 [0.28, 0.73] |
| 7.2 Stroke | 1 | 48 | Mean Difference (IV, Random, 95% CI) | 1.0 [‐1.11, 3.11] |
| 7.3 ICU participants including trauma | 1 | 64 | Mean Difference (IV, Random, 95% CI) | 0.40 [‐1.22, 2.02] |
| 7.4 Frail elderly participants with less severe conditions known to increase protein requirements | 2 | 199 | Mean Difference (IV, Random, 95% CI) | 0.75 [0.22, 1.27] |
| 7.5 Participants do not fall into one of the categories above | 5 | 381 | Mean Difference (IV, Random, 95% CI) | 1.06 [0.26, 1.87] |
| 8 BMI ‐ participants characterised as 'at nutritional risk' due to one of the following criteria | 15 | 1008 | Mean Difference (IV, Random, 95% CI) | 0.57 [0.38, 0.77] |
| 8.1 BMI less than 20.5 kg/m2 | 3 | 229 | Mean Difference (IV, Random, 95% CI) | 1.21 [0.29, 2.12] |
| 8.2 Weight loss of at least 5% during the last three months | 0 | 0 | Mean Difference (IV, Random, 95% CI) | 0.0 [0.0, 0.0] |
| 8.3 Weight loss of at least 10% during the last six months | 0 | 0 | Mean Difference (IV, Random, 95% CI) | 0.0 [0.0, 0.0] |
| 8.4 Insufficient food intake during the last week (50% of requirements or less) | 0 | 0 | Mean Difference (IV, Random, 95% CI) | 0.0 [0.0, 0.0] |
| 8.5 Participants characterised as 'at nutritional risk' by other means | 12 | 779 | Mean Difference (IV, Random, 95% CI) | 0.54 [0.34, 0.75] |
| 9 BMI ‐ participants characterised as 'at nutritional risk' due to biomarkers of anthropometrics | 15 | 1008 | Mean Difference (IV, Random, 95% CI) | 0.57 [0.38, 0.77] |
| 9.1 Biomarkers | 0 | 0 | Mean Difference (IV, Random, 95% CI) | 0.0 [0.0, 0.0] |
| 9.2 Anthropometric measures | 3 | 229 | Mean Difference (IV, Random, 95% CI) | 1.21 [0.29, 2.12] |
| 9.3 Characterised by other means | 12 | 779 | Mean Difference (IV, Random, 95% CI) | 0.54 [0.34, 0.75] |
| 10 BMI ‐ randomisation year | 15 | 1008 | Mean Difference (IV, Random, 95% CI) | 0.57 [0.38, 0.77] |
| 10.1 Before 1960 | 0 | 0 | Mean Difference (IV, Random, 95% CI) | 0.0 [0.0, 0.0] |
| 10.2 1960 to 1979 | 0 | 0 | Mean Difference (IV, Random, 95% CI) | 0.0 [0.0, 0.0] |
| 10.3 1980 to 1999 | 4 | 182 | Mean Difference (IV, Random, 95% CI) | 1.03 [‐0.91, 2.97] |
| 10.4 After 1999 | 11 | 826 | Mean Difference (IV, Random, 95% CI) | 0.56 [0.36, 0.76] |
| 11 BMI ‐ trials where the intervention lasts fewer than three days compared with trials where the intervention lasts three days or more | 15 | 1008 | Mean Difference (IV, Random, 95% CI) | 0.57 [0.38, 0.77] |
| 11.1 Three days or more | 15 | 1008 | Mean Difference (IV, Random, 95% CI) | 0.57 [0.38, 0.77] |
| 11.2 Less than three days | 0 | 0 | Mean Difference (IV, Random, 95% CI) | 0.0 [0.0, 0.0] |
Comparison 32. BMI ‐ maximum follow‐up.
| Outcome or subgroup title | No. of studies | No. of participants | Statistical method | Effect size |
|---|---|---|---|---|
| 1 BMI ‐ overall | 20 | 1528 | Mean Difference (IV, Random, 95% CI) | 0.40 [‐0.02, 0.83] |
| 2 BMI ‐ bias | 20 | 1528 | Mean Difference (IV, Random, 95% CI) | 0.44 [0.02, 0.87] |
| 2.1 High risk of bias | 20 | 1528 | Mean Difference (IV, Random, 95% CI) | 0.44 [0.02, 0.87] |
| 2.2 Low risk of bias | 0 | 0 | Mean Difference (IV, Random, 95% CI) | 0.0 [0.0, 0.0] |
| 3 BMI ‐ mode of delivery | 20 | 1528 | Mean Difference (IV, Random, 95% CI) | 0.44 [0.02, 0.87] |
| 3.1 General nutrition support | 2 | 196 | Mean Difference (IV, Random, 95% CI) | 0.92 [0.26, 1.57] |
| 3.2 Fortified nutrition | 1 | 146 | Mean Difference (IV, Random, 95% CI) | 1.10 [‐0.24, 2.44] |
| 3.3 Oral nutrition support | 8 | 588 | Mean Difference (IV, Random, 95% CI) | 0.43 [‐0.16, 1.02] |
| 3.4 Enteral nutrition | 8 | 519 | Mean Difference (IV, Random, 95% CI) | 0.17 [‐0.60, 0.93] |
| 3.5 Parenteral nutrition | 0 | 0 | Mean Difference (IV, Random, 95% CI) | 0.0 [0.0, 0.0] |
| 3.6 Mixed nutrition support | 1 | 79 | Mean Difference (IV, Random, 95% CI) | 1.12 [‐0.15, 2.39] |
| 4 BMI ‐ by medical speciality | 20 | 1528 | Mean Difference (IV, Random, 95% CI) | 0.44 [0.02, 0.87] |
| 4.1 Cardiology | 0 | 0 | Mean Difference (IV, Random, 95% CI) | 0.0 [0.0, 0.0] |
| 4.2 Medical gastroenterology and hepatology | 3 | 201 | Mean Difference (IV, Random, 95% CI) | 1.02 [0.13, 1.90] |
| 4.3 Geriatrics | 4 | 452 | Mean Difference (IV, Random, 95% CI) | 0.47 [‐0.24, 1.17] |
| 4.4 Pulmonary disease | 0 | 0 | Mean Difference (IV, Random, 95% CI) | 0.0 [0.0, 0.0] |
| 4.5 Endocrinology | 0 | 0 | Mean Difference (IV, Random, 95% CI) | 0.0 [0.0, 0.0] |
| 4.6 Infectious diseases | 0 | 0 | Mean Difference (IV, Random, 95% CI) | 0.0 [0.0, 0.0] |
| 4.7 Rheumatology | 0 | 0 | Mean Difference (IV, Random, 95% CI) | 0.0 [0.0, 0.0] |
| 4.8 Haematology | 0 | 0 | Mean Difference (IV, Random, 95% CI) | 0.0 [0.0, 0.0] |
| 4.9 Nephrology | 0 | 0 | Mean Difference (IV, Random, 95% CI) | 0.0 [0.0, 0.0] |
| 4.10 Gastroenterologic surgery | 6 | 346 | Mean Difference (IV, Random, 95% CI) | ‐0.52 [‐2.16, 1.11] |
| 4.11 Trauma surgery | 2 | 184 | Mean Difference (IV, Random, 95% CI) | 0.64 [0.10, 1.18] |
| 4.12 Ortopaedics | 0 | 0 | Mean Difference (IV, Random, 95% CI) | 0.0 [0.0, 0.0] |
| 4.13 Plastic, reconstructive, and aesthetic surgery | 1 | 37 | Mean Difference (IV, Random, 95% CI) | 1.30 [0.04, 2.56] |
| 4.14 Vascular surgery | 0 | 0 | Mean Difference (IV, Random, 95% CI) | 0.0 [0.0, 0.0] |
| 4.15 Transplant surgery | 0 | 0 | Mean Difference (IV, Random, 95% CI) | 0.0 [0.0, 0.0] |
| 4.16 Urology | 0 | 0 | Mean Difference (IV, Random, 95% CI) | 0.0 [0.0, 0.0] |
| 4.17 Thoracic surgery | 0 | 0 | Mean Difference (IV, Random, 95% CI) | 0.0 [0.0, 0.0] |
| 4.18 Neurological surgery | 0 | 0 | Mean Difference (IV, Random, 95% CI) | 0.0 [0.0, 0.0] |
| 4.19 Oro‐maxillo‐facial surgery | 0 | 0 | Mean Difference (IV, Random, 95% CI) | 0.0 [0.0, 0.0] |
| 4.20 Anaesthesiology | 0 | 0 | Mean Difference (IV, Random, 95% CI) | 0.0 [0.0, 0.0] |
| 4.21 Emergency medicine | 0 | 0 | Mean Difference (IV, Random, 95% CI) | 0.0 [0.0, 0.0] |
| 4.22 Psychiatry | 0 | 0 | Mean Difference (IV, Random, 95% CI) | 0.0 [0.0, 0.0] |
| 4.23 Neurology | 2 | 112 | Mean Difference (IV, Random, 95% CI) | 0.91 [0.24, 1.58] |
| 4.24 Oncology | 1 | 64 | Mean Difference (IV, Random, 95% CI) | 0.40 [‐1.40, 2.20] |
| 4.25 Dermatology | 0 | 0 | Mean Difference (IV, Random, 95% CI) | 0.0 [0.0, 0.0] |
| 4.26 Gynaecology | 0 | 0 | Mean Difference (IV, Random, 95% CI) | 0.0 [0.0, 0.0] |
| 4.27 Mixed | 1 | 132 | Mean Difference (IV, Random, 95% CI) | 1.0 [‐0.67, 2.67] |
| 5 BMI ‐ based on adequacy of the amount of calories | 20 | 1528 | Mean Difference (IV, Random, 95% CI) | 0.40 [‐0.02, 0.83] |
| 5.1 Clearly adequate in intervention and clearly inadequate in control | 9 | 686 | Mean Difference (IV, Random, 95% CI) | 0.54 [0.33, 0.74] |
| 5.2 Inadequate in the experimental or adequate in the control | 2 | 101 | Mean Difference (IV, Random, 95% CI) | 1.00 [0.38, 1.61] |
| 5.3 Experimental group is overfed | 1 | 46 | Mean Difference (IV, Random, 95% CI) | 0.0 [0.0, 0.0] |
| 5.4 Unclear intake in control or experimental | 8 | 695 | Mean Difference (IV, Random, 95% CI) | ‐0.04 [‐1.11, 1.03] |
| 6 BMI ‐ different screening tools | 20 | 1528 | Mean Difference (IV, Random, 95% CI) | 0.44 [0.02, 0.87] |
| 6.1 NRS 2002 | 2 | 211 | Mean Difference (IV, Random, 95% CI) | 1.08 [0.06, 2.09] |
| 6.2 MUST | 1 | 64 | Mean Difference (IV, Random, 95% CI) | 0.90 [0.19, 1.61] |
| 6.3 MNA | 1 | 35 | Mean Difference (IV, Random, 95% CI) | 0.60 [‐0.78, 1.98] |
| 6.4 SGA | 0 | 0 | Mean Difference (IV, Random, 95% CI) | 0.0 [0.0, 0.0] |
| 6.5 Other means | 16 | 1218 | Mean Difference (IV, Random, 95% CI) | 0.30 [‐0.22, 0.83] |
| 7 BMI ‐ participants characterised as 'at nutritional risk' due to one of the following conditions | 20 | 1528 | Mean Difference (IV, Random, 95% CI) | 0.44 [0.02, 0.87] |
| 7.1 Major surgery | 7 | 383 | Mean Difference (IV, Random, 95% CI) | ‐0.23 [‐1.55, 1.09] |
| 7.2 Stroke | 2 | 112 | Mean Difference (IV, Random, 95% CI) | 0.91 [0.24, 1.58] |
| 7.3 ICU participants including trauma | 1 | 64 | Mean Difference (IV, Random, 95% CI) | 0.40 [‐1.22, 2.02] |
| 7.4 Frail elderly participants with less severe conditions known to increase protein requirements | 2 | 199 | Mean Difference (IV, Random, 95% CI) | 0.75 [0.22, 1.27] |
| 7.5 Participants do not fall into one of the categories above | 8 | 770 | Mean Difference (IV, Random, 95% CI) | 0.65 [0.22, 1.09] |
| 8 BMI ‐ participants characterised as 'at nutritional risk' due to one of the following criteria | 20 | 1528 | Mean Difference (IV, Random, 95% CI) | 0.44 [0.02, 0.87] |
| 8.1 BMI less than 20.5 kg/m2 | 3 | 229 | Mean Difference (IV, Random, 95% CI) | 1.21 [0.29, 2.12] |
| 8.2 Weight loss of at least 5% during the last three months | 0 | 0 | Mean Difference (IV, Random, 95% CI) | 0.0 [0.0, 0.0] |
| 8.3 Weight loss of at least 10% during the last six months | 0 | 0 | Mean Difference (IV, Random, 95% CI) | 0.0 [0.0, 0.0] |
| 8.4 Insufficient food intake during the last week (50% of requirements or less) | 0 | 0 | Mean Difference (IV, Random, 95% CI) | 0.0 [0.0, 0.0] |
| 8.5 Participants characterised as 'at nutritional risk' by other means | 17 | 1299 | Mean Difference (IV, Random, 95% CI) | 0.35 [‐0.11, 0.81] |
| 9 BMI ‐ participants characterised as 'at nutritional risk' due to biomarkers or anthropometrics | 20 | 1528 | Mean Difference (IV, Random, 95% CI) | 0.44 [0.02, 0.87] |
| 9.1 Biomarkers | 0 | 0 | Mean Difference (IV, Random, 95% CI) | 0.0 [0.0, 0.0] |
| 9.2 Anthropometric measures | 3 | 229 | Mean Difference (IV, Random, 95% CI) | 1.21 [0.29, 2.12] |
| 9.3 Characterised by other means | 17 | 1299 | Mean Difference (IV, Random, 95% CI) | 0.35 [‐0.11, 0.81] |
| 10 BMI ‐ randomisation year | 20 | 1528 | Mean Difference (IV, Random, 95% CI) | 0.44 [0.02, 0.87] |
| 10.1 Before 1960 | 0 | 0 | Mean Difference (IV, Random, 95% CI) | 0.0 [0.0, 0.0] |
| 10.2 1960 to 1979 | 0 | 0 | Mean Difference (IV, Random, 95% CI) | 0.0 [0.0, 0.0] |
| 10.3 1980 to 1999 | 5 | 249 | Mean Difference (IV, Random, 95% CI) | 0.02 [‐2.62, 2.67] |
| 10.4 After 1999 | 15 | 1279 | Mean Difference (IV, Random, 95% CI) | 0.57 [0.39, 0.75] |
| 11 BMI ‐ trials where the intervention lasts fewer than three days compared with trials where the intervention lasts three days or more | 20 | 1528 | Mean Difference (IV, Random, 95% CI) | 0.44 [0.02, 0.87] |
| 11.1 Three days or more | 20 | 1528 | Mean Difference (IV, Random, 95% CI) | 0.44 [0.02, 0.87] |
| 11.2 Less than three days | 0 | 0 | Mean Difference (IV, Random, 95% CI) | 0.0 [0.0, 0.0] |
Comparison 33. Weight ‐ end of intervention.
| Outcome or subgroup title | No. of studies | No. of participants | Statistical method | Effect size |
|---|---|---|---|---|
| 1 Weight ‐ overall | 81 | 5445 | Mean Difference (IV, Random, 95% CI) | 1.32 [0.65, 2.00] |
| 2 Weight ‐ bias | 81 | 5445 | Mean Difference (IV, Random, 95% CI) | 1.32 [0.65, 2.00] |
| 2.1 High risk of bias | 81 | 5445 | Mean Difference (IV, Random, 95% CI) | 1.32 [0.65, 2.00] |
| 2.2 Low risk of bias | 0 | 0 | Mean Difference (IV, Random, 95% CI) | 0.0 [0.0, 0.0] |
| 3 Weight ‐ mode of delivery | 81 | 5445 | Mean Difference (IV, Random, 95% CI) | 1.32 [0.65, 2.00] |
| 3.1 General nutrition support | 4 | 962 | Mean Difference (IV, Random, 95% CI) | ‐0.00 [‐0.17, 0.16] |
| 3.2 Fortified nutrition | 2 | 230 | Mean Difference (IV, Random, 95% CI) | 1.45 [‐0.92, 3.83] |
| 3.3 Oral nutrition support | 31 | 1924 | Mean Difference (IV, Random, 95% CI) | 0.33 [‐0.21, 0.87] |
| 3.4 Enteral nutrition | 26 | 1616 | Mean Difference (IV, Random, 95% CI) | 2.62 [1.23, 4.01] |
| 3.5 Parenteral nutrition | 17 | 667 | Mean Difference (IV, Random, 95% CI) | 1.48 [‐0.20, 3.15] |
| 3.6 Mixed nutrition support | 1 | 46 | Mean Difference (IV, Random, 95% CI) | ‐3.90 [‐4.45, ‐3.35] |
| 4 Weight ‐ by medical speciality | 81 | 5445 | Mean Difference (IV, Random, 95% CI) | 1.32 [0.65, 2.00] |
| 4.1 Cardiology | 0 | 0 | Mean Difference (IV, Random, 95% CI) | 0.0 [0.0, 0.0] |
| 4.2 Medical gastroenterology and hepatology | 7 | 345 | Mean Difference (IV, Random, 95% CI) | 0.88 [‐0.03, 1.79] |
| 4.3 Geriatrics | 10 | 1422 | Mean Difference (IV, Random, 95% CI) | 0.62 [‐0.30, 1.54] |
| 4.4 Pulmonary disease | 4 | 91 | Mean Difference (IV, Random, 95% CI) | 0.95 [‐0.43, 2.33] |
| 4.5 Endocrinology | 0 | 0 | Mean Difference (IV, Random, 95% CI) | 0.0 [0.0, 0.0] |
| 4.6 Infectious diseases | 0 | 0 | Mean Difference (IV, Random, 95% CI) | 0.0 [0.0, 0.0] |
| 4.7 Rheumatology | 0 | 0 | Mean Difference (IV, Random, 95% CI) | 0.0 [0.0, 0.0] |
| 4.8 Haematology | 0 | 0 | Mean Difference (IV, Random, 95% CI) | 0.0 [0.0, 0.0] |
| 4.9 Nephrology | 0 | 0 | Mean Difference (IV, Random, 95% CI) | 0.0 [0.0, 0.0] |
| 4.10 Gastroenterologic surgery | 35 | 1423 | Mean Difference (IV, Random, 95% CI) | 1.26 [‐0.12, 2.63] |
| 4.11 Trauma surgery | 0 | 0 | Mean Difference (IV, Random, 95% CI) | 0.0 [0.0, 0.0] |
| 4.12 Ortopaedics | 7 | 395 | Mean Difference (IV, Random, 95% CI) | 2.79 [1.36, 4.23] |
| 4.13 Plastic, reconstructive, and aesthetic surgery | 0 | 0 | Mean Difference (IV, Random, 95% CI) | 0.0 [0.0, 0.0] |
| 4.14 Vascular surgery | 0 | 0 | Mean Difference (IV, Random, 95% CI) | 0.0 [0.0, 0.0] |
| 4.15 Transplant surgery | 1 | 29 | Mean Difference (IV, Random, 95% CI) | ‐4.60 [‐15.21, 6.01] |
| 4.16 Urology | 0 | 0 | Mean Difference (IV, Random, 95% CI) | 0.0 [0.0, 0.0] |
| 4.17 Thoracic surgery | 2 | 548 | Mean Difference (IV, Random, 95% CI) | 0.06 [‐2.39, 2.51] |
| 4.18 Neurological surgery | 1 | 48 | Mean Difference (IV, Random, 95% CI) | 10.53 [6.72, 14.34] |
| 4.19 Oro‐maxillo‐facial surgery | 1 | 32 | Mean Difference (IV, Random, 95% CI) | 0.6 [‐1.10, 2.30] |
| 4.20 Anaesthesiology | 0 | 0 | Mean Difference (IV, Random, 95% CI) | 0.0 [0.0, 0.0] |
| 4.21 Emergency medicine | 0 | 0 | Mean Difference (IV, Random, 95% CI) | 0.0 [0.0, 0.0] |
| 4.22 Psychiatry | 0 | 0 | Mean Difference (IV, Random, 95% CI) | 0.0 [0.0, 0.0] |
| 4.23 Neurology | 5 | 247 | Mean Difference (IV, Random, 95% CI) | 0.74 [‐2.15, 3.63] |
| 4.24 Oncology | 1 | 23 | Mean Difference (IV, Random, 95% CI) | ‐1.0 [‐7.41, 5.41] |
| 4.25 Dermatology | 0 | 0 | Mean Difference (IV, Random, 95% CI) | 0.0 [0.0, 0.0] |
| 4.26 Gynaecology | 0 | 0 | Mean Difference (IV, Random, 95% CI) | 0.0 [0.0, 0.0] |
| 4.27 Mixed | 7 | 842 | Mean Difference (IV, Random, 95% CI) | 0.21 [‐0.58, 1.00] |
| 5 Weight ‐ based on adequacy of the amount of calories | 81 | 5445 | Mean Difference (IV, Random, 95% CI) | 1.32 [0.65, 2.00] |
| 5.1 Clearly adequate in intervention and clearly inadequate in control | 20 | 1287 | Mean Difference (IV, Random, 95% CI) | 1.46 [‐0.19, 3.12] |
| 5.2 Inadequate in the experimental or adequate in the control | 19 | 1626 | Mean Difference (IV, Random, 95% CI) | 0.79 [0.06, 1.51] |
| 5.3 Experimental group is overfed | 5 | 151 | Mean Difference (IV, Random, 95% CI) | 0.64 [‐0.86, 2.13] |
| 5.4 Unclear intake in control or experimental | 37 | 2381 | Mean Difference (IV, Random, 95% CI) | 1.61 [0.50, 2.72] |
| 6 Weight ‐ different screening tools | 81 | 5445 | Mean Difference (IV, Random, 95% CI) | 1.32 [0.65, 2.00] |
| 6.1 NRS 2002 | 4 | 353 | Mean Difference (IV, Random, 95% CI) | 1.12 [‐0.29, 2.53] |
| 6.2 MUST | 0 | 0 | Mean Difference (IV, Random, 95% CI) | 0.0 [0.0, 0.0] |
| 6.3 MNA | 2 | 104 | Mean Difference (IV, Random, 95% CI) | 1.45 [‐0.02, 2.91] |
| 6.4 SGA | 2 | 445 | Mean Difference (IV, Random, 95% CI) | ‐0.65 [‐3.30, 2.00] |
| 6.5 Other means | 73 | 4543 | Mean Difference (IV, Random, 95% CI) | 1.41 [0.68, 2.15] |
| 7 Weight ‐ participants characterised as 'at nutritional risk' due to one of the following conditions | 81 | 5445 | Mean Difference (IV, Random, 95% CI) | 1.32 [0.65, 2.00] |
| 7.1 Major surgery | 40 | 2213 | Mean Difference (IV, Random, 95% CI) | 1.24 [0.11, 2.37] |
| 7.2 Stroke | 3 | 181 | Mean Difference (IV, Random, 95% CI) | 0.39 [‐2.75, 3.54] |
| 7.3 ICU participants including trauma | 0 | 0 | Mean Difference (IV, Random, 95% CI) | 0.0 [0.0, 0.0] |
| 7.4 Frail elderly participants with less severe conditions known to increase protein requirements | 8 | 1256 | Mean Difference (IV, Random, 95% CI) | 1.83 [0.71, 2.96] |
| 7.5 Participants do not fall into one of the categories above | 30 | 1795 | Mean Difference (IV, Random, 95% CI) | 0.93 [0.38, 1.48] |
| 8 Weight ‐ participants characterised as 'at nutritional risk' due to one of the following criteria | 81 | 5445 | Mean Difference (IV, Random, 95% CI) | 1.32 [0.65, 2.00] |
| 8.1 BMI less than 20.5 kg/m2 | 5 | 309 | Mean Difference (IV, Random, 95% CI) | 3.97 [1.06, 6.89] |
| 8.2 Weight loss of at least 5% during the last three months | 0 | 0 | Mean Difference (IV, Random, 95% CI) | 0.0 [0.0, 0.0] |
| 8.3 Weight loss of at least 10% during the last six months | 2 | 79 | Mean Difference (IV, Random, 95% CI) | 0.30 [‐0.36, 0.96] |
| 8.4 Insufficient food intake during the last week (50% of requirements or less) | 0 | 0 | Mean Difference (IV, Random, 95% CI) | 0.0 [0.0, 0.0] |
| 8.5 Participants characterised as 'at nutritional risk' by other means | 74 | 5057 | Mean Difference (IV, Random, 95% CI) | 1.30 [0.59, 2.00] |
| 9 Weight ‐ participants characterised as 'at nutritional risk' due to biomarkers or anthropometrics | 81 | 5445 | Mean Difference (IV, Random, 95% CI) | 1.32 [0.65, 2.00] |
| 9.1 Biomarkers | 9 | 750 | Mean Difference (IV, Random, 95% CI) | 4.37 [2.16, 6.58] |
| 9.2 Anthropometric measures | 15 | 996 | Mean Difference (IV, Random, 95% CI) | 1.04 [‐0.15, 2.23] |
| 9.3 Characterised by other means | 54 | 3639 | Mean Difference (IV, Random, 95% CI) | 0.66 [0.13, 1.20] |
| 9.4 Mixed | 3 | 60 | Mean Difference (IV, Random, 95% CI) | ‐0.37 [‐1.95, 1.22] |
| 10 Weight ‐ randomisation year | 81 | 5445 | Mean Difference (IV, Random, 95% CI) | 1.32 [0.65, 2.00] |
| 10.1 Before 1960 | 0 | 0 | Mean Difference (IV, Random, 95% CI) | 0.0 [0.0, 0.0] |
| 10.2 1960 to 1979 | 1 | 21 | Mean Difference (IV, Random, 95% CI) | 3.85 [1.69, 6.01] |
| 10.3 1980 to 1999 | 48 | 2365 | Mean Difference (IV, Random, 95% CI) | 1.23 [0.24, 2.22] |
| 10.4 After 1999 | 32 | 3059 | Mean Difference (IV, Random, 95% CI) | 1.07 [0.35, 1.79] |
| 11 Weight ‐ trials where the intervention lasts fewer than three days compared with trials where the intervention lasts three days or more | 81 | 5445 | Mean Difference (IV, Random, 95% CI) | 1.32 [0.65, 2.00] |
| 11.1 Three days or more | 76 | 5287 | Mean Difference (IV, Random, 95% CI) | 1.40 [0.70, 2.10] |
| 11.2 Less than three days | 5 | 158 | Mean Difference (IV, Random, 95% CI) | 0.15 [‐1.62, 1.92] |
| 12 Weight ‐ Missing SDs | 81 | 5445 | Mean Difference (IV, Random, 95% CI) | 1.40 [0.76, 2.03] |
| 12.1 missing SDs imputed from all trials | 81 | 5445 | Mean Difference (IV, Random, 95% CI) | 1.40 [0.76, 2.03] |
Comparison 34. Weight ‐ maximum follow‐up.
| Outcome or subgroup title | No. of studies | No. of participants | Statistical method | Effect size |
|---|---|---|---|---|
| 1 Weight ‐ overall | 94 | 6916 | Mean Difference (IV, Random, 95% CI) | 1.13 [0.50, 1.75] |
| 2 Weight ‐ bias | 94 | 6916 | Mean Difference (IV, Random, 95% CI) | 1.13 [0.50, 1.75] |
| 2.1 High risk of bias | 94 | 6916 | Mean Difference (IV, Random, 95% CI) | 1.13 [0.50, 1.75] |
| 2.2 Low risk of bias | 0 | 0 | Mean Difference (IV, Random, 95% CI) | 0.0 [0.0, 0.0] |
| 3 Weight ‐ mode of delivery | 94 | 6916 | Mean Difference (IV, Random, 95% CI) | 1.13 [0.50, 1.75] |
| 3.1 General nutrition support | 6 | 1328 | Mean Difference (IV, Random, 95% CI) | 0.41 [‐0.58, 1.41] |
| 3.2 Fortified nutrition | 2 | 230 | Mean Difference (IV, Random, 95% CI) | 1.45 [‐0.92, 3.83] |
| 3.3 Oral nutrition support | 32 | 2149 | Mean Difference (IV, Random, 95% CI) | 0.29 [‐0.22, 0.80] |
| 3.4 Enteral nutrition | 31 | 2081 | Mean Difference (IV, Random, 95% CI) | 1.98 [0.74, 3.22] |
| 3.5 Parenteral nutrition | 22 | 1082 | Mean Difference (IV, Random, 95% CI) | 1.25 [‐0.25, 2.75] |
| 3.6 Mixed | 1 | 46 | Mean Difference (IV, Random, 95% CI) | ‐3.90 [‐4.45, ‐3.35] |
| 4 Weight ‐ by medical speciality | 94 | 6916 | Mean Difference (IV, Random, 95% CI) | 1.13 [0.50, 1.75] |
| 4.1 Cardiology | 0 | 0 | Mean Difference (IV, Random, 95% CI) | 0.0 [0.0, 0.0] |
| 4.2 Medical gastroenterology and hepatology | 8 | 388 | Mean Difference (IV, Random, 95% CI) | 0.13 [‐1.05, 1.30] |
| 4.3 Geriatrics | 11 | 1647 | Mean Difference (IV, Random, 95% CI) | 0.61 [‐0.27, 1.50] |
| 4.4 Pulmonary disease | 4 | 91 | Mean Difference (IV, Random, 95% CI) | 0.95 [‐0.43, 2.33] |
| 4.5 Endocrinology | 0 | 0 | Mean Difference (IV, Random, 95% CI) | 0.0 [0.0, 0.0] |
| 4.6 Infectious diseases | 0 | 0 | Mean Difference (IV, Random, 95% CI) | 0.0 [0.0, 0.0] |
| 4.7 Rheumatology | 0 | 0 | Mean Difference (IV, Random, 95% CI) | 0.0 [0.0, 0.0] |
| 4.8 Haematology | 0 | 0 | Mean Difference (IV, Random, 95% CI) | 0.0 [0.0, 0.0] |
| 4.9 Nephrology | 0 | 0 | Mean Difference (IV, Random, 95% CI) | 0.0 [0.0, 0.0] |
| 4.10 Gastroenterologic surgery | 44 | 2260 | Mean Difference (IV, Random, 95% CI) | 1.09 [‐0.11, 2.29] |
| 4.11 Trauma surgery | 0 | 0 | Mean Difference (IV, Random, 95% CI) | 0.0 [0.0, 0.0] |
| 4.12 Ortopaedics | 8 | 697 | Mean Difference (IV, Random, 95% CI) | 2.62 [1.21, 4.02] |
| 4.13 Plastic, reconstructive, and aesthetic surgery | 0 | 0 | Mean Difference (IV, Random, 95% CI) | 0.0 [0.0, 0.0] |
| 4.14 Vascular surgery | 0 | 0 | Mean Difference (IV, Random, 95% CI) | 0.0 [0.0, 0.0] |
| 4.15 Transplant surgery | 1 | 29 | Mean Difference (IV, Random, 95% CI) | ‐4.60 [‐15.21, 6.01] |
| 4.16 Urology | 0 | 0 | Mean Difference (IV, Random, 95% CI) | 0.0 [0.0, 0.0] |
| 4.17 Thoracic surgery | 2 | 548 | Mean Difference (IV, Random, 95% CI) | 0.06 [‐2.39, 2.51] |
| 4.18 Neurological surgery | 1 | 48 | Mean Difference (IV, Random, 95% CI) | 10.53 [6.72, 14.34] |
| 4.19 Oro‐maxillo‐facial surgery | 1 | 32 | Mean Difference (IV, Random, 95% CI) | 0.6 [‐1.10, 2.30] |
| 4.20 Anaesthesiology | 0 | 0 | Mean Difference (IV, Random, 95% CI) | 0.0 [0.0, 0.0] |
| 4.21 Emergency medicine | 0 | 0 | Mean Difference (IV, Random, 95% CI) | 0.0 [0.0, 0.0] |
| 4.22 Psychiatry | 0 | 0 | Mean Difference (IV, Random, 95% CI) | 0.0 [0.0, 0.0] |
| 4.23 Neurology | 6 | 311 | Mean Difference (IV, Random, 95% CI) | 1.72 [0.19, 3.25] |
| 4.24 Oncology | 1 | 23 | Mean Difference (IV, Random, 95% CI) | ‐1.0 [‐7.41, 5.41] |
| 4.25 Dermatology | 0 | 0 | Mean Difference (IV, Random, 95% CI) | 0.0 [0.0, 0.0] |
| 4.26 Gynaecology | 0 | 0 | Mean Difference (IV, Random, 95% CI) | 0.0 [0.0, 0.0] |
| 4.27 Mixed | 7 | 842 | Mean Difference (IV, Random, 95% CI) | 0.22 [‐0.58, 1.02] |
| 5 Weight ‐ based on adequacy of the amount of nutrition | 94 | 6916 | Mean Difference (IV, Random, 95% CI) | 1.13 [0.50, 1.75] |
| 5.1 Clearly adequate in intervention and clearly inadequate in control | 22 | 1933 | Mean Difference (IV, Random, 95% CI) | 1.03 [‐0.41, 2.46] |
| 5.2 Inadequate in the experimental or adequate in the control | 21 | 1992 | Mean Difference (IV, Random, 95% CI) | 0.86 [0.16, 1.57] |
| 5.3 Experimental group is overfed | 5 | 151 | Mean Difference (IV, Random, 95% CI) | 0.64 [‐0.87, 2.14] |
| 5.4 Unclear intake in control or experimental | 46 | 2840 | Mean Difference (IV, Random, 95% CI) | 1.34 [0.35, 2.33] |
| 6 Weight ‐ different screening tools | 94 | 6916 | Mean Difference (IV, Random, 95% CI) | 1.13 [0.50, 1.75] |
| 6.1 NRS 2002 | 4 | 353 | Mean Difference (IV, Random, 95% CI) | 1.12 [‐0.29, 2.53] |
| 6.2 MUST | 1 | 64 | Mean Difference (IV, Random, 95% CI) | 2.10 [0.30, 3.90] |
| 6.3 MNA | 2 | 104 | Mean Difference (IV, Random, 95% CI) | 1.56 [0.09, 3.03] |
| 6.4 SGA | 4 | 1091 | Mean Difference (IV, Random, 95% CI) | ‐1.03 [‐2.12, 0.06] |
| 6.5 Other means | 83 | 5304 | Mean Difference (IV, Random, 95% CI) | 1.26 [0.56, 1.95] |
| 7 Weight ‐ participants characterised as 'at nutritional risk' due to one of the following conditions | 94 | 6916 | Mean Difference (IV, Random, 95% CI) | 1.13 [0.50, 1.75] |
| 7.1 Major surgery | 49 | 3050 | Mean Difference (IV, Random, 95% CI) | 1.08 [0.08, 2.09] |
| 7.2 Stroke | 4 | 245 | Mean Difference (IV, Random, 95% CI) | 1.68 [0.12, 3.24] |
| 7.3 ICU participants including trauma | 1 | 43 | Mean Difference (IV, Random, 95% CI) | ‐1.6 [‐2.37, ‐0.83] |
| 7.4 Frail elderly participants with less severe conditions known to increase protein requirements | 9 | 1558 | Mean Difference (IV, Random, 95% CI) | 1.61 [0.59, 2.64] |
| 7.5 Participants do not fall into one of the categories above | 31 | 2020 | Mean Difference (IV, Random, 95% CI) | 0.85 [0.33, 1.38] |
| 8 Weight ‐ participants characterised as 'at nutritional risk' due to one of the following criteria | 94 | 6916 | Mean Difference (IV, Random, 95% CI) | 1.13 [0.50, 1.75] |
| 8.1 BMI less than 20.5 kg/m2 | 5 | 309 | Mean Difference (IV, Random, 95% CI) | 3.97 [1.06, 6.89] |
| 8.2 Weight loss of at least 5% during the last three months | 2 | 30 | Mean Difference (IV, Random, 95% CI) | ‐5.83 [‐15.15, 3.48] |
| 8.3 Weight loss of at least 10% during the last six months | 2 | 79 | Mean Difference (IV, Random, 95% CI) | 0.30 [‐0.36, 0.96] |
| 8.4 Insufficient food intake during the last week (50% of requirements or less) | 0 | 0 | Mean Difference (IV, Random, 95% CI) | 0.0 [0.0, 0.0] |
| 8.5 Participants characterised as 'at nutritional risk' by other means | 85 | 6498 | Mean Difference (IV, Random, 95% CI) | 1.12 [0.48, 1.77] |
| 9 Weight ‐ participants characterised as 'at nutritional risk' due to biomarkers or anthropometrics | 94 | 6916 | Mean Difference (IV, Random, 95% CI) | 1.13 [0.50, 1.75] |
| 9.1 Biomarkers | 9 | 750 | Mean Difference (IV, Random, 95% CI) | 4.37 [2.16, 6.58] |
| 9.2 Anthropometric measures | 15 | 996 | Mean Difference (IV, Random, 95% CI) | 0.87 [‐0.30, 2.04] |
| 9.3 Characterised by other means | 67 | 5110 | Mean Difference (IV, Random, 95% CI) | 0.49 [0.01, 0.96] |
| 9.4 Mixed | 3 | 60 | Mean Difference (IV, Random, 95% CI) | ‐0.37 [‐1.95, 1.22] |
| 10 Weight ‐ randomisation year | 23 | 1940 | Mean Difference (IV, Random, 95% CI) | 0.48 [‐0.44, 1.39] |
| 10.1 Before 1960 | 0 | 0 | Mean Difference (IV, Random, 95% CI) | 0.0 [0.0, 0.0] |
| 10.2 1960 to 1979 | 1 | 21 | Mean Difference (IV, Random, 95% CI) | 3.83 [1.66, 6.00] |
| 10.3 1980 to 1999 | 14 | 372 | Mean Difference (IV, Random, 95% CI) | 0.34 [‐0.95, 1.64] |
| 10.4 After 1999 | 8 | 1547 | Mean Difference (IV, Random, 95% CI) | 0.01 [‐1.09, 1.12] |
| 11 Weight ‐ trials where the intervention lasts fewer than three days compared with trials where the intervention lasts three days or more | 94 | 6916 | Mean Difference (IV, Random, 95% CI) | 1.13 [0.50, 1.75] |
| 11.1 Three days or more | 89 | 6758 | Mean Difference (IV, Random, 95% CI) | 1.18 [0.54, 1.83] |
| 11.2 Less than three days | 5 | 158 | Mean Difference (IV, Random, 95% CI) | 0.15 [‐1.62, 1.92] |
34.2. Analysis.
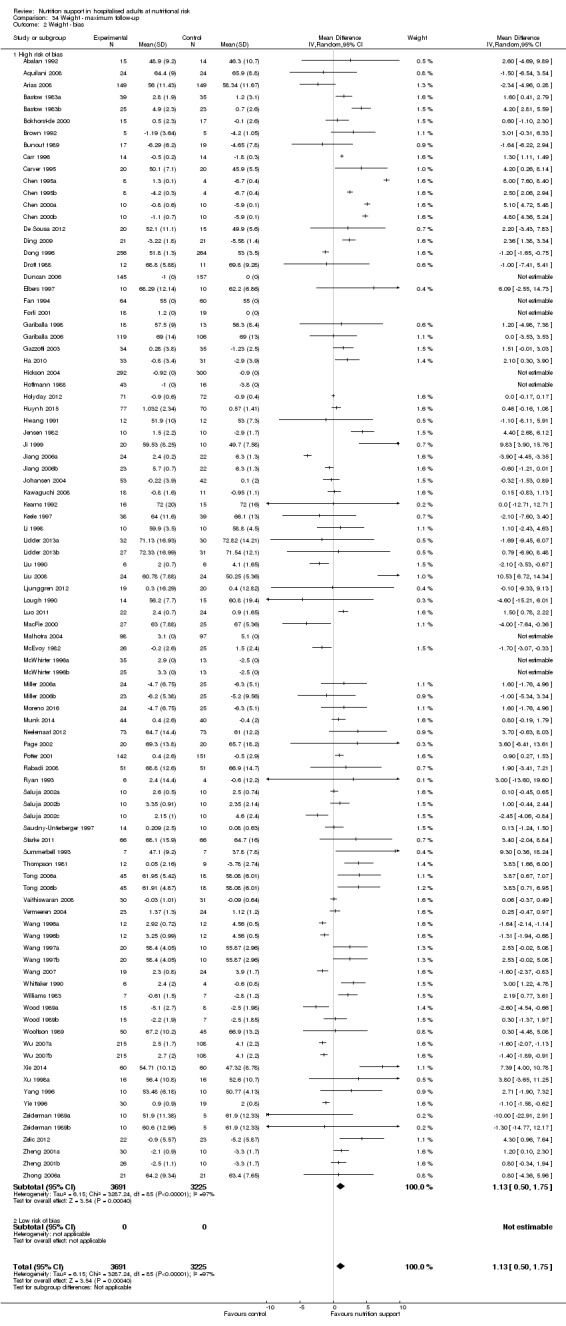
Comparison 34 Weight ‐ maximum follow‐up, Outcome 2 Weight ‐ bias.
Comparison 35. Hand‐grip strength ‐ end of intervention.
| Outcome or subgroup title | No. of studies | No. of participants | Statistical method | Effect size |
|---|---|---|---|---|
| 1 Hand‐grip strength ‐ overall | 14 | 783 | Mean Difference (IV, Random, 95% CI) | 1.47 [0.58, 2.37] |
Comparison 36. Hand‐grip strength ‐ maximum follow‐up.
| Outcome or subgroup title | No. of studies | No. of participants | Statistical method | Effect size |
|---|---|---|---|---|
| 1 Hand‐grip strength ‐ overall | 18 | 1240 | Mean Difference (IV, Random, 95% CI) | 0.96 [0.15, 1.76] |
Comparison 37. Six‐minute walking distance ‐ end of intervention.
| Outcome or subgroup title | No. of studies | No. of participants | Statistical method | Effect size |
|---|---|---|---|---|
| 1 Six‐minute walking distance ‐ overall | 1 | 102 | Mean Difference (IV, Random, 95% CI) | 133.27 [24.32, 242.22] |
Characteristics of studies
Characteristics of included studies [ordered by study ID]
Abalan 1992.
| Methods | Randomised clinical trial, France | |
| Participants | 29 hospitalised geriatric adults, at nutritional risk as characterised by trialist Male:female = 1:28 Mean age = 85 years Exclusion criteria: diabetes mellitus, hepatic, renal, cardiac failure, major illness, sensory impairment, other conditions impeding assessment, prior nutritional treatment, uncooperativeness, poor oral intake, tube‐feeding or being bedridden |
|
| Interventions | Experimental group: Oral nutrition support (n = 15) In addition to normal hospital food, participants received oral nutrients during the 105 trial days. The amounts of calories ingested daily were from day 1 through day 35 equal to 1254 kcal (± 259 kcal), and from day 36 through day 105 equal to 936 kcal (± 235 kcal) Control group: No intervention (n = 15) Co‐interventions: Participants received normal hospital food with no nutritional supplements |
|
| Outcomes | Cognitive function (using MMS scores), body weight | |
| Study dates | Not stated | |
| Notes | We contacted the authors on 6th September 2015 by email: fabalan@ch‐perrens.fr. Authors replied with additional information on randomisation sequence (although we were missing information on whether the coin toss was performed by an independent person), blinding and incomplete outcome data. | |
| Risk of bias | ||
| Bias | Authors' judgement | Support for judgement |
| Random sequence generation (selection bias) | Unclear risk | Randomisation was done my means of coin toss but it was unclear if it was performed by an independent person. |
| Allocation concealment (selection bias) | Unclear risk | Not described. |
| Blinding of participants and personnel (performance bias) All outcomes | High risk | Participants and personnel were not blinded. |
| Blinding of outcome assessment (detection bias) All outcomes | High risk | Blinding of outcome assessment was not performed. |
| Incomplete outcome data (attrition bias) All outcomes | Low risk | There were no drop‐outs. |
| Selective reporting (reporting bias) | Unclear risk | No protocol could be obtained and the trial did not report on all‐cause mortality and serious adverse event. |
| For‐profit bias | High risk | Trial was supported by Sopharga, Latema and Valpan Laboratories, who provided the oral nutrition support. |
| Other bias | Low risk | The trial appeared to be free of other components that could put it at risk of bias. |
Abel 1976.
| Methods | Randomised clinical trial, USA | |
| Participants | 44 hospitalised adults undergoing cardiac surgical procedures and malnourished at nutritional risk due to anthropometricsMale:female = not stated Mean age = not stated Exclusion criteria: not stated. |
|
| Interventions | Experimental group: immediate hypertonic total parenteral nutrition for 5 days(n = 20) Control group: routine postoperative intravenous solutions for 5 days(n = 24) |
|
| Outcomes | Mortality, net fluid balance, nitrogen balance | |
| Study dates | Not stated | |
| Notes | We contadted the authors on 9th November 2015 by email barnett.octo@mgh.harvard.edu. We received no reply. | |
| Risk of bias | ||
| Bias | Authors' judgement | Support for judgement |
| Random sequence generation (selection bias) | Unclear risk | Not described |
| Allocation concealment (selection bias) | Unclear risk | Not described |
| Blinding of participants and personnel (performance bias) All outcomes | Unclear risk | Not described |
| Blinding of outcome assessment (detection bias) All outcomes | Unclear risk | Not described |
| Incomplete outcome data (attrition bias) All outcomes | Unclear risk | The number of participants with incomplete data was not described. |
| Selective reporting (reporting bias) | Unclear risk | No protocol could be obtained and the trial did not report all‐cause mortality and serious adverse events. |
| For‐profit bias | Unclear risk | It was unclear how the trial was funded. |
| Other bias | Low risk | The trial appeared to be free of other components that could put it at risk of bias. |
Abrishami 2010.
| Methods | Randomised clinical trial, Iran | |
| Participants | 20 hospitalised adults with recent ICU admission (< 24 hrs), having systemic inflammatory response syndrome, Acute Physiology and Chronic Health Evaluation II (APACHE II) score > 10 and expected not to feed via oral route for at least 5 days, at nutritional risk due to being in a ICU Mean age = 56.5 years Exclusion criteria: adults with high probability of death in the next 7 days of admission, pregnant, lactating, and having EN contra‐indication |
|
| Interventions | Experimental group: parenteral nutrition (500 ml 10% amino acid solution, 500 ml 50% dextrose) (n = 10) Control group: no intervention (n = 10) Co‐interventions: standard ICU care + EN (1 kCal/ml) |
|
| Outcomes | Mortality, pre‐albumin, tumour necrosis factor, sequential organ failure assessment, therapeutic intervention scoring system | |
| Study dates | November 2007 and May 2009 | |
| Notes | We contacted the authors on 9th November 2015 by email: Mojtahed@sina.tums.ac.ir . We received no reply. | |
| Risk of bias | ||
| Bias | Authors' judgement | Support for judgement |
| Random sequence generation (selection bias) | Unclear risk | Not described |
| Allocation concealment (selection bias) | Unclear risk | Not described |
| Blinding of participants and personnel (performance bias) All outcomes | Unclear risk | Not described |
| Blinding of outcome assessment (detection bias) All outcomes | Unclear risk | Not described |
| Incomplete outcome data (attrition bias) All outcomes | Low risk | One person dropped out (5%) and had missing data. |
| Selective reporting (reporting bias) | Unclear risk | No protocol could be obtained and the trial did not report all‐cause mortality and serious adverse. |
| For‐profit bias | Low risk | The study was partly supported by grant from Tehran University of Medical Sciences research council. |
| Other bias | Low risk | The trial appeared to be free of other components that could put it at risk of bias. |
Anbar 2014.
| Methods | Randomised clinical trial, Israel | |
| Participants | 51 hospitalised adults undergoing surgery for hip fracture, at nutritional risk due to being frail elderly Male:Female = 17:33 Mean age = 83 Exclusion criteria: patients were excluded if they presented to hospital > 48 hours after the injury, were receiving steroids or immunosuppression therapy, or both; in the presence of active oncologic disease, multiple fractures, diagnosed dementia or in the event that patients required supplemental nasal oxygen which precludes the measurement of REE |
|
| Interventions | Experimental group: the tight calorie group received calories with an energy goal determined by repeated REE measurements using indirect calorimetry (IC) (Fitmate, Cosmed, Italy) which was based on hospital‐prepared diets (standard or texture‐adapted). Oral nutritional supplements (ONS) were started 24 hours after surgery and the amount adjusted to make up the difference between energy received from hospital food and measured energy expenditure.
The ONS was provided in the form of Ensure plus (Abbott Laboratories) containing 355 kcal/237 ml and 13.5 g protein or Glucerna (Abbott Laboratories) containing 237 kcal/237 ml and 9.9 g protein/237 ml. The adult, family and caregivers were educated regarding the importance of nutritional support and more attention was given to personal food preferences. (n = 23) Control group: no intervention (n = 28) Co‐intervention: standard hospital diet which provided a mean of 1800 kcal and 80 g of protein |
|
| Outcomes | BMI, Biochemical parameters including serum glucose, albumin, lymphocyte count and creatinine levels | |
| Study dates | May 2010 to December 2011 | |
| Notes | We contacted the authors on 21st October 2015 by email: psinger@clalit.org.il. We received no reply. | |
| Risk of bias | ||
| Bias | Authors' judgement | Support for judgement |
| Random sequence generation (selection bias) | Low risk | The trial states that "Randomization was performed using a concealed, computer‐generated program". |
| Allocation concealment (selection bias) | Unclear risk | It was unclear how the randomisation code was concealed although it was stated that it was concealed as above. |
| Blinding of participants and personnel (performance bias) All outcomes | High risk | The trial was described as unblinded. |
| Blinding of outcome assessment (detection bias) All outcomes | High risk | The trial was described as unblinded. |
| Incomplete outcome data (attrition bias) All outcomes | Low risk | There was one randomised participant who did not complete the trial. |
| Selective reporting (reporting bias) | Low risk | The trial reported all‐cause mortality and complications. |
| For‐profit bias | Unclear risk | It was unclear how the trial was funded. |
| Other bias | Low risk | The trial appeared to be free of other components that could put it at risk of bias. |
Aquilani 2008.
| Methods | Randomised clinical trial, Italy | |
| Participants | 48 adults hospitalised with subacute stroke, cognitive dysfunction (< 20 in the mini‐mental state examination) and independent in their alimentation. They were at nutritional risk due to stroke. Male:Female = 27:21 Mean age = 73 years (experimental group), 71 years (control group) Exclusion criteria: aphasic patients, patients with chronic renal failure or diabetes on hypoglycaemic therapy, or both |
|
| Interventions | Experimental group: Oral caloric‐protein supplement for 21 days, containing 200 ml mixture of cubit an, nutricia, Italy providing 250 calories, 20 g protein, 28,2 g carbohydrates and 7 g lipids (n = 24) Control group: No intervention (n = 24) |
|
| Outcomes | Anthropometric and nutritional (3‐day diary) variables, cognitive function (MMSE) Weight, height, BMI, daily caloric and macronutrient intake |
|
| Study dates | Not stated | |
| Notes | We contacted the authors on 27th September 2015 by email: labmio@unipv.it. We received an initial reply, but did not receive a reply for our follow‐up questions. | |
| Risk of bias | ||
| Bias | Authors' judgement | Support for judgement |
| Random sequence generation (selection bias) | Low risk | Randomisation where performed using SAS statistical tool |
| Allocation concealment (selection bias) | Unclear risk | The description of allocation concealment was too unclear to permit judgement of low or high risk of bias. |
| Blinding of participants and personnel (performance bias) All outcomes | Unclear risk | The study reports to be "double blinded", but does not explicitly describe how. The physician who evaluated the MMSE score was blinded to the supplementation and was different from the physician who prescribed the supplementation. |
| Blinding of outcome assessment (detection bias) All outcomes | Unclear risk | Not described |
| Incomplete outcome data (attrition bias) All outcomes | Unclear risk | The number of participants with incomplete data was not reported. |
| Selective reporting (reporting bias) | Unclear risk | No protocol could be obtained and the trial did not report all‐cause mortality and serious adverse events. |
| For‐profit bias | Unclear risk | It was unclear how the trial was funded. |
| Other bias | Low risk | The trial appeared to be free of other components that could put it at risk of bias. |
Arias 2008.
| Methods | Randomised clinical trial, Uruguay | |
| Participants | 667 hospitalised adults admitted to the medical ward, at nutritional risk due to being malnourished or severely malnourished according the Subjective Global Assessment criteria Male:Female = 337:200 (excluding dropped‐out participants) Exclusion criteria: diabetic, decompensated hepatitis with encephalitis, altered consciousness, difficulty understanding instructions or handicap, where the family was unwilling to co‐operate |
|
| Interventions | Experimental group: oral nutrition support with 1 cal/ml (54.5% carbohydrates, 31.5% lipid, 14% protein), 700 ml maximum (n = 333) Control group: no intervention (n = 334) Co‐interventions: treatment as usual |
|
| Outcomes | Development of infections, pressure ulcers, length of hospital stay, mortality and weight | |
| Study dates | May 2005 to September 2006 | |
| Notes | We contacted the authors by email: sylviaarias@montevideo.com.uy. We received a reply and received information on sequence generation, allocation concealment and weight data. | |
| Risk of bias | ||
| Bias | Authors' judgement | Support for judgement |
| Random sequence generation (selection bias) | Unclear risk | The 'code' was made by folding papers with either a T or a C, not performed by an independent person. |
| Allocation concealment (selection bias) | Unclear risk | The papers were folded and put into a dark bag. It is unclear if the allocation was concealed properly. |
| Blinding of participants and personnel (performance bias) All outcomes | High risk | The trial was not blinded. |
| Blinding of outcome assessment (detection bias) All outcomes | High risk | The trial was not blinded. |
| Incomplete outcome data (attrition bias) All outcomes | High risk | 130 participants dropped out, without the trial using proper methods to deal with the dropouts. |
| Selective reporting (reporting bias) | Low risk | All‐cause mortality and complications were reported. |
| For‐profit bias | Unclear risk | It was unclear how the trial was funded. |
| Other bias | Low risk | The trial appeared to be free of other components that could put it at risk of bias. |
Banerjee 1978.
| Methods | Randomised clinical trial, unknown country. | |
| Participants | 63 hospitalised long‐stay elderly, at nutritional risk according to the trialist Male:Female = 21:42 Mean age: 81 years |
|
| Interventions | Experimental group: 60 g daily oral supplements (n = 31) Control group: no intervention (n = 32) Co‐intervention: observation for 14 weeks before study start, standard hospital diet |
|
| Outcomes | Change in intake, skin‐fold thickness, laboratory test, mortality | |
| Study dates | Not stated | |
| Notes | We did not contact the authors due to the trial's late inclusion. | |
| Risk of bias | ||
| Bias | Authors' judgement | Support for judgement |
| Random sequence generation (selection bias) | Unclear risk | Not described |
| Allocation concealment (selection bias) | Unclear risk | Not described |
| Blinding of participants and personnel (performance bias) All outcomes | Unclear risk | Not described |
| Blinding of outcome assessment (detection bias) All outcomes | Unclear risk | Not described |
| Incomplete outcome data (attrition bias) All outcomes | Low risk | Less than 5% dropped out (3 participants) |
| Selective reporting (reporting bias) | Unclear risk | No protocol could be obtained, and the trial did not report on serious adverse events. |
| For‐profit bias | High risk | The trial was funded by Glaxo Laboratories. |
| Other bias | Low risk | The trial appeared to be free of other components that could put it at risk of bias. |
Barlow 2011.
| Methods | Randomised clinical trial, hospital in UK | |
| Participants | 121 hospitalised adults; most suspected upper gastrointestinal malignancy referred for major elective surgery, at nutritional risk due to major surgery Male:Female = 83:38 Mean age = 64 years Exclusion criteria: age under 18 years; unable or unwilling to give informed consent; pregnant; pre‐operative infection; previous intestinal surgery resulting in residual small intestine length of less than 100 cm |
|
| Interventions | Experimental group: Early Enteral Nutrition was delivered via a needle catheter jejunostomy. Nutritional support begun within 12 hrs of the surgery at 20 ml/hr of a standard 1 kcal/ml commercial whole protein enteral feed for the first 24 hrs in participants undergoing oesophagogastric resection, with the rate increasing as tolerated by 10 ml/hr every 12 hrs, until the maximum feed target rate of 80 ml/h was achieved. Participants undergoing pancreatic resection were started on 10 ml/hr of a 1.3 kcal/ml commercial semi‐elemental enteral feed on the first post‐operative day, which was then steadily increased as for the oesophagogastric participants. The aim was to achieve a minimum of half of nutritional requirements by the 5th postoperative day. Intravenous fluids were administered in addition to the enteral feeding as necessary to maintain fluid balance. Once oral intake was established, participants began a 1.5 kcal/ml enteral feed and converted to overnight enteral nutrition via the jejunostomy over 12 hrs. This continued until it was deemed that 75% of nutritional requirements were being achieved orally. (n = 64) Control group: Participants were kept nil by mouth, with hydration maintained by means of intravenous fluids, which continued until the introduction of oral fluids and diet. These participants also received 10 ml/hr of sterile water via a needle catheter jejunostomy until introduction of oral fluids. (n = 57) |
|
| Outcomes | Postoperative morbidity and mortality, wound infections, chest infections, anastomotic leaks, length of hospital stay | |
| Study dates | ||
| Notes | We contacted the authors on 30th June 2015 by email: barlowR1@cf.ac.uk. We received no reply. | |
| Risk of bias | ||
| Bias | Authors' judgement | Support for judgement |
| Random sequence generation (selection bias) | Low risk | The randomisation sequence was generated by computer in permuted blocks of 30. |
| Allocation concealment (selection bias) | Low risk | The code was kept in opaque, sealed envelopes labelled with sequential study numbers in a locked box. |
| Blinding of participants and personnel (performance bias) All outcomes | High risk | The trial is described as unblinded. |
| Blinding of outcome assessment (detection bias) All outcomes | High risk | The trial is described as unblinded. |
| Incomplete outcome data (attrition bias) All outcomes | Low risk | No dropouts and data on all participants |
| Selective reporting (reporting bias) | Low risk | Protocol is available, but contains no outcomes. In the trial all‐cause mortality and serious adverse events are reported. |
| For‐profit bias | Low risk | This trial was funded by a grant from The Health Foundation, London, UK. |
| Other bias | Low risk | The trial appeared to be free of other components that could put it at risk of bias. |
Barratt 2002a.
| Methods | Randomised clinical trial, Australia | |
| Participants | 57 hospitalised adults scheduled for major upper abdominal surgery, at nutritional risk due to major abdominal surgery Male:Female = 27:20 Mean age = 60.25 years Exclusion criteria: Younger than 21 years or older than 80 years of age, required IVN because of severe malnutrition, or postoperative complications such as sepsis or haemorrhage, surgery involving the diaphragm or thorax, significant cardiac disease, respiratory disease, renal disease, musculoskeletal or neurological disease, hematological disease, drug dependency disorder, or psychiatric disease. |
|
| Interventions | Experimental group: Multimodal analgesia and intravenous nutrition, either glucose or lipid‐based. On the second postoperative day, a peripheral “long‐line” IV was inserted for IVN. From this time, IV feeding was established and continued until day 14. The formulation included 66% of the non‐protein kilo joules as lipid, 9 g/L of nitrogen (Vamin 18; Kabi Vitrum, Stockholm, Sweden), and a non‐nitrogen energy load of 4200 kJ/L. This was infused at a rate of 2 to 2.8 L/24 hr, depending on the participant's calculated requirements. (n = 18) Control group: Multimodal analgesia (n = 14) |
|
| Outcomes | Duration of hospital stay, time to start of oral nutrition, weight (kg), BMI, fat (kg), protein (kg), water (Kg), nitrogen balance. Significant clinical complications | |
| Study dates | Not stated | |
| Notes | We contacted the authors on 12th September 2015 by email mdd06sb@sheffield.ac.uk. We received no reply. | |
| Risk of bias | ||
| Bias | Authors' judgement | Support for judgement |
| Random sequence generation (selection bias) | Unclear risk | Randomly allocated cards, but it was unclear if the shuffling was done by an independent person. |
| Allocation concealment (selection bias) | Unclear risk | The envelopes used to conceal the randomisation code were described as sealed envelopes, but it was unknown if they were opaque. |
| Blinding of participants and personnel (performance bias) All outcomes | High risk | Blinding was not performed. |
| Blinding of outcome assessment (detection bias) All outcomes | High risk | Blinding was not performed. |
| Incomplete outcome data (attrition bias) All outcomes | Unclear risk | The number of participants with incomplete data was not described. |
| Selective reporting (reporting bias) | Unclear risk | No protocol could be obtained and the trial did not report all‐cause mortality and serious adverse events. |
| For‐profit bias | Unclear risk | It was unclear how the trial was funded. |
| Other bias | Low risk | The trial appeared to be free of other components that could put it at risk of bias. |
Barratt 2002b.
| Methods | Randomised clinical trial, Australia | |
| Participants | 57 hospitalised adults scheduled for major upper abdominal surgery, at nutritional risk due to major abdominal surgery Male:Female = 27:20 Mean age = 60.25 years Exclusion criteria: Younger than 21 years or older than 80 years, required IVN because of severe malnutrition, or postoperative complications such as sepsis or haemorrhage. Surgery involving the diaphragm or thorax, significant cardiac disease, respiratory disease, renal disease, musculoskeletal or neurological disease, haematological disease; drug dependency disorder, or psychiatric disease |
|
| Interventions | Experimental group: participant‐controlled analgesia with opioids + Intravenous nutrition either glucose‐ or lipid‐based. On the 2nd postoperative day, a peripheral “long‐line” IV was inserted for IVN. From this time, IV feeding was established and continued until day 14. The formulation included 66% of the non‐protein kilo joules as lipid, 9 g/L of nitrogen (Vamin 18; Kabi Vitrum, Stockholm, Sweden), and a non‐nitrogen energy load of 4200 kJ/L. This was infused at a rate of 2 to 2.8 L/24 hrs, depending on the participant's calculated requirements. (n = 12) Control group: participant‐controlled analgesia with opioids(n = 13) |
|
| Outcomes | Duration of hospital stay, time to commencement of oral nutrition, weight (Kg), BMI, fat (Kg), protein (g), water (Kg), nitrogen balance. Significant clinical complications | |
| Study dates | Not stated | |
| Notes | We contacted the authors on 12th September 2015 by email: mdd06sb@sheffield.ac.uk. We received no reply. | |
| Risk of bias | ||
| Bias | Authors' judgement | Support for judgement |
| Random sequence generation (selection bias) | Unclear risk | Randomly allocated cards, but it was unclear if the shuffling was done by an independent person |
| Allocation concealment (selection bias) | Unclear risk | The envelopes used to conceal the randomisation code were described as sealed envelopes, but it was unknown if they were opaque. |
| Blinding of participants and personnel (performance bias) All outcomes | High risk | The trial was not blinded. |
| Blinding of outcome assessment (detection bias) All outcomes | High risk | The trial was not blinded. |
| Incomplete outcome data (attrition bias) All outcomes | Unclear risk | The number of participants with incomplete data was not reported. |
| Selective reporting (reporting bias) | Unclear risk | No protocol could be obtained and the trial did not report all‐cause mortality and serious adverse events. |
| For‐profit bias | Unclear risk | It was unclear how the trial was funded. |
| Other bias | Low risk | The trial appeared to be free of other components that could put it at risk of bias. |
Bastow 1983a.
| Methods | Randomised clinical trial, hospital in UK | |
| Participants | 122 hospitalised adults with fractured neck of femur and assessed as thin (1 ‐ 2 SDs below the mean), at nutritional risk due to being frail elderly with hip fracture Only women Mean age = 80 years Exclusion criteria: severe dementia or serious concomitant physical disorders, e.g. stroke |
|
| Interventions | Experimental group: an overnight feed of 1 litre Clinifeed Iso (4 ‐ 2 MJ (1000 kcal), including 28 g protein). It was started within 5 days of operation and delivered over 8 hrs each night through a fine bore soft nasogastric tube using a peristaltic pump. Tube‐feeding was continued until the adult was discharged from the ward, did not tolerate the tube or died.(n = 39) Control group: no intervention(n = 35) Co‐interventions: both control and tube‐fed adults ate a normal ward diet during the day and were given free access to snacks and drinks. |
|
| Outcomes | Weight, upper arm circumference, triceps skinfold thickness, mortality, food intake, length of hospital stay, mobility, plasma protein | |
| Study dates | Not stated | |
| Notes | Same trial as Bastow 1983b but with the participants characterised as 'thin'. We could not obtain any contact information on the author. | |
| Risk of bias | ||
| Bias | Authors' judgement | Support for judgement |
| Random sequence generation (selection bias) | Unclear risk | Not described |
| Allocation concealment (selection bias) | Unclear risk | Not described |
| Blinding of participants and personnel (performance bias) All outcomes | Unclear risk | Not described |
| Blinding of outcome assessment (detection bias) All outcomes | Unclear risk | Not described |
| Incomplete outcome data (attrition bias) All outcomes | Unclear risk | The number of participants with incomplete data was not reported. |
| Selective reporting (reporting bias) | Unclear risk | No protocol could be obtained and the trial did not report all‐cause mortality and serious adverse events. |
| For‐profit bias | High risk | One of the authors was supported by a grant from Roussell Laboratories Ltd. |
| Other bias | Low risk | The trial appeared to be free of other components that could put it at risk of bias. |
Bastow 1983b.
| Methods | Randomised clinical trial, hospital in UK | |
| Participants | 122 hospitalised adults with fractured neck of femur and assessed as very thin ( > 2 SDs below the mean), at nutritional risk due to being frail elderly with hip fracture Only women Mean age = 80 years Exclusion criteria: severe dementia or serious concomitant physical disorders, e.g. stroke |
|
| Interventions | Experimental group: an overnight feed of 1 litre Clinifeed Iso (4 ‐ 2 MJ (1000 kcal), including 28 g protein). It was started within 5 days of operation and delivered over 8 hours each night through a fine bore soft nasogastric tube using a peristaltic pump. Tube‐feeding was continued until the adult was discharged from the ward, did not tolerate the tube or died. (n = 25) Control group: no intervention (n = 23) Co‐interventions: both control and tube‐fed adults ate a normal ward diet during the day and were given free access to snacks and drinks. |
|
| Outcomes | Weight, upper arm circumference, triceps skinfold thickness, mortality, food intake, length of hospital stay, mobility, plasma protein | |
| Study dates | Not stated | |
| Notes | Same trial as Bastow 1983a but with the participants characterised as 'very thin' | |
| Risk of bias | ||
| Bias | Authors' judgement | Support for judgement |
| Random sequence generation (selection bias) | Unclear risk | Not described |
| Allocation concealment (selection bias) | Unclear risk | Not described |
| Blinding of participants and personnel (performance bias) All outcomes | Unclear risk | Not described |
| Blinding of outcome assessment (detection bias) All outcomes | Unclear risk | Not described |
| Incomplete outcome data (attrition bias) All outcomes | Unclear risk | The number of participants with incomplete data was not reported. |
| Selective reporting (reporting bias) | Unclear risk | No protocol could be obtained and the trial did not report all‐cause mortality and serious adverse events. |
| For‐profit bias | High risk | One of the authors was supported by a grant from Roussell Laboratories Ltd. |
| Other bias | Low risk | The trial appeared to be free of other components that could put it at risk of bias. |
Bauer 2000.
| Methods | Randomised clinical trial (blocks of 10), France | |
| Participants | 120 hospitalised adults admitted to the ICU for more than 2 days, at nutritional risk due to being in the ICU Male:Female = 82:38 Mean age: 54 years Exclusion criteria: elective surgery or presenting a contraindication to enteral or parenteral support, or both, having a previous history of allergy to vitamins |
|
| Interventions | Experimental group: received parenteral nutrition. Treatment consisted of a 3‐in‐1 solution of carbohydrates, fat, and protein, Vitrimix KV and hydrosoluble vitamins, Soluvit. (n = 60)Control group: received placebo. Treatment consisted of sodium chloride 0.9% with Intralipid 20% (50 ml/l) and Soluvit (10 ml/l), stable for 24 hrs Treatment and placebo were administered in the same type of plastic bags (1 ± 2 l), at a concentration of 1 kcal/ml in the treatment group. The solution was administered through a central line (960 mOSm/l) that was not inserted solely for nutritional purposes. The rate of intravenous administration was increased to 120 ml/hr for 18 ± 24 hrs. (n = 60) Co‐intervention: both groups received enteral support: Participants were bolus‐fed every 4 hrs, 5 times a day with a standard, noncommercial, modular polymeric diet. The composition of the solution was protein (20%), polyunsaturated fats (30%), carbohydrates (50%), non‐soluble fibres, sodium chloride (2 g/l), potassium chloride (3 g/l), and a standard solution of hydro‐ and lipo‐soluble vitamins; the concentration of the solution was 1 kcal/ml. A typical 70‐kg participant would receive 100 ml initially, with an increased amount in 50‐ml steps to a maximum of 350 ml every 4 hrs 5 times a day. |
|
| Outcomes | Levels of retinol‐binding protein and prealbumin, morbidity, mortality, cost | |
| Study dates | Not stated | |
| Notes | No contact information could be obtained. | |
| Risk of bias | ||
| Bias | Authors' judgement | Support for judgement |
| Random sequence generation (selection bias) | Unclear risk | Not described |
| Allocation concealment (selection bias) | Unclear risk | The envelopes were described as sealed but it was uncertain if the envelopes were opaque. |
| Blinding of participants and personnel (performance bias) All outcomes | Low risk | Neither the healthcare providers nor the participants were aware of the treatment given. |
| Blinding of outcome assessment (detection bias) All outcomes | Unclear risk | Although the statistician was blinded to the allocation of treatment until all events had occurred, it is not stated clearly who performed the outcome assessment. |
| Incomplete outcome data (attrition bias) All outcomes | Unclear risk | 6/60 early dropouts in the experimental group and 7/60 in the control group They stated that they used intention‐to‐treat analysis, but did not fully describe how they dealt with missing participants. |
| Selective reporting (reporting bias) | Low risk | The trial reported all‐cause mortality and serious adverse events. No protocol could be found. |
| For‐profit bias | Unclear risk | It was unclear how the trial was funded. |
| Other bias | Low risk | The trial appeared to be free of other components that could put it at risk of bias. |
Beier‐Holgersen 1999.
| Methods | Randomised clinical trial, Denmark | |
| Participants | 60 hospitalised adults with gastro‐intestinal diseases requiring major surgery, at nutritional risk due to major surgery Male:Female = 38:22 Mean age = 64 years Exclusion criteria: Adults with insulin‐dependent diabetes mellitus, inadequate renal or hepatic functions, or inflammatory bowel disease were excluded, as were adults receiving immunosuppressive drugs. |
|
| Interventions | Experimental group: Nutrition (Nutridrink with orange flavour, Nutricia). They were scheduled to receive 600 ml on the day of operation, increasing by 400 ml daily until the 4th postoperative day. (n = 30) Control group: Placebo (water with orange flavour)(n = 30) They were scheduled to receive 600 ml on the day of operation, increasing by 400 ml daily until the 4th postoperative day. |
|
| Outcomes | Cell‐mediated immunity, serious adverse events, all‐cause mortality | |
| Study dates | Not stated | |
| Notes | We contacted the authors on 27th September 2015 by email: rabeho@hih.regionh.dk, We received an initial reply but no reply on following emails. | |
| Risk of bias | ||
| Bias | Authors' judgement | Support for judgement |
| Random sequence generation (selection bias) | Unclear risk | Not described |
| Allocation concealment (selection bias) | Unclear risk | Not described |
| Blinding of participants and personnel (performance bias) All outcomes | Unclear risk | It was reported that the study was double‐blinded, but it was not further described. |
| Blinding of outcome assessment (detection bias) All outcomes | Unclear risk | It was reported that the study was double‐blinded, but it was not further described. |
| Incomplete outcome data (attrition bias) All outcomes | Unclear risk | The number of participants with incomplete data was not reported. |
| Selective reporting (reporting bias) | Low risk | No protocol could be obtained, but all‐cause mortality and serious adverse events were assessed. |
| For‐profit bias | High risk | "Nutricia Research, Zoetermeer, the Netherlands" kindly contributed financially to the study. |
| Other bias | Low risk | The trial appeared to be free of other components that could put it at risk of bias. |
Bellantone 1988.
| Methods | Randomised clinical trial, Italy | |
| Participants | 100 hospitalised adults admitted for gastro‐intestinal surgery, at nutritional risk due to major surgery Male:Female = 64:36 Mean age = 58 years |
|
| Interventions | Experimental group: Parenteral supplements (30 Cal/kg/day 200 mg/kg/day nitrogen) for at least 7 days prior to surgery(n = 54) Control group: No intervention(n = 46) Co‐intervention: Standard hospital oral diet |
|
| Outcomes | Mortality, septic complications | |
| Study dates | Not stated | |
| Notes | We contacted the authors on 9th November 2015 by email: rbellantone@rm.unicatt.it . We received no reply. | |
| Risk of bias | ||
| Bias | Authors' judgement | Support for judgement |
| Random sequence generation (selection bias) | Unclear risk | Not described |
| Allocation concealment (selection bias) | Unclear risk | Not described |
| Blinding of participants and personnel (performance bias) All outcomes | Unclear risk | Not described |
| Blinding of outcome assessment (detection bias) All outcomes | Unclear risk | Not described |
| Incomplete outcome data (attrition bias) All outcomes | Unclear risk | The number of participants with incomplete data was not reported. |
| Selective reporting (reporting bias) | Unclear risk | No protocol could be obtained and the trial did not report all‐cause mortality or serious adverse events. |
| For‐profit bias | Unclear risk | It was unclear how the trial was funded. |
| Other bias | Low risk | The trial appeared to be free of other components that could put it at risk of bias. |
Bokhorst‐de 2000.
| Methods | Randomised clinical trial, the Netherlands | |
| Participants | 49 adults undergoing radical and extensive surgery for advanced head and neck cancer (stage III and IV) severely malnourished (preoperative weight loss > 10%), at nutritional risk due to major surgery Male:Female = 18:15 Mean age = 62.5 years Exclusion criteria: Well‐nourished (weight loss < 10%), received other investigational drugs or steroids, or suffered from renal insufficiency, hepatic failure, any genetic immune disorders or a confirmed diagnosis of AIDS |
|
| Interventions | Experimental group: standard preoperative enteral nutrition (1250 kcal/L, 62.5 g. protein/L) (n = 15) Control group: No preoperative nutritional support(n = 17) Co‐interventions: preoperatively fed for 7 – 10 days. Postoperatively tube‐fed for approximately 14 days, as was standard hospital procedure |
|
| Outcomes | Quality of life, using the scales: QLQ‐C30, COOP–WONCA | |
| Study dates | 1994 to 1997 | |
| Notes | We only use groups 1 and 2. We contacted the authors in September 2015 by email: m.vanbokhorst@vumc.nl. We received a reply with the specific calorie intake in the 2 groups. | |
| Risk of bias | ||
| Bias | Authors' judgement | Support for judgement |
| Random sequence generation (selection bias) | Unclear risk | Not described |
| Allocation concealment (selection bias) | Unclear risk | Not described |
| Blinding of participants and personnel (performance bias) All outcomes | High risk | Blinding of participants, healthcare professionals involved in participant treatment and assessors was only possible in groups II and III. |
| Blinding of outcome assessment (detection bias) All outcomes | High risk | Blinding of participants, healthcare professionals involved in participant treatment and assessors was only possible in groups II and III. |
| Incomplete outcome data (attrition bias) All outcomes | High risk | There were missing data for 18 out of 49 participants for quality of life and the trial did not use proper methodology to account for the missing data. |
| Selective reporting (reporting bias) | Unclear risk | No protocol could be obtained and the trial did not report all‐cause mortality or serious adverse events. |
| For‐profit bias | Unclear risk | It was unclear how the trial was funded. |
| Other bias | Low risk | The trial appeared to be free of other components that could put it at risk of bias. |
Bonkovsky 1991a.
| Methods | Randomised clinical trial, USA | |
| Participants | 39 hospitalised adults with alcoholic hepatitis due to 1. prolonged ethanol intake; 2. laboratory studies; 3. time of cessation of alcohol intake 5 ‐ 14 days before entry to the study, at nutritional risk according to the trialist
Male:Female = 19:20 Mean age = 42 years Exclusion criteria: recent severe gastro‐intestinal bleeding, severe ascites, severe degree of encephalophathy, renal insufficiency, acute pancreatitis, haemodynamic instability, advanced pulmonary disease, diabetes mellitus, active malignancy |
|
| Interventions | The trial consisted of 4 groups. Groups 1 and 3, and groups 2 and 4 could be compared. Experimental group: parenteral nutritional supplementation 2 L (3.5 amino acids, 5% dextrose) for 21 days(n = 9) Control group: no intervention(n = 12) Co‐intervention: standard therapy (nutritionally adequate diets) in all groups and Oxandrolone in groups 2 and 4 |
|
| Outcomes | Laboratory measurements, complications | |
| Study dates | August 1986 to November 1988 | |
| Notes | We here report group 1 (control) versus group 3 (experimental). | |
| Risk of bias | ||
| Bias | Authors' judgement | Support for judgement |
| Random sequence generation (selection bias) | Low risk | Random‐numbers table |
| Allocation concealment (selection bias) | Unclear risk | Not described |
| Blinding of participants and personnel (performance bias) All outcomes | Unclear risk | Not described |
| Blinding of outcome assessment (detection bias) All outcomes | Unclear risk | Not described |
| Incomplete outcome data (attrition bias) All outcomes | Low risk | Data were reported for all participants for all outcomes. |
| Selective reporting (reporting bias) | Unclear risk | No protocol could be obtained, and the trial did not report on serious adverse events or mortality. |
| For‐profit bias | High risk | The trial was funded by Miles Laboratories. |
| Other bias | Low risk | The trial appeared to be free of other components that could put it at risk of bias. |
Bonkovsky 1991b.
| Methods | Randomised clinical trial, USA | |
| Participants | 39 hospitalised adults with alcoholic hepatitis due to 1. prolonged ethanol intake; 2. laboratory studies; 3. time of cessation of alcohol intake 5 ‐ 14 days before entry to the study, at nutritional risk according to the trialist
Male:Female = 19:20 Mean age = 42 years Exclusion criteria: recent severe gastro‐intestinal bleeding, severe ascites, severe degree of encephalopathy, renal insufficiency, acute pancreatitis, haemodynamic instability, advanced pulmonary disease, diabetes mellitus, active malignancy |
|
| Interventions | The trial consisted of 4 groups. Groups 1 and 3, and groups 2 and 4 could be compared. Experimental group: parenteral nutritional supplementation 2 L (3.5 amino acids, 5% dextrose) for 21 days(n = 10) Control group: no intervention(n = 8) Co‐intervention: standard therapy (nutritionally adequate diets) in all groups and Oxandrolone in groups 2 and 4 |
|
| Outcomes | Laboratory measurements, complications | |
| Study dates | August 1986 to November 1988 | |
| Notes | We here report group 2 (control) versus group 4 (experimental). | |
| Risk of bias | ||
| Bias | Authors' judgement | Support for judgement |
| Random sequence generation (selection bias) | Low risk | Random‐numbers table |
| Allocation concealment (selection bias) | Unclear risk | Not described |
| Blinding of participants and personnel (performance bias) All outcomes | Unclear risk | Not described |
| Blinding of outcome assessment (detection bias) All outcomes | Unclear risk | Not described |
| Incomplete outcome data (attrition bias) All outcomes | Low risk | Data were reported for all participants for all outcomes. |
| Selective reporting (reporting bias) | Unclear risk | No protocol could be obtained, and the trial did not report on serious adverse events or mortality. |
| For‐profit bias | High risk | The trial was funded by Miles Laboratories. |
| Other bias | Low risk | The trial appeared to be free of other components that could put it at risk of bias. |
Botella‐Carretero 2008a.
| Methods | Randomised clinical trial, Spain | |
| Participants | 90 hospitalised adults 65 years or older undergoing surgery for hip fracture, at nutritional risk due to frail elderly with hip fracture Male:Female = 71:19 Mean age = 83.5 years Exclusion criteria: Adults with moderate to severe malnutrition (those with a weight loss of > 5% in the previous month or > 10% in the previous 6 months from their usual weight or serum albumin concentrations < 2.7 g/dL, or both) acute or chronic renal failure, hepatic insufficiency or cirrhosis (Child B or C), severe heart failure defined as New York Heart Association class III or IV, respiratory failure, and any Gl condition which precluded adequate oral nutrition intake |
|
| Interventions | Experimental group: Group 2: protein powder ONSs. Adults received protein supplementation in the form of commercial protein powder (Vegenat‐med Proteina; Vegenat SA, Badajoz, Spain; 10‐g packets, with each providing 9 g of protein and 38 kcal) dissolved in water or in the diet’s milk or soup, to aim at 36 g of protein a day (4 packets a day)(n = 30) The oral nutritional supplement was started 48 hrs after operation and maintained after hospital discharge. Control group: No intervention(n = 15) Co‐intervention: All were prescribed a standard or texture‐adapted diet to meet the calculated metabolic rate. |
|
| Outcomes | Changes in serum albumin, prealbumin, retinol‐binding globulin (RBG), BMI, midbrachial circumference, and tricipital fold, tolerance to prescribed ONS, length of hospital stay, postoperative complications, the time from surgery to the start of mobilisation as included in the rehabilitation programme | |
| Study dates | February 2006 to February 2007 | |
| Notes | We contacted authors on 6th June 2015 by email: jbotella.hrc@salud.madrid.org, about details on data of BMI and complications and risk of bias (random sequence generation and blinding of outcome assessment). | |
| Risk of bias | ||
| Bias | Authors' judgement | Support for judgement |
| Random sequence generation (selection bias) | Unclear risk | Not described |
| Allocation concealment (selection bias) | Low risk | Randomised using sealed opaque envelopes |
| Blinding of participants and personnel (performance bias) All outcomes | High risk | Participants were not blinded, as the control group received no intervention |
| Blinding of outcome assessment (detection bias) All outcomes | Unclear risk | Not described |
| Incomplete outcome data (attrition bias) All outcomes | High risk | 5 participants did not complete the study and the trial did not use proper methodology to account for the missing data. |
| Selective reporting (reporting bias) | Unclear risk | No protocol could be obtained and the trial did not report all‐cause mortality or serious adverse events. |
| For‐profit bias | Low risk | The trial was financed by Fundación para la Investigación Biomédica, Hospital Ramón y Cajal (FIBio‐RyC), Madrid, Spain. |
| Other bias | Low risk | The trial appeared to be free of other components that could put it at risk of bias. |
Botella‐Carretero 2008b.
| Methods | Randomised clinical trial, Spain | |
| Participants | 90 hospitalised adults 65 years or older undergoing surgery for hip fracture, at nutritional risk due to frail elderly with hip fracture Male:Female = 71:19 Mean age = 83.5 years Exclusion criteria: Adults with moderate to severe malnutrition (those with a weight loss of > 5% in the previous month or > 10% in the previous 6 months from their usual weight or serum albumin concentrations < 2.7 g/dL, or both) acute or chronic renal failure, hepatic insufficiency or cirrhosis (Child B or C), severe heart failure defined as New York Heart Association class III or IV, respiratory failure, and any Gl condition which precluded adequate oral nutrition intake |
|
| Interventions | Experimental group: Group 3: Energy protein ONSs. Participants received energy and protein supplements by means of commercial enteral nutrition for oral intake (Resource Hiperproteico; Novartis Medical Nutrition, Barcelona, Spain; 200‐mL bricks, with each providing 18.8 g of protein and 250 kcal) to aim at 37.6 g of protein and 500 kcal a day (2 bricks a day). The ONS was started 48 hrs after operation and maintained after hospital discharge.(n = 30) Control group: No intervention(n = 15) Co‐intervention: All were prescribed a standard or texture‐adapted diet to meet the calculated metabolic rate. |
|
| Outcomes | Changes in serum albumin, prealbumin, retinol‐binding globulin (RBG), BMI, midbrachial circumference, and tricipital fold, tolerance to prescribed ONS, length of hospital stay, postoperative complications, the time from surgery to the start of mobilisation as included in the rehabilitation programme | |
| Study dates | February 2006 to February 2007 | |
| Notes | We contacted the authors on 6th June 2015 by email: jbotella.hrc@salud.madrid.org about details on data of BMI and complications and risk of bias (random sequence generation and blinding of outcome assessment). | |
| Risk of bias | ||
| Bias | Authors' judgement | Support for judgement |
| Random sequence generation (selection bias) | Unclear risk | Not described |
| Allocation concealment (selection bias) | Low risk | Randomised using sealed opaque envelopes |
| Blinding of participants and personnel (performance bias) All outcomes | High risk | Participants were not blinded, as the control group received no intervention |
| Blinding of outcome assessment (detection bias) All outcomes | Unclear risk | Not described |
| Incomplete outcome data (attrition bias) All outcomes | High risk | 5 participants did not complete the study and the trial did not use proper methodology to account for the missing data. |
| Selective reporting (reporting bias) | Unclear risk | No protocol could be obtained and the trial did not report all‐cause mortality or serious adverse events. |
| For‐profit bias | Low risk | The trial was financed by Fundación para la Investigación Biomédica, Hospital Ramón y Cajal Madrid, Spain. |
| Other bias | Low risk | The trial appeared to be free of other components that could put it at risk of bias. |
Botella‐Carretero 2010.
| Methods | Randomised clinical trial, Spain | |
| Participants | 60 hospitalised adults with hip fractures, at nutritional risk due to hip surgery Male:Female = 16:44 Mean age = 83.5 years Exclusion criteria: "Patients with moderate–severe malnutrition (those with a weight loss of more than 5% in the previous month or more than 10% in the previous 6 months from their usual weight, and/or serum albumin concentrations below 2.7 g/dL) were automatically excluded from the study. All of these patients receive supplementation according to our Institution protocol, following current guidelines. Other exclusion criteria were acute and/or chronic renal failure, hepatic insufficiency or cirrhosis (Child B or C), severe heart failure with class III or IV of the New York Heart Association (NYHA), respiratory failure, and any gastrointestinal condition that may preclude from adequate oral nutritional intake. None of the patients had been on ONS from the previous 6 months, or had received any nutritional support by any other means. |
|
| Interventions | Experimental group: Oral nutrition energy and protein support by means of commercial enteral nutrition for oral intake (Fortimel, 200 mL bricks, each provides 20 g protein and 200 kcal, Nutricia Advanced Medical Nutrition ‐ Danone Group) to aim at 40 g of protein and 400 kcal a day (2 bricks a day). The treatment was started at admission, before surgery and maintained until the day of hospital discharge. (n = 30) Control group: No intervention (n = 30) Co‐interventions: Every adult was prescribed a standard or texture‐adapted diet to meet their calculated metabolic rate. |
|
| Outcomes | Mortality, serum proteins, BMI, postoperative complications, weight, postoperative hospital stay, time of immobilisation after surgery | |
| Study dates | May 2007 to September 2008 | |
| Notes | We contacted the authors on 6th June 2015 by email: jbotella.hrc@salud.madrid.org about data on BMI, weight and complications, which could not be extracted from the full text. | |
| Risk of bias | ||
| Bias | Authors' judgement | Support for judgement |
| Random sequence generation (selection bias) | Unclear risk | Not described |
| Allocation concealment (selection bias) | Low risk | The randomisation was concealed by means of sealed opaque envelopes. |
| Blinding of participants and personnel (performance bias) All outcomes | High risk | Participants were not blinded. |
| Blinding of outcome assessment (detection bias) All outcomes | Unclear risk | The procedure of blinding was insufficiently described. |
| Incomplete outcome data (attrition bias) All outcomes | High risk | Intention‐to‐treat analysis was performed with the last observation carried forward to evaluate data of all participants at hospital discharge. There were incomplete data for 32 participants. |
| Selective reporting (reporting bias) | Low risk | The protocol could not be obtained, but the study reported on mortality and complications. |
| For‐profit bias | Low risk | One of the Researchers, B.I. was supported by the Fundación para la Investigación Biomédica Hospital Ramón y Cajal (FIBio‐RyC), Madrid, Spain. |
| Other bias | Low risk | The trial appeared to be free of other components that could put it at risk of bias. |
Breedveld‐Peters.
| Methods | Randomised clinical trial, the Netherlands | |
| Participants | 152 hospitalised adults admitted for hip fracture surgery and aged > 55 years, at nutritional risk due to being frail elderly Male:Female = 44:108 Mean age = 78.5 years Exclusion criteria: Pathological or periprosthetic fracture; a disease of bone metabolism (e.g. M Paget, M Kahler, hyperparathyroidism); an estimated life expectancy < 1 year due to underlying disease; if they used an ONS before hospital admission; if they were unable to speak Dutch, lived outside the region or had been bedridden before their hip fracture, had dementia or were cognitively impaired, defined as a score of < 7 on the Abbreviated Mental Test, as assessed before inclusion |
|
| Interventions | Experimental group: frequent dietetic counselling and multinutrient ONSs until 3 months after hip fracture surgery (n = 73) Control group: standard dietetic counselling and diet (n = 79) |
|
| Outcomes | Cost, cost effectiveness, mortality, weight, quality of life | |
| Study dates | ||
| Notes | The trial had both an inpatient and an outpatient phase. We contacted the authors on 16th December 2015 by email: c.wyers@maastrichtuniversity.nl. We received no reply. | |
| Risk of bias | ||
| Bias | Authors' judgement | Support for judgement |
| Random sequence generation (selection bias) | Low risk | Computer‐generated random‐number sequence list |
| Allocation concealment (selection bias) | Unclear risk | The allocation was described as being concealed, but it was unclear how it was concealed. |
| Blinding of participants and personnel (performance bias) All outcomes | Unclear risk | Not described |
| Blinding of outcome assessment (detection bias) All outcomes | Unclear risk | Not described |
| Incomplete outcome data (attrition bias) All outcomes | High risk | More than 5% dropouts, and the trial did not allow proper intention‐to‐treat methodology. |
| Selective reporting (reporting bias) | High risk | The trial did not report length of stay or rate of complications, which were stated in the protocol. |
| For‐profit bias | High risk | The oral nutritional supplements were provided by at nutrition company (Nutricia Advanced Medical Nutrition). |
| Other bias | Low risk | The trial appeared to be free of other components that could put it at risk of bias. |
Brennan 1994.
| Methods | Randomised clinical trial, USA | |
| Participants | 117 hospitalised adults undergoing major pancreatic resections, at nutritional risk due to major surgery. Male:Female = 61:55 (gender not reported for one participants) Mean age = 64 years |
|
| Interventions | Experimental group: Total parenteral nutrition (30 ‐ 35 kcal/kg/day and 1 g protein/kg/day) (n = 60)
Control group: Standard IV fluids (dextrose and salt solutions) (n = 57) Co‐interventions: Both groups were given nutrition until oral intake exceeded 1000 kcal/day |
|
| Outcomes | Mortality, complications, major complications, morbidity, survival data | |
| Study dates | February 1988 to November 1993 | |
| Notes | We contacted the author on 19th August 2015 by email: brennanm@mskcc.org . The author initially replied but did not reply on follow‐up emails. | |
| Risk of bias | ||
| Bias | Authors' judgement | Support for judgement |
| Random sequence generation (selection bias) | Unclear risk | Not described |
| Allocation concealment (selection bias) | Unclear risk | Not described |
| Blinding of participants and personnel (performance bias) All outcomes | Unclear risk | Not described |
| Blinding of outcome assessment (detection bias) All outcomes | Unclear risk | Not described |
| Incomplete outcome data (attrition bias) All outcomes | Unclear risk | The number of participants with incomplete data was not reported. |
| Selective reporting (reporting bias) | Low risk | The trial reported serious adverse events and mortality. |
| For‐profit bias | Low risk | The trial was supported by a non‐profit organisation (Lawrence M. Gelb Foundation). |
| Other bias | Low risk | The trial appeared to be free of other components that could put it at risk of bias. |
Brown 1992.
| Methods | Randomised clinical trial, hospital in UK | |
| Participants | 10 hospitalised adults with fractured neck of femur, at nutritional risk due to major surgery Male:Female = 0:10 Mean age = 81 years Exclusion criteria: any form of malignant disease, mental illness, renal or hepatic failure, neurological disorder, cerebrovascular accident or diabetes |
|
| Interventions | Experimental group: Enteral nutrition (Fresubin) to make up the deficit between regular intake and requirements of nutrition. Received from the 2nd day of admission until the end of the study Intervention lasted approximately 47 days. (n = 5) Control group: No intervention(n = 5) Co‐interventions: Both groups received normal hospital diet. |
|
| Outcomes | Body weight, triceps skinfold thickness, midarm circumference, arm muscle circumference , time of discharge, serum concentrations of albumin, prealbumin, magnesium and zinc. Meals, snacks and fluid intake. Walking with a frame or crutches with 1 or 2 attendants, walking with or without sticks with 1 or 2 attendants, and pressure sores | |
| Study dates | Not stated | |
| Notes | We could not obtain contact information for the author. | |
| Risk of bias | ||
| Bias | Authors' judgement | Support for judgement |
| Random sequence generation (selection bias) | Unclear risk | Not described |
| Allocation concealment (selection bias) | Unclear risk | Not described |
| Blinding of participants and personnel (performance bias) All outcomes | Unclear risk | Not described |
| Blinding of outcome assessment (detection bias) All outcomes | Unclear risk | Not described |
| Incomplete outcome data (attrition bias) All outcomes | Low risk | There were complete data for all participants. |
| Selective reporting (reporting bias) | Unclear risk | No protocol could be obtained, and the trial did not report all‐cause mortality or serious adverse events. |
| For‐profit bias | Unclear risk | It was unclear how the trial was funded. |
| Other bias | Low risk | The trial appeared to be free of other components that could put it at risk of bias. |
Brown 1995.
| Methods | Randomised clinical trial, USA | |
| Participants | 57 hospitalised adults undergoing PEG placement due to different conditions (primarily oropharyngeal dysphagia), at nutritional risk due to trialist indication Male:Female = 38:19 Mean age = 67 years Exclusion criteria: none stated |
|
| Interventions | Experimental: early feeding within 3 hrs of placement(n = 17) Control: no intervention(n = 19) Co‐intervention: feeding from the next day |
|
| Outcomes | Complications related to tube‐feeding (not used) | |
| Study dates | Not stated | |
| Notes | We could not obtain contact information for the author. | |
| Risk of bias | ||
| Bias | Authors' judgement | Support for judgement |
| Random sequence generation (selection bias) | Unclear risk | Not described |
| Allocation concealment (selection bias) | Unclear risk | Not described |
| Blinding of participants and personnel (performance bias) All outcomes | Unclear risk | Not described |
| Blinding of outcome assessment (detection bias) All outcomes | Unclear risk | Not described |
| Incomplete outcome data (attrition bias) All outcomes | Unclear risk | It was unclear how many participants had incomplete outcome data. |
| Selective reporting (reporting bias) | Unclear risk | No protocol could be obtained and the trial did not report all‐cause mortality. |
| For‐profit bias | Unclear risk | It was unclear how the trial was funded. |
| Other bias | Low risk | The trial appeared to be free of other components that could put it at risk of bias. |
Bunout 1989.
| Methods | Randomised clinical trial, hospital in Chile | |
| Participants | 36 hospitalised adults who within the first 3 days of admission met the following criteria: (a) history of excessive alcohol ingestion for at least 2 years; and (b) the presence of 2+ major signs of liver failure: jaundice, encephalopathy, ascites, hepatomegaly, collateral circulation and oedema, who were, at nutritional risk according to the trialist Male:female = not stated Mean age = 49.1 years Exclusion criteria: contraindication for oral or enteral feeding, current upper gastrointestinal bleeding, encephalopathy grade OV and extrahepatic major organ failure (cardiac, pulmonary or renal) |
|
| Interventions | Experimental group: diet aiming at 1.5 g/kg body weight of protein and 50 kcal/kg body weight/day. The protein and energy were provided by a casein‐based nutritional product. Contained casein, maltodextrins, medium‐chain triglycerides, sunflower oil.(n = 17) Control group: standard nutritional therapy (n = 19) | |
| Outcomes | Biochemical analysis, length of hospital stay, anthropometrics, mortality | |
| Study dates | Not stated | |
| Notes | We contacted the author on 08th February 2016 by email: dbunout@inta.cl. We received no reply. | |
| Risk of bias | ||
| Bias | Authors' judgement | Support for judgement |
| Random sequence generation (selection bias) | Unclear risk | The trial was described as being randomised, but there was no description of how the sequence was generated. |
| Allocation concealment (selection bias) | Unclear risk | The trial was described as being randomised, but there were no description of how the allocation was concealed. |
| Blinding of participants and personnel (performance bias) All outcomes | Unclear risk | Not described |
| Blinding of outcome assessment (detection bias) All outcomes | Unclear risk | Not described |
| Incomplete outcome data (attrition bias) All outcomes | Low risk | There were no dropouts. |
| Selective reporting (reporting bias) | Unclear risk | No protocol could be obtained, and the trial did not report all‐cause mortality or serious adverse events. |
| For‐profit bias | Low risk | The trial was funded by a non‐profit organisation: "University of Chile grant no. PRI 823080009". |
| Other bias | Low risk | The trial appeared to be free of other components that could put it at risk of bias. |
Caglayan 2012.
| Methods | Randomised clinical trial, Turkey | |
| Participants | 28 hospitalised adults with colorectal cancer, at nutritional risk due to oncologic history and upcoming surgery Male:Female = 11:16 (gender not reported for one participants) Mean age = 62.79 years Exclusion criteria: Clinical findings of vitamin and element deficiency, diabetes mellitus, a history of renal and hepatic deficiency as well as active infection, and immunosuppressive drug use |
|
| Interventions | Experimental group: 3 groups (only 2 could potentially have been used): Enteral: SE product without RNA or omega‐3 fatty acid (Fresubin) TPN: With subclavian catheter infusion Freamin 8.5% Lipovenöz% 10 ‐ 20 Dekstroz 10%, 20%, 30%. Soluvit N.Vitalipid N adult. Tracutil. (n = 21) Control group: Normal feeding planned by a dietitian (n = 7) |
|
| Outcomes | CD4 cell infiltrate, CD8 cell infiltrate, CD16 cell infiltrate, CD56 cell infiltrate | |
| Study dates | Not stated | |
| Notes | We contacted the authors on 9th December 2015 by email: kasimcaglayan@hotmail.com. We received no reply. | |
| Risk of bias | ||
| Bias | Authors' judgement | Support for judgement |
| Random sequence generation (selection bias) | Unclear risk | Not described |
| Allocation concealment (selection bias) | Unclear risk | Not described |
| Blinding of participants and personnel (performance bias) All outcomes | High risk | Participants and personnel were not blinded. |
| Blinding of outcome assessment (detection bias) All outcomes | Low risk | Pathologist was blinded. |
| Incomplete outcome data (attrition bias) All outcomes | Unclear risk | The number of participants with incomplete data was not reported. |
| Selective reporting (reporting bias) | Unclear risk | No protocol could be obtained and the trial did not report all‐cause mortality or serious adverse events. |
| For‐profit bias | Unclear risk | It was unclear how the trial was funded. |
| Other bias | Low risk | The trial appeared to be free of other components that could put it at risk of bias. |
Campbell 2008.
| Methods | Randomised clinical trial, Australia | |
| Participants | 60 hospitalised adults with chronic kidney disease, at nutritional risk defined by trialists Male:Female = 34:19 (after early exclusions) Mean age = 69.9 years Exclusion criteria: < 18 years, glomerular filtration rate (GFR) > 30 ml/min , previously seen by a dietitian for Stage IV CKD, communication or intellectual impairment inhibiting their ability to undertake the intervention and malnutrition from a cause other than CKD |
|
| Interventions | Experimental group: A dietitian, experienced in renal nutrition, gave treatment over a 12‐week period and aimed to optimise nutritional status and attain evidence‐based dietary prescription. (n = 60) Control group: Standard care(n = 31) |
|
| Outcomes | QOL: Kidney Disease Quality of Life Short Form version 1.3, combining the Short Form‐36 (SF‐36), with a kidney disease‐specific module | |
| Study dates | Not stated | |
| Notes | We contacted the authors on 5th October 2015 by email: katrina.campbell@qub.ac.uk. We received no reply. | |
| Risk of bias | ||
| Bias | Authors' judgement | Support for judgement |
| Random sequence generation (selection bias) | Low risk | Computer‐generated sequence |
| Allocation concealment (selection bias) | Low risk | Concealed from recruiting officer |
| Blinding of participants and personnel (performance bias) All outcomes | High risk | Not blinded |
| Blinding of outcome assessment (detection bias) All outcomes | Unclear risk | Not described |
| Incomplete outcome data (attrition bias) All outcomes | Unclear risk | 13 dropouts (> 5%). No use of intention‐to‐treat |
| Selective reporting (reporting bias) | Unclear risk | No protocol could be obtained and the trial did not report all‐cause mortality or serious adverse events. |
| For‐profit bias | Low risk | Royal Brisbane and Women’s Hospital Foundation seeding grant, Queensland University of Technology Postgraduate Research Award (PhD scholarship) and an Institute of Health and Biomedical Innovation Research Scholarship. |
| Other bias | Low risk | The trial appeared to be free of other components that could put it at risk of bias. |
Capellá 1990.
| Methods | Randomised clinical trial, Spain | |
| Participants | 27 hospitalised adults with gastric adenocardinoma undergoing total gastrectomy, at nutritional risk due to major abdominal surgery Male:Female = 21:6 Mean age = 64 years |
|
| Interventions | Experimental group: Received TPN (n = 15) Control group: Received traditional serum therapy (3 participants actually received peripheral parenteral nutrition)(n = 12) |
|
| Outcomes | Mortality, complications, length of hospital stay | |
| Study dates | 1983 to 1986 | |
| Notes | We contacted the authors on 13th December 2015 by email: gcapella@ico.scs.es. We received no reply. | |
| Risk of bias | ||
| Bias | Authors' judgement | Support for judgement |
| Random sequence generation (selection bias) | Unclear risk | Not described |
| Allocation concealment (selection bias) | Unclear risk | Not described |
| Blinding of participants and personnel (performance bias) All outcomes | Unclear risk | Not described |
| Blinding of outcome assessment (detection bias) All outcomes | Unclear risk | Not described |
| Incomplete outcome data (attrition bias) All outcomes | Unclear risk | The number of participants with incomplete data was not reported. |
| Selective reporting (reporting bias) | Low risk | Mortality and complications were reported. |
| For‐profit bias | Unclear risk | It was unclear how the trial was funded. |
| Other bias | Low risk | The trial appeared to be free of other components that could put it at risk of bias. |
Carr 1996.
| Methods | Randomised clinical trial, UK. | |
| Participants | 30 hospitalised adults undergoing intestinal resection, at nutritional risk due to major surgery Male:Female = 19:11 Mean age = 55.1 years Exclusion criteria: emergencies and allergy or intolerance to the constituents of the feed |
|
| Interventions | Experimental group: early enteral feeding (energy and water requirements were calculated from the weight of the participant and a mixture of Fresubin and water provided the full basic fluid requirements).(n = 15) Control group: standard care (n = 15) |
|
| Outcomes | Daily intake, anthropometrics, complications, length of stay, days to intake, hand‐grip strength, weight | |
| Study dates | Not stated | |
| Notes | We could obtain no contact information for the author. | |
| Risk of bias | ||
| Bias | Authors' judgement | Support for judgement |
| Random sequence generation (selection bias) | Unclear risk | Not described |
| Allocation concealment (selection bias) | Unclear risk | Not described |
| Blinding of participants and personnel (performance bias) All outcomes | Unclear risk | Not described |
| Blinding of outcome assessment (detection bias) All outcomes | Unclear risk | Not described |
| Incomplete outcome data (attrition bias) All outcomes | Unclear risk | More than 5% dropped out, and the trial did not use proper methodology to deal with missing data. |
| Selective reporting (reporting bias) | Low risk | No protocol could be obtained, but the trial reported on mortality and complications. |
| For‐profit bias | Low risk | The trial was funded by the Departments of surgery and intensive care. |
| Other bias | Low risk | The trial appeared to be free of other components that could put it at risk of bias. |
Carver 1995.
| Methods | Randomised clinical trial, UK | |
| Participants | 46 hospitalised adults with a BMI < 20, at nutritional risk due to having a BMI < 20.5 kg/m2. Male:Female = 10:36 Mean age = 75 Exclusion criteria: Residents classified as emaciated, had known physical pathology or were in short‐term or assessment wards |
|
| Interventions | Experimental group: Oral supplements in the form of 200 ml oral supplement Fortisip (Cow & Gate Ltd, Trowbridge, UK) twice daily. This provided 2.5 MJ (600 kcal) energy a day from protein, carbohydrate and fat in addition to a range of vitamins and minerals. (n = 23) Control group: Placebo, in the form of a 200 ml oral vitamin preparation twice daily providing the same vitamins as Fortisip but virtually no macronutrients and thus minimal additional energy(n = 23) |
|
| Outcomes | Weight, BMI, triceps skinfold thickness and midupper‐arm circumference | |
| Study dates | Not stated | |
| Notes | We contacted the authors on 9th November 2015 by email: jcarver@hsc.usf.edu. We received no reply. | |
| Risk of bias | ||
| Bias | Authors' judgement | Support for judgement |
| Random sequence generation (selection bias) | Unclear risk | Not described |
| Allocation concealment (selection bias) | Unclear risk | Not described |
| Blinding of participants and personnel (performance bias) All outcomes | Low risk | Control group received placebo |
| Blinding of outcome assessment (detection bias) All outcomes | Low risk | All measurements were made by the authors, who did not know whether residents were in the treatment or control group. |
| Incomplete outcome data (attrition bias) All outcomes | High risk | 6 participants in each group (12 (26 %) in total) were withdrawn and excluded from the analyses, but reasons for withdrawal were clearly stated. |
| Selective reporting (reporting bias) | Unclear risk | No protocol could be obtained and the trial did not report all‐cause mortality or serious adverse events. |
| For‐profit bias | High risk | The trial was supported by Cow & Gate. |
| Other bias | Low risk | The trial appeared to be free of other components that could put it at risk of bias. |
Casaer 2011.
| Methods | Randomised clinical trial in Belgium | |
| Participants | 4640 hospitalised adults in ICU, at nutritional risk due to having NRS score of 3 or more Male:Female = 2972:1668 Mean age = 64 years Exclusion criteria: "chronic malnourishment (defined as a BMI of < 17) before admission to an ICU and referral from another ICU with an established regimen of enteral or parenteral nutrition" |
|
| Interventions | Experimental group: "Participants received i.v. 20% glucose solution; the target for total energy intake was 400 kcal a day on ICU day 1 and 800 kcal a day on day 2. On day 3, parenteral nutrition (OliClinomel or Clinimix, Baxter) was initiated, with the dose targeted to 100% of the caloric goal through combined enteral and parenteral nutrition. (n = 2312) Control: Participants received 5% glucose solution in a volume equal to that of the parenteral nutrition administered in the early‐initiation group in order to provide adequate hydration, with the delivered volume of enteral nutrition taken into account. If enteral nutrition was insufficient after 7 days in the ICU, parenteral nutrition was initiated on day 8 to reach the caloric goal."(n = 2328) Co‐interventions: "All participants who were unable to eat by day 2 received enteral nutrition (mainly Osmolite, Abbott), while being maintained in a semirecumbent position unless medically contraindicated. Standing orders for enteral nutrition for all participants specified a twice‐daily increase in the infusion rate for enteral nutrition and the use of prokinetic agents and duodenal feeding tubes." |
|
| Outcomes | Vital status (mortality 90 days after randomisation independent of ICU and hospital discharge status, hospital mortality, ICU mortality and proportion of participants discharged alive from ICU within 8 days), hypoglycaemia, serious adverse events and complications related to the mode of nutrition. The primary efficacy endpoint for this RCT was the time to discharge alive from ICU, time to discharge alive from the hospital, time to final (alive) weaning from mechanical respiratory support, kidney failure, need for pharmacological or mechanical haemodynamic support during ICU stay, need for a tracheostomy during ICU stay, cholestasis and liver dysfunction, occurrence of infections during ICU stay, inflammation, distribution of 6‐MWD, proportion of participants independent for all ADL functions in both groups was compared at hospital discharge. | |
| Study dates | August 2007 to November | |
| Notes | We contacted the authors on 17th November 2015 by mail: greet.vandenberghe@med.kuleuven.be regarding allocation sequence generation. We received a reply with the information. | |
| Risk of bias | ||
| Bias | Authors' judgement | Support for judgement |
| Random sequence generation (selection bias) | Low risk | Computer‐based randomisation |
| Allocation concealment (selection bias) | Low risk | "Sequentially numbered, sealed and opaque envelopes". |
| Blinding of participants and personnel (performance bias) All outcomes | High risk | None were blinded. |
| Blinding of outcome assessment (detection bias) All outcomes | Low risk | All outcome assessors, which were investigators not directly involved (such as statisticians, laboratory personnel, infectious disease specialists, pathologists, physiotherapists involved in the strength measurement, electrophysiologists) as well as physicians and nurses in the conventional wards, were blinded to treatment allocation. |
| Incomplete outcome data (attrition bias) All outcomes | High risk | There were incomplete data for 6‐MWD and the trial did not use proper methods to deal with the missing data. |
| Selective reporting (reporting bias) | Low risk | The trial reported on all outcomes stated in the protocol. |
| For‐profit bias | Low risk | Funded by the Methusalem programme of the Flemish government and others. |
| Other bias | Low risk | The trial appeared to be free of other components that could put it at risk of bias. |
Caulfield 2012.
| Methods | Randomised clinical trial, Ireland | |
| Participants | 41 hospitalised adults who were malnourished, at nutritional risk according to the trialist Male:Female = not stated Mean age = not stated Exclusion criteria: none stated |
|
| Interventions | Experimental group 1: 200 ml or 4 x 50 ml ONSs (2 kcal/ml) for 28 days(n = 27) Control group: No intervention(n = 14) Co‐interventions: Dietary counselling |
|
| Outcomes | Nutritional assessment, biochemical measurements, presence of pressure ulcers, product tolerance and compliance | |
| Study dates | Not stated | |
| Notes | Abstract only. We contacted the author on 9th November 2015 via Facebook. We received no reply. | |
| Risk of bias | ||
| Bias | Authors' judgement | Support for judgement |
| Random sequence generation (selection bias) | Unclear risk | Not described |
| Allocation concealment (selection bias) | Unclear risk | Not described |
| Blinding of participants and personnel (performance bias) All outcomes | Unclear risk | Not described |
| Blinding of outcome assessment (detection bias) All outcomes | Unclear risk | Not described |
| Incomplete outcome data (attrition bias) All outcomes | Unclear risk | The number of participants with incomplete data was not reported. |
| Selective reporting (reporting bias) | Unclear risk | No protocol could be obtained, and the trial did not report all‐cause mortality or serious adverse events. |
| For‐profit bias | Unclear risk | It was unclear how the trial was funded. |
| Other bias | Low risk | The trial appeared to be free of other components that could put it at risk of bias. |
Chen 1995a.
| Methods | Randomised clinical trial, China | |
| Participants | 24 hospitalised adults undergoing abdominal elective surgery, at nutritional risk due to major surgery Male:Female = 15:9 Mean age = 53.5 years Exclusion criteria: Unclear |
|
| Interventions | Experimental group A: Recieved the compound nutrition elements of Qingdao biochemical pharmaceutical factory ( 400 kcal, N 2.56 g per 100 g) from the 1st day after the operation. It was infused as a 10% nutrient solution continuously with the speed of 50 ml/hr, reaching the maximum volume (25% of the daily nutrient solution 3000 ml) gradually within a few days according to tolerance. Oral intake was maintained during this time. The amount of perfusion was gradually decreased and the tube removed, when nutrition sufficed from oral intake. (n = 8) Experimental group B: enteral nutrition support after postoperative flatus, in the same way as experimental group A. (n = 8) Control group: Conventional i.v. infusion after surgery. Some received albumin or blood transfusion once or twice. (n = 8) |
|
| Outcomes | Complication, weight, daily calorie, nitrogen and liquid intake, albumin and transferrin, urea nitrogen concentration | |
| Study dates | Not stated | |
| Notes | We tried but failed to contact the author by phone. | |
| Risk of bias | ||
| Bias | Authors' judgement | Support for judgement |
| Random sequence generation (selection bias) | Unclear risk | The trial was described as being randomised, but it was unclear how the sequence was generated. |
| Allocation concealment (selection bias) | Unclear risk | The trial was described as being randomised, but it was unclear how the allocation was concealed. |
| Blinding of participants and personnel (performance bias) All outcomes | High risk | Participants and personnel were not blinded. |
| Blinding of outcome assessment (detection bias) All outcomes | Unclear risk | The procedure of blinding was insufficiently described. |
| Incomplete outcome data (attrition bias) All outcomes | Unclear risk | The numbers and reasons for withdrawals and dropouts were not clearly stated. |
| Selective reporting (reporting bias) | Unclear risk | No protocol could be obtained and the trial did not report on all‐cause mortality. |
| For‐profit bias | Unclear risk | It was unclear how the trial was funded. |
| Other bias | Low risk | The trial appeared to be free of other components that could put it at risk of bias. |
Chen 1995b.
| Methods | Randomised clinical trial, China | |
| Participants | 24 hospitalised adults undergoing abdominal elective surgery, at nutritional risk due to major surgery Male:Female = 15:9 Mean age = 53.5 years Exclusion criteria: Unclear |
|
| Interventions | Experimental group A: Received the compound nutrition elements of Qingdao biochemical pharmaceutical factory (400 kcal, N 2.56g per 100 g) from the 1st day after the operation. It was infused as a 10% nutrient solution continuously with the speed of 50 ml/hr, reaching the maximum volume (25% of the daily nutrient solution 3000 ml) gradually within a few days according to tolerance. Oral intake was maintained during this time. The amount of perfusion was gradually decreased and the tube removed, when nutrition sufficed from oral intake.(n = 8) Experimental group B: enteral nutrition support after postoperative flatus, in the same way as experimental group A(n = 8) Control group: Conventional intravenous infusion after surgery. Some received albumin or blood transfusion once or twice.(n = 8) |
|
| Outcomes | Complication, weight, daily calorie, nitrogen and liquid intake, albumin and transferrin, urea nitrogen concentration | |
| Study dates | Not stated | |
| Notes | We tried but failed to contact the author by phone. | |
| Risk of bias | ||
| Bias | Authors' judgement | Support for judgement |
| Random sequence generation (selection bias) | Unclear risk | The trial was described as being randomised, but it was unclear how the sequence was generated. |
| Allocation concealment (selection bias) | Unclear risk | The trial was described as being randomised, but it was unclear how the allocation was concealed. |
| Blinding of participants and personnel (performance bias) All outcomes | High risk | Participants and personnel were not blinded. |
| Blinding of outcome assessment (detection bias) All outcomes | Unclear risk | The procedure of blinding was insufficiently described. |
| Incomplete outcome data (attrition bias) All outcomes | Unclear risk | The numbers and reasons for withdrawals and dropouts were not clearly stated. |
| Selective reporting (reporting bias) | Unclear risk | No protocol could be obtained and the trial did not report on all‐cause mortality. |
| For‐profit bias | Unclear risk | It was unclear how the trial was funded. |
| Other bias | Low risk | The trial appears to be free of other components that could put it at risk of bias. |
Chen 2000a.
| Methods | Randomised clinical trial, China | |
| Participants | 30 hospitalised adults undergoing moderate or more elective abdominal surgery, at nutritional risk due to abdominal surgery Male:Female = 17:13. Exclusion criteria: Metabolic and infectious diseases, having taken steroids and/or immunosuppressive agents recently |
|
| Interventions | Experimental group A: Enteral nutrition, Nutrison (product of Holland Nutricia company) were infused through a nutrition tube in upper jejunum at the first postoperative day, 1/3 of the total amount on the 1st day, 2/3 on the 2nd day, and full amount (125.4 KJ‐1·kg‐1·d‐1) on the 3rd day (n = 10) Experimental group B: Parenteral nutrition (n = 10) (Huarui company products) through peripheral or central vein from the 1st postoperative day, with the same usage of enteral nutrition group Control group: Conventional infusion for 8 days, the average calorie intake was about 2514 KJ·d‐1(n = 10) |
|
| Outcomes | Complications, plasma protein (total protein, albumin and transferrin), CD3, CD4, CD8, D4/CD8 | |
| Study dates | Not stated | |
| Notes | We tried but failed to contact the author by phone. | |
| Risk of bias | ||
| Bias | Authors' judgement | Support for judgement |
| Random sequence generation (selection bias) | Unclear risk | The trial was described as being randomised, but it was unclear how the sequence was generated. |
| Allocation concealment (selection bias) | Unclear risk | The trial was described as being randomised, but it was unclear how the allocation was concealed. |
| Blinding of participants and personnel (performance bias) All outcomes | High risk | Participants and personnel were not blinded. |
| Blinding of outcome assessment (detection bias) All outcomes | Unclear risk | The procedure of blinding was insufficiently described. |
| Incomplete outcome data (attrition bias) All outcomes | Unclear risk | The numbers and reasons for withdrawals and dropouts were not clearly stated. |
| Selective reporting (reporting bias) | Unclear risk | No protocol could be obtained and the trial did not report on all‐cause mortality. |
| For‐profit bias | Unclear risk | It was unclear how the trial was funded |
| Other bias | Low risk | The trial appeared to be free of other components that could put it at risk of bias. |
Chen 2000b.
| Methods | Randomised clinical trial, China | |
| Participants | 30 hospitalised adults undergoing moderate or more elective abdominal surgery, at nutritional risk due to abdominal surgery Male:Female = 17:13 Exclusion criteria: Metabolic and infectious diseases, having taken steroids or immunosuppressive agents or both recently |
|
| Interventions | Experimental group A: Enteral nutrition, Nutrison (product of Holland Nutricia company) were infused through a nutrition tube in upper jejunum on the 1st postoperative day, 1/3 of the total amount on the 1st day, 2/3 on the 2nd day, and full amount (125.4 KJ‐1·kg‐1·d‐1) on the 3rd day(n = 10) Experimental group B: Parenteral nutrition (Huarui company products) through peripheral or central vein from the 1st postoperative day, with the same usage of enteral nutrition group(n = 10) Control group: Conventional infusion for 8 days, the average calorie intake was about 2514 KJ·d‐1(n = 10) |
|
| Outcomes | Complications, plasma protein (total protein, albumin and transferrin), CD3, CD4, CD8, D4/CD8. | |
| Study dates | Not stated | |
| Notes | Same trial as Chen 2000a. We tried but failed to contact the author by phone (0543‐3258597). | |
| Risk of bias | ||
| Bias | Authors' judgement | Support for judgement |
| Random sequence generation (selection bias) | Unclear risk | The trial was described as being randomised, but it was unclear how the sequence was generated. |
| Allocation concealment (selection bias) | Unclear risk | The trial was described as being randomised, but it was unclear how the allocation was concealed. |
| Blinding of participants and personnel (performance bias) All outcomes | High risk | Participants and personnel were not blinded. |
| Blinding of outcome assessment (detection bias) All outcomes | Unclear risk | The procedure of blinding was insufficiently described. |
| Incomplete outcome data (attrition bias) All outcomes | Unclear risk | The numbers and reasons for withdrawals and dropouts were not clearly stated. |
| Selective reporting (reporting bias) | Unclear risk | No protocol could be obtained and the trial did not report on all‐cause mortality. |
| For‐profit bias | Unclear risk | It was unclear how the trial was funded. |
| Other bias | Low risk | The trial appeared to be free of other components that could put it at risk of bias. |
Chen 2006.
| Methods | Randomised clinical trial, China | |
| Participants | 41 hospitalised adults who were burned and admitted within 18 hours, at nutritional risk due to being in the ICU Male:Female = 24:17 Mean age = 33.5 years Exclusion criteria: 1. Severe metabolic diseases, such as diabetes, hyperthyroidism, or low, severe liver disease; 2. Unsuitable due to shock; 3. Acute renal failure and stress ulcer that occurred during the treatment; 4. Other severe traumas such as visceral rupture and traumatic brain injury; 5. Severe heart and lung deficiency |
|
| Interventions | Experimental group: Via a nasogastric feeding tube, the participants were given protein enriched enteral nutrition mixed supplements (best, Nutricia, containing per 1000 ml; 40 g of protein, 389 g of fat, and 123 g of glucose), according to gastro‐intestinal tolerance and energy demand, at a rate, from 30 ˜ 50 ml/hr. It was gradually increased to 120 ˜ 150 ml/hr, so that on day 8 ‐ 9 the total amount given was 2500 ˜ 3000 ml as a restricted diet. It was unknown for how long the treatment was continued. (n = 21) Control group: Via a central venous catheter, the participants were given the required parenteral nutrition every day (1000 ml, containing 29 g of protein, 25 g of fat, and 62.5 g of glucose, thermal energy 2.78 MJ). They were encouraged to eat regularly as well. It was unknown for how long the treatment was continued. (n = 20) |
|
| Outcomes | Biomarkers, health economics, adverse events | |
| Study dates | Not stated | |
| Notes | We tried but failed to contact the author by phone. | |
| Risk of bias | ||
| Bias | Authors' judgement | Support for judgement |
| Random sequence generation (selection bias) | Unclear risk | The trial was described as being randomised, but it was unclear how the sequence was generated. |
| Allocation concealment (selection bias) | Unclear risk | The trial was described as being randomised, but it was unclear how the allocation was concealed. |
| Blinding of participants and personnel (performance bias) All outcomes | High risk | Participants and personnel were not blinded. |
| Blinding of outcome assessment (detection bias) All outcomes | Unclear risk | The procedure of blinding was insufficiently described. |
| Incomplete outcome data (attrition bias) All outcomes | Unclear risk | The numbers and reasons for withdrawals and dropouts were not clearly stated. |
| Selective reporting (reporting bias) | Unclear risk | No protocol could be obtained and the trial did not report on all‐cause mortality. |
| For‐profit bias | Unclear risk | It was unclear how the trial was funded. |
| Other bias | Low risk | The trial appeared to be free of other components that could put it at risk of bias. |
Choudhry 1996.
| Methods | Randomised clinical trial, USA | |
| Participants | 41 hospitalised adults undergoing PEG placement due to not being able to be orally fed, at nutritional risk due to trialist indication Male:Female = 41:0 Mean age = 72.3 years Exclusion: Inability to obtain an informed consent, not expected to survive the duration of the study, any contraindications for endoscopy, inability to successfully transilluminate the abdominal wall, ascites, massive organomegaly, coagulopathy, and systemic infection |
|
| Interventions | Experimental: Feeding through tube started 3 hrs after PEG placement(n = 10) Control: no intervention (n = 10) Co‐intervention: PEG placement and full‐strength iso‐osmolar feeding after 24 hrs |
|
| Outcomes | The outcomes assessed included maximum residual volumes for each group for each day, adverse events, 30‐day mortality, number of participants alive in each group at the termination of the study, mean number of days a participant lived after PEG placement, and the number of days between PEG placement and termination of the study. | |
| Study dates | Not stated | |
| Notes | ||
| Risk of bias | ||
| Bias | Authors' judgement | Support for judgement |
| Random sequence generation (selection bias) | Unclear risk | Not described |
| Allocation concealment (selection bias) | Unclear risk | Not described |
| Blinding of participants and personnel (performance bias) All outcomes | Unclear risk | Not described |
| Blinding of outcome assessment (detection bias) All outcomes | Unclear risk | Not described |
| Incomplete outcome data (attrition bias) All outcomes | Unclear risk | The number of participants with incomplete data was not described. |
| Selective reporting (reporting bias) | Low risk | The trial reported mortality and adverse events. |
| For‐profit bias | Unclear risk | It was unclear how the trial was funded. |
| Other bias | Low risk | The trial appeared to be free of other components that could put it at risk of bias. |
Chourdakis 2012.
| Methods | Randomised clinical trial, Greece | |
| Participants | 59 hospitalised adults admitted to the ICU, at nutritional risk due to being at the ICU Male:Female = 47:12 Mean age = 34.7 Exclusion criteria: Age < 18 or ≥ 70 years, GCS score ≤ 9, obesity (≥ 30 BMI), pregnancy, lactation, had received corticosteroids or thyroidal hormones or both during the previous month, any of the following conditions: Heart failure, respiratory problems, metabolic syndrome, immunodeficiency, diabetes, neurological problems, internal bleeding, indication for TPN, delay of admission to ICU > 24 hrs from injury |
|
| Interventions | Experimental group: early (within 24 – 48 hrs) enteral feeding (EEF) In the EEF group, enteral feeding was established through the nasogastric tube and feeding began within 24 – 48 hrs from admission to the ICU. The initial administration rate was 30 mL/hr, and the rate reached 80 – 100 mL/hr within 48 hrs by subsequently increasing by 10 mL/hr every 4 – 6 hrs. (n = 34) Control group: Standard delayed enteral feeding (DEF): DEF was initiated when gastroparesis was resolved (> 48 hrs) but no later than 5 days after admission to the ICU, and the goal for the administration rate was to reach 100% of the needs within 4 days. (n = 25) |
|
| Outcomes | The administration rate for the prescribed quantity was calculated for < 24 hrs, excessive gastric residue, frequent diarrhoea, ileus, and thrombocytopenia. Complications, mortality, duration of stay in the ICU, hormonal status | |
| Study dates | August 2003 to May 2005 | |
| Notes | We contacted the authors by email: kouvelas@auth.gr on 5th October 2015. We received no answer. | |
| Risk of bias | ||
| Bias | Authors' judgement | Support for judgement |
| Random sequence generation (selection bias) | Unclear risk | Not described |
| Allocation concealment (selection bias) | Unclear risk | Not described |
| Blinding of participants and personnel (performance bias) All outcomes | High risk | "open‐labelled trial" |
| Blinding of outcome assessment (detection bias) All outcomes | High risk | "open‐labelled trial" |
| Incomplete outcome data (attrition bias) All outcomes | Low risk | There were complete data for all participants. |
| Selective reporting (reporting bias) | Low risk | Mortality and serious adverse events are reported. |
| For‐profit bias | Unclear risk | It was unclear how the trial was funded. |
| Other bias | Low risk | The trial appeared to be free of other components that could put it at risk of bias. |
Chuntrasakul 1996.
| Methods | Randomised clinical trial, Thailand | |
| Participants | 38 hospitalised adults with severe traumatic injury, at nutritional risk due to being at the ICU Male:Female = 31:7 Mean age= 26 ‐ 33 years |
|
| Interventions | Experimental group: Received either enteral feeding through a NG tube (30 ml/hr of .075 kcal/ml) or parenteral nutrition consisting of hypertonic glucose, amino acids and lipids(n = 21) Control group: 5% dextrose as maintenance fluid supplemented with oral nutrition when bowel function was observed(n = 17) | |
| Outcomes | Complications, serum albumin, mortality, ICU stay | |
| Study dates | June 1992 to January 1994 | |
| Notes | We contacted the authors on 3rd December 2015 by email: chomchark@gmail.com. We received no reply. | |
| Risk of bias | ||
| Bias | Authors' judgement | Support for judgement |
| Random sequence generation (selection bias) | Unclear risk | Not described |
| Allocation concealment (selection bias) | Unclear risk | Not described |
| Blinding of participants and personnel (performance bias) All outcomes | Unclear risk | Not described |
| Blinding of outcome assessment (detection bias) All outcomes | Unclear risk | Not described |
| Incomplete outcome data (attrition bias) All outcomes | Unclear risk | The number of participants with incomplete data was not reported. |
| Selective reporting (reporting bias) | Unclear risk | There was no protocol and the trial did not fully report complications. |
| For‐profit bias | High risk | The trial was supported by Bristol‐Meyer‐Squibb and Osothsapha. |
| Other bias | Low risk | The trial appeared to be free of other components that could put it at risk of bias. |
Cicco 1993.
| Methods | Randomised clinical trial, Italy | |
| Participants | 50 hospitalised adults with neoplasms scheduled to receive at least 2 identical courses of chemotherapy, at nutritional risk according to the trialist Male:Female = 26:17 (gender not reported for two participants) Mean age = 59 years Exclusion criteria: weight loss of 6 ‐ 10% of their usual body weight (the study only included normally nourished or undernourished participants) and if one of the following conditions were present: Diabetes mellitus; heart, pulmonary, liver, and kidney failure; sepsis; and bone marrow involvement |
|
| Interventions | Experimental group: TPN (Nonprotein caloric content was divided between dextrose (60%) and lipids (40%) (Intralipid, Kabi Pharmacia, Stockholm, Sweden). Crystalline amino acids (Freamine III, Kendall McGaw Laboratories, Irvine, CA) were provided at a calorie:nitrogen ratio of 160 kcal:l g of nitrogen (1.4 ± 0.2 g of amino acids per kilogram a day). Mineral salts (sodium, potassium, chlorine, magnesium, phosphorus, and calcium), as clinically indicated, and trace elements (5 mL of trace element mix, Don Baxter Laboratories, Trieste, Italy) were added to the nutrient mixture, which was prepared in ethylvinylacetate bags.(n = 24) Control group: No intervention (n = 26) Co‐interventions: Chemotherapy |
|
| Outcomes | Chemotherapy‐related myelotoxicity (leukopenia, anaemia and thrombocytopenia), gastro‐intestinal toxicity(diarrhoea, nausea/vomiting) Fast‐turnover visceral protein and nitrogen balance | |
| Study dates | Not stated | |
| Notes | This is a cross‐over study, the 2 groups switch intervention after the 1st round of chemo. We contacted the authors on 5th October 2015 by email: dfantin@cro.it. We received no reply. | |
| Risk of bias | ||
| Bias | Authors' judgement | Support for judgement |
| Random sequence generation (selection bias) | Unclear risk | Block randomisation ‐ blocks of 4. Not otherwise described. |
| Allocation concealment (selection bias) | Unclear risk | Not described. |
| Blinding of participants and personnel (performance bias) All outcomes | Unclear risk | Not described. |
| Blinding of outcome assessment (detection bias) All outcomes | Unclear risk | Not described. |
| Incomplete outcome data (attrition bias) All outcomes | High risk | 7 patients dropped out ‐ 4 because of disease progression, 2 because of refusal of venous catheterization, and one patient died. |
| Selective reporting (reporting bias) | Unclear risk | No protocol could be obtained and the trial did not report all‐cause mortality and serious adverse events. |
| For‐profit bias | Low risk | "This study was supported by Grant 1580 from the Fondo Sanitario Nazionale. Regione Friuli‐Venezia Giulia, Italy." No industry involvement. |
| Other bias | Low risk | The trial appeared to be free of other components that could put it at risk of bias. |
Clamon 1985.
| Methods | Randomised clinical trial, USA (Prior to randomisation, participants were stratified by extent of disease, weight loss over or under 2% during the 3 months prior to diagnosis, and performance score) |
|
| Participants | 119 hospitalised adults that had histologically‐ or cytologically‐documented small cell lung cancer, with no previous therapy, measurable or evaluable disease, a life expectancy of more than 8 weeks, and a performance score of 3 or better on the ECOG scale, at nutritional risk, due to trialist indication Male:Female = 89:30 Mean age = 60 years Exclusion criteria: Leukocyte count less than 3000/mm3, platelet count < 100.000/mm3, bilirubin level more than 2 mg/dl, creatinine more than 2 mg/dl or blood urea nitrogen (BUN) level greater than 30 mg/dl, recent myocardial infarction, congestive heart failure or arrhythmia precluding adriamycin (doxorubicin) therapy, documented central nervous system metastases, superior vena cava obstruction, inappropriate antidiuretic hormone secretion, or significant other medical problems precluding central venous hyperalimentation |
|
| Interventions | Experimental group: Central IVH for 28 days if no complications occurred. IVH was provided using an amino acid mixture (Travasol, Travenol Company, Deerfield, IL), glucose, and 10% lipid emulsion. Nonprotein calories were evenly divided between glucose and lipid. Electrolytes, multi‐vitamins, and trace elements were added daily; folate and vitamin K were given weekly. Vitamin B12 was given monthly. Participants nutritionally normal at entry to the study were started at 32 cal/kg/day and 1 g protein/kg/day. After 1 week, they were increased to 40 cal/kg and 1.25 g of protein/kg a day and maintained at this level for 3 weeks. Participants nutritionally depleted at entry into the study were started at 48 cal/kg and 1.5 g of protein/kg/day and increased to 56 cal/kg and 1.75 g/kg of protein a day. The IVH was started 1 week prior to the 1st dose of chemotherapy. Participants at the University of Toronto were maintained without oral intake while receiving IVH; at all other institutions participants were allowed to eat ad libitum during IVH. (n = 57) Control group: No intervention (n = 62) |
|
| Outcomes | A nutritional assessment consisting of weight, serum albumin, total iron binding capacity, midarm muscle circumference, triceps skinfold thickness, and creatinine height index was obtained at the beginning of the study (baseline) and repeated every 3 weeks. 3‐day diet records were obtained before the initiation of treatment and at the end of 3 weeks after the 1st, 2nd, 4th, 8th, and 12th cycles of chemotherapy and at the end of 1 year. |
|
| Study dates | Not stated | |
| Notes | We contacted the authors on 5th October 2015 by email: emmoran@uci.edu; edgar.moran@va.gov. We received no reply. | |
| Risk of bias | ||
| Bias | Authors' judgement | Support for judgement |
| Random sequence generation (selection bias) | Unclear risk | Not described |
| Allocation concealment (selection bias) | Unclear risk | Not described |
| Blinding of participants and personnel (performance bias) All outcomes | Unclear risk | Not described |
| Blinding of outcome assessment (detection bias) All outcomes | Unclear risk | Not described |
| Incomplete outcome data (attrition bias) All outcomes | Unclear risk | The number of participants with incomplete data was not reported. |
| Selective reporting (reporting bias) | High risk | No protocol could be obtained and the trial did not report all‐cause mortality or serious adverse events. |
| For‐profit bias | Low risk | This trial was sponsored and funded by the Diet, Nutrition and Cancer Program of the National Cancer Institute. |
| Other bias | Low risk | The trial appeared to be free of other components that could put it at risk of bias. |
De Sousa 2012.
| Methods | Randomised clinical trial, Portugal | |
| Participants | 37 undernourished hospitalised adults aged 60+ years, with recently‐diagnosed probable mild AD and who presented weight loss higher than 5% of body weight in the previous year, at nutritional risk due to anthropometrics Male:Female = 9:26 (gender not reported for one participants) Mean age = 78 years Exclusion criteria: having severe acute illness or being in terminal care, a diagnosis of cancer in the last 5 years, enteral or parenteral nutritional support, and receiving dietary advice or use of nutritional supplements in the preceding month |
|
| Interventions | Experimental group: Oral nutrition. The participants received a 200 mL high‐protein, energy‐dense liquid, which provided 400 kcal/day (42.8 g carbohydrates, 17.4 g fat, and 18 g protein). The OS was available in 2 flavours (vanilla and apricot) and was consumed in the morning, between breakfast and lunch, or in the afternoon. The intervention lasted 21 days. (n = 20)
Control group: No intervention (n = 17) Co‐interventions: All the participants received standard dietetic advice and they followed the treatment protocol in the Geriatric Unit that included folic acid and vitamin B12 supplementation. |
|
| Outcomes | Mini Nutritional Assessment (MNA), weight, BMI, triceps skinfold, upper‐arm circumference, arm muscle circumference, cognitive function (MMSE), functional status (Barthel index), clock‐drawing test, serum nutritional biomarkers (albumin, total protein, total cholesterol, vitamin B12 and folic acid) and mortality | |
| Study dates | Not stated | |
| Notes | We contacted the authors on 1st January 2015 by email: luisavice@gmail.com. We received no reply. | |
| Risk of bias | ||
| Bias | Authors' judgement | Support for judgement |
| Random sequence generation (selection bias) | Unclear risk | Not described |
| Allocation concealment (selection bias) | Unclear risk | Not described |
| Blinding of participants and personnel (performance bias) All outcomes | High risk | The trial is described as non‐blinded. |
| Blinding of outcome assessment (detection bias) All outcomes | High risk | The trial is described as non‐blinded. |
| Incomplete outcome data (attrition bias) All outcomes | Unclear risk | There were no dropouts but it was unclear how many participants had missing data. |
| Selective reporting (reporting bias) | Unclear risk | The trial reports all‐cause mortality, but not serious adverse events. We found no protocol. |
| For‐profit bias | High risk | The nutritional supplements were offered by Novartis, Portugal. |
| Other bias | Low risk | The trial appeared to be free of other components that could put it at risk of bias. |
Delmi 1990.
| Methods | Randomised clinical trial, Switzerland/France | |
| Participants | 59 hospitalised adults with a femoral neck fracture, at nutritional risk due to being frail elderly with fracture of the proximal femur Male:Female = 6:53 Mean age = 81 years Exlusion criteria: Younger than 60, fractures resulting from violent external trauma and pathological fractures due to tumours or non‐osteoporotic osteopathies, renal, hepatic, or endocrine disease, gastrectomy or malabsorption, or treatment with phenytoin, steroids, barbiturates, fluoride, or calcitonin |
|
| Interventions | Experimental group: Oral supplements 250 ml of ONS provided 254 kcal, 20.4 g protein, 29 g carbohydrate, 5 ‐ 8 g lipid, 525 mg calcium, 750 IU vitamin A, 25 IU vitamin D3’ vitamins E, B, B2, B63 B12, C, nicotinamide, folate, calcium pantothenate, biotin, and minerals. Supplementation was started on admission to the orthopaedic unit and continued throughout the stay in the 2nd (recovery) hospital. The supplement was given for a mean period of 32 days at 2000 hrs. (n = 27) Control group: No intervention(n = 32) Co‐interventions: Voluntary oral intake |
|
| Outcomes | Mortality, upper arm circumference, triceps skinfold thickness, complications, serum albumin levels, transferrin levels, alkaline phosphatase levels, osteocalcin levels, lenght of hospital stay | |
| Study dates | March 1985 to May 1985 | |
| Notes | We contacted the authors on 17th November 2015 by email: marino.delmi@grangettes.ch. We received no reply. | |
| Risk of bias | ||
| Bias | Authors' judgement | Support for judgement |
| Random sequence generation (selection bias) | Unclear risk | Not described |
| Allocation concealment (selection bias) | Unclear risk | Not described |
| Blinding of participants and personnel (performance bias) All outcomes | High risk | Not possible due to the nature of the intervention |
| Blinding of outcome assessment (detection bias) All outcomes | Unclear risk | The procedure of blinding was not described |
| Incomplete outcome data (attrition bias) All outcomes | Low risk | There were dropouts above 5%. |
| Selective reporting (reporting bias) | Low risk | No protocol could be obtained, but the trial reported serious adverse events and mortality. |
| For‐profit bias | Unclear risk | It was unclear how the trial was funded. |
| Other bias | Low risk | The trial appeared to be free of other components that could put it at risk of bias. |
Dennis 2005.
| Methods | Randomised clinical trial (stratified for age, sex, and predicted probability of poor outcome), UK | |
| Participants | 4023 hospitalised adults with either: 1. admission to a hospital due to a stroke (1st or recurrent stroke) within 7 days of onset OR 2. suffering a stroke whilst already in hospital where the randomising clinician was uncertain about the best feeding policy and with consent or assent obtained from close relatives as well as having passed a shallow screen. The participants were at nutritional risk due having had a stroke. Male:Female: 53% male Mean age = 71 years Exclusion: (a) People with subarachnoid haemorrhage, people who experienced a transient ischaemic attack (TIA) or trivial stroke and were likely to remain in hospital for only a few days (b) people who could swallow but in whom nutritional supplementation was contraindicated (e.g. morbidly obese) (c) those in coma (i.e. unresponsive to pain) or who were very unlikely to survive more than a few days because of some severe non‐stroke illness OR (d) people who had already been entered into the same FOOD Trial |
|
| Interventions | Experimental group: oral nutritional supplement (equivalent to 360 mL at 6·27 kJ/mL and 62·5 g/L in protein every day) and regular hospital diet(n = 2016) Control group: regular hospital diet(n = 2007) |
|
| Outcomes | Death or poor outcome and overall survival at 6 months, health‐related QoL among survivors, time to hospital discharge, length of stay in hospital, number of days of tube‐feeding, adverse effects of feeding regimens, premature cessation of feeding regimens and reasons | |
| Study dates | Nov 1996 to August 2003 | |
| Notes | We contacted the authors on 12th November 2015 by email: martin.dennis@ed.ac.uk. We received data on quality of life. | |
| Risk of bias | ||
| Bias | Authors' judgement | Support for judgement |
| Random sequence generation (selection bias) | Low risk | Computer‐generated |
| Allocation concealment (selection bias) | Low risk | Locked computer |
| Blinding of participants and personnel (performance bias) All outcomes | High risk | Not blinded. Participants knew their allocation. |
| Blinding of outcome assessment (detection bias) All outcomes | High risk | Only a blinded assessment at 6 months follow‐up. |
| Incomplete outcome data (attrition bias) All outcomes | Low risk | 7 dropouts but reasons for the dropouts were clearly stated and the trial used intention‐to‐treat. |
| Selective reporting (reporting bias) | Low risk | All clinically relevant outcomes were reported, as stated in the protocol. |
| For‐profit bias | Low risk | FOOD was funded by the NHS R&D Health Technology Assessment Programme (Reference 96/29/01), The Stroke Association (Reference 17/98) and Chest Heart and Stroke Scotland (Reference 97/4). The Singapore Medical Research Council supported the trial in Singapore. The Royal Australasian College of Physicians supported the trial in Hawkes Bay, New Zealand. |
| Other bias | Low risk | The trial appeared to be free of other components that could put it at risk of bias. |
Dennis 2006.
| Methods | Randomised clinical trial, UK | |
| Participants | 859 hospitalised adults who were 1. either admitted to hospital with a stroke (1st or recurrent stroke) within 7 days of onset OR 2. suffering a stroke whilst already in hospital AND 3. randomising clinician uncertain about the best feeding policy AND 4. consent or assent from close relatives obtained and 5. did not pass shallow screen. The participants were at nutritional risk due to having had a stroke. Exclusion: Subarachnoid haemorrhage |
|
| Interventions | Experimental group: early enteral tube‐feeding. (n = 429) Control group: no tube‐feeding for > 7 days (early versus avoid)(n = 430) |
|
| Outcomes | Death or poor outcome and overall survival, proportion of participants who were dead at 6 months, health‐related QoL among survivors, time to hospital discharge, length of stay in hospital (which will provide a surrogate outcome for analysis of cost), number of days of tube‐feeding, adverse effects of feeding regimens, premature cessation of feeding regimens and reasons | |
| Study dates | Nov 1996 to August 2003 | |
| Notes | We contacted the authors on 12th November 2015 by email: martin.dennis@ed.ac.uk. We received data on quality of life. | |
| Risk of bias | ||
| Bias | Authors' judgement | Support for judgement |
| Random sequence generation (selection bias) | Low risk | Computer‐generated |
| Allocation concealment (selection bias) | Low risk | Locked computer |
| Blinding of participants and personnel (performance bias) All outcomes | High risk | Not blinded. Participants knew their allocation. |
| Blinding of outcome assessment (detection bias) All outcomes | High risk | Only a blinded assessment at 6 months follow‐up. |
| Incomplete outcome data (attrition bias) All outcomes | Low risk | 1 lost to follow‐up |
| Selective reporting (reporting bias) | Low risk | All clinically relevant outcomes were reported, as stated in the protocol. |
| For‐profit bias | Low risk | FOOD was funded by the NHS R&D Health Technology Assessment Programme (Reference 96/29/01), The Stroke Association (Reference 17/98) and Chest Heart and Stroke Scotland (Reference 97/4). The Singapore Medical Research Council supported the trial in Singapore. The Royal Australasian College of Physicians supported the trial in Hawkes Bay, New Zealand. |
| Other bias | Low risk | The trial appeared to be free of other components that could put it at risk of bias. |
Ding 2009.
| Methods | Randomised clinical trial, China | |
| Participants | 60 hospitalised adults diagnosed with invasive gastric cancer by gastroscopy and pathology, at nutritional risk due to major surgery Male:Female =41:19 Mean age = 47.5 Exclusion criteria: Bad liquid quality, diabetes, hyperthyroidism and other metabolic diseases, poorly‐controlled heart and lung function which could not tolerate surgery, as well as other digestive system diseases such as intestinal obstruction, appendicitis, cholecystitis, vomiting, abdominal distension, diarrhoea |
|
| Interventions | Experimental group: Oral supplement, Nutrison Fibre (Nutricia China,4184 kJ/L)1000 ml/day, based on baseline diet. It was started 3 days prior to the surgery, with the amount calculated based on the co‐intervention. (n = 21) Control group: Normal daily diet prior to surgery, with the amount based on the co‐intervention. (n = 21) Co‐interventions: Postoperative fasting and TPN support for 4 to 5 days, the ratio of nutrient solution to the venous nitrogen was 0.15 g/kg 1/day, nitrogen source was 18 amino acids, non‐protein calorie was 117.2 kJ/kg/day, fat emulsions were 30% ˜ 40% and glucose was 60% ˜ 70%. It was prepared as a nutrient mixture including insulin, potassium chloride, and vitamins in correct proportion. |
|
| Outcomes | Albumin, immunoglobulin, body mass | |
| Study dates | Not stated | |
| Notes | We tried but failed to contact the authors by phone. | |
| Risk of bias | ||
| Bias | Authors' judgement | Support for judgement |
| Random sequence generation (selection bias) | Low risk | The sequence generation was achieved using a random‐numbers table. |
| Allocation concealment (selection bias) | Unclear risk | Not described |
| Blinding of participants and personnel (performance bias) All outcomes | High risk | Participants and personnel were not blinded. |
| Blinding of outcome assessment (detection bias) All outcomes | Unclear risk | The procedure of blinding was insufficiently described. |
| Incomplete outcome data (attrition bias) All outcomes | Unclear risk | The numbers and reasons for withdrawals and dropouts were not clearly stated. |
| Selective reporting (reporting bias) | Unclear risk | No protocol could be obtained and the trial did not report all‐cause mortality. |
| For‐profit bias | Unclear risk | It was unclear how the trial was funded. |
| Other bias | Low risk | The trial appeared to be free of other components that could put it at risk of bias. |
Dionigi 1991.
| Methods | Randomised clinical trial, Italy | |
| Participants | 33 hospitalised adults with advanced gastric cancer, at nutritional risk due to major surgery Male:Female = 24:9 Mean age: 65 years Exclusion criteria: Not specified |
|
| Interventions | Experimental group: parenteral or enteral hyperalimentation, or both. The total energy supply was 1.5 x BEE calculated according to the Harris‐Benedict formula: the ratio KcaYgN administered was adjusted to 130:1. (n = 7) Control group: oral alimentation as possible or peripheral fluids (n = 9) |
|
| Outcomes | SH‐thymidine (3HT) | |
| Study dates | Not stated | |
| Notes | We contacted the author on 9th December 2015 by email: p.dionigi@smatteo.pv.it. We received no reply. | |
| Risk of bias | ||
| Bias | Authors' judgement | Support for judgement |
| Random sequence generation (selection bias) | Unclear risk | Not described |
| Allocation concealment (selection bias) | Unclear risk | Not described |
| Blinding of participants and personnel (performance bias) All outcomes | Unclear risk | Not described |
| Blinding of outcome assessment (detection bias) All outcomes | Unclear risk | Not described |
| Incomplete outcome data (attrition bias) All outcomes | Unclear risk | The number of participants with incomplete data was not reported. |
| Selective reporting (reporting bias) | High risk | No protocol could be obtained and the trial did not report all‐cause mortality or serious adverse events. |
| For‐profit bias | High risk | The trial was funded by Ajinomoto Co. Inc. |
| Other bias | Low risk | The trial appeared to be free of other components that could put it at risk of bias. |
Doglietto 1990.
| Methods | Randomised clinical trial, Italy | |
| Participants | 29 hospitalised adults affected by cancer undergoing total or subtotal gastrectomy, at nutritional risk due to major abdominal surgery Male:Female = 20:9 Mean age = 54 years Exclusion criteria: Not stated |
|
| Interventions | Experimental group: Preoperative enteral nutrition support, which was administered as a supplement to the oral diet for at least 7 days, providing 30 kcal/kg a day (70% as dextrose and 30% as lipids) and 200 mg/kg a day of nitrogen(n = 13) Control group: Standard hospital oral diet (n = 16) |
|
| Outcomes | Postoperative morbidity, mortality, septic complications | |
| Study dates | Not stated | |
| Notes | We contacted the authors on 26th June 2015 by email: gbdoglietto@rm.unicatt.it. We received no reply. | |
| Risk of bias | ||
| Bias | Authors' judgement | Support for judgement |
| Random sequence generation (selection bias) | Unclear risk | Not described |
| Allocation concealment (selection bias) | Unclear risk | Not described |
| Blinding of participants and personnel (performance bias) All outcomes | High risk | Partipants and personnel were not blinded due to the nature of the intervention. |
| Blinding of outcome assessment (detection bias) All outcomes | Unclear risk | Not described |
| Incomplete outcome data (attrition bias) All outcomes | Low risk | There were no dropouts |
| Selective reporting (reporting bias) | Unclear risk | No protocol could be obtained and the trial did not report all‐cause mortality or serious adverse events. |
| For‐profit bias | Unclear risk | It was unclear how the trial was funded |
| Other bias | Low risk | The trial appeared to be free of other components that could put it at risk of bias.Other bias |
Doglietto 1996.
| Methods | Randomised clinical trial, multicenter, Italy | |
| Participants | 678 hospitalised adults undergoing elective abdominal surgery, at nutritional risk due to major elective abdominal surgery Male:Female = 392:286 Mean age = 61 years Exclusion criteria: < 18 and > 80, major concurrent illness, insulin‐dependent diabetes, refusal of informed consent, severe malnutrition |
|
| Interventions | Experimental group: Received 1.16 ± 0.22 g/Kg/day amino acids for at least 5 postoperative days(n = 338) Control group: Received 150 g glucose daily for at least 5 postoperative days(n = 340) Co‐interventions: Additional fluids, electrolytes, vitamins, and trace elements were provided as clinically indicated. |
|
| Outcomes | All‐cause mortality, major complications, minor complications | |
| Study dates | November 1992 to November 1994 | |
| Notes | We contacted the authors on 26th June 2015 by email: gbdoglietto@rm.unicatt.it. We received no reply. | |
| Risk of bias | ||
| Bias | Authors' judgement | Support for judgement |
| Random sequence generation (selection bias) | Low risk | Computer‐generated random numbers |
| Allocation concealment (selection bias) | Unclear risk | The trial was described as randomised, but it was unclear how the allocation was concealed. |
| Blinding of participants and personnel (performance bias) All outcomes | High risk | No blinding was performed. |
| Blinding of outcome assessment (detection bias) All outcomes | High risk | No blinding was performed. |
| Incomplete outcome data (attrition bias) All outcomes | Unclear risk | The number of participants with incomplete data was not reported. |
| Selective reporting (reporting bias) | Low risk | Both all‐cause mortality and serious adverse events were reported. |
| For‐profit bias | Unclear risk | It was unclear how the trial was funded. |
| Other bias | Low risk | The trial appeared to be free of other components that could put it at risk of bias. |
Dong 1996.
| Methods | Randomised clinical trial, China | |
| Participants | 520 hospitalised adults undergoing oesophageal and gastric resection, at nutritional risk due to major surgery Male:Female = 340:180 Mean age = 56.5 years Exclusion criteria: None stated |
|
| Interventions | Experimental group: Received enteral nutrition in the form of mixed milk post‐surgery On the first day,1000 ml mixed milk was given. If no side effect occurred, a minimum of 2500 ml a day were given from the 2nd day, up to 4 ‐ 6 times a day, at a speed of 30 ml per min. After 7 ‐ 9 days the nutrition tube was removed , if there were no serious adverse effects.(n = 256) Control group: No intervention(n = 264) Co‐interventions: Post‐surgery a daily supplement of glucose 150 ˜ 200 g was given, as well as a discontinuous transmission of plasma, blood or albumin, to maintain the water and electrolyte balance. This was continued until the oral intake was started again. |
|
| Outcomes | Albumin, pre‐albumin, transferrin, weight difference, nitrogen balance | |
| Study dates | Not stated | |
| Notes | We could find no contact information for the author. | |
| Risk of bias | ||
| Bias | Authors' judgement | Support for judgement |
| Random sequence generation (selection bias) | Unclear risk | Not described |
| Allocation concealment (selection bias) | Unclear risk | Not described |
| Blinding of participants and personnel (performance bias) All outcomes | High risk | Participants and personnel were not blinded |
| Blinding of outcome assessment (detection bias) All outcomes | Unclear risk | Not described |
| Incomplete outcome data (attrition bias) All outcomes | Unclear risk | The number of participants with incomplete data was not reproted |
| Selective reporting (reporting bias) | Unclear risk | No protocol could be obtained and the trial did not report all‐cause mortality or serious adverse events. |
| For‐profit bias | Unclear risk | It was unclear how the trial was funded |
| Other bias | Low risk | The trial appeared to be free of other components that could put it at risk of bias.Other bias |
Drott 1988.
| Methods | Randomised clinical trial, Sweden | |
| Participants | 23 hospitalised adults with nonseminomatous germ cell tumours of the testis, at nutritional risk due to trialist indication Male:Female = 23:0 Mean age = 28.5 years. Exclusion criteria: None stated |
|
| Interventions | Experimental group: TPN administered 4 ‐ 5 days before chemotherapy initiation as well as during hospitalisation. Non‐eprotein calories were isocalorically divided between fat (intralipid 20%) and D‐glucose 30%. Control: Spontanous oral intake Co‐intervention: Chemotherapy |
|
| Outcomes | Weight | |
| Study dates | Not stated | |
| Notes | We found no contact information for the author. | |
| Risk of bias | ||
| Bias | Authors' judgement | Support for judgement |
| Random sequence generation (selection bias) | Unclear risk | Not described |
| Allocation concealment (selection bias) | Unclear risk | Not described |
| Blinding of participants and personnel (performance bias) All outcomes | Unclear risk | Not described |
| Blinding of outcome assessment (detection bias) All outcomes | Unclear risk | Not described |
| Incomplete outcome data (attrition bias) All outcomes | Unclear risk | The number of participants with incomplete data was not reported. |
| Selective reporting (reporting bias) | Unclear risk | No protocol could be obtained and the trial did not report all‐cause mortality and serious adverse events. |
| For‐profit bias | Low risk | Supported by the Swedish Cancer Society. |
| Other bias | Low risk | The trial appeared to be free of other components that could put it at risk of bias. |
Duncan 2006.
| Methods | Randomised clinical trial, UK. | |
| Participants | 314 hospitalised adults undergoing surgery for hip fracture, at nutritional risk due to being frail elderly undergoing less than major surgery Male:Female = 0:314. Exclusion criteria: None stated |
|
| Interventions | Experimental group: Received additional personal attention of the dietetic assistants in addition to standard care throughout the length of the intervention (n = 153) Control group: the conventional pattern of nurse‐ and dietitian‐led care, normally provided on the trauma unit (n = 165) | |
| Outcomes | Mortality, length of stay, energy intake and nutritional status | |
| Study dates | May 2000 to August 2003. | |
| Notes | We contacted the authors on 12th December 2015 by email: antony.johansen@wales.nhs.uk. We received no reply. | |
| Risk of bias | ||
| Bias | Authors' judgement | Support for judgement |
| Random sequence generation (selection bias) | Low risk | Randomisation was by sequentially‐numbered, opaque envelopes, in blocks of 10, prepared by a member of staff not directly involved in the trial. |
| Allocation concealment (selection bias) | Low risk | They used sealed envelopes. |
| Blinding of participants and personnel (performance bias) All outcomes | High risk | Not blinded |
| Blinding of outcome assessment (detection bias) All outcomes | Low risk | Outcome assessment was blinded. |
| Incomplete outcome data (attrition bias) All outcomes | Low risk | They partly used intention‐to‐treat, but had a small number of dropouts. |
| Selective reporting (reporting bias) | Unclear risk | No protocol could be obtained and the trial did not report all‐cause mortality or serious adverse events. |
| For‐profit bias | High risk | The trial was funded by British Dietetic Association. |
| Other bias | Low risk | The trial appeared to be free of other components that could put it at risk of bias. |
Dvorak 2004.
| Methods | Randomised clinical trial, Canada | |
| Participants | 17 hospitalised adults who sustained an ASCI with an International Standards for Neurologic Classification of Spinal Cord Injury Impairment Scale15 grades A, B, C., had a last normal neurologic level between C2 and T1, and were admitted to the ASCIU within 72 hours of injury. At nutritional risk due to trauma. Male:Female = 15:2 Mean age = 43 years Exclusion criteria: 1. Had a pre‐existing medical condition such as active bowel disease or a premorbid condition with a significantly diminished nutritional status (e.g. AIDS, cancer). 2. Had surgical resection of a portion of the large or small bowel. 3. Had additional injuries that prevented feeding through a nasogastric tube. 4. Had major chest or abdominal trauma |
|
| Interventions | Experimental: Enteral feeding from 72 hours using continuous enteral feeding. A registered dietitian evaluated the participant's conditions to determine their estimated energy requirements, using the Harris‐Benedict equation. The formulas used were Promote, Jevity, Jevity Plus, and Osmolite HN.(n = 7) Control: No intervention (n = 10) Co‐intervention: Enteral feeding from 120 hrs using Promote, Jevity, Jevity Plus, and Osmolite HN |
|
| Outcomes | Complications (count data), length of stay | |
| Study dates | Not stated | |
| Notes | We did not contact the authors due to the late inclusion of the trial. | |
| Risk of bias | ||
| Bias | Authors' judgement | Support for judgement |
| Random sequence generation (selection bias) | Low risk | Computer program (omnistat) |
| Allocation concealment (selection bias) | Unclear risk | Not described |
| Blinding of participants and personnel (performance bias) All outcomes | Unclear risk | Not described |
| Blinding of outcome assessment (detection bias) All outcomes | Unclear risk | Not described |
| Incomplete outcome data (attrition bias) All outcomes | Unclear risk | The number of participants with incomplete data was not described. |
| Selective reporting (reporting bias) | Unclear risk | No protocol could be obtained and the trial did not report mortality. |
| For‐profit bias | Low risk | Supported by the Mr. and Mrs. P. A. Woodward’s Foundation, Vancouver, BC, Canada. |
| Other bias | Low risk | The trial appeared to be free of other components that could put it at risk of bias. |
Dölp 1987.
| Methods | Randomised clinical trial, Germany | |
| Participants | 20 hospitalised adults undergoing vaginal hysterectomy, at nutritional risk due to major surgery Male:Female = 0:20 Mean age = 53.5 years |
|
| Interventions | Experimental group: Parenteral nutrition (40 ml/kg body weight 3.5% amino acid solution, 5% carbohydrates) for 3 days(n = 10) Control group: Water and electrolytes (standard treatment)(n = 10) |
|
| Outcomes | Plasma proteins, nitrogen balance | |
| Study dates | Not stated | |
| Notes | We found no contact information for the author. | |
| Risk of bias | ||
| Bias | Authors' judgement | Support for judgement |
| Random sequence generation (selection bias) | Unclear risk | Not described |
| Allocation concealment (selection bias) | Unclear risk | Not described |
| Blinding of participants and personnel (performance bias) All outcomes | Unclear risk | Not described |
| Blinding of outcome assessment (detection bias) All outcomes | Unclear risk | Not described |
| Incomplete outcome data (attrition bias) All outcomes | Unclear risk | The number of participants with incomplete data was not described. |
| Selective reporting (reporting bias) | Unclear risk | No protocol could be obtained, and the trial did not report all‐cause mortality or serious adverse events. |
| For‐profit bias | Unclear risk | It was unclear how the trial was funded. |
| Other bias | Low risk | The trial appeared to be free of other components that could put it at risk of bias. |
Elbers 1997.
| Methods | Randomised clinical trial, Germany. | |
| Participants | 20 hospitalised adults undergoing curative resection of gastric cancer, at nutritional risk due to major surgery Male:female = 11:9 Mean age = 64 years |
|
| Interventions | Experimental group: oral supplement with a proteinful, liquid sip feed (3 x 200 ml, 600 kcal/day, 54 g protein/day) starting on day 5 after surgery(n = 10) Control group: no intervention(n = 10) Co‐intervention: standard diet and parenteral nutrition until day 5 |
|
| Outcomes | Plasma proteins, nitrogen balance | |
| Study dates | Not stated | |
| Notes | We found no contact information for the author. | |
| Risk of bias | ||
| Bias | Authors' judgement | Support for judgement |
| Random sequence generation (selection bias) | Unclear risk | Not described |
| Allocation concealment (selection bias) | Unclear risk | Not described |
| Blinding of participants and personnel (performance bias) All outcomes | Unclear risk | Not described |
| Blinding of outcome assessment (detection bias) All outcomes | Unclear risk | Not described |
| Incomplete outcome data (attrition bias) All outcomes | Unclear risk | The number of participants with incomplete data was not reported. |
| Selective reporting (reporting bias) | Unclear risk | No protocol could be obtained and the trial did not report mortality. |
| For‐profit bias | Unclear risk | The trial was supported by a company that might have an interest in a given result (Fresemius AG). |
| Other bias | Low risk | The trial appeared to be free of other components that could put it at risk of bias. |
Elimam 2001.
| Methods | Randomised clinical trial, Sweden | |
| Participants | 14 hospitalised adults undergoing elective open cholecystectomy, at nutritional risk due to major surgery Male:Female = 8:6 Mean age = 42.5 years |
|
| Interventions | Experimental group: TPN immediately after surgery (T 135 kJ/kg body weight every 24 hrs)(n = 7)
Control group: Saline infusion for 24 hrs postoperatively(n = 7) Co‐interventions: Saline infusion during surgery |
|
| Outcomes | Biochemistry | |
| Study dates | Not stated | |
| Notes | We contacted the authors n 19th August 2015 by email: claude.marcus@ki.se. We received no reply. | |
| Risk of bias | ||
| Bias | Authors' judgement | Support for judgement |
| Random sequence generation (selection bias) | Unclear risk | The trial was described as randomised, but it was unclear how the sequence was generated. |
| Allocation concealment (selection bias) | Unclear risk | The trial was described as randomised, but it was unclear how the allocation was concealed. |
| Blinding of participants and personnel (performance bias) All outcomes | Unclear risk | Not described |
| Blinding of outcome assessment (detection bias) All outcomes | Unclear risk | Not described |
| Incomplete outcome data (attrition bias) All outcomes | Unclear risk | The number of participants with incomplete data was not reported. |
| Selective reporting (reporting bias) | Unclear risk | No protocol could be obtained and the trial did not report all‐cause mortality or serious adverse events. |
| For‐profit bias | Low risk | The trial was funded by: "Wera EkstroÈm Foundation, the Frimurare Barnhuset Foundation, the Jerring Foundation, the Swedish Society for Medical Research, and the Swedish Medical Research Council (9941, 04210, 09101).". |
| Other bias | Low risk | The trial appeared to be free of other components that could put it at risk of bias. |
Eneroth 2005.
| Methods | Randomised clinical trial, Sweden | |
| Participants | 80 hospitalised adults admitted for hip surgery, at nutritional risk because of being frail elderly with minor surgery Male:Female = 17:63 Mean age = 81.5 years Exclusion criteria: Multiple fractures, pathologic fractures, malignant disease, inflammatory joint disease, pain or functional impairment other than the hip fracture which might hamper normal mobilisation, depression, dementia, acute psychosis, known alcohol or medication abuse, epileptic seizures, diseases of such severity that they might negatively influenced the supplementary treatment regimen |
|
| Interventions | Experimental group: intravenous supplementary nutrition (1000 kcal/day) for 3 days followed by OSN (400 kcal/day) for 7 days or until discharge(n = 40)
Control group: No intervention(n = 40) Co‐interventions: Standard hospital food and beverage |
|
| Outcomes | Anthropometrics (triceps skin‐fold, arm muscle circumference, BMI), biochemistry, SGA‐screening | |
| Study dates | Not stated | |
| Notes | We contacted the authors on 12th November 2015 by email: magnus.eneroth@med.lu.se. We received a reply (allocation concealment). | |
| Risk of bias | ||
| Bias | Authors' judgement | Support for judgement |
| Random sequence generation (selection bias) | Unclear risk | The trial was described as being randomised, but it was unclear how the sequence was generated. |
| Allocation concealment (selection bias) | Low risk | The trial used sealed, opaque envelopes for allocation concealment. |
| Blinding of participants and personnel (performance bias) All outcomes | High risk | The trial was described as being unblinded. |
| Blinding of outcome assessment (detection bias) All outcomes | High risk | The trial was described as being unblinded. |
| Incomplete outcome data (attrition bias) All outcomes | High risk | There were above 5% dropouts on BMI, and it was unclear who and how these were handled. |
| Selective reporting (reporting bias) | Low risk | No protocol could be obtained. The trial reported mortality and complications. |
| For‐profit bias | Low risk | This trial was supported by a non‐profit organisation (Medical Faculty of Lund University, the County of Skane and the Swedish National Board of Health and Welfare). |
| Other bias | Low risk | The trial appeared to be free of other components that could put it at risk of bias. |
Espaulella 2000.
| Methods | Randomised, placebo‐controlled clinical trial, Spain. | |
| Participants | 171 hospitalised adults hospitalised due to hip fracture, at nutritional risk due to being frail elderly Male:Female = 36:135 Mean age = 82.5 years Exclusion criteria: Younger than 70, advanced dementia, need for IVN, those with pathological fractures or fractures not due to accidental falls |
|
| Interventions | Experimental group: Oral supplement of 20g protein and 800 mg calcium for 60 days(n = 85) Control group: Placebo (n = 86) Co‐interventions: Normal diet |
|
| Outcomes | Mortality, complications, functional recovery, use of walking aids | |
| Study dates | Not stated | |
| Notes | We contacted the authors by email: hguyer@umich.edu. We received no reply. | |
| Risk of bias | ||
| Bias | Authors' judgement | Support for judgement |
| Random sequence generation (selection bias) | Low risk | Computer‐generated in blocks of 4 |
| Allocation concealment (selection bias) | Low risk | Allocation concealment with sealed envelopes |
| Blinding of participants and personnel (performance bias) All outcomes | Low risk | An independent pharmacist assigned the study number, and prepared the appropriate nutritional supplement. |
| Blinding of outcome assessment (detection bias) All outcomes | Unclear risk | It was unclear how the outcome assessment was blinded. |
| Incomplete outcome data (attrition bias) All outcomes | High risk | The pattern of dropouts was not clearly stated, and exceeded 5%. The trial did not use multiple imputation. |
| Selective reporting (reporting bias) | Unclear risk | No protocol could be obtained, and the trial did not report all‐cause mortality or serious adverse events. |
| For‐profit bias | High risk | The trial was funded by Clinical Nutrition SA. |
| Other bias | Low risk | The trial appeared to be free of other components that could put it at risk of bias. |
Essén 1993.
| Methods | Randomised clinical trial, presumably Sweden | |
| Participants | 17 hospitalised adults admitted for elective open cholecystectomy, at nutritional risk due to major surgery Male:Female = 3:14 Mean age = 42.5 Exclusion criteria: metabolically unhealthy |
|
| Interventions | Experimental group: TPN (135 kj/kg body weight/day and 0.2 g/kg body weight/day protein) for 3 days (n = 9) Control group: saline infusion (n = 8) |
|
| Outcomes | Rate of protein synthesis, urine excretion | |
| Study dates | Not stated | |
| Notes | We contacted the author on 12th November 2015 by Linkedin. We received no reply. | |
| Risk of bias | ||
| Bias | Authors' judgement | Support for judgement |
| Random sequence generation (selection bias) | Unclear risk | Not described |
| Allocation concealment (selection bias) | Unclear risk | Not described |
| Blinding of participants and personnel (performance bias) All outcomes | Unclear risk | Not described |
| Blinding of outcome assessment (detection bias) All outcomes | Unclear risk | Not described |
| Incomplete outcome data (attrition bias) All outcomes | Unclear risk | The number of participants with incomplete data was not reported. |
| Selective reporting (reporting bias) | Unclear risk | No protocol could be obtained and the trial did not report all‐cause mortality or serious adverse events |
| For‐profit bias | High risk | The trial was supported by the company Kabi Baxter Infusion AB |
| Other bias | Low risk | The trial appeared to be free of other components that could put it at risk of bias |
Eyer 1993.
| Methods | Randomised clinical trial, USA | |
| Participants | 52 hospitalised adults admitted for blunt trauma ICU, at nutritional risk due to being at an ICU department Male:Female = 22:16 (analysed participants) Mean age = 42.5 years Exclusion criteria: Contra‐indication for enteral feeding, new upper intestinal suture lines, unstable cervical fracture, admission creatinine level > 2 mg/dL, admission bilirubin > 3 mg/dL; pre‐existing malnutrition, use of steroids, radiation, chemotherapy, malignancy, acute spinal cord injury |
|
| Interventions | Experimental group: Early feeding within < 24 hrs (Enteral nutrition: 1.33 kcal/mL, 125:1 nonprotein kcal/g. 58g protein, 158g carbohydrate, 52g fat) (n = 26) Control group: No intervention (n = 26) Co‐interventions: Enteral feeding after 72 hrs |
|
| Outcomes | Urinary catecholamine, cortisol excretion, infections, ICU days, ventilation days, mortality | |
| Study dates | December 1988 to May 1991 | |
| Notes | We could obtain no contact information. | |
| Risk of bias | ||
| Bias | Authors' judgement | Support for judgement |
| Random sequence generation (selection bias) | Unclear risk | The trial was described as being randomised, but it was unclear how the sequence was generated. |
| Allocation concealment (selection bias) | Unclear risk | The trial used sealed envelopes to conceal the allocation, but it was unclear if the envelope was opaque. |
| Blinding of participants and personnel (performance bias) All outcomes | High risk | The trial was described as unblinded. |
| Blinding of outcome assessment (detection bias) All outcomes | Unclear risk | Not described |
| Incomplete outcome data (attrition bias) All outcomes | Unclear risk | The number of participants with incomplete data was not reported. |
| Selective reporting (reporting bias) | Unclear risk | No protocol could be obtained, and the trial did not report all‐cause mortality or serious adverse events. |
| For‐profit bias | High risk | The trial was funded in part by Hoechst‐Roussel. |
| Other bias | Low risk | The trial appeared to be free of other components that could put it at risk of bias. |
Fan 1989.
| Methods | Randomised clinical trial, Hong Kong | |
| Participants | 40 hospitalised adults with oesophageal cancer, at nutritional risk due to major surgery Male:Female = 35:5 Mean age = 65 years Exclusion criteria: Not described. |
|
| Interventions | Experimental group: Pre‐operative parenteral nutrition 14 days before surgery(n = 20)
Control group: No intervention(n = 20) Co‐interventions: Oral feeding |
|
| Outcomes | Nitrogen intake, calorie intake, weight, lymphocyte count before surgery, complications, mortality and albumin | |
| Study dates | April 1985 to November 1986 | |
| Notes | We contacted the authors in September 2015 by email: stfan@hku.hk. We received no reply. | |
| Risk of bias | ||
| Bias | Authors' judgement | Support for judgement |
| Random sequence generation (selection bias) | Unclear risk | It was only described that participants were randomised by "drawing sealed envelopes". |
| Allocation concealment (selection bias) | Unclear risk | It was only described that participants were randomised by "drawing sealed envelopes". |
| Blinding of participants and personnel (performance bias) All outcomes | Unclear risk | Not described |
| Blinding of outcome assessment (detection bias) All outcomes | Unclear risk | Not described |
| Incomplete outcome data (attrition bias) All outcomes | Unclear risk | The number of participants with incomplete data was not described. |
| Selective reporting (reporting bias) | Low risk | There was no protocol. The trial reported all‐cause mortality and complications. |
| For‐profit bias | Unclear risk | It was unclear how the trial was funded. |
| Other bias | Low risk | The trial appeared to be free of other components that could put it at risk of bias. |
Fan 1994.
| Methods | Randomised clinical trial, Hong Kong | |
| Participants | 150 hospitalised adults undergoing resection of hepatocellular carcinoma, at nutritional risk due to major abdominal surgery Male:Female = 109:15 (gender not reported for 26 participants) Mean age = 53.5 years Exclusion criteria: Metastatic disease (exclusion was done after randomisation) |
|
| Interventions | Experimental group: Perioperative parenteral nutrition started 7 days before hepatic resection and continued for 7 days after operation. PN consisted of 1.5 g amino acid a kilogram of body weight, dextrose and lipid emulsion providing 30 kcal a kilogram each day.(n = 75) Control group: No intervention except 5% dextrose in normal saline postoperatively(n = 75) Co‐interventions: Usual oral diet. Cefotaxime at the time of induction and postoperatively, and 25 g of albumin intravenously for 5 days |
|
| Outcomes | All‐cause mortality, complications, morbidity, aspartate aminotransferase, glucose, urea, transferrin, prealbumin, retinol‐binding protein, body weight, midarm circumference, triceps skinfold, grip strength, serum immunoglobulin, hospital stay | |
| Study dates | September 1990 to June 1993 | |
| Notes | We contacted the authors on 23rd June 2015 by email: stfan@hku.hk. We received no reply. | |
| Risk of bias | ||
| Bias | Authors' judgement | Support for judgement |
| Random sequence generation (selection bias) | Unclear risk | Not described |
| Allocation concealment (selection bias) | Unclear risk | Not described |
| Blinding of participants and personnel (performance bias) All outcomes | High risk | The trial was described as unblinded. |
| Blinding of outcome assessment (detection bias) All outcomes | Unclear risk | It was determined by an independent observer, but not described that person was blinded. |
| Incomplete outcome data (attrition bias) All outcomes | High risk | There were above 5% dropouts, and even though it was clearly stated who was removed from the trial, the trial did not use proper methodology to deal with incomplete outcome data. |
| Selective reporting (reporting bias) | Low risk | Seriours adverse events and all‐cause mortality were reported. No protocol could be found. |
| For‐profit bias | Unclear risk | It was unclear how the trial was funded. |
| Other bias | Low risk | The trial appeared to be free of other components that could put it at risk of bias. |
Fasth 1987.
| Methods | Randomised clinical trial, Sweden | |
| Participants | 92 hospitalised adults undergoing major colorectal surgery for carcinoma of the large bowel or inflammatory bowel disease Male:Female = unknown Mean age = unknown Exclusion criteria: none specified |
|
| Interventions | Experimental group: 48 participants were allocated to postoperative TPN for a minimum of 7 days or until an oral diet was tolerated. The TPN was given through a central venous catheter and included infusion of an amino acid solution to a mean nitrogen intake of 215+8 mg/ kg/ day, and 500 ml of a 20% fat emulsion plus 10% dextrose to 45 + 1.6 kcal/ kg/day. The TPN was given for 9.7 + 1.1 days. 20 mmol of phosphate was added daily to everyone in the TPN group. (n = 48)
Control group: No intervention (n = 44) Co‐interventions:10% dextrose solution containing electrolytes according to individual needs until an oral diet was tolerated, these participants were given an IV fusion with a mean of 16 + 0.8 kcal/kg/day for 6.2 + 0.7 days (mean + SD). |
|
| Outcomes | Overall mortality, serious adverse events (septic and non‐septic complications), morbidity | |
| Study dates | Not described | |
| Notes | We could obtain no contact information for the authors. | |
| Risk of bias | ||
| Bias | Authors' judgement | Support for judgement |
| Random sequence generation (selection bias) | Unclear risk | Not described |
| Allocation concealment (selection bias) | Unclear risk | Not described |
| Blinding of participants and personnel (performance bias) All outcomes | Unclear risk | Not described |
| Blinding of outcome assessment (detection bias) All outcomes | Unclear risk | Not described |
| Incomplete outcome data (attrition bias) All outcomes | Unclear risk | The number of participants with incomplete data was not described. |
| Selective reporting (reporting bias) | Unclear risk | No protocol could be obtained and the trial did not report all‐cause mortality or serious adverse events. |
| For‐profit bias | High risk | The trial was funded by Vitrum AB. |
| Other bias | Low risk | The trial appeared to be free of other components that could put it at risk of bias. |
Figuerasfelip 1986.
| Methods | Randomised clinical trial (multicentre study in 4 hospitals), Spain | |
| Participants | 70 hospitalised adults undergoing medium to major surgery, at nutritional risk due to major surgery Male:Female = 38:32 Mean age = 57 years Exclusion criteria: recent loss of more than 10% of body weight, serum albumin of 3 g/dl or less, serum creatinine above 2 mg/dl; diabetes, sepsis or recent haemorrhage, or both |
|
| Interventions | Experimental group: hypocaloric peripheral parenteral nutrition (HPPN), consisting of 1 g of amino acids and 2 g of polyols (sorbitol and xylitol) a kg each day. The solution was started on the 1st postoperative day after normalisation of the haemodynamic status and remained in the study for a minimum of 5 days. (n = 41)
Control group: 1500 ml of 5% glucose and 1500 ml of saline The solution was started on the 1st postoperative day after normalisation of the haemodynamic status and remained in the study for a minimum of 5 days. (n = 29) |
|
| Outcomes | Weight, urinary nitrogen excretion, serum albumin, total proteins, prealbumin, transferrin, glucose, urea, creatinine and cholesterol, hospital stay | |
| Study dates | ||
| Notes | We could obtain no contact information for the authors. | |
| Risk of bias | ||
| Bias | Authors' judgement | Support for judgement |
| Random sequence generation (selection bias) | Unclear risk | Not described |
| Allocation concealment (selection bias) | Low risk | Sealed envelopes |
| Blinding of participants and personnel (performance bias) All outcomes | Unclear risk | Not described |
| Blinding of outcome assessment (detection bias) All outcomes | Unclear risk | Not described |
| Incomplete outcome data (attrition bias) All outcomes | Unclear risk | The number of participants with incomplete data was not reported. |
| Selective reporting (reporting bias) | Unclear risk | No protocol could be obtained. The trial reported complications and mortality. |
| For‐profit bias | Unclear risk | It was unclear how the trial was funded. |
| Other bias | Low risk | The trial appeared to be free of other components that could put it at risk of bias. |
Fletcher 1986a.
| Methods | Randomised clinical trial, Australia | |
| Participants | 28 hospitalised adults admitted for aortic grafting, at nutritional risk due to major surgery Male:Female = 22:6 Mean age = 64 years |
|
| Interventions | Experimental group 1: 1 litre of their daily intravenous fluid requirements given as TPN (250 gm dextrose, 40 gm amino acids)(n = 10) Control group: Standard intravenous fluids postoperatively(n = 5) |
|
| Outcomes | Nitrogen intake and balance, mortality, complications, length of stay | |
| Study dates | Not stated | |
| Notes | Same as Fletcher 1986b. We only reported experimental group 1 vs control here. We contacted the authors 12th December 2015 by email: johnf@med.usyd.edu.au. The author replied that he would give us the information some time in the future. We have not received the information at the time of writing. | |
| Risk of bias | ||
| Bias | Authors' judgement | Support for judgement |
| Random sequence generation (selection bias) | Unclear risk | The trial was described as being randomised, but it was unclear how the sequence was generated. |
| Allocation concealment (selection bias) | Unclear risk | The trial was described as being randomised, but it was unclear how the allocation was concealed. |
| Blinding of participants and personnel (performance bias) All outcomes | High risk | Only experimental group two received an enteral tube. |
| Blinding of outcome assessment (detection bias) All outcomes | Unclear risk | Not described |
| Incomplete outcome data (attrition bias) All outcomes | Unclear risk | The number of participants with incomplete data was not reported. |
| Selective reporting (reporting bias) | Unclear risk | No protocol could be obtained, and the trial did not report serious adverse events properly (only total complications, not by group). |
| For‐profit bias | High risk | The trial was funded by Bristol‐Myers Squibb. |
| Other bias | Low risk | The trial appeared to be free of other components that could put it at risk of bias. |
Fletcher 1986b.
| Methods | Randomised clinical trial, Australia | |
| Participants | 28 adult hospitalised patients admitted for aortic grafting, at nutritional risk due to major surgery Male:Female = 22:6 Mean age: 64 years |
|
| Interventions | Experimental group 2: Enteral nutrition(n = 9) Control group: Standard intravenous fluids postoperatively(n = 4) |
|
| Outcomes | Nitrogen intake and balance, mortality, complications, length of stay | |
| Study dates | ||
| Notes | ||
| Risk of bias | ||
| Bias | Authors' judgement | Support for judgement |
| Random sequence generation (selection bias) | Unclear risk | The trial was described as being randomised, but it was unclear how the sequence was generated. |
| Allocation concealment (selection bias) | Unclear risk | The trial was described as being randomised, but it was unclear how the allocation was concealed. |
| Blinding of participants and personnel (performance bias) All outcomes | High risk | Only experimental group two received an enteral tube. |
| Blinding of outcome assessment (detection bias) All outcomes | Unclear risk | Not described |
| Incomplete outcome data (attrition bias) All outcomes | Unclear risk | The number of participants with incomplete data was not reported. |
| Selective reporting (reporting bias) | Unclear risk | No protocol could be obtained, and the trial did not report serious adverse events properly (only total complications, not by group). |
| For‐profit bias | High risk | The trial was funded by Bristol‐Myers Squibb. |
| Other bias | Low risk | The trial appeared to be free of other components that could put it at risk of bias. |
Foschi 1986.
| Methods | Randomised clinical trial, Italy | |
| Participants | 64 hospitalised adults with obstructive jaundice, with serum bilirubin above 200 µmol undergoing percutaneous transhepatic biliary drainage, at nutritional risk due to undergoing major surgery Male:Female = 39:21 (gender not reported for four participants) Mean age = 63.5 years Exclusion criteria: None stated |
|
| Interventions | Experimental group: Either enteral (19 participants) or parenteral nutrition (4 participants) or both (5 participants). Enteral nutrition was Precision BR with 10% peptides, 0.8% lipid, 81.9% carbohydrate; parenteral nutrition was Freamine III (50% dextrose and 8.5% amino acid). All nutrition was for at least 12 days preoperatively.(n = 28) Control group: no intervention(n = 32) Co‐interventions: percutaneous trans‐hepatic biliary drainage and standard care |
|
| Outcomes | Complications, mortality | |
| Study dates | Not stated | |
| Notes | We contacted the authors on 6th April 2016 by email: Diego.Foschi@unimi.it. We received no reply. | |
| Risk of bias | ||
| Bias | Authors' judgement | Support for judgement |
| Random sequence generation (selection bias) | Unclear risk | Not described |
| Allocation concealment (selection bias) | Unclear risk | Not described |
| Blinding of participants and personnel (performance bias) All outcomes | Unclear risk | Not described |
| Blinding of outcome assessment (detection bias) All outcomes | Unclear risk | Not described |
| Incomplete outcome data (attrition bias) All outcomes | Unclear risk | There are > 5% dropouts and it is unclear how the trial handles missing data. |
| Selective reporting (reporting bias) | Low risk | The trial reports complications and mortality. |
| For‐profit bias | Unclear risk | It was unclear how the trial was funded. |
| Other bias | Low risk | The trial appeared to be free of other components that could put it at risk of bias. |
Førli 2001.
| Methods | Randomised clinical trial (stratified for age and sex), Norway | |
| Participants | 42 underweight hospitalised adults with end‐stage pulmonary disease referred to the hospital to be evaluated for lung transplantation, at nutritional risk due to low BMI Male:Female = 20:22 Mean age = 48.5 years Exclusion criteria: Unwillingness to participate and eat the prescribed diet, too sick to be able to co‐operate and leave of absence due to the possibility of eating meals outside the hospital |
|
| Interventions | Experimental group: Energy‐rich diet 10 MJ/day + offered extra meals(n = 20) Control group: Regular hospital diet 8.5 ‐ 9 MJ/day(n = 22) | |
| Outcomes | Weight, BMI, energy intake, mortality, pulmonary function | |
| Study dates | Not stated | |
| Notes | We could obtain no contact information for the authors. | |
| Risk of bias | ||
| Bias | Authors' judgement | Support for judgement |
| Random sequence generation (selection bias) | Low risk | The trial used random‐number tables. |
| Allocation concealment (selection bias) | Unclear risk | Not described |
| Blinding of participants and personnel (performance bias) All outcomes | High risk | The trial was described as unblinded |
| Blinding of outcome assessment (detection bias) All outcomes | High risk | The trial was described as unblinded |
| Incomplete outcome data (attrition bias) All outcomes | High risk | Above 5% dropouts and the trial did not allow proper methodology for an intention‐to‐treat analysis. |
| Selective reporting (reporting bias) | Unclear risk | No protocol could be obtained, and the trial did not report all‐cause mortality or serious adverse events. |
| For‐profit bias | High risk | The trial was supported by the Research Council of Norway and the Norwegian Heart and Lung Association, as well as financial support from Pharmacia & Upjohn and Abbott Norway A/S. |
| Other bias | Low risk | The trial appeared to be free of other components that could put it at risk of bias. |
Gariballa 1998.
| Methods | Randomised clinical trial, UK | |
| Participants | 42 hospitalised adults admitted with an acute stroke and did not have problems with swallowing. The participants had to be conscious the 1st week after the stroke, and they had to show evidence of undernutrition measured with midarm circumference ˜1 SD below the
mean, and triceps skinfold thickness. Partipants were at nutritional risk due to stroke. Male:Female = 21:21 Mean age = 78 years Exclusion criteria: cerebral and subarachnoid haemorrhage, active gastrointestinal disease, gastric surgery, biochemical evidence of hepatic or renal impairment, uncontrolled heart failure, diagnosed malignancy, sepsis, or persistent swallowing difficulty |
|
| Interventions | Experimental group: Daily oral food supplement for 4 weeks in addition to hospital food(n = 21) The nutritional support consisted of > 400 mL of Fortisip containing 600 kcal and 20 g protein. Control group: Received only hospital food for 4 weeks(n = 21) |
|
| Outcomes | Energy and protein intakes during the intervention period, change in nutritional status, disability, infective complications, length of stay, and mortality | |
| Study dates | Not stated | |
| Notes | We contacted the authors on 19th August 2015 by email: s.gariballa@uaeu.ac.ae . We received no reply. | |
| Risk of bias | ||
| Bias | Authors' judgement | Support for judgement |
| Random sequence generation (selection bias) | Unclear risk | The trial was described as block‐randomised, but it was unclear how the sequence was generated. |
| Allocation concealment (selection bias) | Low risk | Randomisation blocks were kept separately by the dietitian, and allocation to the treatment group was done by telephone. |
| Blinding of participants and personnel (performance bias) All outcomes | High risk | Nurses and participants were not blinded. |
| Blinding of outcome assessment (detection bias) All outcomes | Low risk | Single‐blinded study, with the outcome assessors blinded |
| Incomplete outcome data (attrition bias) All outcomes | High risk | Above 5% dropouts according to weight, and the trial did not allow proper methodology for intention‐to‐treat analysis. |
| Selective reporting (reporting bias) | Low risk | All‐cause mortality and serious adverse events were reported. A protocol was not found. |
| For‐profit bias | Unclear risk | It was unclear how the trial was funded. |
| Other bias | Low risk | The trial appeared to be free of other components that could put it at risk of bias. |
Gariballa 2006.
| Methods | Randomised clinical trial, UK. | |
| Participants | 445 hospitalised adults > 65 of age and able to swallow, at nutritional risk according to the trialist Male:Female = 234:211 Mean age = 76.7 Exclusion criteria: Undergone gastric surgery, diagnosed malabsorption and morbid obesity, in a coma, diagnosed severe dementia, malignancy, living in an institution, already taking supplements |
|
| Interventions | Experimental group: Oral supplements (400 ml 995 kcal)(n = 223) Control group: Placebo (n = 222) Co‐interventions: Standard hospital diet |
|
| Outcomes | 6 months of disability (Barthel score), non‐elective readmission, length of stay in hospital, discharge destination, morbidity (infective complications), mortality, nutritional status | |
| Study dates | Not stated | |
| Notes | We contacted the authors on 19th August 2015 by email: s.gariballa@uaeu.ac.ae . We received no reply. | |
| Risk of bias | ||
| Bias | Authors' judgement | Support for judgement |
| Random sequence generation (selection bias) | Unclear risk | The sequence was generated by the trial statistician but it was unclear how. |
| Allocation concealment (selection bias) | Low risk | Sealed opaque envelopes |
| Blinding of participants and personnel (performance bias) All outcomes | Low risk | The trial was a placebo study. |
| Blinding of outcome assessment (detection bias) All outcomes | Low risk | The trial was placebo and no‐one knew who received placebo or supplement. |
| Incomplete outcome data (attrition bias) All outcomes | High risk | Above 5% dropouts according to BMI, and the trial did not allow proper methodology for intention‐to‐treat analysis. |
| Selective reporting (reporting bias) | Unclear risk | No protocol could be obtained, and the trial did not report all‐cause mortality or serious adverse events. |
| For‐profit bias | Unclear risk | It was unclear how the trial was funded. |
| Other bias | Low risk | The trial appeared to be free of other components that could put it at risk of bias. |
Gazzotti 2003.
| Methods | Randomised clinical trial, Belgium | |
| Participants | 80 hospitalised adults, at nutritional risk based on Mini Nutritional Assessment Male:Female = 19:61 Mean age = 80 years |
|
| Interventions | Experimental group: oral supplements (1.5 kcal/ml 500 kcal and 21 g protein a day in 200 ml cup)(n = 39) Control group: no intervention(n = 41) Co‐interventions: standard diet throughout the hospitalisation and after discharge for 2 months |
|
| Outcomes | All‐cause mortality, weight change, MNA score | |
| Study dates | November 1999 to April 2000 | |
| Notes | We contacted the authors on 23rd June 2015 by email: claire.gazzotti@chrcitadelle.be. We received no reply. | |
| Risk of bias | ||
| Bias | Authors' judgement | Support for judgement |
| Random sequence generation (selection bias) | Unclear risk | The trial was described as being randomised, but it was unclear how the sequence was generated. |
| Allocation concealment (selection bias) | Low risk | The allocation was concealed using sealed envelopes. |
| Blinding of participants and personnel (performance bias) All outcomes | High risk | The trial was described as not blinded. |
| Blinding of outcome assessment (detection bias) All outcomes | High risk | The trial was described as not blinded. |
| Incomplete outcome data (attrition bias) All outcomes | High risk | Above 5% dropouts and the trial did not use proper methodology for intention‐to‐treat analysis. |
| Selective reporting (reporting bias) | Unclear risk | No protocol could be obtained, and the trial did not report all‐cause mortality or serious adverse events. |
| For‐profit bias | Low risk | It was unclear how the trial was funded. |
| Other bias | Low risk | The trial appeared to be free of other components that could put it at risk of bias. |
Gong 2011.
| Methods | Randomised clinical trial, China | |
| Participants | 24 hospitalised adults diagnosed with ulcerative colitis in accordance with China's diagnosis of inflammatory bowel disease and treatment standard of consensus on diagnostic criteria, at nutritional risk due to ulcerative colitis. Male:Female = 12:9 (gender not reported for three participants) Exclusion criteria: Unclear |
|
| Interventions | Experimental group: short peptide enteral nutrition agent of 125 g (100 general, Nutricia Pharmaceutical Co. Ltd, Switzerland) for oral feeding, 4 times each day (n = 11) Control group: no intervention (n = 10) Co‐intervention: mesalazine 1.0 g (ADIS, ethypharm Pharmaceutical Group, France) by mouth, 4 times each day |
|
| Outcomes | Fructose concentration, mannitol concentration, disease activity index, BMI, symptom relief | |
| Study dates | Not stated | |
| Notes | We tried but failed to contact the authors by phone. | |
| Risk of bias | ||
| Bias | Authors' judgement | Support for judgement |
| Random sequence generation (selection bias) | Low risk | The sequence generation was achieved using a random‐numbers table. |
| Allocation concealment (selection bias) | Unclear risk | The trial was described as being randomised, but it was unclear how the allocation was concealed. |
| Blinding of participants and personnel (performance bias) All outcomes | High risk | Participants and personnel were not blinded. |
| Blinding of outcome assessment (detection bias) All outcomes | Unclear risk | The procedure of blinding was insufficiently described. |
| Incomplete outcome data (attrition bias) All outcomes | Unclear risk | The number of participants with incomplete data was not reported. |
| Selective reporting (reporting bias) | Unclear risk | No protocol could be obtained, and the trial did not report all‐cause mortality. |
| For‐profit bias | Unclear risk | It was unclear how the trial was funded. |
| Other bias | Low risk | The trial appeared to be free of other components that could put it at risk of bias. |
Gunerhan 2009.
| Methods | Randomised clinical trial, Turkey | |
| Participants | 38 hospitalised adults with gastrointestinal tumours admitted for surgery, at nutritional risk according to the trialist Male:Female = 9:17 Mean age = 62.5 Exclusion criteria: Diabetes mellitus, renal or hepatic failure or both, active infection, a history of immunosuppressive drug use or clinical signs of vitamin or trace element deficiency |
|
| Interventions | Experimental group: Standard enteral feeding (without RNA and omega3)(n = 19) Control group: Normal feeding planned by a dietitian(n = 19) |
|
| Outcomes | Lymphocyte count, complications, length of hospital stay | |
| Study dates | Not stated | |
| Notes | There was also a 3rd group of immunonutrition, not included in this review. We contacted the authors on 19th August 2015 by email: ygunerhan@gmail.com . We received no reply. | |
| Risk of bias | ||
| Bias | Authors' judgement | Support for judgement |
| Random sequence generation (selection bias) | Unclear risk | Not described |
| Allocation concealment (selection bias) | Unclear risk | Not described |
| Blinding of participants and personnel (performance bias) All outcomes | High risk | Not blinded. Only the experimental group received a tube. |
| Blinding of outcome assessment (detection bias) All outcomes | Unclear risk | Not described |
| Incomplete outcome data (attrition bias) All outcomes | High risk | Above 5% dropouts and the trial did not allow proper methodology for intention‐to‐treat analysis. |
| Selective reporting (reporting bias) | Unclear risk | No protocol could be obtained, and the trial did not report all‐cause mortality or serious adverse events. |
| For‐profit bias | Unclear risk | It was unclear how the trial was funded. |
| Other bias | Low risk | The trial appeared to be free of other components that could put it at risk of bias. |
Gupta 1998.
| Methods | Randomised clinical trial, UK | |
| Participants | 37 hospitalised adults undergoing hepatic or pancreatic surgery due to benign or malignant disease, at nutritional risk due to major surgery. Male:Female = not reported Mean age = not reported. Exclusion criteria = not stated |
|
| Interventions | Experimental group: Received total enteral nutrition immediately postoperatively(n = 15) Control group: No intervention (n = 20) | |
| Outcomes | Oxidative stress | |
| Study dates | Not stated | |
| Notes | We contacted the authors on 12th December 2015 by email: c.d.johnson@soton.ac.uk. The author could not provide any additional information. | |
| Risk of bias | ||
| Bias | Authors' judgement | Support for judgement |
| Random sequence generation (selection bias) | Unclear risk | The trial was described as being randomised, but it was unclear how the sequence was generated. |
| Allocation concealment (selection bias) | Unclear risk | The trial was described as being randomised, but it was unclear how the allocation was concealed. |
| Blinding of participants and personnel (performance bias) All outcomes | Unclear risk | Not described |
| Blinding of outcome assessment (detection bias) All outcomes | Unclear risk | Not described |
| Incomplete outcome data (attrition bias) All outcomes | Unclear risk | The number of participants with incomplete data was not reported. |
| Selective reporting (reporting bias) | Unclear risk | No protocol could be obtained, and the trial did not report all‐cause mortality or serious adverse events. |
| For‐profit bias | Unclear risk | It was unclear how the trial was funded. |
| Other bias | Low risk | The trial appeared to be free of other components that could put it at risk of bias. |
Guy 1995.
| Methods | Randomised clinical trial, country unknown. | |
| Participants | 32 hospitalised adults awaiting liver transplant, at nutritional risk due to malnutrition Male:Female = not reported. Exclusion criteria: admitted to the ICU, grade 4 encephalopathy or with infections precluding liver transplant candidacy |
|
| Interventions | Experimental group: Enteral nutrition. Fed via nasogastric tube with “Impact” (n = not reported)
Control group: No intervention (n = not reported) Co‐interventions: Oral diet with unrestricted protein/calorie supplements |
|
| Outcomes | Nutritional intake, encephalopathy, gastro‐intestinal bleeding, infection, length of hospital stay and mortality | |
| Study dates | Not stated | |
| Notes | We found no contact information for the authors. | |
| Risk of bias | ||
| Bias | Authors' judgement | Support for judgement |
| Random sequence generation (selection bias) | Unclear risk | Not described |
| Allocation concealment (selection bias) | Unclear risk | Not described |
| Blinding of participants and personnel (performance bias) All outcomes | Unclear risk | Not described |
| Blinding of outcome assessment (detection bias) All outcomes | Unclear risk | Not described |
| Incomplete outcome data (attrition bias) All outcomes | Unclear risk | The number of participants with incomplete data was not reported. |
| Selective reporting (reporting bias) | Unclear risk | No protocol could be obtained, and the trial did not report all‐cause mortality or serious adverse events. |
| For‐profit bias | Unclear risk | It was unclear how the trial was funded. |
| Other bias | Low risk | The trial appeared to be free of other components that could put it at risk of bias. |
Ha 2010.
| Methods | Randomised clinical trial, Norway | |
| Participants | 165 hospitalised adults admitted due to stroke, at nutritional risk due to MUST Male:Female = 60:64 (only reported for the participants that completed the study) Mean age = 79 years |
|
| Interventions | Experimental group: Individualised nutritional care aiming to prevent weight loss(n = 84) Control group: Routine practice with use of oral sip feeding, or tube feeding at the discretion of the attending physician(n = 86) |
|
| Outcomes | Number of participants with unintentional weight loss of 5% after 3 months, all‐cause mortality, weight change, quality of life, hand‐grip strength, length of hospital stay | |
| Study dates | May 2005 to December 2007 | |
| Notes | We contacted the authors on 12th December 2015 by email: lisaha@online.no. We received information on serious adverse events and participants lost to follow‐up. | |
| Risk of bias | ||
| Bias | Authors' judgement | Support for judgement |
| Random sequence generation (selection bias) | Low risk | The randomisation sequence was computer‐generated in blocks of 20. |
| Allocation concealment (selection bias) | Low risk | The allocation was sequentially‐numbered, non‐transparent envelopes. |
| Blinding of participants and personnel (performance bias) All outcomes | High risk | The personnel were not blinded to the treatment. |
| Blinding of outcome assessment (detection bias) All outcomes | High risk | The assessor performing the outcome assessment was not blinded. |
| Incomplete outcome data (attrition bias) All outcomes | High risk | Above 5% dropouts and the trial did not allow proper methodology for intention‐to‐treat analysis. |
| Selective reporting (reporting bias) | Low risk | The outcomes described in the protocol, were assessed in the trial. |
| For‐profit bias | Low risk | This study was supported by the South‐Eastern Norway Regional Health Authority and Østfold Hospital Trust. |
| Other bias | Low risk | The trial appeared to be free of other components that could put it at risk of bias. |
Hartgrink 1998.
| Methods | Randomised clinical trial, the Netherlands | |
| Participants | 140 hospitalised adults admitted due to hip fracture and a pressure sore risk score of 8, at nutritional risk due to being frail elderly Male:Female = 16:113 (of participants analysed) Mean age = 83.7 years Exclusion criteria: Pressure sore of grade 2 or more at admission |
|
| Interventions | Experimental group: Tube‐feeding consisting of 1 litre Nutrison Steriflo Energy (1500 kcal/1 energy, 60 gram/1 protein) which was administered with a feeding pump through a nasogastric feeding tube. Tube‐feeding was meant to be given for 2 weeks, and was administered between 21:00 and 05:00 to minimise interference with the normal hospital diet.(n = 70) Control group: No intervention(n = 70) Co‐interventions: Standard hospital diet |
|
| Outcomes | Risk factors for pressure sores, pressure‐sore grade, mortality, serum protein, albumin | |
| Study dates | May 1993 to November 1995 | |
| Notes | We contacted the authors on 19th August 2015 by email: H.H.Hartgrink@lumc.nl. The authors did not keep records of any of the missing information. | |
| Risk of bias | ||
| Bias | Authors' judgement | Support for judgement |
| Random sequence generation (selection bias) | Unclear risk | Not described |
| Allocation concealment (selection bias) | Unclear risk | Not described |
| Blinding of participants and personnel (performance bias) All outcomes | High risk | Participants and physicians were not blinded, since the control group did not receive a naso‐gastric tube. |
| Blinding of outcome assessment (detection bias) All outcomes | Unclear risk | Not described |
| Incomplete outcome data (attrition bias) All outcomes | High risk | The trial had more than 5% of participants with incomplete data, and the trial did not use proper methodology for intention‐to‐treat analysis. |
| Selective reporting (reporting bias) | Unclear risk | No protocol could be obtained, and the trial did not report all‐cause mortality or serious adverse events. |
| For‐profit bias | High risk | "The authors want to thank Nuldcia corp., Netherlands for their support of Nutrison tube feeding and the nasogastric tubes". |
| Other bias | Low risk | The trial appeared to be free of other components that could put it at risk of bias. |
Hasse 1995.
| Methods | Randomised clinical trial, USA | |
| Participants | 50 hospitalised adults undergoing surgery with liver transplant, at nutritional risk due to major surgery Male:Female = 17:14 (completed the study) Mean age = 51 years Exclusion criteria: Dialysis requirements or choledochojejunostomy was performed at the time of transplant. |
|
| Interventions | Experimental group: With feeding‐tube the participants were given full‐strength Reabilan HN (Elan Pharma, Cambridge, MA) 12 hours after surgery. The infusion rate was started at 20 ml/hr and was increased to 40 mL/hr 24 hrs after the initiation of the tube‐feeding. If tolerated 40 mL/hour, the feeding rate was increased to 60 mL/hr 12 hrs after the previous rate increased.(n = 25) Control group: Conventional IV electrolytes(n = 25) Co‐interventions: non‐feeding naso‐gastric tube |
|
| Outcomes | Medical condition, tube‐feeding tolerance, signs of infection, calorie and protein intake, resting energy expenditure, respiratory quotient (RQ), urinary urea nitrogen (UUN), nitrogen balance, hand‐grip strength, length of hospital stay, rehospitalisation, overall cost, weight, chemical assays | |
| Study dates | Not stated | |
| Notes | We contacted the authors on 19th August 2015 by email: jm.hasse@baylorhealth.edu . We received no reply. | |
| Risk of bias | ||
| Bias | Authors' judgement | Support for judgement |
| Random sequence generation (selection bias) | Unclear risk | Not described |
| Allocation concealment (selection bias) | Unclear risk | Not described |
| Blinding of participants and personnel (performance bias) All outcomes | Unclear risk | Not described |
| Blinding of outcome assessment (detection bias) All outcomes | Unclear risk | Not described |
| Incomplete outcome data (attrition bias) All outcomes | High risk | The 2 groups could not be described as similar, and the dropout rate was above 5%. |
| Selective reporting (reporting bias) | Unclear risk | No protocol could be obtained, and the trial did not report all‐cause mortality. |
| For‐profit bias | High risk | The study was supported in part by grants from the Di‐etitians in Nutrition Support Practice Group Member Research Award, Elan Pharma. |
| Other bias | Low risk | The trial appeared to be free of other components that could put it at risk of bias. |
Heidegger 2013.
| Methods | Randomised clinical trial, Switzerland | |
| Participants | 305 hospitalised adults admitted to ICU for more than 3 days. They were expected to stay for more than 5 days at the ICU and to survive for more than 7 days. They received less than 60% of their energy target and were at nutritional risk due to being in a ICU. Male:Female = 215:90 Mean age = 60.5 years Exclusion criteria: Receiving PN, had persistent gastro‐intestinal dysfunction and ileus, were pregnant, refused to consent, or had been readmitted to the ICU after previous randomisation |
|
| Interventions | Experimental group: supplemental parenteral feeding, 0.62 – 1.37 kcal/mL of energy (20% proteins, 29% lipids (15% medium‐chain triglycerides), and 51% carbohydrates) on day 3(n = 153) Control group: no intervention on day 3(n = 152) Co‐interventions: enteral nutrition |
|
| Outcomes | Nosocomial infections, number of antibiotic‐free days, duration of invasive and non‐invasive mechanical ventilation, length of stay in the ICU and hospital, mortality in ICU, general mortality, duration of renal replacement therapy, glycaemia (crude blood glucose concentration and area under the curve (AUC)), phosphataemia, concentration of C‐reactive protein, liver test results, and drug administration (insulin, steroids, and antifungal agents). | |
| Study dates | Not stated | |
| Notes | We contacted the authors on 19th August 2015 by email: claude.pichard@unige.ch. We received an initial reply, but obtained no further information. | |
| Risk of bias | ||
| Bias | Authors' judgement | Support for judgement |
| Random sequence generation (selection bias) | Low risk | Computer‐generated randomisation sequence |
| Allocation concealment (selection bias) | Low risk | Sequentially‐numbered, sealed, opaque envelopes |
| Blinding of participants and personnel (performance bias) All outcomes | High risk | Treatment providers and participants were unblinded. |
| Blinding of outcome assessment (detection bias) All outcomes | Low risk | The statistician did not know to which group the participants were allocated. |
| Incomplete outcome data (attrition bias) All outcomes | Low risk | There were under 5% of participants with incomplete outcome data. |
| Selective reporting (reporting bias) | High risk | The trial did not report ICU complications as stated in the protocol. |
| For‐profit bias | High risk | Financial support came from the public Foundation Nutrition 2000Plus, APSI‐ICU quality funds of the Geneva University Hospital, Internal Service Resources of the Lausanne University Hospital, and from unconditional and non‐restrictive research grants from Baxter and Fresenius Kabi, representing less than 25% of the global expenses. RT has received a research award from the academic Société Nationale Française de Gastroentérologie. The sponsors did not place any restrictions on the study design. |
| Other bias | Low risk | The trial appeared to be free of other components that could put it at risk of bias. |
Heim 1985.
| Methods | Randomised clinical trial, Germany | |
| Participants | 36 hospitalised adults with advanced colorectal carcinoma, at nutritional risk due to trialist indication Male:Female = 20:16 Mean age = 52 years Exclusion criteria: None stated |
|
| Interventions | Experimental group: a standard 10% amino acid solution, 40% dextrose and 10% fat solution over a 10‐day period(n = 18) Control group: No intervention(n = 18) Co‐intervention: chemotherapy |
|
| Outcomes | Survival (not usable), side effects of parenteral nutrition | |
| Study dates | Not stated | |
| Notes | We could obtain no contact information for the authors. | |
| Risk of bias | ||
| Bias | Authors' judgement | Support for judgement |
| Random sequence generation (selection bias) | Unclear risk | Not described |
| Allocation concealment (selection bias) | Unclear risk | Not described |
| Blinding of participants and personnel (performance bias) All outcomes | Unclear risk | Not described |
| Blinding of outcome assessment (detection bias) All outcomes | Unclear risk | Not described |
| Incomplete outcome data (attrition bias) All outcomes | Unclear risk | The number of participants with incomplete data was not reported. |
| Selective reporting (reporting bias) | Low risk | The trial reported survival and side effects. |
| For‐profit bias | Unclear risk | It was unclear how the trial was funded. |
| Other bias | Low risk | The trial appeared to be free of other components that could put it at risk of bias. |
Hendry 2010.
| Methods | Randomised clinical trial, factorial design | |
| Participants | 74 hospitalised adults undergoing liver resection, at nutritional risk due to major surgery Male:Female = 38:30 (gender not reported for six participants) Median age = 62 years Exclusion criteria: Patients with a BMI of < 18 or greater than 30 kg/m2, pre‐existing conditions limiting mobility, underlying cirrhotic liver disease, a history of liver resection, and those in whom bile duct excision and central or extended hepatectomy was planned before randomisation |
|
| Interventions | Experimental group: Received 800 ml oral carbohydrate loading drink (Nutricia Preop); Nutricia Clinical Care, Trowbridge, UK) at 22.00 hrs the night before surgery and 400 ml at 06.00 hrs on the morning of surgery. In addition, they received ONS (2 cartons a day comprising 400 ml, 600 kcal, 24 g protein, Nutricia Fortisip; Nutricia Clinical Care) from the day of surgery until day 30 (n = 36) Control group: no intervention (n = 38) Co‐interventions: standard care, laxatives (only in 2 of the arms) |
|
| Outcomes | Mortality, morbidity, gastric emptying, length of hospital stay | |
| Study dates | Not stated | |
| Notes | We contacted the authors on 29th April 2016 by email: paul.hendry@ed.ac.uk. We have not received a reply at the time of writing. | |
| Risk of bias | ||
| Bias | Authors' judgement | Support for judgement |
| Random sequence generation (selection bias) | Low risk | The trial used a random‐numbers table. |
| Allocation concealment (selection bias) | Low risk | The trial used sealed opaque envelopes. |
| Blinding of participants and personnel (performance bias) All outcomes | High risk | Not blinded |
| Blinding of outcome assessment (detection bias) All outcomes | High risk | Not blinded |
| Incomplete outcome data (attrition bias) All outcomes | Unclear risk | There were above 5% dropouts and it was unclear how the trial accounted for missing data. |
| Selective reporting (reporting bias) | Low risk | No prepublished protocol could be obtained but the trial reported mortality and morbidity (NCT00538954). |
| For‐profit bias | High risk | Nutricia Preop (Nutricia Nutridrink in The Netherlands) and Nutricia Fortisip drinks were supplied by Nutricia Clinical Care (Trowbridge, UK) and Nutricia Nederland (Advanced Medical Nutrition, Zoetermeer, The Netherlands). |
| Other bias | Low risk | The trial appeared to be free of other components that could put it at risk of bias. |
Henriksen 2003a.
| Methods | Randomised clinical trial, Denmark | |
| Participants | 58 hospitalised adults admitted for bowel resection, at nutritional risk due to major surgery Male:Female = 21:37 Mean age = 63.7 years Exclusion criteria: inflammatory bowel disease, disseminated malignant disease, previous treatment for intra‐abdominal cancer, serious cardiovascular disease (New York Heart Association angina class III and IV) diabetes mellitus, disabling mental disease, dementia or a history of alcoholic, medicine or drug abuse |
|
| Interventions | The night before surgery: Experimental group 1: 12.5 g/100 ml carbohydrate (maltodextrin) drink (n = 16) Experimental group 2: 2.5 g/100 ml carbohydrate (maltodextrin) and 3.5 g/100 ml of hydrolyzed soy protein (n = 16) Control group: No treatment (n = 8) Co‐interventions: Pure water until 3 hrs before induction of anaesthesia + basic postoperative regimen |
|
| Outcomes | Voluntary grip and quadriceps strength, body composition, pulmonary function, VAS‐score of 8 parameters of well‐being, muscle biopsies and insulin, glucagon, IGF‐1 and free fatty acids | |
| Study dates | Not stated | |
| Notes | We contacted the authors on 19th August 2015 by email: gaarden@dadlnet.dk . We received a reply. | |
| Risk of bias | ||
| Bias | Authors' judgement | Support for judgement |
| Random sequence generation (selection bias) | Unclear risk | Not described |
| Allocation concealment (selection bias) | Unclear risk | The trial used sealed envelopes for allocation but it was unclear if they were opaque. |
| Blinding of participants and personnel (performance bias) All outcomes | Unclear risk | Not described |
| Blinding of outcome assessment (detection bias) All outcomes | Unclear risk | Nutritional status was described as blinded, but it was unclear how the rest of the outcomes were assessed. |
| Incomplete outcome data (attrition bias) All outcomes | Unclear risk | The number of dropouts exceeds 5%. The dropouts were described, but it was unclear from which group they came. |
| Selective reporting (reporting bias) | Unclear risk | No protocol could be obtained, and the trial did not report all‐cause mortality or serious adverse events. |
| For‐profit bias | Unclear risk | It was unclear how the trial was funded. |
| Other bias | Low risk | The trial appeared to be free of other components that could put it at risk of bias. |
Henriksen 2003b.
| Methods | Randomised clinical trial, Denmark | |
| Participants | 58 hospitalised adults admitted for bowel resection, at nutritional risk due to major surgery. Male:Female = 21:37 Mean age = 63.7 years Exclusion criteria: inflammatory bowel disease, disseminated malignant disease, previous treatment for intra‐abdominal cancer, serious cardiovascular disease (New York Heart Association angina class III and IV) diabetes mellitus, disabling mental disease, dementia or a history of alcoholic, medicine or drug abuse |
|
| Interventions | The night before surgery: Experimental group 1: 12.5 g/100 ml carbohydrate (maltodextrin) drink (n = 16) Experimental group 2: 2.5 g/100 ml carbohydrate (maltodextrin) and 3.5 g/100 ml of hydrolyzed soy protein (n = 16) Control group: No treatment (n = 8) Co‐interventions: Pure water until 3 hrs before induction of anaesthesia + basic postoperative regimen |
|
| Outcomes | Voluntary grip and quadriceps strength, body composition, pulmonary function, VAS‐score of 8 parameters of well‐being, muscle biopsies and insulin, glucagon, IGF‐1 and free fatty acids | |
| Study dates | Not stated | |
| Notes | We report here group 2 vs control group. We contacted the authors on 19th August 2015 by email: gaarden@dadlnet.dk . We received a reply. | |
| Risk of bias | ||
| Bias | Authors' judgement | Support for judgement |
| Random sequence generation (selection bias) | Unclear risk | Not described |
| Allocation concealment (selection bias) | Unclear risk | The trial used sealed envelopes for allocation but it was unclear if they were opaque |
| Blinding of participants and personnel (performance bias) All outcomes | Unclear risk | There was no description of blinding of participants and personnel. |
| Blinding of outcome assessment (detection bias) All outcomes | Unclear risk | Nutritional status was described as blinded, but it was unclear how the rest of the outcomes were assessed. |
| Incomplete outcome data (attrition bias) All outcomes | Unclear risk | The number of dropouts exceeds 5%. The dropouts were described, but it was unclear from which group they came. |
| Selective reporting (reporting bias) | Unclear risk | No protocol could be obtained, and the trial did not report all‐cause mortality or serious adverse events. |
| For‐profit bias | Unclear risk | It was unclear how the trial was funded. |
| Other bias | Low risk | The trial appeared to be free of other components that could put it at risk of bias. |
Herndon 1987.
| Methods | Randomised clinical trial, USA | |
| Participants | 28 hospitalised adults with burns > 50% of total body surface area, at nutritional risk due to trauma Mean age = 36 years |
|
| Interventions | Experimental group: supplementary TPN (n = 13)
Control group: No intervention (n = 15) Co‐interventions: peripheral intravenous fluids to meet fluid requirements |
|
| Outcomes | Caloric intake, immune function, liver function, serum albumin, mortality | |
| Study dates | Not stated | |
| Notes | We contacted the authors on 19th August 2015 by email: dherndon@utmb.edu. We received no reply. | |
| Risk of bias | ||
| Bias | Authors' judgement | Support for judgement |
| Random sequence generation (selection bias) | Unclear risk | Not described |
| Allocation concealment (selection bias) | Unclear risk | Not described |
| Blinding of participants and personnel (performance bias) All outcomes | Unclear risk | Not described |
| Blinding of outcome assessment (detection bias) All outcomes | Unclear risk | Not described |
| Incomplete outcome data (attrition bias) All outcomes | Unclear risk | The number of participants with incomplete data was not reported. |
| Selective reporting (reporting bias) | Unclear risk | No protocol could be obtained, and the trial did not report all‐cause mortality or serious adverse events. |
| For‐profit bias | Unclear risk | It was unclear how the trial was funded. |
| Other bias | Low risk | The trial appeared to be free of other components that could put it at risk of bias. |
Heys 1991.
| Methods | Randomised clinical trial, UK | |
| Participants | 18 hospitalised adults admitted for localised colorectal carcinoma, at nutritional risk due to major surgery Male:Female = not stated Mean age = 72 years Exclusion criteria: Metastasis |
|
| Interventions | Experimental group: 20 hours of intravenous nutrition. Amino acids 1.25 g/kg body weight and 25 kcal/kg body weight (40% dextrose and 60% lipid)(n = 9)
Control group: Fluids only(n = 9) Co‐interventions: Vitamins and electrolytes + low‐residue diet given days 2 and 3 before surgery |
|
| Outcomes | Tumour protein synthesis rate | |
| Study dates | Not stated | |
| Notes | We contacted the authors on 19th August 2015 by email: s.d.heys@abdn.ac.uk . We received no reply. | |
| Risk of bias | ||
| Bias | Authors' judgement | Support for judgement |
| Random sequence generation (selection bias) | Unclear risk | Not described |
| Allocation concealment (selection bias) | Unclear risk | Not described |
| Blinding of participants and personnel (performance bias) All outcomes | Unclear risk | Not described |
| Blinding of outcome assessment (detection bias) All outcomes | Unclear risk | Not described |
| Incomplete outcome data (attrition bias) All outcomes | Low risk | There were below 5% dropouts. |
| Selective reporting (reporting bias) | Unclear risk | No protocol could be obtained and the trial did not report all‐cause mortality or serious adverse events. |
| For‐profit bias | High risk | "We thank the Wellcome Trust, Grampian Health Board, Scottish Hospital Endowment Research Trust and Nestec Ltd." The trial was supported by a company that might have an interest in a given result. |
| Other bias | Low risk | The trial appeared to be free of other components that could put it at risk of bias. |
Hickson 2004.
| Methods | Randomised clinical trial, UK | |
| Participants | 592 hospitalised adults admitted to 3 Medicine for the Elderly wards, at nutritional risk due to being frail elderly Male:Female = 219:373 Mean age = 82 years Exclusion criteria: unable to take food orally (e.g. unconscious, severe dysphagia), those not expected to survive the current admission, those who had discharge planned within 4 days, and those who were readmitted and had already participated in the trial |
|
| Interventions | Experimental group: This group received additional nutritional care in the form of feeding support from a trained healthcare assistant (HCA), which began as soon as the participant was randomised. The health assistants helped in the following ways: 1. Identified reduced food intake and other risk factors for malnutrition and planned care to resolve these problems. 2. Encouraged and enabled participants in feeding and supported the ward staff in this role. 3. Offered snacks and drinks throughout the day.(n = 292) Control group:Usual ward care(n = 300) Co‐interventions: prescribed medical and nutritional therapy |
|
| Outcomes | Mortality in hospital, infection rate, intravenous or subcutaneous fluids or both, length of hospital stay | |
| Study dates | Not stated | |
| Notes | We contacted the authors in September 2015 by email: mary.hickson@imperial.nhs.uk. We received a reply with the caloric intake. | |
| Risk of bias | ||
| Bias | Authors' judgement | Support for judgement |
| Random sequence generation (selection bias) | Low risk | Prepared by an independent group |
| Allocation concealment (selection bias) | Low risk | The randomisation code was concealed using sealed envelopes. |
| Blinding of participants and personnel (performance bias) All outcomes | High risk | Not possible to blind |
| Blinding of outcome assessment (detection bias) All outcomes | High risk | The trial stated that the researcher in charge of outcome assessment was not blinded. |
| Incomplete outcome data (attrition bias) All outcomes | Unclear risk | The analysis was on an intention‐to‐ treat basis, but the method was not further described. There were many drop‐outs described. |
| Selective reporting (reporting bias) | Unclear risk | No protocol was found, but the study reported all‐cause mortality (while hospitalised). |
| For‐profit bias | Low risk | The trial was funded by the NHS. |
| Other bias | Low risk | The trial appeared to be free of other components that could put it at risk of bias. |
Hill 2002.
| Methods | Randomised clinical trial, USA | |
| Participants | 46 hospitalised multitrauma adults having an injury severity score (ISS) > 20, at nutritional risk due to being being multitrauma patient. Male:Female = unclear Mean age = 41 years Exclusion criteria: Not described |
|
| Interventions | Experimental group: Enteral nutrition within 24 hours of injury(n = 22) Control group: Enteral nutrition started at day 5 post‐injury(n = 24) | |
| Outcomes | Mortality, IL6, CRP, pneumonia | |
| Study dates | Not stated | |
| Notes | There was an additional group which did not fit our inclusion criteria. | |
| Risk of bias | ||
| Bias | Authors' judgement | Support for judgement |
| Random sequence generation (selection bias) | Unclear risk | Not described |
| Allocation concealment (selection bias) | Unclear risk | Not described |
| Blinding of participants and personnel (performance bias) All outcomes | Unclear risk | Not described |
| Blinding of outcome assessment (detection bias) All outcomes | Unclear risk | Not described |
| Incomplete outcome data (attrition bias) All outcomes | Unclear risk | Not described |
| Selective reporting (reporting bias) | Unclear risk | No protocol could be obtained, and the trial did not report on serious adverse events (only pneumonia). |
| For‐profit bias | Unclear risk | It was unclear how the trial was funded. |
| Other bias | Low risk | The trial appeared to be free of other components that could put it at risk of bias. |
Hoffmann 1988.
| Methods | Randomised clinical trial, Denmark | |
| Participants | 102 hospitalised adults undergoing surgery due to colorectal cancer, at nutritional risk due to major surgery Male:Female = not described Mean age = not reported. Exclusion criteria: Previous cancer diagnosis and hormonal disorders |
|
| Interventions | Experimental group: Received TPN containing 4400 kcal a day, 45% fat/55% glucose, starting 3 days preoperatively and continued until 7 days post‐operation, except for the day of the operation(n = 51)
Control group: No intervention(n = 51) Co‐interventions: Usual treatment |
|
| Outcomes | Postoperative complications, mortality, length of hospital stay and weight loss | |
| Study dates | 1984‐1986 | |
| Notes | We could obtain no contact information for the authors. | |
| Risk of bias | ||
| Bias | Authors' judgement | Support for judgement |
| Random sequence generation (selection bias) | Unclear risk | Not described |
| Allocation concealment (selection bias) | Unclear risk | Not described |
| Blinding of participants and personnel (performance bias) All outcomes | Unclear risk | Not described |
| Blinding of outcome assessment (detection bias) All outcomes | Unclear risk | Not described |
| Incomplete outcome data (attrition bias) All outcomes | Unclear risk | The pattern of dropouts was reported to be differently in the 2 intervention groups. |
| Selective reporting (reporting bias) | Low risk | No protocol available, but all‐cause mortality and serious adverse events are reported. |
| For‐profit bias | Unclear risk | It was unclear how the trial was funded. |
| Other bias | Low risk | The trial appeared to be free of other components that could put it at risk of bias. |
Holter 1977.
| Methods | Randomised clinical trial, USA | |
| Participants | 56 hospitalised adults undergoing open abdominal surgery, at nutritional risk due to major surgery Male:Female = not described Exclusion criteria: not described |
|
| Interventions | Experimental group: parenteral nutrition. TPN began 72 hrs prior to surgery. At the time of surgery participants were receiving 80 cc/hr or approximately 2000 calories/day with approximately 80 g of protein equivalent, either in the form of casein hydrolysate or crystalline amino acids. Hyperalimentation was continued for a 10‐day period postoperatively or until 1500 calories were achieved by oral intake. (n = 30) Control group: Treatment as usual with blood and albumin infusions, as is routine. (n = 26) |
|
| Outcomes | Mortality, complications, weight, serum albumin levels and time needed to archive full peri‐oral nutrition | |
| Study dates | Not stated | |
| Notes | We could not find any contact information for the authors. | |
| Risk of bias | ||
| Bias | Authors' judgement | Support for judgement |
| Random sequence generation (selection bias) | Low risk | Participants were randomised from a random‐numbers table. |
| Allocation concealment (selection bias) | Unclear risk | Not described |
| Blinding of participants and personnel (performance bias) All outcomes | Unclear risk | Not described |
| Blinding of outcome assessment (detection bias) All outcomes | Unclear risk | Not described |
| Incomplete outcome data (attrition bias) All outcomes | Unclear risk | The number of participants with incomplete data was not reported. |
| Selective reporting (reporting bias) | Low risk | No protocol could be obtained, but the trial reported serious adverse events and mortality. |
| For‐profit bias | Unclear risk | It was unclear how the trial was funded. |
| Other bias | Low risk | The trial appeared to be free of other components that could put it at risk of bias. |
Holyday 2012.
| Methods | Randomised clinical trial, Australia | |
| Participants | 143 hospitalised adults admitted to the geriatric ward due to falls, delirium and polypharmacy problems, at nutritional risk due to being elderly frail Male:Female = 61:82 Mean age = 83.5 Exclusion criteria: expected length of stay < 72 hrs, palliative unable to be nutritionally assessed (non‐English‐speaking, severe dementia/confusion, non‐co‐operative/refused), already seen by a dietitian during the admission (e.g. transferred from another ward) or enrolled in the study during a previous admission |
|
| Interventions | Experimental group: General nutrition support. The Malnutrition Care Plan involved the modification of hospital meals (texture modification and fortification), prescription of nutrition supplements, i.e. nutrient‐dense drinks and snacks including commercial supplements, flagging for assistance with meals by ward‐based staff, education of participants and their caregivers regarding optimisation of nutrition intake and referral to other health professionals for discharge planning. The Malnutrition Care Plan was tailored to individual requirements based on the clinical dietitian’s assessment and prescription.(n = 71) Control group: Treatment as usual(n = 72) |
|
| Outcomes | Weight, mortality, length of stay and cost of hospital admission | |
| Study dates | Between April 2006 and September 2006 | |
| Notes | We contacted the authors on 9th June 2015 by email: Margaret.Holyday@sesiahs.health.nsw.gov.au. We received no reply. | |
| Risk of bias | ||
| Bias | Authors' judgement | Support for judgement |
| Random sequence generation (selection bias) | Low risk | Participants were randomised by computerised random‐number generator. |
| Allocation concealment (selection bias) | Unclear risk | Not described |
| Blinding of participants and personnel (performance bias) All outcomes | High risk | Participants and personnel could not be blinded. |
| Blinding of outcome assessment (detection bias) All outcomes | Unclear risk | Not described |
| Incomplete outcome data (attrition bias) All outcomes | Unclear risk | The number of participants with incomplete data was not reported. |
| Selective reporting (reporting bias) | Unclear risk | No protocol could be obtained and the trial did not report serious adverse events. |
| For‐profit bias | High risk | The trial was funded by the Gut Foundation (Randwick, Australia) and funded by Pharmatel Fresenius Kabi Pty Ltd. |
| Other bias | Low risk | The trial appeared to be free of other components that could put it at risk of bias. |
Houwing 2003.
| Methods | Randomised clinical trial, the Netherlands | |
| Participants | 103 hospitalised adults admitted for hip fracture and PO‐score > 8, at nutritional risk due to being frail elderly Male:Female = 19:84 Mean age = 81 years Exclusion criteria: Terminal care, metastatic hip fracture, insulin‐dependent diabetes, renal disease (creatinine > 176 mmol/l), hepatic disease, morbid obesity (BMI > 40), need for therapeutic diet incompatible with supplementation, and pregnancy or lactating |
|
| Interventions | Experimental group: 400 ml high‐protein nutritional supplement enriched with arginine, zinc and antioxidants with energy: 500 kcal, 40 g of protein (n = 51) Control group: 400 ml placebo (non‐caloric, water‐based drink only sweeteners, colourants and flavourings) Look and taste of the supplements were not exactly identical, but were given in similar, blinded packages to mask the differences. Participants received 400 ml daily between regular meals of either the study or placebo supplement starting immediately postoperatively for a period of 4 weeks or until discharge. (n = 52) Co‐intervention: regular diet (oral) |
|
| Outcomes | Incidence of pressure ulcers and maximum wound size | |
| Study dates | Between April 1998 and December 1999 | |
| Notes | We contacted the authors by Linkedin. We received an initial response but no further response. | |
| Risk of bias | ||
| Bias | Authors' judgement | Support for judgement |
| Random sequence generation (selection bias) | Unclear risk | Not described |
| Allocation concealment (selection bias) | Unclear risk | Not described |
| Blinding of participants and personnel (performance bias) All outcomes | Low risk | The control group received a placebo drink. |
| Blinding of outcome assessment (detection bias) All outcomes | Unclear risk | It was unclear how the outcome assessment was performed. |
| Incomplete outcome data (attrition bias) All outcomes | Low risk | There were below 5% dropouts and participants with incomplete data. |
| Selective reporting (reporting bias) | Unclear risk | No protocol could be obtained, and the trial did not report all‐cause mortality or serious adverse events. |
| For‐profit bias | High risk | The trial was funded by a company that might have conflict of interest (Numico). |
| Other bias | Low risk | The trial appeared to be free of other components that could put it at risk of bias. |
Hsu 2000a.
| Methods | Randomised clinical trial, Taiwan | |
| Participants | 80 hospitalised adults admitted for colon resection due to colorectal cancer, at nutritional risk due to major surgery Male:Female = 44:36 Mean age = 61.6 years Exclusion criteria: previous gastric resection, previous vagotomy, and active peptic ulcer |
|
| Interventions | Experimental group 1: Received enteral nasogastric feeding, started from 500 kcal/day, and if tolerated increased to 1500 kcal/day, as well as Osmolite HN (protein: 4.2 g, fat: 3.5 g, carbohydrate: 13.4 g)/100 kcal (n = 20)
Experimental group 2: Received enteral nasogastric feeding, started from 500 kcal/day, and if tolerated increased to 1500 kcal/day, as well as Pulmocare (protein: 4.2 g, fat: 6.1 g, carbohydrate: 7 g)/100 kcal(n = 20) Experimental group 3: Received enteral nasogastric feeding, started from 500 kcal/day, and if tolerated increased to 1500 kcal/day, as well as AlitraQ (protein: 4.2 g, fat: 2 .1 g, carbohydrate: 18.2 g)/100 kcal. (n = 20) Control group: No oral intake for a week(n = 20) |
|
| Outcomes | Change of intragastric pH after surgery and change of intragastric pH after tube‐feeding | |
| Study dates | April 1997 to February 1998 | |
| Notes | Same trial as Hsu 2000b and Hsu 2000c with the results from experimental group 1 vs control. We contacted the authors on 13th December 2015 by email: tzuchi@ms2.mmh.org.tw. We received no reply. | |
| Risk of bias | ||
| Bias | Authors' judgement | Support for judgement |
| Random sequence generation (selection bias) | Unclear risk | Not described |
| Allocation concealment (selection bias) | Unclear risk | Not described |
| Blinding of participants and personnel (performance bias) All outcomes | Unclear risk | Not described |
| Blinding of outcome assessment (detection bias) All outcomes | Unclear risk | Not described |
| Incomplete outcome data (attrition bias) All outcomes | Unclear risk | The number of participants with incomplete data was not reported. |
| Selective reporting (reporting bias) | Unclear risk | The trial did not properly describe mortality,or serious adverse events. |
| For‐profit bias | Unclear risk | It was unclear how the trial was funded. |
| Other bias | Low risk | The trial appeared to be free of other components that could put it at risk of bias. |
Hsu 2000b.
| Methods | Randomised clinical trial, Taiwan | |
| Participants | 80 hospitalised adults admitted for colon resection due to colorectal cancer, at nutritional risk due to major surgery. Male:Female = 44:36 Mean age = 61.6 years Exclusion criteria: previous gastric resection, previous vagotomy, and active peptic ulcer |
|
| Interventions | Experimental group 1: Received enteral nasogastric feeding, started from 500 kcal/day, and if tolerated increased to 1500 kcal/day, as well as Osmolite HN (protein: 4.2 g, fat: 3.5 g, carbohydrate: 13.4 g)/100 kcal(n = 20)
Experimental group 2: Received enteral nasogastric feeding, started from 500 kcal/day, and if tolerated increased to 1500 kcal/day, as well as Pulmocare (protein: 4.2 g, fat: 6.1 g, carbohydrate: 7 g)/100 kcal.(n = 20) Experimental group 3: Received enteral nasogastric feeding, started from 500 kcal/day, and if tolerated increased to 1500 kcal/day, as well as AlitraQ (protein: 4.2 g, fat: 2.1 g, carbohydrate: 18.2 g)/100 kcal(n = 20) Control group: No oral intake for a week (n = 20) |
|
| Outcomes | Change of intragastric pH after surgery and change of intragastric pH after tube‐feeding | |
| Study dates | April 1997 to February 1998 | |
| Notes | Same trial as Hsu 2000a and Hsu 200c with the results from experimental group 2 vs control. We contacted the authors on 13th December 2015 by email: tzuchi@ms2.mmh.org.tw. We received no reply. | |
| Risk of bias | ||
| Bias | Authors' judgement | Support for judgement |
| Random sequence generation (selection bias) | Unclear risk | Not described |
| Allocation concealment (selection bias) | Unclear risk | Not described |
| Blinding of participants and personnel (performance bias) All outcomes | Unclear risk | Not described |
| Blinding of outcome assessment (detection bias) All outcomes | Unclear risk | Not described |
| Incomplete outcome data (attrition bias) All outcomes | Unclear risk | The number of participants with incomplete data was not reported. |
| Selective reporting (reporting bias) | Unclear risk | The trial did not properly describe mortality, or serious adverse events. |
| For‐profit bias | Unclear risk | It was unclear how the trial was funded. |
| Other bias | Low risk | The trial appeared to be free of other components that could put it at risk of bias. |
Hsu 2000c.
| Methods | Randomised clinical trial, Taiwan | |
| Participants | 80 hospitalised adults admitted for colon resection due to colorectal cancer, at nutritional risk due to major surgery Male:Female = 44:36 Mean age = 61.6 years Exclusion criteria: previous gastric resection, previous vagotomy, and active peptic ulcer |
|
| Interventions | Experimental group 1: Received enteral nasogastric feeding, started from 500 kcal/day, and if tolerated increased to 1500 kcal/day, as well as Osmolite HN (protein: 4.2 g, fat: 3.5 g, carbohydrate: 13.4 g)/100 kcal(n = 20)
Experimental group 2: Received enteral nasogastric feeding, started from 500 kcal/day, and if tolerated increased to 1500 kcal/day, as well as Pulmocare (protein: 4.2 g, fat: 6.1 g, carbohydrate: 7 g)/100 kcal(n = 20) Experimental group 3: Received enteral nasogastric feeding, started from 500 kcal/day, and if tolerated increased to 1500 kcal/day, as well as AlitraQ (protein: 4.2 g, fat: 2.1 g, carbohydrate: 18.2 g)/100 kcal(n = 20) Control group: No oral intake for a week(n = 20) |
|
| Outcomes | Change of intragastric pH after surgery and change of intragastric pH after tube‐feeding | |
| Study dates | April 1997 to February 1998 | |
| Notes | Same trial as Hsu 2000a and Hsu 200b with the results from experimental group 3 vs control. We contacted the authors on 13th December 2015 by email: tzuchi@ms2.mmh.org.tw. We received no reply. | |
| Risk of bias | ||
| Bias | Authors' judgement | Support for judgement |
| Random sequence generation (selection bias) | Unclear risk | Not described |
| Allocation concealment (selection bias) | Unclear risk | Not described |
| Blinding of participants and personnel (performance bias) All outcomes | Unclear risk | Not described |
| Blinding of outcome assessment (detection bias) All outcomes | Unclear risk | Not described |
| Incomplete outcome data (attrition bias) All outcomes | Unclear risk | The number of participants with incomplete data was not reported. |
| Selective reporting (reporting bias) | Unclear risk | The trial did not properly describe mortality, or serious adverse events. |
| For‐profit bias | Unclear risk | It was unclear how the trial was funded. |
| Other bias | Low risk | The trial appeared to be free of other components that could put it at risk of bias. |
Hu 1998.
| Methods | Randomised clinical trial, USA | |
| Participants | 40 hospitalised adults admitted for 2‐stage anterior and posterior spinal reconstructive surgery, at nutritional risk due to major surgery Male:Female = 9:31 Mean age = 50.5 Exclusion criteria: Poorly‐controlled diabetes or had other medical contraindications |
|
| Interventions | Experimental group: TPN through a subclavian Hone catheter. It was started on the 1st postoperative day at 40 ml/hr and increased until calculated nutritional needs were achieved. Weaning began when they could consume 50% of their daily requirements orally. (n = 20) Control group: Standard intravenous fluids (n = 20) |
|
| Outcomes | Operative time, blood loss, transfusion requirements, all complications, length of hospital stay, albumin, pre‐albumin, weight, triceps skinfold, total lymphocyte count | |
| Study dates | May 1994 to June 1997 | |
| Notes | We contacted the authors on 23rd August 2015 by email: shu3@stanford.edu, and obtained additional information. | |
| Risk of bias | ||
| Bias | Authors' judgement | Support for judgement |
| Random sequence generation (selection bias) | Low risk | The trial used a random‐number list for the sequence generation. |
| Allocation concealment (selection bias) | Unclear risk | The trial was described as randomised, but it was unclear how the allocation was concealed. |
| Blinding of participants and personnel (performance bias) All outcomes | High risk | Only the experimental group had placement of a catheter. |
| Blinding of outcome assessment (detection bias) All outcomes | Unclear risk | It was unclear how the outcome was assessed. |
| Incomplete outcome data (attrition bias) All outcomes | High risk | 1 of the participants was transferred from the experimental group to the control group due to not receiving the intervention. There was also over 5% dropouts not accounted for with proper methodology. |
| Selective reporting (reporting bias) | Unclear risk | No protocol could be obtained, and the trial did not report all‐cause mortality or serious adverse events properly. |
| For‐profit bias | Unclear risk | It was unclear how the trial was funded. |
| Other bias | Low risk | The trial appeared to be free of other components that could put it at risk of bias. |
Huynh 2015.
| Methods | Randomised clinical trial, India | |
| Participants | 212 hospitalised adults admitted within 36 hours to either the medical or the surgical wards, and who were diagnosed with moderate or severe malnutrition based on the modified Subjective Global Assessment were eligible for inclusion. The participants were at nutritional risk due to being malnourished according to SGA. Male:Female = 115:92 (5 participants not included in this assessment) Mean age = 40 years Exclusion criteria: being less than 6 weeks post‐partum,active tuberculosis, acute hepatitis B or C, or HIV, diabetes type I and II, dementia, brain metastases, active malignancy, severe renal or liver failure, burn injury covering ≥ 15% of the body, clinically significant ascites, severe oedema, eating disorders or psychological conditions that might interfere with dietary intake, severe nausea, dysphagia, vomiting, active gastritis and gastrointestinal bleeding. Other exclusion criteria included taking progestational agents, steroids and growth hormone. |
|
| Interventions | Experimental group: 2 servings of ONS a day for 12 weeks. The ONS was a commercially‐available powder product (Ensure; Abbott Healthcare Private Limited, Mumbai, India). For this study, the ONS was packaged in single serving sachets (53 g each) and labelled as clinical study product. When given twice daily, the ONS provided 432 kcal, 16 g of high‐quality protein, 60 g of carbohydrate, 14 g of fat and 28 micronutrients. (n = 106)
Control group: No intervention (n = 106) Co‐interventions: 3 sessions of dietary counselling administered at baseline, weeks 4 and 8. During the hospital stay, participants from both groups consumed hospital‐prepared foods as prescribed by the dietitians. |
|
| Outcomes | Weight, BMI, modified SGA score, pre‐albumin, albumin, haemoglobin, total protein and C‐reactive protein, changes in dietary intake and functionality using hand‐grip strength | |
| Study dates | Not stated | |
| Notes | The participants started the intervention during hospitalisation but received some of the intervention as outpatients. We only used the assessment at 4 weeks, due to the nature of the intervention. We contacted the author on 08th February 2016 by email: dieu.huynh@abbott.com. We received an initial reply but no further information. | |
| Risk of bias | ||
| Bias | Authors' judgement | Support for judgement |
| Random sequence generation (selection bias) | Low risk | Randomisation was performed using SAS. |
| Allocation concealment (selection bias) | Low risk | The envelopes were described as sealed and opaque. |
| Blinding of participants and personnel (performance bias) All outcomes | High risk | The oral supplements were labelled as study supplement. |
| Blinding of outcome assessment (detection bias) All outcomes | Unclear risk | Not described |
| Incomplete outcome data (attrition bias) All outcomes | High risk | There were > 5% dropouts and the trial did not use proper methodology to account for the missing data for participants. |
| Selective reporting (reporting bias) | Low risk | The trial reported the outcomes in the pre‐published protocol (NCT01641770). |
| For‐profit bias | High risk | |
| Other bias | Low risk | |
Hwang 1991.
| Methods | Randomised clinical trial, Taiwan | |
| Participants | 24 hospitalised adults undergoing choledocholithotomy, at nutritional risk according to the trialist Male:Female = 11:13 Mean age = 51.5 years Exclusion criteria: displayed prominent jaundice, sepsis or complicated medical problems |
|
| Interventions | Experimental group: Enteral feeding (hospital blenderised diet consisting of 17% protein, 33% fat and 50% carbohydrate) through a tube on 1st postoperative day until the 4th day. (n = 12)
Control group: Nothing until 4th day (n = 12) Co‐interventions: Blenderised diet for additionally 4 days |
|
| Outcomes | Daily intake/output and nitrogen balance, middle arm circumference, triceps skinfold, creatinine‐height index, liver function, serum albumin, pre‐albumin, transferrin, total lymphocyte count | |
| Study dates | Not stated | |
| Notes | We contacted the authors on 19th August 2015 by email: hwangtl@adm.cgmh.org.tw. We received no reply. | |
| Risk of bias | ||
| Bias | Authors' judgement | Support for judgement |
| Random sequence generation (selection bias) | Unclear risk | The trial was described as being randomised, but it was unclear how the sequence was generated. |
| Allocation concealment (selection bias) | Unclear risk | The trial was described as being randomised, but it was unclear how the allocation was concealed. |
| Blinding of participants and personnel (performance bias) All outcomes | Unclear risk | Not described |
| Blinding of outcome assessment (detection bias) All outcomes | Unclear risk | Not described |
| Incomplete outcome data (attrition bias) All outcomes | Unclear risk | The number of participants with incomplete data was not reported. |
| Selective reporting (reporting bias) | Unclear risk | No protocol could be obtained, but the trial did not report on all‐cause mortality and serious adverse events. |
| For‐profit bias | Unclear risk | It was unclear how the trial was funded. |
| Other bias | Low risk | The trial appeared to be free of other components that could put it at risk of bias. |
Inoue 1993.
| Methods | Randomised clinical trial, USA | |
| Participants | 13 hospitalised adults undergoing abdominal surgery, at nutritional risk due to major abdominal surgery Male:Female = not stated Mean age = not stated Exclusion criteria: diabetes or steroid medications |
|
| Interventions | Experimental group: TPN (30 nonprotein kcal/kg/day (34% fat as Intralipid), and 1.27 g protein as Aminosyn/kg/day (0.20 gmN/kg/day)) for 1 week(n = 6) Control group: Regular hospital diet (28.2 non‐protein kcal/kg/day (34% fat), and 1.25 g protein/kg/day (0.20 g N/kg/day))(n = 7) |
|
| Outcomes | Brush‐border amino acid and glucose transport activity | |
| Study dates | Not stated | |
| Notes | We could obtain no contact information for the authors. | |
| Risk of bias | ||
| Bias | Authors' judgement | Support for judgement |
| Random sequence generation (selection bias) | Unclear risk | Not described |
| Allocation concealment (selection bias) | Unclear risk | Not described |
| Blinding of participants and personnel (performance bias) All outcomes | Unclear risk | Not described |
| Blinding of outcome assessment (detection bias) All outcomes | Unclear risk | Not described |
| Incomplete outcome data (attrition bias) All outcomes | Unclear risk | The number of participants with incomplete data was not reported. |
| Selective reporting (reporting bias) | Unclear risk | There were no protocol, and the trial did not report on all‐cause mortality or serious adverse events. |
| For‐profit bias | Low risk | It was funded by an NIH grant CA45327 and a grant from the Veterans Administration Merit Review Board. (Dr. Souba). |
| Other bias | Low risk | The trial appeared to be free of other components that could put it at risk of bias. |
Iresjö 2008.
| Methods | Randomised clinical trial, Sweden | |
| Participants | 12 hospitalised adults undergoing surgery of the upper gastrointestinal tract, at nutritional risk due to major surgery Male:Female = 7:5 Mean age = 64 years Exclusion criteria: diabetes or steroid medications |
|
| Interventions | Experimental group: Parenteral nutrition: TPN was supplied as an all‐in‐one bag (0.16 gN · kg−1 of body weight · day−1 (30 kcal · kg−1 of body weight · day−1); Kabiven® Perifer; Fresenius Kabi(n = 6) Control group: Placebo (saline)(n = 6) Infusions started between 16.00 and 17.00 hours on the day before the operation, and continued at a constant rate until muscle biopsies were taken from the rectus abdominis muscles directly after the induction of anaesthesia (15 – 16 hrs later) |
|
| Outcomes | Levels of amino acids and substrates in peripheral blood, formation of 4E‐BPI‐eIF4E and eIF4G‐eIF4E complexes, 4E‐BPI phosphorylation, p70S6K phosphorylation | |
| Study dates | Not stated | |
| Notes | We contacted authors about risk of bias details on 6th September 2015 by email: kent.lundholm@surgery.gu.se. We received additional information on randomisation sequence, blinding and incomplete outcome data. | |
| Risk of bias | ||
| Bias | Authors' judgement | Support for judgement |
| Random sequence generation (selection bias) | Low risk | Randomisation was done after the participant was recruited to the study by the responsible physician. Randomisation was done by a computer algorithm based on age, sex, cancer (type of cancer)/no cancer, height, weight, % weight loss (compared to pre‐disease weight). |
| Allocation concealment (selection bias) | Unclear risk | Not described |
| Blinding of participants and personnel (performance bias) All outcomes | Low risk | Participants were blinded as the control group received placebo. |
| Blinding of outcome assessment (detection bias) All outcomes | High risk | Blinding of outcome assessment was not performed. |
| Incomplete outcome data (attrition bias) All outcomes | Low risk | There were no dropouts and complete data for all 12 participants. |
| Selective reporting (reporting bias) | Unclear risk | No protocol could be obtained and the trial did not report on all‐cause mortality or serious adverse events. |
| For‐profit bias | Low risk | The study was, in part, supported by grants from the Swedish Cancer Society (2014), the Swedish Research Council (08712), Tore Nilson Foundation, Assar Gabrielsson Foundation (AB Volvo), Jubileumskliniken foundation, IngaBritt & Arne Lundberg Research Foundation, Swedish and Göteborg Medical Societies, the Medical Faculty, Göteborg University, VGR 19/00, 1019/00, Swedish Nutrition Foundation. |
| Other bias | Low risk | The trial appeared to be free of other components that could put it at risk of bias. |
Itou 2011.
| Methods | Randomised clinical trial, Japan | |
| Participants | 36 hospitalised adults with chronic liver disease and oesophageal and gastric varices, at nutritional risk defined by trialist Male:Female = 29:7 Mean age: 65.9 years Exclusion criteria: Ascites and renal failure |
|
| Interventions | Experimental group: Oral supplement consisting of a 200 kcal CalorieMate Jelly(n = 18) Control group: No intervention (no meal)(n = 18) | |
| Outcomes | Physical symptoms (thirst, light‐headedness, nausea, headache, palpitation and cold sweat) and mental symptoms(hunger, hypodynamia, fatigue, poor thinking, poor concentration, irritability) | |
| Study dates | Not stated | |
| Notes | The authors were contacted on 9.12.15 by email: Itou74m@med.kurume‐u.ac.jp. We received no reply. | |
| Risk of bias | ||
| Bias | Authors' judgement | Support for judgement |
| Random sequence generation (selection bias) | Unclear risk | Not described |
| Allocation concealment (selection bias) | Unclear risk | Not described |
| Blinding of participants and personnel (performance bias) All outcomes | High risk | Participants were not blinded. |
| Blinding of outcome assessment (detection bias) All outcomes | Low risk | Endoscopists were blinded. |
| Incomplete outcome data (attrition bias) All outcomes | Low risk | No dropouts |
| Selective reporting (reporting bias) | Unclear risk | No protocol could be obtained and the trial did not report on all‐cause mortality or serious adverse event. |
| For‐profit bias | Low risk | The study was supported, in part, by a Grant‐in‐Aid for Young Scientists (B) (No.22790874 to T.K.) and a Grant‐in‐Aid for Scientific Research (C)(No. 21590865 to M.S.) from the Ministry of Education, Culture, Sports, Science and Technology of Japan, and by Health and Labour Sciences Research Grants for Research on Hepatis from the Ministry of Health, Labour and Welfare of Japan. |
| Other bias | Low risk | The trial appeared to be free of other components that could put it at risk of bias. |
Jauch 1995a.
| Methods | Randomised clinical trial, Germany | |
| Participants | 44 hospitalised adults undergoing major surgery and metabolically healthy, in need of ICU, at nutritional risk due to major surgery and iCU. Male:Female = 30:14 Mean age = 61.6 |
|
| Interventions | Experimental group 1: Parenteral nutrition (3% amino acid solution) for 4 days(n = 17) Experimental group 2: Parenteral nutrition (carbohydrate and amino acid solution) for 4 days(n = 17) Control group: Saline solution only(n = 10) |
|
| Outcomes | Mortality, glucose, insulin, lactate, betahydroxybuturat, glycerin and fatty acids, protein, creatinine | |
| Study dates | Not stated | |
| Notes | Same trial as Jauch 1995b with the results from experimental group 1 vs control. We contacted the authors on 13th December 2015 by email: Karl‐Walter.Jauch@med.uni‐muenchen.de. We received no reply. | |
| Risk of bias | ||
| Bias | Authors' judgement | Support for judgement |
| Random sequence generation (selection bias) | Unclear risk | Not described |
| Allocation concealment (selection bias) | Unclear risk | Not described |
| Blinding of participants and personnel (performance bias) All outcomes | Unclear risk | Not described |
| Blinding of outcome assessment (detection bias) All outcomes | Unclear risk | Not described |
| Incomplete outcome data (attrition bias) All outcomes | Unclear risk | The amount of dropouts was not clearly stated. |
| Selective reporting (reporting bias) | Unclear risk | No protocol could be obtained, and the trial did not report on serious adverse events. |
| For‐profit bias | Unclear risk | It was unclear how the trial was funded. |
| Other bias | Low risk | The trial appeared to be free of other components that could put it at risk of bias. |
Jauch 1995b.
| Methods | Randomised clinical trial, Germany | |
| Participants | 44 hospitalised adults undergoing major surgery and metabolically healthy, in need of ICU, at nutritional risk due to major surgery and ICU. Male:Female = 30:14 Mean age = 61.6 |
|
| Interventions | Experimental group 1: Parenteral nutrition (3% amino acid solution) for 4 days(n = 17) Experimental group 2: Parenteral nutrition (carbohydrate and amino acid solution) for 4 days(n = 17) Control group: Saline solution only(n = 10) |
|
| Outcomes | Mortality, glucose, insulin, lactate, betahydroxybuturat, glycerin and fatty acids, protein, creatinine | |
| Study dates | Not stated | |
| Notes | Same trial as Jauch 1995a with the results from experimental group 2 vs control | |
| Risk of bias | ||
| Bias | Authors' judgement | Support for judgement |
| Random sequence generation (selection bias) | Unclear risk | Not described |
| Allocation concealment (selection bias) | Unclear risk | Not described |
| Blinding of participants and personnel (performance bias) All outcomes | Unclear risk | Not described |
| Blinding of outcome assessment (detection bias) All outcomes | Unclear risk | Not described |
| Incomplete outcome data (attrition bias) All outcomes | Unclear risk | The amount of dropouts was not clearly stated. |
| Selective reporting (reporting bias) | Unclear risk | No protocol could be obtained, and the trial did not report on serious adverse events. |
| For‐profit bias | Unclear risk | It was unclear how the trial was funded. |
| Other bias | Low risk | The trial appeared to be free of other components that could put it at risk of bias. |
Jensen 1982.
| Methods | Randomised clinical trial, Denmark | |
| Participants | 20 hospitalised adults admitted for rectal cancer, at nutritional risk due to major surgery. Male:Female = 12:8 Mean age = 61 years Exclusion criteria: diabetes mellitus, treatment with glucocorticoid, coagulation defect, above 80 years of age, not radically operated |
|
| Interventions | Experimental group: Parenteral nutrition (40 ‐ 50 kcal/kg/day and 1.5 ‐ 2 g protein/kg/day) for 2 days preoperatively and 6 days postoperatively (n = 10) Control group: Standard i.v. fluids for 2 days preoperatively and 6 days postoperatively(n = 10) |
|
| Outcomes | Complications, weight change, length of hospital stay, nitrogen balance | |
| Study dates | Not stated | |
| Notes | ||
| Risk of bias | ||
| Bias | Authors' judgement | Support for judgement |
| Random sequence generation (selection bias) | Unclear risk | The trial was described as being randomised, but it was unclear how the sequence was generated. |
| Allocation concealment (selection bias) | Unclear risk | The trial was described as being randomised, but it was unclear how the allocation was concealed. |
| Blinding of participants and personnel (performance bias) All outcomes | High risk | The trial was described as being unblinded. |
| Blinding of outcome assessment (detection bias) All outcomes | Unclear risk | Not described |
| Incomplete outcome data (attrition bias) All outcomes | Unclear risk | The number of dropouts was unclear. |
| Selective reporting (reporting bias) | Unclear risk | No protocol could be obtained, and the trial did not report on all‐cause mortality. |
| For‐profit bias | Unclear risk | It was unclear how the trial was funded. |
| Other bias | Low risk | The trial appeared to be free of other components that could put it at risk of bias |
Ji 1999.
| Methods | Randomised clinical trial, China | |
| Participants | 41 hospitalised adults undergoing surgery of the digestive tract, at nutritional risk due to major surgery Male:Female = 23:7 (gender not reported for 11 participants) Mean age = 58.35 years Exclusion criteria: metabolic diseases |
|
| Interventions | Experimental group: Participant was infused with saline 500 ml by using jejunum or gastrostomy nutrient catheter at 24 hrs after surgery, and followed by Nutrison Fibre 100 ml with the speed of 50 ml/hr, and 150 ml with the speed of 80 ‐ 120 ml/hr after 72 hrs if there were no adverse reactions. It was maintained at this amount and gradually reduced the amount of peripheral venous transfusion.(n = 22) Control group: conventional infusion therapy after surgery(n = 10) Co‐interventions: oral feeding after recovery of intestinal peristalsis |
|
| Outcomes | TRF, Pre‐albumin, albumin, haemoglobin, thrombin time, GPT, AKP, Total bilirubin, conjugated bilirubin, BUN,Cr, Blood glucose, gastrin, weight | |
| Study dates | Not stated | |
| Notes | We contacted the author by phone 3 times, but he did not have time to answer any questions. | |
| Risk of bias | ||
| Bias | Authors' judgement | Support for judgement |
| Random sequence generation (selection bias) | Unclear risk | Not described |
| Allocation concealment (selection bias) | Unclear risk | Not described |
| Blinding of participants and personnel (performance bias) All outcomes | High risk | Participants and personnel were not blinded. |
| Blinding of outcome assessment (detection bias) All outcomes | Unclear risk | The procedure of blinding was insufficiently described. |
| Incomplete outcome data (attrition bias) All outcomes | Unclear risk | The numbers and reasons for withdrawals and dropouts were not clearly stated. |
| Selective reporting (reporting bias) | Unclear risk | No protocol could be obtained and the trial dit not report on all‐cause mortality. |
| For‐profit bias | Unclear risk | It was unclear how the trial was funded. |
| Other bias | Low risk | The trial appeared to be free of other components that could put it at risk of bias. |
Jiang 2006a.
| Methods | Randomised clinical trial, China | |
| Participants | 69 hospitalised adults undergoing gastrointestinal surgery, at nutritional risk due to major surgery Male:Female = 46:23 Mean age = 49.3 years Exclusion criteria: Unclear |
|
| Interventions | Experimental group 1: Enteral and parenteral nutrition: Enteral nutrition with Supportan (Sino‐Swed Pharmaceutical Corp. Ltd) by using nasogastric tube. (Energy 543 kJ, protein 5.85 g, fat 7.2 g, carbohydrate 10.4 g, sugar 3.6 g, fatty acid 0.3 g, dietary fiber 1.3 g, mineral substance) (n = 22) Experimental group 2: Parenteral nutrition with Novamin (N 8.5%, amino acid injection, Sino‐Swed Pharmaceutical Corp. Ltd), non‐protein calorie supported by glucose and fat emulsion (Sino‐Swed Pharmaceutical Corp. Ltd) on a one‐to‐one ratio, plus electrolytes, vitamin and microelement, total 3 L were infused through peripheral or central vein within 10 hrs. (Energy 120 kJ/kg/day, N 0.15 g/kg/day; NPC:N = 150:1)(n = 23) Control group: Conventional infusion with glucose (50 ‐ 100 g/L), total energy 250 ‐ 300 kJ/day(n = 22) |
|
| Outcomes | Morbidity (rate), change of weight, length of stay, time to recovery of gastrointestinal function | |
| Study dates | Not stated | |
| Notes | We could obtain no contact information for the author. | |
| Risk of bias | ||
| Bias | Authors' judgement | Support for judgement |
| Random sequence generation (selection bias) | Unclear risk | Not described |
| Allocation concealment (selection bias) | Unclear risk | Not described |
| Blinding of participants and personnel (performance bias) All outcomes | High risk | Participants and personnel were not blinded. |
| Blinding of outcome assessment (detection bias) All outcomes | Unclear risk | Not described |
| Incomplete outcome data (attrition bias) All outcomes | Unclear risk | The number of participants with incomplete data was not reported. |
| Selective reporting (reporting bias) | Unclear risk | No protocol could be obtained and the trial did not report on all‐cause mortality. |
| For‐profit bias | Unclear risk | It was unclear how the trial was funded. |
| Other bias | Low risk | The trial appeared to be free of other components that could put it at risk of bias. |
Jiang 2006b.
| Methods | Randomised clinical trial, China | |
| Participants | 69 hospitalised adults undergoing gastrointestinal surgery, at nutritional risk due to major surgery Male:Female = 46:23 Mean age = 49.3 years Exclusion criteria: Unclear |
|
| Interventions | Experimental group 1: Enteral and parenteral nutrition: Enteral nutrition with Supportan (Sino‐Swed Pharmaceutical Corp. Ltd) by using nasogastric tube. (Energy 543 kJ, protein 5.85 g, fat 7.2 g, carbohydrate 10.4 g, sugar 3.6 g, fatty acid 0.3 g, dietary fibre 1.3 g, mineral substance) (n = 22) Experimental group 2: Parenteral nutrition with Novamin (N 8.5% amino acid injection, Sino‐Swed Pharmaceutical Corp. Ltd), non‐protein calorie supported by glucose and fat emulsion (Sino‐Swed Pharmaceutical Corp. Ltd) on a one‐to‐one ratio, plus electrolytes, vitamin and microelement, total 3L were infused through peripheral or central vein within 10 hrs. (Energy 120 kJ/kg/day, N 0.15 g/kg/day; NPC:N = 150:1)(n = 23) Control group: conventional infusion with glucose (50 ‐ 100 g/L), total energy 250 ‐ 300 kJ/day(n = 22) |
|
| Outcomes | Morbidity (rate), change of weight, length of stay, time for recovery of gastrointestinal function | |
| Study dates | Not stated | |
| Notes | We could obtain no contact information for the authors. | |
| Risk of bias | ||
| Bias | Authors' judgement | Support for judgement |
| Random sequence generation (selection bias) | Unclear risk | Not described |
| Allocation concealment (selection bias) | Unclear risk | Not described |
| Blinding of participants and personnel (performance bias) All outcomes | High risk | Participants and personnel were not blinded. |
| Blinding of outcome assessment (detection bias) All outcomes | Unclear risk | Not described |
| Incomplete outcome data (attrition bias) All outcomes | Unclear risk | The number of participants with incomplete data was not reported. |
| Selective reporting (reporting bias) | Unclear risk | No protocol could be obtained and the trial did not report on all‐cause mortality. |
| For‐profit bias | Unclear risk | It was unclear how the trial was funded. |
| Other bias | Low risk | The trial appeared to be free of other components that could put it at risk of bias. |
Jimenez 1995a.
| Methods | Randomised clinical trial, Spain | |
| Participants | 75 hospitalised adults, at nutritional risk due to low levels of albumin or body weight below 95% of ideal weight Male:Female = not stated Mean age = not stated Exclusion: none stated |
|
| Interventions | Experimental group 1: 59.1 g amino acids + 694 non‐protein calories (glucose)(n = 20) Experimental group 2: 57.9 g amino acids + 600 non‐protein calories (glycerol)(n = 20) Experimental group 3: 56.6 g amino acids + 590 non‐protein calories (sorbitol‐xylitol)(n = 20) Control group: Conventional infusion therapy (5% glucose)(n = 15) |
|
| Outcomes | All‐cause mortality, complications, plasma concentrations | |
| Study dates | Not stated | |
| Notes | Same as Jimenez 1995b and Jimenez 1995c. We only report experimental group 1 vs control here. We contacted the authors on 13th December 2015 by email: fjavierjimenez@telefonica.net. We received no reply. | |
| Risk of bias | ||
| Bias | Authors' judgement | Support for judgement |
| Random sequence generation (selection bias) | Unclear risk | Not described |
| Allocation concealment (selection bias) | Unclear risk | Not described |
| Blinding of participants and personnel (performance bias) All outcomes | Unclear risk | Not described |
| Blinding of outcome assessment (detection bias) All outcomes | Unclear risk | Not described |
| Incomplete outcome data (attrition bias) All outcomes | Low risk | There were no drop‐outs. |
| Selective reporting (reporting bias) | Low risk | All‐cause mortality and serious adverse events were assessed. |
| For‐profit bias | Low risk | The trial was funded by the Spanish Ministry of Health. |
| Other bias | Low risk | The trial appeared to be free of other components that could put it at risk of bias. |
Jimenez 1995b.
| Methods | Randomised clinical trial, Spain | |
| Participants | 75 hospitalised adults, at nutritional risk due to low levels of albumin or body weight below 95% of ideal weight | |
| Interventions | Experimental group 1: 59.1 g amino acids + 694 non‐protein calories (glucose)(n = 20)
Experimental group 2: 57.9 g amino acids + 600 non‐protein calories (glycerol)(n = 20) Experimental group 3: 56.6 g amino acids + 590 non‐protein calories (sorbitol‐xylitol)(n = 20) Control group: Conventional infusion therapy (5% glucose)(n = 15) |
|
| Outcomes | All‐cause mortality, complications, plasma concentrations | |
| Study dates | Not stated | |
| Notes | Same as Jimenez 1995a and Jimenenz 1995c. We only report experimental group 2 vs control here. We contacted the authors on 13th December 2015 by email: fjavierjimenez@telefonica.net. We received no reply. | |
| Risk of bias | ||
| Bias | Authors' judgement | Support for judgement |
| Random sequence generation (selection bias) | Unclear risk | Not described |
| Allocation concealment (selection bias) | Unclear risk | Not described |
| Blinding of participants and personnel (performance bias) All outcomes | Unclear risk | Not described |
| Blinding of outcome assessment (detection bias) All outcomes | Unclear risk | Not described |
| Incomplete outcome data (attrition bias) All outcomes | Low risk | There were no drop‐outs. |
| Selective reporting (reporting bias) | Low risk | All‐cause mortality and serious adverse events were assessed. |
| For‐profit bias | Low risk | The trial was funded by the Spanish Ministry of Health. |
| Other bias | Low risk | The trial appeared to be free of other components that could put it at risk of bias. |
Jimenez 1995c.
| Methods | Randomised clinical trial, Spain | |
| Participants | 75 hospitalised adults, at nutritional risk due to low levels of albumin or body weight below 95% of ideal weight | |
| Interventions | Experimental group 1: 59.1 g amino acids + 694 non‐protein calories (glucose)(n = 20)
Experimental group 2: 57.9 g amino acids + 600 non‐protein calories (glycerol)(n = 20) Experimental group 3: 56.6 g amino acids + 590 non‐protein calories (sorbitol‐xylitol)(n = 20) Control group: Conventional infusion therapy (5% glucose)(n = 15) |
|
| Outcomes | All‐cause mortality, complications, plasma concentrations | |
| Study dates | Not stated | |
| Notes | Same as Jimenez 1995a and Jimenez 1995b. We only report experimental group 3 vs control here. We contacted the authors on 13th December 2015 by email: fjavierjimenez@telefonica.net. We received no reply. | |
| Risk of bias | ||
| Bias | Authors' judgement | Support for judgement |
| Random sequence generation (selection bias) | Unclear risk | Not described |
| Allocation concealment (selection bias) | Unclear risk | Not described |
| Blinding of participants and personnel (performance bias) All outcomes | Unclear risk | Not described |
| Blinding of outcome assessment (detection bias) All outcomes | Unclear risk | Not described |
| Incomplete outcome data (attrition bias) All outcomes | Low risk | There were no drop‐outs. |
| Selective reporting (reporting bias) | Low risk | All‐cause mortality and serious adverse events were assessed. |
| For‐profit bias | Unclear risk | The trial was funded by the Spanish Ministry of Health. |
| Other bias | Low risk | The trial appeared to be free of other components that could put it at risk of bias. |
Jin 1999a.
| Methods | Randomised clinical trial, China | |
| Participants | 92 hospitalised adults diagnosed with adenocarcinoma of the GI tract deemed operable by a consultant surgeon, at nutritional risk due to serum albumin < 30 g/L or a recent weight loss of > 10% body weight Male:Female = 58:34 Mean age = 57 years Exclusion:congestive heart failure, obstructive lung disease, metabolic diseases, clinically‐evident cirrhotic liver disease or renal disease |
|
| Interventions | Experimental group 1: Parenteral nutrition: Preoperative PN provided 35 kcal/kg a day. Non‐protein caloric content was divided between dextrose (60%) and lipids (40%) (Intralipid; Kabi Pharmacia, Sweden). Crystalline amino acids (7% Vamin; Kabi Pharmacia, Sweden) were provided at a calorie:nitrogen ratio of 150:1 g of nitrogen (0.23 g of nitrogen a kilogram a day). Each day, the nutrient mixture, which was prepared in ethyl vinyl acetate bags, was infused through a subclavian polyurethane catheter over 24 hrs by an infusion pump. The catheter was inserted using a strict aseptic procedure in the operating room.(n = 23) Control group 1: No intervention(n = 23) |
|
| Outcomes | Weight, complications, postoperative mortality and nutritional parametres including serum albumin (g/L), serum transferrin (g/L), nitrogen balance (g/L) | |
| Study dates | Not stated | |
| Notes | We could obtain no contact information for the authors. Same trial as Jin 1999b but with the experimental and control group that did not received chemotherapy. | |
| Risk of bias | ||
| Bias | Authors' judgement | Support for judgement |
| Random sequence generation (selection bias) | Unclear risk | Not described |
| Allocation concealment (selection bias) | Unclear risk | Not described |
| Blinding of participants and personnel (performance bias) All outcomes | High risk | Participants and personnel were not blinded. |
| Blinding of outcome assessment (detection bias) All outcomes | High risk | Outcome assessors were not blinded. |
| Incomplete outcome data (attrition bias) All outcomes | Low risk | All participants completed the study. |
| Selective reporting (reporting bias) | Low risk | The protocol could not be obtained, but the trial reported on serious adverse events and mortality. |
| For‐profit bias | Unclear risk | It was unclear how the trial was funded. |
| Other bias | Low risk | The trial appeared to be free of other components that could put it at risk of bias. |
Jin 1999b.
| Methods | Randomised clinical trial, China | |
| Participants | 92 hospitalised adults diagnosed with adenocarcinoma of the GI tract deemed operable by a consultant surgeon, at nutritional risk due to serum albumin < 30 g/L or a recent weight loss of > 10% body weight Male:Female = 58:34 Mean age = 57 years Exclusion: congestive heart failure, obstructive lung disease, metabolic diseases, clinically‐evident cirrhotic liver disease or renal disease |
|
| Interventions | Experimental group 2: Parenteral nutrition: Preoperative PN provided 35 kcal/kg a day. Non‐protein caloric content was divided between dextrose (60%) and lipids (40%) (Intralipid; Kabi Pharmacia, Sweden). Crystalline amino acids (7% Vamin; Kabi Pharmacia, Sweden) were provided at a calorie:nitrogen ratio of 150:1 g of nitrogen (0.23 g of nitrogen a kilogram a day). Each day, the nutrient mixture, which was prepared in ethyl vinyl acetate bags, was infused through a subclavian polyurethane catheter over 24 hrs by an infusion pump. The catheter was inserted using a strict aseptic procedure in the operating room.(n = 23) Control group 2: No intervention (n = 23) Co‐interventions: chemotherapy |
|
| Outcomes | Weight, complications, postoperative mortality and nutritional parametres including serum albumin (g/L), serum transferrin (g/L), nitrogen balance (g/L) | |
| Study dates | Not stated | |
| Notes | Same trial as Jin 1999a but with the experimental and control group that received chemotherapy as a co‐intervention. | |
| Risk of bias | ||
| Bias | Authors' judgement | Support for judgement |
| Random sequence generation (selection bias) | Unclear risk | Not described |
| Allocation concealment (selection bias) | Unclear risk | Not described |
| Blinding of participants and personnel (performance bias) All outcomes | High risk | Participants and personnel were not blinded. |
| Blinding of outcome assessment (detection bias) All outcomes | High risk | Outcome assessors were not blinded. |
| Incomplete outcome data (attrition bias) All outcomes | Low risk | All participants completed the study. |
| Selective reporting (reporting bias) | Low risk | The protocol could not be obtained, but the trial reported on serious adverse events and mortality. |
| For‐profit bias | Low risk | The study received the support of the general surgical department and the image cytometry department of Zhong Shan Hospital at the Shanghai Medical University. This research was supported by a grant from the International Clinical Epidemiology Network. |
| Other bias | Low risk | The trial appeared to be free of other components that could put it at risk of bias. |
Johansen 2004.
| Methods | Randomised clinical trial (stratified for age), Denmark | |
| Participants | 212 hospitalised adults, at nutritional risk due to NRS‐2012
Male:Female = 102:110 Mean age = 62.2 years |
|
| Interventions | Experimental group: A specialised nutritional team (nurse and dietitian) attended the participants and staff for motivation, detailed a nutritional plan, assured delivery of prescribed food and gave advice on enteral or parenteral nutrition when appropriate.(n = 108) Control group: Standard regimen used in the department(n = 104) |
|
| Outcomes | All‐cause mortality, complications, designated length of hospital stay, quality of life | |
| Study dates | August 1st 2001 to March 1st 2002 | |
| Notes | We contacted the authors on 13th December 2012 by email: nielsjohansen@dadlnet.dk. We received no reply. | |
| Risk of bias | ||
| Bias | Authors' judgement | Support for judgement |
| Random sequence generation (selection bias) | Low risk | The sequence was generated by a random‐numbers system. |
| Allocation concealment (selection bias) | Low risk | Sequentially‐numbered sealed opaque envelopes |
| Blinding of participants and personnel (performance bias) All outcomes | High risk | The nurses and participants were not blinded. |
| Blinding of outcome assessment (detection bias) All outcomes | High risk | Even though the investigator assessing the outcome was blinded, the nurses who reported the outcomes were not. |
| Incomplete outcome data (attrition bias) All outcomes | High risk | There were above 5% dropouts, and the trial did not use proper intention‐to‐treat analysis. |
| Selective reporting (reporting bias) | Low risk | Both all‐cause mortality and serious adverse events were reported. |
| For‐profit bias | Low risk | The trial was not funded by any company that had an interest in the outcome. |
| Other bias | Low risk | The trial appeared to be free of other components that could put it at risk of bias. |
Kang 2012.
| Methods | Randomised clinical trial, South Korea | |
| Participants | 60 elderly hospitalised adults older than 65 years and admitted to the hospital for hip fracture surgery, at nutritional risk due to being frail elderly Male:female = not stated Mean age = 80.7 years |
|
| Interventions | Experimental group: ONSs, trace elements supplements and dietetic counselling for 2 weeks postoperatively (n = 30) Control group: usual care (n = 30) |
|
| Outcomes | MNA, hand‐grip strength | |
| Study dates | Not stated | |
| Notes | Only abstract. We could obtain no contact information for the authors. | |
| Risk of bias | ||
| Bias | Authors' judgement | Support for judgement |
| Random sequence generation (selection bias) | Unclear risk | Not described |
| Allocation concealment (selection bias) | Unclear risk | Not described |
| Blinding of participants and personnel (performance bias) All outcomes | Unclear risk | Not described |
| Blinding of outcome assessment (detection bias) All outcomes | Unclear risk | Not described |
| Incomplete outcome data (attrition bias) All outcomes | Unclear risk | The number of participants with incomplete data was not reported. |
| Selective reporting (reporting bias) | Unclear risk | No protocol could be obtained, and the trial did not report on all‐cause mortality or serious adverse events. |
| For‐profit bias | Unclear risk | It was unclear how the trial was funded. |
| Other bias | Low risk | The trial appeared to be free of other components that could put it at risk of bias. |
Kaur 2005.
| Methods | Randomised clinical trial, India | |
| Participants | 100 hospitalised adults undergoing open abdominal surgery, at nutritional risk due major surgery Male:Female = 79:21 Mean age = 36 years Exclusion criteria: dementia, diabetes, renal failure, or hepatic failure |
|
| Interventions | Experimental group: Early Enteral Nutrition: Participants were given a hospital kitchen‐prepared feed through the nasojejunal tube 24 hrs after surgery. The 500 ml of feed contained 375 ml milk, 12.5 g sugar, 12.5 g butter, 12.5 g starch, 125 ml rice water, and half an egg. The feed provided 500 kcal energy, 16.66 g protein, 43.5 g carbohydrates, and 30 g fat. The feed was started at a rate of 50 ml/hr in the 1st 6 hrs and gradually increased to 100 ml/hr by the 3rd postoperative day. The nutritional goal was to deliver 35 ‐ 40 kcal/kg/day and 1.5 ‐ 2.0 g protein/kg/day. The nasogastric tube was taken out when gastric aspirate was minimal or nil and when participants started taking 2 L of feed a day, usually by the 4th or 5th postoperative day. (n = 50) Control group: Treatment as usual(n = 50) |
|
| Outcomes | All cause‐mortality, hand‐grip strength, complications | |
| Study dates | April 2000 to March 2002 | |
| Notes | We contacted the authors on 9th June 2015 by email: dr_navkaur@hotmail.com. We received no reply. | |
| Risk of bias | ||
| Bias | Authors' judgement | Support for judgement |
| Random sequence generation (selection bias) | Unclear risk | Not described |
| Allocation concealment (selection bias) | Unclear risk | Not described |
| Blinding of participants and personnel (performance bias) All outcomes | High risk | Participants and personnel were not blinded. |
| Blinding of outcome assessment (detection bias) All outcomes | Unclear risk | The method of blinding of outcome assessment was not described. |
| Incomplete outcome data (attrition bias) All outcomes | Low risk | All participants completed the study. |
| Selective reporting (reporting bias) | Low risk | No protocol available, but serious adverse events and all‐cause mortality were reported. |
| For‐profit bias | Unclear risk | It was unclear how the trial was funded. |
| Other bias | Low risk | The trial appeared to be free of other components that could put it at risk of bias. |
Kawaguchi 2008.
| Methods | Randomised clinical trial, Japan | |
| Participants | 29 hospitalised adults with cirrhosis, at nutritional risk due to the trialist indication Male:Female = 18:11 Mean age = 63.2 years Exclusion criteria: Ascites or renal failure |
|
| Interventions | Experimental group: Supplement 200 kcal(n = 18) Control group: No energy supplied (fasting)(n = 11) | |
| Outcomes | Self‐rating questionnaire (physical symptoms and mental symptoms), biochemical parameters, CT or MRI. | |
| Study dates | April 2005 to July 2006 | |
| Notes | We contacted the authors on 19th August 2015 by email: takumi@med.kurume‐u.ac.jp . We received no reply. | |
| Risk of bias | ||
| Bias | Authors' judgement | Support for judgement |
| Random sequence generation (selection bias) | Unclear risk | Not described |
| Allocation concealment (selection bias) | Unclear risk | Not described |
| Blinding of participants and personnel (performance bias) All outcomes | Unclear risk | Not described |
| Blinding of outcome assessment (detection bias) All outcomes | Unclear risk | Not described |
| Incomplete outcome data (attrition bias) All outcomes | Unclear risk | The number of participants with incomplete data was not reported. |
| Selective reporting (reporting bias) | Unclear risk | No protocol could be obtained and the trial did not report on all‐cause mortality or serious adverse events. |
| For‐profit bias | Low risk | The trial was funded by grants from the Ministry of Education, Culture, Sports, Science and Technology, Japan, the Vehicle Racing Commemorative Foundation, Japan, and the Ishibashi Foundation for the Promotion of Science, Japan. |
| Other bias | Low risk | The trial appeared to be free of other components that could put it at risk of bias. |
Kearns 1992.
| Methods | Randomised clinical trial, USA | |
| Participants | 31 hospitalised adults with alcoholic liver disease, a serum bilirubin leve1 of > 5 l pmol/L, and one of the following: albumin < 30 g/L, prothrombin time prolonged ≥ 4 seconds over control, or presence of ascites on physical examination at nutritional risk due to trialist indication Male:Female = 21:10 Mean age = 44 years Exclusion criteria (prospectively): Objection to the length of the study, refusal of nasoduodenal (ND) tube placement, continuation of gastro‐intestinal bleeding, elevation of serum creatinine level to > 221 pmol/L, and inability to give informed consent |
|
| Interventions | Experimental group: Enteral nutrition. The EN provided 167 kJ/kg and 1.5 g/kg of ideal body weight protein. A constant‐infusion pump delivered the solution through an 8F ND tube. 2‐gram sodium and 1500‐mL fluid restrictions were imposed in the presence of peripheral oedema or ascites. Participants remained on a medical ward until discharge. Subsequently, they stayed in the clinical research unit for the remaining 28 days. If appetite permitted, the treatment group drank the EN after transfer.(n = 16) Control group: No intervention(n = 15) Co‐interventions: Regular diet |
|
| Outcomes | The average lengths of hospital stay, incidence of diarrhoea, renal insufficiency, gastro‐intestinal bleeding, changes in anthropometrics and ascites, weight, pneumonia, improvement of encephalopathy, change in metabolic rate, calorie intake, change in functional hepatic mass, survival, lactulose requirements. Biochemical outcomes: serum albumin, serum bilirubin, antipyrine elimination, alanine amino‐transferase, aspartate aminotransferase, y‐glutamyltransferase, alkaline phosphatase, pre‐albumin, thyroid‐binding globulin, and transferring | |
| Study dates | Not stated | |
| Notes | We contacted the authors on 1st October 2015 by email: pj.kearns@med.stanford.edu. We received a reply. | |
| Risk of bias | ||
| Bias | Authors' judgement | Support for judgement |
| Random sequence generation (selection bias) | Low risk | A random‐number generator was used, performed by personnel not a part of the clinical phase of the study. |
| Allocation concealment (selection bias) | Low risk | The random numbers were recorded and placed into numbered, opaque envelopes. |
| Blinding of participants and personnel (performance bias) All outcomes | Low risk | Investigators and participants were blinded to allocation. |
| Blinding of outcome assessment (detection bias) All outcomes | High risk | Outcome assessors were not blinded. |
| Incomplete outcome data (attrition bias) All outcomes | Low risk | Each group had 3 participants drop out. Clinical characteristics of dropouts were well matched to those of participants completing the trial. The dropouts did not have missing data. Data were censored at the participant's death and last‐observed data points were used. |
| Selective reporting (reporting bias) | Low risk | No protocol available, but serious adverse events and all‐cause mortality were reported. |
| For‐profit bias | High risk | The trial was supported in part by Mead Johnson Nutritional Division Inc., Evansville, Indiana, and by National Institutes of Health Grant 22209. |
| Other bias | Low risk | The trial appeared to be free of other components that could put it at risk of bias. |
Keele 1997.
| Methods | Randomised clinical trial, UK | |
| Participants | 100 hospitalised adults admitted for major abdominal surgery, at nutritional risk due to major abdominal surgery Male:female = 48:38 (gender not reported for 14) Mean age: 62.5 years |
|
| Interventions | Experimental group: Standard ward diet + oral supplements (200 ml (1.5 kcal/ml and 0.05 g protein/ml)(n = 47) Control group: Standard ward diet(n = 53) |
|
| Outcomes | All‐cause mortality, complications, nutritional status, anthropometrics, hand‐grip strength | |
| Study dates | Not stated | |
| Notes | We could obtain no contact information for the authors. | |
| Risk of bias | ||
| Bias | Authors' judgement | Support for judgement |
| Random sequence generation (selection bias) | Unclear risk | Not described |
| Allocation concealment (selection bias) | Unclear risk | Not described |
| Blinding of participants and personnel (performance bias) All outcomes | Unclear risk | Not described |
| Blinding of outcome assessment (detection bias) All outcomes | Unclear risk | Not described |
| Incomplete outcome data (attrition bias) All outcomes | High risk | There were above 5% dropouts, and the trial did not use proper intention‐to‐treat analysis. |
| Selective reporting (reporting bias) | Low risk | Both all‐cause mortality, and serious adverse events were reported. |
| For‐profit bias | High risk | The trial was funded by Nutricia research, which might have a conflict of interest. |
| Other bias | Low risk | The trial appeared to be free of other components that could put it at risk of bias. |
Kendell 1982.
| Methods | Randomised clinical trial, USA | |
| Participants | 24 hospitalised adults undergoing orthognathic surgery and maxillomandibular fixation, at nutritional risk due major surgery to decreased food intake Male:Female = 5:17 (gender not reported for two participants) Mean age = 25 years Exclusion criteria: Participants who showed evidence of pathologic condition or systemic disease |
|
| Interventions | Experimental group: Participants were instructed to consume a minimum of 50% of their calculated caloric requirements in the form of a nutritionally‐complete liquid supplement containing 1.5 cal/ml. The supplement consisted of 14.7% of calories as protein, 32% as fat and 53.3% as carbohydrates. The intervention lasted 6 weeks by mouth.(n = 12) Control group: No intervention (n = 12) Co‐interventions: Dextrose (5%) in water and ¼ normal saline solution were administered postoperatively at a rate consistent with each participant's requirement. Everyone consumed blenderised foods. All were required to refrain from consuming any other commercial supplement or vitamin preparation. |
|
| Outcomes | Weight, mid‐arm muscle circumference, triceps skinfold, creatinine height index, serum albumin, transferrin, total lymphocyte count, urinary nitrogen and creatinine, serum chemistries, caloric intake, protein and carbohydrate intake, thiamine, niacin, zinc, folic acid and riboflavin intake and length of hospital stay | |
| Study dates | Not stated | |
| Notes | We could obtain no contact information for the authors. | |
| Risk of bias | ||
| Bias | Authors' judgement | Support for judgement |
| Random sequence generation (selection bias) | Unclear risk | Not described |
| Allocation concealment (selection bias) | Unclear risk | Not described |
| Blinding of participants and personnel (performance bias) All outcomes | Unclear risk | Not described |
| Blinding of outcome assessment (detection bias) All outcomes | Unclear risk | Not described |
| Incomplete outcome data (attrition bias) All outcomes | Low risk | There were complete data for all participants. |
| Selective reporting (reporting bias) | Unclear risk | No protocol could be obtained, and the trial did not report on all‐cause mortality or serious adverse events. |
| For‐profit bias | Unclear risk | It was unclear how the trial was funded. |
| Other bias | Low risk | The trial appeared to be free of other components that could put it at risk of bias. |
Lanzotti 1980.
| Methods | Randomised clinical trial, USA | |
| Participants | 48 hospitalised adults with Non‐Oat cell Lung Cancer, at nutritional risk due to decreased food intake Male:Female: Not reported Exclusion criteria: 1 person was excluded due to diagnosis mesothelioma |
|
| Interventions | Experimental group: Parenteral Nutrition. TPN administered by central venous catheter at > 35 ckal/kg/day. TPN was initiated 7 days before the 1st course and 2 days before the 2nd course of chemotherapy. TPN was discontinued on day 12 of each course of chemotherapy. Thus the intervention group received 19 days with the 1st course and 14 days with the 2nd. (n = 14) Control group: No intervention (n = 13) | |
| Outcomes | Average time of survival, white cell count/granulocyte count | |
| Study dates | Not stated | |
| Notes | We contacted the authors on 13th November 2015 by email: lanzotti@unina.it. We received no reply. | |
| Risk of bias | ||
| Bias | Authors' judgement | Support for judgement |
| Random sequence generation (selection bias) | Unclear risk | Not described |
| Allocation concealment (selection bias) | Unclear risk | Not described |
| Blinding of participants and personnel (performance bias) All outcomes | Unclear risk | Not described |
| Blinding of outcome assessment (detection bias) All outcomes | Unclear risk | Not described |
| Incomplete outcome data (attrition bias) All outcomes | Unclear risk | The number of participants with incomplete data was not reported. |
| Selective reporting (reporting bias) | Unclear risk | No protocol could be obtained, and the trial did not report on all‐cause mortality or serious adverse events. |
| For‐profit bias | Unclear risk | It was unclear how the trial was funded. |
| Other bias | Low risk | The trial appeared to be free of other components that could put it at risk of bias. |
Larsson 1990a.
| Methods | Randomised clinical trial, Sweden | |
| Participants | 501 adults hospitalised at the geriatric ward, at nutritional risk due to being elderly Male:Female = 190:311 Mean age = 79 years Exclusion criteria: none stated |
|
| Interventions | Experimental group: 400 ml dietary supplement containing 4 g of protein, 4 g of fat and 11.8 g of carbohydrate per 100 ml. Served in the morning and in the evening (n = 250)
Control group: no intervention(n = 251) Co‐intervention: standard ward diet (2200 kcal/day) |
|
| Outcomes | Nutritional status by anthropometry, serum protein analysis, delayed hypersensitivity skin test, mortality | |
| Study dates | Not stated | |
| Notes | We contacted the authors on 22nd August 2015 by email: mitra.unosson@liu.se. We received an initial reply but no further reply. | |
| Risk of bias | ||
| Bias | Authors' judgement | Support for judgement |
| Random sequence generation (selection bias) | Unclear risk | Not described |
| Allocation concealment (selection bias) | Unclear risk | The randomisation code was concealed using sealed envelopes but it unclear if they were opaque. |
| Blinding of participants and personnel (performance bias) All outcomes | Unclear risk | Not described |
| Blinding of outcome assessment (detection bias) All outcomes | Unclear risk | Not described |
| Incomplete outcome data (attrition bias) All outcomes | High risk | There were above 5% dropouts, and the trial did not use proper intention‐to‐treat analysis. |
| Selective reporting (reporting bias) | Unclear risk | No protocol could be obtained, and the trial did not report on serious adverse events. |
| For‐profit bias | High risk | The trial was supported from a company that might have an interest in a given result: "Grants from the Swedish Medical Research Council (project no. 07528 and 09330). the Research Fund of the County of Östergotland, the University Hospital and the University of Linkoping, and Kabi Nutrition, Sweden,". |
| Other bias | Low risk | The trial appeared to be free of other components that could put it at risk of bias. |
Ledinghen 1997.
| Methods | Randomised clinical trial, France | |
| Participants | 22 hospitalised adults with cirrhosis and bleeding from oesophageal varices, at nutritional risk as defined by trialists Male:Female = 17:5 Mean age = 56 years Exclusion criteria: severe liver failure (defined as a hepatorenal syndrome or end‐stage cirrhosis), hepatocellular carcinoma, severe hepatic encephalopathy, 80 years old or older |
|
| Interventions | Experimental group: Enteral nutrition: Polymeric enteral diet (Dripac Sondalis, Sopharga, France) was infused by bolus administration and provided 1665 kcal/day and 71 g of protein. A constant‐infusion pump delivered each Dripac in 3 hrs, by a 10 French nasogastric feeding tube. Participants received EN from day 1 through the 2nd sclerotherapy session.(n = 12) Control group: Treatment as usual (n = 10) From day 1 through day 3, participants received nil by mouth. On day 4, all received a standard low‐sodium milk diet (800 kcal), on day 5 a mixed, warm, low‐sodium diet (1400 kcal), and on day 6 a standard low‐sodium hospital diet (1800 kcal). |
|
| Outcomes | Child‐Pugh’s score, occurrence of pneumonia, presence of gastro‐intestinal bleeding or diarrhoea, amount of ascites, degree of encephalopathy, height, triceps skinfold thickness, mid‐arm muscle circumference, BMI, serum creatinine level, liver function tests, prothrombin time, serum albumin and pre‐albumin, nitrogen balance and mortality | |
| Study dates | August 1994 through August 1995 | |
| Notes | We contacted the authors on 9th June 2015 by email: victor.deledinghen@chu‐bordeaux.fr. We received an initial reply but no reply after this. | |
| Risk of bias | ||
| Bias | Authors' judgement | Support for judgement |
| Random sequence generation (selection bias) | Unclear risk | Not described |
| Allocation concealment (selection bias) | Unclear risk | Not described |
| Blinding of participants and personnel (performance bias) All outcomes | High risk | Participants and personnel were not blinded. |
| Blinding of outcome assessment (detection bias) All outcomes | Unclear risk | Not described |
| Incomplete outcome data (attrition bias) All outcomes | Low risk | There were no dropouts. |
| Selective reporting (reporting bias) | Low risk | The protocol could not be obtained, but the trial reported on all‐cause mortality and serious adverse events. |
| For‐profit bias | Unclear risk | It was unclear how the trial was funded. |
| Other bias | Low risk | The trial appeared to be free of other components that could put it at risk of bias. |
Levinson 1993a.
| Methods | Randomised clinical trial, Australia | |
| Participants | 100 hospitalised adults admitted to the ICU and critically ill, at nutritional risk due to inability to take food orally Male:Female = Not reported Mean age = Not reported Exclusion criteria: No bowel sounds, nasogastric aspirates for the previous day exceeded 300 ml/24 hrs, unstable, if the enteral feeding was an unsuitable feed, diarrhoea, or major bowel resection |
|
| Interventions | Experimental group: Enteral feeding. The participants received a standard isotonic feed via nasogastric tube, initially at 40 ml/hr and increased by 20 ml/hr every 12 hrs until desired caloric load was reached. Enteral feeding was temporarily ceased if the residual gastric volume (RGV) exceeded 100 ml and reattempted after 4 hours. Each intervention period lasted for 3 days. (n = 19) Control group 1: No intervention(n = 7) Co‐interventions: All participants received nitrogen and calories from supplemental parenteral nutrition during the study. Enteral nutrition for the first 3 days of the study. |
|
| Outcomes | Mortality, diarrhoea, stool frequency, colonising organisms from stool culture, serum albumin concentration, RGV and gastric colonisation | |
| Study dates | Not stated | |
| Notes | We here report the experimental group that received Experimental enteral feeding for 6 days versus the group that received it only for the 1st 3 days. We contacted the authors on 1st October 2015 by email: mlevinson@cabrini.com.au. We received an initial reply but no answer to our specific questions. Note that for a large amount of participants, it was not stated which group they were randomised to. | |
| Risk of bias | ||
| Bias | Authors' judgement | Support for judgement |
| Random sequence generation (selection bias) | Unclear risk | Randomisation was performed by shuffling cards and producing batches of 15 protocol sheets to be used in order. Uncertain if it was performed by an independent person not otherwise involved in the trial |
| Allocation concealment (selection bias) | Unclear risk | The trial was described as being randomised, but it was unclear how the allocation was concealed. |
| Blinding of participants and personnel (performance bias) All outcomes | High risk | Participants were blinded to treatment. Treatment providers were not blinded to feeding. |
| Blinding of outcome assessment (detection bias) All outcomes | High risk | Outcome assessors were not blinded. |
| Incomplete outcome data (attrition bias) All outcomes | High risk | Participants who failed to complete the first 3 days of the study were not analysed further, other than to record the cause of failure. This resulted in above 5% dropouts. The trial did not use proper methodology to deal with incomplete outcome data. |
| Selective reporting (reporting bias) | Low risk | The trial reported all‐cause mortality and serious adverse events. No protocol could be found. |
| For‐profit bias | Unclear risk | It was unclear how the trial was funded. |
| Other bias | Low risk | The trial appeared to be free of other components that could put it at risk of bias. |
Levinson 1993b.
| Methods | Randomised clinical trial, Australia | |
| Participants | 100 hospitalised adults admitted to the ICU and critically ill, at nutritional risk due to inability to take food orally Male:Female = Not reported Mean age = approximately 55 Exclusion criteria: no bowel sounds, nasogastric aspirates for the previous day exceeded 300 ml/24 hrs, if the enteral feeding was an unsuitable feed, diarrhoea, or major bowel resection |
|
| Interventions | Experimental group: Enteral feeding. The participants received a standard isotonic feed via nasogastric tube, initially at 40 ml/hr and increased by 20 ml/hr every 12 hrs until desired caloric load was reached. Enteral feeding was temporarily ceased if the residual gastric volume (RGV) exceeded 100 ml and reattempted after 4 hrs. Each intervention period lasted for 3 days. (n = 19) Control group 2: No intervention (n = 17) Co‐interventions: All participants received nitrogen and calories from supplemental parenteral nutrition during the study. |
|
| Outcomes | Mortality, diarrhoea, stool frequency, colonising organisms from stool culture, serum albumin concentration, RGV and gastric colonisation | |
| Study dates | Not stated | |
| Notes | We here report the experimental group that received Experimental enteral feeding for the last 3 days versus the group that did not receive enteral nutrition. | |
| Risk of bias | ||
| Bias | Authors' judgement | Support for judgement |
| Random sequence generation (selection bias) | Unclear risk | Randomisation was performed by shuffling cards and producing batches of 15 protocol sheets to be used in order. Uncertain if it was performed by an independent person not otherwise involved in the trial. |
| Allocation concealment (selection bias) | Unclear risk | Not described |
| Blinding of participants and personnel (performance bias) All outcomes | High risk | Participants were blinded to treatment. Treatment providers were not blinded to feeding. |
| Blinding of outcome assessment (detection bias) All outcomes | High risk | Outcome assessors were not blinded. |
| Incomplete outcome data (attrition bias) All outcomes | High risk | Participants who failed to complete the first 3 days of the study were not analysed further, other than to record the cause of failure. This resulted in above 5% dropouts. The trial did not use proper methodology to deal with incomplete outcome data. |
| Selective reporting (reporting bias) | Low risk | The trial reported all‐cause mortality and serious adverse events. No protocol could be found. |
| For‐profit bias | Unclear risk | It was unclear how the trial was funded. |
| Other bias | Low risk | The trial appeared to be free of other components that could put it at risk of bias. |
Li 1997.
| Methods | Randomised clinical trial, China | |
| Participants | 21 hospitalised adults diagnosed with COPD and critically ill according to the following criteria: diagnosed with pulmonary heart disease, pulmonary function test is FEV1/FVC < 70%, less than 10% increase of FEVI/FVC after using bronchus spasmolytic, arterial blood gas analysis: PaO2 < 60 mmHg and (or) PaCO2 > 50 mmHg. The participants were also diagnosed with malnutrition according to following criteria: 1. referred to the multiparameter nutritional index scoring system (MNI) by Laeabn JP, considering body weight (WT); 2. triceps skinfold (TSF); 3. mid‐arm muscle circumference (MAMC); 4. creatinine increased with normal liver and kidney function, at nutritional risk according to the trialist. Male:Female = 19:2 Mean age = 68 years Exclusion criteria: asthma, neuromuscular disease, chronic gastrointestinal malabsorption, diabetes, thyroid disease and cancer |
|
| Interventions | Experimental group: Parenteral nutrition: 30 Kcal/ Kg each day, nitrogen 0.20˜ 0.25g/kg by amino acid, 35%˜45% calorie by fat emulsion. Treatment course was 14 days.(n = 10) Control group: Intravenous infusion: 100˜200Kcal glucose each day for 14 days.(n = 11) Co‐interventions: Food nutrition: hospital‐made nutrition diet(protein 17%, fat 30% and carbohydrate 53%). |
|
| Outcomes | Serum albumin concentration, serum TRF, pre‐albumin concentration, CHI, SFAA. | |
| Study dates | Not stated | |
| Notes | We contacted the authorby phone 3 times, but he had no time to answer. | |
| Risk of bias | ||
| Bias | Authors' judgement | Support for judgement |
| Random sequence generation (selection bias) | Unclear risk | Not described |
| Allocation concealment (selection bias) | Unclear risk | Not described |
| Blinding of participants and personnel (performance bias) All outcomes | High risk | Participants and personnel were not blinded. |
| Blinding of outcome assessment (detection bias) All outcomes | Unclear risk | Not described |
| Incomplete outcome data (attrition bias) All outcomes | Unclear risk | The number of participants with incomplete data was not reported. |
| Selective reporting (reporting bias) | Unclear risk | No protocol could be obtained and the trial did not report on all‐cause mortality or serious adverse event. |
| For‐profit bias | Unclear risk | It was unclear how the trial was funded. |
| Other bias | Low risk | The trial appeared to be free of other components that could put it at risk of bias. |
Li 1998.
| Methods | Randomised clinical trial, China | |
| Participants | 20 hospitalised adults undergoing resection of pancreas and duodenum, at nutritional risk due to major surgery Male:Female = 16:4 Mean age = 56 years Exclusion criteria: Unclear |
|
| Interventions | Experimental group: TPN through central vein from the 1st day after surgery for 7 days. The calorie was 125.52 ˜ 146 KJ/(kg/day), of which 35% ˜ 40% was provided by 10% Interlipid and others by glucose. Nitrogen supply was 0.2 g/kg/day ) provided by 15‐HBC (Tianjin amino acid); vitamin and trace elements(SSPC) were supplied as conventional amount; water and electrolyte according to the balance of intake and output. All nutrients were mixed in an infusion bag, and distributed uniformly over 24 hrs. (n = 10) Control group: Conventional infusion: 200 g glucose calorie by 10% glucose liquid, without exogenous nitrogen supply, for 7 days(n = 10) |
|
| Outcomes | Weight, triceps skinfold thickness, arm circumference, and nitrogen balance | |
| Study dates | Not stated | |
| Notes | We contacted the author by phone 3 times, but he had no time to answer. | |
| Risk of bias | ||
| Bias | Authors' judgement | Support for judgement |
| Random sequence generation (selection bias) | Unclear risk | Not described |
| Allocation concealment (selection bias) | Unclear risk | Not described |
| Blinding of participants and personnel (performance bias) All outcomes | High risk | Participants and personnel were not blinded. |
| Blinding of outcome assessment (detection bias) All outcomes | Unclear risk | The procedure of blinding was insufficiently described. |
| Incomplete outcome data (attrition bias) All outcomes | Unclear risk | The numbers and reasons for withdrawals and dropouts were not clearly stated. |
| Selective reporting (reporting bias) | Unclear risk | No protocol could be obtained and the trial dit not report on all‐cause mortality or serious adverse events. |
| For‐profit bias | Unclear risk | It was unclear how the trial was funded. |
| Other bias | Low risk | The trial appeared to be free of other components that could put it at risk of bias. |
Lidder 2013a.
| Methods | Randomised clinical trial, UK | |
| Participants | 120 hospitalised adults with planned curative resection and primary anastomosis of histologically‐confirmed colorectal cancer, at nutritional risk due to weight loss > 5% over the past 3 months. Male:Female = 61:57 (gender not reported for two participants) Mean age = approximately 70 years Exclusion criteria: younger than 18 years, inability to give informed consent, frailty (unlikely to be able to mobilise immediately after the operation), participation in another trial, pregnancy, diabetes, a preoperative fasting glucose > 7 mmol/l, use of steroids or immunosuppressants, history of abnormal gastric emptying, intestinal obstruction, or concurrent parenteral or enteral nutrition |
|
| Interventions | Experimental group: Group B: Received carbohydrate drinks preoperatively. On the day of surgery, 400 ml of carbohydrate supplement was given 2 hrs before surgery. The supplement consisted of carbohydrate, 50 kcal per 100 ml, 290 mOsm/kg, pH 5.0(n = 30) Group C: Received a postoperative carbohydrate drink (Fortifresh!, Numico) consisting of 50 kcal per 100 ml, 965 mOsm/kg, pH 4.2(n = 32) Group D: Received the same preoperative carbohydrate drink as group B and the same postoperative carbohydrate drink as group C(n = 31) Control group (group A): received placebo(n = 27) Co‐interventions: free fluids permitted immediately after surgery and a light diet as tolerated |
|
| Outcomes | Postoperative fluid balance, energy intake, Insulin resistance, hand‐grip strength, peak expiratory flow rate, intestinal permeability, bowel function, nausea, vomiting, abdominal pain, insulin, glucose, length of postoperative hospital stay, postoperative complications (wound infection, pneumonia, diarrhoea, septicaemia, anastomotic leak, intra‐abdominal collection, intestinal obstruction, ileus, stroke/transient Ischaemic attack, thrombosis, congestive cardiac failure, myocardial infarction, renal failure) and mortality | |
| Study dates | Not stated | |
| Notes | Same trial as Lidder 2013b and Lidder 2013c. We here report group B compared with control. We contacted the authors on 11th November 2015 by email: sjl@doctors.org.uk. We received information on hand‐grip strength, BMI and weight. | |
| Risk of bias | ||
| Bias | Authors' judgement | Support for judgement |
| Random sequence generation (selection bias) | Low risk | Randomisation codes were computer‐generated using Microsoft Excel. |
| Allocation concealment (selection bias) | Low risk | Randomisation codes were held in sealed, opaque envelopes. |
| Blinding of participants and personnel (performance bias) All outcomes | Low risk | Participants and investigators were blinded to the treatment allocation. The active and placebo products were packaged identically. |
| Blinding of outcome assessment (detection bias) All outcomes | Low risk | Analysis was conducted by a trialist blinded to which intervention the participants received. |
| Incomplete outcome data (attrition bias) All outcomes | Low risk | There were none lost to follow‐up. |
| Selective reporting (reporting bias) | Low risk | The trial reported all‐cause mortality and serious adverse events. |
| For‐profit bias | High risk | One of the authors received grants from "Numico Research". |
| Other bias | Low risk | The trial appeared to be free of other components that could put it at risk of bias. |
Lidder 2013b.
| Methods | Randomised clinical trial, UK | |
| Participants | 120 hospitalised adults with planned curative resection and primary anastomosis of histologically‐confirmed colorectal cancer, at nutritional risk due to weight loss > 5% over the past 3 months Male:Female = 61:57 (gender not reported for two participants) Mean age = approximately 70 years Exclusion criteria: younger than 18 years, inability to give informed consent, frailty (unlikely to be able to mobilise immediately after the operation), participation in another trial, pregnancy, diabetes, a preoperative fasting glucose > 7 mmol/l, use of steroids or immunosuppressants, history of abnormal gastric emptying, intestinal obstruction, or concurrent parenteral or enteral nutrition |
|
| Interventions | Experimental group: Oral nutrition. Group B: Received carbohydrate drinks preoperatively. On the day of surgery, 400 ml of carbohydrate supplement was given 2 hrs before surgery. The supplement consisted of carbohydrate, 50 kcal per 100 ml, 290 mOsm/kg, pH 5.0(n = 30) Group C: Received a postoperative carbohydrate drink (Fortifresh!, Numico) consisting of 50 kcal per 100 ml, 965 mOsm/kg, pH 4.2(n = 32) Group D: Received the same preoperative carbohydrate drink as group B and the same postoperative carbohydrate drink as group C(n = 31) Control group (group A): received placebo preoperatively(n = 27) Co‐interventions: Postoperatively: Polymeric nutritional supplement drink (600 ml/day) from the period immediately after their operation until discharge. The supplement consisted of 150 kcal per 100 ml, 965 mOsm/kg, pH 4.2. Free fluids permitted immediately after surgery and a light diet as tolerated |
|
| Outcomes | Postoperative fluid balance, energy intake, Insulin resistance, hand‐grip strength, peak expiratory flow rate, intestinal permeability, bowel function, nausea, vomiting, abdominal pain, insulin, glucose, length of postoperative hospital stay, postoperative complications (wound infection, pneumonia, diarrhoea, septicaemia, anastomotic leak, intra‐abdominal collection, intestinal obstruction, ileus, stroke/transient Ischaemic attack, thrombosis, congestive cardiac failure, myocardial infarction, renal failure) and mortality | |
| Study dates | Not stated | |
| Notes | Same trial as Lidder 2013a and Lidder 2013c, but group C compared with control | |
| Risk of bias | ||
| Bias | Authors' judgement | Support for judgement |
| Random sequence generation (selection bias) | Low risk | Randomisation codes were computer‐generated using Microsoft Excel. |
| Allocation concealment (selection bias) | Low risk | Randomisation codes were held in sealed, opaque envelopes. |
| Blinding of participants and personnel (performance bias) All outcomes | Low risk | Participants and investigators were blinded to the treatment allocation. The active and placebo products were packaged identically. |
| Blinding of outcome assessment (detection bias) All outcomes | Low risk | Analysis was conducted by a trialist blinded to which intervention the participants received. |
| Incomplete outcome data (attrition bias) All outcomes | Low risk | There were none lost to follow‐up. |
| Selective reporting (reporting bias) | Low risk | The trial reported all‐cause mortality and serious adverse events. |
| For‐profit bias | High risk | One of the authors received grants from "Numico Research". |
| Other bias | Low risk | The trial appeared to be free of other components that could put it at risk of bias. |
Lidder 2013c.
| Methods | Randomised clinical trial, UK | |
| Participants | 120 hospitalised adults with planned curative resection and primary anastomosis of histologically‐confirmed colorectal cancer, at nutritional risk due to weight loss > 5% over the past 3 months Male:Female = 61:57(gender not reported for two participants) Mean age = approximately 70 years Exclusion criteria: younger than18 years, inability to give informed consent, frailty (unlikely to be able to mobilise immediately after the operation), participation in another trial, pregnancy, diabetes, a preoperative fasting glucose > 7 mmol/l, use of steroids or immunosuppressants, history of abnormal gastric emptying, intestinal obstruction, or concurrent parenteral or enteral nutrition |
|
| Interventions | Experimental group: Group B: Received carbohydrate drinks preoperatively. On the day of surgery, 400 ml of carbohydrate supplement was given 2 hrs before surgery. The supplement consisted of carbohydrate, 50 kcal per 100 ml, 290 mOsm/kg, pH 5.0(n = 30) Group C: Received a postoperative carbohydrate drink (Fortifresh!, Numico) consisting of 50 kcal per 100 ml, 965 mOsm/kg, pH 4.2(n = 32) Group D: Received the same preoperative carbohydrate drink as group B and the same postoperative carbohydrate drink as group C(n = 31) Control group (group A): Received placebo(n = 27) Co‐interventions: Free fluids permitted immediately after surgery and a light diet as tolerated |
|
| Outcomes | Postoperative fluid balance, energy intake, insulin resistance, hand‐grip strength, peak expiratory flow rate, intestinal permeability, bowel function, nausea, vomiting, abdominal pain, insulin, glucose, length of postoperative hospital stay, postoperative complications (wound infection, pneumonia, diarrhoea, septicaemia, anastamotic leak, intra‐abdominal collection, intestinal obstruction, ileus, stroke/transient ischaemic attack, thrombosis, congestive cardiac failure, myocardial infarction, renal failure) and mortality | |
| Study dates | Not stated | |
| Notes | Same trial as Lidder 2013a and Lidder 2013b, but group D compared with control. We contacted the authors on 11th November 2015 by email: sjl@doctors.org.uk. We received information on hand‐grip strength, BMI and weight. | |
| Risk of bias | ||
| Bias | Authors' judgement | Support for judgement |
| Random sequence generation (selection bias) | Low risk | Randomisation codes were computer‐generated using Microsoft Excel. |
| Allocation concealment (selection bias) | Low risk | Randomisation codes were held in sealed, opaque envelopes. |
| Blinding of participants and personnel (performance bias) All outcomes | Low risk | Participantsand investigators were blinded to the treatment allocation. The active and placebo products were packaged identically. |
| Blinding of outcome assessment (detection bias) All outcomes | Low risk | Analysis was conducted by a trialist blinded to which intervention the participants received. |
| Incomplete outcome data (attrition bias) All outcomes | Low risk | There were none lost to follow‐up. |
| Selective reporting (reporting bias) | Low risk | The trial reported all‐cause mortality and serious adverse events. |
| For‐profit bias | High risk | One of the authors received grants from "Numico Research". |
| Other bias | Low risk | The trial appeared to be free of other components that could put it at risk of bias. |
Liu 1990.
| Methods | Randomised clinical trial, China | |
| Participants | 12 hospitalised adults undergoing radical gastrectomy for advanced gastric antrum cancer and with normal liver and kidney function, at nutritional risk due to advanced gastric cancer after radical gastrectomy Male:Female = Unclear Mean age = 55 years Exclusion criteria: metabolic diseases |
|
| Interventions | Experimental group: Intravenous nutrition with 134 ± 15.9 kJ/kg (32 ± 3.8 kcal/kg) calories a day, including the use of 14‐823 Compound amino acid liquid which was produced by Changzheng pharmaceutical factory, Shanghai, as a protein stroma with a dosage of 1.23 g/kg/day).(n = 6) Control group: conventional fluid infusion with 59 ± 5.0 kJ/kg (14 ± 1.2 kcal/kg) calories a day without exogenous protein intake (n = 6) Co‐interventions: after been hospitalised, all participants were given fixed diet (1.3 g/kg protein and 121 kJ/kg (29 kcal/kg) calories) a day for a week prior to the surgery. |
|
| Outcomes | The decomposition rate of total protein, creatinine, urea nitrogen, 3‐methylhistidine (3‐MN), serum CPK and change of weight | |
| Study dates | Not stated | |
| Notes | We could obtain no contact information for the authors. | |
| Risk of bias | ||
| Bias | Authors' judgement | Support for judgement |
| Random sequence generation (selection bias) | Unclear risk | Not described |
| Allocation concealment (selection bias) | Unclear risk | Not described |
| Blinding of participants and personnel (performance bias) All outcomes | High risk | Participants and personnel were not blinded |
| Blinding of outcome assessment (detection bias) All outcomes | Unclear risk | The procedure of blinding was insufficiently described. |
| Incomplete outcome data (attrition bias) All outcomes | Unclear risk | The number of participants with incomplete data was not reported. |
| Selective reporting (reporting bias) | Unclear risk | No protocol could be obtained and the trial did not report on all‐cause mortality or serious adverse event. |
| For‐profit bias | Unclear risk | It was unclear how the trial was funded. |
| Other bias | Low risk | The trial appeared to be free of other components that could put it at risk of bias. |
Liu 1996b.
| Methods | Randomised clinical trial, China | |
| Participants | 29 hospitalised adults between 60 ˜ 80 year admitted with gastrointestinal disorders, at nutritional risk due major surgery Male:Female = 17:12 Mean age = 66.2 years Exclusion criteria: Other serious diseases, besides the gastrointestinal system |
|
| Interventions | Experimental group: Parenteral nutrition was given through peripheral vein or central vein in perioperative period, and ½ ˜ ⅔ dose on surgery day. The treatment course was 5 ˜ 14 days. The non‐protein calorie was given as 150% of basic energy consumption (BEE) (calculated through Harris and Benedict equation), provided by prepared nutrient solution (7 g nitrogen and 25% glucose/L, and trace elements, vitamin, electrolyte). Control group: participants were encouraged to eat food, and given fluid supplement prior to the surgery; general intravenous infusion of glucose, isotonic saline and vitamin, etc. were given after surgery. |
|
| Outcomes | Plasma albumin, lymphocyte count, weight, postoperative complications | |
| Study dates | Not stated | |
| Notes | We could obtain no contact information for the authors. | |
| Risk of bias | ||
| Bias | Authors' judgement | Support for judgement |
| Random sequence generation (selection bias) | Low risk | The sequence generation was achieved using a random‐numbers table. |
| Allocation concealment (selection bias) | Unclear risk | Not described |
| Blinding of participants and personnel (performance bias) All outcomes | High risk | Participants and personnel were not blinded. |
| Blinding of outcome assessment (detection bias) All outcomes | Unclear risk | The procedure of blinding was insufficiently described. |
| Incomplete outcome data (attrition bias) All outcomes | Unclear risk | The number of participants with incomplete data was not reported. |
| Selective reporting (reporting bias) | Unclear risk | No protocol could be obtained and the trial did not report on all‐cause mortality. |
| For‐profit bias | Unclear risk | It was unclear how the trial was funded. |
| Other bias | Low risk | The trial appeared to be free of other components that could put it at risk of bias. |
Liu 1997.
| Methods | Randomised clinical trial, China | |
| Participants | 41 hospitalised adults admitted with COPD (diagnostic criteria standard), at nutritional risk due to being elderly with COPD Male:Female = 32:6 (gender not reported for three participants) Mean age = 66 years Exclusion criteria: Unclear |
|
| Interventions | Experimental group: Normal diet + nutraceutical series made by Huarui Pharmaceutical Co. Ltd. 1. 20% Intralipid 250 ml+ Soluvit 10 ml, and 2.vamin N solution 250 ml+ Addamel 10 ml ivgtt, alternating twice a week(n = 29) Control group: no intervention(n = 9) Co‐interventions: Normal diet |
|
| Outcomes | Weight, circumference of the upper arm, albumin, trace elements in plasma (Fe, Cu, Zn), lung function, humoral immunity, T cells (T3, T4, T8) | |
| Study dates | Not stated | |
| Notes | We contacted the author by phone 3 times, but he had no time to answer. | |
| Risk of bias | ||
| Bias | Authors' judgement | Support for judgement |
| Random sequence generation (selection bias) | Unclear risk | Not described |
| Allocation concealment (selection bias) | Unclear risk | Not described |
| Blinding of participants and personnel (performance bias) All outcomes | High risk | Participants and personnel were not blinded. |
| Blinding of outcome assessment (detection bias) All outcomes | Unclear risk | The procedure of blinding was insufficiently described. |
| Incomplete outcome data (attrition bias) All outcomes | Unclear risk | The number of participants with incomplete data was not reported. |
| Selective reporting (reporting bias) | Unclear risk | No protocol could be obtained and the trial did not report on all‐cause mortality or serious adverse events. |
| For‐profit bias | Unclear risk | It was unclear how the trial was funded. |
| Other bias | Low risk | The trial appeared to be free of other components that could put it at risk of bias. |
Liu 2000a.
| Methods | Randomised clinical trial, China | |
| Participants | 40 hospitalised adults admitted with advanced pancreatic carcinoma by pathological diagnosis and undergoing palliative operation, at nutritional risk due to major surgery Male:Female = 25:15 Mean age = 58 years Exclusion criteria: Unclear |
|
| Interventions | Experimental group: TPN: total caloric value (NPC) 20 Kcal/(kg/day), N/Q = 1 g: 125 Kcal, glucose:fat = 6:4. The average course of treatment was 11.5 days (8 ˜ 15 days). (n = 20) Control group: Routine treatment; the detailed information and the course of the treatment were unclear.(n = 20) Co‐interventions: All participants received combined chemotherapy, with a regimen of 5‐Fu + CF + MMC+DDP/EPI (5‐fluorouracil + Calcium folniate + Cisplatin or Eplrubicin) or IFN‐γ(interferon‐γ). Dosages of drugs were modified for bone marrow toxicity, stomatitis and declining performance status. After 28 days, the regimen was repeated. |
|
| Outcomes | Nutritional and immunological parameters, quality of life, effects of treatment | |
| Study dates | Not stated | |
| Notes | We could obtain no contact information for the authors. | |
| Risk of bias | ||
| Bias | Authors' judgement | Support for judgement |
| Random sequence generation (selection bias) | Unclear risk | Not described |
| Allocation concealment (selection bias) | Unclear risk | Not described |
| Blinding of participants and personnel (performance bias) All outcomes | High risk | Participants and personnel were not blinded. |
| Blinding of outcome assessment (detection bias) All outcomes | Unclear risk | The procedure of blinding was insufficiently described. |
| Incomplete outcome data (attrition bias) All outcomes | Unclear risk | The number of participants with incomplete data was not reported. |
| Selective reporting (reporting bias) | Unclear risk | No protocol could be obtained and the trial did not report on all‐cause mortality. |
| For‐profit bias | Unclear risk | It was unclear how the trial was funded. |
| Other bias | Low risk | The trial appeared to be free of other components that could put it at risk of bias. |
Liu 2008.
| Methods | Randomised clinical trial, China | |
| Participants | 48 hospitalised adults admitted with thoracolumbar vertebral tuberculosis and had received anti‐tuberculosis treatment for 4 weeks, haemoglobin > 10 g/L, and did not have abortive tuberculosis in other parts; surgical indications where the following surgery could be conducted: anterior cervical lesions removal + autogenous iliac bone graft + anterior plate internal fixation, definitely diagnosed as TB by intraoperative rapid pathological section, and continue to anti‐tuberculosis after the surgery; agreed to participate in the trial and could co‐operate with researchers. At nutritional risk due to thoracolumbar spinal tuberculosis Male:Female = 25:23 Mean age = 48.25 years Exclusion criteria: Unclear |
|
| Interventions | Experimental group: Parenteral nutrition (0.2 g/kg nitrogen and 104.6 KJ/kg calorie, nitrogen comes from aminophenol, 60% non‐protein calories provided by glucose, and 40% of them are provided by fat emulsion, aminophenol preparation was 8.5% Novamin, fat emulsion was 20%, 30% Introlipid). Given on the basis of the common diet, started 7 days prior to the surgery and lasted until 7 days after the operation. It was put into 3 L sacks,and infused through the jugular vein.(n = 24) Control group: Ordinary diet was given prior to the surgery, liquid diet and intravenous fluids (glucose and saline) were started from the 1st day after the surgery, and normal diet afterwards. (n = 24) |
|
| Outcomes | Weight, serum albumin, ESR | |
| Study dates | Not stated | |
| Notes | We tried and failed 3 times to contact the author by phone. | |
| Risk of bias | ||
| Bias | Authors' judgement | Support for judgement |
| Random sequence generation (selection bias) | Unclear risk | Not described |
| Allocation concealment (selection bias) | Unclear risk | Not described |
| Blinding of participants and personnel (performance bias) All outcomes | High risk | Participants and personnel were not blinded. |
| Blinding of outcome assessment (detection bias) All outcomes | Unclear risk | The procedure of blinding was insufficiently described. |
| Incomplete outcome data (attrition bias) All outcomes | Unclear risk | The number of participants with incomplete data was not reported. |
| Selective reporting (reporting bias) | Unclear risk | No protocol could be obtained and the trial did not report on all‐cause mortality. |
| For‐profit bias | Unclear risk | It was unclear how the trial was funded. |
| Other bias | Low risk | The trial appeared to be free of other components that could put it at risk of bias. |
Ljunggren 2012.
| Methods | Randomised clinical trial, Sweden | |
| Participants | 60 hospitalised adults undergoing elective hip fracture surgery, at nutritional risk due to being frail elderly with hip fracture Male:Female = not reported Mean age = 69 years. Exclusion criteria: endocrinologic disorders, including diabetes, and treatment with cortisone |
|
| Interventions | Experimental group: a carbohydrate drink (50 kcal/100 mL; Preop, NutriciaNordica AB, Stockholm, Sweden) 800 mL in the evening before the surgery (Day 0) and 400 mL 2 hrs before entering the operating room (Day 1) (n = 20) Control group: no food or water from midnight before the surgery (n = 20) |
|
| Outcomes | Stress (cortisol in plasma and urine), muscle catabolism (urinary 3‐methylhistidine), well‐being, glucose clearance and insulin sensitivity | |
| Study dates | Not stated | |
| Notes | We contacted the authors on 2nd October 2015 by email: r.hahn@telia.com. We received information on randomisation, quality of life, serious adverse events. | |
| Risk of bias | ||
| Bias | Authors' judgement | Support for judgement |
| Random sequence generation (selection bias) | Unclear risk | The randomisation was not performed by an independent party. It was performed by making envelopes with the intervention to be received and these envelopes were then put into a bag. It was unclear if this unorthodox method was at low risk of bias. |
| Allocation concealment (selection bias) | Low risk | The envelopes used for randomisation are described as sealed and opaque. |
| Blinding of participants and personnel (performance bias) All outcomes | High risk | The study was not blinded. |
| Blinding of outcome assessment (detection bias) All outcomes | High risk | The study was not blinded. |
| Incomplete outcome data (attrition bias) All outcomes | Low risk | There were 5% dropouts. |
| Selective reporting (reporting bias) | Low risk | The outcomes stated in the protocol were reported on. |
| For‐profit bias | Low risk | Supported by: Olle Engkvist Byggmästare Foundation the Stockholm County Council (Grant number 2009 – 0433). |
| Other bias | Low risk | The trial appeared to be free of other components that could put it at risk of bias. |
Lough 1990.
| Methods | Randomised clinical trial, UK | |
| Participants | 29 hospitalised adults undergoing bone marrow transplantation Male:Female = 20:9 Mean age = 69 Exclusion criteria: none stated |
|
| Interventions | Experimental group: TPN as a solution of dextrose (50%), intralipid (20%), amino acid (8.5%), sodium, potassium, magnesium, SolivitoH, Vitlipid; Addamel for 14 days (n = 14) Control group: 5% dextrose solution for 14 days (n = 15) Co‐intervention: standard care including standard oral diet |
|
| Outcomes | Weight, albumin, transferrin, mortality | |
| Study dates | Not stated | |
| Notes | We found no contact information for the authors. | |
| Risk of bias | ||
| Bias | Authors' judgement | Support for judgement |
| Random sequence generation (selection bias) | Unclear risk | Not described |
| Allocation concealment (selection bias) | Unclear risk | The envelopes were described as sealed but it was unclear if they were opaque. |
| Blinding of participants and personnel (performance bias) All outcomes | Unclear risk | Not described |
| Blinding of outcome assessment (detection bias) All outcomes | Unclear risk | Not described |
| Incomplete outcome data (attrition bias) All outcomes | Unclear risk | It was unclear how many participants had incomplete outcome data |
| Selective reporting (reporting bias) | Unclear risk | The trial reports survival at 100 days but does not report complications in general terms |
| For‐profit bias | Unclear risk | It was unclear how the trial was funded |
| Other bias | Low risk | The trial appeared to be free of other components that could put it at risk of bias |
Lu 1996.
| Methods | Randomised clinical trial, China | |
| Participants | 27 hospitalised adults undergoing radical total gastrectomy (RTG) due to gastric cardia cancer with a weight loss of at least 10% during the last 3 months, at nutritional risk due to major surgery Male:Female = 18:9 Mean age = 55(E), 40(C) Exclusion criteria: Unclear |
|
| Interventions | Experimental group: TPN with 35 ˜ 40 Kcal/kg calories, 0.2 g/kg nitrogen each day. 30% ˜ 40% non‐protein calorie was provided by the 10% Intralipid, 60% to 70% of them was provided by glucose. The course of the treatment was unclear. (n = 17) Control group: partial parenteral nutrition with 15 ˜ 20 kcal/kg calories provided by glucose, and 0 ˜ 0.1 g/kg nitrogen each day. The course of the treatment was unclear. (n = 10) |
|
| Outcomes | NK cell activity,T lymphocyte and its subsets (CD3+, CD4+, CD8+). | |
| Study dates | Not stated | |
| Notes | We tried to contact the author by phone 3 times, but the author was too busy to answer. | |
| Risk of bias | ||
| Bias | Authors' judgement | Support for judgement |
| Random sequence generation (selection bias) | Unclear risk | Not described |
| Allocation concealment (selection bias) | Unclear risk | Not described |
| Blinding of participants and personnel (performance bias) All outcomes | High risk | Participants and personnel were not blinded. |
| Blinding of outcome assessment (detection bias) All outcomes | Unclear risk | The procedure of blinding was insufficiently described. |
| Incomplete outcome data (attrition bias) All outcomes | Unclear risk | The number of participants with incomplete data was not reported. |
| Selective reporting (reporting bias) | Unclear risk | No protocol could be obtained and the trial did not report on all‐cause mortality or serious adverse events. |
| For‐profit bias | Unclear risk | It was unclear how the trial was funded. |
| Other bias | Low risk | The trial appeared to be free of other components that could put it at risk of bias. |
Luo 2011.
| Methods | Randomised clinical trial, China | |
| Participants | 127 hospitalised adults admitted due to hip fracture surgery within 14 days of fracture and serum albumin levels < 38 g/l as well as moderately malnourished, at nutritional risk due to being frail elderly Male:Female = not stated Mean age = not stated Exclusion criteria: none stated |
|
| Interventions | Experimental group: ONS 3 times a day (100 ml between meals and 200 ml as evening snack). Each 200 ml (389 kcal, 17 g protein, 18 g fat, 40 g CHO) for 28 days (n = 63) Control group: No intervention(n = 64) Co‐interventions: Standard hospital diet |
|
| Outcomes | Weight, serum albumin, pre‐albumin, total protein, suture status and functional recovery status | |
| Study dates | Not stated | |
| Notes | We could obtain no contact information for the authors. | |
| Risk of bias | ||
| Bias | Authors' judgement | Support for judgement |
| Random sequence generation (selection bias) | Unclear risk | Not described |
| Allocation concealment (selection bias) | Unclear risk | Not described |
| Blinding of participants and personnel (performance bias) All outcomes | Unclear risk | Not described |
| Blinding of outcome assessment (detection bias) All outcomes | Unclear risk | Not described |
| Incomplete outcome data (attrition bias) All outcomes | Unclear risk | The reasons for dropouts were unclear. |
| Selective reporting (reporting bias) | Unclear risk | No protocol could be obtained, and the trial did not report on all‐cause mortality or serious adverse events. |
| For‐profit bias | Unclear risk | It was unclear how the trial was funded. |
| Other bias | Low risk | The trial appeared to be free of other components that could put it at risk of bias. |
Luo 2012.
| Methods | Randomised clinical trial, China | |
| Participants | 60 hospitalised adults diagnosed with acute exacerbation of COPD, at nutritional risk due to trialist indication Male:Female = Unclear Mean age = Unclear Exclusion criteria: Malignant tumour, gastro‐intestinal bleeding, intestinal obstruction, gastroenteritis, severe haemodynamic instability, severe liver and kidney function, hyperthyroidism, diabetes, tuberculosis |
|
| Interventions | Experimental group: A deep venous catheter was adopted for nutritional support. Amino acid was provided by 8.5% novamin, fat was provided by 20% medium long chain fat emulsion. Fat and glucose accounted for 50% of the energy. Supplement water‐soluble vitamins, fat‐soluble vitamins and micro elements were given each day. (n = 30) Control group: no intervention(n = 30) Co‐interventions: placement of nasogastric tube and started feeding at an amount of 20 ml/h nutrition by pumping. Residual gastric volume was checked every 4 hrs, and the feeding speed was increased with 20 ml/h every 8 hrs if residual gastric volume was below 200 ml and no abdominal distention, or diarrhoea occurred. It was continued until target quantity. The speed was suspended to give nutrition and assessed after 4 hrs if the gastric residual was above 200 ml or abdominal distension and diarrhoea occurred. Instead was chosen Nutrison Fibre (a balanced EN mixed suspension,with total protein fibre type, containing a variety of dietary fibre,16% protein, 35% fat and 49% carbohydrate, energy density of 6.276 kJ/ml,and calorie/nitrogen ratio of 548.1 kJ:lg) as nutraceutical. |
|
| Outcomes | Urine nitrogen, nitrogen balance, the former protein, transferrin before and 7 days after treatment, 7‐day and 28‐day offline success rate, 28‐day incidence of ventilator‐associated pneumonia (VAP) and mortality at 28 days | |
| Study dates | Not stated | |
| Notes | We tried but failed to contact the authorsby phone. | |
| Risk of bias | ||
| Bias | Authors' judgement | Support for judgement |
| Random sequence generation (selection bias) | Low risk | The sequence generation was achieved using a random‐numbers table. |
| Allocation concealment (selection bias) | Unclear risk | Not described |
| Blinding of participants and personnel (performance bias) All outcomes | High risk | Participants and personnel were not blinded. |
| Blinding of outcome assessment (detection bias) All outcomes | Unclear risk | The procedure of blinding was insufficiently described. |
| Incomplete outcome data (attrition bias) All outcomes | Unclear risk | The number of participants with incomplete data was not reported. |
| Selective reporting (reporting bias) | Unclear risk | No protocol could be obtained and the trial did not report on all‐cause mortality or serious adverse event. |
| For‐profit bias | Unclear risk | It was unclear how the trial was funded. |
| Other bias | Low risk | The trial appeared to be free of other components that could put it at risk of bias. |
López 2008.
| Methods | Randomised clinical trial, Spain | |
| Participants | 24 hospitalised adults undergoing elective gastroenterologic surgery, at nutritional risk due to undergoing major surgery Male:Female = not stated Mean age = not stated (between 30 ‐ 80) Exclusion criteria: no kidney or liver disease, no peritoneal carcinomatosis or known metastasis, no malnutrition (normal albumin and transthyretin, normal BMI, no weight loss greater than 10% in the last 3 months) and no metabolic disease |
|
| Interventions | Experimental group: was given 3 different formulas of parenteral nutrition Group 2: 5% glucose, 30 g/L aminoacids(n = 6) Group 3: 6.7% carbohydrates, 30 g/L aminoacids, 16.6 g/L fat(n = 6) Group 4: 10% carbohydrates, 45 g/L amino acids, 44.4 g/L fat(n = 6) Control group: 5% glucose (n = 6) |
|
| Outcomes | Whole body protein, nitrogen balance | |
| Study dates | Not stated | |
| Notes | We contacted the authors on 13th July 2016 by email: joalopez@ir.vhebron.net. We received no reply. | |
| Risk of bias | ||
| Bias | Authors' judgement | Support for judgement |
| Random sequence generation (selection bias) | Low risk | Random‐numbers table |
| Allocation concealment (selection bias) | Unclear risk | Not described |
| Blinding of participants and personnel (performance bias) All outcomes | Low risk | Coded black infusion bags |
| Blinding of outcome assessment (detection bias) All outcomes | Unclear risk | Not described |
| Incomplete outcome data (attrition bias) All outcomes | Unclear risk | The number of participants with incomplete data was not reported. |
| Selective reporting (reporting bias) | Unclear risk | No protocol could be obtained and the trial did not report mortality or serious adverse events. |
| For‐profit bias | Low risk | "This study was supported by the Spanish Ministry of Health Grant FIS 97/ 0932.". |
| Other bias | Low risk | The trial appeared to be free of other components that could put it at risk of bias. |
MacFie 2000.
| Methods | Randomised clinical trial, UK | |
| Participants | 52 hospitalised adults undergoing elective major gastrointestinal surgery, at nutritional risk due to major gastrointestinal surgery Male:Female = 20:32 Mean age = 65 years Exclusion criteria: dementia, major concurrent metabolic problems, such as uncontrolled diabetes, advanced liver disease, or uraemia, and those requiring emergency surgery |
|
| Interventions | Experimental group: Oral Dietary Supplements for at least 7 days Oral dietary supplements were available in 200‐mL cartons (Fortisip, Nutricia Ltd., Towbridge, Wiltshire, UK), in a variety of flavours providing 1.5 kcal, 0.05 g protein, and 0.18 g carbohydrate per mL. A fruit‐flavored supplement (Fortijuice, Nutricia Ltd.) was available as an alternative, providing 1.25 kcal, 0.025 g protein, and 0.285 g carbohydrate per mL. Participants were instructed to drink the supplements in addition to and not in place of their normal diet and were encouraged to take a minimum of 2 cartons daily. They were advised to drink only the volume of supplement they felt able to tolerate. (n = 27) Control group: No intervention(n = 25) Co‐interventions: Normal diet |
|
| Outcomes | Nutritional status, voluntary food intake, weight loss, serum albumin, morbidity and mortality, anxiety and depression, postoperative activity levels, hand‐grip strenght, midarm circumference, triceps skinfold thickness and BMI | |
| Study dates | Not stated | |
| Notes | We include only the inpatient part of the trial. We contacted the author on 30th June 2015 by email: johnmacfie@aol.com. We received information on financial support and randomisation. | |
| Risk of bias | ||
| Bias | Authors' judgement | Support for judgement |
| Random sequence generation (selection bias) | Low risk | Randomisation was done by a random‐number sequence. |
| Allocation concealment (selection bias) | Low risk | Sealed envelopes were used. |
| Blinding of participants and personnel (performance bias) All outcomes | High risk | Described as unblinded |
| Blinding of outcome assessment (detection bias) All outcomes | High risk | Described as unblinded |
| Incomplete outcome data (attrition bias) All outcomes | Unclear risk | The amount of dropouts was unclear. |
| Selective reporting (reporting bias) | Low risk | No protocol published, but the trial reported all‐cause mortality and serious adverse events. |
| For‐profit bias | Low risk | No financial support. |
| Other bias | Low risk | The trial appeared to be free of other components that could put it at risk of bias. |
Maderazo 1985.
| Methods | Randomised clinical trial, USA | |
| Participants | 18 hospitalised adults admitted following motor vehicle accidents, at nutritional risk due to trauma | |
| Interventions | Experimental group: intravenous hyperalimentation for at least 7 days(n = 9) Control group: no intravenous hyperalimentation (n = 9) |
|
| Outcomes | Chemokinesis, chemotaxis | |
| Study dates | Not stated | |
| Notes | We could obtain no contact information for the authors. | |
| Risk of bias | ||
| Bias | Authors' judgement | Support for judgement |
| Random sequence generation (selection bias) | Unclear risk | Not described |
| Allocation concealment (selection bias) | Unclear risk | Not described |
| Blinding of participants and personnel (performance bias) All outcomes | Unclear risk | Not described |
| Blinding of outcome assessment (detection bias) All outcomes | Unclear risk | Not described |
| Incomplete outcome data (attrition bias) All outcomes | Unclear risk | The number of participants with incomplete data was not reported. |
| Selective reporting (reporting bias) | Unclear risk | No protocol could be obtained, and the trial did not report on all‐cause mortality or serious adverse events. |
| For‐profit bias | Unclear risk | It was unclear how the trial was funded. |
| Other bias | Low risk | The trial appeared to be free of other components that could put it at risk of bias. |
Malhotra 2004.
| Methods | Randomised clinical trial, India | |
| Participants | 200 hospitalised adults undergoing surgical intervention for peritonitis following perforation of the gut, at nutritional risk due to major surgery Male:Female = 159:41 Mean age = 37 years Exclusion criteria: Undergoing ileostomy. |
|
| Interventions | Experimental group: Early Enteral Nutrition (through a naso‐gastric tube) from the 2nd postoperative day 100 grams of a balanced diet formula (containing proteins, fats, carbohydrates, vitamins, minerals and fibre) dissolved in 500 ml of gram dry weight (GDW) 5% (600 Calories) was given slowly at the rate of 50 ml/hr by an intravenous drip set connected to a nasogastric tube. Participants received another 300 ‐ 400 calories in the form of intravenous dextrose. From the 5th postoperative day, in addition to enteral feeds, participants were kept on intravenous patency line. Between the 8th and t10th day the nasogastric tube was removed and complete oral feeds in the form of semi‐solid diet were begun. (n = 100) Control group: Conventional regimen of intravenous fluid administration for up to 7 days and kept nil by oral intake. Participants were assessed for the feasibility of oral intake on the 5th postoperative day and those found suitable were given sips of an appetising liquid. Those tolerating the sips graduated to 500‐ml liquids and then semi‐solids over the next 2 days. Those who did not tolerate oral feed stayed on intravenous fluids till they could take feeds orally.(n = 100) | |
| Outcomes | Complications: wound infection, wound dehiscence, pneumonia, leakage of anastomoses, abdominal distension, vomiting, diarrhoea, leak, septicaemia and death. Calorie intake, mean duration of stay, mean duration of ICU stay. Determination of weight on the 1st, 7th and 10th postoperative days or at the time of discharge, or both. Biochemical and haematological investigations that were done included: estimation of haemoglobin concentration, levels of albumin and creatinine in the serum, blood urea levels and urinary urea levels on the 3rd and 8th postoperative days. |
|
| Study dates | May 2000 and February 2003 | |
| Notes | On postoperative day 8, 84% from the experimental group and 0% from the control group received over 2500 calories a day. We have estimated this to be an adequate amount of nutrition for the experimental group and an inadequate amount for the control group. We could otain no contact information. | |
| Risk of bias | ||
| Bias | Authors' judgement | Support for judgement |
| Random sequence generation (selection bias) | Low risk | Randomisation was performed using random tables. |
| Allocation concealment (selection bias) | Unclear risk | Not described |
| Blinding of participants and personnel (performance bias) All outcomes | High risk | Blinding was not performed. |
| Blinding of outcome assessment (detection bias) All outcomes | Unclear risk | Not described |
| Incomplete outcome data (attrition bias) All outcomes | Low risk | 5 left against medical advice. In the experimental group there were 3 drop outs because of side effects. |
| Selective reporting (reporting bias) | Low risk | No protocol published, but the trial reported all‐cause mortality and serious adverse events. |
| For‐profit bias | Unclear risk | It was unclear how the trial was funded. |
| Other bias | Low risk | The trial appeared to be free of other components that could put it at risk of bias. |
Mattox 1992.
| Methods | Randomised clinical trial, USA | |
| Participants | 18 hospitalised adults admitted for rectal carcinoma surgery, at nutritional risk due to major surgery. Male:Female = not stated Mean age = not stated Exclusion criteria: none stated |
|
| Interventions | Experimental group: Lipid‐based TPN(n = 9) Control group: Intravenous fluid (n = 9) | |
| Outcomes | Tumour protein synthesis | |
| Study dates | Not stated | |
| Notes | We contacted the author on 13th December 2015 by email: mattoxtw@moffitt.usf.edu. We received no reply. | |
| Risk of bias | ||
| Bias | Authors' judgement | Support for judgement |
| Random sequence generation (selection bias) | Unclear risk | Not described |
| Allocation concealment (selection bias) | Unclear risk | Not described |
| Blinding of participants and personnel (performance bias) All outcomes | Unclear risk | Not described |
| Blinding of outcome assessment (detection bias) All outcomes | Unclear risk | Not described |
| Incomplete outcome data (attrition bias) All outcomes | Unclear risk | The reasons for dropouts were unclear. |
| Selective reporting (reporting bias) | Unclear risk | No protocol could be obtained, and the trial did not report on all‐cause mortality or serious adverse events. |
| For‐profit bias | Unclear risk | It was unclear how the trial was funded. |
| Other bias | Low risk | The trial appeared to be free of other components that could put it at risk of bias. |
Maude 2011.
| Methods | Randomised clinical trial, Thailand | |
| Participants | 56 hospitalised adult with proven cerebral plasmodium falciparum malaria, at nutritional risk due to being admitted to an ICU. Male:Female = 10:46 Mean age = 31 years |
|
| Interventions | Experimental group: Enteral feeding at admission (1000 – 2000 kCal every 24 hrs for an adult weighing 50 kg) (n = 27)
Control group: Standard i.v. fluids (n = 29) Co‐interventions: Nasogastric tube at admission + after 60 hours: continued enteral nutrition or oral feeding if the participants were able to |
|
| Outcomes | Aspirations, pneumonia, death, sepsis | |
| Study dates | Not stated | |
| Notes | We contacted the author on 19th August 2015 by email: arjen@tropmedres.ac, and on 23rd August 2015 by email: Richard@tropmedres.ac. We only received an initial response. | |
| Risk of bias | ||
| Bias | Authors' judgement | Support for judgement |
| Random sequence generation (selection bias) | Unclear risk | Not described |
| Allocation concealment (selection bias) | Low risk | The allocation was concealed in sealed envelopes. |
| Blinding of participants and personnel (performance bias) All outcomes | High risk | The trial was unblinded. |
| Blinding of outcome assessment (detection bias) All outcomes | High risk | The trial was unblinded. |
| Incomplete outcome data (attrition bias) All outcomes | Unclear risk | There were no dropouts. |
| Selective reporting (reporting bias) | High risk | Time to stand was not described in the trial. |
| For‐profit bias | Low risk | The trial was funded by: Wellcome Trust of Great Britain (www.wellcome.ac.uk, grant number 077166/Z/05/Z). |
| Other bias | Low risk | The trial appeared to be free of other components that could put it at risk of bias. |
McCarter 1998.
| Methods | Randomised clinical trial, USA | |
| Participants | 112 hospitalised adults with an appropriate clinical indication for PEG, 16 years of age or older, and life expectancy of 30 days or more, at nutritional risk due to trialist indication Male:Female = 63:49 Mean age = 63 years Exclusion: prior gastric surgery, evidence of gastro‐intestinal obstruction, known gastric or small bowel dysmotility, marked ascites, infection or cellultis at the anticipated PEG site, proximal small bowel fistula, neoplastic or infiltrative disease of the gastric wall, morbid obesity, extensive scarring of the anterior abdominal wall, prolonged prothrombin time not correctable to < 3 s of the control value, and platelet count < 50 K |
|
| Interventions | Experimental: started enteral feeding (Isocal) through PEG after 4 hours(n = 57) Control: no intervention(n = 55) Co‐intervention: enteral feeding (Isocal) after 24 hrs |
|
| Outcomes | Mortality, complications | |
| Study dates | Not stated | |
| Notes | We could find no contact information for the authors. | |
| Risk of bias | ||
| Bias | Authors' judgement | Support for judgement |
| Random sequence generation (selection bias) | Unclear risk | Not described |
| Allocation concealment (selection bias) | Unclear risk | Not described |
| Blinding of participants and personnel (performance bias) All outcomes | Unclear risk | Not described |
| Blinding of outcome assessment (detection bias) All outcomes | Unclear risk | Not described |
| Incomplete outcome data (attrition bias) All outcomes | Unclear risk | The number of participants with incomplete data was not reported. |
| Selective reporting (reporting bias) | Low risk | The trial reports mortality and complications. |
| For‐profit bias | Unclear risk | It was unclear how the trial was funded. |
| Other bias | Low risk | The trial appeared to be free of other components that could put it at risk of bias. |
McEvoy 1982.
| Methods | Randomised clinical trial, UK | |
| Participants | 51 hospitalised elderly adults at the the acute geriatric ward, at nutritional risk due to weight below 85% of ideal weight for height, triceps skinfold thickness below 85% of standard values or serum albumin level < 34 g/l Male:Female = Not reported Mean age = Not reported Exclusion criteria: Malignant conditions or metabolic disease such as thyrotoxicosis or diabetes |
|
| Interventions | Experimental group: received 2 sachets of “Build‐up” oral supplement daily providing 36.4 g protein and 644 kcal(n = 26) Control group: No intervention(n = 25) Co‐interventions: All received a normal hospital diet |
|
| Outcomes | Weight, triceps skinfold thickness, mid‐upper arm circumference, serum albumin level and nutritional status | |
| Study dates | Not stated | |
| Notes | We could obtain no contact information for the authors. | |
| Risk of bias | ||
| Bias | Authors' judgement | Support for judgement |
| Random sequence generation (selection bias) | Unclear risk | Not described |
| Allocation concealment (selection bias) | Unclear risk | Not described |
| Blinding of participants and personnel (performance bias) All outcomes | Unclear risk | Not described |
| Blinding of outcome assessment (detection bias) All outcomes | Unclear risk | Not described |
| Incomplete outcome data (attrition bias) All outcomes | Unclear risk | The number of participants with incomplete data was not reported. |
| Selective reporting (reporting bias) | Unclear risk | No protocol could be obtained, and the trial did not report on all‐cause mortality or serious adverse events. |
| For‐profit bias | Unclear risk | It was unclear how the trial was funded. |
| Other bias | Low risk | The trial appeared to be free of other components that could put it at risk of bias. |
McWhirter 1996a.
| Methods | Randomised clinical trial, UK | |
| Participants | 86 hospitalised adults admitted to a medical ward, at nutritional risk according to anthropometric measurements 29 were mildly, 23 moderately, and 34 were severely nutritionally depleted Male:Female = Not reported Mean age = 71 years Exclusion criteria: Not described |
|
| Interventions | Experimental group: Group 1: Participants received ONSs (n = 35) Group 2: Participants were tube‐fed, through nasogastric tube (n = 25) Feeding was continued until oral intake or nutritional status had improved sufficiently or when agreement between participant and medical staff deemed it appropriate, or on discharge from hospital. Nutrients were prescribed to make up the difference between inadequate oral intake and estimated energy requirements. Energy requirements were defined for each participant using the Schofield equation 24 corrected for stress and activity. All participants were fed for at least 7 days. Control group: No intervention(n = 26) Co‐interventions: Both intervention groups had access to hospital diet. |
|
| Outcomes | Nutritional status, nutritional intake, weight, height, triceps skinfold thickness, mid‐arm muscle circumference | |
| Study dates | Not stated | |
| Notes | Same trial as McWhirter 1996b with the results of experimental group 1 vs control. We contacted the authors on 17th November 2015 by email: janetbaxter@nhs.net. We received no additional information. | |
| Risk of bias | ||
| Bias | Authors' judgement | Support for judgement |
| Random sequence generation (selection bias) | Unclear risk | Not described |
| Allocation concealment (selection bias) | Unclear risk | Not described |
| Blinding of participants and personnel (performance bias) All outcomes | Unclear risk | Not described |
| Blinding of outcome assessment (detection bias) All outcomes | Unclear risk | Not described |
| Incomplete outcome data (attrition bias) All outcomes | Unclear risk | The description of the number of dropouts is unclear. |
| Selective reporting (reporting bias) | Unclear risk | The trial did not report on all‐cause mortality or serious adverse events. |
| For‐profit bias | High risk | The trial was supported by Clintec Nutrition Ltd. which might have and interest in the outcome. |
| Other bias | Low risk | The trial appeared to be free of other components that could put it at risk of bias. |
McWhirter 1996b.
| Methods | Randomised clinical trial, UK | |
| Participants | 86 hospitalised adults admitted to a medical ward, at nutritional risk according to anthropometric measurements 29 were mildly, 23 moderately, and 34 were severely nutritionally depleted. Male:Female = Not reported Mean age = 71 years Exclusion criteria: Not described |
|
| Interventions | Experimental group: Group 1: Participants received ONSs. (n = 35) Group 2: Participants were tube‐fed, through nasogastric tube. (n = 25) Feeding was continued until oral intake or nutritional status had improved sufficiently or when agreement between participant and medical staff deemed it appropriate, or on discharge from hospital. Nutrients were prescribed to make up the difference between inadequate oral intake and estimated energy requirements. Energy requirements were defined for each participant using the Schofield equation 24 corrected for stress and activity. All participants were fed for at least 7 days. Control group: No intervention(n = 26) Co‐interventions: Both intervention groups had access to hospital diet. |
|
| Outcomes | Nutritional status, nutritional intake, weight, height, triceps skinfold thickness, mid‐arm muscle circumference | |
| Study dates | Not stated | |
| Notes | Same trial as McWhirter 1996a with the results of experimental group 1 vs control. We contacted the authors on 17th November 2015 by email: janetbaxter@nhs.net. We received no additional information. | |
| Risk of bias | ||
| Bias | Authors' judgement | Support for judgement |
| Random sequence generation (selection bias) | Unclear risk | Not described |
| Allocation concealment (selection bias) | Unclear risk | Not described |
| Blinding of participants and personnel (performance bias) All outcomes | Unclear risk | Not described |
| Blinding of outcome assessment (detection bias) All outcomes | Unclear risk | Not described |
| Incomplete outcome data (attrition bias) All outcomes | Unclear risk | The description of the number of drop outs is unclear. |
| Selective reporting (reporting bias) | Unclear risk | The trial did not report on all‐cause mortality or serious adverse events. |
| For‐profit bias | High risk | The trial was supported by Clintec Nutrition Ltd. which might have and interest in the outcome. |
| Other bias | Low risk | The trial appeared to be free of other components that could put it at risk of bias. |
Meng 2014.
| Methods | Randomised clinical trial, China | |
| Participants | 64 hospitalised adults with hepatocellular carcinoma and cirrhosis, at nutritional risk due to hepatectomy Male:Female = 39:25 Mean age = 51 years Exclusion criteria: none specified |
|
| Interventions | Enteral nutrition suspension (TP‐MCT) 500ml (1 bottle/day) orally on 3rd preoperative day, using jejunal nutrient canal with 500 ml normal saline during operation for 12 hrs, and enteral nutrition suspension (TP‐MCT) 1000 ml on postoperative days 2 to 4; Based on co‐intervention. Total treatment duration was 7 days.(n = 55) Control: treatment as usual (n = 54) |
|
| Outcomes | Biomarkers, adverse events, complications | |
| Study dates | Not stated | |
| Notes | We tried to contact the authors by phone and by email: mengfl.123@163.com. We received no reply. | |
| Risk of bias | ||
| Bias | Authors' judgement | Support for judgement |
| Random sequence generation (selection bias) | Low risk | Random‐number table |
| Allocation concealment (selection bias) | Unclear risk | Not described |
| Blinding of participants and personnel (performance bias) All outcomes | High risk | Participants and personnel were not blinded. |
| Blinding of outcome assessment (detection bias) All outcomes | Unclear risk | Not described |
| Incomplete outcome data (attrition bias) All outcomes | Unclear risk | The number of participants with incomplete data was not described. |
| Selective reporting (reporting bias) | Low risk | No protocol but the trial reported on all‐cause mortality and serious adverse events. |
| For‐profit bias | Unclear risk | It was unclear how the trial was funded. |
| Other bias | Low risk | The trial appeared to be free of other components that could put it at risk of bias. |
Mezey 1991.
| Methods | Randomised clinical trial, USA | |
| Participants | 54 hospitalised adults with severe alcoholic hepatitis, recent history of heavy alcohol ingestion, laboratory‐based liver disease discriminant function defined as 4.6 X prothrombin time + serum bilirubin > 85 (mg/dl) and the clinical and laboratory characteristics adopted by the International Association for the Study of the Liver for the diagnosis of alcoholic hepatitis Male:Female = 32:22 Mean age = 43 years Exclusion criteria: pregnancy, cardiovascular, pulmonary or chronic kidney disease; pancreatitis, type I diabetes, recent (within 1 month) gastro‐intestinal bleeding, peptic ulcer disease, or concurrent infection |
|
| Interventions | Experimental group: 1L parenteral nutrition each 12 hour (25.8 g amino acids) for 30 days(n = 28)
Control group: no intervention(n = 26) Co‐intervention: Standard hospital diet + parenteral nutrition (6.5% glucose) |
|
| Outcomes | Biochemistry, mid‐arm circumference, triceps skinfold thickness, body weight, mortality | |
| Study dates | Not stated | |
| Notes | The trial was included late in the process of the review, so we did not contact the authors. | |
| Risk of bias | ||
| Bias | Authors' judgement | Support for judgement |
| Random sequence generation (selection bias) | Unclear risk | Not described |
| Allocation concealment (selection bias) | Low risk | The code was kept by the pharmaceutical company, and was not broken until the study was terminated. |
| Blinding of participants and personnel (performance bias) All outcomes | Unclear risk | The participants and investigators were described as unaware of the allocation. However, the placebo was not described. |
| Blinding of outcome assessment (detection bias) All outcomes | Unclear risk | It was described that the participants and investigators was unaware of the allocation. However, the placebo was not described. |
| Incomplete outcome data (attrition bias) All outcomes | Unclear risk | More than 5% were lost to follow‐up, and the trial did not use proper methodology to deal with missing data. |
| Selective reporting (reporting bias) | Unclear risk | No protocol could be obtained, and the trial did not report serious adverse events. |
| For‐profit bias | Low risk | The trial was funded by the United States‐Spanish Joint Committee for Scientific and Technological Cooperation (grant CCA‐85101050). |
| Other bias | Low risk | The trial appeared to be free of other components that could put it at risk of bias. |
Miller 2006a.
| Methods | Randomised clinical trial, Australia | |
| Participants | 100 hospitalised adults aged 70 or above and admitted with fall‐related lower limb fracture at nutritional risk due to being frail elderly with lower limb fracture Male:Female = 21:79 Mean age: 83 years Exclusion: Did not reside within southern Adelaide, unable to comprehend instructions relating to positioning of the upper arm for eligibility assessment, unable to fully weight‐bear on the side of the injury for more than 7 days post‐admission, not independently mobile prefracture, medically unstable/7 days post‐admission, suffering from cancer, chronic renal failure, unstable angina or unstable diabetes or were not classified as malnourished, (]/25th percentile for mid‐arm circumference of a large representative sample of older Australians/27.0 cm for men and 26.3 cm for males and 26.3 cm for women). |
|
| Interventions | Experimental group: Fortisip (Nutricia Australia Pty Ltd), a complete ONS (6.3 kJ (1.5 kcal)/mL, 16% protein, 35% fat and 49% carbohydrate). Between 580 ‐ 800 mL was given. (n = 25) Control: Attention control, with tri‐weekly visits (of equivalent duration) from weeks 1 to 6 and then weekly visits weeks 7 to 12, to match the home visits of the active intervention groups. (n = 26) Co‐intervention: usual clinical care, including general nutrition and exercise advice, usual dietetic and physiotherapy care, transfer to residential care, rehabilitation facility or directly home. |
|
| Outcomes | Mid‐arm circumference, quality of life, weight, quadriceps strength, mortality | |
| Study dates | September 2000 and October 2002 | |
| Notes | The groups with nutrition + resistance training vs resistance training alone. We contacted the authors on 25th January 2016 by email: maria.crotty@flinders.edu.au. We received no reply. The trial starts as an inpatient trial but the intervention continues outside the hospital. | |
| Risk of bias | ||
| Bias | Authors' judgement | Support for judgement |
| Random sequence generation (selection bias) | Low risk | Computer‐generated allocation sequence |
| Allocation concealment (selection bias) | Low risk | Sealed opaque envelopes |
| Blinding of participants and personnel (performance bias) All outcomes | Unclear risk | It was unclear if the trial was blinded. |
| Blinding of outcome assessment (detection bias) All outcomes | Unclear risk | it was unclear if the participants were blinded, and the trial reported quality of life. |
| Incomplete outcome data (attrition bias) All outcomes | High risk | There was above 5% dropouts for weight data and the trial did not account for the missing data properly. |
| Selective reporting (reporting bias) | Unclear risk | No protocol could be obtained. The trial reported all‐cause mortality but did not report serious adverse events. |
| For‐profit bias | High risk | Supported by: NHMRC Public Health Postgraduate Research Scholarship, Flinders University‐Industry Collaborative Research Grant and Nutricia Australia Pty Ltd. |
| Other bias | Low risk | The trial appeared to be free of other components that could put it at risk of bias. |
Miller 2006b.
| Methods | Randomised clinical trial, Australia | |
| Participants | 100 hospitalised adults aged 70 or above and admitted with fall‐related lower limb fracture, at nutritional risk due to being frail elderly with lower limb fracture Male:female = 21:79 Mean age: 83 years Exclusion: Did not reside within southern Adelaide, unable to comprehend instructions relating to positioning of the upper arm for eligibility assessment, unable to fully weight‐bear on the side of the injury for more than 7 days post‐admission, not independently mobile prefracture, medically unstable/7 days post‐admission, suffering from cancer, chronic renal failure, unstable angina or unstable diabetes or were not classified as malnourished, (]/25th percentile for mid‐arm circumference of a large representative sample of older Australians/27.0 cm for men and 26.3 cm for women) |
|
| Interventions | Experimental group: Fortisip (Nutricia Australia Pty Ltd), a complete oral nutritional supplement (6.3 kJ (1.5 kcal)/mL, 16% protein, 35% fat and 49% carbohydrate). Between 580 ‐ 800 mL was given. (n = 24) Control: Attention control, with tri‐weekly visits (of equivalent duration) from weeks 1 to 6 and then weekly visits weeks 7 to 12, to match the home visits of the active intervention groups. (n = 25) Co‐intervention: usual clinical care (including general nutrition and exercise advice, usual dietetic and physiotherapy care, transfer to residential care, rehabilitation facility or directly home) and resistance training. |
|
| Outcomes | Mid‐arm circumference, quality of life, weight, quadriceps strength, mortality | |
| Study dates | September 2000 and October 2002 | |
| Notes | Groups attention control vs nutrition supplements | |
| Risk of bias | ||
| Bias | Authors' judgement | Support for judgement |
| Random sequence generation (selection bias) | Low risk | Computer‐generated allocation sequence |
| Allocation concealment (selection bias) | Low risk | Sealed opaque envelopes |
| Blinding of participants and personnel (performance bias) All outcomes | Unclear risk | It was unclear if the trial was blinded. |
| Blinding of outcome assessment (detection bias) All outcomes | Unclear risk | it was unclear if the participants were blinded, and the trial reported quality of life. |
| Incomplete outcome data (attrition bias) All outcomes | High risk | There was above 5% dropouts for weight data and the trial did not account for the missing data. |
| Selective reporting (reporting bias) | Unclear risk | No protocol could be obtained. The trial reported all‐cause mortality but did not report serious adverse events. |
| For‐profit bias | High risk | Supported by: NHMRC Public Health Postgraduate Research Scholarship, Flinders University‐Industry Collaborative Research Grant and Nutricia Australia Pty Ltd. |
| Other bias | Low risk | The trial appeared to be free of other components that could put it at risk of bias. |
Moreno 2016.
| Methods | Randomised clinical trial, Belgium | |
| Participants | 136 hospitalised adults with severe alcoholic hepatitis, at nutritional risk by trialists Male:Female = 86:50 Mean age = 50 years Exclusion criteria: Not stated |
|
| Interventions | Experimental group: Intensive enteral nutrition: Enteral nutrition was given using a feeding tube for 14 days and participants received Fresubin HP Energy (1.5 kcal/ml, 7.5 g prot/100 ml) as follows: 1 L/day if body weight < 60 kgs, 1.5 L if body weight was between 60 and 90 kgs, 2 L if body weight was > 90 kgs. (n = 68) Control group: Treatment as usual ("conventional nutrition")(n = 68) Co‐interventions: Methylprednisolone |
|
| Outcomes | 6 months survival | |
| Study dates | Feburary 2010 to February 2013 | |
| Notes | We did not contact the authors since the trial was included late in the writing phase. | |
| Risk of bias | ||
| Bias | Authors' judgement | Support for judgement |
| Random sequence generation (selection bias) | Unclear risk | Not described |
| Allocation concealment (selection bias) | Low risk | Sealed opaque envelopes |
| Blinding of participants and personnel (performance bias) All outcomes | High risk | Participants were not blinded. |
| Blinding of outcome assessment (detection bias) All outcomes | Unclear risk | Not described |
| Incomplete outcome data (attrition bias) All outcomes | Low risk | There was under 5% with missing data |
| Selective reporting (reporting bias) | Low risk | A protocol could not be obtain but the trial reported all‐cause mortality and serious adverse events (NCT01801332, published after completion). |
| For‐profit bias | High risk | Several of the authors received grants for trials which might have conflict of interest (Abbvie, Novartis). |
| Other bias | Low risk | The trial appeared to be free of other components that could put it at risk of bias. |
Munk 2014.
| Methods | Randomized clinical trial, Denmark | |
| Participants | 84 hospitalised adults at nutritional risk according to the Nutritional Risk Screening‐2002 (NRS‐2002) tool. Male:Female = 34:47 (gender not reported for three participants) Mean age = 75 years Exclusion criteria: terminally ill dysphagia, food allergy or intolerance, anatomical obstructions preventing oral food intake, those who exclusively received enteral or parenteral nutrition |
|
| Interventions | Experimental group: Fortified foods: They received a special target food concept consisting of dishes fortified with natural energy and protein ingredients and with high‐quality protein powder. These dishes supplemented the standard hospital food. The final energy and protein fortified novel menu consisted of 23 small dishes. All dishes contained a minimum (range) of 6 g (6.1 – 11.5 g) of protein. The mean (range) energy density was 9.4 kJ/g (2.5 kJ/g to 19.8 kJ/g). All but 3 dishes (baked salmon, meat loaf, meat balls of veal) contained protein powder. The intervention menu was served a la carte with room service.(n = 44) Control group: No intervention (n = 40) Co‐intervention: Standard food service Buffet‐style serving system: 3 main meals + 2 ‐ 3 in‐between meals, e.g. snacks The national nutritional guidelines for the ‘hospital diet’, with energy‐ and protein‐rich beverage included, recommended that the hospital diet on average contained 9000 kJ, 95 g of protein (15% – 20% of energy), 100 g of fat (40% – 50% of energy) and 225 g of carbohydrate (40% – 45% of energy). |
|
| Outcomes | Energy and protein intake, hand‐grip strength, average daily energy and protein intake, use of tube‐feeding, use of parenteral nutrition, length of stay, changes in body weight | |
| Study dates | October 2011 to February 2012 | |
| Notes | We contacted the authors on 11th February 2016 by email: Tina.munk@regionh.dk. We received additional information on the random sequence generation. | |
| Risk of bias | ||
| Bias | Authors' judgement | Support for judgement |
| Random sequence generation (selection bias) | Low risk | Participants were randomised using stratified block‐randomisation. The allocation sequence was generated by a secretary who was not otherwise involved in the trial by randomly allocating sealed opaque envelopes. |
| Allocation concealment (selection bias) | Low risk | Participants were randomised using sealed, opaque envelopes with a total of 9 blocks, each consisting of 10 envelopes. |
| Blinding of participants and personnel (performance bias) All outcomes | High risk | Blinding of participants and personnel was not possible. |
| Blinding of outcome assessment (detection bias) All outcomes | Low risk | Data analysis was blinded by allocating the letters A and B to the two groups. The analysis was undertaken by the principal investigator who was blinded to the randomisation. |
| Incomplete outcome data (attrition bias) All outcomes | Low risk | 81 participants completed the trial, giving a completion rate of 96%. |
| Selective reporting (reporting bias) | Low risk | The protocol was published before the trial was begun and the outcomes stated in the protocol were reported on. |
| For‐profit bias | High risk | "We also thank the company ‘Toft Care System’ (Copenhagen, Denmark) for giving us the protein powder used free of charge. The sources of funding had no influence on the design of the study; the collection, analysis, or interpretation of the data; the writing of the manuscript; or the decision to submit for publication." |
| Other bias | Low risk | The trial appeared to be free of other components that could put it at risk of bias |
Myers 1990.
| Methods | Randomised clinical trial, USA | |
| Participants | 80 hospitalised adults with non‐surgically debrided pressure ulcers, at nutritional risk as defined by trialists Male:Female = 46:34 Mean age = 70.4 years Exclusion criteria: Not described |
|
| Interventions | Experimental group: Prescribed nutritional support, including oral supplements, tube‐feedings, parenteral nutrition, vitamins, and trace elements according to the clinical condition and the nutritional assessment completed by the hospital nutritional support team (n = 25) Control group: No intervention (n = 20) Co‐interventions: Standard hospital care. This included both wound treatment and nutritional evaluation and recommendation by dietitians to attending physicians. |
|
| Outcomes | Change in ulcers stage, changes in ulcer size, clinical assessment of treatment | |
| Study dates | Not stated | |
| Notes | We found no contact information for the authors. | |
| Risk of bias | ||
| Bias | Authors' judgement | Support for judgement |
| Random sequence generation (selection bias) | Unclear risk | Not described |
| Allocation concealment (selection bias) | Unclear risk | Not described |
| Blinding of participants and personnel (performance bias) All outcomes | Unclear risk | Not described |
| Blinding of outcome assessment (detection bias) All outcomes | Unclear risk | Not described |
| Incomplete outcome data (attrition bias) All outcomes | Unclear risk | The number of participants with incomplete data was not reported. |
| Selective reporting (reporting bias) | High risk | No protocol could be obtained and the study did not report on all‐cause mortality or serious adverse events. |
| For‐profit bias | High risk | The study was supported by a grant from Ross Laboratories, who might have had an interest in the outcome assessment. |
| Other bias | Low risk | The trial appeared to be free of other components that could put it at risk of bias. |
Müller 1982a.
| Methods | Randomised cclinical trial, Germany | |
| Participants | 160 hospitalised adults with carcinoma of the oesophagus, stomach, colon, rectum or pancreas, at nutritional risk due to major surgery of gastrointestinal carcinoma Male:Female = 77:48 (gender not reported for 35 participants) Mean age = 59 years Exclusion criteria: Total obstructions of the gut |
|
| Interventions | Experimental group: Preoperativ parenteral nutrition. The experimental group received 10 days of preoperative parenteral nutrition group (1.5 g amino acids/kg body weight; 11 g glucose/kg body weight; electrolytes, trace elements, and vitamins) by a central venous catheter(n = 80) Control group: Treatment as usual They received regular hospital diet of 2400 kcal/day. (n = 40) |
|
| Outcomes | Postoperative complications, mortality, serum protein levels (total protein, albumin, pre‐albumin, thyroxine‐binding globin, retinol‐binding protein, transferrin), immunological status (IgA, IgM, IgG, C3A, C4, skin tests). | |
| Study dates | Not stated | |
| Notes | We found no contact information for the authors. | |
| Risk of bias | ||
| Bias | Authors' judgement | Support for judgement |
| Random sequence generation (selection bias) | Unclear risk | Not described |
| Allocation concealment (selection bias) | Unclear risk | Not described |
| Blinding of participants and personnel (performance bias) All outcomes | High risk | Blinding was not possible due to the nature of the intervention. |
| Blinding of outcome assessment (detection bias) All outcomes | Unclear risk | Not described |
| Incomplete outcome data (attrition bias) All outcomes | High risk | 33 (13%) of participants were withdrawn from the trial and analysis and reasons for withdrawal were clearly stated. |
| Selective reporting (reporting bias) | Low risk | No protocol could be obtained, but the trial reported mortality and serious adverse events. |
| For‐profit bias | Unclear risk | It was unclear how the trial was funded. |
| Other bias | Low risk | The trial appeared to be free of other components that could put it at risk of bias. |
Müller 1982b.
| Methods | Randomised cclinical trial, Germany | |
| Participants | 160 hospitalised adults with carcinoma of the oesophagus, stomach, colon, rectum or pancreas, at nutritional risk due to major surgery of gastrointestinal carcinoma Male:Female = 77:48 (gender not reported for 35 participants) Mean age = 59 years Exclusion criteria: Total obstructions of the gut |
|
| Interventions | Experimental group: Preoperativ parenteral nutrition: The experimental group received 10 days of preoperative parenteral nutrition group (1.5 g amino acids/kg body weight; 45 kcal/kg body weight with half derived from lipids; electrolytes, trace elements, and vitamins) by a central venous catheter(n =55) Control group: Treatment as usual. They received regular hospital diet of 2400 kcal/day. (n = 40) |
|
| Outcomes | ||
| Study dates | ||
| Notes | ||
| Risk of bias | ||
| Bias | Authors' judgement | Support for judgement |
| Random sequence generation (selection bias) | Low risk | Random‐numbers table |
| Allocation concealment (selection bias) | Unclear risk | Not described |
| Blinding of participants and personnel (performance bias) All outcomes | High risk | Blinding was not possible due to the nature of the intervention. |
| Blinding of outcome assessment (detection bias) All outcomes | Unclear risk | Not described |
| Incomplete outcome data (attrition bias) All outcomes | High risk | 33 (13%) of participants were withdrawn from the trial and analysis and reasons for withdrawal were clearly stated. |
| Selective reporting (reporting bias) | Low risk | No protocol could be obtained, but the trial reported mortality and serious adverse events. |
| For‐profit bias | Unclear risk | It was unclear how the trial was funded. |
| Other bias | Low risk | The trial appeared to be free of other components that could put it at risk of bias. |
Naveau 1986.
| Methods | Randomised clinical trial, France | |
| Participants | 40 hospitalised adults with alcoholic cirrhosis and total serum bilirubin ≥ 5 mg a dL, at nutritional risk due trialist indication Male:Female = 25:15 Mean age = 53 years Exclusion criteria: hepatocellular carcinoma, renal failure, hyponatraemia septicaemia, spontaneous bacterial peritonitis, gastro‐intestinal bleeding within 3 days or hepatic coma |
|
| Interventions | Experimental group: Received daily through central catheter 40 kcal a kg of body weight measured before illness, given as equal proportions of glucose (50% glucose) and intravenous fat emulsion (20% Intralipid), and 200 mg nitrogen a kg of body measured weight before illness. This SPN provided electrolytes, minerals, vitamins and trace element requirements in a sodium‐free solution. (n = 20) In participants with ascites, the oral sodium intake was 400 mg a day; without ascites, the oral sodium was 4 mg a day. The intervention lasted 28 days. Control group: No intervention (n = 20) Co‐interventions: All were offered a daily diet containing 40 kcal a kg and 200 mg nitrogen a kg of their body weight measured before illness. |
|
| Outcomes | Serum bilirubin, prothrombin time and proaccelerin expressed as percentage of normal, blood, urea nitrogen, hematocrit, plasma protein, serum creatinine, sodium, y‐glutamyl transpeptidase (GGT) and TSB/GGT ratio, SGOT, SGPT, albumin, alkaline phosphatase, transferrin, pre‐albumin, retinol binding protein, upper‐arm fat and upper‐arm muscle areas expressed as percentage of the standard value of the age‐ and sex‐specific 50th percentile and skin test, mortality and anthropometric measurements | |
| Study dates | Not stated | |
| Notes | We contacted the authors on 30th June 2015 by email: sylvie.naveau@abc.ap‐hop‐paris.fr. We received only an initial reply. | |
| Risk of bias | ||
| Bias | Authors' judgement | Support for judgement |
| Random sequence generation (selection bias) | Low risk | Randomisation was performed using a computer programme. |
| Allocation concealment (selection bias) | Low risk | Serially‐numbered, sealed, opaque envelopes were used for random assignment of participants in 2 groups. |
| Blinding of participants and personnel (performance bias) All outcomes | Unclear risk | Not described |
| Blinding of outcome assessment (detection bias) All outcomes | Unclear risk | Not described |
| Incomplete outcome data (attrition bias) All outcomes | Unclear risk | There was above 5% dropouts and it was unclear how the trial accounted for the participants. |
| Selective reporting (reporting bias) | Unclear risk | No protocol was available, but the numbers and reasons for all‐cause mortality and serious adverse events was reported. |
| For‐profit bias | Unclear risk | It was unclear how the trial was funded. |
| Other bias | Low risk | The trial appeared to be free of other components that could put it at risk of bias. |
Neelemaat 2012.
| Methods | Randomised cclinical trial, the Netherlands | |
| Participants | 210 hospitalised adults at nutritional risk due to a > 10 % unintentional weight loss in the previous 6 months and/or > 5% unintentional weight loss in the previous month and/or a BMI < 20 kg/m2 Male:Female = 94:116 Mean age = 74 years. Exclusion criteria: Senile dementia, not able to understand the Dutch language or not able or willing to give fully‐informed consent |
|
| Interventions | Experimental group: Fortified foods and general nutrition support. Participants received standardised nutritional support started at the hospital and continued until 3 months after discharge. It included: ‐ Energy‐ and protein‐enriched diet (during the stay at hospital) ‐ 2 additional servings of an ONS (Nutridrink!, Nutricia), leading to an expected increase in intake of 2520 kJ/day (1⁄4600 kilocalories/day and 24 g protein/day (during the entire study period)) ‐ 400 IE vitamin D3 and 500 mg calcium (Calci‐Chew D3!, Nycomed) a day (during the entire study period) ‐ Telephone counselling by a dietician in order to give advice and to stimulate compliance with the proposed nutritional intake (every other week after discharge from the hospital, 6 in total)(n = 105) Control group: Usual care(n = 105) Participants were given nutritional support only on prescription by their treating physician. In general, they did not receive post‐discharge nutritional support. |
|
| Outcomes | QALY, body weight, BMI, fat‐free mass, hand‐grip strength, physical activity, fall incidence, mortality, cost effectiveness, functional limitations | |
| Study dates | Not stated | |
| Notes | We contacted the authors on 04th April 2016 by email: f.neelemaat@vumc.nl. | |
| Risk of bias | ||
| Bias | Authors' judgement | Support for judgement |
| Random sequence generation (selection bias) | Low risk | Randomisation was performed using a random‐number generator. Block randomisation in blocks of 10 was used to ensure equal numbers of participants in each group. |
| Allocation concealment (selection bias) | Low risk | The randomisation was concealed using numbered, opaque envelopes. |
| Blinding of participants and personnel (performance bias) All outcomes | High risk | Blinding of participants and personnel was not performed. |
| Blinding of outcome assessment (detection bias) All outcomes | High risk | The participants were not blinded, and the trial reported quality of life. |
| Incomplete outcome data (attrition bias) All outcomes | High risk | Data was incomplete for 60 (28.6%) participants.The trial performed intention‐to‐treat analysis but used last observation carried forward for missing data besides cost, which was imputed using multiple imputations. |
| Selective reporting (reporting bias) | Unclear risk | No protocol could be obtained and serious adverse events were not reported. |
| For‐profit bias | Low risk | The trial was funded by: The Netherlands Organisation for Health Research and Development (ZonMw) (94506203). |
| Other bias | Low risk | The trial appeared to be free of other components that could put it at risk of bias. |
Neuvonen 1984.
| Methods | Randomised clinical trial, Finland | |
| Participants | 19 hospitalised adults undergoing major abdominal surgery and having 3 out of the following 7 criteria: weight loss > 5% a month, the weight‐for‐height index, arm muscle circumference, triceps skinfold thickness or creatinine‐height index was < 90% of normal or if the serum albumin concentration was < 32 g/l or the serum pre‐albumin concentration was < 0.08 g/l, at nutritional risk due major abdominal surgery Male:Female = 12:7 Mean age = 55 years Exclusion criteria: Not stated |
|
| Interventions | Experimental group: TPN was started 10 days before the planned operation. The participants received nutrition through a central venous catheter which included 1 ‐ 2 g/kg/day amino acids, 150 ‐ 200 kcal/1gN (glucose and fat), 40 ‐ 60 ml/kg water together with the necessary minerals and vitamins(n = 9) Control group: No treatment(n = 10) |
|
| Outcomes | Leucocyte counts, mitogen‐ and antigen‐induced lymphocyte proliferative responses, complications, mortality | |
| Study dates | Not stated | |
| Notes | We found no contact information for the authors. | |
| Risk of bias | ||
| Bias | Authors' judgement | Support for judgement |
| Random sequence generation (selection bias) | Unclear risk | Not described |
| Allocation concealment (selection bias) | Unclear risk | Not described |
| Blinding of participants and personnel (performance bias) All outcomes | High risk | Participants and personnel were not blinded due to the nature of the intervention. |
| Blinding of outcome assessment (detection bias) All outcomes | Unclear risk | Not described |
| Incomplete outcome data (attrition bias) All outcomes | Low risk | There were no dropouts. |
| Selective reporting (reporting bias) | Low risk | No protocol could be obtained, but the trial reported serious adverse event and mortality. |
| For‐profit bias | Unclear risk | It was unclear how the trial was funded. |
| Other bias | Low risk | The trial appeared to be free of other components that could put it at risk of bias. |
Nguyen 2012.
| Methods | Randomised clinical trial, Australia | |
| Participants | 28 hospitalised adults admitted to a level 3 ICU due to being critically ill and able to receive enteral nutrition, and likely to receive mechanical ventilation for at least 4 days, at nutritional risk due to ICU hospitalisation Male:Female = 18:10 Mean age = 55.6 years Exclusion criteria: transferred from other ICUs or were recently (within 14 days) admitted to an ICU; receiving parenteral nutrition; recent (< 4 weeks) major surgery that involved opening the abdominal cavity or gastro‐intestinal tract or previous surgery of the oesophagus or stomach; receiving prokinetic therapy within 24 hrs before the study; and pregnant or breastfeeding |
|
| Interventions | Experimental group: Early enteral feeding within 24 hrs of admission for 4 days (n = 14)
Control group: delayed feeding in which the participants did not receive any form of nutritional support, including parenteral nutrition for the first 4 days in ICU (n = 14) Co‐intervention: Normal enteral feeding after 4 days, nasogastric tube |
|
| Outcomes | Plasma 3‐OMG levels, duration of mechanical ventilation, prevalence of ventilator‐associated pneumonia, and mortality, length of stay at ICU, gastric emptying | |
| Study dates | Not stated | |
| Notes | We contacted the authors on 19th August 2015 by email: quoc.nguyen@health.sa.gov.au. We received no reply. | |
| Risk of bias | ||
| Bias | Authors' judgement | Support for judgement |
| Random sequence generation (selection bias) | Low risk | Computer‐generated sequence |
| Allocation concealment (selection bias) | Low risk | List was maintained by an independent research co‐ordinator. |
| Blinding of participants and personnel (performance bias) All outcomes | Unclear risk | Not described |
| Blinding of outcome assessment (detection bias) All outcomes | Unclear risk | Not described |
| Incomplete outcome data (attrition bias) All outcomes | Unclear risk | The number of participants with incomplete data was not reported. |
| Selective reporting (reporting bias) | Unclear risk | No protocol could be obtained, and the trial did not report on serious adverse events. |
| For‐profit bias | Low risk | The trial was funded by a non‐profit organisation (National Health and Medical Research Council, and by the Australian National Health and Research Council grant). |
| Other bias | Low risk | The trial appeared to be free of other components that could put it at risk of bias. |
Nixon 1981.
| Methods | Randomised clinical trial, USA | |
| Participants | 50 hospitalised adults with advanced colorectal carcinoma, at nutritional risk according to the trialist Male:Female = 19:26 (gender not reported for five participants) Mean age = 58 years Exclusion criteria: severe heart or renal disease, antibiotic‐resistant infections, weight loss > 24% of premorbid level, or important nutrient losses from vomiting, diarrhoea, or fistulae. No surgery, radiation, or chemotherapy could have occurred for 2 weeks prior to study entry. |
|
| Interventions | Experimental group: Total parenteral nutrition and chemotherapy. Participants were to receive 28 days of central parenteral hyperalimentation at the level of 30 ‐ 35 kcal and 0.2 ‐ 0.3 N/kg body weight/day. Chemotherapy (5‐fluorouracil + methyl CCNU) was begun on the 14th day after these nutrient levels were reached. Only 1 course of total parenteral nutrition was administered; afterwards total oral intake as wished was tolerated.(n = 25) Control group: No intervention. Control group were begun immediately on an identical chemotherapy regimen and allowed to eat as they wished. (n = 25) Co‐intervention: Chemotherapy |
|
| Outcomes | Overall median survival (days) | |
| Study dates | Not stated | |
| Notes | We found no contact information for the authors. | |
| Risk of bias | ||
| Bias | Authors' judgement | Support for judgement |
| Random sequence generation (selection bias) | Unclear risk | Not described |
| Allocation concealment (selection bias) | Low risk | The trial used a sealed‐envelope system developed by the support contractor. |
| Blinding of participants and personnel (performance bias) All outcomes | High risk | Blinding was not performed. |
| Blinding of outcome assessment (detection bias) All outcomes | Unclear risk | Not described |
| Incomplete outcome data (attrition bias) All outcomes | Unclear risk | 5 (10%) of the participants were withdrawn from the trial and the analyses. It was unclear how the trial dealt with missing data. |
| Selective reporting (reporting bias) | High risk | No protocol could be obtained and the trial did not report on all‐cause mortality or serious adverse events. |
| For‐profit bias | Low risk | The study was funded by NIH contract NO1‐CP‐65892, NIH Grants RR39 and 16255, the American Legion Gioia Osborne Cancer Research Fund, and the state of Georgia Contract Cancer‐Nutrition. |
| Other bias | Low risk | The trial appeared to be free of other components that could put it at risk of bias. |
Norman 2005.
| Methods | Randomised clinical trial, Germany | |
| Participants | 63 hospitalised adults admitted with decompensated liver cirrhosis, at nutritional risk according to the trialist Male:Female = not stated Mean age = not stated Exclusion criteria: none stated |
|
| Interventions | Experimental group: Protein‐rich enteral nutrition (35 kcal/kg body weight and 1.5 g protein/kg body weight) for 14 days(n = 13) Control group: Standard hospital diet(n = 12) |
|
| Outcomes | Muscle function, prothrombin time, hand‐grip strength, subjective global assessment, bilirubin, albumin | |
| Study dates | Not stated | |
| Notes | We contacted the authors on 19th August 2015 by email: matthias.pirlich@charite.de. We received no reply. | |
| Risk of bias | ||
| Bias | Authors' judgement | Support for judgement |
| Random sequence generation (selection bias) | Unclear risk | Not described |
| Allocation concealment (selection bias) | Unclear risk | Not described |
| Blinding of participants and personnel (performance bias) All outcomes | Unclear risk | Not described |
| Blinding of outcome assessment (detection bias) All outcomes | Unclear risk | Not described |
| Incomplete outcome data (attrition bias) All outcomes | Unclear risk | The number of participants with incomplete data was not reporteded. |
| Selective reporting (reporting bias) | Unclear risk | No protocol could be obtained and the trial did not report on all‐cause mortality or serious adverse events. |
| For‐profit bias | Unclear risk | It was unclear how the trial was funded. |
| Other bias | Low risk | The trial appeared to be free of other components that could put it at risk of bias. |
Oh 2014.
| Methods | Randomised clinical trial, Korea | |
| Participants | 31 hospitalised adults with a diagnosis of advanced cancer with no future plans for anticancer treatment, at nutritional risk due to being in intensive care Male:Female = 19:12 Mean age = 59 years Exclusion criteria: cardiac or renal disease that restricted the administration of fluid; an electrolyte controlled diabetes (HbA1c > 8% despite therapy); an indication of unsuitability for participating in the trial as determined by the attending physician |
|
| Interventions | Experimental group: Parenteral nutrition. The Nutritional Support Team determined the parenteral nutrition composition during initial periods of the study treatment. All types of marketed intravenous amino acid and fat emulsions were allowed, including ready‐to‐use products. Treatment was continued from randomisation until death or withdrawal of consent.(n = 16) Control group: Treatment as usual (n = 15) Cointervention: Participants received intravenous fluid. The total amount of fluid was determined by the attending physician with a maximum of 30 ml/kg a day in addition to replacement of abnormal losses from the previous day to meet the physiologic fluid requirement of healthy adults. The fluids were normal saline, half saline or dextrose water. Decision of total administered calories was made by the attending physician, but limited to under the 20 kcal/kg a day, which is the minimum energy requirement of a bedridden person. |
|
| Outcomes | Overall survival, total administered calories | |
| Study dates | June 2011 to December 2011 | |
| Notes | We did not obtain the author's email until late in the writing phase of the review, and have not contacted them. | |
| Risk of bias | ||
| Bias | Authors' judgement | Support for judgement |
| Random sequence generation (selection bias) | Unclear risk | Not described |
| Allocation concealment (selection bias) | Low risk | Random allocation was made by research staff of Seoul Medical Center Research Institute. Allocated groups were announced to investigators at the time of assignment of each participant by telephone call. |
| Blinding of participants and personnel (performance bias) All outcomes | High risk | No blinding of participants and personnel was performed. |
| Blinding of outcome assessment (detection bias) All outcomes | Unclear risk | Not described |
| Incomplete outcome data (attrition bias) All outcomes | Low risk | There were no dropouts. |
| Selective reporting (reporting bias) | Unclear risk | No protocol could be obtained, and all‐cause mortality and serious adverse events were not reported. |
| For‐profit bias | Low risk | This study received 2011 grant of Seoul Medical Center Research Institute. |
| Other bias | Low risk | The trial appeared to be free of other components that could put it at risk of bias. |
Ollenschläger 1992.
| Methods | Randomised clinical trial, Germany | |
| Participants | 32 hospitalised adults with acute leukaemia, at nutritional risk due to weight loss > 5% within 3 months or acute weight < 90% ideal body weight Male:Female = approximately 14:16 Mean age ˜ 37 Exclusion criteria: metabolic diseases; renal or liver insufficiency; need for artificial nutrition |
|
| Interventions | Experimental group: General nutrition support; intensified oral nutrition. Participants received nutrition education, daily visits by a dietitian and recording of food intake, as well as a weekly assessment of subjective well‐being. Intervention lasted throughout the whole tumour therapy (median 22 weeks). (n = 16) Control group: No intervention(n = 16) Co‐intervention: All received menus of free choice, with a daily offer of 1.0 ‐ 2.0 g protein, 30 ‐ 50 kcal/kg body weight, depending on the pretreatment nutritional status |
|
| Outcomes | Septic episodes, days with body temperatures above 38.5 °C, mortality, nutritional status, weight, tumour treatment side effects, amount of complete remissions, energy intake, nutrient intake, quality of life (only experimental group) | |
| Study dates | Not stated | |
| Notes | We found no contact information for the authors. | |
| Risk of bias | ||
| Bias | Authors' judgement | Support for judgement |
| Random sequence generation (selection bias) | Unclear risk | The trial was described as being randomised, but it was unclear how the sequence was generated. |
| Allocation concealment (selection bias) | Unclear risk | No described |
| Blinding of participants and personnel (performance bias) All outcomes | Unclear risk | Not described |
| Blinding of outcome assessment (detection bias) All outcomes | Unclear risk | Not described |
| Incomplete outcome data (attrition bias) All outcomes | Unclear risk | The number of participants with incomplete data was not reported. |
| Selective reporting (reporting bias) | Unclear risk | No protocol could be obtained, and the trial did not properly report serious adverse events. All‐cause mortality was reported. |
| For‐profit bias | Unclear risk | It was unclear how the trial was funded. |
| Other bias | Low risk | The trial appeared to be free of other components that could put it at risk of bias. |
Pacelli 2007.
| Methods | Randomised clinical trial, Italy | |
| Participants | 20 hospitalised adults with a clinical or pathologic diagnosis of cancer of the stomach, at nutritional risk due to weight loss of 10% with respect to usual body weight Male:Female = 10:10 Mean age = 69.5 years |
|
| Interventions | Experimental group: standard hospital oral diet plus PN. The PN formula contained 0.2 g/kg/day of nitrogen and 30 nonprotein kcal/kg/day. The PN was given as a balanced mixture of D‐glucose, lipids (20% Intralipid), and amino acids, electrolytes, vitamins, and trace elements. (n = 10) Control group: standard hospital oral diet(n = 10) |
|
| Outcomes | Percentage of cells incorporating bromodeoxyuridine in vitro and percentage of cells in the S‐phase as measured by flow cytometry | |
| Study dates | Not stated | |
| Notes | We contacted the authors on 23rd June 2015 by email: maubosso@tin.it.. We received no reply. | |
| Risk of bias | ||
| Bias | Authors' judgement | Support for judgement |
| Random sequence generation (selection bias) | Low risk | Randomisation was performed by using a central computerised system. |
| Allocation concealment (selection bias) | Unclear risk | Not described |
| Blinding of participants and personnel (performance bias) All outcomes | High risk | The personnel were not blinded. |
| Blinding of outcome assessment (detection bias) All outcomes | Unclear risk | Not described |
| Incomplete outcome data (attrition bias) All outcomes | Low risk | There were no dropouts or withdrawals. |
| Selective reporting (reporting bias) | High risk | No protocol could be obtained and the trial did not report on all‐cause mortality or serious adverse events. |
| For‐profit bias | Unclear risk | It was unclear how the trial was funded. |
| Other bias | Low risk | The trial appeared to be free of other components that could put it at risk of bias. |
Page 2002.
| Methods | Randomised clinical trial, UK | |
| Participants | 40 hospitalised adults undergoing oesophageal resection for carcinoma, at nutritional risk due to major surgery Male:Female = 28:12 Mean age = 67.3 years |
|
| Interventions | Experimental group: Isocaloric enteral feed (1048 kcal/l and 40 g protein/l)(n = 20) Control group: Standard intravenous fluids (5% glucose)(n = 20) |
|
| Outcomes | Weight, BMI, haematological and serological parameters, days in hospital, duration of enteral feed, death, complications | |
| Study dates | Not stated | |
| Notes | We contacted the authors on 23rd June 2015 by email: richard.page@ccl‐tr.nwest.nhs.uk. We received no reply. | |
| Risk of bias | ||
| Bias | Authors' judgement | Support for judgement |
| Random sequence generation (selection bias) | Unclear risk | The trial was described as being randomised, but it was unclear how the sequence was generated. |
| Allocation concealment (selection bias) | Low risk | The trial used sealed envelopes. |
| Blinding of participants and personnel (performance bias) All outcomes | Unclear risk | Not described |
| Blinding of outcome assessment (detection bias) All outcomes | Unclear risk | Not described |
| Incomplete outcome data (attrition bias) All outcomes | Unclear risk | The number of participants with incomplete data was not reported. |
| Selective reporting (reporting bias) | Low risk | The trial reported serious adverse events and all‐cause mortality. |
| For‐profit bias | Unclear risk | It was unclear how the trial was funded. |
| Other bias | Low risk | The trial appeared to be free of other components that could put it at risk of bias. |
Pang 2007.
| Methods | Randomised clinical trial, China | |
| Participants | 89 hospitalised adults undergoing either gastrointestinal, urologic neoplasms, cardiothoracic, hepatobiliary or pancreas surgery, at nutritional risk due to major surgery Male:Female = 47:42 Mean age = 46 years Exclusion criteria: none stated |
|
| Interventions | Experimental group: Participants received continuous infusion of enteral nutrition liquid by using nasal‐jejunal feeding‐tube, infusion speed from 25 ml/hr to 100 ml/hr, for 15 days.(n = 49) Control group: Home‐made diet by oral feeding for 15 days(n = 40) |
|
| Outcomes | Total lymphocyte counts, serum albumin, and wound‐healing rate, thyroxin and albumin levels, cost effectiveness | |
| Study dates | Not stated | |
| Notes | We tried and failed 5 times to contact the author by phone. | |
| Risk of bias | ||
| Bias | Authors' judgement | Support for judgement |
| Random sequence generation (selection bias) | Unclear risk | Not described |
| Allocation concealment (selection bias) | Unclear risk | Not described |
| Blinding of participants and personnel (performance bias) All outcomes | High risk | Participants and personnel were not blinded. |
| Blinding of outcome assessment (detection bias) All outcomes | Unclear risk | Not described |
| Incomplete outcome data (attrition bias) All outcomes | Unclear risk | The number of participants with incomplete data was not reported. |
| Selective reporting (reporting bias) | Unclear risk | No protocol could be obtained and the trial did not report on all‐cause mortality or serious adverse events. |
| For‐profit bias | Unclear risk | It was unclear how the trial was funded. |
| Other bias | Low risk | The trial appeared to be free of other components that could put it at risk of bias. |
Peck 2004.
| Methods | Randomised clinical trial, USA | |
| Participants | 32 hospitalised adults either between 18 and 50 and admitted within 24 hours of burn injury with at least 20% of total body surface area burns, or younger than 18 or older than 50 and with at least 10% total body surface area burns, at nutritional risk due to trauma Male:Female = 19:8 (analysed) Mean age = 46.5 years Exclusion criteria: Pre‐existing medical conditions that led to inanition and wasting (e.g. such as adult immunodeficiency syndrome, cancer), had high‐voltage electrical injuries, were admitted to the burn centre for treatment of an exfoliative skin disorder, or were treated with the volumetric diffusive respirator (VDR) for smoke inhalation injury because of the inability to obtain indirect calorimetry measurements on the VDR |
|
| Interventions | Experimental group: Early feeding through nasogastric tube group initiated within 24 hrs(n = 16) Control group: No intervention(n = 16) Co‐intervention: Nasogastric tube placement at admission. Normal oral feeding |
|
| Outcomes | REE/BEE, weight, transthyretin, transferrin, urine urea nitrogen, feeding complications, infections, number of antibiotic days, number of ventilator days, number of ICU days, length of acute days, mortality | |
| Study dates | Not stated | |
| Notes | We contacted the authors on 19th August 2015 by email: mpeck@unc.med.edu. We received no reply. | |
| Risk of bias | ||
| Bias | Authors' judgement | Support for judgement |
| Random sequence generation (selection bias) | Unclear risk | The trial was described as being randomised, but it was unclear how the sequence was generated. |
| Allocation concealment (selection bias) | Unclear risk | The trial used sealed envelopes but it was unclear if they were opaque. |
| Blinding of participants and personnel (performance bias) All outcomes | Unclear risk | Not described |
| Blinding of outcome assessment (detection bias) All outcomes | Unclear risk | Not described |
| Incomplete outcome data (attrition bias) All outcomes | Unclear risk | The trial reported 5 dropouts, but it was unclear from which group and the trial did not allow proper intention‐to‐treat methodology. |
| Selective reporting (reporting bias) | Unclear risk | No protocol could be obtained, and the trial did not properly report serious adverse events. |
| For‐profit bias | Low risk | The trial was funded by a non‐profit organisation (Sponsored by the North Carolina Jaycee Burn Center and General Clinical Research Center Program of the Division of Research Resources). |
| Other bias | Low risk | The trial appeared to be free of other components that could put it at risk of bias. |
Peng 2001.
| Methods | Randomised clinical trial, China | |
| Participants | 22 hospitalised adults admitted with severe burn injuries (TBSA > 50%), at nutritional risk due to trauma Male:Female = 15:7 Mean age = 31 years Exclusion criteria: moderate‐to‐severe inhalation injury, diarrhoea or ileus |
|
| Interventions | Experimental group: Early enteral feeding. Participants were given ENSURE (carbohydrate 54.5%, protein 14%, lipid 31.5%) oral or nasal feeding. 78 ‐ 80 ml/3hr, 0.75 Kcal/ml in first 24 hrs after burn, 100 ‐ 150 ml/3hr, 0.75 ‐ 1 Kcal/ml within the next 24 hrs.(n = 13) Control group: Delayed enteral feeding. Oral liquid diet 48 hrs after burn(n = 9) Co‐intervention: Conventional therapy |
|
| Outcomes | Plasma, endotoxin TNF‐α, urine mannitol, urinary lactulose | |
| Study dates | Not stated | |
| Notes | We tried and failed 3 times to contact the author by phone. | |
| Risk of bias | ||
| Bias | Authors' judgement | Support for judgement |
| Random sequence generation (selection bias) | Unclear risk | Not described |
| Allocation concealment (selection bias) | Unclear risk | Not described |
| Blinding of participants and personnel (performance bias) All outcomes | High risk | Participants and personnel were not blinded. |
| Blinding of outcome assessment (detection bias) All outcomes | Unclear risk | Not described |
| Incomplete outcome data (attrition bias) All outcomes | Unclear risk | The number of participants with incomplete data was not reported. |
| Selective reporting (reporting bias) | Unclear risk | No protocol could be obtained and the trial did not report on all‐cause mortality or serious adverse events. |
| For‐profit bias | Unclear risk | It was unclear how the trial was funded. |
| Other bias | Low risk | The trial appeared to be free of other components that could put it at risk of bias. |
Popp 1981.
| Methods | Randomised clinical trial, USA | |
| Participants | 42 hospitalised adults undergoing aggressive induction‐consolidation‐late intensification chemotherapy for advanced diffuse lymphoma Male:Female = 23:18 (gender not reported for 1 participant) Mean age = 42 years Exclusion: None stated |
|
| Interventions | Experimental group: TPN during the first 14 days of each 28‐day induction and late intensification chemotherapy cycle. TPN contained 500 mL of Freamine II as well as vitamins and minerals. (n = 20) Control: no intervention (n = 21) Co‐intervention: chemotherapy with ProMACE and MOPP, oral intake as wished. |
|
| Outcomes | Survival, nutritional markers, blood count | |
| Study dates | Not stated | |
| Notes | We could obtain no contact information for the authors. | |
| Risk of bias | ||
| Bias | Authors' judgement | Support for judgement |
| Random sequence generation (selection bias) | Unclear risk | Not described |
| Allocation concealment (selection bias) | Unclear risk | Not described |
| Blinding of participants and personnel (performance bias) All outcomes | Unclear risk | Not described |
| Blinding of outcome assessment (detection bias) All outcomes | Unclear risk | Not described |
| Incomplete outcome data (attrition bias) All outcomes | Low risk | Under 5% of participants had incomplete outcome data. |
| Selective reporting (reporting bias) | Low risk | The trial reports mortality and nutrition‐related complications. |
| For‐profit bias | Unclear risk | It was unclear how the trial was funded. |
| Other bias | Low risk | The trial appeared to be free of other components that could put it at risk of bias. |
Potter 2001.
| Methods | Randomised clinical trial, UK | |
| Participants | 381 hospitalised elderly adults admitted from home and with no known malignancy, had the ability to swallow, and were not obese (BMI < 75th percentile), at nutritional risk according to anthropometrics. Male:Female = not reported Median age = 83.years Exclusion criteria: none specified |
|
| Interventions | Experimental group: Normal ward diet + oral supplements (1.5 kcal/mL energy, intended to provide 22.5 g protein and 540 kcal energy a day. It was prescribed 3 times daily with 120 mL each time (8:00 AM, 2:00 PM, and 6:00 PM).(n =186) Control group: Normal ward diet + dietetic intervention was available to all participants in the study.(n = 195) | |
| Outcomes | Total energy intake, weight, arm muscle circumference, mortality, functional recovery, discharge placement, length of hospital stay | |
| Study dates | Not stated | |
| Notes | We contacted the authors on 19th August 2015 by email: Jan.potter@guic.scot.nhs.uk . We received no reply. | |
| Risk of bias | ||
| Bias | Authors' judgement | Support for judgement |
| Random sequence generation (selection bias) | Unclear risk | Not described |
| Allocation concealment (selection bias) | Unclear risk | The trial used sealed envelopes, but it was unclear if they were opaque. |
| Blinding of participants and personnel (performance bias) All outcomes | High risk | The trial was a non‐placebo trial, and the participants were not blinded. |
| Blinding of outcome assessment (detection bias) All outcomes | Low risk | The dietician performing the outcome assessment was blinded to the intervention. |
| Incomplete outcome data (attrition bias) All outcomes | Unclear risk | There were above 5% dropouts according to weight, and they were not accounted for using proper methodology. |
| Selective reporting (reporting bias) | Unclear risk | No protocol could be obtained and serious adverse events was not reported. |
| For‐profit bias | High risk | The trial received supplements from a company that might have conflict of interest (Frusenius UK Ltd). |
| Other bias | Low risk | The trial appeared to be free of other components that could put it at risk of bias. |
Prieto 1994.
| Methods | Randomised clinical trial, Spain | |
| Participants | 84 hospitalised adults entering the Digestive Surgery Service and with planned surgery, at nutritional risk due to the trialist classifying them as at risk Male:Female = 33:51 Mean age = 57 years |
|
| Interventions | Experimental group: Received peripheral parenteral nutrition (25.30 g amino acids/3L, 50 g carbohydrates/3L)(n = 22) Control group: Received conventional serum therapy of 5% glucose(n = 22) |
|
| Outcomes | Percentage of ideal weight, albumin, haemoglobin, arm circumference, transferrin | |
| Study dates | Not stated | |
| Notes | We found no contact information for the authors. | |
| Risk of bias | ||
| Bias | Authors' judgement | Support for judgement |
| Random sequence generation (selection bias) | Unclear risk | Not described |
| Allocation concealment (selection bias) | Unclear risk | Not described |
| Blinding of participants and personnel (performance bias) All outcomes | Unclear risk | Not described |
| Blinding of outcome assessment (detection bias) All outcomes | Unclear risk | Not described |
| Incomplete outcome data (attrition bias) All outcomes | Unclear risk | The number of participants with incomplete data was not reported. |
| Selective reporting (reporting bias) | Unclear risk | No protocol could be obtained and the trial did not report on all‐cause mortality or serious adverse events. |
| For‐profit bias | Unclear risk | It was unclear how the trial was funded. |
| Other bias | Low risk | The trial appeared to be free of other components that could put it at risk of bias. |
Pupelis 2000.
| Methods | Randomised clinical trial, Latvia | |
| Participants | 29 hospitalised adults undergoing surgery for severe pancreatitis, at nutritional risk due to major surgery Mean age = 51 years Male:female = not reported Exclusion criteria: not reported |
|
| Interventions | Experimental group: Postoperative enteral nutrition during the first 24 hrs after operation with Pepti 2000 until the participant could receive standard nutrition.(n = 11)
Control group: No intervention(n = 18) Co‐interventions: Conventional intravenous fluids |
|
| Outcomes | APACHE‐score, number of complications, length of hospital stay, length of stay in ICU | |
| Study dates | January 1997 to February 1998 | |
| Notes | We contacted the authors on 23rd June 2015 by email: pupelis@gailes.lv. We received no reply. | |
| Risk of bias | ||
| Bias | Authors' judgement | Support for judgement |
| Random sequence generation (selection bias) | Unclear risk | Not described |
| Allocation concealment (selection bias) | Unclear risk | Not described |
| Blinding of participants and personnel (performance bias) All outcomes | High risk | Only the experimental group had a tube. |
| Blinding of outcome assessment (detection bias) All outcomes | Unclear risk | Not described |
| Incomplete outcome data (attrition bias) All outcomes | Unclear risk | The number of participants with incomplete data was not reported. |
| Selective reporting (reporting bias) | Low risk | Serious adverse events and mortality were reported. |
| For‐profit bias | Unclear risk | It was unclear how the trial was funded. |
| Other bias | Low risk | The trial appeared to be free of other components that could put it at risk of bias |
Pupelis 2001.
| Methods | Randomised clinical trial, Latvia | |
| Participants | 60 hospitalised adults undergoing surgery for peritonitis and severe pancreatitis. None of the included participants received TPN before surgery. At nutritional risk due to major surgery Male:Female = 45:15 Mean age = 51.4 years Exclusion criteria: none specified |
|
| Interventions | Experimental group: Jejunal feeding was started during the 1st 12 hrs postoperatively in the ICU with full‐strength whole‐protein formula (1 kcal/mL) or oligopeptide‐based formula (1 kcal/mL), providing at least 300 mL each day.(n = 30) Control group: Standard intravenous fluids(n = 30) |
|
| Outcomes | Complications, SIRS, death caused by multiple organ dysfunction syndrome, mortality | |
| Study dates | January 1997 to April 1999 | |
| Notes | We contacted the authors on 23rd June 2015 by email: pupelis@gailes.lv. We received no reply. | |
| Risk of bias | ||
| Bias | Authors' judgement | Support for judgement |
| Random sequence generation (selection bias) | Unclear risk | Not described |
| Allocation concealment (selection bias) | Unclear risk | Not described |
| Blinding of participants and personnel (performance bias) All outcomes | High risk | Only the experimental group received a tube. |
| Blinding of outcome assessment (detection bias) All outcomes | Unclear risk | Not described |
| Incomplete outcome data (attrition bias) All outcomes | Unclear risk | The number of participants with incomplete data was not reported. |
| Selective reporting (reporting bias) | Low risk | No protocol was found. Serious adverse events and all‐cause mortality were reported. |
| For‐profit bias | High risk | The trial was funded by Amaija ltd. (Nutrition manufacturer). |
| Other bias | Low risk | The trial appeared to be free of other components that could put it at risk of bias. |
Rabadi 2008.
| Methods | Randomised clinical trial, USA | |
| Participants | 116 hospitalised adults with 1. 1st acute stroke event within 4 weeks of admission to an inpatient rehabilitation facility; 2. haemorrhagic or ischaemic stroke documented clinically and by neuroimaging; 3. significant weight loss as indicated by unintentional weight loss of at least 2.5% within 2 weeks following
stroke onset; 4. medically stable from a cardiorespiratory standpoint that they could participate in their daily therapies; 5. ability to ingest food including supplements either orally or through the PEG tube; 6. Informed consent, if possible from the participant; where it was not possible, proxy consent was obtained from the next of kin according to institutional IRB standards. At nutritional risk due to stroke. Male:Female = 68:48 Mean age = 74.2 |
|
| Interventions | Experimental group: The “intensive” nutritional supplement was Novasource 2.0 (240 calories, 11 g of proteins).(n = 58) Control group: The “standard” nutritional supplement was Resource Standard (127 calories, 5 g of protein).(n = 58) The supplements were always given within 72 hrs after arriving at the rehabilitation facility. |
|
| Outcomes | FIM‐score, 2‐minute walking test, 6‐minute walking test, weight, albumin, transferrin, % IBW | |
| Study dates | Not stated | |
| Notes | We contacted the authors on 23rd June 2015 by email: rabadimh@gmail.com. We received no reply. | |
| Risk of bias | ||
| Bias | Authors' judgement | Support for judgement |
| Random sequence generation (selection bias) | Low risk | 10‐block randomisation |
| Allocation concealment (selection bias) | Low risk | Sealed opaque envelopes |
| Blinding of participants and personnel (performance bias) All outcomes | Low risk | The trial was blinded to the participants and personnel. |
| Blinding of outcome assessment (detection bias) All outcomes | Low risk | The investigators performing the outcome assessment were blinded. |
| Incomplete outcome data (attrition bias) All outcomes | High risk | There were more than 5% dropouts, and the dropouts in the 2 groups could not be described as being similar. |
| Selective reporting (reporting bias) | Unclear risk | No protocol could be obtained and the trial did not report on all‐cause mortality or serious adverse events. |
| For‐profit bias | Low risk | No pharmaceutical company funded the trial. |
| Other bias | Low risk | The trial appeared to be free of other components that could put it at risk of bias. |
Rana 1992.
| Methods | Randomised clinical trial, country unknown. | |
| Participants | 54 hospitalised adults admitted for 1 of the following elective gastrointestinal surgical procedures: Gastro‐oesophagectomy, total and subtotal gastrectomy for carcinoma, open cholecystectomy, and exploration of common bile duct, palliative cholecystojejunostomy and enterostomy or choledochojejunostomy and enterostomy for carcinoma of the pancreas, ileocolonic resection, hemicolectomy or anterior resection of colon and abdominoperineal resection of colon; at nutritional risk due to major surgery Male:Female = 19:21 (only participants that completed the study) Mean age: 60.7 years (only participants that completed the study) Exclusion criteria: dementia, received any form of pre‐operative nutritional support. |
|
| Interventions | Experimental group: Oral nutrition sip feed of 200 ml. (1.5 kcal/ml, 7.8 g/L)(n = 27) Control group: No intervention(n = 27) Co‐intervention: Standard hospital diet |
|
| Outcomes | Nutritional status, nutritional intake, monitoring and complications | |
| Study dates | Not stated | |
| Notes | We could obtain no contact information for the authors. | |
| Risk of bias | ||
| Bias | Authors' judgement | Support for judgement |
| Random sequence generation (selection bias) | Unclear risk | Not described |
| Allocation concealment (selection bias) | Unclear risk | Not described |
| Blinding of participants and personnel (performance bias) All outcomes | Unclear risk | Not described |
| Blinding of outcome assessment (detection bias) All outcomes | Unclear risk | Not described |
| Incomplete outcome data (attrition bias) All outcomes | High risk | More than 5% dropped out, and the trial did not use proper methodology to deal with missing data. |
| Selective reporting (reporting bias) | Low risk | No protocol could be obtained but the trial reported serious adverse events and mortality. |
| For‐profit bias | High risk | The trial was funded by Nutricia. |
| Other bias | Low risk | The trial appeared to be free of other components that could put it at risk of bias. |
Reilly 1990.
| Methods | Randomised clinical trial, USA | |
| Participants | 18 hospitalised adults with hypoalbuminaemic cirrhosis admitted for liver transplantation, at nutritional risk due to major surgery Male:Female = 9:9 Mean age = 47.5 years |
|
| Interventions | Experimental group: TPN (non‐protein caloric intake 35 kcal/kg and 1.5 g/kg/day amino acids)(n = 10) Control group: No specific nutritional therapy, standard intravenous isotonic glucose solutions(n = 8) |
|
| Outcomes | GCS, nitrogen balance, serum ammonia, bilirubin, days intubated, days in ICU, length of stay, hospital costs, mortality | |
| Study dates | Not stated | |
| Notes | We contacted the authors on 19th August 2015 by email: jjreilly@andrew.cmu.edu. We received no reply. | |
| Risk of bias | ||
| Bias | Authors' judgement | Support for judgement |
| Random sequence generation (selection bias) | Unclear risk | Not described |
| Allocation concealment (selection bias) | Unclear risk | Not described |
| Blinding of participants and personnel (performance bias) All outcomes | High risk | The trial was described as being partially blinded, but the control group was not blinded. |
| Blinding of outcome assessment (detection bias) All outcomes | Unclear risk | Not described |
| Incomplete outcome data (attrition bias) All outcomes | Unclear risk | The number of participants with incomplete data was not reported. |
| Selective reporting (reporting bias) | Unclear risk | No protocol could be obtained, and the trial did not report serious adverse events. |
| For‐profit bias | Unclear risk | It was unclear how the trial was funded. |
| Other bias | Low risk | The trial appeared to be free of other components that could put it at risk of bias. |
Reissman 1995.
| Methods | Randomised clinical trial, USA | |
| Participants | 161 hospitalised adults undergoing major abdominal surgery, at nutritional risk due to major surgery Male:Female = 77:84 Mean age = 53.5 years |
|
| Interventions | Experimental group: Early feeding group, clear liquid diet on 1st postoperative day, and advanced to a regular diet with 24 ‐ 48 hrs(n = 80) Control group: Regular feeding. Nothing by mouth until resolution of ileus(n = 81) | |
| Outcomes | Vomiting, abdominal distention, length of ileus, tolerance of regular diet, length of hospitalisation, and complications | |
| Study dates | November 1992 and April 1994 | |
| Notes | We could obtain no contact information for the authors. | |
| Risk of bias | ||
| Bias | Authors' judgement | Support for judgement |
| Random sequence generation (selection bias) | Unclear risk | Not described |
| Allocation concealment (selection bias) | Unclear risk | Not described |
| Blinding of participants and personnel (performance bias) All outcomes | Unclear risk | Not described |
| Blinding of outcome assessment (detection bias) All outcomes | Unclear risk | Not described |
| Incomplete outcome data (attrition bias) All outcomes | Unclear risk | The number of participants with incomplete data was not reported. |
| Selective reporting (reporting bias) | Low risk | All‐cause mortality and serious adverse events were reported. |
| For‐profit bias | Unclear risk | It was unclear how the trial was funded. |
| Other bias | Low risk | The trial appeared to be free of other components that could put it at risk of bias. |
Ren 2015.
| Methods | Randomised clinical trial, China | |
| Participants | 167 adult hospitalised adults, at nutritional risk due to orthopaedic injury operation Male:Female = 88:79 Mean age: 58.8 years Excluded criteria: None specified |
|
| Interventions | Experimental group: Enteral nutrition: Short peptide nutrient solution was taken orally the 1st day after operation. 80 ‐ 160 g of short peptide nutrition was diluted to 300 ml with water and the treatment dose was dependent on participant's disease degree and health status.(n = 85) Control group: Standard care after the operation (n = 82) |
|
| Outcomes | Time of leaving bed, hospital stays, anus exhaust time, effective rate and complications | |
| Study dates | Not stated | |
| Notes | We contacted the authors by phone. We received information on random sequence generation. | |
| Risk of bias | ||
| Bias | Authors' judgement | Support for judgement |
| Random sequence generation (selection bias) | Low risk | The randomisation was conducted by random table. |
| Allocation concealment (selection bias) | Unclear risk | Not described |
| Blinding of participants and personnel (performance bias) All outcomes | High risk | The participants and personnel were not blinded. |
| Blinding of outcome assessment (detection bias) All outcomes | Unclear risk | Whether the outcome assessors were blinded was not reported. |
| Incomplete outcome data (attrition bias) All outcomes | Unclear risk | The numbers and reasons for withdrawals and dropouts were not reported. |
| Selective reporting (reporting bias) | Unclear risk | All‐cause mortality and serious adverse events were reported. |
| For‐profit bias | Unclear risk | It was unclear how the trial was funded. |
| Other bias | Low risk | The trial may or may not be free of other components that could put it at risk of bias. |
Rimbau 1989.
| Methods | Randomised clinical trial, France | |
| Participants | 20 hospitalised adults undergoing aortabifemoral bypass, at nutritional risk due to major surgery Male:female = not stated Mean age = 56.5 years Exclusion: diseases predisposing malnutrition, renal or hepatic disease |
|
| Interventions | Experimental group: TPN from 12 hrs post‐operatively to day 4 at the rate of 0.16 N/kg/day and 16.7 kcal/kg/day with 50% from carbohydrates and 50% from lipids (n = 10) Control group: standard post‐operative fluids (n = 10) |
|
| Outcomes | IPN prior to the surgery and on day 4, triceps skinfold thickness, albumin, transferrin, delayed cutaneus hypersensibility defined on a scale from 0 to 2, protein catabolism, blood loss during surgery, complications, length of hospital stay, cost benefit | |
| Study dates | Not stated | |
| Notes | We found no contact information for the authors. | |
| Risk of bias | ||
| Bias | Authors' judgement | Support for judgement |
| Random sequence generation (selection bias) | Unclear risk | Not described |
| Allocation concealment (selection bias) | Unclear risk | Not described |
| Blinding of participants and personnel (performance bias) All outcomes | Unclear risk | Not described |
| Blinding of outcome assessment (detection bias) All outcomes | Unclear risk | Not described |
| Incomplete outcome data (attrition bias) All outcomes | Low risk | No dropouts |
| Selective reporting (reporting bias) | Unclear risk | Mortality was not reported. |
| For‐profit bias | Unclear risk | It was unclear how the trial was funded. |
| Other bias | Low risk | The trial appeared to be free of other components that could put it at risk of bias. |
Roberts 2000.
| Methods | Randomised clinical trial, USA | |
| Participants | 55 hospitalised adults undergoing analogues marrow or blood transplantation Male:Female = not described Mean age = not described Exclusion criteria: Not reported |
|
| Interventions | Experimental: TPN 30 ‐ 35 kcal/kg and 1.5 ‐ 1.75 g protein/kg(n = 28) Control: No intervention(n = 28) Co‐intervention: Oral diet |
|
| Outcomes | Length of stay, albumin, hand‐grip strength (not used) | |
| Study dates | Not stated | |
| Notes | We contacted the authors by email: Susan.Roberts@BSWHealth.org. The author responded with information on blinding. | |
| Risk of bias | ||
| Bias | Authors' judgement | Support for judgement |
| Random sequence generation (selection bias) | Unclear risk | Not described |
| Allocation concealment (selection bias) | Unclear risk | Not described |
| Blinding of participants and personnel (performance bias) All outcomes | High risk | Not blinded |
| Blinding of outcome assessment (detection bias) All outcomes | High risk | The outcome assessors were not blinded. |
| Incomplete outcome data (attrition bias) All outcomes | Unclear risk | The number of participants with incomplete data was not reported. |
| Selective reporting (reporting bias) | Unclear risk | No protocol could be obtained and the trial did not report mortality or complications. |
| For‐profit bias | Low risk | The trial was funded by the local hospital. |
| Other bias | Unclear risk | The trial appeared to be free of other components that could put it at risk of bias. |
Roth 2013.
| Methods | Randomised clinical trial, Switzerland | |
| Participants | 157 hospitalised adults undergoing surgery with pelvic lymph node dissection, cystectomy and ileal diversion for bladder cancer, at nutritional risk due to major surgery Male:Female = 106:51 Mean age = 67 years Exclusion criteria: previous pelvic lymph node dissection, previous radiation therapy, prior bowel surgery, severe hepatic or cardiac dysfunction, an inability to give fully informed consent |
|
| Interventions | Experimental group: TPN consisting of Nutriflex special 70/240 (B. Braun Medical, Melsungen, Germany), a solution with a total energy of 1240 kcal/1000 ml and containing polyamino acids, glucose, and electrolytes. TPN (1500 ml/day; total 1860 kcal/day; 105 g polyamino acids/day; 360 g glucose/day; 0 g lipids/day) was administered continuously for 5 days starting on postoperative day 1. No intravenous supplementation of vitamins or trace elements were given. An additional 30 IU Actrapid HM (Novo Nordisk, Copenhagen, Denmark) and 1875 IU heparin (Liquemin; Drossapharm, Basel‐Stadt, Switzerland) every 24 hrs were added to the TPN solution. (n = 74) Control group: Ringer’s lactate solution (Sintetica–Bioren, Mendrisio, Switzerland; 1500 ml/24 h) and additional potassium substitution (40 mmol/24 h) (n = 83) Co‐interventions: Oral intake was started with clear fluids on the day of surgery, with fluids started on postoperative day 1. Solid diet was resumed on the return of active bowel sounds and when fluids were well tolerated. Perioperatively, a central venous catheter was placed in all participants. Perioperative antibiotic therapy consisted of aminoglycoside and metronidazole for 48 hrs and amoxicilin/clavulanic acid until removal of all stents and catheters. Perioperatively, 3000 ‐ 4000 ml of parenteral crystalloids were routinely administered. Combined general and epidural anaesthesia were given intra‐operatively. Postoperative epidural (T9 ‐ T10) analgesia was routinely used, but systemic morphine derivates were avoided. To stimulate postoperative bowel function, subcutaneous injections of 0.5 mg neostigmine methylsulfate up to 6 times a day were administered to all in similar distribution starting on postoperative day 2 and continuing until bowel activity resumed. Anti‐emetics and other prokinetic drugs were not routinely administered and only given as needed. Low‐molecular‐weight heparin (Fraxiparine) was started on the evening before surgery and maintained for at least 10 days. |
|
| Outcomes | Occurence of postoperative complications, time to recovery of bowel function, biochemical nutritional (serum albumin, serum prealbumin, serum total protein) and inflammatory (C‐reactive protein) parametres, length of hospital stay, cost attributed to the TPN, time to full diet resumption | |
| Study dates | September 2008 and March 2011 | |
| Notes | We contacted the authors on 07th April 2016 by email: urology.berne@insel.ch. | |
| Risk of bias | ||
| Bias | Authors' judgement | Support for judgement |
| Random sequence generation (selection bias) | Low risk | Randomisation was done by a computer‐based programme. |
| Allocation concealment (selection bias) | Unclear risk | Not described |
| Blinding of participants and personnel (performance bias) All outcomes | High risk | Blinding was not performed. |
| Blinding of outcome assessment (detection bias) All outcomes | Unclear risk | Not described |
| Incomplete outcome data (attrition bias) All outcomes | Low risk | No drop‐outs, none lost to follow‐up |
| Selective reporting (reporting bias) | Low risk | No protocol could be obtained but the trial reported complications and mortality. |
| For‐profit bias | Low risk | The trial was not funded by any company that might have a vested interest in the results. |
| Other bias | Low risk | The trial appeared to be free of other components that could put it at risk of bias. |
Russell 1984.
| Methods | Randomised clinical trial, Canada | |
| Participants | 31 hospitalised adults with small‐cell lung cancers, at nutritional risk due to trialist indication Male:Female = 21:10 Mean age = 55.8 years Exclusion criteria: (a) recent myocardial infarction (< 3 months from the date of diagnosis), congestive cardiac failure, or cardiac arrhythmia; (b) documented central nervous system metastases (c) superior vena cava obstruction precluding central venous catheterisation for TPN; (d) inappropriate antidiuretic hormone syndrome; (e) other comorbid disease which rendered treatment inappropriate; (f) performance status of 4 on the ECOG scale |
|
| Interventions | Experimental: the TPN provided between 1 and 1.25 g/kg body weight/day of crystalline amino acids (Travasol; Baxter‐Travenol Laboratories of Canada) and a nonprotein calorie intake of between 32 and 40 kcal/kg body weight/day given as an equicaloric mixture of dextrose and lipid (Nutralipid; Pharmacia, Canada). Depleted participants (> 5% body weight loss in the 3 months prior to diagnosis) received an amino acid intake of between 1.50 and 2.0 g/kg body weight/day and a nonprotein calorie intake of 48 to 64 kcal/kg body weight/day. Both the protein and calorie intake were reassessed each week, and minor adjustments were made depending on clinical assessment of the nutritional status. Oral intake was restricted to noncaloric fluids. (n = 15) Control: continued to consume a self‐regulated oral diet(n = 16) Co‐interventions: chemotherapy |
|
| Outcomes | Energy metabolism and substrate hormone profile | |
| Study dates | Not stated | |
| Notes | We could obtain no contact information for the authors. | |
| Risk of bias | ||
| Bias | Authors' judgement | Support for judgement |
| Random sequence generation (selection bias) | Unclear risk | Not described |
| Allocation concealment (selection bias) | Unclear risk | Not described |
| Blinding of participants and personnel (performance bias) All outcomes | Unclear risk | Not described |
| Blinding of outcome assessment (detection bias) All outcomes | Unclear risk | Not described |
| Incomplete outcome data (attrition bias) All outcomes | Unclear risk | The number of participants with incomplete data was not reported. |
| Selective reporting (reporting bias) | Unclear risk | No protocol could be obtained and the trial did not report mortality or complications. |
| For‐profit bias | Unclear risk | It was unclear if the trial was supported by a company with an interest in a given result: "Supported by an NIH Contract with the University of Toronto (Contract NOICM‐ 97267), the Ontario Ministry of Health (Grant PR 228), and various sponsors.". |
| Other bias | Low risk | The trial appeared to be free of other components that could put it at risk of bias. |
Ryan 1993.
| Methods | Randomised clinical trial, Canada | |
| Participants | 10 hospitalised adults, at nutritional risk due to being 85% of ideal weight Male:Female = 5:5 Mean age = 68 years |
|
| Interventions | Experimental group: nocturnal supplemental nasoenteric infusion (1000 kcal above usual caloric intake), or 1.7 times measured REE.(n = 6)
Control group: placebo (containing < 100 kcal, same volume)(n = 4) Co‐intervention: normal diet |
|
| Outcomes | Kcal/day, weight change, Vo2/min, RQ | |
| Study dates | Not stated | |
| Notes | We contacted the authors on 13th December 2015 by email: fryan@interchange.ubc.ca. We received no reply. | |
| Risk of bias | ||
| Bias | Authors' judgement | Support for judgement |
| Random sequence generation (selection bias) | Unclear risk | Not described |
| Allocation concealment (selection bias) | Unclear risk | Not described |
| Blinding of participants and personnel (performance bias) All outcomes | Low risk | The trial was a placebo study, and described how the participants and personnel were blinded. |
| Blinding of outcome assessment (detection bias) All outcomes | Low risk | The trial was a placebo study, and described how the outcome assessment was blinded. |
| Incomplete outcome data (attrition bias) All outcomes | Unclear risk | The number of participants with incomplete data was not reported. |
| Selective reporting (reporting bias) | Unclear risk | No protocol could be obtained, and the trial did not report on all‐cause mortality or serious adverse events. |
| For‐profit bias | High risk | The trial was funded by a pharmaceutical company (Bristol‐Myers Squibb). |
| Other bias | Low risk | The trial appeared to be free of other components that could put it at risk of bias. |
Sabin 1998.
| Methods | Randomised clinical trial, Germany | |
| Participants | 80 hospitalised adults admitted for PEG placement, at nutritional risk due to being in an ICU | |
| Interventions | Experimental group: Enteral nutrition 3 hrs after PEG placement for 1 day(n = 40) Control group: i.v. fluids for 2 days(n = 40) Co‐interventions: Normal enteral nutrition from 2nd day |
|
| Outcomes | RV, complications, mortality, pneumoperitoneum | |
| Study dates | Not stated | |
| Notes | We contacted the authors on 13th December 2015 by email: med2.keymling@klinikum‐meiningen.de. We received no reply. | |
| Risk of bias | ||
| Bias | Authors' judgement | Support for judgement |
| Random sequence generation (selection bias) | Unclear risk | Not described |
| Allocation concealment (selection bias) | Unclear risk | Not described |
| Blinding of participants and personnel (performance bias) All outcomes | Unclear risk | Not described |
| Blinding of outcome assessment (detection bias) All outcomes | Unclear risk | Not described |
| Incomplete outcome data (attrition bias) All outcomes | Unclear risk | The number of participants with incomplete data was not reported. |
| Selective reporting (reporting bias) | Low risk | The trial reported serious adverse events and mortality. |
| For‐profit bias | Unclear risk | It was unclear how the trial was funded. |
| Other bias | Low risk | The trial appeared to be free of other components that could put it at risk of bias. |
Sacks 1995.
| Methods | Randomised clinical trial, USA | |
| Participants | 17 hospitalised adults with severe closed‐head injury, at nutritional risk due to increased nutritional requirements Male:Female = not reported Mean age = 37.2 years Exclusion criteria: Pregnancy, age > 65 years, documented hepatic dysfunction (serum bilirubin > 2.0 mg/dL or a history of cirrhosis), hypertriglyceridaemia (> 300 mg/dL), or infection at the time of admission. People with significant intra‐abdominal injuries routinely received enteral nutrition through jejunal tubes and were not enrolled into the study. People requiring scheduled corticosteroid pharmacotherapy after the 1st 24 hrs of hospital admission were also excluded from the study. |
|
| Interventions | Experimental group: Participants received parenteral nutrition (PN) at day 1 through a central venous catheter with a nutrient goal of 2 g protein/kg a day and 40 non‐protein kcal/kg a day. Maximum glucose administration was not allowed to exceed 6 mg/kg a minute. IV fat emulsion was administered and comprised 15% to 30% of non‐protein calories. The PN solution was supplemented with electrolytes and standard amounts of vitamins and trace elements.(n = 8) Control group: No intervention(n = 9) Co‐interventions: Participants were transitioned to enteral nutrition support as soon as the gastro‐intestinal tract became functional and accessible. |
|
| Outcomes | T‐lymphocyte responsiveness to mitogen stimulation, proliferative response to Con A stimulation, T‐lymphocyte proliferative response, IL‐6 serum concentrations, pre‐albumin serum concentrations, A (Con A), phytohaemagglutinin (PHA), and pokeweed mitogens (PWM), peripheral blood mononuclear cells (PBMCs), urinary nitrogen excretion, immunologic function, nutrient, energy and protein intake and mortality | |
| Study dates | Not stated | |
| Notes | We contacted the authors on 30th June 2015 by email: KUDSK@surgery.wisc.edu. We received a reply. | |
| Risk of bias | ||
| Bias | Authors' judgement | Support for judgement |
| Random sequence generation (selection bias) | Low risk | Random sequence generation was done using a table of random numbers. |
| Allocation concealment (selection bias) | Unclear risk | The allocation was concealed in sealed envelopes, but it was unclear if they were opaque. |
| Blinding of participants and personnel (performance bias) All outcomes | Unclear risk | Not described |
| Blinding of outcome assessment (detection bias) All outcomes | Unclear risk | Not described |
| Incomplete outcome data (attrition bias) All outcomes | Unclear risk | The number of participants with incomplete data was not reported. |
| Selective reporting (reporting bias) | Unclear risk | No protocol could be obtained. The trial reported all‐cause mortality but not serious adverse events. |
| For‐profit bias | Low risk | No financial support. |
| Other bias | Low risk | The trial appeared to be free of other components that could put it at risk of bias. |
Sada 2014.
| Methods | Randomised clinical trial, Kosovo, parallel design, conducted between January 2010 – January 2012 | |
| Participants | 145 hospitalised adults undergoing open colorectal and open cholecystectomy, at nutritional risk due to undergoing major surgery Male:Female = 53:89 (3 missing) Mean age = 56 years Exclusion: type 1 or 2 diabetes mellitus, stomach‐emptying disorders or documented gastric oesophageal reflex disease, emergency surgery interventions |
|
| Interventions | Experimental: the study group received 800 mL (by mouth) of carbohydrate beverage in the evening before surgery (22:00) and an additional 400 mL 2 hrs before anaesthesia induction. The beverage contained 12.5% carbohydrates (polycarbohydrates), 50 kcal/100 mL, 285 mOsmol/kg (NutriciapreOp, Nutricia Ltd.) (n = 44) Control: there were 2 control groups: 1. The placebo group received a non‐caloric colourless liquid with the same taste and without carbohydrates in the same amount as the participants in the experimental group. (n = 46) 2. The control group did not receive any of these drinks and were subject to the traditional preoperative fasting(n = 52) |
|
| Outcomes | VAS score, length of stay | |
| Study dates | January 2010 – January 2012 | |
| Notes | Trial registration: ANZCTR.org.au: ACTRN12614000995673. | |
| Risk of bias | ||
| Bias | Authors' judgement | Support for judgement |
| Random sequence generation (selection bias) | Low risk | Throwing dice by an independent person, not otherwise involved in the trial |
| Allocation concealment (selection bias) | Unclear risk | Not described |
| Blinding of participants and personnel (performance bias) All outcomes | Low risk | The placebo was identical in appearance and taste. |
| Blinding of outcome assessment (detection bias) All outcomes | Low risk | The placebo was identical in appearance and taste. |
| Incomplete outcome data (attrition bias) All outcomes | Low risk | Under 5% of participants had incomplete outcome data. |
| Selective reporting (reporting bias) | Unclear risk | The trial was retrospectively registered and did not report mortality or serious adverse events. |
| For‐profit bias | Unclear risk | The trial was sponsored by University Clinical Center of Kosovo and by an individual Avdyl Krasniqi. |
| Other bias | Low risk | The trial appeared to be free of other components that could put it at risk of bias. |
Saluja 2002a.
| Methods | Randomised clinical trial, India | |
| Participants | 20 hospitalised adults between 20 and 60 years undergoing major abdominal surgery, at nutritional risk due to major abdominal surgery | |
| Interventions | Experimental group: Received the standard ward diet plus the hospital kitchen‐prepared liquid sip feed of 500 ml, providing 500 kcal comprising 16.66 g protein, 43.5 g carbohydrate, and 30 g fat. The 500‐ml sip feed contained 375 ml milk, 12.5 g sugar, 12.5 g butter, 12.5 g colustarch, 125 ml rice water, and half an egg. (n = 19) Control group: Received a standard ward diet (n = 10) |
|
| Outcomes | Weight, albumin, middle‐arm circumference (MAC), hand‐grip strength, lymphocyte count | |
| Study dates | April 1999 to March 2000 | |
| Notes | 1st comparison of the complete trial Saluja 2002. We contacted the authors by email sundeepsaluja@yahoo.co.in. The author could not remember the method of randomisation. | |
| Risk of bias | ||
| Bias | Authors' judgement | Support for judgement |
| Random sequence generation (selection bias) | Unclear risk | In the trial the randomisation was described as being done through drawing lots but it was unclear if this was done by an independent person. The author could not remember the method of randomisation. |
| Allocation concealment (selection bias) | Unclear risk | Not described |
| Blinding of participants and personnel (performance bias) All outcomes | High risk | Not described |
| Blinding of outcome assessment (detection bias) All outcomes | High risk | Not described |
| Incomplete outcome data (attrition bias) All outcomes | Low risk | There were no dropouts or withdrawals. |
| Selective reporting (reporting bias) | Low risk | No protocol could be obtained, but we received information on all‐cause mortality and serious adverse events. |
| For‐profit bias | Unclear risk | It was unclear how the trial was funded. |
| Other bias | Low risk | The trial appeared to be free of other components that could put it at risk of bias. |
Saluja 2002b.
| Methods | Randomised clinical trial, India | |
| Participants | 20 hospitalised adults between 20 and 60 undergoing major abdominal surgery, at nutritional risk due to major abdominal surgery | |
| Interventions | Experimental group: Received the standard ward diet plus the hospital kitchen‐prepared liquid sip feed of 500 ml, providing 500 kcal comprising 16.66 g protein, 43.5 g carbohydrate, and 30 g fat. The 500‐ml sip feed contained 375 ml milk, 12.5 g sugar, 12.5 g butter, 12.5 g colostric, 125 ml rice water, and half an egg. (n = 10) Control group: Received a standard ward diet(n = 10) |
|
| Outcomes | Weight, albumin, middle‐arm circumference (MAC), hand‐grip strength, lymphocyte count | |
| Study dates | April 1999 to March 2000 | |
| Notes | 2nd category of the complete trial Saluja 2002 | |
| Risk of bias | ||
| Bias | Authors' judgement | Support for judgement |
| Random sequence generation (selection bias) | Unclear risk | In the trial the randomisation was described as being done through drawing lots but it was unclear if this was done by an independent person. |
| Allocation concealment (selection bias) | Unclear risk | Not described |
| Blinding of participants and personnel (performance bias) All outcomes | High risk | Not described |
| Blinding of outcome assessment (detection bias) All outcomes | Unclear risk | Not described |
| Incomplete outcome data (attrition bias) All outcomes | Low risk | There were no dropouts or withdrawals. |
| Selective reporting (reporting bias) | Low risk | No protocol could be obtained, but we received information on all‐cause mortality and serious adverse events. |
| For‐profit bias | Unclear risk | It was unclear how the trial was funded. |
| Other bias | Low risk | The trial appeared to be free of other components that could put it at risk of bias. |
Saluja 2002c.
| Methods | Randomised clinical trial, India | |
| Participants | 20 hospitalised adults between 20 and 60 undergoing major abdominal surgery, at nutritional risk due to major abdominal surgery | |
| Interventions | Experimental group: Received the standard ward diet plus the hospital kitchen‐prepared liquid sip feed of 500 ml, providing 500 kcal comprising 16.66 g protein, 43.5 g carbohydrate, and 30 g fat. The 500‐ml sip feed contained 375 ml milk, 12.5 g sugar, 12.5 g butter, 12.5 g colustarch, 125 ml rice water, and half an egg(n = 10) Control group: Received a standard ward diet(n = 10) |
|
| Outcomes | Weight, albumin, middle‐arm circumference (MAC), hand‐grip strength, lymphocyte count | |
| Study dates | April 1999 to March 2000 | |
| Notes | 3rd category of the complete trial Saluja 2002 | |
| Risk of bias | ||
| Bias | Authors' judgement | Support for judgement |
| Random sequence generation (selection bias) | Unclear risk | In the trial the randomisation was described as being done through drawing lots but it was unclear if this was done by an independent person. |
| Allocation concealment (selection bias) | Unclear risk | Not described |
| Blinding of participants and personnel (performance bias) All outcomes | High risk | Not described |
| Blinding of outcome assessment (detection bias) All outcomes | Unclear risk | Not described |
| Incomplete outcome data (attrition bias) All outcomes | Low risk | There were no dropouts or withdrawals. |
| Selective reporting (reporting bias) | Low risk | No protocol could be obtained, but we received information on all‐cause mortality and serious adverse events. |
| For‐profit bias | Unclear risk | It was unclear how the trial was funded. |
| Other bias | Low risk | The trial appeared to be free of other components that could put it at risk of bias. |
Samuels 1981.
| Methods | Randomised clinical trial, USA | |
| Participants | 35 hospitalised adults admitted for stage III metastatic testicular cancer, at nutritional risk due to anthropometrics Male:Female = Not reported Mean age = Not reported Exclusion criteria: Participants characterised as severely malnourished (weight loss > 12%, duration not stated) |
|
| Interventions | Experimental group: received intravenous hyperalimentation solution containing 25% dextrose with 4.25% amino acids, supplementary vitamins, electrolytes and trace elements, which provided 35 kcals/kg/day. Intervention started on day 1 of hospitalisation, and was continued throughout the course of the chemotherapy, terminating 24 hrs before discharge. The mean duration of IVH was 48 days for noninfected participants and 18 days for infected participants. (n = 20) Control group: control participants who developed significant gastro‐intestinal toxic effects received 3 litres of parenteral fluids daily, usually containing 5% glucose, 0.5 normal saline and 40 mEq of potassium chloride. In the event of > 12% weight loss after chemotherapy, control participants were crossed over to receive intravenous hyperalimentation at the discretion of the investigator. (n = 15) Co‐intervention: Both groups was divided in 2, where 1 group received vinblastine and bleomycin, and the other received vinblastine, bleomycin and cisplatin. |
|
| Outcomes | Mortality, weight, septicaemia, pneumonia, infections, liver function, leukopenia, serum albumin, serum transferrin, granulocyte count, granulocytopenic fever, platelet count and oral toxicity | |
| Study dates | Not stated | |
| Notes | We could obtain no contact information from the authors. The 35 patients were stratified into 3 nutritional‐status categories: well‐nourished, moderately malnourished and malnourished. | |
| Risk of bias | ||
| Bias | Authors' judgement | Support for judgement |
| Random sequence generation (selection bias) | Low risk | The trial was block‐randomised using random‐number tables. |
| Allocation concealment (selection bias) | Unclear risk | Allocation concealment was done using sealed envelopes but it was unclear if they were opaque. |
| Blinding of participants and personnel (performance bias) All outcomes | Unclear risk | Not described |
| Blinding of outcome assessment (detection bias) All outcomes | Unclear risk | Not described |
| Incomplete outcome data (attrition bias) All outcomes | Low risk | There were no dropouts. |
| Selective reporting (reporting bias) | Low risk | No protocol could be obtained , but all‐cause‐mortality and serious adverse events were reported. |
| For‐profit bias | Low risk | Supported by contracts from the division of Cancer Cause and prevention, National Cancer institute, National Institutes of Health, Department of Health and Human Services. |
| Other bias | Low risk | The trial appeared to be free of other components that could put it at risk of bias. |
Saudny‐Unterberger 1997.
| Methods | Randomised clinical trial, Canada | |
| Participants | 33 hospitalised adults with COPD and a FEV1 ≤ 60% of the predicted value, admitted because of acute exacerbation, at nutritional risk due to trialist indication.
Male:Female = 15:9 (gender not reported for nine participants) Mean age = 69 (only participants who completed the study) Exclusion criteria: in need of mechanical ventilation, gastro‐intestinal tract disorder, active cancer or other conditions predisposing to weight loss, terminally ill, unable to communicate in English or French, suffered from mental confusion or followed a special diet |
|
| Interventions | Experimental group: ONS. Participants received oral supplements; Ensure, Ensure Plus, puddings or extra snacks to assure a caloric intake of at least 1.5 x resting energy expenditure (REE) if their BMI was normal (20 to 27) and at least 1.7 x REE if their BMI was below 20. (n = 17) Control group: No intervention (n = 16) Co‐interventions: All participants received traditional hospital diet |
|
| Outcomes | Lung function; FEV1, FVC, inspiratory muscle strength (PImax), respiratory muscle strength; Expiratory muscle strength (PEmax), hand‐grip strength, upper body strength, activities of daily living in older adults, nitrogen balance; glucocorticosteroid use, weight, mean energy and macronutrient intakes, degree of breathlessness, 6‐minute walk test, length of hospital stay and general well‐being (QoL) | |
| Study dates | November 1993 to May 1996 | |
| Notes | We contacted the authors on 13th November 2015 by email: James.Martin@McGill.ca . The authors replied that additional data did not exist. | |
| Risk of bias | ||
| Bias | Authors' judgement | Support for judgement |
| Random sequence generation (selection bias) | Unclear risk | Not described |
| Allocation concealment (selection bias) | Unclear risk | Not described |
| Blinding of participants and personnel (performance bias) All outcomes | Unclear risk | Not described |
| Blinding of outcome assessment (detection bias) All outcomes | Unclear risk | All strength measurements were done by laboratory personnel who were blinded. Blinding of other outcome assessments was not described. |
| Incomplete outcome data (attrition bias) All outcomes | Unclear risk | They did not use intention‐to‐treat analysis, but the numbers and reasons for dropouts were clearly stated. There were incomplete data for more than 5%. |
| Selective reporting (reporting bias) | Unclear risk | The trial reported all‐cause mortality, but not serious adverse events. No protocol could be obtained. |
| For‐profit bias | High risk | Supplements were provided by Abbott Laboratories, Montreal, Canada. |
| Other bias | Low risk | The trial appeared to be free of other components that could put it at risk of bias. |
Sax 1987.
| Methods | Randomised clinical trial, USA | |
| Participants | 55 hospitalised adults with acute pancreatitis, at nutritional risk according to the trialist Male:Female = 40:15 Mean age = 39.8 years |
|
| Interventions | Experimental group: Early TPN (25% dextrose, 4.25% amino acid) for 7 days(n = 29) Control group: No intervention (n = 26) Co‐interventions: Conventional therapy, consisting of intravenous fluids, analgesics, antacids, and nasogastric suction |
|
| Outcomes | Length of hospital stay, serum amylase, glucose, alkaline phosphatase, bilirubin, albumin, total lymphocyte count, days until first oral intake, nitrogen balance, serum transferrin, complications, catheter sepsis, mortality | |
| Study dates | Not stated | |
| Notes | We contacted the authors on 23rd June 2015 on email: hcsaxmd@gmail.com. We received no reply. | |
| Risk of bias | ||
| Bias | Authors' judgement | Support for judgement |
| Random sequence generation (selection bias) | Unclear risk | Not described |
| Allocation concealment (selection bias) | Unclear risk | Not described |
| Blinding of participants and personnel (performance bias) All outcomes | Unclear risk | Not described |
| Blinding of outcome assessment (detection bias) All outcomes | Unclear risk | Not described |
| Incomplete outcome data (attrition bias) All outcomes | Unclear risk | The number of participants with incomplete data was not reported. |
| Selective reporting (reporting bias) | Low risk | The trial reported all‐cause‐mortality and serious adverse events. |
| For‐profit bias | Unclear risk | It was unclear how the trial was funded. |
| Other bias | Low risk | The trial appeared to be free of other components that could put it at risk of bias. |
Schmitz 1984.
| Methods | Randomised clinical trial, Germany | |
| Participants | 40 hospitalised adults admitted because of polytraumatised and in need of ventilation, at nutritional risk due to being in an ICU. Male:Female = 26:14 Mean age = 35.4 |
|
| Interventions | Experimental group 1: parenteral carbohydrates for 4 days(n = 10)
Experimental group 2: parenteral carbohydrates + 1 g amino acids for 4 days(n = 10) Experimental group 3: parenteral carbohydrates + 2 g amino acids for 4 days(n = 10) Control group: i.v. fluids(n = 10) |
|
| Outcomes | Serum and urinary biomarkers (glucose, fructose), xylitconcentration, energy, urea | |
| Study dates | Not stated | |
| Notes | We found no contact information for the authors. | |
| Risk of bias | ||
| Bias | Authors' judgement | Support for judgement |
| Random sequence generation (selection bias) | Unclear risk | Not described |
| Allocation concealment (selection bias) | Unclear risk | Not described |
| Blinding of participants and personnel (performance bias) All outcomes | Unclear risk | Not described |
| Blinding of outcome assessment (detection bias) All outcomes | Unclear risk | Not described |
| Incomplete outcome data (attrition bias) All outcomes | Unclear risk | The number of participants with incomplete data was not reported. |
| Selective reporting (reporting bias) | Unclear risk | No protocol could be obtained, and the trial did not report on all‐cause mortality or serious adverse events. |
| For‐profit bias | Unclear risk | It was unclear how the trial was funded. |
| Other bias | Low risk | The trial appeared to be free of other components that could put it at risk of bias. |
Schriker 2008.
| Methods | Randomised clinical trial, Canada. | |
| Participants | 22 hospitalised adults undergoing colorectal cancer surgery, at nutritional risk due to major surgery Male:Female = 13:9 Mean age = 62.5 Exclusion criteria: metastatic disease, weight loss 10% over the preceding 3 months, congestive heart failure, hepatic disease, diabetes, and those receiving drugs known to have metabolic effects such as corticosteroids or beta‐blockers |
|
| Interventions | Experimental group: Preoperative nutrition (glucose and amino acids) for 2 days(n = 11) Control group: no intervention(n = 11) Co‐intervention: Postoperative nutrition (glucose and amino acids) |
|
| Outcomes | Biochemistry, gaseous exchange | |
| Study dates | between June 2004 and June 2007 | |
| Notes | We contacted the authors on 24th August 2016 by email: thomas.schricker@mcgill.ca. | |
| Risk of bias | ||
| Bias | Authors' judgement | Support for judgement |
| Random sequence generation (selection bias) | Low risk | Computer‐generated random allocation |
| Allocation concealment (selection bias) | Unclear risk | The sealed envelope were not described as opaque. |
| Blinding of participants and personnel (performance bias) All outcomes | Unclear risk | Not described |
| Blinding of outcome assessment (detection bias) All outcomes | Low risk | The surgeon and investigators responsible for sample analyses and data analysis were not aware of group assignment. |
| Incomplete outcome data (attrition bias) All outcomes | Low risk | No dropouts |
| Selective reporting (reporting bias) | Low risk | NCT00614133 ‐ all outcomes stated in the protocol were assessed. |
| For‐profit bias | Low risk | The trial was sponsored by McGill University Health Center |
| Other bias | Low risk | The trial appeared to be free of other components that could put it at risk of bias |
Schroeder 1991.
| Methods | Randomised clinical trial, New Zealand | |
| Participants | 32 hospitalised adults undergoing small or large bowel resection, at nutritional risk due to major gastrointestinal surgery Male:Female = 17:15 Mean age = 52 years Exclusion criteria: none stated |
|
| Interventions | Experimental group: Enteral feeding was initiated postsurgically with 50 ml/hr and increased to 80 ml/hr if absorption was without problems (n = 16).
Control group: Postoperative i.v. fluids were normal saline and 5% dextrose solutions (n = 16). Co‐interventions: Oral fluids and food were restarted usually depending on the presence of bowel sounds and passage of flatus. |
|
| Outcomes | Complications, time to flatus, time to first bowel movement, weight loss, water loss, protein loss, fat loss, wound healing, muscle function, postoperative caloric intake and length of stay | |
| Study dates | Not stated | |
| Notes | 1 participant in the Experimental group had chronic renal failure, and was given a low‐protein modification of Osmolite. We contacted the authors in September 2015 by email: reception@obesitysurgery.co.nz.. We received no reply. | |
| Risk of bias | ||
| Bias | Authors' judgement | Support for judgement |
| Random sequence generation (selection bias) | Unclear risk | Not described |
| Allocation concealment (selection bias) | Unclear risk | Not described |
| Blinding of participants and personnel (performance bias) All outcomes | Unclear risk | Not described |
| Blinding of outcome assessment (detection bias) All outcomes | Unclear risk | Not described |
| Incomplete outcome data (attrition bias) All outcomes | Unclear risk | The number of participants with incomplete data was not reported. |
| Selective reporting (reporting bias) | Unclear risk | No protocol could be obtained and the trial did not report on all‐cause mortality. |
| For‐profit bias | High risk | The trial was funded by Abbott Laboratories. |
| Other bias | Low risk | The trial appeared to be free of other components that could put it at risk of bias. |
Schuetz 2006.
| Methods | Randomised clinical trial, country unknown. | |
| Participants | 22 hospitalised adults with liver cirrhosis, at nutritional risk due to increased nutritional requirements Male:Female = 16:6 Mean age = 60 years Exclusion criteria: None stated |
|
| Interventions | Experimental group: Enteral nutrition. Tube‐feeding providing a high energy and protein intake for 2 weeks (n = unknown) Control group: No intervention (n = unknown) Co‐interventions: Both groups received normal diet |
|
| Outcomes | Severity of hepatic encephalopathy with psychometric and neurophysiologic tests, and calorie consumption | |
| Study dates | Not stated | |
| Notes | We could obtain no contact information for the authors. | |
| Risk of bias | ||
| Bias | Authors' judgement | Support for judgement |
| Random sequence generation (selection bias) | Unclear risk | Not described |
| Allocation concealment (selection bias) | Unclear risk | Not described |
| Blinding of participants and personnel (performance bias) All outcomes | Unclear risk | Not described |
| Blinding of outcome assessment (detection bias) All outcomes | Unclear risk | Not described |
| Incomplete outcome data (attrition bias) All outcomes | Unclear risk | The number of participants with incomplete data was not reported. |
| Selective reporting (reporting bias) | Unclear risk | No protocol could be obtained, and the trial did not report on all‐cause mortality or serious adverse events. |
| For‐profit bias | Unclear risk | It was unclear how the trial was funded. |
| Other bias | Low risk | The trial appeared to be free of other components that could put it at risk of bias. |
Sharma 2013.
| Methods | Randomised clinical trial, UK | |
| Participants | 55 hospitalised adults undergoing colorectal surgery, at nutritional risk due to major gastro‐intestinal surgery Male:Female = 35:20 Mean age = 66 Exclusion criteria: Dementia, lactose intolerance, pregnancy, diabetes mellitus, age under 16, musculoskeletal conditions preventing accurate use of the hand‐grip dynamometer and unable to feed orally preoperatively. Postoperative exclusion criteria were postoperative admission to ICU or administration of TPN. |
|
| Interventions | Experimental group: Received standard diet + 6 x 60 ml/day of Pro‐Cal (3.33 kcal/ml and 0.06 mg/ml of protein) for the duration of the hospital stay(n = 32) Control group: Received standard diet for the duration of the hospital stay (n = 30) | |
| Outcomes | Primary outcome: Muscle strength at discharge Secondary outcome: Daily calorie intake, nausea, days to first flatus, days to first bowel movement and postoperative length of hospital stay |
|
| Study dates | Between June 2007 and November 2010 | |
| Notes | We contacted the authors in September 2015 by email: dr_miteshsharma@yahoo.co.uk. We received no reply. | |
| Risk of bias | ||
| Bias | Authors' judgement | Support for judgement |
| Random sequence generation (selection bias) | Low risk | Computer‐generated |
| Allocation concealment (selection bias) | Unclear risk | The envelopes were described as sealed but not opaque. |
| Blinding of participants and personnel (performance bias) All outcomes | High risk | Not blinded |
| Blinding of outcome assessment (detection bias) All outcomes | Unclear risk | Not described |
| Incomplete outcome data (attrition bias) All outcomes | High risk | 7 randomised participants were later excluded resulting in above 5% dropouts. The trial did not account for the missing participants. |
| Selective reporting (reporting bias) | Unclear risk | No protocol could be obtained and the trial did not report on all‐cause mortality or serious adverse events. |
| For‐profit bias | Low risk | "The resources of our department were utilized to conduct the study". |
| Other bias | Low risk | The trial appeared to be free of other components that could put it at risk of bias. |
Shestopalov 1996.
| Methods | Randomised clinical trial, Russia | |
| Participants | 64 hospitalised adults with multiple organ failure because of diffuse purulent peritonitis, at nutritional risk due to increased nutritional requirements Male:Female = Not reported Exclusion criteria: Not reported |
|
| Interventions | Experimental group: Enteral nutrition. Started from the 1st hours after operation (n = 33) Control group: No intervention(n = 31) |
|
| Outcomes | Metabolic, hormonal and immunologic status change, stage of intestinal insufficiency syndrome, severity of organ disorders, severity of gastro‐intestinal function disorders, hepatic, cardiac and respiratory insufficiency, and mortality | |
| Study dates | Not stated | |
| Notes | We contacted the authors on 14th October 2015 by email: ashest@yandex.ru. We received an initial reply but no further answer. | |
| Risk of bias | ||
| Bias | Authors' judgement | Support for judgement |
| Random sequence generation (selection bias) | Unclear risk | Not described |
| Allocation concealment (selection bias) | Unclear risk | Not described |
| Blinding of participants and personnel (performance bias) All outcomes | Unclear risk | Not described |
| Blinding of outcome assessment (detection bias) All outcomes | Unclear risk | Not described |
| Incomplete outcome data (attrition bias) All outcomes | Unclear risk | The number of participants with incomplete data was not reported. |
| Selective reporting (reporting bias) | Unclear risk | No protocol could be obtained, and the trial did not report all‐cause mortality or serious adverse events. |
| For‐profit bias | Unclear risk | It was unclear how the trial was funded. |
| Other bias | Low risk | The trial appeared to be free of other components that could put it at risk of bias. |
Simon 1988.
| Methods | Randomised clinical trial, USA | |
| Participants | 34 hospitalised adults with moderate or severe alcoholic hepatitis (chronic ethanol ingestion > 80 g/day for at least 2 years and right lobe hepatomegaly), at nutritional risk according to the trialist Male:Female = 7:15(gender not reported for 12 participants) Mean age = 41.5 years (only for the severe malnourished) Exclusion criteria: acute pancreatitis, insulin‐dependent diabetes mellitus, positive HBsAg, malignancy, hypotension, congestive heart failure, sepsis, severe COPD, and recent severe trauma, surgery, mild disease or rapidly became moribund |
|
| Interventions | Experimental group: 28 days of peripheral parenteral nutrition (2 litres a day). Each litre consisted of 35 g Aminosyn, 50 g dextrose, 500 ml of 10% Intralipid a day for a total of 1070 intravenous calories a day.(n = 16)
Control group: no intervention(n = 18) Co‐interventions: diet consisting of 2400 calories and 100 g protein + can of Ensure |
|
| Outcomes | Biochemistry, grade of encephalopathy, mortality, ascites, function tests | |
| Study dates | Not stated | |
| Notes | We contacted the authors on 19th August 2015 by email: jgalamb@emory.edu. We received no reply. | |
| Risk of bias | ||
| Bias | Authors' judgement | Support for judgement |
| Random sequence generation (selection bias) | Unclear risk | Not described |
| Allocation concealment (selection bias) | Unclear risk | The trial used sealed envelopes, but they were not described as being opaque. |
| Blinding of participants and personnel (performance bias) All outcomes | High risk | The trial was described as "lack of blinding". |
| Blinding of outcome assessment (detection bias) All outcomes | High risk | The trial was described as "lack of blinding". |
| Incomplete outcome data (attrition bias) All outcomes | Unclear risk | The number of participants with incomplete data was not reported. |
| Selective reporting (reporting bias) | Unclear risk | No protocol could be obtained, and the trial did not report on serious adverse events. |
| For‐profit bias | Unclear risk | It was unclear how the trial was funded. |
| Other bias | Low risk | The trial appeared to be free of other components that could put it at risk of bias. |
Singh 1998.
| Methods | Randomised clinical trial, India | |
| Participants | 43 hospitalised adults with nontraumatic intestinal perforation and peritonitis, at nutritional risk due to major abdominal surgery Male:Female = not described Mean age = 39.9 years Exclusion criteria: renal, cardiac, or hepatic failure at the time of admission, surgery preformed elsewhere and subsequently referred to this hospital |
|
| Interventions | Experimental group: Given a feeding jejunostomy in which they received enteral nutritional support by the following process: 12 – 24 hrs postoperatively: normal saline and 5% dextrose solution in a 1:3 ratio at 100 mL/hr; 24 – 48 hours postoperatively: 1.0 L of half‐strength feed at 50 mL/hr; 48 – 72 hrs postoperatively: 2.0 L of half‐strength feed at 100 mL/hr; and 72 hours onward: at least 2.0 L of full‐strength feed every 24 hrs Enteral nutrition consisted of a low‐residue, easily absorbable, milk‐based, blenderised diet which was made in the Dietetics Department at the hospital. Proprietary vitamin supplements were added. The intervention lasted 6.5 days on average.(n = 21) Control group: Received intravenous fluids and electrolyte supplements as needed(n = 22) |
|
| Outcomes | Mortality, complications, nitrogen balance and caloric intake | |
| Study dates | Not stated | |
| Notes | e contacted the authors on 16th September 2015 by email: gurpreet@ksu.edu. We received no reply. | |
| Risk of bias | ||
| Bias | Authors' judgement | Support for judgement |
| Random sequence generation (selection bias) | Unclear risk | Not described |
| Allocation concealment (selection bias) | Unclear risk | Not described |
| Blinding of participants and personnel (performance bias) All outcomes | High risk | Not blinded. The experimental group received a jejunostomy whereas the control group did not. |
| Blinding of outcome assessment (detection bias) All outcomes | Unclear risk | Not described |
| Incomplete outcome data (attrition bias) All outcomes | Low risk | There were no incomplete data for any participants. |
| Selective reporting (reporting bias) | Low risk | We found no protocol. The trial reported all‐cause mortality and complications. |
| For‐profit bias | Unclear risk | It was unclear how the trial was funded. |
| Other bias | Low risk | The trial appeared to be free of other components that could put it at risk of bias. |
Smedley 2004a.
| Methods | Randomised clinical trial, UK, factorial design. | |
| Participants | 179 hospitalised adults undergoing elective moderate to major lower gastrointestinal tract surgery, at nutritional risk due to major surgery Male:Female = 100:79 Mean age = 60 years Exclusion criteria: Age under 18, pregnancy, overt dementia, emergency or laparoscopic surgery, receipt of other forms of preoperative nutritional support, and inability to take ONS for at least 7 days before operation |
|
| Interventions | Experimental group 1: post‐operative supplements (drink containing 1.5 kcal and 0.05 g protein per ml. Participants were encouraged to drink this as wanted in small, frequent quantities between meals).(n = 42) Control group 1: No intervention (n = 48) Co‐interventions 1: pre‐operative supplements (drink containing 1.5 kcal and 0.05 g protein per ml. Participants were encouraged to drink this ad libitumas wanted in small, frequent quantities between meals). Standard diet. Experimental group 2: post‐operative supplements (drink containing 1.5 kcal and 0.05 g protein per ml. Participants were encouraged to drink this as wanted in small, frequent quantities between meals). (n = 39) Control group 2: No intervention (n = 50) Co‐interventions 2: standard diet |
|
| Outcomes | Postoperative change in body weight, clinical complications, length of hospital stay, nutritional status, quality of life, cost of care, anthropometrics | |
| Study dates | Between October 1998 and March 2001 | |
| Notes | Same trial as Smedley 2004b with results from experimental group 1 vs control 1. We contacted the authors on 19th August 2015 by email: tim.bowling@mail.qmcuh‐tr.trent.nhs.uk. We received no reply. | |
| Risk of bias | ||
| Bias | Authors' judgement | Support for judgement |
| Random sequence generation (selection bias) | Unclear risk | Not described |
| Allocation concealment (selection bias) | Unclear risk | The trial used sealed envelopes, but they were not described as being opaque. |
| Blinding of participants and personnel (performance bias) All outcomes | High risk | Not blinded. Only the experimental group received a supplement. |
| Blinding of outcome assessment (detection bias) All outcomes | Unclear risk | Not described |
| Incomplete outcome data (attrition bias) All outcomes | High risk | There were more than 5% dropouts, and the trial did not use proper intention‐to‐treat methodology. |
| Selective reporting (reporting bias) | Unclear risk | No protocol could be obtained, and the trial did not report on all‐cause mortality. |
| For‐profit bias | High risk | The trial was funded by a nutrition company (Numico Research). |
| Other bias | Low risk | The trial appeared to be free of other components that could put it at risk of bias. |
Smedley 2004b.
| Methods | Randomised clinical trial, UK | |
| Participants | 179 hospitalised adults undergoing elective moderate to major lower gastrointestinal tract surgery, at nutritional risk due to major surgery Male:Female = 100:79 Mean age = 60 years Exclusion criteria: Age under 18, pregnancy, overt dementia, emergency or laparoscopic surgery, receipt of other forms of preoperative nutritional support, and inability to take ONS for at least 7 days before operation |
|
| Interventions | Experimental group 1: post‐operative supplements (drink containing 1.5 kcal and 0.05 g protein per ml. Participants were encouraged to drink this as wanted in small, frequent quantities between meals).(n = 42) Control group 1: No intervention (n = 48) Co‐interventions 1: pre‐operative supplements (drink containing 1.5 kcal and 0.05 g protein per ml. Participants were encouraged to drink this ad libitumas wanted in small, frequent quantities between meals). Standard diet. Experimental group 2: post‐operative supplements (drink containing 1.5 kcal and 0.05 g protein per ml. Participants were encouraged to drink this as wanted in small, frequent quantities between meals). (n = 39) Control group 2: No intervention (n = 50) Co‐interventions 2: standard diet |
|
| Outcomes | Postoperative change in body weight, clinical complications, length of hospital stay, nutritional status, quality of life, cost of care, anthropometrics | |
| Study dates | Between October 1998 and March 2001 | |
| Notes | Same trial as Smedley 2004a with results from experimental group 2 vs control 2. We contacted the authors on 19th August 2015 by email: tim.bowling@mail.qmcuh‐tr.trent.nhs.uk. We received no reply. | |
| Risk of bias | ||
| Bias | Authors' judgement | Support for judgement |
| Random sequence generation (selection bias) | Unclear risk | Not described |
| Allocation concealment (selection bias) | Unclear risk | The trial used sealed envelopes, but they were not described as being opaque. |
| Blinding of participants and personnel (performance bias) All outcomes | High risk | Only the experimental group received a supplement. |
| Blinding of outcome assessment (detection bias) All outcomes | Unclear risk | Not described |
| Incomplete outcome data (attrition bias) All outcomes | High risk | There were more than 5% dropouts, and the trial did not use proper intention‐to‐treat methodology. |
| Selective reporting (reporting bias) | Unclear risk | No protocol could be obtained, and the trial did not report on all‐cause mortality. |
| For‐profit bias | High risk | The trial was funded by a nutrition company (Numico Research). |
| Other bias | Low risk | The trial appeared to be free of other components that could put it at risk of bias. |
Smith 1985.
| Methods | Randomised clinical trial, Australia | |
| Participants | 50 hospitalised adults with gastro‐intestinal tract malignancy scheduled for surgical treatment, at nutritional risk due to undergoing major surgery Male:Female = 34:16 Mean age = 65 years Exclusion criteria: emergency cases, people with peritonitis or bowel obstruction |
|
| Interventions | Experimental group: enteral nutrition (Isocal) containing 34 g protein, 44 g fat and 133 g glucose a litre (n = 25)
Control group: no intervention(n = 25) Co‐intervention: intravenous isotonic fluids and standard hospital diet |
|
| Outcomes | Mortality, complications, length of hospital stay | |
| Study dates | January 1981 to June 1983 | |
| Notes | We could obtain no contact information for the authors. | |
| Risk of bias | ||
| Bias | Authors' judgement | Support for judgement |
| Random sequence generation (selection bias) | Unclear risk | Randomly‐ordered cards |
| Allocation concealment (selection bias) | Unclear risk | Sealed envelopes but it was unclear if they were opaque. |
| Blinding of participants and personnel (performance bias) All outcomes | Unclear risk | Not described |
| Blinding of outcome assessment (detection bias) All outcomes | Unclear risk | Not described |
| Incomplete outcome data (attrition bias) All outcomes | Unclear risk | It was unclear how many participants had incomplete outcome data. |
| Selective reporting (reporting bias) | Low risk | The trial reported mortality and complications. |
| For‐profit bias | Unclear risk | It was unclear how the trial was funded. |
| Other bias | Low risk | The trial appeared to be free of other components that could put it at risk of bias. |
Smith 1988.
| Methods | Randomised clinical trial, USA | |
| Participants | 34 hospitalised adults with major upper gastro‐intestinal surgery, at nutritional risk due to major surgery Male:Female = 27:7 Mean age = 67.5 years |
|
| Interventions | Experimental group: preoperative intravenous nutrition 10 days before surgery. Infusing 50 ‐ 60 kcal/kg/day of glucose/amino acid IVN mixture, containing 150 kcal/l g of nitrogen(n = 17) Control group: prepared for surgery in the usual manner and did not receive any preoperative nutritional support but were scheduled for the next convenient operating list(n = 17) | |
| Outcomes | Mortality, major complications, serum transferrin, length of hospital stay | |
| Study dates | Not stated | |
| Notes | We contacted the authors in December 2015 by email: rsmith@med.usyd.edu.au. We received information regarding blinding and nutritional intake in the study group. | |
| Risk of bias | ||
| Bias | Authors' judgement | Support for judgement |
| Random sequence generation (selection bias) | Low risk | Randomly‐ordered cards |
| Allocation concealment (selection bias) | Unclear risk | Sealed envelopes were used, but they were not described as opaque. |
| Blinding of participants and personnel (performance bias) All outcomes | High risk | Blinding was not performed. |
| Blinding of outcome assessment (detection bias) All outcomes | High risk | Blinding was not performed. |
| Incomplete outcome data (attrition bias) All outcomes | Low risk | There were no dropouts. |
| Selective reporting (reporting bias) | Low risk | The trial reported all‐cause‐mortality and serious adverse events. |
| For‐profit bias | Unclear risk | It was unclear how the trial was funded. |
| Other bias | Low risk | The trial appeared to be free of other components that could put it at risk of bias. |
Sokulmez 2014.
| Methods | Randomised clinical trial, Turkey | |
| Participants | 38 hospitalised adults with inflammatory bowel disease, at nutritional risk according to the trialist Male:Female = 28:10 Mean age = 37.1 years Exclusion criteria: none reported |
|
| Interventions | Experimental group: Received a standard enteral product added into the hospital diet(n = 15) Control group: No intervention(n = 23) Co‐interventions: All received a normal hospital diet |
|
| Outcomes | Hospitalisation period, subjective global assessment (SGA), BMI, bowel movements, change of nutritional state, general status, disease severity, changes of clinical findings, and consumption's of nutrients, fibre and water soluble‐fibre | |
| Study dates | Not stated | |
| Notes | We could not use this publication since it only presents results as per protocol. We contacted the authors on 30th June 2015 by email: sokulmezpinar@gmail.com and again in September by email: pinar.sokulmez@omu.edu.tr. We received no reply. | |
| Risk of bias | ||
| Bias | Authors' judgement | Support for judgement |
| Random sequence generation (selection bias) | Unclear risk | Not described |
| Allocation concealment (selection bias) | Unclear risk | Not described |
| Blinding of participants and personnel (performance bias) All outcomes | Unclear risk | Not described |
| Blinding of outcome assessment (detection bias) All outcomes | Unclear risk | Not described |
| Incomplete outcome data (attrition bias) All outcomes | Low risk | There were complete data for all participants. |
| Selective reporting (reporting bias) | Unclear risk | No protocol could be obtained, and the trial did not report all‐cause mortality or serious adverse events. |
| For‐profit bias | Unclear risk | It was unclear how the trial was funded. |
| Other bias | Low risk | The trial appeared to be free of other components that could put it at risk of bias. |
Song 1993.
| Methods | Randomised clinical trial, China | |
| Participants | 25 hospitalised adults with COPD and infection, PaO2 < 8 kPa, or PaCO2 > 6.7 kPa, at nutritional risk due to trialist characterising them as malnourished. Male:Female = 23:2 Mean age = 60.3 years Exclusion criteria: diabetes, hyperthyroidism or other endocrine and metabolic diseases |
|
| Interventions | Experimental group: Received parenteral nutrition in the form of amino acids injection (5% Nutrisol‐S) 500 ml (Green Cross, Japan) and lipid emulsion (Intralipid: (1000 ml Intralipid contains rectification soybean oil 100 g, glycerinum 22.5 g rectification lecithin 12 g, PH 8.0, 4602.4 kJ/kg)) 500 ml (Sino‐Swed Pharmaceutical Corp. Ltd. China) for intravenous drip, once daily, for 10 to 20 days (10 of the participants were over 15 days). (n = 23) Control group: standard diet(n = 23) Co‐intervention: persistent low‐flow oxygen inspiration and anti‐infection, anti‐asthmatic and antitussive and standard diet |
|
| Outcomes | All‐cause mortality, NEFA, ABG, serum amino acid | |
| Study dates | Not stated | |
| Notes | We tried and failed to contact the authors by phone. | |
| Risk of bias | ||
| Bias | Authors' judgement | Support for judgement |
| Random sequence generation (selection bias) | Unclear risk | Not described |
| Allocation concealment (selection bias) | Unclear risk | Not described |
| Blinding of participants and personnel (performance bias) All outcomes | High risk | Participants and personnel were not blinded. |
| Blinding of outcome assessment (detection bias) All outcomes | Unclear risk | Not described |
| Incomplete outcome data (attrition bias) All outcomes | Unclear risk | The number of participants with incomplete data was not reported. |
| Selective reporting (reporting bias) | Low risk | No protocol could be obtained but all‐cause mortality was reported. |
| For‐profit bias | Unclear risk | It was unclear how the trial was funded. |
| Other bias | Low risk | The trial appeared to be free of other components that could put it at risk of bias. |
Sonnenfeld 1978.
| Methods | Randomised clinical trial, France | |
| Participants | 26 hospitalised adults undergoing gastro‐intestinal surgery, at nutritional risk due to major surgery Male:Female = 17:9 Mean age = 46.5 years Exclusion criteria: Not reported |
|
| Interventions | Experimental group: parenteral nutrition 12.4 g Nitrogen (1200 kcal) and 1200 kcal of glucose for 2 days(n = 11) Control group: no intervention (n = 15) Co‐interventions: parenteral nutrition from day 2, 12.4 g Nitrogen (1200 kcal) and 1200 kcal of glucose, given until they tolerate oral intake | |
| Outcomes | Nitrogen balance, complications, mortality | |
| Study dates | Not stated | |
| Notes | We could find no contact information for the authors. | |
| Risk of bias | ||
| Bias | Authors' judgement | Support for judgement |
| Random sequence generation (selection bias) | Unclear risk | Not described |
| Allocation concealment (selection bias) | Unclear risk | Not described |
| Blinding of participants and personnel (performance bias) All outcomes | Unclear risk | Not described |
| Blinding of outcome assessment (detection bias) All outcomes | Unclear risk | Not described |
| Incomplete outcome data (attrition bias) All outcomes | Low risk | There were no dropouts. |
| Selective reporting (reporting bias) | Low risk | The trial reported mortality and serious adverse events. |
| For‐profit bias | Unclear risk | It was unclear how the trial was funded. |
| Other bias | Low risk | The trial appeared to be free of other components that could put it at risk of bias. |
Soop 2004.
| Methods | Randomised clinical trial, Sweden/UK | |
| Participants | 20 hospitalised adults undergoing elective major colorectal surgery, at nutritional risk due to major surgery Male:Female = 12:6 (gender not reported for two participants) Mean age = 62 years Exclusion criteria: age below 18 years or above 80 years; BMI below 18 or above 30 kg/m2 |
|
| Interventions | Experimental group: Immediate postoperative enteral nutrition with an energy‐dense residue‐free solution (1·5 kcal/ml Nutrison Energy, Nutricia)(n = 10) Control group: Immediate postoperative enteral nutrition with a hypocaloric solution with an indistinguishable appearance (0·2 kcal/ml Nutricia)(n = 10) | |
| Outcomes | Urinary nitrogen losses, insulin resistance, blood glucose, complication and hospital stay | |
| Study dates | Not stated | |
| Notes | We contacted the authors in December 2015 by email: mattias.soop@mac.com. We received an initial reply but no further information was supplied. | |
| Risk of bias | ||
| Bias | Authors' judgement | Support for judgement |
| Random sequence generation (selection bias) | Unclear risk | Not described |
| Allocation concealment (selection bias) | Unclear risk | Not described |
| Blinding of participants and personnel (performance bias) All outcomes | Low risk | The control group received a solution with an indistinguishable appearance. |
| Blinding of outcome assessment (detection bias) All outcomes | Unclear risk | Not described |
| Incomplete outcome data (attrition bias) All outcomes | Low risk | There were no dropouts. |
| Selective reporting (reporting bias) | Unclear risk | No protocol could be obtained and the trial did not report all‐cause mortality or serious adverse events. |
| For‐profit bias | High risk | Financial support from Numico Research. |
| Other bias | Low risk | The trial appeared to be free of other components that could put it at risk of bias. |
Stableforth 1986.
| Methods | Randomised clinical trial, UK | |
| Participants | 61 hospitalised adults with femoral neck fracture, at nutritional risk due to major surgery Male:Female = 0:61 Mean age = 81 Exclusion criteria: Not stated |
|
| Interventions | Experimental group: Oral nutrition. Participants were encouraged to drink a liquid flavoured milk‐based nutrient supplement through their waking hours. 1 300‐ml package of the supplement contained 18.5 g protein, 11 g fat, and 40 g carbohydrate with vitamins and minerals, and provided 320 kcal per feed. Intervention period was for 10 days.
Control group: No intervention Co‐interventions: All participants received normal ward meals and drinks. |
|
| Outcomes | Weight, food consumption, protein and calorie intake, fluid balance, bowel action, daily nitrogen production, excreted and retained, calorie expenditure (physical activity), plasma urea concentration, urine creatinine and nitrogen | |
| Study dates | Not stated | |
| Notes | We could obtain no contact information for the authors. | |
| Risk of bias | ||
| Bias | Authors' judgement | Support for judgement |
| Random sequence generation (selection bias) | Unclear risk | Not described |
| Allocation concealment (selection bias) | Unclear risk | Not described |
| Blinding of participants and personnel (performance bias) All outcomes | Unclear risk | Not described |
| Blinding of outcome assessment (detection bias) All outcomes | Unclear risk | Not described. |
| Incomplete outcome data (attrition bias) All outcomes | Unclear risk | There was insufficient information to assess whether missing data were likely to induce bias in the results. |
| Selective reporting (reporting bias) | Unclear risk | The trial reported all‐cause mortality and serious adverse events. No protocol could be obtained. |
| For‐profit bias | Low risk | The trial was funded by a grant from the South West Regional Hospital Board. |
| Other bias | Low risk | The trial appeared to be free of other components that could put it at risk of bias |
Starke 2011.
| Methods | Randomised clinical trial, Switzerland | |
| Participants | 134 hospitalised adults at nutritional risk according to NRS‐2002 Male:female = not reported Mean age: 72.5 years |
|
| Interventions | Experimental group: Individual nutritional care, including a detailed nutritional assessment, individual food supply, fortification of meals with maltodextrin, rapeseed oil, cream or protein powder or both, in between snacks and oral nutritional supplements (n = 67) Control group: Standard nutritional care, including the prescription of ONSs and nutritional therapy prescribed by the physician independently of this study and according to the routine ward management (n = 67) |
|
| Outcomes | Average daily intake, protein intake, changes in body weight, complications, antibiotic therapies, length of hospital stay, quality of life, mortality, compliance, plasma‐concentrations | |
| Study dates | Not stated | |
| Notes | We contacted the authors on 17th December 2015 by email: remy.meier@ksli.ch. We received no reply. | |
| Risk of bias | ||
| Bias | Authors' judgement | Support for judgement |
| Random sequence generation (selection bias) | Low risk | The trial was randomised using a computer‐generated randomisation. |
| Allocation concealment (selection bias) | Unclear risk | Not described |
| Blinding of participants and personnel (performance bias) All outcomes | Unclear risk | Not described |
| Blinding of outcome assessment (detection bias) All outcomes | Unclear risk | Not described |
| Incomplete outcome data (attrition bias) All outcomes | Unclear risk | The number of participants with incomplete data was not reported. |
| Selective reporting (reporting bias) | Low risk | Both all‐cause‐mortality and serious adverse events were reported. |
| For‐profit bias | High risk | The trial was funded by Nestlé. |
| Other bias | Low risk | The trial appeared to be free of other components that could put it at risk of bias. |
Stein 2002.
| Methods | Randomised clinical trial, Germany | |
| Participants | 80 hospitalised adults admitted to intensive or intermediate care with percutaneous endoscopic gastrostomy, at nutritional risk due to being ICU patients Male:Female = 33:47 Mean age = 68 years Exclusion criteria: chronically ill admitted only for PEG placement, outpatients, not eligible for ICU or intermediate care, undergoing Billroth operation, and a PEG placed for relief of gastric outlet obstruction, and ascites |
|
| Interventions | Experimental group: received enteral feeding within 1 hr, with feeding that was provided through a tube by a continuous feeding pump and consisted of a polymeric iso‐osmolar formula 1 kcal/ml(n = 40) Control group: no intervention for the first 24 hrs (n = 40) Co‐interventions: All participants were tube‐fed 24 hrs after PEG placement. Both groups received feedings at a rate of 30 ml/hr for 20 hrs on day 1, 70 on day 2, and 100 on day 3 after initiation of feeding. Thereafter the volume was adjusted to the individual nutritional requirements as recommended by the nutrition team. |
|
| Outcomes | Gastric residual volume, frequency of complications (stomatitis, vomiting, bleeding, leakage, diarrhoea, aspiration, and pneumoperitoneum), vital signs, abdominal distension, presence of bowel sounds, abdominal tenderness, and mortality | |
| Study dates | Not stated | |
| Notes | Note that all participants were tube‐fed after 24 hrs, and therefore the co‐intervention lasts longer than the intervention period alone. Results for maximum follow‐up are after 30 days. We contacted the author on 1st October 2015 by email: j.stein@em.uni‐frankfurt.de. We received no reply. | |
| Risk of bias | ||
| Bias | Authors' judgement | Support for judgement |
| Random sequence generation (selection bias) | Unclear risk | Not described |
| Allocation concealment (selection bias) | Unclear risk | Not described |
| Blinding of participants and personnel (performance bias) All outcomes | High risk | Blinding was not performed. |
| Blinding of outcome assessment (detection bias) All outcomes | High risk | Blinding was not performed. |
| Incomplete outcome data (attrition bias) All outcomes | Low risk | There were complete outcome data for all participants. |
| Selective reporting (reporting bias) | Unclear risk | The trial reported all‐cause mortality but not serious adverse events. No protocol could be obtained. |
| For‐profit bias | Unclear risk | It was unclear how the trial was funded. |
| Other bias | Low risk | The trial appeared to be free of other components that could put it at risk of bias. |
Stokes 1994.
| Methods | Randomised clinical trial, Ireland | |
| Participants | 20 hospitalised adults admitted for abdominal aortic aneurysm repair, at nutritional risk due to major surgery Male:Female = not stated Mean age = not stated Exclusion criteria: none stated |
|
| Interventions | Experimental group: peripheral parenteral nutrition from the second postoperative day and for 6 days(n = 10) Control group: routine postoperative fluids and diet (n = 10) | |
| Outcomes | Respiratory and skeletal muscle function, wound healing, postoperative stay and complications | |
| Study dates | Not stated | |
| Notes | We found no contact information for the author. | |
| Risk of bias | ||
| Bias | Authors' judgement | Support for judgement |
| Random sequence generation (selection bias) | Unclear risk | Not described |
| Allocation concealment (selection bias) | Unclear risk | Not described |
| Blinding of participants and personnel (performance bias) All outcomes | Unclear risk | Not described |
| Blinding of outcome assessment (detection bias) All outcomes | Unclear risk | Not described |
| Incomplete outcome data (attrition bias) All outcomes | Unclear risk | The number of participants with incomplete data was not reported. |
| Selective reporting (reporting bias) | Unclear risk | No protocol could be obtained, and all‐cause mortality was not reported. |
| For‐profit bias | Unclear risk | It was unclear how the trial was funded. |
| Other bias | Low risk | The trial appeared to be free of other components that could put it at risk of bias. |
Sullivan 1998.
| Methods | Randomised clinical trial, USA | |
| Participants | 18 hospitalised adults > 64 years of age, and with an acute femoral neck or intertrochanteric fracture which required surgical intervention, at nutritional risk due to being frail elderly. Male:Female = 17:1 Mean age = 75.5 years Exclusion criteria: incapable of giving informed consent and did not have a legal guardian; pathological fracture (due to cancer or other non‐osteoporotic pathologies) or significant trauma to other organ systems (e.g. multi‐trauma from a motor vehicle accident); metastatic cancer, cirrhosis of the liver, a contraindication to the use of enteral feedings (e.g. severe short‐bowel syndrome), or organ failure which rendered the proposed intervention inappropriate |
|
| Interventions | Experimental group: 1375 cc of polymeric enteral formula (Promotet, Ross Laboratories, 85.8 g protein, 4314 non‐nitrogenous kJ (1031 kcal)) over an 11‐hr period (125 cc/hr by enteral feeding pump) beginning at 7 p.m. each night for at least 3 consecutive days or until discharged from the hospital(n = 8) Control group: no intervention (n = 10) Co‐interventions: standard postoperative nutritional care receiving 3 meals a day |
|
| Outcomes | Complications, life‐threatening complications, discharge data, mortality, MMSE, ADL‐score, albumin, transferrin, cholesterol, length of hospital stay | |
| Study dates | Not stated | |
| Notes | Notes taken from Avanell 2010. We contacted the authors on 8th February 2016 by email: sullivandennish@uams.edu. We received no reply. | |
| Risk of bias | ||
| Bias | Authors' judgement | Support for judgement |
| Random sequence generation (selection bias) | Unclear risk | The trial was described as being randomised, but it was unclear how the sequence was generated. |
| Allocation concealment (selection bias) | Low risk | "The randomization process was prepared by the biostatistician, using a series of sealed envelopes. Security (lined) envelopes were used to assure that the assignment could not be read without opening the envelope. After consent had been obtained and the baseline assessment was completed, the next envelope in order was opened to reveal the group assignment. Each envelope contained a card. The card had the assignment for treatment or control pre‐printed. Space was provided to enter the patient name and ID as well as the date, time and person responsible for randomization. The study nurse completed the card, photocopied it, and returned the original to the biostatistician as a check that the randomization process was progressing appropriately. Subjects were randomized to either treatment or control within blocks to assure that there were roughly equal numbers of subjects in each group at the end of the study. The block sizes were randomly varied to minimize the ability to deduce the assignment for a particular patient before opening the envelope" Quote taken from (Avenell 2016). |
| Blinding of participants and personnel (performance bias) All outcomes | High risk | The trial was described as non‐blinded: "this non‐blinded randomized controlled trial". |
| Blinding of outcome assessment (detection bias) All outcomes | High risk | The trial was described as non‐blinded: "this non‐blinded randomized controlled trial". |
| Incomplete outcome data (attrition bias) All outcomes | High risk | There were more than 5% dropouts, and the trial did not use proper methodology to deal with missing data. |
| Selective reporting (reporting bias) | Low risk | The trial reported mortality and serious adverse events. |
| For‐profit bias | High risk | The trial was funded by Ross Laboratories. |
| Other bias | Low risk | The trial appeared to be free of other components that could put it at risk of bias. |
Sullivan 2004.
| Methods | Randomised clinical trial, USA | |
| Participants | 57 hospitalised adults older than 64 who underwent surgical repair of an acute hip fracutre, at nutritonal risk due to being frail elderly Male:Female = 39:18 Mean age = 78.8 years Exclusion criteria: incapable of giving informed consent and did not have a legal guardian; pathological fracture (due to cancer or other non‐osteoporotic pathologies), trauma to other organ systems (e.g. multi‐trauma from a motor vehicle accident); metastatic cancer, cirrhosis of the liver, a contraindication to the use of enteral feedings (e.g. severe short‐bowel syndrome), or organ failure which rendered the proposed intervention inappropriate |
|
| Interventions | Experimental group: The participants' ‘nutrient deficit’ for the day (‘target intake’ minus ‘volitional intake’) was calculated each evening. Nightly enteral feedings were initiated with a nutritionally complete, lactose‐free, polymeric enteral formula (Pro‐mote®, Ross Laboratories) that contained 1000 Kcal (4187kJ), 62.5 g protein (25% of calories), 26 g fat (23% of calories), and 130 grams carbohydrates (52% of calories) per litre. On the 1st night after the feeding tube was placed, the participant was provided enteral feedings at a rate of 50 cc/hr over an 11‐hr period beginning at 7 p.m. (i.e. a total of 550 cc of enteral formula, 34.5 g protein). If the participant tolerated the tube‐feedings, the rate was increased by 25 cc/hr each night to either: (a) a maximum of 125 cc/hr over an 11‐hr period beginning at 7 p.m.; or (b) the ‘nutrient deficit’ was reached. For example, if the participants' ‘target intake’ was calculated to be 2100 Kcal and his ‘volitional intake’ was 1400 Kcal, the enteral feeding rate that night was set to 64 cc/hr for a total of 700 cc over 11 hrs, which equalled his ‘nutrient deficit’. (n = 27) Control group: No intervention (n = 30) Co‐interventions: standard postoperative care |
|
| Outcomes | Complications, life‐threatening complications, discharge data, mortality, length of stay, MMSE, ADL, albumin, pre‐albumin, cholesterol | |
| Study dates | Not stated | |
| Notes | Notes taken from Avanell 2010. We contacted the authors on 8th February 2016 by email: sullivandennish@uams.edu. We received no reply. | |
| Risk of bias | ||
| Bias | Authors' judgement | Support for judgement |
| Random sequence generation (selection bias) | Unclear risk | The trial was described as being randomised, but it was unclear how the sequence was generated. |
| Allocation concealment (selection bias) | Low risk | "The randomisation process was prepared by the biostatistician, using a series of sealed envelopes. Security (lined) envelopes were used to assure that the assignment could not be read without opening the envelope. After consent had been obtained and the baseline assessment was completed, the next envelope in order was opened to reveal the group assignment. Each envelope contained a card. The card had the assignment for treatment or control pre‐printed. Space was provided to enter the patient name and ID as well as the date, time and person responsible for randomization. The study nurse completed the card, photocopied it, and returned the original to the biostatistician as a check that the randomization process was progressing appropriately. Subjects were randomized to either treatment or control within blocks to assure that there were roughly equal numbers of subjects in each group at the end of the study. The block sizes were randomly varied to minimize the ability to deduce the assignment for a particular patient before opening the envelope" Quote taken from (Avenell 2016). |
| Blinding of participants and personnel (performance bias) All outcomes | Unclear risk | Not described |
| Blinding of outcome assessment (detection bias) All outcomes | Unclear risk | Not described |
| Incomplete outcome data (attrition bias) All outcomes | Low risk | There were no dropouts. |
| Selective reporting (reporting bias) | Low risk | The trial reported mortality and serious adverse events. |
| For‐profit bias | High risk | The trial was funded by Ross Laboratories: "We also wish to express our appreciation to Ross Laboratories for supplying the nutritional supplements and the nasogastric feeding tubes". |
| Other bias | Low risk | The trial appeared to be free of other components that could put it at risk of bias. |
Summerbell 1993.
| Methods | Randomised clinical trial, UK | |
| Participants | 20 hospitalised adults, at nutritional risk due to low levels of albumin Male:Female = 4:16 Mean age = 87.5 years Exclusion criteria: none stated |
|
| Interventions | Experimental group: oral supplement (1365 kJ) twice daily (n = 10) Control group: no intervention (n = 10) Co‐intervention: normal hospital provision | |
| Outcomes | Esterase activity, weight, middle‐arm circumference, triceps skinfold thickness | |
| Study dates | Not stated | |
| Notes | We contacted the authors on 13th December 2015 by email: f.m.williams@ncl.ac.uk. We received no reply. | |
| Risk of bias | ||
| Bias | Authors' judgement | Support for judgement |
| Random sequence generation (selection bias) | Unclear risk | Not described |
| Allocation concealment (selection bias) | Unclear risk | Not described |
| Blinding of participants and personnel (performance bias) All outcomes | Unclear risk | Not described |
| Blinding of outcome assessment (detection bias) All outcomes | Unclear risk | Not described |
| Incomplete outcome data (attrition bias) All outcomes | High risk | The dropouts exceeded 5% and the trial did not allow proper intention‐to‐treat methodology. |
| Selective reporting (reporting bias) | Unclear risk | No protocol could be obtained, and the trial did not report all‐cause mortality or serious adverse events. |
| For‐profit bias | Unclear risk | It was unclear how the trial was funded. |
| Other bias | Low risk | The trial appeared to be free of other components that could put it at risk of bias. |
Sustic 2006.
| Methods | Randomised clinical trial, Croatia | |
| Participants | 40 hospitalised adults undergoing CABG surgery, at nutritional risk due to being ICU patients Male:Female = 30:10 Mean age = 58 years Exclusion criteria: anamnestic data about diseases of gastroduodenal part of digestive tract or endoscopic findings confirming gastric or duodenal ulceration in last 5 years; loss of weight of > 10% in last 3 months or extreme obesity (BMI > 35), diabetes mellitus, preoperative elevated biochemical parameters of hepatic (ASAT, ALAP, gamma GT and bilirubin) or renal function (urea, creatinine), preoperative intake of drugs which could influence gastric motility (cisapride, metoclopramide, erythromycin, dopamine in doses > 2 μg/kg/min) or the paracetamol absorption test (e.g. NSAID). Serious concomitant valvular disease, recent myocardial infarction (< 3 weeks), preoperative ejection fraction < 35% and intraoperative use of intra‐aortic balloon pump due to the possible influence of haemodynamic instability on gastric motility |
|
| Interventions | Experimental group: Enteral feeding. The participants started with iso‐osmolar enteral feeding through the nasogastric tube 18 hrs after CABG surgery according to the following protocol: the first 3 hrs 30 ml/hr, next 3 hrs 50 ml/hr, i.e. with a total of 240 ml after 6 hrs. After 6 hrs of feeding (i.e. 24 hrs after surgery) the gastric supply was stopped. (n = 20) Control group: Placebo. Participants received only crystalloid solutions for first 24 hrs. (n = 20) |
|
| Outcomes | Plasma paracetamol concentration, gastric motility, venous blood samples and emptying | |
| Study dates | Not stated | |
| Notes | We contacted the authors on 1st October 2015 and received a reply, see below. | |
| Risk of bias | ||
| Bias | Authors' judgement | Support for judgement |
| Random sequence generation (selection bias) | Low risk | According to correspondence with the author software randomisation was used. |
| Allocation concealment (selection bias) | Unclear risk | It was unclear from the author's response, how the allocation sequence was concealed. |
| Blinding of participants and personnel (performance bias) All outcomes | Low risk | According to correspondence with the author participants and personnel were blinded. |
| Blinding of outcome assessment (detection bias) All outcomes | Low risk | According to correspondence with the author outcome assessors were blinded. |
| Incomplete outcome data (attrition bias) All outcomes | Unclear risk | The number of participants with incomplete data was not reported. Correspondence with the author provided no further information. |
| Selective reporting (reporting bias) | Unclear risk | No protocol could be obtained, and the trial did not report all‐cause mortality or serious adverse events. |
| For‐profit bias | Unclear risk | It was unclear how the trial was funded. |
| Other bias | Low risk | The trial appeared to be free of other components that could put it at risk of bias. |
Swails 1995.
| Methods | Randomised clinical trial, USA | |
| Participants | 25 hospitalised adults with cancer of the oesophagus undergoing elective oesophagogastrectomy, at nutritional risk due to major surgery Male:Female = 17:8 Mean age = 61 years Exclusion criteria: Undergoing emergency surgery for oesophagogastrectomy or an oesophagogastrectomy performed by surgeons other than a specific doctor |
|
| Interventions | Experimental group: received feeding jejunostomy tube with immediate postoperative enteral nutrition support. These participants received either a full‐strength elemental or polymeric diet at 10 mL/hr within 24 hrs of operation. The enteral feeding infusion rate was gradually increased by 10 mL/hr every 12 to 24 hrs until nutritional needs were met (estimated 25 ‐ 30 kcal/kg body weight and 1.2 ‐ 1.5 g protein/kg body weight). After contrast radiographic demonstration of an intact anastomosis, they began oral feeding. (n = 13) Control group: Standard care. Participants received a conventional intravenous fluid and electrolyte replacement until postoperative day 4 or 5 when radiographic assessment demonstrated an intact anastomosis. A clear liquid diet was initially provided and was gradually progressed over a period of 1 to 3 days to a regular post‐oesophagogastrectomy diet consisting of 6 small meals daily. (n = 12) |
|
| Outcomes | Length of hospital stay, number of days spent in the ICU, number of days fed enterally or parenterally, postoperative complications including infections, wound healing, anastomotic leak, wound dehiscence, feeding tube‐related complications, caloric intake, gastrointestinal signs and symptoms | |
| Study dates | January 1991 to June 1993 | |
| Notes | We could find no contact information for the authors. | |
| Risk of bias | ||
| Bias | Authors' judgement | Support for judgement |
| Random sequence generation (selection bias) | Unclear risk | Not described |
| Allocation concealment (selection bias) | Unclear risk | Not described |
| Blinding of participants and personnel (performance bias) All outcomes | Unclear risk | Not described |
| Blinding of outcome assessment (detection bias) All outcomes | Unclear risk | Not described |
| Incomplete outcome data (attrition bias) All outcomes | Low risk | There were no dropouts. |
| Selective reporting (reporting bias) | Unclear risk | The trial reported complications, but not all‐cause mortality. No protocol could be obtained. |
| For‐profit bias | Unclear risk | It was unclear how the trial was funded. |
| Other bias | Low risk | The trial appeared to be free of other components that could put it at risk of bias. |
Szeszycki 1998.
| Methods | Randomised clinical trial, USA | |
| Participants | 30 hospitalised adults with lymphoma or Ieukaemia undergoing allogenic or autologous bone marrow transplant, at nutritional risk due to major surgery Male:Female = 17:13 Mean age = approximately 38 years Exclusion criteria: not described |
|
| Interventions | Experimental group: Participants received standard glutamine‐free PN, STD‐PN provided calories at 1.3 BEE, (500 kcal/day as fat emulsion) and protein at 1.5 g/kg/day. PN containing micronutrients alone, without dextrose or amino acids (n = 16) Control group: Participants received PN containing micronutrients alone, without dextrose or amino acids. It provided standard amounts of vitamins, trace elements, electrolytes and 50 kcal/day as fat emulsion (to maintain blinding). Considered to be placebo (n = 14) |
|
| Outcomes | Length of hospital stay, infectious complications, non‐prophylactic antibiotic administration, fever, engraftment, and body weight changes from PN initiation until hospital discharge. Serum chemistries, electrolyte requirements and oral kcal as wanted and protein intake during the period of PN infusion | |
| Study dates | Not stated | |
| Notes | We contacted the authors on 13th December 2015 by email: tzieg01@emory.edu. We received no reply. | |
| Risk of bias | ||
| Bias | Authors' judgement | Support for judgement |
| Random sequence generation (selection bias) | Unclear risk | Not described |
| Allocation concealment (selection bias) | Unclear risk | Not described |
| Blinding of participants and personnel (performance bias) All outcomes | Unclear risk | The trial was described as double‐blinded. Participants were blinded but it is unclear whether personnel were blinded. |
| Blinding of outcome assessment (detection bias) All outcomes | Unclear risk | The trial was described as double‐blinded, but it was unclear if the outcome assessors were blinded. |
| Incomplete outcome data (attrition bias) All outcomes | Unclear risk | They used intention‐to‐treat analysis, but did not describe how they dealt with missing participants. |
| Selective reporting (reporting bias) | Unclear risk | No protocol could be obtained, and the trial did not report all‐cause mortality, but they did report adverse events. |
| For‐profit bias | Unclear risk | It was unclear how the trial was funded. |
| Other bias | Low risk | The trial appeared to be free of other components that could put it at risk of bias. |
Thompson 1981.
| Methods | Randomised clinical trial, USA | |
| Participants | 21 hospitalised adults with gastrointestinal cancer and a weight loss > 10 lb over 3 to 6 months prior to admission for major surgery, at nutritional risk due to major abdominal surgery Male:Female = 21:0 Mean age = 65 years Exclusion criteria: not stated |
|
| Interventions | Experimental group: Parenteral nutrition. Participants received hyperalimentation 8 days preoperatively, 10 days postoperatively. The intervention consisted of intravenous PN, with crystalline amino acids in 25% Dextrose beginning at least 5 days preoperatively and continuing until a regular diet (1500 cal) postoperatively was tolerated. Infusion rates were to provide 40 ‐ 50 kcal/kg/day or approximately 2000 ‐ 4000 cal per day. (n = 12) Control group: standard care (n = 9) |
|
| Outcomes | Major postoperative complications; abscess, anastomotic leak, wound infection, minor complications; urinary tract infection, superficial wound infection, prolonged atelectasis and complications directly related to total parenteral nutrition. Weight, serum albumin and mortality | |
| Study dates | Not stated | |
| Notes | We contacted the authors on 13th November 2015 by email: tjulian@wpahs.org. We received no reply. | |
| Risk of bias | ||
| Bias | Authors' judgement | Support for judgement |
| Random sequence generation (selection bias) | Unclear risk | Not described |
| Allocation concealment (selection bias) | Unclear risk | Not described |
| Blinding of participants and personnel (performance bias) All outcomes | Unclear risk | Not described |
| Blinding of outcome assessment (detection bias) All outcomes | Unclear risk | Not described |
| Incomplete outcome data (attrition bias) All outcomes | Unclear risk | The number of participants with incomplete data was not reported. |
| Selective reporting (reporting bias) | Low risk | The trial reported all‐cause mortality and serious adverse events. No protocol could be found. |
| For‐profit bias | Unclear risk | It was unclear how the trial was funded. |
| Other bias | Low risk | The trial appeared to be free of other components that could put it at risk of bias. |
Tong 2006a.
| Methods | Randomised clinical trial, China | |
| Participants | 126 hospitalised adults with gastrointestinal tumour, at nutritional risk due to major surgery Male:Female = 62:46 Mean age = 68.2 years Exclusion criteria: Body weight over or less than 15% of the participants usual body weight, diabetes and decompensate hyperthyroidism or serious hepatorenal dysfunction (ALT > 60 U/L, TBiL > 25.7 μmol/L, BUN 10.7 mmol/L, Cre > 132.9 μmol/L) and haemorrhagic shock |
|
| Interventions | Experimental group 1: TPN after surgery (50 ml/kg/day, N/Q = 1 g:552 kJ) for intravenous drip (n = 45) Experimental group 2: Enteral nutrient fluids (50 ml/kg/day, N/Q = 1 g : 552 kJ) for infusion after gastrointestinal fistulation, 500 ml (40 ‐ 50 ml/hr) of the fluids after 1st 24 hrs, 1000 ml (80 ‐ 120 ml/hr) after 48 hrs, and 1500 ml (80 ‐ 120 ml/hr) after 72 hrs. Semi‐liquid diet after 6 ‐ 7 days of infusion. (n = 45) Control group: Conventional therapy of fluid infusion, transition diet after recovery of intestinal peristalsis (n = 36) |
|
| Outcomes | Complications, body weight (9 days after treatment) | |
| Study dates | Not stated | |
| Notes | Same as Tong 2006b, but with experimental group 1 vs. control group. We tried but failed to contact the authors on 23rd September 2015 by phone and email: surgerytong@yahoo.com.cn. | |
| Risk of bias | ||
| Bias | Authors' judgement | Support for judgement |
| Random sequence generation (selection bias) | Unclear risk | Not described |
| Allocation concealment (selection bias) | Unclear risk | Not described |
| Blinding of participants and personnel (performance bias) All outcomes | High risk | Participants and personnel were not blinded. |
| Blinding of outcome assessment (detection bias) All outcomes | Unclear risk | Not described |
| Incomplete outcome data (attrition bias) All outcomes | Unclear risk | The number of participants with incomplete data was not reported. |
| Selective reporting (reporting bias) | Unclear risk | No protocol could be obtained and the trial did not report on all‐cause mortality or serious adverse event. |
| For‐profit bias | Unclear risk | It was unclear how the trial was funded. |
| Other bias | Low risk | The trial appeared to be free of other components that could put it at risk of bias. |
Tong 2006b.
| Methods | Randomised clinical trial, China | |
| Participants | 126 hospitalised adults with gastrointestinal tumour, at nutritional risk due to major surgery Male:Female = 62:46 Mean age = 68.2 years Exclusion criteria: Body weight over or less than 15% of the participants usual body weight, diabetes and decompensate hyperthyroidism or serious hepatorenal dysfunction (ALT > 60 U/L, TBiL > 25.7 μmol/L, BUN 10.7 mmol/L, Cre > 132.9 μmol/L) and haemorrhagic shock |
|
| Interventions | Experimental group 1: TPN after surgery (50 ml/kg/day, N/Q = 1 g:552 kJ) for intravenous drip (n = 45) Experimental group 2: Enteral nutrient fluids (50 ml/kg/day, N/Q = 1 g : 552 kJ) for infusion after gastrointestinal fistulation, 500 ml (40 ‐ 50 ml/hr) of the fluids after 1st 24 hrs, 1000 ml (80 ‐ 120 ml/hr) after 48 hrs, and 1500 ml (80 ‐ 120 ml/hr) after 72 hrs. Semi‐liquid diet after 6 ‐ 7 days of infusion. (n = 45) Control group: Conventional therapy of fluid infusion, transition diet after recovery of intestinal peristalsis (n = 36) |
|
| Outcomes | Complications, body weight (9 days after treatment) | |
| Study dates | Not stated | |
| Notes | Same as Tong 2006a, but with experimental group 2 vs. control group | |
| Risk of bias | ||
| Bias | Authors' judgement | Support for judgement |
| Random sequence generation (selection bias) | Unclear risk | Not described |
| Allocation concealment (selection bias) | Unclear risk | Not described |
| Blinding of participants and personnel (performance bias) All outcomes | High risk | Participants and personnel were not blinded |
| Blinding of outcome assessment (detection bias) All outcomes | Unclear risk | Not described |
| Incomplete outcome data (attrition bias) All outcomes | Unclear risk | The number of participants with incomplete data was not reported. |
| Selective reporting (reporting bias) | Unclear risk | No protocol could be obtained and the trial did not report on all‐cause mortality or serious adverse events. |
| For‐profit bias | Unclear risk | It was unclear how the trial was funded. |
| Other bias | Low risk | The trial appeared to be free of other components that could put it at risk of bias |
Vaithiswaran 2008.
| Methods | Randomised clinical trial, India | |
| Participants | 63 hospitalised adults undergoing elective upper gastrointestinal surgery, at nutritional risk due to major abdominal surgery Male:Female = 51:10 (only analysed participants) Mean age = 44 years (only analysed participants) Exclusion criteria: emergency upper gastro‐intestinal surgery, comorbid medical conditions (diabetes mellitus, gross renal or hepatic dysfunction), intolerance to milk‐based foods and unresectable tumours |
|
| Interventions | Experimental group: Early postoperative enteral nutrition through a nasojejunal tube. The diet was milk‐based in a standard feeding protocol with an energy supply of 2296 kcal/day. The diet consisted of: skimmed milk powder 150 g, sugar 50 g, vegetable oil 20 g and whey water to make one litre. 12 hrs after surgery the feeding was started according to the protocol: 12 ‐ 24 hours: normal saline and 5% dextrose; 1:3 ratio at 100 ml/hr 24 ‐ 48 hrs: 1 litre of half‐strength feed at 50 ml/hr 48 ‐ 72 hrs: 2 litres of half‐strength feed at 100 ml/hr 72 hours onwards: 2 litres of full‐strength feed/24 hrs Enteral nutrition was continued until oral feeding was considered tolerable. (n = 32) Control group: Treament as usual with intravenous fluids (n = 31) |
|
| Outcomes | Body weight, serum albumin, serum transferrin, bowel sounds, passage of flatus, diarrhoea, abdominal cramps, abdominal distension, ileus, wound infection, abdominal abscess, respiratory infection, urinary nitrogen, urinary tract infection, septicaemia, wound dehiscence, anastomotic leak, respiratory infection, vomiting and length of hospital stay | |
| Study dates | Not stated | |
| Notes | We contacted the authors on 26th October 2015 by email: Vaithiswaran@gmail.com; vaithiv@hotmail.com. We received no reply. | |
| Risk of bias | ||
| Bias | Authors' judgement | Support for judgement |
| Random sequence generation (selection bias) | Low risk | Patients were randomised into 2 groups using a random‐number table. |
| Allocation concealment (selection bias) | Unclear risk | The trial was described as being randomised, but it was unclear how the allocation was concealed. |
| Blinding of participants and personnel (performance bias) All outcomes | Unclear risk | Not described |
| Blinding of outcome assessment (detection bias) All outcomes | Unclear risk | Not described |
| Incomplete outcome data (attrition bias) All outcomes | Unclear risk | They did not use intention‐to‐treat analysis and did not fully describe how they dealt with missing participants. |
| Selective reporting (reporting bias) | Unclear risk | The trial reported serious adverse events, but not all‐cause mortality. No protocol could be found. |
| For‐profit bias | Unclear risk | It was unclear how the trial was funded. |
| Other bias | Low risk | The trial appeared to be free of other components that could put it at risk of bias. |
Valdivieso 1987.
| Methods | Randomised clinical trial, USA | |
| Participants | 65 hospitalised adults, previously untreated, with small cell bronchogenic carcinoma admitted for chemotherapy, at nutritional risk according to the trialist Male:Female = 40:18 Mean age = 59 years |
|
| Interventions | Experimental group: Intravenous hyperalimentation 500 ml 50% glucose, 500 ml 8.5% amino acid(n = 30)
Control group: No intervention (n = 35) Co‐intervention: oral nutrition as wanted + chemotherapy |
|
| Outcomes | Myelosuppresive toxicity, infectious complications, weight, triceps skinfold, mid‐upper arm muscle circumference, days of hospitalisation, survival, remission | |
| Study dates | Not stated | |
| Notes | The same participants were randomised to prophylactic antibiotics or no prophylactic antibiotics. The 2 groups of antibiotics could be described as being similar in the 2 groups. We contacted the authors on 23rd June 2015 by email: manuelva@umich.edu. The author replied that he had left the research environment and could not provide further information. | |
| Risk of bias | ||
| Bias | Authors' judgement | Support for judgement |
| Random sequence generation (selection bias) | Unclear risk | Not described |
| Allocation concealment (selection bias) | Unclear risk | Not described |
| Blinding of participants and personnel (performance bias) All outcomes | Unclear risk | Not described |
| Blinding of outcome assessment (detection bias) All outcomes | Unclear risk | Not described |
| Incomplete outcome data (attrition bias) All outcomes | Unclear risk | There were above 5% dropouts, and the trial did not use proper methodology to deal with those lost to follow‐up. |
| Selective reporting (reporting bias) | Low risk | The trial reported mortality and serious adverse events. |
| For‐profit bias | Low risk | The trial was funded by a non‐profit organisation (National Cancer Institute). |
| Other bias | Low risk | The trial appeared to be free of other components that could put it at risk of bias. |
Vermeeren 2004.
| Methods | Randomised clinical trial, the Netherlands | |
| Participants | 56 hospitalised adults admitted with acute exacerbation of COPD, at nutritional risk due to BMI < 22 kg/m2, or a BMI < 25 kg/m2 with > 5% weight loss in 1 month, or > 10% weight loss in 6 months prior to admission to the hospital Exclusion criteria: Diabetes mellitus 1, thyroid or intestinal diseases or carcinoma |
|
| Interventions | Experimental group: 3 x 125 ml Respifors/day; 2.38 MJ/day, 20 energy% from protein, 20 energy% from fat and 60 energy% from carbohydrate (n = 29)
Control group: 3 x 125 ml vanilla‐flavoured water with 0 MJ/day (n = 27) Co‐intervention: Nutritional intervention was implemented in the standardised usual‐care management of these participants They received standardised hospital diet. Dietetic consultation was standardised during the study period and they were given 500 ml 5% glucose infusion. |
|
| Outcomes | Weight, fat‐free mass, fat mass, FEV1%, IVC, Pi‐max, mean hand‐grip strength, quadriceps strength, dyspnoea score, loss of appetite score, early satiety score, bloating score, fatigue score, readmission to ward | |
| Study dates | Not stated | |
| Notes | We contacted the authors on 19th August 2015 by email: vermeeren.marja@zonnet.nl. We received no reply. | |
| Risk of bias | ||
| Bias | Authors' judgement | Support for judgement |
| Random sequence generation (selection bias) | Unclear risk | Not described |
| Allocation concealment (selection bias) | Unclear risk | Not described |
| Blinding of participants and personnel (performance bias) All outcomes | Low risk | The trial was double‐blinded, and the packages were described as being similar. |
| Blinding of outcome assessment (detection bias) All outcomes | Unclear risk | Not described |
| Incomplete outcome data (attrition bias) All outcomes | High risk | There were above 5% dropouts, and the trial did not use proper intention‐to‐treat methodology. |
| Selective reporting (reporting bias) | Unclear risk | No protocol could be obtained and the trial did not report on all‐cause mortality or serious adverse events. |
| For‐profit bias | High risk | The trial was funded by a nutrition company (Numico Research BV). |
| Other bias | Low risk | The trial appeared to be free of other components that could put it at risk of bias. |
Vicic 2013.
| Methods | Randomised clinical trial, Croatia | |
| Participants | 101 hospitalised adults with burns covering more than 20% of the body surface, at nutritional risk due to being in the ICU Male:Female = 49:52 Mean age = 48 years |
|
| Interventions | Experimental group: Fed via introduced nasojejunal probe equipped with enteral feeding. Basal feeding dose was 25 ml liquid enteral preparation each hr. (n = 52) Control group: Fed in standard manner by mouth (3 standard hospital meals) immediately after the 1st wound dressing(n = 49) |
|
| Outcomes | Complete blood count, plasma electrolytes, plasma glucose, urea, creatinine, albumin, C‐reactive protein and transferrin, BMI, complications, death | |
| Study dates | Not stated | |
| Notes | We contacted the authors on 25th August 2015 by email: vedkovac@inet.hr. We received no reply. | |
| Risk of bias | ||
| Bias | Authors' judgement | Support for judgement |
| Random sequence generation (selection bias) | Low risk | "Subjects were divided into two groups using computer randomization process." |
| Allocation concealment (selection bias) | Unclear risk | Not described |
| Blinding of participants and personnel (performance bias) All outcomes | High risk | The trial was not blinded since the participants were they only ones with tubes. |
| Blinding of outcome assessment (detection bias) All outcomes | High risk | The trial was not blinded since the participants were they only ones with tubes. |
| Incomplete outcome data (attrition bias) All outcomes | Unclear risk | The number of participants with incomplete data was not reported. |
| Selective reporting (reporting bias) | Low risk | There was no protocol. The trial reported complications and death. |
| For‐profit bias | Unclear risk | It was unclear how the trial was funded. |
| Other bias | Low risk | The trial appeared to be free of other components that could put it at risk of bias. |
Vlaming 2001.
| Methods | Randomised clinical trial, UK | |
| Participants | 549 hospitalised adults who were admitted acutely under the care of general medical, surgical or orthopaedic teams and were 'thin’ (5% ‐ 10% weight loss or BMI 18 ‐ 22), at nutritional risk due to anthropometrics Male:Female = 314:235 Mean age = 66.5 years Exclusion criteria: Planned admissions to medical or orthopaedic wards or to wards other than those 15 taking part in the trial, younger than 18, suffering mental illness, if water‐soluble vitamin supplementation was part of their standard treatment, if their admission would clearly be for 2 days or less, or if they had previously taken part in the trial. For the secondary randomisation to sip‐feed supplements, undernourished participants were excluded if; Their BMI was < 18 or if the unintentional weight loss exceeded 10%, to allow routine supplementation, were receiving therapeutic diets, e.g. insulin‐dependent diabetes, unable to swallow liquids, or if randomisation was considered clinically unacceptable. In practice, participants unable to communicate effectively and stroke victims could not be included because of consent issues. Weight loss, height and weight could not be documented in all participants. Under these circumstances the trial dietitians used their overall assessment of the participant and their discretion as to whether to randomise participants in the sip‐feed study. |
|
| Interventions | Experimental group: 400 ml of a complete sip‐feed supplement (Ensure Plus, Abbott Laboratories Ltd) from the 2nd day (n = 275) Control group: 400 ml of a placebo drink (n = 274) | |
| Outcomes | Length of hospital stay, mortality | |
| Study dates | Not stated | |
| Notes | We contacted the authors on 8th February 2016 by email: j.powell_tuck@qmul.ac.uk. We received no reply. | |
| Risk of bias | ||
| Bias | Authors' judgement | Support for judgement |
| Random sequence generation (selection bias) | Unclear risk | Not described |
| Allocation concealment (selection bias) | Unclear risk | The envelopes used to conceal the randomisation code were sealed but not described as opaque. |
| Blinding of participants and personnel (performance bias) All outcomes | Unclear risk | It was unclear if the treatment providers were properly blinded: "The enteral feeds tasted different from each other and EnsurePlus was familiar to the ward nurses. The control feed, which tasted medicinal, was described as an alternative trial feed and we avoided discussion of which feed was ‘under test’. Nurses were not discouraged from assuming that it was the new, unfamiliar feed that was primarily under trial.". |
| Blinding of outcome assessment (detection bias) All outcomes | Unclear risk | Not described |
| Incomplete outcome data (attrition bias) All outcomes | High risk | There was more than 5% of participants without complete data. "Of 275 patients who received supplemental active sipfeed 97 had BMI data and 99 weight loss data and 54 had both." "274 patients received the placebo sip‐supplement of whom 101 had BMI data and 76 weight loss data and 44 both, and 133 had either one or other." The pattern of incomplete data could be described as being different in the 2 groups. |
| Selective reporting (reporting bias) | Unclear risk | There was no protocol and the trial did not report serious adverse events. |
| For‐profit bias | High risk | The trial received funds from the industry: "We are grateful also to Abbott Laboratories Ltd (especially Dr Stephen Coles, Dr Jackie Edington and Ms J Boorman) who supplied the sip feeds and placebo drinks and provided supplementary financial". |
| Other bias | Low risk | The trial appeared to be free of other components that could put it at risk of bias. |
Von Meyenfeldt 1992a.
| Methods | Randomised clinical trial, the Netherlands | |
| Participants | 151 hospitalised adults with newly‐detected, histologically‐proven gastric or colorectal carcinoma requiring surgical treatment, who had not undergone treatment for other malignant tumours Male:Female = 93:58 Mean age = 66.5 years Exclusion criteria: Patients above 80, patients with normal nutritional status, |
|
| Interventions | Experimental groups: Group 1 (TPN): Participants in group 1 were planned to receive 150% of BEE, calculated using the Harris and Benedict equation, as non‐protein calories from a parenteral nutrition stock solution that contained 7g N/l (Synthamin 14) and 25% dextrose. Trace elements and vitamins (MVI) were added to conform to today’s standards. Electrolytes were added according to the individual participant’s needs. 500 ml of an intravenous fat emulsion (Intralipid 20%) was administered at least 3 times a week. Preoperative nutritional support lasted at least 10 days. (n = 51) Group 2 (TEN): Participants in group 2 received enteral nutrition (Precitene or Isotein) for at least 10 days preoperatively either by nasogastric tube or by mouth. Energy intake was planned to contain 150% of the calculated BEE.(n = 50) Control group: Group 3: No intervention (underwent immediate operation, which was assessed as an acceptable control intervention) (n = 50) |
|
| Outcomes | Mortality, complications | |
| Study dates | Not stated | |
| Notes | We here report group 1 versus group 3. | |
| Risk of bias | ||
| Bias | Authors' judgement | Support for judgement |
| Random sequence generation (selection bias) | Unclear risk | Not described |
| Allocation concealment (selection bias) | Unclear risk | Not described |
| Blinding of participants and personnel (performance bias) All outcomes | High risk | Not possible |
| Blinding of outcome assessment (detection bias) All outcomes | High risk | Not possible |
| Incomplete outcome data (attrition bias) All outcomes | Unclear risk | The number of participants with incomplete data was not reported. |
| Selective reporting (reporting bias) | Low risk | The trial reported mortality and complications. |
| For‐profit bias | High risk | The trial was funded by a company that might have an interest in a given result (Wander Research and Clintec). |
| Other bias | Low risk | The trial appeared free of other bias that might put it at risk. |
Von Meyenfeldt 1992b.
| Methods | Randomised clinical trial, the Netherlands | |
| Participants | 151 hospitalised adults with newly‐detected, histologically‐proven gastric or colorectal carcinoma requiring surgical treatment, who had not undergone treatment for other malignant tumours Male:Female = 93:58 Mean age = 66.5 years Exclusion criteria: Patients above 80, patients with normal nutritional status |
|
| Interventions | Group 1 (TPN): Participants in group 1 were planned to receive 150% of BEE, calculated using the Harris and Benedict equation, as non‐protein calories from a parenteral nutrition stock solution that contained 7g N/l (Synthamin 14) and 25% dextrose. Trace elements and vitamins (MVI) were added to conform to today’s standards. Electrolytes were added according to the individual participant’s needs. 500 ml of an intravenous fat emulsion (Intralipid 20%) was administered at least 3 times a week. Preoperative nutritional support lasted at least 10 days. (n = 51) Group 2 (TEN): Participants in group 2 received enteral nutrition (Precitene or Isotein) for at least 10 days preoperatively either by nasogastric tube or by mouth. Energy intake was planned to contain 150% of the calculated BEE.(n = 50) Control Group: group 3, who received no intervention (underwent immediate operation, which was assessed as an acceptable control intervention) (n = 50) |
|
| Outcomes | Mortality, complications | |
| Study dates | Not stated | |
| Notes | We here report group 2 versus group 3. | |
| Risk of bias | ||
| Bias | Authors' judgement | Support for judgement |
| Random sequence generation (selection bias) | Unclear risk | Not described |
| Allocation concealment (selection bias) | Unclear risk | Not described |
| Blinding of participants and personnel (performance bias) All outcomes | Unclear risk | Not possible |
| Blinding of outcome assessment (detection bias) All outcomes | Unclear risk | Not possible |
| Incomplete outcome data (attrition bias) All outcomes | Unclear risk | The number of participants with incomplete data was not reported. |
| Selective reporting (reporting bias) | Low risk | The trial reported mortality and complications. |
| For‐profit bias | High risk | The trial was funded by a company that might have an interest in a given result (Wander Research and Clintec). |
| Other bias | Unclear risk | The trial appeared free of other bias that might put it at risk. |
Wang 1996a.
| Methods | Randomised clinical trial, China | |
| Participants | 36 hospitalised adults with gastric cardia adenocarcinoma, gastric carcinoma, pancreatic carcinoma and biliary calculi, at nutritional risk due to open abdominal surgery Male:Female = 29:7 Mean age = approx 54 years |
|
| Interventions | Experimental group 1: Parenteral nutrition. Central venous infusion at postoperative day, 105 ‐ 125 KJ/kg/d (25 ‐ 30 kcal/kg/day), 30% ‐ 40% of the nonprotein energy was provided by fat emulsion (10% intralipid SSPS). Nitrogen 0.12 ‐ 0.15 g/kg/day (7% Vamin SSPC), Energy:Nitrogen = 170 ‐ 220:1. Total infusion volume was 2500 ‐ 3000 ml nutrition support from the 1st postoperative day, for 7 days in total. (n = 12) Experimental group 2: Enteral nutrition. Tube‐feeding with Compound nutrition elements (Qingdao biochemical and pharmaceutical factory) at postoperative day, with the same intake of energy and nitrogen as experimental group 1. Peripheral intravenous infusion with energy and nitrogen from 24 to 48 hrs if the tube‐feeding was insufficient. Total infusion volume was 2500 ‐ 3000 ml nutrition support from the 1st day postoperative , for 7 days in total. (n = 12) Control group: Conventional therapy of peripheral intravenous infusion with glucose saline 2500 ml, including glucose 175 g, calorie 2926 kJ (700 kcal)/day). Total infusion volume was 2500 ‐ 3000 ml nutrition support from the 1st day postoperative for 7 days in total. (n = 12) |
|
| Outcomes | Body weight | |
| Study dates | Not stated | |
| Notes | Same as Wong 1996b, but with experimental group 1 vs control group. We tried and failed to contact the authors by phone. | |
| Risk of bias | ||
| Bias | Authors' judgement | Support for judgement |
| Random sequence generation (selection bias) | Unclear risk | Not described |
| Allocation concealment (selection bias) | Unclear risk | Not described |
| Blinding of participants and personnel (performance bias) All outcomes | High risk | Participants and personnel were not blinded. |
| Blinding of outcome assessment (detection bias) All outcomes | Unclear risk | Not described |
| Incomplete outcome data (attrition bias) All outcomes | Unclear risk | The number of participants with incomplete data was not reported. |
| Selective reporting (reporting bias) | Unclear risk | No protocol could be obtained and the trial did not report on all‐cause mortality or serious adverse events. |
| For‐profit bias | Unclear risk | It was unclear how the trial was funded. |
| Other bias | Low risk | The trial appeared to be free of other components that could put it at risk of bias. |
Wang 1996b.
| Methods | Randomised clinical trial, China | |
| Participants | 36 hospitalised adults with gastric cardia adenocarcinoma, gastric carcinoma, pancreatic carcinoma and biliary calculi, at nutritional risk due to open abdominal surgery Male:Female = 29:7 Mean age = approx. 54 years Exclusion criteria: Not reported |
|
| Interventions | Experimental group 1: Parenteral nutrition. Central venous infusion at postoperative day, 105 ‐ 125 KJ/kg/day (25 ‐ 30 kcal/kg/day), 30% ‐ 40% of the nonprotein energy was provided by fat emulsion (10% intralipid SSPS). Nitrogen 0.12 ‐ 0.15 g/kg/day (7% Vamin SSPC), Energy:Nitrogen = 170 ‐ 220:1. Total infusion volume was 2500 ‐ 3000 ml nutrition support from the 1st postoperative day, for 7 days in total. (n = 12) Experimental group 2: Enteral nutrition. Tube‐feeding with Compound nutrition elements (Qingdao biochemical and pharmaceutical factory) at postoperative day, with the same intake of energy and nitrogen as the experimental group 1. Peripheral intravenous infusion with energy and nitrogen from 24 to 48 hrs if the tube‐feeding was insufficient. Total infusion volume was 2500 ‐ 3000 ml nutrition support from the 1st day postoperative , for 7 days in total. (n = 12) Control group: Conventional therapy of peripheral intravenous infusion with glucose saline 2500 ml, including glucose 175 g, calorie 2926 kJ (700 kcal)/day). Total infusion volume was 2500 ‐ 3000 ml nutrition support from the 1st day postoperative for 7 days in total. (n = 12) |
|
| Outcomes | Body weight | |
| Study dates | Not stated | |
| Notes | Same as Wang 1996a, but with experimental group 2 vs control group | |
| Risk of bias | ||
| Bias | Authors' judgement | Support for judgement |
| Random sequence generation (selection bias) | Unclear risk | Not described |
| Allocation concealment (selection bias) | Unclear risk | Not described |
| Blinding of participants and personnel (performance bias) All outcomes | High risk | Participants and personnel were not blinded. |
| Blinding of outcome assessment (detection bias) All outcomes | Unclear risk | Not described |
| Incomplete outcome data (attrition bias) All outcomes | Unclear risk | The number of participants with incomplete data was not reported. |
| Selective reporting (reporting bias) | Unclear risk | No protocol could be obtained and the trial did not report on all‐cause mortality or serious adverse events. |
| For‐profit bias | Unclear risk | It was unclear how the trial was funded. |
| Other bias | Low risk | The trial appeared to be free of other components that could put it at risk of bias. |
Wang 1997a.
| Methods | Randomised clinical trial, China | |
| Participants | 60 hospitalised adults with oesophageal cancer and cardiac cancer, at nutritional risk due to gastro‐oesophageal surgery Male:Female = 47:13 Mean age = 58.7 years Exclusion criteria: Not stated |
|
| Interventions | Experimental group: Group 1: Recieved enteral nutrition of about 2.93 kJ/(kg/hr) calories from the 1st day post‐operation, which was gradually increased to 5.44 kJ/(kg/hr) calories until the 4th day, and then gradually reduced to 3.35 kJ/(kg/hr) calories from the 4th day until the 14th day; including 50 g aminophenol each day. After that conventional fluid infusion (4.18 kJ/(kg/hr) and 35 g aminophenol was given each day. The course of the treatment was 14 days. (n = 20) Group 2: Recieved parenteral feeding of about 2.93 kJ/(kg/hr) calories from the 1st day post‐operation, which was gradually increased to 5.44 kJ/(kg/hr) calories until the 4th day, and then gradually reduced to 3.35 kJ/(kg/hr) calories from the 4th day until the 14th day, including 50 g aminophenol each day. After that conventional fluid infusion (4.18 kJ/(kg/hr) and 35 g aminophenol was given each day. The course of the treatment was 14 days. (n = 20) Control group: Recieved conventional fluid and electrolyte infusion (about 1673.6 ˜ 2510.4 kJ calories), from the 1st until 5 ˜ 7 days after the operation. They then received a liquid diet, then gradually received semi‐liquid and ended with general food.The course of the treatment was 14 days. (n = 20) |
|
| Outcomes | Triceps folds, forearm midpoint circumference, body weight, albumin, transferrin, blood biochemistry, liver function and the calculation of nitrogen balance | |
| Study dates | Not stated | |
| Notes | Same as Wang 1997c, but with experimental group 1 vs control. We could obtain no contact information for the authors. | |
| Risk of bias | ||
| Bias | Authors' judgement | Support for judgement |
| Random sequence generation (selection bias) | Unclear risk | Not described |
| Allocation concealment (selection bias) | Unclear risk | Not described |
| Blinding of participants and personnel (performance bias) All outcomes | High risk | Participants and personnel were not blinded. |
| Blinding of outcome assessment (detection bias) All outcomes | Unclear risk | Not described |
| Incomplete outcome data (attrition bias) All outcomes | Unclear risk | The number of participants with incomplete data was not reported. |
| Selective reporting (reporting bias) | High risk | No protocol could be obtained and the trial did not report on all‐cause mortality and serious adverse events. |
| For‐profit bias | Unclear risk | It was unclear how the trial was funded. |
| Other bias | Low risk | The trial appeared to be free of other components that could put it at risk of bias. |
Wang 1997b.
| Methods | Randomised clinical trial, China | |
| Participants | 60 hospitalised adults with oesophageal cancer and cardiac cancer, at nutritional risk due to gastro‐oesophageal surgery Male:Female = 47:13 Mean age = 58.7 years Exclusion criteria: not stated |
|
| Interventions | Experimental group: Group 1: received enteral nutrition of about 2.93 kJ/(kg/hr) calories from the 1st day post‐operation, which was gradually increased to 5.44 kJ/(kg/hr) calories until the 4th day, and then gradually reduced to 3.35 kJ/(kg/hr) calories from the 4th day until the 14th day, including 50 g aminophenol each day. After that conventional fluid infusion (4.18 kJ/(kg/hr) and 35 g aminophenol was given each day. The course of the treatment was 14 days. (n = 20) Group 2: received parenteral feeding of about 2.93 kJ/(kg/hr) calories from the 1st day post‐operation, which was gradually increased to 5.44 kJ/(kg/hr) calories until the 4th day, and then gradually reduced to 3.35 kJ/(kg/hr) calories from the 4th day until the 14th day, including 50 g aminophenol each day. After that conventional fluid infusion (4.18 kJ/(kg/hr) and 35 g aminophenol was given each day. The course of the treatment was 14 days. (n = 20) Control group: received conventional fluid and electrolyte infusion (about 1673.6 ˜ 2510.4 kJ calories), from the 1st until 5 ˜ 7 days after the operation. They then received a liquid diet, then gradually received semi‐liquid and ended with general food.The course of the treatment was 14 days.(n = 20) |
|
| Outcomes | Triceps folds, forearm midpoint circumference, body weight, albumin, transferrin, blood biochemistry, liver function and the calculation of nitrogen balance | |
| Study dates | Not stated | |
| Notes | Same as Wang 1997a, but with experimental group 2 vs control | |
| Risk of bias | ||
| Bias | Authors' judgement | Support for judgement |
| Random sequence generation (selection bias) | Unclear risk | Not described |
| Allocation concealment (selection bias) | Unclear risk | Not described |
| Blinding of participants and personnel (performance bias) All outcomes | High risk | Participants and personnel were not blinded. |
| Blinding of outcome assessment (detection bias) All outcomes | Unclear risk | Not described |
| Incomplete outcome data (attrition bias) All outcomes | Unclear risk | The number of participants with incomplete data was not reported. |
| Selective reporting (reporting bias) | High risk | No protocol could be obtained and the trial did not report on all‐cause mortality or serious adverse events. |
| For‐profit bias | Unclear risk | It was unclear how the trial was funded. |
| Other bias | Low risk | The trial appeared to be free of other components that could put it at risk of bias. |
Wang 2007.
| Methods | Randomised clinical trial, China | |
| Participants | 64 hospitalised adults with severe acute pancreatitis, at nutritional risk due to digestive disorders Male:Female = 34:30 Mean age = 52 years Exclusion criteria: Not stated |
|
| Interventions | Experimental group: Enteral nutrition by nasogastric feeding starting 48 ‐ 96 hrs after being hospitalised as well as conventional treatment. The course of the treatment was unclear. (n = 40) Control group: No intervention(n = 24) Co‐interventions: Conventional treatment including; fasting, gastro‐intestinal decompression, PPI due to acid, grease and octreotide Gabay enzyme inhibition, antibiotic therapy, colloid supplement and traditional Chinese medicine Qingyi Decotion orally |
|
| Outcomes | The recovery time from symptoms, physical signs and laboratory parameters (white blood cell count, CRP and serum amylase), changes in body weight and serum albumin, cost of hospitalisation and length of stay | |
| Study dates | Not stated | |
| Notes | We tried but failed to contact the authors by phone and email: meteorcloud@yeahnet. | |
| Risk of bias | ||
| Bias | Authors' judgement | Support for judgement |
| Random sequence generation (selection bias) | Unclear risk | Not described |
| Allocation concealment (selection bias) | Unclear risk | Not described |
| Blinding of participants and personnel (performance bias) All outcomes | High risk | Participants and personnel were not blinded. |
| Blinding of outcome assessment (detection bias) All outcomes | Unclear risk | Not described |
| Incomplete outcome data (attrition bias) All outcomes | Unclear risk | The number of participants with incomplete data was not reported. |
| Selective reporting (reporting bias) | High risk | No protocol could be obtained and the trial did not report on all‐cause mortality or serious adverse events. |
| For‐profit bias | Unclear risk | It was unclear how the trial was funded. |
| Other bias | Low risk | The trial appeared to be free of other components that could put it at risk of bias. |
Wang 2011b.
| Methods | Randomised clinical trial, China | |
| Participants | 79 hospitalised adult with AIDS, at nutritional risk due to surgery or mechanical ventilation Male:Female = 41:38 Mean age = 38.2 years Exclusion criteria: diabetes mellitus, hyperthyroidism, severe liver and kidney dysfunction, CD4 cell count > 200 /μl |
|
| Interventions | Experimental group: Enteral nutrition of non‐protein calorie 84 kJ/(kg/day), nitrogen 0.2 g/(kg/day). Participants received a guaranteed calorie intake every day of 83.6 ~ 146.3 kJ/(kg/day). The course of treatment was 5 ˜ 7 days. (n = 46) Control group: no intervention (n = 33) Co‐interventions: conventional treatment (glucose and saline as intravenous infusion) |
|
| Outcomes | T lymphocytes (CD3, CD4, and CD8), blood biochemical parameters. | |
| Study dates | Not stated | |
| Notes | We contacted the authors on email: docwang@126.com. We received no reply. | |
| Risk of bias | ||
| Bias | Authors' judgement | Support for judgement |
| Random sequence generation (selection bias) | Low risk | The sequence generation was achieved using a random‐numbers table. |
| Allocation concealment (selection bias) | Unclear risk | Not described |
| Blinding of participants and personnel (performance bias) All outcomes | High risk | Participants and personnel were not blinded. |
| Blinding of outcome assessment (detection bias) All outcomes | Unclear risk | Not described |
| Incomplete outcome data (attrition bias) All outcomes | Unclear risk | The number of participants with incomplete data was not reported. |
| Selective reporting (reporting bias) | Unclear risk | No protocol could be obtained and the trial did not report on all‐cause mortality or serious adverse events. |
| For‐profit bias | Unclear risk | It was unclear how the trial was funded. |
| Other bias | Low risk | The trial appeared to be free of other components that could put it at risk of bias. |
Wang 2013a.
| Methods | Randomised clinical trial, China | |
| Participants | 48 hospitalised adults with colorectal cancer, at nutritional risk due to major surgery Male:Female = 27:21 Age range = 37 ‐ 73 years Exclusion criteria: Older than 80, received chemotherapy prior to the surgery, serious organ function disorder, low rectal cancer and having abdominoperineal resection, palliative operation, or emergency operation, severely obese, fatty or malnourished, metabolic and endocrine diseases such as hyperthyroidism 7, having Intestinal obstruction, perforation, or intestinal necrosis |
|
| Interventions | Experimental group: Enteral nutrition: 500 ml Jevity each day was taken orally from the 1st day of admission to the hospital (500 ml Jevity contained 2196.6 KJ, protein 20 g, fat 17 g, carbohydrate 70 g and dietary fibre 5.3 g). A nasal tube was placed after the surgery, and water was given at the 1st postoperative day, and if there was no discomfort, 500 ml Jevity and water were administered on the 2nd postoperative day. From the 3rd day on, 1000 ml Jevity was given with certain nutrition liquid diet until hospital discharge. If the participants had symptoms like nausea, vomiting or abdominal distention, the dose of Jevity would be decreased or changed to another kind of nutrient.(n = 24) Control group: Standard usual care. Participants were administered venous transfusion after the surgery, and water was given after anal‐exsufflation. If there was no discomfort, the volume of water would be increased and a liquid diet considered. (n = 24) |
|
| Outcomes | Postoperative exhaust time, hospital stay, treatment charge, bio markers postoperative complications such as pulmonary infection, the completion rate of nutrition agents | |
| Study dates | Not stated | |
| Notes | We contacted the authors on 09th December 2015 by phone and by email: ngds0538@sina.com. We received no reply. | |
| Risk of bias | ||
| Bias | Authors' judgement | Support for judgement |
| Random sequence generation (selection bias) | Low risk | The randomisation method was random table. |
| Allocation concealment (selection bias) | Unclear risk | Not described |
| Blinding of participants and personnel (performance bias) All outcomes | High risk | Participants and personnel were not blinded. |
| Blinding of outcome assessment (detection bias) All outcomes | Unclear risk | Not described |
| Incomplete outcome data (attrition bias) All outcomes | Unclear risk | The number of participants with incomplete data was not reported. |
| Selective reporting (reporting bias) | Unclear risk | No protocol could be obtained and the trial did not report on all‐cause mortality or serious adverse events. |
| For‐profit bias | Unclear risk | It was unclear how the trial was funded. |
| Other bias | Low risk | The trial appeared to be free of other components that could put it at risk of bias. |
Ward 1983.
| Methods | Randomised clinical trial, UK | |
| Participants | 8 hospitalised adults with ongoing gastrointestinal oncologic surgery, at nutritional risk due to major surgery Male:Female = not stated Mean age = 69.5 years Exclusion criteria: none stated |
|
| Interventions | Experimental group: Enteral feeding of 1800 ‐ 2000 kcal in addition to the hospitals standard diet (1600 kcal) 7 ‐ 10 days before surgery (n = 8) Control group: Standard diet (n = 8) | |
| Outcomes | Whole‐protein turnover and muscle protein synthesis | |
| Study dates | Not stated | |
| Notes | We found no contact information for the authors. | |
| Risk of bias | ||
| Bias | Authors' judgement | Support for judgement |
| Random sequence generation (selection bias) | Unclear risk | Not described |
| Allocation concealment (selection bias) | Unclear risk | Not described |
| Blinding of participants and personnel (performance bias) All outcomes | High risk | Not blinded |
| Blinding of outcome assessment (detection bias) All outcomes | Unclear risk | Not described |
| Incomplete outcome data (attrition bias) All outcomes | Low risk | No dropouts |
| Selective reporting (reporting bias) | Unclear risk | Not described |
| For‐profit bias | High risk | Funded by Abbott Laboratories |
| Other bias | Low risk | The trial appears to be free of other components that could put it at risk of bias. |
Watters 1997.
| Methods | Randomised clinical trial, Canada | |
| Participants | 31 hospitalised adults undergoing oesophagectomy or pancreatoduodenectomy, at nutritional risk due to major abdominal surgery Male:Female = 22:6 (analysed participants only) Mean age = 62.5 Exclusion criteria: Metastases identified before surgery or at the time of surgery, diabetes mellitus,and corticosteroid use |
|
| Interventions | Experimental group: Immediate postoperative enteral feeding (The enteral preparation provided 4.4 g protein and 445 kJ/100 mL) (n = 15)
Control group: No enteral feeding during the 1st 6 postoperative days (n = 16) Co‐intervention: PEG placement |
|
| Outcomes | Hand‐grip strength, spirometry, serum biochemistry, urine biochemistry, mobility | |
| Study dates | Not stated | |
| Notes | We could obtain no contact information for the authors. | |
| Risk of bias | ||
| Bias | Authors' judgement | Support for judgement |
| Random sequence generation (selection bias) | Low risk | The sequence generation was computer‐generated. |
| Allocation concealment (selection bias) | Low risk | The allocation was concealed in sealed envelopes. |
| Blinding of participants and personnel (performance bias) All outcomes | High risk | The participants and personnel were unblinded. |
| Blinding of outcome assessment (detection bias) All outcomes | High risk | The outcome assessment was unblinded. |
| Incomplete outcome data (attrition bias) All outcomes | High risk | There were above 5% dropouts, and the trial did not allow proper intention‐to‐treat methodology. |
| Selective reporting (reporting bias) | Unclear risk | No protocol could be obtained, and all‐cause mortality was not reported. |
| For‐profit bias | Unclear risk | It was unclear how the trial was funded. |
| Other bias | Low risk | The trial appeared to be free of other components that could put it at risk of bias |
Wei 2013.
| Methods | Randomised clinical trial, China | |
| Participants | 79 hospitalised adults admitted for the 1st time with gastro‐intestinal cancer and distant metastasis undergoing Capecitabine monotherapy regimen for 2 cycles. They were younger than 60, KPS score > 60; had normal liver and kidney function, ECG, without chemotherapy contraindication, at nutritional risk due to trialist indication Male:Female = 42:37 Mean age = unknown Exclusion criteria: none stated |
|
| Interventions | Experimental group: Parenteral and enteral nutrition. The participants were given parenteral nutrition support according to gastro‐intestinal function. If the oral intake was less than 60% of normal intake, a 30% fat emulsion injection was used (Intralipid force in Huarui Pharmaceutical Co. Ltd), as well as amino acid injection (Novamin, SSPC), fat‐soluble vitamins (Zhi Weibao, North China Pharmaceutical Limited by Share Ltd), water‐soluble vitamins (Soluvit, Huarui Pharmaceutical Co. Ltd), insulin, potassium chloride and sodium chloride to give parenteral nutrition for 3 14 days. The amount of enteral nutrition was increased gradually according to gastro‐intestinal tolerability, and reaching complete enteral nutrition when nausea, vomiting and diarrhoea were absent and the body state allowed for it. The enteral nutrition was given as an emulsion (Supportan, Huarui Pharmaceutical Co. Ltd.), with an initial dosage of 20% to 50% of the required nutrients. The calorie level was 80 kJ/(kg/day), protein was 1 g/(kg/day), and the ratio of non‐protein calorie versus nitrogen was 100:1. The treatment lasted for 2 cycles of chemotherapy. (n = 42) Control group: no intervention (n = 37) Co‐interventions: chemotherapy |
|
| Outcomes | Nutritional statusKPS, toxic reaction and nosocomial infection rate | |
| Study dates | Not stated | |
| Notes | We contacted the authors on 21st January 2016 by phone. We received information on allocation sequence generation. | |
| Risk of bias | ||
| Bias | Authors' judgement | Support for judgement |
| Random sequence generation (selection bias) | Unclear risk | Random‐number table |
| Allocation concealment (selection bias) | Unclear risk | Not described |
| Blinding of participants and personnel (performance bias) All outcomes | High risk | Participants and personnel were not blinded. |
| Blinding of outcome assessment (detection bias) All outcomes | Unclear risk | Not described |
| Incomplete outcome data (attrition bias) All outcomes | Unclear risk | The number of participants with incomplete data was not reported. |
| Selective reporting (reporting bias) | Unclear risk | No protocol could be obtained and the trial did not report on all‐cause mortality or serious adverse events. |
| For‐profit bias | Low risk | The trial was funded by Special funds of the central government (2012QN050). |
| Other bias | Low risk | The trial appeared to be free of other components that could put it at risk of bias. |
Wernerman 1986.
| Methods | Randomised clinical trial, Sweden | |
| Participants | 16 hospitalised adults admitted for elective abdominal surgery, at nutritional risk due to major surgery Male:Female = 7:9 Mean age = 57.2 years Exclusion criteria: metabolic disease |
|
| Interventions | Experimental group: TPN (135 kj/body weight/day, carbohydrates and fat and an amino acid nitrogen supply). Control group: treatment as usual (electrolytes only) |
|
| Outcomes | Polyribosomes/total ribosome, sucrose density gradient, nitrogen balance | |
| Study dates | Not stated | |
| Notes | We could obtain no contact information for the authors. | |
| Risk of bias | ||
| Bias | Authors' judgement | Support for judgement |
| Random sequence generation (selection bias) | Unclear risk | Not described |
| Allocation concealment (selection bias) | Unclear risk | Not described |
| Blinding of participants and personnel (performance bias) All outcomes | Unclear risk | Not described |
| Blinding of outcome assessment (detection bias) All outcomes | Unclear risk | Not described |
| Incomplete outcome data (attrition bias) All outcomes | Low risk | No dropouts |
| Selective reporting (reporting bias) | Unclear risk | No protocol could be obtained. |
| For‐profit bias | Low risk | The trial was funded by the Swedish Medical Research Council and Trygg‐Hansa foundation. |
| Other bias | Low risk | The trial appeared to be free of other components that could put it at risk of bias. |
Whittaker 1990.
| Methods | Randomised clinical trial, Canada | |
| Participants | 10 hospitalised adults with COPD, at nutritional risk due to being malnourished Male:Female = 5:5 Mean age = 68 years Exclusion criteria: Congestive heart failure, clinically unstable, active respiratory infection, malabsorption or diabetes mellitus |
|
| Interventions | Experimental group: Enteral feeding consisting of 1000 kcal/day for 16 days(n = 6) Control group: Enteral feeding < 100 kcal/day for 16 days (n = 4) | |
| Outcomes | Weight, pulmonary function test | |
| Study dates | Not stated | |
| Notes | We contacted the authors were contacted on 9th December 2015 by email: swhittaker@telus.net. We received no reply. | |
| Risk of bias | ||
| Bias | Authors' judgement | Support for judgement |
| Random sequence generation (selection bias) | Unclear risk | Not described |
| Allocation concealment (selection bias) | Unclear risk | Not described |
| Blinding of participants and personnel (performance bias) All outcomes | Unclear risk | Not described |
| Blinding of outcome assessment (detection bias) All outcomes | Unclear risk | Not described |
| Incomplete outcome data (attrition bias) All outcomes | Low risk | No dropouts |
| Selective reporting (reporting bias) | Unclear risk | No protocol could be obtained and the trial did not report on all‐cause mortality or serious adverse events. |
| For‐profit bias | Unclear risk | It was unclear how the trial was funded. |
| Other bias | Low risk | The trial appeared to be free of other components that could put it at risk of bias. |
Williams 1983.
| Methods | Randomised clinical trial, UK | |
| Participants | 14 hospitalised adults with squamous cell carcinoma of the oesophagus, at nutritional risk according to the trialist Exclusion criteria: unable to swallow their saliva at presentation |
|
| Interventions | Experimental group: fine‐bore enteral feeding (2400 ml of Isocal/24 hrs. (n = 7) Each litre = 33 g protein, 42 g of fat, 125 g carbohydrate) for 6 weeks
Control group: no intervention (n = 7) Co‐interventions: standard ward diet |
|
| Outcomes | Potassium, weight change | |
| Study dates | Not stated | |
| Notes | The trial found that very few of the experimental group had received the standard ward diet, because of the supplementary enteral feeding. The trial was terminated before it was finished, due to an increased effect of the experimental group. We contacted the authors by email:john.fenwick@ccotrust.nhs.uk. We received no reply. |
|
| Risk of bias | ||
| Bias | Authors' judgement | Support for judgement |
| Random sequence generation (selection bias) | Unclear risk | Not described |
| Allocation concealment (selection bias) | Unclear risk | Not described |
| Blinding of participants and personnel (performance bias) All outcomes | High risk | Not blinded. Only the experimental group received tube‐feeding. |
| Blinding of outcome assessment (detection bias) All outcomes | Unclear risk | Not described |
| Incomplete outcome data (attrition bias) All outcomes | Unclear risk | The number of participants with incomplete data was not reported. |
| Selective reporting (reporting bias) | Unclear risk | No protocol could be obtained and the trial did not report serious adverse events or mortality. |
| For‐profit bias | Unclear risk | It was unclear how the trial was funded. |
| Other bias | Low risk | The trial appeared to be free of other components that could put it at risk of bias. |
Williams 1985.
| Methods | Randomised clinical trial, unknown country. | |
| Participants | 64 hospitalised adults with acute alcoholic hepatitis, at nutritional risk defined by trialist Male:Female = 31:33 Mean age = 49 years Exclusion criteria: hepatocellular carcinoma |
|
| Interventions | Experimental group: 2 litres daily of liquid diet providing, regardless of encephalopathy, approximately 2000 nonprotein kcal and 10 g nitrogen as 65 g of conventional protein administered enterally for 3 weeks (n = 21) Control group: No intervention (n = 22) Co‐intervention: The control diet yielded < 22 mol sodium, 1800 ‐ 2400 kcal and 70 ‐ 100 g protein. The adults receiving only the control diet were given vitamin K i.v. (10 mg x 3) and were subsequently managed with protein restriction (to 40 or 60 g) if indicated for control of encephalopathy, and by intravenous infusion of 5 ‐ 20% dextrose solutions if temporarily unable to take food orally. |
|
| Outcomes | Mortality, complications, hepatic function (prothrombin time), indices of malnutrition and nitrogen balance | |
| Study dates | Not stated | |
| Notes | "The authors were not contacted since dr. Calvey died several years ago and no additional data was available" (Koretz 2012). | |
| Risk of bias | ||
| Bias | Authors' judgement | Support for judgement |
| Random sequence generation (selection bias) | Unclear risk | Not described |
| Allocation concealment (selection bias) | Unclear risk | Not described |
| Blinding of participants and personnel (performance bias) All outcomes | Unclear risk | Not described |
| Blinding of outcome assessment (detection bias) All outcomes | Unclear risk | Not described |
| Incomplete outcome data (attrition bias) All outcomes | Unclear risk | The number of participants with incomplete data was not reported. |
| Selective reporting (reporting bias) | Low risk | The trial reported mortality and complications. |
| For‐profit bias | Low risk | The trial was supported by the Joint Research Committee of King's College Hospital and Medical School. |
| Other bias | Low risk | The trial appeared to be free of other components that could put it at risk of bias. |
Williford 1991.
| Methods | Randomised clinical trial, USA | |
| Participants | 459 hospitalised adults undergoing major abdominal or thoracic surgery, at nutritional risk according to Nutritional Risk Index (NRI) Male:Female = 455:4 Mean age = 62.9 years |
|
| Interventions | Experimental group: 7 ‐ 15 days preoperative TPN (n = 231) Control group: No preoperative TPN. After 72 hrs if clinically indicated (n = 228) | |
| Outcomes | Complications, all‐cause‐mortality | |
| Study dates | Not stated | |
| Notes | We could find no contact information for the authors. | |
| Risk of bias | ||
| Bias | Authors' judgement | Support for judgement |
| Random sequence generation (selection bias) | Low risk | The sequence was randomly computer‐generated. |
| Allocation concealment (selection bias) | Unclear risk | Not described |
| Blinding of participants and personnel (performance bias) All outcomes | Unclear risk | Not described |
| Blinding of outcome assessment (detection bias) All outcomes | Unclear risk | Not described |
| Incomplete outcome data (attrition bias) All outcomes | High risk | There were above 5% dropouts, and the trial did not allow proper intention‐to‐treat methodology. |
| Selective reporting (reporting bias) | Low risk | The outcomes were as stated in the protocol. |
| For‐profit bias | High risk | The trial was funded by Armour Pharmaceutical. |
| Other bias | Low risk | The trial appeared to be free of other components that could put it at risk of bias. |
Wood 1989a.
| Methods | Randomised clinical trial, USA | |
| Participants | 55 hospitalised adult men undergoing routine major surgery, at nutritional risk due to major surgery Male:Female = 55:0 Mean age = 54 years Exclusion criteria: none stated |
|
| Interventions | Experimental group 1: TPN (90 g of crystalline amino acids, 3000 calories as glucose a day) from 2 weeks prior to surgery until 1 week after surgery (n = 10)
Experimental group 2: parenteral nutrition 90 g amino acids a day (n = 15) Experimental group 3: parenteral nutrition: peripheral parenteral nutrition (90 g amino acids plus 1600 calories, 60% as fat a day)(n =15) Control group: treatment as usual (100 g glucose) (n = 15) |
|
| Outcomes | Nitrogen balance, maintenance of body cell mass, serum albumin levels, exercise capacity | |
| Study dates | Not stated | |
| Notes | Group 1 could not be used in the analysis, since this group was not properly randomised (they had to have a certain degree of malnutrition, before being randomised to this group). | |
| Risk of bias | ||
| Bias | Authors' judgement | Support for judgement |
| Random sequence generation (selection bias) | Unclear risk | Not described |
| Allocation concealment (selection bias) | Unclear risk | Not described |
| Blinding of participants and personnel (performance bias) All outcomes | Unclear risk | Not described |
| Blinding of outcome assessment (detection bias) All outcomes | Unclear risk | Not described |
| Incomplete outcome data (attrition bias) All outcomes | Unclear risk | Not described |
| Selective reporting (reporting bias) | Unclear risk | No protocol could be obtained, and the trial did not report mortality or serious adverse events. |
| For‐profit bias | Low risk | The trial was funded by the Veterans Affairs Administration. |
| Other bias | Low risk | The trial appeared to be free of other components that could put it at risk of bias. |
Wood 1989b.
| Methods | Randomised clinical trial, USA | |
| Participants | 55 hospitalised adult men undergoing routine major surgery, at nutritional risk due to major surgery Male:Female = 55:0 Mean age = 54 years Exclusion criteria: none stated |
|
| Interventions | Experimental group 1: total parenteral nutritionTPN (90 g of crystalline amino acids, 3,000 calories as glucose pera day) from 2 weeks prior to surgery until 1 week after surgery. (n = 10)
Experimental group 2: parenteral nutrition 90 g amino acids pera day (n = 15) Experimental group 3: parenteral nutrition: peripheral parenteral nutrition (90 g amino acids plus 1,600 calories, 60% percent as fat pera day).(n =15) Control group: treatment as usual (100 g glucose) (n = 15) |
|
| Outcomes | Nitrogen balance, maintenance of body cell mass, serum albumin levels, exercise capacity | |
| Study dates | Not stated | |
| Notes | Group 1 could not be used in the analysis, since this group was not properly randomised (they had to have a certain degree of malnutrition, before being randomised to this group). | |
| Risk of bias | ||
| Bias | Authors' judgement | Support for judgement |
| Random sequence generation (selection bias) | Unclear risk | Not described |
| Allocation concealment (selection bias) | Unclear risk | Not described |
| Blinding of participants and personnel (performance bias) All outcomes | Unclear risk | Not described |
| Blinding of outcome assessment (detection bias) All outcomes | Unclear risk | Not described |
| Incomplete outcome data (attrition bias) All outcomes | Unclear risk | Not described |
| Selective reporting (reporting bias) | Unclear risk | No protocol could be obtained, and the trial did not report mortality or serious adverse events. |
| For‐profit bias | Low risk | The trial was funded by the Veterans Affairs Administration. |
| Other bias | Low risk | The trial appeared to be free of other components that could put it at risk of bias. |
Woolfson 1989.
| Methods | Randomised clinical trial, UK | |
| Participants | 122 hospitalised adults with major thoracal/abdominal surgery Male:Female = 86:36 Mean age= 62.5 years Exclusion criteria: Unable to give consent (or refused), chronic renal or hepatic disease, diabetes mellitus requiring regular insulin treatment. Any use of systemic corticosteroids in the month prior to operation |
|
| Interventions | Experimental group: Parenteral nutrition (Glucose: 9.2 g/kg previous body weight/24 hrs (35 kcal/kg/24 hrs); Amino‐acids as FreAmine II*: (1 mg amino‐acid N/175 kcal/non‐N energy); Intralipid 20%: 500 ml on days 2 and 5; Sodium: 150 mmol/24 hrs plus replacement of any significant extra‐renal losses.
Potassium: 50 mmol/24 hrs, plus 5 mmol/g N, plus replacement of any significant extra‐renal losses. Phosphate: 30 mmo1/24 hrs. Micronutrients: Addamel* 1 ampoule/day Solvito* 1 ampoule/day Folate 5 mg/day Vitlipid* 1 ampoule/bottle Intralipid. Water: The total volume was made up to 2.5 ‐ 3 L according to clinical indications. This was kept constant during the study period.
Any other solutions (non‐nutrient) were allowed at the discretion of the surgical team, and were recorded if given. (n = 62) Control group: The basic solutions used in each participant were 1000 ml 0.9”” saline, and 2000 ml 5’j, glucose. All the other electrolytes and additives were given, calculated as if the participants were being fed. (n = 60) |
|
| Outcomes | Any death, duration of hospital stay, complications, weight, anastomotic leakage, triceps skinfold, general progress, arm muscle circumference | |
| Study dates | Not stated | |
| Notes | We could find no contact information for the authors. | |
| Risk of bias | ||
| Bias | Authors' judgement | Support for judgement |
| Random sequence generation (selection bias) | Low risk | Random‐numbers table |
| Allocation concealment (selection bias) | Unclear risk | Short block sequence made it unclear if the investigators could foresee the allocation sequence. |
| Blinding of participants and personnel (performance bias) All outcomes | Unclear risk | Although there was blinding the administration of Intralipid was not sufficiently described. |
| Blinding of outcome assessment (detection bias) All outcomes | Unclear risk | The assessment was blinded but it was not stated who did the calculations and analyses and if they were blinded. |
| Incomplete outcome data (attrition bias) All outcomes | High risk | There were above 5% missing data for weight and the trial did not account for the missing data. |
| Selective reporting (reporting bias) | Low risk | All clinical relevant outcomes were reported, despite no protocol published. |
| For‐profit bias | High risk | Funded by Boots UK. |
| Other bias | Low risk | The trial appeared to be free of other components that could put it at risk of bias. |
Wu 2007a.
| Methods | Randomised clinical trial, China | |
| Participants | 646 hospitalised adults with gastrointestinal cancer, at nutritional risk due to gastro‐colorectal surgery Male:Female = 366:280 Mean age = 62 years Exclusion criteria: severe liver function damage (Child.Pugh class > B), severe impairment of renal function (serum creatinine > 265.2 mol/L or needed haemodialysis), severe respiratory dysfunction (arterial PaO2 < 70 mmHg), severe impairment of cardiac function (NYHA class > 3), already infected, (temperature > 37.6 °, WBC > 11.0 x 10⁹/L or bacteraemia), immune deficiency or damage (after radiotherapy or chemotherapy or WBC < 2.0 × 10⁹/L) |
|
| Interventions | Experimental group: Group 1: enteral nutrition of 125.5 kJ (30 cal)/(kg/day), 0.25 g/(kg/day) nitrogen. The course of the treatment was 7 days. (n = 215) Group 2: parenteral nutrition of 125.5 kJ (30 cal)/(kg/day), 0.25 g/(kg/day) nitrogen, electrolyte, microelements and vitamins. The course of the treatment was 7 days. (n = 215) Control group: Conventional fluid infusion (5% and 10% glucose and electrolytes) until they resumed normal eating ( 43.9 ˜ 13.4) kJ (10.5 ˜ 3.2) kcal/(kg/day). The course of the treatment was unclear. (n = 216) |
|
| Outcomes | Triceps folds, forearm midpoint circumference, body weight, albumin, transferrin, blood biochemistry, liver function and the calculation of nitrogen balance. Postoperative complications, mortality, serious adverse events, morbidity, postoperative length of hospital stay and weight change | |
| Study dates | Not stated | |
| Notes | Same as Wu 2007b, but with group 1 vs control. We found no contact information for the authors. | |
| Risk of bias | ||
| Bias | Authors' judgement | Support for judgement |
| Random sequence generation (selection bias) | Low risk | The sequence generation was achieved using computer random‐number generator. |
| Allocation concealment (selection bias) | Unclear risk | Not described |
| Blinding of participants and personnel (performance bias) All outcomes | High risk | Participants and personnel were not blinded. |
| Blinding of outcome assessment (detection bias) All outcomes | Unclear risk | Not described |
| Incomplete outcome data (attrition bias) All outcomes | Unclear risk | The number of participants with incomplete data was not reported. |
| Selective reporting (reporting bias) | Unclear risk | No protocol could be obtained. |
| For‐profit bias | Unclear risk | It was unclear how the trial was funded. |
| Other bias | Low risk | The trial appeared to be free of other components that could put it at risk of bias. |
Wu 2007b.
| Methods | Randomised clinical trial, China | |
| Participants | 725 hospitalised adults with gastro‐intestinal cancer, at nutritional risk due to gastro‐colorectal surgery Male:Female = 366:280 Mean age = 62 years Exclusion criteria: severe liver function damage (Child.Pugh class > B), severe impairment of renal function (serum creatinine > 265.2 mol/L or need haemodialysis), severe respiratory dysfunction (arterial PaO2 < 70 mmHg), severe impairment of cardiac function (NYHA class > 3), already infected (temperature > 37.6 °, WBC > 11.0 x 10⁹/L or bacteraemia), immune deficiency or damage (after radiotherapy or chemotherapy or WBC < 2.0 × 10⁹/L) |
|
| Interventions | Experimental group: Group 1:Enteral nutrition of 125.5 kJ (30 cal)/(kg/day), 0,25 g/(kg/day) nitrogen. The course of the treatment was 7 days. (n = 215) Group 2: parenteral nutrition of 125.5 kJ (30 cal)/(kg/day), 0.25 g/(kg/day) nitrogen, electrolyte, microelements and vitamins. The course of the treatment was 7 days. (n = 215) Control group: Conventional fluid infusion (5% and 10% glucose and electrolytes) until resume normal eating (43.9 ˜ 13.4) kJ (10.5 ˜ 3.2) kcal/(kg/day). The course of the treatment was unclear. (n = 216) |
|
| Outcomes | Triceps folds, forearm midpoint circumference, body weight, albumin, transferrin, blood biochemistry, liver function and the calculation of nitrogen balance. Postoperative complications, mortality, serious adverse events, morbidity, postoperative length of hospital stay and weight change | |
| Study dates | Not stated | |
| Notes | Same as Wu 2007a, but with group 2 vs control | |
| Risk of bias | ||
| Bias | Authors' judgement | Support for judgement |
| Random sequence generation (selection bias) | Low risk | The sequence generation was achieved using computer random‐number generator. |
| Allocation concealment (selection bias) | Unclear risk | Not described |
| Blinding of participants and personnel (performance bias) All outcomes | High risk | Participants and personnel were not blinded. |
| Blinding of outcome assessment (detection bias) All outcomes | Unclear risk | Not described |
| Incomplete outcome data (attrition bias) All outcomes | Unclear risk | The number of participants with incomplete data was not reported. |
| Selective reporting (reporting bias) | Unclear risk | No protocol could be obtained. |
| For‐profit bias | Unclear risk | It was unclear how the trial was funded. |
| Other bias | Low risk | The trial appeared to be free of other components that could put it at risk of bias. |
Xie 2014.
| Methods | Randomised clinical trial, China. | |
| Participants | 120 hospitalised adults, at nutritional risk due to being frail elderly with hip fracture Male:Female = 66:54 Mean age = 69 Exclusion criteria: Not stated |
|
| Interventions | Experimental group: Received early enteral nutrition. Stomach tube was inserted within 24 ‐ 48 hrs after surgery, and a small dose of fluid diet was given. If there was no obvious gastric retention, the diet was provided 48 hrs after surgery, started with ¼ of required volume, and increased by ¼ volume, so that at the 6 ‐ 7‐day the intake reached full volume, i.e. 2500 mL ± 500 mL. (n = 60) Control group: No treatment (n = 60) Co‐intervention: Intravenous drip of Esomeprazole 40 mg + saline 100 ml, twice a day |
|
| Outcomes | Gastric juice PH, gastroscopic mucosa pathological variation, albumin, pre‐albumin, total protein, weight, digestive complications and adverse events | |
| Study dates | Not stated | |
| Notes | We tried and failed to contact the authors by phone and by email: 1339946939@qq.com. | |
| Risk of bias | ||
| Bias | Authors' judgement | Support for judgement |
| Random sequence generation (selection bias) | Unclear risk | Not described |
| Allocation concealment (selection bias) | Unclear risk | Not described |
| Blinding of participants and personnel (performance bias) All outcomes | High risk | Participants and personnel were not blinded. |
| Blinding of outcome assessment (detection bias) All outcomes | Unclear risk | Not described |
| Incomplete outcome data (attrition bias) All outcomes | Unclear risk | The number of participants with incomplete data was not reported. |
| Selective reporting (reporting bias) | Unclear risk | We found no protocol and the trial did not report serious adverse events or all‐cause mortality. |
| For‐profit bias | Unclear risk | It was unclear how the trial was funded. |
| Other bias | Low risk | The trial appeared to be free of other components that could put it at risk of bias. |
Xu 1998a.
| Methods | Randomised clinical trial, China | |
| Participants | 32 hospitalised elderly adults admitted for gastro‐oesophageal, small intestine, colorectal surgery, at nutritional risk due to major surgery Male:Female = 19:13 Mean age = 67.6 years Exclusion criteria: none stated |
|
| Interventions | Experimental group: Parenteral nutrition of 104.5 ˜ 146.4 kJ/(kg/day), 0.15 ˜ 0.24 g/(kg/day) nitrogen, 10% KCL 30 ml, 10% NaCL 40 ml, glucose, vitamin and exogenous insulin. The course of treatment was 7 days. (n = 16) Control group: conventional fluid infusion (the detailed composition of conventional fluid infusion and treatment course were unclear) (n = 16) |
|
| Outcomes | Body weight, 24‐hr urinary nitrogen excretion, serum albumin, siderophilin, pre‐albumin, total lymphocyte count, nitrogen balance and morbidity | |
| Study dates | Not stated | |
| Notes | We found no contact information for the authors. | |
| Risk of bias | ||
| Bias | Authors' judgement | Support for judgement |
| Random sequence generation (selection bias) | Unclear risk | Not described |
| Allocation concealment (selection bias) | Unclear risk | Not described |
| Blinding of participants and personnel (performance bias) All outcomes | High risk | Participants and personnel were not blinded. |
| Blinding of outcome assessment (detection bias) All outcomes | Unclear risk | Not described |
| Incomplete outcome data (attrition bias) All outcomes | Unclear risk | The number of participants with incomplete data was not reported. |
| Selective reporting (reporting bias) | High risk | The outcomes stated in the protocol are not reported. |
| For‐profit bias | Unclear risk | It was unclear how the trial was funded. |
| Other bias | Low risk | The trial appeared to be free of other components that could put it at risk of bias. |
Xu 2003.
| Methods | Randomised clinical trial, China | |
| Participants | 40 hospitalised adults with oesophageal cancer, at nutritional risk due to gastroenterologic surgery Male:Female = 28:12 Mean age = 45.6 years Exclusion criteria: abnormal function or disorder of the liver and kidney, metabolic disease |
|
| Interventions | Experimental group: Nutrison Fibre enteral nutrition. Started on the 1st day after the surgery. The course of the treatment was unclear. (n = 20) Control group: Traditional Nutrison Fibre enteral nutrition. Started when the intestinal function began to recover. The course of the treatment was unclear. (n = 20) |
|
| Outcomes | All‐cause mortality, serious adverse events, biomarkers, vital signs, recovery of gastrointestinal function and morbidity | |
| Study dates | Not stated | |
| Notes | We could find no contact information for the authors. | |
| Risk of bias | ||
| Bias | Authors' judgement | Support for judgement |
| Random sequence generation (selection bias) | Unclear risk | Not described |
| Allocation concealment (selection bias) | Unclear risk | Not described |
| Blinding of participants and personnel (performance bias) All outcomes | High risk | Participants and personnel were not blinded. |
| Blinding of outcome assessment (detection bias) All outcomes | Unclear risk | Not described |
| Incomplete outcome data (attrition bias) All outcomes | Unclear risk | The number of participants with incomplete data was not reported. |
| Selective reporting (reporting bias) | Unclear risk | No protocol could be obtained, but the trial reported on all‐cause mortality and serious adverse events. |
| For‐profit bias | Unclear risk | It was unclear how the trial was funded. |
| Other bias | Low risk | The trial appeared to be free of other components that could put it at risk of bias. |
Yamada 1983.
| Methods | Randomised clinical trial, Japan | |
| Participants | 34 hospitalised adults who had undergone gastrectomy, at nutritional risk due to major abdominal surgery Male:Female = Not described Exclusion criteria: older than 70 |
|
| Interventions | Experimental group: TPN (24% glucose and 12% crystalline amino acids) with appropriate amounts of salts and minerals started on the 4th day after the surgery and continued for 14 days(n = 18)
Control group: no intervention (n = 16) Co‐interventions: 5‐Fluorouracil, no oral restriction |
|
| Outcomes | Mortality, complications, weight, serum values | |
| Study dates | ||
| Notes | We found no contact information for the authors. | |
| Risk of bias | ||
| Bias | Authors' judgement | Support for judgement |
| Random sequence generation (selection bias) | Unclear risk | Not described |
| Allocation concealment (selection bias) | Unclear risk | Not described |
| Blinding of participants and personnel (performance bias) All outcomes | Unclear risk | Not described |
| Blinding of outcome assessment (detection bias) All outcomes | Unclear risk | Not described |
| Incomplete outcome data (attrition bias) All outcomes | Low risk | No incomplete data |
| Selective reporting (reporting bias) | Low risk | No protocol could be obtained but the trial did report all‐cause mortality and major complications. |
| For‐profit bias | Low risk | Supported by grants by the Japanese Ministry of Health and Welfare. |
| Other bias | Low risk | The trial appears to be free of other components that could put it at risk of bias. |
Yang 1996.
| Methods | Randomised clinical trial, China | |
| Participants | 21 hospitalised adults with gastric ulcer and cancer, at nutritional risk due to gastric surgery Male:Female = 13:8 Mean age = 48.9 years Exclusion criteria: not stated |
|
| Interventions | Experimental group: from the 1st day after operation, the participants received Nutrison enteral nutrition (418 kJ calorie, 4.0 g protein, 3.9 g fat, 12.3 g carbohydrate per 100 ml). The intake was 500 ml at the beginning and increased with 500 ml a day, until it reached 2000 ml/day. The course of the treatment was 7 days. (n = 11) Control group: No intervention Liquid diet was started on the 3rd ˜ 5th day. (n = 10) Co‐interventions: Conventional fluid infusion to maintain water, electrolyte balance. Blood transfusion was given as needed. |
|
| Outcomes | Serious adverse events, morbidity, urea nitrogen, nitrogen balance, plasma protein, T cell subsets and NK cell activity were calculated, body weight | |
| Study dates | Not stated | |
| Notes | We found no contact information for the authors. | |
| Risk of bias | ||
| Bias | Authors' judgement | Support for judgement |
| Random sequence generation (selection bias) | Unclear risk | Not described |
| Allocation concealment (selection bias) | Unclear risk | Not described |
| Blinding of participants and personnel (performance bias) All outcomes | High risk | Participants and personnel were not blinded. |
| Blinding of outcome assessment (detection bias) All outcomes | Unclear risk | Not described |
| Incomplete outcome data (attrition bias) All outcomes | Low risk | The numbers and reasons for the withdrawals and dropouts were clearly stated. |
| Selective reporting (reporting bias) | Unclear risk | No protocol could be obtained. The trial reported on serious adverse events. |
| For‐profit bias | Unclear risk | It was unclear how the trial was funded. |
| Other bias | Low risk | The trial appeared to be free of other components that could put it at risk of bias. |
Yie 1996.
| Methods | Randomised clinical trial, China | |
| Participants | 83 hospitalised adults with carcinoma of oesophagus and cardia, at nutritional risk due to gastro‐oesophageal surgery Male:Female = 59:24 Mean age = 55 years Exclusion criteria: Heart, lung, liver, kidney or endocrine diseases |
|
| Interventions | Experimental group: Group 2: Based on the conventional treatment, enteral nutrition (homemade homogenate liquid made of: rice, lean meat, egg, carrot, milk powder, sugar, etc.) was started from the 5th ˜ 6th day after the surgery. The treatment course was about 6 to 10 days (average 7 days). The average calorie supply was 3562 KJ. (n = 16) Control group: conventional fluid infusion through peripheral vein from the 1st day after surgery; the liquid volume was about 3000 ml; the calories were about 3562 KJ (n = 37) |
|
| Outcomes | Reduced weight/ideal body weight, BMI, morbidity and the times of stool after EN | |
| Study dates | Not stated | |
| Notes | We did not include group 1 as the experimental group received an elemental diet. We found no contact information for the authors. | |
| Risk of bias | ||
| Bias | Authors' judgement | Support for judgement |
| Random sequence generation (selection bias) | Unclear risk | Not described |
| Allocation concealment (selection bias) | Unclear risk | Not described |
| Blinding of participants and personnel (performance bias) All outcomes | High risk | Participants and personnel were not blinded. |
| Blinding of outcome assessment (detection bias) All outcomes | Unclear risk | Not described |
| Incomplete outcome data (attrition bias) All outcomes | Unclear risk | The number of participants with incomplete data was not reported. |
| Selective reporting (reporting bias) | Unclear risk | No protocol could be obtained. |
| For‐profit bias | Unclear risk | It was unclear how the trial was funded. |
| Other bias | Low risk | The trial appeared to be free of other components that could put it at risk of bias. |
Yin 1994.
| Methods | Randomised clinical trial, China. | |
| Participants | 25 hospitalised adults with advanced gastric cancer and undergoing surgery, at nutrition risk due to having major surgery Male:Female = 13:12 Mean age = 61 years |
|
| Interventions | Experimental group: participants received intravenous nutrition through vein catheterisation 5 days before the operation. The amount of nitrogen was 0.15 g/kg/day, and non‐protein calorie 28 kcal/kg/day, added with insuline, potassium chloride and moderate vitamins and microelements. (n = 6) Control group: no intervention (n = 6) Co‐interventions: chemotherapy |
|
| Outcomes | Serum pre‐albumin, transferrin, NK and LAK cell viability and FCM analysis | |
| Study dates | Not stated | |
| Notes | We tried but failed to contact the authors by phone. | |
| Risk of bias | ||
| Bias | Authors' judgement | Support for judgement |
| Random sequence generation (selection bias) | Unclear risk | Not described |
| Allocation concealment (selection bias) | Unclear risk | Not described |
| Blinding of participants and personnel (performance bias) All outcomes | High risk | Participants and personnel were not blinded. |
| Blinding of outcome assessment (detection bias) All outcomes | Unclear risk | Not described |
| Incomplete outcome data (attrition bias) All outcomes | Unclear risk | The number of participants with incomplete data was not reported. |
| Selective reporting (reporting bias) | Unclear risk | No protocol could be obtained and the trial did not report on all‐cause mortality or serious adverse events. |
| For‐profit bias | Unclear risk | It was unclear how the trial was funded. |
| Other bias | Low risk | The trial appeared to be free of other components that could put it at risk of bias. |
Young 1989a.
| Methods | Randomised clinical trial, UK | |
| Participants | 30 hospitalised adults with gastro‐intestinal neoplasms, at nutritional risk due to having lost more than 5 kg of weight over the last 3 months Male:Female = 21:9 Mean age = 65 years |
|
| Interventions | Experimental group: Group A) IVN for 3 days (0.18 g N/kg/day as amino acid; 30 kcal/kg/day as glucose)(n = 10) Group B) IVN for 7 days (n = 10) Control group: Standard hospital diet (n = 10) |
|
| Outcomes | Plasma proteins, plasma amino acids, liver protein synthesis rate | |
| Study dates | Not stated | |
| Notes | Same trial as Young 1989b with the results from experimental Group (A) vs control. We could obtain no contact information for the authors. | |
| Risk of bias | ||
| Bias | Authors' judgement | Support for judgement |
| Random sequence generation (selection bias) | Unclear risk | Not described |
| Allocation concealment (selection bias) | Unclear risk | Not described |
| Blinding of participants and personnel (performance bias) All outcomes | Unclear risk | Not described |
| Blinding of outcome assessment (detection bias) All outcomes | Unclear risk | Not described |
| Incomplete outcome data (attrition bias) All outcomes | Unclear risk | The number of participants with incomplete data was not reported. |
| Selective reporting (reporting bias) | High risk | No protocol could be obtained and the trial did not report on all‐cause mortality or serious adverse events. |
| For‐profit bias | Unclear risk | It was unclear how the trial was funded. |
| Other bias | Low risk | The trial appeared to be free of other components that could put it at risk of bias. |
Young 1989b.
| Methods | Randomised clinical trial, UK | |
| Participants | 30 hospitalised adults with gastro‐intestinal neoplasms, at nutritional risk due to having lost more than 5 kg of weight over the last 3 months Male:Female = 21:9 Mean age = 65 years |
|
| Interventions | Experimental group: Group A) IVN for 3 days (0.18 g N/kg/day as amino acid; 30 kcal/kg/day as glucose) (n = 10) Group B) IVN for 7 days (n = 10) Control group: Standard hospital diet (n = 10) |
|
| Outcomes | Plasma proteins, plasma amino acids, liver protein synthesis rate | |
| Study dates | Not stated | |
| Notes | Same trial as Young 1989a with the results from experimental Group (B) vs control | |
| Risk of bias | ||
| Bias | Authors' judgement | Support for judgement |
| Random sequence generation (selection bias) | Unclear risk | Not described |
| Allocation concealment (selection bias) | Unclear risk | Not described |
| Blinding of participants and personnel (performance bias) All outcomes | Unclear risk | Not described |
| Blinding of outcome assessment (detection bias) All outcomes | Unclear risk | Not described |
| Incomplete outcome data (attrition bias) All outcomes | Unclear risk | The number of participants with incomplete data was not reported. |
| Selective reporting (reporting bias) | Unclear risk | No protocol could be obtained and the trial did not report on all‐cause mortality or serious adverse events. |
| For‐profit bias | Unclear risk | It was unclear how the trial was funded. |
| Other bias | Low risk | The trial appeared to be free of other components that could put it at risk of bias. |
Zareba 2013a.
| Methods | Randomised clinical trial, Poland | |
| Participants | 75 hospitalised adults undergoing elective gastric and large intestine cancer surgery, at nutritional risk due to major surgery Male:Female = 38:37 Mean age = 66 years Exclusion: frank diabetes; preoperatively‐diagnosed resistance to insulin; stomach emptying disorders, undernourishment (according to SGA and NRS 2002) |
|
| Interventions | Experimental group: Group II: 25 participants who received an “all in one” type of TPN for 5 days prior to surgical procedure. The mixture contained carbohydrates (glucose solutions), lipids (lipid emulsions) and amino acid solutions. Vitamins, 10% NaCl‐20ml, 15% KCl‐10ml, 20% MgSO4‐4ml and microelements were added to the TPN bag. Total energy value was 10 kcal/kg of body weight. (n = 25) Control group: Received no preparations influencing the perioperative insulin resistance level (n = 25) Co‐intervention: They had standard hospital meals for 4 days prior to the surgery. |
|
| Outcomes | Insulin resistance level | |
| Study dates | "Between 2008‐2009" | |
| Notes | Same trial as Zareba 2013b but with group I vs II We contacted the authors on 25th September 2015 by email: nikt00@gazeta.pl. We received no reply. | |
| Risk of bias | ||
| Bias | Authors' judgement | Support for judgement |
| Random sequence generation (selection bias) | Unclear risk | Not described |
| Allocation concealment (selection bias) | Unclear risk | Not described |
| Blinding of participants and personnel (performance bias) All outcomes | High risk | Trial was not blinded. |
| Blinding of outcome assessment (detection bias) All outcomes | High risk | Trial was not blinded |
| Incomplete outcome data (attrition bias) All outcomes | Unclear risk | The number of participants with incomplete data was not reported. |
| Selective reporting (reporting bias) | Unclear risk | No protocol could be obtained and the trial did not report on all‐cause mortality or serious adverse events. |
| For‐profit bias | Unclear risk | It was unclear how the trial was funded. |
| Other bias | Low risk | The trial appeared to be free of other components that could put it at risk of bias. |
Zareba 2013b.
| Methods | Randomised clinical trial, Poland | |
| Participants | 75 hospitalised adults undergoing elective gastric and large intestine cancer surgery, at nutritional risk due to major surgery Male:Female = 38:37 Mean age = 66 years Exclusion: frank diabetes; preoperatively‐diagnosed resistance to insulin; stomach emptying disorders, undernourishment (according to SGA and NRS 2002) |
|
| Interventions | Experimental group: Group III: 25 participants who received standard hospital diet and TPN (with the same ingredients and energy value as in group II), as well as prior to the surgery; oral preoperative preparation. The evening before the surgery, the participants were given 800 ml of the preparation and 400 ml again on the actual day of the surgery (but no later than 2 hours prior to the start of surgery) (n = 25) Control group: Received no preparations influencing the perioperative insulin resistance level (n = 25) Co‐intervention: They had standard hospital meals for 4 days prior to the surgery. |
|
| Outcomes | Insulin resistance level | |
| Study dates | "Between 2008‐2009" | |
| Notes | Same trial as Zareba 2013a but with group I vs III. We contacted the authors on 25th September 2015 by email: nikt00@gazeta.pl. We received no reply. | |
| Risk of bias | ||
| Bias | Authors' judgement | Support for judgement |
| Random sequence generation (selection bias) | Unclear risk | Not described |
| Allocation concealment (selection bias) | Unclear risk | Not described |
| Blinding of participants and personnel (performance bias) All outcomes | High risk | Trial was not blinded. |
| Blinding of outcome assessment (detection bias) All outcomes | High risk | Trial was not blinded. |
| Incomplete outcome data (attrition bias) All outcomes | Unclear risk | The number of participants with incomplete data was not reported. |
| Selective reporting (reporting bias) | Unclear risk | No protocol could be obtained and the trial did not report all‐cause mortality or serious adverse events. |
| For‐profit bias | Unclear risk | It was unclear how the trial was funded. |
| Other bias | Low risk | The trial appeared to be free of other components that could put it at risk of bias. |
Zeiderman 1989a.
| Methods | Randomised clinical trial, UK | |
| Participants | 30 hospitalised adults undergoing elective resection of a gastrointestinal cancer who had lost more than 5 kg in weight over the previous 3 months, at nutritional risk due to a weight loss of 5% during the last 3 months Male:Female = 21:9 Mean age = 69 years Exclusion criteria: weight loss of < 5 kg in the 3 months prior to admission or uncertainty about change in body weight |
|
| Interventions | Experimental group 1: Intravenous nutrition for 3 days before operation. The feeding regimen consisted of glucose infused at a rate of 126 kJ/kg body weight/day and amino acids (FreAmine III, Boots Co. plc, Nottingham, UK) infused at 0.18 g nitrogen/kg/24 hrs (1 g protein/kg/day). In addition, 10 ml of multivitamin solution (Multibionta, E. Merck, Hampshire, UK) and 5 ml of trace element solution (Pharmacy Department, Leeds General Infirmary) were infused daily. Electrolytes were provided as required, according to daily measurements of the plasma concentrations. In order to replete essential fatty acids, and in keeping with the standard hospital regimen, fat emulsion (500 ml of 20% ‘Intralipid’, KabiVitrum, Ealing, UK) was given on the 1st day only, with an equicaloric reduction in the amount of glucose provided. (n = 10)
Control group: no intervention (n = 10) Co‐interventions: Hospital diet (HD group): free access to routine diet for 7 days before operation |
|
| Outcomes | Weight, height, mid‐arm circumference and hand‐grip strength. Skin‐fold thickness was measured at 3 sites (biceps, triceps and subcapsular). Haematological and immunological variables. Biochemical determinations. Preoperative determination of protein synthetic rate in vitro | |
| Study dates | Not stated | |
| Notes | Same as Zeiderman 1989a, comparing experimental group 1 and control group. We could obtain no contact information for the authors. | |
| Risk of bias | ||
| Bias | Authors' judgement | Support for judgement |
| Random sequence generation (selection bias) | Unclear risk | Not described |
| Allocation concealment (selection bias) | Unclear risk | Not described |
| Blinding of participants and personnel (performance bias) All outcomes | Unclear risk | Not described |
| Blinding of outcome assessment (detection bias) All outcomes | Unclear risk | Not described |
| Incomplete outcome data (attrition bias) All outcomes | Unclear risk | The number of participants with incomplete data was not reported. |
| Selective reporting (reporting bias) | Unclear risk | No protocol could be obtained and the trial did not report on all‐cause mortality or serious adverse events. |
| For‐profit bias | High risk | The trial was supported by Boots Company PLC. |
| Other bias | Low risk | The trial appeared to be free of other components that could put it at risk of bias. |
Zeiderman 1989b.
| Methods | Randomised clinical trial, UK | |
| Participants | 30 hospitalised adults undergoing elective resection of a gastrointestinal cancer who had lost more than 5 kg in weight over the previous 3 months, at nutritional risk due to a weight loss of 5% during the last 3 month.
Male:Female = 21:9 Mean age = 69 years Exclusion criteria: Weight loss of < 5 kg in the 3 months prior to admission or uncertainty about change in body weight |
|
| Interventions | Experimental group 2: Intravenous nutrition for 7 days before operation. The feeding regimen consisted of glucose infused at a rate of 126 kJ/kg body weight/day and amino acids (FreAmine III, Boots Co. plc, Nottingham, UK) infused at 0.18 g nitrogen/kg/24 hrs (1 g protein/kg/day). In addition, 10 ml of multivitamin solution (Multibionta, E. Merck, Hampshire, UK) and 5 ml of trace element solution (Pharmacy Department, Leeds General Infirmary) were infused daily. Electrolytes were provided as required, according to daily measurements of the plasma concentrations. In order to replete essential fatty acids, and in keeping with the standard hospital regimen, fat emulsion (500 ml of 20% ‘Intralipid’, KabiVitrum, Ealing, UK) was given on the 1st day only, with an equicaloric reduction in the amount of glucose provided. (n = 10)
Control group: no intervention(n = 10) Co‐interventions: Hospital diet (HD group): free access to routine diet for 7 days before operation |
|
| Outcomes | Weight, height, mid‐arm circumference and hand‐grip strength. Skin‐fold thickness was measured at 3 sites (biceps, triceps and subcapsular). Haematological and immunological variables. Biochemical determinations. Preoperative determination of protein synthetic rate in vitro | |
| Study dates | Not stated | |
| Notes | Same as Ziederman 1989a, comparing experimental group 2 and control group | |
| Risk of bias | ||
| Bias | Authors' judgement | Support for judgement |
| Random sequence generation (selection bias) | Unclear risk | Not described |
| Allocation concealment (selection bias) | Unclear risk | Not described |
| Blinding of participants and personnel (performance bias) All outcomes | Unclear risk | Not described |
| Blinding of outcome assessment (detection bias) All outcomes | Unclear risk | Not described |
| Incomplete outcome data (attrition bias) All outcomes | Unclear risk | The number of participants with incomplete data was not reported. |
| Selective reporting (reporting bias) | Unclear risk | No protocol could be obtained and the trial did not report on all‐cause mortality or serious adverse events. |
| For‐profit bias | High risk | The trial was supported by Boots Company PLC. |
| Other bias | Low risk | The trial appeared to be free of other components that could put it at risk of bias. |
Zelic 2012.
| Methods | Randomised clinical trial, Croatia | |
| Participants | 40 hospitalised adults with colon, upper rectal or rectosigmoid cancer undergoing surgery, at nutritional risk due to major abdominal surgery Male:Female = 24:16 Mean age = 69 years Exclusion criteria: Previous operations, metastatic disease, diabetes mellitus, BMI > 30, ASA grade III ‐ IV, conditions that might impair gastrointestinal motility, gastro‐oesophageal reflux, potential difficulty with airway management |
|
| Interventions | Experimental group: Carbohydrate‐rich beverage (12.5 g/100 mL carbohydrate, 12% monosaccharide, 12% disaccharides, 76% polysaccharides, 285 mosmol/k;Nutricia Preop; Numico, Zoetermeer, Netherlands) ingested 800 mL the evening before surgery and 400 mL 2 hours before surgery(n = 20) Control group: Standard preoperative regime(n = 20) | |
| Outcomes | IL‐10, IL‐6, morbidity | |
| Study dates | ||
| Notes | We contacted the authors on 14th October 2015 by email: zelicm@medri.hr. We received no reply. | |
| Risk of bias | ||
| Bias | Authors' judgement | Support for judgement |
| Random sequence generation (selection bias) | Unclear risk | The trial was described as being randomised but only stated that it used the "closed envelope technique". |
| Allocation concealment (selection bias) | Unclear risk | The trial was described as being randomised but only stated it used the "closed envelope technique". |
| Blinding of participants and personnel (performance bias) All outcomes | High risk | The trial stated it was blinded but "the investigator was informed of the allocation, being responsible for the preoperative information of the participants". |
| Blinding of outcome assessment (detection bias) All outcomes | Low risk | The trial gave the impression that the outcome assessors were blinded. |
| Incomplete outcome data (attrition bias) All outcomes | Unclear risk | The number of participants with incomplete data was not reported. |
| Selective reporting (reporting bias) | Unclear risk | There was no protocol and the trial did not report all‐cause mortality or serious adverse events. |
| For‐profit bias | Unclear risk | It was unclear how the trial was funded. |
| Other bias | Low risk | The trial appeared to be free of other components that could put it at risk of bias. |
Zhang 2013.
| Methods | Randomised clinical trial, China | |
| Participants | 100 hospitalised adults with viral hepatitis, and alcoholic liver disease, at nutritional risk according to the trialist. Male:Female = 80:20 Mean age = 49 years Exclusion criteria: Upper gastro‐intestinal haemorrhage within 2 weeks before admission, uncontrolled diabetes, malignant tumour, clinical manifestations of hepatic encephalopathy, clear infection, antiviral indications of hepatitis B cirrhosis in the prevention and treatment guidelines of chronic hepatitis (2010 version), but did not want to or could not receive nucleoside analogue antiviral treatment |
|
| Interventions | Experimental group: Enteral nutrition: Weekly recipes were prepared with 35 ˜ 40 kcal/(kg/day) , 1.2 ˜ 1.5 g/(kg/day) protein, 0.8 ˜ 1.2 g/(kg/day) amino acid and 350 ˜ 500 g/day carbohydrate. Additionally supplemented vitamins A, D, e, K, B and Se, were included on the 4th day in the daily meals. They were given yoghurt (or hot milk) of 100 ml and 15 g Noveliver compound protein granule (purchased from the Global Partner of Institute for Liver Cell Media, Myer Otec Co. California USA, which contained 18 kinds of amino acids including all essential amino acids, and folic acid, selenium, etc.) at bedtime. Nutrition intervention lasted for 4 weeks.(n = 50) Control group: Conventional diet(n = 50) Co‐interventions: Protecting liver therapy and antiviral therapy |
|
| Outcomes | Triceps skin fold, BMI, mid‐arm circumference, mid‐arm muscle circumference, self‐conscious symptoms, growth and decline of ascites, Albumin, pre‐albumin, cholinesterase, transaminase and bilirubin, blood coagulation index, HBV DNA and complications | |
| Study dates | Not stated | |
| Notes | We contacted the author by phone and received information on mortality, follow‐up length, and funding. | |
| Risk of bias | ||
| Bias | Authors' judgement | Support for judgement |
| Random sequence generation (selection bias) | Unclear risk | The author told us that he could not remember the specific method of randomisation. |
| Allocation concealment (selection bias) | Unclear risk | Not described |
| Blinding of participants and personnel (performance bias) All outcomes | High risk | Participants and personnel were not blinded. |
| Blinding of outcome assessment (detection bias) All outcomes | Unclear risk | Not described |
| Incomplete outcome data (attrition bias) All outcomes | Unclear risk | The number of participants with incomplete data was not reported. |
| Selective reporting (reporting bias) | Unclear risk | No protocol could be obtained and the trial did not report on all‐cause mortality or serious adverse events. |
| For‐profit bias | Low risk | The trial was funded by Major special projects of science and technology bureau of Changchun (10SF05). |
| Other bias | Low risk | The trial appeared to be free of other components that could put it at risk of bias. |
Zhao 2014.
| Methods | Randomised clinical trial, China | |
| Participants | 64 hospitalised adults with acute non‐lymphocytic leukaemia, at nutritional risk according to trialist indication Male:Female = not stated Mean age = 32.8 years Exclusion criteria: acute disease exacerbation; chronic diseases such as concomitant with diabetes, hypertension, liver and kidney dysfunction; concomitant with serious allergy and other immune system diseases; pregnant or lactating; within 6 months after surgery; end‐stage leukaemia |
|
| Interventions | Experimental group: Standard nutrition support provided to the participants with established nutrition risk (NRS‐2002 ≥ 3) during the next chemotherapy course. The participants should have high protein and high energy intake 3 days before and 1 week after chemotherapy, which was achieved with oral Enteral Nutritional Powder (TP) 40 g.
The nutrition support protocol of “allowable intake inadequacy” of relatively lower energy (80% of required energy) should consist of oral Enteral Nutritional Powder (TP) 30 g, twice a day, as supplementation.(n = 32) Control group: Standard hospital diet(n = 32) |
|
| Outcomes | Prealbumin, haemoglobin, red blood cell, albumin, total protein, BMI | |
| Study dates | Not stated | |
| Notes | We had trouble understanding the language in this trial, hence limited descriptions. We contacted the authors on 25th September 2015 by email: zhuzhiming6542@sina.com. We received no reply. | |
| Risk of bias | ||
| Bias | Authors' judgement | Support for judgement |
| Random sequence generation (selection bias) | Unclear risk | Not described |
| Allocation concealment (selection bias) | Unclear risk | Not described |
| Blinding of participants and personnel (performance bias) All outcomes | Unclear risk | Not described |
| Blinding of outcome assessment (detection bias) All outcomes | Unclear risk | Not described |
| Incomplete outcome data (attrition bias) All outcomes | Unclear risk | The number of participants with incomplete data was not reported. |
| Selective reporting (reporting bias) | Unclear risk | No protocol could be obtained and the trial did not report all‐cause mortality or serious adverse events. |
| For‐profit bias | Low risk | Trial was supported by the Creative Foundation of Navy General Hospital (CX201113). |
| Other bias | Low risk | The trial appeared to be free of other components that could put it at risk of bias. |
Zheng 2001a.
| Methods | Randomised clinical trial, China | |
| Participants | 135 hospitalised adults with chronic damage in hepatic function receiving surgical treatment, at nutritional risk according to trialist classification. Male:Female = not reported Mean age = unknown Exclusion criteria: No other diease except the primary disease affecting the metabolism |
|
| Interventions | Experimental group: In the EN group, Nutrison Fibre was selected. After the participants had received PN for 2 days EN was started on the 3rd day post‐operatively through the jejunostomy tube. 1st day was given 500 mL Nutrison fibre. If there was no malaise, 500 mL dose would be increased each day until the volume of 1500 mL/day was reached, while the PN was decreased until it was substituted by EN. This dose was given for at least 7 days. (n = 30)(n = 10) | |
| Outcomes | Lactulose/mannitol ratio, weight, circumference of upper arm, liver function, kidney function and electrolyte markers | |
| Study dates | Not stated | |
| Notes | Same trial as Zheng 2001b but with the enteral group. We could obtain no contact information for the authors. | |
| Risk of bias | ||
| Bias | Authors' judgement | Support for judgement |
| Random sequence generation (selection bias) | Unclear risk | Not described |
| Allocation concealment (selection bias) | Unclear risk | Not described |
| Blinding of participants and personnel (performance bias) All outcomes | Unclear risk | Not described |
| Blinding of outcome assessment (detection bias) All outcomes | Unclear risk | Not described |
| Incomplete outcome data (attrition bias) All outcomes | Low risk | There was only 1 dropout. |
| Selective reporting (reporting bias) | Unclear risk | No protocol could be obtained and the trial did not report all‐cause mortality or serious adverse events. |
| For‐profit bias | Unclear risk | It was unclear how the trial was funded. |
| Other bias | Low risk | The trial appeared to be free of other components that could put it at risk of bias. |
Zheng 2001b.
| Methods | Randomised clinical trial, China | |
| Participants | 76 hospitalised adults with chronic damage in hepatic function receiving surgical treatment, at nutritional risk according to trialist classification Male:female = Mean age = unknown |
|
| Interventions | Experimental group: In the PN group the participants received 30 kcal/kg/day and 0.16 g N/kg/day. 25 ‐ 33% of nonprotein calories were fat and the remainder was given as carbohydrates. The solution was given through a peripheral vein from day 1 until at least day 7 (n = 26). Control group: No nutritional support(n = 10) |
|
| Outcomes | Lactulose/mannitol ratio, weight, circumference of upper arm, liver function, kidney function and electrolyte markers | |
| Study dates | Not stated | |
| Notes | Same trial as Zheng 2001a but with the parenteral group | |
| Risk of bias | ||
| Bias | Authors' judgement | Support for judgement |
| Random sequence generation (selection bias) | Unclear risk | Not described |
| Allocation concealment (selection bias) | Unclear risk | Not described |
| Blinding of participants and personnel (performance bias) All outcomes | Unclear risk | Not described |
| Blinding of outcome assessment (detection bias) All outcomes | Unclear risk | Not described |
| Incomplete outcome data (attrition bias) All outcomes | Low risk | There was only 1 dropout. |
| Selective reporting (reporting bias) | Unclear risk | No protocol could be obtained and the trial did not report all‐cause mortality or serious adverse events. |
| For‐profit bias | Unclear risk | It was unclear how the trial was funded. |
| Other bias | Low risk | The trial appeared to be free of other components that could put it at risk of bias. |
Zheng 2015.
| Methods | Randomised clinical trial, China | |
| Participants | 146 hospitalised adult with acute stroke, at nutritional risk according to the trialist Male:Female = 85:61 Mean age = 71.6 years Exclusion criteria: Transient ischaemic attack, subarachnoid haemorrhage, severe endocrine or metabolic disorders, hematological disorders, malignancies, chronic lung and heart dysfunction, severe liver or kidney failure, stress ulcer of the digestive system, those who died within a week of admission, and received thrombolytic therapy |
|
| Interventions | Experimental group: Nutrison fibre (Nutricia; Groupe Danone, Paris France), Swiss High (RAE; 4.18– 6.27 kJ/ml), or a solution with high nutrition content made by nutritionists in the hospital and based on condition, body weight, and nutritional status. Energy requirements were in the range of 83.68 – 125.52 kJ/kg/day (1 kcalth = 4.184 kJ). These solutions were infused by gravity under the supervision of nurses with a starting speed of 40 – 60 ml/hr. If there were no adverse events such as reflux, diarrhoea or flatulence the speed was adjusted to 100 – 125 ml/hr. The total volume for the 1st day was 500 ml followed by an increase of 500 ml/day until the requirement was met. (n = 75) Control group: Regular food from their families which consisted of milk, soy milk, juice, vegetable juice, broth, congee and eggs(n = 71) Co‐interventions: Similar pharmacological treatment and those who were confirmed to have dysphagia were supported with nasogastric nutrition within 72 hrs of admission, which lasted at least 10 days |
|
| Outcomes | Nutritional status and rate of malnutrition, nosocomial infection, mortality, and neurological evaluation | |
| Study dates | Not stated | |
| Notes | We contacted authors on 8th February 2016 by email: wangshaoshi@126.com. We received no reply. | |
| Risk of bias | ||
| Bias | Authors' judgement | Support for judgement |
| Random sequence generation (selection bias) | Unclear risk | Not described |
| Allocation concealment (selection bias) | Unclear risk | Not described |
| Blinding of participants and personnel (performance bias) All outcomes | Unclear risk | Not described |
| Blinding of outcome assessment (detection bias) All outcomes | Low risk | The doctors performing measurements were blinded to the intervention. |
| Incomplete outcome data (attrition bias) All outcomes | Low risk | There were no dropouts. |
| Selective reporting (reporting bias) | Unclear risk | No protocol could be obtained, and the trial did not report serious adverse events. |
| For‐profit bias | Unclear risk | It was unclear how the trial was funded. |
| Other bias | Low risk | The trial appeared to be free of other components that could put it at risk of bias. |
Zhong 1998.
| Methods | Randomised clinical trial, China | |
| Participants | 25 hospitalised adults with hepatobiliary cancer operation, at nutritional risk due to having major surgery Male:Female = 10:15 Mean age = 65 years |
|
| Interventions | Experimental group: Parenteral nutrition. Participants received infusion of nutrient solution (non‐protein calorie 20 ‐ 25 Kcal/kg/day, nitrogen 0.1 ‐ 0.15 g/kg/day) and appropriate insulin and vitamin supplements from the 1st day of operation for 7 days. (n = 13) Control group: Conventional liquid infusion with non‐protein calorie < 10 kcal/kg/day for 7 days after operation, and liquid or semi‐liquid diets since the 4th day after operation (n = 12) |
|
| Outcomes | Nitrogen‐related index (urinary urea nitrogen, nitrogen balance), nutrition and biochemistry index. | |
| Study dates | Not stated | |
| Notes | We tried but failed to contact the authors by phone. | |
| Risk of bias | ||
| Bias | Authors' judgement | Support for judgement |
| Random sequence generation (selection bias) | Unclear risk | Not described |
| Allocation concealment (selection bias) | Unclear risk | Not described |
| Blinding of participants and personnel (performance bias) All outcomes | Unclear risk | Not described |
| Blinding of outcome assessment (detection bias) All outcomes | Unclear risk | Not described |
| Incomplete outcome data (attrition bias) All outcomes | Unclear risk | The number of participants with incomplete data was not reported. |
| Selective reporting (reporting bias) | Unclear risk | No protocol could be obtained and the trial did not report on all‐cause mortality or serious adverse events. |
| For‐profit bias | Unclear risk | It was unclear how the trial was funded. |
| Other bias | Low risk | The trial appeared to be free of other components that could put it at risk of bias. |
Zhong 2006a.
| Methods | Randomised clinical trial, China | |
| Participants | 42 hospitalised adults admitted for colon/rectum cancer operation, at nutritional risk due to major surgery Male:Female = 28:14 Mean age = 67 years Exclusion criteria: without obvious ileus, severe heart, lung or kidney disease |
|
| Interventions | Experimental group: Enteral nutrition support, consisted of 1500 ‐ 2000 ml/day Nutrison Fibre, for 3 days before until 16 hrs before the surgery (n = 21) Control group: Oral nutrition support, consisted of semi‐liquid diets, liquid diets, fasting and liquid infusion, for 3 days before the operation until the morning of the surgery (n = 21) |
|
| Outcomes | Side effects, times of intestinal lavage, nutritional parameters including weight. | |
| Study dates | Not stated | |
| Notes | We tried but failed to contact the authors by phone and email: zhiqiang.zhong@163.com. | |
| Risk of bias | ||
| Bias | Authors' judgement | Support for judgement |
| Random sequence generation (selection bias) | Unclear risk | Not described |
| Allocation concealment (selection bias) | Unclear risk | Not described |
| Blinding of participants and personnel (performance bias) All outcomes | High risk | Participants and personnel were not blinded. |
| Blinding of outcome assessment (detection bias) All outcomes | Unclear risk | Not described |
| Incomplete outcome data (attrition bias) All outcomes | Unclear risk | The number of participants with incomplete data was not reported. |
| Selective reporting (reporting bias) | Unclear risk | No protocol could be obtained and the trial did not report on all‐cause mortality or serious adverse event. |
| For‐profit bias | Unclear risk | It was unclear how the trial was funded. |
| Other bias | Low risk | The trial appeared to be free of other components that could put it at risk of bias. |
Zhong 2014.
| Methods | Randomised clinical trial, China | |
| Participants | 120 hospitalised adults with severe cerebrovascular disease, at nutritional risk due to stroke Male:Female = 67:53 Mean age = 59.1 years Exclusion criteria: no metabolic and endocrine disorders before onset, no organic disease of important organs |
|
| Interventions | Experimental group: Early enteral nutrition. Adopted perfusion of nutrient solution from low concentration and low speed, and gradually accelerated dosage to the full amount. On the 1st day the perfusion was about 20 ml/hr, and it was increased by 20 ml/hr each day, until the maximum speed of 125 ml/hr (the nutrient solution temperature should be moderate). The treatment duration was unclear. (n = 60) Control group: Conventional nutrition according to physical circumstances, and given enteral nutrition after 72 hrs(n = 60) |
|
| Outcomes | Dietary intakes, defaecation volume, cure condition, mortality, morbidity and sequellae | |
| Study dates | Not stated | |
| Notes | We contacted the authors by phone. The authors did not know when they would have time to provide information. | |
| Risk of bias | ||
| Bias | Authors' judgement | Support for judgement |
| Random sequence generation (selection bias) | Unclear risk | Not described |
| Allocation concealment (selection bias) | Unclear risk | Not described |
| Blinding of participants and personnel (performance bias) All outcomes | High risk | Participantsand personnel were not blinded. |
| Blinding of outcome assessment (detection bias) All outcomes | Unclear risk | Not described |
| Incomplete outcome data (attrition bias) All outcomes | Unclear risk | The number of participants with incomplete data was not reported. |
| Selective reporting (reporting bias) | Unclear risk | No protocol could be obtained. |
| For‐profit bias | Unclear risk | It was unclear how the trial was funded. |
| Other bias | Low risk | The trial appeared to be free of other components that could put it at risk of bias. |
Zhu 2000.
| Methods | Randomised clinical trial, China | |
| Participants | 98 hospitalised adults undergoing gastric operation, at nutritional risk due to having major surgery Male:Female = 60:38 Mean age = 47.8 years |
|
| Interventions | Experimental group: Enteral nutrition support. On the 1st day a half‐dose, 66.9 Kj/kg/day, dripping speed of 60 ‐ 100 ml/hr; increased on the 2nd day up to full dose, dripping speed of 120 ‐ 150 ml/hr through nasal‐jejunum tube for 7 days.(n = 48) Control group: Conventional infusion of 2494.4 Kj/day and without protein for 7 days after operation (n = 50) |
|
| Outcomes | Serum cytokine levels (IL‐2, IFN‐γ, IL‐2Rα, sIL‐2R) | |
| Study dates | Not stated | |
| Notes | We tried but failed to contact the authors were att by phone. | |
| Risk of bias | ||
| Bias | Authors' judgement | Support for judgement |
| Random sequence generation (selection bias) | Unclear risk | Not described |
| Allocation concealment (selection bias) | Unclear risk | Not described |
| Blinding of participants and personnel (performance bias) All outcomes | High risk | Not mentioned, but the trial compared fluid infusion with enteral nutrition, which can be judged as high risk of bias |
| Blinding of outcome assessment (detection bias) All outcomes | Unclear risk | Not described |
| Incomplete outcome data (attrition bias) All outcomes | Unclear risk | The numbers and reasons for withdrawals and dropouts were not clearly stated or not stated at all. |
| Selective reporting (reporting bias) | Unclear risk | There is no protocol and the outcomes all‐cause mortality and serious adverse events are not reported on. |
| For‐profit bias | Unclear risk | It was unclear how the trial was funded. |
| Other bias | Low risk | The trial appeared to be free of other components that could put it at risk of bias. |
Zhu 2002a.
| Methods | Randomised clinical trial, China | |
| Participants | 42 hospitalised adults undergoing gastric operation, at nutritional risk due to major surgery Male:Female = 29:13 Mean age = 58.6 years Exclusion criteria: Metabolic and endocrine diseases, abnormal liver or kidney function |
|
| Interventions | Experimental group: Enteral nutrition support. The amount of calories was 125.5 kJ (30 kcal)/(kg/day), and nitrogen was 0.2 g/(kg/day). It was given through a nasal‐duodenal tube for 7 days (half‐dose for the first 2 days).The nutrition was provided by Nutrition Fiber (protein 20 g, fat 19.5 g,carbohydrate 61.5 g, minerals 3 g, food fibre 7.5 g, energy 4.18 Kj(1 kcal)/ml per 500ml).(n = 24) Control group: Conventional infusion which consisted of 5% ‐ 10% glucose, electrolytes, and vitamins, about 2500 kJ (600 kcal)/day, without exogenous nitrogen (n = 18) |
|
| Outcomes | All‐cause mortality, severe complications, adverse events, nutritive index including body weight, biochemical index, immune index (IgA, IgM, IgG,lymphocyte). | |
| Study dates | Not stated | |
| Notes | The authors were attempted contacted by phone. No contact was made. | |
| Risk of bias | ||
| Bias | Authors' judgement | Support for judgement |
| Random sequence generation (selection bias) | Unclear risk | Not described |
| Allocation concealment (selection bias) | Unclear risk | Not described |
| Blinding of participants and personnel (performance bias) All outcomes | High risk | Participants and personnel were not blinded. |
| Blinding of outcome assessment (detection bias) All outcomes | Unclear risk | Not described |
| Incomplete outcome data (attrition bias) All outcomes | Unclear risk | The number of participants with incomplete data was not reported. |
| Selective reporting (reporting bias) | Low risk | No protocol could be obtained but the trial did report on all‐cause mortality and serious adverse event. |
| For‐profit bias | Unclear risk | It was unclear how the trial was funded. |
| Other bias | Low risk | The trial appeared to be free of other components that could put it at risk of bias. |
Zhu 2012a.
| Methods | Randomised clinical trial, China | |
| Participants | 97 hospitalised adults admitted with stroke, at nutritional risk due to stroke Male:Female = 56:41 Mean age = 72 years Exclusion criteria: None |
|
| Interventions | Experimental group 1: Received both enteral and parenteral supplements.The energy was 84 ‐ 105 kj/kg/day, and increased to the target volume 126 ‐ 147 kj/kg/day, based on participant's recovery condition. Whole protein supplements (6.3 kJ/ml) were given through nasogastric tube, and the sugar, fat and protein were provided through vein tube.(n = 33) Experimental group 2: Received only enteral supplements. The energy was 84 ‐ 105 kj/kg/day, and increased to the target volume 126 ‐ 147 kj/kg/day based on participant's recovery condition. All the nutrition was provided through the nasogastric tube. (n = 32) Control group: The nutrition (6.3 kJ/ml)was given through nasogastric tube under the control of a specialist nurse(n = 32) |
|
| Outcomes | Triceps skinfold thickness, arm muscle circumference, haemoglobin, albumin, prealbumin, triglyceride, incidence rate of malnutrition; infection rate, mortality, NIHSS, Barthel Index | |
| Study dates | Not stated | |
| Notes | Same as Zhu 2012b, but with experimental group 1 vs control group. We found no contact information for the authors. | |
| Risk of bias | ||
| Bias | Authors' judgement | Support for judgement |
| Random sequence generation (selection bias) | Low risk | Not described |
| Allocation concealment (selection bias) | Unclear risk | Not described |
| Blinding of participants and personnel (performance bias) All outcomes | High risk | The participants and personnel were not blinded. |
| Blinding of outcome assessment (detection bias) All outcomes | Unclear risk | Not described |
| Incomplete outcome data (attrition bias) All outcomes | Unclear risk | The number of participants with incomplete data was not reported. |
| Selective reporting (reporting bias) | Low risk | No protocol could be obtained but the trial did report on all‐cause mortality and serious adverse events. |
| For‐profit bias | Unclear risk | It was unclear how the trial was funded. |
| Other bias | Low risk | The trial appeared to be free of other components that could put it at risk of bias. |
Zhu 2012b.
| Methods | Randomised clinical trial, China | |
| Participants | 97 hospitalised adults admitted with stroke, at nutritional risk due to stroke Male:Female = 56:41 Mean age = 73 years Exclusion criteria: None |
|
| Interventions | Experimental group 1: Received both enteral and parenteral supplements.The energy was 84 ‐ 105 kj/kg/day, and increased to the target volume 126 ‐ 147 kj/kg/day based on participant's recovery condition. Whole protein supplements (6.3 kJ/ml) were given through nasogastric tube, and the sugar, fat and protein were provided through vein tube.(n = 33) Experimental group 2: Received only enteral supplements. The energy was 84 ‐ 105 kj/kg/day, and increased to the target volume 126 ‐ 147 kj/kg/day based on participant's recovery condition. All the nutrition was provided through the nasogastric tube.(n = 32) Control group: The nutrition (6.3 kJ/ml) was given through nasogastric tube under the control of a specialist nurse.(n = 32) |
|
| Outcomes | Triceps skinfold thickness, arm muscle circumference, haemoglobin, albumin, prealbumin, triglyceride, incidence rate of malnutrition;,infection rate, mortality, NIHSS, Barthel Index | |
| Study dates | ||
| Notes | Same as Zhu 2012a, but with experimental group 2 vs control group | |
| Risk of bias | ||
| Bias | Authors' judgement | Support for judgement |
| Random sequence generation (selection bias) | Low risk | Not described |
| Allocation concealment (selection bias) | Unclear risk | Not described |
| Blinding of participants and personnel (performance bias) All outcomes | High risk | The participants and personnel were not blinded. |
| Blinding of outcome assessment (detection bias) All outcomes | Unclear risk | Not described |
| Incomplete outcome data (attrition bias) All outcomes | Unclear risk | The number of participants with incomplete data was not reported. |
| Selective reporting (reporting bias) | Low risk | No protocol could be obtained but the trial did report on all‐cause mortality and serious adverse events. |
| For‐profit bias | Unclear risk | It was unclear how the trial was funded. |
| Other bias | Low risk | The trial appeared to be free of other components that could put it at risk of bias. |
6‐MWD: 6‐minute walking distance ABG: arterial blood gas AD: Alhzeimer's disease ADL: activities of daily living AKP: alkaline phosphatase ASCI(U): Acute Spinal Cord Injury (Unit) BEE: basal energy expenditure BMI: body mass index BUN: blood urea nitrogen CABG: coronary artery bypass graft COPD: chronic obstructive pulmonary disease CRP: C‐reactive protein ECOG: Eastern Co‐operative Oncology Scale EN: enteral nutrition ESR: erythrocyte sedimentation rate FCM: flow cytometry FEV: forced expiratory volume FIM: functional independence measure FVC: forced volume capacity GCS: Glasgow coma scale GPT: glutamate pyruvate transaminase IBW: ideal body weight ICU: intensive care unit i.v.: intravenous IVH: intrravenous hyperalimentation IVN: intravenous nutrition KPS: Karnofsky performance score MMSE: Mini metal state examination MNA: mini nutritional assessment MUST: Malnutrition Universal Screening Tool NEFA: non‐essential fatty acids NIHSS: NIH stroke scale NRS: Nutritional Risk Screening NSAID: non‐steroidal anti‐inflammatory drug NYHA: New York Heart Association ONS: oral nutrition supplement PEG: percutaneous endoscopic gastrotomy PN: parenteral nutrition QALYs: quality‐adjusted life years QoL: quality of life REE: resting energy expenditure RQ: respiratory quotient SD: standard deviation SFAA: serum‐free amino acid SGOT: serum glutamic oxaloacetic transaminase SGPT: serum glutamate pyruvate transaminase SIRS: sepsis inflammatory response syndrome SPN: supplementary parenteral nutrition TBSA: total body surface area TPN: total parenteral nutrition WBC: white blood cell
Characteristics of excluded studies [ordered by study ID]
| Study | Reason for exclusion |
|---|---|
| Abbasinazari 2011 | Wrong control group (enteral feeding) |
| Abitbol 1989 | Wrong control (all 3 groups received total parenteral nutrition) |
| Achord 1987 | Multi‐intervention (experimental group received cortisol and heparin in addition to their nutrition intervention) |
| Aguilar‐Nascimento 2002 | Wrong intervention group (the intervention group did not receive nutritional support (early oral feeding)) |
| Akizuki 2009 | Not randomised |
| Albano 2003 | Not adults |
| Aoki 2000 | Wrong intervention group (The intervention is preoperative glutamine supplement) |
| Aoki 2001 | Wrong intervention group (glutamine supplementation as primary intervention) |
| Arabi 2011 | Wrong control group (control group not described as standard care) |
| Arcand 2005 | Outpatients |
| Arnaud‐Battandier 1999 | Outpatients |
| Arnold 1989 | Outpatients |
| Aronsson 2009 | Not at nutritional risk (after correspondence with author) |
| Arustamyan 2011 | Wrong control group (control group did not receive standard care) |
| Arutiunov 2009 | Not randomised (the study was an observational study) |
| Ashworth 2006 | Wrong control group (both the intervention and control group received oral nutrition support) |
| Askanazi 1986 | Wrong control group (control group not described as standard care) |
| Bachmann 2008 | Not randomised (clinical case study) |
| Bachrach‐Lindström 2000 | Not randomised |
| Baek 1975 | Not randomised |
| Bakiner 2013 | Wrong control group (control group receives parenteral nutrition) |
| Bakker 2011 | Protocol to the trial Bakker 2014 |
| Bar 2008 | Participants were pregnant (elective C‐section) |
| Barle 1997 | Not at nutritional risk (undergoing elective laparoscopic surgery and the trialist does not describe participants as at nutritional risk) |
| Baron 1986 | Not randomised |
| Barton 2000 | Wrong intervention group (experimental group received both reduced portion size and fortifications) |
| Bastarache 2012 | Wrong control group (the trial compared two different enteral feedings (trophic food)) |
| Bastian 1999 | Wrong intervention group (immunonutrition) |
| Bauer 2005a | Wrong intervention group (both the experimental group and control group received an isocaloric supplement. Not nutritional support) |
| Bauer 2005b | Wrong intervention group (both the experimental group and control group received an isocaloric supplement. Not nutritional support) |
| Bayer‐Berger 1989 | Not randomised (the control group were not randomised) |
| Beattie 2000 | Outpatients |
| Beau 1986 | Wrong control group (control group received enteral nutrition as standard care) |
| Benzineb 1995 | Wrong intervention (experimental group received early oral feeding) |
| Bickel 1992 | Wrong intervention group (the experimental group received early oral feeding) |
| Blackburn 1973 | Wrong control group (there was no control group in this trial); not described as randomised |
| Bonetti 1988 | Wrong control group (control group was not described as standard care) |
| Bories 1994 | Participants were younger than 18 years old |
| Bos 2000 | Not randomised |
| Bos 2001 | Not randomised |
| Boultetreau 1978 | Wrong control group (both groups receives parenteral nutrition) |
| Bourdel‐Marchasson 2000 | Cluster‐randomised trial |
| Bozzetti 1974 | Wrong control group (control group received parenteral nutrition) |
| Bozzetti 1976 | Wrong control group (control group received parenteral nutrition) |
| Bozzetti 1998 | Not randomised |
| Bozzetti 2000 | The control group receives hypocaloric PN |
| Braga 2002 | Wrong intervention (experimental group received diet enriched with arginine, omega‐3 fatty acid and RNA) |
| Braunschweig 2015 | Wrong control group (control group receives enteral or parenteral nutrition as part of standard care) |
| Britton 2012 | Cluster‐randomised trial |
| Brooks 1999 | Wrong intervention group (the experimental group received immunonutrition) |
| Buchman 1969 | Not randomised |
| Burden 2011 | Outpatients |
| Buzby 1988 | Protocol. The finished review could not be obtained, and may never have been conducted |
| Cabre 1990 | Wrong control group |
| Cai 1999 | Wrong control group (the comparison of the study is EN (dietary fibre + glucose + protein) versus EN (glucose + protein)) |
| Cai 2000 | Wrong control group (the comparison of the study is EN versus PN) |
| Cameron 2011 | Wrong control group (the control group received an intervention the experimental group did not (milk)) |
| Cao 1994 | Outpatients (participants were with cancer and having chemotherapy) |
| Capparros 1982 | Not randomised |
| Chadwick 2002 | Wrong intervention group (not nutritional support) |
| Chatterjee 2012 | Wrong intervention group (early oral feeding) |
| Chattophadhyay 2002 | Not at nutritional risk (meeting abstract). Authors could not be found for further information. |
| Chen 1994 | Wrong control group (the comparison of the study is early EN versus PN) |
| Chen 2000c | Wrong control group (the comparison of the study is EN versus PN) |
| Chen 2001 | Wrong control group (the comparison of the study is EN versus PN) |
| Chen 2010 | Not a randomised clinical trial, and the comparison is EN versus PN |
| Chen 2014 | Not randomised |
| Cheng 1997 | Not a randomised trial |
| Chiarelli 1990 | The study said it had randomised participants according to the "case‐control method". We could not be sure it was a randomised clinical trial. |
| Collins 1978 | Not randomised |
| Consoli 2010 | Wrong intervention group (the experimental group received early oral feeding (not nutritional support)) |
| Cornu 2000 | Outpatients |
| Csapo 2003 | Not a randomised clinical trial |
| Cui 1994 | Not a randomised clinical trial |
| Cui 2013 | Wrong control group (EN (nasogastric tube) vs EN ((nasogastric tube) + PN (venous)) vs + PN (venous)) |
| Dag 2011 | Wrong intervention group (the experimental group received early oral feeding (not nutritional support)) |
| Daly 1987 | Not randomised |
| Davies 1998 | Not randomised clinical trial |
| De Castro 2012 | Wrong control group (control group receives isocaloric enteral nutrition) |
| De Luis 2003 | Outpatients |
| De Lédinghen 1998 | Wrong intervention group (the experimental group received early oral feeding (not nutritional support)) |
| Dea 1996 | Not at nutritional risk |
| Deligné 1974 | Not randomised |
| Demetriou 1992 | Comment on Kearns 1992 |
| Dhanraj 1997 | Wrong control group (control group received hospital‐made enteral nutrition as standard care) |
| Dias 1999 | Wrong intervention group (the experimental group did not receive nutritional support (glutamine)) |
| Ding 1999 | Participants were pregnant women. |
| Ding 2015 | Wrong control group (control group receives enteral nutrition) |
| Dintinjana 2012 | Multi‐intervention (including megestrol acetate) |
| Dixon 1984 | Outpatients |
| Djunet 2012 | Wrong control group |
| Dock‐Nascimento 2012 | Glutatemine enriched nutritional support |
| Doglietto 2004 | Wrong intervention (does not receive a nutrition intervention) |
| Dong 1997 | Wrong control group (the comparison of the study is EN versus PN) |
| Driver 1990 | Not randomised |
| Dupont 2012 | Outpatients |
| Dutta 2004 | Not randomised |
| Eckerwall 2007 | Early oral feeding |
| Edstrom 1989 | Not at nutritional risk. Trialists investigate tumor kinetics following TPN and do not indicate that their participants are at nutritional risk. |
| Efthimiou 1988 | Outpatients |
| El Nakeeb 2009 | Wrong intervention group (the experimental group received early oral feeding, not nutritional support) |
| Elke 2013 | Not randomised |
| Elmore 1989 | Wrong intervention group (the intervention group received elemental diet) |
| Eneroth 1997 | Not randomised |
| Eneroth 2004 | Outpatients |
| Esaki 2005 | Not randomised |
| Evans 1987 | Outpatients |
| Fairfull‐Smith 1980 | Not randomised |
| Feinstein 1981 | Dialysis |
| Feldblum 2011 | Wrong control group (there was no control group. The trial compared group 2 and 3 as one). |
| Feng 2008 | Wrong intervention group (the experimental group received early oral feeding. Not nutritional support) |
| Feo 2004 | Multiintervention (early oral feeding) |
| Fernandez‐Estivariz 2006 | Outpatients (not hospitalised. Both groups received parenteral nutrition) |
| Flynn 1987 | Outpatients |
| Foltz 1987 | Outpatients |
| Fonseca 2011 | Wrong intervention group (experimental group receives early oral feeding (not nutrition support)) |
| Foster 1980 | Wrong intervention group (experimental group did not receive nutritional support) |
| Freund 1990 | Not randomised |
| Fuenzalida 1990 | Outpatients (the participants were not hospitalised, but were admitted to a Clinical Research Centre) |
| Förli 2001 | Publication of the outpatient phase of Förli 2001 |
| Ganzoni 1994 | Outpatients |
| Garcia‐Rodriguez 2013 | Outpatients and control intervention not described as standard care |
| Genton 2004 | Not randomised |
| Georgieff 1980 | Not randomised |
| Gerasimidis 2014 | Outpatients |
| Grahm 1989 | Quasi‐randomised |
| Greenberg 1982 | Wrong control group (control group received parenteral feeding) |
| Grizas 2008 | Wrong control group (the diet of the control group was not described as standard care but rather Early natural nutrition) |
| Grode 2014 | Wrong control group (both groups receives nutritional intervention) |
| Gunnarsson 2009 | Quasi‐randomised |
| Gurgun 2013 | Outpatients |
| Haffejee 1980 | Not randomised |
| Han‐Geurts 2001 | Wrong control group (fixed oral diet versus patient‐controlled oral diet) |
| Han‐Geurts 2007 | Wrong intervention group (experimental group was not described as nutritional support) |
| Harries 1983 | Outpatients |
| Hasenberg 2010 | The trial was retracted |
| Hasse 1997 | Outpatients |
| He 2000 | Not a randomised clinical trial |
| Heatley 1979 | Quasi‐randomised (participants were randomly allocated into 1 of 2 groups according to odd or even year of birth) |
| Hedberg 1999 | Not randomised |
| Heslin 1997 | Wrong intervention group (immunonutrition) |
| Hickey 1982 | Not randomised to nutrition support (randomised to oral hygiene) |
| Hidding 1988 | Wrong control group (2 different enteral solutions) |
| Hochwald 1997 | Wrong intervention group (intervention group received immunonutrition containing arginine) |
| Honda 1990 | Not randomised |
| Hosseini 2010 | Early oral feeding |
| Hovels 1951 | Not adults (infants) |
| Hu 1995 | Not a randomised clinical trial |
| Hu 2003 | Wrong control group (control group did not receive standard care) |
| Hur 2011 | Wrong control group (both groups were intervention groups receiving the same intervention in different time periods) |
| Ibrahim 2002 | Wrong control group (both groups were intervention groups, and both of them had enteral feeding) |
| Irvine 2004 | Wrong control group (No participants received a control diet) |
| Isenring 2003a | Outpatients |
| Isenring 2003b | Outpatients |
| Isenring 2004 | Outpatients |
| Ishiki 2015 | No group received standard care (enteral nutrition versus oral nutrition versus enteral plus oral nutrition) |
| Jacob 1989 | Wrong control group (all groups received different parenteral nutrition therapy) |
| Jacobson 2012 | Not randomised (patients was chosen in consecutive manner and compared to patients during a preceeding 20‐year period) |
| Jenkins 1994 | Not adults |
| Jiang 1994a | Not a randomised clinical trial. |
| Jiang 1994b | Wrong control group (the comparison of the study is EN versus PN) |
| Jiang 2001 | Wrong control group (the comparison of the study is EN versus PN) |
| Jiang 2002 | Wrong control group (the comparison of the study is EN versus PN) |
| Jiang 2003 | Wrong control group (the comparison of the study is hypocaloric PN vs traditional PN) |
| Jin 2002 | Wrong control group (early EN versus PN plus EN) |
| Joosten 2001 | Not randomised |
| Kang 1994 | Not a randomised clinical trial |
| Kang 2011 | Wrong control group (the control group receives PN) |
| Keller 1991 | Wrong control group (2 intervention groups (hypercaloric vs hypocaloric)) |
| Keohane 1983 | Wrong control group (control group received enteral nutrition as standard care) |
| Kilgallen 1996 | Outpatients |
| Kilic 2012 | Not randomised |
| Kinsella 1981 | Outpatients |
| Kirkil 2012 | Wrong control group (control group received a different enteral formula) |
| Kirvela 1993 | Outpatients |
| Kiss 2014a | Wrong control group (control group received nutrition support until 50% of energy requirements were met) |
| Kiss 2014b | Outpatients |
| Kiss 2014c | Outpatients |
| Klahr 1996 | Trial to test the efficacy of providing less protein in diet |
| Klek 2011 | Wrong control group. There were 4 intervention groups: standard enteral nutrition, immunmodulating enteral nutrition, standard parenteral nutrition, immunmodulating parenteral nutrition, and therefore no control group |
| Knowles 1988 | Outpatients (ambulatory) |
| Kochar 2011 | Not adults |
| Kompan 1999 | Wrong control group (both groups were intervention groups receiving enteral nutrition at different times) |
| Kompan 2004 | Wrong control group (control group receives total parenteral nutrition) |
| Konrad 1966 | Not randomised |
| Kult 1975 | Not randomised |
| Kwon Lee 2006 | Outpatients |
| Laaban 1986 | Not a randomised clinical trial (observational study) |
| Lapillonne 1995 | Not adults |
| Lapp 2001 | Not randomised (quasi‐randomised according to birth date) |
| Lassen 2008 | Early oral feeding |
| Lauque 2004 | Outpatients |
| Lawson 2003 | Not randomised |
| Le Cornu 2000 | Outpatients |
| Ledinghen 1996 | Not adults (neonatal patients) |
| Lee 2014 | Outpatients |
| Lei 2011 | Wrong intervention group (immunonutrition) |
| Li 2003 | Wrong control group (comparison of the study is EN versus PN) |
| Li 2014 | Multi‐intervention |
| Liao 1996 | Not a randomised clinical trial |
| Liao 1997 | Not a randomised clinical trial, and the comparison is EN versus PN |
| Liao 2005 | Not a randomised clinical trial |
| Lidder 2010 | Wrong control group (the control group received 100% parenteral nutrition, while the intervention group received 70% parenteral nutrition, and 30% enteral nutrition) |
| Lier 2012 | Outpatients |
| Lim 2010 | Not at nutritional risk (healthy learning adults) |
| Lin 1997 | Not a randomised clinical trial |
| Lindschinger 2000 | Multi‐intervention (PEG‐sonde versus nasogastric tube) |
| Liu 1998 | Not a randomised clinical trial |
| Liu 2000b | Wrong control group (the comparison of the study is (146kj/kg/day + glucose, protein, lipid + electrolyte + vitamins) versus (105 kj/kg/day + glucose, protein, lipid + electrolyte + vitamins)) |
| Liu 2007 | Wrong control group (control group receives enteral nutrition) |
| Liu 2010 | Not a randomised clinical trial |
| Liu 2012 | Wrong control group (control described as receiving nutrition support) |
| Lo 2005 | Wrong control group (control groups received enteral nutrition) |
| Lobato 2010 | Wrong intervention group (experimental group receives early oral feeding (not nutrition support)) |
| Lopez 1980 | Wrong control group |
| Lovik 1996 | Outpatients |
| Lucha 2005 | Wrong intervention group (early oral feeding) |
| Luder 2002 | Not adults |
| Lundholm 2004 | Outpatients |
| Luo 1996 | Wrong control group (comparison of the study is EN versus PN) |
| Luo 1999 | Wrong control group (comparison of the study is standard caloric PN versus hypercaloric PN) |
| Lv 2000 | Not a randomised clinical trial |
| Lédinghen 1998 | Wrong intervention group (experimental group received early oral feeding) |
| Löhlein 1981 | Not randomised |
| Ma 1999 | Not a randomised clinical trial |
| Ma 2014 | Wrong control group |
| Maci 1991 | Outpatients (participants were not hospitalised at time of randomisation) |
| Mackenzie 2005 | Not a randomised clinical trial (prospective cohort study) |
| Madigan 2005 | Outpatients |
| Marktl 1980 | Wrong control group (control group received a different parenteral nutrition solution than experimental) |
| Martin 2004 | Cluster‐randomised trial |
| Mattioli 1993 | Wrong control group (control group received parenteral nutrition) |
| Mault 2000 | The trial compares nutrition support guided by energy expenditure compared with being blinded to energy expenditure. Both groups receive nutrition support. |
| McClave 2001 | Not at nutritional risk |
| McCowen 2000 | Wrong control group (both groups received total parenteral nutrition) |
| Mehringer 2001 | Wrong control group (received trophic feeds of enteral nutrition) |
| Mehta 2010 | Pregnant participants |
| Meisner 2008 | Not a nutritional risk (participants received laparoscopic surgery, and the authors did not describe them as at nutritional risk) |
| Mendenhall 1985 | Wrong intervention group (experimental group received a nutrition supplement high in calories, protein and branched‐chain amino acids, hence is immunonutrition) |
| Mi 2012 | Wrong control group (intervention were not comparable between groups) |
| Miao 2005 | Multi‐intervention (intervention group receives insulin in addition to the nutrition support) |
| Minard 2000 | Wrong intervention group (additionally the experimental group received immunonutrition) |
| Minig 2009 | Wrong intervention group (experimental group received early oral feeding) |
| Moghissi 1977 | Not randomised |
| Moloney 1983 | Not randomised |
| Moore 1983 | Experimental group received elemental diet |
| Moore 1986 | Wrong experimental intervention (received elemental diet) |
| Moore 1991 | Wrong experimental intervention (received elemental diet) |
| Murphy 1992 | Outpatients |
| Müller 1995 | Wrong control group (there was no control group) |
| Nachtigal 2008 | Outpatients |
| Nagata 2009 | Wrong control group (EN vs PN + EN (different dosages)) |
| Namulema 2008 | Outpatients |
| Nataloni 1999 | Wrong control group (control group receives parenteral feeding or enteral feeding) |
| Navratilova 2007 | Outpatients (institutionalised) |
| Nayel 1992 | Outpatients |
| Neander 2004 | Outpatients |
| Neto 2012 | Wrong control group (control group receives parenteral feeding or enteral feeding) |
| Norman 2008 | Outpatients |
| Nørregaard 1987 | Most likely not hospitalised (no contact information for first author could be found) |
| Oehler 1987 | Not randomised |
| Ohura 2011 | Wrong control group (control group receives enteral nutrition) |
| Olin 1996 | Not randomised (non‐randomised cluster study) |
| Olofsson 2007 | Multi‐intervention (intervention group received a list of multi‐interventions that included ones that were not nutrition support) |
| Oloriz 1992 | Wrong control group (control group receives enteral nutrition) |
| Otte 1989 | Outpatients (ambulant) |
| Ouyang 2003 | Wrong control (control group received nasogastric feeding) |
| Ovesen 1992 | Wrong control group (supplement versus dense supplement) |
| Ovesen 1993 | Outpatients |
| Pan 2000 | Not a randomised clinical trial |
| Pandey 2002 | Early oral feeding |
| Pantzaris 2012 | Wrong intervention group (immunonutrition) and outpatients |
| Paton 2004 | Outpatients |
| Pawlotsky 1987 | Not randomised (cancer patients compared with healthy patients) |
| Pedersen 2005 | Not randomised (quasi‐randomised) |
| Peitsch 1982 | Not randomised |
| Persson 2002 | Outpatients |
| Persson 2007 | Wrong control group (control group received another advice intervention) and trial was in outpatients |
| Pinilla 2001 | Multi‐intervention (both prokinetics and higher gastric threshold) |
| Pitkanen 1991 | Wrong control group |
| Pivi 2011 | Outpatients |
| Powell 2000 | Not at nutritional risk (test if nutrition helps on inflammatory response) |
| Powers 1986 | Not randomised |
| Praygod 2011 | Outpatients |
| Preshaw 1979 | Quasi‐randomised (participants randomised by last digit in hospital registration number) |
| Prohaska 1977 | Not randomised |
| Pronio 2008 | Wrong intervention group (immunonutrition) |
| Qiu 1998 | Not a randomised clinical trial |
| Rabeneck 1998 | Outpatients |
| Rabinovitch 2006 | Not a randomised clinical trial (retrospective study) |
| Ramirez 1979 | Wrong control group (all groups received total parenteral nutrition) |
| Ravasco 2005a | Outpatients |
| Ravasco 2005b | Outpatients |
| Rice 2011 | Wrong control group (2 intervention groups (trophic vs full). No standard care) |
| Rice 2012 | Wrong control group (control received a different enteral nutrition than the experimental group (trophic)) |
| Rickard 1983 | Not adults |
| Rinaldi 2006 | Not randomised |
| Riviere 2001 | Outpatients, and not randomised |
| Rogers 1992 | Control participants were not hospitalised |
| Rypkema 2004 | Not randomised (intervention based on enrolment to specific hospital) |
| Rüfenacht 2010 | Wrong control group (2 intervention groups: oral supplements and nutritional therapy group) |
| Safdari‐Dehcheshmehi 2011 | Wrong intervention group (early oral feeding) |
| Sakai 2015 | Wrong intervention group (immunonutrition) |
| Sako 1981 | Wrong control group (control group received enteral nutrition) |
| Sandstrøm 1993 | Wrong control group (not standard care (10% or 20% glucose)) |
| Savassi‐Rocha 1992 | Wrong intervention group (nasogastric decompression, versus no nasogastric decompression) |
| Savva 2013 | Outpatients |
| Schega 1967 | Wrong control group (4 different parenteral solutions) |
| Schilder 1997 | Wrong intervention group (the experimental group received early oral nutrition) |
| Schneider 2000 | Not a randomised clinical trial (article is a comment on Bozetti 1998) |
| Schols 1995 | Outpatients |
| Schröter 1974 | Wrong control group (control group were not described as standard care) |
| Schwarz 1998 | Wrong control group (all 3 groups received total parenteral nutrition) |
| Schwenk 1999 | Outpatients |
| Scott 2005 | Primarily outpatients |
| Seguy 2006 | Not randomised |
| Serclov 2009 | Multi‐intervention |
| Seri 1984 | Outpatients (not all participants were hospitalised) |
| Serrou 1981b | Not at nutritional risk |
| Serrou 1982b | Not at nutritional risk |
| Serrou 1983 | Wrong intervention group (no nutrition) |
| Seven 2003 | Wrong control group (not described as standard care) |
| Sha 1998 | Not a randomised clinical trial |
| Shamberger 1983 | Not adults (We wrote to the author (Robert.Shamberger@childrens.harvard.edu) for separate data for the adults. The author did not have separate data). |
| Shan 1997 | Wrong control group (both groups received EN and PN in different volumes) |
| Shang 2006 | The trial was retracted |
| Shaw 1983 | Wrong control group (control group receives TPN) |
| Shen 1994 | Not a randomised clinical trial |
| Shepherd 1988 | Not adults |
| Shi 2000 | Wrong control group (participants with inflammatory bowel disease in intervention group received PN containing lipids, while control group received PN without lipids) |
| Shi 2001a | Wrong control group (EN vs PN) |
| Shi 2001b | Wrong control group (EN vs PN) |
| Shi 2002 | Outpatients |
| Shizgal 1976 | Not randomised |
| Shukla 1984 | Wrong intervention group (elemental diet) |
| Silander 2012 | Wrong intervention group (intervention is a prophylatic PEG) |
| Silander 2013 | Outpatients |
| Silva 2010 | Outpatients |
| Silvers 2014 | Outpatients |
| Singer 2011 | Wrong control group (both groups received different enteral nutrition) |
| Singh 2008 | Outpatients |
| Smith 1982 | Wrong control group (control group received parenteral nutrition) |
| Smith 2008 | Wrong control group (both groups received nutritional support) |
| Snyderman 1999 | Wrong intervention group (immunonutrition vs standard nutrition). We contacted the authors in September 2015 by email to get specific information on groups 3 and 4: CSNYD+@Pitt.edu. We received no reply. |
| Somanchi 2011 | Not randomised |
| Song 2003 | Wrong control group (oral feeding 48 to 72 hours after surgery versus oral feeding 10 to 12 days after surgery) |
| Song 2009 | Wrong intervention group (participants in intervention group reveived EN contains 2 types of nutritious supplementary while control group received EN contains only 1 type) |
| Sorrentino 2012 | Wrong intervention group (immunonutrition) |
| Spain 1998 | Wrong control group (control group receives enteral nutrition) |
| Stein 1981 | Not randomised |
| Stewart 1998 | Wrong intervention group (early oral feeding) |
| Sudarsanam 2011 | Outpatients |
| Sultan 2012 | Wrong control group (control group receives enteral nutrition) |
| Tabei 2004 | Not described as randomised |
| Tai 2011 | Wrong control group (control group receives an oral nutritional intervention in addition to standard hospital diet) |
| Tan 2002 | Not a randomised clinical trial |
| Tandon 1984 | Outpatients |
| Tang 1999 | Wrong control group (PN vs EN) |
| Tang 2003 | Wrong control group (PN vs EN) |
| Tang 2010 | This study aims to find out the relationship between education and nutrition support. |
| Tanuwihardja 2010 | Wrong intervention group (experimental group received immunonutrition) |
| Taylor 1998 | Wrong control group (control group received enteral nutrition) |
| Teich 2009 | Wrong intervention group (early oral feeding) |
| Tesinsky 1999 | Outpatients |
| Thomas 2005 | Outpatients |
| Tjäder 1996 | Not randomised |
| Tkatch 1992 | Controls received oral supplement that differed only in the amount of protein |
| Touger Decker 1997 | Not at nutritional risk |
| Toyoda 1999 | Wrong control group (EN vs PN) |
| Trinidad Ruiz 2005 | Not randomised |
| Uzunkoy 2012 | Early oral feeding |
| Valerio 1978 | Wrong control group (both groups received nutritional intervention) |
| Vargas 1995 | Outpatients |
| Vermeeren 2001 | Wrong control group (control group not standard care, high carbohydrate versus high fat content supplements) |
| Vivanti 2015 | Outpatients |
| Vizia 1998 | Not adults |
| Vomel 2000 | Not randomised |
| Wang 1995 | Wrong control group (PN vs EN) |
| Wang 1997c | Not a randomised clinical trial |
| Wang 1998a | Wrong control group (discontinued PN vs continued PN) |
| Wang 1998b | Wrong control group (PN vs EN) |
| Wang 2000a | Not a randomised clinical trial |
| Wang 2000b | Not a randomised clinical trial |
| Wang 2000c | Not a randomised clinical trial |
| Wang 2006 | Outpatients |
| Wang 2011a | Wrong control group |
| Wang 2012 | Multi‐intervention (both nutrition and early mobilisation) |
| Wang 2013b | Outpatients |
| Wang 2015 | Wrong intervention group (elemental diet) |
| Warnold 1988 | Wrong control group (2 intervention groups) |
| Way 1975 | Not randomised |
| Wei 1998 | Wrong control group (control group does not receive standard care) |
| Weiner 1985 | Outpatients |
| Weisdorf 1987 | Not adults |
| Williams 1976 | Not a randomised clinical trial (quasi‐randomised) |
| Wong 2004 | Outpatients |
| Woo 1994 | Outpatients |
| Woolley 1996 | Wrong control group (control group receives enteral nutrition) |
| Wouters‐Wesseling 2002 | Outpatients |
| Wright 2006 | Not a randomised clinical trial (quasi‐randomised) |
| Wu 1996b | Wrong control group (portal vein nutrition in intervention group versus peripheral vein nutrition in control group) |
| Wu 1999 | Wrong control group (EN vs PN) |
| Wu 2006 | Wrong control group (control group did not receive standard care (hypocalorisk + protein postoperatively)) |
| Xiao 2000 | No information on experimental group or control group |
| Xu 1995 | Not a randomised clinical trial (observational study) |
| Xu 1998b | Not a randomised clinical trial |
| Xu 1998c | Not a randomised clinical trial |
| Xu 2000 | Not a randomised clinical trial |
| Yang 1997 | Wrong control group (EN vs PN) |
| Yao 2013 | Not at nutritional risk |
| Ye 2011 | Wrong intervention group |
| Yetimalar 2010 | Not a randomised clinical trial (quasi‐randomised) |
| Yu 1999 | Wrong intervention group (this type of comparison could not find which kind of intervention worked. Clinical intervention combined with food intake as wishes in intervention group versus clinical intervention combined with intake of high‐energy high protein food in control group) |
| Yu 2007 | Wrong intervention group (stomach tube homogenate diets and yogurt in intervention group versus stomach tube homogenate diets in control group) |
| Yu 2012 | Wrong control group (EN vs. PN) |
| Yuan 2003 | This study is on the effectiveness of rehabilitation not nutritional support. Rehabilitation treatment plus oral feeding of Nutren versus rehabilitation plus oral feeding of normal food like poridge versus oral feeding of normal food like poridge. |
| Yun 1993 | Wrong control group (food with different calories and protein and intravenous nutrition were performed in 2 different groups) |
| Zandier 1998 | Not described as randomised |
| Zavertailo 2010 | Wrong control group (control group received enteral nutrition) |
| Zelic 2013 | Not at nutritional risk |
| Zhang 1996 | Wrong control group (PN in different ways in 2 groups, one is portal vein nutrition, the other is central vein nutrition) |
| Zhang 2000a | Wrong control group (EN vs PN): (PN (after 48 hrs) plus EN (after 1 week replaced with EN) vs PN (after 48 hrs normal feeding resumes, at least 2 weeks) vs EN) |
| Zhang 2000b | Not a randomised clinical trial |
| Zhang 2004 | Wrong control group (control group receives enteral nutrition) |
| Zhang 2006 | Wrong control group (EN of different nutrition (different ratio of protein, lipid)) |
| Zhang 2011 | Wrong control group (control group receives EN or TPN) |
| Zhao 1995 | Not a randomised clinical trial |
| Zhao 2012 | Wrong intervention group (early oral feeding) |
| Zhao 2015 | Retracted |
| Zhen 2002 | Wrong control group (EN vs TPN) |
| Zheng 2006 | Wrong control group (control group receives enteral nutrition) |
| Zhong 2006b | Not a randomised clinical trial |
| Zhou 2006 | Multi‐intervention (both experimental groups had removal of nasogastric tube, and oral feeding, while the control group had no feeding, and kept the nasogastric tube until flatus) |
| Zhu 2002b | Wrong control group (EN vs PN) |
| Zhuang 1997 | Wrong control group (EN vs PN) |
| Zingirenko 2007 | Wrong control group (control group receives enteral nutrition) |
| Zou 2014 | Wrong control group (early EN+PN vs TPN+EN) |
| Zwaluw 2014 | Outpatients |
EN: enteral nutrition PN: parenteral nutrition TPN: total parenteral nutrition
Characteristics of studies awaiting assessment [ordered by study ID]
Anonymous 2003.
| Methods | Could not be found |
| Participants | |
| Interventions | |
| Outcomes | |
| Notes |
Cao 1995.
| Methods | Could not be found |
| Participants | |
| Interventions | |
| Outcomes | |
| Notes |
Cardona 1986.
| Methods | Could not be found |
| Participants | |
| Interventions | |
| Outcomes | |
| Notes |
Chai 1998.
| Methods | Could not be found |
| Participants | |
| Interventions | |
| Outcomes | |
| Notes |
Dai 1993.
| Methods | Could not be found |
| Participants | |
| Interventions | |
| Outcomes | |
| Notes |
Driver 1994.
| Methods | Could not be found |
| Participants | |
| Interventions | |
| Outcomes | |
| Notes |
Eckart 1992.
| Methods | Could not be found |
| Participants | |
| Interventions | |
| Outcomes | |
| Notes |
Guo 1998.
| Methods | Could not be found |
| Participants | |
| Interventions | |
| Outcomes | |
| Notes |
Hu 1996.
| Methods | Could not be found |
| Participants | |
| Interventions | |
| Outcomes | |
| Notes |
Huang 1990.
| Methods | Could not be found |
| Participants | |
| Interventions | |
| Outcomes | |
| Notes |
Huo 1998.
| Methods | Could not be found |
| Participants | |
| Interventions | |
| Outcomes | |
| Notes |
Jin 2000.
| Methods | Could not be found |
| Participants | |
| Interventions | |
| Outcomes | |
| Notes |
Kolacinski 1993.
| Methods | Could not be found |
| Participants | |
| Interventions | |
| Outcomes | |
| Notes |
Li 1993.
| Methods | Could not be found |
| Participants | |
| Interventions | |
| Outcomes | |
| Notes |
Li 2013.
| Methods | Could not be found |
| Participants | |
| Interventions | |
| Outcomes | |
| Notes |
Liu 1989.
| Methods | Could not be found |
| Participants | |
| Interventions | |
| Outcomes | |
| Notes |
Liu 1996.
| Methods | Could not be found |
| Participants | |
| Interventions | |
| Outcomes | |
| Notes |
Liu 1996a.
| Methods | Could not be found |
| Participants | |
| Interventions | |
| Outcomes | |
| Notes |
Lu 1997.
| Methods | Could not be found |
| Participants | |
| Interventions | |
| Outcomes | |
| Notes |
Lv 1995.
| Methods | Could not be found |
| Participants | |
| Interventions | |
| Outcomes | |
| Notes |
Mori 1992.
| Methods | Could not be found |
| Participants | |
| Interventions | |
| Outcomes | |
| Notes |
Rovera 1989.
| Methods | Could not be found |
| Participants | |
| Interventions | |
| Outcomes | |
| Notes |
Serrou 1982a.
| Methods | Could not be found |
| Participants | |
| Interventions | |
| Outcomes | |
| Notes |
Volkert 1996.
| Methods | Could not be found |
| Participants | |
| Interventions | |
| Outcomes | |
| Notes |
Wenzel 1968.
| Methods | Could not be found |
| Participants | |
| Interventions | |
| Outcomes | |
| Notes |
Wu 1995.
| Methods | Could not be found |
| Participants | |
| Interventions | |
| Outcomes | |
| Notes |
Wu 1996a.
| Methods | Could not be found |
| Participants | |
| Interventions | |
| Outcomes | |
| Notes |
Xue 1996.
| Methods | Could not be found |
| Participants | |
| Interventions | |
| Outcomes | |
| Notes |
Yoichi 1996.
| Methods | Could not be found |
| Participants | |
| Interventions | |
| Outcomes | |
| Notes |
Yu 1995.
| Methods | Could not be found |
| Participants | |
| Interventions | |
| Outcomes | |
| Notes |
Yu 1996.
| Methods | Could not be found |
| Participants | |
| Interventions | |
| Outcomes | |
| Notes |
Zeng 1997.
| Methods | Could not be found |
| Participants | |
| Interventions | |
| Outcomes | |
| Notes |
Zhen 1997.
| Methods | Could not be found |
| Participants | |
| Interventions | |
| Outcomes | |
| Notes |
Characteristics of ongoing studies [ordered by study ID]
Alim‐K.
| Trial name or title | Efficacy of parenteral nutrition in patients at the palliative phase of cancer (Alim‐K) |
| Methods | Multicenter randomised clinical trial, France |
| Participants | Hospitalised adults, aged > 18 years suffering from cancer at the palliative stage, i.e. patients in whom the main aim of treatment is to limit pain and discomfort, curative treatment has either been discontinued, or may still be ongoing but with little expected benefit in terms of overall survival. Life expectancy must be > 2 months, participants must have a functional digestive tract, present malnutrition defined as a BMI < 18.5 kg/m² in those aged < 70 years or < 21 kg/m² in those aged ≥70 years; or weight loss of 2% in 1 week, 5% in 1 month, or 10% in 6 months, participants with antalgic radiotherapy or scheduled to undergo palliative surgery; participants must already have a functional central venous catheter in place. Exclusion criteria: non‐functional digestive tract (intestinal occlusion, tumour compression, subocclusive peritoneal carcinosis), any disorder preventing oral ingestion (cancer of the upper aerodigestive tract, oesophagus or stomach); parenteral nutrition that is ongoing or dating from < 1 month; intravenous chemotherapy through a pump lasting > 48 hours, as this is incompatible with administration of parenteral nutritional through the central venous line; presence of gastrostomy or jejunostomy; persisting sensation of hunger in aphagic patients with haematological cancers undergoing bone marrow transplant, acute renal failure (defined as creatinine clearance < 30 ml/min) or heart failure (defined as a left ventricular ejection fraction < 30%); adult patients under legal guardianship unable to respond to the 'quality of life' questionnaire (due to psychiatric disorders, attention disorders, or cognitive disorders). Patients participating in another ongoing clinical trial |
| Interventions | Experimental group: Parenteral nutrition Control group: Standard care |
| Outcomes | Quality of life, survival, body weight, albumin, C‐Reactive Protein |
| Starting date | May 2014 |
| Contact information | raubry@chu‐besancon.fr |
| Notes | Status: Currently recruiting. Expected finish June 2016 NCT02151214 |
Games‐Lopez 2014.
| Trial name or title | Nutritional intervention program in malnourished patients admitted for heart failure (PICNIC) |
| Methods | Multicentre, randomised, blinded, controlled study |
| Participants | Hospitalised adults aged over 18 years who are admitted for acute heart failure, whether chronic and uncompensated or of new onset, in a state of malnutrition (score on the MNA < 17 points) at nutritional risk due to MNA. Expected number: 182 |
| Interventions | Experimental group: Diet optimisation, specific recommendations, nutritional supplements Control group: No intervention Co‐intervention: conventional treatment for heart failure |
| Outcomes | Quality of life (Minnesota living with heart failure questionnaire), morbidity, mortality, readmission |
| Starting date | 11th November 2011 |
| Contact information | jnlsbnll@hotmail.com |
| Notes | Status: terminated due to beneficial effect of the experimental group, no data has yet been reported. NCT01472237 |
NCT02517476.
| Trial name or title | Effect of early nutritional therapy on frailty, functional outcomes and recovery of undernourished medical inpatients trial (EFFORT) |
| Methods | Multicentre randomised clinical trial, Switzerland |
| Participants | Hospitalised adults at risk for undernutrition defined by the nutritional risk score (NRS 2002) and an expected hospital length of stay > 5 days, at nutritional risk according to screening tools. Expected number: 2000 ‐ 3000. Exclusion criteria: Initially admitted to critical care units (except intermediate care), scheduled for surgery or in an immediate postoperative state, unable to ingest oral nutrition and thus need for enteral or parenteral nutrition, admitted with, or scheduled for, total parenteral nutrition or tube‐feeding, currently under nutritional therapy (defined by at least 1 visit with a dietician in the last month), who are hospitalised because of anorexia nervosa, in terminal condition (end‐of‐life situation), hospitalised due to acute pancreatitis, hospitalised due to acute liver failure, earlier inclusion into this trial, cystic fibrosis, patients after gastric bypass operations, stem cell transplantation, any contraindication against nutritional therapy (i.e. enteral or parenteral or both) |
| Interventions | Experimental group: These guidelines specify a reinforced nutritional therapy strategy to cover nutritional requirements, focusing on nutritional targets based on the specific nutritional diagnoses defined by the IDNT. The nutritional guidelines may vary according to important medical diagnoses (e.g. renal failure). They specify not only nutritional targets, but also escalation of the route (e.g. food fortification, oral, enteral, parenteral) if targets cannot be achieved (≤ 75%) every 5 hours. Nutritional goals are being assessed daily in participants in the intervention group. Control group: Usual care ("appetite‐guided") controls |
| Outcomes | All‐cause mortality, admission to the ICU from the medical ward, major complications, unplanned hospital readmissions, decline in functional outcome from admission to day 30 assessed by Barthel`s index (‐10%); each single component of the primary endpoint, short‐term nutritional and functional outcomes from inclusion to day 10 or hospital discharge; hospital outcomes; 30‐day and 180‐day outcomes, Other safety endpoints including adverse gastrointestinal effects associated with nutritional therapy assessed daily until hospital discharge. |
| Starting date | July 30, 2015 |
| Contact information | schuetzph@gmail.com |
| Notes | Status: Recruiting NCT02517476 |
NCT02624752.
| Trial name or title | Oral nutrition supplementation in hospitalized patients (NutriSuP Oral) |
| Methods | Randomised clinical trial, Switzerland |
| Participants | Hospitalised adults admitted to a general medical ward and recruited within 48 hours, over the age of 65 years, and malnourished (subjective global assessment categories B or C patients), at nutritional risk according to a screening tool. Expected number: 60 participants Exclusion criteria: have an allergy or intolerance to any component of the oral supplement, are designated palliative care, are currently suffering from refeeding syndrome, have a pre‐existing medical condition that prevents oral intake of full fluids, or a contraindication to administration of fluid (i.e. are in volume overloaded state, are being given IV furosemide, or have end‐stage renal disease requiring renal replacement therapy with haemodialysis or peritoneal dialysis), have a diagnosis or suspicion of septic shock, have an expected length of stay of < 48 hours from the time of assessment, have suspected ischaemic stroke as cause for admission, reside in a residential care home, are unable to walk prior to current illness, are pregnant/breastfeeding, have a current diagnosis of diabetic ketoacidosis or hyperglycemic hyperosmolar syndrome |
| Interventions | Experimental group: 2 cans of Ensure (or similar product) a day while in hospital and will continue 2 cans a day of Ensure when discharged home until they have been receiving the enhanced ONS for a total of 90 days Control group: No intervention Co‐intervention: Standard care |
| Outcomes | Readmission rate, adherence to treatment |
| Starting date | December 4th 2015 |
| Contact information | stephanie.handsor@lhsc.on.ca |
| Notes | Status: not yet recruiting NCT02624752 |
NCT02632630.
| Trial name or title | Nutritional supplementation in hospitalized patients (NutriSuP) |
| Methods | Randomised clinical trial, Canada |
| Participants | Hospitalised adults with a Subjective Global Assessment (SGA) category B or C and have been hospitalised for < 48 hours, at nutritional risk according to a screening tool. Expected number: 100 Exclusion criteria: Have an allergy or intolerance to any component of the oral supplement or parenteral nutrition, have a contraindication to administration of IV fluid (i.e. are in volume overloaded state, are being given IV furosemide), are currently suffering from refeeding syndrome, have a pre‐existing medical condition that prevents oral intake of full fluids, have a diagnosis or suspicion of septic shock, have an expected length of stay of < 48 hours from the time of assessment, or have a current diagnosis of diabetic ketoacidosis or hyperglycaemic hyperosmolar syndrome |
| Interventions | Experimental group 1: Peripheral parenteral nutrition and enhanced oral supplementation
Control group 1: Peripheral parenteral nutrition and standard care for oral supplementation Experimental group 2: Standard care for parenteral fluid administration and enhanced oral supplementation; Control group 2: Standard care for parenteral fluid administration and standard of care for oral supplementation |
| Outcomes | Quality of life, physical function, and nutrition‐related variables |
| Starting date | December 3rd 2015 |
| Contact information | stephanie.handsor@lhsc.on.ca |
| Notes | Status: Not yet recruiting NCT02632630 |
Ridley 2015.
| Trial name or title | Supplemental parenteral nutrition in critically ill adults: a pilot randomised controlled trial |
| Methods | Stratified prospective multicentre unblinded randomised phase II study |
| Participants | Hospitalised adults Admitted to intensive care between 48 hours and 72 hours previously. Mechanically ventilated at the time of enrolment and expected to remain ventilated until the day after tomorrow. At least 16 years of age. Have central venous access suitable for PN solution administration. Have one or more organ system failure related to their acute illness, defined as: (a) PaO2/FiO2 ≤ 300 mmHg; b) Currently on one or more continuous vasopressor infusions which were started at least 4 hours ago at a minimum dose of: dopamine ≥ 5 mcg/kg/min, noradrenaline ≥ 0.1 mcg/kg/min, adrenaline ≥ 0.1 mcg/kg/min, any dose of vasopressin, milrinone > 0.25 mcg/kg/min). With r without renal dysfunction but currently has an intracranial pressure monitor or ventricular drain in situ, currently receiving extracorporeal membrane oxygenation. Currently has a ventricular assist device |
| Interventions | Experimental group: supplementary parenteral nutrition Control group: no intervention Co‐intervention: standard enteral nutrition |
| Outcomes | Energy amount in calories, antibiotic usage, sequential organ failure assessment score, mechanical ventilation duration, length of hospital stay, mortality, quality of life |
| Starting date | April 22nd 2013 |
| Contact information | emma.ridley@monash.edu |
| Notes | Last updated October 13th 2015 (still recruiting) NCT01847534 |
IDNT: Internation Dietetics and Nutrition Terminology
Differences between protocol and review
Added 'mixed' as a possibility in the subgroup comparing trials with different types of intervention.
We only require participants to be blinded for 'low risk of bias' for outcome assessment when assessing participant‐reported outcomes such as quality of life.
Changed the alpha from 3% to 2.5%. We had miscalculated the adjusted alpha according to Jakobsen 2014.
We performed post hoc Trial Sequential Analyses of the different modes of delivery and major surgery participants.
Adequate range was changed from '20 kcal/kg to 30 kcal/kg' into '20 kcal/kg to 35 kcal/kg'. In our original definition, participants receiving 30 ‐ 35 kcal/kg were not placed into any category. This did not change any of our results in terms of statistical significance.
We added that immuno‐nutrition include branched chain amino acid‐enriched formulas.
Solutions of dextrose/glucose of 5% to 10% are considered standard care, even if not explicitly stated in the trial.
Contributions of authors
Joshua Feinberg (JF): drafted the protocol, extracted data, co‐ordinated the review, conceived the review, designed the review, interpreted the data providing a methodological view, and revised the review. Emil Eik Nielsen (EEN): drafted the protocol, extracted data, drafted the review, interpreted the data providing a methodological view, and revised the review. Steven Kwasi Korang: extracted data and commented on the review. Kirstine Halberg Engell: extracted data and commented on the review. Marie Skøtt Rasmussen: extracted data and commented on the review. Kang Zhang: extracted data, co‐ordinated the Chinese data extraction, and commented on the review. Maria Didriksen: extracted data and commented on the review. Lisbeth Lund: extracted data and commented on the review. Niklas Lindahl: extracted data and commented on the review. Sara Hallum: extracted data and commented on the review. Xuemei Yang: extracted data and commented on the review. Ning Liang: extracted data and commented on the review. Wenjing Xiong: extracted data and commented on the review. Pernille Brunsgaard: extracted data and commented on the review. Alexandre Garioud: extracted data and commented on the review. Sanam Safi: extracted data and commented on the review. Jane Lindschou: revised the protocol and extracted data. Jens Kondrup: drafted the Background section of the protocol, interpreted the data by providing a clinical view, and commented on and revised the review. Christian Gluud: revised the protocol, interpreted the data providing a methodological and clinical view, commented on, and revised the review. Januc C. Jakobsen: revised the protocol, analysed the data, interpreted the data providing a methodological and clinical view, commented on, and revised the review.
Sources of support
Internal sources
-
The Copenhagen Trial Unit, Centre for Clinical Intervention Research, Rigshospitalet, Copenhagen, Denmark.
Salary for the review authors, use of offices and equipment, access to literature.
-
The Cochrane Hepato‐Biliary Group, Rigshospitalet, Copenhagen, Denmark.
Salary for the review authors, use of offices and equipment, access to literature.
External sources
No sources of support supplied
Declarations of interest
Joshua Feinberg: no conflict of interest. Emil Eik Nielsen: no conflict of interest. Steven Kwasi Korang: no conflict of interest. Kirstine Halberg Engell: no conflict of interest. Marie Skøtt Rasmussen: no conflict of interest. Kang Zhang: no conflict of interest. Maria Didriksen: no conflict of interest. Lisbeth Lund: no conflict of interest. Niklas Lindahl: no conflict of interest. Sara Hallum: no conflict of interest. Xuemei Yang: no conflict of interest. Ning Liang: no conflict of interest. Wenjing Xiong: no conflict of interest. Pernille Brunsgaard: no conflict of interest. Alexandre Garioud: no conflict of interest. Sanam Safi: no conflict of interest. Jane Lindschou: no conflict of interest. Jens Kondrup has been delivering bi‐annual lectures on nutrition support as part of his job at the Rigshospital, Denmark. JK is involved in an ongoing trial on a new enteral formula (developed by Nutricia) for which JK receives no payment. Christian Gluud: no conflict of interest. Januc C. Jakobsen: no conflict of interest.
New
References
References to studies included in this review
Abalan 1992 {published data only}
- Abalan F, Manciet G, Dartigues JF, Decamps A, Zapata E, Saumtally B, et al. Nutrition and SDAT. Biological Psychiatry 1992;31(1):103‐5. [DOI] [PubMed] [Google Scholar]
Abel 1976 {published data only}
- Abel RM, Fischer JE, Buckley MJ, Barnett GO, Austen GW. Malnutrition in cardiac patients: results of a prospective, randomized evaluation of early postoperative total parenteral nutrition (TPN). Acta Chirurgica Scandinavica 1976;466:77. [PubMed] [Google Scholar]
Abrishami 2010 {published data only}
- Abrishami R, Ahmadi A, Abdollahi M, Moosivand A, Khalili H, Najafi A, et al. Comparison the inflammatory effects of early supplemental parenteral nutrition plus enteral nutrition versus enteral nutrition alone in critically ill patients. Daru 2010;18(2):103‐6. [PMC free article] [PubMed] [Google Scholar]
Anbar 2014 {published data only}
- Anbar R, Beloosesky Y, Madar Z, Theilla M, Koren‐Hakim T, Weiss A, et al. Tight calorie control (TICACOS) in geriatric hip fracture patients. Clinical Nutrition, Supplement 2012;7(1):18. [DOI] [PubMed] [Google Scholar]
- Anbar R, Beloosesky, Y, Cohen J, Madar Z, Weiss A, Theilla M, et al. Tight calorie control in geriatric patients following hip fracture decreases complications: a randomized, controlled study. Clinical Nutrition 2014;33(1):23‐8. [DOI] [PubMed] [Google Scholar]
Aquilani 2008 {published data only}
- Aquilani R, Scocchi M, Boschi F, Viglio S, Iadarola P, Pastoris O, et al. Effect of calorie‐protein supplementation on the cognitive recovery of patients with subacute stroke. Nutritional Neuroscience 2008;11(5):235‐40. [DOI] [PubMed] [Google Scholar]
Arias 2008 {published data only}
- Arias S, Bruzzone I, Blanco V, Inchausti M, Garcia F, Casavieja G, et al. Identification and early nutritional support in hospitalized malnourished patients. Nutricion Hospitalaria 2008;23(4):348‐53. [PubMed] [Google Scholar]
Banerjee 1978 {published data only}
- Banerjee AK, Brocklehurst JC, Wainwright H, Swindell R. Nutritional status of long‐stay geriatric in‐patients: effects of a food supplement (Complan). Age and Ageing 1978;7(4):237‐43. [PUBMED: 103378] [DOI] [PubMed] [Google Scholar]
Barlow 2011 {published data only}
- Barlow R, Price P, Reid TD, Hunt S, Clark GW, Havard TJ, et al. Prospective multicentre randomised controlled trial of early enteral nutrition for patients undergoing major upper gastrointestinal surgical resection. Clinical Nutrition 2011;30(5):560‐6. [DOI] [PubMed] [Google Scholar]
- Reid TD, Barlow R, Davies LI, Price P, Lewis WG. Prospective randomised comparison of early enteral nutrition (EEN) in patients undergoing radical resection for oesophagogastric cancer. British Journal of Surgery 2010;97:32. [Google Scholar]
Barratt 2002a {published data only}
- Barratt SM, Smith RC, Kee AJ, Mather LE, Cousins MJ. Multimodal analgesia and intravenous nutrition preserves total body protein following major upper gastrointestinal surgery. Regional Anesthesia and Pain Medicine 2002;27(1):15‐22. [DOI] [PubMed] [Google Scholar]
Barratt 2002b {published data only}
Bastow 1983a {published data only}
- Bastow MD, Rawlings J, Allison SP. Benefits of supplementary tube feeding after fractured neck of femur: a randomised controlled trial. British Medical Journal 1983;287(6405):1589‐92. [PMC free article] [PubMed] [Google Scholar]
Bastow 1983b {published data only}
Bauer 2000 {published data only}
- Bauer P, Charpentier C, Bouchet C, Nace L, Raffy F, Gaconnet N. Parenteral with enteral nutrition in the critically ill. Intensive Care Medicine 2000;26(7):893‐900. [DOI] [PubMed] [Google Scholar]
Beier‐Holgersen 1999 {published data only}
- Beier‐Holgersen R, Boesby S. Influence of postoperative enteral nutrition on postsurgical infections. Gut 1996;39(6):833‐5. [DOI] [PMC free article] [PubMed] [Google Scholar]
- Beier‐Holgersen R, Brandstrup B. Influence of early postoperative enteral nutrition versus placebo on cell‐mediated immunity, as measured with the Multitest CMI. Scandinavian Journal of Gastroenterology 1999;34(1):98‐102. [DOI] [PubMed] [Google Scholar]
- Beier‐Holgersen R, Brandstrup B. Influence of postoperative enteral nutrition on cellular immunity. A random double‐blinded placebo controlled clinical trial. International Journal of Colorectal Disease 2012;27(4):513‐20. [DOI] [PubMed] [Google Scholar]
Bellantone 1988 {published data only}
- Bellantone R, Doglietto G, Bossola M, Pacelli F, Negro F, Sofo L. Preoperative parenteral nutrition of malnourished surgical patients. Acta Chirurgica Scandinavica 1988;154(4):249‐51. [PubMed] [Google Scholar]
Bokhorst‐de 2000 {published data only}
- Bokhorst‐De van der Schueren MA, Langendoen SI, Vondeling H, Kuik DJ, Quak JJ, Leeuwen PA. Perioperative enteral nutrition and quality of life of severely malnourished head and neck cancer patients: a randomized clinical trial. Clinical Nutrition 2000;19(6):437‐44. [DOI] [PubMed] [Google Scholar]
- Bokhorst‐De van der Schueren MA, Quak JJ, Blomberg‐van der Flier BM, Kuik DJ, Langendoen SI, Snow GB, et al. Effect of perioperative nutrition, with and without arginine supplementation, on nutritional status, immune function, postoperative morbidity, and survival in severely malnourished head and neck cancer patients. American Journal of Clinical Nutrition 2001;73(2):323‐32. [DOI] [PubMed] [Google Scholar]
Bonkovsky 1991a {published data only}
- Bonkovsky HL, Fiellin DA, Smith GS, Slaker DP, Simon D, Galambos JT. A randomized, controlled trial of treatment of alcoholic hepatitis with parenteral nutrition and oxandrolone. I. Short‐term effects on liver function. American Journal of Gastroenterology 1991;86(9):1200‐8. [PubMed] [Google Scholar]
Bonkovsky 1991b {published data only}
Botella‐Carretero 2008a {published data only}
- Botella‐Carretero JI, Iglesias B, Balsa JA, Zamarron I, Arrieta F, Vazquez C. Effects of oral nutritional supplements in normally nourished or mildly undernourished geriatric patients after surgery for hip fracture: a randomized clinical trial. Journal of Parenteral and Enteral Nutrition 2008;32(2):120‐8. [DOI] [PubMed] [Google Scholar]
Botella‐Carretero 2008b {published data only}
Botella‐Carretero 2010 {published data only}
- Botella‐Carretero JI, Iglesias B, Balsa JA, Zamarron I, Arrieta F, Vazquez C. Perioperative oral nutritional supplements in normally or mildly undernourished geriatric patients submitted to surgery for hip fracture: a randomized clinical trial. Clinical Nutrition 2010;29(5):574‐9. [DOI] [PubMed] [Google Scholar]
Breedveld‐Peters {published data only}
- Breedveld‐Peters JJ, Reijven PL, Wyers CE, Helden S, Arts JJ, Meesters B, et al. Integrated nutritional intervention in the elderly after hip fracture. A process evaluation. Clinical Nutrition 2012;31(2):199‐205. [DOI] [PubMed] [Google Scholar]
- Rannou F. Designing an RCT to assess the effectiveness of a nutritional intervention after hip surgery. Focus on Alternative and Complementary Therapies 2011;16(1):80‐1. [Google Scholar]
- Wyers C, Reijven PL, Evers SM, Willems PC, Heyligers IC, Verburg AD, et al. Cost‐effectiveness of nutritional intervention in elderly subjects after hip fracture: a randomized controlled trials. Clinical Nutrition, Supplement 2012;7(1):49. [DOI] [PMC free article] [PubMed] [Google Scholar]
- Wyers C, Reijven PL, Evers SM, Willems PC, Heyligers IC, Verburg AD, et al. Cost‐effectiveness of nutritional intervention in hip fracture patients: a multi‐centre randomised controlled trial (RCT). 2012 Clinical Nutrition, Supplement;7(1):49. [DOI] [PMC free article] [PubMed] [Google Scholar]
- Wyers CE, Breedveld‐Peters JJ, Reijven PL, Arts C, Thomassen BJ, Verburg AD, et al. Effect of nutritional intervention on nutritional intake and status in hip fracture patients: a multicentre randomised controlled trial (RCT). Clinical Nutrition, Supplement. 2012;7(1):50‐1. [Google Scholar]
- Wyers CE, Reijven PL, Breedveld‐Peters JJ, Helden S, Schotanus M, Meesters B, et al. Effect of nutritional intervention on length of stay, postoperative complications, functional status and mortality in hip fracture patients: A multi‐centre randomised controlled trial (RCT). Clinical Nutrition, Supplement 2012;7(1):51. [Google Scholar]
Brennan 1994 {published data only}
- Brennan MF, Pisters PW, Posner M, Quesada O, Shike M. A prospective randomized trial of total parenteral nutrition after major pancreatic resection for malignancy. Annals of Surgery 1994;220(4):436‐41; discussion 441‐4. [DOI] [PMC free article] [PubMed] [Google Scholar]
Brown 1992 {published data only}
- Brown KM, Seabrook NA. Effect of nutrition on recovery after fractured femur. Medical Audit News 1992;2(1):10‐2. [Google Scholar]
Brown 1995 {published data only}
- Brown DN, Miedema BW, King PD, Marshall JB. Safety of early feeding after percutaneous endoscopic gastrostomy. Journal of Clinical Gastroenterology 1995;21(4):330‐1. [DOI] [PubMed] [Google Scholar]
Bunout 1989 {published data only}
- Bunout D, Aicardi V, Hirsch S, Petermann M, Kelly M, Silva G, et al. Nutritional support in hospitalized patients with alcoholic liver disease. European Journal of Clinical Nutrition 1989;43(9):615‐21. [PUBMED: 2691239] [PubMed] [Google Scholar]
Caglayan 2012 {published data only}
- Caglayan K, Oner I, Gunerhan Y, Ata P, Koksal N, Ozkara S. The impact of preoperative immunonutrition and other nutrition models on tumor infiltrative lymphocytes in colorectal cancer patients. American Journal of Surgery 2012;204(4):416‐21. [DOI] [PubMed] [Google Scholar]
Campbell 2008 {published data only}
- Campbell KL, Ash S, Bauer JD. The impact of nutrition intervention on quality of life in pre‐dialysis chronic kidney disease patients. Clinical Nutrition 2008;27(4):537‐44. [DOI] [PubMed] [Google Scholar]
Capellá 1990 {published data only}
- Capellá G, Ruiz JM, Hidalgo L, Alonso M, Salvador R, Cardona D. Value of parenteral nutrition in total gastrectomy for cancer. A prospective study. Nutrición Hospitalaria Organo Oficial de la Sociedad Española de Nutrición Parenteral y Enteral 1990;5(5):317‐21. [PubMed] [Google Scholar]
Carr 1996 {published data only}
- Carr CS, Ling KD, Boulos P, Singer M. Randomised trial of safety and efficacy of immediate postoperative enteral feeding in patients undergoing gastrointestinal resection. BMJ (Clinical research ed.) 1996;312(7035):869‐71. [PUBMED: 8611872] [DOI] [PMC free article] [PubMed] [Google Scholar]
Carver 1995 {published data only}
- Carver AD, Dobson AM. Effects of dietary supplementation of elderly demented hospital residents. Journal of Human Nutrition and Dietetics 1995;8(6):389‐94. [Google Scholar]
Casaer 2011 {published data only}
- Casaer MP, Langouche L, Coudyzer W, Vanbeckevoort D, Dobbelaer B, Guiza FG, et al. Impact of early parenteral nutrition on muscle and adipose tissue compartments during critical illness. Critical Care Medicine 2013;41(10):2298‐309. [DOI] [PubMed] [Google Scholar]
- Casaer MP, Mesotten D, Hermans G, Wouters PJ, Schetz M, Meyfroidt G, et al. Early versus late parenteral nutrition in critically ill adults. New England Journal of Medicine 2011;365(6):506‐17. [PUBMED: 21714640] [DOI] [PubMed] [Google Scholar]
- Casaer MP, Wilmer A, Hermans G, Wouters PJ, Mesotten D, Berghe G, et al. Role of disease and macronutrient dose in the randomized controlled EPaNIC trial: a post hoc analysis (EPANIC). American Journal of Respiratory and Critical Care Medicine 2013;187(3):247‐55. [DOI] [PubMed] [Google Scholar]
- Gunst J, Vanhorebeek I, Casaer MP, Hermans G, Wouters PJ, Dubois J, et al. Impact of early parenteral nutrition on metabolism and kidney injury. Journal of the American Society of Nephrology 2013;24(6):995‐1005. [DOI] [PMC free article] [PubMed] [Google Scholar]
- Hermans G, Clerckx B, Vanhullebusch T, Bruyninckx F, Casaer M, MeerssemanP, et al. Withholding parenteral nutrition for 1 week reduces ICU‐acquired weakness. Critical Care 2013;17:S94‐S95. [Google Scholar]
- Langouche L, Casaer MP, Coudyzer W, Vanbeckevoort D, Dobbelaer B, Guiza FG, et al. Impact of early parenteral nutrition on muscle and adipose tissue compartments during critical illness. Critical Care 2013;17:S95. [DOI] [PubMed] [Google Scholar]
- Vanderheyden S, Casaer MP, Kesteloot K, Simoens S, Rijdt T, Peers G, et al. Early versus late parenteral nutrition in ICU patients: cost analysis of the EPANIC trial. Critical Care 2012;16(3):R96. [DOI] [PMC free article] [PubMed] [Google Scholar]
- Vanwijngaerden YM, Langouche L, Brunner R, Debaveye Y, Gielen M, Casaer M, et al. Withholding parenteral nutrition during the first week of critical illness increases plasma bilirubin but lowers the incidence of cholestasis and gallbladder sludge. Hepatology (Baltimore, Md.) 2014;60(1):202‐10. [DOI] [PubMed] [Google Scholar]
Caulfield 2012 {published data only}
- Caulfield C. Examining the benefits of an oral nutritional supplement (ONS) with regard to its safety, tolerance and clinical efficacy in improving nutritional status of undernourished, hospitalised patients. Clinical Nutrition, Supplement 2012;7(1):280. [Google Scholar]
Chen 1995a {published data only}
- Chen QP, Bian FG, Fei JC. Clinical study on enteral nutrition in different periods after major abdominal operations. Chinese Journal of Clinical Nutrition 1995;3(1):26‐9. [Google Scholar]
Chen 1995b {published data only}
Chen 2000a {published data only}
- Chen QP, Ou K, Zhao HM, Zhou X, Xin X. Effect of early enteral nutrition on T lymphocyte subset after abdominal operation. World Chinese Journal of Gastroenterology 2000;8(12):1438‐9. [Google Scholar]
Chen 2000b {published data only}
Chen 2006 {published data only}
- Chen GX, Han CM. Economic evaluation of early enteral nutrition in severely burned patients. Chinese Journal of Clinical Nutrition 2006;14(1):7‐10. [Google Scholar]
Choudhry 1996 {published data only}
- Choudhry U, Barde CJ, Markert R, Gopalswamy N. Percutaneous endoscopic gastrostomy: a randomized prospective comparison of early and delayed feeding. Gastrointestinal Endoscopy 1996;44(2):164‐7. [DOI] [PubMed] [Google Scholar]
Chourdakis 2012 {published data only}
- Chourdakis M, Kraus MM, Tzellos T, Sardeli C, Peftoulidou M, Vassilakos D, et al. Effect of early compared with delayed enteral nutrition on endocrine function in patients with traumatic brain injury: an open‐labeled randomized trial. Journal of Parenteral and Enteral Nutrition 2012;36(1):108‐16. [DOI] [PubMed] [Google Scholar]
Chuntrasakul 1996 {published data only}
- Chuntrasakul C, Siltharm S, Chinswangwatanakul V, Pongprasobchai T, Chockvivatanavanit S, Bunnak A. Early nutritional support in severe traumatic patients. Journal of the Medical Association of Thailand 1996; Vol. 79, issue 1:21‐6. [PubMed]
Cicco 1993 {published data only}
- Cicco M, Panarello G, Fantin D, Veronesi A, Pinto A, Zagonel V, et al. Parenteral nutrition in cancer patients receiving chemotherapy: effects on toxicity and nutritional status. Journal of Parenteral and Enteral Nutrition 1993;17(6):513‐8. [DOI] [PubMed] [Google Scholar]
Clamon 1985 {published data only}
- Clamon G, Gardner L, Pee D, Stumbo P, Feld R, Evans W, et al. The effect of intravenous hyperalimentation on the dietary intake of patients with small cell lung cancer. A randomized trial. Cancer 1985;55(7):1572‐8. [DOI] [PubMed] [Google Scholar]
- Evans WK, Makuch R, Clamon GH, Feld R, Weiner RS, Moran E, et al. Limited impact of total parenteral nutrition on nutritional status during treatment for small cell lung cancer. Cancer Research 1985;45(7):3347‐53. [PubMed] [Google Scholar]
Delmi 1990 {published data only}
- Delmi M, Rapin CH, Bengoa JM, Delmas PD, Vasey H, Bonjour JP. Dietary supplementation in elderly patients with fractured neck of the femur. Lancet 1990;335(8696):1013‐6. [DOI] [PubMed] [Google Scholar]
Dennis 2005 {published data only}
- Dennis M, Lewis S, Cranswick G, Forbes J. FOOD: a multicentre randomised trial evaluating feeding policies in patients admitted to hospital with a recent stroke. Health Technology Assessment 2006;10:iii‐iv, ix‐x, 1‐120. [DOI] [PubMed] [Google Scholar]
- Dennis MS, Lewis SC, Warlow C. Routine oral nutritional supplementation for stroke patients in hospital (FOOD): a multicentre randomised controlled trial. Lancet 2005; Vol. 365, issue 9461:755‐63. [DOI] [PubMed]
Dennis 2006 {published data only}
- Clarke J, Cranswick G, Dennis MS, Flaig R, Fraser A, Grant S, et al. Effect of timing and method of enteral tube feeding for dysphagic stroke patients (FOOD): a multicentre randomised controlled trial. Lancet 2005;365(9461):764‐72. [DOI] [PubMed] [Google Scholar]
- Clarke J, Cranswick G, Dennis MS, Flaig R, Fraser A, Grant S, et al. Effect of timing and method of enteral tube feeding for dysphagic stroke patients (FOOD): a multicentre randomised controlled trial. Lancet 2005;365(9461):764‐72. [DOI] [PubMed] [Google Scholar]
- Dennis M, Lewis S, Cranswick G, Forbes J. FOOD: a multicentre randomised trial evaluating feeding policies in patients admitted to hospital with a recent stroke. Health Technology Assessment 2006;10:iii‐iv, ix‐x, 1‐120. [DOI] [PubMed] [Google Scholar]
De Sousa 2012 {published data only}
- Sousa OL, Amaral TF. Three‐week nutritional supplementation effect on long‐term nutritional status of patients with mild Alzheimer disease. Alzheimer Disease and Associated Disorders 2012;26(2):119‐23. [DOI] [PubMed] [Google Scholar]
Ding 2009 {published data only}
- Ding GP, Chen P, Yi ZB, Zheng Q. Roles of nutrition risk screening and preventive enteral nutritional support before radical resection of gastric cancer. Chinese Journal of Gastrointestinal Surgery 2009;12(2):141‐4. [PubMed] [Google Scholar]
Dionigi 1991 {published data only}
- Dionigi P, Jemos V, Cebrelli T, Ferrari C, Ferrari A, Berizzi F, et al. Pre‐operative nutritional support and tumour cell kinetics in malnourished patients with gastric cancer. Clinical Nutrition 1991;10(Spec Suppl):77‐84. [DOI] [PubMed] [Google Scholar]
Doglietto 1990 {published data only}
- Doglietto GB, Bellantone R, Bossola M, Pacelli F, Negro F, Crucitti F. Preoperative parenteral nutritional support in gastric cancer. Nutrition 1990;6(3):256‐7. [PubMed] [Google Scholar]
Doglietto 1996 {published data only}
- Doglietto GB, Gallitelli L, Pacelli F, Bellantone R, Malerba M, Sgadari A, et al. Protein‐sparing therapy after major abdominal surgery: lack of clinical effects. Protein‐Sparing Therapy Study Group. Annals of Surgery 1996;223(4):357‐62. [DOI] [PMC free article] [PubMed] [Google Scholar]
Dölp 1987 {published data only}
- Dölp R, Grunert A, Schmitz E, Ahnefeld FW. Clinical studies of peripheral venous parenteral nutrition. Effect of a 3.5% amino acid solution on postoperative metabolism with special reference to amino acid homeostasis. Infusionstherapie und Klinische Ernahrung 1987;14(1):10‐6. [PubMed] [Google Scholar]
Dong 1996 {published data only}
- Dong MF, Qiao YZ, Yin G, Zhou SL, Ma SJ. Employment of duodenal nutrition pipe in esophageal surgery. Parenteral and Enteral Nutrition 1996;3(3):209‐11. [Google Scholar]
Drott 1988 {published data only}
- Drott C, Unsgaard B, Schersten T, Lundholm K. Total parenteral nutrition as an adjuvant to patients undergoing chemotherapy for testicular carcinoma: Protection of body composition. A randomized, prospective study. Surgery 1988;103(5):499‐506. [PubMed] [Google Scholar]
Duncan 2006 {published data only}
- Duncn DG, Beck SJ, Hood K, Johansen A. Using dietetic assistants to improve the outcome of hip fracture: a randomised controlled trial of nutritional support in an acute trauma ward. Age and Ageing 2006;35(2):148‐53. [DOI] [PubMed] [Google Scholar]
Dvorak 2004 {published data only}
- Dvorak MF, Noonan VK, Belanger L, Bruun B, Wing PC, Boyd MC, et al. Early versus late enteral feeding in patients with acute cervical spinal cord injury ‐ A pilot study. Spine 2004;29(5):E175‐80. [DOI] [PubMed] [Google Scholar]
Elbers 1997 {published data only}
- Elbers M, Awwad E, Scharfstädt A, Drücke D, Löhlein D. [Effekte einer postoperativen, oralen, supplementären, proteinreichen Substratzufuhr auf Körperzusammensetzung, Proteinstatus and Lebensqualität bei Magenkarzinom‐Patienten]. Aktuelle Ernahrungsmedizin 1997;22:69‐75. [Google Scholar]
Elimam 2001 {published data only}
- Elimam A, Tjader I, Norgren S, Wernerman J, Essen P, Ljungqvist O, et al. Total parenteral nutrition after surgery rapidly increases serum leptin levels. European Journal of Endocrinology 2001;144(2):123‐8. [DOI] [PubMed] [Google Scholar]
Eneroth 2005 {published data only}
- Eneroth M, Olsson UB, Thorngren KG. Insufficient fluid and energy intake in hospitalised patients with hip fracture. A prospective randomised study of 80 patients. Clinical Nutrition 2005;24(2):297‐303. [DOI] [PubMed] [Google Scholar]
- Eneroth M, Olsson UB, Thorngren KG. Nutritional supplementation decreases hip fracture‐related complications. Clinical Orthopaedics and Related Research 2006;451:212‐7. [DOI] [PubMed] [Google Scholar]
Espaulella 2000 {published data only}
- Espaulella J, Guyer H, Diaz‐Escriu F, Mellado‐Navas JA, Castells M, Pladevall M. Nutritional supplementation of elderly hip fracture patients. A randomized, double‐blind, placebo‐controlled trial. Age and Ageing 2000;29(5):425‐31. [DOI] [PubMed] [Google Scholar]
Essén 1993 {published data only}
- Essén P, McNurlan MA, Sonnenfeld T, Milne E, Vinnars E, Wernerman J, et al. Muscle protein synthesis after operation: effects of intravenous nutrition. European Journal of Surgery 1993;159(4):195‐200. [PubMed] [Google Scholar]
Eyer 1993 {published data only}
- Eyer SD, Micon LT, Konstantinides FN, Edlund DA, Rooney KA, Luxenberg MG, et al. Early enteral feeding does not attenuate metabolic response after blunt trauma. Journal of Trauma 1993;34(5):639‐43; discussion 643‐4. [DOI] [PubMed] [Google Scholar]
Fan 1989 {published data only}
- Fan ST, Lau WY, Wong KK, Chan YPM. Pre‐operative parenteral nutrition in patients with oesophageal cancer: a prospective, randomised clinical trial. Clinical Nutrition 1989;8(1):23‐7. [DOI] [PubMed] [Google Scholar]
Fan 1994 {published data only}
- Fan ST, Lo CM, Lai EC, Chu KM, Liu CL, Wong J, et al. Perioperative nutritional support in patients undergoing hepatectomy for hepatocellular carcinoma. New England Journal of Medicine 1994;331(23):1547‐52. [DOI] [PubMed] [Google Scholar]
- Ziegler TR. Perioperative nutritional support in patients undergoing hepatectomy for hepatocellular carcinoma. Journal of Parenteral and Enteral Nutrition 1996;20(1):91‐2. [DOI] [PubMed] [Google Scholar]
Fasth 1987 {published data only}
- Fasth S, Hulten L, Magnusson O, Nordgren S, Warnold I. Postoperative complications in colorectal surgery in relation to preoperative clinical and nutritional state and postoperative nutritional treatment. International Journal of Colorectal Disease 1987;2(2):87‐92. [DOI] [PubMed] [Google Scholar]
- Fasth S, Hulten L, Magnusson O, Nordgren S, Warnold I. The immediate and long‐term effects of postoperative total parenteral nutrition on body composition. International Journal of Colorectal Disease 1987;2(3):139‐45. [DOI] [PubMed] [Google Scholar]
Figuerasfelip 1986 {published data only}
- Figuerasfelip J, Rafecasrenau A, Sitgesserra A, Puiggris P, Pisiques F, Colomer J, et al. Does peripheral hypocaloric parenteral‐nutrition benefit the postoperative‐patient ‐ results of a multicentric randomized trial. Clinical Nutrition 1986;5(2):117‐21. [DOI] [PubMed] [Google Scholar]
Fletcher 1986a {published data only}
- Fletcher JP, Little JM. A comparison of parenteral nutrition and early postoperative enteral feeding on the nitrogen balance after major surgery. Surgery 1986;100(1):21‐4. [PubMed] [Google Scholar]
Fletcher 1986b {published data only}
Foschi 1986 {published data only}
- Foschi D, Cavagna G, Callioni F, Morandi E, Rovati V. Hyperalimentation of jaundiced patients on percutaneous transhepatic biliary drainage. British Journal of Surgery 1986;73(9):716–9. [DOI] [PubMed] [Google Scholar]
Førli 2001 {published data only}
- Førli L, Pedersen JI, Bjørtuft Ø, Vatn M, Boe J. Dietary support to underweight patients with end‐stage pulmonary disease assessed for lung transplantation. Respiration 2001;68(1):51‐7. [DOI] [PubMed] [Google Scholar]
Gariballa 1998 {published data only}
- Gariballa SE, Parker SG, Taub N, Castleden CM. A randomized, controlled, a single‐blind trial of nutritional supplementation after acute stroke. Journal of Parenteral and Enteral Nutrition 1998;22(5):315‐9. [DOI] [PubMed] [Google Scholar]
Gariballa 2006 {published data only}
- Gariballa S, Forster S. Effects of dietary supplements on depressive symptoms in older patients: a randomised double‐blind placebo‐controlled trial. Clinical Nutrition 2007;26(5):545‐51. [DOI] [PubMed] [Google Scholar]
- Gariballa S, Forster S, Walters S, Power H. A randomized, double‐blind, placebo‐controlled trial of nutritional supplementation during acute illness. American Journal of Medicine 2006;119(7‐8):693‐9. [DOI] [PubMed] [Google Scholar]
Gazzotti 2003 {published data only}
- Gazzotti C, Arnaud‐Battandier F, Parello M, Farine S, Seidel L, Albert A, et al. Prevention of malnutrition in older people during and after hospitalisation: results from a randomised controlled clinical trial. Age and Ageing 2003;32(3):321‐5. [DOI] [PubMed] [Google Scholar]
Gong 2011 {published data only}
- Gong YZ, Zhang ST, Zhang HF, Wu HB, Chen SJ, Zhu ST, et al. Effects of enteral nutrition on intestinal permeability in patients with active ulcerative colitis. Chinese Journal of Clinical Nutrition 2011;19(4):232‐5. [Google Scholar]
Gunerhan 2009 {published data only}
- Gunerhan Y, Koksal N, Sahin UY, Uzun MA, Eksioglu‐Demiralp E. Effect of preoperative immunonutrition and other nutrition models on cellular immune parameters. World Journal of Gastroenterology 2009;15(4):467‐72. [DOI] [PMC free article] [PubMed] [Google Scholar]
Gupta 1998 {published data only}
- Gupta R, Patel K, Primrose JN, Yaqoob P, Calder P, Johnson CD. Oxidative stress in patients receiving early enteral nutrition following operations for hepatic or pancreatic disease. Digestion 1998;59(3):248. [Google Scholar]
Guy 1995 {published data only}
- Guy S, Tanzer‐Torres G, Palese M, Sheiner P, Mor E, Emre S, et al. Does nasoenteral nutritional support reduce mortality after liver transplant?. Hepatology (Baltimore, Md.) 1995;22:144A. [Google Scholar]
Ha 2010 {published data only}
- Ha L, Hauge T, Spenning AB, Iversen PO. Individual, nutritional support prevents undernutrition, increases muscle strength and improves QoL among elderly at nutritional risk hospitalized for acute stroke: a randomized, controlled trial. BMC Geriatrics 2010;29:567‐73. [DOI] [PubMed] [Google Scholar]
Hartgrink 1998 {published data only}
- Hartgrink HH, Wille J, König P, Hermans J, Breslau PJ. Pressure sores and tube feeding in patients with a fracture of the hip: a randomized clinical trial. Clinical Nutrition 1998;17(6):287‐92. [DOI] [PubMed] [Google Scholar]
Hasse 1995 {published data only}
- Hasse JM, Blue LS, Liepa GU, Goldstein RM, Jennings LW, Mor E, et al. Early enteral nutrition support in patients undergoing liver transplantation. Journal of Parenteral and Enteral Nutrition 1995;19(6):437‐43. [DOI] [PubMed] [Google Scholar]
Heidegger 2013 {published data only}
- Berger M, Brancato V, Graf S, Heidegger C, Darmon P, Pichard C. SPN study: Supplemental Parenteral Nutrition (PN) to reach energy target does not compromise glucose control. Clinical Nutrition, Supplement 2011;6(1):11‐2. [Google Scholar]
- Graf S, Berger MM, Clerc A, Brancato V, Heidegger CP, Pichard C. SPN study: Supplemental Parenteral Nutrition (SPN) to reach energy target does not compromise glucose control. Clinical Nutrition, Supplement 2012;7(1):138‐9. [Google Scholar]
- Heidegger CP, Berger MM, Graf S, Zingg W, Darmon P, Costanza MC, et al. Optimisation of energy provision with supplemental parenteral nutrition in critically ill patients: a randomised controlled clinical trial. Lancet 2013;381(9864):385‐93. [DOI] [PubMed] [Google Scholar]
- Heidegger CP, Graf S, Thibault R, Darmon P, Berger M, Pichard C. Supplemental parenteral nutrition (SPN) in intensive care unit (ICU) patients for optimal energy coverage: improved clinical outcome. Clinical Nutrition, Supplement 2011;6(1):2‐3. [Google Scholar]
Heim 1985 {published data only}
- Heim M E, Leweling H, Edler L, Queisser W. Adjuvant parenteral nutrition in patients with colorectal cancer receiving polychemotherapy: a randomized clinical trial. Tumor, Diagnostik & Therapie 1985;6(4):129‐33. [Google Scholar]
Hendry 2010 {published data only}
- Hendry PO, Dam RM, Bukkems SF, McKeown DW, Parks RW, Preston T, et al. Randomized clinical trial of laxatives and oral nutritional supplements within an enhanced recovery after surgery protocol following liver resection. British Journal of Surgery 2010;97(8):1198‐206. [DOI] [PubMed] [Google Scholar]
Henriksen 2003a {published data only}
- Henriksen MG, Hessov I, Dela F, Hansen HV, Haraldsted V, Rodt SA. Effects of preoperative oral carbohydrates and peptides on postoperative endocrine response, mobilization, nutrition and muscle function in abdominal surgery. Acta Anaesthesiologica Scandinavica 2003;47(2):191‐9. [DOI] [PubMed] [Google Scholar]
Henriksen 2003b {published data only}
Herndon 1987 {published data only}
- Herndon DN, Barrow RE, Stein M, Linares H, Rutan TC, Rutan R, et al. Increased mortality with intravenous supplemental feeding in severely burned patients. Journal of Burn Care and Rehabilitation 1989;10(4):309‐13. [DOI] [PubMed] [Google Scholar]
- Herndon DN, Stein MD, Rutan TC, Abston S, Linares H. Failure of TPN supplementation to improve liver function, immunity, and mortality in thermally injured patients. Journal of Trauma 1987;27(2):195‐204. [DOI] [PubMed] [Google Scholar]
Heys 1991 {published data only}
- Heys SD, Park KGM, McNurlan MA, Milne E, Eremin O, Wernerman J, et al. Stimulation of protein‐synthesis in human tumors by parenteral‐nutrition ‐ evidence for modulation of tumor‐growth. British Journal of Surgery 1991;78(4):483‐7. [DOI] [PubMed] [Google Scholar]
Hickson 2004 {published data only}
- Hickson M, Bulpitt C, Nunes M, Peters R, Cooke J, Nicholl C, et al. Does additional feeding support provided by health care assistants improve nutritional status and outcome in acutely ill older in‐patients? A randomised control trial. Clinical Nutrition 2004;23(1):69‐77. [DOI] [PubMed] [Google Scholar]
Hill 2002 {published data only}
- Charash WE, Kearney PA, Annis KA, Hill DB, Magnuson BL, Ryzowicz TA, et al. Early enteral feeding associated with an attenuation of the acute phase cytokine response and improved outcome following multiple trauma. Journal of Trauma 1994;37:1015. [Google Scholar]
- Hill DB, Kearney P, Magnuson B, Charash W, Annis K, McClain C. Effects of route and timing of nutrition support in critically ill patients. Gastroenterology 2002;122:A‐38. [Google Scholar]
Hoffmann 1988 {published data only}
- Hoffmann E, Hansen BB, Owen‐Falkenberg T, Djorup J. Total parenteral nutrition in colon surgery. Ugeskrift for Laeger 1988;150(21):1277‐9. [PubMed] [Google Scholar]
Holter 1977 {published data only}
- Holter AR, Fischer JE. The effects of perioperative hyperalimentation on complications in patients with carcinoma and weight loss. Journal of Surgical Research 1977;23(1):31‐4. [DOI] [PubMed] [Google Scholar]
- Holter AR, Rosen HM, Fischer JE. The effects of hyperalimentation on major surgery in patients with malignant disease: a prospective study. Acta Chirurgica Scandinavica ‐ Supplementum 1976;466:86‐7. [PubMed] [Google Scholar]
Holyday 2012 {published data only}
- Holyday M, Daniells S, Bare M, Caplan G A, Petocz P, Bolin T. Malnutrition screening and early nutrition intervention in hospitalised patients in acute aged care: a randomised controlled trial. Journal of Nutrition, Health and Aging 2012;16(6):562‐8. [DOI] [PubMed] [Google Scholar]
Houwing 2003 {published data only}
- Houwing RH, Rozendaal M, Wouters‐Wesseling W, Beulens JW, Buskens E, Haalboom JR. A randomised, double‐blind assessment of the effect of nutritional supplementation on the prevention of pressure ulcers in hip‐fracture patients. Clinical Nutrition 2003;22(4):401‐5. [DOI] [PubMed] [Google Scholar]
Hsu 2000a {published data only}
- Hsu TC, Leu SC, Su CF, Huang PC, Tsai LF, Tsai SL. Assessment of intragastric pH value changes after early nasogastric feeding. Nutrition 2000;16(9):751‐4. [DOI] [PubMed] [Google Scholar]
Hsu 2000b {published data only}
Hsu 2000c {published data only}
Hu 1998 {published data only}
- Hu SS, Fontaine F, Kelly B, Bradford DS. Nutritional depletion in staged spinal reconstructive surgery. The effect of total parenteral nutrition. Spine 1998;23(12):1401‐5. [DOI] [PubMed] [Google Scholar]
Huynh 2015 {published data only}
- Huynh DTT, Devitt AA, Paule CL, Reddy BR, Marathe P, Hegazi RA, et al. Effects of oral nutritional supplementation in the management of malnutrition in hospital and post‐hospital discharged patients in India: a randomised, open‐label, controlled trial. Journal of Human Nutrition and Dietetics 2015;28(4):331‐43. [DOI] [PubMed] [Google Scholar]
Hwang 1991 {published data only}
- Hwang TL, Huang SL, Chen MF. Early nasoduodenal feeding for the post‐biliary surgical patient. Journal of the Formosan Medical Association 1991;90(10):993‐7. [PubMed] [Google Scholar]
Inoue 1993 {published data only}
- Inoue Y, Espat NJ, Frohnapple DJ, Epstein H, Copeland EM, Souba WW. Effect of total parenteral‐nutrition on amino‐acid and glucose‐transport by the human small‐intestine. Annals of Surgery 1993;217(6):604‐14. [DOI] [PMC free article] [PubMed] [Google Scholar]
Iresjö 2008 {published data only}
- Iresjö BM, Körner U, Hyltander A, Ljungman D, Lundholm K. Initiation factors for translation of proteins in the rectus abdominis muscle from patients on overnight standard parenteral nutrition before surgery. Clinical Science 2008;114(9):603‐10. [DOI] [PubMed] [Google Scholar]
Itou 2011 {published data only}
- Itou M, Kawaguchi T, Taniguchi E, Oriishi T, Suetsugu T, Hano R, et al. Supplementation before endoscopic therapy for esophageal varices reduces mental stress in patients with liver cirrhosis. Hepato‐Gastroenterology 2011;58(107‐108):814‐8. [PubMed] [Google Scholar]
Jauch 1995a {published data only}
- Jauch KW, Kroner G, Hermann A, Inthorn D, Hartl W, Gunther B. Postoperative infusion therapy ‐ A comparison of electrolyte solution with hypocaloric glucose or xylitol/sorbitol‐aminoacid solutions. Zentralblatt Fur Chirurgie 1995;120(9):682‐8. [PubMed] [Google Scholar]
Jauch 1995b {published data only}
Jensen 1982 {published data only}
- Jensen S, Ginnerup P. Complete parenteral nutrition peri‐operatively for patients with rectal adenocarcinoma. Nitrogen balance and the clinical course. Ugeskrift for Laeger 1982;144(7):460‐3. [PubMed] [Google Scholar]
Ji 1999 {published data only}
- Ji F, Yan M, Yin HR. Early postoperative enteral nutrition support after digestive tract surgery. Chinese Journal of Clinical Nutrition 1999;7(4):150‐4. [Google Scholar]
Jiang 2006a {published data only}
- Jiang YJ, Kong XJ, Cheng G, Tian ZB. Effects of reasonable preoperative nutrition on recoveries of gastrointestinal cancer patients. World Chinese Journal of Digestology 2006;14(19):1928‐32. [Google Scholar]
Jiang 2006b {published data only}
Jimenez 1995a {published data only}
- Jiménez FJJ, Leyba CO, Jiménez LMJ, Valdecasas MSG, Montero JG. Study of hypocaloric peripheral parenteral‐nutrition in postoperative‐patients (Europan Project). Clinical Nutrition 1995;14(2):88‐96. [DOI] [PubMed] [Google Scholar]
- Jiménez JiménezFJ, Ortiz Leyba C, Jiménez Jiménez L, García Valdecasas MS. Hypocaloric peripheral parenteral nutrition in postoperative patients (Proyecto Europan) [Nutrición parenteral periférica hipocalórica en pacientes posquirúrgicos (Proyecto Europan)]. Nutricion Hospitalaria 1992;7(4):245‐52. [PubMed] [Google Scholar]
Jimenez 1995b {published data only}
Jimenez 1995c {published data only}
Jin 1999a {published and unpublished data}
- Jin D, Phillips M, Byles JE. Effects of parenteral nutrition support and chemotherapy on the phasic composition of tumor cells in gastrointestinal cancer. Journal of Parenteral and Enteral Nutrition 1999;23(4):237‐41. [DOI] [PubMed] [Google Scholar]
Jin 1999b {published and unpublished data}
Johansen 2004 {published data only}
- Johansen N, Kondrup J, Plum LM, Bak L, Nørregaard P, Bunch E, et al. Effect of nutritional support on clinical outcome in patients at nutritional risk. Clinical Nutrition 2004;23(4):539‐50. [DOI] [PubMed] [Google Scholar]
Kang 2012 {published data only}
- Kang JH, Shin DW, Baik HW, Hong J. Short‐term oral nutritional supplements and nutrition intervention in elderly patients after hip fracture surgery: a randomized controlled clinical trial. Clinical Nutrition, Supplement 2012;7(1):280. [Google Scholar]
Kaur 2005 {published data only}
- Kaur N, Gupta MK, Minocha VR. Early enteral feeding by nasoenteric tubes in patients with perforation peritonitis. World Journal of Surgery 2005;29(8):1023‐7; discussion 1027‐8. [DOI] [PubMed] [Google Scholar]
Kawaguchi 2008 {published data only}
- Kawaguchi T, Taniguchi E, Itou M, Mutou M, Ibi R, Shiraishi S, et al. Supplement improves nutrition and stresses caused by examination‐associated fasting in patients with liver cirrhosis. Hepatology Research 2008;38(12):1178‐85. [DOI] [PubMed] [Google Scholar]
Kearns 1992 {published data only}
- Kearns PJ, Young H, Garcia G, Blaschke T, O'Hanlon G, Rinki M, et al. Accelerated improvement of alcoholic liver disease with enteral nutrition. Gastroenterology 1992;102(1):200‐5. [DOI] [PubMed] [Google Scholar]
Keele 1997 {published data only}
- Keele AM, Bray MJ, Emery PW, Duncan HD, Silk DBA. Two phase randomised controlled clinical trial of postoperative oral dietary supplements in surgical patients. Gut 1997;40(3):393‐9. [DOI] [PMC free article] [PubMed] [Google Scholar]
Kendell 1982 {published data only}
- Kendell BD, Fonseca RJ, Lee M. Postoperative nutritional supplementation for the orthognathic surgery patient. Journal of Oral and Maxillofacial Surgery 1982;40(4):205‐13. [DOI] [PubMed] [Google Scholar]
Lanzotti 1980 {published data only}
- Lanzotti V, Copeland E, Bhuchar V, Wesley M, Corriere J, Dudrick S. A randomized trial of total parenteral‐nutrition (TPN) with chemotherapy for non‐oat cell lung‐cancer (NOCLC). Proceedings of the American Association for Cancer Research 1980;21:377. [Google Scholar]
Larsson 1990a {published data only}
- Ek AC, Unosson M, Larsson J, Schenck H, Bjurulf P. The development and healing of pressure sores related to the nutritional state. Clinical Nutrition 1991;10(5):245‐50. [DOI] [PubMed] [Google Scholar]
- Larsson J, Unosson M, Ek AC, Nilsson L, Thorslund S, Bjurulf P. Effect of dietary supplement on nutritional status and clinical outcome in 501 geriatric patients‐‐a randomised study. Clinical Nutrition 1990;9(4):179‐84. [PUBMED: 16837353] [DOI] [PubMed] [Google Scholar]
- Unosson M, Ek AC, Bjurulf P, Larsson J. Effect of dietary supplement on functional parameters in geriatric patients [abstract]. Clinical Nutrition 1990;9(Spec Suppl):42. [Google Scholar]
- Unosson M, Larsson J, Ek AC, Bjurulf P. Effects of dietary supplement on functional condition and clinical outcome measured with a modified Norton scale. Clinical Nutrition 1992;11(3):134‐9. [DOI] [PubMed] [Google Scholar]
Ledinghen 1997 {published data only}
- Ledinghen V, Beau P, Mannant PR, Borderie C, Ripault M P, Silvain C, et al. Early feeding or enteral nutrition in patients with cirrhosis after bleeding from esophageal varices? A randomized controlled study. Digestive Diseases and Sciences 1997;42(3):536‐41. [DOI] [PubMed] [Google Scholar]
Levinson 1993a {published data only}
- Levinson M, Bryce A. Enteral feeding, gastric colonisation and diarrhoea in the critically ill patient: is there a relationship?. Anaesthesia and Intensive Care 1993;21(1):85‐8. [DOI] [PubMed] [Google Scholar]
Levinson 1993b {published data only}
Li 1997 {published data only}
- Li S Q, Niu SF, He LX. The effect of parenteral nutritional support on serum free amino acids in exacerbation of COPD patients with malnutrition. Chinese Journal of Clinical Nutrition 1997;5(3):122‐6. [Google Scholar]
Li 1998 {published data only}
- Li YJ, Ma K, Zhang XY. Early application of parenteral nutrition on patients with obstructive jaundice after pancreatic duodenectomy. Parenteral and Enteral Nutrition 1998;5(1):30‐3. [Google Scholar]
Lidder 2013a {published data only}
- Lidder P, Thomas S, Fleming S, Hosie K, Shaw S, Lewis S. A randomized placebo controlled trial of preoperative carbohydrate drinks and early postoperative nutritional supplement drinks in colorectal surgery. Colorectal Disease 2013;15(6):737‐45. [DOI] [PubMed] [Google Scholar]
Lidder 2013b {published data only}
Lidder 2013c {published data only}
Liu 1990 {published data only}
- Liu FK. Effect of intravenous nutrition on protein catabolism in stomach cancer patients after radical gastrectomy. Chinese Journal of Surgery 1990;28(4):231‐4, 254. [PubMed] [Google Scholar]
Liu 1996b {published data only}
- Liu JF, Yang SL, Wang Z. Nutritional support of perioperative periods and operative complications in aged patients. Chinese Journal of Clinical Nutrition 1996;4(2):83‐5. [Google Scholar]
Liu 1997 {published data only}
- Liu LH, Wang HY, Lu YJ. The clinical study on total parenteral nutrition support in chronic obstructive pulmonary disease. Chinese Journal of Clinical Nutrition 1997;5(4):180‐2. [Google Scholar]
Liu 2000a {published data only}
- Liu JD, Cai YH. A randomised study of parenteral nutritional support in the post‐palliative operations of advanced pancreatic carcinoma patients receiving chemotherapy. Chinese Journal of Clinical Nutrition 2000;8(1):37‐8. [Google Scholar]
Liu 2008 {published data only}
- Liu JY, Li KH, Hu JZ, Zhang HQ. A controlled clinical trial of perioperative nutritional support of thoracolumbar spinal tuberculosis. China Journal of Orthopaedics and Traumatology 2008;21(1):28‐9. [PubMed] [Google Scholar]
Ljunggren 2012 {published data only}
- Ljunggren S, Hahn RG. Oral nutrition or water loading before hip replacement surgery; a randomized clinical trial. Trials 2012;13:97. [DOI] [PMC free article] [PubMed] [Google Scholar]
López 2008 {published data only}
- López Hellín J, Baena‐Fustegueras JA, Sabín‐Urkía P, Schwartz‐Riera S, García‐Arumí E. Nutritional modulation of protein metabolism after gastrointestinal surgery. European Journal of Clinical Nutrition 2008;62(2):254‐62. [DOI] [PubMed] [Google Scholar]
Lough 1990 {published data only}
- Lough M, Watkins R, Campbell M, Carr K, Burnett A, Shenkin A. Parenteral nutrition in bone marrow transplantation. Clinincal Nutrition 1990;9(2):97‐101. [DOI] [PubMed] [Google Scholar]
Lu 1996 {published data only}
- Lu Q, Wang JF. Effects of postoperative TPN on immunocompetence in patients with cardia carcinoma. Chinese Journal of Clinical Oncology 1996;23(5):338‐40. [Google Scholar]
Luo 2011 {published data only}
- Luo M, Golybev G, Klyukvin I, Reznik L, Kuropatkin G, Voss AC. Oral nutritional supplement (ONS) improved nutritional status in malnourished patients receiving hip fracture surgery. Clinical Nutrition, Supplement 2011;6(1):151. [Google Scholar]
Luo 2012 {published data only}
- Luo Y, Jia WC, Wang Z. A comparison of effects between early enteral combined with parenteral nutrition versus early enteral nutrition in treating patients suffering from chronic obstructive pulmonary disease with acute exacerbation undergoing mechanical ventilation. Chinese Critical Care Medicine 2012;24(7):436‐8. [PubMed] [Google Scholar]
MacFie 2000 {published data only}
- MacFie J, Woodcock NP, Palmer MD, Walker A, Townsend S, Mitchell CJ. Oral dietary supplements in pre‐ and postoperative surgical patients: a prospective and randomized clinical trial. Nutrition 2000;16(9):723‐8. [DOI] [PubMed] [Google Scholar]
Maderazo 1985 {published data only}
- Maderazo FG, Drezner AD, Albano SD, Woronick CL, Quercia R, Platt D. Intravenous hyperalimentation does not improve neutrophil locomotory dysfunction in blunt trauma. Critical Care Medicine 1985;13(4):337. [Google Scholar]
Malhotra 2004 {published data only}
- Malhotra A, Mathur AK, Gupta S. Early enteral nutrition after surgical treatment of gut perforations: a prospective randomised study. Journal of Postgraduate Medicine 2004;50(2):102‐6. [PubMed] [Google Scholar]
Mattox 1992 {published data only}
- Mattox TW. Stimulation of protein synthesis in human tumors by parenteral nutrition: evidence for modulation of tumor growth. Journal of Parenteral and Enteral Nutrition 1992;16(3):291‐2. [DOI] [PubMed] [Google Scholar]
Maude 2011 {published data only}
- Maude RJ, Hoque G, Hasan MU, Abu Sayeed, Akter S, Samad R, et al. Timing of enteral feeding in cerebral malaria in resource‐poor settings: a randomized trial. Plos One 2011;6(11):1‐7. [DOI] [PMC free article] [PubMed] [Google Scholar]
McCarter 1998 {published data only}
- McCarter TL, Condon SC, Aguilar RC, Gibson DJ, Chen YK. Randomized prospective trial of early versus delayed feeding after percutaneous endoscopic gastrostomy placement. American Journal of Gastroenterology 1998;93(3):419‐21. [DOI] [PubMed] [Google Scholar]
McEvoy 1982 {published data only}
- McEvoy AW, James OF. The effect of a dietary supplement (Build‐up) on nutritional status in hospitalized elderly patients. Human Nutrition. Applied Nutrition 1982;36(5):374‐6. [PubMed] [Google Scholar]
McWhirter 1996a {published data only}
- McWhirter JP, Pennington CR. A comparison between oral and nasogastric nutritional supplements in malnourished patients. Nutrition 1996;12(7‐8):502‐6. [DOI] [PubMed] [Google Scholar]
McWhirter 1996b {published data only}
Meng 2014 {published data only}
- Meng FL, Chen Y. Early enteral nutrition combined with digestive fluid reinfusion in patients with severe intestinal fistula. World Chinese Journal of Digestology 2014;22(29):4530‐3. [Google Scholar]
Mezey 1991 {published data only}
- Mezey E, Caballería J, Mitchell MC, Parés A, Herlong F, Rodés J. Effect of parenteral amino acid supplementation on short‐term and long‐term outcomes in severe alcoholic hepatitis: A randomised controlled trial. Hepatology 1991;14:1090‐6. [PubMed] [Google Scholar]
Miller 2006a {published data only}
- Miller MD, Crotty M, Whitehead C, Bannerman E, Daniels LA. Nutritional supplementation and resistance training in nutritionally at risk older adults following lower limb fracture: a randomized controlled trial. Clinical Rehabilitation 2006;20(4):311‐23. [DOI] [PubMed] [Google Scholar]
Miller 2006b {published data only}
Moreno 2016 {published data only}
- Moreno C, Deltenre P, Senterre C, Louvet A, Gustot T, Bastens B, et al. Intensive enteral nutrition is ineffective for patients with severe alcoholic hepatitis treated with corticosteroids. Gastroenterology 2016;150(4):903‐10. [DOI] [PubMed] [Google Scholar]
- Moreno C, Trepo E, Louvet A, Degre D, Bastens B, Hittelet A, et al. Impact of intensive enteral nutrition in association with corticosteroids in the treatment of severe alcoholic hepatitis: a multicenter randomized controlled trial. Hepatology (Baltimore, Md.) 2014;60:269A‐70A. [Google Scholar]
Müller 1982a {published data only}
- Müller JM, Brenner U, Dienst C, Pichlmaier H. Preoperative parenteral feeding in patients with gastrointestinal carcinoma. Lancet 1982;1(8263):68‐71. [DOI] [PubMed] [Google Scholar]
- Müller JM, Brenner U, Schindler J, Pichlmaier H. Is pre‐operative parenteral nutrition in tumour surgery necessary?. Zentralblatt fur Chirurgie 1982;107(15):984. [Google Scholar]
- Müller M. Investigations on the preoperative nutrition of tumour patients. Die Medizinische Welt 1980;31:1697. [Google Scholar]
- Rose R, Müller JM, Dienst T, Pichlmaier H. Pre‐operative hyperalimentation in tumour surgery ‐ a prospective, randomised study. Zentralblatt fur Chirurgie 1981;106(7):484. [Google Scholar]
Müller 1982b {published data only}
Munk 2014 {published data only}
- Munk T, Beck AM, Holst M, Rosenbom E, Rasmussen HH, Nielsen MA, et al. Positive effect of protein‐supplemented hospital food on protein intake in patients at nutritional risk: a randomised controlled trial. Journal of Human Nutrition and Dietetics 2014;27(2):122‐32. [DOI] [PubMed] [Google Scholar]
- Munk T, Rosenbom E, Beck AM, Klausen T, Nielsen M, Bitz C, et al. Positive effect of fortified hospital food on nutritional intake in patients at nutritional risk. Clinical Nutrition, Supplement 2012;7(1):3. [Google Scholar]
Myers 1990 {published data only}
- Myers SA, Takiguchi S, Slavish S, Rose CL. Consistent wound care and nutritional support in treatment. Decubitus 1990;3(3):16‐28. [PubMed] [Google Scholar]
Naveau 1986 {published data only}
- Naveau S, Pelletier G, Poynard T. A randomised clinical trial of supplementary parenteral nutrition in jaundiced alcoholic cirrhotic patients. Hepatology (Baltimore, Md.) 1986;6(2):270‐4. [DOI] [PubMed] [Google Scholar]
Neelemaat 2012 {published data only}
- Neelemaat F, Bokhorst‐De Van Der Schueren MA, Bontkes HJ, Seidell JC, Hougee S, Thijs A. Effects of nutritional intervention on immune markers in malnourished elderly. Clinical Nutrition, Supplement 2012;7(1):51. [Google Scholar]
- Neelemaat F, Bosmans JE, Thijs A, Seidell JC, Bokhorst‐De Van Der Schueren MAE. Oral nutritional support in malnourished elderly decreases functional limitations with no extra costs. Clinical Nutrition 2012;31(2):183‐90. [DOI] [PubMed] [Google Scholar]
- Neelemaat F, Bosmans JE, Thijs A, Seidell JC, Bokhorst‐de van der Schueren MA. Post‐discharge nutritional support in malnourished elderly individuals improves functional limitations. Journal of the American Medical Directors Association 2011;12(4):295‐301. [DOI] [PubMed] [Google Scholar]
- Neelemaat F, Lips P, Bosmans JE, Thijs A, Seidell JC, Bokhorst‐de van der Schueren MA, et al. Short‐term oral nutritional intervention with protein and vitamin D decreases falls in malnourished older adults. Journal of the American Geriatrics Society 2012;60(4):691‐9. [DOI] [PubMed] [Google Scholar]
Neuvonen 1984 {published data only}
- Neuvonen P, Salo M. Effects of preoperative parenteral nutrition on cell‐mediated immunity in malnourished patients. Clinical Nutrition 1984;3(3):197‐201. [DOI] [PubMed] [Google Scholar]
Nguyen 2012 {published data only}
- Nguyen NQ, Besanko LK, Burgstad C, Bellon M, Holloway RH, Chapman M, et al. Delayed enteral feeding impairs intestinal carbohydrate absorption in critically ill patients. Critical Care Medicine 2012;40(1):50‐4. [DOI] [PubMed] [Google Scholar]
Nixon 1981 {published data only}
- Nixon DW, Lawson DH, Kutner MH, Moffitt SD, Ansley J, Heymsfield S B, et al. Effect of total parenteral nutrition on survival in advanced colon cancer. Cancer Detection and Prevention 1981;4(1‐4):421‐7. [PubMed] [Google Scholar]
Norman 2005 {published data only}
- Norman K, Kirchner H, Friedrich U, Lochs H, Ockenga J, Pirlich M. Enteral nutrition improves functional parameters in patients with advanced liver cirrhosis. Zeitschrift fur Gastroenterologie 2005;43(8):913. [Google Scholar]
Oh 2014 {published data only}
- Oh SY, Jun HJ, Park SJ, Park IK, Lim GJ, Yu Y, et al. A randomized phase ii study to assess the effectiveness of fluid therapy or intensive nutritional support on survival in patients with advanced cancer who cannot be nourished via enteral route. Journal of Palliative Medicine 2014;17(11):1266‐70. [DOI] [PubMed] [Google Scholar]
Ollenschläger 1992 {published data only}
- Ollenschläger G, Thomas W, Konkol K. Nutrition therapy and subjective well‐being during induction regimens of the acute leukemias. Journal of Cancer Research and Clinical Oncology 1990;116(Suppl):355. [Google Scholar]
- Ollenschläger G, Thomas W, Konkol K, Diehl V, Roth E. Nutritional behaviour and quality of life during oncological polychemotherapy: results of a prospective study on the efficacy of oral nutrition therapy in patients with acute leukaemia. European Journal of Clinical Investigation 1992;22(8):546‐53. [DOI] [PubMed] [Google Scholar]
Pacelli 2007 {published data only}
- Pacelli F, Bossola M, Teodori L, Trinca ML, Tortorelli A, Rosa F, et al. Parenteral nutrition does not stimulate tumor proliferation in malnourished gastric cancer patients. Journal of Parenteral and Enteral Nutrition 2007;31(6):451‐5. [PUBMED: 17947598] [DOI] [PubMed] [Google Scholar]
Page 2002 {published data only}
- Page RD, Oo AY, Russell GN, Pennefather SH. Intravenous hydration versus naso‐jejunal enteral feeding after esophagectomy: a randomised study. European Journal of Cardio‐Thoracic Surgery 2002;22(5):666‐72. [PUBMED: 12414028] [DOI] [PubMed] [Google Scholar]
Pang 2007 {published data only}
- Pang XJ, Feng T. Individualized application of enteral nutrition liquid. Chinese Journal of Clinical Nutrition 2007;15(4):228‐31. [Google Scholar]
Peck 2004 {published data only}
- Peck MD, Kessler M, Cairns BA, Chang YH, Ivanova A, Schooler W. Early enteral nutrition does not decrease hypermetabolism associated with burn injury. Journal of Trauma 2004;57(6):1143‐8; discussion 1148‐9. [DOI] [PubMed] [Google Scholar]
Peng 2001 {published data only}
- Peng YZ, Yuan ZQ, Xiao GX. Effects of early enteral feeding on the preservation of intestinal mucosal barrier in severely burned patients. Journal of Chinese Physician 2003;5(11):400. [Google Scholar]
- Peng YZ, Yuan ZQ, Xiao GX. Effects of early enteral feeding on the prevention of enterogenic infection in severely burned patients. Burns 2001;27(2):145‐9. [PUBMED: 11226652] [DOI] [PubMed] [Google Scholar]
Popp 1981 {published data only}
- Levine AS, Brennan MF, Ramu A, Fisher RI, Pizzo PA, Glaubiger DL. Controlled clinical trials of nutritional intervention as an adjunct to chemotherapy, with a comment on nutrition and drug resistance. Cancer Research 1982;42(2):774s‐81s. [PubMed] [Google Scholar]
- Popp MB, Fisher RI, Simon RM, Brennan MF. A prospective randomized study of adjuvant parenteral nutrition in the treatment of diffuse lymphoma: effect on drug tolerance. Surgery 1981;90(2):129‐35. [PubMed] [Google Scholar]
- Popp MB, Fisher RI, Wesley R, Aamodt R, Brennan MF. A prospective randomized study of adjuvant parenteral nutrition in the treatment of advanced diffuse lymphoma: influence on survival. Surgery 1981;90(2):195‐203. [PubMed] [Google Scholar]
Potter 2001 {published data only}
- Potter JM, Roberts MA, McColl JH, Reilly JJ. Protein energy supplements in unwell elderly patients‐‐a randomized controlled trial. Journal of Parenteral and Enteral Nutrition 2001;25(6):323‐9. [DOI] [PubMed] [Google Scholar]
- Roberts M, Potter J, McColl J, Reilly J. Can prescription of sip‐feed supplements increase energy intake in hospitalised older people with medical problems?. British Journal of Nutrition 2003;90(2):425‐9. [DOI] [PubMed] [Google Scholar]
Prieto 1994 {published data only}
- Prieto Reyes MA, Márquez Báez MA, Vázquez Márquez L, Redel del Pueyo J, Gordón del Río A, Arévalo Jiménez E. Hypocaloric peripheral parenteral nutrition. Nutricion Hospitalaria 1994;9(3):181‐5. [PubMed] [Google Scholar]
Pupelis 2000 {published data only}
- Pupelis G, Austrums E, Jansone A, Sprucs R, Wehbi H. Randomised trial of safety and efficacy of postoperative enteral feeding in patients with severe pancreatitis: preliminary report. European Journal of Surgery 2000;166(5):383‐7. [DOI] [PubMed] [Google Scholar]
Pupelis 2001 {published data only}
- Pupelis G, Selga G, Austrums E, Kaminski A. Jejunal feeding, even when instituted late, improves outcomes in patients with severe pancreatitis and peritonitis. Nutrition 2001;17(2):91‐4. [PUBMED: 11240334] [DOI] [PubMed] [Google Scholar]
Rabadi 2008 {published data only}
- Rabadi MH, Coar PL, Lukin M, Lesser M, Blass JP. Intensive nutritional supplements can improve outcomes in stroke rehabilitation. Neurology 2008;71(23):1856‐61. [PUBMED: 18946003] [DOI] [PubMed] [Google Scholar]
Rana 1992 {published data only}
- Rana SK, Bray J, Menzies‐Gow N, Jameson J, James JJP, Frost P, et al. Short term benefits op post‐operative oral dietary supplements in surgical patients. Clinical Nutrition 1992;11(6):337‐44. [PUBMED: 16840018] [DOI] [PubMed] [Google Scholar]
Reilly 1990 {published data only}
- Reilly J, Mehta R, Teperman L, Cemaj S, Tzakis A, Yanaga K, et al. Nutritional support after liver transplantation: a randomized prospective study. Journal of Parenteral and Enteral Nutrition 1990;14(4):386‐91. [DOI] [PubMed] [Google Scholar]
Reissman 1995 {published data only}
- Reissman P, Teoh TA, Cohen SM, Weiss EG, Nogueras JJ, Wexner SD. Is early oral feeding safe after elective colorectal surgery? A prospective randomized trial. Annals of Surgery 1995;222(1):73‐7. [DOI] [PMC free article] [PubMed] [Google Scholar]
Ren 2015 {published data only}
- Ren XS, Wan YC. Therapeutic effect of enteral nutrition liquid on digestive dysfunction after surgery for orthopedics trauma. World Chinese Journal of Digestology 2015;23(4):680‐3. [Google Scholar]
Rimbau 1989 {published data only}
- Arteaga R, Rimbau V, Arroyo JA, Balcells M, Pou JM. Effects of peripheral parenteral nutrition in the postoperative period of aortic surgery. Annals de Medicina 1990;76(4):93. [Google Scholar]
- Rimbau V, Cardona D, Escudero JR, Artega R, Mestres JM, Viver E. Effect of peripheral parenteral nutrition on the immediate postoperative period in surgery of the aortic sector. Angiologíca 1989;41(3):87‐92. [PubMed] [Google Scholar]
Roberts 2000 {published data only}
- Roberts S, Miller JE, Pineiro LA. Is total parenteral nutrition beneficial in breast cancer patients after analogous marrow or blood transplantation?. Journal of Parenteral and Enteral Nutrition 2000;24(1):S11‐2. [Google Scholar]
Roth 2013 {published data only}
- Roth B, Birkhauser FD, Zehnder P, Thalmann GN, Huwyler M, Burkhard FC, et al. Parenteral nutrition does not improve postoperative recovery from radical cystectomy: results of a prospective randomised trial. European Urology 2013;63(3):475‐82. [DOI] [PubMed] [Google Scholar]
Russell 1984 {published data only}
- Russell DM, Shike M, Marliss EB, Detsky AS, Shepherd FA, Feld R, et al. Effects of total parenteral nutrition and chemotherapy on the metabolic derangements in small cell lung cancer. Cancer Research 1984;44(4):1706‐11. [PubMed] [Google Scholar]
Ryan 1993 {published data only}
- Ryan CF, Road JD, Buckley PA, Ross C, Whittaker JS. Energy balance in stable malnourished patients with chronic obstructive pulmonary disease. Chest 1993;103(4):1038‐44. [DOI] [PubMed] [Google Scholar]
Sabin 1998 {published data only}
- Hofmann A, Keymling M, Sabin M, Rosenstock U, Clemens S, Brandt U, et al. PEG in the acutely ill: immediate nutrition against nutrition on the following day ‐ a randomised prospective study. Endoskopie Heute 1998;11(1):144. [Google Scholar]
- Sabin M, Keymling M, Hofmann A, Rosenstock U, Clemens S, Brandt U, et al. PEG in the acute ill: immediate nutrition versus nutrition the following day ‐ a randomised, prospective study. Zeitschrift fur Gastroenterologie 1998;36(8):754. [Google Scholar]
Sacks 1995 {published data only}
- Sacks GS, Brown RO, Teague D, Dickerson RN, Tolley EA, Kudsk KA. Early nutrition support modifies immune function in patients sustaining severe head injury. Journal of Parenteral and Enteral Nutrition 1995;19(5):387‐92. [DOI] [PubMed] [Google Scholar]
Sada 2014 {published data only}
- Sada F, Krasniqi A, Hamza A, Gecaj‐Gashi A, Bicaj B, Kavaja F. A randomized trial of preoperative oral carbohydrates in abdominal surgery. BMC Anesthesiology 2014;14:93. [DOI] [PMC free article] [PubMed] [Google Scholar]
Saluja 2002a {published data only}
- Saluja SS, Kaur N, Shrivastava UK. Enteral nutrition in surgical patients. Surgery Today 2002;32(8):672‐8. [PUBMED: 12181715] [DOI] [PubMed] [Google Scholar]
Saluja 2002b {published data only}
Saluja 2002c {published data only}
Samuels 1981 {published data only}
- Samuels ML, Selig DE, Ogden S, Grant C, Brown B. Iv hyperalimentation and chemotherapy for stage III testicular cancer: a randomized study. Cancer Treatment Reports 1981;65(7‐8):615‐27. [PubMed] [Google Scholar]
Saudny‐Unterberger 1997 {published data only}
- Saudny‐Unterberger H, Martin JG, Gray‐Donald K. Impact of nutritional support on functional status during an acute exacerbation of chronic obstructive pulmonary disease. American Journal of Respiratory and Critical care Medicine 1997;156(3 Pt 1):794‐9. [DOI] [PubMed] [Google Scholar]
Sax 1987 {published data only}
- Sax HC, Warner BW, Talamini MA, Hamilton FN, Bell RH, Fischer JE, et al. Early total parenteral nutrition in acute pancreatitis: lack of beneficial effects. American Journal of Surgery 1987;153(1):117‐24. [DOI] [PubMed] [Google Scholar]
Schmitz 1984 {published data only}
- Schmitz JE. Effect of metabolism‐oriented substrate administration on energy and protein metabolism in polytraumatized artificial respiration patients. Infusionstherapie und Klinische Ernährung 1984;11(4):205‐18. [PubMed] [Google Scholar]
Schriker 2008 {published data only}
- Schricker T, Meterissian S, Lattermann R, Adegoke OAJ, Marliss EB, Mazza L, et al. Anticatabolic effects of avoiding preoperative fasting by intravenous hypocaloric nutrition a randomized clinical trial. Annals of Surgery 2008;248(6):1051‐9. [DOI] [PubMed] [Google Scholar]
Schroeder 1991 {published data only}
- Schroeder D, Gillanders L, Mahr K, Hill GL. Effects of immediate postoperative enteral nutrition on body composition, muscle function, and wound healing. Journal of Parenteral and Enteral Nutrition 1991;15(4):376‐83. [DOI] [PubMed] [Google Scholar]
Schuetz 2006 {published data only}
- Schuetz T, Norman K, Friedrich‐Pagels U, Ockenga J, Luu TN, Lochs H, et al. Tube feeding does not affect subclinical hepatic encephalopathy in patients with liver cirrhosis. Gastroenterology 2006;130:A326. [Google Scholar]
Sharma 2013 {published data only}
- Sharma M, Wahed S, O'Dair G, Gemmell L, Hainsworth P, Horgan AF. A randomized controlled trial comparing a standard postoperative diet with low‐volume high‐calorie oral supplements following colorectal surgery. Colorectal Disease 2013;15(7):885‐91. [DOI] [PubMed] [Google Scholar]
Shestopalov 1996 {published data only}
- Shestopalov AY, Ushakov II. Enteral nutrition in the treatment of multiple organ failure. Research in Surgery 1996;8(1):iv. [Google Scholar]
Simon 1988 {published data only}
- Simon D, Galambos JT. A randomized controlled study of peripheral parenteral nutrition in moderate and severe alcoholic hepatitis. Journal of Hepatology 1988;7(2):200‐7. [DOI] [PubMed] [Google Scholar]
- Simon DM, Galambos JT. Peripheral hyperalimentation (Ppn) in moderate and severe alcoholic hepatitis (ah) ‐ a randomized controlled‐study. American Journal of Gastroenterology 1987;82(9):979. [Google Scholar]
Singh 1998 {published data only}
- Singh G, Ram RP, Khanna SK. Early postoperative enteral feeding in patients with nontraumatic intestinal perforation and peritonitis. Journal of the American College of Surgeons 1998;187(2):142‐6. [DOI] [PubMed] [Google Scholar]
Smedley 2004a {published data only}
- Smedley F, Bowling T, James M, Stokes E, Goodger C, O'Connor O, et al. Randomized clinical trial of the effects of preoperative and postoperative oral nutritional supplements on clinical course and cost of care. British Journal of Surgery 2004;91(8):983‐90. [DOI] [PubMed] [Google Scholar]
Smedley 2004b {published data only}
Smith 1985 {published data only}
- Smith RC, Hartemink RJ, Hollinshead JW, Gillett DJ. Fine bore jejunostomy feeding following major abdominal surgery: a controlled randomized clinical trial. British Journal of Surgery 1985;72(6):458‐61. [DOI] [PubMed] [Google Scholar]
Smith 1988 {published data only}
- Smith RC, Hartemink R. Improvement of nutritional measures during preoperative parenteral nutrition in patients selected by the prognostic nutritional index: a randomized controlled trial. Journal of Parenteral and Enteral Nutrition 1988;12(6):587‐91. [DOI] [PubMed] [Google Scholar]
Sokulmez 2014 {published data only}
- Sokulmez P, Demirbag AE. The effects of oral enteral nutritional support on malnutrition in patients with inflammatory bowel disease by using subjective global assessment. Clinical Nutrition, Supplement 2012;7(1):263. [Google Scholar]
- Sokulmez P, Demirbag AE, Arslan P, Disibeyaz S. Effects of enteral nutritional support on malnourished patients with inflammatory bowel disease by subjective global assessment. Turkish Journal of Gastroenterology 2014;25(5):493‐507. [DOI] [PubMed] [Google Scholar]
Song 1993 {published data only}
- Song Y, Kang XM, Xia XR. Clinical observation on short term nutritional support in the treatment of advanced chronic obstructive pulmonary disease. Chinese Journal of Internal Medicine 1993;32(12):819‐22. [PubMed] [Google Scholar]
Sonnenfeld 1978 {published data only}
- Sonnenfeld H, Cecat P, Robelet D, Scherpereel P. Use of a new solution of synthetic amino acids in postoperative surgical intensive care. Evaluation of the value of nitrogen intake started in the immediate preoperative period. Annales de l'Anesthésiologie Française 1978;19(19):935‐40. [PubMed] [Google Scholar]
Soop 2004 {published data only}
- Soop M, Carlson GL, Hopkinson J, Clarke S, Thorell A, Nygren J, et al. Randomized clinical trial of the effects of immediate enteral nutrition on metabolic responses to major colorectal surgery in an enhanced recovery protocol. British Journal of Surgery 2004;91(9):1138‐45. [DOI] [PubMed] [Google Scholar]
Stableforth 1986 {published data only}
- Stableforth PG. Supplement feeds and nitrogen and calorie balance following femoral neck fracture. British Journal of Surgery 1986;73(8):651‐5. [PUBMED: 3742182] [DOI] [PubMed] [Google Scholar]
Starke 2011 {published data only}
- Starke J, Schneider H, Alteheld B, Stehle P, Meier R. Short‐term individual nutritional care as part of routine clinical setting improves outcome and quality of life in malnourished medical patients. Clinical Nutrition 2011;30(2):194‐201. [DOI] [PubMed] [Google Scholar]
Stein 2002 {published data only}
- Stein J, Schulte‐Bockholt A, Sabin M, Keymling M. A randomized prospective trial of immediate vs. next‐day feeding after percutaneous endoscopic gastrostomy in intensive care patients. Intensive Care Medicine 2002;28(11):1656‐60. [DOI] [PubMed] [Google Scholar]
Stokes 1994 {published data only}
- Stokes MA, Delany C, McKeever J, Mehigan D. Peripheral parenteral nutrition is beneficial following aortic aneurysm surgery. Irish Journal of Medical Science 1994;163:529‐30. [Google Scholar]
Sullivan 1998 {published data only}
- Sullivan DH, Nelson CL, Bopp MM, Puskarich‐May CL, Walls RC. Nightly enteral nutrition support of elderly hip fracture patients: a phase I trial. Journal of the American College of Nutrition 1998;17(2):155‐61. [PUBMED: 9550459] [DOI] [PubMed] [Google Scholar]
Sullivan 2004 {published data only}
- Sullivan DH, Nelson CL, Klimberg VS, Bopp MM. Nightly enteral nutrition support of elderly hip fracture patients: a pilot study. Journal of the American College of Nutrition 2004;23(6):683‐91. [PUBMED: 15637216] [DOI] [PubMed] [Google Scholar]
Summerbell 1993 {published data only}
- Summerbell J, Wynne H, Hankey CR, Williams FM. The effect of age and frailty upon blood esterase activities and their response to dietary supplementation. British Journal of Clinical Pharmacology 1993;36(5):399‐404. [DOI] [PMC free article] [PubMed] [Google Scholar]
Sustic 2006 {published data only}
- Sustic A, Zelic M, Medved I, Sokolic J. Early postoperative gastric enteral nutrition improves gastric emptying after non‐complicated cardiac surgery. Signa Vitae 2006;1(1):16‐9. [Google Scholar]
Swails 1995 {published data only}
- Swails WS, Babineau TJ, Ellis FH, Kenler AS, Forse RA. The role of enteral jejunostomy feeding after esophagogastrectomy: A prospective, randomized study. Diseases of the Esophagus 1995;8(3):193‐9. [Google Scholar]
Szeszycki 1998 {published data only}
- Szeszycki EE, Griffith DP, Puckett AB, Tyre C, Furr CE, Bergman GF, et al. Efficacy of parenteral nutrition in hospitalized bone marrow transplant (BMT) patients: A pilot study. Journal of Parenteral and Enteral Nutrition 1998;22(1):S9. [Google Scholar]
Thompson 1981 {published data only}
- Thompson BR, Julian TB, Stremple JF. Perioperative total parenteral nutrition in patients with gastrointestinal cancer. Journal of Surgical Research 1981;30(5):497‐500. [DOI] [PubMed] [Google Scholar]
Tong 2006a {published data only}
- Tong Q, Wang GB, Lu XM, Tao KX, Chen DD. Safety and clinical efficacy of enteral nutrition in elderly postoperative patients with malignant gastrointestinal tumor. Chinese Journal of Clinical Nutrition 2006;14(3):154‐8. [Google Scholar]
Tong 2006b {published data only}
Vaithiswaran 2008 {published data only}
- Vaithiswaran V, Srinivasan K, Kadambari D. Effect of early enteral feeding after upper gastrointestinal surgery. Tropical Gastroenterology 2008;29(2):91‐4. [PubMed] [Google Scholar]
Valdivieso 1987 {published data only}
- Valdivieso M, Bodey GP, Benjamin RS, Barkley HT, Freeman MB, Ertel M, et al. Role of intravenous hyperalimentation as an adjunct to intensive chemotherapy for small cell bronchogenic carcinoma. Cancer Treatment Reports 1981;65(Suppl 5):145‐50. [PubMed] [Google Scholar]
- Valdivieso M, Frankmann C, Murphy WK, Benjamin RS, Barkley HT, McMurtrey MJ, et al. Long‐term effects of intravenous hyperalimentation administered during intensive chemotherapy for small cell bronchogenic carcinoma. Cancer 1987;59(2):362‐9. [DOI] [PubMed] [Google Scholar]
Vermeeren 2004 {published data only}
- Vermeeren MA, Wouters EF, Geraerts‐Keeris AJ, Schols AM. Nutritional support in patients with chronic obstructive pulmonary disease during hospitalization for an acute exacerbation; a randomized controlled feasibility trial. Clinical Nutrition 2004;23(5):1184‐92. [DOI] [PubMed] [Google Scholar]
Vicic 2013 {published data only}
- Vicic VK, Radman M, Kovacic V. Early initiation of enteral nutrition improves outcomes in burn disease. Asia Pacific Journal of Clinical Nutrition 2013;22(4):543‐7. [DOI] [PubMed] [Google Scholar]
Vlaming 2001 {published data only}
- Vlaming S, Biehler A, Hennessey EM, Jamieson CP, Chattophadhyay S, Obeid OA, et al. Should the food intake of patients admitted to acute hospital services be routinely supplemented? A randomized placebo controlled trial. Clinical Nutrition 2001;20(6):517‐26. [PUBMED: 11884000] [DOI] [PubMed] [Google Scholar]
Von Meyenfeldt 1992a {published data only}
- Meijerink WJ, Meyenfeldt MF, Rouflart MM, Soeters PB. Efficacy of perioperative nutritional support. Lancet 1992;340(8812):187‐8. [DOI] [PubMed] [Google Scholar]
- Meyenfeldt MF, Meijerink WJ, Rouflart MM, Builmaassen MT, Soeters PB. Perioperative nutritional support: a randomised clinical trial. Clinical Nutrition 1992;11(4):180‐6. [PUBMED: 16839996] [DOI] [PubMed] [Google Scholar]
Von Meyenfeldt 1992b {published data only}
Wang 1996a {published data only}
- Wang B, Tang CH, Zhou LM. Comparative study of 3 different ways of nutritional support after major abdominal operation. Parenteral and Enteral Nutrition 1996;3(1):19‐20. [Google Scholar]
Wang 1996b {published data only}
Wang 1997a {published data only}
- Wang ZH, Zhang HC. Parenteral nutrition and enteral nutrition in 60 postoperative patients of esophageal cancer and cardiac cancer. Parenteral and Enteral Nutrition 1997;4(3):144‐6. [Google Scholar]
Wang 1997b {published data only}
Wang 2007 {published data only}
- Wang YZ, Ding YB, Wu J, Deng B, Xiao WM. Treatment of 64 cases severe acute pancreatitis with early enteral nutrition and intestinal barrier protective agents. World Chinese Journal of Digestology 2007;15(33):3545‐8. [Google Scholar]
Wang 2011b {published data only}
- Wang YL, Qi YW, Bai JS, Zheng G, Yue YX. Effect of enteral nutrition on T lymphocytes‐mediated immune function in patients with acquired immune deficiency syndrome. Chinese Journal of Clinical Nutrition 2011;19(1):12‐5. [Google Scholar]
Wang 2013a {published data only}
- Wang ZH, Zhong B, Xiang JY, Zhou YB, Wang DS. Effect of early oral enteral nutrition on clinical outcomes after colorectal cancer surgery. Zhonghua Weichang Waike Zazhi 2013;16(8):735‐8. [PubMed] [Google Scholar]
Ward 1983 {published data only}
- Ward MW, Halliday D, Matthews DE, Matthews SM, Peters JL, Harrison RA, et al. The effect of enteral nutritional support on skeletal muscle protein synthesis and whole‐body protein turnover in fasted surgical patients. Human Nutrition. Clinical Nutrition 1983;37(6):453‐8. [PubMed] [Google Scholar]
Watters 1997 {published data only}
- Watters JM, Kirkpatrick SM, Norris SB, Shamji FM, Wells GA. Immediate postoperative enteral feeding results in impaired respiratory mechanics and decreased mobility. Annals of Surgery 1997;226(3):369‐77; discussion 377‐80. [DOI] [PMC free article] [PubMed] [Google Scholar]
Wei 2013 {published data only}
- Wei B, Xiong ZF, Chen JS. Combined parenteral and enteral nutrition support with chemotherapy in treating elderly patients with advanced gastrointestinal cancer. Chinese Journal of Clinical Nutrition 2013;21(2):72‐6. [Google Scholar]
Wernerman 1986 {published data only}
- Wernerman J, Decken A, Vinnars E. Protein synthesis in skeletal muscle in relation to nitrogen balance after abdominal surgery: the effect of total parenteral nutrition. Journal of Parenteral and Enteral Nutrition 1986;10(6):578‐82. [DOI] [PubMed] [Google Scholar]
Whittaker 1990 {published data only}
- Whittaker JS, Ryan CF, Buckley PA, Road JD. The effects of refeeding on peripheral and respiratory muscle function in malnourished chronic obstructive pulmonary disease patients. American Review of Respiratory Disease 1990;142(2):283‐8. [DOI] [PubMed] [Google Scholar]
Williams 1983 {published data only}
- Williams RH, Alderson D, Fenwick JD, Turnbull SK, Boddy K, Dawes PJ, et al. Nutritional support in patients with malignant strictures of the oesophagus using a fine‐bore feeding tube. Human Nutrition. Clinical Nutrition 1983;37(2):139‐42. [PubMed] [Google Scholar]
Williams 1985 {published data only}
- Williams R, Calvey H, Davis M. Controlled trial of nutritional supplementation in acute alcoholic hepatitis. Metabolism and Nutrition in Liver Disease. 1985:361‐8. [DOI] [PubMed]
- Williams R, Calvey H, Davis M. Controlled trial of nutritional supplementation, with and without branched chain amino acid enrichment, in treatment of acute alcoholic hepatitis. Journal of Hepatology 1985;1(2):141‐51. [PUBMED: 3932509] [DOI] [PubMed] [Google Scholar]
Williford 1991 {published data only}
- Eisenberg JM, Glick HA, Buzby GP, Kinosian B, Williford WO. Does perioperative total parenteral nutrition reduce medical care costs?. Journal of Parenteral and Enteral Nutrition 1993;17(3):201‐9. [DOI] [PubMed] [Google Scholar]
- Williford WO. Perioperative total parenteral‐nutrition in surgical patients. New England Journal of Medicine 1991;325(8):525‐32. [DOI] [PubMed] [Google Scholar]
Wood 1989a {published data only}
- Wood CD, Glover J, McCune M, Hendricks J, Johns M, Pollard M. The effect of intravenous nutrition on muscle mass and exercise capacity in perioperative patients. American Journal of Surgery 1989;158(1):63‐7. [DOI] [PubMed] [Google Scholar]
Wood 1989b {published data only}
Woolfson 1989 {published data only}
- Woolfson AMJ, Smith JAR. Elective nutritional support after major surgery: a prospective randomised trial. Clinical Nutrition 1989;8(1):15‐21. [DOI] [PubMed] [Google Scholar]
Wu 2007a {published data only}
- Wu GH, Zhang YW, Pan HT, Zhang B, Liu ZH, Wu ZH. A randomized controlled trial of postoperative artificial nutrition in malnourished patients with gastrointestinal cancer. Chinese Journal of Gastrointestinal Surgery 2007;10(6):546‐9. [PubMed] [Google Scholar]
Wu 2007b {published data only}
Xie 2014 {published data only}
- Xie W. Clinical effects of early enteral nutrition in combination with esomeprazole for digestive complications in elderly patients after artificial hip joint replacement. World Chinese Journal of Digestology 2014;22(30):4674‐8. [Google Scholar]
Xu 1998a {published data only}
- Xu JF, Xu BH, Wang XF, Feng G, Tong B. Clinical use of parenteral nutrition in elderly abdominal patients during preoperative period. Parenteral and Enteral Nutrition 1998;5(4):205‐7. [Google Scholar]
Xu 2003 {published data only}
- Xu WH, Qian YY, Xu ZH. Clinical studies on early postoperative enteral nutrition in patients with esophageal cancer. Parenteral and Enteral Nutrition 2003;10(3):151‐3. [Google Scholar]
Yamada 1983 {published data only}
- Yamada N, Koyama H, Hioki K, Yamada T, Yamamoto M. Effect of postoperative total parenteral nutrition (TPN) as an adjunct to gastrectomy for advanced gastric carcinoma. British Journal of Surgery 1983;70(5):267‐74. [DOI] [PubMed] [Google Scholar]
Yang 1996 {published data only}
- Yang DG, Shun RL, Hou SX, Zhu BC, Li XH. Early enteral nutrition after gastric operation. Parenteral and Enteral Nutrition 1996;3(4):212‐4. [Google Scholar]
Yie 1996 {published data only}
- Yie WC. Early enteral nutrition support for the patients with carcinoma of esophagus and cardia. Chinese Journal of Cancer 1996;15(5):383‐4. [Google Scholar]
Yin 1994 {published data only}
- Yin HR, Jiao HB, Cao WX. Preoperative parenteral nutrition and adjuvant chemotherapy of gastric cancer. Chinese Journal of Clinical Nutrition 1994;2(2):65‐8. [Google Scholar]
Young 1989a {published data only}
- Young GA, Zeiderman MR, Thompson M, McMahon MJ. Influence of preoperative intravenous nutrition upon hepatic protein synthesis and plasma proteins and amino acids. Journal of Parenteral and Enteral Nutrition 1989;13(6):596‐602. [DOI] [PubMed] [Google Scholar]
Young 1989b {published data only}
Zareba 2013a {published data only}
- Zareba K, Czygier M, Kamocki Z, Cepowicz D, Szmitkowski M, Kedra B. Parenteral nutrition and preop preparation in prevention of post‐operative insulin resistance in gastrointestinal carcinoma. Advances in Medical Sciences 2013;58(1):150‐5. [DOI] [PubMed] [Google Scholar]
Zareba 2013b {published data only}
Zeiderman 1989a {published data only}
- Zeiderman MR, Gowland G, Peel B, McMahon MJ. The influence of short‐term pre‐operative intravenous nutrition upon anthropometric variables, protein synthesis and immunological indices in patients with gastrointestinal cancer. Clinical Science 1991;10(3):213‐21. [DOI] [PubMed] [Google Scholar]
- Zeiderman MR, King RF, Young GA, McMahon MJ. Metabolic changes in human liver associated with preoperative intravenous nutrition. Clinical Science 1989;77:343‐9. [DOI] [PubMed] [Google Scholar]
Zeiderman 1989b {published data only}
Zelic 2012 {published data only}
- Zelic M, Stimac D, Mendrila D, Tokmadzic VS, Fisic E, Uravic M, et al. Influence of preoperative oral feeding on stress response after resection for colon cancer. Hepato‐Gastroenterology 2012;59(117):1385‐9. [DOI] [PubMed] [Google Scholar]
- Zelic M, Uravic M, Sustic A. Preoperative oral feeding reduces stress response after laparoscopic colorectal resection. European Surgery ‐ Acta Chirurgica Austriaca 2012;44(245 Suppl):6. [Google Scholar]
Zhang 2013 {published data only}
- Zhang SQ, Sun HY. Effect of enteral nutrition therapy in patients with decompensated liver cirrhosis. Chinese Journal of Hepatology 2013;21(10):769‐71. [PubMed] [Google Scholar]
Zhao 2014 {published data only}
- Zhao M, Li XG, Ma YY, Liu Y, Wang LX, Shen JL, et al. Application of enteral nutrition during perichemotherapy of acute non‐lymphocytic leukemia. Journal of Chemical and Pharmaceutical Research 2014;6(6):768‐71. [Google Scholar]
Zheng 2001a {published data only}
- Zheng Q, Hu Q. The influence of enteral nutrition on gut barrier in the post‐operative patients with damaged hepatic function. Journal of Tongji Medical University 2001;21(4):323‐5. [DOI] [PubMed] [Google Scholar]
Zheng 2001b {published data only}
Zheng 2015 {published data only}
- Zheng TH, Zhu XP, Liang HZ, Huang HX, Yang JD, Wang SS. Impact of early enteral nutrition on short term prognosis after acute stroke. Journal of Clinical Neuroscience 2015;22(9):1473‐6. [DOI] [PubMed] [Google Scholar]
Zhong 1998 {published data only}
- Zhong Y, Wang ZP, Zhang YM. Short‐period PN support for the elderly patients after hepatobiliary surgery and the changes of biochemistry. Chinese Journal of Clinical Nutrition 1998;6(3):143‐4. [Google Scholar]
Zhong 2006a {published data only}
- Zhong ZQ, Song MM, Bai RX, Cheng S. Clinical effects of enteral nutrition‐assisted preoperative bowel preparation. Chinese Journal of Clinical Nutrition 2006;14(1):11‐4. [Google Scholar]
Zhong 2014 {published data only}
- Zhong GY, Li YH, Ma LP, Huang CP. Early enteral nutrition and nursing care for prevention of complications of severe cerebrovascular diseases. World Chinese Journal of Digestology 2014;22(11):1612‐5. [Google Scholar]
Zhu 2000 {published data only}
- Zhu JS, Jiang XH, Wang GT. Effect of early enteral nutrition therapy on cell factors in postoperative patients with gastric cancer. Chinese Journal of Digestion 2000;20(2):133‐4. [Google Scholar]
Zhu 2002a {published data only}
- Zhu LG, Hang DB, Che JM, Qiu WC, Chen ZY. The use of early enteral nutrition in post‐operative patients with esophageal or cardiac cancer. Parenteral and Enteral Nutrition 2002;9(3):138‐40. [Google Scholar]
Zhu 2012a {published data only}
- Zhu DJ, Xu ZQ, Luo BY. Clinical observation of short term prognosis of acute severe stroke patients with early enteral and parenteral nutrition. Chinese Journal of Neurology 2012;45(12):855‐60. [Google Scholar]
Zhu 2012b {published data only}
References to studies excluded from this review
Abbasinazari 2011 {published data only}
- Abbasinazari M, Farsad BF, Alavi SM, Bakhshandeh H, Kharazmkia A, Ariaeinejad P. Comparison of Maastricht index between ICU admitted patients receiving a standard enteral feeding product or kitchen made enteral feeding in a teaching hospital of Iran. Journal of Mazandaran University of Medical Sciences 2011;20(81):53‐60. [Google Scholar]
Abitbol 1989 {published data only}
- Abitbol JL, Nitenberg G, Fuerxer F, Coudray‐Lucas C, Ekindjian FO, Pico JL, et al. Effects of varying nitrogen (N) intake of total parenteral nutrition (TPN) in bone marrow transplant (BMT) recipients. A randomized prospective trial [abstract]. Clinical Nutrition 1989;8(Spec Suppl):70. [Google Scholar]
Achord 1987 {published data only}
- Achord JL. A prospective randomized clinical trial of peripheral amino acid‐glucose supplementation in acute alcoholic hepatitis. American Journal of Gastroenterology 1987;82(9):871‐5. [PUBMED: 3307390] [PubMed] [Google Scholar]
Aguilar‐Nascimento 2002 {published data only}
- Aguilar‐Nascimento JE, Goelzer J. Early feeding after intestinal anastomoses: risks or benefits?. Associação Médica Brasileira 2002;48(4):348‐52. [PubMed] [Google Scholar]
Akizuki 2009 {published data only}
- Akizuki E, Kimura Y, Nobuoka T, Imamura M, Nagayama M, Sonoda T, et al. Reconsideration of postoperative oral Intake tolerance after pancreaticoduodenectomy prospective consecutive analysis of delayed gastric emptying according to the ISGPS definition and the amount of dietary intake. Annals of Surgery 2009;249(6):986‐94. [DOI] [PubMed] [Google Scholar]
Albano 2003 {published data only}
- Albano F, Arigliani R, Mangani S, Brugo A, Chiamenti G, Guarino A. Espghan guidelines for acute gastroenteritis: a RCT on applicability and efficacy (the Pueris study). Journal of Pediatric Gastroenterology and Nutrition 2003;36(4):539. [Google Scholar]
Aoki 2000 {published data only}
- Aoki K, Ikeda K, Sato N. Clinical appraisal of the additional total parenteral nutrition combined with postoperative enteral feeding on the patient of thoracic esophageal cancer surgery. Japanese Journal of Gastroenterological Surgery 2000;33(6):693‐702. [Google Scholar]
Aoki 2001 {published data only}
- Aoki K, Ikeda K, Sato N, Otsuka K, Nitta H, Ishida K, et al. Is postoperative short term dietary restriction by enteral route unfavorable for amino acids metabolism and wound healing?. Journal of Parenteral and Enteral Nutrition 2001;25(1):S22‐3. [Google Scholar]
Arabi 2011 {published data only}
- Arabi Y, Tamim H, Shifaat G, Sakkijha M, Al‐Dawood A. Permissive underfeeding versus target feeding in critically ill patients: randomized controlled trial. American Thoracic Society International Conference 2009:A2167.
- Arabi YM, Tamim HM, Dhar GS, Al‐Dawood A, Al‐Sultan M, Sakkijha MH, et al. Permissive underfeeding and intensive insulin therapy in critically ill patients: a randomized controlled trial. American Journal of Clinical Nutrition 2011;93(3):569‐77. [DOI] [PubMed] [Google Scholar]
Arcand 2005 {published data only}
- Arcand JA, Brazel S, Joliffe C, Choleva M, Berkoff F, Allard JP, et al. Education by a dietitian in patients with heart failure results in improved adherence with a sodium‐restricted diet: a randomized trial. American Heart Journal 2005;150(4):716. [DOI] [PubMed] [Google Scholar]
Arnaud‐Battandier 1999 {published data only}
- Arnaud‐Battandier F, Lauque S, Paintin M, Mansourian R, Vellas B, Guigoz Y. MNA and nutritional intervention. Nestlé Nutrition Workshop Series. Clinical and Performance Programme 1999;1:131‐8; discussion 138‐40. [DOI] [PubMed] [Google Scholar]
Arnold 1989 {published data only}
- Arnold C, Richter MP. The effect of oral nutritional supplements on head and neck cancer. International Journal of Radiation Oncology, Biology, Physics 1989;16(6):1595‐9. [PUBMED: 2656603] [DOI] [PubMed] [Google Scholar]
Aronsson 2009 {published data only}
- Aronsson A, Al‐Ani NA, Brismar K, Hedstrom M. A carbohydrate‐rich drink shortly before surgery affected IGF‐I bioavailability after a total hip replacement. A double‐blind placebo controlled study on 29 patients. Aging Clinical and Experimental Research 2009;21(2):97‐101. [DOI] [PubMed] [Google Scholar]
Arustamyan 2011 {published data only}
- Arustamyan SA, Yeghiazaryan MI. Enteral nutrition support and electrolyte balance of patients in critical conditions. Clinical Nutrition, Supplement 2011;6(1):126. [Google Scholar]
Arutiunov 2009 {published data only}
- Arutiunov GP, Kostiukevich OI, Bylova NA. Prevalence and clinical significance of malnutrition and effectiveness of nutritional support for patients suffering from chronic heart failure. Experimental and Clinical Gastroenterology 2009;2009(2):22‐33. [PubMed] [Google Scholar]
Ashworth 2006 {published data only}
- Ashworth A. Nutritional supplementation and hip fracture patients ‐ implications for future research trials. Proceedings of the Nutrition Society 2006;65:6a. [Google Scholar]
Askanazi 1986 {published data only}
- Askanazi J, Hensle TW, Starker PM, Lockhart SH, LaSala PA, Olsson C, et al. Effect of immediate postoperative nutritional support on length of hospitalization. Annals of Surgery 1986;203(3):236‐9. [DOI] [PMC free article] [PubMed] [Google Scholar]
Bachmann 2008 {published data only}
- Bachmann P. Peri‐operative nutrition. Nutrition Clinique Et Metabolisme 2008;22(1):33‐8. [Google Scholar]
Bachrach‐Lindström 2000 {published data only}
- Bachrach‐Lindström M, Johansson T, Unosson M, Ek AC, Wahlström O. Nutritional status and functional capacity after femoral neck fractures: a prospective randomized one‐year follow‐up study. Aging (Milano) 2000;12(5):366‐74. [DOI] [PubMed] [Google Scholar]
Baek 1975 {published data only}
- Baek SM, Makabali GG, Bryan‐Brown CW, Kusek J, Shoemaker WC. The influence of parenteral nutrition on the course of acute renal failure. Surgery, Gynecology & Obstetrics 1975;141(3):405‐8. [PUBMED: 808871] [PubMed] [Google Scholar]
Bakiner 2013 {published data only}
- Bakiner O, Bozkirli E, Giray S, Arlier Z, Kozanoglu I, Sezgin N, et al. Impact of early versus late enteral nutrition on cell mediated immunity and its relationship with glucagon like peptide‐1 in intensive care unit patients: a prospective study. Critical Care (London, England) 2013;17(3):R123. [DOI] [PMC free article] [PubMed] [Google Scholar]
Bakker 2011 {published data only}
- Bakker OJ, Santvoort HC, Brunschot S, Ahmed Ali U, Besselink MG, Boermeester MA, et al. Pancreatitis, very early compared with normal start of enteral feeding (PYTHON trial): design and rationale of a randomised controlled multicenter trial. Trials 2011;12:73. [DOI] [PMC free article] [PubMed] [Google Scholar]
Bar 2008 {published data only}
- Bar G, Sheiner E, Lezerovizt A, Lazer T, Hallak M. Early maternal feeding following caesarean delivery: a prospective randomised study. Acta Obstetricia et Gynecologica Scandinavica 2008;87(1):68‐71. [DOI] [PubMed] [Google Scholar]
Barle 1997 {published data only}
- Barle H, Nyberg B, Andersson K, Essen P, McNurlan MA, Wernerman J, et al. The effects of short‐term parenteral nutrition on human liver protein and amino acid metabolism during laparoscopic surgery. Journal of Parenteral and Enteral Nutrition 1997;21(6):330‐5. [DOI] [PubMed] [Google Scholar]
Baron 1986 {published data only}
- Baron PL, Lawrence W, Chan WM, White FK, Banks WL. Effects of parenteral nutrition on cell cycle kinetics of head and neck cancer. Archives of Surgery 1986;121(11):1282‐6. [DOI] [PubMed] [Google Scholar]
Barton 2000 {published data only}
- Barton AD, Beigg CL, Macdonald IA, Allison SP. A recipe for improving food intakes in elderly hospitalized patients. Clinical Nutrition 2000;19(6):451‐4. [DOI] [PubMed] [Google Scholar]
Bastarache 2012 {published data only}
- Bastarache JA, Ware LB, Girard TD, Wheeler AP, Rice TW. Markers of inflammation and coagulation may be modulated by enteral feeding strategy. Journal of Parenteral and Enteral Nutrition 2012;36(6):732‐40. [DOI] [PMC free article] [PubMed] [Google Scholar]
Bastian 1999 {published data only}
- Bastian L, Grotz M, Knop C, Mahlke L, Weimann A. Special problems and aspects of the enteral nutrition of polytraumatised patients. Hefte Zur der Unfallchirurg 1999;272:385‐6. [Google Scholar]
Bauer 2005a {published data only}
- Bauer J, Capra S, Battistutta D, Davidson W, Ash S. Compliance with nutrition prescription improves outcomes in patients with unresectable pancreatic cancer. Clinical Nutrition 2005;24(6):998‐1004. [DOI] [PubMed] [Google Scholar]
Bauer 2005b {published data only}
- Bauer JD, Capra S. Nutrition intervention improves outcomes in patients with cancer cachexia receiving chemotherapy ‐ a pilot study. Supportive Care in Cancer 2005;13(4):270‐4. [DOI] [PubMed] [Google Scholar]
Bayer‐Berger 1989 {published data only}
- Bayer‐Berger M, Chiolero R, Freeman J, Hirschi B. Incidence of phlebitis in peripheral parenteral nutrition: effect of the different nutrient solutions. Clinical Nutrition 1989;8(4):181‐6. [DOI] [PubMed] [Google Scholar]
Beattie 2000 {published data only}
- Beattie AH, Prach AT, Baxter JP, Pennington CR. A randomised controlled trial evaluating the use of enteral nutritional supplements postoperatively in malnourished surgical patients. Gut 2000;46(6):813‐8. [DOI] [PMC free article] [PubMed] [Google Scholar]
Beau 1986 {published data only}
- Beau P, Fabre J, Abitbol JL. Continuous ambulatory enteral nutrition in hospitalized adults: a prospective experience in 98 patients. Gastroentérologie Clinique et Biologique 1986;10(2):134‐40. [PubMed] [Google Scholar]
Benzineb 1995 {published data only}
- Benzineb N, Slim MN, Masmoudi A, Ben Taieb A, Sfar R. Value of early oral feeding after a cesarean section. Revue Française de Gynécologie et d'Obstétrique 1995;90(5‐6):281‐2, 285. [PubMed] [Google Scholar]
Bickel 1992 {published data only}
- Bickel A, Shtamler B, Mizrahi S. Early oral feeding following removal of nasogastric tube in gastrointestinal operations. A randomized prospective study. Archives of Surgery 1992;127(3):287‐9; discussion 289. [DOI] [PubMed] [Google Scholar]
Blackburn 1973 {published data only}
- Blackburn GL, Flatt JP, Clowes GH, O'Donnell TE. Peripheral intravenous feeding with isotonic amino acid solutions. American Journal of Surgery 1973;125(4):447‐54. [DOI] [PubMed] [Google Scholar]
Bonetti 1988 {published data only}
- Bonetti G, Iapichino G, Radrizzani D, Scherini A, Malacrida R, Ronzoni G, et al. Methionine, cystathionine and cystine increased urinary losses during total parenteral nutrition of adult patients. Clinical Nutrition 1988;7(7):43‐8. [Google Scholar]
Bories 1994 {published data only}
- Bories PN, Campillo B. One‐month regular oral nutrition in alcoholic cirrhotic‐patients ‐ changes of nutritional‐status, hepatic‐function and serum‐lipid pattern. British Journal of Nutrition 1994;72(6):937‐46. [DOI] [PubMed] [Google Scholar]
Bos 2000 {published data only}
- Bos C, Benamouzig R, Bruhat A, Roux C, Mahe S, Valensi P, et al. Short‐term protein and energy supplementation activates nitrogen kinetics and accretion in poorly nourished elderly subjects. American Journal of Clinical Nutrition 2000;71(5):1129‐37. [DOI] [PubMed] [Google Scholar]
Bos 2001 {published data only}
- Bos C, Benamouzig R, Bruhat A, Roux C, Valensi P, Ferriëre F, et al. Nutritional status after short‐term dietary supplementation in hospitalized malnourished geriatric patients. Clinical Nutrition 2001;20(3):225‐33. [DOI] [PubMed] [Google Scholar]
Boultetreau 1978 {published data only}
- Boultetreau P, Delafosse B, Flandrois C. Protein saving in the early postoperative period: comparative significance of exclusive parenteral nitrogen feeding and total parenteral feeding. Anesthésie, Analgésie, Réanimation 1978;35(1):41‐53. [PubMed] [Google Scholar]
Bourdel‐Marchasson 2000 {published data only}
- Bourdel‐Marchasson I, Barateau M, Rondeau V, Dequae‐Merchadou L, Salles‐Montaudon N, Emeriau J P, et al. A multi‐center trial of the effects of oral nutritional supplementation in critically ill older inpatients. GAGE Group. Groupe Aquitain Geriatrique d'Evaluation. Nutrition 2000;16(1):1‐5. [DOI] [PubMed] [Google Scholar]
Bozzetti 1974 {published data only}
- Bozzetti F, Terno G, Longoni C. Postoperative parenteral hyperalimentation and wound healing in oncological surgery. Tumori 1974;60(1):53‐63. [DOI] [PubMed] [Google Scholar]
Bozzetti 1976 {published data only}
- Bozzetti F, Terno G, Pupa A, Uccellini M, Rota G, Emanuelli H. Parenteral hyperalimentation in patients with advanced neoplastic disease. Tumori 1976;62(6):623‐44. [DOI] [PubMed] [Google Scholar]
Bozzetti 1998 {published data only}
- Bozzetti F, Cozzaglio L, Gavazzi C, Bidoli P, Bonfanti G, Montalto F, et al. Nutritional support in patients with cancer of the esophagus: impact on nutritional status, patient compliance to therapy, and survival. Tumori 1998;84(6):681‐6. [DOI] [PubMed] [Google Scholar]
Bozzetti 2000 {published data only}
- Bozzetti F, Gavazzi C, Miceli R, Rossi N, Mariani L, Cozzaglio L, et al. Perioperative total parenteral nutrition in malnourished, gastrointestinal cancer patients: a randomized, clinical trial. Journal of Parenteral and Enteral Nutrition 2000;24(1):7‐14. [DOI] [PubMed] [Google Scholar]
Braga 2002 {published data only}
- Braga M, Gianotti L, Nespoli L, Radaelli G, Carlo V. Nutritional approach in malnourished surgical patients: a prospective randomized study. Archives of Surgery 2002;137(2):174‐80. [DOI] [PubMed] [Google Scholar]
Braunschweig 2015 {published data only}
- Braunschweig CA, Sheean PM, Peterson SJ, Gomez Perez S, Freels S, Lateef O, et al. Intensive nutrition in acute lung injury: a clinical trial (Intact). Journal of Parenteral and Enteral Nutrition 2015;39(1):13‐20. [DOI] [PMC free article] [PubMed] [Google Scholar]
Britton 2012 {published data only}
- Britton B, Baker A, Bauer J, Wolfenden L, Wratten C, Beck A, et al. Eat: a stepped wedge cluster randomised trial to improve nutrition in head and neck cancer patients undergoing radiotherapy. Asia‐Pacific Journal of Clinical Oncology 2012;8:259. [Google Scholar]
Brooks 1999 {published data only}
- Brooks AD, Hochwald SN, Heslin MJ, Harrison LE, Burt M, Brennan MF. Intestinal permeability after early postoperative enteral nutrition in patients with upper gastrointestinal malignancy. Journal of Parenteral and Enteral Nutrition 1999;23(2):75‐9. [DOI] [PubMed] [Google Scholar]
Buchman 1969 {published data only}
- Buchman E, Kaung DT, Dolan K, Knapp RN. Unrestricted diet in the treatment of duodenal ulcer. Gastroenterology 1969;56(6):1016‐20. [PubMed] [Google Scholar]
Burden 2011 {published data only}
- Al Bedah AA. Preoperative oral supplements in colorectal cancer. Focus on Alternative and Complementary Therapies 2012;17(2):138‐9. [Google Scholar]
- Burden ST, Hill J, Shaffer JL, Campbell M, Todd C. An unblinded randomised controlled trial of preoperative oral supplements in colorectal cancer patients. Journal of Human Nutrition and Dietetics 2011;24(5):441‐8. [DOI] [PubMed] [Google Scholar]
Buzby 1988 {published data only}
- Buzby GP, Knox LS, Crosby LO, Eisenberg JM, Haakenson CM, McNeal GE, et al. Study protocol: a randomized clinical trial of total parenteral nutrition in malnourished surgical patients. American Journal of Clinical Nutrition 1988;47(2):366‐81. [DOI] [PubMed] [Google Scholar]
Cabre 1990 {published data only}
- Cabre E, Gonzalez‐Huix F, Abad‐Lacruz A, Esteve M, Acero D, Fernandez‐Banares F, et al. Effect of total enteral nutrition on the short‐term outcome of severely malnourished cirrhotics. A randomized controlled trial. Gastroenterology 1990;98(3):715‐20. [PUBMED: 2105256] [DOI] [PubMed] [Google Scholar]
Cai 1999 {published data only}
- Cai DL, Chen XL, Hu TJ. The nutritional therapeutic effect of enteral nutrition on coma patients. Chinese Journal of Clinical Nutrition 1999;7(2):63‐5. [Google Scholar]
Cai 2000 {published data only}
- Cai DL, Hu ZT, Zhu LP. The therapeutic effects of enteral nutrition on patients with colon cancer perceiving coloproctostomy. Chinese Journal of Clinical Nutrition 2000;8(1):68‐9. [Google Scholar]
Cameron 2011 {published data only}
- Cameron ID, Kurrle SE, Uy C, Lockwood KA, Au L, Schaafsma FG. Effectiveness of oral nutritional supplementation for older women after a fracture: rationale, design and study of the feasibility of a randomized controlled study. BMC Geriatrics 2011;11:32. [DOI] [PMC free article] [PubMed] [Google Scholar]
Cao 1994 {published data only}
- Cao WX, Xiao HB, Yin HR. Effects of preoperative parenteral nutritional support with chemotherapy on tumor cell kinetics in gastric cancer patients. Chinese Journal of Oncology 1994;16(2):137‐40. [PubMed] [Google Scholar]
Capparros 1982 {published data only}
- Capparrós Fernández de Aguilar T, López Martínez J, Pérez Picouto F. Parenteral nutrition and "hypermetabolic" acute renal failure. Revista Clinica Espanola 1982;165(4):239‐44. [PubMed] [Google Scholar]
Chadwick 2002 {published data only}
- Chadwick VJ, Helmer SD, Jost GD. Do peptide‐based tube feeding formulas improve outcome after trauma or burn?. Journal of Parenteral and Enteral Nutrition 2002;26(4):296. [Google Scholar]
Chatterjee 2012 {published data only}
- Chatterjee S, Bala S K, Chakraborty P, Dey R, Sinha S, Ray R, et al. A comparative study between early enteral feeding (within 24 hours) versus conventional enteral feeding after enteric anastomosis. Bangladesh Journal of Medical Science 2012;11(4):273‐83. [Google Scholar]
Chattophadhyay 2002 {published data only}
- Chattophadhyay S, Irving PM, Cunliffe A, Archer C, Murphy D, King F, et al. The short term effects of total parenteral nutrition (TPN) on fatigue: a double blind placebo controlled study. Gut 2002;50:A88. [Google Scholar]
Chen 1994 {published data only}
- Chen QP, Bian FG, Pei XC, Wang RH, Ou K. Randomized controlled studies on enteral and parenteral nutrition during early period after abdominal surgery. Chinese Journal of General Surgery 1994;3(6):328‐30. [Google Scholar]
Chen 2000c {published data only}
- Chen DW, Quan ZW, Luo MD. Application of enteral nutrtion and parenteral nutrition in patients undergoing major abdominal saurgery. Chinese Journal of Clinical Nutrition 2000; Vol. 8, issue 4:255‐6.
Chen 2001 {published data only}
- Chen GQ, Xia Q. Short‐term EN and PN in abdominal surgery. Journal of China Clinic Medicine 2001;8(3):210‐1. [Google Scholar]
Chen 2010 {published data only}
- Chen YJ, Yang Q, Zhao WC, Zhou ZL. Safety of application of enteral nutrition in non‐blood circulation disorders of elderly patients with intestinal obstruction. Chinese Journal of Clinical Nutrition 2010;18(3):162‐6. [Google Scholar]
Chen 2014 {published data only}
- Chen H, Zhang YL. Early enteral nutrition support in patients with gastric cancer after surgical treatment: clinical efficacy and nursing strategies. World Chinese Journal of Digestology 2014;22(23):3475‐8. [Google Scholar]
Cheng 1997 {published data only}
- Cheng QM, Chao WX, Yin HR. Postoperative parenteral nutrition support of patients with gastro‐intestinal cancer. Parenteral and Enteral Nutrition 1997;4(1):23‐5. [Google Scholar]
Chiarelli 1990 {published data only}
- Chiarelli A, Enzi G, Casadei A, Baggio B, Valerio A, Mazzoleni F. Very early nutrition supplementation in burned patients. American Journal of Clinical Nutrition 1990;51(6):1035‐9. [DOI] [PubMed] [Google Scholar]
Collins 1978 {published data only}
- Collins JP, Oxby CB, Hill GL. Intravenous aminoacids and intravenous hyperalimentation as protein‐sparing therapy after major surgery. A controlled clinical trial. Lancet (London, England) 1978;1(8068):788‐91. [PUBMED: 85812] [DOI] [PubMed] [Google Scholar]
Consoli 2010 {published data only}
- Consoli MLD, Fonseca LM, Silva RG, Correia M. Early postoperative oral feeding impacts positively in patients undergoing colonic resection: results of a pilot study. Nutricion Hospitalaria 2010;25(5):806‐9. [PubMed] [Google Scholar]
Cornu 2000 {published data only}
- Cornu KA, McKiernan FJ, Kapadia SA, Neuberger JM. A prospective randomized study of preoperative nutritional supplementation in patients awaiting elective orthotopic liver transplantation. Transplantation 2000;69(7):1364‐9. [DOI] [PubMed] [Google Scholar]
Csapo 2003 {published data only}
- Csapo Z, Vesztergombi G, Harsanyi L. Perioperative nutrition in gastric cancer patients. Zeitschrift fur Gastroenterologie 2003;41(5):432. [Google Scholar]
Cui 1994 {published data only}
- Cui XL, Guo ZR, Yuan HJ. The nutrition support of severely burned patients. Chinese Journal of Clinical Nutrition 1994;2(3):121‐3. [Google Scholar]
Cui 2013 {published data only}
- Cui ZJ, Wang LC, Wang LY, Feng RG, Li C, Zheng S. Effect of individualized nutrition support on short‐term outcomes of elderly patients with refractory heart failure. Chinese Journal of Clinical Nutrition 2013;21(2):65‐71. [Google Scholar]
Dag 2011 {published data only}
- Dag A, Colak T, Turkmenoglu O, Gundogdu R, Aydin S. A randomized controlled trial evaluating early versus traditional oral feeding after colorectal surgery. Clinics 2011;66(12):2001‐5. [DOI] [PMC free article] [PubMed] [Google Scholar]
Daly 1987 {published data only}
- Daly JM, Bonau R, Stofberg P, Bloch A, Jeevanandam M, Morse M, et al. Immediate postoperative jejunostomy feeding. Clinical and metabolic results in a prospective trial. American Journal of Surgery 1987;153(2):198‐206. [PUBMED: 3101530] [DOI] [PubMed] [Google Scholar]
Davies 1998 {published data only}
- Davies S, Fall S, Ellul Y. Dysphagia and nutrition after stroke: should more patients be considered for early percutaneous endoscopic gastrostomy (PEG) feeding?. Clinical Rehabilitation 1998; Vol. 12:162.
Dea 1996 {published data only}
- Dea SK, Chin PC. Clinical outcomes of early feeding after percutaneous endoscopic gastrostomy (PEG) placement: a randomized controlled trial. Gastrointestinal Endoscopy 1996;43(4):234. [Google Scholar]
De Castro 2012 {published data only}
- Castro LG, Pontes‐Arruda A, Furtado‐Lima B, Do Ceara VDA, Neto HMC, Dos Santos MCfC, et al. The effect of parenteral nutrition delivery system upon intensive care and hospital days: an international, prospective, randomized, open‐label and controlled study. Critical Care Medicine 2012;40(12):U283. [Google Scholar]
De Lédinghen 1998 {published data only}
- Lédinghen V, Beau P, Mannant PR, Ripault MP, Borderie C, Silvain C, et al. When is time feeding in patients with bleeding peptic ulcer? A randomized controlled study. Gastroenterologie Clinique et Biologique 1998;22(3):282‐5. [PubMed] [Google Scholar]
Deligné 1974 {published data only}
- Deligné P, Prochiantz E, Bunodiere M, Lauvergeat J, Brault D, Corcos S, et al. Nitrogen balance in the early postoperative period after digestive surgery. Influence of caloric and protein intake (exclusive parenteral alimentation). Annales de l'Anesthésiologie Française 1974;15(15):127‐39. [PubMed] [Google Scholar]
De Luis 2003 {published data only}
- Luis D, Aller R, Bachiller P, Gonzalez‐Sagrado M, Luis J, Izaola O, et al. Isolated dietary counselling program versus supplement and dietary counselling in patients with human immunodeficiency virus infection. Medicina Clinica 2003;120(15):565‐7. [DOI] [PubMed] [Google Scholar]
Demetriou 1992 {published data only}
- Demetriou AA. Accelerated improvement of alcoholic liver disease with enteral nutrition. Journal of Parenteral and Enteral Nutrition 1992;16(3):289‐90. [DOI] [PubMed] [Google Scholar]
Dhanraj 1997 {published data only}
- Dhanraj P, Chacko A, Mammen M, Bharathi R. Hospital‐made diet versus commercial supplement in postburn nutritional support. Journal of the International Society for Burn Injuries 1997;23(6):512‐4. [DOI] [PubMed] [Google Scholar]
Dias 1999 {published data only}
- Dias MC, Faintuch J, Cukler CS, Maculevicius J, Gana‐Rodrigues JJ, Pirotti HW. Oral diet and glutamine in patients with short bowel syndrome. Journal of Parenteral and Enteral Nutrition 1999;23(5):S157. [Google Scholar]
Ding 1999 {published data only}
- Ding H, Wang DZ, Qiao C. Study of the treatment of IVGR by peripheral venous nutrition. Chinese Journal of Clinical Nutrition 1999;7(1):40‐1. [Google Scholar]
Ding 2015 {published data only}
- Ding DY, Feng Y, Song B, Gao SH, Zhao JS. Effects of preoperative and postoperative enteral nutrition on postoperative nutritional status and immune function of gastric cancer patients. Turkish Journal of Gastroenterology 2015;26(2):181‐5. [DOI] [PubMed] [Google Scholar]
Dintinjana 2012 {published data only}
- Dintinjana RD, Trivanovic D, Dintinjana M, Vukelic J. Effects of nutritional support in patients with colorectal cancer. Journal of Cachexia, Sarcopenia and Muscle 2012;3(1):68. [Google Scholar]
Dixon 1984 {published data only}
- Dixon J. Effect of nursing interventions on nutritional and performance status in cancer patients. Nursing Research 1984;33(6):330‐5. [PubMed] [Google Scholar]
Djunet 2012 {published data only}
- Djunet NA. Effect of adequate nutrition therapy in rectal carcinoma post‐surgery patients. Supportive Care in Cancer 2012;20(6):S123. [Google Scholar]
Dock‐Nascimento 2012 {published data only}
- Dock‐Nascimento DB, Aguilar‐Nascimento JE, Faria MSM, Caporossi C, Slhessarenko N, Waitzberg DL. Evaluation of the effects of a preoperative 2‐hour fast with maltodextrine and glutamine on insulin resistance, acute‐phase response, nitrogen balance, and serum glutathione after laparoscopic cholecystectomy: a controlled randomized trial. Journal of Parenteral and Enteral Nutrition 2012;36(1):43‐52. [DOI] [PubMed] [Google Scholar]
Doglietto 2004 {published data only}
- Doglietto GB, Pacelli F, Papa V, Tortorelli AP, Bossola M, Covino M. Use of a nasojejunal tube after total gastrectomy: a multicentre prospective randomised trial. Chirurgia Italiana 2004;56(6):761‐8. [PubMed] [Google Scholar]
Dong 1997 {published data only}
- Dong MF, Qiao YZ, Yin G, Zhou SL, Ma SJ. A comparative study of postoperative early nutritional support in esophageal carcinoma patients. Parenteral and Enteral Nutrition 1997;4(4):71‐3. [Google Scholar]
Driver 1990 {published data only}
- Driver LT, Lumbers M, Older J, Williams CM. A controlled trial of sip‐feed supplements in orthopaedic patients: post‐discharge clinical outcome in relation to supplementation and compliance. Proceedings of the Nutrition Society 1990; Vol. 49:137a.
Dupont 2012 {published data only}
- Dupont B, Dao T, Joubert C, Dupont‐Lucas C, Gloro R, Nguyen‐Khac E, et al. Randomised clinical trial: enteral nutrition does not improve the long‐term outcome of alcoholic cirrhotic patients with jaundice. Alimentary Pharmacology & Therapeutics 2012;35(10):1166‐74. [DOI] [PubMed] [Google Scholar]
Dutta 2004 {published data only}
- Dutta D, Bannerjee M, Chambers T. Is tube feeding associated with altered arterial oxygen saturation in stroke patients?. Age and Ageing 2004;33(5):493‐6. [DOI] [PubMed] [Google Scholar]
Eckerwall 2007 {published data only}
- Eckerwall GE, Tingstedt BB, Bergenzaun PE, Andersson RG. Immediate oral feeding in patients with mild acute pancreatitis is safe and may accelerate recovery ‐ a randomized clinical study. Clinical Nutrition 2007;26(6):758‐63. [DOI] [PubMed] [Google Scholar]
Edstrom 1989 {published data only}
- Edstrom S, Westin T, Delle U, Lundholm K. Cell cycle distribution and ornithine decarboxylase activity in head and neck cancer in response to enteral nutrition. European Journal of Cancer and Clinical Oncology 1989;25(2):227‐32. [DOI] [PubMed] [Google Scholar]
Efthimiou 1988 {published data only}
- Efthimiou J, Fleming J, Gomes C, Spiro SG. The effect of supplementary oral nutrition in poorly nourished patients with chronic obstructive pulmonary disease. American Review of Respiratory Disease 1988;137(5):1075‐82. [PUBMED: 3057956] [DOI] [PubMed] [Google Scholar]
Elke 2013 {published data only}
- Elke G, Kuhnt E, Ragaller M, Schadler D, Frerichs I, Brunkhorst FM, et al. Enteral nutrition is associated with improved outcome in patients with severe sepsis. A secondary analysis of the VISEP trial. Medizinische Klinik ‐ Intensivmedizin und Notfallmedizin 2013;108(3):223‐33. [DOI] [PubMed] [Google Scholar]
Elmore 1989 {published data only}
- Elmore MF, Gallagher SC, Jones JG, Koons KK, Schmalhausen AW, Strange PS. Esophagogastric decompression and enteral feeding following cholecystectomy: a controlled, randomized prospective trial. Medizinische Klinik ‐ Intensivmedizin und Notfallmedizin 1989;13(3):377‐81. [DOI] [PubMed] [Google Scholar]
El Nakeeb 2009 {published data only}
- Nakeeb A, Fikry A, Metwally T, Fouda E, Youssef M, Ghazy H, et al. Early oral feeding in patients undergoing elective colonic anastomosis. International Journal of Surgery 2009;7(3):206‐9. [DOI] [PubMed] [Google Scholar]
Eneroth 1997 {published data only}
- Eneroth M, Apelqvist J, Larsson J, Persson BM. Improved wound healing in transtibial amputees receiving supplementary nutrition. International Orthopaedics 1997;21(2):104‐8. [DOI] [PMC free article] [PubMed] [Google Scholar]
Eneroth 2004 {published data only}
- Eneroth M, Larsson J, Oscarsson C, Apelqvist J. Nutritional supplementation for diabetic foot ulcers: the first RCT. Journal of Wound Care 2004;13(6):230‐4. [DOI] [PubMed] [Google Scholar]
Esaki 2005 {published data only}
- Esaki M, Matsumoto T, Hizawa K, Nakamura S, Jo Y, Mibu R, et al. Preventive effect of nutritional therapy against postoperative recurrence of Crohn disease, with reference to findings determined by intra‐operative enteroscopy. Scandinavian Journal of Gastroenterology 2005;40(12):1431‐7. [DOI] [PubMed] [Google Scholar]
Evans 1987 {published data only}
- Evans WK, Nixon DW, Daly JM, Ellenberg SS, Gardner L, Wolfe E, et al. A randomized study of oral nutritional support versus ad lib nutritional intake during chemotherapy for advanced colorectal and non‐small‐cell lung cancer. Journal of Clinical Oncology 1987;5(1):113‐24. [DOI] [PubMed] [Google Scholar]
Fairfull‐Smith 1980 {published data only}
- Fairfull‐Smith R, Abunassar R, Freeman JB, Maroun JA. Rational use of elemental and nonelemental diets in hospitalized patients. Annals of Surgery 1980;192(5):600‐3. [DOI] [PMC free article] [PubMed] [Google Scholar]
Feinstein 1981 {published data only}
- Feinstein EI, Blumenkrantz MJ, Healy M, Koffler A, Silberman H, Massry SG, et al. Clinical and metabolic responses to parenteral nutrition in acute renal failure. A controlled double‐blind study. Medicine 1981;60(2):124‐37. [PUBMED: 6783809] [DOI] [PubMed] [Google Scholar]
Feldblum 2011 {published data only}
- Feldblum I, German L, Castel H, Harman‐Boehm I, Shahar DR. Individualized nutritional intervention during and after hospitalization: the nutrition intervention study clinical trial. Journal of the American Geriatrics Society 2011;59(1):10‐7. [DOI] [PubMed] [Google Scholar]
- Moon, KT. Reducing post‐hospital mortality via individualized nutrition plan. American Family Physician 2012;85(2):200. [Google Scholar]
Feng 2008 {published data only}
- Feng S, Chen L, Wang G, Chen A, Qiu Y. Early oral intake after intra‐abdominal gynecological oncology surgery. Cancer Nursing 2008;31(3):209‐13. [DOI] [PubMed] [Google Scholar]
Feo 2004 {published data only}
- Feo CV, Romanini B, Sortini D, Ragazzi R, Zamboni P, Pansini GC, et al. Early oral feeding after colorectal resection: a randomized controlled study. Journal of Surgery 2004;74(5):298‐301. [DOI] [PubMed] [Google Scholar]
Fernandez‐Estivariz 2006 {published data only}
- Fernandez‐Estivariz C, Luo MH, Bazargan N, Gu LH, Sitaraman SV, Klapproth JM, et al. Effects of modified oral diet and human growth hormone on nutrient absorption and parenteral nutrition needs in adults with severe short bowel syndrome: results of a randomized, double‐blind, placebo‐controlled clinical trial. Gastroenterology 2006;130(5):A68. [Google Scholar]
Flynn 1987 {published data only}
- Flynn MB, Leightty FF. Preoperative outpatient nutritional support of patients with squamous cancer of the upper aerodigestive tract. American Journal of Surgery 1987;154(4):359‐62. [PUBMED: 3661837] [DOI] [PubMed] [Google Scholar]
Foltz 1987 {published data only}
- Foltz A, Besser P, Ellenberg S, Carty C, Mitchell S, Paul K, et al. Effectiveness of nutritional counseling on caloric intake, weight change, and percent protein intake in patients with advanced colorectal and lung cancer. Nutrition 1987;3(4):263‐71. [Google Scholar]
Fonseca 2011 {published data only}
- Fonseca LM, Profeta da Luz MM, Lacerda‐Filho A, Correia MI, Gomes da Silva R. A simplified rehabilitation program for patients undergoing elective colonic surgery ‐ randomized controlled clinical trial. International Journal of Colorectal Disease 2011;26(5):609‐16. [DOI] [PubMed] [Google Scholar]
Förli 2001 {published data only}
- Förli L, Bjortuft O, Vatn M, Kofstad J, Boe J. A study of intensified dietary support in underweight candidates for lung transplantation. Annals of Nutrition and Metabolism 2001;45(4):159‐68. [DOI] [PubMed] [Google Scholar]
Foster 1980 {published data only}
- Foster KJ, Alberti KG, Binder C, Hinks L, Karran S, Smythe P, et al. Metabolic effects of the use of protein‐sparing infusions in postoperative patients. Clinical Science 1980;58(6):507‐15. [DOI] [PubMed] [Google Scholar]
Freund 1990 {published data only}
- Freund HR, Coronado E, Lijovatzky G, Berry EM. Early quantitative and qualitative changes in liver lipids during total parenteral nutrition. Nutrition 1990;6(1):119. [PubMed] [Google Scholar]
Fuenzalida 1990 {published data only}
- Fuenzilda CE, Petty TL, Jones ML, Jarrett S, Harbeck R, Terry R, et al. The immune response to short‐term nutritional intervention in advanced chronic obstructive pulmonary disease. American Review of Respiratory Disease 1990;142:49‐56. [DOI] [PubMed] [Google Scholar]
Ganzoni 1994 {published data only}
- Ganzoni A, Heilig P, Schönenberger K, Hügli O, Fitting JW, Brändli O. High‐caloric nutrition in chronic obstructive lung disease. Schweizerische Rundschau für Medizin Praxis 1994;83(1):13‐6. [PubMed] [Google Scholar]
Garcia‐Rodriguez 2013 {published data only}
- Garcia‐Rodriguez CE, Mesa MD, Martin MV, Rico MC, Campana L, Perez‐Rodriguez M, et al. Randomized double‐blind cross‐over study of a nutritional supplement specific for patients with neurodegenerative diseases over inflammatory and cardiovascular risk biomarkers. Annals of Nutrition and Metabolism 2013;63:587. [Google Scholar]
Genton 2004 {published data only}
- Genton L, Dupertuis YM, Romand JA, Simonet ML, Jolliet P, Huber O, et al. Higher calorie prescription improves nutrient delivery during the first 5 days of enteral nutrition. Clinical Nutrition 2004;23(3):307‐15. [DOI] [PubMed] [Google Scholar]
Georgieff 1980 {published data only}
- Georgieff M, Kattermann R, Geiger K, Storz LW, Saeger HD, Bethke U, et al. Postoperative metabolism‐‐differences between pre‐ and postoperative start of total parenteral nutrition. Anästhesie, Intensivtherapie, Notfallmedizin 1980; Vol. 15, issue 1:20‐35. [PubMed]
Gerasimidis 2014 {published data only}
- Gerasimidis K, Fatima S, Wright C, Malkova D. Impact of high energy nutritional supplement drink consumed for five consecutive days on cardio metabolic risk factors in underweight females. Clinical Nutrition 2014;33:S23. [DOI] [PMC free article] [PubMed] [Google Scholar]
Grahm 1989 {published data only}
- Grahm TW, Zadrozny DB, Harrington T. The benefits of early jejunal hyperalimentation in the head‐injured patient. Neurosurgery 1989;25(5):729‐35. [DOI] [PubMed] [Google Scholar]
Greenberg 1982 {published data only}
- Greenberg G, Jeejeebjoy K, Sales D, Rosenberg I, Fleming R. A 3‐center randomized study comparing total parenteral‐nutrition (TPN), enteral formula (EF), and nutritional control (NC) in Crohns‐disease. Gastroenterology 1982;82(5):1219. [Google Scholar]
Grizas 2008 {published data only}
- Grizas S, Gulbinas A, Barauskas G, Pundzius J. A comparison of the effectiveness of the early enteral and natural nutrition after pancreatoduodenectomy. Medicina 2008;44(9):678‐86. [PubMed] [Google Scholar]
Grode 2014 {published data only}
Gunnarsson 2009 {published data only}
- Gunnarsson AK, Lonn K, Gunningberg L. Does nutritional intervention for patients with hip fractures reduce postoperative complications and improve rehabilitation?. Journal of Clinical Nursing 2009;18(9):1325‐33. [DOI] [PubMed] [Google Scholar]
Gurgun 2013 {published data only}
- Gurgun A, Deniz S, Argin M, Karapolat H. Effects of nutritional supplementation combined with conventional pulmonary rehabilitation in muscle‐wasted chronic obstructive pulmonary disease: a prospective, randomized and controlled study. Respirology 2013;18(3):495‐500. [DOI] [PubMed] [Google Scholar]
Haffejee 1980 {published data only}
- Haffejee AA, Angorn IB, Baker LW. Nutritional support in high‐output fistulas of the alimentary tract. South African Medical Journal 1980;57(7):227‐31. [PubMed] [Google Scholar]
Han‐Geurts 2001 {published data only}
- Han‐Geurts IJ, Jeekel J, Tilanus HW, Brouwer KJ. Randomized clinical trial of patient‐controlled versus fixed regimen feeding after elective abdominal surgery. British Journal of Surgery 2001;88(12):1578‐82. [DOI] [PubMed] [Google Scholar]
Han‐Geurts 2007 {published data only}
- Han‐Geurts IJ, Hop WC, Kok NF, Lim A, Brouwer KJ, Jeekel J. Randomized clinical trial of the impact of early enteral feeding on postoperative ileus and recovery. British Journal of Surgery 2007;94(5):555‐61. [DOI] [PubMed] [Google Scholar]
Harries 1983 {published data only}
- Harries AD, Jones LA, Danis V, Fifield R, Heatley RV, Newcombe RG, et al. Controlled trial of supplemented oral nutrition in Crohn's disease. Lancet 1983;1(8330):887‐90. [DOI] [PubMed] [Google Scholar]
Hasenberg 2010 {published data only}
- Hasenberg T, Essenbreis M, Herold A, Post S, Shang E. Early supplementation of parenteral nutrition is capable of improving quality of life, chemotherapy‐related toxicity and body composition in patients with advanced colorectal carcinoma undergoing palliative treatment: results from a prospective, randomized clinical trial. Colorectal Disease 2010; Vol. 12, issue 10:190‐9. [DOI] [PubMed]
Hasse 1997 {published data only}
- Hasse J, Crippin J, Blue L, Huang K, DiCecco S, Francisco‐Ziller N, et al. Does nutrition supplementation benefit liver transplant candidates with a history of encephalopathy?. Journal of Parenteral and Enteral Nutrition 1997;21(1):S16. [Google Scholar]
He 2000 {published data only}
- He XX, He J, He WD. The nutrition support to radial enteritis. Chinese Journal of Clinical Nutrition 2000;8(1):57‐8. [Google Scholar]
Heatley 1979 {published data only}
- Heatley RV, Williams RH, Lewis MH. Pre‐operative intravenous feeding‐a controlled trial. Postgraduate Medical Journal 1979;55(646):541‐5. [DOI] [PMC free article] [PubMed] [Google Scholar]
Hedberg 1999 {published data only}
- Hedberg AM, Lairson DR, Aday LA, Chow J, Suki R, Houston S, et al. Economic implications of an early postoperative enteral feeding protocol. Journal of the American Dietetic Association 1999;99(7):802‐7. [DOI] [PubMed] [Google Scholar]
Heslin 1997 {published data only}
- Heslin MJ, Latkany L, Leung D, Brooks AD, Hochwald SN, Pisters PW, et al. A prospective, randomized trial of early enteral feeding after resection of upper gastrointestinal malignancy. Annals of Surgery 1997;226(4):567‐77; discussion 577‐80. [PUBMED: 9351723] [DOI] [PMC free article] [PubMed] [Google Scholar]
Hickey 1982 {published data only}
- Hickey AJ, Toth BB, Lindquist SB. Effect of intravenous hyperalimentation and oral care on the development of oral stomatitis during cancer chemotherapy. Journal of Prosthetic Dentistry 1982;47(2):188‐93. [PUBMED: 6173478] [DOI] [PubMed] [Google Scholar]
Hidding 1988 {published data only}
- Hidding J, Pfisterer M, Schlien HP, Mertes N, Nolte G, Sicking K. Effect of two different enteral diets on free plasma and intracellular amino acids following tumor surgery in the oral cavity. Deutsche Zeitschrift für Mund, Kiefer und Gesichts Chirurgie 1988;12(2):156‐60. [PubMed] [Google Scholar]
Hochwald 1997 {published data only}
- Hochwald SN, Harrison LE, Heslin MJ, Burt ME, Brennan MF. Early postoperative enteral feeding improves whole body protein kinetics in upper gastrointestinal cancer patients. American Journal of Surgery 1997;174(3):325‐30. [DOI] [PubMed] [Google Scholar]
Honda 1990 {published data only}
- Honda H, Fukuo Y, Kobayashi Y, Iwasaki M, Terashi A, Seta K, et al. The trial of the rich‐proteined tube alimentation in the patients with cerebrovascular accident. Stroke 1990;21 Suppl I(8):I‐38. [Google Scholar]
Hosseini 2010 {published data only}
- Hosseini SN, Mousavinasab SN, Rahmanpour H, Sotodeh S. Comparing early oral feeding with traditional oral feeding in upper gastrointestinal surgery. Turkish Journal of Gastroenterology 2010;21(2):119‐24. [DOI] [PubMed] [Google Scholar]
Hovels 1951 {published data only}
- Hovels O. Influence of nutrition on the success of rickets prophylaxis. Strahlentherapie 1951;86(2):282‐5. [Google Scholar]
Hu 1995 {published data only}
- Hu XY, Wang HY, Yang GL, Cui YF, Liang JY. Effect of total parenteral nutrition in multiple trauma patients. Parenteral and Enteral Nutrition 1995;2(1):25‐6. [Google Scholar]
Hu 2003 {published data only}
- Hu QG, Zheng QC. The influence of enteral nutrition in postoperative patients with poor liver function. World Journal of Gastroenterology 2003;9(4):843‐6. [DOI] [PMC free article] [PubMed] [Google Scholar]
Hur 2011 {published data only}
- Hur H, Kim SG, Shim JH, Song KY, Kim W, Park CH, et al. Effect of early oral feeding after gastric cancer surgery: a result of randomized clinical trial. Surgery 2011;149(4):561‐8. [DOI] [PubMed] [Google Scholar]
Ibrahim 2002 {published data only}
- Ibrahim EH, Mehringer L, Prentice D, Sherman G, Schaiff R, Fraser V, et al. Early versus late enteral feeding of mechanically ventilated patients: results of a clinical trial. Journal of Parenteral and Enteral Nutrition 2002;26(3):174‐81. [DOI] [PubMed] [Google Scholar]
Irvine 2004 {published data only}
- Irvine P, Mouzet JB, Marteau C, Salle A, Genaitay M, Favreau AM, et al. Short‐term effect of a protein load on appetite and food intake in diseased mildly undernourished elderly people. Clinical Nutrition 2004;23(3):1146‐52. [DOI] [PubMed] [Google Scholar]
Isenring 2003a {published data only}
- Isenring EA, Capra S, Bauer J. Outcome measures demonstrate the beneficial impact of nutrition support in oncology outpatients receiving radiotherapy. Journal of Parenteral and Enteral Nutrition 2003;27(1):S3‐4. [Google Scholar]
Isenring 2003b {published data only}
- Isenring EA, Capra S, Bauer J, Davies PS. Nutrition support is successful in maintaining body composition in oncology outpatients receiving radiotherapy. Journal of Parenteral and Enteral Nutrition 2003;27(1):27. [Google Scholar]
Isenring 2004 {published data only}
- Isenring E, Capra S, Bauer J. Patient satisfaction is rated higher by radiation oncology outpatients receiving nutrition intervention compared with usual care. Journal of Human Nutrition and Dietetics 2004;17(2):145‐52. [DOI] [PubMed] [Google Scholar]
Ishiki 2015 {published data only}
- Ishiki H, Iwase S, Gyoda Y, Kanai Y, Ariyoshi K, Miyaji T, et al. Oral nutritional support can shorten the duration of parenteral hydration in end‐of‐life cancer patients: a randomized controlled trial. Nutrition and Cancer 2015;67(1):105‐11. [DOI] [PubMed] [Google Scholar]
Jacob 1989 {published data only}
- Jacob F, Strub P, Mariot J, Perrier JF, Voltz C. Quantitative and qualitative aspects of the protein intake in total parenteral nutrition following uncomplicated abdominal surgery. Cahiers d'Anesthésiologie 1989;37(7):483‐8. [PubMed] [Google Scholar]
Jacobson 2012 {published data only}
- Jacobson S. Early postoperative complications in patients with Crohn's disease given and not given preoperative total parenteral nutrition. Scandinavian Journal of Gastroenterology 2012;47(2):170‐7. [DOI] [PMC free article] [PubMed] [Google Scholar]
Jenkins 1994 {published data only}
- Jenkins ME, Gottschlich MM, Warden GD. Enteral feeding during operative procedures in thermal injuries. Journal of Burn Care and Rehabilitation 1994;15(2):199‐205. [DOI] [PubMed] [Google Scholar]
Jiang 1994a {published data only}
- Jiang JZ, Zhang YT. Perioperative nutrition support in patients with advanced gastric cancer. Chinese Journal of Clinical Nutrition 1994;2(2):84‐6. [Google Scholar]
Jiang 1994b {published data only}
- Jiang ZM, Wang XR, Zheng CJ. Metabolic effects of parenteral and enteral nutrition on post‐operative patients. Chinese Journal of Clinical Nutrition 1994;2(1):7‐12. [Google Scholar]
Jiang 2001 {published data only}
- Jiang ZM, Wang XR, Gu CY, Zheng W. The impact of enteral nutrition for post‐operative patients on nitrogen balance, gut permeability and cost/effect (60 cases randomized, controlled, multi‐center clinical trial). Chinese Journal of Clinical Nutrition 2001;9(2):73‐6. [Google Scholar]
Jiang 2002 {published data only}
- Jiang WR, Hu ZM, Cang M. The clinical research of early enteral nutrition through jejunostomy after total gastrectomy. Parenteral and Enteral Nutrition 2002;9(3):165‐7. [Google Scholar]
Jiang 2003 {published data only}
- Jiang ZM, Wang XR, Wei JM. The impact of hypocaloric and lower nitrogen parenteral nutrition on blood glucose level, infection related complication, hospital stay and cost in postoperative patients (multi‐center, randomized, controlled clinical trail for 100 cases). Chinese Journal of Clinical Nutrition 2003;11(3):179‐83. [Google Scholar]
Jin 2002 {published data only}
- Jin XM, Wang HY, Lan MJ, Qian YF. Effect of early enteral nutrition on the prophylaxis of stress ulcer of critically ill patients. Chinese Journal of Nursing 2002;37(7):485‐7. [Google Scholar]
Joosten 2001 {published data only}
- Joosten E, Vander Elst B. Does nutritional supplementation influence the voluntary dietary intake in an acute geriatric hospitalized population?. Aging Clinical and Experimental Research 2001;13(5):391‐4. [DOI] [PubMed] [Google Scholar]
Kang 1994 {published data only}
- Kang Y, Wu YT, Luo CX, Ying MY, Wang B. Effect of parenteral nutrtion on respiratory function of serious patients. Parenteral and Enteral Nutrition 1994;1(1):39‐41. [Google Scholar]
Kang 2011 {published data only}
- Kang WM, Yu JC, Ma ZQ, Wang J, Ge JN, Li ZT. Comparison of clinical efficacy between standard sequential early enteral nutrition plus parenteral nutrition and parenteral nutrition support in patients undergoing gastrointestinal surgery: a clinical randomized controlled trial. Chinese Journal of Clinical Nutrition 2011;19(3):148‐53. [Google Scholar]
Keller 1991 {published data only}
- Keller HW, Müller JM. The effectiveness of hypercaloric and hypocaloric postoperative parenteral nutrition in large abdominal surgery. A prospective randomized study. Langenbecks Archiv für Chirurgie 1991;376(4):232‐7. [DOI] [PubMed] [Google Scholar]
Keohane 1983 {published data only}
- Keohane P, Attrill H, Love M, Frost P, Silk DBA. Double‐blind controlled trial of starter regimes in enteral nutrition. Gut 1983;24(5):A495‐6. [Google Scholar]
Kilgallen 1996 {published data only}
- Kilgallen K, O'Neill S. The effect of growth hormone and nutritional support in COPD malnutrition. Clinical Nutrition 1996;15:36. [Google Scholar]
Kilic 2012 {published data only}
- Kilic D, Iren S, Bagriacik U, Benekli M. The impact of nutritional support on treatment related complications, qol and survival in lung cancer patients undergoing radiotherapy: a randomized, controlled study. Clinical Nutrition, Supplement 2012;7(1):164. [Google Scholar]
Kinsella 1981 {published data only}
- Kinsella TJ, Malcolm AW, Bothe A, Valerio D, Blackburn GL. Prospective study of nutritional support during pelvic irradiation. International Journal of Radiation Oncology, Biology, Physics 1981;7(4):543‐8. [DOI] [PubMed] [Google Scholar]
Kirkil 2012 {published data only}
- Kirkil C, Bulbuller N, Aygen E, Basbug M, Ayten R, Ilhan N, et al. The effect of preoperative nutritional supports on patients with gastrointestinal cancer: prospective randomized study. Hepato‐Gastroenterology 2012;59(113):86‐9. [DOI] [PubMed] [Google Scholar]
Kirvela 1993 {published data only}
- Kirvela O, Stern R C, Askanazi J, Doershuk CF, Rothkopf MM, Katz DP. Long‐term parenteral‐nutrition in cystic‐fibrosis. Nutrition 1993;9(2):119‐26. [PubMed] [Google Scholar]
Kiss 2014a {published data only}
- Kiss N, Seymour JF, Prince HM, Dutu G. Challenges and outcomes of a randomized study of early nutrition support during autologous stem‐cell transplantation. Current Oncology 2014; Vol. 21, issue 2:334‐9. [DOI] [PMC free article] [PubMed]
Kiss 2014b {published data only}
- Kiss N, Krishnasamy M, Gough K, Wheeler G, Wirth A, Campbell B, et al. Patient satisfaction with an intensive nutrition intervention compared to usual care in lung cancer patients receiving (chemo)radiotherapy. Supportive Care in Cancer 2014;22(1):115‐6. [Google Scholar]
Kiss 2014c {published data only}
- Kiss N, Isenring E, Gough K, Wheeler G, Wirth A, Campbell B, et al. Outcomes from a pilot randomised controlled trial of early and intensive dietary counselling in lung cancer patients receiving (chemo)radiotherapy. Asia‐Pacific Journal of Clinical Oncology 2014;10:129. [DOI] [PubMed] [Google Scholar]
Klahr 1996 {published data only}
- Klahr S. Primary and secondary results of the modification of diet in renal disease study. Mineral and Electrolyte Metabolism 1996;22(1‐3):138‐42. [PubMed] [Google Scholar]
- Klahr S. The modification of diet in renal disease study. New England Journal of Medicine 1989;320(13):864‐6. [DOI] [PubMed] [Google Scholar]
Klek 2011 {published data only}
- Klek S, Sierzega M, Szybinski P, Szczepanek K, Scislo L, Walewska E, et al. Perioperative nutrition in malnourished surgical cancer patients ‐ A prospective, randomized, controlled clinical trial. Clinical Nutrition 2011;30(6):708‐13. [DOI] [PubMed] [Google Scholar]
Knowles 1988 {published data only}
- Knowles JB, Fairbarn MS, Wiggs BJ, Chan‐Yan C, Pardy RL. Dietary supplementation and respiratory muscle performance in patients with COPD. Chest 1988;93(5):977‐83. [DOI] [PubMed] [Google Scholar]
Kochar 2011 {published data only}
- Kochar R, Herold KC. Prevention of T1DM: feeding the ultimate goal. Nature Reviews Endocrinology 2011;7(3):132‐4. [DOI] [PubMed] [Google Scholar]
Kompan 1999 {published data only}
- Kompan L, Kremzar B, Gadzijev E, Prosek M. Effects of early enteral nutrition on intestinal permeability and the development of multiple organ failure after multiple injury. Intensive Care Medicine 1999;25(2):157‐61. [DOI] [PubMed] [Google Scholar]
Kompan 2004 {published data only}
- Kompan L, Vidmar G, Spindler‐Vesel A, Pecar J. Is early enteral nutrition a risk factor for gastric intolerance and pneumonia?. Clinical Nutrition 2004;23(4):527‐32. [DOI] [PubMed] [Google Scholar]
Konrad 1966 {published data only}
- Konrad RM, Ammedick U, Hupfauer W, Pruckner J, Ringler W. The effect of high protein and calory nutrition on the postoperative nitrogen balance in lung surgery patients. Zentralblatt fur Chirurgie 1966;91(16):585‐93. [PubMed] [Google Scholar]
Kult 1975 {published data only}
- Kult J, Treutlein E, Dragoun GP, Heidland A. Value of post‐operative parenteral nutrition as shown by various plasma protein measurements. Deutsche Medizinische Wochenschrift 1975;100(13):695‐7. [PubMed] [Google Scholar]
Kwon Lee 2006 {published data only}
- Kwon Lee S, Posthauer ME, Dorner B, Maloney MJ, Redovian V. Pressure ulcer healing with a concentrated, fortified, collagen protein hydrolysate supplement: a randomized, controlled trial. Advances in Skin Wound and Care 2006;19(2):92‐6. [DOI] [PubMed] [Google Scholar]
Laaban 1986 {published data only}
- Laaban JP, Geslin J, Dautheribes‐Wysocki C, Bengolea G, Dermine H, Rochemaure J. Influence of hypercaloric nutrition on PaCO2 in patients with chronic obstructive respiratory insufficiency during weaning from ventilatory support. Gastroenterologie Clinique et Biologique 1986;10(3):274. [Google Scholar]
Lapillonne 1995 {published data only}
- Lapillonne A, Braillon PM, Glorieux FH, Chambon M, Claris O, Delmas PD, et al. Body composition of premature low birth weight ‐ role of alimentation [Composition corporelle du premature de faible poids de naissance ‐ role de l'alimentation]. Archives Francaises de Pediatrie 1995;Suppl 1:129s. [Google Scholar]
Lapp 2001 {published data only}
- Lapp MA, Bridwell KH, Lenke LG, Baldus C, Blanke K, Iffrig TM. Prospective randomization of parenteral hyperalimentation for long fusions with spinal deformity: its effect on complications and recovery from postoperative malnutrition. Spine 2001;26(7):809‐17; discussion 817. [DOI] [PubMed] [Google Scholar]
Lassen 2008 {published data only}
- Lassen K, Kjaeve J, Fetveit T, Tranø G, Sigurdsson HK, Horn A, et al. Allowing normal food at will after major upper gastrointestinal surgery does not increase morbidity: a randomized multicenter trial. Annals of Surgery 2008;247(5):721‐9. [DOI] [PubMed] [Google Scholar]
Lauque 2004 {published data only}
- Lauque S, Arnaud‐Battandier F, Gillette S, Plaze JM, Andrieu S, Cantet C, et al. Improvement of weight and fat‐free mass with oral nutritional supplementation in patients with Alzheimer's disease at risk of malnutrition: a prospective randomized study. Journal of the American Geriatrics Society 2004;52(10):1702‐7. [DOI] [PubMed] [Google Scholar]
Lawson 2003 {published data only}
- Lawson RM, Doshi MK, Barton JR, Cobden I. The effect of unselected post‐operative nutritional supplementation on nutritional status and clinical outcome of orthopaedic patients. Clinical Nutrition 2003;22(1):39‐46. [DOI] [PubMed] [Google Scholar]
Le Cornu 2000 {published data only}
- Cornu KA, McKiernan FJ, Kapadia SA, Neuberger JM. A prospective randomized study of preoperative nutritional supplementation in patients awaiting elective orthotopic liver transplantation. Transplantation 2000;69(7):1364‐9. [DOI] [PubMed] [Google Scholar]
Ledinghen 1996 {published data only}
- Lédinghen V, Mannant PR, Beau P, Borderie C, Ripault M P, Silvain C, et al. Effect of enternal nutrition immediately after digestive hemorrhage in cirrhotics: a randomised controlled study. Gastroentérologie Clinique et Biologique 1996;20:A120. [Google Scholar]
Lédinghen 1998 {published data only}
- Lédinghen V, Beau P, Mannant PR, Ripault MP, Borderie C, Silvain C, et al. When should patients with bleeding peptic ulcer resume oral intake? A randomized controlled study. Gastroentérologie Clinique et Biologique 1998;22(3):282‐5. [PubMed] [Google Scholar]
Lee 2014 {published data only}
- Lee HJ, Na JR, Suh YS, Kong SH, Yang HK. Effect of perioperative oral nutritional supplementation in malnourished patients who will receive gastrectomy: a prospective randomized trial. Clinical Nutrition 2014;33:S249. [DOI] [PubMed] [Google Scholar]
Lei 2011 {published data only}
- Lei K, Schneider H, Venetz W, Beale R. Effect of enteral pharmaconutrition on organ dysfunction in septic patients. Clinical Nutrition, Supplement 2011;6(1):214. [Google Scholar]
Li 2003 {published data only}
- Li YX, Li L, Jiang XH, Li FN. Efficiency of enteral nutrition in the post‐operative patients: a prospective, randomized, controlled clinical trial. Parenteral and Enteral Nutrition 2003;10(1):34‐7. [Google Scholar]
Li 2014 {published data only}
- Li K, Li JP, Peng NH, Jiang LL, Hu YJ, Huang MJ. Fast‐track improves post‐operative nutrition and outcomes of colorectal surgery: a single‐center prospective trial in China. Asia Pacific Journal of Clinical Nutrition 2014;23(1):41‐7. [DOI] [PubMed] [Google Scholar]
Liao 1996 {published data only}
- Liao CX, Li CL, Lv XZ. Relationship between liver cancer growth and nutrition support in human. Chinese Journal of Clinical Nutrition 1996;4(4):184‐5. [Google Scholar]
Liao 1997 {published data only}
- Liao SS, Yang DM, Huang TQ. Postoperative enteral nutrition support of patients with esophageal or stomach cancer through upper jejunum. Chinese Journal of Clinical Nutrition 1997;5(1):40‐2. [Google Scholar]
Liao 2005 {published data only}
- Liao Q, Zhao YP, Wang WB, Dai MH, Hu Y, Liu ZW, et al. Perioperative nutrition support of the patients with pancreatic head cancer. Acta Academiae Medicinae Sinicae 2005;27(5):579‐82. [PubMed] [Google Scholar]
Lidder 2010 {published data only}
- Lidder P, Flanagan D, Fleming S, Russell M, Morgan N, Wheatley T, et al. Combining enteral with parenteral nutrition to improve postoperative glucose control. British Journal of Nutrition 2010;103(11):1635‐41. [DOI] [PubMed] [Google Scholar]
Lier 2012 {published data only}
- Lier HO, Biringer E, Stubhaug B, Tangen T. The impact of preoperative counseling on postoperative treatment adherence in bariatric surgery patients: a randomized controlled trial. Patient Education and Counseling 2012;87(3):336‐42. [DOI] [PubMed] [Google Scholar]
Lim 2010 {published data only}
- Lim S, Kim SS. Impact of repeated over‐nutrition intake: randomized controlled trial. Free Radical Biology and Medicine 2010;49:S222. [Google Scholar]
Lin 1997 {published data only}
- Lin XP, Zhang XZ. Treatment of parenteral nutrition in patients with cardia and esophageal anastomotis leaks. Chinese Journal of Clinical Nutrition 1997;5(2):77‐9. [Google Scholar]
Lindschinger 2000 {published data only}
- Lindschinger M, Pamperl I, Anderhuber W, Hinterleitner T. Effect of an early percutaneous gastrostomy on the nutritional state, quality of life, anxiety and depression in patients with malignomas in the region of the larynx and pharynx. Aktuelle Ernahrungsmedizin 2000;25(2):74‐6. [Google Scholar]
Liu 1998 {published data only}
- Liu DG, Wang KF, Xiao CM, Ye QF, Hu CY, Qin XF, et al. Study on the change of antioxidase activity by parenteral nutrition support. Parenteral and Enteral Nutrition 1998;5(2):76‐9. [Google Scholar]
Liu 2000b {published data only}
- Liu YS, Long LM, Qu XB, Na RS, He FQ. The efficacy of parenteral nutrition with different energy for systemic inflammatory response syndrome (SIRS) in the aged. Bulletin of Hunan Medical University 2000;25(3):251‐3. [PubMed] [Google Scholar]
Liu 2007 {published data only}
- Liu WQ, Chen XY, Huang CH. Effect of enteral nutrition support on immune function in chronic obstructive pulmonary disease patients undergoing mechanic ventilation. Chinese Journal of Clinical Nutrition 2007;15(5):285‐8. [Google Scholar]
Liu 2010 {published data only}
- Liu Y, Tao KX, Wang GB. Effects of perioperative total parenteral nutrition support on cyclin D1 expression, recurrence and metastasis of colorectal cancer cells. Chinese Journal of Gastrointestinal Surgery 2010;13(6):433‐5. [PubMed] [Google Scholar]
Liu 2012 {published data only}
- Liu H, Ling W, Shen ZY, Jin X, Cao H. Clinical application of immune‐enhanced enteral nutrition in patients with advanced gastric cancer after total gastrectomy. Journal of Digestive Diseases 2012;13(6):401‐6. [DOI] [PubMed] [Google Scholar]
Lo 2005 {published data only}
- Lo HC, Lin CH, Tsai LJ. Effects of hypercaloric feeding on nutrition status and carbon dioxide production in patients with long‐term mechanical ventilation. Journal of Parenteral and Enteral Nutrition 2005;29(5):380‐7. [DOI] [PubMed] [Google Scholar]
Lobato 2010 {published data only}
- Lobato Dias Consoli M, Maciel Fonseca L, Gomes da Silva R, Toulson Davisson Correia MI. Early postoperative oral feeding impacts positively in patients undergoing colonic resection: results of a pilot study. Nutricion Hospitalaria 2010;25(5):806‐9. [PubMed] [Google Scholar]
Löhlein 1981 {published data only}
- Löhlein D. Protein‐sparing effect of various types of peripheral parenteral nutrition. Zeitschrift fur Ernahrungswissenschaft 1981;20(2):81‐95. [DOI] [PubMed] [Google Scholar]
Lopez 1980 {published data only}
- Lopez Martinez J, Caparros T, Perez Picouto F, Lopez Diez F, Cereijo E. Parenteral nutrition in septic patients with acute renal failure in polyuric phase. Revista Clinica Española 1980;157(3):171‐7. [PubMed] [Google Scholar]
Lovik 1996 {published data only}
- Lovik A, Almendingen K, Dotterud M, Forli L, Boysen M, Omarhus M, et al. Dietary information after radiotherapy of head and neck cancer. Tidsskrift for Den Norske Laegeforening 1996;116(19):2303‐6. [PubMed] [Google Scholar]
Lucha 2005 {published data only}
- Lucha PA, Butler R, Plichta J, Francis M. The economic impact of early enteral feeding in gastrointestinal surgery: a prospective survey of 51 consecutive patients. American Surgeon 2005;71(3):187‐90. [PubMed] [Google Scholar]
Luder 2002 {published data only}
- Luder E, Lou WWY. Effect of enteral nutrition on the course of cystic fibrosis. American Journal of Respiratory and Critical Care Medicine 2002;165(8):A283. [Google Scholar]
Lundholm 2004 {published data only}
- Lundholm K, Daneryd P, Bosaeus I, Korner U, Lindholm E. Palliative nutritional intervention in addition to cyclooxygenase and erythropoietin treatment for patients with malignant disease: effects on survival, metabolism, and function. Cancer 2004;100(9):1967‐77. [DOI] [PubMed] [Google Scholar]
Luo 1996 {published data only}
- Luo B, Li GW, Wang WZ. Effect of route of early nutritional support on postoperative surgical patients‐‐comparison of nutritional state and catabolic hormone secretion. Parenteral and Enteral Nutrition 1996;3(3):134‐6. [Google Scholar]
Luo 1999 {published data only}
- Luo SC, Hu RX, Zhang SY. Effect of TPN with hypocaloric regimens on metabolic response of postoperative surgical patients. Chinese Journal of Clinical Nutrition 1999;7(4):161‐4. [Google Scholar]
Lv 2000 {published data only}
- Lv L, Liu QC, Li Y. The short term effect of enteral nutrition support which achieve the nutritional goal on critical patients. Chinese Journal of Clinical Nutrition 2000;8(1):70‐1. [Google Scholar]
Ma 1999 {published data only}
- Ma JZ, Tang YQ. Efficacy study of supplementary parenteral nutrition in the treatment of 22 cases of elderly pneumoia. Practical Geriatrics 1999;13(3):76. [Google Scholar]
Ma 2014 {published data only}
- Ma LP, Zhong GY, Lei ZP, Li NX. Early enteral nutrition with nursing intervention for improvement of nutritional status and prognosis in critically ill patients in gastroenterology department. World Chinese Journal of Digestology 2014;22(30):4679‐82. [Google Scholar]
Maci 1991 {published data only}
- Maci E, Moran J, Santos J, Blanco M, Mahedero G, Salas J. Nutritional evaluation and dietetic care in cancer patients treated with radiotherapy: prospective study. Nutrition 1991;7(3):205‐9. [PubMed] [Google Scholar]
Mackenzie 2005 {published data only}
- Mackenzie SL, Zygun DA, Whitmore BL, Doig CJ, Hameed SM. Implementation of a nutrition support protocol increases the proportion of mechanically ventilated patients reaching enteral nutrition targets in the adult intensive care unit. Journal of Parenteral and Enteral Nutrition 2005;29(2):74‐80. [DOI] [PubMed] [Google Scholar]
Madigan 2005 {published data only}
- Madigan SM, Stevenson M, Wright ME, Fleming P, Dobbs F, McAuley D. A randomised controlled trial of a pragmatic nutrition education intervention in primary care. Proceedings of the Nutrition Society 2005;64:34A. [Google Scholar]
Marktl 1980 {published data only}
- Marktl W, Reich‐Hilscher B, Benke A, Rudas B. Metabolism of parenterally administered amino acids in infusions of various carbohydrate solutions during the postoperative phase. Die Medizinische Welt 1980;31(23):890‐3. [PubMed] [Google Scholar]
Martin 2004 {published data only}
- Martin CM, Doig GS, Heyland DK, Morrison T, Sibbald WJ. Multicentre, cluster‐randomized clinical trial of algorithms for critical‐care enteral and parenteral therapy. Canadian Medical Association Journal 2004;170(2):197‐204. [PMC free article] [PubMed] [Google Scholar]
Mattioli 1993 {published data only}
- Mattioli S, Lazzari A, Federica Lerro M, Simone MP, Pilotti V, Raspadori A, et al. Parenteral nutrition after major digestive surgery. A randomized study on different standard diets abstract. [Italian]. Chirurgia 1993;6(3):129‐33. [Google Scholar]
Mault 2000 {published data only}
- Mault J. Energy balance and outcome in critically‐ill patients: results of a multi‐center, prospective, randomized trial by the ICU Nutrition Study Group (Univ. Colorado; Univ. Michigan; Denver Health Med Center; Univ. Cincinnati; and Univ. Pennsylvania). Journal of Parenteral and Enteral Nutrition 2000;24(1):S4. [Google Scholar]
McClave 2001 {published data only}
- McClave S, Adams J, Lowen C, Looney S, Kleber M, Lukan J, et al. When should enteral nutrition support be stopped prior to a procedure or diagnostic test?. Journal of Parenteral and Enteral Nutrition 2001;25(1):S14. [Google Scholar]
McCowen 2000 {published data only}
- McCowen KC, Friel C, Sternberg J, Chan S, Forse RA, Burke PA, et al. Hypocaloric total parenteral nutrition: effectiveness in prevention of hyperglycemia and infectious complications ‐ a randomized clinical trial. Critical Care Medicine 2000;28(11):3606‐11. [DOI] [PubMed] [Google Scholar]
Mehringer 2001 {published data only}
- Mehringer L, Ibrahim E, Prentice D, Marin K. A comparative analysis of the effect of early versus late enteral feeding on the clinical outcomes of mechanically ventilated patients in the intensive care unit setting. Journal of Parenteral and Enteral Nutrition 2001;25(1):S18. [Google Scholar]
Mehta 2010 {published data only}
- Mehta S, Gupta S, Goel N. Postoperative oral feeding after cesarean section ‐ early versus late initiation: a prospective randomized trial. Journal of Gynecologic Surgery 2010;26(4):247‐50. [Google Scholar]
Meisner 2008 {published data only}
- Meisner M, Ernhofer U, Schmidt J. Liberalisation of preoperative fasting guidelines: effects on patient comfort and clinical practicability during elective laparoscopic surgery of the lower abdomen. Zentralblatt für Chirurgie 2008;133(5):479‐85. [DOI] [PubMed] [Google Scholar]
Mendenhall 1985 {published data only}
- Mendenhall C, Bongiovanni G, Goldberg S. VA cooperative study on alcoholic hepatitis III: changes in protein‐calorie malnutrition associated with 30 days of hospitalization with and without enteral nutritional therapy. Journal of Parenteral and Enteral Nutrition 1985;9(5):590‐6. [DOI] [PubMed] [Google Scholar]
Mi 2012 {published data only}
- Mi L, Zhong B, Zhang DL, Zhou YB, Wang DS. Effect of early oral enteral nutrition on clinical outcomes after gastric cancer surgery. Chinese Journal of Gastrointestinal Surgery 2012;15(5):464‐7. [PubMed] [Google Scholar]
Miao 2005 {published data only}
- Miao LJ, Wang J, Liu H, Cheng Z. Role of enteral nutrition combined with parenteral nutrition in supporting the mechanical ventilation of patients with chronic obstructive pulmonary disease accompanied by respiratory failure. Zhongguo Linchuang Kangfu 2005;9(31):27‐9. [Google Scholar]
Minard 2000 {published data only}
- Minard G, Kudsk KA, Melton S, Patton JH, Tolley EA. Early versus delayed feeding with an immune‐enhancing diet in patients with severe head injuries. Journal of Parenteral and Enteral Nutrition 2000;24(3):145‐9. [DOI] [PubMed] [Google Scholar]
Minig 2009 {published data only}
- Minig L, Biffi R, Zanagnolo V, Attanasio A, Beltrami C, Bocciolone L, et al. Early oral versus "traditional" postoperative feeding in gynecologic oncology patients undergoing intestinal resection: a randomized controlled trial. Annals of Surgical Oncology 2009;16(6):1660‐8. [DOI] [PubMed] [Google Scholar]
Moghissi 1977 {published data only}
- Moghissi K, Hornshaw J, Teasdale PR, Dawes EA. Parenteral nutrition in carcinoma of the oesophagus treated by surgery: nitrogen balance and clinical studies. British Journal of Surgery 1977;64(2):125‐8. [PUBMED: 407963] [DOI] [PubMed] [Google Scholar]
Moloney 1983 {published data only}
- Moloney M, Moriarty M, Daly L. Controlled studies of nutritional intake in patients with malignant disease undergoing treatment. Human Nutrition. Applied Nutrition 1983;37(1):30‐5. [PUBMED: 6841130] [PubMed] [Google Scholar]
Moore 1983 {published data only}
- Moore EE, Jones TN. Nutritional assessment and preliminary report on early support of the trauma patient. Journal of the American College of Nutrition 1983;2(1):45‐54. [DOI] [PubMed] [Google Scholar]
Moore 1986 {published data only}
- Moore EE, Jones TN. Benefits of immediate jejunostomy feeding after major abdominal trauma‐‐a prospective, randomized study. Journal of Trauma 1986;26(10):874‐81. [DOI] [PubMed] [Google Scholar]
Moore 1991 {published data only}
- Moore EE, Moore FA. Immediate enteral nutrition following multisystem trauma ‐ a decade perspective. Journal of the American College of Nutrition 1991;10(6):633‐48. [DOI] [PubMed] [Google Scholar]
Müller 1995 {published data only}
- Müller TF, Müller A, Bachem MG, Lange H. Immediate metabolic effects of different nutritional regimens in critically ill medical patients. Intensive Care Medicine 1995;21(7):561‐6. [DOI] [PubMed] [Google Scholar]
Murphy 1992 {published data only}
- Murphy J, Cameron DW, Garber G, Conway B, Denomme N. Dietary counselling and nutritional supplementation in HIV‐infection. Journal of the Canadian Dietetic Association 1992;53(3):205‐8. [Google Scholar]
Nachtigal 2008 {published data only}
- Nachtigal R. Are food supplements effective in knee osteoarthritis?. Aktuelle Rheumatologie 2008;33(2):62‐3. [Google Scholar]
Nagata 2009 {published data only}
- Nagata S, Fukuzawa K, Iwashita Y, Kabashima A, Kinoshita T, Wakasugi K, et al. Comparison of enteral nutrition with combined enteral and parenteral nutrition in post‐pancreaticoduodenectomy patients: a pilot study. Nutrition Journal 2009;8:24. [DOI] [PMC free article] [PubMed] [Google Scholar]
Namulema 2008 {published data only}
- Namulema E, Sparling J, Foster HD. When the nutritional supplements stop: Evidence from a double‐blinded, HIV clinical trial at Mengo Hospital, Kampala, Uganda. Journal of Orthomolecular Medicine 2008;23(3):130‐2. [Google Scholar]
Nataloni 1999 {published data only}
- Nataloni S, Gentili P, Marini B, Guidi A, Marconi P, Busco F, et al. Nutritional assessment in head injured patients through the study of rapid turnover visceral proteins. Clinical Nutrition 1999;18(4):247‐51. [DOI] [PubMed] [Google Scholar]
Navratilova 2007 {published data only}
- Navratilova M, Jarkovsky J, Ceskova E, Leonard B, Sobotka L. Alzheimer disease: malnutrition and nutritional support. Clinical and Experimental Pharmacology and Physiology 2007;34:S11‐3. [Google Scholar]
Nayel 1992 {published data only}
- Nayel H, Elghoneimy E, Elhaddad S. Impact of nutritional supplementation on treatment delay and morbidity in patients with head and neck tumors treated with irradiation. Nutrition 1992;8(1):13‐8. [PubMed] [Google Scholar]
Neander 2004 {published data only}
- Neander K, Hesse F, Wagenaar L, Wouters‐Wesseling W. A specific nutritional supplement reduces the incidence of pressure ulcers in elderly people. Journal of Parenteral and Enteral Nutrition 2004;28(1):S31‐2. [Google Scholar]
Neto 2012 {published data only}
- Neto HMC, Pontes‐Arruda A, Castro LG, Furtado‐Lima Vdadb, Dos Santos Mcfc, Martins LF. The effect of parenteral nutrition delivery upon development of severe sepsis and septic shock: an international, prospective, randomized, open‐label and controlled study. Critical Care Medicine 2012;40(12):U283‐4. [Google Scholar]
Norman 2008 {published data only}
- Norman K, Kirchner H, Freudenreich M, Ockenga J, Lochs H, Pirlich M. Three month intervention with protein and energy rich supplements improve muscle function and quality of life in malnourished patients with non‐neoplastic gastrointestinal disease ‐ A randomized controlled trial. Clinical Nutrition 2008;27(1):48‐56. [DOI] [PubMed] [Google Scholar]
- Norman K, Pirlich M, Smoliner C, Kilbert A, Schulzke JD, Ockenga J, et al. Cost‐effectiveness of a 3‐month intervention with oral nutritional supplements in disease‐related malnutrition: a randomised controlled pilot study. European Journal of Clinical Nutrition 2011;65(6):735‐42. [DOI] [PubMed] [Google Scholar]
Nørregaard 1987 {published and unpublished data}
- Nørregaard O, Tottrup A, Saaek A, Hessov I. Effects of oral nutritional supplements to adults with chronic obstructive pulmonary disease. Clinical Respiratory Physiology 1987;23(suppl12):388s. [Google Scholar]
Oehler 1987 {published data only}
- Oehler GB, Bdinger M, Heinrich D, Schmahl FW, Schondorf T. Plasma protein pattern and free fatty acids in patients with myocardial infarction on oral and additional parenteral nutrition. Die Medizinische Welt 1987;38(38):130‐3. [Google Scholar]
Ohura 2011 {published data only}
- Ohura T, Nakajo T, Okada S, Omura K, Adachi K. Evaluation of effects of nutrition intervention on healing of pressure ulcers and nutritional states (randomized controlled trial). Wound Repair and Regeneration 2011;19(3):330‐6. [DOI] [PubMed] [Google Scholar]
Olin 1996 {published data only}
- Olin AO, Osterberg P, Hadell K, Armyr I, Jerstrom S, Ljungqvist O, et al. Energy‐enriched hospital food to improve energy intake in elderly patients. Journal of Parenteral and Enteral Nutrition 1996;20(2):93‐7. [DOI] [PubMed] [Google Scholar]
Olofsson 2007 {published data only}
- Olofsson B, Stenvall M, Lundstrom M, Svensson O, Gustafson Y. Malnutrition in hip fracture patients: an intervention study. Journal of Clinical Nursing 2007;16(11):2027‐38. [DOI] [PubMed] [Google Scholar]
Oloriz 1992 {published data only}
- Oloriz Rivas MR, Dominguez Vazquez A. Nutritional support in laryngectomized patients. Nutricion Hospitalaria 1992;7(4):282‐90. [PubMed] [Google Scholar]
Otte 1989 {published data only}
- Otte KE, Ahlburg P, D'Amore F, Stellfeld M. Nutritional repletion in malnourished patients with emphysema. Journal of Parenteral and Enteral Nutrition 1989;13(2):152‐6. [PUBMED: 2651744] [DOI] [PubMed] [Google Scholar]
Ouyang 2003 {published data only}
- Ouyang HM, Wang XH, Song HQ. Applied research on early enteral nutrition in patiens with severe cerebral infarction. Chinese Journal of Clinical Rehabilitation 2003;7(28):3836‐7. [Google Scholar]
Ovesen 1992 {published data only}
- Ovesen L. The effect of a supplement which is nutrient dense compared to standard concentration on the total nutritional intake of anorectic patients. Clinical Nutrition 1992;11(3):154‐7. [DOI] [PubMed] [Google Scholar]
Ovesen 1993 {published data only}
- Ovesen L, Allingstrup L, Hannibal J, Mortensen EL, Hansen OP. Effect of dietary counselling on food intake, body weight, response rate, survival, and quality of life in cancer patients undergoing chemotherapy: a prospective, randomized study. Journal of Clinical Oncology 1993;11(10):2043‐9. [DOI] [PubMed] [Google Scholar]
Pan 2000 {published data only}
- Pan HY. The effect of early enteral nutrition on the patients with cerebral stoke. Chinese Journal of Clinical Nutrition 2000;8(3):116‐7. [Google Scholar]
Pandey 2002 {published data only}
- Pandey SK, Ahuja V, Joshi YK, Sharma MP. A randomized trial of oral refeeding compared with jejunal tube refeeding in acute pancreatitis. Indian Journal of Gastroenterology 2004;23(2):53‐55. [PubMed] [Google Scholar]
Pantzaris 2012 {published data only}
- Pantzaris MC, Loukaides GN, Ntzani EE, Patrikios IS. A novel oral medical nutrition formula (Plp10) for the treatment of relapsing‐remitting multiple sclerosis: a randomised, double‐blind, placebo‐controlled proof‐of‐concept clinical trial. Multiple Sclerosis Journal 2012;18:473. [DOI] [PMC free article] [PubMed] [Google Scholar]
Paton 2004 {published data only}
- Paton NI, Chua YK, Earnest A, Chee CB. Randomized controlled trial of nutritional supplementation in patients with newly diagnosed tuberculosis and wasting. American Journal of Clinical Nutrition 2004;80(2):460‐5. [DOI] [PubMed] [Google Scholar]
Pawlotsky 1987 {published data only}
- Pawlotsky JM, Cosnes J, Bellanger J, Quintrec M, Baumer P, Gendre JP, et al. Does cancer modify the nutritional response of continuous enteral alimentation?. Gastroenterologie Clinique et Biologique 1987;11(2):282a. [Google Scholar]
Pedersen 2005 {published data only}
- Pedersen PU. Nutritional care: the effectiveness of actively involving older patients. Journal of Clinical Nursing 2005;14(2):247‐55. [DOI] [PubMed] [Google Scholar]
Peitsch 1982 {published data only}
- Peitsch W. Postoperative parenteral feeding. Die Medizinische Welt 1982;33(35):1198‐204. [PubMed] [Google Scholar]
Persson 2002 {published data only}
- Persson CR, Johansson BB, Sjoden PO, Glimelius BL. A randomized study of nutritional support in patients with colorectal and gastric cancer. Nutrition and Cancer 2002;42(1):48‐58. [DOI] [PubMed] [Google Scholar]
Persson 2007 {published data only}
- Persson M, Hytter‐Landahl A, Brismar K, Cederholm T. Nutritional supplementation and dietary advice in geriatric patients at risk of malnutrition. Clinical Nutrition 2007;26(2):216‐24. [PUBMED: 17275141] [DOI] [PubMed] [Google Scholar]
Pinilla 2001 {published data only}
- Pinilla JC, Samphire J, Arnold C, Liu L, Thiessen B. Comparison of gastrointestinal tolerance to two enteral feeding protocols in critically ill patients: a prospective, randomized controlled trial. Journal of Parenteral and Enteral Nutrition 2001;25(2):81‐6. [DOI] [PubMed] [Google Scholar]
Pitkanen 1991 {published data only}
- Pitkanen O, Takala J, Poyhonen M, Kari A. Nitrogen and energy balance in septic and injured intensive care patients: response to parenteral nutrition. Clinical Nutrition 1991;10(5):258‐65. [PUBMED: 16839929] [DOI] [PubMed] [Google Scholar]
Pivi 2011 {published data only}
- Pivi G A, Silva RV, Juliano Y, Novo NF, Okamoto IH, Brant CQ, et al. A prospective study of nutrition education and oral nutritional supplementation in patients with Alzheimer's disease. Nutrition Journal 2011;10:98. [DOI] [PMC free article] [PubMed] [Google Scholar]
Powell 2000 {published data only}
- Powell JJ, Hill G, Storey S, Murchison J, Fearon KCH, Ross JA, et al. Phase II randomised controlled trial of early enteral nutrition in predicted severe acute pancreatitis. Gastroenterology 1999;116(4):A1342. [Google Scholar]
- Powell JJ, Murchison JT, Fearon KC, Ross JA, Siriwardena AK. Randomized controlled trial of the effect of early enteral nutrition on markers of the inflammatory response in predicted severe acute pancreatitis. British Journal of Surgery 2000;87(10):1375‐81. [DOI] [PubMed] [Google Scholar]
- Siriwardena A, Fearon KCH, Ross JA, Murchison J. Randomised, controlled trial of early enteral nutrition in severe acute pancreatitis. Health Bulletin 1997;55(3):197. [Google Scholar]
Powers 1986 {published data only}
- Powers DA, Brown RO, Cowan GS, Luther RW, Sutherland DA, Drexler PG. Nutritional support team vs nonteam management of enteral nutritional support in a Veterans Administration Medical Center Teaching Hospital. Journal of Parenteral and Enteral Nutrition 1986;10(6):635‐8. [DOI] [PubMed] [Google Scholar]
Praygod 2011 {published data only}
- Praygod G, Range N, Faurholt‐Jepsen D, Jeremiah K, Faurholt‐Jepsen M, Aabye MG. The effect of energy‐protein supplementation on weight, body composition and handgrip strength among pulmonary tuberculosis HIV‐co‐infected patients: randomised controlled trial in Mwanza, Tanzania. British Journal of Nutrition 2011;1(1):1‐9 ePub. [DOI] [PubMed] [Google Scholar]
Preshaw 1979 {published data only}
- Preshaw RM, Attisha RP, Hollingsworth WJ. Randomized sequential trial of parenteral nutrition in healing of colonic anastomoses in man. Canadian Journal of Surgery. Journal Canadien de Chirurgie 1979;22(5):437‐9. [PubMed] [Google Scholar]
Prohaska 1977 {published data only}
- Prohaska H, Tiso B, Koppel H. Modification of the repair phase in myocardial infarct through partial parenteral feeding. Preliminary report. Wiener Medizinische Wochenschrift 1977;127(13):428‐9. [PubMed] [Google Scholar]
Pronio 2008 {published data only}
- Pronio A, Filippo A, Aguzzi D, Laviano A, Narilli P, Piroli S, et al. Treatment of mild malnutrition and reduction of morbidity in abdominal surgery: a trial on 153 patients. Clinica Terapeutica 2008;159(1):13‐8. [PubMed] [Google Scholar]
Qiu 1998 {published data only}
- Qiu HQ. The effect of short term intravenous nutrition therapy on the effectiveness of the treatment of pulmonary heart disease with heart‐lung failure. Chinese Journal of Enteral and Parenteral Nutrition 1998;6(1):16‐9. [Google Scholar]
Rabeneck 1998 {published data only}
- Rabeneck L, Palmer A, Knowles JB, Seidehamel RJ, Harris CL, Merkel KL, et al. A randomized controlled trial evaluating nutrition counseling with or without oral supplementation in malnourished HIV‐infected patients. Journal of the American Dietetic Association 1998;98(4):434‐8. [PUBMED: 9550167] [DOI] [PubMed] [Google Scholar]
Rabinovitch 2006 {published data only}
- Rabinovitch R, Grant B, Berkey BA, Raben D, Ang KK, Fu KK, et al. Impact of nutrition support on treatment outcome in patients with locally advanced head and neck squamous cell cancer treated with definitive radiotherapy: a secondary analysis of RTOG trial 90‐03. Head and Neck 2006;28(4):287‐96. [DOI] [PubMed] [Google Scholar]
Ramirez 1979 {published data only}
- Ramirez Acosta J, Bracamontes F, Bourges H. Minimal protein and calories parenteral route requirements in order to have a positive nitrogen balance in patients with acute diseases. Revista de Gastroenterologia de Mexico 1979;44(1):9‐14. [PubMed] [Google Scholar]
Ravasco 2005a {published data only}
- Ravasco P, Monteiro‐Grillo I, Marques Vidal P, Camilo ME. Impact of nutrition on outcome: a prospective randomized controlled trial in patients with head and neck cancer undergoing radiotherapy. Head and Neck 2005;27(8):659‐68. [DOI] [PubMed] [Google Scholar]
Ravasco 2005b {published data only}
- Ravasco P, Monteiro‐Grillo I, Vidal PM, Camilo ME. Dietary counselling improves patient outcomes: a prospective, randomized, controlled trial in colorectal cancer patients undergoing radiotherapy. Journal of Clinical Oncology 2005;23(7):1431‐8. [DOI] [PubMed] [Google Scholar]
Rice 2011 {published data only}
- Rice TW, Mogan S, Hays MA, Bernard GR, Jensen GL, Wheeler AP. Randomized trial of initial trophic versus full‐energy enteral nutrition in mechanically ventilated patients with acute respiratory failure. Critical Care Medicine 2011;39(5):967‐74. [DOI] [PMC free article] [PubMed] [Google Scholar]
Rice 2012 {published data only}
- Rice TW, Wheeler AP, Thompson BT, Steingrub J, Hite RD, Moss M, et al. National Heart, Lung, and Blood Institute Acute Respiratory Distress Syndrome (ARDS) Clinical Trials Network. Initial trophic vs full enteral feeding in patients with acute lung injury: the EDEN randomized trial. JAMA 2012;307(8):795‐803. [DOI] [PMC free article] [PubMed] [Google Scholar]
Rickard 1983 {published data only}
- Rickard KA, Detamore CM, Coates TD, Grosfeld JL, Weetman RM, White NM, et al. Effect of nutrition staging on treatment delays and outcome in Stage IV neuroblastoma. Cancer 1983;52(4):587‐98. [PUBMED: 6407749] [DOI] [PubMed] [Google Scholar]
Rinaldi 2006 {published data only}
- Rinaldi Schinkel E, Pettine SM, Adams E, Harris M. Impact of varying levels of protein intake on protein status indicators after gastric bypass in patients with multiple complications requiring nutritional support. Obesity Surgery 2006;16(1):24‐30. [DOI] [PubMed] [Google Scholar]
Riviere 2001 {published data only}
- Riviere S, Gillette‐Guyonnet S, Voisin T, Reynish E, Andrieu S, Lauque S, et al. A nutritional education program could prevent weight loss and slow cognitive decline in Alzheimer's disease. Journal of Nutrition, Health and Aging 2001;5(4):295‐9. [PubMed] [Google Scholar]
Rogers 1992 {published data only}
- Rogers RM, Donahoe M, Costantino J. Physiologic effects of oral supplemental feeding in malnourished patients with chronic obstructive pulmonary disease. A randomized control study. American Review of Respiratory Disease 1992;146(6):1511‐7. [DOI] [PubMed] [Google Scholar]
Rüfenacht 2010 {published data only}
- Rüfenacht U, Ruhlin M, Wegmann M, Imoberdorf R, Ballmer PE. Nutritional counselling improves quality of life and nutrient intake in hospitalized undernourished patients. Nutrition 2010;26(7):53‐60. [DOI] [PubMed] [Google Scholar]
Rypkema 2004 {published data only}
- Rypkema G, Adang E, Dicke H, Naber T, Swart B, Disselhorst L, et al. Cost‐effectiveness of an interdisciplinary intervention in geriatric inpatients to prevent malnutrition. Journal of Nutrition, Health and Aging 2004;8(2):122‐7. [PubMed] [Google Scholar]
Safdari‐Dehcheshmehi 2011 {published data only}
- Safdari‐Dehcheshmehi F, Salehian T, Parvin N, Akbari N. Comparison of the effects of gum chewing with those of early initiation of oral feeding and routine regimen on recovery of bowel function in primiparous women after cesarean section. Scientific Journal of Kurdistan University of Medical Sciences 2011;16(2):9‐15. [Google Scholar]
Sakai 2015 {published data only}
- Sakai Y, Iwata Y, Enomoto H, Saito M, Yoh K, Ishii A, et al. Two randomized controlled studies comparing the nutritional benefits of branched‐chain amino acid (BCAA) granules and a BCAA‐enriched nutrient mixture for patients with esophageal varices after endoscopic treatment. Journal of Gastroenterology 2015;50(1):109‐118. [DOI] [PMC free article] [PubMed] [Google Scholar]
Sako 1981 {published data only}
- Sako K, Lore JM, Kaufman S, Razack MS, Bakamjian V, Reese P. Parenteral hyperalimentation in surgical patients with head and neck cancer: a randomized study. Journal of Surgical Oncology 1981;16(4):391‐402. [DOI] [PubMed] [Google Scholar]
Sandstrøm 1993 {published data only}
- Sandstrøm R, Drott C, Hyltander A, Arfvidsson B, Schersten T, Wickstrom I, et al. The effect of postoperative intravenous feeding (TPN) on outcome following major surgery evaluated in a randomized study. Annals of Surgery 1993;217(2):185‐95. [DOI] [PMC free article] [PubMed] [Google Scholar]
Savassi‐Rocha 1992 {published data only}
- Savassi‐Rocha PR, Conceicao SA, Ferreira JT, Diniz MT, Campos IC, Fernandes VA, et al. Evaluation of the routine use of the nasogastric tube in digestive operation by a prospective controlled study. Surgery, Gynecology and Obstetrics 1992;174(4):317‐20. [PubMed] [Google Scholar]
Savva 2013 {published data only}
- Savva J, Silvers MA, Haines T, Huggins CE, Truby H. Exploring potential benefit of earlier nutritional interventions in adults with upper gastrointestinal cancer: a randomised trial. Asia‐Pacific Journal of Clinical Oncology 2013;9:73. [Google Scholar]
Schega 1967 {published data only}
- Schega W, Bussmann JF, Trabert E. Contribution to parenteral feeding in surgery. Deutsche Medizinische Wochenschrift 1967;92(20):925‐31. [DOI] [PubMed] [Google Scholar]
Schilder 1997 {published data only}
- Schilder JM, Hurteau JA, Look KY, Moore DH, Raff G, Stehman FB, et al. A prospective controlled trial of early postoperative oral intake following major abdominal gynecologic surgery. Gynecologic Oncology 1997;67(3):235‐40. [DOI] [PubMed] [Google Scholar]
Schneider 2000 {published data only}
- Schneider S. Perioperative parenteral nutrition in malnourished patients with digestive system cancer. Gastroenterologie Clinique et Biologique 2000;24(5):596‐7. [PubMed] [Google Scholar]
Schols 1995 {published data only}
- Schols AM, Soeters PB, Mostert R, Pluymers RJ, Wouters EF. Physiologic effects of nutritional support and anabolic steroids in patients with chronic obstructive pulmonary disease. A placebo‐controlled randomized trial. American Journal of Respiratory and Critical Care Medicine 1995;152(4 Pt 1):1268‐74. [PUBMED: 7551381] [DOI] [PubMed] [Google Scholar]
Schröter 1974 {published data only}
- Schröter J, Jekat F. Parenteral feeding using amino acid solutions [German]. Die Medizinische Welt 1974;25(26):1147‐51. [PubMed] [Google Scholar]
Schwarz 1998 {published data only}
- Schwarz G, Pichard C L, Sierro Ch, Frei A. Prospective comparative study on application costs of total parenteral nutrition (TPN) [abstract]. Clinical Nutrition 1998;17(Suppl 1):4‐5. [Google Scholar]
Schwenk 1999 {published data only}
- Schwenk A, Steuck H, Kremer G. Oral supplements as adjunctive treatment to nutritional counselling in malnourished HIV‐infected patients: randomized controlled trial. Clinical Nutrition 1999;18(6):371‐4. [DOI] [PubMed] [Google Scholar]
Scott 2005 {published data only}
- Scott F, Beech R, Smedley F, Timmis L, Stokes E, Jones P, et al. Prospective, randomized, controlled, single‐blind trial of the costs and consequences of systematic nutrition team follow‐up over 12 mo after percutaneous endoscopic gastrostomy. Nutrition 2005;21(11‐12):1071‐7. [DOI] [PubMed] [Google Scholar]
Seguy 2006 {published data only}
- Seguy D, Berthon C, Micol JB, Darre S, Dalle JH, Neuville S, et al. Enteral feeding and early outcomes of patients undergoing allogeneic stem cell transplantation following myeloablative conditioning. Transplantation 2006;82(6):835‐9. [DOI] [PubMed] [Google Scholar]
Serclov 2009 {published data only}
- Serclov Z, Dytrych P, Marvan J, Nov K, Hankeov Z, Ryska O, et al. Fast‐track in open intestinal surgery: prospective randomized study. Clinical Nutrition 2009;28(6):618‐24. [DOI] [PubMed] [Google Scholar]
Seri 1984 {published data only}
- Seri S, Aquilio E. Effects of early nutritional support in patients with abdominal trauma. Italian Journal of Surgical Sciences 1984;14(3):223‐7. [PubMed] [Google Scholar]
Serrou 1981b {published data only}
- Serrou B, Cupissol D, Plagne R, Boutin P, Carcassone Y, Michel FB. Parenteral intravenous nutrition (PIVN) as an adjunct to chemotherapy in small cell anaplastic lung carcinoma. Cancer Treatment Reports 1981;65(Suppl 5):151‐5. [PubMed] [Google Scholar]
Serrou 1982b {published data only}
- Serrou B, Cupissol D, Godard P, Plagne R, Favier F, Chollet P, et al. Randomized trial appraisal of adjuvant parenteral‐alimentation to chemotherapy in the management of small cell‐carcinoma. Bulletin Du Cancer 1982;69(1):108‐9. [Google Scholar]
Serrou 1983 {published data only}
- Serrou B, Cupissol D, Rey A, Favier F, Chollet P, Favier C, et al. Parenteral‐nutrition as a therapeutic adjuvant ‐ 30‐month results of randomized study of patients with anaplastic bronchial‐cancer. Bulletin Du Cancer 1983;70(2):84‐7. [PubMed] [Google Scholar]
Seven 2003 {published data only}
- Seven H, Calis AB, Turgut S. A randomized controlled trial of early oral feeding in laryngectomized patients. Laryngoscope 2003;113(6):1076‐9. [DOI] [PubMed] [Google Scholar]
Sha 1998 {published data only}
- Sha JH, Chen YX, Jin GH. The analysis of the effect of nutrition (PN) in general surgical postoperative patients. Chinese Journal of Clinical Nutrition 1998;6(2):89‐91. [Google Scholar]
Shamberger 1983 {published data only}
- Shamberger RC, Brennan MF, Goodgame JT, Lowry SF, Maher MM, Wesley RA, et al. A prospective, randomized study of adjuvant parenteral‐nutrition in the treatment of sarcomas ‐ results of metabolic and survival studies. Surgery 1984;96(1):1‐13. [PubMed] [Google Scholar]
- Shamberger RC, Pizzo PA, Goodgame JT, Lowry SF, Maher MM, Wesley RA, et al. The effect of total parenteral nutrition on chemotherapy‐induced myelosuppression. A randomized study. American Journal of Medicine 1983;74(1):40‐8. [DOI] [PubMed] [Google Scholar]
Shan 1997 {published data only}
- Shan PY, Zhang XP, Qi J. An observation on the effect of high protein diet on wound healing after transplantation at early stage. Chinese Journal of Clinical Nutrition 1997;5(3):116‐8. [Google Scholar]
Shang 2006 {published data only}
- Shang E, Weiss C, Post S, Kaehler G. The influence of early supplementation of parenteral nutrition on quality of life and body composition in patients with advanced cancer. Journal of Parenteral and Enteral Nutrition 2006;30(3):222‐30. [PubMed] [Google Scholar]
Shaw 1983 {published data only}
- Shaw SN, Elwyn DH, Askanazi J, Iles M, Schwarz Y, Kinney JM. Effects of increasing nitrogen intake on nitrogen balance and energy expenditure in nutritionally depleted adult patients receiving parenteral nutrition. American Journal of Clinical Nutrition 1983;37(6):930‐40. [DOI] [PubMed] [Google Scholar]
Shen 1994 {published data only}
- Shen YM, Li JH, Wen ZZ. Immunorestorative effect of TPN on post‐operative stomach cancer patients. Chinese Journal of Clinical Nutrition 1994;2(4):159‐62. [Google Scholar]
Shepherd 1988 {published data only}
- Shepherd RW, Holt TL, Cleghorn G, Ward LC, Isles A, Francis P. Short‐term nutritional supplementation during management of pulmonary exacerbations in cystic fibrosis: a controlled study, including effects of protein turnover. American Journal of Clinical Nutrition 1988;48(2):235‐9. [DOI] [PubMed] [Google Scholar]
Shi 2000 {published data only}
- Shi Z. Application of enteral nutrition in critically ill patients. Journal of Clinical Internal Medicine 2000;2:116‐7. [Google Scholar]
Shi 2001a {published data only}
- Shi XY, Xiao JQ, Yi JY. The study on the effect of partial parenteral nutrition on the inflammatory bowel diseases. Chinese Journal of Digestion 2001;21(1):59‐60. [Google Scholar]
Shi 2001b {published data only}
- Shi XY, Xiao JQ, Yi JY, Zhu YQ, Deng CS. Influence of partial parenteral nutrition with fat emulsion on nutritional status in patients with abdominal tuberculosis. Journal of Clinical Internal Medicine 2001;18(2):120. [Google Scholar]
Shi 2002 {published data only}
- Shi ZY, Jiang ZG, Li GQ, Chen XB. Clinical study of parenteral nutrition for gastrointestinal carcinoma post‐operation during perichemotheraputic period. Henan Journal of Oncology 2002;15(1):23‐5. [Google Scholar]
Shizgal 1976 {published data only}
- Shizgal HM, Spanier AH, Kurtz RS. Effect of parenteral nutrition on body composition in the critically ill patient. American Journal of Surgery 1976;131(2):156‐61. [DOI] [PubMed] [Google Scholar]
Shukla 1984 {published data only}
- Shukla HS, Rao RR, Banu N, Gupta RM, Yadav RC. Enteral hyperalimentation in malnourished surgical patients. Indian Journal of Medical Research 1984;80:339‐46. [PubMed] [Google Scholar]
Silander 2012 {published data only}
- Silander E, Nyman J, Bove M, Johansson L, Larsson S, Hammerlid E. Impact of prophylactic percutaneous endoscopic hastrostomy on malnutrition and quality of life in patients with head and neck cancer‐a randomized study. Head and Neck 2012;34(1):1‐9. [DOI] [PubMed] [Google Scholar]
Silander 2013 {published data only}
- Silander E, Jacobsson I, Berteus‐Forslund H, Hammerlid E. Energy intake and sources of nutritional support in patients with head and neck cancer‐‐a randomised longitudinal study. European Journal of Clinical Nutrition 2013;67(1):47‐52. [DOI] [PubMed] [Google Scholar]
Silva 2010 {published data only}
- Silva LBD, Mourao LF, Silva AA, Lima NMFV, Almeida SR, Franca MC, et al. Effect of nutritional supplementation with milk whey proteins in amyotrophic lateral sclerosis patients. Arquivos De Neuro‐Psiquiatria 2010;68(2):263‐8. [DOI] [PubMed] [Google Scholar]
Silvers 2014 {published data only}
- Silvers MA, Savva J, Huggins CE, Truby H, Haines T. Potential benefits of early nutritional intervention in adults with upper gastrointestinal cancer: a pilot randomised trial. Supportive Care in Cancer 2014;22(11):3035‐44. [DOI] [PubMed] [Google Scholar]
Singer 2011 {published data only}
- Singer P, Anbar R, Cohen J, Shapiro H, Shalita‐Chesner M, Lev S, et al. The tight calorie control study (TICACOS): a prospective, randomized, controlled pilot study of nutritional support in critically ill patients. Intensive Care Medicine 2011;37(4):601‐9. [DOI] [PubMed] [Google Scholar]
Singh 2008 {published data only}
- Singh S, Midha S, Singh N, Joshi YK, Garg PK. Dietary counselling versus dietary supplements for malnutrition in chronic pancreatitis: a randomized controlled trial. Clinical Gastroenterology and Hepatology 2008;6(3):353‐9. [DOI] [PubMed] [Google Scholar]
Smith 1982 {published data only}
- Smith RC, Burkinshaw L, Hill GL. Optimal energy and nitrogen intake for gastroenterological patients requiring intravenous nutrition. Gastroenterology 1982;82(3):445‐52. [PubMed] [Google Scholar]
Smith 2008 {published data only}
- Smith TR, Austin P, Harding S, Leach Z, Wootton SA, Stroud MA. Optimal levels of perioperative parenteral nutrition support: a double‐blind randomised controlled trial. Gut 2008;57(1):A19. [Google Scholar]
Snyderman 1999 {published data only}
- Snyderman CH, Kachman K, Molseed L, Wagner R, D'Amico F, Bumpous J, et al. Reduced postoperative infections with an immune‐enhancing nutritional supplement. Laryngoscope 1999;109(6):915‐21. [DOI] [PubMed] [Google Scholar]
Somanchi 2011 {published data only}
- Somanchi M, Tao X, Mullin GE. The facilitated early enteral and dietary management effectiveness trial in hospitalized patients with malnutrition. Journal of Parenteral and Enteral Nutrition 2011;35(2):209‐16. [DOI] [PubMed] [Google Scholar]
Song 2003 {published data only}
- Song J, Jing S, Shi H. The clinical observation of early oral feeding following total laryngectomy. Journal of Clinical Otorhinolaryngology 2003;17(9):527‐8. [PubMed] [Google Scholar]
Song 2009 {published data only}
- Song ML, Zou XM, Li XL. Enteral nutrition in patients after total gastrectomy: an analysis of 58 cases. World Chinese Journal of Digestology 2009;17(21):2195‐7. [Google Scholar]
Sorrentino 2012 {published data only}
- Sorrentino P, Castaldo G, Tarantino L, Bracigliano A, Perrella A, Perrella O, et al. Preservation of nutritional‐status in patients with refractory ascites due to hepatic cirrhosis who are undergoing repeated paracentesis. Journal of Gastroenterology and Hepatology 2012;27(4):813. [DOI] [PubMed] [Google Scholar]
Spain 1998 {published data only}
- Spain DA, McClave SA, Adams JL, Sexton LK, Blandford BS, Sullins ME, et al. Use of an infusion protocol improves the delivery of enteral tube feed (ETF) in the critical care setting. Journal of Parenteral and Enteral Nutrition 1998;22(1):S13. [DOI] [PubMed] [Google Scholar]
Stein 1981 {published data only}
- Stein TP, Buzby GP, Rosato EF, Mullen JL. Effect of parenteral nutrition on protein synthesis in adult cancer patients. Intensive Care Medicine 1981;34(11):1484‐8. [DOI] [PubMed] [Google Scholar]
Stewart 1998 {published data only}
- Stewart BT, Woods RJ, Collopy BT, Fink RJ, Mackay JR, Keck JO. Early feeding after elective open colorectal resections: a prospective randomized trial. Australian and New Zealand Journal of Surgery 1998;68(2):125‐8. [DOI] [PubMed] [Google Scholar]
Sudarsanam 2011 {published data only}
- Sudarsanam TD, John J, Kang G, Mahendri V, Gerrior J, Franciosa M, et al. Pilot randomized trial of nutritional supplementation in patients with tuberculosis and HIV‐tuberculosis coinfection receiving directly observed short‐course chemotherapy for tuberculosis. Tropical Medicine and International Health 2011;16(6):699‐706. [DOI] [PMC free article] [PubMed] [Google Scholar]
Sultan 2012 {published data only}
- Sultan J, Griffin SM, Franco F, Kirby JA, Shenton BK, Seal CJ, et al. Randomized clinical trial of omega‐3 fatty acid‐supplemented enteral nutrition versus standard enteral nutrition in patients undergoing oesophagogastric cancer surgery. British Journal of Surgery 2012;99(6):346‐55. [DOI] [PMC free article] [PubMed] [Google Scholar]
Tabei 2004 {published data only}
- Tabei I, Kyoda S, Kosuge M, Tabata Y, Kashiwagi H, Anazawa S, et al. The re‐evaluation of early enteral nutritional management in esophageal/gastric surgery. Journal of Parenteral and Enteral Nutrition 2004;28(1):S31. [Google Scholar]
Tai 2011 {published data only}
- Tai MLS, Razlan H, Goh KL, Mohd Taib SH, Huzaini AHM, Rampal S, et al. Short term nasogastric versus oral feeding in hospitalised patients with advanced cirrhosis: a randomised trial. European Society for Clinical Nutrition and Metabolism 2011;6(6):e242‐7. [Google Scholar]
Tan 2002 {published data only}
- Tan WH, Wu J, Tai S, Che JH, Chi Q. The use of parenteral nutrition in postoperative patients with advanced ovarian cancer. Parenteral and Enteral Nutrition 2002;9(4):218‐20. [Google Scholar]
Tandon 1984 {published data only}
- Tandon SP, Gupta SC, Sinha SN, Naithani YP. Nutritional support as an adjunct therapy of advanced cancer patients. Indian Journal of Medical Research 1984;80:180‐8. [PubMed] [Google Scholar]
Tang 1999 {published data only}
- Tang CH, Hu YL. The effect of early postoperative enteral nutrition on cellular immunity in patients with gastrointestinal cancer. Chinese Journal of Clinical Nutrition 1999;7(4):165‐7. [Google Scholar]
Tang 2003 {published data only}
- Tang Y, Li R, Chen L. Support effects of enteral nutrition after total gastrectomy. Chinese Journal of Gastrointestinal Surgery 2003;6(2):128‐30. [Google Scholar]
Tang 2010 {published data only}
- Tang Y, Wu XS, Wei B, Chen L, Li R. Clinical application of perioperative fast‐track and nutrition support program in elderly patients with gastric cancer. Chinese Journal of Clinical Nutrition 2010;18(3):137‐40. [Google Scholar]
Tanuwihardja 2010 {published data only}
- Tanuwihardja RK, Rosario DC, Frane RG, Campomanes CML, Zotomayor RC, Samson MJT, et al. The effect of immuno‐modulator nutrition, among mechanically ventilated patients due to severe community acquired pneumonia. a double‐blind, randomized, controlled trial. Respirology 2010;15:38. [Google Scholar]
Taylor 1998 {published data only}
- Taylor SJ, Fettes SB. Enhanced enteral nutrition in head injury: effect on the efficacy of nutritional delivery, nitrogen balance, gastric residuals and risk of pneumonia. Journal of Human Nutrition and Dietetics 1998;11(5):391‐401. [Google Scholar]
- Taylor SJ, Fettes SB, Jewkes C, Nelson RJ. Prospective, randomized, controlled trial to determine the effect of early enhanced enteral nutrition on clinical outcome in mechanically ventilated patients suffering head injury. Critical Care Medicine 1999;27(11):2525‐31. [DOI] [PubMed] [Google Scholar]
Teich 2009 {published data only}
- Teich N, Aghdassi A, Fischer J, Walz B, Caca K, Wallochny T, et al. Restarting oral nutrition by mild acute pancreatitis ‐ results of a multi‐centre, open, randomised study. Zeitschrift fur Gastroenterologie 2009;47(9):862. [Google Scholar]
Tesinsky 1999 {published data only}
- Tesinsky P, Rusavy Z, Staudinger T. Enteral nutrition: an effective method in treatment of pancreatic pseudocysts. Journal of Parenteral and Enteral Nutrition 1999;23(1):S12. [Google Scholar]
Thomas 2005 {published data only}
- Thomas DR, Zdrodowski CD, Wilson MM, Conright KC, Diebold M, Morley JE. A prospective, randomized clinical study of adjunctive peripheral parenteral nutrition in adult subacute care patients. Journal of Nutrition, Health and Aging 2005;9(5):321‐5. [PubMed] [Google Scholar]
Tjäder 1996 {published data only}
- Tjäder I, Essen P, Thorne A, Garlick PJ, Wernerman J, McNurlan MA. Muscle protein synthesis rate decreases 24 hours after abdominal surgery irrespective of total parenteral nutrition. Journal of Parenteral and Enteral Nutrition 1996;20(2):135‐8. [DOI] [PubMed] [Google Scholar]
Tkatch 1992 {published data only}
- Tkatch L, Rapin CH, Rizzoli R, Slosman D, Nydegger V, Vasay H, et al. Benefits of oral protein supplementation in elderly patients with fracture of the proximal femur. Journal of the American College of Nutrition 1992;11(5):519‐25. [DOI] [PubMed] [Google Scholar]
Touger Decker 1997 {published data only}
- Touger Decker R, Schaeffer M, Flinton R, Steinberg L. Impact of diet counselling and diet and nutrition status post‐denture. Journal of Dental Research 1997;76(1):s148. [Google Scholar]
Toyoda 1999 {published data only}
- Toyoda Y, Tashiro T, Yamamori H, Takagi K, Hayashi N, Iatabashi T, et al. Enteral nutrition promotes recovery of the cell‐mediated immunity and attenuates stress responses in patients receiving esophagectomy. Journal of Parenteral and Enteral Nutrition 1999;23(5):S148. [Google Scholar]
Trinidad Ruiz 2005 {published data only}
- Trinidad Ruiz G, Luengo Pérez LM, Marcos García M, Pardo Romero G, González Palomino A, Pino Rivero V, et al. Value of nutritional support in patients with pharingocutaneous fistula. Acta Otorrinolaringologica Espanola 2005;56(1):25‐30. [DOI] [PubMed] [Google Scholar]
Uzunkoy 2012 {published data only}
- Uzunkoy A. Effects of early enteral nutrition on postoperative complications after gastrointestinal anastomosis. Surgical Endoscopy and Other Interventional Techniques 2012;26(1):S280. [Google Scholar]
Valerio 1978 {published data only}
- Valerio D, Overett L, Malcolm A, Blackburn GL. Nutritional support for cancer patients receiving abdominal and pelvic radiotherapy: a randomized prospective clinical experiment of intravenous versus oral feeding. Surgical Forum 1978;29:145‐8. [PubMed] [Google Scholar]
Vargas 1995 {published data only}
- Vargas M, Puig A, Maza MP, Morales P, Vargas D, Bunout D, et al. Effects of an inspiratory muscle training program and nutritional support in patients with chronic obstructive lung disease. Revista Medica De Chile 1995;123(10):1225‐34. [PubMed] [Google Scholar]
Vermeeren 2001 {published data only}
- Vermeeren MAP, Wouters EF, Nelissen LH, Lier A, Hofman Z, Schols AM. Acute effects of different nutritional supplements on symptoms and functional capacity in patients with chronic obstructive pulmonary disease. American Journal of Clinical Nutrition 2001;73(2):295‐301. [DOI] [PubMed] [Google Scholar]
Vivanti 2015 {published data only}
- Vivanti A, Isenring E, Baumann S, Powrie D, O'Neill M, Clark D, et al. Emergency department malnutrition screening and support model improves outcomes in a pilot randomised controlled trial. Emergency Medicine Journal 2015;32(3):180‐3. [DOI] [PubMed] [Google Scholar]
Vizia 1998 {published data only}
- Vizia B, Cucchiara S, Franco MT, Emiliano M, Romano C, Sferlazzas C, et al. Enteral nutrition (EN) as sole treatment is more effective than mesalazine in maintaining remission in Chron's disease. Italian Journal of Gastroenterology and Hepatology 1998;30(Suppl 1):A25. [Google Scholar]
Vomel 2000 {published data only}
- Vomel T. The influence of enteral nutrition on cognitive and ADL‐functions in senile dementia. Medizinische Welt 2000;51(12):390‐2. [Google Scholar]
Wang 1995 {published data only}
- Wang ZM, Hui GZ. The favorable effect of early parenteral feeding on survival and metabolism in head‐injured patients. Parenteral and Enteral Nutrition 1995;2(1):27‐33. [Google Scholar]
Wang 1997c {published data only}
- Wang S, Wang S, Li A. A clinical study of early enteral feeding to protect the gut function in burned patients. Chinese Journal of Plastic Surgery and Burns 1997;13(4):267‐71. [PubMed] [Google Scholar]
Wang 1998a {published data only}
- Wang TZ, Hu XH, Wang BS, Wang GX, Lu XK, Wang LX, et al. Study on the promotion effect of the intermittent total parenteral nutrition in nutrition and immunological function recovery of post‐operation patients with gastrointestinal carcinoma. Parenteral and Enteral Nutrition 1998;5(2):69‐73. [Google Scholar]
Wang 1998b {published data only}
- Wang XS, Liu P, Zhang GH. Clinical research of nutrition maintenance for gastric cancer during preoperative period. Parenteral and Enteral Nutrition 1998;5(2):66‐8. [Google Scholar]
Wang 2000a {published data only}
- Wang XH, Bao L, Mu YJ. Effect of parenteral nutrition support on nutrition condition and immunity function in advanced malignant tumor patients. Chinese Journal of Clinical Nutrition 2000;8(2):112‐3. [Google Scholar]
Wang 2000b {published data only}
- Wang YQ, Zhang J. Parenteral nutrition in acute severe pancreatitis. Chinese Journal of Clinical Nutrition 2000;8(1):59. [Google Scholar]
Wang 2000c {published data only}
- Wang X, Pan C. Prospective control study of early parenteral nutrition in severe cerebral hemorrhage patients. Journal of Xi'an Medical University 2000;21(1):49‐51. [Google Scholar]
Wang 2006 {published data only}
- Wang YL, Qi YW, Bai JS, Li MW, Zhao Q. Effect of nutritional support on immunity function in the acquired immune deficiency syndrome patients. Chinese Critical Care Medicine 2006;18(10):603‐4. [PubMed] [Google Scholar]
Wang 2011a {published data only}
- Wang HX, Xia Y, Shao SY. Influence of enteral nutrition during the preoperative and postoperative periods on postoperative nutritional status and immunologic function in patients with gastric cancer. Journal of Xi'an Jiaotong University 2011;32(3):375‐8. [Google Scholar]
Wang 2012 {published data only}
- Wang Q, Suo J, Jiang J, Wang C, Zhao YQ, Cao X. Effectiveness of fast‐track rehabilitation vs conventional care in laparoscopic colorectal resection for elderly patients: a randomized trial. Colorectal Disease 2012;14(8):1009‐13. [DOI] [PubMed] [Google Scholar]
Wang 2013b {published data only}
- Wang RP, Deng J, Yang L. Influence of enteral nutrition on cardiac function and inflammatory factors in elderly patients with chronic pulmonary heart failure. Journal of the American Geriatrics Society 2013;61:S316. [Google Scholar]
Wang 2015 {published data only}
- Wang F, Hou MX, Wu XL, Bao LD, Dong PD. Impact of enteral nutrition on postoperative immune function and nutritional status. Genetics and Molecular Research 2015;14(2):6065‐72. [DOI] [PubMed] [Google Scholar]
Warnold 1988 {published data only}
- Warnold I, Eden E, Lundholm K. The inefficiency of total parenteral nutrition to stimulate protein synthesis in moderately malnourished patients. Annals of Surgery 1988;208(2):143‐9. [DOI] [PMC free article] [PubMed] [Google Scholar]
Way 1975 {published data only}
- Way CW, Meng HC, Sandstead HH. Nitrogen balance in postoperative patients receiving parenteral nutrition. Archives of Surgery 1975;110(3):272‐6. [DOI] [PubMed] [Google Scholar]
Wei 1998 {published data only}
- Wei HB, Han XY, Liu YZ. Effects of perioperative parenteral nutrition on T‐lymophocyte subsets in aged patients with colorectal cancer. Chinese Journal of Clinical Nutrition 1998;8(4):161‐4. [Google Scholar]
Weiner 1985 {published data only}
- Weiner RS, Kramer BS, Clamon GH, Feld R, Evans W, Moran EM, et al. Effects of intravenous hyperalimentation during treatment in patients with small‐cell lung cancer. Journal of Clinical Oncology 1985;3(7):949‐57. [DOI] [PubMed] [Google Scholar]
Weisdorf 1987 {published data only}
- Weisdorf SA, Lysne J, Wind D, Haake RJ, Sharp HL, Goldman A, et al. Positive effect of prophylactic total parenteral nutrition on long‐term outcome of bone marrow transplantation. Transplantation 1987;43(6):833‐8. [PubMed] [Google Scholar]
Williams 1976 {published data only}
- Williams RH, Heatley RV, Lewis MH. Proceedings: a randomized controlled trial of preoperative intravenous nutrition in patients with stomach cancer. British Journal of Surgery 1976;63(8):667. [PubMed] [Google Scholar]
Wong 2004 {published data only}
- Wong SY, Lau EM, Lau WW, Lynn HS. Is dietary counselling effective in increasing dietary calcium, protein and energy intake in patients with osteoporotic fractures? A randomized controlled clinical trial. Journal of Human Nutrition and Dietetics 2004;17(4):359‐64. [DOI] [PubMed] [Google Scholar]
Woo 1994 {published data only}
- Woo J, Ho SC, Mak YT, Law LK, Cheung A. Nutritional status of elderly patients during recovery from chest infection and the role of nutritional supplementation assessed by a prospective randomized single‐blind trial. Age and Ageing 1994;23(1):40‐8. [PUBMED: 8010171] [DOI] [PubMed] [Google Scholar]
Woolley 1996 {published data only}
- Woolley E, Humphreys J, Edington J, Lombard M. A comparison of pre‐operative percutaneous endoscopic gastrostomy feeding with standard management in patients undergoing major head and neck surgery for cancer. Proceedings of the Nutritional Society 1996;56:191a. [Google Scholar]
Wouters‐Wesseling 2002 {published data only}
- Wouters‐Wesseling W, Rozendaal M, Graus Y, Snijder M, Staveren W, Groot L, et al. Effect of a nutritional supplement on antibody response to influenza vaccine in the elderly. American Journal of Clinical Nutrition 2002;75(2):390s‐1s. [Google Scholar]
Wright 2006 {published data only}
- Wright L, Hickson M, Frost G. Eating together is important: using a dining room in an acute elderly medical ward increases energy intake. Journal of Human Nutrition and Dietetics 2006;19(1):23‐6. [DOI] [PubMed] [Google Scholar]
Wu 1996b {published data only}
- Wu WX, Hua YB, Liang H, Yu XM. A clinical comparative study of parenteral nutrition in portal vein. Parenteral and Enteral Nutrition 1996;3(2):113. [Google Scholar]
Wu 1999 {published data only}
- Wu WX, Xu Q, Hua YB, Shen LZ. Early enteral nutrition after colorectal resections: a prospective clinical trial. World Chinese Journal of Gastroenterology 1999;7(12):1024‐8. [Google Scholar]
Wu 2006 {published data only}
- Wu GH, Liu ZH, Wu ZH, Wu ZG. Perioperative artificial nutrition in malnourished gastrointestinal cancer patients. World Journal of Gastroenterology 2006;12(15):2441‐4. [DOI] [PMC free article] [PubMed] [Google Scholar]
Xiao 2000 {published data only}
- Xiao LY, Wang BF, Qiou ZX. Research of nutritional support in COPD patients. Chinese Journal of Clinical Nutrition 2000;8(1):55‐6. [Google Scholar]
Xu 1995 {published data only}
- Xu HZ, Zhang Q. Nutrition of burned patients: prognosis indices of inflammation. Chinese Journal of Enteral and Parenteral Nutrition 1995;3(2):39‐40,43. [Google Scholar]
Xu 1998b {published data only}
- Xu FZ, Gao FS, Wang AC, Wang AH, Liu YZ, Zhou CC, et al. Effect of short‐term intravenous nutritional supply on energy metabolism and exercise intolerance in chronic obstructive pulmonary disease. Parenteral and Enteral Nutrition 1998;5(2):80‐5. [Google Scholar]
Xu 1998c {published data only}
- Xu SC, Shun J. Application of parenteral nutrition in abdomen surgery. Parenteral and Enteral Nutrition 1998;5(2):74‐5. [Google Scholar]
Xu 2000 {published data only}
- Xu PY, Tan J, Xu SC. Clinical study of early enteral feeding for patients after abdominal operation. Chinese Journal of Clinical Nutrition 2000;8(2):107‐9. [Google Scholar]
Yang 1997 {published data only}
- Yang YM, Wang H, Wu LM. Comparison of nutritive method after esophageal cancer operation. Chinese Journal of Clinical Nutrition 1997;5(4):185‐8. [Google Scholar]
Yao 2013 {published data only}
- Yao JF, Zhang W, Chen J, Zhang GS, Zheng SB. Enteral nutrition before bowel preparation improves the safety of colonoscopy in the elderly. Turkish Journal of Gastroenterology 2013;24(5):400‐5. [DOI] [PubMed] [Google Scholar]
Ye 2011 {published data only}
- Ye HJ, Hu LJ, Yao YY, Chen JH. The effects of two health education models on psychological and nutritional profile of patients waiting for kidney transplantation. Chinese Journal of Internal Medicine 2011;50(10):845‐7. [PubMed] [Google Scholar]
Yetimalar 2010 {published data only}
- Yetimalar H, Koksal A, Aksakalli V, Kasap B, Cukurova K. Effects of early oral feeding after major abdominal gynecological operations. Turk Jinekoloji ve Obstetrik Dernegi Dergisi 2010;7(1):34‐8. [Google Scholar]
Yu 1999 {published data only}
- Yu SQ, Guo B, Ni MY. Diet intervention and free amino acid analysis in patients. Chinese Journal of Clinical Nutrition 1999;7(2):58‐60. [Google Scholar]
Yu 2007 {published data only}
- Yu CZ, Tuerhun A, Wang ZQ, YuM. Clinical application of homogenate diet and yogurt in patients with severe head injury. Chinese Journal of Clinical Nutrition 2007;15(4):232‐6. [Google Scholar]
Yu 2012 {published data only}
- Yu LN, Xi GM, Liu JX, Zhao ZX. Effects of nutritional support on serum amino acid spectrum and neurological function in acute stroke patients. Chinese Journal of Neurology 2012;45(12):849‐54. [Google Scholar]
Yuan 2003 {published data only}
- Yuan ZM, Huang LR, Chen ZL. Coagulant and enteral nutrition agent in the rehabilitation of deglutition disorders for patients with acute stroke. Chinese Journal of Clinical Rehabilitation 2003;7(28):3834‐5. [Google Scholar]
Yun 1993 {published data only}
- Yun HR, Cao WX, Lin YZ. Short term parenteral nutritional support and the changes of clinical biochemistry. Chinese Journal of Clinical Nutrition 1993;1(1):28‐30. [Google Scholar]
Zandier 1998 {published data only}
- Zandier LM, Jias LM, Leon‐Knapp I, Wilson DO. Quality and cost implications of a new Nutrition Support Service (NSS) on parenteral nutrition (TPN) in a community teaching hospital. Journal of Parenteral and Enteral Nutrition 1998;22(1):S19. [Google Scholar]
Zavertailo 2010 {published data only}
- Zavertailo LL, Semen'kova GV, Leiderman IN. Effect of an original enteral feeding protocol on clinical outcome indicators in patients with acute cerebral damage of vascular and traumatic genesis. Anesteziologiia i Reanimatologiia 2010;4:35‐8. [PubMed] [Google Scholar]
Zelic 2013 {published data only}
- Zelic M, Stimac D, Mendrila D, Tokmadzic VS, Fisic E, Uravic M, et al. Preoperative oral feeding reduces stress response after laparoscopic cholecystectomy. Hepato‐Gastroenterology 2013;60(127):1602‐6. [PubMed] [Google Scholar]
Zhang 1996 {published data only}
- Zhang ZT, Wang Y, Xu YD, Li JS. The application of parenteral nutrition in portal vein in patients after operation on abdomen. Parenteral and Enteral Nutrition 1996;3(2):114. [Google Scholar]
Zhang 2000a {published data only}
- Zhang JJ, Xuan HF, Gu SJ. Clinical evaluation of rationality of nutrition support in the cases of serious cerebral injuries. Chinese Journal of Clinical Nutrition 2000;8(1):14‐7. [Google Scholar]
Zhang 2000b {published data only}
- Zhang SG, Yu ZH, Ran CL. Nutritional support in critically ill patients of surgery. Chinese Journal of Clinical Nutrition 2000;8(1):58‐9. [Google Scholar]
Zhang 2004 {published data only}
- Zhang JJ, Dong WF, Gu SJ, Zhang J, Xuan HF, Xie RL. Clinical study on the early nutrition support in postoperative patients with critical hypertensive intracerebral hemorrhage. Chinese Critical Care Medicine 2004;16(9):552‐5. [PubMed] [Google Scholar]
Zhang 2006 {published data only}
- Zhang YY, Qin DY, Ni XY. Clinical effect of enteral nutrient solution in improving chronic obstructive pulmonary disease patients under mechanical ventilation. Chinese Journal of Clinical Nutrition 2006;14(1):33‐6. [Google Scholar]
Zhang 2011 {published data only}
- Zhang YS, Shu XL, Zhong JX, Sheng Y, Meng BL. Total parenteral nutrition combined with enteral nutrition in treatment of severe acute pancreatitis. Academic Journal of Second Military Medical University 2011;32(7):737‐40. [Google Scholar]
Zhao 1995 {published data only}
- Zhao HC, Zhang R. The observation and analysis for nutritional support prolonging survival in patients with middle and advanced non‐small‐cell lung cancer. Parenteral and Enteral Nutrition 1995;2(1):39‐40. [Google Scholar]
Zhao 2012 {published data only}
- Zhao XL, Xue GJ, Liu YL, Wan MH, Chen GY, Tang WF. Influence of early refeeding on triglyceride in patients with mild acute pancreatitis. Journal of Pure and Applied Microbiology 2012;6(2):633‐7. [Google Scholar]
Zhao 2015 {published data only}
- Zhao HY, Zhao HY, Wang Y, Jing H, Ding Q, Xue J. Randomized clinical trial of arginine‐supplemented enteral nutrition versus standard enteral nutrition in patients undergoing gastric cancer surgery. Journal of Cancer Research and Clinical Oncology 2015;141(3):573. [DOI] [PubMed] [Google Scholar]
Zhen 2002 {published data only}
- Zhen JS, Xu JF, Guo YJ. Clinical study of early enteral feeding in severe head injury. Journal of Traumatic Surgery 2002;4(1):24‐5. [Google Scholar]
Zheng 2006 {published data only}
- Zheng TH, Wang SS, Chen ZL, Yang JD, Zhao HF, Cheng L. The effect of early enteral nutrition support on immunological function in patients with acute stroke. Chinese Journal of Cerebrovascular Diseases 2006;3(8):356‐60. [Google Scholar]
Zhong 2006b {published data only}
- Zhong HJ, Ying JE, Ma SL. Effect of Supportan on nutritional status and immune function of late‐staged gastric cancer patients undergoing chemotherapy. Chinese Journal of Gastrointestinal Surgery 2006;9(5):405‐8. [PubMed] [Google Scholar]
Zhou 2006 {published data only}
- Zhou T, Wu XT, Zhou YJ, Huang X, Fan W, Li YC. Early removing gastrointestinal decompression and early oral feeding improve patients' rehabilitation after colorectostomy. World Journal of Gastroenterology 2006;12(15):2459‐63. [DOI] [PMC free article] [PubMed] [Google Scholar]
Zhu 2002b {published data only}
- Zhu MW, Wei JM, Zhao X, Cao JF, Tang DN, Chen Y, et al. The clinical study on the internal nutrition improving the nutritional metabolism and intestinal mucosa barrier of aged post‐traumatic patients. Chinese Journal of Geriatrics 2002;21(1):34‐6. [Google Scholar]
Zhuang 1997 {published data only}
- Zhuang YY, Wang YW, Zhao T. Application of compound diet in enteral nutrition of hospitalized patients. Chinese Journal of Clinical Nutrition 1997;5(4):189‐91. [Google Scholar]
Zingirenko 2007 {published data only}
- Zingirenko VB. Nutritive support using special mixtures for enteral nutrition in the intensive therapy of patients with peritonitis. Experimental & Clinical Gastroenterology 2007;2:131‐7. [PubMed] [Google Scholar]
Zou 2014 {published data only}
- Zou J, Liu Y, Shan Y, Li D, Shuai W, Zhu Y, et al. Effect of early enteral nutrition on mechanically ventilated patients. Chinese Journal of Clinical Nutrition 2014;22(1):34‐7. [Google Scholar]
Zwaluw 2014 {published data only}
- Zwaluw NL, Rest O, Tieland M, Adam JJ, Hiddink GJ, Loon LJ. The impact of protein supplementation on cognitive performance in frail elderly. European Journal of Nutrition 2014;53(3):803‐12. [DOI] [PubMed] [Google Scholar]
References to studies awaiting assessment
Anonymous 2003 {published data only}
- Anonymous. Nutrition. Complementary therapies in Ontario. Treatment Update 2003;15:4‐5. [PubMed] [Google Scholar]
Cao 1995 {published data only}
- Cao W, Lin Y, Yin H. [Use of parenteral nutritional support in patients with gastric cancer: the relationship of protein turn over, immunocompetence and tumor cell kinetics]. Zhonghua Wai Ke Za Zhi 1995;33(5):265‐8. [PubMed] [Google Scholar]
Cardona 1986 {published data only}
- Cardona D, Del MV, Salvador R. Early postoperative total parenteral nutrition in gastric cancer: a cost‐effectiveness study. Journal of Clinical Nutrition & Gastroenterology 1986;1:267‐70. [Google Scholar]
Chai 1998 {published data only}
- Chai DL, Chen XL, Hu TJ, Chao F, Zhu LP. [Effect of enteral nutrition treatment on coma patients]. Chinese Journal of Enteral and Parenteral Nutrition 1998;6:162‐6. [Google Scholar]
Dai 1993 {published data only}
- Dai FS, Liu Y, Zhou HT, Yi PT. [The effect of nitrogen sparing infusion treatment on the protein metabolism of post‐operation patients with common gastroenteric diseases]. Chinese Journal of Enteral and Parenteral Nutrition 1993;1:8‐10. [Google Scholar]
Driver 1994 {published data only}
- Driver L. Evaluation of supplemental nutrition in elderly orthopaedic patients [PhD thesis]. Guildford, Surrey (UK): University of Surrey, 1994. [Google Scholar]
Eckart 1992 {published data only}
- Eckart T, Suchner U, Senftleben U, Murr R, Enzenbach R, Peter K. Influence of post‐operative enteral and parenteral nutrition on gastrointestinal function. Anaesthesist 1992;41:S131. [DOI] [PubMed] [Google Scholar]
Guo 1998 {published data only}
- Guo SH, Zhang HQ, Zhou QJ, Shu F, Chai DL. [Application of homogenate diets in patients with severe burns]. Chinese Journal of Enteral and Parenteral Nutrition 1998;6:127‐31. [Google Scholar]
Hu 1996 {published data only}
- Hu W, Xiao YH, Ma CL. [Clinical observation of enteral nutrition in treatment of unconscious patients]. Chinese Journal of Enteral and Parenteral Nutrition 1996;4:174‐8. [Google Scholar]
Huang 1990 {published data only}
- Huang SL, Lee ST. [Nutritional care of severe acute head injury patients: formulas for early enteral alimentation]. Journal of the Formosan Medical Association 1990;89:498‐503. [PubMed] [Google Scholar]
Huo 1998 {published data only}
- Huo QQ, Shan LCh, Wang Ch L, Zhang XH, Sun LY. [Advantages and disadvantages of preoperative nutritional support in patients with large bowel carcinoma]. Chinese Journal of Enteral and Parenteral Nutrition 1998;6:117‐20. [Google Scholar]
Jin 2000 {published data only}
- Jin Y. Effects of early enteral hyper nutrition therapy on IL 2 system of postoperative patients with late colon cancer. Tumor 2000;20(6):443‐44. [Google Scholar]
Kolacinski 1993 {published data only}
- Kolacinski Z. Early parenteral nutrition in patients unconscious because of acute drug poisoning. JPEN. Journal of Parenteral and Enteral Nutrition 1993;17:25‐9. [DOI] [PubMed] [Google Scholar]
Li 1993 {published data only}
- Li Zd, Wang B, Zhou LM, Yang G. [An experimental study on clinical effect of total parenteral nutrition on the concentration of IgG. IgA and IgM]. Chinese Journal of Enteral and Parenteral Nutrition 1993;1:20‐3. [Google Scholar]
Li 2013 {published data only}
- Li CZ, Li QS, Li X, Yan JH, Wang RL, Jiang RX. Enhanced nutritional therapy may promote wound healing after endoscopic therapy in patients with liver cirrhosis and esophageal varices. Chung Hua Kan Tsang Ping Tsa Chih 2013;21(10):739‐42. [DOI] [PubMed] [Google Scholar]
Liu 1989 {published data only}
- Liu FK. [Effect of hypocaloric nutritional support on protein metabolism in patients with gastric cancer after radical gastrectomy]. Chinese Journal of Surgery 1989;27:409‐12, 445. [PubMed] [Google Scholar]
Liu 1996 {published data only}
- Liu JC, Lin HW, Li M, Zhang XH. [Clinical research on the effect of early stage enteral nutrition in gastrointestinal function of the extensive burned patients]. Chinese Journal of Enteral and Parenteral Nutrition 1996;4:15‐7. [Google Scholar]
Liu 1996a {published data only}
- Liu JC, Qi SZ, Gu TM, Lin HW. [Enteral nutrition of burn patients during early period]. Chinese Journal of Enteral and Parenteral Nutrition 1996;4:182‐4. [Google Scholar]
Lu 1997 {published data only}
- Lu Q, Wang JP. [Effect of postoperative total parenteral nutrition on immunocompetence in patients with advanced gastric cancer]. Chinese Journal of Enteral and Parenteral Nutrition 1997;5:116‐21. [Google Scholar]
Lv 1995 {published data only}
- Lv GZ, Yu JJ. [Clinical application of early gastrointestinal tract feeding after extensive burn]. Chinese Journal of Clinical Nutrition 1995;13:83‐5. [Google Scholar]
Mori 1992 {published data only}
- Mori S, Shineha R, Abo S, Koie H, Saito K, Tsukamoto C, et al. Multicenter clinical trial of GE‐1, 2 and 3 (glucose and electrolyte solutions for TPN) in comparison with hicaliq‐NC solutions ‐ Phase III study (2). Japanese Journal of Clinical Pharmacology and Therapeutics 1992;20:171‐89. [Google Scholar]
Rovera 1989 {published data only}
- Rovera L, Rolle G, Alliaudi C, Aloi MR, Buffa G, Cocimano V, et al. Usefullness of preoperative nutritional support in patients with bladder cancer. Rivista Italiana di Nutrizione Parenterale ed Enterale 1989;7:79‐85. [Google Scholar]
Serrou 1982a {published data only}
- Serrou B, Cupissol D, Plagne R, Boutin P, Chollet P, Carcassonne Y, et al. Follow‐up of a randomized trial for oat cell carcinoma evaluating the efficacy of peripheral intravenous nutrition (PIVN) as adjunct treatment. Recent Results in Cancer Research 1982;80:246‐53. [DOI] [PubMed] [Google Scholar]
Volkert 1996 {published data only}
- Volkert D, Hübsch S, Oster P, Schlierf G. Nutritional support and functional status in undernourished geriatric patients during hospitalization and 6‐month follow‐up. Aging (Milano) 1996;8:386‐95. [DOI] [PubMed] [Google Scholar]
Wenzel 1968 {published data only}
- Wenzel M. Parenteral nutrition and acid‐base balance. Zeitschrift fur Praktische Anasthesie und Wiederbelebung 1968;3:398‐403. [Google Scholar]
Wu 1995 {published data only}
- Wu CW, Meng HC, Mok KT, Kung SP, Lin SH, Liu WY, et al. Effect of total parenteral nutrition on the postoperative outcome in aged patients with gastric cancer. Digestive Surgery 1995;12:164‐70. [Google Scholar]
Wu 1996a {published data only}
- Wu GH, Jin DY, Wu ZH, Huang DX, Wu ZG. [A study on the effect and safety of early enteral nutrition after gastrointestinal operation]. Chinese Journal of Enteral and Parenteral Nutrition 1996;4:123‐7. [Google Scholar]
Xue 1996 {published data only}
- Xue ZX, Bian WL. Clinical experiences in nutrition support in extensive burned patients. Chinese Journal of Enteral and Parenteral Nutrition 1996;4:29‐31. [Google Scholar]
Yoichi 1996 {published data only}
- Yoichi S. Clinical evaluation of the hyperalimentation preparations GA‐1080(L) and GA‐1080(H): a multicenter randomized comparative trial with commercially available preparations. Japanese Journal of Clinical and Experimental Medicine 1996;73:731‐50. [Google Scholar]
Yu 1995 {published data only}
- Yu JG, Chen RH, Xu JY. [Application of venous nutrition in the treatment of acute necrotic pancreatitis]. Chinese Journal of Enteral and Parenteral Nutrition 1995;3:13‐4. [Google Scholar]
Yu 1996 {published data only}
- Yu QX, Liu JC, Gu TM, Zhang XH. [Evaluation on the tolerance of tube feeding in patients with severe burn]. Chinese Journal of Enteral and Parenteral Nutrition 1996;4:132‐3. [Google Scholar]
Zeng 1997 {published data only}
- Zeng SW, Yiao JL. [Application of two way nutrition support in acute necrotic pancreatitis]. Chinese Journal of Enteral and Parenteral Nutrition 1997;5:121‐3. [Google Scholar]
Zhen 1997 {published data only}
- Zhen F. [Preoperative nutritional support of patients with hepatic decompensation in the cirrhotic stage]. Chinese Journal of Enteral and Parenteral Nutrition 1997;5:50‐4. [Google Scholar]
References to ongoing studies
Alim‐K {published data only}
- Pazart L, Cretin E, Grodard G, Cornet C, Mathieu‐Nicot F, Bonnetain F, et al. Parenteral nutrition at the palliative phase of advanced cancer: the ALIM‐K study protocol for a randomized controlled trial. Trials 2014;15:370. [PUBMED: 25248371] [DOI] [PMC free article] [PubMed] [Google Scholar]
Games‐Lopez 2014 {published data only}
- Gamez‐Lopez AL, Bonilla‐Palomas JL, Anguita‐Sanchez M, Morendo‐Conde M, Lopez‐Ibanez C, Alhambra‐Exposito R. Rationale and design of PICNIC study: nutritional intervention program in hospitalized patients with heart failure who are malnourished. Revista Española de Cardiología 2014;67(4):277‐82. [DOI] [PubMed] [Google Scholar]
NCT02517476 {published data only}
- NCT02517476. Effect of early nutritional therapy on frailty, functional outcomes and recovery of undernourished medical inpatients trial (EFFORT). clinicaltrials.gov/ct2/show/NCT02517476 July 30, 2015.
NCT02624752 {published data only}
- NCT02624752. Oral nutrition supplementation in hospitalized patients (NutriSup Oral). clinicaltrials.gov/ct2/show/NCT02624752 December 4, 2015.
NCT02632630 {published data only}
- NCT02632630. Nutrition supplementation in hospitalized patients (NutriSuP). clinicaltrials.gov/ct2/show/NCT02632630 December 3, 2015.
Ridley 2015 {published data only}
- Ridley EJ, Davies AR, Parke R, Bailey M, McArthur C, Gillanders L, et al. Supplemental parenteral nutrition in critically ill patients: a study protocol for a phase ii randomised controlled trial. Trials 2015;16:1‐9. [DOI] [PMC free article] [PubMed] [Google Scholar]
Additional references
Avenell 2016
- Avenell A, Smith TO, Curtain JP, Mak JCS, Myint PK. Nutritional supplementation for hip fracture aftercare in older people. Cochrane Database of Systematic Reviews 2016, Issue 11. [DOI: 10.1002/14651858.CD001880.pub6] [DOI] [PMC free article] [PubMed] [Google Scholar]
Bally 2016
- Bally MR, Blaser Yildirim PZ, Bounoure L, Gloy VL, Mueller B, Briel M, et al. Nutritional support and outcomes in malnourished medical inpatients: a systematic review and meta‐analysis. JAMA Internal Medicine 2016;176(1):43‐53. [DOI] [PubMed] [Google Scholar]
Barker 2011
- Barker LA, Gout BS, Crowe TC. Hospital malnutrition: prevalence, identification and impact on patients and the healthcare system. International Journal of Environmental Research and Public Health 2011;8(2):514‐27. [PUBMED: 21556200] [DOI] [PMC free article] [PubMed] [Google Scholar]
Begg 1994
- Begg CB, Mazumdar M. Operating characteristics of a rank correlation test for publication bias. Biometrics 1994;50(4):1088‐101. [PUBMED: 7786990] [PubMed] [Google Scholar]
Bistrian 2011
- Bistrian BR. Early or late parenteral nutrition in critically ill adults. New England Journal of Medicine 2011;365(19):1840; author reply 1‐2. [DOI] [PubMed] [Google Scholar]
Borenstein 2009
- Borenstein M, Hedges LV, Higgins JPT, Rothstein HR. Introduction to Meta‐Analysis. John Wiley & Sons, Ltd, Chichester, UK, 2009. [Google Scholar]
Brok 2008
- Brok J, Thorlund K, Gluud C, Wetterslev J. Trial sequential analysis reveals insufficient information size and potentially false positive results in many meta‐analyses. Journal of Clinical Epidemiology 2008;61(8):763‐9. [PUBMED: 18411040] [DOI] [PubMed] [Google Scholar]
Brok 2009
- Brok J, Thorlund K, Wetterslev J, Gluud C. Apparently conclusive meta‐analyses may be inconclusive. Trial Sequential Analysis adjustment of random error risk due to repetitive testing of accumulating data in apparently conclusive neonatal meta‐analyses. International Journal of Epidemiology 2009;38(1):287‐98. [PUBMED: 18824466] [DOI] [PubMed] [Google Scholar]
Burden 2012
- Burden S, Todd C, Hill J, Lal S. Pre‐operative nutrition support in patients undergoing gastrointestinal surgery. Cochrane Database of Systematic Reviews 2012, Issue 11. [DOI: 10.1002/14651858.CD008879.pub2] [DOI] [PubMed] [Google Scholar]
Calder 2003
- Calder PC. Immunonutrition: may have beneficial effects in surgical patients. BMJ (Clinical Research Ed.) 2003;327(7407):117‐8. [DOI] [PMC free article] [PubMed] [Google Scholar]
Chalela 2004
- Chalela JA, Haymore J, Schellinger PD, Kang DW, Warach S. Acute stroke patients are being underfed: a nitrogen balance study. Neurocritical Care 2004;1(3):331‐4. [PUBMED: 16174930] [DOI] [PubMed] [Google Scholar]
Chan 2004
- Chan AW, Hrobjartsson A, Haahr MT, Gotzsche PC, Altman DG. Empirical evidence for selective reporting of outcomes in randomized trials: comparison of protocols to published articles. JAMA 2004;291(20):2457‐65. [DOI] [PubMed] [Google Scholar]
Cipriani 2013
- Cipriani A, Higgins JP, Geddes JR, Salanti G. Conceptual and technical challenges in network meta‐analysis. Annals of Internal Medicine 2013;159(2):130‐7. [DOI] [PubMed] [Google Scholar]
DeMets 1987
- DeMets DL. Methods of combining randomized trials: strength and limitations. Statistics in Medicine 1987;6(3):341‐50. [DOI] [PubMed] [Google Scholar]
DerSimonian 1986
- DerSimonian R, Laird N. Meta‐analysis in clinical trials. Controlled Clinical Trials 1986;7(3):177‐88. [DOI] [PubMed] [Google Scholar]
Detsky 1987
- Detsky AS, McLaughlin JR, Baker JP, Johnston N, Whittaker S, Mendelson RA, et al. What is subjective global assessment of nutritional status?. Journal of Parenteral and Enteral Nutrition 1987;11(1):8‐13. [PUBMED: 3820522] [DOI] [PubMed] [Google Scholar]
Egger 1997
- Egger M, Davey Smith G, Schneider M, Minder C. Bias in meta‐analysis detected by a simple, graphical test. BMJ (Clinical Research Ed.) 1997;315(7109):629‐34. [PUBMED: 9310563] [DOI] [PMC free article] [PubMed] [Google Scholar]
Elia 2003
- Elia M (editor). Screening for malnutrition: a multidisciplinary responsibility. Development and use of the Malnutrition Universal Screening Tool ('MUST') for adults. Malnutrition Advisory Group (MAG), a Standing Committee of BAPEN. Redditch: Bapen, 2003.
Felbinger 2011
- Felbinger TW, Weigand MA, Mayer K. Early or late parenteral nutrition in critically ill adults. New England Journal of Medicine 2011;365(19):1839; author reply 41‐2. [DOI] [PubMed] [Google Scholar]
Fisher 1922
- Fisher RA. On the interpretation of X^2 from contingency tables, and the calculation of P. Journal of the Royal Statistical Society 1922;85(1):87‐94. [Google Scholar]
Garattini 2016
- Garattini S, Jakobsen JC, Wetterslev J, Bertelé V, Banzi R, Rath A, et al. Evidence‐based clinical practice: Overview of threats to the validity of evidence and how to minimise them. European Journal of Internal Medicine 2016;32:13‐21. [DOI] [PubMed] [Google Scholar]
Gluud 2006
- Gluud LL. Bias in clinical intervention research. American Journal of Epidemiology 2006;163(6):493‐501. [PUBMED: 16443796] [DOI] [PubMed] [Google Scholar]
Gluud 2016
- Gluud C, Nikolova D, Klingenberg SL. Cochrane Hepato‐Biliary Group. About Cochrane (Cochrane Review Groups (CRGs)) 2016, Issue 8. Art. No.: LIVER.
Guyatt 2008
- Guyatt GH, Oxman AD, Vist GE, Kunz R, Falck‐Ytter Y, Alonso‐Coello P, et al. GRADE: an emerging consensus on rating quality of evidence and strength of recommendations. BMJ (Clinical Research Ed.) 2008;336:924‐6. [DOI] [PMC free article] [PubMed] [Google Scholar]
Harbord 2006
- Harbord RM, Egger M, Sterne JAC. A modified test for small‐study effects in meta‐analyses of controlled trials with binary endpoints. Statistics in Medicine 2006;25(20):3443‐57. [DOI] [PubMed] [Google Scholar]
Harris 1918
- Harris JA, Benedict FG. A biometric study of human basal metabolism. Proceedings of the National Academy of Sciences of the United States of America 1918;4(12):370‐3. [PUBMED: 16576330] [DOI] [PMC free article] [PubMed] [Google Scholar]
Hickson 2006
- Hickson M. Malnutrition and ageing. Postgraduate Medical Journal 2006;82(963):2‐8. [PUBMED: 16397072] [DOI] [PMC free article] [PubMed] [Google Scholar]
Higgins 2002
- Higgins JP, Thompson SG. Quantifying heterogeneity in a meta‐analysis. Statistics in Medicine 2002;21(11):1539‐58. [DOI] [PubMed] [Google Scholar]
Higgins 2003
- Higgins JP, Thompson SG, Deeks JJ, Altman DG. Measuring inconsistency in meta‐analyses. BMJ (Clinical Research Ed.) 2003;327(7414):557‐60. [PUBMED: 12958120] [DOI] [PMC free article] [PubMed] [Google Scholar]
Higgins 2011
- Higgins JP, Green S, editor(s). Cochrane Handbook for Systematic Reviews of Interventions Version 5.1.0 (updated March 2011). The Cochrane Collaboration, 2011. Available from handbook.cochrane.org.
Hrobjartsson 2012
- Hrobjartsson A, Thomsen AS, Emanuelsson F, Tendal B, Hilden J, Boutron I, et al. Observer bias in randomised clinical trials with binary outcomes: systematic review of trials with both blinded and non‐blinded outcome assessors. BMJ (Clinical Research Ed.) 2012;344:e1119. [DOI] [PubMed] [Google Scholar]
Hrobjartsson 2013
- Hrobjartsson A, Thomsen ASS, Emanuelsson F, Tendal B, Hilden J, Boutron I, et al. Observer bias in randomized clinical trials with measurement scale outcomes: a systematic review of trials with both blinded and nonblinded assessors. CMAJ : Canadian Medical Association Journal 2013;185(4):E201‐11. [DOI] [PMC free article] [PubMed] [Google Scholar]
Hrobjartsson 2014a
- Hrobjartsson A, Emanuelsson F, Skou Thomsen AS, Hilden J, Brorson S. Bias due to lack of patient blinding in clinical trials. A systematic review of trials randomizing patients to blind and nonblind sub‐studies. International Journal of Epidemiology 2014;43(4):1272‐83. [DOI] [PMC free article] [PubMed] [Google Scholar]
Hrobjartsson 2014b
- Hrobjartsson A, Thomsen AS, Emanuelsson F, Tendal B, Rasmussen JV, Hilden J, et al. Observer bias in randomized clinical trials with time‐to‐event outcomes: systematic review of trials with both blinded and non‐blinded outcome assessors. International Journal of Epidemiology 2014;43(3):937‐48. [DOI] [PubMed] [Google Scholar]
ICH‐GCP 1997
- International Conference on Harmonisation Expert Working Group. International Conference on Harmonisation of technical requirements for registration of pharmaceuticals for human use. ICH harmonised tripartite guideline. Guideline for good clinical practice CFR & ICH Guidelines. www.ich.org/fileadmin/Public_Web_Site/ICH_Products/Guidelines/Efficacy/E6/E6_R1_Guideline.pdf. Pennsylvania: Barnett International/PAREXEL, 1997; Vol. 1. [PUBMED: 11656783] 11656783
Jakobsen 2011
- Jakobsen JC, Lindschou Hansen J, Storebo OJ, Simonsen E, Gluud C. The effects of cognitive therapy versus 'treatment as usual' in patients with major depressive disorder. PLoS ONE 2011;6(8):e22890. [PUBMED: 21829664] [DOI] [PMC free article] [PubMed] [Google Scholar]
Jakobsen 2013
- Jakobsen JC, Gluud C. The necessity of randomized clinical trials. British Journal of Medicine & Medical Research 2013;3(4):1453‐68. [Google Scholar]
Jakobsen 2014
- Jakobsen J, Wetterslev J, Winkel P, Lange T, Gluud C. Thresholds for statistical and clinical significance in systematic reviews with meta‐analytic methods. BMC Medical Research Methodology 2014;14:120. [DOI] [PMC free article] [PubMed] [Google Scholar]
Jakobsen 2016
- Jakobsen JC, Wetterslev J, Lange T, Gluud C. Viewpoint: taking into account risks of random errors when analysing multiple outcomes in systematic reviews[editorial]. Cochrane Database of Systematic Reviews 2016, issue 3. [DOI: 10.1002/14651858.ED000111] [DOI] [PMC free article] [PubMed]
Jensen 2010
- Jensen GL, Mirtallo J, Compher C, Dhaliwal R, Forbes A, Grijalba RF, et al. Adult starvation and disease‐related malnutrition: a proposal for etiology‐based diagnosis in the clinical practice setting from the International Consensus Guideline Committee. JPEN. Journal of Parenteral and Enteral Nutrition 2010;34(2):156‐9. [DOI] [PubMed] [Google Scholar]
Keus 2010
- Keus F, Wetterslev J, Gluud C, Laarhoven CJ. Evidence at a glance: error matrix approach for overviewing available evidence. BMC Medical Research Methodology 2010;10:90. [PUBMED: 20920306] [DOI] [PMC free article] [PubMed] [Google Scholar]
Kjaergard 2001
- Kjaergard LL, Villumsen J, Gluud C. Reported methodologic quality and discrepancies between large and small randomized trials in meta‐analyses. Annals of Internal Medicine 2001;135(11):982‐9. [PUBMED: 11730399] [DOI] [PubMed] [Google Scholar]
Kondrup 2003
- Kondrup J, Rasmussen HH, Hamberg O, Stanga Z. Nutritional risk screening (NRS 2002): a new method based on an analysis of controlled clinical trials. Clinical Nutrition 2003;22(3):321‐36. [PUBMED: 12765673] [DOI] [PubMed] [Google Scholar]
Koretz 2001
- Koretz RL, Lipman TO, Klein S. AGA technical review on parenteral nutrition. Gastroenterology 2001;121(4):970‐1001. [PUBMED: 11606512] [DOI] [PubMed] [Google Scholar]
Koretz 2007
- Koretz RL, Avenell A, Lipman TO, Braunschweig CL, Milne AC. Does enteral nutrition affect clinical outcome? A systematic review of the randomized trials. American Journal of Gastroenterology 2007;102(2):412‐29; quiz 468. [PUBMED: 17311654] [DOI] [PubMed] [Google Scholar]
Koretz 2012
- Koretz RL, Avenell A, Lipman TO. Nutritional support for liver disease. Cochrane Database of Systematic Reviews 2012, Issue 5. [DOI: 10.1002/14651858.CD008344.pub2] [DOI] [PMC free article] [PubMed] [Google Scholar]
Koretz 2014
- Koretz RL, Lipman TO. The presence and effect of bias in trials of early enteral nutrition in critical care. Clinical Nutrition 2014;33(2):240‐5. [PUBMED: 23845382] [DOI] [PubMed] [Google Scholar]
Larsson 1990b
- Larsson J, Lennmarken C, Martensson J, Sandstedt S, Vinnars E. Nitrogen requirements in severely injured patients. British Journal of Surgery 1990;77(4):413‐6. [PUBMED: 2111195] [DOI] [PubMed] [Google Scholar]
Lochs 2006
- Lochs H, Allison SP, Meier R, Pirlich M, Kondrup J, Schneider S, et al. Introductory to the ESPEN guidelines on enteral nutrition: terminology, definitions and general topics. Clinical Nutrition 2006;25(2):180‐6. [PUBMED: 16697086] [DOI] [PubMed] [Google Scholar]
Lundh 2017
- Lundh A, Lexchin J, Mintzes B, Schroll JB, Bero L. Industry sponsorship and research outcome. Cochrane Database of Systematic Reviews 2017, issue 2. [DOI: 10.1002/14651858.MR000033.pub2; PUBMED: 23235689] [DOI] [PMC free article] [PubMed]
Marik 2011
- Marik PE. Early or late parenteral nutrition in critically ill adults. New England Journal of Medicine 2011;365(19):1840‐1; author reply 1‐2. [DOI] [PubMed] [Google Scholar]
Milne 2009
- Milne AC, Potter J, Vivanti A, Avenell A. Protein and energy supplementation in elderly people at risk from malnutrition. Cochrane Database of Systematic Reviews 2009, Issue 2. [DOI: 10.1002/14651858.CD003288.pub3] [DOI] [PMC free article] [PubMed] [Google Scholar]
Moher 1998
- Moher D, Pham B, Jones A, Cook DJ, Jadad AR, Moher M, et al. Does quality of reports of randomised trials affect estimates of intervention efficacy reported in meta‐analyses?. Lancet 1998;352(9128):609‐13. [DOI] [PubMed] [Google Scholar]
Morlion 1998
- Morlion BJ, Stehle P, Wachtler P, Siedhoff HP, Koller M, Konig W, et al. Total parenteral nutrition with glutamine dipeptide after major abdominal surgery: a randomized, double‐blind, controlled study. Annals of Surgery 1998;227(2):302‐8. [PUBMED: 9488531] [DOI] [PMC free article] [PubMed] [Google Scholar]
Murray 2017
- Murray SM, Pindoria S. Nutrition support for bone marrow transplant patients. Cochrane Database of Systematic Reviews 2017, Issue 3. [DOI: 10.1002/14651858.CD002920.pub3] [DOI] [PMC free article] [PubMed] [Google Scholar]
Norman 2008a
- Norman K, Pichard C, Lochs H, Pirlich M. Prognostic impact of disease‐related malnutrition. Clinical Nutrition 2008;27(1):5‐15. [PUBMED: 18061312] [DOI] [PubMed] [Google Scholar]
O'Leary 2011
- O'Leary MJ, Ferrie S. Early or late parenteral nutrition in critically ill adults. New England Journal of Medicine 2011;365(19):1839‐40; author reply 41‐2. [DOI] [PubMed] [Google Scholar]
Perel 2006
- Perel P, Yanagawa T, Bunn F, Roberts I, Wentz R, Pierro A. Nutritional support for head‐injured patients. Cochrane Database of Systematic Reviews 2006, Issue 4. [DOI: 10.1002/14651858.CD001530.pub2] [DOI] [PMC free article] [PubMed] [Google Scholar]
RevMan 2014 [Computer program]
- The Nordic Cochrane Centre, The Cochrane Collaboration. Review Manager (RevMan). Version 5.3. Copenhagen: The Nordic Cochrane Centre, The Cochrane Collaboration, 2014.
Royle 2003
- Royle P, Milne R. Literature searching for randomized controlled trials used in Cochrane reviews: rapid versus exhaustive searches. International Journal of Technology Assessment in Health Care 2003;19(4):591‐603. [DOI] [PubMed] [Google Scholar]
Savović 2012a
- Savović J, Jones HE, Altman DG, Harris RJ, Juni P, Pildal J, et al. Influence of reported study design characteristics on intervention effect estimates from randomized, controlled trials. Annals of Internal Medicine 2012;157(6):429‐38. [PUBMED: 22945832] [DOI] [PubMed] [Google Scholar]
Savović 2012b
- Savović J, Jones H, Altman D, Harris R, Juni P, Pildal J, et al. Influence of reported study design characteristics on intervention effect estimates from randomised controlled trials: combined analysis of meta‐epidemiological studies. Health Technology Assessment 2012;16(35):1‐82. [PUBMED: 22989478] [DOI] [PubMed] [Google Scholar]
Schulz 1995
- Schulz KF, Chalmers I, Hayes RJ, Altman DG. Empirical evidence of bias. Dimensions of methodological quality associated with estimates of treatment effects in controlled trials. JAMA 1995;273(5):408‐12. [DOI] [PubMed] [Google Scholar]
Shaw 1987
- Shaw JH, Wildbore M, Wolfe RR. Whole body protein kinetics in severely septic patients. The response to glucose infusion and total parenteral nutrition. Annals of Surgery 1987;205(3):288‐94. [PUBMED: 3103555] [DOI] [PMC free article] [PubMed] [Google Scholar]
Stata 2013 [Computer program]
- StataCorp. 2013. Stata statistical software. Version 13. College Station, TX: StataCorp LP, 2013.
Sterne 2009
- Sterne JA, White IR, Carlin JB, Spratt M, Royston P, Kenward MG, et al. Multiple imputation for missing data in epidemiological and clinical research: potential and pitfalls. BMJ (Clinical Research Ed.) 2009;338:b2393. [PUBMED: 19564179] [DOI] [PMC free article] [PubMed] [Google Scholar]
Stratton 2003
- Stratton RJ, Green CJ, Elia M (editors). Disease‐Related Malnutrition: an Evidence‐Based Approach to Treatment. Wallingford, UK: CABI Publishing, 2003. [Google Scholar]
Stratton 2007
- Stratton RJ, Elia M. Who benefits from nutritional support: what is the evidence?. European Journal of Gastroenterology & Hepatology 2007;19(5):353‐8. [PUBMED: 17413283] [DOI] [PubMed] [Google Scholar]
Student 1908
- Student. The probable error of a mean. Biometrika 1908;6(1):1‐25. [Google Scholar]
Sutton 2000
- Sutton AJ, Duval SJ, Tweedie RL, Abrams KR, Jones DR. Empirical assessment of effect of publication bias on meta‐analyses. BMJ (Clinical research ed) 2000;320(7249):1574‐7. [DOI] [PMC free article] [PubMed] [Google Scholar]
Tan 2014
- Tan HB, Danilla S, Murray A, Serra R, Dib R, Henderson TOW, et al. Immunonutrition as an adjuvant therapy for burns. Cochrane Database of Systematic Reviews 2014, Issue 12. [DOI: 10.1002/14651858.CD007174.pub2] [DOI] [PMC free article] [PubMed] [Google Scholar]
Thorlund 2009
- Thorlund K, Devereaux PJ, Wetterslev J, Guyatt G, Ioannidis JP, Thabane L, et al. Can trial sequential monitoring boundaries reduce spurious inferences from meta‐analyses?. International Journal of Epidemiology 2009;38(1):276‐86. [PUBMED: 18824467] [DOI] [PubMed] [Google Scholar]
Thorlund 2010
- Thorlund K, Anema A, Mills E. Interpreting meta‐analysis according to the adequacy of sample size. An example using isoniazid chemoprophylaxis for tuberculosis in purified protein derivative negative HIV‐infected individuals. Clinical Epidemiology 2010;2:57‐66. [PUBMED: 20865104] [DOI] [PMC free article] [PubMed] [Google Scholar]
Thorlund 2011
- Thorlund K, Engstrøm J, Wetterslev J, Brok J, Imberger G, Gluud C. User manual for Trial Sequential Analysis (TSA), 2011. ctu.dk/tsa/files/tsa_manual.pdf (accessed 7 January 2015).
TSA 2011 [Computer program]
- Copenhagen Trial Unit. TSA ‐ Trial Sequential Analysis. Version 0.9 Beta. Copenhagen: Copenhagen Trial Unit, 2011.
Tudur Smith 2016
- Tudur Smith C, Marcucci M, Nolan SJ, Iorio A, Sudell M, Riley R, et al. Individual participant data meta‐analyses compared with meta‐analyses based on aggregate data. Cochrane Database of Systematic Reviews 2016, Issue 9. [DOI: 10.1002/14651858.MR000007.pub3] [DOI] [PMC free article] [PubMed] [Google Scholar]
Van Bokhorst 2014
- Bokhorst‐de van der Schueren MA, Guaitoli PR, Jansma EP, Vet HC. Nutrition screening tools: does one size fit all? A systematic review of screening tools for the hospital setting. Clinical Nutrition 2014;33(1):39‐58. [PUBMED: 23688831] [DOI] [PubMed] [Google Scholar]
Vellas 1999
- Vellas B, Guigoz Y, Garry PJ, Nourhashemi F, Bennahum D, Lauque S, et al. The Mini Nutritional Assessment (MNA) and its use in grading the nutritional state of elderly patients. Nutrition (Burbank, Los Angeles County, Calif.) 1999;15(2):116‐22. [PUBMED: 9990575] [DOI] [PubMed] [Google Scholar]
Ware 1992
- Ware JE Jr, Sherbourne CD. The MOS 36‐item short‐form health survey (SF‐36). I. Conceptual framework and item selection. Medical Care 1992;30(6):473‐83. [PUBMED: 1593914] [PubMed] [Google Scholar]
Wasiak 2006
- Wasiak J, Cleland H, Jeffery R. Early versus delayed enteral nutrition support for burn injuries. Cochrane Database of Systematic Reviews 2006, Issue 3. [DOI: 10.1002/14651858.CD005489.pub2] [DOI] [PubMed] [Google Scholar]
Wetterslev 2008
- Wetterslev J, Thorlund K, Brok J, Gluud C. Trial sequential analysis may establish when firm evidence is reached in cumulative meta‐analysis. Journal of Clinical Epidemiology 2008;61(1):64‐75. [PUBMED: 18083463] [DOI] [PubMed] [Google Scholar]
Wetterslev 2009
- Wetterslev J, Thorlund K, Brok J, Gluud C. Estimating required information size by quantifying diversity in random‐effects model meta‐analyses. BMC Medical Research Methodology 2009;9:86. [PUBMED: 20042080] [DOI] [PMC free article] [PubMed] [Google Scholar]
Wood 2008
- Wood L, Egger M, Gluud LL, Schulz KF, Juni P, Altman DG, et al. Empirical evidence of bias in treatment effect estimates in controlled trials with different interventions and outcomes: meta‐epidemiological study. BMJ (Clinical Research Ed.) 2008;336(7644):601‐5. [PUBMED: 18316340] [DOI] [PMC free article] [PubMed] [Google Scholar]
References to other published versions of this review
Feinberg 2015
- Feinberg J, Nielsen EE, Gluud C, Lindschou J, Kondrup J, Jakobsen Janus C. Nutrition support in hospitalised adults at nutritional risk. Cochrane Database of Systematic Reviews 2015, Issue 3. [DOI: 10.1002/14651858.CD011598; CD011598] [DOI] [PMC free article] [PubMed] [Google Scholar]