Abstract
The shear modulus and logarithmic decrement at approximately 1 c/s have been measured from −180 °C to about 150 °C for a series of samples of isotactic polypropylene prepared by various thermal treatments. The samples had varying densities (degrees of crystallinity) and morphologies as characterized by spherulite size. All of the samples exhibited the three relaxations characteristic of polypropylene. The maxima in the three measures of relaxation (logarithmic decrement, G″, and J″) occur at about −60 °C, 0–10 °C, and 50 to 100 °C for the three processes. However, the relation between crystallinity and the magnitude of the peak value of the particular measure of loss depends upon the relaxation and the function used to measure the loss. The loss is almost independent of density and morphology for all three relaxations when G″ is used to characterize the loss, whereas the loss increases monotonically as the density decreases when using J″ to characterize the loss behavior. The logarithmic decrement behaves in a more complicated manner. The implications of this behavior are discussed, and it is shown that the primary effect of changing density is to change the equilibrium modulus rather than the relaxation processes.
1. Introduction
Mechanical relaxation in amorphous and crystalline polymers has been extensively studied because of its intrinsic and practical importance and because its correct intrepretation can elucidate the nature of molecular motions in these systems. In amorphous polymers, a great deal of experimental and theoretical work has been carried out, and agreement between experiment and molecular theories of relaxation has been achieved.
In crystalline polymers, the situation is much more complex. The complicated morphological nature of these polymers has permitted only qualitative interpretation of various relaxation processes in molecular terms [1, 2].1 Indeed, most of the interpretation has been in terms of an amorphous- crystalline two-phase model of polymer morphology using the degree of crystallinity (as determined by density or some other means) as the primary parameter for comparison of different samples. The effort has gone primarily into inferring the phase in which the relaxation process occurs and the probable size and type of relaxing species. Such a model may be too restrictive for highly crystalline polymers such as linear polyethylene, where electron microscope [3] and heat of fusion [4] results indicate a very small amorphous component which can, in fact, be regarded primarily as in the crystalline phase imperfections such as chain folds [5]. Moreover, even on the basis of the two phase model, there is considerable disagreement as to the site of various relaxations in specific cases. Thus, for example, McCrum [6] deduces that the high temperature (see below) relaxation in polypropylene involves a “crystal disordering,” while Flocke [7] attributes the same relaxation to a process occurring in the amorphous regions. Other evidence [8, 9], also indicates that the degree of crystallinity is not a sensitive enough criterion for comparing samples of varying thermal treatment, and that some of the relaxation processes are related to more subtle aspects of the morphology.
In most of the work relating mechanical behavior to morphology, comparison of various samples has been made on the basis of tan δ (the ratio of the imaginary part of the complex modulus to the real part) or some related quantity such as the logarithmic decrement (which in this paper we shall denote by the symbol Δ), primarily because most of the experiments have been carried out by the methods of forced or free oscillation in which the behavior of the specimen is governed by this quantity. However, it is well known that the maximum value of tan δ against frequency (or, more commonly, temperature) is not a good measure of the strength of the relaxation 2 unless the change in G′, the real part of the complex modulus, is very small compared to the static modulus, Ge. This is not the case in most polymer systems. The correct quantity to use would be the area under the G″ peak in a G″ versus lnω plot, where ω is the frequency. This type of data is not usually available, and the area under a G″—1/T curve at constant frequency (which would be equivalent if all the relaxation times had the same temperature dependence) is often very difficult to obtain because the peaks are unresolved. In some cases G″ has been used as a measure of the relaxation strength when comparing samples of different crystallinity or morphology [10]. However, even in this case there is no a priori reason to use G″ rather than J″, the imaginary part of the complex compliance. When comparing samples in which the modulus changes, the two methods, as will be seen, may lead to quite different conclusions.
In order to clarify some of these points a study was made of mechanical relaxation in polypropylene. This is a good material for study in that it can be obtained in both atactic (i.e., noncrystallizable) and isotactic (crystallizable) forms. It is known from the work of Keith and Padden [11] that atactic polypropylene mixed with isotactic is excluded from the crystalline phase when the isotactic component crystallizes. Hence, a density defect (density lower than the crystal density) in such a mixed system may be fairly unambiguously identified with the presence of a true amorphous phase. A thorough study of mechanical relaxation in such a system has already been carried out by Flocke [7]. Our own aims were threefold. These were: (a) to compare the behavior of a quenched isotactic specimen with that of a mixed isotactic-atactic specimen of the same density; (b) to compare the behavior of a sample which had been quenched and subsequently annealed to a given density, with that of one in which the same density had been achieved by isothermal crystallization (it is well known that such treatments produce widely different morphologies); (c) to compare the various viscoelastic functions for these samples.
2. Experimental Details
2.1. Apparatus and Method
All the measurements reported here were taken using a torsion pendulum based on the design of Nielsen [12]. In this type of torsion pendulum the inertial member is supported by a fine wire of negligible elastance and is counterbalanced so that the sample is under no longitudinal stress. The inertial member was designed so that the frequency would be 1 c/s for a sample with a shear modulus of 109 N/m2 and the chosen dimensions (see below).
The primary quantities measured in such an apparatus are the period of the oscillation and the rate of decay of the vibration amplitude. In some of the experiments the amplitude decay and the frequency were measured by a galvanometer lamp and scale arrangement. In a later development a strain gage was added to the system to provide an electrical signal proportional to displacement. This signal was then recorded on a recording oscillograph. There was no discernible difference in the results obtained by the two methods.
In both methods of operation the period was determined by timing the swings, either by a stop watch in the first case, or by timing-markers on the recorder chart in the second. The logarithmic decrement, Δ, in both cases was determined by plotting the logarithm of the amplitude against the number of the swing and determining the slope of the resulting line. In practically all cases good straight lines were obtained.
The real part of the complex modulus, G′, was determined from the frequency, the known moment of inertia of the inertial member of the pendulum, and the sample dimensions (see “Sample Preparation” below). The approximate equation
where ω is the angular frequency, I the moment of inertia and k a form factor depending on sample dimensions [12], was used. The maximum error this approximation produced was about 1 percent. From G′ and Δ, G″ and J″ were calculated by the equations
| (1) |
and
| (2) |
2.2. Material and Sample Preparation
The material was an experimental sample of isotactic polypropylene kindly provided by the AviSun Corporation. This had a viscosity average molecular weight of 207,700 and contained 2.56 percent material extractable by C7 hydrocarbon fraction. It contained 0.02 percent of stabilizer.
The samples were in the form of flat strips, with nominal dimensions 10×2×0.125 cm. This rather long flat shape was chosen to permit easy quenching of the specimens. The latter were prepared in the following manner. Flat sheets about 15×15 cm and of the proper thickness were prepared by compression molding. From these a specimen about 12 cm long and 2 cm wide was cut. This was then mounted between two aluminum strips of the proper dimensions and the sandwich tightly wrapped in aluminum foil. This wrapped sandwich was then mounted between two 0.8 mm thick sheets of phosphor-bronze held together by slight spring tension. The whole assembly was heated to 200 °C for a few minutes either in a silicone oil bath or an oven, and then either quenched in dry-ice acetone or isothermally crystallized. This arrangement was chosen over a conventional mold to reduce the mass and provide fast quenching. From the resulting strip the final specimen was shaped by machining. The variation in width was negligible. The thickness was measured at several places along the sample and the results averaged. The maximum variation in thickness over the sample was about 5 percent. Since the thickness enters the form factor for calculating G′ as the cube, an average of the cube of the thickness was used.
The primary means of comparison of the state of various specimens was the degree of crystallinity, χ, as determined by density. This was determined by hydrostatic weighing and converted to crystallinity by the crystallinity-density scale of Danusso and Maraglio [13]. Because of effects such as static charge on the specimen which affected the weighing, χ has an estimated standard error of about ±1 percent.
As mentioned in the introduction, one of the aims of this work was to compare samples of the same χ, but achieved in different ways, i.e., by the quench-anneal technique and isothermal crystallization. The quench-anneal experiments were carried out on one specimen which had been quenched by the procedure outlined above. After measurement in the torsion pendulum, this specimen was annealed for a certain time, remeasured, etc. The history of this sample is reported in table 1. During the run in the torsion pendulum the specimens of course crystallized somewhat, particularly at the lower crystallinities. This limited the temperature range of the experiments for the lower crystallinity samples. Furthermore, the curves for the lower crystallinity samples are once-through curves. The change in χ during the measurements on the torsion-pendulum is also reported.
Table 1.
Thermal treatment and crystallinity of samples
| Sample No. | Treatment |
x % |
|
|---|---|---|---|
| Before run | After run | ||
| 1 | Quenched _ _ _ _ _ _ _ _ _ _ _ _ _ _ _ _ _ _ _ _ _ _ _ _ _ _ _ _ _ | 44 | 47 |
| 1A | No. 1 + 1 hr at 70 °C _ _ _ _ _ _ _ _ _ _ _ _ _ _ _ _ _ _ _ | 50.3 | 51.1 |
| 1B | No. 1A+1 hr at 90 °C _ _ _ _ _ _ _ _ _ _ _ _ _ _ _ _ _ | 55.2 | 56.2 |
| 1C | No. 1B+4 hr at 135 °C _ _ _ _ _ _ _ _ _ _ _ _ _ _ _ _ | 64. 4 | 65.8 |
| 1D | No. 1C+4 hr at 150 °C _ _ _ _ _ _ _ _ _ _ _ _ _ _ _ _ | 70.3 | _ _ _ _ _ _ _ _ _ _ _ _ _ _ |
| 2 | Isothermal; 40 hr at 135 °C _ _ _ _ _ _ _ _ _ _ _ _ | 68.5 | _ _ _ _ _ _ _ _ _ _ _ _ _ _ |
One other sample was crystallized isothermally. It is also reported in the table. In addition to these, other specimens were used to check and amplify the results. They will be mentioned in the text.
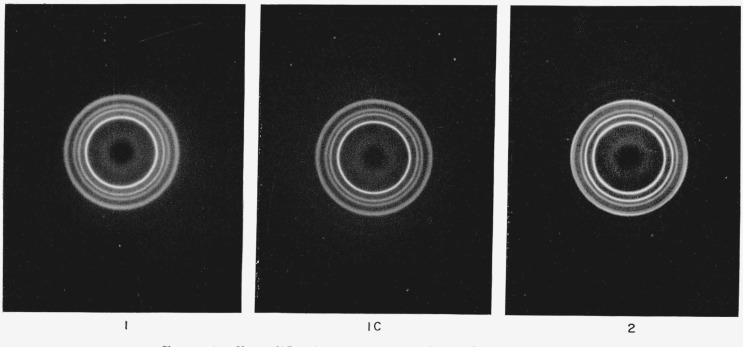
X-ray diffraction studies 3 were carried out on specimens 1, 1C, and 2, and flat film transmission patterns are shown in figure 1. Specimen No. 1 contained a small amount of polypropylene in the hexagonal crystal form [14], which disappeared on annealing. Although not apparent from the photographs shown in figure 1, specimens 1 and 2 showed a, small amount of preferred orientation, determined by more precise diffractometer measurements. This was probably caused by multiple nucleation at the walls of the quenching apparatus, and is not expected to affect the results significantly.
Figure 1. X-ray diffraction patterns of samples 1, 1C, and 2 in table 1.
More precise diffractometer measurements show a small amount of preferred orientation in samples 1 and 2.
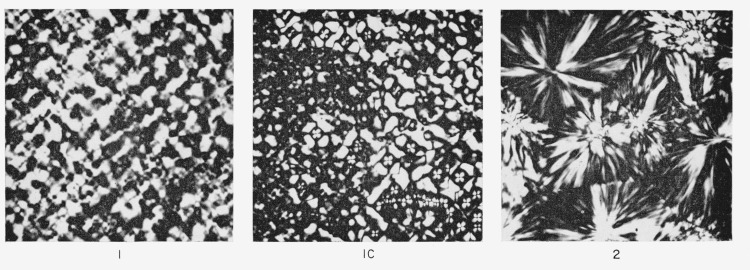
The gross morphology of specimens 1, 1C, and 2 was observed by studying thin sections of these specimens under the polarizing microscope, and photomicrographs are shown in figure 2. The results are as expected; specimens 1 and 1C show a highly irregular, granular morphology, with some indication of spherulites, albeit ill-formed and irregular. Specimen 2 shows typical well-formed spherulites of mixed positive and negative character [15].
Figure 2. Optical micrographs under crossed polaroids of thin sections of samples 1, 1C, and 2 in table 1.
The magnification is 290 × in each case. Note the well formed spherulites in sample 2.
3. Results and Discussion
As mentioned in the introduction, Δ is not a good quantity to use to determine the strength of a relaxation, nor the average relaxation time of the process. Nevertheless, we shall delay discussion of G″ and J″, which are more directly related to the relaxation parameters, and discuss the relaxations in terms of Δ. This will be more nearly comparable to much of the discussion in the literature, and make comparison with it easier.
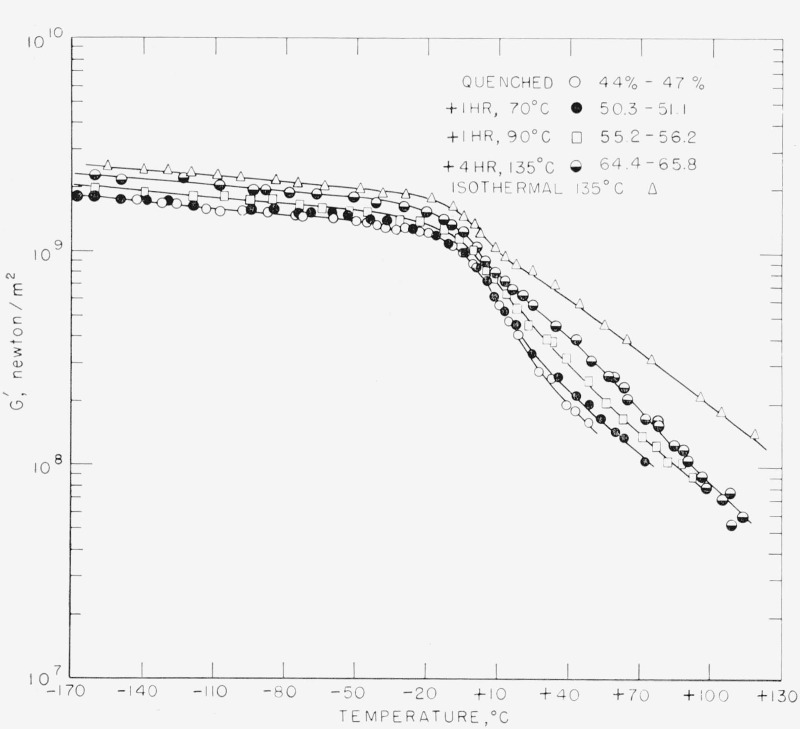
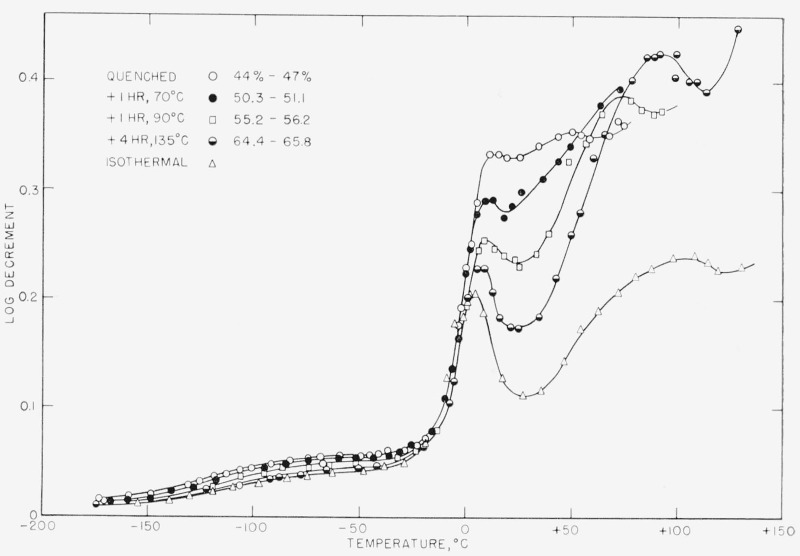
The results for G′ and Δ are shown in figures 3 and 4 for samples 1, 1A, IB, 1C, and 2. Sample 1D is omitted for clarity but is reported in table 2 (see below). Sample No. 1 was measured only to 53 °C, but the data for Δ were later extended and checked by similar samples whose dimensions, unfortunately, were not uniform enough to permit unambiguous calculation of G′.
Figure 3. The real part of the complex modulus as a function of temperature for five of the specimens listed in table 2: 1—○, 1Α—●, 1Β—□, 1C—◒, 2—△.
The numbers denote degrees of crystallinity before and after the run.
Figure 4. The logarithmic decrement as a function of temperature for the same specimens shown in figure 3.
Note the behavior with crystallinity of the high temperature relaxation.
Table 2.
Experimental parameters for the three relaxations observed
| LTR |
GTR |
HTR |
||||||||||||
|---|---|---|---|---|---|---|---|---|---|---|---|---|---|---|
| Sample No. | Tmax | Δmax | G′ | ν | Tmax | Δmax | G′ | ν | Tmaxa | Δmax | G′ | ν | G″max | Tmaxb |
| °C | newton/m2 | c/s | °C | newton/m2 | c/s | °C | newton/m2 | c/s | newton/m2 | |||||
| 1_ _ _ _ _ _ _ _ | −60 | 0.057 | 1.42×10⁹ | 1.070 | 12 | 0.334 | 0.52×10⁹ | 0.650 | 50 | 0.355 | _ _ _ _ _ _ _ _ _ _ _ _ _ _ _ _ | 0.383 | _ _ _ _ _ _ _ _ _ _ _ _ _ _ _ | _ _ _ _ _ _ _ _ |
| 1A _ _ _ _ _ _ | −60 | .055 | 1.52 | 1.111 | 11 | .292 | .55 | .665 | 72 | .373 | 0.104×10⁹ | .294 | _ _ _ _ _ _ _ _ _ _ _ _ _ _ _ | _ _ _ _ _ _ _ _ |
| 1B _ _ _ _ _ _ | −55 | .052 | 1.80 | 1.104 | 9 | .254 | .76 | .785 | 74 | .369 | .124 | .323 | 0.25×10⁸ | 47 |
| 1C _ _ _ _ _ _ | −50 | .045 | 1.80 | 1.204 | 7.5 | .230 | .85 | .823 | 93 | .426 | .100 | .275 | .25 | 57 |
| 1D _ _ _ _ _ _ | −50 | .043 | 2.05 | 1.36 | 4 | .212 | 1.14 | 1.020 | 108 | .468 | .106 | .312 | .28 | 66 |
| 2 _ _ _ _ _ _ _ _ | −50 | .043 | 2.04 | 0.888 | 4 | .203 | 1.12 | 0.671 | 105 | .240 | .170 | .258 | .23 | 57 |
The temperature of the maximum in Δ.
The temperature of the maximum in G″.
The Δ versus T curve shows the three peaks indicating three relaxation processes characteristic of other crystalline polymers. (The lowest temperature peak is small and very broad, appearing almost as a shoulder on the low temperature side of the intermediate temperature peak.) These relaxations have been referred to in almost as many ways as there are authors in the field. Indeed, they have been called transitions, although they are not necessarily related to true thermodynamic transitions, except in some cases. We prefer to use the term “relaxation” for these peaks, and adopt the nomenclature of Scott et al. [9] for them. Thus, the low temperature peak we call the “low-temperature relaxation” (LTR), the medium temperature peak we call the “glass transition relaxation” (GTR) since it occurs near the dilatometric glass transition temperature, and the high temperature peak we call simply the “high-temperature relaxation” (HTR).
3.1. Low Temperature Relaxation
This is a very broad relaxation with a maximum in Δ (Δmax) occurring at approximately −60 °C. It has been previously observed by other workers [6, 7, 16, 17]. The pertinent information for this and the other relaxations are given in table 2. The curves for the real part of the shear modulus (fig. 3) do not show any inflection point within the temperature range of this relaxation. However, it will be noticed that, with the exception of sample 1D, Δmax decreases and G′ increases as the density increases. This is even more evident in the data of Flocke [7], where the different densities were obtained by differing polymerization procedures and hence refer to samples of varying tacticity, and he was therefore able to study samples of lower density. Where comparison is possible the present data agree with those of Flocke to within about 10 percent.
The difference in density between samples 1D and 2 is just outside experimental error. The slightly higher values of Δmax than would be expected for sample 1D from the behavior of the other samples indicates that some imperfections in the crystal for the quench-annealed samples may be the cause of a small amount of relaxation. The same difference occurs in the GTR.
Now, as mentioned in the introduction, it is well known from the work of Keith and Padden [11, 18] that atactic polymer in the presence of isotactic polymer is excluded from the crystalline phase when the isotactic component crystallizes. This atactic component segregates at interspherulitic boundaries, between lamellae or fibrils, etc., and exists as a true amorphous phase coexisting with the crystalline phase. Thus, reasoning from the behavior of Δmax with crystallinity one would conclude, at least from the data of Flocke, that whatever process is responsible for the LTR, it is occurring in the amorphous phase, since Δmax decreased with increasing crystallinity. And, to the extent that mechanical behavior as exemplified by A can be used to infer the thermodynamic state of a polymer, one would conclude that the quenched isotactic polymer is in the same state as the mixed atactic-isotactic polymer. This would be a fairly good reason for adopting a two-phase model for the fine morphological structure of a quenched polymer.
Moreover, the behavior of A in the LTR region is almost independent of the grosser details of the morphology. The behavior of specimen 2 is essentially what would be predicted from the behavior of the various specimens 1. This behavior would follow from the mechanisms proposed to explain the LTR in other polymers [1, 2, 8]. The relaxing unit is presumably small, consisting of only a few chain segments, and involves no motion of more complex morphological units.
3.2. Glass-Temperature Relaxation
The GTR is the next that occurs on the temperature scale. Again with the slight exception of the Δmax value for sample 1D, the magnitude Δmax decreases and G′ increases as density increases in all cases, independently of how the density is achieved. Again these data are in agreement with those of Flocke, and the same remarks that have been made for the LTR apply also to this relaxation.
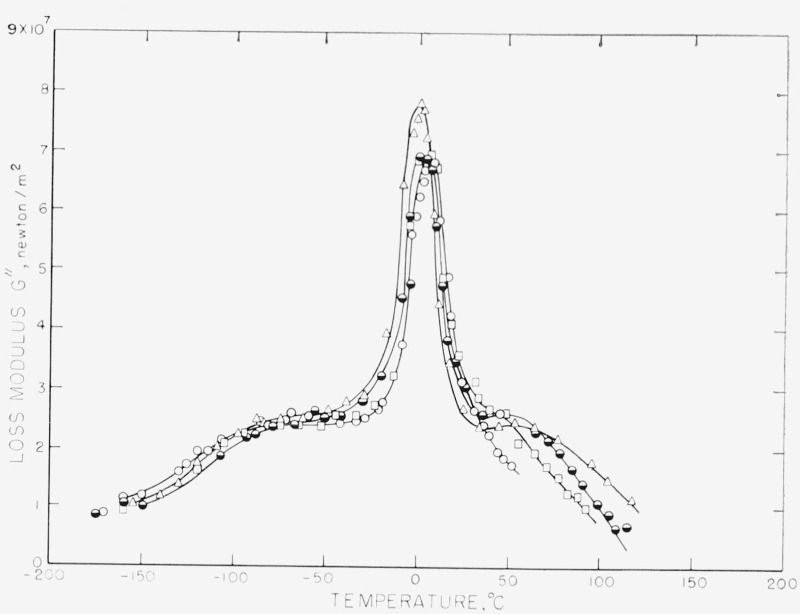
There is an easily discernible difference in the temperature of the maximun in Δ. It is unfortunately difficult to discuss this in quantitative terms since “mixing” of this peak with that due to the HTR undoubtedly raises the temperature of the GTR maximum somewhat. (See, however, the G″—T curves in figure 6. The same temperature difference exists for the maximum in the G″—T curve, with much less mixing of peaks.) Without data at different frequencies these two peaks are difficult to separate. However, the behavior persists even with samples 1C, 1D, and 2 where mixing is less likely to influence the temperatures of the maximum and it is tempting to ascribe this variation to a more fundamental cause. It is known that the glass transition temperature in isotactic polypropylene is somewhat higher than in atactic polypropylene [19, 20]. The present sample of polypropylene contains 2.5 percent extractable material which is presumably all atactic, and may contain more atactic either as high molecular weight atactic chains or (as is more likely) atactic sequences in the main chains which would make the main chain a stereoblock copolymer. If this is true, and, as discussed above, atactic sequences are excluded from crystallites, then as the degree of crystallinity is increased the composition of the resulting amorphous component is changed, becoming richer in atactic material, and the glass-transition temperature falls. Since this relaxation is associated with the glass transition, the temperature of the maximum in Δ also falls.
Figure 6. The loss modulus of four of the samples in figure 4 as a function of temperature.
The symbols are the same as in figure 4. Note the reversal in the behavior with crystallinity both in the glass temperature relaxation and in the high temperature relaxation as compared with figure 4.
This may be put into somewhat more quantitative terms. We assume that the whole polymer contains a fraction f of atactic material and (1—f) of isotactic material, with glass transition temperatures and respectively. The glass transition is a property only of the amorphous polymer, and for a mixture of atactic and isotactic components can be related for our purposes to the glass transition temperature of the pure atactic and pure isotactic components by the equation [21]
| (3) |
where φ is the fraction of atactic polymer in the amorphous component. With these assumptions it is easy to show that
| (4) |
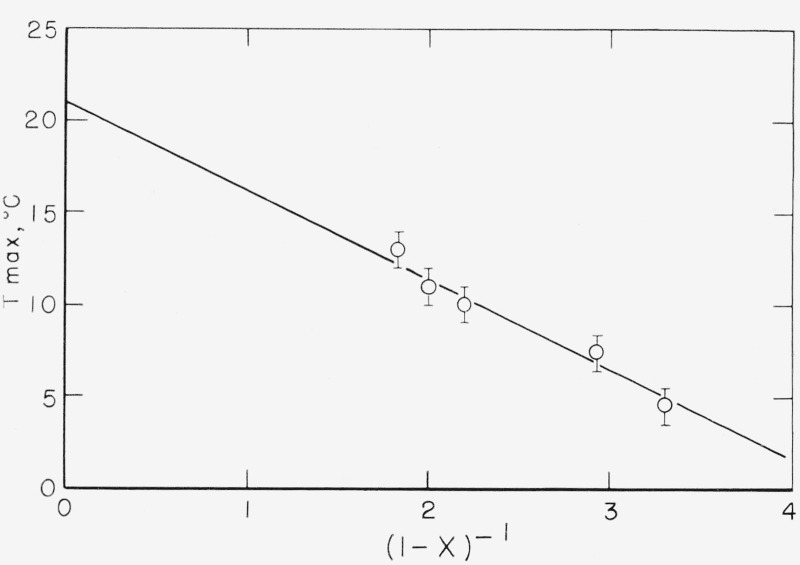
where χ is the degree of crystallinity. It is now reasonable to expect that Tmax, the temperature of the maximum in Δ, is displaced by the same amount from the dilatometric Tg for each of the pure components and for the mixture, provided the frequency of measurement is the same, as is very nearly true in these experiments. Figure 5 shows a plot of the observed Tmax against (1—χ)−1, and it will be seen that the fit is surprisingly good. Extrapolating the curve to the (physically impossible) value of (1—χ)−1 = 0 gives a value of 21 °C for for this frequency. If we accept the value of 2 °C for from the 16.1 percent isotactic sample (measured at 2.0 c/s) of Flocke, then we calculate the not unreasonable value of 0.27 for f. Although the agreement is almost certainly fortuitous, this is in striking agreement with the value of 0.25 for the same quantity deduced by Wyckoff [22] from x-ray determinations on a similar polymer.
Figure 5.
A plot of the temperature of the maximum in Δ in the glass temperature relaxation against (1—χ)−1 (see text).
Further elaboration of this point would be inappropriate, considering the drastic nature of the approximations. However, the reasonable value of the quantities calculated indicate that some validity may be attached to this interpretation of the dependence of Tmax on χ.
3.3. High-Temperature Relaxation
This is the most complex of the relaxations. It is quite evident from the Δ-T curves that the behavior is quite intimately associated with the method of sample preparation. Arguing from the curves for specimen 1, one would be tempted to ascribe the source of this relaxation to some process occurring within the crystal, for the magnitude of Δmax increases with sample crystallinity, and the temperature of the maximum also rises. This, however, cannot be the case, for specimen 2, which is more highly crystalline than any of the No. 1 specimens shown on the figure, has a lower peak than any of the latter. Indeed, specimen 1D, which had a χ of 0.70 shows a value of 0.468 for Δmax whereas specimen 2 with essentially the same χ has a value of 0.24 for Δmax.
This strong dependence on the gross morphology is unquestionably the basis of the conflicting interpretations found in the literature about the source of this process. Thus McCrum [6] ascribed this relaxation to “crystal disordering,” Flocke [7] to a process in the amorphous regions, and Scott et ah, ascribed the analogous relaxation in poly(chlorotrifluoroethylene) to “lamellar surfaces or interlamellar interactions.” We are inclined to consider the last interpretation as being the most nearly correct.
The behavior of G′ requires little comment. It is worthwhile to point out, however, that G′ is higher throughout the whole temperature range for the higher crystallinity samples.
3.4. Behavior of Other Viscoelastic Functions
The various relaxation processes have been discussed with respect to the behavior of the logarithmic decrement, although the relationship of this quantity to the fundamental parameters of the relaxation is not very direct. That is to say, Δmax may change not only because of a change in ΔG(G∞ — Ge), but also because of a change in Ge alone. The more appropriate quantities for discussing the relaxation behavior are either G″ or J″ both of which have a direct relation to the relaxation strength.
However, in the case of a material such as a crystalline polymer, even the behavior of G″ and J″ is not sufficient to describe the situation completely. This is because such polymers are in a sense composite materials, consisting, on scale almost observable by optical microscopy, of a high modulus crystalline phase and some less well defined regions of lower modulus. In a polymer such as isotactic polypropylene there is evidence, as we have seen, for what amounts to a true amorphous phase. In a polymer such as polyethylene, which is much more highly crystalline, there exists a low modulus region consisting probably of some tie-molecules and certainly of juxtaposed chain-fold planes between lamellae. We shall call these different modulus regions “phases,” without meaning to imply that they both are true thermodynamic phases. In either case the evidence is that such materials are composites on a fairly gross scale.
Now, before mechanical relaxation can be observed, the applied stress, or strain, must be coupled to the relaxing species. And it will be clear that if the relaxing species exists primarily in one of the phases, then the connectivity between the phases is of paramount importance in determining the extent of relaxation. This problem of connectivity has already been discussed by Sasaguri and Stein [23] with reference to the optical behavior, and by Takayanagi [10] with respect to mechanical behavior of spherulites under deformation. The latter author has developed a phenomenological model which accounts for the behavior of filled polymer systems and mixtures of two polymers. Unfortunately, its application to the problem of relaxations in crystalline polymers presupposes a knowledge of the viscoelastic properties of the two phases over the whole range of temperatures, and this is usually not known.
In the absence of a detailed knowledge of the viscoelastic properties of the two phases, or of the details of the connectivity (which in principle could make their properties calculable from the properties of the composite if one could solve the formidable mechanical problem), we have chosen to compare the different samples studied at equivalent macroscopic strains and stresses. At a macroscopic sinusoidal strain ϵ0 sin ωt, the energy lost per cycle per unit volume is given by
| (5) |
At a macroscopic sinusoidal stress of σ0 sin ωt, the energy lost per cycle per unit volume is given by
| (6) |
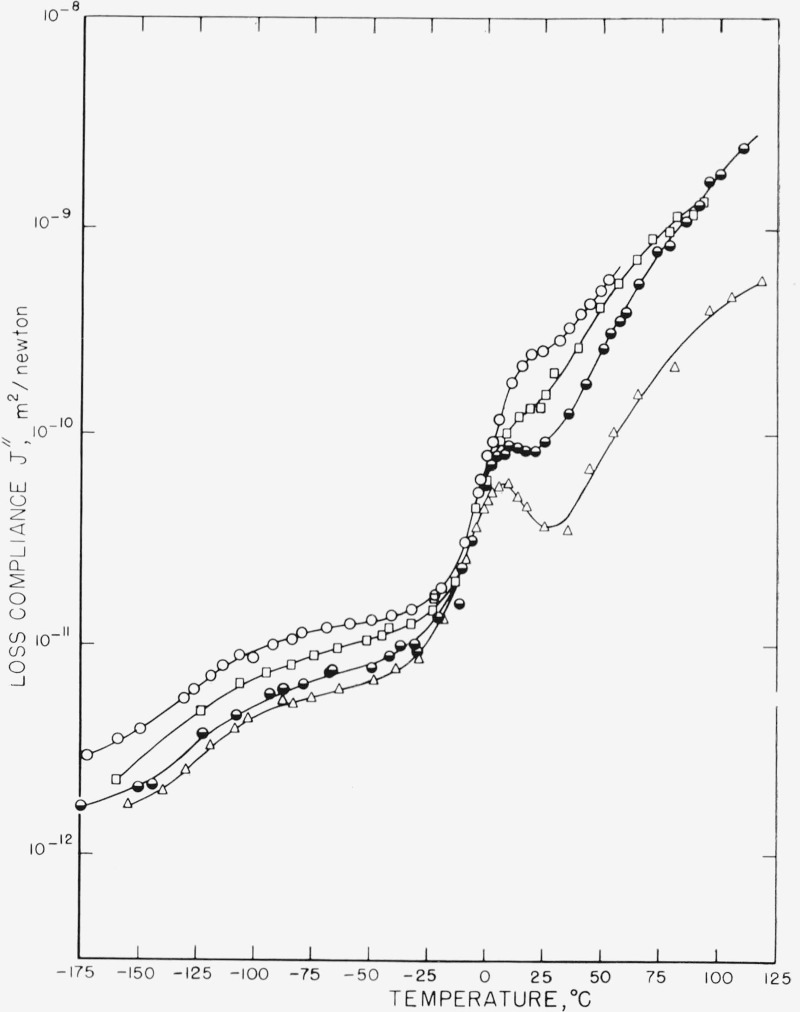
Hence the correct quantities for comparing the loss at equivalent macroscopic strains and equivalent macroscopic stresses are G″ and J″ respectively. Plots of these quantities against temperature are shown in figures 6 and 7.
Figure 7. The imaginary part of the complex compliance as a function of temperature for the same four samples as in figure 6.
Figures 4, 6, and 7 indicate that for this material analysis of the effect of morphology upon the various relaxation processes depends upon the viscoelastic function chosen to characterize the relaxation.
The differences between the Δ and G″ curves are striking; those between the Δ and J″ curves are not as great. The only distinct relaxation in the G” curves is the GTR, the LTR and HTR appearing only as shoulders on this. Moreover, the order of the samples has been reversed in the GTR. Samples Nos. 2 and 1D (not shown) now have the highest value of G″ at the peak, with very little difference between the other No. 1 samples.
As shown in table 2, the differences in in the HTR are very much smaller than the differences in Δmax, and above 125 °C, G″ for sample No. 2 is higher than for any of the No. 1 samples. This again is to be contrasted with the behavior of Δ. Moreover, in the HTR the temperature at which the maximum in G″ occurs is from 27 to 48 °C lower than the temperature at which the maximum in Δ occurs (table 2). This is due to the fact that and Δmax are different functions of the relaxation times and the relaxing moduli, and Δmax is also a function of the equilibrium modulus. These quantities change by varying and unknown amounts as the crystallinity and morphology change.
The LTR is less complex, and to the precision of the data in this region these samples must be considered the same. In essence, the G″ curves have minimized the differences in the samples demonstrated by Δ, and, in fact, inverted the behavior.
The J″ curves, on the other hand, magnify the differences among the curves as compared to the Δ plot.
From these sets of curves, and bearing in mind that the samples in question had different degrees of crystallinity, one would be led to quite conflicting conclusions. Reasoning from the J″ curves one would conclude that the LTR, GTR, and HTR are all processes which occur in amorphous regions since all three processes are more prominent in the least crystalline specimens. Reasoning from the Δ curves one would conclude, as previously discussed, that the LTR and GTR are properties of an amorphous phase, while the HTR is a complex process depending very strongly on the morphology. Reasoning from the G″ curves, however, one would conclude that the differences among the samples are small, and what differences do exist are such that more relaxation is taking place in the more crystalline specimens and that hence the site of the relaxation process is in the crystal.
Such conflicting conclusions show the degree of caution which must be exercised when using any one mechanical experiment to deduce something about the nature of the relaxation processes in crystalline polymers. Not only must any one viscoelastic function be measured but the others must be computed from it and their behavior taken into consideration. To go beyond this one would need a molecular or phenomenological model on the basis of which the behavior of the viscoelastic functions could be calculated. With present knowledge of the details of the morphology of crystalline polymers this would be a formidable task.
It is relatively easy to show what conditions are necessary to have G′ change and G″ not change over the whole temperature (and hence frequency) range as the degree of crystallinity is changed. This is approximately the behavior shown by the curves in figure 6. From linear viscoelasticity we have
| (7) |
and
| (8) |
where Ge is the equilibrium (low frequency) modulus, the τi are the relaxation times with associated relaxation moduli Gi, and ω is the frequency. For the purposes of this analysis we assume (as is approximately true) that the temperature dependence of G′ and G″ comes only from the temperature dependence of the τi. Since ω and τ appear symmetrically in these equations, G′ and G″ are the same functions of ω as they are of τ. Hence asking that a change in crystallinity produce no change in G″ over the whole temperature range at constant frequency is equivalent to asking that no change be produced over the whole frequency range at constant temperature.
Now, we expect Ge, the Gi, and the τi all to be functions of the degree of crystallinity, χ. Hence we have
| (9) |
| (10) |
The vanishing of dG″/dχ at all frequencies (and hence at all temperatures) implies that both dGi/dχ and dτi/dχ are zero. If this is the case, then the only variation in G′ comes about from the variation in Ge with crystallinity. This would imply that the G′ curves for the various crystallinities are parallel to one another when plotted on a linear scale. A plot of the data shown in figure 3 shows that this is indeed approximately the case, at least below the GTR, where the G″ curves are very similar. Above this temperature the curves approach one another more closely, a reflection, no doubt, of the real differences that exist in the G″ curves in the HTR region.
These results imply that the main effect of changing χ is to change the static modulus, Ge, and that the differences observed in the Δ—T and J″—T curves for different χ are primarily, although not entirely, due to the variation of this quantity. This seems to be the case below and through the GTR, but above this temperature, both Gi and τi, may change with χ. This behavior is understandable on the two- phase crystalline-amorphous concept of polymer morphology.
3.5. Conclusions
Three relaxation processes are observed for isotactic polypropylene in plots of G″, Δ, or J″ against T: one below the temperature at which the dilatometric glass transition is observed (the LTR), one near the dilatometric glass transition temperature (the GTR), and one above this temperature (the HTR).
Changing the crystallinity and morphology by annealing quenched specimens on the one hand, or preparing isothermally crystallized specimens on the other hand, has only a small effect on the behavior of G″ with temperature.
On the other hand, J″ for the less crystalline specimens is higher at all temperatures than for the more crystalline specimens, quite independently of the morphology. The behavior of Δ is more complicated, the LTR and GTR decreasing with crystallinity, while the HTR may increase or decrease. It is concluded that when comparison of different samples is made, completely different results will be obtained if comparison is made at equivalent macroscopic strains (G″) or equivalent macroscopic stresses (J″). This is presumably due to the unknown microscopic connectivity of the composite material which is the crystalline polymer. It is incorrect, therefore, to say that changing the degree of crystallinity increases or decreases the magnitude of a given relaxation process; whether it does or does not depends primarily upon the mode of comparison. It is shown from these results that the primary effect of changing the degree of crystallinity is to change the static modulus, Ge.
Footnotes
Figures in brackets indicate tbc literature references at the end of this paper.
By “strength of the relaxation” we mean the difference between the moduli at very high and very low frequencies, i.e., .
We are highly indebted to Mr. Norman M. Walter of the American Viscose Corporation for carrying out these studies for us
4. References
- [1].Sauer J. A. and Woodward A. E., Rev. Modern Phys. 32, 88 (1960). [Google Scholar]
- [2].Eby R. K. and Sinnott K. W., J. Appl. Phys. 32, 1765 (1961). [Google Scholar]
- [3].See, for example, Anderson F. R., J. Appl. Phys. 35, 64 (1964). [Google Scholar]
- [4].Passaglia E. and Kevorkian H. K., J. Appl. Polymer Sci. 7, 119 (1963). [Google Scholar]
- [5].Hoffman J. D., to be published.
- [6].McCrum N. G., Makromol. Chemie.
- [7].Flocke H. A., Kolloid Z. 180, 119 (1962). [Google Scholar]
- [8].Ferry J. D., Viscoelastic Properties of Polymers, p. 338 (John Wiley & Sons, New York, N.Y., 1961). [Google Scholar]
- [9].Scott A. H., Scheiber D. J., Curtis A. J., Lauritzen J. I. Jr., and Hoffman J. D., J. Res. NBS 66A, (Phys. and Chem.) No. 4, 269 (1962). [Google Scholar]
- [10].Takayanagi M., Memoirs of Faculty of Engineering, Kyushu University; XXIII, 42 (1963). [Google Scholar]
- [11].Keith H. D. and Padden F. J., J. Appl. Phys. 34, 2409 (1963). [Google Scholar]
- [12].Nielsen L. E., Rev. Sci. Instrum. 22, 690 (1951). [Google Scholar]
- [13].Danusso F. and Moraglio G., Chimica e industria 41, 748 (1959). [Google Scholar]
- [14].Keith H. D., Padden F. J., Walter N. M., and Wyckoff H. W., J. Appl. Phys. 30, 1485 (1959). [Google Scholar]
- [15].Padden F. J. and Keith H. D., J. Appl. Phys. 30, 1479 (1959). [Google Scholar]
- [16].Woodward A. E., Trans. N. Y. Acad. Sci. 24, 250 (1962). [Google Scholar]
- [17].Illers K. H., Rheol. Acta 1, 616 (1961). [Google Scholar]
- [18].Keith H. D. and Padden F. J., J. Appl. Phys. 35, 1270–1296 (1964). [Google Scholar]
- [19].Passaglia E. and Kevorkian H. K., J. Appl. Phys. 34, 90 (1963). [Google Scholar]
- [20].Dainton F. S., Evans D. M., Hoare F. E. and Melia T. P., Polymer 3, 286 (1962). [Google Scholar]
- [21].DiMarzio E. A., Private communication.
- [22].Wyckoff H. W., J. Polymer Sci. 62, 83 (1962). [Google Scholar]
- [23].Sasaguri K. and Stein R. S., to be published.


