

Abstract
The hypothalamus controls essential social behaviors and homeostatic functions. However, the cellular architecture of hypothalamic nuclei, including the molecular identity, spatial organization, and function of distinct cell types, is poorly understood. Here, we developed an imaging-based in situ cell type identification and mapping method and combined it with single-cell RNA-sequencing to create a molecularly annotated and spatially resolved cell atlas of the mouse hypothalamic preoptic region. We profiled ~1 million cells, identified ~70 neuronal populations characterized by distinct neuromodulatory signatures and spatial organizations, and defined specific neuronal populations activated during social behaviors in male and female mice, providing a high-resolution framework for mechanistic investigation of behavior circuits. The approach described opens a new avenue for the construction of cell atlases in diverse tissues and organisms.
One sentence summary
In situ gene expression profiling of single cells reveals the molecular identity, spatial organization and function of neurons in the mouse hypothalamic preoptic region.
A mechanistic understanding of brain function requires a systematic assessment of cell types and their spatial organization, connectivity, and functional properties. A case in point is the preoptic region of the hypothalamus, which is comprised of multiple nuclei and controls essential social behaviors such as parenting, mating, and aggression, as well as homeostatic functions, such as thermoregulation, thirst, and sleep (1, 2). Because these are evolutionarily conserved functions, it has been proposed that the associated neural circuits are genetically defined and, thus, composed of transcriptionally distinct neuronal types (1–3). Indeed, several neuronal populations within the preoptic region, each defined by discrete molecular markers, have been linked to distinct behavioral and homeostatic functions (4–11). However, the number of cell types present in the preoptic region, as well as their molecular signatures, spatial organizations, and functional roles remain unclear, hampering our ability to investigate the underlying neural circuits.
Single-cell RNA-sequencing (scRNA-seq) provides a powerful means to identify cell types and cell states by genome-wide expression profiling of individual cells, offering rich insights into the cellular diversity of many tissues, including the brain (12–15). However, scRNA-seq requires cell dissociation and thus results in the loss of the spatial context of cells that is critical for understanding tissue function (15, 16). Recently, image-based single-cell transcriptomic approaches have been developed that quantify gene expression by directly imaging individual RNA molecules within intact cells and tissues using multiplexed fluorescence in situ hybridization (FISH) or in situ sequencing (15, 17–22). These approaches offer new opportunities to identify cell populations within complex tissues, while simultaneously mapping their spatial organization and uncovering their functions by combining gene expression profiling with imaging of activity markers, such as the induction of immediate early genes (IEGs) (22, 23). Among these, multiplexed error-robust FISH (MERFISH) detects individual RNA molecules with single-molecule FISH (smFISH) (24, 25) and uses error-robust barcoding, combinatorial labeling, and sequential imaging to multiplex smFISH measurements, thereby enabling transcriptome-scale RNA imaging of individual cells in situ (20, 26).
Here, we developed a MERFISH-based imaging and analysis platform for in situ cell type identification and mapping, and used this approach, in combination with scRNA-seq, to create a cell atlas of the preoptic region of the mouse hypothalamus. We used scRNA-seq to catalog cell populations and identify their marker genes. We then performed MERFISH imaging of these marker genes together with genes of known functional importance to identify cell populations and map their spatial organization in situ., we combined MERFISH with measurements of IEG expression to identify discrete cell populations activated by specific social behaviors, including parenting, aggression, and mating, in both sexes and different physiological states.
Results
scRNA-seq of the preoptic region
We dissected a rostral part of the mouse hypothalamus containing the preoptic region (Fig. 1A), i.e. the medial preoptic area (MPOA) and surrounding nuclei (~2.5 mm x 2.5 mm x 1.1 mm, Bregma +0.5 to −0.6) from adult female and male brains, and dissociated the tissue using a custom protocol that improved cell survival and capture (fig. S1). We collected scRNA-seq profiles from 31,299 cells across 3 replicates of each sex using droplet-based scRNA-seq (27–29).
Figure 1. scRNA-seq of the preoptic region in the mouse hypothalamus.
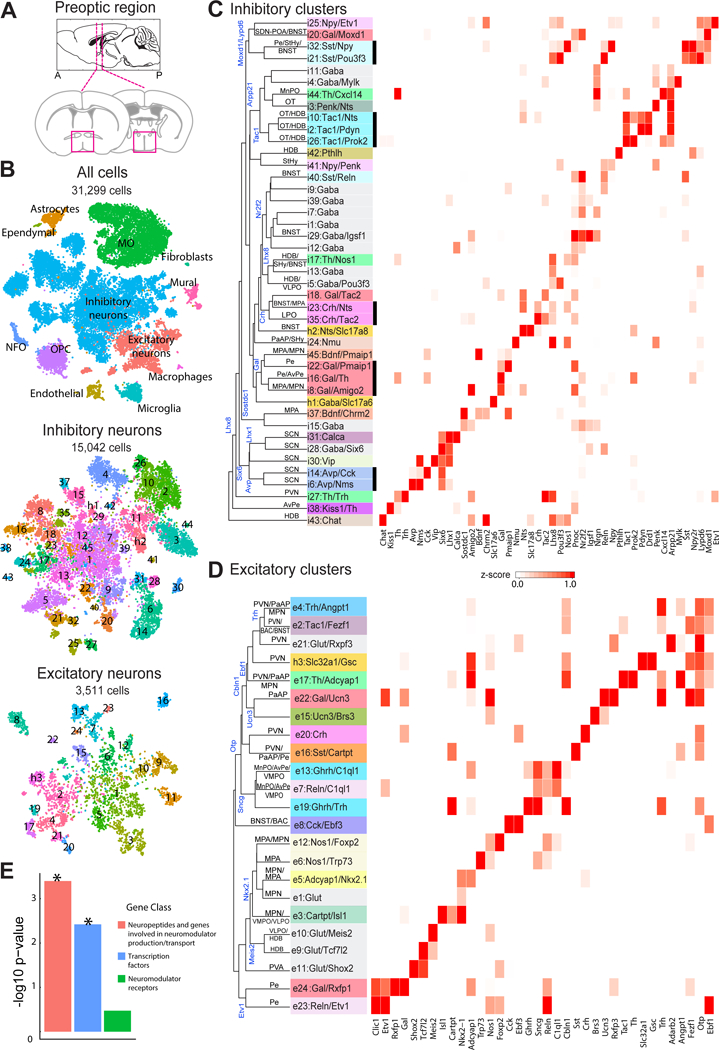
(A) Schematic of the preoptic region of the hypothalamus. Magenta boxes indicate the area dissected for scRNA-seq (Bregma +0.5 to −0.6). (B) t-distributed stochastic neighbor embedding (tSNE) for all cells, inhibitory and excitatory neurons, with cells colored by cluster. Numbers superimposed on the tSNE indicate the cluster ID. Total cell numbers for each tSNE plot are indicated. NFO: newly formed oligodendrocytes. OPC: oligodendrocyte progenitor cells. MO: mature oligodendrocytes. (C) Heat map of z-scores of expression for select genes within inhibitory neuronal clusters. Clusters are organized on the basis of the hierarchical tree constructed with expression in principal component space, with some of the genes differentially expressed between branches indicated (blue). The nomenclature of clusters uses a numeric indicator of excitatory or inhibitory cluster followed by one or two marker genes, with the first marker typically a neuromodulator (29). Inhibitory and excitatory clusters that lack a notable neuromodulator marker gene were designated as Gaba and Glut, respectively, with an additional marker gene to help differentiate among these clusters when possible. Cluster names are colored based on the first gene. Predicted anatomical locations for the clusters are listed on the tree and the unlabeled lines indicate that such prediction was not possible. Thick black lines underscore clusters grouped by common neuropeptide expression. (D) As in (C) but for excitatory neurons. The hybrid neuronal clusters h1/h2 and h3 are listed in (C) and (D) respectively, as they were initially classified as inhibitory and excitatory, respectively. (E) –log10(p-value) for the enrichment of gene categories in differentially expressed genes that mark neuronal clusters calculated based on a Gene-Set Enrichment Analysis (GSEA) as shown in fig. S6. * indicated p < 0.05.
We used unsupervised, graph-based, community detection methods (28, 30, 31) modified by us (fig. S2) to cluster cells (29). This led to the delineation of major cell classes including inhibitory and excitatory neurons, microglia, astrocytes, immature oligodendrocytes (newly formed oligodendrocytes and oligodendrocyte progenitor cells), mature oligodendrocytes, ependymal cells, endothelial cells, fibroblasts, macrophages, and mural cells, as well as subdivisions within these cell classes (Fig. 1B, Table S1).
Further clustering of inhibitory neurons (15,042 cells) and excitatory neurons (3,511 cells) separately revealed 43 and 23 subpopulations, respectively (Figs. 1B, S3A, B; Tables S1, S2). Hereafter, we denote excitatory and inhibitory neuronal clusters as e1, e2, …, and i1, i2, …, respectively. We also provide specific names for these clusters based on marker genes (Fig. 1C, D and see figs. S4, S5 for displays emphasizing neuropeptide expression) (29).
While the majority of the identified clusters expressed either excitatory or inhibitory neuronal markers, we observed expression of the GABA synthetic genes Gad1 and Gad2 in many excitatory neuronal clusters classified on the basis of expression of Vglut2 (Slc17a6), with Gad2 expression being particularly widespread (fig. S3C). By contrast, very few Slc17a6-positive clusters expressed the GABA transporter gene Vgat (Slc32a1). These data suggest that Slc17a6 and Slc32a1 are better discriminators for excitatory versus inhibitory neurons, corroborating evidence from other brain areas (32). Interestingly, cells in two neuronal clusters originally designated as inhibitory and one originally designated as excitatory co-expressed Slc17a6 (or Slc17a8, vGlut3) and Slc32a1. These cells were unlikely to be a clustering artifact because individual cells co-expressed both markers, nor did they correspond to doublets (29), hence they potentially represent hybrid neurons capable of GABA/Glutamate co-release, as characterized in the hypothalamus and a few other brain regions (32–34). We denote these clusters as h1, h2 and h3 (Figs. 1C, D, S3C).
To determine the gene categories that best discriminate neuronal clusters, we examined the top 5 most differentially expressed genes in each cluster and observed enrichment for neuropeptides and molecules involved in neuromodulator production and transport, as well as for transcription factors, but not for neuromodulator (neuropeptide and hormone) receptors. Quantitative analyses of enrichment profiles of these three gene classes among differentially expressed genes further support this notion (Figs. 1E, S6; Table S3). Neuromodulator receptors did discriminate some clusters (for example Npr1, Rxfp1, Brs3, Drd1; Figs. 1C, D, S4, S5). However, on average, neuromodulator receptors were expressed more widely and at lower levels than neuromodulators and transcription factors, limiting their use as potential markers for functional studies. Notably, most clusters were discriminated by combinations of genes, rather than by single markers.
Hierarchical tree analyses (29) showed that inhibitory neuronal clusters expressing a common neuromodulator were often grouped together on the tree, for example clusters expressing Avp, Gal, Crh, Tac1 and Sst (Fig. 1C), suggesting potential functional or developmental commonality among them. By contrast, neuromodulators largely failed to group excitatory neuronal clusters (Fig. 1D). Instead, predicted locations of individual clusters on the basis of spatial expression patterns of their marker genes observed in the Allen Brain Atlas (35) and our own in situ hybridization data (fig. S7) suggest that excitatory clusters tended to be grouped on the tree by anatomical structures or nuclei (Fig. 1D). For example, markers of clusters e4, e2, e21, h3, and e17 defined a node in the tree located in the PVN and adjacent nuclei (MPN, PaAP, BAC, and BNST), markers of node-sharing clusters e13 and e7 placed these populations in the MnPO/AvPe/VMPO region, while markers of e12, e6, e5, and e1 placed these cells in the MPN/MPA region (Fig. 1D) (See Table S4 for full names of the nuclei described in this work). We thus hypothesize that excitatory neuron types tend to be spatially segregated in distinct anatomical structures of the preoptic region, in a manner similar to the spatial segregation of different types of excitatory neurons in various layers of the cortex (36). Similar analysis with the inhibitory neuronal tree suggests that, while some groups of clusters were defined by spatially restricted transcription factor expression, for example, Six6 marking the SCN (Fig. 1C), such spatial grouping of transcriptionally similar clusters appeared to be less pronounced than with excitatory clusters. Additionally, transcription factors tended to mark groups of neuronal clusters further sub-divided by neuromodulator expression (Fig. 1C, D), consistent with earlier reports of hypothalamic parcellation by transcription factors during early development (37).
Specific neuronal clusters identified by scRNA-seq
Previous studies of the preoptic region have defined cell populations associated with the regulation of specific homeostatic and behavioral functions on the basis of the expression of one or more marker genes (Table S5). Clusters expressing these marker combinations were identified in our scRNA-seq data (figs. S4, S5), together with many previously unknown cell populations. Moreover, we uncovered a high level of molecular heterogeneity among a number of previously reported singular cell types, thus partitioning them into multiple distinct populations, as illustrated below on specific examples.
The neuropeptide galanin (Gal) has been associated with behaviorally relevant cell populations of the preoptic region (4, 5, 38) in the MPOA (parenting and feeding) (5, 38) and VLPO (sleep) (4). Our scRNA-seq data revealed seven neuronal clusters that were statistically enriched in Gal expression, each characterized by distinct marker genes (Fig. 2A) validated with two-color in situ hybridization (fig. S7A). These clusters were each associated with different hormonal modulations, ranging from cluster i20:Gal/Moxd1 predicted to lie in the sexually dimorphic nucleus of the POA (Fig. 1C) and expressing a wide range of sex steroid and neuropeptide receptors, to cluster e24:Gal/Rxfp1 expressing no sex steroid receptor (Fig. 2A).
Figure 2. scRNA-seq identifies sub-divisions of cells expressing markers previously associated with single neuronal populations.
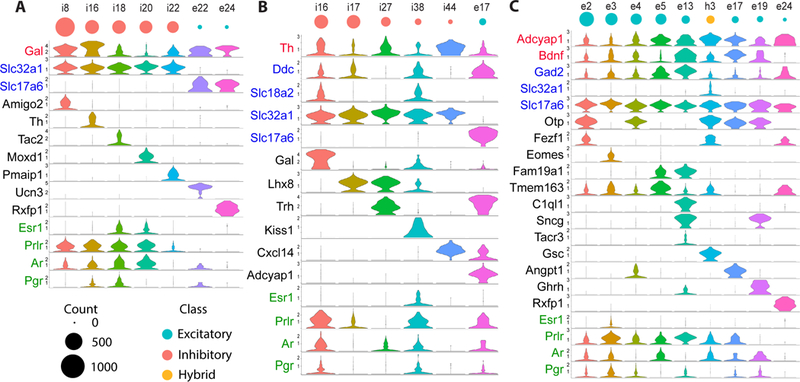
(A-C) Expression distributions of selected marker genes and genes of interest in all neuronal clusters that are statistically enriched (Model-based Analysis of Single-cell Transcriptomics [MAST] (75), false-discovery-rate <0.01) in (A) galanin (Gal), (B) tyrosine hydroxylase (Th), or (C) Bdnf and Adcyap1. Gene names in black: Differentially expressed genes for each selected neuronal cluster. Gene names in blue: inhibitory (Gad1, Gad2, Slc32a1) and excitatory (Slc17a6) neuronal markers, as well as dopaminergic markers (Ddc, Slc6a3, and Slc18a2). Gene names in green: sex hormone receptors. Y-axis on each violin plot depicts the log transformed counts with the range set to the 95% expression quantile of the cluster with the highest expression (29). The sizes of red, cyan, and yellow circles correspond to the cell abundance of the inhibitory, excitatory, and hybrid clusters, respectively.
Second, cells expressing tyrosine hydroxylase (Th), a key enzyme involved in catecholamine synthesis, have been viewed as a single population involved in several social behaviors (6, 39). Here we identified six Th-enriched neuronal clusters (Figs. 2B, S7B), among which only i16:Gal/Th and i38:Kiss1/Th expressed both Dopa decarboxylase (Ddc) and the vesicular monoamine transporter Vmat2 (Slc18a2), genes required for dopaminergic function (Fig. 2B).
Lastly, the neuropeptide adenylate cyclase activating polypeptide 1 (Adcyap1) and brain-derived neurotrophic factor (Bdnf) have recently been identified as combined markers for preoptic neurons sensing warm temperature (8). Our data revealed nine Adcyap1- and Bdnf-enriched clusters (Fig. 2C). Although the warm-sensitive neurons have been previously considered as inhibitory neurons on the basis of their functional properties and expression of Gad2, all nine Adcyap1- and Bdnf-enriched clusters identified here co-expressed Gad2 and Slc17a6 and only one of them also expressed Slc32a1 (Fig. 2C), identifying these clusters as excitatory or hybrid neurons. We further identified one of these clusters as representing warm-sensitive neurons with the help of MERFISH (see below). A recent study has revealed that a neuronal population controlling thirst-motivated behavior also express Adcyap1 and Bdnf (10), further supporting the notion that Adcyap1 and Bdnf are imperfect markers for warm-sensitive cells.
MERFISH measurements of the preoptic region
Next, we performed MERFISH measurements of the preoptic region (1.8 mm x 1.8 mm x 0.6 mm, Bregma +0.26 to −0.34), within the area characterized by scRNA-seq, targeting a set of 155 genes (Fig. 3A; Table S6) (29). These genes were comprised of two groups: 1) 85 preselected genes that were either known markers for major cell classes or relevant to neuronal functions of the hypothalamus, such as neuropeptides and neuromodulator receptors; 2) 70 additional genes that were identified by scRNA-seq as neuronal cluster markers but not already included in the 85 preselected genes. Among these 155 genes, 135 genes were imaged using combinatorial smFISH with an error-robust barcoding scheme, as demonstrated previously for MERFISH (20, 26, 40). The remaining 20 genes were relatively short and/or expressed at high levels, challenging for combinatorial smFISH detection, and hence were measured in sequential rounds of multi-color FISH following the combinatorial run. The sexually dimorphic expression previously reported for eleven genes (41, 42) was confirmed here (fig. S8).
Figure 3. Major cell classes and their spatial organizations in the preoptic region as revealed by MERFISH.

(A) (Left) Schematic of the MERFISH measurements. Combinatorial smFISH imaging was used to identify 135 genes, followed by sequential rounds of two-color FISH to identify 20 additional genes. Total polyadenylated mRNA and nuclei co-stains then allowed cell boundary segmentation. (Top right): Pseudo-colored dots marking localizations of individual molecules of eight example RNA species, each marking a distinct major cell class, in a 10-µm-thick, 1.8-mm × 1.8-mm slice. (Bottom right): Magnification of the white boxed region (left) and the total mRNA image and the segmented cell boundaries of the same region (right). The raw and decoded MERFISH images of the same field of view (FOV) for all 135 genes measured using combinatorial smFISH are shown in fig. S9; the total mRNA and nuclei co-stain images and segmented cell boundaries for the same FOV are shown in fig. S10. The segmented cell boundaries represent the boundaries of the cell soma (29). A subset of identified RNA molecules fell outside these boundaries and are thus candidates for RNAs in neuronal or glial processes. (B) Expression of all genes measured with MERFISH for ~500,000 cells imaged in multiple naïve animals. Expression for each gene is normalized to the 95% expression quantile for that gene across all cells. Cells are grouped by major classes, and markers of each major cell class are listed on the right. OD: oligodendrocytes. (C) tSNE plot of these cells. (D) Pairwise Pearson correlation coefficients between the average expression profiles (in z-scores) of individual cell classes identified by MERFISH and by scRNA-seq. (E) Upper panels: Spatial distribution of all major cell classes across sections at different anterior – posterior positions from a single female mouse. Cells are marked with cell segmentation boundaries and colored by cell classes as indicated. Six of the twelve 1.8-mm X 1.8-mm imaged slices are shown. The 0μm, 100μm, 200μm, 300μm, 400μm and 500μm labels indicate the distance from the anterior position (Bregma +0.26). Lower panels: Enlarged image of the slice at 400 μm from the anterior position (left) and a further magnified image of the region shown in the grey dashed box (right). Scale bars: 500 μm (left) and 250 μm (right). (F) Spatial distributions of individual cell classes are shown as colored dots on the background of all cells shown as grey dots. Dashed ovals indicate several specific hypothalamic nuclei and are colored identically to the nuclei abbreviations listed to the right. BNST: Bed nucleus of the stria terminalis. MPN: Medial preoptic nucleus. MnPO: Median preoptic nucleus. Pe: Periventricular hypothalamic nucleus. AvPe: Anteroventral periventricular nucleus. VMPO: Ventromedial preoptic nucleus. VLPO: Ventrolateral preoptic nucleus. PVA: Paraventricular thalamic nucleus. PaAP: Paraventricular hypothalamic nucleus, anterior parvicellular.
We sectioned the preoptic region into 60 evenly spaced slices along the anterior-posterior axis and performed 3D MERFISH imaging on every fifth slice (29). Individual RNA molecules were clearly detected and identified (fig. S9) and individual cells were segmented based on DAPI and total mRNA staining (fig. S10) (29). In total, we profiled >400,000 cells from 3–4 replicates in naïve male and female animals, as well as >500,000 additional cells from 3–5 replicates of animals subjected to behavioral stimuli (29). MERFISH expression data showed high reproducibility between replicates (fig. S11A), good correlation with bulk RNA-seq data of the preoptic region (43) (fig. S11B), and a low false-detection rate (fig. S11C). For the targeted genes, MERFISH detected on average 6 – 8 fold more transcript copies per cell than scRNA-seq (fig. S12A–D), underscoring the high sensitivity of MERFISH.
An unsupervised, community-detection-based clustering approach similar to that applied to scRNA-seq data was used to identify transcriptionally distinct cell populations in MERFISH data (Fig. 3B, C; Table S7) (29). MERFISH identified all major cell classes (Fig. 3B, C), except for macrophages and fibroblasts potentially because the corresponding marker genes were not included in the MERFISH gene library. The expression profiles of cell classes measured by MERFISH were strongly correlated with those determined by scRNA-seq (Fig. 3D). However, the relative abundance of cells in various cell classes differed in the two datasets (fig. S12E). In particular, astrocytes, endothelial cells and ependymal cells were depleted in our scRNA-seq data, presumably due to cell loss during tissue dissociation.
MERFISH also provided a direct measurement of the spatial distribution of major cell classes. As expected, mature oligodendrocytes were enriched in the anterior commissure and the fornix—major myelinated fiber tracts of the rostral hypothalamus, whereas immature oligodendrocytes, astrocytes, microglia, and endothelial cells were dispersed throughout (Fig. 3E, F). Ependymal cells formed a single layer lining the more caudal aspects of the third ventricle, and mural cells were organized in vermiform structures resembling blood vessels (Fig. 3E, F). Notably, inhibitory and excitatory neurons exhibited distinct distributions (Fig. 3E, F). Inhibitory neurons, the more abundant neuronal type in the preoptic region, were widely dispersed across this region but enriched in specific posterior nuclei, including the BNST and MPN. By contrast, excitatory neurons were specifically enriched in a few nuclei anteriorly, but became more dispersed posteriorly, and, in agreement with previous reports (44), were depleted in the posterior BNST.
MERFISH analyses of specific neuronal types
Clustering analyses of inhibitory neurons and excitatory neurons separately identified ~40 inhibitory and ~30 excitatory neuronal populations (Fig. 4A, B; Tables S7, S8). We investigated the impact of the number of genes used to cluster cells in MERFISH data and found that ~90% of the identified neuronal clusters were recovered using the ~75 genes that were most informative among the 155 (fig. S13). Beyond this point, cluster recovery increased more slowly with the number of genes added (fig. S13). Hereafter, we denote excitatory and inhibitory neuronal clusters identified by MERFISH as E-1, E-2, … and I-1, I-2, …, respectively, and the one identified hybrid cluster as H-1.
Figure 4. Neuronal clusters in the preoptic region as revealed by MERFISH.
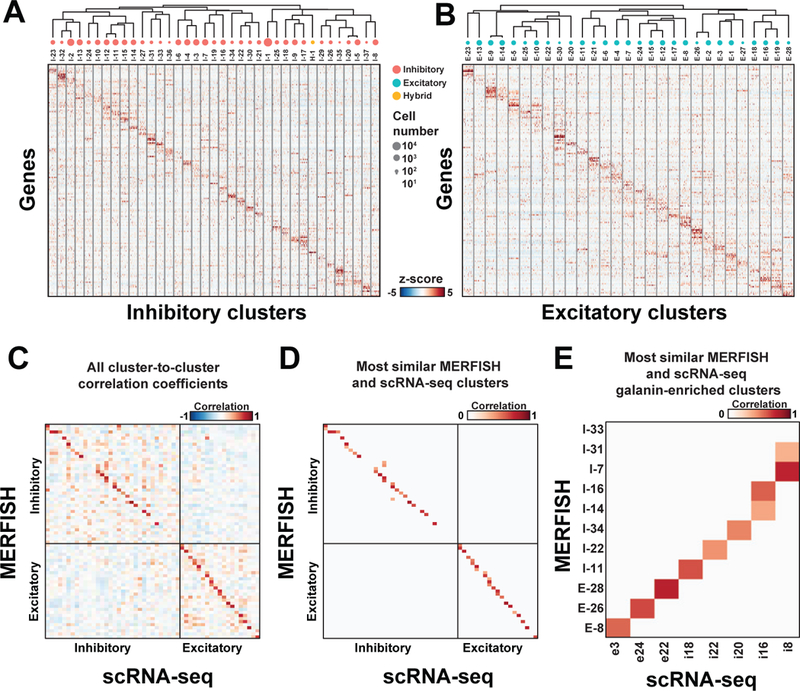
(A, B) z-scores of expression profiles for (A) inhibitory and (B) excitatory neuronal clusters identified with MERFISH. 100 random cells from each cluster are depicted. The neuronal clusters are organized on the basis of similarity in their expression profiles, as depicted by the dendrogram. The sizes of red, cyan and yellow circles indicate the abundance of neuronal clusters, and only clusters with more than 100 cells are depicted. H-1 is grouped with the inhibitory clusters as it was initially classified as inhibitory neurons. (C) The pairwise Pearson correlation coefficients between the expression profile (in z-score) of the MERFISH and scRNA-seq clusters. The order of the clusters in (C) is not the same as in (A, B). (D) As in (C) but with only scRNA-seq cluster(s) most similar to each MERFISH cluster shown, identified as the cluster(s) with the highest Pearson correlation coefficient(s) (fig. S14; Table S9) (29). When multiple scRNA-seq clusters show statistically indistinguishable, highest correlation coefficients to a MERFISH cluster (29), all of them are indicated. scRNA-seq clusters outside the region imaged by MERFISH, as assessed by the expression patterns of the marker genes in the Allen Brain Atlas (35) and our own in situ data (fig. S7) (29), are excluded from this analysis (29). (E) Same as (D) but for clusters enriched in galanin (Gal).
The expression profiles of most neuronal clusters determined by MERFISH correlated well with those of scRNA-seq clusters (Figs. 4C, S14A, B). This observation allowed us to infer, for each MERFISH cluster, the putative corresponding or most similar scRNA-seq cluster(s), defined as the cluster(s) with the highest correlation coefficient(s) (Figs. 4D, S14C; Table S9) (29), which could help expand our knowledge of the expression profiles of the MERFISH clusters. Similar correspondence was observed using a neural network classifier (fig. S14D, E). Correlations between MERFISH and scRNA-seq clusters were only moderately weaker than those between scRNA-seq clusters derived from bootstrapped replicates (fig. S14F, G). Notably, many MERFISH clusters had a unique, most similar scRNA-seq cluster (Figs. 4D, S14; Table S9). However, in some instances, multiple MERFISH clusters exhibited the highest correlation to the same scRNA-seq cluster; in addition, a small fraction of MERFISH clusters lacked a statistically significant correlation to any scRNA-seq cluster (Figs. 4D, S14; Table S9). Both of these scenarios suggest that some clusters identified by MERFISH were not discriminated by scRNA-seq. Conversely, a small fraction of scRNA-seq clusters lacked a statistically significant correlation to any MERFISH cluster (Figs. 4D, S14; Table S9), suggesting that these clusters were not identifiable by the MERFISH gene panel or were located outside the MERFISH imaged area (29).
As a specific illustration, MERFISH identified ten clusters enriched in Gal expression, some showing one-to-one correspondences to Gal-enriched scRNA-seq clusters (Figs. 4E, S15A, B, Table S9). We also observed instances in which two Gal-enriched MERFISH clusters putatively corresponded to the same Gal-enriched scRNA-seq cluster (for example, I-14 and I-16 to i16) (Fig. 4E, Table S9), suggesting that MERFISH resolved sub-populations within the scRNA-seq cluster. Indeed, we identified two subsets of cells within the scRNA-seq cluster i16, each respectively expressing markers of the MERFISH clusters I-14 and I-16 (fig. S15C, D). The calcitonin receptor (Calcr)- and bombesin receptor (Brs3)-positive I-14 and the Th-positive I-16 were found to be differentially activated in specific social behaviors, as described later (Table S9) (see below), supporting the resolution of these cells into two distinct populations. We also observed a similar resolution of i8 into I-7 and I-31 (Figs. 4E, S15E, F, Table S9). A Gal-enriched scRNA-seq cluster could also be split into Gal-enriched and non-Gal-enriched MERFISH clusters (for example i20 into Gal-enriched cluster I-34 and non-Gal-enriched clusters I-2 and I-32 (fig. S15G, H, Table S9)).
Examination of the MERFISH or scRNA-seq clusters that were not discriminated by the other method showed several trends. Some of the MERFISH clusters not detected by scRNA-seq had relatively low abundance, and thus might not be sufficiently represented in our scRNA-seq data, which profiled 4% as many neurons as we did in MERFISH. Some of the MERFISH clusters not discriminated by scRNA-seq had lowly expressed marker genes, which may not be reliably detected by scRNA-seq. Conversely, some scRNA-seq clusters not identified by MERFISH had marker genes that were not included in the MERFISH gene library. Some of the extremely low abundance MERFISH or scRNA-seq clusters lacking correspondence may not represent well-identified clusters. These results thus demonstrate the complementary nature of MERFISH and scRNA-seq and an increased ability to characterize cell populations when both approaches are combined. Nevertheless, some clusters still exhibited heterogeneity in gene expression associated with distinct spatial locations (fig. S16), suggesting either spatial gradients in gene expression within the same cluster or the presence of unresolved cell subpopulations.
Spatial organization of specific neuronal cell types
Next, we examined the spatial distributions of individual neuronal clusters (Figs. 5A, S17, S18) within the framework of major anatomically defined nuclei of the preoptic region as depicted in Fig. 5B (45). About 30% of the MERFISH clusters were enriched primarily in a single nucleus (pink shading, Fig. 5C), for example cluster I-5 primarily in the VLPO and cluster E-9 in the PVA (Fig. 5A-C), while approximately half of the clusters were distributed over a few (two to four), often physically contiguous nuclei (unshaded clusters, Fig. 5C)—for instance cluster I-3 in the BNST-mv, PaAP, PS and SHy and cluster I-12 in the StHy, MPA, and MPN (Fig. 5A-C). This anatomical dispersion may reflect a similar function of the same cell type across distinct nuclei, or a developmental relationship of spatially distinct cells. By contrast, a small fraction of the neuronal clusters were dispersed and not enriched in any given nucleus, e.g. I-21 and E-22 (Fig. 5A). While most nuclei were populated by both excitatory and inhibitory neurons, the PVA and BAC only contained excitatory clusters (Fig. 5C, green shaded row) and the BNST-p and BNST-mv contained only inhibitory clusters (Fig. 5C, blue shaded rows), consistent with previous observations of high expression of Slc17a6 and Slc32a1 in these regions, respectively (35, 44).
Figure 5. The spatial organization of neuronal clusters in the preoptic region.
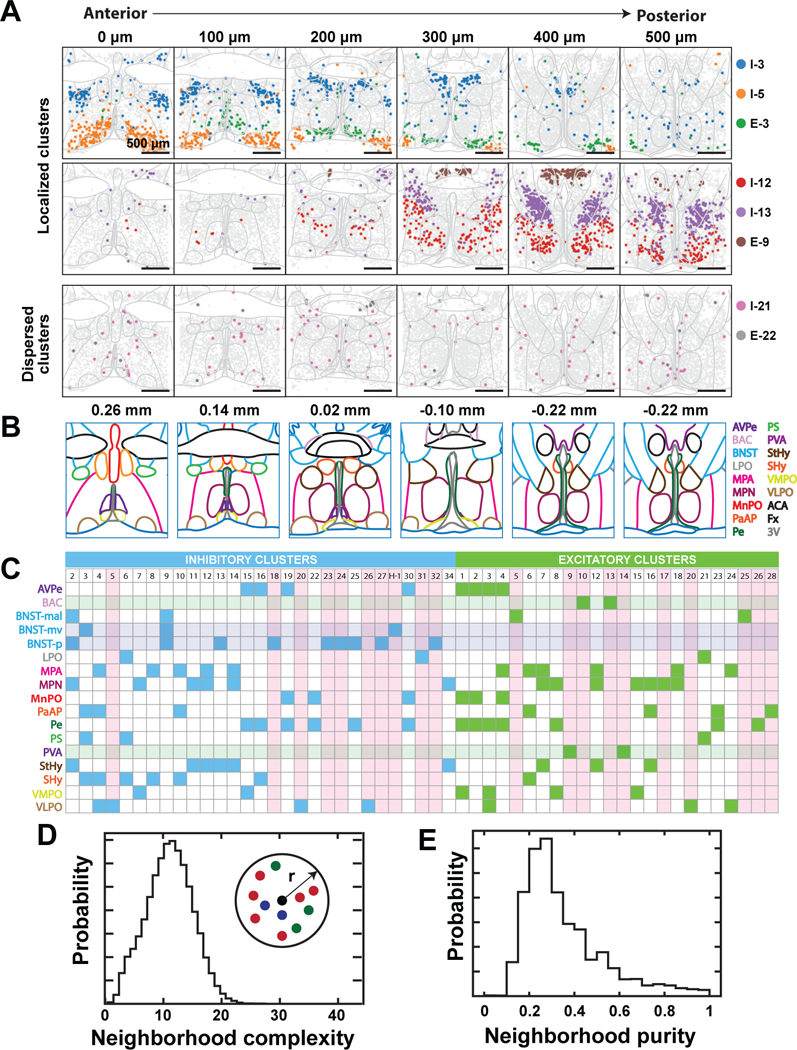
(A) Spatial distribution of example neuronal clusters that are localized (top and middle) or dispersed (bottom). Depicted are six of the twelve slices imaged from a female mouse. Colored markers indicate cells of the specified neuronal clusters and gray markers indicate all other neurons. Nuclei boundaries depicted in light grey are drawn according to (45) and aligned to the tissue slices based on the locations of landmarks, such as the anterior commissure, fornix, and ventricle. The 0, 100, 200, 300, 400, and 500 µm labels indicate the distance from the anterior position (Bregma +0.26). (B) Illustration of major hypothalamic nuclei spanning the imaged region and colored according to legend on the right (45). Nuclei abbreviations are as defined in Fig. 3F, and additionally, BAC: Bed nucleus of the anterior commissure; LPO: Lateral preoptic area; MPA: Medial preoptic area; PS: Parastrial nucleus; StHy: Striohypothalamic nucleus; SHy: Septohypothalamic nucleus; ACA: Anterior commissure; Fx: Fornix; 3V: Third ventricle. Bregma locations are listed on top and the map at Bregma −0.22 is duplicated. (C) Summary of nuclei in which inhibitory (blue) or excitatory (green) neuronal clusters are enriched. Translucent horizontal bars indicate nuclei that contain only inhibitory (blue) or excitatory (green) clusters. Vertical pink bars highlight clusters primarily enriched in single nuclei. BNST-mal: BNST, medial division, anterolateral part. BNST-mv: BNST, medial division, ventral part. BNST-p: BNST, posterior part. (D, E) Analysis of spatial mixing of distinct neuronal clusters. We define the complexity of the neighborhood surrounding any given neuron as the number of distinct neuronal clusters present within that neighborhood, and the purity of that neighborhood as the fraction of all cells within the given neighborhood that are part of the most abundant cluster. Probability distributions of the complexity (D) and purity (E) of the 100-µm-radius neighborhood surrounding any given neuron are depicted.
Neuronal clusters of the preoptic region appeared highly intermixed, with multiple clusters occupying any given nucleus. To quantify the degree of intermixing, we calculated the neighborhood composition for each neuron. This analysis showed that each neighborhood contained multiple clusters and was typically not dominated by a single cell population (Fig. 5D, E).
These direct spatial measurements allowed us to provide an anatomy-based taxonomy for the identified neuronal clusters, except for the dispersed clusters, which we named based on marker genes (Table S9). The putative correspondence between these MERFISH clusters and scRNA-seq clusters allowed us to further assess the spatial locations of scRNA-seq clusters and compare them with our earlier predictions shown in Fig. 1C, D. In nearly all cases, the predicted locations matched or partially overlapped those of the corresponding MERFISH clusters (Table S9), lending additional support to our earlier observations on the spatial relationship between transcriptionally similar clusters (Fig. 1C, D). However, we cautiously note that the predicted scRNA-seq cluster locations represent rough approximations due to the relatively low resolution of available in situ hybridization data and suffer from occasional ambiguity in the spatial patterns of some marker genes. Moreover, due to the remaining heterogeneity in some of the identified scRNA-seq and MERFISH clusters, the putative correspondence may only represent similarity between subsets of cells within these clusters.
Spatial and molecular organization of socially relevant cell populations
Neuromodulators, hormones and associated signaling pathways play critical roles in hypothalamic functions, but analyses with cellular resolution have been limited due to the low expression level of many of the corresponding receptors. MERFISH enabled us to examine the distribution of these genes throughout the preoptic region, providing functional insights into the associated cell populations.
Sex steroid hormones are essential to the development and modulation of social behaviors and reproduction. We examined the distribution of enzymes and receptors essential for steroid hormone signaling in the preoptic region. The enzyme Aromatase (Cyp19a1) converts testosterone to estrogen and thus modulates steroid function (39). MERFISH revealed Aromatase-enriched clusters with distinct repertoires of sex hormone receptors (Fig. 6A, B). Interestingly, several of these clusters (e.g. I-2, I-13, I-24, I-32 and E-12) expressed both androgen receptor (Ar) and estrogen receptor alpha (Esr1), suggesting that, in these cell populations, circulating testosterone can be converted into estrogen and thus affect gene expression in a cell-autonomous manner through Esr1 activation. In addition, the Aromatase-enriched clusters E-12 and I-2 substantially overlapped with locations of several Esr1-enriched clusters (Fig. 6C-F), suggesting that estrogen synthesized by these Aromatase-expressing cells may also act in a paracrine manner on cells of the nearby Esr1-enriched clusters, in addition to the autocrine signaling mode described above (Fig. 6G).
Figure 6. Spatial and molecular organization of neuronal clusters enriched in genes relevant to social behaviors.
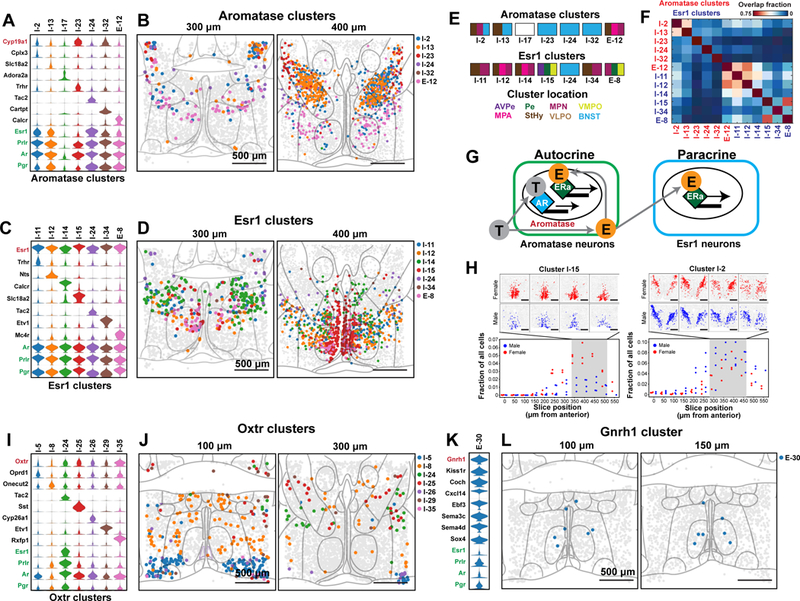
(A) Expression distributions of selected marker genes and genes of interest for neuronal clusters enriched in aromatase (Cyp19a1). Expression distributions are calculated as in Fig. 2. (B) Spatial distributions of neuronal clusters depicted in (A). Two of the twelve slices from a female mouse sample are depicted. Nuclei boundaries depicted in light gray are as defined in Fig. 5A. (C, D) As in (A, B) but for clusters enriched in estrogen receptor alpha (Esr1). (E) Schematic showing the nuclei spanned by individual clusters, as indicated by the color subdivisions of the rectangles, colored identically to the nuclei abbreviations listed below. The nuclei abbreviations are as defined in Figs. 3F, 5B. I-17 is not colored because it was found at the edge of our imaged region and falls outside of the boundaries of the nearest imaged nuclei, the VLPO (Table S9). (F) Average overlap fraction between aromatase-enriched clusters and Esr1-enriched clusters for all measured animals. Cluster I-24 is enriched in both aromatase and Esr1 and only listed only once. (G) Models of autocrine and paracrine signaling. Circulating testosterone (gray T) can activate cells expressing androgen receptor (AR) or, in cells expressing aromatase, can be converted to estrogen (orange E). Autocrine: In cells co-expressing aromatase and Esr1, estrogen produced in these cells can activate estrogen receptor (ERa) in the same cells. Paracrine: Estrogen produced by aromatase-enriched cells can activate ERa in nearby cells enriched with Esr1. (H) Comparison of the fraction of cells that belong to the specified neuronal clusters (I-15 or I-2) for all male (blue) and female (red) replicates as a function of the anterior-posterior position of the slices. Above each panel are the spatial distribution of the cluster in four slices from a single female (red) and male (blue) replicate. (I, J) As in (A, B) but for clusters enriched in oxytocin receptor (Oxtr). (K, L) As in (A, B) but for a cluster enriched in gonadotropin releasing hormone 1 (Gnrh1). MERFISH revealed 8, 15, and 19 Aromatase-, Esr1- and Oxtr-enriched clusters, respectively, with only the 7 most enriched clusters depicted for each.
We noted that some Esr1-enriched- and Aromatase-enriched clusters exhibited differences in cell abundance of varying extent between males and females. For example, the Esr1-enriched cluster I-15 showed an appreciable enrichment in female animals while the aromatase-enriched cluster I-2 showed a more modest male enrichment (Fig. 6H). Interestingly, I-2 overlapped with the sexually dimorphic nucleus of the preoptic area (SDN-POA) and its marker gene Cplx3 was co-expressed with MoxD1 (a canonical SDN-POA marker (46) not in our MERFISH gene library) in cells of the SDN-POA and BNST (fig. S19). However, I-2:BNST/StHy/MPN spatially extended beyond the boundaries of the SDN-POA, suggesting that it may contain unresolved subpopulations, which may partially mask a sexual dimorphism in SDN-POA cell populations.
We next considered clusters enriched in the expression of oxytocin receptor (Oxtr), an important modulator of social behaviors that exerts its effects broadly throughout the brain (47). While the low expression level of Oxtr has previously made it challenging to identify oxytocin targets, the high sensitivity of MERFISH allowed us to detect enrichment of Oxtr in multiple clusters (Fig. 6I, J). For example, the Oxtr-enriched BNST cluster I-24 co-expressed multiple sex hormone receptors as well as the neuropeptide Tac2 implicated in social isolation stress (48), aggression and fear (48, 49), suggesting the involvement of oxytocin signaling in these functions. This cluster was specifically activated following pup-directed aggression by virgin males as described below, corroborating studies implicating the BNST in this function (50). This highlights a seemingly paradoxical role for Oxtr in agonistic pup encounters versus its known roles in affiliative behaviors (47). Oxtr was also found in the VLPO cluster I-5, implying that oxytocin might have a role in the modulation of VLPO functions such as sleep or temperature sensing (4, 51–53).
The high throughput of MERFISH measurements allowed us to identify some extremely rare cell types. GnRH-expressing cells (E-30) represent a rare cell population dispersed within the preoptic area and basal forebrain that integrates and orchestrates peripheral and central aspects of reproduction (54–56). Only a few cells were found to express appreciable GnRH in our scRNA-seq data and did not form a distinct cluster. By contrast, MERFISH identified a GnRH-enriched cluster (Fig. 6K, L), which expressed remarkably low levels of Esr1 and Ar (Fig. 6K), suggesting that GnRH neurons may receive indirect feedback from circulating hormones within the hypothalamic–pituitary–gonadal (HPG) axis, potentially through synaptic input from hormone responsive cell-types such as Kisspeptin (Kiss)-expressing cells (57).
Partition of previously defined cell types into multiple cell populations
Our MERFISH data also partitioned a number of previously reported single cell types, for example Gal-expressing and Adcyap1-expressing neurons, into multiple distinct cell populations (Fig. 7A). We observed ten Gal-enriched MERFISH clusters, several of which were scattered across multiple nuclei, such as cluster I-14:MPA/MPN/StHy (Fig. 7A-C). I-14 was strongly activated during parenting, as shown below, revealing that molecularly and functionally defined cell types can spread across multiple nuclei.
Figure 7. Sub-divisions of neuronal populations expressing Gal or Adcyap1 revealed by MERFISH.
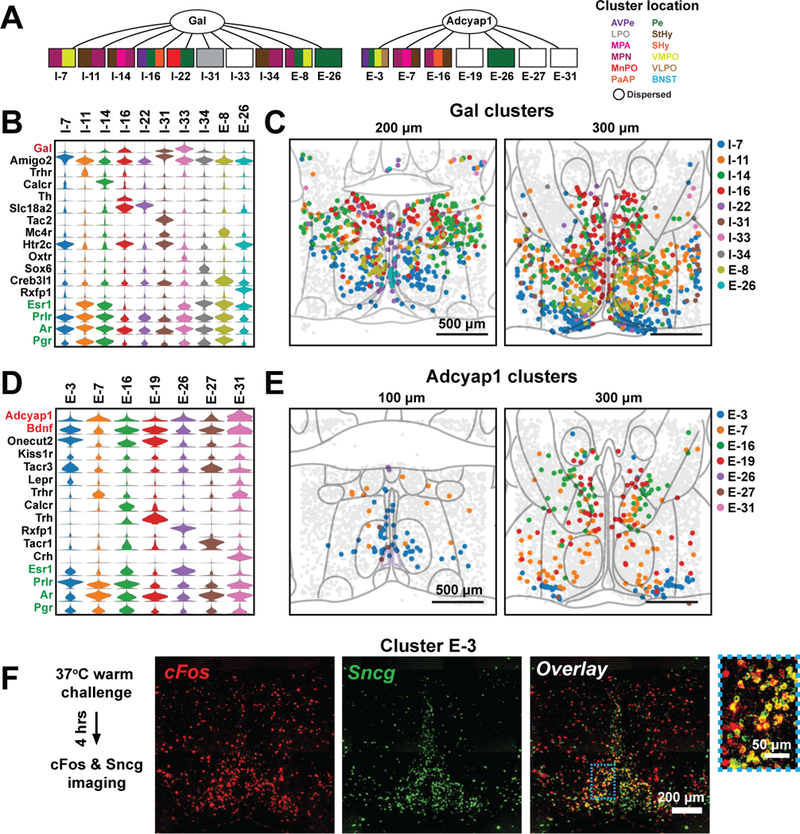
(A) MERFISH sub-divides galanin-expressing and Adycap1-expressing cells into multiple transcriptionally and spatially distinct clusters. Color subdivision of the rectangles shows the nuclei spanned by individual clusters, colored identically to the nuclei abbreviations listed on the right. The nuclei abbreviations are as defined in Figs. 3F, 5B. (B) Expression distributions of selected marker genes and genes of interest for all neuronal clusters enriched in galanin (Gal). Expression distributions are calculated as in Fig. 2. (C) Spatial distributions of all inhibitory and excitatory Gal-enriched clusters. (D, E) As in (B, C) but for Adcyap1- and Bdnf-enriched clusters. The seven most enriched of the 14 Adcyap1- and Bdnf-enriched clusters are shown. (F) in situ hybridization images of cFos (red), Sncg (green) and overlay of an anterior slice of the preoptic region taken from a heat-stressed animal. The blue boxed region is magnified and shown on the right. Sncg is a marker for the scRNA-seq cluster e13 which corresponds to the MERFISH cluster E-3 (Table S9).
Similarly, MERFISH identified 14 clusters enriched in Adcyap1 and Bdnf (Fig. 7A, D, E), previously designated as markers for warm-sensitive neurons (8). Yet only one of these clusters, E-3: AvPe/Pe/VMPO/VLPO, displayed the established spatial location of warm-sensitive cells (8) (Fig. 7E). Indeed, upon heat stress (29), a high level of the IEG cFos was expressed in cells in the region covered by E-3, and Sncg, a marker gene of E-3’s corresponding scRNA-seq cluster e13 (Table S9), was highly enriched in these cFos-positive cells (Fig. 7F). Interestingly, E-3 expressed the leptin and prolactin receptors (Lepr and Prlr; Fig. 7D), suggesting a mechanism whereby metabolic and reproductive states may modulate thermoregulation. Indeed, preoptic cells receiving projections from Arcuate Nucleus Kiss1 cells were recently implicated in the regulation of hormonally induced hot flashes via the activation of the receptor Tacr3 (58). Notably, E-3 and e13 expressed both Kiss1 receptor and Tacr3, implicating the warm-sensitive cluster in the generation of hot flashes.
Neuronal cell types activated by key social behaviors
To investigate the role of specific neuronal populations in discrete social behaviors, we included cFos in MERFISH measurements and characterized animals after parenting, aggression, or mating. We performed clustering analysis of these behavioral samples together with naïve samples not subjected to behavioral stimuli, and did not observe any cluster that was present only in behavioral samples. Notably, for each behavior, only a few neuronal clusters, each characterized by key markers, exhibited a statistically significant enrichment in cFos-positive cells (Figs. 8A,B, S20). In addition, many other clusters showed a small fraction of cFos-positive cells, which together accounted for a substantial subset of all cFos-positive cells (Figs. 8A, S20B). Notably, activated neurons in all tested behaviors were predominately inhibitory.
Figure 8. Neuronal clusters activated during specific social behaviors revealed by MERFISH.
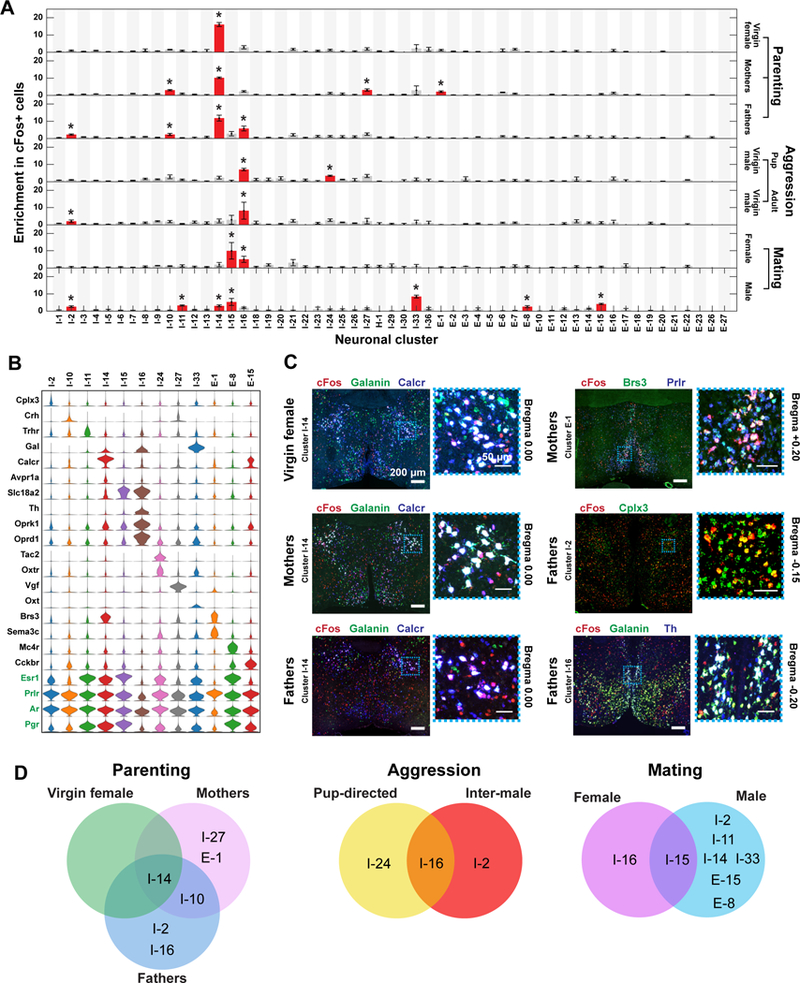
(A) Enrichment in cFos-positive cells within each neuronal cluster observed in males or females after displaying a given social behavior. Red bars marked with asterisks are clusters with statistically significant enrichment in cFos-positive cells, as compared to the fraction of cFos-positive cells in all cells (binomial test; false-discovery rate < 5%). Error bars represent standard error of the mean (N = 3 – 5 replicates). We measured fewer slices in behaviorally stimulated animals than in naive animals (4 versus 12 slices per animal) (29), and only clusters in which at least 10 cells are present in two or more behavior replicates are depicted. (B) Expression distributions of selected marker genes and genes of interest for neuronal clusters enriched in cFos-positive cells in the tested social behaviors. Expression distributions are calculated as in Fig. 2. (C) Representative in situ hybridization images of 16-μm-thick sections from the preoptic region showing cFos expression in cells expressing markers of neuronal clusters activated during parenting, in virgin females, mothers, and fathers. Regions in blue dashed boxes are magnified and shown on the right. Red, green, and blue mark the listed genes and white (or yellow for I-2) indicates co-expression in the merged images. Clusters that cannot be distinguished by a combination of two marker genes plus their spatial location (I-27 and I-10) were not tested. (D) Venn diagrams summarizing the clusters that were activated during specific behaviors in different sexes or physiological states.
We first examined clusters preferentially activated by pup exposure, which elicits parenting behaviors in virgin females, mothers, and fathers but triggers aggression in virgin males (5, 59). We identified, by MERFISH, preferentially activated clusters, i.e. clusters enriched in cFos-positive cells (referred to as cFos enrichment hereafter) (Figs. 8A, B, S20), and validated, using two- or three-color in situ hybridization, all clusters that could be uniquely defined by two marker genes and spatial location (Fig. 8C). In all animal groups displaying parenting, I-14:MPA/MPN/StHy had substantially higher cFos enrichment than any other cluster (Figs. 8A, S20). The expression of Gal and vasopressin receptor (Avpr1a) within this cluster (Fig. 8B) is consistent with the established role of Gal neurons in parenting (5) and their recently documented vasopressinergic input (60). Moreover, this cluster expressed a large set of hormone and peptide receptors (Fig. 8B), substantiating the complex neuromodulation of parenting (61). Interestingly, in addition to I-14, we observed a preferential activation of clusters by pup exposure in a state dependent manner. In mothers and fathers, cFos enrichment was observed in Oxtr-expressing cluster I-10:MPA/PaAP/SHy, while mothers additionally showed modest cFos enrichment in I-27:BNST and E-1:AvPe/Pe/MnPO/VMPO (Figs. 8, S20). Fathers additionally showed cFos enrichment in clusters I-2:BNST/StHy/MPN and in I-16:AvPe/Pe/SHy (Figs. 8, S20).
By contrast, I-14 was not preferentially activated in virgin males exposed to pups, consistent with their aggressive responses towards pups (5). Instead, I-16:AvPe/Pe/SHy and I-24:BNST exhibited cFos enrichment following pup-directed aggression (Figs. 8, S20, S21). I-16 was also preferentially activated in virgin males displaying inter-male aggression, as was I-2 (Figs. 8, S20, S21), suggesting that I-16 is broadly involved in aggressive responses while I-24 and I-2 may mediate differential responses to pups and adults. Interestingly, I-16 was also activated in fathers during parenting, which might indicate that the switch from pup-directed aggression to parenting (59, 61) occurs in circuit nodes downstream of I-16, or that the role of I-16 in aggression is inhibited by pro-parenting circuits. Notably, the Gal- and Th-enriched cluster I-16 expressed Vmat2 (Slc18a2) and showed correspondence to the scRNA-seq cluster i16:Gal/Th (Table S9), which additionally expressed Ddc, suggesting that this cell population is dopaminergic. The activation of a dopaminergic neuronal population during aggression may provide a cellular basis to understand the observations that dopamine is released during aggression and modulates aggressive behavior (6). I-16 also expressed the opioid receptors Oprd1 and Oprk1 (Fig. 8B), supporting the effects of opioid receptor ligands on aggressive encounters in mice and other rodents (62).
Next, we examined clusters activated by successful mating (29) to capture neural activity associated with appetitive and consummatory aspects of sexual behavior. The cluster I-15:AvPe/Pe/VMPO, which displayed a cell abundance enrichment in female mice compared to males (Fig. 6H), was preferentially activated in females and to a lesser extent in males after mating (Figs. 8, S20, S21). Both I-14 and I-15, activated by parenting and mating, respectively, expressed Esr1 (Fig. 8B), consistent with recent findings on the involvement of Esr1-expressing cells in parenting and mating behaviors (63, 64). However, our data showed that cells activated by parenting and mating belong to two distinct cell populations localized to distinct preoptic nuclei. More generally, we found Esr1 expression in nearly all behaviorally activated clusters, suggesting that this gene alone cannot define specific behaviorally relevant cell types. In addition to I-15, which was activated in both sexes after mating, we also observed a few clusters that exhibited sexually dimorphic cFos enrichment, such as I-16 in female mating and I-2, I-11, I-14, I-33, E-8, and E-15 in male mating (Figs. 8, S20, S21). The weak activation of the parenting cluster I-14 following male sexual behavior is consistent with our previous finding that a small subset of Gal neurons are activated in both mating and parenting (5) and may suggest a mechanism underlying the mating dependent switch to parental behavior in virgin male mice. Intriguingly, the Th-enriched cluster I-16 was activated by different behaviors in animals of different sexes, mating in females and aggression in males, similarly to the functional sexual dimorphism observed in a recent study of AvPe Th cells (6).
Discussion
Here, we combined the power of scRNA-seq and MERFISH to create a spatially resolved and functionally aware cell atlas of the preoptic region of the mouse hypothalamus. These methods identified major cell classes and neuronal subpopulations with correlated gene expression profiles, providing cross validations for both methods. Moreover, the two methods are complementary: scRNA-seq measured more genes than MERFISH and helped define marker genes for MERFISH; whereas MERFISH provided spatial context of cells at high resolution, as well as more accurate detection and quantification of weakly expressed genes, including functionally important genes such as neuropeptide and hormone receptors. As a result, the combined data provided a more complete picture of the transcriptional diversity and spatial organization of individual cells in the preoptic region.
We observed a remarkable diversity of neurons in this region, comprising ~70 different neuronal clusters. Transcription factors and cell surface markers have been observed as markers of neuronal identity in the mouse spinal cord (65) and cortex (66) and the Drosophila olfactory system (67). In the mouse preoptic region, genes discriminating neuronal clusters were enriched for neuropeptides and molecules involved in neuromodulator synthesis and transport, and for transcription factors. By contrast, neuromodulator receptors were weaker discriminators of these neuronal populations or were expressed at low levels, providing a useful note of caution in using these genes for targeted functional studies in the preoptic region. Many of these neuronal populations were defined by a combination of multiple genes, indicating that genetic intersectional approaches will be most useful in the functional interrogation of specific cell types (67).
The list of cell populations identified in this work substantially expands and further defines previously reported cell types in this region. We observed specific clusters enriched in genes previously identified as markers of functionally important preoptic cells (for example, cells involved in parenting, aggression, thermoregulation, sleep, thirst), such as Galanin, Th, Adcyap1, Nts, Crh, Tac1, Cck, Agtr1a, Nos1, and Aromatase (Tables S5, S9). Our data also resolved many of the previously described singular cell types into multiple cell populations. We observed good correlation between our data and recent scRNA-seq analyses of the whole mouse hypothalamus (68) and of the whole mouse brain (69). In the latter study, which we compared to ours in more detail because it had a larger whole hypothalamic dataset, 15 neuronal clusters were identified from ~2,000 profiled hypothalamic neurons (fig. S22) (69). However, because we used ~10 times more neuronal scRNA-seq profiles to characterize about 1/5 of the whole hypothalamus (the preoptic region), we were able to analyze the preoptic region with a greater depth and thus gain finer delineation of cell populations (fig. S22B). The neuronal populations that we uncovered in the preoptic region also largely differed from cell clusters described in scRNA-seq studies of other hypothalamic areas (33, 70), perhaps suggesting a molecular and cellular distinctiveness of this brain area.
MERFISH further allowed us to map the spatial organization of cell populations. Structural features of the hypothalamus are not as visibly apparent as in laminated parts of the brain, and hypothalamic nuclei have largely been defined by subtle differences in neuronal density together with specific connectivity and functional roles (1). However, the differences versus similarities in the cell type composition and function of distinct nuclei in the hypothalamus remains unclear (71). MERFISH allowed us to examine the organization of distinct cell populations within individual hypothalamic nuclei, providing a framework to explore the molecular basis of their anatomical segregation. Notably, the spatial organizations of neuronal clusters were diverse: many of the neuronal clusters were each primarily enriched in one or a few nuclei whereas several clusters were substantially more dispersed. Moreover, individual nuclei were composed of multiple neuronal clusters. We also observed specific topographical organizations that can support defined modes of function: for instance, the spatial proximity of aromatase- and Esr1-expressing cells may support paracrine estrogen signaling. Interestingly, although aromatase- and Esr1-enriched cell populations regulate sex hormone production and signaling, rarely any of them appeared to be exclusively expressed in either sex, consistent with behavioral evidence that males and females are capable of exhibiting behaviors typical of the opposite sex (5, 72).
Lastly, the ability of MERFISH to interrogate intact tissue allowed us to include activity-dependent IEGs in our measurements, allowing the identification of neuronal populations activated by specific behaviors. Using this approach to study several social behaviors including parenting, aggression and mating, we observed that only a small number of neuronal clusters displayed statistically significant enrichment in cFos-positive cells following each behavior. This observation supports a model in which genetically encoded circuits comprised of transcriptionally distinct neuronal types control specific hypothalamic functions. However, in all three behaviors, we also observed wide-spread activation of many neuronal clusters at a substantially weaker level, suggesting a secondary role for many different neuronal types in these behaviors and possibly reflecting necessary crosstalk between different behavior circuits. We cautiously note that the large range of cFos expression levels seen in our samples suggests that some activated clusters with low levels of activity-dependent cFos induction may not have been identified if their cFos levels were below the background noise in our measurements.
This study also extended our previous work on circuits underlying parenting behavior (5, 60) by resolving preoptic Gal neurons into several distinct subpopulations, with only one of them involved in both male and female parenting. In addition, we identified distinct cell populations that were differentially activated in mothers and fathers during parenting, providing insights into how physiological state may affect parental behavior. Moreover, we identified cell populations associated with sexual behavior in males and females as well as those involved in male aggression towards infants and conspecific males. Together, our data defined functionally relevant cell populations underlying social behavior with a high molecular and spatial resolution.
Overall, our study demonstrates the power of combining scRNA-seq and MERFISH to map cell types and their organization in the brain, reveal their functional roles in diverse behaviors, and generate hypotheses about structure-function relationships in neural circuits. The identification of marker gene combinations and spatial locations defining the neuronal populations in the preoptic region provides necessary tools for the precise targeting and perturbation of these neurons, thus enabling future functional studies. As an imaging-based approach, we envision that MERFISH can be combined with diverse imaging methods for anatomical tracing and functional interrogation to provide insights into how distinct cell types communicate to form functional circuits in the healthy and diseased brain, as well as in other tissues.
Methods summary
scRNA-seq of the preoptic region was performed using protocols modified from (70) to increase neuronal survival. Tissue fixation and sectioning as well as MERFISH probe construction, staining, and imaging were performed using established protocols (26). 155 genes were imaged in MERFISH measurements, with 135 genes imaged using combinatorial smFISH measurements, and 20 additional genes imaged using sequential rounds of non-combinatorial FISH. The sequences of all probes used for MERFISH are provided in Tables S10, S11. Individual cells were segmented with a seeded watershed algorithm using DAPI and total mRNA co-stains (29). Cell clusters were identified using Louvain community detection on a nearest neighbor graph built upon the statistically significant principle components of gene expression (28, 31, 73) modified to allow an optimized choice of the number of nearest neighbors in the graph. Behavioral stimuli were applied to animals using established protocols (5, 72, 74), and only animals scored as displaying the desired behavior were used for MERFISH measurements.
Supplementary Material
Acknowledgments:
We thank Dr. Yaron Sigal and Dr. Hazen Babcock for advice on sample preparation and assistance with instrumentation, and Dr. Jean Fan for assistance in the gene set enrichment analysis.
Funding: This work is in part supported by the National Institutes of Health (R01MH113094 to X.Z and C.D.; R01MH111502 to C.D., X.Z. and A.R.; R01HD082131 to C.D.). D.B-M. and K.S. are supported in part by the National Institutes of Health Pathway to Independence Award (K99HD092542 to D.B-M. and K99EY028625 to K.S.). A.R. was supported by the Klarman Cell Observatory. A.R., C.D. and X.Z. are Howard Hughes Medical Institute Investigators.
Footnotes
Competing interests: J.R.M. and X.Z. are inventors on patents applied for by Harvard University related to MERFISH. A.R. is a founder of Celsius Therapeutics and a SAB member of Thermo Fisher Scientific, Driver Group, and Syros Pharmaceuticals.
Data and materials availability: scRNA-seq data are available on Gene Expression Omnibus (GEO) (GSE113576). MERFISH data are available on Dryad (doi:10.5061/dryad.8t8s248) and the analysis software is available at https://github.com/ZhuangLab/MERFISH_analysis.
References and Notes:
- 1.Swanson LW. Brain Res 886, 113–164 (2000). [DOI] [PubMed] [Google Scholar]
- 2.Simerly RB, in The rat nervous system, Paxinos G, Ed. (Elsevier, ed. 3rd, 2004), pp. 335–368. [Google Scholar]
- 3.Sternson SM. Neuron 77, 810–824 (2013). [DOI] [PMC free article] [PubMed] [Google Scholar]
- 4.Lu J et al. J. Neurosci 22, 4568–76 (2002). [DOI] [PMC free article] [PubMed] [Google Scholar]
- 5.Wu Z, Autry AE, Bergan JF, Watabe-Uchida M, Dulac CG. Nature 509, 325–330 (2014). [DOI] [PMC free article] [PubMed] [Google Scholar]
- 6.Scott N, Prigge M, Yizhar O, Kimchi T. Nature 525, 519–22 (2015). [DOI] [PubMed] [Google Scholar]
- 7.Sokolowski K et al. Neuron 86, 403–416 (2015). [DOI] [PMC free article] [PubMed] [Google Scholar]
- 8.Tan CL et al. Cell 167, 47–59.e15 (2016). [DOI] [PMC free article] [PubMed] [Google Scholar]
- 9.Leib DE et al. Neuron 96, 1272–1281.e4 (2017). [DOI] [PMC free article] [PubMed] [Google Scholar]
- 10.Allen WE et al. Science 357, 1149–1155 (2017). [DOI] [PMC free article] [PubMed] [Google Scholar]
- 11.Chung S et al. Nature 545, 477–481 (2017). [DOI] [PMC free article] [PubMed] [Google Scholar]
- 12.Poulin JF, Tasic B, Hjerling-Leffler J, Trimarchi JM, Awatramani R. Nat. Neurosci 19, 1131–1141 (2016). [DOI] [PubMed] [Google Scholar]
- 13.Tanay A, Regev A. Nature 541, 331–338 (2017). [DOI] [PMC free article] [PubMed] [Google Scholar]
- 14.Zeng H, Sanes JR. Nat. Rev. Neurosci 18, 530–546 (2017). [DOI] [PubMed] [Google Scholar]
- 15.Lein E, Borm LE, Linnarsson S. Science 358, 64–69 (2017). [DOI] [PubMed] [Google Scholar]
- 16.Crosetto N, Bienko M, van Oudenaarden A. Nat. Rev. Genet 16, 57–66 (2015). [DOI] [PubMed] [Google Scholar]
- 17.Levsky JM, Shenoy SM, Pezo RC, Singer RH. Science 297, 836–40 (2002). [DOI] [PubMed] [Google Scholar]
- 18.Ke R et al. Nat. Methods 10, 857–860 (2013). [DOI] [PubMed] [Google Scholar]
- 19.Lee JH et al. Science 343, 1360–1363 (2014). [DOI] [PMC free article] [PubMed] [Google Scholar]
- 20.Chen KH, Boettiger AN, Moffitt JR, Wang S, Zhuang X. Science 348, aaa6090 (2015). [DOI] [PMC free article] [PubMed] [Google Scholar]
- 21.Shah S, Lubeck E, Zhou W, Cai L. Neuron 92, 342–357 (2016). [DOI] [PMC free article] [PubMed] [Google Scholar]
- 22.Wang X et al. Science 361, eaat5691 (2018).29930089 [Google Scholar]
- 23.Greenberg ME, Ziff EB, Greene LA. Science 234, 80–83 (1986). [DOI] [PubMed] [Google Scholar]
- 24.Femino AM, Fay FS, Fogarty K, Singer R. Science 280, 585–590 (1998). [DOI] [PubMed] [Google Scholar]
- 25.Raj A, van den Bogaard P, Rifkin SA, van Oudenaarden A, Tyagi S. Nat. Methods 5, 877–879 (2008). [DOI] [PMC free article] [PubMed] [Google Scholar]
- 26.Moffitt JR et al. Proc. Natl. Acad. Sci 113, 14456–14461 (2016). [DOI] [PMC free article] [PubMed] [Google Scholar]
- 27.Klein AM et al. Cell 161, 1187–1201 (2015). [DOI] [PMC free article] [PubMed] [Google Scholar]
- 28.Macosko EZ et al. Cell 161, 1202–1214 (2015). [DOI] [PMC free article] [PubMed] [Google Scholar]
- 29. Materials and methods are available as supplementary materials.
- 30.Levine JH et al. Cell 162, 184–197 (2015). [DOI] [PMC free article] [PubMed] [Google Scholar]
- 31.Shekhar K et al. Cell 166, 1308–1323.e30 (2016). [DOI] [PMC free article] [PubMed] [Google Scholar]
- 32.Wojcik SM et al. Neuron 50, 575–587 (2006). [DOI] [PubMed] [Google Scholar]
- 33.Romanov RA et al. Nat. Neurosci 20, 176–188 (2017). [DOI] [PMC free article] [PubMed] [Google Scholar]
- 34.Shabel SJ, Proulx CD, Piriz J, Malinow R. Science 345, 1494–1498 (2014). [DOI] [PMC free article] [PubMed] [Google Scholar]
- 35.Lein ES et al. Nature 445, 168–176 (2007). [DOI] [PubMed] [Google Scholar]
- 36.Tasic B et al. Nat. Neurosci 19, 335–346 (2016). [DOI] [PMC free article] [PubMed] [Google Scholar]
- 37.Shimogori T et al. Nat Neurosci 13, 767–775 (2010). [DOI] [PMC free article] [PubMed] [Google Scholar]
- 38.Knight ZA et al. Cell 151, 1126–1137 (2012). [DOI] [PMC free article] [PubMed] [Google Scholar]
- 39.Simerly RB. Annu. Rev. Neurosci 25, 507–536 (2002). [DOI] [PubMed] [Google Scholar]
- 40.Moffitt JR et al. Proc. Natl. Acad. Sci 113, 11046–11051 (2016). [DOI] [PMC free article] [PubMed] [Google Scholar]
- 41.V Wu M et al. Cell 139, 61–72 (2009). [DOI] [PMC free article] [PubMed] [Google Scholar]
- 42.Xu X et al. Cell 148, 596–607 (2012). [DOI] [PMC free article] [PubMed] [Google Scholar]
- 43.Gregg C et al. Science 329, 643–648 (2010). [DOI] [PMC free article] [PubMed] [Google Scholar]
- 44.Kudo T et al. J Neurosci 32, 18035–18046 (2012). [DOI] [PMC free article] [PubMed] [Google Scholar]
- 45.Paxinos G, Franklin K, The Mouse Brain in Stereotaxic Coordinates (Academic Press Inc., San Diego, ed. 3rd, 2007). [Google Scholar]
- 46.Tsuneoka Y et al. Front. Neuroanat 11, 26 (2017). [DOI] [PMC free article] [PubMed] [Google Scholar]
- 47.Marlin BJ, Froemke RC. Dev. Neurobiol 77, 169–189 (2017). [DOI] [PubMed] [Google Scholar]
- 48.Zelikowsky M et al. Cell 173, 1265–1268.e19 (2018). [DOI] [PMC free article] [PubMed] [Google Scholar]
- 49.Andero R, Dias BG, Ressler KJ. Neuron 83, 444–454 (2014). [DOI] [PMC free article] [PubMed] [Google Scholar]
- 50.Tsuneoka Y et al. J Comp Neurol 521, 1633–1663 (2013). [DOI] [PubMed] [Google Scholar]
- 51.Gallopin T et al. Nature 404, 992–995 (2000). [DOI] [PubMed] [Google Scholar]
- 52.Lu J, a Greco M, Shiromani P, Saper CB. J. Neurosci 20, 3830–42 (2000). [DOI] [PMC free article] [PubMed] [Google Scholar]
- 53.Zhao Z et al. Proc. Natl. Acad. Sci 114, 2042–2047 (2017). [DOI] [PMC free article] [PubMed] [Google Scholar]
- 54.Sisk CL, Foster DL. Nat. Neurosci 7, 1040–1047 (2004). [DOI] [PubMed] [Google Scholar]
- 55.Yoon H, Enquist LW, Dulac C. Cell 123, 669–682 (2005). [DOI] [PubMed] [Google Scholar]
- 56.Boehm U, Zou Z, Buck LB. Cell 123, 683–695 (2005). [DOI] [PubMed] [Google Scholar]
- 57.George JT, Seminara SB. Endocrinology 153, 5130–6 (2012). [DOI] [PMC free article] [PubMed] [Google Scholar]
- 58.Padilla SL, Johnson CW, Barker FD, Patterson MA, Palmiter RD. Cell Rep 24, 271–277 (2018). [DOI] [PMC free article] [PubMed] [Google Scholar]
- 59.Vom Saal FS. Physiol. Behav 34, 7–15 (1985). [DOI] [PubMed] [Google Scholar]
- 60.Kohl J et al. Nature 556, 326–331 (2018). [DOI] [PMC free article] [PubMed] [Google Scholar]
- 61.Dulac C, O’Connell LA, Wu Z. Science 345, 765–70 (2014). [DOI] [PMC free article] [PubMed] [Google Scholar]
- 62.Campbell Teskey G, Kavaliers M. Pharmacol. Biochem. Behav 31, 43–52 (1988). [DOI] [PubMed] [Google Scholar]
- 63.Fang Y-Y, Yamaguchi T, Song SC, Tritsch NX, Lin D. Neuron 98, 192–207.e10 (2018). [DOI] [PMC free article] [PubMed] [Google Scholar]
- 64.Wei Y-C et al. Nat. Commun 9, 279 (2018). [DOI] [PMC free article] [PubMed] [Google Scholar]
- 65.Arber S. Neuron 74, 975–989 (2012). [DOI] [PubMed] [Google Scholar]
- 66.Paul A et al. Cell 171, 522–539.e20 (2017). [DOI] [PMC free article] [PubMed] [Google Scholar]
- 67.Li H et al. Cell 171, 1206–1220.e22 (2017). [DOI] [PMC free article] [PubMed] [Google Scholar]
- 68.Chen R, Wu X, Jiang L, Zhang Y. Cell Rep 18, 3227–3241 (2017). [DOI] [PMC free article] [PubMed] [Google Scholar]
- 69.Zeisel A et al. Cell 174, 999–1014.e22 (2018). [DOI] [PMC free article] [PubMed] [Google Scholar]
- 70.Campbell JN et al. Nat. Neurosci 20, 484–496 (2017). [DOI] [PMC free article] [PubMed] [Google Scholar]
- 71.Blackshaw S et al. J. Neurosci 30, 14925–14930 (2010). [DOI] [PMC free article] [PubMed] [Google Scholar]
- 72.Kimchi T, Xu J, Dulac C. Nature 448, 1009–1014 (2007). [DOI] [PubMed] [Google Scholar]
- 73.Pandey S, Shekhar K, Regev A, Schier AF. Curr. Biol 28, 1052–1065.e7 (2018). [DOI] [PMC free article] [PubMed] [Google Scholar]
- 74.Stowers L, Holy TE, Meister M, Dulac C, Koentges G. Science 295, 1493–1500 (2002). [DOI] [PubMed] [Google Scholar]
- 75.Finak G et al. Genome Biol 16, 1–13 (2015).25583448 [Google Scholar]
- 76.Horii-Hayashi N, Sasagawa T, Matsunaga W, Nishi M. Neural Plast 2015, 1–12 (2015). [DOI] [PMC free article] [PubMed] [Google Scholar]
- 77.Ilicic T et al. Genome Biol 17, 1–15 (2016). [DOI] [PMC free article] [PubMed] [Google Scholar]
- 78.Van Den Brink SC et al. Nat. Methods 14, 935–936 (2017). [DOI] [PubMed] [Google Scholar]
- 79.Buettner F et al. Nat. Biotechnol 33, 155–160 (2015). [DOI] [PubMed] [Google Scholar]
- 80.van der Maaten L. J. Mach. Learn. Res 15, 3221–3245 (2014). [Google Scholar]
- 81.Subramanian A et al. Proc. Natl. Acad. Sci 102, 15545–15550 (2005). [DOI] [PMC free article] [PubMed] [Google Scholar]
- 82.Perez JD et al. Elife 4, 41 (2015). [Google Scholar]
- 83.Wang G, Moffitt JR, Zhuang X. Sci. Rep 8, 1–13 (2018). [DOI] [PMC free article] [PubMed] [Google Scholar]
- 84.Rasnik I, McKinney SA, Ha T. Nat. Methods 3, 891–3 (2006). [DOI] [PubMed] [Google Scholar]
- 85.Aitken CE, Marshall RA, Puglisi JD. Biophys. J 94, 1826–35 (2008). [DOI] [PMC free article] [PubMed] [Google Scholar]
- 86.Wu TJ, Gibson MJ, Rogers MC, Silverman AJ. J. Neurobiol 33, 983–98 (1997). [DOI] [PubMed] [Google Scholar]
- 87.Gottsch ML et al. Endocrinology 145, 4073–4077 (2004). [DOI] [PubMed] [Google Scholar]
- 88.Maclusky NJ, Naftolin F. Science 211, 1294–1303 (1981). [DOI] [PubMed] [Google Scholar]
- 89.Lenz KM, Nugent BM, Haliyur R, McCarthy MM. J. Neurosci 33, 2761–72 (2013). [DOI] [PMC free article] [PubMed] [Google Scholar]
- 90.Juntti SA et al. Neuron 66, 260–72 (2010). [DOI] [PMC free article] [PubMed] [Google Scholar]
- 91.Sherin JE, Elmquist JK, Torrealba F, Saper CB. J. Neurosci 18, 4705–21 (1998). [DOI] [PMC free article] [PubMed] [Google Scholar]
- 92.McHenry JA et al. Nat. Neurosci 20, 449–458 (2017). [DOI] [PMC free article] [PubMed] [Google Scholar]
- 93.Hellier V et al. Nat. Commun 9, 400 (2018). [DOI] [PMC free article] [PubMed] [Google Scholar]
- 94.Park S-G et al. Nat. Neurosci 21, 364–372 (2018). [DOI] [PubMed] [Google Scholar]
- 95.Jennings JH et al. Nature 496, 224–8 (2013). [DOI] [PMC free article] [PubMed] [Google Scholar]
- 96.Abbott SBG, Saper CB. J. Physiol 595, 6569–6583 (2017). [DOI] [PMC free article] [PubMed] [Google Scholar]
- 97.Augustine V et al. Nature 555, 204–209 (2018). [DOI] [PMC free article] [PubMed] [Google Scholar]
Associated Data
This section collects any data citations, data availability statements, or supplementary materials included in this article.