

Abstract
Background
The glycaemic index (GI) is a physiological measure of the ability of a carbohydrate to affect blood glucose. Interest is growing in this area for the clinical management of people at risk of, or with, established cardiovascular disease. There is a need to review the current evidence from randomised controlled trials (RCTs) in this area. This is an update of the original review published in 2008.
Objectives
To assess the effect of the dietary GI on total mortality, cardiovascular events, and cardiovascular risk factors (blood lipids, blood pressure) in healthy people or people who have established cardiovascular disease or related risk factors, using all eligible randomised controlled trials.
Search methods
We searched CENTRAL, MEDLINE, Embase and CINAHL in July 2016. We also checked reference lists of relevant articles. No language restrictions were applied.
Selection criteria
We selected RCTs that assessed the effects of low GI diets compared to diets with a similar composition but a higher GI on cardiovascular disease and related risk factors. Minimum trial duration was 12 weeks. Participants included were healthy adults or those at increased risk of cardiovascular disease, or previously diagnosed with cardiovascular disease. Studies in people with diabetes mellitus were excluded.
Data collection and analysis
Two reviewers independently screened and selected studies. Two review authors independently assessed risk of bias, evaluated the overall quality of the evidence using GRADE, and extracted data following the Cochrane Handbook for Systematic Reviews of Interventions. We contacted trial authors for additional information. Analyses were checked by a second reviewer. Continuous outcomes were synthesized using mean differences and adverse events were synthesized narratively.
Main results
Twenty‐one RCTs were included, with a total of 2538 participants randomised to low GI intervention (1288) or high GI (1250). All 21 included studies reported the effect of low GI diets on risk factors for cardiovascular disease, including blood lipids and blood pressure.
Twenty RCTs (18 of which were newly included in this version of the review) included primary prevention populations (healthy individuals or those at high risk of CVD, with mean age range from 19 to 69 years) and one RCT was in those diagnosed with pre‐existing CVD (a secondary prevention population, with mean age 26.9 years). Most of the studies did not have an intervention duration of longer than six months. Difference in GI intake between comparison groups varied widely from 0.6 to 42.
None of the included studies reported the effect of low GI dietary intake on cardiovascular mortality and cardiovascular events such as fatal and nonfatal myocardial infarction, unstable angina, coronary artery bypass graft surgery, percutaneous transluminal coronary angioplasty, and stroke. The unclear risk of bias of most of the included studies makes overall interpretation of the data difficult. Only two of the included studies (38 participants) reported on adverse effects and did not observe any harms (low‐quality evidence).
Authors' conclusions
There is currently no evidence available regarding the effect of low GI diets on cardiovascular disease events. Moreover, there is currently no convincing evidence that low GI diets have a clear beneficial effect on blood lipids or blood pressure parameters.
Plain language summary
Low glycaemic index diets for cardiovascular disease
Background
The glycaemic index (GI) is a measure of the ability of a carbohydrate (for example sugar or starch) to affect blood sugar levels.
Study characteristics
In this review update, we examined 21 randomised studies that assessed the effects of low GI diets compared to diets with a similar composition but a higher GI on cardiovascular disease events and levels of cholesterol in the blood or blood pressure (major risk factors for cardiovascular disease, such as heart attacks or stroke). Studies were included up to July 2016.
Results
Participants were adults with a mean age of between 19 and 69 years. In most studies, participants had cardiovascular risk factors such as overweight or obesity or abnormal blood fat levels, and one study included participants with existing heart disease. The diets were followed for at least 12 weeks but most studies had unclear of bias and some of the compared diets only had small differences in GI. Cardiovascular disease events were not reported and no evidence of differences in effects of the diets on blood cholesterol and blood pressure were seen. Most studies did not report harms but the two that did found no harmful effects of the diets, however the evidence was poor.
Conclusions
There was insufficient evidence from randomised controlled trials to recommend consumption of low GI diets for the purpose of improving blood lipids or blood pressure.
Summary of findings
Summary of findings 1. Low GI versus high GI for the primary prevention of cardiovascular disease.
| Low GI versus high GI for the primary prevention of cardiovascular disease | ||||||
|
Patient or population: Overweight or obese adults
Settings: Unclear and research centre
Intervention: Low GI Control: High GI | ||||||
| Outcomes | Illustrative comparative risks* (95% CI) | Relative effect (95% CI) | No of Participants (studies) | Quality of the evidence (GRADE) | Comments | |
| Assumed risk | Corresponding risk | |||||
| High GI | Low GI | |||||
| Total and cardiovascular mortality | See comment | See comment | See comment | See comment | See comment | No trials reported total and CVD mortality for the primary prevention of CVD |
| Fatal and nonfatal myocardial infarction | See comment | See comment | See comment | See comment | See comment | No trials reported fatal and nonfatal myocardial infarction for the primary prevention of CVD |
| Unstable angina | See comment | See comment | See comment | See comment | See comment | No trials reported unstable angina for the primary prevention of CVD |
| Coronary artery bypass graft surgery | See comment | See comment | See comment | See comment | See comment | No trials reported coronary artery bypass graft surgery for the primary prevention of CVD |
| Percutaneous transluminal coronary angioplasty | See comment | See comment | See comment | See comment | See comment | No trials reported percutaneous transluminal coronary angioplasty for the primary prevention of CVD |
| Stroke | See comment | See comment | See comment | See comment | See comment | No trials reported stroke for the primary prevention of CVD |
| Adverse events Measurement unclear Follow‐up: 6 months | No adverse events | No adverse events | ‐ | 38 (2 studies) | ⊕⊕⊝⊝ lowa | See Appendix 1 adverse events checklist for the primary prevention of CVD |
| *The basis for the assumed risk (e.g. the median control group risk across studies) is provided in footnotes. The corresponding risk (and its 95% confidence interval) is based on the assumed risk in the comparison group and the relative effect of the intervention (and its 95% CI). CI: Confidence interval; RR: Risk ratio; | ||||||
| GRADE Working Group grades of evidence High quality: Further research is very unlikely to change our confidence in the estimate of effect. Moderate quality: Further research is likely to have an important impact on our confidence in the estimate of effect and may change the estimate. Low quality: Further research is very likely to have an important impact on our confidence in the estimate of effect and is likely to change the estimate. Very low quality: We are very uncertain about the estimate. | ||||||
a Downgraded by one level because of serious risk of bias and one level for serious imprecision (see Appendix 1)
Summary of findings 2. Low GI versus high GI for the secondary prevention of cardiovascular disease.
| Low GI versus high GI for the secondary prevention of cardiovascular disease | ||||||
|
Patient or population: Adults with coronary heart disease
Settings: Clinical setting
Intervention: Low GI Control: Healthy eating advice | ||||||
| Outcomes | Illustrative comparative risks* (95% CI) | Relative effect (95% CI) | No of Participants (studies) | Quality of the evidence (GRADE) | Comments | |
| Assumed risk | Corresponding risk | |||||
| High GI | Low GI | |||||
| Total and cardiovascular mortality | See comment | See comment | See comment | See comment | See comment | The trial did not report total and CVD mortality for the secondary prevention of CVD |
| Fatal and nonfatal myocardial infarction | See comment | See comment | See comment | See comment | See comment | The trial did not report fatal and nonfatal myocardial infarction for the secondary prevention of CVD |
| Unstable angina | See comment | See comment | See comment | See comment | See comment | The trial did not report unstable angina for the secondary prevention of CVD |
| Coronary artery bypass graft surgery | See comment | See comment | See comment | See comment | See comment | The trial did not report coronary artery bypass graft surgery for the secondary prevention of CVD |
| Percutaneous transluminal coronary angioplasty | See comment | See comment | See comment | See comment | See comment | The trial did not report percutaneous transluminal coronary angioplasty for the secondary prevention of CVD |
| Stroke | See comment | See comment | See comment | See comment | See comment | The trial did not report stroke for the secondary prevention of CVD |
| Adverse events | See comment | See comment | See comment | See comment | See comment | The trial did not report adverse events for the secondary prevention of CVD |
| *The basis for the assumed risk (e.g. the median control group risk across studies) is provided in footnotes. The corresponding risk (and its 95% confidence interval) is based on the assumed risk in the comparison group and the relative effect of the intervention (and its 95% CI). CI: Confidence interval; RR: Risk ratio; | ||||||
| GRADE Working Group grades of evidence High quality: Further research is very unlikely to change our confidence in the estimate of effect. Moderate quality: Further research is likely to have an important impact on our confidence in the estimate of effect and may change the estimate. Low quality: Further research is very likely to have an important impact on our confidence in the estimate of effect and is likely to change the estimate. Very low quality: We are very uncertain about the estimate. | ||||||
Background
This was an update of the original review published in 2004 (Kelly 2004).
Description of the condition
Cardiovascular diseases (CVD) are a group of conditions that affect the heart and blood vessels and include coronary heart disease, cerebrovascular disease, and peripheral arterial disease (WHO 2013). One of the main mechanisms thought to cause CVD is atherosclerosis, where the arteries become clogged by atheromas or plaques (NHS 2012). CVD occurs when the arteries are completely blocked or when blood flow is restricted by a narrowed artery, limiting the amount of blood and oxygen delivered to organs or tissue (BHF 2014). Arteries may naturally become harder and narrower with age, although this process may be accelerated by such factors as a sedentary lifestyle, obesity, diet, diabetes, ethnicity, smoking, high cholesterol, and high blood pressure (NHS 2012). Another cause of CVD is unstable plaque rupturing. It is thought that unstable plaques activate an inflammatory response in the body that causes the structure of atherosclerotic plaque to weaken and rupture, leading to the formation of blood clots (Spagnoli 2007).
CVD is the number one cause of death and disability (WHO 2013) globally. Around 30% of total global deaths can be attributed to CVD (WHO 2013), and it is estimated to cause 17 million deaths per year (Bovet 2012). The World Health Organization (WHO) reports that by 2030, CVDs will account for almost 23.3 million deaths per year (WHO 2013). This burden is set to increase as a consequence of ageing populations and increasing levels of sedentary lifestyles, and obesity.
One key public health priority in the prevention of CVD is targeting modifiable risk factors. One such risk factor is diet, which plays a major role in the aetiology of many chronic conditions, including CVD. A number of dietary factors are thought to lower CVD risk, such as a low sodium intake (Aburto 2013), a low‐carbohydrate diet (Hu 2014), intake of whole grains (Ye 2012), and a high consumption of fruits and vegetables (Oude 2010). Such risk factors are important, not only because they have been linked to CVD development, but also because they can be modified, which makes them one of the main targets for interventions aimed at primary prevention and management of CVD.
Description of the intervention
An association between cardiovascular disease and dietary fat intake is well‐documented (e.g. Vafeiadou 2012) but the role of dietary carbohydrate in cardiovascular disease is not. There is increasing evidence from observational nonrandomised studies that the glycaemic index (GI) of dietary carbohydrates may be important in disease prevention and control (Brand‐Miller 2002; Frost 2000; Leeds 2002; Rizkalla 2002). A 2008 meta‐analysis of 37 prospective cohort studies (Barclay 2008) investigating the association between GI and chronic diseases (including diabetes, colorectal cancer, cardiovascular disease, and eye diseases) found a positive association between GI and chronic disease (relative risk for coronary heart disease 1.25, 95% CI 1.00 to 1.56; relative risk for all diseases combined 1.14, 95% CI 1.09 to 1.19). The World Health Organisation (WHO) recommended in 1997 that dietary carbohydrates be classified according to their GI and that the methodology for assessing the GI should be standardised (FAO/WHO 1997). In 2007, the WHO published a scientific update on carbohydrates in nutrition, where it was acknowledged that the GI can be a useful means to choose carbohydrate food, but that this should always be considered in the context of other nutritional indicators and should not be based solely on the basis of the GI (FAO/WHO 2007a; FAO/WHO 2007b).
The concept of GI was first proposed in 1981 (Jenkins 1981). The GI of a dietary carbohydrate is an assessment of its postprandial effect on blood glucose. The lower the GI, the smaller the effect of the carbohydrate on postprandial glucose levels. The GI classification is a standardised comparison of the 2‐hour postprandial glucose response to 50g of a carbohydrate with that of 50g of white bread or glucose, calculated from the area under the glucose response curve. The GI of white bread and of glucose is 100 and all other carbohydrate foods have a GI between 0 and 100. The GI of a carbohydrate depends on its rate of intestinal absorption, which can be influenced by its composition and ease of digestion (Frost 2000). Low GI carbohydrates have lower 2‐hour areas under the glucose curve than white bread.
Cooking and food preparation can modify the GI of foods. Highly processed convenience foods tend to have a high GI. Cooked pulse vegetables (legumes, e.g. lentils, peas, kidney beans) have a low GI as their cell walls are resistant to cooking. The intact cereal grains of rye and granary bread all have low GIs. However, when granary bread is processed to wholemeal bread, the grains are disrupted, resulting in a higher GI. Some examples of GI of common carbohydrate foods are given in Table 3 (Frost 2000).
1. Glycaemic index values for food types.
| Food type | Glycaemic index |
| White bread | 100 |
| Wholemeal bread | 100 |
| Weetabix | 100 |
| Cornflakes | 119 |
| Porridge | 87 |
| Baked beans | 69 |
| Digestive biscuits | 84 |
| Apple | 52 |
In 1995, the first international tables of GI of individual foods were published (Foster‐Powell 1995) and updated in 2002 (Foster‐Powell 2002) and 2008 (Atkinson 2008), and the methodology on their derivation has also been reported (Jenkins 1981; Wolever 1990). The GI of a mixed meal can be calculated from the different proportions of each of the carbohydrate‐containing foods and their individual GI values. For example, when bread and beans are mixed in equal quantities, the resulting glycaemic response is midway between that of bread alone and beans alone (Wolever 1985; Wolever 1986). The addition of fat to a mixed meal reduces the glycaemic response (Bornet 1987; Coulston 1987; Wolever 1988), but the relative response of one carbohydrate to another remains.
Another measure often used is the glycaemic load which puts the GI in relation to the total amount of carbohydrate actually consumed. The glycaemic load of a food is calculated as the carbohydrate content (g) multiplied by the GI value of the food and divided by 100 (Ebbeling 2003). So for example, a watermelon is a high GI food but has a low glycaemic load for the amount typically consumed.
How the intervention might work
Lower GI foods cause lower peaks and fewer fluctuations in postprandial blood glucose levels than foods with high GI values. Increases in fasting and postprandial glucose concentrations promote oxidative stress, inflammation and endothelial dysfunction thereby predisposing to cardiovascular disease and type 2 diabetes (Blaak 2012). Type 2 diabetes is also associated with increased cardiovascular risk and there is a suggestion that low GI foods may play a role in the prevention of type 2 diabetes and also improve the blood glucose control in people with type 2 diabetes (Du 2006).
Abnormal levels of serum lipids also represent a risk factor for cardiovascular disease and two cross‐sectional studies found a significant negative correlation between dietary GI and high density lipoprotein (HDL) cholesterol concentrations (Ford 2001; Frost 1999). Two systematic reviews also suggested that low glycaemic index diets can significantly lower total and low density lipoprotein (LDL) cholesterol levels (Fleming 2013; Goff 2013). Obesity is also a risk factor for cardiovascular disease. Diets based on low GI foods produced greater weight loss in overweight or obese populations than did diets based on high GI foods (Thomas 2007). One hypothesis is that low GI diets lead to increased satiety and decreased sensations of hunger, thus leading to a lower energy intake. However, results from studies were inconsistent. While some short‐term studies reported a reduction in satiety with low GI diets, this did not lead to a long term reduction in energy intake (Bornet 2007; Niwano 2009).
Why it is important to do this review
Three recent meta‐analyses summarised the effects of GI and glycaemic load on coronary heart disease or cardiovascular events or both (Dong 2012; Ma 2012; Mirrahimi 2012). The studies summarised between eight and 14 prospective cohort studies (large overlap between reviews) involving between 229,213 and 240,936 participants. Cohorts were followed for six to 25 years and the dietary GI and glycaemic load were largely assessed using food frequency questionnaires. GI and glycaemic load levels were divided into categories and cardiovascular events compared between the highest and the lowest categories. Mirrahimi 2012 reported dietary composition in their review of ten studies and both carbohydrate and fibre content tended to be higher in the higher glycaemic load categories. All three reviews agreed that the evidence showed that women in the highest GI and glycaemic load categories had a significantly higher risk of cardiovascular or coronary heart disease (or both) events than women in the lowest categories, but this effect was not shown for men. Dong 2012 also found that the unfavourable effects of high GI or glycaemic load may be more pronounced in overweight and obese participants.
As described, recent meta‐analyses examining GI and CVD events included only prospective cohort studies. There is evidence that high GI diets may contribute to a greater risk of CVD. There appears to be suggestive evidence of benefit of low GI diets on CVD risk factors (Augustin 2015); however, evidence has largely been from observational studies which may be prone to confounding and other biases. We undertook this systematic review to examine evidence on the effects of GI on CVD from randomised controlled trials. An update was necessary to include newly published relevant RCTs and to distinguish the review from other relevant Cochrane reviews.
Objectives
To assess the effect of the dietary GI on total mortality, cardiovascular events, and cardiovascular risk factors (blood lipids, blood pressure) in healthy people or people who have established cardiovascular disease or related risk factors, using all eligible randomised controlled trials.
Methods
Criteria for considering studies for this review
Types of studies
Randomised controlled studies (RCTs). Cross‐over trials were eligible but only the first half was used before cross‐over took place, treating it as a parallel group design. Minimum study duration was 12 weeks.
Types of participants
Free‐living adults (age ≥18 years) were eligible for inclusion if they were healthy, had established cardiovascular disease, or one or more of the following risk factors: abnormal blood lipid levels (high and low density lipoprotein (HDL, LDL) cholesterol, triglycerides and total cholesterol), raised blood pressure/hypertension, overweight (body mass index (BMI) > 25 kg/m2), or obesity (BMI > 30 kg/m2).
A separate Cochrane review is concerned with the effects of low GI diets in people with diabetes mellitus (Thomas 2009) and another Cochrane review has focused on low GI diets in overweight and obesity (Thomas 2007). Hence, we excluded studies in people with type 2 diabetes and studies which only focused on weight loss if they did not also measure other cardiovascular risk factors.
Types of interventions
Interventions were eligible if they were advice on diet or dietary carbohydrate or a prescribed diet. Diets with a lower GI had to be compared with a diet with a higher GI and the GI of the diets had to be reported. Compared diets had to have similar overall energy levels and levels of carbohydrate, fat, and protein. Studies manipulating any other components of the diet were included if this was similar for the low and high GI groups.
Types of outcome measures
Primary outcomes
Total and cardiovascular mortality
Cardiovascular events (e.g. fatal and nonfatal myocardial infarction, unstable angina, coronary artery bypass graft surgery, percutaneous transluminal coronary angioplasty, stroke)
Adverse events (e.g. bloating, nausea, weight gain, difficulty in eating out)
Secondary outcomes
Blood lipid levels (total cholesterol, HDL cholesterol, LDL cholesterol, triglycerides) (mmol/L)
Systolic and diastolic blood pressure (mmHg)
Quality of life (using validated instruments)
Attitudes to diets, satisfaction, appetite, satiety, or similar (as reported by the studies, using validated instruments)
Weight (Kg) and BMI (Kg/m2) were recorded as additional potentially effect‐modifying parameters. Studies had to report at least one of the outcomes of interest to be eligible for inclusion.
Search methods for identification of studies
Electronic searches
For this update, the searches from the previously published review (Kelly 2004) were updated (to adjust for the broadened inclusion criteria) and re‐run on 31 July 2016. Searches were conducted in the Cochrane Central Register of Controlled Trials (CENTRAL, Issue 7 of 12, 2016) in the Cochrane Library, MEDLINE (Ovid, 1946 to 31 July 2016) and Embase Classic and Embase (Ovid, 1947 to 30 July 2016) and CINAHL (EBSCO, 1937 to 31 July 2016).
See Appendix 2 for details of search strategies. The sensitivity‐maximising version of the Cochrane RCT filter (Lefebvre 2011) was applied to MEDLINE and adaptations of it to the other databases, except CENTRAL. No language restrictions were applied.
Searching other resources
The reference lists of all relevant studies were checked. Relevant published reviews were also sought as a source of RCTs. We contacted authors of potentially relevant publications for further studies.
Data collection and analysis
Selection of studies
The titles and abstracts of retrieved records were scanned independently by two reviewers (CC, NF, LH, SK, LA‐K) and were only rejected if the reviewer could determine that they definitely did not meet the inclusion criteria. Full texts were obtained for any that could not be rejected with certainty. Each paper was then assessed independently by two reviewers (CC, RG, SK, LA‐K). An in/out form was used to assess the inclusion (or otherwise) of full papers into the review. If a trial was excluded after the full paper has been obtained, a record of the study and reason for exclusion was recorded. Differences in selection of the final full text articles were resolved by discussion or by consulting a third reviewer (KR).
Data extraction and management
Original reports of trial results were extracted by one reviewer (CC, EL, LA‐K) and checked by a second reviewer (KR, EL, SK).
Data were extracted as follows and are reported in the characteristics of included studies table:
General information: published/unpublished, title, authors, source, country, year of publication, trial dates, additional publications;
Trial characteristics: design, setting, duration, randomisation (and method), allocation concealment (and method), blinding (outcome assessors), check of blinding, funding/conflict of interest;
Participants: inclusion criteria, exclusion criteria, total number and number in comparison groups, sex/age, ethnicity, BMI, lipid levels, blood pressure, similarity of groups at baseline, withdrawals/losses to follow‐up, assessment of adherence, medications used, smoking status, when provided;
Intervention: dietary information/diet provided, length of intervention, comparison interventions, macronutrient composition of diets and GI;
Outcomes: outcomes as specified above, the main outcome assessed in the study, other events, length of follow‐up;
Results: for outcomes and times of assessment.
Assessment of risk of bias in included studies
We assessed risk of bias according to the Cochrane Handbook (Higgins 2011). We categorised risk of bias as ’low’, ’unclear’ or ’high’. The risk of bias was assessed by one reviewer (CC, LA‐K) and checked by a second (EL, SK, KR).
Studies were not excluded on the basis of a high 'risk of bias' score. In particular, the following factors were examined:
Method of randomisation;
Allocation concealment;
Blinding of outcome assessment (detection bias);
Incomplete outcome data (attrition bias);
Intention‐to‐treat analysis;
Selective reporting (reporting bias);
Groups comparable at baseline;
Other (e.g. power analysis, analysis issues).
Measures of treatment effect
We processed data in accordance with the Cochrane Handbook for Systematic Reviews of Interventions (Higgins 2011). We expressed dichotomous outcomes as hazard ratios (HRs), with 95% confidence intervals (CIs). For continuous outcomes, we compared net changes (i.e. intervention group minus control group differences) and calculated a mean difference (MD) and standard deviation difference for each study.
Where necessary, we imputed standard deviation differences from baseline to follow‐up, as these data were not available in the papers. To do this, we followed the guidelines in the Cochrane Handbook of obtaining standard deviations from standard errors (Higgins 2011, chapter 7.3.3) and we used a correlation coefficient of 0.5 in these calculations, as recommended by Follman (Follman 1992). We included studies reporting multiple comparison groups in this review. In studies that found a difference between groups, we used the data for the control group for each intervention group comparison and reduced the weight assigned to the control group by dividing the number of participants in the control group by the number of intervention groups (Higgins 2011, chapter 7.7.3).
Three studies reported results as medians and interquartile range (Philippou 2008; RISCK 2010 high MUFA; RISCK 2010 low fat, Juanola‐Falgarona 2014) ‐ these data could not be converted to means and standard deviations and could therefore not be included in the meta‐analyses, but were included in the narrative summary of the results.
We included cluster‐randomised trials in this review by using the unit of randomisation (cluster) as the number of observations. Where necessary, we utilised individual level means and standard deviations adjusted for clustering together with the number of clusters in the denominator, in order to weight the trials appropriately.
We entered data presented as a scale with a consistent direction of effect, with the exception of HDL cholesterol where an increase in this outcome was a positive finding.
Assessment of heterogeneity
For each outcome, we conducted tests of heterogeneity using the Chi2 test of heterogeneity and the I2 statistic. Where there was no heterogeneity, we performed a fixed‐effect meta‐analysis. If substantial heterogeneity was detected (I2 = 50% or greater), we looked for possible explanations for this (e.g. difference in GI between study groups, study duration, weight loss versus weight maintenance interventions) and used a random‐effects model with appropriate cautious interpretation.
Data synthesis
We carried out statistical analysis using Cochrane’s statistical software, Review Manager 2014. We entered continuous data as the change in means and standard deviations from baseline to follow‐up measurements.
Studies in primary prevention populations (healthy individuals or those at high risk of CVD) or secondary prevention populations (defined as those with a pre‐existing diagnosis of CVD) were analysed separately.
Data were pooled using a fixed‐effect model and the results for the longest follow‐up. Data were pooled for the studies categorised as primary prevention. Only one study in a secondary prevention population was included and this was reported in the narrative synthesis only.
Studies reported results either as absolute values at the endpoint or as change from baseline. For the pooled analysis, change from baseline values were reported. Where papers did not report results as change from baseline, we calculated this and for the standard deviation differences, we followed the methods presented in the Cochrane Handbook for Systematic Reviews of Interventions for imputing these (16.1.3.2 Imputing standard deviations for changes from baseline Higgins 2011), and assumed a correlation of 0.5 between baseline and follow‐up measures, as suggested by Follman (Follman 1992).
Quality of evidence
We presented the overall quality of the evidence for each primary outcome (Table 1; Table 2) according to the Grading of Recommendations Assessment, Development and Evaluation (GRADE) approach, which takes into account issues not only related to internal validity (risk of bias, inconsistency, imprecision, publication bias) but also to external validity such as directness of results. Two review authors (LA, KR) rated the quality for each outcome. We presented summaries of the evidence in 'Summary of findings' tables, which provide key information about the best estimate of the magnitude of the effect, in relative terms for each relevant comparison of alternative management strategies, numbers of participants and trials addressing each important outcome, and the rating of the overall confidence in effect estimates for each outcome. We created the 'Summary of findings' tables based on the methods described in the Cochrane Handbook for Systematic Reviews of Interventions (Higgins 2011). We presented results on the outcomes as described in Types of outcome measures.
In addition, we established an appendix 'Checklist to aid consistency and reproducibility of GRADE assessments' (Meader 2014) to help with standardisation of 'Summary of findings' tables (Appendix 1).
Results
Description of studies
Results of the search
The study flow is shown in Figure 1. The searches resulted in the identification of 18614 potentially relevant records. 18036 of these were excluded based on titles and abstracts as clearly not relevant and 578 full text articles were assessed for eligibility. Twelve additional records were identified through screening reference lists of systematic reviews, other potentially relevant articles and contacting authors; of these, nine studies were excluded and three were included. In total, five studies are awaiting classification, one study is ongoing and 21 studies were included in the analysis of this review. Three of these had been included in the previous version of this review (Frost 2004; Raatz 2005; Wolever 2002); the other RCTs included in the previous version of the review no longer fulfilled the updated inclusion criteria. Nineteen studies could be included in the meta‐analysis. Four studies included four eligible comparison groups (DiOGenes 2011a high protein; DiOGenes 2011 low protein; Ghani 2014a high insulin; Ghani 2014 low insulin; McMillan‐Price 2006 high CHO; McMillan‐Price 2006 high protein; RISCK 2010 high MUFA; RISCK 2010 low fat) with different cointerventions and therefore two independent comparisons per study could be included in the analysis. However, the RISCK study (RISCK 2010 high MUFA; RISCK 2010 low fat) only reported medians and interquartile range and could therefore not be included in the pooled analysis. The pooled analyses therefore included up to 17 comparisons.
1.

Ongoing: 1 study (3 records)
Awaiting classification: 5 studies (5 records)
Study flow diagram.
Included studies
Detailed study characteristics are shown in Characteristics of included studies.
Study design
All included studies were parallel group RCTs. Most used individual randomisation, while one randomised Weight Watchers classes (Bellisle 2007) and one randomised families (DiOGenes 2011a high protein; DiOGenes 2011 low protein). Most RCTs were single centre studies, while two were multicentre studies (DiOGenes 2011a high protein; DiOGenes 2011 low protein; RISCK 2010 high MUFA; RISCK 2010 low fat). One multicentre study was carried out in eight European countries; five came from the UK, four from the USA, and one each from Australia, New Zealand, Brazil, Canada, France, Italy, Germany, and Mexico. Nine studies had a duration of 12 weeks (Bellisle 2007; Buscemi 2013; Frost 2004; Juanola‐Falgarona 2014; McMillan‐Price 2006 high CHO; McMillan‐Price 2006 high protein; Melanson 2012; Philippou 2008; Shikany 2005; Solomon 2010), two of four months (Philippou 2009a; Wolever 2002), six of between 24 weeks and 6 months (Armendariz‐Anguiano 2011; DiOGenes 2011a high protein; DiOGenes 2011 low protein; Hönemann 2010; Juanola‐Falgarona 2014; Philippou 2009; RISCK 2010 high MUFA; RISCK 2010 low fat), one of 36 weeks (Raatz 2005), one of one year (Ghani 2014a high insulin; Ghani 2014 low insulin) and two of 18 months (Sichieri 2007; Venn 2010). Most of the studies did not report on postintervention follow‐up periods. One study mentioned a 12‐month weight maintenance phase after the main intervention, but results were not reported (Buscemi 2013). One study reported an extension up to one year in two of the eight centres taking part in the main six‐month study (DiOGenes 2011a high protein; DiOGenes 2011 low protein).
Types of participants
The included studies had a total of 2538 participants (n = 2233 included in meta‐analysis). Sample sizes ranged between 18 and 773, with more than half of the studies having fewer than 100 participants (median 60). Sample sizes per comparison group ranged from 6 to 159.
The inclusion criterion for over half of the studies was overweight or obesity, or both. Four studies included participants who were overweight or obese and had additional cardiovascular risk factors or the metabolic syndrome (Buscemi 2013; Ghani 2014a high insulin; Ghani 2014 low insulin; RISCK 2010 high MUFA; RISCK 2010 low fat; Solomon 2010). Two studies included participants with at least one recognised heart disease risk factor (Philippou 2008; Philippou 2009). One study included participants with hyperlipidaemia (Shikany 2005), and one included participants with impaired glucose tolerance (Wolever 2002). One study included participants with coronary heart disease (Frost 2004).
Where reported (15 studies), the mean age of participants was between 30 and 67 years. One study did not report on the sex of participants, four included only women, one only men, the rest included between 12% and 88.5% men.
At baseline, the mean BMI of participants ranged from 26.7 kg/m2 to 36.5 kg/m2 (reported by 19 studies). Mean total cholesterol was between 4.1 and 6.1 mmol/L and between 6.1 and 6.3 mmol/L in the study restricted to hyperlipidaemic participants (reported by 19 studies). Mean HDL cholesterol levels were between 1.1 and 1.9 mmol/L (reported by 20 studies) and mean LDL cholesterol levels between 2.4 and 4.4 mmol/L (reported by 19 studies). Mean systolic blood pressure was between 112 and 141 mmHg and mean diastolic blood pressure between 71 and 84 mmHg (reported by 13 studies). Medication use was not reported by twelve studies, participants in five studies used no medication for cardiovascular disorders (Bellisle 2007; McMillan‐Price 2006 high CHO; McMillan‐Price 2006 high protein; Melanson 2012; Philippou 2009), and four studies reported on medication use for cardiovascular disorders (Buscemi 2013; Frost 2004; RISCK 2010 high MUFA; RISCK 2010 low fat; Wolever 2002).
Types of interventions
Recommendations regarding high or low GI diets were generally based on standard tables or on specific high or low GI food groups. In some trials, relevant foods were provided to the participants (McMillan‐Price 2006 high CHO; McMillan‐Price 2006 high protein; Randolph 2014; RISCK 2010 high MUFA; RISCK 2010 low fat; Solomon 2010; Wolever 2002), and/or participants received prescribed diets or eating plans (Armendariz‐Anguiano 2011; Buscemi 2013; McMillan‐Price 2006 high CHO; McMillan‐Price 2006 high protein; Sichieri 2007), and/or menu lists and recipes (Armendariz‐Anguiano 2011; DiOGenes 2011a high protein; DiOGenes 2011 low protein; Juanola‐Falgarona 2014; Melanson 2012; Raatz 2005; Shikany 2005; Venn 2010). In one trial (Raatz 2005), a feeding phase with diet prepared by a metabolic kitchen (12 weeks) was followed by a 12 week phase where participants prepared their own meals. In the DiOGenes trial (DiOGenes 2011a high protein; DiOGenes 2011 low protein), a lab‐based shop system was used in two of eight centres. Trials also included written information (information booklets/instructions) (Bellisle 2007; Ghani 2014a high insulin; Ghani 2014 low insulin; Hönemann 2010; Juanola‐Falgarona 2014; Melanson 2012; Philippou 2009a; RISCK 2010 high MUFA; RISCK 2010 low fat; Shikany 2005; Venn 2010; Wolever 2002), dietary counselling or staff being available for questions (Armendariz‐Anguiano 2011; Buscemi 2013; Frost 2004; McMillan‐Price 2006 high CHO; McMillan‐Price 2006 high protein; Melanson 2012; Philippou 2008; Philippou 2009; Raatz 2005; Shikany 2005; Sichieri 2007; Solomon 2010; Venn 2010), cooking and behavioural advice (DiOGenes 2011a high protein; DiOGenes 2011 low protein), cooking classes (Venn 2010), reminders (Armendariz‐Anguiano 2011), and group instructions (Shikany 2005). Two trials were based on the Weight Watchers programme (Bellisle 2007; Melanson 2012). Several trials specifically based their recommendations on current healthy eating guidelines (Frost 2004; Philippou 2009a; Shikany 2005; Venn 2010), in one trial, a Mediterranean diet was followed (Buscemi 2013), one trial was based on a traditional Mexican diet (Armendariz‐Anguiano 2011), and one was based one a low GI diet of wholegrains and pulses (Venn 2010). Melanson 2012 compared a low GI diet with a portion control group (with similar nutritional composition) and a high carbohydrate diet was used in the trial by Wolever 2002.
In most trials, the diet was energy‐reduced in all participants (Armendariz‐Anguiano 2011; Bellisle 2007; Buscemi 2013; Ghani 2014a high insulin; Ghani 2014 low insulin; Juanola‐Falgarona 2014; McMillan‐Price 2006 high CHO; McMillan‐Price 2006 high protein; Philippou 2008; Philippou 2009; Raatz 2005; Randolph 2014; Sichieri 2007) or in participants with a BMI above a certain level (Frost 2004). Several trials did not specifically report that the diet was energy‐reduced, but the energy content of the actual intervention diets consumed was lower than the energy content of the baseline diets (Melanson 2012; Shikany 2005; Venn 2010). Other studies specifically used a weight‐maintenance diet (DiOGenes 2011a high protein; DiOGenes 2011 low protein; Philippou 2009a; RISCK 2010 high MUFA; RISCK 2010 low fat; Solomon 2010; Wolever 2002).
Two studies included a weight loss phase before randomisation and randomisation was based on a defined level of weight loss during that phase (DiOGenes 2011a high protein; DiOGenes 2011 low protein; Philippou 2009a). Of the trials with multiple dietary interventions, the DiOGenes trial (DiOGenes 2011a high protein; DiOGenes 2011 low protein) compared high and low GI groups receiving concomitant high or low protein diets, and other trials compared high and low GI diets in the context of high carbohydrate and low protein diets (McMillan‐Price 2006 high CHO; McMillan‐Price 2006 high protein), or low fat and high monounsaturated fatty acid diets (RISCK 2010 high MUFA; RISCK 2010 low fat).
One trial included exercise sessions (Solomon 2010) and others recommended increased physical activity (Bellisle 2007; Philippou 2009a; Venn 2010; RISCK 2010 high MUFA; RISCK 2010 low fat). Dietary adherence was generally checked using food records or food diaries (e.g. 3‐day food records) (Armendariz‐Anguiano 2011; Buscemi 2013; DiOGenes 2011a high protein; DiOGenes 2011 low protein; Frost 2004; Ghani 2014a high insulin; Ghani 2014 low insulin; Juanola‐Falgarona 2014; McMillan‐Price 2006 high CHO; McMillan‐Price 2006 high protein; Melanson 2012; Philippou 2008; Philippou 2009; Raatz 2005; Randolph 2014; RISCK 2010 high MUFA; RISCK 2010 low fat; Shikany 2005; Venn 2010; Wolever 2002); some trials used food choice checklists (Bellisle 2007), a computer‐based check of consumption (Hönemann 2010), or food‐container weigh‐backs (Solomon 2010).
Where reported (20 studies, see Analysis 1.1), daily energy intake of the intervention diets varied widely between 5335 and 14,000 kJ per day. Despite aiming for a similar energy content of diets, the low GI diet in the trial by Frost 2004 had a significantly higher energy content than the high GI diet (8506 (SE 473) kJ/day versus 7360 (SE 331) kJ/day, P = 0.04). Carbohydrate content of diets varied between 143 g and 258 g per day (7 studies) or 40% and 62% of energy (15 studies), fat content between 32 g and 73 g per day (7 studies) or 19% and 39.6% of energy (15 studies), protein content between 57 g and 95 g per day (7 studies) or 15% and 28% of energy (13 studies), and fibre content between 8 g and 44.5 g per day (14 studies).
1.1. Analysis.

Comparison 1: Low GI versus control (primary prevention), Outcome 1: Total cholesterol (mmol/L) change
GI was clearly reported for 19 studies (see Analysis 1.1). Mean GI ranged between 30 and 71 in the low GI groups (mean 49) and between 47 and 81 in the high GI groups (mean 63). The GI difference between groups varied widely between 0.6 and 42 (mean 13.5).
Types of outcomes
None of the studies reported on mortality (total or cardiovascular) or cardiovascular events. All studies reported weight, BMI, or both. Most studies reported on blood lipids (total cholesterol, HDL cholesterol, LDL cholesterol, triglycerides). A range of studies reported systolic and diastolic blood pressure (Bellisle 2007; Buscemi 2013; DiOGenes 2011a high protein; DiOGenes 2011 low protein; Frost 2004; Hönemann 2010; Melanson 2012; Philippou 2009; Randolph 2014; RISCK 2010 high MUFA; RISCK 2010 low fat; Solomon 2010; Venn 2010). Only a small number of studies reported on adverse events (Armendariz‐Anguiano 2011; Raatz 2005), satisfaction (Bellisle 2007; DiOGenes 2011a high protein; DiOGenes 2011 low protein), hunger/satiety (Bellisle 2007; Juanola‐Falgarona 2014; Melanson 2012; Philippou 2009a; Sichieri 2007), or appetite/desire to eat (Bellisle 2007; Philippou 2009a).
Most studies also reported on variables related to blood glucose values and insulin sensitivity (Armendariz‐Anguiano 2011; Bellisle 2007; Frost 2004; Ghani 2014a high insulin; Ghani 2014 low insulin; Hönemann 2010; Juanola‐Falgarona 2014; McMillan‐Price 2006 high CHO; McMillan‐Price 2006 high protein; Melanson 2012; Philippou 2008; Philippou 2009; Philippou 2009a; Raatz 2005; Randolph 2014; RISCK 2010 high MUFA; RISCK 2010 low fat; Shikany 2005; Solomon 2010; Venn 2010; Wolever 2002), but these outcomes are not reported here. Buscemi 2013 also reported flow‐mediated dilatation and carotid intima thickness.
Funding
Nine studies reported noncommercial funding (Ghani 2014a high insulin; Ghani 2014 low insulin; Hönemann 2010; Juanola‐Falgarona 2014; Philippou 2009; Raatz 2005; Shikany 2005; Sichieri 2007; Solomon 2010; Venn 2010). Four studies had both noncommercial and commercial funding (the latter partially for sponsoring of food products)(DiOGenes 2011a high protein; DiOGenes 2011 low protein; RISCK 2010 high MUFA; RISCK 2010 low fat; Wolever 2002; McMillan‐Price 2006 high CHO; McMillan‐Price 2006 high protein). One study was sponsored by Weight Watchers International (Bellisle 2007), one study reported that a slimming product used in the weight loss phase was provided by the manufacturer (Philippou 2009a) and one study was funded by the United States Potato Board (Randolph 2014). Four studies did not report the source of funding (Armendariz‐Anguiano 2011; Frost 2004; Melanson 2012; Philippou 2008) and one reported that there was no specific funding (Buscemi 2013).
Excluded studies
Reasons for study exclusion (Figure 1) included: the study was not an RCT, study duration was less than 12 weeks, not relevant intervention, not relevant participants (participants with diabetes or of children or adolescents), or the study reported no eligible outcomes. The Characteristics of excluded studies table includes both excluded studies from this version of the review and of the previous version of this review.
Ongoing studies
The PREVIEW study (Brand‐Miller 2013) is an ongoing 3‐year RCT that includes 2500 adults and children who are overweight (BMI ≥ 25.0 kg/m2) and prediabetic. The study compares high‐protein, low‐glycaemic index diet to a high‐carbohydrate, medium‐glycaemic index diet in combination with moderate or high intensity physical activity on the incidence of type 2 diabetes and CVD outcomes. There was insufficient information about the intervention and study completion is in 2018 (Characteristics of ongoing studies).
Studies awaiting classification
Five studies are awaiting classification (Characteristics of studies awaiting classification). Three studies did not clearly report if CVD outcomes were collected (Boyadjieva 2015; Giroux 2015; Karl 2015), and the diet composition was not clear in one study (Cayanan 2015). The authors of the three studies were contacted for further details but the authors did not respond (Studies awaiting classification). The library could not track down one study (Weinhold 2015).
Risk of bias in included studies
Risk of bias was generally unclear (see Figure 2 and Figure 3). Three studies were at high risk of bias for at least three domains (Armendariz‐Anguiano 2011; Hönemann 2010; Raatz 2005) while eight studies were at low risk of bias for at least three domains (DiOGenes 2011a high protein; DiOGenes 2011 low protein; Ghani 2014a high insulin; Ghani 2014 low insulin; Juanola‐Falgarona 2014; McMillan‐Price 2006 high CHO; McMillan‐Price 2006 high protein; Randolph 2014; RISCK 2010 high MUFA; RISCK 2010 low fat; Sichieri 2007; Venn 2010).
2.
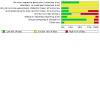
Risk of bias graph: review authors' judgements about each risk of bias item presented as percentages across all included studies.
3.
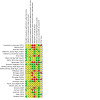
Risk of bias summary: review authors' judgements about each risk of bias item for each included study.
Allocation
Nine of 21 studies reported an adequate method of randomisation (Buscemi 2013; DiOGenes 2011a high protein; DiOGenes 2011 low protein; Frost 2004; Ghani 2014a high insulin; Ghani 2014 low insulin; Juanola‐Falgarona 2014; Randolph 2014; RISCK 2010 high MUFA; RISCK 2010 low fat; Sichieri 2007; Wolever 2002), while none of the studies clearly reported allocation concealment.
Blinding
Adequate blinding of outcome assessment was only reported by four of the 21 trials (Buscemi 2013; Ghani 2014a high insulin; Ghani 2014 low insulin; Juanola‐Falgarona 2014; Randolph 2014) and were at low risk of bias. The other trials did not report whether outcome assessment was blinded.
Incomplete outcome data
Many studies had high levels of dropouts or losses to follow‐up (reported by 19 studies). The attrition rate ranged between 0 and 41.5% (mean 23.8%) in the low GI groups and between 0 and 70.4% (mean 26.6%) in the high GI groups.
Five trials reported an intention‐to‐treat analysis (low risk of bias: DiOGenes 2011a high protein; DiOGenes 2011 low protein; McMillan‐Price 2006 high CHO; McMillan‐Price 2006 high protein; Juanola‐Falgarona 2014; Sichieri 2007; Venn 2010), while 12 trials clearly included only participants completing the trial in the analysis (high risk of bias: Armendariz‐Anguiano 2011; Bellisle 2007; Buscemi 2013; Frost 2004; Hönemann 2010; Melanson 2012; Philippou 2009a; Raatz 2005; Randolph 2014; Shikany 2005; Solomon 2010; Wolever 2002).
Selective reporting
In the study by Raatz 2005, there was only very limited reporting of outcomes for the second phase of their trial (i.e. the phase where participants prepared their own meals, after the initial phase where food was obtained from a metabolic kitchen). The study by Juanola‐Falgarona 2014 did not report postintervention blood pressure parameters. Most other studies appeared to report all outcomes as intended, however, not enough information was available to check (protocols were not available) and these have been judged as at unclear risk of bias.
Other potential sources of bias
Comparability at baseline
Differences at baseline are indicative of selection bias. In most trials, comparison groups were similar at baseline, although in a number of studies, baseline characteristics were reported only for participants that completed the study. In the study by Frost 2004, significantly fewer participants took a statin or aspirin in the low GI group than in the high GI group. In the study by Hönemann 2010, triglycerides were significantly lower at baseline in the low GI group than in the control group. Melanson 2012 reported a significantly higher level of triglycerides, a significantly lower fibre intake and significantly lower blood glucose in the low GI group compared to the portion control group at baseline. Philippou 2009a did not report age or sex and the RISCK (RISCK 2010 high MUFA; RISCK 2010 low fat) trial only reported baseline data for men versus women, but not for the different comparison groups. Raatz 2005 reported that baseline characteristics between comparison groups were similar, but only limited data were shown.
Power analysis
Seven studies reported a power analysis and the study was adequately powered (Bellisle 2007; Buscemi 2013; Ghani 2014a high insulin; Ghani 2014 low insulin; Hönemann 2010; Randolph 2014; RISCK 2010 high MUFA; RISCK 2010 low fat; Venn 2010). However, some of these studies did not base their power analyses on outcomes relevant for the present review, so it was unclear if they were adequately powered for measuring these outcomes (Buscemi 2013; Ghani 2014a high insulin; Ghani 2014 low insulin; Randolph 2014; RISCK 2010 high MUFA; RISCK 2010 low fat).
Six studies reported a power analysis but the study was underpowered ‐ this was partially due to an underestimation of dropouts (Armendariz‐Anguiano 2011; DiOGenes 2011a high protein; DiOGenes 2011 low protein; McMillan‐Price 2006 high CHO; McMillan‐Price 2006 high protein; Sichieri 2007; Venn 2010; Wolever 2002). Three studies reported a power analysis but it was unclear if the study was adequately powered (Frost 2004; Juanola‐Falgarona 2014; Melanson 2012). Six studies reported no power analysis (Philippou 2008; Philippou 2009; Philippou 2009a; Raatz 2005; Shikany 2005; Solomon 2010).
Other
The study by Bellisle 2007 was cluster randomised but this does not appear to have been taken account of in the analysis.
Effects of interventions
Results are reported separately for primary prevention studies and the secondary prevention study.
Primary outcomes
Total and cardiovascular mortality:
None of the included studies reported on total cardiovascular mortality.
Cardiovascular disease events ‐ fatal and nonfatal myocardial infarction:
None of the included studies reported on fatal and nonfatal myocardial infarction.
Cardiovascular disease events ‐ unstable angina:
None of the included studies reported on unstable angina.
Cardiovascular disease events ‐ coronary artery bypass graft surgery:
None of the included studies reported on coronary artery bypass graft surgery.
Cardiovascular disease events ‐ percutaneous transluminal coronary angioplasty:
None of the included studies reported on percutaneous transluminal coronary angioplasty.
Cardiovascular disease events ‐ stroke:
None of the included studies reported on stroke.
Adverse events
Two trials reported adverse effects (Armendariz‐Anguiano 2011; Raatz 2005), low‐quality evidence (Table 1). In one study (Armendariz‐Anguiano 2011) no side effects were observed with the diets (0/24). In another study (Raatz 2005) no participant withdrew due to side effects or health complications (0/14). The remaining trials did not report on adverse events.
Secondary outcomes
Blood lipids
Primary Prevention Studies
Pooled summaries for the effects of low GI diets on blood lipids are shown in Analysis 1.1 to Analysis 1.4. Studies in the analyses are sorted by magnitude of GI difference between study groups, with the study with the largest GI difference listed first and the studies with an unclearly reported GI difference listed last.
1.4. Analysis.

Comparison 1: Low GI versus control (primary prevention), Outcome 4: Triglycerides (mmol/L) change
Total cholesterol
Seventeen studies reported total cholesterol and 14 of these could be summarised in a meta‐analysis (17 comparisons). Including all studies reporting this outcome, the change in total cholesterol from baseline to study end varied between ‐0.80 and +1.5 mmol/L in the low GI groups and between ‐0.67 and +1.5 mmol/L in the control groups.
The pooled analysis showed no evidence for a difference between comparison groups (mean difference (MD) ‐0.12 mmol/L, 95% CI ‐0.26 to 0.02, P = 0.10, 1277 participants, 14 studies, 17 comparisons, Analysis 1.1). However, there was substantial heterogeneity (I2 = 61%), but no evidence for an effect of the magnitude of the difference in GI between comparison diets, of study duration or of weight loss versus weight maintenance studies could be seen.
Of the trials that could not be included in the pooled analysis, the RISCK trial (RISCK 2010 high MUFA; RISCK 2010 low fat) did not show evidence for a difference in total cholesterol between the low and high GI groups after 24 weeks of intervention. Similarly, there was no evidence for a difference in total cholesterol between the low and high GI groups after 12 weeks of intervention in the trial by Philippou 2008, after 4 months in the trial by Wolever 2002, and after one year in a subgroup of participants of the DiOGenes trial (DiOGenes 2011a high protein; DiOGenes 2011 low protein). Melanson 2012 reported a significant reduction in total cholesterol in all comparison groups over 12 weeks (P < 0.001), but there was no evidence for a difference between groups, and numeric values were not reported.
HDL cholesterol
Seventeen studies reported HDL cholesterol and 14 of these could be summarised in a meta‐analysis (17 comparisons). Including all studies reporting this outcome, the change in HDL cholesterol from baseline to study end varied between ‐0.6 and +0.4 mmol/L in the low GI groups and between ‐0.7 and +0.6 mmol/L in the control groups.
The pooled analysis showed no evidence for a difference between comparison groups (MD ‐0.00 mmol/L, 95% CI ‐0.03 to 0.02, P = 0.69, 1329 participants, 14 studies, 17 comparisons, Analysis 1.2). No evidence for an effect of the magnitude of the difference in GI between comparison diets, of study duration or of weight loss versus weight maintenance studies could be seen. There was no substantial heterogeneity (I2= 0%).
1.2. Analysis.

Comparison 1: Low GI versus control (primary prevention), Outcome 2: HDL Cholesterol (mmol/L) change
Of the trials that could not be included in the pooled analysis, the RISCK trial (RISCK 2010 high MUFA; RISCK 2010 low fat) did not show evidence of a difference in HDL cholesterol between the low and high GI groups after 24 weeks of intervention. Similarly, there was no evidence of a difference in HDL cholesterol between the low and high GI groups after 12 weeks of intervention in the trial by Philippou 2008, after 4 months in the trial by Wolever 2002, and after one year in a subgroup of participants of the DiOGenes trial (DiOGenes 2011a high protein; DiOGenes 2011 low protein). Melanson 2012 reported a significant overall reduction in HDL cholesterol over 12 weeks (P < 0.001), but there was no evidence of a difference between groups, and numeric values were not reported.
LDL cholesterol.
Seventeen studies reported LDL cholesterol and 14 of these could be summarised in a meta‐analysis (17 comparisons). Including all studies reporting this outcome, the change in LDL cholesterol from baseline to study end varied between ‐0.45 and +0.5 mmol/L in the low GI groups and between ‐0.44 and +0.52 mmol/L in the control groups.
The pooled analysis showed no evidence for a difference between comparison groups (MD ‐0.03 mmol/L, 95% CI ‐0.10 to 0.04, P = 0.46, 1274 participants, 14 studies, 17 comparisons, Analysis 1.3). No evidence of an effect of the magnitude of the difference in GI between comparison diets, of study duration or of weight loss versus weight maintenance studies could be seen. There was no substantial heterogeneity (I2= 4%).
1.3. Analysis.

Comparison 1: Low GI versus control (primary prevention), Outcome 3: LDL cholesterol (mmol/L) change
Of the trials that could not be included in the pooled analysis, the RISCK trial (RISCK 2010 high MUFA; RISCK 2010 low fat) did not find a significant difference in LDL cholesterol between the low and high GI groups after 24 weeks of intervention. Similarly, there was no significant difference in LDL cholesterol between the low and high GI groups after 12 weeks of intervention in the trial by Philippou 2008, after 4 months in the trial by Wolever 2002, and after one year in a subgroup of participants of the DiOGenes trial (DiOGenes 2011a high protein; DiOGenes 2011 low protein). Melanson 2012 reported a significant reduction in LDL cholesterol in all comparison groups after 12 weeks (P < 0.001), but no significant difference between groups, and numeric values were not reported.
Triglycerides
Seventeen studies reported triglyceride levels and 13 of these could be summarised in a meta‐analysis (16 comparisons). Including all studies reporting this outcome, the change in triglycerides from baseline to study end varied between ‐0.61 and +0.28 mmol/L in the low GI groups and between ‐2.34 and +0.36 mmol/L in the control groups.
The pooled analysis showed no evidence for a difference between comparison groups (MD 0.03 mmol/L, 95% CI ‐0.03 to 0.09, P = 0.32, 1252 participants, 13 studies, 16 comparisons, Analysis 1.4). No effect of the magnitude of the difference in GI between comparison diets, of study duration or of weight loss versus weight maintenance studies could be seen. There was no substantial heterogeneity (I2 = 9%).
Of the trials that could not be included in the pooled analysis, the RISCK trial (RISCK 2010 high MUFA; RISCK 2010 low fat) did not show evidence of a difference in triglycerides between the low and high GI groups after 24 weeks of intervention. Similarly, there was no evidence of a difference in triglycerides between the low and high GI groups after 12 weeks of intervention in the trial by Philippou 2008, after 4 months in the trial by Wolever 2002, and after one year in a subgroup of participants of the DiOGenes trial (DiOGenes 2011a high protein; DiOGenes 2011 low protein). One study (Juanola‐Falgarona 2014) reported change in triglyceride levels as median and interquartile range (IQR); there was a nonsignificant difference (P = 0.516) between low (median 0.27 mmol/L, 41 participants) and high GI groups (median ‐0.26 mmol/L, 40 participants) after six months.
Secondary Prevention study
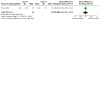
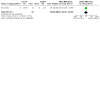
In the one study (Frost 2004) including participants with CHD, there were no evidence of differences seen between groups in the change from baseline values for total cholesterol (MD ‐0.10, 95% CI ‐0.59 to 0.39, 55 participants, 1 study, 1 comparison, Analysis 2.1); HDL cholesterol (MD ‐0.03 mmol/L, 95% CI ‐0.18 to 0.12, 55 participants, 1 study, 1 comparison, Analysis 2.2); LDL cholesterol (MD ‐0.06 mmol/L, 95% CI ‐0.47 to 0.35, 55 participants, 1 study, 1 comparison, Analysis 2.3); and triglycerides (MD ‐0.29 mmol/L, 95% CI ‐0.73 to 0.15, 55 participants, 1 study, 1 comparison, Analysis 2.4).
2.1. Analysis.

Comparison 2: Low GI versus control (secondary prevention), Outcome 1: Total cholesterol (mmol/L) change
2.2. Analysis.
Comparison 2: Low GI versus control (secondary prevention), Outcome 2: HDL Cholesterol (mmol/L) change
2.3. Analysis.

Comparison 2: Low GI versus control (secondary prevention), Outcome 3: LDL cholesterol (mmol/L) change
2.4. Analysis.

Comparison 2: Low GI versus control (secondary prevention), Outcome 4: Triglycerides (mmol/L) change
Blood pressure
Primary Prevention studies
Eleven studies reported blood pressure and nine of these could be summarised in a meta‐analysis (10 comparisons). Including all studies reporting this outcome, the change in systolic blood pressure from baseline to study end varied between ‐10 and +4.5 mmHg (mean ‐3.44 mmHg) in the low GI groups and between ‐14 and +5.1 mmHg (mean ‐4.14 mmHg) in the control groups. The change in diastolic blood pressure from baseline to study end varied between ‐8 and +1.9 mmHg (mean ‐1.85 mmHg) in the low GI groups and between ‐8 and +3.6 mmHg (mean ‐2.37 mmHg) in the control groups.
The pooled analysis showed no evidence of a difference between comparison groups in systolic blood pressure (MD 0.52 mmHg, 95% CI ‐1.21 to 2.25, P = 0.55, 786 participants, 9 studies, 10 comparisons, Analysis 1.5) with no substantial heterogeneity (I2 = 7%). The pooled analysis showed no evidence of a difference between comparison groups in diastolic blood pressure (MD ‐0.23 mmHg, 95% CI ‐1.42 to 0.96, P = 0.71, 786 participants, 9 studies, 10 comparisons, Analysis 1.6) where there was moderate heterogeneity (I2 = 38%). No evidence of an effect of the magnitude of the difference in GI between comparison diets, of study duration or of weight loss versus weight maintenance studies could be seen.
1.5. Analysis.

Comparison 1: Low GI versus control (primary prevention), Outcome 5: Systolic blood pressure (mmHg) change
1.6. Analysis.

Comparison 1: Low GI versus control (primary prevention), Outcome 6: Diastolic blood pressure (mmHg) change
Of the trials that could not be included in the pooled analysis, the RISCK trial (RISCK 2010 high MUFA; RISCK 2010 low fat) did not show evidence of a difference in systolic or diastolic blood pressure between the low and high GI groups after 24 weeks of intervention. Similarly, there was no evidence of a difference in systolic or diastolic blood pressure between the low and high GI groups after one year in a subgroup of participants of the DiOGenes trial (DiOGenes 2011a high protein; DiOGenes 2011 low protein) and no evidence of a difference in diastolic blood pressure after four months of intervention in the trial by Wolever 2002.
Secondary Prevention study
In the one study (Frost 2004) including participants with CHD, there was no evidence of any differences seen between groups in systolic blood pressure (MD ‐2.00 mmHg, 95% CI ‐14.97 to 10.97, 55 participants, 1 study, 1 comparison, Analysis 2.5) and diastolic blood pressure (MD ‐4.00 mmHg, 95% CI ‐13.41 to 5.41, Analysis 2.6).
2.5. Analysis.
Comparison 2: Low GI versus control (secondary prevention), Outcome 5: Systolic blood pressure (mmHg) change
2.6. Analysis.

Comparison 2: Low GI versus control (secondary prevention), Outcome 6: Diastolic blood pressure (mmHg) change
Other secondary outcomes (health‐related quality of life, attitudes to diets, satisfaction)
None of the studies reported on health‐related quality of life. Two studies (Armendariz‐Anguiano 2011; Bellisle 2007) reported on behaviour change, both studies reported no difference between the intervention and control (see Analysis 1.7). In the study by Bellisle 2007, both the 12 week low GI and the control diet produced a similar increase in dietary restraint, and a similar decrease in disinhibition, hunger sensations, emotionality and externality. In the study by Armendariz‐Anguiano 2011, there was no no significant change in physical activity observed.
1.7. Analysis.
Comparison 1: Low GI versus control (primary prevention), Outcome 7: Behaviour change
| Behaviour change | |||
| Study | Low GI group | Control group | P |
| Armendariz‐Anguiano 2011 | diet as per menu plans | diet as per menu plans | NS |
| no significant change in physical activity observed | no significant change in physical activity observed | NS | |
| Bellisle 2007 | increase in dietary restraint; decrease in disinhibition, hunger sensations, emotionality, and externality | increase in dietary restraint; decrease in disinhibition, hunger sensations, emotionality and externality | NS |
Five studies (Bellisle 2007; Juanola‐Falgarona 2014; Melanson 2012; Philippou 2008; Sichieri 2007) reported on hunger/desire to eat parameters (see Analysis 1.8). In one study (Bellisle 2007) participants in the low GI group had significantly lower intensity of hunger (P < 0.001) and desire to eat than participants of the control group (P < 0.001). In one study (Juanola‐Falgarona 2014), the low GI group reported lower hunger sensation in comparison to the control. Philippou 2009a and Sichieri 2007 reported no evidence of a difference in hunger/fullness between the low GI and the control groups after the intervention (four, six and 18 months respectively).
1.8. Analysis.
Comparison 1: Low GI versus control (primary prevention), Outcome 8: Hunger/desire to eat
| Hunger/desire to eat | |||
| Study | Low GI group | Control group | P |
| Bellisle 2007 | Participants in the low GI group had significantly lower intensity of hunger and desire to eat than participants of the control group | < 0.0001 for both | |
| Juanola‐Falgarona 2014 | ‐ 4.13 (SE 0.46) hunger sensation | ‐ 2.52 (SE 0.45) hunger sensation | 0.048 between the two groups |
| Melanson 2012 | Hunger and satiety ratings only reported for low GI and low energy density groups, no significant difference between groups after 12 weeks | ||
| Philippou 2009a | No significant difference between groups for hunger and fullness | 0.8 for both | |
| Sichieri 2007 | ‐1.31 (SD 6.3) on hunger scale | ‐0.98 (SD 4.3) on hunger scale | 0.74 |
Three studies (Bellisle 2007; DiOGenes 2011a high protein; DiOGenes 2011 low protein) reported on participants satisfaction (see Analysis 1.9). In one study (Bellisle 2007) participants of both the low GI and the control group were equally satisfied with the dietary programme and that both 12 week diets were perceived to be equally effective but they found the low GI diet significantly easier to follow than the control diet. The DiOGenes 2011a high protein and DiOGenes 2011 low protein studies reported mean scores of intervention acceptability for the overall (high protein and low protein) low GI group (n = 273) and the overall (high protein and low protein) high GI group (n = 255). Both low GI and high GI groups reported similar scores and there was no difference between groups for satisfaction with the program, convenience of the program, ease of adherence to the program, motivation to continue the program, and enjoying the dietary intervention.
1.9. Analysis.
Comparison 1: Low GI versus control (primary prevention), Outcome 9: Satisfaction
| Satisfaction | ||||
| Study | Outcome | Low GI group | Control group | P |
| Bellisle 2007 | Satisfaction with programme (VAS) | 73.2 (SE 1.2) | 69.1 (SE 1.2) | NS |
| Perception of effectiveness (VAS) | 71.5 (SE 1.2) | 70.4 (SE 1.0) | NS | |
| Ease of following diet (VAS) | 70.2 (SE 1.3) | 65.1 (SE 1.3) | 0.0048 | |
Weight change as a potential confounder
Primary Prevention studies
Most studies reported some weight loss in both the low and high GI groups. Weight loss ranged from 0.26 kg to 9.95 kg in the weight loss studies and from a weight loss of 9 kg to a weight gain of 1.45 kg in the weight maintenance studies. In the studies with an initial weight loss phase before a weight maintenance phase, participants had a mean weight loss of 11.2 kg (SD 3.5) in the DiOGenes study (DiOGenes 2011a high protein; DiOGenes 2011 low protein) and a median weight loss of 6.1% body weight in the study by Philippou 2009a. There was no evidence for a difference in weight loss between the low and the high GI groups (MD ‐0.16 kg, 95% CI ‐0.54 to 0.21, P = 0.40, 1403 participants, 14 studies, 17 comparisons, Analysis 1.10). There was no substantial heterogeneity. There was also no evidence for a difference in change in recorded BMI between low and high GI groups at the end of the interventions (MD ‐0.0 kg/m2, 95% CI ‐0.26 to 0.26, P = 0.98, 525 participants, 11 studies, 11 comparisons, Analysis 1.11). There was no substantial heterogeneity (I2 = 0%). In the studies that could not be included in the meta‐analysis, weight change was between +0.3 and ‐4 kg in the low GI groups and between ‐0.3 and ‐8.4 kg in the high GI groups. There was no evidence for a difference between high and low GI comparison groups in weight change in these studies. One study (Juanola‐Falgarona 2014) reported significant changes according to weight loss between the beginning and the end of the intervention, mostly in the high GI group that showed a significant decrease in BMI compared to the high GI group.
1.10. Analysis.

Comparison 1: Low GI versus control (primary prevention), Outcome 10: Weight change (kg)
1.11. Analysis.

Comparison 1: Low GI versus control (primary prevention), Outcome 11: BMI change (kg/m2)
Secondary Prevention study
In the one study (Frost 2004) including participants with CHD, there was no evidence for differences in weight loss between the low and high GI groups (MD 0.70 kg, 95% CI ‐6.77 to 8.17, 55 participants, 1 study, 1 comparison, Analysis 2.7) or change in BMI (MD 0.30 kg, 95% CI ‐1.75 to 2.35, 55 participants, 1 study, 1 comparison, Analysis 2.8).
2.7. Analysis.
Comparison 2: Low GI versus control (secondary prevention), Outcome 7: Weight change (kg)
2.8. Analysis.
Comparison 2: Low GI versus control (secondary prevention), Outcome 8: BMI change (kg.m2)
Discussion
Summary of main results
This systematic review summarised 21 RCTs, with 2538 randomised participants, examining the effect of low GI diets or foods compared with higher GI diets or foods on risk factors for cardiovascular disease over 12 weeks or more. Twenty RCTs were in a primary prevention population and one RCT in a secondary prevention population. None of the studies reported on mortality (total or cardiovascular) or cardiovascular events. Risk of bias was high, with none of the studies fulfilling more than half of the criteria. Most of the studies did not have an intervention duration of longer than six months. Difference in GI between comparison groups varied widely from 0.6 to 42.
Overall, in the primary prevention studies, no evidence of a difference between low GI and high GI groups was seen for blood lipid parameters and blood pressure parameters: total cholesterol (MD ‐0.12 mmol/L, 95% CI ‐0.26 to 0.02, P = 0.10), HDL cholesterol (MD ‐0.00 mmol/L, 95% CI ‐0.03 to 0.02, P = 0.78), LDL cholesterol (MD ‐0.03 mmol/L, 95% CI ‐0.10 to 0.04, P = 0.46), triglycerides (MD 0.03 mmol/L, 95% CI ‐0.03 to 0.09, P = 0.32), systolic blood pressure (MD 0.52 mmHg, 95% CI ‐1.21 to 2.25, P = 0.55), and diastolic blood pressure (MD ‐0.23 mmHg, 95% CI ‐1.42 to 0.96, P = 0.90). Similarly, no differences were seen in body weight or BMI (as a potential confounder): weight (MD 0.16 kg, 95% CI ‐0.54 to 0.21, P = 0.40), BMI (MD ‐0.00 kg/m2, 95% CI ‐0.26 to 0.26, P = 0.98). Hunger or satiety, or both, were only reported by five studies and evidence of a difference in favour of the low GI group was only reported by one of these studies.
In the secondary prevention study, no evidence of any differences were observed between low and high GI groups on any reported outcomes of this review.
Overall completeness and applicability of evidence
The GI of compared diets varied considerably between comparison groups for the included studies from 2.5 to 42 (see Analysis 1.1). It is unclear therefore whether the apparent lack of effect on CVD risk factors was due to small differences in GI between intervention and control groups. Most diets were energy‐reduced (with associated weight loss) and followed some form of healthy eating recommendations. We examined the effects of the diets on weight and BMI as potential confounders and, whilst no differences were seen between low GI and comparison groups, the small sample sizes and short follow‐up periods may not have allowed the separation of the true effect of low GI foods compared to the effects produced by weight loss and general healthy eating, especially in view of the fact that, in some studies, GI differences were very small.
It should be noted that the GI of the low and high GI diets were measured in most of the studies by food diaries and showed considerable variation. The method of measuring the GI of individual foods was standardised in 1997 (FAO/WHO 1997), and all included trials were published after that date. There is some debate about the accurate measurement of GI in the diet. Most of the low GI diets used in the studies in this review were based on mixed meals. It has been demonstrated that the GI of mixed meals predicted by table values does not predict the measured GI, and that the fat and protein content, or energy content of mixed meals are more strongly correlated with the GI of mixed meals than carbohydrate content (Flint 2004). Additionally, it has been reported that most current food frequency questionnaires are not constructed for the purpose of measuring GI and have not been validated for this purpose (Barclay 2006).
Quality of the evidence
The unclear risk of bias (according to Cochrane criteria) of most of the included studies makes overall interpretation of the data difficult. Sample sizes were small and durations of follow‐up were short and many trials had a large number of dropouts. Adverse events (including useful information about how easy it was to make the dietary changes) were generally not reported. Differences between studies in measuring the GI of the diets consumed may also have contributed some bias (Du 2006).
We aimed to assess the overall quality of the evidence for each primary outcome according to the Grading of Recommendations Assessment, Development and Evaluation (GRADE) approach which takes into account issues not only related to internal validity (risk of bias, inconsistency, imprecision, publication bias) but also to external validity such as directness of results. We presented two tables; for the primary prevention of CVD and the secondary prevention of CVD. For the primary prevention of CVD, the majority of the included randomised controlled trials did not report the primary outcomes (n = 6) of this review, therefore we could not assess the overall quality (Table 1). Adverse events (one of the primary outcomes) was downgraded by one level for risk of bias because of a high attrition rate, adverse events not reported consistently and potentially underpowered studies. Adverse events was downgraded by one level for imprecision because of the small number of participants and included studies. Overall, inconsistency was difficult to evaluate because the majority of the domains were not applicable (Appendix 1). For the secondary prevention of CVD, there was one included study which did not measure primary outcomes (Table 2).
Potential biases in the review process
The inclusion criteria for this update were expanded to include all cardiovascular disease and not just coronary heart disease. We also included studies with healthy participants to capture a primary prevention subset. As there are other Cochrane reviews which examine the effect of low GI diets in obesity (Thomas 2007) and diabetes (Thomas 2009), studies were only included if they reported blood lipids or blood pressure, or both, and studies in participants with diabetes were excluded. We also excluded studies reporting weight‐related outcomes, but if studies reported weight change and blood lipids and/or blood pressure, we abstracted this information since weight change is a potential confounder. We chose to include studies of at least 12 weeks duration and therefore excluded many short‐term studies. However, by selecting studies of longer duration, we were able to determine if these effects were sustained, which is more relevant for public health interventions.
There was substantial heterogeneity in the composition of diets between studies so what drives the effects of low GI across studies might be different; for example, if the intake of fibre was controlled, this might make a difference to the outcome. Low GI diets are often characterised by a higher fibre content which may confound the effect of low GI per se, although data have shown that the effects of low GI diets can be seen in the absence of difference in fibre content (Bjorck 2003). Where reported, the studies included in this review had no significant difference in fibre content when comparing the high and the low GI diets. The inclusion criteria required a similar dietary composition between the intervention and control groups with the exception of low GI within each study, but the composition of diets between studies varied widely and studies were variable in the level of detail provided. There may also be different effects seen for advice to consume low GI foods and provision of low GI foods. Currently, there were insufficient studies included in the review to explore this in subgroup analyses.
Agreements and disagreements with other studies or reviews
Thomas 2007 summarised six RCTs (duration five weeks to six months) of the effects of low GI diets in overweight or obese participants (n = 202). They found a significantly greater weight loss in low GI groups (WMD ‐1.1 kg, 95% CI: ‐2.0, ‐0.2, P < 0.05, n = 163) and also a significantly greater decrease in total cholesterol (WMD ‐0.22 mmol/L, 95% CI: ‐0.43, ‐0.02, P < 0.05) and LDL cholesterol (WMD ‐0.24 mmol/L, 95% CI: ‐0.44, ‐0.05, P < 0.05). However, the comparison diets in this review were not matched for macronutrient composition, and so other dietary factors may have contributed to the effect seen.
Goff 2013 assessed the effects of low GI diets on blood lipids in 28 RCTs lasting at least four weeks (n = 1272). Studies comparing intended macronutrient differences of diets were excluded but differences in fibre content were allowed. The authors also found a significant reduction in total (WMD ‐0.13 mmol/L, 95% CI: ‐0.22, ‐0.04, P < 0.004, n = 1441) and LDL cholesterol (WMD ‐0.16 mmol/L, 95% CI: ‐0.24, ‐0.08, P < 0.0001, n = 1281) in the low GI groups. This may have been due to the larger number of short term studies included in that review; the meta‐analyses suggest that few of the individual trials found significant differences in cholesterol levels.
The review by Kristo 2013 focused on controlled feeding studies (i.e. all food and drinks provided throughout the study) of low versus high GI diets (with similar macronutrient composition). They included five studies lasting between four and 12 weeks and reported inconsistent results regarding the effects of the diets on blood lipids.
Authors' conclusions
Implications for practice.
There is currently no evidence available regarding the effect of low GI diets on cardiovascular disease events. Moreover, there is currently no convincing evidence that low GI diets have a clear beneficial effect on blood lipids or blood pressure parameters.
Implications for research.
There is a need for well‐designed, adequately powered, long‐term (follow‐up at one year or more) RCTs to assess the effects of low GI diets on cardiovascular risk factors. Measurement of GI and desirable GI differences between diets should be standardised.
Studies are needed assessing the effects of low GI diets on hard cardiovascular outcomes (to reduce the power requirements, this may be best done in populations with an increased cardiovascular risk, such as in patients with existing cardiovascular disease or type 2 diabetes mellitus).
What's new
| Date | Event | Description |
|---|---|---|
| 15 April 2021 | Amended | Two new studies have been identified with a search from June 2019 (details available on request). Trialists did not respond when contacted to obtain full results. One already previously identified study (PREVIEW) plans to have full results available by 2022 at the earliest. The conclusions of this Cochrane Review are therefore still considered up to date. |
History
Protocol first published: Issue 4, 2003 Review first published: Issue 4, 2004
| Date | Event | Description |
|---|---|---|
| 4 July 2017 | New citation required and conclusions have changed | 18 new studies were added and in contrast to the last version, no changes in lipid levels were found. |
| 31 July 2016 | New search has been performed | The review was updated and the inclusion criteria were expanded to include all cardiovascular disease (CVD) and not just coronary heart disease. As there are other Cochrane reviews which examine the effect of low glycaemic index diets in obesity and diabetes, studies were only included if they reported blood lipids and/or blood pressure, and studies in participants with diabetes were excluded. Studies in healthy participants were included to capture both primary and secondary prevention of CVD. As more trials are available now, we have excluded short‐term studies and included only those of at least 12 weeks duration. This means that only three RCTs of the previous version of the review were retained and 15 new trials were added. The updated search was done in July 2016. |
| 8 April 2008 | Amended | Converted to new review format. |
| 15 May 2006 | New search has been performed | The search was updated to July 2006. Six new studies were identified and added to the review. There is no change to the conclusions of the review. |
Acknowledgements
Update:
We would like to thank Nicole Martin (Cochrane Heart Group) for running the updated searches and extending the search strategy to include primary prevention trials. We would also like to thank Dr Clara Rübner Jørgensen (University of Warwick) for helping with the translation of a Danish trial potentially eligible for inclusion. We would also like to acknowledge the significant contributions of Carolyn Summerbell and Victoria Whittaker to earlier versions of this review.
Previous review version:
Margaret Burke (Cochrane Heart Group) for assistance with the development of the search strategy.
Appendices
Appendix 1. Checklist to aid consistency and reproducibility of GRADE assessments
| Adverse events | ||
| Study limitations (risk of bias)a | 1. Was random sequence generation used (i.e. no potential for selection bias)? | Unclear |
| 2. Was allocation concealment used (i.e. no potential for selection bias)? | Unclear | |
| 3. Was there blinding of participants and personnel (i.e. no potential for performance bias)? | N/A | |
| 4. Was there blinding of outcome assessment (i.e. no potential for detection bias)? | Unclear | |
| 5. Was an objective outcome used? | Unclear | |
| 6. Were more than 80% of participants enrolled in trials included in the analysis (i.e. no potential reporting bias)?e | No () | |
| 7. Were data reported consistently for the outcome of interest (i.e. no potential selective reporting)? | No () | |
| 8. No other biases reported (i.e. no potential of other bias)? | No () | |
| 9. Did the trials end up as scheduled (i.e. not stopped early)? | No | |
| Inconsistencyb | 1. Point estimates did not vary widely? | N/A |
| 2. To what extent did confidence intervals overlap (substantial: all confidence intervals overlap at least one of the included studies point estimate; some: confidence intervals overlap but not all overlap at least one point estimate; no: at least one outlier: where the confidence interval of some of the studies do not overlap with those of most included studies)? | N/A | |
| 3. Was the direction of effect consistent? | Yes | |
| 4. What was the magnitude of statistical heterogeneity (as measured by I²) ‐ low (I² < 40%), moderate (I² 40% to 60%), high I² > 60%)? | N/A | |
| 5. Was the test for heterogeneity statistically significant (P < 0.1)? | N/A | |
| Indirectnessa | 1. Were the populations in included studies applicable to the decision context? | Yes |
| 2. Were the interventions in the included studies applicable to the decision context? | Yes | |
| 3. Was the included outcome not a surrogate outcome? | Yes | |
| 4. Was the outcome timeframe sufficient? | Yes | |
| 5. Were the conclusions based on direct comparisons? | Yes | |
| Imprecisionc | 1. Was the confidence interval for the pooled estimate not consistent with benefit? | N/A |
| 2. What is the magnitude of the median sample size (high: 300 participants, intermediate: 100‐300 participants, low: < 100 participants)?e | low () | |
| 3. What was the magnitude of the number of included studies (large: > 10 studies, moderate: 5‐10 studies, small: < 5 studies)?e | small () | |
| 4. Was the outcome a common event (e.g. occurs more than 1/100)? | No | |
| Publication biasd | 1. Was a comprehensive search conducted? | Yes |
| 2. Was grey literature searched? | No | |
| 3. Were no restrictions applied to study selection on the basis of language? | No | |
| 4. There was no industry influence on studies included in the review? | Unclear | |
| 5. There was no evidence of funnel plot asymmetry? | N/A | |
| 6. There was no discrepancy in findings between published and unpublished trials? | N/A | |
| aQuestions on risk of bias are answered in relation to the majority of the aggregated evidence in the meta‐analysis rather than to individual trials. bQuestions on inconsistency are primarily based on visual assessment of forest plots and the statistical quantification of heterogeneity based on I2. cWhen judging the width of the confidence interval, it is recommended to use a clinical decision threshold to assess whether the imprecision is clinically meaningful. dQuestions address comprehensiveness of the search strategy, industry influence, funnel plot asymmetry, and discrepancies between published and unpublished trials. eDepends on the context of the systematic review area. (): key item for possible downgrading the quality of the evidence (GRADE) as shown in the footnotes of the ’Summary of finding’ table(s); GRADE: Grading of Recommendations Assessment, Development and Evaluation; N/A: not applicable | ||
Appendix 2. Search strategies
Search update 2016
CENTRAL
#1 MeSH descriptor: [Glycemic Index] this term only #2 glyc?emic near/3 low #3 glyc?emic near/2 (index or indices) #4 glyc?emic near/3 diet* #5 #1 or #2 or #3 or #4 #6 MeSH descriptor: [Dietary Carbohydrates] explode all trees #7 MeSH descriptor: [Carbohydrates] this term only #8 carbohydrate* #9 MeSH descriptor: [Starch] explode all trees #10 starch* #11 #6 or #7 or #8 or #9 or #10 #12 MeSH descriptor: [Cardiovascular Diseases] explode all trees #13 heart near/2 disease* #14 coronary near/3 disease* #15 chd #16 cardiovascular #17 angina #18 cvd #19 MeSH descriptor: [Cholesterol] explode all trees #20 cholesterol #21 blood near/2 pressure #22 MeSH descriptor: [Blood Pressure] explode all trees #23 MeSH descriptor: [Hypertension] explode all trees #24 hypertensi* #25 MeSH descriptor: [Obesity] explode all trees #26 obes* #27 insulin next resistan* #28 metabolic next syndrome* #29 MeSH descriptor: [Diabetes Mellitus] explode all trees #30 diabet* #31 insulin next sensitiv* #32 glycemic near/3 control* #33 glycaemic near/3 control* #34 MeSH descriptor: [Hyperlipidemias] explode all trees #35 MeSH descriptor: [Overweight] explode all trees #36 MeSH descriptor: [Glucose Metabolism Disorders] explode all trees #37 MeSH descriptor: [Hyperinsulinism] explode all trees #38 cardio* near/6 risk* #39 overweight #40 over‐weight #41 hdl or ldl #42 hyperlip* #43 lipid* #44 hyperglycem* #45 hyperglycaem* #46 #12 or #13 or #14 or #15 or #16 or #17 or #18 or #19 or #20 #47 #21 or #22 or #23 or #24 or #25 or #26 or #27 or #28 or #29 or #30 #48 #31 or #32 or #33 or #34 or #35 or #36 or #37 or #38 or #39 or #40 #49 #41 or #42 or #43 or #44 or #45 #50 #46 or #47 or #48 or #49 #51 #11 and #50 #52 #5 or #51
MEDLINE Ovid
1. Glycemic Index/ 2. (glyc?emic adj3 low).tw. 3. glyc?emic index.tw. 4. (glyc?emic adj (index or indices)).tw. 5. (glyc?emic adj3 diet$).tw. 6. or/1‐5 7. exp Dietary Carbohydrates/ 8. Carbohydrates/ 9. carbohydrate$.tw. 10. exp Starch/ 11. starch*.tw. 12. or/7‐11 13. exp Cardiovascular Diseases/ 14. (heart adj2 disease*).tw. 15. (coronary adj2 disease*).tw. 16. chd.tw. 17. cardiovascular.tw. 18. angina*.tw. 19. cvd.tw. 20. exp Cholesterol/ 21. exp blood pressure/ 22. exp Obesity/ 23. exp Hyperinsulinism/ 24. exp Hyperlipidemias/ 25. exp Glucose Metabolism Disorders/ 26. insulin resistan*.tw. 27. insulin sensitiv*.tw. 28. (glyc?emic adj3 control).tw. 29. exp Hypertension/ 30. exp Overweight/ 31. (cardio* adj6 risk*).tw. 32. (blood adj2 pressure).tw. 33. overweight.tw. 34. obes*.tw. 35. over‐weight.tw. 36. cholesterol.tw. 37. (hdl or ldl).tw. 38. hyperlip*.tw. 39. lipid*.tw. 40. hyperglyc?em*.tw. 41. hypertens*.tw. 42. diabet*.tw. 43. or/13‐42 44. 12 and 43 45. 6 or 44 46. randomized controlled trial.pt. 47. controlled clinical trial.pt. 48. randomized.ab. 49. placebo.ab. 50. drug therapy.fs. 51. randomly.ab. 52. trial.ab. 53. groups.ab. 54. 46 or 47 or 48 or 49 or 50 or 51 or 52 or 53 55. exp animals/ not humans.sh. 56. 54 not 55 57. 45 and 56 Embase Ovid 1. glycemic index/ 2. (glyc?emic adj3 low).tw. 3. (glyc?emic adj3 diet$).tw. 4. glyc?emic index.tw. 5. (glyc?emic adj (index or indices)).tw. 6. 1 or 2 or 3 or 4 or 5 7. carbohydrate diet/ 8. carbohydrate/ 9. carbohydrate$.tw. 10. starch/ 11. starch*.tw. 12. or/7‐11 13. exp coronary artery disease/ 14. exp cardiovascular disease/ 15. (heart adj2 disease*).tw. 16. (coronary adj2 disease*).tw. 17. chd.tw. 18. cardiovascular.tw. 19. angina*.tw. 20. cvd.tw. 21. exp cholesterol/ 22. exp blood pressure/ 23. exp Obesity/ 24. exp "disorders of carbohydrate metabolism"/ 25. (glyc?emic adj3 control).tw. 26. insulin resistan*.tw. 27. insulin sensitiv*.tw. 28. exp Hypertension/ 29. exp Overweight/ 30. (cardio* adj6 risk*).tw. 31. (blood adj2 pressure).tw. 32. overweight.tw. 33. obes*.tw. 34. over‐weight.tw. 35. cholesterol.tw. 36. (hdl or ldl).tw. 37. hyperlip*.tw. 38. lipid*.tw. 39. hyperglyc?em*.tw. 40. hypertens*.tw. 41. exp hyperinsulinism/ 42. exp hyperlipidemia/ 43. diabet*.tw. 44. or/13‐43 45. 12 and 44 46. 6 or 45 47. random$.tw. 48. factorial$.tw. 49. crossover$.tw. 50. cross over$.tw. 51. cross‐over$.tw. 52. placebo$.tw. 53. (doubl$ adj blind$).tw. 54. (singl$ adj blind$).tw. 55. assign$.tw. 56. allocat$.tw. 57. volunteer$.tw. 58. crossover procedure/ 59. double blind procedure/ 60. randomized controlled trial/ 61. single blind procedure/ 62. 47 or 48 or 49 or 50 or 51 or 52 or 53 or 54 or 55 or 56 or 57 or 58 or 59 or 60 or 61 63. (animal/ or nonhuman/) not human/ 64. 62 not 63 65. 46 and 64 66. limit 65 to embase CINAHL S63 S44 AND S62 S62 S45 OR S46 OR S47 OR S48 OR S49 OR S50 OR S51 OR S52 OR S53 OR S54 OR S55 OR S56 OR S57 OR S58 OR S59 OR S60 OR S61 S61 TX cross‐over* S60 TX crossover* S59 TX volunteer* S58 (MH "Crossover Design") S57 TX allocat* S56 TX control* S55 TX assign* S54 TX placebo* S53 (MH "Placebos") S52 TX random* S51 TX (doubl* N1 mask*) S50 TX (singl* N1 mask*) S49 TX (doubl* N1 blind*) S48 TX (singl* N1 blind*) S47 TX (clinic* N1 trial?) S46 PT clinical trial S45 (MH "Clinical Trials+") S44 S6 OR S43 S43 S12 AND S42 S42 S13 OR S14 OR S15 OR S16 OR S17 OR S18 OR S19 OR S20 OR S21 OR S22 OR S23 OR S24 OR S25 OR S26 OR S27 OR S28 OR S29 OR S30 OR S31 OR S32 OR S33 OR S34 OR S35 OR S36 OR S37 OR S38 OR S39 OR S40 OR S41 S41 TI diabet* or AB diabet* S40 TI hypertens* or AB hypertens* S39 TI hyperglycaem* or AB hyperglycaem* S38 TI hyperglycem* or AB hyperglycem* S37 TI lipid* or AB lipid* S36 TI hyperlip* or AB hyperlip* S35 (TI hdl or ldl) or (AB hdl or ldl) S34 TI cholesterol or AB cholesterol S33 TI obes* or AB obes* S32 TI over‐weight or AB over‐weight S31 TI overweight or AB overweight S30 TI blood N2 pressure or AB blood N2 pressure S29 TI cardio* N6 risk* or AB cardio* N6 risk* S28 (MH "Hypertension") S27 TI glycaemic N3 control* or AB glycaemic N3 control* S26 TI glycemic N3 control* or AB glycemic N3 control* S25 TI insulin N2 sensitiv* or AB insulin N2 sensitiv* S24 TI insulin N2 resist* or AB insulin N2 resist* S23 (MH "Metabolic Diseases+") S22 (MH "Obesity") S21 (MH "Blood Pressure+") S20 (MH "Cholesterol") S19 TI cvd or AB cvd S18 TI angina* or AB angina* S17 TI cardiovascular or AB cardiovascular S16 TI chd or AB chd S15 (TI coronary N2 disease*) or (AB coronary N2 disease*) S14 (TI heart N2 disease*) or (AB heart N2 disease*) S13 (MH "Cardiovascular Diseases+") S12 S7 OR S8 OR S9 OR S10 OR S11 S11 (MH "Glucans") S10 TI starch* or AB starch* S9 TI carbohydrate* or AB carbohydrate* S8 (MH "Carbohydrates") S7 (MH "Dietary Carbohydrates+") S6 S1 OR S2 OR S3 OR S4 OR S5 S5 TI glyc?emic N3 diet* or AB glyc?emic N3 diet* S4 TI "glyc?emic indices" or AB "glyc?emic indices" S3 TI "glyc?emic index" or AB "glyc?emic index" S2 TI glyc?emic N3 low OR AB glyc?emic N3 low S1 (MH "Glycemic Index")
Search strategies previous version
CENTRAL
1. glyc?emic index.tw. 2. (glyc?emic adj3 low).tw. 3. (glyc?emic adj3 diet$).tw. 4. (carbohydrate$ adj25 diet$).ab,ti. 5. (starch$ adj25 diet$).ab,ti. 6. 1 or 2 or 3 or 4 or 5 7. coronary$.ab,ti. 8. cardiovascular$.ab,ti. 9. heart$.ab,ti. 10. chd.ab,ti. 11. angina.ab,ti. 12. cvd.ab,ti. 13. ischemic$.ab,ti. 14. myocardial$.ab,ti. 15. cardiac$.ab,ti. 16. lipid$.ab,ti. 17. cholesterol$.ab,ti. 18. blood pressure.ab,ti. 19. obes$.ab,ti. 20. diabet$.ab,ti. 21. glyc?emic.ab,ti. 22. 7 or 8 or 9 or 10 or 11 or 12 or 13 or 14 or 15 or 16 or 17 or 18 or 19 or 20 or 21 23. 6 and 22 24. random$.ab,ti. 25. compar$.ab,ti. 26. control$.ab,ti. 27. study.ab,ti. 28. follow$ up.ab,ti. 29. clinic$.ab,ti. 30. blind$.ab,ti. 31. double$.ab,ti. 32. cross?over.ab,ti. 33. 24 or 25 or 26 or 27 or 28 or 29 or 30 or 31 or 32 34. 23 and 33
MEDLINE
1. Glycemic Index/ 2. (glyc?emic adj3 low).tw. 3. glyc?emic index.tw. 4. (glyc?emic adj3 diet$).tw. 5. 1 or 2 or 3 or 4 6. exp Dietary Carbohydrates/ 7. CARBOHYDRATES/ 8. carbohydrate$.tw. 9. starch*/ 10. or/6‐9 11. exp Coronary Disease/ 12. Cardiovascular Diseases/ 13. heart disease$.tw. 14. coronary disease$.tw. 15. chd.tw. 16. cardiovascular.tw. 17. angina.tw. 18. cvd.tw. 19. 11 or 12 or 13 or 14 or 15 or 16 or 17 or 18 20. 10 and 19 21. 5 or 20 22. randomized controlled trial.pt. 23. controlled clinical trial.pt. 24. Randomized controlled trials/ 25. random allocation.sh. 26. double blind method.sh. 27. single‐blind method.sh. 28. 22 or 23 or 24 or 25 or 26 or 27 29. (animal not human).sh. 30. 28 not 29 31. clinical trial.pt. 32. exp Clinical Trials/ 33. (clin$ adj25 trial$).ab,ti. 34. ((singl$ or doubl$ or trebl$ or tripl$) adj (blind$ or mask$)).ab,ti. 35. placebos.sh. 36. placebo$.ab,ti. 37. random$.ab,ti. 38. research design.sh. 39. 31 or 32 or 33 or 34 or 35 or 36 or 37 or 38 40. 39 not 29 41. 40 not 30 42. comparative study.sh. 43. exp Evaluation Studies/ 44. follow up studies.sh. 45. prospective studies.sh. 46. (control$ or prospectiv$ or volunteer$).ab,ti. 47. 42 or 43 or 44 or 45 or 46 48. 47 not 29 49. 48 not (30 or 41) 50. 30 or 41 or 49 51. 21 and 50
Embase
1. (glyc?emic adj3 low).tw. 2. (glyc?emic adj3 diet$).tw. 3. glyc?emic index.tw,ti. 4. 1 or 2 or 3 5. exp Carbohydrate Diet/ 6. Carbohydrate/ 7. carbohydrate$.tw. 8. exp STARCH/ 9. 5 or 6 or 7 or 8 10. exp Ischemic Heart Disease/ 11. exp Coronary Artery Disease/ 12. Cardiovascular Disease/ 13. heart disease$.tw. 14. coronary disease$.tw. 15. chd.tw. 16. cardiovascular.tw. 17. angina.tw. 18. cvd.tw. 19. 10 or 11 or 12 or 13 or 14 or 15 or 16 or 17 or 18 20. 9 and 19 21. 4 or 20 22. Controlled Study/ 23. Clinical Trial/ 24. random$.ab,ti. 25. compar$.ab,ti. 26. control$.ab,ti. 27. study.ab,ti. 28. follow$ up.ab,ti. 29. clinic$.ab,ti. 30. blind$.ab,ti. 31. Double Blind Procedure/ 32. double$.ab,ti. 33. 22 or 23 or 24 or 25 or 26 or 27 or 28 or 29 or 30 or 31 or 32 34. 21 and 33
CINAHL
1. exp Glycemic Index/ 2. (glyc?emic adj3 low).tw. 3. glyc?emic index.tw. 4. (glyc?emic adj3 diet$).tw. 5. 1 or 2 or 3 or 4 6. exp Dietary Carbohydrates/ 7. CARBOHYDRATES/ 8. carbohydrate$.tw. 9. 6 or 7 or 8 10. exp Coronary Disease/ 11. Cardiovascular Diseases/ 12. heart disease$.tw. 13. chd.tw. 14. cardiovascular.tw. 15. angina.tw. 16. cvd.tw. 17. 10 or 11 or 12 or 13 or 14 or 15 or 16 18. 9 and 17 19. 5 or 18 20. clinical trial.pt. 21. exp Clinical Trials/ 22. (clin$ adj25 trial$).tw. 23. ((singl$ or doubl$ or trebl$ or tripl$) adj (blind$ or mask$)).tw. 24. PLACEBOS/ 25. placebo$.tw. 26. random$.tw. 27. exp Evaluation Research/ 28. exp Prospective Studies/ 29. Random Assignment/ 30. Random Sample/ 31. Crossover Design/ 32. Comparative Studies/ 33. 20 or 21 or 22 or 23 or 24 or 25 or 26 or 27 or 28 or 29 or 30 or 31 or 32 34. 19 and 33
Data and analyses
Comparison 1. Low GI versus control (primary prevention).
| Outcome or subgroup title | No. of studies | No. of participants | Statistical method | Effect size |
|---|---|---|---|---|
| 1.1 Total cholesterol (mmol/L) change | 17 | 1277 | Mean Difference (IV, Random, 95% CI) | ‐0.12 [‐0.26, 0.02] |
| 1.2 HDL Cholesterol (mmol/L) change | 17 | 1329 | Mean Difference (IV, Fixed, 95% CI) | ‐0.00 [‐0.03, 0.02] |
| 1.3 LDL cholesterol (mmol/L) change | 17 | 1274 | Mean Difference (IV, Fixed, 95% CI) | ‐0.03 [‐0.10, 0.04] |
| 1.4 Triglycerides (mmol/L) change | 16 | 1252 | Mean Difference (IV, Fixed, 95% CI) | 0.03 [‐0.03, 0.09] |
| 1.5 Systolic blood pressure (mmHg) change | 10 | 786 | Mean Difference (IV, Fixed, 95% CI) | 0.52 [‐1.21, 2.25] |
| 1.6 Diastolic blood pressure (mmHg) change | 10 | 786 | Mean Difference (IV, Fixed, 95% CI) | ‐0.23 [‐1.42, 0.96] |
| 1.7 Behaviour change | 2 | Other data | No numeric data | |
| 1.8 Hunger/desire to eat | 5 | Other data | No numeric data | |
| 1.9 Satisfaction | 1 | Other data | No numeric data | |
| 1.10 Weight change (kg) | 20 | 1403 | Mean Difference (IV, Fixed, 95% CI) | ‐0.16 [‐0.54, 0.21] |
| 1.11 BMI change (kg/m2) | 11 | 525 | Mean Difference (IV, Fixed, 95% CI) | ‐0.00 [‐0.26, 0.26] |
Comparison 2. Low GI versus control (secondary prevention).
| Outcome or subgroup title | No. of studies | No. of participants | Statistical method | Effect size |
|---|---|---|---|---|
| 2.1 Total cholesterol (mmol/L) change | 1 | 55 | Mean Difference (IV, Fixed, 95% CI) | ‐0.10 [‐0.59, 0.39] |
| 2.2 HDL Cholesterol (mmol/L) change | 1 | 55 | Mean Difference (IV, Fixed, 95% CI) | ‐0.03 [‐0.18, 0.12] |
| 2.3 LDL cholesterol (mmol/L) change | 1 | 55 | Mean Difference (IV, Fixed, 95% CI) | ‐0.06 [‐0.47, 0.35] |
| 2.4 Triglycerides (mmol/L) change | 1 | 55 | Mean Difference (IV, Fixed, 95% CI) | ‐0.29 [‐0.73, 0.15] |
| 2.5 Systolic blood pressure (mmHg) change | 1 | 55 | Mean Difference (IV, Fixed, 95% CI) | ‐2.00 [‐14.99, 10.99] |
| 2.6 Diastolic blood pressure (mmHg) change | 1 | 55 | Mean Difference (IV, Fixed, 95% CI) | ‐4.00 [‐13.41, 5.41] |
| 2.7 Weight change (kg) | 1 | 55 | Mean Difference (IV, Fixed, 95% CI) | 0.70 [‐6.77, 8.17] |
| 2.8 BMI change (kg.m2) | 1 | 55 | Mean Difference (IV, Fixed, 95% CI) | 0.30 [‐1.75, 2.35] |
Characteristics of studies
Characteristics of included studies [ordered by study ID]
Armendariz‐Anguiano 2011.
| Study characteristics | ||
| Methods |
Setting: Mexico; single centre; details of setting not reported. Design: individual randomisation, parallel group. Dates: trial dates not reported. Intervention duration: 6 months. Follow‐up: no postintervention follow‐up. Focus: to compare the effects of different glycaemic load diets on biochemical data and body composition in overweight and obese participants. |
|
| Participants |
N: 54 (16/27 completers in the intervention group and 8/27 in the control group). Inclusion criteria: overweight or obese adults. Exclusion criteria: pregnancy, diabetes, cancer, psychiatric disorders, physical disabilities. Age (years) (mean (SD)):intervention: 36.9 (SD 9.0) (22 to 57); control: 33.8 (SD 8.2) (21 to 53) Sex (% men):intervention: 33.4%; control: 32.2%. Ethnicity: Mexican. Cardiovascular risk status (mean (SD)): BMI (kg/m2):intervention: 30.7 (SD 4.0) (24 to 42); control: 32.5 (SD 5.9) (26 to 46). Total cholesterol (mmol/L):intervention: 5.5 (SD 1.2); control: 6.1 (SD 3.0). HDL cholesterol (mmol/L):intervention: 1.6 (SD 0.4); control: 1.7 (SD 0.4). LDL cholesterol (mmol/L):intervention: 3.8 (SD 0.8); control: 4.4 (SD 2.7). Blood pressure (mmHg): not reported. Medications used: not reported. |
|
| Interventions |
Low GI group (n = 27): low glycaemic load diet. Control (n = 27): high glycaemic load diet. Description of dietary intervention: high and low glycaemic load diets were designed according to the food habits of Mexicans living in the Tijuana area; GI values of each food were estimated from the tables by Foster‐Powell 2002; participants were given menus with the high or low glycaemic load diets at the start of the intervention; a research assistant was available by phone or mail for questions during the whole intervention; emails were sent as reminders and diet reinforcements every 2 weeks. Incentives: not reported. Cointerventions in both groups: none. Assessment of dietary adherence: 3‐day dietary records (2 weekdays and one weekend day); only participants who completed these were included in the analysis. Was the diet energy‐reduced? yes. Comparability of diet composition: yes, see Table 6. Change in diet over time: both groups significantly decreased their caloric intake by 468 to 500 kcal/day from baseline to 6 months, no significant difference between groups. |
|
| Outcomes | Outcomes (not clearly divided into primary and secondary): waist circumference, BMI, fat mass, serum glucose, serum insulin, insulin resistance (HOMA), total cholesterol, HDL cholesterol, LDL cholesterol, triglycerides; physical activity (International Physical Activity Questionnaire), adverse events. | |
| Funding / conflict of interest | Not reported. | |
| Notes | ||
| Risk of bias | ||
| Bias | Authors' judgement | Support for judgement |
| Random sequence generation (selection bias) | Unclear risk | Allocation method not reported. |
| Allocation concealment (selection bias) | Unclear risk | Allocation method not reported. |
| Blinding of outcome assessment (detection bias) All outcomes | Unclear risk | Blinding method not reported. |
| Incomplete outcome data (attrition bias) All outcomes | High risk | Large number of dropouts/losses to follow‐up, reasons not given, imbalance between groups. Loss to follow‐up/drop‐outs: Low GI group: 11/27 (40.7%). Control: 19/27 (70.4%). |
| Intention‐to‐treat analysis | High risk | No, only completers analysed. |
| Selective reporting (reporting bias) | Unclear risk | Not enough detail to judge. |
| Groups comparable at baseline | Low risk | With respect to demographic variables, body composition and biochemical markers. |
| Other bias | High risk | Power analysis (80% power to detect a change in waist circumference with 30 participants per group, i.e. study was underpowered). |
2. Comparibility of diets achieved.
| Study ID | Dietary component | Low GI | Control | P |
| Armendariz‐Anguiano 2011 | Energy (kJ/day) | 5690 (SE 1255) kJ/day | 6460 (SE 2489) kJ/day | NS |
| Carbohydrate (g/day) | 173 (SE 41) g/day | 197 (SE 82) g/day | NS | |
| Fat (g/day) | 48 (SE 22) g/day | 49 (SE 39) g/day | NS | |
| Protein (g/day) | 67 (SE 18) g/day | 82 (SE 31) g/day | NS | |
| Fibre (g/day) | 23 (SE 12) g/day | 14 (SE 7) g/day | NS | |
| GI | 51 (SE 7) | 59 (SE 5) | 0.008 | |
| Bellisle 2007 | Energy (kJ or kcal/day) | NR | NR | |
| Carbohydrate (g/day or % energy) | NR | NR | ||
| Fat (g/day or % energy) | NR | NR | ||
| Protein (g/day or % energy) | NR | NR | ||
| High GI foods selected over 3 days (n) | 5.8 (SE 0.7) | 10.7 (SE 1.5) | 0.002 | |
| Low GI foods selected over 3 days (n) | 19.6 (SE 1.3) | 17 (SE 1.3) | 0.18 | |
| Buscemi 2013 | Energy (kJ/day) | set to about 20 kcal/kg BW (83.7 kJ) (1400, 1600, 1800 or 2000 kcal/day (5858, 6694, 7531, 8368 kJ/day)), data below for 1600 kcal/day (6694 kJ/day) | set to about 83.7 kJ/kg BW (5858, 6694, 7531, 8368 kJ/day), data below for 6694 kJ/day (1600 kcal/day) | |
| Carbohydrate (g/day or % energy) | 218 g/day 55% of energy |
230 g/day 57% of energy |
||
| Fat (g/day or % energy) | 45 g/day 25% of energy |
43 g/day 24% of energy |
||
| Protein (g/day or % energy) | 81 g/day 20% of energy |
74 g/day 19% of energy |
||
| Fibre (g/day) | 32 g/day | 33 g/day | ||
| GI | 43.8 | 54.1 | ||
| DiOGenes 2011 low protein | Energy (kJ/day) | screening: 9075 (SD 3388) kJ/day week 26: ‐2218 (SD 3734) kJ/day |
screening: 9752 (SD 3529) kJ/day week 26: ‐2046 (SD 3210) kJ/day |
|
| Carbohydrate (% energy) | screening: 42.2 (SD 9.0) % of energy week 26: +9.0 (SD 8.6) % of energy |
screening: 44.7 (SD 8.6) % of energy week 26: +6.0 (SD 10.1) % of energy |
||
| Fat (% energy) | screening: 37.4 (SD 7.8) % of energy week 26: ‐7.7 (SD 8.8) % of energy |
screening: 36.3 (SD 7.4) % of energy week 26: ‐5.5 (SD 10.4) % of energy |
||
| Protein (% energy) | screening: 18.3 (SD 5.2) % of energy week 26: ‐0.3 (SD 4.7) % of energy |
screening: 17.0 (SD 4.0) % of energy week 26: ‐0.7 (SD 4.9) % of energy |
||
| Fibre (g/day) | screening: 19.3 (SD 8.9) g/day week 26: +1.7 (SD 14.7) g/day |
screening: 18.7 (SD 8.2) g/day week 26: +1.6 (SD 10.4) g/day |
||
| GI | screening: 61.0 (SD 5.7) week 26: ‐4.7 (SD 6.8) |
screening: 60.7 (SD 4.7) week 26: +0.3 (SD 5.6) |
||
| DiOGenes 2011a high protein | Energy (kJ/day) | screening: 9657 (SD 2868) kJ/day week 26: ‐2259 (SD 2759) kJ/day |
screening: 9492 (SD 3311) kJ/day week 26: ‐2609 (SD 2603) kJ/day |
|
| Carbohydrate (% energy) | screening: 43.7 (SD 8.8) % of energy week 26: +1.4 (SD 10.7) % of energy |
screening: 45.2 (SD 7.3) % of energy week 26: +0.5 (SD 7.4) % of energy |
||
| Fat (% energy) | screening: 36.1 (SD 7.5)% of energy week 26: ‐4.9 (SD 9.6) % of energy |
screening: 36.3 (SD 6.7)% of energy week 26: ‐5.9 (SD 8.1) % of energy |
||
| Protein (% energy) | screening: 17.5 (SD 4.0) % of energy week 26: +4.2 (SD 4.5) % of energy |
screening: 16.0 (SD 3.6) % of energy week 26: +6.4 (SD 6.0) % of energy |
||
| Fibre (g/day) | screening: 19.8 (SD 8.6) g/day week 26: +1.6 (SD 13.5) g/day |
screening: 18.9 (SD 8.1) g/day week 26: +0.1 (SD 7.6) g/day |
||
| GI | screening: 61.1 (SD 5.2) week 26: ‐4.9 (SD 6.9) |
screening: 61.4 (SD 4.4) week 26: +0.3 (SD 6.0) |
||
| Frost 2004 | Energy (kJ/day) | 8506 (SE 473) kJ/day | 7360 (SE 331) kJ/day | 0.04 |
| Carbohydrate (% energy) | 49 (SE 1) % of energy | 47 (SE 2) % of energy | 0.43 | |
| Fat (% energy) | 31 (SE 1) % of energy | 32 (SE 2) % of energy | 0.36 | |
| Protein (% energy) | 18 (SE 1) % of energy | 18 (SE 1) % of energy | 0.48 | |
| Fibre (g/day) | 27 (SE 2) g/day | 21 (SE 2) g/day | 0.03 | |
| GI | 71 (SE 1) | 81 (SE 1) | 0.0001 | |
| Ghani 2014 low insulin | Energy (kcal) | At 1 year: 1706 (SD 351) | At 1 year: 1595 (SD 298) | At 1 year: 0.298 |
| Carbohydrate (g) | At 1 year: 221 (SD 46) | At 1 year: 221 (SD 55) | At 1 year: 0.975 | |
| Protein (g) | At 1 year: 68 (SD 15) | At 1 year: 60 (SD 13) | At 1 year: 0.086 | |
| Fat (g) | At 1 year: 59 (SD 17) | At 1 year: 51 (SD 11) | At 1 year: 0.093 | |
| Fibre (g) | At 1 year: 17 (SD 4) | At 1 year: 13 (SD 3) | At 1 year: 0.004 | |
| GI | At 1 year: 59 (SD 4) | At 1 year: 65 (SD 4) | At 1 year: <0.001 | |
| Ghani 2014a high insulin | Energy (kcal) | At 1 year: 1554 (SD 292) | At 1 year: 1595 (SD 442) | At 1 year: 0.927 |
| Carbohydrate (g) | At 1 year: 186 (SD 62) | At 1 year: 208 (SD 48) | At 1 year: 0.331 | |
| Protein (g) | At 1 year: 70 (SD 11) | At 1 year: 67 (SD 28) | At 1 year: 0.259 | |
| Fat (g) | At 1 year: 50 (SD 10) | At 1 year:55 (SD 20) | At 1 year: 0.977 | |
| Fibre (g) | At 1 year: 17 (SD 4) | At 1 year: 13 (SD 5) | At 1 year: 0.048 | |
| GI | At 1 year: 56 (SD 4) | At 1 year: 62 (SD 6) | At 1 year: 0.021 | |
| Hönemann 2010 | Energy (kJ/day) | 10769 (SD 2982) kJ/day at baseline; ‐2481 (SD 2983) kJ/day at 6 months | 10022 (SD 2960) kJ/day at baseline; ‐1653 (SD 2958) kJ/day at 6 months | NR |
| Carbohydrate (% energy) | 51.88% of energy | 49.01% of energy | NR | |
| Fat (% energy) | 32.63% of energy | 33.69% of energy | NR | |
| Protein (% energy) | 15.49% of energy | 17.30% of energy | NR | |
| Fibre (g/day) | +3.8 (SD 10.6) g/day | +2.7 (SD 12.2) g/day | NR | |
| GI | NR | NR | NR | |
| Juanola‐Falgarona 2014 | Energy (kcal/day) | baseline: 2076 (SE 89) 6 months: ‐685 (SE 94) |
baseline: 2036 (SE 101) 6 months: ‐610 (SE 87) |
NS across all three groups |
| Carbohydrate (% energy) | baseline: 41.8 (SE 1.3) 6 months: ‐2.1 (SE 1.3) |
baseline: 41.0 (SE 1.0) 6 months: 1.6 (SE 1.5) |
0.001 across all 3 groups (for 6‐month change) but not reported for low GI vs high GI comparison | |
| Fat (% energy) | baseline: 39.6 (SE 1.0) 6 months: ‐1.5 (SE 1.3) |
baseline: 38.0 (SE 0.9) 6 months: ‐2.9 (SE 1.2) |
0.014 across all 3 groups (for 6‐month change) but not reported for low GI vs high GI comparison | |
| Protein (% energy) | baseline: 17.0 (SE 0.4) 6 months: 4.2 (SE 0.7) |
baseline: 18.8 (SE 0.5) 6 months: 2.8 (SE 0.8) |
NS across all three groups | |
| Fibre (g/day) | baseline: 9.0 (SE 0.7) 6 months: 4.2 (SE 0.7) |
baseline: 10.0 (SE 0.7) 6 months: 2.8 (SE 0.8) |
NS across all three groups | |
| GI | baseline: 56.27 (SE 0.87) 6 months: ‐7.00 (SE 1.08) |
baseline: 56.87 (SE 0.74) 6 months: 0.50 (SE 0.87) |
0.001 across all 3 groups (for 6‐month change) but not reported for low GI vs high GI comparison | |
| McMillan‐Price 2006 high CHO | Energy (kJ) | 6150 (SE 190) kJ/day | 6010 (SE 240) kJ/day | NS |
| Carbohydrate (g/day or % energy) | 200 (SE 7) g/day 56 (SE 1) % of energy |
209 (SE 9) g/day 60 (SE 1) % of energy |
NR | |
| Fat (g/day or % energy) | 36 (SE 2) g/day 22 (SE 1) % of energy |
32 (SE 2) g/day 19 (SE 1) % of energy |
NR | |
| Protein (g/day or % energy) | 69 (SE 2) g/day 19 (SE 0) % of energy |
63 (SE 3) g/day 18 (SE 1) % of energy |
NR | |
| Fibre (g/day) | 30 (SE 1) g/day | 23 (SE 1) g/day | NR | |
| GI | 45 (SE 1) | 70 (SE 1) | NR | |
| McMillan‐Price 2006 high protein | Energy (kJ) | 5970 (SE 190) kJ/day | 5950 (SE 170) kJ/day | NS |
| Carbohydrate (g/day or % energy) | 143 (SE 7) g/day 40 (SE 2) % of energy |
146 (SE 6) g/day 42 (SE 1) % of energy |
NR | |
| Fat (g/day or % energy) | 48 (SE 2) g/day 29 (SE 1) % of energy |
44 (SE 2) g/day 27 (SE 1) % of energy |
NR | |
| Protein (g/day or % energy) | 93 (SE 3) g/day 26 (SE 1) % of energy |
95 (SE 2) g/day 28 (SE 1) % of energy |
NR | |
| Fibre (g/day) | 24 (SE 1) g/day | 21 (SE 1) g/day | NR | |
| GI | 44 (SE 1) | 59 (SE 1) | NR | |
| Melanson 2012 | Energy (kJ/day) | ‐3270.2 (SD 2734.2) kJ/day | ‐2608.3 (SD 2032.6) kJ/day | NS |
| Carbohydrate (% energy) | ‐0.3 (SD 8.0) % of energy | +1.3 (SD 9.6) % of energy | NS | |
| Fat (% energy) | ‐3.2 (SD 7.9) % of energy | ‐4.3 (SD 7.8) % of energy | NS | |
| Protein (% energy) | +4.4 (SD 5.7) % of energy | +3.3 (SD 5.3) % of energy | NS | |
| Fibre (g/day) | +3.6 (SD 4.5) g/day | ‐2.4 (SD 5.6) g/day | < 0.001 | |
| GI | 42.43 (SD 7.35) | 46.69 (SD 7.74) | < 0.05 | |
| Philippou 2008 | Energy (kJ/day, median, IQR) | 7418 (8661 to 10205) kJ/day | 5472 (5129 to 8133) kJ/day | NS |
| Carbohydrate (%energy, median, IQR) | 46.0 (37.8 to 51.0) % of energy | 49.4 (47.8 to 51.7) % of energy | NS | |
| Fat (%energy, median, IQR) | 32.8 (31.3 to 37.1) % of energy | 29.2 (25.2 to 34.5) % of energy | NS | |
| Protein (% energy, median, IQR) | 17.1 (15.7 to 17.4) % of energy | 19.6 (14.0 to 23.1) % of energy | NS | |
| Fibre (g/day, median, IQR) | 8.0 (7.6 to 10.1) g/day | 10.0 (6.1 to 11.1) g/day | NS | |
| GI (median, IQR) | 51.3 (51.0 to 52.0) | 59.3 (59.2 to 64.0) | < 0.05 | |
| Philippou 2009 | Energy (kJ/day) | ‐1870 (SD 2088) kJ/day compared to baseline | ‐987 (SD 2644) kJ/day compared to baseline | 0.3 |
| Carbohydrate (g/day or % energy) | 224 (SD 50) g/day | 278 (SD 7) g/day | < 0.001 | |
| Fat (g/day or % energy) | NR | NR | ||
| Protein (g/day or % energy) | NR | NR | ||
| Fibre (g/day) | NR | NR | ||
| GI | 50.6 (SD 4.6) | 63.2 (SD 5.6) | < 0.001 | |
| Philippou 2009a | Energy (kJ/day) | 6054 (SD 1590) kJ/day | 6711 (SD 1439) kJ/day | 0.2 |
| Carbohydrate (% energy) | 47.6 (SD 6.7) % of energy | 48.5 (SD 7.0) % of energy | 0.6 | |
| Fat (% energy) | 31.8 (SD 5.8) % of energy | 30.9 (SD 9.0) % of energy | 0.7 | |
| Protein (% energy) | 19.5 (SD 4.2) % of energy | 19.3 (SD 4.9) % of energy | 0.8 | |
| Fibre (g/day) | 13.2 (SD 5.7) g/day | 10.8 (SD 4.7) g/day | 0.2 | |
| GI | 49.7 (SD 5.7) | 63.7 (SD 9.4) | < 0.001 | |
| Raatz 2005 | Energy (kJ/day) | mean daily energy level (initial 12 weeks) for whole population 7883 (SE 57.8) kJ/day (range 5021 to 11,297 kJ/day), not reported for groups separately | ||
| Carbohydrate (g/day or % energy) | 60% of energy (initial 12 weeks) | 60% of energy (initial 12 weeks) | NS | |
| Fat (% energy) | 25% of energy (initial 12 weeks) | 25% of energy (initial 12 weeks) | NS | |
| Protein (% energy) | 15% of energy (initial 12 weeks) | 15% of energy (initial 12 weeks) | NS | |
| Fibre (g/day) | 16.7 g/4184 kJ (initial 12 weeks) | 9.1 g/4184 kJ (initial 12 weeks) | NS | |
| GI | 33 (initial 12 weeks) at 24 weeks, low GI group at significantly lower GI than high GI group (P = 0.014), no significant difference any more at 36 weeks (P = 0.14) |
63 (initial 12 weeks) | ||
| Randolph 2014 | Energy (kcal/day) | baseline: 1924.3 (SE 147.7) mean of weeks 3, 6, 9: 1624.9 (SE 81.4) |
baseline: 1712.3 (SE 76.7) mean of weeks 3, 6, 9: 1573.9 (SE 102.0) |
NS |
| Carbohydrate (g/day) Carbohydrate(% energy) |
baseline: 239.2 (SE 20.4) mean of weeks 3, 6, 9: 219.1 (SE 10.2) baseline: 49.7 (SE 1.8) mean of weeks 3, 6, 9: 52.3 (SE 2.8) |
baseline: 211.7 (SE 8.8) mean of weeks 3, 6, 9: 197.4 (SE 11.2) baseline: 50.7 (SE 2.1) mean of weeks 3, 6, 9: 51.6 (SE 0.9) |
NS | |
| Fat (g/day) Fat (% energy) |
baseline: 73.1 (SE 7.2) mean of weeks 3, 6, 9: 49.1 (SE 4.6) baseline: 33.4 (SE 1.8) mean of weeks 3, 6, 9: 26.6 (SE 1.6) |
baseline: 59.9 (SE 5.1) mean of weeks 3, 6, 9: 52.6 (SE 6.2) baseline: 30.5 (SE 1.6) mean of weeks 3, 6, 9: 28.8 (SE 1.4) |
NS | |
| Protein (g/d) Protien (% energy) |
baseline: 84.7 (SE 6.1) mean of weeks 3, 6, 9: 79.2 (SE 5.7) baseline: 18.4 (SE 1.0) mean of weeks 3, 6, 9: 18.6 (SE 1.2) |
baseline: 76.6 (SE 5.0) mean of weeks 3, 6, 9: 73.4 (SE 4.9) baseline: 18.0 (SE 0.8) mean of weeks 3, 6, 9: 19.0 (SE 0.8) |
NS | |
| Fibre (g/day) | baseline: 23.9 (SE 2.1) mean of weeks 3, 6, 9: 23.8 (SE 1.5) |
baseline: 25.2 (SE 1.6) mean of weeks 3, 6, 9: 23.3 (SE 1.7) |
NS | |
| GI | baseline: 52.6 (SE 1.2) mean of weeks 3, 6, 9: 52.3 (SE 0.8) |
baseline: 55.4 (SE 1.1) mean of weeks 3, 6, 9: 53.3 (SE 0.8) |
unclear | |
| RISCK 2010 high MUFA | Energy (kJ/day) | ‐310 (95% CI: ‐760 to +150) MJ/day (8590 (SD 2110) for all during run‐in) |
‐540 (95% CI: ‐1000 to ‐80) kJ/day (8590 (SD 2110) for all during run‐in) |
NS |
| Carbohydrate (%energy) | +1.6 (95% CI: ‐0.2 to +3.4) % of energy (43.0 (SD 6.5) for all during run‐in) |
+1.9 (95% CI: +0.1 to +3.7) % of energy (43.0 (SD 6.5) for all during run‐in) |
NS | |
| Fat (%energy) | ‐2.2 (95% CI: ‐3.9 to ‐0.4) % of energy (37.9 (SD 5.3) for all during run‐in) |
‐2.3 (95% CI: ‐4.1 to ‐0.5) % of energy (37.9 (SD 5.3) for all during run‐in) |
NS | |
| Protein (g/day) | +3.4 (95% CI: ‐1.9 to +8.6) g/day (80.8 (SD 20.7) for all during run‐in) |
‐2.2 (95% CI: ‐7.5 to +3.1) g/day (80.8 (SD 20.7) for all during run‐in) |
NS | |
| Fibre (g/day) | NR | NR | ||
| GI | ‐8.3 (95% CI: ‐9.4 to ‐7.2) (63.5 (SD 3.6) for all during run‐in) |
‐0.2 (95% CI: ‐1.3 to +1.0) (63.5 (SD 3.6) for all during run‐in) |
< 0.05 | |
| RISCK 2010 low fat | Energy (kJ/day) | ‐1310 (95% CI: ‐1750 to ‐880) kJ/day (8590 (SD 2110) for all during run‐in) |
‐830 (95% CI: ‐1300 to ‐370) kJ/day (8590 (SD 2110) for all during run‐in) |
NS |
| Carbohydrate (%energy) | +8.5 (95% CI: +6.8 to +10.2) % of energy (43.0 (SD 6.5) for all during run‐in) |
+8.1 (95% CI: +6.3 to +9.9) % of energy (43.0 (SD 6.5) for all during run‐in) |
NS | |
| Fat (%energy) | ‐11.8 (95% CI: ‐13.5 to ‐10.1) % of energy (37.9 (SD 5.3) for all during run‐in) |
‐10.4 (95% CI: ‐12.2 to ‐8.6) % of energy (37.9 (SD 5.3) for all during run‐in) |
NS | |
| Protein (g/day) | ‐2.8 (95% CI: ‐7.8 to +2.2) g/day (80.8 (SD 20.7) for all during run‐in) |
‐0.30 (95% CI: ‐5.7 to +5.1) g/day (80.8 (SD 20.7) for all during run‐in) |
NS | |
| Fibre (g/day) | NR | NR | ||
| GI | ‐7.2 (95% CI: ‐8.3 to ‐6.1) (63.5 (SD 3.6) for all during run‐in) |
+0.9 (95% CI: ‐0.3 to +2.0) (63.5 (SD 3.6) for all during run‐in) |
< 0.05 | |
| Shikany 2005 | Energy (kJ/day) | 5335 (SE 276) kJ/day | 5565 (SE 305) kcal/day | NS |
| Carbohydrate (g/day) | 166 (SE 11) g/day | 190 (SE 12) g/day | NS | |
| Fat (g/day) | 37.9 (SE 2.8) g/day | 40.3 (SE 3.1) g/day | NS | |
| Protein (g/day) | 63.4 (SE 3.4) g/day | 56.9 (SE 3.7) g/day | NS | |
| Fibre (g/day) | NR | NR | ||
| GI | 55.2 (SE 1.0) | 57.7 (SE 1.1) | P < 0.05 | |
| Sichieri 2007 | Energy (MJ/day) | 11200 (SD 7000) MJ/day | 14000 (SD 9100) kJ/day | NS |
| Carbohydrate (%energy) | 59.5 (SD 6.3) % of energy | 61.6 (SD 6.2) % of energy | NS | |
| Fat (%energy) | 27.2 (SD 4.6) % of energy | 26.1 (SD 4.7) % of energy | NS | |
| Protein (%energy) | NR | NR | NS | |
| Fibre (g/day) | 36.0 (SD 21) g/day | 44.5 (SD 27) g/day | NS | |
| GI | 30 (SD 54) | 72 (SD 40) | 0.02 | |
| Solomon 2010 | Energy (kJ/day) | 7364 (SE 456) kJ/day | 7494 (SE 347) kJ/day | NS |
| Carbohydrate (g/day or % energy) | 247 (SE 16) g/day 54.7 (SE 0.1) % of energy |
258 (SE 12) g/day 55.6 (SE 0.2) % of energy |
NS | |
| Fat (g/day or % energy) | 56.7 (SE 3.4) g/day 28.3 (SE 0.1) % of energy |
57.3 (SE 2.9) g/day 27.8 (SE 0.2) % of energy |
NS | |
| Protein (g/day or % energy) | 76.8 (SE 4.8) g/day 17.0 (SE 0.1) % of energy |
76.7 (SE 3.5) g/day 16.6 (SE 0.1) % of energy |
NS | |
| Fibre (g/day) | 28.5 (SE 1.6) g/day | 26.1 (SE 1.4) g/day | NS | |
| GI | 39.8 (SE 0.3) | 80.0 (SE 0.6) | < 0.05 | |
| Venn 2010 | Energy (kJ/day, median and IQR) | 6350 (5559, 7297) kJ/day | 6508 (5845, 7311) kJ/day | NS |
| Carbohydrate (% energy, median and IQR) | 51 (48, 57) % of energy | 52 (46, 56) % of energy | NS | |
| Fat (% energy, median and IQR) | 27 (21, 31) % of energy | 26 (22, 29) % of energy | NS | |
| Protein (% energy, median and IQR) | 20 (17, 22) % of energy | 20 (18, 23) % of energy | NS | |
| Fibre (g/day, median and IQR) | 25 (21, 34) g/day | 23 (18, 28) g/day | NS | |
| GI (median and IQR) | 47 (43, 50) | 51 (49, 54) | 0.011 | |
| Wolever 2002 | Energy (kJ/day) | 7090 (SE 280) kJ/day | 7170 (SE 390) kJ/day | NS |
| Carbohydrate (% energy) | 54.8 (SE 1.7) % of energy | 52.8 (SE 2.0) % of energy | NS | |
| Fat (% energy) | 24.7 (SE 1.6) % of energy | 27.9 (SE 1.9) % of energy | NS | |
| Protein (% energy) | 19.4 (SE 0.5) % of energy | 17.4 (SE 0.7) % of energy | < 0.05 | |
| Fibre (g/day) | 36.2 (SE 2.6) g/day | 22.7 (SE 2.2) g/day | < 0.05 | |
| GI | 54.4 (SE 0.7) | 59.3 (SE 0.6) | < 0.05 |
KJ: kilojoules; SE: standard error; SD: standard deviation; g: grams; kcal: kilocalories; GI: glycaemic index; IQR: interquartile range; d: day; MJ: microjoule
Bellisle 2007.
| Study characteristics | ||
| Methods |
Setting: France; 16 Weight Watchers classes in Paris; visits of the Hotel‐Dieu hospital for anthropometric and biochemical assessments. Design: cluster randomisation (Weight Watchers classes randomised), parallel group. Dates: classes attended January to March 2004. Intervention duration: 12 weeks. Follow‐up: no postintervention follow‐up. Focus: to assess whether the Weight Watchers weight loss system could be improved by encouraging dieters to select low GI, high carbohydrate foods. |
|
| Participants |
N: 96 (35/51 completers in the intervention group and 30/45 in the control group). Inclusion criteria: female, age 18 years or over, BMI > 25 kg/m2; recruited among first time applicants to the Weight Watchers programme. Exclusion criteria: chronic disease (diabetes mellitus, eating disorders, psychiatric disorders), pharmacological treatment. Age (years) (mean (SE)):intervention: 46.1 (SE 2.3); control: 45.3 (SE 2.2). Sex:intervention: 100% women; control: 100% women. Ethnicity: not reported. Cardiovascular risk status (mean (SE)): BMI (kg/m2):intervention: 30.2 (SE 0.7); control: 30.4 (SE 0.8). Total cholesterol (mmol/L):intervention: 5.64 (SE 0.19); control: 5.88 (SE 0.16). HDL cholesterol (mmol/L):intervention: 1.9 (SE 0.07); control: 1.81 (SE 0.09). LDL cholesterol (mmol/L):intervention: 3.56 (SE 0.19); control: 3.91 (SE 0.14). Blood pressure (mmHg):intervention: systolic 120.6 (SE 2.5), diastolic 74.1 (SE 1.8); control: systolic 118.6 (SE 3.0), diastolic 72.8 (SE 2.2). Medications used: not reported. |
|
| Interventions |
Low GI group (n = 51): standard Weight Watchers POINTS Weight Loss System plus additional information about the GI of foods based on the International Table of Glycaemic Index and Glycaemic Load Values (Foster‐Powell 2002); Weight Watchers booklets modified to emphasise low GI foods, participants encouraged to include at least one low GI food (GI < 55) at each meal. Control (n = 45): standard Weight Watchers POINTS Weight Loss System with additional information about the French National Nutrition and Health Programme, not specifically dealing with GI (advice similar to that of Weight Watchers programme). Description of dietary intervention: booklets with information on food selection, weekly Weight Watchers class, increased consumption of fruit and vegetables, Ca and carbohydrate, reduced total fat, increased daily physical activity; special training for class leaders. Incentives: all costs associated with hospital visits were covered; participants were offered three coupons for one free weekly attendance at Weight Watchers classes. Cointerventions in both groups: none. Assessment of dietary adherence: food choice checklist completed for 3 days during a randomly selected week of the 12 week programme (2 weekdays and one weekend day). Was the diet energy‐reduced? yes. Comparability of diet composition: no details of diet composition, difference in food selection based on GI reported, see Table 6. Change in diet over time: diets of both groups tended to be rich in low GI foods (mainly fruit and vegetables), but the low GI group included fewer high GI choices. |
|
| Outcomes | Outcomes (not clearly divided into primary and secondary): weight (basis of power analysis), BMI, blood pressure, fasting glucose, insulin, blood lipids, insulin sensitivity (HOMA); behavioural and motivational questionnaires (Three Factor Eating Questionnaire, Dutch Eating Questionnaire); hunger (VAS), desire to eat (VAS). | |
| Funding / conflict of interest | Research grant by Weight Watchers International. | |
| Notes | ||
| Risk of bias | ||
| Bias | Authors' judgement | Support for judgement |
| Random sequence generation (selection bias) | Unclear risk | Classes were randomised, but method not stated. |
| Allocation concealment (selection bias) | Unclear risk | Allocation method not reported. |
| Blinding of outcome assessment (detection bias) All outcomes | Unclear risk | Blinding method not reported. |
| Incomplete outcome data (attrition bias) All outcomes | High risk | High attrition rate; reasons included lack of time, pregnancy, illness, personal reasons; no difference in anthropometric and biochemical parameters between completers and non‐completers but women were younger in the non‐completers. Loss to follow‐up / drop‐outs: Low GI group: 16/51 (31.4%). Control: 15/45 (33.3%). |
| Intention‐to‐treat analysis | High risk | Not explicitly reported, but probably not as results were only reported for completers. |
| Selective reporting (reporting bias) | Unclear risk | Not enough detail to judge. |
| Groups comparable at baseline | Unclear risk | With respect to demographic variables, body composition and biochemical markers but only study completers reported. |
| Other bias | Unclear risk | Power analysis (90% power to detect a change in weight with 18 participants per group); randomised as clusters but this was not considered in the analysis. |
Buscemi 2013.
| Study characteristics | ||
| Methods |
Setting: Italy; medical centre. Design: individual randomisation, parallel group. Dates: study period November 2010 to February 2012. Intervention duration: 3 months. Follow‐up: intervention phase followed by 12 month weight maintenance phase, but results not reported. Focus: to assess the effects of hypocaloric diets with different glycaemic indexes and glycaemic loads on endothelial function and glycaemic variability in nondiabetic participants at increased cardiovascular risk. |
|
| Participants |
N: 47 (19/22 completers in the intervention group and 21/25 in the control group). Inclusion criteria: age 18 to 60 years, BMI 25.0 to 49.9 kg/m2, presence of ≥ 2 metabolic syndrome diagnostic criteria: waist circumference > 80 cm for women and 94 cm for men, serum triglycerides >150 mg/dL, serum HDL‐cholesterol < 50 mg/dL for women or 40 mg/dL for men, blood pressure > 130 mmHg for systolic or > 85 mmHg for diastolic blood pressure, fasting plasma glucose ≥ 100 mg/dL; recruited through announcement posted at medical centre. Exclusion criteria: diabetes mellitus, gastrointestinal or connective diseases, chronic pancreatitis, liver or kidney disease, use of acetylsalicylic acid or other antiplatelet drugs, statins or fibrates, oral hypoglycaemic drugs, nitrates, nonsteroidal anti‐inflammatory drugs, corticosteroids, drugs interfering with coagulation, supplementation with vitamins and/or antioxidants, pregnancy or lactation in the last six months, regular sports activity. Age (years) (mean (SD)):intervention: 51 (SD 8) (20 to 60); control: 49 (SD 8) (21 to 59). Sex (% men):intervention: 52.6%; control: 42.9%. Ethnicity: not reported. Cardiovascular risk status (mean (SD)): BMI (kg/m2): intervention: 34.3 (SD 6.6) (25.1 to 49.6); control: 34.5 (SD 5.1) (27.6 to 47.5). Total cholesterol (mmol/L): intervention: 5.48 (SD 1.01); control: 5.69 (SD 1.11). HDL cholesterol (mmol/L): intervention: 1.23 (SD 0.31); control: 1.44 (SD 0.43). LDL cholesterol (mmol/L): intervention: 3.88 (SD 0.96); control: 3.49 (SD 0.88). Blood pressure (mmHg): intervention: systolic 128 (SD 15), diastolic 77 (SD 8); control: systolic 124 (SD 13), diastolic 76 (SD 11). Smokers: intervention: 10.5%; control: 14.3%. Prediabetes: intervention: 42.1%; control: 38.1%. Hypertension: intervention: 42.1%; control: 42.9%. Medications used:intervention: 26.3% ACE inhibitors/angiotensin receptor blockers, 15.8% β‐blockers, 10.5% Ca channel blockers, 5.3% α‐blockers, 15.3% diuretics; control: 14.3% ACE inhibitors/angiotensin receptor blockers, 19.0% β‐blockers, 4.8% Ca channel blockers, 0% α‐blockers, 23.8% diuretics. |
|
| Interventions |
Low GI group (n = 22): hypocaloric low GI diet. Control (n = 25): hypocaloric high GI diet. Description of dietary intervention: diets were designed using lists of food high or low in GI with participants receiving about 20 kcal per kg of body weight up to 2000 kcal/day (1400, 1600, 1800, and 2000 kcal/day); after the initial 3 month intervention phase, participants were assigned to a weight maintenance phase with the same Mediterranean diet for 12 months (results not reported). Incentives: no incentives. Cointerventions in both groups: none. Assessment of dietary adherence: participants met with a registered dietitian weekly (maximum of 2 missed visits per participant allowed), received nutritional counselling, and compiled a 3‐day food diary (Friday, Saturday and Sunday) every 2 weeks; adherence with prescribed diets was > 90% for both groups. Was the diet energy‐reduced? yes. Comparability of diet composition: yes, see Table 6. Change in diet over time: prescribed diet. |
|
| Outcomes | Outcomes (not clearly divided into primary and secondary): flow‐mediated dilatation (basis of power analysis), body composition and fat distribution, carotid intima thickness, renal ultrasound analysis, 48‐h continuous subcutaneous glucose monitoring, lipid levels, uric acid, plasma glucose, plasma insulin, HbA1c, insulin resistance (HOMA) | |
| Funding / conflict of interest | No funding, authors declared that they had no financial or other conflict of interest. | |
| Notes | ||
| Risk of bias | ||
| Bias | Authors' judgement | Support for judgement |
| Random sequence generation (selection bias) | Low risk | Computer‐generated random list. |
| Allocation concealment (selection bias) | Unclear risk | Not reported, random number list was generated by one of the investigators. |
| Blinding of outcome assessment (detection bias) All outcomes | Low risk | Staff members who obtained outcome measurements were not informed of the diet group assignment and intervention staff members who delivered the intervention did not take outcome measurements. |
| Incomplete outcome data (attrition bias) All outcomes | Unclear risk | Reasons for non‐completion not reported. Loss to follow‐up / drop‐outs: Low GI group: 3/22 (13.6%). Control: 4/25 (16%). |
| Intention‐to‐treat analysis | High risk | Not explicitly reported, results were only reported for completers. |
| Selective reporting (reporting bias) | Low risk | All outcomes stated in protocol reported. |
| Groups comparable at baseline | Unclear risk | With respect to demographic variables, body composition, biochemical markers, medication, comorbidities, but only study completers reported. |
| Other bias | Unclear risk | Power analysis (80% power to detect a change in flow‐mediated dilatation with 17 participants per group). |
DiOGenes 2011a high protein.
| Study characteristics | ||
| Methods | See previous ‐ study has two independent relevant comparisons. | |
| Participants | ||
| Interventions | ||
| Outcomes | ||
| Funding / conflict of interest | ||
| Notes | ||
| Risk of bias | ||
| Bias | Authors' judgement | Support for judgement |
| Random sequence generation (selection bias) | Low risk | See above ‐ study has two independent relevant comparisons. |
| Allocation concealment (selection bias) | Unclear risk | See above. |
| Blinding of outcome assessment (detection bias) All outcomes | Unclear risk | See above. |
| Incomplete outcome data (attrition bias) All outcomes | Unclear risk | See above. |
| Intention‐to‐treat analysis | Low risk | See above. |
| Selective reporting (reporting bias) | Unclear risk | See above. |
| Groups comparable at baseline | Low risk | See above. |
| Other bias | Unclear risk | See above. |
DiOGenes 2011 low protein.
| Study characteristics | ||
| Methods |
Setting: 8 European countries (Netherlands, Denmark, UK, Greece, Spain, Germany, Bulgaria, Czech Republic); research centres. Design: cluster randomisation (by family), parallel group. Dates: enrolment November 2005 to April 2007. Intervention duration: 26 weeks, extension to 1 year in 2 centres (Copenhagen, Maastricht). Follow‐up: no postintervention follow‐up. Focus: to examine the effects of weight loss or diets varying in protein content and GI without further changes in body weight on cardiovascular risk factors. |
|
| Participants |
N: 773 adults (95/150 analysed in the low GI/low protein group, 84/155 high GI/low protein, 108/159 low GI/high protein, 96/155 high GI/high protein, 104/154 control (not considered here)). Inclusion criteria: generally healthy families (two parents or single parent) with at least 1 parent overweight (BMI ≥ 27 kg/m2) and aged < 65 years and with at least 1 child aged between 5 and 18 years. Exclusion criteria: (for adults) BMI > 45 kg/m2, liver or kidney diseases, cardiovascular diseases, diabetes mellitus, special diets/eating disorders, systemic infections/chronic diseases, cancer within the last 10 years, weight change > 3 kg within the previous 3 months, other clinical disorders or use of prescription medication that might interfere with the outcome of the study, planned major changes in physical activity, pregnancy/lactation, individuals following special diet; recruitment through various strategies (referrals from GPs, flyers and posters, radio, TV, newspapers, internet). Age (years) (mean (SD)):low GI/low protein: 42.1 (SD 5.8); high GI/low protein: 41.6 (SD 5.9); low GI/high protein: 42.6 (SD 6.3); high GI/high protein: 42.2 (SD 5.6) (all numbers based on study completers). Sex (% men):low GI/low protein: 34.7%; high GI/low protein: 32.2%; low GI/high protein: 35.8%; high GI/high protein: 38.7% (all numbers based on ITT group). Ethnicity: not reported. Cardiovascular risk status (mean (SD)): BMI (kg/m2): 32.5 to 36.1 (only reported for centres), total group 33.8. Total cholesterol (mmol/L):low GI/low protein: 4.14 (SD 0.91); high GI/low protein: 4.12 (SD 0.92); low GI/high protein: 4.17 (SD 0.87); high GI/high protein: 4.21 (SD 0.98). HDL cholesterol (mmol/L):low GI/low protein: 1.13 (SD 0.28); high GI/low protein: 1.17 (SD 0.25); low GI/high protein: 1.16 (SD 0.29); high GI/high protein: 1.14 (SD 0.27). LDL cholesterol (mmol/L):low GI/low protein: 2.54 (SD 0.76); high GI/low protein: 2.42 (SD 0.79); low GI/high protein: 2.54 (SD 0.81); high GI/high protein: 2.56 (SD 0.81). Blood pressure (mmHg):low GI/low protein: systolic 118.6 (SD 9.4), diastolic 73.9 (SD 13.7); high GI/low protein: systolic 115.5 (SD 13.9), diastolic 71.4 (SD 9.2); low GI/high protein: systolic 118.8 (SD 13.3), diastolic 73.5 (SD 9.6); high GI/high protein: systolic 120.1 (SD 15.0), diastolic 73.4 (SD 10.3). Medications used: not reported. |
|
| Interventions |
Low GI/low protein (n = 150): low GI (difference 15 points between high and low GI diets), low protein diet (10 to 15% energy from protein, 57 to 62% from carbohydrate). High GI/low protein (n = 155): high GI, low protein diet (10 to 15% energy from protein, 57 to 62% from carbohydrate). Low GI/high protein (n = 159): low GI, high protein diet (23 to 28% energy from protein, 45 to 50% from carbohydrate). High GI/high protein (n = 155): high GI, high protein diet (23 to 28% energy from protein, 45 to 50% from carbohydrate). (Control diet (n = 154): control diet according to accepted national guidelines (12 to 15% energy from protein, 55 to 63% from carbohydrate) (not considered here)). Description of dietary intervention: eligible adults followed an 8‐week low calorie diet (800 kcal/day, Modifast); about 200 g (up to 400 g) of additional raw vegetables per day were allowed; the families of adults achieving a weight loss of ≥ 8% (mean weight loss 11.2 (SD 3.5 kg)) were randomised to one of the 5 ad libitum diets above; participants were instructed to maintain weight loss during ad libitum phase; the average amount of plant protein intake of total protein was 36%; dietary counselling every 2 weeks during first 6 weeks (with children, where possible), then monthly; families were provided with recipes, cooking and behavioural advice; point‐based system to achieve desired macronutrient composition; in 2 centres ('shop centres', Copenhagen and Maastricht), adherence to dietary compositions (food lists) was optimised during the first 6 months by providing > 80% of all relevant foods for each of the diet groups at no cost through a lab‐based shop system. Incentives: free food in 'shop centres'. Cointerventions in both groups: none. Assessment of dietary adherence: (adults) 3‐day food diaries (2 weekdays, 1 weekend day) before study visit 1, 2 to 4 weeks after randomisation and before study visits 3 and 4. Was the diet energy‐reduced? no. Comparability of diet composition: yes, see Table 6. Change in diet over time: energy reduced in all groups. |
|
| Outcomes |
Primary outcomes: weight, body composition, proportion maintaining > 5% or > 10% of initial weight loss, dropout rate. Secondary outcomes: abdominal fat mass, risk factors for type 2 diabetes and cardiovascular disease (including blood lipids, blood pressure), appetite and satiety hormones, physical activity, fat tissue mRNA, certain blood peptide and protein biomarkers; genetic profiles, measurements of basal metabolic rate, free‐living energy expenditure; psychological features (appetite and food preferences, health promoting behaviour, attitudes towards eating, social support). |
|
| Funding / conflict of interest | Funding by European Commission Food Quality and Safety Priority of the 6th Framework Programme (contract FP6‐2005‐513946); local sponsors made financial contributions to the shop centres and local food manufacturers provided a number of foods free of charge (but had no influence on the selection of foods found in the two shops, nor were they in any other way involved in the study). | |
| Notes | ||
| Risk of bias | ||
| Bias | Authors' judgement | Support for judgement |
| Random sequence generation (selection bias) | Low risk | Web‐based randomisation programme; block randomisation with stratification according to centre, number of eligible parents within the family, number of parents with BMI > 34 kg/m2. |
| Allocation concealment (selection bias) | Unclear risk | Not reported. |
| Blinding of outcome assessment (detection bias) All outcomes | Unclear risk | The investigators who performed the statistical analysis had not been in contact with the participants; but blinding of outcome assessment unclear. |
| Incomplete outcome data (attrition bias) All outcomes | Unclear risk | Slightly different numbers given in different papers, following numbers according to Larsen et al. 2010 NEJM; reasons for dropout not given. Loss to follow‐up/dropouts: Low GI/low protein: 44/150 (29.3%). High GI/low protein: 58/155 (37.4%). Low GI/high protein: 35/159 (22.0%). High GI/high protein: 48/155 (31.0%). (Control diet: 40/154 (26.0%)) |
| Intention‐to‐treat analysis | Low risk | 'intention‐to‐treat analyses were performed including...' |
| Selective reporting (reporting bias) | Unclear risk | Not enough information to judge. |
| Groups comparable at baseline | Unclear risk | With respect to demographic variables, body composition, biochemical markers, but only study completers reported. |
| Other bias | Unclear risk | Power analysis (97% power to detect a change in weight with 918 participants; slightly underpowered). |
Frost 2004.
| Study characteristics | ||
| Methods |
Setting: UK; Hammersmith Hospital, London. Design: individual randomisation, parallel group. Dates: unclear, patients entered on a cardiac intervention database for coronary bypass grafting or cardiac angioplasty in 1997 and 1998 were selected and received a letter of invitation to participate. Intervention duration: 12 weeks. Follow‐up: no postintervention follow‐up. Focus: to assess whether low GI diets improve the metabolic profile of patients having undergone coronary artery bypass grafting (CABG). |
|
| Participants |
N: 57 (55/57 completed the study). Inclusion criteria: age 30 to 70 years with coronary heart disease (myocardial infarction, unstable angina, or angiographically proven coronary artery disease). Exclusion criteria: cardiomyopathy, serious organ disease, systemic illness, chronic alcohol abuse, serious psychiatric illness, poor compliance with food diaries or failed medical screening. Age (years) (mean (SD)):intervention: 63.6 (SD 9.4); control: 61.8 (SD 9.0). Sex (% men):intervention: 88.5%; control: 86.2%. Ethnicity: not reported. Cardiovascular risk status (mean (SD or SE)): BMI (kg/m2): intervention: 26.9 (SD 3.3); control: 28.7 (SD 4.6). Total cholesterol (mmol/L): intervention: 4.77 (SE 0.15); control: 4.94 (SE 0.20). HDL cholesterol (mmol/L): intervention: 1.11 (SE 0.04); control: 1.09 (SE 0.05). LDL cholesterol (mmol/L): intervention: 2.89 (SE 0.13); control: 3.04 (SE 0.16). Blood pressure (mmHg): intervention: systolic 141 (SE 6), diastolic 81 (SE 5); control: systolic 140 (SE 4), diastolic 80 (SE 2). Smokers: intervention: 38.5% never, 53.8% ex‐smoker, 7.7% smoker; control: 31.0% never, 62.1% ex‐smoker, 6.9% smoker. CABG: intervention: 84.6%; control: 89.7%. Angioplasty: intervention: 7.7%; control: 6.9%. CABG and angioplasty: intervention: 7.7%; control: 3.4%. Length of diagnosis CABG (years) (mean (SD)): intervention: 7.0 (SD 6.5); control: 6.5 (SD 6.5). Medications used:intervention: 58% statins, 23% ACE inhibitors, 19% diuretics, 73% aspirin; control: 86% statins, 28% ACE inhibitors, 28% diuretics, 100% aspirin. |
|
| Interventions |
Low GI group (n = 26): healthy eating advice emphasising low GI carbohydrates (GI < 85). Control (n = 29): healthy eating advice only. Description of dietary intervention: one‐to‐one nutritional counselling, participants supported by regular visits to the unit (weeks 0, 4 and 8) and telephone calls; advice based on current health education guidelines advocated by the COMA panel; aim to provide a diet with 50% carbohydrate and 35% of total energy as fat; unrefined high cereal fibre carbohydrates were encouraged and fat content specified to be < 10% saturated fat, 10% polyunsaturated fat and 15% monounsaturated fat; daily target of five portions of fruit and vegetables; all patients with BMI > 28 kg/m2 were given advice to lose weight with target 1 kg weight loss per month. Low GI also at least 1 low GI food at each meal. Liberal use of carbohydrates (pasta, basmati rice, wholegrains foods, granary breads, whole fruit, beans, vegetables, pulses or milk). Incentives: not reported. Cointerventions in both groups: none. Assessment of dietary adherence: participants were asked to keep a 7‐day diet diary on four occasions during the study period. Was the diet energy‐reduced? weight loss targeted in participants with BMI > 28 kg/m2. Comparability of diet composition: significant difference in daily energy, seeTable 6. Change in diet over time:intervention: GI decreased, fibre increased, sucrose decreased; control: reduced energy intake (P = 0.04 versus low GI) and sugar and GI. |
|
| Outcomes | Outcomes (not clearly divided into primary and secondary): total cholesterol (basis of power analysis), weight, BMI, HbA1c, fasting glucose, insulin, HOMA, fasting lipids, blood pressure. | |
| Funding / conflict of interest | Not reported. | |
| Notes | ||
| Risk of bias | ||
| Bias | Authors' judgement | Support for judgement |
| Random sequence generation (selection bias) | Low risk | Randomisation by random numbers. |
| Allocation concealment (selection bias) | Unclear risk | Method not reported. |
| Blinding of outcome assessment (detection bias) All outcomes | Unclear risk | Not reported. |
| Incomplete outcome data (attrition bias) All outcomes | Unclear risk | Not clearly reported, stated that 57 patients met the inclusion criteria and 55 completed the study, no further detail. |
| Intention‐to‐treat analysis | High risk | Not explicitly reported, but probably not as results were only reported for completers. |
| Selective reporting (reporting bias) | Unclear risk | Not enough information to judge. |
| Groups comparable at baseline | High risk | Significantly fewer participants in the low GI group took a statin (58% versus 86%, P = 0.02) and aspirin (73% versus 100%, P = 0.01). |
| Other bias | Unclear risk | Power analysis based on total cholesterol, but unclear if the study had adequate power. |
Ghani 2014a high insulin.
| Study characteristics | ||
| Methods | See previous ‐ study stratified analysis by fasting insulin levels. | |
| Participants | ||
| Interventions | ||
| Outcomes | ||
| Funding / conflict of interest | ||
| Notes | ||
| Risk of bias | ||
| Bias | Authors' judgement | Support for judgement |
| Random sequence generation (selection bias) | Low risk | See above. |
| Allocation concealment (selection bias) | Unclear risk | See above. |
| Blinding of outcome assessment (detection bias) All outcomes | Low risk | See above. |
| Incomplete outcome data (attrition bias) All outcomes | Unclear risk | See above. |
| Intention‐to‐treat analysis | Unclear risk | See above. |
| Selective reporting (reporting bias) | Low risk | See above. |
| Groups comparable at baseline | Low risk | See above. |
| Other bias | Unclear risk | See above. |
Ghani 2014 low insulin.
| Study characteristics | ||
| Methods |
Setting: not clear. Design: individual randomisation (1:1 ratio). Dates: not reported (all GDM deliveries registered in the institution between January and September were screened for eligibility). Intervention duration: 1 year. Follow‐up: no follow‐up (end of intervention). Focus: the effects of a lowering glycaemic index diet on fasting blood glucose, serum lipids, body weight and composition of post‐GDM women with varying fasting insulin levels. |
|
| Participants |
N: 77 (39 in the low GI group, 38 in the conventional dietary recommendations group). Inclusion criteria: BMI > 23 kg/m2, WC > 80 cm, increased risk of T2DM, dysglycaemia, 20 to 40 year old Asian women, previous history of GDM after a lapse of at least 2 months of their last GDM delivery, family history of diabetes. Exclusion criteria: current diagnosis of diabetes, BMI > 40 kg/m2, BMI < 19 kg/m2, enrolled in weight loss programmes, underlying health complications or those on drugs altering study outcomes, subjects who became pregnant during trial. Age (years) (mean (SD)):intervention (low fasting insulin): 31.2 (SD 4.2), intervention (high fasting insulin): 31.5 (SD 5.2); control (low fasting insulin): 31.0 (SD 3.8); control (low fasting insulin): 31.8 (SD 5.1). Sex:intervention: 100% women; control: 100% women. Ethnicity: not reported. Cardiovascular risk status (mean (SD)): Total cholesterol (mmol/L):intervention (low fasting insulin): 5.0 (SD 0.98), intervention (high fasting insulin): 5.2 (SD 0.7); control (low fasting insulin): 5.3 (SD 0.81), control (low fasting insulin): 5.2 (SD 0.77). HDL cholesterol (mmol/L):intervention (low fasting insulin): 1.5 (SD 0.4), intervention (high fasting insulin): 1.2 (SD 0.3); control (low fasting insulin): 1.5 (SD 0.5), control (high fasting insulin): 1.3 (SD 0.2). LDL cholesterol (mmol/L):intervention (low fasting insulin): 3.2 (SD 1.0), intervention (high fasting insulin): 3.4 (SD 0.8); control (low fasting insulin): 3.3 (SD 0.7), control (high fasting insulin): 3.3 (SD 0.7). Triglyceride (mmol/L):intervention (low fasting insulin): 0.7 (SD 0.2), intervention (high fasting insulin): 1.3 (SD 0.5) ; control (low fasting insulin): 0.93 (SD 2.8), control (high fasting insulin): 1.1 (SD 0.5). Weight (kg):intervention (low fasting insulin): 61.7 (SD 10.2), intervention (high fasting insulin): 71.1 (SD 11.3); control (low fasting insulin): 57.9 (SD 10.1), control (high fasting insulin): 72.1 (SD 10.6). Medications used: not reported. |
|
| Interventions |
Low‐GI education + conventional dietary recommendations: emphasis on reducing GI intake along with nutrition education to lower CVD and T2DM was provided. Conventional dietary recommendations: nutrition education to lower CVD and T2DM was provided. They provided a sample high GI menu. Description of dietary intervention: received GI education to substitute high GI foods with low GI options. Substituting high GI staple food (rice, bread, breakfast cereal) with low GI such as Basmati or brown rice and low GI multigrain bread. Restricting rice consumption to once per day, opting for low GI staple options like noodles or spaghetti and increasing consumption of legumes. Foods were classified as high, moderate and low GI to enable easy comprehension. Energy intake was individually calculated and a 500 calorie deficit was carried out. Prescribed diets were provided. Vouchers for low GI breads were provided. Nutrition education to lower CVD and T2DM was provided (minimise salt, sugar, and oil and more fruit and vegetables). Take home educational material was provided. Frequency of contact between the two groups was kept similar. Incentives: not reported. Cointerventions in both groups: none. Assessment of dietary adherence: not reported. Was the diet energy‐reduced? individually calculated with a 500 calorie deficit carried out. Comparability of diet composition: not clear, see Table 6. Change in diet over time: GI was significantly lower in the intervention group in comparison to the control. |
|
| Outcomes | Outcomes (not clearly divided into primary and secondary): total cholesterol, triglyceride, fasting lipids, blood pressure. | |
| Funding / conflict of interest | Noncommercial. | |
| Notes | Outcomes were stratified by insulin levels (low fasting insulin INS < 2 μIU ml, high fasting insulin INS ≥ μIU ml) Author contacted on 24.06.2016 for risk of bias, CVD outcomes and further details on control. Author reply provided published paper |
|
| Risk of bias | ||
| Bias | Authors' judgement | Support for judgement |
| Random sequence generation (selection bias) | Low risk | “eligible subjects were randomised according to an allocation list (allocation 1:1) generated using randomisation software from John Hopkins Division of Biostatics”. |
| Allocation concealment (selection bias) | Unclear risk | Not reported. |
| Blinding of outcome assessment (detection bias) All outcomes | Low risk | “Laboratory technicians and physicians reviewing the subjects were blinded to the randomisation”. |
| Incomplete outcome data (attrition bias) All outcomes | Unclear risk | Outcome data available for all randomized participants (n = 77). However, in an earlier investigation (part of the 1‐year study) authors stated attrition rate and reported different numbers (n = 60) to the 1‐year study: Intervention group (low LGI): 7/30 (23%). Control group (conventional healthy dietary recommendations): 5/30 (17%). |
| Intention‐to‐treat analysis | Unclear risk | Not stated. |
| Selective reporting (reporting bias) | Low risk | Reported outcomes that they intended to measure. |
| Groups comparable at baseline | Low risk | With respect to demographic variables, anthropometric and biochemical markers. |
| Other bias | Unclear risk | "Individual effect size values were calculated for changes in outcomes for each of the two diet groups and compared. ES values between 0.2 to 0.5, 0.5 to 0.8 and > 0.8 were taken to denote ‘small’, ‘moderate’ and ‘large’ changes in outcomes". Did not report how many participants required to reach this effect size. |
Hönemann 2010.
| Study characteristics | ||
| Methods |
Setting: Germany; Institute of Nutritional Psychology, Göttingen. Design: individual randomisation, parallel group. Dates: not reported. Intervention duration: 6 months. Follow‐up: no postintervention follow‐up. Focus: to assess the effects of several popular nutritional weight‐reducing strategies on cardiovascular risk factors. |
|
| Participants |
N: 160 (31/53 completers in the low GI/low fat group, 27/54 in the low fat group, 26/53 in the low CHO group). Inclusion criteria: female, age 25 to 70 years, BMI 25 to 42 kg/m2, no serious comorbidities; recruited through newspaper advertisements. Exclusion criteria: dieting attempts/weight reduction in the past 6 months, extreme low fat or low carbohydrate nutrition before the start of the study. Age (years) (mean (SD)):intervention: 51.1 (SD 8.6); control: 49.6 (SD 11.4). Sex:intervention: 100% women; control: 100% women. Ethnicity: not reported. Cardiovascular risk status (mean (SD)): Weight (kg):intervention: 84.1 (SD 9.8); control: 83.0 (SD 10.8). Total cholesterol (mmol/L):intervention: 5.35 (SD 0.77); control: 5.38 (SD 1.00). HDL cholesterol (mmol/L):intervention: 1.45 (SD 0.24); control: 1.48 (SD 0.33). LDL cholesterol (mmol/L):intervention: 3.59 (SD 0.66); control: 3.54 (SD 0.86). Blood pressure (mmHg):intervention: systolic 129.8 (SD 18.4), diastolic 82.9 (SD 8.7); control: systolic 127.7 (SD 16.7), diastolic 82.7 (SD 9.4). Medications used: not reported. |
|
| Interventions |
Low GI group (n = 53): low fat and reduction of glycaemic load, maximum 30 g fat per day in first 4 weeks, then maximum 45 g fat per day for 5 months; maximum 50 g carbohydrates with high glycaemic load. Control (n = 54): low fat only, maximum 30 g fat per day in first 4 weeks, then maximum 45 g fat per day for 5 months. (Low CHO group (n = 53): maximum 30 g carbohydrates per day in first 4 weeks, then maximum 60 g carbohydrates per day for 5 months (not considered here)). Description of dietary intervention: written information about the different diets according to study group; written instructions for behaviour change including increase in physical activity; other macronutrients could be consumed ad libitum. Cointerventions in both groups: none. Assessment of dietary adherence: weekly appointments for weight control, analysis of consumption using computer system at time 0, 1 month and 6 months; adherence intervention 69.8%, control 64.8%. Was the diet energy‐reduced? not reported. Comparability of diet composition: unclear, see Table 6. Change in diet over time:intervention: carbohydrate increased, fat decreased, small increase in fibre (+ 3.8 (SD 10.6) g/day); control: carbohydrate increased, fat decreased. |
|
| Outcomes | Outcomes (not clearly divided into primary and secondary): weight (basis of power analysis), blood pressure, blood lipids, blood glucose, B vitamins, homocysteine. | |
| Funding / conflict of interest | Funded by Stifterverband für die Deutsche Wissenschaft; authors declared that they had no conflicts of interest. | |
| Notes | ||
| Risk of bias | ||
| Bias | Authors' judgement | Support for judgement |
| Random sequence generation (selection bias) | Unclear risk | Allocation method not reported. |
| Allocation concealment (selection bias) | Unclear risk | Allocation method not reported. |
| Blinding of outcome assessment (detection bias) All outcomes | Unclear risk | Not reported. |
| Incomplete outcome data (attrition bias) All outcomes | High risk | High attrition rate, reasons for discontinuation not reported; 59/160 (36.9%) discontinued, 17/160 were excluded (12 due to high sensitive reactive C‐protein elevation > 8 mg/L, 2 due to lack of adherence). Loss to follow‐up/dropouts: Low GI group: 22/53 (41.5%); Control: 27/54 (50%). ( Low CHO group: 27/53 (50.9%)). |
| Intention‐to‐treat analysis | High risk | Per‐protocol analysis; weight reduction was also analysed in an intention‐to‐treat analysis. |
| Selective reporting (reporting bias) | Low risk | Reported outcomes that the authors intended to measure. |
| Groups comparable at baseline | High risk | With respect to demographic variables, most biochemical markers; triglycerides were significantly lower in the low GI group at baseline than in the control group. |
| Other bias | Low risk | Power analysis (80% power to detect a change in weight with 16 participants per group). |
Juanola‐Falgarona 2014.
| Study characteristics | ||
| Methods |
Setting: Spain, community‐dwelling, setting not clearly reported. Design: Parallel group design. Dates: Recruitment from 2010 to 2012. Enrolment: completed at the end of May 2012. Intervention duration: 6 months, February 2010 to November 2012. Follow‐up: No follow‐up (end of intervention at 6 months). Focus: to assess the efficacy of 2 moderate‐carbohydrate diets and an LF diet with different GIs on weight loss and the modulation of satiety, inflammation, and other metabolic risk markers. |
|
| Participants |
N: 121 (37/41 completers in the low GI group, 36/41 completers in the high GI group, 31/40 completers in the low fat group). Inclusion criteria: community‐dwelling, females and males, age 30 to 60 years, BMI between 27 and 35 kg/m2. Exclusion criteria: noncontrolled type 2 diabetes defined as glycated hemoglobin 8%, systolic blood pressure 159 mm Hg or diastolic blood pressure 99 mm Hg, plasma LDL cholesterol concentration 160 mg/dL, plasma triglyceride concentration 400 mg/dL, suspicion of secondary obesity, presence of any inflammatory or chronic obstructive pulmonary disease, infection, active neoplastic, endocrine, or hematologic disease at the time of the study, blood leukocyte count ≥ 11 × 106 cells, use of anti‐inflammatory drugs, steroids, hormones or antibiotics that could affect the variables analysed in the study, changes in medication for lipid profile, diabetes, or hypertension in the previous 3 months, active alcoholism or drug dependence, excluding tobacco use, a restrictive diet 3 months before the study or weight loss 0.5 kg in the previous 3 months, any medical condition that advised against being included in the study, problems understanding the study or anticipated difficulty in making dietary changes according to the Prochaska and DiClemente model. Age (years) (mean (SE)):low GI group: 42.5 (SE 1.1); high GI group: 44 (SE 1.3). Sex (% men):low GI group: 19%; high GI group: 17%. Ethnicity: not reported. Cardiovascular risk status (mean (SE)): Weight (kg):low GI group: 82.7 (SE 1.5); high GI group: 82.7 (SE 1.6). BMI (kg/m2):low GI group: 31.2 (SE 0.3); high GI group: 30.8 (SE 0.3). Total cholesterol (mmol/L):low GI group: 4.99 (SE 0.13); high GI group: 5.13 (SE 0.13). HDL cholesterol (mmol/L):low GI group: 1.45 (SE 0.05); high GI group: 1.47 (SE 0.05). LDL cholesterol (mmol/L):low GI group: 3.05 (SE 0.11); high GI group: 3.15 (SE 0.10). Blood pressure (mmHg):low GI group: systolic 128.0 (SE 2.7), diastolic 80.2 (SE 1.7); high GI group: systolic 128.0 (SE 2.4), diastolic 81.2 (SE 1.5). Medications used: not reported. |
|
| Interventions |
Low GI group (n = 41): encouraged to eat whole grain cereals and pulses as the base of their diet, avoid rice and potatoes, and were also recommended to select specific type of fruit (apple, orange, peach) and vegetables (courgette, tomato, onion) with low GI, avoiding the ripe pieces. They were advised to reduce the time cooking of carbohydrate‐rich foods in order to maintain the low GI of the foods. The principal animal protein sources of the diet were white fish and white meat.. High GI group (n = 41): encouraged to eat refined grain cereals, fruits (banana, kiwi, melon) and vegetables (carrot, green bean, cabbage) with high GI, and avoid pulses. Were advised to increase the time cooking in order to raise the GI of the foods. In this intervention group, intake of white fish and white meat were the main animal sources of protein. (Low fat group (n = 40): maintain a high‐GI diet but with lower fat content. They were encouraged to avoid red meat and blue fish due its high fat content and also recommended to eat low‐fat dairy products.(not considered here)). Description of dietary intervention: a booklet, biweekly menus and seasonal receipts. Cointerventions in both groups: diets were designed at 1500, 1700, 2000, and 2500 kcal/d, and all participants were categorized as having one of the 4 categories of dietary energy content after subtracting 500 kcal/d of the total estimated energy intake to achieve a desired weight loss. Assessment of dietary adherence: not reported. Was the diet‐energy reduced? subtracting 500 kcal/d of the total estimated energy intake to achieve a desired weight loss. Comparability of diet composition: not clear, see Table 6. Change in diet over time:low GI: energy, % of energy from carbohydrates, % of energy from fat and GI decreased; % of energy from protein and fibre increased. high GI: energy and % of energy from fat decreased; % of energy from carbohydrates, % of energy from protein, fibre, and GI increased. |
|
| Outcomes | Primary outcome: weight loss (power calculations based on body weight). | |
| Funding / conflict of interest | Grant from the Institut d’Investigació Sanitaria Pere Virgili (PV11059S) and Fondo de Investigación Sanitaria (PI120153). None of the authors had a personal or financial conflict of interest. | |
| Notes | Author contacted on 15.08.2016 to clarify risk of bias. Author did not reply. | |
| Risk of bias | ||
| Bias | Authors' judgement | Support for judgement |
| Random sequence generation (selection bias) | Low risk | 'Subjects fulfilling the inclusion criteria were randomly assigned to three equally sized different dietary intervention groups, by using a computer generated random‐number sequence’. |
| Allocation concealment (selection bias) | Unclear risk | Not reported. |
| Blinding of outcome assessment (detection bias) All outcomes | Low risk | 'Laboratory technicians and statisticians were blinded to group assignments'. |
| Incomplete outcome data (attrition bias) All outcomes | Low risk |
Loss to follow‐up/dropouts: Low GI group: 4/41 (9.8%); High GI group: 5/41 (12.2%). |
| Intention‐to‐treat analysis | Low risk | "All statistical analyses were conducted by both intention‐to‐treat (ITT) and per protocol (PP) approaches. The ITT analysis included all randomly assigned participants. The last observation carried forward was used for handling missing data". |
| Selective reporting (reporting bias) | High risk | Blood pressure parameters were not reported postintervention. Physical activity was assessed but not reported. |
| Groups comparable at baseline | Low risk | With respect to demographic variables, anthropometric and biochemical markers. |
| Other bias | Unclear risk | Power calculations based on body weight not outcomes of interest for this review; so the study may be underpowered for the outcomes of interest, i.e. lipids and blood pressure. |
McMillan‐Price 2006 high CHO.
| Study characteristics | ||
| Methods |
Setting: Australia; setting not clearly reported. Design: individual randomisation, parallel group. Dates: screening July 2002 to July 2004. Intervention duration: 12 weeks. Follow‐up: no postintervention follow‐up. Focus: to assess the relative effects of low GI and high protein diets on weight loss and cardiovascular risk factors. |
|
| Participants |
N: 129 (30/32 completers in the low GI/high CHO group, 27/32 in the high GI/high CHO group, 28/33 in the low GI/high protein group, 31/32 in the high GI/high protein group). Inclusion criteria: 18 to 40 years, BMI ≥ 25 kg/m2, body weight < 150 kg, weight fluctuations < 5 kg in past 2 months, willing to eat red meat and maintain current physical activity; recruited using notice boards and newspaper advertisements. Exclusion criteria: chronic illness, regular medication other than birth control pills, eating disorders, special diets, pregnancy, food allergy, and insufficient command of English. Age (years) (mean (SE)):low GI/high CHO: 30.5 (SE 1.4); high GI/high CHO: 31.8 (SE 1.7); low GI/high protein: 34.6 (SE 1.5); high GI/high protein: 30.2 (SE1.5). Sex (% men):low GI/high CHO: 28%; high GI/high CHO: 22%; low GI/high protein: 21%; high GI/high protein: 25%. Ethnicity: not reported. Cardiovascular risk status (mean (SE)): BMI (kg/m2):low GI/high CHO: 30.6 (SE 0.8; high GI/high CHO: 30.9 (SE 0.6); low GI/high protein: 32.1 (SE 0.9); high GI/high protein: 31.3 (SE 0.8). Total cholesterol (mmol/L):low GI/high CHO: 4.71 (SE 0.19); high GI/high CHO: 4.79 (SE 0.19); low GI/high protein: 4.83 (SE 0.14); high GI/high protein: 5.15 (SE 0.18). HDL cholesterol (mmol/L):low GI/high CHO: 1.17 (SE 0.05); high GI/high CHO: 1.29 (SE 0.07); low GI/high protein: 1.36 (SE 0.08); high GI/high protein: 1.16 (SE 0.05). LDL cholesterol (mmol/L):low GI/high CHO: 2.90 (SE 0.14); high GI/high CHO: 2.87 (SE 0.16); low GI/high protein: 2.89 (SE 0.14); high GI/high protein: 3.33 (SE 0.15). Blood pressure (mmHg): not reported. Medications used: none. |
|
| Interventions |
Low GI/high CHO (n = 32): high carbohydrate (55% of energy), average protein (15% of energy), based on low GI foods. High GI/high CHO (n = 32): high carbohydrate (55% of energy), average protein (15% of energy), based on high GI wholegrains. Low GI/high protein (n = 33): higher protein (25% of energy), reduced carbohydrate (45% of energy), based on lean red meat and low GI foods. High GI/high protein (n = 32): higher protein (25% of energy), reduced carbohydrate (45% of energy), based on lean red meat and high GI wholegrains. Description of dietary intervention: reduced energy, reduced fat (30% of energy), moderate fibre (30 g/day) eating plans; eating plans were devised to achieve the desired macronutrients and to provide 1400 kcal/day for women and 1900 kcal/day for men; additional lists of appropriate meals and snacks provided; all key carbohydrate and protein foods and some prepared meals were provided using a colour‐coded 'shop' system where participants could collect the respective food each week; participants met with a dietitian on the same day who encouraged adherence and answered queries. Incentives: as above. Cointerventions in both groups: none. Assessment of dietary adherence: 3‐day food diaries (2 weekdays, 1 weekend day) kept at baseline and during weeks 4 and 8. Was the diet energy‐reduced? yes. Comparability of diet composition: yes, see Table 6. Change in diet over time: change in energy and nutrient intake, as intended. |
|
| Outcomes | Outcomes: weight, fat mass, blood lipids, blood glucose, blood insulin, insulin sensitivity (HOMA), leptin. | |
| Funding / conflict of interest | Funded by the National Heart Foundation and Meat and Livestock Australia. | |
| Notes | ||
| Risk of bias | ||
| Bias | Authors' judgement | Support for judgement |
| Random sequence generation (selection bias) | Unclear risk | Stratified according to weight (< 80 kg, 80 to 100 kg, > 100 kg) and sex; allocation method not reported. |
| Allocation concealment (selection bias) | Unclear risk | Allocation method not reported. |
| Blinding of outcome assessment (detection bias) All outcomes | Unclear risk | Not reported. |
| Incomplete outcome data (attrition bias) All outcomes | Low risk | Reasons for discontinuation only reported overall (1 pregnancy, 1 failed to complete the final analysis, 2 moved away, 9 were disappointed with weight loss). Loss to follow‐up/dropouts: Low GI/high CHO: 2/32 (6.3%); High GI/high CHO: 5/32 (16.6%). Low GI/high protein: 5/33 (15.2%). High GI/high protein: 1/32 (3.1%). |
| Intention‐to‐treat analysis | Low risk | Last observation carried forward. |
| Selective reporting (reporting bias) | Unclear risk | Not enough information to assess. |
| Groups comparable at baseline | Low risk | With respect to demographic variables, anthropometric and biochemical markers. |
| Other bias | Unclear risk | Power analysis (90% power to detect a change in weight with 30 participants per group; but considering dropouts, the study may be underpowered). |
McMillan‐Price 2006 high protein.
| Study characteristics | ||
| Methods | See previous ‐ study had two independent relevant comparisons. | |
| Participants | ||
| Interventions | ||
| Outcomes | ||
| Funding / conflict of interest | ||
| Notes | ||
| Risk of bias | ||
| Bias | Authors' judgement | Support for judgement |
| Random sequence generation (selection bias) | Unclear risk | See above ‐ study had two independent relevant comparisons. |
| Allocation concealment (selection bias) | Unclear risk | See above. |
| Blinding of outcome assessment (detection bias) All outcomes | Unclear risk | See above. |
| Incomplete outcome data (attrition bias) All outcomes | Low risk | See above. |
| Intention‐to‐treat analysis | Low risk | See above. |
| Selective reporting (reporting bias) | Unclear risk | See above. |
| Groups comparable at baseline | Low risk | See above |
| Other bias | Unclear risk | See above. |
Melanson 2012.
| Study characteristics | ||
| Methods |
Setting: USA; setting not reported. Design: individual randomisation, parallel group. Dates: not reported. Intervention duration: 12 weeks. Follow‐up: no postintervention follow‐up. Focus: to assess the effects of multidisciplinary weight loss programmes on chronic disease prevention. |
|
| Participants |
N: 157 (49/59 completers in the low GI group, 41/41 in the portion control group, 45/57 in the low energy density group). Inclusion criteria: age 25 to 50 years, BMI 27 to 35 kg/m2, sedentary (< 150 min physical activity per week), weight stable; recruited through newspaper advertisements. Exclusion criteria: taking prescription medication or over‐the‐counter supplements for weight loss; diabetes, uncontrolled hypertension, orthopaedic limitations, eating disorders, pregnancy or lactation, surgical medical conditions, recent weight loss, excess alcohol intake, serious medical conditions; current enrolment in commercial weight loss programme. Age (years) (mean (SD)):low GI: 39.1 (SD 7.1); portion control: 37.9 (SD 7.0). Sex (% men):low GI: 11.9%; portioncontrol: 12.2%. Ethnicity: not reported. Cardiovascular risk status (mean (SD)): BMI (kg/m2):low GI: 31.13 (SD 2.50); portion control: 31.83 (SD 2.18). Total cholesterol (mmol/L):low GI: 5.22 (SD 1.05); portion control: 5.29 (SD 1.29). HDL cholesterol (mmol/L):low GI: 1.42 (SD 0.33); portion control: 1.44 (SD 0.31). LDL cholesterol (mmol/L):low GI: 3.07 (SD 0.76); portion control: 3.32 (SD 1.27). Blood pressure (mmHg):low GI: systolic 113.02 (SD 10.11), diastolic 72.42 (SD 7.13); portion control: systolic 112.39 (SD 8.69), diastolic 71.12 (SD 7.27). Medications used: none. |
|
| Interventions |
Low GI group (n = 59): followed a dietary plan based on foods from the Low Glycaemic Index Pyramid; no prescription of specific portions or food tracking; encouraged to eat unrefined grains; instructions to eat prior to getting too hungry and stopping before feeling too full. Portion control (n = 41): instructed on an approach assigning point values to foods based on energy content, dietary fibre, total fat in defined serving sizes; individual target amount of point values to consume assigned to each participant, based on current weight and a target weight loss of about 0.5 to 1 kg/week; participants kept track of the point values of foods consumed, to assure that their daily intake was within their points limit; guidelines regarding food choices to ensure nutritional adequacy provided. (Low energy density (n = 57): instructed to follow a plan based on wholesome low energy density foods; guidelines about making food choices encouraging balanced intake; instructions to eat prior to getting too hungry and stopping before feeling too full (not considered here as GI not different from low GI group)). Description of dietary intervention: participation in Weight Watchers programme with weekly meetings to encourage regular physical activity, cognitive skills; weekly one‐hour meetings included weigh‐ins, social support, discussions, education; at baseline, all groups received individual counselling from a registered dietitian on how to follow the assigned dietary plans, including education materials; distribution of recipes, shopping lists, and other guidelines specific to the respective diets; adherence to diets emphasised. Incentives: not reported. Cointerventions in both groups: none. Assessment of dietary adherence: 3‐day food diaries (2 weekdays, 1 weekend day) before baseline and week 12 visit. Was the diet energy‐reduced? not reported. Comparability of diet composition: yes, see Table 6. Change in diet over time: all groups significantly decreased their energy intake. |
|
| Outcomes | Outcomes (not clearly divided into primary and secondary): weight (basis of power analysis), BMI, body composition, waist circumference, blood pressure, blood lipids, blood glucose, blood insulin, insulin sensitivity (HOMA), hunger/satiety (VAS). | |
| Funding / conflict of interest | Funding not reported; one author had received consulting fees and research grants from Weight Watchers International. | |
| Notes | ||
| Risk of bias | ||
| Bias | Authors' judgement | Support for judgement |
| Random sequence generation (selection bias) | Unclear risk | Allocation method not reported. |
| Allocation concealment (selection bias) | Unclear risk | Allocation method not reported. |
| Blinding of outcome assessment (detection bias) All outcomes | Unclear risk | Not reported. |
| Incomplete outcome data (attrition bias) All outcomes | Unclear risk | Reasons for discontinuation not reported. Loss to follow‐up/dropouts: Low GI group: 10/59 (17%); Portion control: 41/41 (0%); (Low energy density: 12/57 (21%)) |
| Intention‐to‐treat analysis | High risk | Not explicitly reported, but probably not as results were only reported for completers. |
| Selective reporting (reporting bias) | Unclear risk | Unclear, total cholesterol and LDL cholesterol only reported narratively, no data provided. |
| Groups comparable at baseline | High risk | With respect to demographic variables, anthropometric variables, most biochemical markers; significantly higher blood triglycerides, significantly lower fibre intake and significantly lower blood glucose in the low GI group compared to the portion control group at baseline. |
| Other bias | Unclear risk | Power analysis (based on weight, but details not reported). |
Philippou 2008.
| Study characteristics | ||
| Methods |
Setting: UK; setting not reported. Design: individual randomisation, parallel group. Dates: not reported. Intervention duration: 12 weeks. Follow‐up: no postintervention follow‐up. Focus: to assess the effects of two energy‐restricted health diets with or without low GI on heart disease risk factors in participants at risk of heart disease. |
|
| Participants |
N: 18 (13/18 completers, not reported for comparison groups). Inclusion criteria: age 35 to 65 years, at least one recognised heart disease risk factor (BMI 27 to 35 kg/m2, waist circumference ≥ 88 cm for women and ≥ 94 cm for men, total cholesterol:HDL ratio ≥ 5.0 mmol/L, blood pressure systolic > 130 mmHg or diastolic > 85 mmHg). Exclusion criteria: major illnesses, lipid lowering, and weight loss medication. Age (years):intervention: 54 (49 to 58); control: 45 (39 to 50). Sex (% men):intervention: 42.9%; control: 33.3%. Ethnicity: not reported. Cardiovascular risk status: BMI (kg/m2):intervention: 28.6 (28.1 to 29.8); control: 33.2 (28.2 to 34.2). Total cholesterol (mmol/L, median, IQR):intervention: 5.7 (4.9 to 6.1); control: 5.3 (5.0 to 6.1). HDL cholesterol (mmol/L, median, IQR):intervention: 1.5 (1.1 to 1.6); control: 1.3 (1.2 to 1.4). LDL cholesterol (mmol/L, median, IQR):intervention: 3.7 (3.0 to 4.3); control: 3.4 (3.1 to 3.9). Blood pressure (mmHg): not reported. Medications used: not reported. |
|
| Interventions |
Low GI group (n = 7): healthy eating advice plus advice to have one low GI food with meals and snacks from a list of food choices. Control (n = 6): healthy eating advice plus advice to have one high GI food with meals and snacks from a list of food choices. Description of dietary intervention: individual advice on healthy eating for heart disease prevention aiming for 50 to 55% of energy intake from carbohydrates, < 30% energy from total fat (of which < 10% saturated fat, replacing saturated fats by monounsaturated fats, consuming oily fish twice a week), and limiting alcohol and salt intake; overweight participants were advised on weight loss by aiming for a 500 kcal/day energy deficit. Incentives: not reported. Cointerventions in both groups: none. Assessment of dietary adherence: regular visits, telephone calls, 7‐day food diaries. Was the diet energy‐reduced? yes, for overweight participants. Comparability of diet composition: yes, see Table 6. Change in diet over time: energy intake decreased in both groups. |
|
| Outcomes | Outcomes (not clearly divided into primary and secondary): weight, fasting glucose, fasting blood lipids. | |
| Funding / conflict of interest | Funding not reported. | |
| Notes | ||
| Risk of bias | ||
| Bias | Authors' judgement | Support for judgement |
| Random sequence generation (selection bias) | Unclear risk | Allocation method not reported. |
| Allocation concealment (selection bias) | Unclear risk | Allocation method not reported. |
| Blinding of outcome assessment (detection bias) All outcomes | Unclear risk | Not reported. |
| Incomplete outcome data (attrition bias) All outcomes | High risk | High attrition rate, reasons for discontinuation not reported; 4 discontinued, 1 excluded due to high alcohol intake and triglycerides > mean + 2SD. Loss to follow‐up/drop‐outs: only reported for whole group, 5/18 (27.8%). |
| Intention‐to‐treat analysis | Unclear risk | Not reported. |
| Selective reporting (reporting bias) | Unclear risk | Not enough information to judge. |
| Groups comparable at baseline | Low risk | With respect to demographic variables, anthropometric variables, biochemical markers. |
| Other bias | High risk | No power analysis, small sample size. |
Philippou 2009.
| Study characteristics | ||
| Methods |
Setting: UK; setting not reported. Design: individual randomisation, parallel group. Dates: not reported. Intervention duration: 6 months. Follow‐up: no postintervention follow‐up. Focus: to assess the effects of altering GI, in addition to healthy eating and weight loss advice, on heart disease risk factors. |
|
| Participants |
N: 56 (38/56 completers, not reported for comparison groups). Inclusion criteria: men, age 35 to 65 years, at least one recognised heart disease risk factor (BMI 27 to 35 kg/m2, waist circumference ≥ 94 cm, total cholesterol:HDL ratio ≥ 5.0 mmol/L, raised blood pressure to a maximum of 140/90 mmHg); in good health. Exclusion criteria: medication use. Age (years): not reported. Sex (% men): all men. Ethnicity: not reported. Cardiovascular risk status (mean (SD)): BMI (kg/m2):intervention: 20/22 had BMI > 25 kg/m2; control: all had BMI > 25 kg/m2; no further details. Total cholesterol (mmol/L):intervention: 5.61 (SD 0.79); control: 5.19 (SD 0.91). HDL cholesterol (mmol/L, median, IQR):intervention: 1.1 (1.01 to 1.26); control: 1.1 (0.96 to 1.37). LDL cholesterol (mmol/L):intervention: 3.62 (SD 0.63); control: 3.34 (SD 0.80). Blood pressure (mmHg):intervention: systolic 130 (SD 15), diastolic 81 (SD 11); control: systolic 132 (SD 13), diastolic 81 (SD 10). Medications used: not on medication. |
|
| Interventions |
Low GI group (n = 22): healthy eating advice plus advice to have one low GI food with meals and snacks. Control (n = 16): healthy eating advice plus advice to have one high GI food with meals and snacks. Description of dietary intervention: advice on healthy eating for heart disease prevention and weight loss if BMI > 25 kg/m (energy reduced by 500 kcal with respect to the estimated needs); supported by behavioural techniques; groups were asked to avoid foods of the opposite GI; dietetic consultations and anthropometric measurements were carried out monthly. Incentives: not reported. Cointerventions in both groups: none. Assessment of dietary adherence: monthly 3‐day food diaries. Was the diet energy‐reduced? yes, for overweight participants. Comparability of diet composition: significant difference in carbohydrate, fat/protein/fibre not reported but stated that no other difference in dietary composition; see Table 6. Change in diet over time: energy intake decreased in both groups. |
|
| Outcomes | Outcomes (not clearly divided into primary and secondary): arterial compliance (pulse wave velocity), 24‐h blood pressure, fasting blood lipids, fasting glucose and insulin, weight. | |
| Funding / conflict of interest | Funded by the British Heart Foundation. | |
| Notes | ||
| Risk of bias | ||
| Bias | Authors' judgement | Support for judgement |
| Random sequence generation (selection bias) | Unclear risk | Allocation method not reported. |
| Allocation concealment (selection bias) | Unclear risk | Allocation method not reported. |
| Blinding of outcome assessment (detection bias) All outcomes | Unclear risk | Not reported. |
| Incomplete outcome data (attrition bias) All outcomes | High risk | High attrition rate, reasons for discontinuation not reported. Loss to follow‐up/dropouts: only reported for whole group 18/56 (32.1%). |
| Intention‐to‐treat analysis | Unclear risk | Not reported. |
| Selective reporting (reporting bias) | Unclear risk | Not enough detail to judge. |
| Groups comparable at baseline | Low risk | With respect to biochemical and anthropomorphic variables. |
| Other bias | Unclear risk | No power analysis. |
Philippou 2009a.
| Study characteristics | ||
| Methods |
Setting: UK; Hammersmith Hospital, London. Design: individual randomisation, parallel group. Dates: not reported. Intervention duration: 4 months. Follow‐up: no postintervention follow‐up. Focus: to assess the effects of altering diet GI on weight loss maintenance. |
|
| Participants |
N: 42 completers (not reported how many started the study). Inclusion criteria: age 18 to 65 years, BMI 27 to 45 kg/m2, good health status assessed by blood tests, medical examination and ECG. Exclusion criteria: not reported. Age (years): not reported. Sex (% men): not reported. Ethnicity: not reported. Cardiovascular risk status (mean (SD)): BMI (kg/m2):intervention: 32.5 (SD 4.8); control: 31.3 (SD 4.8). Total cholesterol (mmol/L):intervention: 4.67 (SD 0.93); control: 4.87 (SD 0.67). HDL cholesterol (mmol/L):intervention: 1.26 (SD 0.21); control: 1.19 (SD 0.16). LDL cholesterol (mmol/L):intervention: 3.01 (SD 0.81); control: 3.21 (SD 0.58). Blood pressure (mmHg): not reported. Medications used: not reported. |
|
| Interventions |
Low GI group (n = 23): low GI diet. Control (n = 19): high GI diet. Description of dietary intervention: the study consisted of a nonrandomised weight loss phase which was the prerequisite to being randomised to a low or high GI diet for weight maintenance; the weight loss phase aimed to achieve a 500 to 1000 kcal/day deficit and a 5% reduction in body weight (including use of Slimfast); participants who lost 5% body weight were then randomised to the second part of the study (median weight loss achieved was 6.1 (IQR 5.2 to 7.1)% body weight); during the randomised phase, participants were asked to include at least one low or high GI food with each of their meals or snacks; participants were asked to eat to satisfy their appetite and follow healthy eating guidelines (e.g. avoid high fat foods, consume 5 portions of fruit and vegetables a day) and continue exercising for at least half and hour a day. Cointerventions in both groups: none. Assessment of dietary adherence: participants seen monthly for dietetic assessment; adherence assessed using semiquantitative 3‐day food diaries. Was the diet energy‐reduced? no, weight maintenance after weight loss. Comparability of diet composition: yes; see Table 6. Change in diet over time: not reported with respect to weight loss phase or study start. |
|
| Outcomes |
Primary outcome: weight change during weight maintenance phase. Secondary outcomes: BMI, waist circumference, % body fat, fasting blood lipids, fasting blood glucose and insulin, insulin sensitivity (HOMA), appetite/hunger/fullness (VAS). |
|
| Funding / conflict of interest | Not reported; Slimfast used during the weight loss phase provided by Unilever; one of the authors was a consultant to Unilever. | |
| Notes | ||
| Risk of bias | ||
| Bias | Authors' judgement | Support for judgement |
| Random sequence generation (selection bias) | Unclear risk | Allocation method not reported. |
| Allocation concealment (selection bias) | Unclear risk | Allocation method not reported. |
| Blinding of outcome assessment (detection bias) All outcomes | Unclear risk | Not reported. |
| Incomplete outcome data (attrition bias) All outcomes | Unclear risk | Only reported how many participants completed the study, not how many participants started the study. |
| Intention‐to‐treat analysis | High risk | Only participants completing the study were analysed. |
| Selective reporting (reporting bias) | Unclear risk | Not enough detail to judge. |
| Groups comparable at baseline | Low risk | No significant difference in any of the outcomes at randomisation; age and sex not reported. |
| Other bias | Unclear risk | No power analysis. |
Raatz 2005.
| Study characteristics | ||
| Methods |
Setting: USA; research centre. Design: individual randomisation, parallel group. Dates: not reported. Intervention duration: 36 weeks (two phases of 12 and 24 weeks). Follow‐up: no postintervention follow‐up. Focus: to assess the effects of a reduced GI hypocaloric diet on weight loss. |
|
| Participants |
N: 29 in second phase (6/10 completers in low GI group, 8/9 in high GI group). Inclusion criteria: age 18 to 70 years, BMI 30 to 40 kg/m2, habitually consumed regular diets with no food restrictions. Exclusion criteria: taking prescription medication, existing medical conditions, pregnancy. Age (years): not reported. Sex (% men):low GI: 30%; high GI: 22.2%. Ethnicity: not reported. Cardiovascular risk status: BMI (kg/m2) (mean (SE)):low GI: 36.5 (SE 1.8); high GI: 34.6 (SE 1.4). Total cholesterol (mmol/L): not reported. HDL cholesterol (mmol/L): not reported. LDL cholesterol (mmol/L): not reported. Blood pressure (mmHg): not reported. Medications used: no prescription medication. |
|
| Interventions |
Low GI group (n = 10): hypocaloric low GI diet. High GI group (n = 9): hypocaloric high GI diet. (High fat group (n = 10): hypocaloric high fat diet (not considered here)). Description of dietary intervention: two phases: 12‐week feeding phase where individualised energy‐restricted diets were prepared by Metabolic Kitchen and participants were required to eat all foods provided and consume no additional foods; in the second phase (weeks 13 to 24), diet assignment was maintained but participants prepared their own meals, receiving intensive dietary instructions regarding their assigned dietary regimen and sample menus and recipes; ongoing nutrition counselling every 2 weeks; energy levels designed to promote weight loss 0.7 kg/week for each participant; fatty acid distribution of the diets was 1:1:1 for the ratio of polyunsaturated to monounsaturated to saturated fatty acids; cholesterol content constant at 100 g/4184 kJ. Incentives: as above. Cointerventions in both groups: none. Assessment of dietary adherence: daily questionnaires during first 12 weeks; 5‐day food diaries at weeks 24 and 26. Was the diet energy‐reduced? yes. Comparability of diet composition: yes, data only given for the first 12 weeks, no numeric data for the 24 weeks participants prepared their own meals (only significance levels for GI); see Table 6. Change in diet over time: prescribed diets. |
|
| Outcomes |
Primary outcome: weight. Secondary outcomes:, BMI, % body fat, lean body mass, serum insulin, plasma glucose, plasma triglycerides, insulin sensitivity (HOMA). |
|
| Funding / conflict of interest | Funding by National Institutes of Health and Allan Foundation of Midland, MI. | |
| Notes | ||
| Risk of bias | ||
| Bias | Authors' judgement | Support for judgement |
| Random sequence generation (selection bias) | Unclear risk | Allocation method not reported. |
| Allocation concealment (selection bias) | Unclear risk | Allocation method not reported. |
| Blinding of outcome assessment (detection bias) All outcomes | Unclear risk | Not reported. |
| Incomplete outcome data (attrition bias) All outcomes | High risk | 42 participants started the study, 13 left the study before completion of the first 12 weeks (31%), 29 started the second phase. Loss to follow‐up/dropouts during 2nd phase: Low GI group: 4/10 (40%); High GI control: 1/9 (11.1%); (High fat group: 2/10 (20%)). |
| Intention‐to‐treat analysis | High risk | Only participants completing the first phase were analysed (n = 29) but not stated how non‐completers of the second phase were handled. |
| Selective reporting (reporting bias) | High risk | Only very limited reporting of outcomes after phase 2. |
| Groups comparable at baseline | Low risk | For participants completing the first phase, with respect to anthropometric and biochemical variables. |
| Other bias | High risk | No power analysis, probably underpowered. |
Randolph 2014.
| Study characteristics | ||
| Methods |
Setting: USA; setting not reported. Design: parallel group design. Dates: recruitment July 2008 to June 2010. Intervention duration: 12‐week intervention. Follow‐up: no postintervention follow‐up. Focus: assess the role of glycemic index on measures of body weight, body composition, and metabolic indices in a free‐living overweight population and to assess the compliance of prescribed diets based on the GI system in free‐living individuals. |
|
| Participants |
N: 90 (24/31 completers for the low GI group, 25/30 completers for the high GI group, 24/29 completers for the control group). Inclusion criteria: females and males, age over 18 years, BMI 25 to 37 kg/m2, light to moderate exercise, normal fasting plasma glucose, able to meet the time and effort requirements required for study participation. Exclusion criteria: total cholesterol not greater than 300 mg/dL, fasting triglyceride not greater than 300 mg/dL, LDL cholesterol (LDL‐C) not greater than 180 mg/dL, smokers, female subjects who were pregnant or lactating, subjects taking any medications that would interfere with outcomes of the study, subjects with unusual dietary habits (eg. pica), subjects who were actively losing weight or trying to lose weight, subjects who were addicted to drugs or alcohol or who are < 1 y in a recovery program, subjects who presented with significant psychiatric or neurological disturbances, subjects with known allergy or intolerance to potato products, subjects with documented atherosclerotic disease, inflammatory disease, diabetes mellitus, uncontrolled hypertension ( 140/90 mm Hg), chronic lung, renal or liver disease, presence of other health problems requiring ongoing intervention by their personal physician, excessive exercisers or trained athletes, intolerance to potatoes. Age (years) (mean SD)): low GI group: 47.8 (SD 14.1), high GI group: 51.4 ( SD14.7). Sex (% men): 18.9% male over both intervention and control group. Ethnicity: not reported. Cardiovascular risk status (mean (SD)): BMI (kg/m2): low GI group: 29.5 (SD 4.1), high GI group: 29.7 (SD 4.0). Total cholesterol (mg/dL):low GI‐energy restricted group: 192.8 (SD 38.5), high GI‐energy restricted group: 189.1 (SD 31.9). HDL cholesterol (mg/dL):low GI‐energy restricted group: 50.5 (SD 11.9), high GI‐energy restricted group: 53.8 (SD 15.2). LDL cholesterol (mg/dL):low GI‐energy restricted group: 122.9 (SD 35.8), high GI‐energy restricted group: 118.5 (SD 28.1). Blood pressure (mmHg):low GI‐energy restricted group: systolic 121.6 (SD 2.9), diastolic 77.1 (SD 2.0); high GI‐energy restricted group: systolic 119.3 (SD 2.4), diastolic 75.4 (SD 1.2). Medications used: not reported. |
|
| Interventions |
Low GI, energy‐restricted group (n = 31): the targeted average GI was 30 for the low GI energy‐restricted group. They were provided with potatoes (6 russet and 3 red potato varieties) on a weekly basis. Customized food lists of low GI foods were provided. Received a customized recipe booklet for potato preparation, cooking methods, and specific recipes to comply with low GI dietary preparation. High GI, energy‐restricted (n = 30): the targeted average GI was 80 for the high GI energy‐restricted group. Customized food lists of high GI foods were provided. Received a customized recipe booklet for potato preparation, cooking methods and specific recipes to comply with high GI dietary preparation. (Control diet (n = 29): prescribed for weight maintenance with no energy reduction (not considered here)). Description of dietary intervention: weekly counselling visits by a registered dietitian for the first 6 weeks, then every other week until week 12. Cointerventions in both groups: They were provided with potatoes (6 russet and 3 red potato varieties) on a weekly basis. They were required 5 to 7 servings of potatoes each week such as one medium potato or ½ cup of cooked potato, providing approximately 110 kcal of potato/serving. Assessment of dietary adherence: weekly potato consumption was based on review of food records and verbal interview. Was the diet energy‐reduced? Diets were energy‐restricted (~ 500 kcal deficit/d) for weight loss. Participants received a new energy prescription with each 5 kg drop in weight. Comparability of diet composition: yes; see Table 6. Change in diet over time: energy, carbohydrates and fat intakes significantly decreased in the low GI, energy‐restricted group. |
|
| Outcomes |
Primary outcome: weight loss. Secondary outcomes: glucose tolerance, blood pressure, and body composition. |
|
| Funding / conflict of interest | Funding for this project was provided by the United States Potato Board. | |
| Notes | Author was contacted on 15.08.2016 to clarify risk of bias and blood pressure measurements. | |
| Risk of bias | ||
| Bias | Authors' judgement | Support for judgement |
| Random sequence generation (selection bias) | Low risk | Author response 'Randomization was computer generated'. |
| Allocation concealment (selection bias) | Unclear risk | Author response 'Allocation was blinded to subjects in the sense that the arms were coded/named with nonidentifying titles as to what diets they would follow. The coordinator of subject schedules and allocation was not blinded and held the key in sealed envelope. After subject was randomized this information was given to RD to carry out counselling'. |
| Blinding of outcome assessment (detection bias) All outcomes | Low risk | Author response 'Nurses, staff, statistician were blinded since everything was coded'. |
| Incomplete outcome data (attrition bias) All outcomes | Low risk |
Loss to follow‐up/dropouts: Low GI, energy‐restricted group: 7/31 (22%). High GI,energy‐restricted group: 5/30 (16%). |
| Intention‐to‐treat analysis | High risk | 'Body weight missing data were replaced with the last known value for the ITT analysis. All other results are based on the per protocol data set, which includes only those subjects who completed both 0 and 12 week procedures'. |
| Selective reporting (reporting bias) | Unclear risk | Not all lipids reported at baseline were reported at follow‐up (only triglycerides). However, they reported all primary and secondary outcomes. |
| Groups comparable at baseline | Low risk | With respect to anthropomorphic and biochemical baseline values for low and high GI groups. |
| Other bias | Unclear risk | Power calculations based on body weight (80% power to detect 2 kg change in weight) not on the outcomes of interest for this review i.e. lipids and blood pressure. So, the study may be underpowered for these outcomes. |
RISCK 2010 high MUFA.
| Study characteristics | ||
| Methods |
Setting: UK; clinic at five research centres (Reading, Imperial College, Surrey, Cambridge, Kings College). Design: individual randomisation, parallel group. Dates: baseline assessments made between August 2004 and April 2006. Intervention duration: 24 weeks (after 4 week run‐in). Follow‐up: no postintervention follow‐up. Focus: to assess the effects of replacing saturated fatty acids with monounsaturated fatty acids or carbohydrates and of lowering GI on insulin sensitivity and other cardiovascular risk factors in participants at risk of developing a metabolic syndrome. |
|
| Participants |
N: 720 (116/144 completers in MUFA/low GI group, 111/145 in MUFA/high GI group, 121/149 in low fat/low GI group, 116/145 in low fat/high GI group, 85/137 in control group). Inclusion criteria: age 30 to 70 years, BMI 30 to 40 kg/m2; a score of ≥ 4 was required for entry, according to the following point system: fasting glucose concentration > 5.5 mmol/L or insulin concentration > 40 pmol/L = 3 points; BMI > 30 kg/m2 or waist > 102 cm for men and > 88 cm for women = 2 points; BMI of 25 to 30 kg/m2 or waist > 94 cm for men and > 80 cm (women) = 1 point; treated hypertension = 2 points; systolic blood pressure > 140 mmHg = 1 point; diastolic blood pressure > 90 mm Hg = 1 point; HDL cholesterol concentration < 1.0 mmol/L for men and < 1.3 mmol/L for women = 2 points; and serum triacylglycerol concentration > 1.3 mmol/L = 1 point; recruited from the general population (undefined). Exclusion criteria: history of ischaemic heart disease; a > 30% 10‐year risk of cardiovascular disease; diabetes mellitus; cancer, pancreatitis, cholestatic liver disease, renal disease; use of lipid‐lowering drugs, systemic corticosteroids, androgens, phenytoin, erythromycin, or drugs for regulating haemostasis (excluding aspirin); exposure to any investigational agent 30 days before the study; presence of gastrointestinal disorder or use of a drug likely to alter gastrointestinal motility or nutrient absorption; history of substance misuse or alcoholism; pregnancy, planned pregnancy, or given birth in the past 12 months; allergy or intolerance to intervention foods; unwillingness to follow the protocol or to give informed consent; weight change of > 3 kg in the 2 months before the study; intake of > 1 g eicosapentaenoic and docosahexaenoic acids/day, smoking > 20 cigarettes/day Age (years) (mean (SD)):men: 52 (SD 10); women: 51 (SD 9). Sex (% men): 42%. Ethnicity:men: 83.5% White, 9.1% South Asian, 5.2% Black, 2.2% other; women: 78.3% White, 9.7% South Asian, 8.8% Black, 3.2% other. Cardiovascular risk status (mean (SD)): BMI (kg/m2):men: 28.3 (SD 3.8); women: 28.6 (SD 5.3). Smoking:men: 7.8%; women: 5.6%. Total cholesterol (mmol/L):men: 5.5 (SD 0.9); women: 5.5 (SD 1.0). HDL cholesterol (mmol/L):men: 1.2 (SD 0.3); women: 1.5 (SD 0.4). LDL cholesterol (mmol/L): not reported. Blood pressure (mmHg):men: systolic 138 (SD 16), diastolic 84 (SD 10); women: systolic 129 (SD 17), diastolic 80 (SD 9.3). Medications used:men: 19.1% on blood pressure medication; women: 16.3% on blood pressure medication. Baseline values only reported for men and women, not for separate comparison groups. |
|
| Interventions |
MUFA/low GI (n = 144): high monounsaturated fatty acids and low GI diet. MUFA/high GI (n = 145): high monounsaturated fatty acids and high GI diet. Low fat/low GI (n = 149): low fat and low GI diet. Low fat/high GI (n = 145): low fat and low GI diet. (High SFA/high GI (n = 137): high saturated fatty acids and high GI diet (control) (not considered here)). Description of dietary intervention: run‐in with a diet of high saturated fatty acids and high GI; intervention: provision of key sources of fat (spreads, cooking oils, margarine) and carbohydrates (bread, pasta, rice, cereals) with additional dietary information tailored to study group (given in writing and reinforced by counselling at 12 individual study visits); target for total fat intakes was 38% of energy in the MUFA groups and 28% of energy in the low fat groups with carbohydrate intakes of 45% and 55% of energy, respectively; saturated fatty acids were reduced to 10% of energy with a planned MUFA intake of 20% of energy in the high MUFA group and 12% in the low fat group; the target difference in GI was about 11 points in the MUFA comparison and 13 points in the low fat comparison; dietary targets were achieved using a food exchange model; participants were offered sufficient quantities of study foods for their whole household on a fortnightly basis. Incentives: see below. Cointerventions in both groups: advice to engage in exercise, avoid alcohol. Assessment of dietary adherence: unweighed 4‐day food records (3 weekdays and 1 weekend day) before run‐in and during the 3rd and the final month of the intervention; a small remuneration was given for participation. Was the diet energy‐reduced? no, participants were told that diets were designed for weight maintenance. Comparability of diet composition: yes; see Table 6. Change in diet over time: decrease in reported energy intake. |
|
| Outcomes |
Primary outcome: insulin sensitivity. Secondary outcomes: blood lipids, blood pressure, weight. |
|
| Funding / conflict of interest | Funding by UK Food Standards Agency (project NO2031); foods supplied by Unilever Food and Health Research Institute, Cereal Partners UK, Grampian, Weetabix Ltd, Sainsbury’s Supermarkets Ltd. | |
| Notes | ||
| Risk of bias | ||
| Bias | Authors' judgement | Support for judgement |
| Random sequence generation (selection bias) | Low risk | Computer‐based minimisation procedure to balance assignment by age, sex, waist circumference, HDL cholesterol. |
| Allocation concealment (selection bias) | Unclear risk | Not reported. |
| Blinding of outcome assessment (detection bias) All outcomes | Unclear risk | Not reported. |
| Incomplete outcome data (attrition bias) All outcomes | Unclear risk | Relatively high attrition rate, reasons for loss to follow‐up not reported. MUFA/low GI: 28/144 (19.4%). MUFA/high GI: 34/145 (23.4%). Low fat/low GI: 28/149 (18.8%). Low fat/high GI: 29/145 (20.0%). (High SFA/high GI: 52/137 (38.0%)). |
| Intention‐to‐treat analysis | Unclear risk | Probably not, stated that 548/549 participants were analysed (of 720 randomised). |
| Selective reporting (reporting bias) | Unclear risk | Not enough detail to judge. |
| Groups comparable at baseline | Unclear risk | Baseline data only given for men and women, not for different comparison groups. |
| Other bias | Unclear risk | Power analysis (80% power to detect a change in insulin sensitivity with 113 participants per group). |
RISCK 2010 low fat.
| Study characteristics | ||
| Methods | See previous ‐ study had two independent relevant comparisons. | |
| Participants | ||
| Interventions | ||
| Outcomes | ||
| Funding / conflict of interest | ||
| Notes | ||
| Risk of bias | ||
| Bias | Authors' judgement | Support for judgement |
| Random sequence generation (selection bias) | Low risk | See above ‐ study had two independent relevant comparisons. |
| Allocation concealment (selection bias) | Unclear risk | See above. |
| Blinding of outcome assessment (detection bias) All outcomes | Unclear risk | See above. |
| Incomplete outcome data (attrition bias) All outcomes | Unclear risk | See above. |
| Intention‐to‐treat analysis | Unclear risk | See above. |
| Selective reporting (reporting bias) | Unclear risk | See above. |
| Groups comparable at baseline | Unclear risk | See above. |
| Other bias | Unclear risk | See above. |
Shikany 2005.
| Study characteristics | ||
| Methods |
Setting: USA; University of Alabama Division of Preventive Medicine clinic and classrooms. Design: individual randomisation, parallel group. Dates: not reported. Intervention duration: 12 weeks. Follow‐up: no postintervention follow‐up. Focus: to assess the effects of a low fat/low GI diet on serum lipids. |
|
| Participants |
N: 62 (57/62 completers, distribution by comparison group not reported). Inclusion criteria: age 19 to 70 years, serum LDL‐C ≥ 160 mg/dL with less than two heart disease risk factors or ≥ 130 mg/dL with two or more heart disease risk factors. Exclusion criteria: serum triglycerides ≥ 400 mg/dL; use of cholesterol‐lowering medications; use of low‐fat or other specialised diets; ≥ 8 meals per week consumed away from home; history of serious illness, including coronary heart disease, stroke, diabetes, cancer, severe renal or liver disease. Age (years):intervention: 29%: 19 to 39 yrs, 25.8%: 40 to 49 yrs, 45.2%: 50 to 69 yrs; control: 11.5%: 19 to 39 yrs, 34.6%: 40 to 49 yrs, 53.8%: 50 to 69 yrs. Sex (% men):intervention: 61.3%; control: 65.4%. Ethnicity:intervention: 71.0% White, 22.6% African American, 6.5% Asian, 0 Native American; control: 76.9% White, 15.4% African American, 0 Asian, 7.7% Native American. Cardiovascular risk status (mean (SD)): BMI (kg/m2):intervention: 30.1 (SE 1.0); control: 30.4 (SE 1.1). Current smoker:intervention: 9.7%; control: 0. Total cholesterol (mmol/L):intervention: 6.13 (SE 0.10); control: 6.26 (SE 0.10). HDL cholesterol (mmol/L):intervention: 1.14 (SE 0.05); control: 1.14 (SE 0.05). LDL cholesterol (mmol/L):intervention: 4.19 (SE 0.10); control: 4.32 (SE 0.10). Blood pressure (mmHg): not reported. Medications used: not reported. |
|
| Interventions |
Low GI group (n = 31): low fat/low GI diet; National Cholesterol Education Program TLC diet, replacement of high GI carbohydrates with low carbohydrate alternatives (including information on factors influencing GI such as food processing and cooking time), encouraged to increase intake in fruit, vegetables and legumes; low GI cookbook provided. High GI group (n = 26): low fat only diet; National Cholesterol Education Program TLC diet, no recommendations on types of carbohydrate to consume. Description of dietary intervention: 7 sessions held over a 12 week period; the first 4 sessions were held weekly, then biweekly over the final 8 weeks; all sessions were conducted by registered dietitians and were 60 mins long for the low fat only group and 90 min for the low fat plus low GI group; sessions included group instruction and individual counselling; participants who missed sessions were mailed session materials and offered individual advice by person or over the phone; session topics included goal setting, label reading, food shopping, challenges associated with dining out. Incentives: not reported. Cointerventions in both groups: none. Assessment of dietary adherence: food diaries completed for a minimum of 5 days a week throughout 12 weeks; reviewed by dietitian at each session who gave individual feedback; additional 3‐day food records at baseline, 4 weeks and 12 weeks. Was the diet energy‐reduced? unclear. Comparability of diet composition: yes; see Table 6. Change in diet over time: total energy intake, carbohydrate intake, fat intake reduced significantly in both groups, but no significant difference between groups. |
|
| Outcomes |
Primary outcomes: serum lipids. Secondary outcomes: BMI, serum glucose, serum insulin, HbA1c. |
|
| Funding / conflict of interest | Funding by the American Heart Association. | |
| Notes | ||
| Risk of bias | ||
| Bias | Authors' judgement | Support for judgement |
| Random sequence generation (selection bias) | Unclear risk | Allocation method not reported. |
| Allocation concealment (selection bias) | Unclear risk | Allocation method not reported. |
| Blinding of outcome assessment (detection bias) All outcomes | Unclear risk | Not reported. |
| Incomplete outcome data (attrition bias) All outcomes | Unclear risk | Reasons for discontinuation/exclusion only reported overall (5 did not complete the 4‐week dietary and/or the 12 week session). Loss to follow‐up/dropouts: not reported by comparison group, 5/62 (8.1%) overall. |
| Intention‐to‐treat analysis | High risk | Only completers included in the analysis. |
| Selective reporting (reporting bias) | Unclear risk | Not enough detail to judge. |
| Groups comparable at baseline | Low risk | With respect to demographic, anthropomorphic and biochemical baseline values. |
| Other bias | Unclear risk | No power analysis. |
Sichieri 2007.
| Study characteristics | ||
| Methods |
Setting: Brazil; primary care centres. Design: individual randomisation, parallel group. Dates: recruitment October 2003 to September 2004. Intervention duration: 18 months. Follow‐up: no postintervention follow‐up. Focus: to investigate the long term effect of a low GI diet compared with a high GI diet, with all other dietary components being equal, on weight and satiety. |
|
| Participants |
N: 203 (61/101 completers in the intervention group and 46/102 in the control group). Inclusion criteria: healthy women; overweight (BMI 23 to 29.9 kg/m2), age 25 to 45 years, not pregnant or breastfeeding, with at least one child. Exclusion criteria: physician‐diagnosed thyroid disease; diabetes; menopausal women; not being able to eat beans on a daily basis or having a particular dislike for them. Age (years) (mean (SD)):intervention: 37.2 (SD 5.4); control: 37.5 (SD 5.6). Sex:intervention: 100% women; control: 100% women. Ethnicity:intervention: 54.5% White, 19.8% Black, 25.7% Mulatto; control: 52.0% White, 15.0% Black, 33.0% Mulatto. Cardiovascular risk status (mean (SD)): BMI (kg/m2):intervention: 26.9 (SD 1.8); control: 26.7 (SD 2.1). Total cholesterol (mmol/L):intervention: 4.88 (SD 0.90); control: 5.02 (SD 0.96). HDL cholesterol (mmol/L):intervention: 1.11 (SD 0.4); control: 1.12 (SD 0.41). LDL cholesterol (mmol/L):intervention: 3.30 (SD 0.85); control: 3.44 (SD 0.95). Blood pressure (mmHg): not reported. Medications used: not reported. |
|
| Interventions |
Low GI group (n = 101): low GI diet. Control (n = 102): high GI diet. Description of dietary intervention: study started with a 6 week run‐in phase (2 weeks low GI diet, 4 weeks high GI diet) after completion of which participants were randomised to intervention or control; main intervention: dietary counselling based on a small energy restriction (100 to 300 kcal/day), skipping the diet 1 day/week was allowed; individual nutritional counselling every month with menus and exchange lists; both diets designed with 26% to 28% of energy as fat; low GI diets for each meal designed to maintain an average difference of 40 GI units compared to high GI diet (major determinant was sticky rice versus parboiled rice and amount of beans); participants were instructed to eat 3 meals and 3 snacks per day according to a 6 day menu plan; instructions also included limiting to a minimum all candies, added sugar, sodas, except for the weekly day free of diet; portions of staple foods were reduced monthly if the participants reported that they were prescribed too much food. Incentives: see above. Cointerventions in both groups: none. Assessment of dietary adherence: food frequency questionnaire at the beginning of the run‐in and 3, 6, 12 and 18 months after the start of the intervention; adherence in the low GI group was greater than in the high GI group (61% versus 46%, P = 0.0006). Was the diet energy‐reduced? yes. Comparability of diet composition: yes, see Table 6. Change in diet over time: energy reduced in both groups, no significant difference. |
|
| Outcomes | Outcomes (not clearly divided into primary and secondary): BMI (basis of power analysis), serum lipids, fasting serum glucose, fasting serum insulin, insulin sensitivity (HOMA), hunger/satiety. Abstract suggested weight change was the primary outcome and yet this was not reported. | |
| Funding / conflict of interest | Funding by National Institutes of Health and Brazilian Research Council; authors stated that they had no conflicts of interest. | |
| Notes | ||
| Risk of bias | ||
| Bias | Authors' judgement | Support for judgement |
| Random sequence generation (selection bias) | Low risk | Computer‐generated randomisation list with blocking. |
| Allocation concealment (selection bias) | Unclear risk | Not reported. |
| Blinding of outcome assessment (detection bias) All outcomes | Unclear risk | Not reported. |
| Incomplete outcome data (attrition bias) All outcomes | High risk |
Reasons for non‐completion:intervention: n = 39 withdrawn, n = 13 tired of the diet, n = 4 pregnancy, n = 6 moving away, n = 1 death, n = 9 other reasons; control: n = 41 withdrawn, n = 20 tired of the diet, n = 1 pregnancy, n = 5 moving away, n = 15 other reasons. Loss to follow‐up/dropouts: Low GI group: 40/101 (39.6%) non‐completers; 38/101 (37.6%) did not return for the last visit. Control: 56/102 (54.9%) non‐completers; 42/102 (41.2%) did not return for the last visit. |
| Intention‐to‐treat analysis | Low risk | |
| Selective reporting (reporting bias) | Unclear risk | BMI at follow‐up not reported. |
| Groups comparable at baseline | Low risk | With respect to demographic, anthropometric and biochemical variables. |
| Other bias | Unclear risk | Power analysis (90% power to detect a change in BMI with 206 participants, allowing for 20% loss during follow‐up ‐ but more participants did not complete the study, so the study was probably underpowered). |
Solomon 2010.
| Study characteristics | ||
| Methods |
Setting: USA; setting not reported. Design: individual randomisation, parallel group. Dates: not reported. Intervention duration: 12 weeks. Follow‐up: no postintervention follow‐up. Focus: to assess the effects of exercise training with a low or high GI diet on metabolic syndrome severity. |
|
| Participants |
N: 24 (10/12 completers in the intervention group (11 in Malin 2012) and 12/12 in the control group (10 in Malin 2012)). Inclusion criteria: older (mean age 66 years) obese (BMI = 35.5 kg/m2) (34.4 in Solomon) adults meeting the National Cholesterol Education Program Adult Treatment Panel (ATP) III criteria for metabolic syndrome; non‐smokers, sedentary, weight‐stable (< 2 kg weight change in previous 6 months); recruited through advertisements. Exclusion criteria: heart, kidney, liver, thyroid, intestinal, pulmonary disease; taking medications affecting the primary outcomes; contraindications to increments in physical activity (based on exercise ECG). Age (years) (mean (SE)):intervention: 67 (SE 2); control: 64 (SE 1). Sex (% men):intervention: 30%; control: 41.7%. Ethnicity: not reported. Cardiovascular risk status (mean (SE)): BMI (kg/m2):intervention: 34.9 (SE 1.1); control: 34.1 (SE 1.1). Total cholesterol (mmol/L):intervention: 5.55 (SE 0.29); control: 5.36 (SE 0.21). HDL cholesterol (mmol/L):intervention: 1.38 (SE 0.09); control: 1.29 (SE 0.11). LDL cholesterol (mmol/L):intervention: 3.32 (SE 0.24); control: 3.40 (SE 0.17). Blood pressure (mmHg):intervention: systolic 127 (SE 3,) diastolic 76 (SE 3); control: systolic 133 (SE 5), diastolic 79 (SE 3). Medications used: not reported. |
|
| Interventions |
Low GI group (n = 12): low GI diet (GI 40) plus exercise. Control (n = 12): high GI (GI 80) diet plus exercise. Description of dietary intervention: measurements of resting metabolic rate to ascertain caloric requirements; all meals, snacks, and beverages were provided to participants on a daily basis; diets designed by a registered dietitian and isocaloric to the individual requirements of participants; dietary macronutrient composition (including fibre) matched between groups. Incentives: as above. Cointerventions in both groups: 60 min of aerobic exercise 5 days/week (treadmill walking and cycle ergometry) at about 85% of the maximum heart rate obtained during an incremental maximal aerobic‐exercise test; sessions supervised by exercise physiologist. Assessment of dietary adherence: daily food‐container weigh backs; weekly counselling session with a research dietitian; adherence 98% (SE 1) low GI group, 96% (SE 1) control group. Was the diet energy‐reduced? no. Comparability of diet composition: yes, see Table 6. Change in diet over time: prescribed diet. |
|
| Outcomes | Outcomes (not clearly divided into primary and secondary): body composition, aerobic fitness, insulin sensitivity, plasma lipids, plasma insulin, plasma glucose, HbA1c, metabolic syndrome severity (Z‐score). | |
| Funding / conflict of interest | Funding by National Institutes of Health Grants RO1 AG‐12834 and National Institutes of Health National Center for Research Resources 1UL1RR024989; authors stated that they had no financial or other conflicts of interest. | |
| Notes | ||
| Risk of bias | ||
| Bias | Authors' judgement | Support for judgement |
| Random sequence generation (selection bias) | Unclear risk | Allocation method not reported. |
| Allocation concealment (selection bias) | Unclear risk | Allocation method not reported. |
| Blinding of outcome assessment (detection bias) All outcomes | Unclear risk | Not reported. |
| Incomplete outcome data (attrition bias) All outcomes | Low risk | 24 participants in Solomon 2010, 21 in Malin 2012. 2 exclusions in the low GI group (failure to comply with diet and exercise, refusal of repeated testing). Loss to follow‐up/dropouts: Low GI group: 2/12 (16.7%) (11 completers in Malin 2012). Control: 0/12 (0%) (10 completers in Malin 2012). |
| Intention‐to‐treat analysis | High risk | Not explicitly reported, but probably not as results were only reported for completers. |
| Selective reporting (reporting bias) | Unclear risk | Different papers reporting different outcomes ‐ unclear what the primary/secondary outcomes of the overall study were. |
| Groups comparable at baseline | Low risk | Not specifically reported, but study characteristics table suggests that there were no significant differences between groups in demographic, anthropometric and biochemical variables at baseline. |
| Other bias | Unclear risk | No power analysis reported. |
Venn 2010.
| Study characteristics | ||
| Methods |
Setting: New Zealand; setting not reported. Design: individual randomisation, parallel group. Dates: not reported. Intervention duration: 18 months. Follow‐up: no postintervention follow‐up. Focus: to compare weight loss, metabolic outcomes, and nutrient intakes in obese people assigned to a diet rich in pulses and wholegrains or to a control diet. |
|
| Participants |
N: 108 (43/53 completers in the intervention group and 30/55 in the control group). Inclusion criteria: BMI ≥28 kg/m2. Exclusion criteria: pregnancy, lactation; chronic disease (diabetes mellitus, cancer, coronary heart disease). Age (years) (mean (SD)):intervention: 42 (SD 11.2); control: 42 (SD 10.3). Sex (% men):intervention: 16%; control: 12%. Ethnicity: not reported. Cardiovascular risk status (mean (SD)): BMI (kg/m2):intervention: 36.1 (SD 6.5); control: 34.7 (SD 4.6). Total cholesterol (mmol/L):intervention: 5.3 (SD 1.0); control: 5.2 (SD 1.0). HDL cholesterol (mmol/L):intervention: 1.2 (SD 0.3); control: 1.3 (SD 0.3). LDL cholesterol (mmol/L):intervention: 3.3 (SD 0.8); control: 3.2 (SD 0.8) Blood pressure (mmHg):intervention: systolic 132 (SD 15.4), diastolic 83 (SD 8.7); control: systolic 133 (SD 13.2), diastolic 83 (SD 9.0). Hypertension:intervention: 10%; control: 12%. Medications used: not reported. |
|
| Interventions |
Low GI group (n = 53): diet emphasising pulses and wholegrains; similar advice as given to the control group below but specifically instructed to consume 2 servings of pulses as a substitute for 2 servings of breads and cereals and all other breads were to be wholegrain. Control (n = 55): diet based on guidelines produced by the National Heart Foundation of New Zealand (see below). Description of dietary intervention: diet based on guidelines produced by the National Heart Foundation of New Zealand: instructions to eat each day 3 servings of vegetables and 2 servings of fruit, at least 6 servings of breads and cereals; 1 to 2 servings of protein‐rich foods; 1 to 2 tablespoons of monounsaturated fats and oil products; small amounts of nuts and seeds; instructed to stay within the portion size guidelines of the National Heart Foundation of New Zealand; counselling sessions in pairs every 2 weeks for the first 6 months and provision of key foods, followed by 12 months with monthly contacts with study investigators; cooking classes and supermarket tours during first 6 months, as well as dietary advice and recipe cards. Incentives: as above. Cointerventions in both groups: encouraged to exercise half an hour a day and given a pedometer. Assessment of dietary adherence: daily dietary check sheets discussed with the dietitian every 2 weeks during the first 6 months; 3‐day weighed diet records (2 weekdays and 1 weekend day) recorded by participants on 4 occasions (before randomisation, 2, 6, 12 months). Was the diet energy‐reduced? no (based on National Heart Foundation of New Zealand guidelines of 7.2 MJ/day). Comparability of diet composition: yes, see Table 6. Change in diet over time: energy reduced in both groups, no significant difference. |
|
| Outcomes | Outcomes (not clearly divided into primary and secondary): weight (basis of power analysis), BMI, waist circumference, plasma lipids, fasting glucose, blood pressure. | |
| Funding / conflict of interest | Funding by New Zealand Foundation for Research, Science and Technology and the Lifestyle foods programme; the authors declared that they had no conflicts of interest. | |
| Notes | ||
| Risk of bias | ||
| Bias | Authors' judgement | Support for judgement |
| Random sequence generation (selection bias) | Unclear risk | Allocation method not reported. |
| Allocation concealment (selection bias) | Unclear risk | Allocation method not reported. |
| Blinding of outcome assessment (detection bias) All outcomes | Unclear risk | Not reported. |
| Incomplete outcome data (attrition bias) All outcomes | Unclear risk | High attrition rate, especially in the control group. Reasons for non‐completion:intervention: n = 1 moved away, n = 1 achieved their weight loss goals, n = 1 illness, n = 3 family reasons, n = 4 failed to meet their expectations; control: n = 3 moved away, n = 3 achieved their weight loss goals, n = 5 illness/injury, n = 3 family reasons, n = 11 failed to meet their expectations. Loss to follow‐up/drop‐outs: Low GI group: 10/53 (18.9%). Control: 25/55 (45.5%). |
| Intention‐to‐treat analysis | Low risk | "The data were analyzed according to modified intention to treat...." |
| Selective reporting (reporting bias) | Unclear risk | Not enough detail to judge. |
| Groups comparable at baseline | Low risk | With respect to demographic, anthropometric and biochemical variables. |
| Other bias | Low risk | Power analysis (80% power to detect a difference in weight loss with 40 participants per group). |
Wolever 2002.
| Study characteristics | ||
| Methods |
Setting: Canada; setting not reported. Design: individual randomisation, parallel group. Dates: not reported. Intervention duration: 4 months. Follow‐up: no postintervention follow‐up. Focus: to examine the optimal amount and source of dietary carbohydrate for managing insulin resistance. |
|
| Participants |
N: 37 (13/13 completers in the low GI group and 11/13 in the high GI group). Inclusion criteria: age 30 to 65 years, impaired glucose tolerance, BMI < 40 kg/m2, serum triacylglycerol < 10 mmol/L. Exclusion criteria: pregnancy. Age (years) (mean (SE)):low GI: 55.2 (SE 3.0); high GI: 58.8 (SE 4.0). Sex (% men):low GI: 23%; high GI: 18%. Ethnicity: not reported. Cardiovascular risk status (mean (SE)): BMI (kg/m2): low GI: 29.7 (SE 1.2); high GI: 29.3 (SE 2.2). Total cholesterol (mmol/L): whole study population: 5.24 (SE 0.16). HDL cholesterol (mmol/L): whole study population: 1.21 (SE 0.06). LDL cholesterol (mmol/L): whole study population: 3.18 (SE 0.13). Blood pressure (mmHg): low GI: systolic 129 (SE 4), diastolic 80 (SE 2); high GI: systolic 126 (SE 6), diastolic 78 (SE 3). Medications used: thiazide diuretics were used by one high GI participant; β‐blockers were taken by one low GI participant at stable doses throughout the study. |
|
| Interventions |
Low GI group (n = 13): high carbohydrate, low GI (at least one serving of low GI food at each meal). High GI group (n = 11): high carbohydrate, high GI (at least one serving of high GI food at each meal). (MUFA group (n = 11): low carbohydrate, high monounsaturated fatty acid (MUFA) (not considered here)). Description of dietary intervention: weight‐maintaining ad libitum diet; baseline 3‐day food records were used as a basis for individualised dietary advice; high carbohydrate diets contained 55% of energy from carbohydrate and 30% from fat; lists of high and low GI foods provided, along with specified foods to be used in the diet. Cointerventions in both groups: none. Assessment of dietary adherence: participants were seen monthly for consultation with the dietitian and to hand in 3‐day food records. Was the diet energy‐reduced? no. Comparability of diet composition: significantly more protein (% of energy) in the low GI group, see Table 6. Change in diet over time: small decrease in energy intake in the low GI group. |
|
| Outcomes | Outcomes (not clearly divided into primary and secondary): insulin sensitivity (basis of power analysis), body weight, fasting lipids, blood pressure, fasting plasma glucose, HbA1c, glucose effectiveness, pancreatic responsivity, glucose disposition index, postprandial plasma glucose, insulin. | |
| Funding / conflict of interest | Funding by the Canadian Diabetes Association and the International Olive Oil Council. | |
| Notes | ||
| Risk of bias | ||
| Bias | Authors' judgement | Support for judgement |
| Random sequence generation (selection bias) | Low risk | Coin toss; stratification by age, sex, BMI. |
| Allocation concealment (selection bias) | Unclear risk | Not reported. |
| Blinding of outcome assessment (detection bias) All outcomes | Unclear risk | Not reported. |
| Incomplete outcome data (attrition bias) All outcomes | Unclear risk | Reasons for discontinuation not reported; 1 person participated in 2 arms of the study (MUFA and high GI). Loss to follow‐up/drop‐outs: Low GI group: 0/13 (0%). High GI group: 2/13 (15.4%). MUFA group: 1/12 (8.3%). |
| Intention‐to‐treat analysis | High risk | Not explicitly reported, but probably not as results were only reported for completers. |
| Selective reporting (reporting bias) | Unclear risk | Selective reporting of numeric values, data mainly reported in graphical form. |
| Groups comparable at baseline | Low risk | With respect to demographic, anthropometric and biochemical variables. |
| Other bias | Unclear risk | Power analysis (90% power to detect a difference in insulin sensitivity with 12 participants per group, i.e. slightly underpowered). |
ACE: Angiotensin‐converting‐enzyme; ATP: Adenosine triphosphate; BMI: Body mass index; Ca: Calcium; CHO: Carbohydrates ; CVD: Cardiovascular disease; ECG: Electrocardiogram; Es: Effect size; GDM: Gestational diabetes mellitus; GI: Glycaemic index; HbA1c: Glycated hemoglobin a1c; HDL: HIgh density lipoprotein; HOMA: Homeostatic model assessment; INS: Fasting insulin levels; kcal: Kilocalories; Kg: Killograms; LDL: Low‐density lipoprotein ; LF: Low fat; LGI: Low glycaemic index; mRNA: Messenger ribonucleic acid; MUFA: Mono-unsaturated fatty acids; RD: Registered dietitian; T2DM: Type 2 diabetes mellitis; TLC: Theraputic lifestyle changes; VAS: Visual analogue scale; WC: Waist circumference
Characteristics of excluded studies [ordered by study ID]
| Study | Reason for exclusion |
|---|---|
| Abbasi 2000 | Participants not diagnosed with CHD or at risk of CHD. GI of the diet not reported or compared. Intervention < 12 weeks. |
| Abete 2008 | Intervention duration < 12 weeks. |
| Agus 2000 | Intervention duration < 12 weeks. |
| Alfenas 2005 | Intervention duration < 12 weeks. Participants not diagnosed with CHD or at risk of CHD. Participants not free‐living. |
| Alfenas 2012 | Intervention duration < 12 weeks. |
| Amano 2007 | Participants with type 2 diabetes. |
| Argiana 2011 | Participants with type 2 diabetes. |
| Aston 2008 | No relevant outcomes reported (primary and/or secondary outcomes) |
| Bahadori 2005 | Not an RCT. |
| Barakatun 2010 | Participants with type 2 diabetes. |
| Barkoukis 2002 | Participants not diagnosed with CHD or at risk of CHD. Intervention duration < 12 weeks. |
| Bouche 2002 | Intervention duration < 12 weeks. |
| Brand 1991 | Participants with type 2 diabetes. |
| Brynes 2003 | Intervention duration < 12 weeks. |
| Calle‐Pascual 1988 | Participants with diabetes mellitus. |
| Carels 2005 | No relevant outcomes reported (primary and/or secondary outcomes). |
| Chanteleau 1985 | Intervention duration < 12 weeks. |
| Cheong 2009 | Participants with type 2 diabetes. |
| Chiavaroli 2016 | Participants with type 2 diabetes. |
| Clapp 1998 | Participants not diagnosed with CHD or at risk of CHD. Participants pregnant. |
| Colagiuri 1986 | Intervention duration < 12 weeks. GI of diets not reported or compared. |
| Collier 1986 | Comparison not between diets with similar overall energy and macronutrient contents. Intervention duration < 12 weeks. CHD mortality, morbidity or risk factor outcomes not reported. |
| Collier 1988 | Intervention in children. |
| Coulston 1984 | Intervention duration < 12 weeks. |
| Crapo 1981 | GI of diets not reported or compared. Participants not free‐living. Intervention duration < 12 weeks. |
| De Rougemont 2007 | Intervention duration < 12 weeks. |
| Dumesnil 2001 | Comparison not between diets with similar energy and macronutrient contents. Participants not free‐living. Intervention duration < 12 weeks. |
| Ebbeling 2003 | Comparison not between diets with similar energy and macronutrient contents. |
| Ebbeling 2005 | Comparison not between diets with similar energy and macronutrient contents. |
| Fontvielle 1988 | Intervention duration < 12 weeks. |
| Fontvielle 1992 | Participants with diabetes mellitus. |
| Frost 1994 | Participants with type 2 diabetes. |
| Frost 1996 | Intervention duration < 12 weeks. |
| Frost 1998a | Intervention duration < 12 weeks. |
| Frost 1998b | Not a dietary intervention. |
| Frost 1999 | Not an RCT or CCT. |
| Fuh 1990 | Participants not free‐living. GI of diets not reported or compared. Comparison not between diets with similar overall energy and macronutrient levels. Intervention duration < 12 weeks. |
| Garg 1988 | GI of diets not reported or compared. Participants not free‐living. |
| Garg 1992 | GI of diets not reported or compared. Comparison not between diets with similar overall energy and macronutrient intakes. Participants not free‐living. Intervention duration < 12 weeks. |
| Garg 1994 | GI of diets not reported or compared. |
| Giacco 2000 | Participants with type 1 diabetes. |
| Gilbertson 2001 | Participants were children. |
| Gilbertson 2003 | Study did not report CHD risk factors or outcomes. |
| Golay 1992 | Intervention duration < 12 weeks. |
| Grant 2010 | Pregnant women, gestational hyperglycaemia. |
| Gutschall 2009 | Participants with type 2 diabetes. |
| Heilbronn 2002 | Participants with type 2 diabetes. |
| Herrmann 2001 | Participants not diagnosed with CHD or at risk of CHD. Intervention duration < 12 weeks. |
| Hollenbeck 1985 | GI of diets not reported or compared. Comparisons not between diets with similar overall energy and macronutrient levels. |
| Jarvi 1995 | Intervention duration < 12 weeks. |
| Jarvi 1999 | Intervention duration < 12 weeks. |
| Jenkins 1985 | Not RCT or CCT. |
| Jenkins 1987a | Participants not diagnosed with CHD or at risk of CHD. Intervention duration < 12 weeks. |
| Jenkins 1987b | Not RCT or CCT. |
| Jenkins 1988 | Intervention duration < 12 weeks. |
| Jenkins 2002a | GI of diets not reported or compared. Participants not free‐living. |
| Jenkins 2002b | Intervention duration < 12 weeks. |
| Jenkins 2008 | Participants with type 2 diabetes. |
| Jensen 2008 | Intervention duration < 12 weeks. |
| Jeppesen 1997 | Participants not diagnosed with CHD or at risk of CHD. GI of diets not reported or compared. Comparisons not between diets with similar overall energy and macronutrient contents. Intervention duration < 12 weeks. |
| Jimenez‐Cruz 2003a | Participants with type 2 diabetes. |
| Jiminez‐Cruz 2003b | Intervention duration < 12 weeks. |
| Jiminez‐Cruz 2004 | Intervention duration < 12 weeks. |
| Kabir 2002 | Participants with type 2 diabetes. |
| Kelly 2011 | No relevant outcomes reported (primary and/or secondary outcomes). |
| Kendall 2012 | Participants with type 2 diabetes. |
| Kiens 1996 | Participants not diagnosed with CHD or at risk of CHD. |
| Komindr 2001 | Participants with type 2 diabetes. |
| Krog‐Mikkelsen 2011 | Intervention duration < 12 weeks. |
| Kwak 2012 | Intervention duration < 12 weeks. |
| Lafrance 1998 | Intervention duration < 12 weeks. |
| LaHaye 2005 | Not an RCT. |
| Laitinen 1993 | GI of diets not reported or compared. |
| Leinonen 2000 | GI of diet not reported or compared. |
| Lerman‐Garber 1995 | GI of diets not reported or compared. Comparison not between diets with similar overall energy and macronutrient contents. |
| Lieberman 2003 | Not an RCT. |
| Liu 2000 | Not RCT or CCT. |
| Liu 2002 | Not RCT or CCT. |
| Ludwig 1999 | Participants were children. |
| Lunetta 1996 | Intervention duration < 12 weeks. Participants not free‐living. |
| Luscombe 1999 | Participants with type 2 diabetes. |
| Marsh 2010 | Participants with polycystic ovary syndrome. |
| Morales 1997 | Not RCT or CCT. Participants were children. |
| Nazare 2010 | Intervention duration < 12 weeks. |
| Pacy 1984 | GI of diets not reported or compared. Comparison not between diets with similar overall energy and macronutrient contents. |
| Patel 2004 | Intervention duration < 12 weeks. |
| Patel 2011a | Intervention duration < 12 weeks. |
| Percheron 1997 | Comparison not between diets with similar energy and macronutrient levels. Participants not free‐living. Intervention duration < 12 weeks. |
| Pereira 2002 | GI of diets not reported or compared. |
| Pereira 2004 | Comparison not between diets with similar energy and macronutrient levels. |
| Perichart‐Perera 2012 | Pregnant women with diabetes or gestational diabetes. |
| Pittas 2005 | Comparison not between diets with similar energy and macronutrient levels. |
| Poppitt 2002 | GI of the diets not reported or compared. |
| Rabasa‐Lhoret 1999 | Comparison not between diets with similar overall energy and macronutrient levels.. Participants not free‐living. Intervention duration < 12 weeks. |
| Rasmussen 1993 | GI of diets not reported or compared. Comparison not between diets with similar overall energy and macronutrient contents. |
| Runchey 2012 | Intervention duration < 12 weeks. |
| Runchey 2013 | Intervention duration < 12 weeks. |
| Sacks 2013 | Intervention duration < 12 weeks. |
| Salmeron 1997 | Not an RCT or CCT. |
| Santacroce 1990 | GI of diets not reported or compared. |
| Scholz 2003 | Intervention duration < 12 weeks. |
| Sciarrone 1993 | Participants not diagnosed with CHD or at risk of CHD. |
| Sharafetdinov 1997 | Intervention duration < 12 weeks. |
| Shikany 2009 | Intervention duration < 12 weeks. |
| Shyam 2013 | No relevant outcomes reported (primary and/or secondary outcomes). |
| Singh 1991 | GI of the diets not reported or compared. Comparison not between diets of similar energy and macronutrient intake. |
| Slabber 1994 | GI of the diets not reported or compared. |
| Sloth 2004 | Intervention duration < 12 weeks. |
| Spieth 2000 | Participants were children. |
| Taghrid 2004 | Participants with type 2 diabetes. |
| Tovar 2012 | Intervention duration < 12 weeks. |
| Tsihlias 2000 | Participants with type 2 diabetes. |
| Van Horn 1991 | GI of diets not reported or compared. |
| Visek 2011 | Participants with type 2 diabetes. |
| Vrolix 2010 | Intervention duration < 12 weeks. |
| Wolever 1992a | Participants with type 2 diabetes and overweight/obese. |
| Wolever 1992b | Intervention duration < 12 weeks. |
| Wolever 1995 | Participants not diagnosed with CHD or at risk of CHD. Intervention duration < 12 weeks. |
| Wolever 2008 | Participants with type 2 diabetes. |
| Yang 2002 | Not an RCT. |
| Yusof 2009 | Participants with type 2 diabetes. |
| Zhang 2010 | Intervention duration < 12 weeks. |
CHD: Coronary heart disease; GI: Glycaemic index
Characteristics of studies awaiting classification [ordered by study ID]
Boyadjieva 2015.
| Methods | RCT. |
| Participants | 30 obese adults (males and females). |
| Interventions | 16 weeks dietary intervention: low GI vs high GI. |
| Outcomes | Plasma ghrelin, leptin, and anthropometric parameters. |
| Notes | Not clear if they collected CVD outcomes. Contacted authors (23.06.2016) to clarify the measurement of CVD outcomes. Authors did not respond. |
Cayanan 2015.
| Methods | RCT. |
| Participants | 44 obese adults with obstructive sleep apnea. |
| Interventions | Low glycaemic index high protein diet. |
| Outcomes | Cardio‐metabolic markers (such as blood pressure). |
| Notes | Diet composition not clear. Contacted authors (18.08.2016) to clarify intervention and control diet composition. Authors did not respond. |
Giroux 2015.
| Methods | Design not clear. |
| Participants | 26 rural adults with prediabetes. |
| Interventions | 6‐month lifestyle education program. |
| Outcomes | Eating behaviour and anthropometric measures. |
| Notes | Study design and CVD outcomes are not clear. Contacted authors (23.06.2106) to clarify study design and measured outcomes. Author did not respond. |
Karl 2015.
| Methods | RCT |
| Participants | 91 obese adults. |
| Interventions | 17 weeks of four food provided diets: moderate carbohydrate/low GI; moderate carbohydrate/high GI; high carbohydrate/low GI; high carbohydrate/low GI |
| Outcomes | Anthropometric measures and metabolic adaptation. |
| Notes | CVD outcomes not available. |
Weinhold 2015.
| Methods | RCT. |
| Participants | Employees 18 to 65 years old with prediabetes. |
| Interventions | Intervention: 16‐week group based lifestyle intervention adapted from the Diabetes Prevention Program. Control: usual care. |
| Outcomes | Weight loss, glucose control, blood pressure, and food intake. |
| Notes | Library unable to locate. |
RCT: Randomised controlled trial; GI: Glycaemic index; CVD: Cardiovascular disease
Characteristics of ongoing studies [ordered by study ID]
Brand‐Miller 2013.
| Study name | PREVIEW. |
| Methods | RCT. |
| Participants | 2500 adults and children, overweight (BMI ≥ 25.0 kg/m2) and prediabetic will be recruited. |
| Interventions | 3 years high‐protein, low‐glycaemic index diet vs a high‐carbohydrate, medium‐glycaemic index diet in combination with moderate or high intensity physical activity. |
| Outcomes | Incidence of type 2 diabetes and related outcomes including CVD outcomes. |
| Starting date | 2013 |
| Contact information | Author response 'Indeed the PREVIEW intervention study is ongoing, and the data will not be analysed for the whole data set until late 2018. We are including CVD risk factors". |
| Notes | 6‐year EU project (2013–2018). |
RCT: Randomised controlled trial; BMI: Body mass index; CVD: Cardiovascular disease; EU: European Unioin
Differences between protocol and review
The inclusion criteria for this review were expanded to include all cardiovascular disease and not just coronary heart disease. As there are other Cochrane reviews which examine the effect of low GI diets in obesity and diabetes, studies were only included if they reported blood lipids or blood pressure or both, and studies in participants with diabetes were excluded. Studies in healthy participants were included to capture both primary and secondary prevention of CVD. As more trials are available now, we have excluded short‐term studies and included only those of at least 12 weeks duration. Only adults (age 18 or older) were included.
Contributions of authors
Update:
C Clar: study selection, data extraction, update of the review text and tables, data analyses and summaries.
L Al‐Khudairy: study selection, data extraction, update of the review text and tables, data analyses.
E Loveman: data extraction, checking analyses, writing results text.
L Hartley: study selection.
S Kelly: study selection, data extraction.
R Germanò: study selection.
G Frost: conceived the original idea for the review, critically read the final draft.
K Rees: project management, arbitrator for study inclusions, checking data abstraction, checking completion of final review and critically reading drafts.
Previous review version:
S Kelly: prepared and designed the protocol. Developed and ran the search strategy. Organised the retrieval of papers and screened papers for inclusion and exclusion. Extracted data from papers that were included and took the primary role in writing the review. For the update of the review, ran the search strategy, organised the retrieval of papers, screened papers for inclusion and exclusion, extracted data from included papers and took the primary role in writing the review.
G Frost: conceived the review and obtained funding. Provided a methodological, policy and clinical perspective on the data.
C Summerbell: for the original review, screened papers for inclusion and exclusion and extracted data from papers that were included in the review for the purpose of dual data collection. Provided a methodological, policy and clinical perspective on the data.
V Whittaker: advised on meta‐analysis and quality assessment of studies. For the update of the review, extracted data from papers and advised on statistics and quality assessment of studies.
Sources of support
Internal sources
Warwick Medical School, University of Warwick, UK
External sources
NIHR Cochrane Programme Grant, UK
Karen Rees is also supported by the National Institute for Health Research (NIHR) Collaboration for Leadership in Applied Health Research and Care West, Midlands at University Hospitals, Birmingham NHS Foundation Trust, UK
Declarations of interest
CC: None known.
LAK: None known.
EL: None known.
SAMK: None known.
LH: None known.
NF: None known.
RG: None known.
GF: None of the relationships described are felt to be a conflict of interest regarding this publication. Consultancy for appetite regulation with Unilever; grant application to Nestle on modified cereal fibre and glycaemic control (awaiting outcome); patent on compounds and their effects on appetite control and insulin sensitivity (WO2014020344 A1).
KR: None known.
Edited (no change to conclusions)
References
References to studies included in this review
Armendariz‐Anguiano 2011 {published data only}
- Armendariz-Anguiano AL, Jimenez-Cruz A, Bacardi-Gascon M, Hurtado-Ayala L. Effect of a low glycemic load on body composition and Homeostasis Model Assessment (HOMA) in overweight and obese subjects. Nutricion Hospitalaria 2011;26:170-5. [PubMed] [Google Scholar]
Bellisle 2007 {published data only}
- Bellisle F, Dalix AM, De Assis MA, Kupek E, Gerwig U, Slama G, et al. Motivational effects of 12-week moderately restrictive diets with or without special attention to the glycaemic Index of foods. British Journal of Nutrition 2007;97:790-8. [DOI] [PubMed] [Google Scholar]
Buscemi 2013 {published data only}
- Buscemi S, Cosentino L, Rosafio G, Morgana M, Mattina A, Sprini D, et al. Effects of hypocaloric diets with different glycemic indexes on endothelial function and glycemic variability in overweight and in obese adult patients at increased cardiovascular risk. Clinical Nutrition 2013;32:346-52. [DOI] [PubMed] [Google Scholar]
DiOGenes 2011a high protein {published data only}
- Aller EE, Larsen TM, Claus H, Lindroos AK, Kafatos A, Pfeiffer A, et al. Weight loss maintenance in overweight subjects on ad libitum diets with high or low protein content and glycemic index: the DIOGENES trial 12-month results. International Journal of Obesity 2014;28(12):1511-7. [DOI] [PubMed] [Google Scholar]
- Gogebakan O, Kohl A, Osterhoff MA, Van Baak MA, Jebb SA, Papadaki A, et al. Effects of weight loss and long-term weight maintenance with diets varying in protein and glycemic index on cardiovascular risk factors: the diet, obesity, and genes (DiOGenes) study: a randomized, controlled trial. Circulation 2011;124:2829-38. [DOI] [PubMed] [Google Scholar]
- Goyenechea E, Holst C, Van Baak M, Saris W, Jebb S, Kafatos A, et al. Effects of different protein content and glycaemic index of ad libitum diets on diabetes risk factors in overweight adults: the DIOGenes multicentre, randomized, dietary intervention trial. Diabetes/Metabolism Research and Reviews 2011;27(7):705-16. [DOI] [PubMed] [Google Scholar]
- Larsen T M, Dalskov S, Baak M, Jebb S, Kafatos A, Pfeiffer A, et al. The Diet, Obesity and Genes (Diogenes) Dietary Study in eight European countries - a comprehensive design for long-term intervention. Obesity Reviews 2010;11:76-91. [DOI] [PubMed] [Google Scholar]
- Larsen TM, Dalskov SM, Van Baak M, Jebb SA, Papadaki A, Pfeiffer AF, et al. Diets with high or low protein content and glycemic index for weight-loss maintenance. New England Journal of Medicine 2010;363:2102-13. [DOI] [PMC free article] [PubMed] [Google Scholar]
- McConnon A, Horgan G, Lawton C, Stubbs J, Shepherd R, Astrup A, et al. Experience and acceptability of diets of varying protein content and glycemic index in an obese cohort: results from the Diogenes trial. European Journal of Clinical Nutrition 2013;67(9):990-5. [DOI] [PubMed] [Google Scholar]
DiOGenes 2011 low protein {published data only}
- Aller EE, Larsen TM, Claus H, Lindroos AK, Kafatos A, Pfeiffer A, et al. Weight loss maintenance in overweight subjects on ad libitum diets with high or low protein content and glycemic index: the DIOGENES trial 12-month results. International Journal of Obesity 2014;28(12):1511-7. [DOI] [PubMed] [Google Scholar]
- Gogebakan O, Kohl A, Osterhoff MA, Van Baak MA, Jebb SA, Papadaki A, et al. Effects of weight loss and long-term weight maintenance with diets varying in protein and glycemic index on cardiovascular risk factors: the diet, obesity, and genes (DiOGenes) study: a randomized, controlled trial. Circulation 2011;124:2829-38. [DOI] [PubMed] [Google Scholar]
- Goyenechea E, Holst C, Van Baak M, Saris W, Jebb S, Kafatos A, et al. Effects of different protein content and glycaemic index of ad libitum diets on diabetes risk factors in overweight adults: the DIOGenes multicentre, randomized, dietary intervention trial. Diabetes/Metabolism Research and Reviews 2011;27(7):705-16. [DOI] [PubMed] [Google Scholar]
- Larsen T M, Dalskov S, Baak M, Jebb S, Kafatos A, Pfeiffer A, et al. The Diet, Obesity and Genes (Diogenes) Dietary Study in eight European countries - a comprehensive design for long-term intervention. Obesity Reviews 2010;11:76-91. [DOI] [PubMed] [Google Scholar]
- Larsen TM, Dalskov SM, Van Baak M, Jebb SA, Papadaki A, Pfeiffer AF, et al. Diets with high or low protein content and glycemic index for weight-loss maintenance. New England Journal of Medicine 2010;363:2102-13. [DOI] [PMC free article] [PubMed] [Google Scholar]
- McConnon A, Horgan G, Lawton C, Stubbs J, Shepherd R, Astrup A, et al. Experience and acceptability of diets of varying protein content and glycemic index in an obese cohort: results from the Diogenes trial. European Journal of Clinical Nutrition 2013;67(9):990-5. [DOI] [PubMed] [Google Scholar]
Frost 2004 {published data only}
- Frost GS, Brynes AE, Bovill-Taylor C, Dornhorst A. A prospective randomised trial to determine the efficacy of a low glycaemic index diet given in addition to healthy eating and weight loss advice in patients with coronary heart disease. European Journal of Clinical Nutrition 2004;58:121-7. [DOI] [PubMed] [Google Scholar]
Ghani 2014a high insulin {published data only}
- Fatimah A, Rohana AG, Norasyikin AW, Karuthan C, Nik Shanita S, Mohd Yusof BN, et al. Lowering dietary glycaemic index through nutrition education among Malaysian women with a history of gestational diabetes mellitus. Malaysian Journal of Nutrition 2013;19(1):9-23. [PubMed] [Google Scholar]
- Ghani RA, Shyam S, Arshad F, Wahab NA, Chinna K, Safii NS, et al. The influence of fasting insulin level in post-gestational diabetes mellitus women receiving low-glycaemic-index diets. Nutrition & Diabetes 2014;4(2):e107. [DOI] [PMC free article] [PubMed] [Google Scholar]
- Shyam S, Arshad F, Abdul Ghani R, Abdul Wahab N, Barakatun Nisak M, Safii N, et al. Women with previous gestational diabetes mellitus achieve clinically significant weight loss on low glycaemic index diets. In: Obesity Reviews. Vol. 15. 2014:92.
Ghani 2014 low insulin {published data only}
- Fatimah A, Rohana AG, Norasyikin AW, Karuthan C, Nik Shanita S, Mohd Yusof BN, et al. Lowering dietary glycaemic index through nutrition education among Malaysian women with a history of gestational diabetes mellitus. Malaysian Journal of Nutrition 2013;19(1):9-23. [PubMed] [Google Scholar]
- Ghani RA, Shyam S, Arshad F, Wahab NA, Chinna K, Safii NS, et al. The influence of fasting insulin level in post-gestational diabetes mellitus women receiving low-glycaemic-index diets. Nutrition & Diabetes 2014;4(2):e107. [DOI] [PMC free article] [PubMed] [Google Scholar]
- Shyam S, Arshad F, Abdul Ghani R, Abdul Wahab N, Barakatun Nisak M, Safii N, et al. Women with previous gestational diabetes mellitus achieve clinically significant weight loss on low glycaemic index diets. In: Obesity Reviews. Vol. 15. 2014:92.
Hönemann 2010 {published data only}
- Hönemann I, Ranke C, Austel A, Jarzemski S, Deeken I, Pleyer I, et al. Changes of cardiovascular risk factors while following one of three currently discussed dietetic weight-reducing strategies [Veränderungen kardiovaskulärer Risikofaktoren unter drei aktuell diskutierten Ernährungsstrategien zur Gewichtsreduktion]. Aktuelle Ernahrungsmedizin 2010;35:227-35. [Google Scholar]
Juanola‐Falgarona 2014 {published data only}
- Giardina S, Hernandez Alonso P, Salas Salvado J, Bullo M. Effects of Glycemic index on the expression of selected miRNAs in adipose tissue: the GLYNDIET study. In: Obesity facts. Vol. 9. 2016:223.
- Juanola-Falgarona M, Ibarrola N, Salvadó JS, Soler AR, Bulló M. Design and methods of the GLYNDIET study; assessing the role of glycemic index on weight loss and metabolic risk markers. Nutrición Hospitalaria 2013;28(2):382-90. [DOI] [PubMed] [Google Scholar]
- Juanola-Falgarona M, Salas-Salvadó J, Ibarrola-Jurado N, Rabassa-Soler A, Bulló M. Effect of dietary glycemic index and glycemic load on body weight and cardiovascular risk factors: the GLYNDIET Study. In: Obesity Facts. Vol. 6. 2013:111.
- Juanola-Falgarona M, Salas-Salvadó J, Ibarrola-Jurado N, Rabassa-Soler A, Díaz-López A, Guasch-Ferré M, et al. Effect of the glycemic index of the diet on weight loss, modulation of satiety, inflammation, and other metabolic risk factors: a randomized controlled trial. American Journal of Clinical Nutrition 2014;11(1):27-35. [DOI] [PubMed] [Google Scholar]
McMillan‐Price 2006 high CHO {published data only}
- McMillan-Price J, Petocz P, Atkinson F, O'Neill K, Samman S, Steinbeck K, et al. Comparison of 4 diets of varying glycemic load on weight loss and cardiovascular risk reduction in overweight and obese young adults: a randomized controlled trial. Archives of Internal Medicine 2006;166:1466-75. [DOI] [PubMed] [Google Scholar]
McMillan‐Price 2006 high protein {published data only}
- McMillan-Price J, Petocz P, Atkinson F, O'Neill K, Samman S, Steinbeck K, et al. Comparison of 4 diets of varying glycemic load on weight loss and cardiovascular risk reduction in overweight and obese young adults: a randomized controlled trial. Archives of Internal Medicine 2006;166:1466-75. [DOI] [PubMed] [Google Scholar]
Melanson 2012 {published data only}
- Melanson KJ, Summers A, Nguyen V, Brosnahan J, Lowndes J, Angelopoulos TJ, et al. Body composition, dietary composition, and components of metabolic syndrome in overweight and obese adults after a 12-week trial on dietary treatments focused on portion control, energy density, or glycemic index. Nutrition Journal 2012;11:57. [DOI] [PMC free article] [PubMed] [Google Scholar]
Philippou 2008 {published data only}
- Philippou E, McGowan BM, Brynes AE, Dornhorst A, Leeds AR, Frost GS. The effect of a 12-week low glycaemic index diet on heart disease risk factors and 24 h glycaemic response in healthy middle-aged volunteers at risk of heart disease: a pilot study. European Journal of Clinical Nutrition 2008;62:145-9. [DOI] [PubMed] [Google Scholar]
Philippou 2009 {published data only}
- Philippou E, Bovill-Taylor C, Rajkumar C, Vampa ML, Ntatsaki E, Brynes AE, et al. Preliminary report: the effect of a 6-month dietary glycemic index manipulation in addition to healthy eating advice and weight loss on arterial compliance and 24-hour ambulatory blood pressure in men: a pilot study. Metabolism: Clinical and Experimental 2009;58:1703-8. [DOI] [PubMed] [Google Scholar]
Philippou 2009a {published data only}
- Philippou E, Neary NM, Chaudhri O, Brynes AE, Dornhorst A, Leeds AR, et al. The effect of dietary glycemic index on weight maintenance in overweight subjects: a pilot study. Obesity 2009;17:396-401. [DOI] [PubMed] [Google Scholar]
Raatz 2005 {published data only}
- Raatz SK, Torkelson CJ, Redmon JB, Reck KP, Kwong CA, Swanson JE, et al. Reduced glycemic index and glycemic load diets do not increase the effects of energy restriction on weight loss and insulin sensitivity in obese men and women. Journal of Nutrition 2005;135:2387-91. [DOI] [PubMed] [Google Scholar]
Randolph 2014 {published data only}
- NCT01186393. Effects of potatoes in a weight loss program (BBFUSPB). clinicaltrials.gov/ct2/show/NCT01186393?term=NCT01186393&rank=1 (accessed on June 2016).
- Randolph J, Edirisinghe I, Kappagoda CT, Burton-Freeman B. Glycemic index and potato consumption: effects on glucose metabolism and body composition. In: Obesity. Vol. 18. 2010:S91.
- Randolph JM, Edirisinghe I, Masoni AM, Kappagoda T, Burton-Freeman B. Potatoes, glycemic index, and weight loss in free-living individuals: practical implications. Journal of the American College of Nutrition 2014;33(5):375-84. [DOI] [PubMed] [Google Scholar]
RISCK 2010 high MUFA {published data only}
- Jebb SA, Lovegrove JA, Griffin BA, Frost GS, Moore CS, Chatfield MD, et al. Effect of changing the amount and type of fat and carbohydrate on insulin sensitivity and cardiovascular risk: the RISCK (Reading, Imperial, Surrey, Cambridge, and Kings) trial. American Journal of Clinical Nutrition 2010;92:748-58. [DOI] [PMC free article] [PubMed] [Google Scholar]
- Moore C, Gitau R, Goff L, Lewis FJ, Griffin MD, Chatfield MD, et al. Successful manipulation of the quality and quantity of fat and carbohydrate consumed by free-living individuals using a food exchange model. Journal of Nutrition 2009;139:1534-40. [DOI] [PMC free article] [PubMed] [Google Scholar]
RISCK 2010 low fat {published data only}
- Jebb SA, Lovegrove JA, Griffin BA, Frost GS, Moore CS, Chatfield MD, et al. Effect of changing the amount and type of fat and carbohydrate on insulin sensitivity and cardiovascular risk: the RISCK (Reading, Imperial, Surrey, Cambridge, and Kings) trial. American Journal of Clinical Nutrition 2010;92:748-58. [DOI] [PMC free article] [PubMed] [Google Scholar]
- Moore C, Gitau R, Goff L, Lewis FJ, Griffin MD, Chatfield MD, et al. Successful manipulation of the quality and quantity of fat and carbohydrate consumed by free-living individuals using a food exchange model. Journal of Nutrition 2009;139:1534-40. [DOI] [PMC free article] [PubMed] [Google Scholar]
Shikany 2005 {published data only}
- Shikany JM, Goudie A, Oberman A. Comparison of a low-fat/low-glycemic index diet to a low-fat only diet in the treatment of adults with hypercholesterolemia. Nutrition Research 2005;25:971-81. [Google Scholar]
Sichieri 2007 {published data only}
- Mediano MF, Sichieri R. Insulin resistance predicts the effectiveness of different glycemic index diets on weight loss in non-obese women. Obesity Facts 2012;5:641-7. [DOI] [PMC free article] [PubMed] [Google Scholar]
- Sichieri R, Moura AS, Genelhu V, Hu F, Willett WC. An 18-mo randomized trial of a low-glycemic-index diet and weight change in Brazilian women. American Journal of Clinical Nutrition 2007;86:707-13. [DOI] [PubMed] [Google Scholar]
Solomon 2010 {published data only}
- Malin SK, Niemi N, Haus JM, Kelly KR, Filion J, Rocco M, et al. Exercise training with weight loss and either a high- or low-glycemic index diet reduces metabolic syndrome severity in older adults. Annals of Nutrition & Metabolism 2012;61:135-41. [DOI] [PMC free article] [PubMed] [Google Scholar]
- Solomon TP, Haus JM, Kelly KR, Cook MD, Filion J, Rocco M, et al. A low-glycemic index diet combined with exercise reduces insulin resistance, postprandial hyperinsulinemia, and glucose-dependent insulinotropic polypeptide responses in obese, prediabetic humans. American Journal of Clinical Nutrition 2010;92:1359-68. [DOI] [PMC free article] [PubMed] [Google Scholar]
Venn 2010 {published data only}
- Venn BJ, Perry T, Green TJ, Skeaff CM, Aitken W, Moore NJ, et al. The effect of increasing consumption of pulses and wholegrains in obese people: a randomized controlled trial. Journal of the American College of Nutrition 2010;29:365-72. [DOI] [PubMed] [Google Scholar]
Wolever 2002 {published and unpublished data}
- Wolever TMS, Mehling C. High carbohydrate-low glycaemic index dietary advice improves glucose disposition index in subjects with impaired glucose tolerance. British Journal of Nutrition 2002;87:477-87. [DOI] [PubMed] [Google Scholar]
- Wolever TMS, Mehling C. Long-term effect of varying the source or amount of dietary carbohydrate on postprandial plasma glucose, insulin, triacylglycerol and free fatty acid concentrations in subjects with impaired glucose tolerance. American Journal of Clinical Nutrition 2003;77(3):612-21. [DOI] [PubMed] [Google Scholar]
References to studies excluded from this review
Abbasi 2000 {published data only}
- Abbasi F, McLaughlin T, Lamendola C, Kim HS, Tanaka A, Wang T, et al. High carbohydrate diets, triglyceride-rich lipoproteins, and coronary heart disease risk. American Journal of Cardiology 2000;85:45-8. [DOI] [PubMed] [Google Scholar]
Abete 2008 {published data only}
- Abete I, Parra D, Martinez JA. Energy-restricted diets based on a distinct food selection affecting the glycemic index induce different weight loss and oxidative response. Clinical Nutrition 2008;27:545-51. [DOI] [PubMed] [Google Scholar]
Agus 2000 {published data only}
- Agus MSD, Swain JF, Larson CL, Eckert EA, Ludwig DS. Dietary composition and physiologic adaptations to energy restriction. American Journal of Clinical Nutrition 2000;71(4):901-7. [DOI] [PMC free article] [PubMed] [Google Scholar]
Alfenas 2005 {published data only}
- Alfenas RCG, Mattes RD. Influence of glycemic index/load on glycemic response, appetite, and food intake in healthy humans. Diabetes Care 2005;28(9):2123-9. [DOI] [PubMed] [Google Scholar]
Alfenas 2012 {published data only}
- Alfenas RCG. The consumption of low glycemic meals reduces abdominal obesity in subjects with excess body weight. Nutricion Hospitalaria 2012;27:1178-83. [DOI] [PubMed] [Google Scholar]
Amano 2007 {published data only}
- Amano Y, Sugiyama M, Lee JS, Kawakubo K, Mori K, Tang AC, et al. Glycemic index-based nutritional education improves blood glucose control in Japanese adults: a randomized controlled trial. Diabetes Care 2007;30:1874-6. [DOI] [PubMed] [Google Scholar]
Argiana 2011 {published data only}
- Argiana V, Kanellos P, Elefteriadou I, Alexiadou K, Grigoropoulou P, Tsitsinakis G, et al. The role of glycaemic index and glycaemic load on weight loss and on the metabolic parameters of adults with type 2 diabetes. Diabetologia 2011;54:S354. [Google Scholar]
Aston 2008 {published data only}
- Aston LM, Stokes CS, Jebb SA. No effect of a diet with a reduced glycaemic index on satiety, energy intake and body weight in overweight and obese women. International Journal of Obesity 2008;32:160-5. [DOI] [PMC free article] [PubMed] [Google Scholar]
Bahadori 2005 {published data only}
- Bahadori B, Yazdani-Biuki B, Krippl P, Brath H, Uitz E, Wascher TC. Low-fat, high carbohydrate (low glycaemic index) diet induces weight loss and preserves lean body mass in obese healthy subjects: results of a 24 week study. Diabetes, Obesity and Metabolism 2005;7:290-3. [DOI] [PubMed] [Google Scholar]
Barakatun 2010 {published data only}
- Barakatun Nisak MY, Ruzita AT, Norimah AK, Gilbertson H, Nor Azmi K. Improvement of dietary quality with the aid of a low glycemic index diet in Asian patients with type 2 diabetes mellitus. Journal of the American College of Nutrition 2010;29:161-70. [DOI] [PubMed] [Google Scholar]
Barkoukis 2002 {published data only}
- Barkoukis H, Fiedler KM, Lerner E. A combined high-fiber, low-glycemic index diet normalizes glucose tolerance and reduces hyperglycemia and hyperinsulinemia in adults with hepatic cirrhosis. Journal of the American Dietetic Association 2002;102:1503-7. [DOI] [PubMed] [Google Scholar]
Bouche 2002 {published data only}
- Bouche C, Rizkalla SW, Luo J, Vidal H, Veronese A, Pacher N, et al. Five-week, low glycemic index diet decreases total fat mass and improves plasma lipid profile in moderately overweight nondiabetic men. Diabetes Care 2002;25(5):822-8. [DOI] [PubMed] [Google Scholar]
Brand 1991 {published data only}
- Brand JC, Colagiuri S, Crossman S, Allen A, Roberts DCK, Truswell AS. Low-glycemic index foods improve long-term glycemic control in NIDDM. Diabetes Care 1991;14(2):95-101. [DOI] [PubMed] [Google Scholar]
Brynes 2003 {published data only}
- Brynes AE, Edwards CM, Ghatei MA, Dornhorst A, Morgan LM, Bloom SR, et al. A randomised four-intervention crossover study investigating the effect of carbohydrates on daytime profiles of insulin, glucose, non-esterified fatty acids and triacylglycerols in middle-aged men. British Journal of Nutrition 2003;89:207-18. [DOI] [PubMed] [Google Scholar]
Calle‐Pascual 1988 {published and unpublished data}
- Calle-Pascual AL, Gomez V, Leon E, Bordiu E. Foods with a low glycemic index do not improve glycemic control of both type 1 and type 2 diabetic patients after one month of therapy. Diabete et Metabolisme 1988;14(5):629-33. [PubMed] [Google Scholar]
Carels 2005 {published data only}
- Carels RA, Darby LA, Douglass OM, Cacciapaglia HM, Rydin S. Education on the glycemic index of foods fails to improve treatment outcomes in a behavioral weight loss program. Eating Behaviours 2005;5:145-50. [DOI] [PubMed] [Google Scholar]
Chanteleau 1985 {published data only}
- Chanteleau E, Sonnenburg GE, Kunze K, Berger M. Importance of the glycaemic index of carbohydrate-containing foods for metabolic control of type 1 diabetics under insulin pump therapy [Die Bedeutung des glykämischen Index kohlenhydrathaltiger Lebensmittel für die Stoffwechselkontrolle von Typ1 Diabetikern unter Insulinpumpentherapie]. Aktuelle Ernährungsmedizin Klinik und Praxis 1985;10:236-40. [Google Scholar]
Cheong 2009 {published data only}
- Cheong SH, McCargar LJ, Paty BW, Tudor-Locke C, Bell RC. The First Step First Bite Program: guidance to increase physical activity and daily intake of low-glycemic index foods. Journal of the American Dietetic Association 2009;109:1411-6. [DOI] [PubMed] [Google Scholar]
Chiavaroli 2016 {published data only}
- Chiavaroli L, Mirrahimi A, Ireland C, Mitchell S, Sahye-Pudaruth S, Coveney J, Olowoyeye O, Maraj T, Patel D, Souza RJ, Augustin LS. Low-glycaemic index diet to improve glycaemic control and cardiovascular disease in type 2 diabetes: design and methods for a randomised, controlled, clinical trial. BMJ open 2016;6(7):e012220. [DOI] [PMC free article] [PubMed] [Google Scholar]
Clapp 1998 {published data only}
- Clapp JF. Effect of dietary carbohydrate on the glucose and insulin response to mixed caloric intake and exercise in both nonpregnant and pregnant women. Diabetes Care 1998;21:106-13. [PubMed] [Google Scholar]
Colagiuri 1986 {published data only}
- Colagiuri S, Miller JJ, Holliday JL, Phelan E. Comparison of plasma glucose, serum Insulin, and C-peptide responses to three isocaloric breakfasts in non-insulin-dependant diabetic subjects. Diabetes Care 1986;9:250-5. [DOI] [PubMed] [Google Scholar]
Collier 1986 {published data only}
- Collier GR, Wolever TMS, Wong GS, Josse RG. Prediction of glycemic response to mixed meals in noninsulin-dependant diabetic subjects. American Journal of Clinical Nutrition 1986;44:349-52. [DOI] [PubMed] [Google Scholar]
Collier 1988 {published data only}
- Collier GR, Giudici S, Kalmusky J, Wolever TMS, Helman G, Wesson V, et al. Low glycaemic index starchy foods improve glucose control and lower serum cholesterol in diabetic children. Diabetes, Nutrition and Metabolism - Clinical and Experimental 1988;1:11-9. [Google Scholar]
Coulston 1984 {published data only}
- Coulston AM, Hollenbeck CB, Liu GC, Williams RA, Starich GH, Mazzaferri EL, et al. Effect of source of dietary carbohydrate on plasma glucose, insulin, and gastric inhibitory polypeptide responses to test meals in subjects with noninsulin-dependant diabetes mellitus. American Society of Clinical Nutrition 1984;40:965-70. [DOI] [PubMed] [Google Scholar]
Crapo 1981 {published data only}
- Crapo PA, Insel J, Sperling M, Kolterman OG. Comparison of serum glucose, insulin, and glucagon responses to different types of complex carbohydrate in noninsulin-dependant diabetic patients. American Journal of Clinical Nutrition 1981;34:184-90. [DOI] [PubMed] [Google Scholar]
De Rougemont 2007 {published data only}
- De Rougemont A, Normand S, Nazare JA, Skilton MR, Sothier M, Vinoy S, et al. Beneficial effects of a 5-week low-glycaemic index regimen on weight control and cardiovascular risk factors in overweight non-diabetic subjects. British Journal of Nutrition 2007;98:1288-98. [DOI] [PubMed] [Google Scholar]
Dumesnil 2001 {published data only}
- Dumesnil JG, Turgeon J, Tremblay A, Poirer P, Gilbert M, Gagnon L, et al. Effect of a low-glycaemic Index-low-fat-high protein diet on the atherogenic metabolic risk profile of abdominally obese men. British Journal of Nutrition 2001;86:557-68. [DOI] [PubMed] [Google Scholar]
Ebbeling 2003 {published data only}
- Ebbeling CB, Leidig MM, Sinclair KB, Hangen JP, Ludwig DS. A reduced glycemic load diet in the treatment of adolescent obesity. Archives of Pediatrics and Adolescent Medicine 2003;157:773-9. [DOI] [PubMed] [Google Scholar]
Ebbeling 2005 {published data only}
- Ebbeling CB, Leidig MM, Sinclair KB, Seger-Shippee LG, Feldman HA, Ludwig DS. Effects of an ad libitum low glycemic load diet on cardiovascular disease risk factors in obese young adults. American Journal of Clinical Nutrition 2005;81:976-82. [DOI] [PubMed] [Google Scholar]
Fontvielle 1988 {published data only}
- Fontvieille AM, Acosta M, Rizkalla SW, Bornet F, David P, Letanoux M, et al. A moderate switch from high to low glycaemic-index foods for 3 weeks improves the metabolic control of Type I (IDDM) diabetic subjects. Diabetes, Nutrition and Metabolism - Clinical and Experimental 1988;1:139-43. [Google Scholar]
Fontvielle 1992 {published data only}
- Fontvielle AM, Rizkalla SW, Penfornis A, Acosta M, Bornet FRJ, Slama G. The use of low glycaemic index foods improves metabolic control of diabetic patients over five weeks. Diabetic Medicine 1992;9:444-50. [DOI] [PubMed] [Google Scholar]
Frost 1994 {published data only}
- Frost G, Wilding J, Beecham J. Dietary advice based on the glycaemic index improves dietary profile and metabolic control in type 2 diabetic patients. Diabetic Medicine 1994;11:397-401. [DOI] [PubMed] [Google Scholar]
Frost 1996 {published data only}
- Frost G, Keogh B, Smith D, Akinsanya K, Leeds A. The effect of low-glycemic carbohydrate on insulin and glucose response in vivo and in vitro in patients with coronary heart disease. Metabolism 1996;45(6):669-72. [DOI] [PubMed] [Google Scholar]
Frost 1998a {published data only}
- Frost G, Leeds A, Trew G, Margara R, Dornhurst A. Insulin sensitivity in women at risk of coronary heart disease and the effect of a low glycemic diet. Metabolism 1998;47(10):1245-51. [DOI] [PubMed] [Google Scholar]
Frost 1998b {published data only}
- Frost GE, Keogh BE, Smith D, Leeds AR, Dornhorst A. Reduced adipocyte insulin sensitivity in Caucasian and Asian subjects with coronary heart disease. Diabetic Medicine 1998;15:1003-9. [DOI] [PubMed] [Google Scholar]
Frost 1999 {published data only}
- Frost G, Leeds AA, Dore CJ, Madeiros S, Brading S, Dornhurst A. Glycaemic index as a determinant of serum HDL-cholesterol concentration. Lancet 1999;353:1045-8. [DOI] [PubMed] [Google Scholar]
Fuh 1990 {published data only}
- Fuh MMT, Lee MMS, Jeng CY, Ma F, Chen I, Reavem GM. Effect of low fat-high carbohydrate diets in hypertensive patients with non-insulin-dependent diabetes mellitus. American Journal of Hypertension 1990;3:527-32. [DOI] [PubMed] [Google Scholar]
Garg 1988 {published data only}
- Garg A, Bonanome A, Grundy SM, Zhang ZU, Unger RH. Comparison of a high-carbohydrate diet with a high-monounsaturated-fat diet in patients with non-insulin-dependent diabetes mellitus. New England Journal of Medicine 1988;13:828-35. [DOI] [PubMed] [Google Scholar]
Garg 1992 {published data only}
- Garg A, Grundy SM, Unger RH. Comparison of effects of high and low carbohydrate diets on plasma lipoproteins and insulin sensitivity in patients with mild NIDDM. Diabetes 1992;41:1278-85. [PubMed] [Google Scholar]
Garg 1994 {published data only}
- Garg A, Bantle JP, Henry RR, Coulston AM, Griver KA, Raatz SK, et al. Effects of varying carbohydrate content of diet in patients with non-insulin-dependant diabetes mellitus. JAMA 1994;271:1420-9. [DOI] [PubMed] [Google Scholar]
Giacco 2000 {published data only}
- Giacco R, Parillo M, Rivellese AA, Lasorella G, Giacco A, D'Episcopo L, et al. Long-term dietary treatment with increased amounts of fiber-rich low-glycemic index natural foods improves blood glucose control and reduces the number of hypoglycemic events in type 1 diabetic patients. Diabetes Care 2000;23(10):1461-6. [DOI] [PubMed] [Google Scholar]
Gilbertson 2001 {published data only}
- Gilbertson HR, Brand-Miller JC, Thornburn AW, Evans S, Chondros P, Werther GA. The effect of flexible low glycemic index dietary advice versus measured carbohydrate exchange diets on glycemic control in children with type 1 diabetes. Diabetes Care 2001;24(7):1137-43. [DOI] [PubMed] [Google Scholar]
Gilbertson 2003 {published data only}
- Gilbertson HR, Thornburn AW, Brand-Miller JC, Chondros P, Werther GA. Effect of low glycaemic-index dietary advice on dietary quality and food choice in children with type 1 diabetes. American Journal of Clinical Nutrition 2003;77:83-90. [DOI] [PubMed] [Google Scholar]
Golay 1992 {published data only}
- Golay A, Koellreutter B, Bloise D, Assal JP, Wursch P. The effect of muesli or cornflakes at breakfast on carbohydrate metabolism in type 2 diabetic patients. Diabetes Research and Clinical Practice 1992;15:135-42. [DOI] [PubMed] [Google Scholar]
Grant 2010 {published data only}
- Grant S, Wolever TMS, O'Connor DL, Josse RG. The effect of a low glycemic index diet on gestational hyperglycemia: a pilot trial. Federation of the American Societies of Experimental Biology Journal 2010;19(11):15-22. [Google Scholar]
Gutschall 2009 {published data only}
- Gutschall MD, Miller CK, Mitchell DC, Lawrence FR. A randomized behavioural trial targeting glycaemic index improves dietary, weight and metabolic outcomes in patients with type 2 diabetes. Public Health Nutrition 2009;12:1846-54. [DOI] [PubMed] [Google Scholar]
Heilbronn 2002 {published data only}
- Heilbronn LK, Noakes M, Clifton PM. The effect of high- and low-glycemic index energy restricted diets on plasma lipid and glucose profiles in type 2 diabetic subjects with varying glycemic control. Journal of the American College of Nutrition 2002;21(2):120-7. [DOI] [PubMed] [Google Scholar]
Herrmann 2001 {published data only}
- Herrmann TS, Bean ML, Black TM, Wang P, Coleman RA. High glycemic index carbohydrate diet alters the diurnal rhythm of leptin but not insulin concentrations. Experimental Biology & Medicine 2001;226:1037-44. [DOI] [PubMed] [Google Scholar]
Hollenbeck 1985 {published data only}
- Hollenbeck CB, Riddle MC, Connor WE, Leklem JE. The effects of subject-selected high carbohydrate, low fat diets on glycemic control in insulin dependant diabetes mellitus. American Society for Clinical Nutrition 1985;41:293-8. [DOI] [PubMed] [Google Scholar]
Jarvi 1995 {published data only}
- Jarvi AE, Karlstrom BE, Granfeldt YE, Bjorck IME, Vessby BOH, Asp LN. The influence of food structure on postprandial metabolism in patients with non-insulin-dependant diabetes mellitus. American Journal of Clinical Nutrition 1995;61:837-43. [DOI] [PubMed] [Google Scholar]
Jarvi 1999 {published data only}
- Jarvi A, Karlstrom B, Granfeldt Y, Bjorck I, Asp NG, Vessby B. Improved glycemic control and lipid profile and normalized fibrinolytic activity on a low glycemic index diet in type 2 diabetic patients. Diabetes Care 1999;22:10-8. [DOI] [PubMed] [Google Scholar]
Jenkins 1985 {published data only}
- Jenkins DJA, Wolever TMS, Kalmusky J, Giudici S, Giordano C, Wong GS, et al. Low glycemic index carbohydrate foods in the management of hyperlipidemia. American Journal of Clinical Nutrition 1985;42:604-17. [DOI] [PubMed] [Google Scholar]
Jenkins 1987a {published data only}
- Jenkins DJA, Wolever TMS, Collier GR, Ocana A, Rao AV, Buckley G, et al. Metabolic effects of a low-glycemic-index diet. American Society for Clinical Nutrition 1987;46:968-75. [DOI] [PubMed] [Google Scholar]
Jenkins 1987b {published data only}
- Jenkins DJA, Wolever TMS, Kalmusky J, Guidici S, Giordano C, Patten R, et al. Low glycemic index diet in hyperlipidemia: use of traditional starchy foods. American Journal of Clinical Nutrition 1987;46:66-71. [DOI] [PubMed] [Google Scholar]
Jenkins 1988 {published data only}
- Jenkins DJA, Wolever TMS, Buckley G, Lam KY, Giudici S, Kalmusky J, et al. Low glycemic index starchy foods in the diabetic diet. American Journal of Clinical Nutrition 1988;48:248-54. [DOI] [PubMed] [Google Scholar]
Jenkins 2002a {published data only}
- Jenkins DJA, Kendall CWC, Augustin LSA, Martini MC, Axelsen M, Faulkner D, et al. Effect of wheat bran on glycemic control and risk factors for cardiovascular disease in type 2 diabetes. Diabetes Care 2002;25:1522-8. [DOI] [PubMed] [Google Scholar]
Jenkins 2002b {published data only}
- Jenkins AL, Jenkins DJA, Zdravkovic U, Wursch P, Vuksan V. Depression of the glycemic index by high levels of B-glucan fiber in two functional foods tested in type 2 diabetes. European Journal of Clinical Nutrition 2002;56:622-8. [DOI] [PubMed] [Google Scholar]
Jenkins 2008 {published data only}
- Jenkins DJ, Kendall CW, McKeown-Eyssen G, Josse RG, Silverberg J, Booth GL, et al. Effect of a low-glycemic index or a high-cereal fiber diet on type 2 diabetes: a randomized trial. JAMA 2008;300:2742-53. [DOI] [PubMed] [Google Scholar]
Jensen 2008 {published data only}
- Jensen L, Sloth B, Krog-Mikkelsen I, Flint A, Raben A, Tholstrup T, et al. A low-glycemic-index diet reduces plasma plasminogen activator inhibitor-1 activity, but not tissue inhibitor of proteinases-1 or plasminogen activator inhibitor-1 protein, in overweight women. American Journal of Clinical Nutrition 2008;87:97-105. [DOI] [PubMed] [Google Scholar]
Jeppesen 1997 {published data only}
- Jeppensen J, Schaaf P, Jones C, Zhou MY, Chen IYD, Reaven GM. Effects of low-fat, high-carbohydrate diets on risk factors for ischemic heart disease in postmenopausal women. American Society for Clinical Nutrition 1997;65:1027-33. [DOI] [PubMed] [Google Scholar]
Jimenez‐Cruz 2003a {published data only}
- Jimenez-Cruz A, Bacardi-Gascon M, Turnbull WH, Rosales G, Severino-Lugo I. A flexible, low-glycemic index Mexican-style diet in overweight and obese subjects with type 2 diabetes improves metabolic parameters during a 6-week treatment period. Diabetes Care 2003;26(7):1967-70. [DOI] [PubMed] [Google Scholar]
Jiminez‐Cruz 2003b {published data only}
- Jiminez-Cruz A, Seimandi-Mora H, Bacardi-Gascon M. Effect of low glycemic index diet in hyperlipidemia [Efecto de dietas con bajo indice glucemico en hiperlipidemicos]. Nutricion Hospitalaria 2003;18(6):331-5. [PubMed] [Google Scholar]
Jiminez‐Cruz 2004 {published data only}
- Jiminez-Cruz A, Turnbull WH, Bacardi-Gascon MB, Rosales-Garay P. A high fiber, moderate-glycemic index, Mexican style diet improves dyslipidemia in individuals with type 2 diabetes. Nutrition Research 2004;24(1):19-27. [Google Scholar]
Kabir 2002 {published data only}
- Kabir M, Oppert J-M, Vidal H, Bruzzo F, Fiquet C, Wursch P, et al. Four-week low-glycemic index breakfast with a modest amount of soluble fibers in type 2 diabetic men. Metabolism 2002;51(7):819-26. [DOI] [PubMed] [Google Scholar]
- Kabir M, Rizkalla SW, Oppert J-M, Wursch P, Bruzzo F, Slama G. Chronic effects of a low glycemic index starch breakfast on glucose and lipid metabolism in type 2 diabetic men: results of a controlled study. Diabetes 1999;48(Suppl 1):A461. [Google Scholar]
Kelly 2011 {published data only}
- Kelly KR, Haus JM, Solomon TP, Patrick-Melin AJ, Cook M, Rocco M, et al. A low-glycemic index diet and exercise intervention reduces TNF(alpha) in isolated mononuclear cells of older, obese adults. Journal of Nutrition 2011;141:1089-94. [DOI] [PMC free article] [PubMed] [Google Scholar]
Kendall 2012 {published data only}
- Kendall CWC, Augustin LS, Mitchell S, Sahye-Pudaruth S, Coveney J, Cerovic A, et al. Effect of pulses as part of a low glycemic index diet compared to a high fiber diet on HbA1c and blood lipids in type 2 diabetes. Federation of the American Societies of Experimental Biology Journal 2012;26:5. [Google Scholar]
Kiens 1996 {published data only}
- Kiens B, Richter EA. Types of carbohydrate in an ordinary diet affect insulin action and muscle substrates in humans. American Journal of Clinical Nutrition 1996;63:47-53. [DOI] [PubMed] [Google Scholar]
Komindr 2001 {published data only}
- Komindr S, Ingsriswang S, Lerdvuthisopon N, Boontawee A. Effect of long-term intake of Asian food with different glycaemic indices on diabetic control and protein conservation in type 2 diabetic patients. Journal of the Medical Association of Thailand 2001;84(1):85-97. [PubMed] [Google Scholar]
Krog‐Mikkelsen 2011 {published data only}
- Krog-Mikkelsen I, Sloth B, Dimitrov D, Tetens I, Bjorck I, Flint A, et al. A low glycemic index diet does not affect postprandial energy metabolism but decreases postprandial insulinemia and increases fullness ratings in healthy women. Journal of Nutrition 2011;141:1679-84. [DOI] [PubMed] [Google Scholar]
Kwak 2012 {published data only}
- Kwak JH, Paik JK, Kim HI, Kim OY, Shin DY, Kim HJ, et al. Dietary treatment with rice containing resistant starch improves markers of endothelial function with reduction of postprandial blood glucose and oxidative stress in patients with prediabetes or newly diagnosed type 2 diabetes. Atherosclerosis 2012;224:457-64. [DOI] [PubMed] [Google Scholar]
Lafrance 1998 {published data only}
- Lafrance L, Rabasa-Lhoret R, Poisson D, Ducros F, Chiasson J-L. The effects of different glycaemic index foods and dietary fibre intake on glycaemic control in type 1 diabetic patients on intensive insulin therapy. Diabetic Medicine 1998;15:972-8. [DOI] [PubMed] [Google Scholar]
LaHaye 2005 {published data only}
- LaHaye SA, Hollett PM, Vyselaar JR, Shakchi M, Lahey KA, Day AG. Comparison between a low glycemic load diet and a Canada Food Guide diet in cardiac rehabilitation patients in Ontario. Canadian Journal of Cardiology 2005;21(6):489-94. [PubMed] [Google Scholar]
Laitinen 1993 {published data only}
- Laitinen JH, Ahola IE, Sarkkinen ES, Winberg RL, Harmaakorpi-IIvonen PA, Uusitupa MI. Impact of intensified dietary therapy on energy and nutrient intakes and fatty acid composition of serum lipids in patients with recently diagnosed non-insulin-dependant diabetes mellitus. Diabetes Spectrum 1995;8:102-3. [DOI] [PubMed] [Google Scholar]
Leinonen 2000 {published data only}
- Leinonen KS, Poutanen KS, Mykkanen HM. Rye bread decreases serum total and LDL cholesterol in men with moderately elevated serum cholesterol. Journal of Nutrition 2000;130:164-70. [DOI] [PubMed] [Google Scholar]
Lerman‐Garber 1995 {published data only}
- Lerman-Garber I, Gulias-Herrero A, Palma ME, Valles VE, Guerrero LA, Garcia EG, et al. Response to high carbohydrate and high monounsaturated fat diets in hypertriglyceridemic non-insulin dependent diabetic patients with poor glycemic control. Diabetes, Nutrition and Metabolism - Clinical and Experimental 1995;8:339-45. [Google Scholar]
Lieberman 2003 {published data only}
- Lieberman S. Natural methods for accelerating weight loss: the low glycemic index diet, green tea, chromium, and 5-hydroxytryptophan. Alternative and Complementary Therapies 2003;9(6):307-11. [Google Scholar]
Liu 2000 {published data only}
- Liu S, Willett WC, Stampfer MJ, Hu FB, Franz M, Sampson L, et al. A prospective study of dietary glycemic load, carbohydrate intake and risk of coronary heart disease in US women. American Journal of Clinical Nutrition 2000;71(6):1455-61. [DOI] [PubMed] [Google Scholar]
Liu 2002 {published data only}
- Liu S, Manson JE, Buring JE, Stampfer MJ, Willett WC, Ridker PM. Relation between a diet with a high glycemic load and plasma concentrations of high-sensitivity C-reactive protein in middle-aged women. American Journal of Clinical Nutrition 2002;75(3):492-8. [DOI] [PubMed] [Google Scholar]
Ludwig 1999 {published data only}
- Ludwig DS, Majzoub JA, Al-Zahrani A, Dallal GE, Blanco I, Roberts SB. High glycemic index foods, overeating, and obesity. Pediatrics 1999;103(3):E26. [DOI] [PubMed] [Google Scholar]
Lunetta 1996 {published data only}
- Lunetta M, Mauro MD. Different effect of acute and chronic oral metformin administration on glucose and insulin response to bread and to pasta in non-insulin dependent diabetic patients. Diabetes Research and Clinical Practice 1996;33:53-8. [DOI] [PubMed] [Google Scholar]
Luscombe 1999 {published data only}
- Luscombe ND, Noakes M, Clifton PM. Diets high and low in glycemic index versus high monounsaturated fat diets: effects on glucose and lipid metabolism in NIDDM. European Journal of Clinical Nutrition 1999;53:473-8. [DOI] [PubMed] [Google Scholar]
Marsh 2010 {published data only}
- Marsh KA, Steinbeck KS, Atkinson FS, Petocz P, Brand-Miller JC. Effect of a low glycemic index compared with a conventional healthy diet on polycystic ovary syndrome. American Journal of Clinical Nutrition 2010;92:83-92. [DOI] [PubMed] [Google Scholar]
Morales 1997 {published data only}
- Morales LM, Semprun-Fereira M, Ryder E, Valbuena H, Rincon E, Fernandez V, et al. Improved triglyceride control with low glycaemic index-high carbohydrate modified-lipid diet in a hypertriglyceridaemic child. Acta Paediatrica 1997;86:772-4. [DOI] [PubMed] [Google Scholar]
Nazare 2010 {published data only}
- Nazare JA, De Rougemont A, Normand S, Sauvinet V, Sothier M, Vinoy S, et al. Effect of postprandial modulation of glucose availability: short-and long-term analysis. British Journal of Nutrition 2010;103:1461-70. [DOI] [PubMed] [Google Scholar]
Pacy 1984 {published data only}
- Pacy PJ, Dodson PM, Kubicki AJ, Fletcher RF, Taylor KG. Effect of a high fibre, high carbohydrate dietary regimen on serum lipids and lipoproteins in type II hypertensive diabetic patients. Diabetes Research 1984;1:159-63. [PubMed] [Google Scholar]
Patel 2004 {published data only}
- Patel VC, Aldridge RD, Leeds A, Dornhorst A, Frost GS. Retrospective analysis of the impact of a low glycaemic index diet on hospital stay following coronary artery bypass grafting: a hypothesis. Journal of Human Nutrition and Dietetics 2004;17(3):241-7. [DOI] [PubMed] [Google Scholar]
Patel 2011a {published data only}
- Patel JV, Hughes EA, Lip GY, Gill PS. Diabetes Health, Residence & Metabolism in Asians: the DHRMA study, research into foods from the Indian subcontinent - a blinded, randomised, placebo controlled trial. BMC Cardiovascular Disorders 2011;11:70. [DOI] [PMC free article] [PubMed] [Google Scholar]
Percheron 1997 {published data only}
- Percheron C, Colette C, Avignon A, Monnier L. Metabolic responses to high carbohydrate breakfasts in obese patients with impaired glucose tolerance. Comparison of meals containing dairy products and fruits versus bread. Nutrition Research 1997;17:797-806. [Google Scholar]
Pereira 2002 {published data only}
- Pereira MA, Jacobs DR, Pins JJ, Raatz SK, Gross MD, Slavin JL, et al. Effext of whole grains on insulin sensitivity in overweight hyperinsulinemic adults. American Journal of Clinical Nutrition 2002;75(5):848-55. [DOI] [PubMed] [Google Scholar]
Pereira 2004 {published data only}
- Pereira MA, Swain J, Goldfine AB, Rifai N, Ludwig DS. Effects of a low glycemic index load diet on resting energy expenditure and heart disease risk factors during weight loss. JAMA 2004;292(20):2482-90. [DOI] [PubMed] [Google Scholar]
Perichart‐Perera 2012 {published data only}
- Perichart-Perera O, Balas-Nakash M, Rodriguez-Cano A, Legorreta-Legorreta J, Parra-Covarrubias A, Vadillo-Ortega F. Low glycemic index carbohydrates versus all types of carbohydrates for treating diabetes in pregnancy: a randomized clinical trial to evaluate the effect of glycemic control. International Journal of Endocrinology 2012;Epub 2012 Nov 29:296017. [DOI] [PMC free article] [PubMed] [Google Scholar]
Pittas 2005 {published data only}
- Pittas AG, Das SK, Hajduk CL, Golden J, Saltzman E, Stark PC, et al. A low glycemic load diet facilitates greater weight loss in overweight adults with high insulin secretion but not in overweight adults with low insulin secretion in the CALERIE trial. Diabetes Care 2005;28(12):2939-41. [DOI] [PubMed] [Google Scholar]
Poppitt 2002 {published data only}
- Poppitt SD, Keogh GF, Prentice AM, Williams DEM, Sonnemans HMW, Valk EEJ, et al. Long-term effects of ad libitum low-fat, high-carbohydrate diets on body weight and serum lipids in overweight subjects with metabolic syndrome. American Society for Clinical Nutrition 2002;75:11-20. [DOI] [PubMed] [Google Scholar]
Rabasa‐Lhoret 1999 {published data only}
- Rabasa-Lhoret R, Garon J, Langelier H, Poisson D, Chiasson JL. Effects of meal carbohydrate content on insulin requirements in type 1 diabetic patients treated intensively with the basal-bolus (ultralente- regular) insulin regimen. Diabetes Care 1999;22:667-73. [DOI] [PubMed] [Google Scholar]
Rasmussen 1993 {published data only}
- Rasmussen OW, Thomsen C, Hansen KW, Vesterlund M, Winther E, Hermansen K. Effects on blood pressure, glucose, and lipid levels of a high-monounsaturated fat diet compared with a high-carbohydrate diet in NIDDM subjects. Diabetes Care 1993;16:1564-71. [DOI] [PubMed] [Google Scholar]
Runchey 2012 {published data only}
- Runchey SS, Pollak MN, Valsta LM, Coronado GD, Schwarz Y, Breymeyer KL, et al. Glycemic load effect on fasting and post-prandial serum glucose, insulin, IGF-1 and IGFBP-3 in a randomized, controlled feeding study. European Journal of Clinical Nutrition 2012;66:1146-52. [DOI] [PMC free article] [PubMed] [Google Scholar]
Runchey 2013 {published data only}
- Runchey SS, Valsta LM, Schwarz Y, Wang C, Song X, Lampe JW, et al. Effect of low- and high-glycemic load on circulating incretins in a randomized clinical trial. Metabolism: Clinical and Experimental 2013;62:188-95. [DOI] [PMC free article] [PubMed] [Google Scholar]
Sacks 2013 {published data only}
- Sacks FM, Appel LJ, Carey VJ, Anderson CA, Charleston J, Copeland P, et al. Effect of dietary carbohydrate (amount and type) on risk factors for cardiovascular disease and diabetes: the omnicarb trial. Circulation 2013;127(Suppl 12):A016. [Google Scholar]
Salmeron 1997 {published data only}
- Salmeron J, Ascherio A, Rimm EB, Colditz GA, Spiegelman D, Jenkins DJ, et al. Dietary fiber, glycemic load, and risk of NIDDM in men. Diabetes Care 1997;20(4):545-50. [DOI] [PubMed] [Google Scholar]
Santacroce 1990 {published data only}
- Santacroce G, Forlani G, Giangiulio S, Galuppi V, Pagani M, Vannini P. Long-term effects of eating sucrose on metabolic control of type 1 (insulin-dependent) diabetic outpatients. Acta Diabetologica Latina 1990;27:365-70. [DOI] [PubMed] [Google Scholar]
Scholz 2003 {published data only}
- Scholz S, Chantelau E. Glycemic index and insulin dosage on intensive insulin therapy [Glykämischer Index und Insulindosierung bei intensivierter Insulin-Therapie]. Interistische Praxis 2003;43(2):389-96. [Google Scholar]
Sciarrone 1993 {published data only}
- Sciarrone SEG, Martin T, Strahan LJ, Beilin VB, Burke V, Rogers P, et al. Ambulatory blood pressure and heart rate responses to vegetarian meals. Journal of Hypertension 1993;11:227-85. [DOI] [PubMed] [Google Scholar]
Sharafetdinov 1997 {published data only}
- Sharafetdinov KhKh, Meshcheriakova VA, Plotnikova OA. Change in postprandial glycemia as affected by various carbohydrate-containing products in patients with type II diabetes mellitus [Izmenenie poslepishchevoi glikemii pod vliianiem nekotorykh uglevodsoderzhashchikh produktov u bol'nykh sakharnym diabetom II tipa]. Voprosny Pitania 1997;1:27-30. [PubMed] [Google Scholar]
Shikany 2009 {published data only}
- Shikany JM, Phadke RP, Redden DT, Gower BA. Effects of low- and high-glycemic index/glycemic load diets on coronary heart disease risk factors in overweight/obese men. Metabolism: Clinical and Experimental 2009;58:1793-801. [DOI] [PMC free article] [PubMed] [Google Scholar]
Shyam 2013 {published data only}
- Shyam S, Arshad F, Abdul Ghani R, Wahab NA, Safii NS, Nisak MY, et al. Low glycaemic index diets improve glucose tolerance and body weight in women with previous history of gestational diabetes: a six months randomized trial. Nutrition Journal 2013;12:68. [DOI] [PMC free article] [PubMed] [Google Scholar]
Singh 1991 {published data only}
- Singh RB, Rastogi SS, Sircar AR, Mehta PJ, Sharma KK. Dietary strategies for risk factor modification to prevent cardiovascular diseases. Nutrition 1991;7:210-5. [PubMed] [Google Scholar]
Slabber 1994 {published data only}
- Slabber M, Barnard HC, Kuyl JM, Dannhauser A, Schall R. Effects of a low-insulin response, energy restricted diet on weight loss and plasma insulin concentrations in hyperinsulinemic obese females. American Journal of Clinical Nutrition 1994;60:48-53. [DOI] [PubMed] [Google Scholar]
Sloth 2004 {published data only}
- Sloth B, Krog-Mikkelson I, Flint A, Tetens I, Bjorck I, Vinoy S, et al. No difference in body weight decrease between a low-glycemic-index and a high-glycemic-index diet but reduced LDL cholesterol after 10-wk ad libitum intake of the low glycemic-index diet. American Journal of Clinical Nutrition 2004;80:337-47. [DOI] [PubMed] [Google Scholar]
Spieth 2000 {published data only}
- Spieth LE, Harnish JD, Lenders CM, Raezer LB, Pereira MA, Hangen SJ, et al. A low glycemic index diet in the treatment of pediatric obesity. Archives of Pediatrics and Adolescent Medicine 2000;154:947-51. [DOI] [PubMed] [Google Scholar]
Taghrid 2004 {published and unpublished data}
- Huet D, Rizkalla SW, Rigoir A, Veronese A, Pacher N, Slama G. Metabolic effects of chronic low glycemic index diet in type 2 diabetes. Diabetes 2001;50(Suppl 2):A367. [Google Scholar]
- Rizkalla SW, Taghrid L, Laromiguiere M, Huet D, Boillot J, Rigoir A, et al. Improved plasma glucose control, whole-body glucose utilization, and lipid profile on a low-glycemic index diet in type 2 diabetic men: a randomized controlled trial. Diabetes Care 2004;27(8):1866-72. [DOI] [PubMed] [Google Scholar]
- Taghrid L, Rizkalla SW, Huet D, Rigoir A, Veronese A, Slama G. Improvement of glycemic control and plasma lipid levels by chronic low glycemic index diet in type 2 diabetes. Diabetes 2003;52(Suppl 1):A72. [Google Scholar]
Tovar 2012 {published data only}
- Tovar J, Nilsson A, Johansson M, Ekesbo R, Aberg AM, Johansson U, et al. A diet based on multiple functional concepts improves cardiometabolic risk parameters in healthy subjects. Nutrition and Metabolism 2012;9:29. [DOI] [PMC free article] [PubMed] [Google Scholar]
Tsihlias 2000 {published and unpublished data}
- Tsihlias EB, Gibbs AL, McBurney MI, Wolever TMS. Comparison of high-and low-glycemic index breakfast cereals with monounsaturated fat in the long-term dietary management of type 2 diabetes. American Journal of Clinical Nutrition 2000;72(2):439-49. [DOI] [PubMed] [Google Scholar]
Van Horn 1991 {published data only}
- Van Horn L, Moag-Stahlberg A, Liu K, Ballew C, Ruth K, Hughes R, et al. Effects on serum lipids of adding instant oats to usual American diets. American Journal of Public Health 1991;81(2):183-4. [DOI] [PMC free article] [PubMed] [Google Scholar]
Visek 2011 {published data only}
- Visek J, Lacigova S, Cechurova D, Blaha V, Rusavy Z. Comparison of the impact of a low-glycemic index diet and a commonly used diabetic diet - a randomized crossover study. Clinical Nutrition Supplements 2011;6(1):117. [Google Scholar]
Vrolix 2010 {published data only}
- Vrolix R, Mensink RP. Effects of glycemic load on metabolic risk markers in subjects at increased risk of developing metabolic syndrome. American Journal of Clinical Nutrition 2010;92:366-74. [DOI] [PubMed] [Google Scholar]
Wolever 1992a {published data only}
- Wolever TMS, Jenkins DJA, Vuksan V, Jenkins AL, Wong GS, Josse RG. Beneficial effect of low-glycemic index diet in overweight NIDDM subjects. Diabetes Care 1992;15(4):562-4. [DOI] [PubMed] [Google Scholar]
Wolever 1992b {published data only}
- Wolever TMS, Jenkins DJA, Vuksan V, Jenkins AL, Wong GS, Josse RG. Beneficial effect of low-glycaemic index diet in type 2 diabetes. Diabetic Medicine 1992;9:451-8. [DOI] [PubMed] [Google Scholar]
Wolever 1995 {published data only}
- Wolever T, Bentum-Williams AM, Jenkins DJA. Physiological modulation of plasma free fatty acid concenrations by diet: metabolic implications in nondiabetic subjects. Diabetes Care 1995;18:962-70. [DOI] [PubMed] [Google Scholar]
Wolever 2008 {published data only}
- Wolever TM, Mehling C, Chiasson JL, Josse RG, Leiter LA, Maheux P, et al. Low glycaemic index diet and disposition index in type 2 diabetes (the Canadian trial of carbohydrates in diabetes): a randomised controlled trial. Diabetologia 2008;51:1607-15. [DOI] [PubMed] [Google Scholar]
Yang 2002 {published data only}
- Yang EJ, Chung HK, Kim WY, Kerver JM, Song WO. Carbohydrate intake is associated with diet quality and risk factors for cardiovascular disease in US adults: NHANES III. Journal of the American College of Nutrition 2002;22:71-9. [DOI] [PubMed] [Google Scholar]
Yusof 2009 {published data only}
- Yusof BN, Talib RA, Kamaruddin NA, Karim NA, Chinna K, Gilbertson H. A low-GI diet is associated with a short-term improvement of glycaemic control in Asian patients with type 2 diabetes. Diabetes, Obesity & Metabolism 2009;11:387-96. [DOI] [PubMed] [Google Scholar]
Zhang 2010 {published data only}
- Zhang Z, Lanza E, Kris-Etherton PM, Colburn NH, Bagshaw D, Rovine MJ, et al. A high legume low glycemic index diet improves serum lipid profiles in men. Lipids 2010;45:765-75. [DOI] [PMC free article] [PubMed] [Google Scholar]
References to studies awaiting assessment
Boyadjieva 2015 {published data only}
- Boyadjieva N, Handjieva-Darlenska T, Karamfilova V, Kamenov Z. No effect of glycemic index (low vs. high) on ghrelin and leptin in obesity. In: Obesity Facts. Vol. 8. 2015:39.
Cayanan 2015 {published data only}
- Cayanan E, Marhsall N, Yee B, Wong K, Djavadkhani Y, Grunstein R, Hoyos C. Effectiveness of two maintenance diets following a very low energy diet to reduce cardio-metabolic risk In obese sleep apnea patients: a randomized controlled trial. Sleep and Biological Rhythms 2015;13:56. [Google Scholar]
Giroux 2015 {published data only}
- Giroux I, Azzi S, Lavigne-Robichaud M, Comtois E, Blaine S, Whebby B, et al. The effect of a 6-month lifestyle education program on dietary behaviors in rural adults with prediabetes. In: Canadian Journal of Dietetic Practice & Research. Vol. 73. 2015:e2.
Karl 2015 {published data only}
- Karl JP, Roberts SB, Schaefer EJ, Gleason JA, Fuss P, Rasmussen H, Saltzman E, Das SK. Effects of carbohydrate quantity and glycemic index on resting metabolic rate and body composition during weight loss. Obesity 2015;23(11):2190-2198. [DOI] [PMC free article] [PubMed] [Google Scholar]
Weinhold 2015 {published data only}
- Weinhold K, Miller CK, Marrero DG, Nagaraja H, Focht B. Worksite diabetes prevention trial improves outcomes among employees with prediabetes. Diabetes 2015;64:A216. [DOI] [PMC free article] [PubMed] [Google Scholar]
References to ongoing studies
Brand‐Miller 2013 {published data only}
- Raben A, Fogelholm M, Feskens E, Westerterp-Plantenga M, Schlicht W, Brand-Miller J. PREVIEW: PREVention of diabetes through lifestyle Intervention and population studies in Europe and around the World. Obesity Facts 2013;6:194. [Google Scholar]
- Raben A, Fogelholm M, Larsen TM, Drummens M, Poppitt S, Formiguera JA, et al. PREVIEW: Prevention of diabetes through lifestyle intervention and population studies in Europe and around the world. Over 2,000 volunteers randomized to the 3-y RCT. In: Obesity Facts. Vol. 8. 2015:126.
- Silvestre M, Poppitt S, Liu A, Folgelholm M, Freskens E, Westerterp-Plantenga M, et al. PREVIEW: PREVention of diabetes through lifestyle Intervention in Europe and around the World – Where are we now? Obesity Research & Clinical Practice 2014;8:93-4. [Google Scholar]
Additional references
Aburto 2013
- Aburto NJ, Ziolkovska A, Hooper L, Elliott P, Cappuccio FP, Meerpohl JJ. Effect of lower sodium intake on health: systematic review and meta-analyses. British Medical Journal 2013;346:f1326. [DOI] [PMC free article] [PubMed] [Google Scholar]
Atkinson 2008
- Atkinson FS, Foster-Powell K, Brand-Miller JC. International tables of glycaemic index and glycaemic load values: 2008. Diabetes Care 2008;31:2281-3. [DOI] [PMC free article] [PubMed] [Google Scholar]
Augustin 2015
- Augustin L, Kendall C, Jenkins D, Willett W, Astrup A, Barclay A, et al. Glycemic index, glycemic load and glycemic response: an International Scientific Consensus Summit from the International Carbohydrate Quality Consortium (ICQC). Nutrition, Metabolism and Cardiovascular Diseases 2015;25(9):795-815. [DOI] [PubMed] [Google Scholar]
Barclay 2006
- Barclay AW, Brand-Miller JC. Validity of glycemic index estimates in the insulin resistance atherosclerosis study. Diabetes Care 2006;29(7):1718. [DOI] [PubMed] [Google Scholar]
Barclay 2008
- Barclay AW, Petocz P, McMillan-Price J, Flood VM, Prvan T, Mitchell P, et al. Glycemic index, glycemic load, and chronic disease risk - a meta-analysis of observational studies. American Journal of Clinical Nutrition. 2008;87:627-37. [DOI] [PubMed] [Google Scholar]
BHF 2014
- Cardiovascular Disease 2014. www.bhf.org.uk/heart-health/conditions/cardiovascular-disease.aspx (accessed January 2014).
Bjorck 2003
- Bjorck I, Elmstahl HL. The glycaemic index: importance of dietary fibre and other food properties. Proceedings of the Nutrition Society 2003;62(1):201-6. [PMID: ] [DOI] [PubMed] [Google Scholar]
Blaak 2012
- Blaak EE, Antoine JM, Benton D, Bjorck I, Bozzetto L, Brouns F, et al. Impact of postprandial glycaemia on health and prevention of disease. Obesity Reviews 2012;13(10):923-84. [PMID: ] [DOI] [PMC free article] [PubMed] [Google Scholar]
Bornet 1987
- Bornet FR, Costagliola D, Rizkalla SW, Blayo A, Fontvielle AM, Haardt MJ, et al. Insulinemic and glycemic indexes of six starch-rich foods taken alone and in a mixed meal by type 2 diabetics. American Journal of Clinical Nutrition 1987;45:588-95. [DOI] [PubMed] [Google Scholar]
Bornet 2007
- Bornet FR, Jardy-Gennetier AE, Jacquet N, Stowell J. Glycaemic response to foods: impact on satiety and long-term weight regulation. Appetite 2007;49(3):535-53. [PMID: ] [DOI] [PubMed] [Google Scholar]
Bovet 2012
- Bovet P, Paccaud F. Cardiovascular disease and the changing face of global public health: a focus on low and middle income countries. Public Health Reviews 2012;33(2):397-415. [Google Scholar]
Brand‐Miller 2002
- Brand-Miller JC, Holt SHA, Pawlak DB, McMillan J. Glycemic index and obesity. American Journal of Clinical Nutrition 2002;76(1):281S-5S. [DOI] [PubMed] [Google Scholar]
Coulston 1987
- Coulston AM, Hollenbeck CB, Swislocki AL, Reaven GM. Effect of source of dietary carbohydrate on plasma glucose and insulin responses to mixed meals in subjects with NIDDM. Diabetes Care 1987;10:395-400. [DOI] [PubMed] [Google Scholar]
Dong 2012
- Dong JY, Zhang YH, Wang P, Qin LQ. Meta-analysis of dietary glycemic load and glycemic index in relation to risk of coronary heart disease. American Journal of Cardiology 2012;109(11):1608-13. [PMID: ] [DOI] [PubMed] [Google Scholar]
Du 2006
FAO/WHO 1997
- FAO/WHO Expert Committee. Carbohydrates in Human Nutrition. FAO, 1998. [Google Scholar]
FAO/WHO 2007a
- Venn BJ, Green TJ. Glycemic index and glycemic load: measurement issues and their effect on diet–disease relationships. European Journal of Clinical Nutrition 2007;61 Suppl 1:S122–31. [DOI] [PubMed] [Google Scholar]
FAO/WHO 2007b
- Mann J, Cummings JH, Englyst HN, Key T, Liu S, Riccardi G, et al. FAO/WHO Scientific Update on carbohydrates in human nutrition: conclusions. European Journal of Clinical Nutrition 2007;61 Suppl 1:S132-7. [DOI] [PubMed] [Google Scholar]
Fleming 2013
- Fleming P, Godwin M. Low-glycaemic index diets in the management of blood lipids: a systematic review and meta-analysis. Family Practice 2013;30(5):485-91. [PMID: ] [DOI] [PubMed] [Google Scholar]
Flint 2004
- Flint A, Moller BK, Raben A, Pedersen D, Tetens I, Holst JJ, et al. The use of glycaemic index tables to predict glycaemic index of composite breakfast meals. British Journal of Nutrition 2004;91:979-89. [DOI] [PubMed] [Google Scholar]
Follman 1992
- Follmann D, Elliot P, Suh I, Cutler J. Variance imputation for overviews of clinical trials with continuous response. Journal of Clinical Epidemiology 1992;45(7):769-73. [DOI] [PubMed] [Google Scholar]
Ford 2001
- Ford ES, Liu S. Glycemic index and serum high density lipoprotein cholesterol concentration among US adults. Archives of Internal Medicine 2001;161:572-6. [DOI] [PubMed] [Google Scholar]
Foster‐Powell 1995
- Foster-Powell K, Miller JB. International tables of glycaemic index. American Journal of Clinical Nutrition 1995;62(4):871S-90S. [DOI] [PubMed] [Google Scholar]
Foster‐Powell 2002
- Foster-Powell K, Holt SH, Brand-Miller JB. International tables of glycemic index and glycemic load values. American Journal of Clinical Nutrition 2002;76:5-56. [DOI] [PubMed] [Google Scholar]
Frost 2000
- Frost G, Dornhorst A. The relevance of the glycaemic index to our understanding of dietary carbohydrates. Diabetic Medicine 2000;17:336-45. [DOI] [PubMed] [Google Scholar]
Goff 2013
- Goff LM, Cowland DE, Hooper L, Frost GS. Low glycaemic index diets and blood lipids: a systematic review and meta-analysis of randomised controlled trials. Nutrition, Metabolism and Cardiovascular Diseases 2013;23(1):1-10. [PMID: ] [DOI] [PubMed] [Google Scholar]
Higgins 2011
- Higgins JPT, Green S, editor(s). Cochrane Handbook for Systematic Reviews of Interventions Version 5.1.0 (updated March 2011). The Cochrane Collaboration, 2011. Available from handbook.cochrane.org.
Hu 2014
- Hu T, Bazzano LA. The low-carbohydrate diet and cardiovascular risk factors: evidence from epidemiologic studies. Nutrition, Metabolism and Cardiovascular Diseases 2014;24(4):337-43. [DOI] [PMC free article] [PubMed] [Google Scholar]
Jenkins 1981
- Jenkins D, Wolever T, Taylor H, Barker H, Fielden H, Baldwin AM, et al. Glycemic index of foods. A physiological basis for carbohydrate exchange. American Journal of Clinical Nutrition 1981;34:362-6. [DOI] [PubMed] [Google Scholar]
Kristo 2013
- Kristo AS, Matthan NR, Lichtenstein AH. Effect of diets differing in glycemic index and glycemic load on cardiovascular risk factors: review of randomized controlled-feeding trials. Nutrients 2013;5(4):1071-80. [PMID: ] [DOI] [PMC free article] [PubMed] [Google Scholar]
Leeds 2002
- Leeds AR. Glycemic index and heart disease. American Journal of Clinical Nutrition 2002;76(1):286S-9S. [DOI] [PubMed] [Google Scholar]
Lefebvre 2011
- Lefebvre C, Manheimer E, Glanville J. Chapter 6: Searching for studies. In: Higgins JPT, Green S, editor(s). Cochrane Handbook for Systematic Reviews of Interventions Version 5.1.0 (updated March 2011). The Cochrane Collaboration, 2011. Available from handbook.cochrane.org.
Ma 2012
- Ma XY, Liu JP, Song ZY. Glycemic load, glycemic index and risk of cardiovascular diseases: meta-analyses of prospective studies. Atherosclerosis 2012;223(2):491-6. [PMID: ] [DOI] [PubMed] [Google Scholar]
Meader 2014
- Meader N, King K, Llewellyn A, Norman G, Brown J, Rodgers M, et al. A checklist designed to aid consistency and reproducibility of GRADE assessments: development and pilot validation. Systematic Reviews 2014;3(1):82. [DOI] [PMC free article] [PubMed] [Google Scholar]
Mirrahimi 2012
- Mirrahimi A, De Souza RJ, Chiavaroli L, Sievenpiper JL, Beyene J, Hanley AJ, et al. Associations of glycemic index and load with coronary heart disease events: a systematic review and meta-analysis of prospective cohorts. Journal of the American Heart Association 2012;1(5):e000752. [PMID: ] [DOI] [PMC free article] [PubMed] [Google Scholar]
NHS 2012
- National Health Service. Atherosclerosis 2012.. www.nhs.uk/conditions/Atherosclerosis/Pages/Introduction.aspx#commentCountLink (accessed January 2014).
Niwano 2009
- Niwano Y, Adachi T, Kashimura J, Sakata T, Sasaki H, Sekine K, et al. Is glycemic index of food a feasible predictor of appetite, hunger, and satiety? Journal of Nutritional Science and Vitaminology 2009;55(3):201-7. [PMID: ] [DOI] [PubMed] [Google Scholar]
Oude 2010
- Oude Griep LM, Gelejinse JM, Kronhout D, Ocke MC, Verschuern WM. Raw and processed fruit and vegetable consumption and 10-year coronary heart disease incidence in a population-based cohort study in the Netherlands. PLOS One 2010;5:e13609. [DOI] [PMC free article] [PubMed] [Google Scholar]
Rizkalla 2002
- Rizkalla SW, Bellisle F, Slama G. Health benefits of low glycaemic index foods, such as pulses, in diabetic patients and healthy individuals. British Journal of Nutrition 2002;88(Suppl 3):S255-S262. [DOI] [PubMed] [Google Scholar]
Spagnoli 2007
- Spagnoli LG, Bonanno E, Sangiorgi G, Mauriello A. Role of inflammation in atherosclerosis. Journal of Nuclear Medicine 2007;48(11):1800-15. [DOI] [PubMed] [Google Scholar]
Thomas 2007
- Thomas DE, Elliot EJ, Baur L. Low glycaemic index, or low glycaemic load, diets for overweight and obesity. Cochrane Database of Systematic Reviews 2007, Issue 3. Art. No: CD005105. [DOI: 10.1002/14651858.CD005105.pub2] [DOI] [PMC free article] [PubMed] [Google Scholar]
Thomas 2009
- Thomas D, Elliott EJ. Low glycaemic index, or low glycaemic load, diets for diabetes mellitus. Cochrane Database of Systematic Reviews 2009, Issue 1. Art. No: CD006296. [DOI: 10.1002/14651858.CD006296.pub2] [DOI] [PMC free article] [PubMed] [Google Scholar]
Vafeiadou 2012
- Vafeiadou K, Weech M, Sharma V, Yaqoob P, Todd S, Williams CM, et al. A review of the evidence for the effects of total dietary fat, saturated, monounsaturated and n-6 polyunsaturated fatty acids on vascular function, endothelial progenitor cells and microparticles. British Journal of Nutrition 2012;107(3):303-24. [PMID: ] [DOI] [PubMed] [Google Scholar]
WHO 2013
- World Health Organization. Cardiovascular diseases (CVDs). http://www.who.int/mediacentre/factsheets/fs317/en/index.html (accessed January 2014).
Wolever 1985
- Wolever TM, Jenkins DJ. Application of glycaemic index to mixed meals [letter]. Lancet 1985;2:944. [DOI] [PubMed] [Google Scholar]
Wolever 1986
- Wolever TM, Jenkins DJ. The use of the glycemic index in predicting the blood glucose response to mixed meals. American Journal of Clinical Nutrition 1986;43:167-72. [DOI] [PubMed] [Google Scholar]
Wolever 1988
- Wolever TM, Jenkins DJ, Collier GR, Lee R. Metabolic response to test meals containing different carbohydrate foods. 1. Relationship between rate of digestion and plasma insulin. Nutrition Reviews 1988;8:573-81. [Google Scholar]
Wolever 1990
- Wolever TM. The glycaemic index. World Review in Nutrition and Dietetics 1990;62:120-85. [PubMed] [Google Scholar]
Ye 2012
- Ye EQ, Chacko SA, Chou EL, Kugizaki M, Liu S. Greater whole-grain intake is associated with lower risk of type 2 diabetes, cardiovascular disease, and weight gain. Journal of Nutrition 2012;142(7):1304-13. [DOI] [PMC free article] [PubMed] [Google Scholar]
References to other published versions of this review
Kelly 2004
- Kelly SAM, Frost G, Whittaker V, Summerbell CD. Low glycaemic index diets for coronary heart disease. Cochrane Database of Systematic Reviews 2004, Issue 4. Art. No: CD004467. [DOI: 10.1002/14651858.CD004467.pub2] [DOI] [PubMed] [Google Scholar]