

Abstract
Background
Efficacy and the risk of severe late effects have to be well‐balanced in treatment of Hodgkin lymphoma (HL). Late adverse effects include secondary malignancies which often have a poor prognosis. To synthesise evidence on the risk of secondary malignancies after current treatment approaches comprising chemotherapy and/or radiotherapy, we performed a meta‐analysis based on individual patient data (IPD) from patients treated for newly diagnosed HL.
Objectives
We investigated several questions concerning possible changes in the risk of secondary malignancies when modifying chemotherapy or radiotherapy (omission of radiotherapy, reduction of the radiation field, reduction of the radiation dose, use of fewer chemotherapy cycles, intensification of chemotherapy). We also analysed whether these modifications affect progression‐free survival (PFS) and overall survival (OS).
Search methods
We searched MEDLINE and Cochrane CENTRAL trials databases comprehensively in June 2010 for all randomised trials in HL since 1984. Key international trials registries were also searched. The search was updated in March 2015 without collecting further IPD (one further eligible study found) and again in July 2017 (no further eligible studies).
Selection criteria
We included randomised controlled trials (RCTs) for untreated HL patients which enrolled at least 50 patients per arm, completed recruitment by 2007 and performed a treatment comparison relevant to our objectives.
Data collection and analysis
Study groups submitted IPD, including age, sex, stage and the outcomes secondary malignant neoplasm (SMN), OS and PFS as time‐to‐event data. We meta‐analysed these data using Petos method (SMN) and Cox regression with inverse‐variance pooling (OS, PFS) for each of the five study questions, and performed subgroup and sensitivity analyses to assess the applicability and robustness of the results.
Main results
We identified 21 eligible trials and obtained IPD for 16. For four studies no data were supplied despite repeated efforts, while one study was only identified in 2015 and IPD were not sought. For each study question, between three and six trials with between 1101 and 2996 participants in total and median follow‐up between 6.7 and 10.8 years were analysed. All participants were adults and mainly under 60 years. Risk of bias was assessed as low for the majority of studies and outcomes.
Chemotherapy alone versus same chemotherapy plus radiotherapy. Omitting additional radiotherapy probably reduces secondary malignancy incidence (Peto odds ratio (OR) 0.43, 95% confidence interval (CI) 0.23 to 0.82, low quality of evidence), corresponding to an estimated reduction of eight‐year SMN risk from 8% to 4%. This decrease was particularly true for secondary acute leukemias. However, we had insufficient evidence to determine whether OS rates differ between patients treated with chemotherapy alone versus combined‐modality (hazard ratio (HR) 0.71, 95% CI 0.46 to 1.11, moderate quality of evidence). There was a slightly higher rate of PFS with combined modality, but our confidence in the results was limited by high levels of statistical heterogeneity between studies (HR 1.31, 95% CI 0.99 to 1.73, moderate quality of evidence).
Chemotherapy plus involved‐field radiation versus same chemotherapy plus extended‐field radiation (early stages). There is insufficient evidence to determine whether smaller radiation field reduces SMN risk (Peto OR 0.86, 95% CI 0.64 to 1.16, low quality of evidence), OS (HR 0.89, 95% C: 0.70 to 1.12, high quality of evidence) or PFS (HR 0.99, 95% CI 0.81 to 1.21, high quality of evidence).
Chemotherapy plus lower‐dose radiation versus same chemotherapy plus higher‐dose radiation (early stages). There is insufficient evidence to determine the effect of lower‐radiation dose on SMN risk (Peto OR 1.03, 95% CI 0.71 to 1.50, low quality of evidence), OS (HR 0.91, 95% CI 0.65 to 1.28, high quality of evidence) or PFS (HR 1.20, 95% CI 0.97 to 1.48, high quality of evidence).
Fewer versus more courses of chemotherapy (each with or without radiotherapy; early stages). Fewer chemotherapy courses probably has little or no effect on SMN risk (Peto OR 1.10, 95% CI 0.74 to 1.62), OS (HR 0.99, 95% CI 0.73 to1.34) or PFS (HR 1.15, 95% CI 0.91 to 1.45).Outcomes had a moderate (SMN) or high (OS, PFS) quality of evidence.
Dose‐intensified versus ABVD‐like chemotherapy (with or without radiotherapy in each case). In the mainly advanced‐stage patients who were treated with intensified chemotherapy, the rate of secondary malignancies was low. There was insufficient evidence to determine the effect of chemotherapy intensification (Peto OR 1.37, CI 0.89 to 2.10, low quality of evidence). The rate of secondary acute leukemias (and for younger patients, all secondary malignancies) was probably higher than among those who had treatment with standard‐dose ABVD‐like protocols. In contrast, the intensified chemotherapy protocols probably improved PFS (eight‐year PFS 75% versus 69% for ABVD‐like treatment, HR 0.82, 95% CI 0.7 to 0.95, moderate quality of evidence). Evidence suggesting improved survival with intensified chemotherapy was not conclusive (HR: 0.85, CI 0.70 to 1.04), although escalated‐dose BEACOPP appeared to lengthen survival compared to ABVD‐like chemotherapy (HR 0.58, 95% CI 0.43 to 0.79, moderate quality of evidence).
Generally, we could draw valid conclusions only in terms of secondary haematological malignancies, which usually occur less than 10 years after initial treatment, while follow‐up within the present analysis was too short to record all solid tumours.
Authors' conclusions
The risk of secondary acute myeloid leukaemia and myelodysplastic syndrome (AML/MDS) is increased but efficacy is improved among patients treated with intensified chemotherapy protocols. Treatment decisions must be tailored for individual patients. Consolidating radiotherapy is associated with an increased rate of secondary malignancies; therefore it appears important to define which patients can safely be treated without radiotherapy after chemotherapy, both for early and advanced stages. For early stages, treatment optimisation methods such as use of fewer chemotherapy cycles and reduced field or reduced‐dose radiotherapy did not appear to markedly affect efficacy or secondary malignancy risk. Due to the limited amount of long‐term follow‐up in this meta‐analysis, further long‐term investigations of late events are needed, particularly with respect to secondary solid tumours. Since many older studies have been included, possible improvement of radiotherapy techniques must be considered when interpreting these results.
Plain language summary
Optimisation of chemotherapy and radiotherapy for Hodgkin lymphoma patients with respect to second cancers and survival
Review question
We aimed to compare various forms of treatment for newly diagnosed Hodgkin lymphoma involving chemotherapy with or without additional radiotherapy. We particularly looked at the risk of second cancers caused by these treatments, although survival and elimination of Hodgkin lymphoma were also investigated.
Background
Since Hodgkin lymphoma often afflicts young people and highly effective treatments allow most patients to survive long after their diagnosis, curing the disease has to be weighed against the risk of causing long‐term adverse effects. Second cancers are a particularly severe form of late toxicity after chemotherapy and radiotherapy. We performed a meta‐analysis based on individual patient data from patients treated for newly diagnosed Hodgkin lymphoma in order to compare second cancer risk, survival and Hodgkin‐free survival with various treatment options. These options included: (1) used of chemotherapy with or without additional radiotherapy; (2) use of a more extensive or more restricted radiation field; (3) use of a higher or lower radiation dose; (4) use of more or fewer courses of chemotherapy and (5) use of standard‐dose or dose‐intensified types of chemotherapy.
Study characteristics
The evidence is current to July 2017, based on a total of 16 clinical trials which treated people between 1984 and 2007. Four eligible trials were excluded due to failure to obtain individual patient data, while one further eligible trial was identified only in 2015 and data were not sought. For each of the five study questions (see above), data from between three and six trials with between 1101 and 2996 participants were analysed. Each trial's data covered a follow‐up period of between six and 11 years. All included trials employed modern, widely accepted forms of chemotherapy and radiotherapy. Patients were non‐elderly adults of both sexes with early or advances stage disease, according to study question. All trials were funded by public bodies or charities without any direct industry funding.
Key results
In the comparison of chemotherapy alone versus same chemotherapy plus radiotherapy (all stages), the use of chemotherapy without additional radiotherapy was associated with a lower second cancer risk but possibly at the cost of more growth or regrowth of the disease.
In the comparison of chemotherapy plus involved‐field radiation versus same chemotherapy plus extended‐field radiation (early stages), neither second cancer risk, survival or Hodgkin‐free survival was markedly different.
In the comparison of chemotherapy plus lower‐dose radiation versus same chemotherapy plus higher‐dose radiation (early stages), neither second cancer risk, survival or Hodgkin‐free survival was markedly different.
In the comparison of fewer versus more courses of chemotherapy (early stages), neither second cancer risk, survival or Hodgkin‐free survival was markedly different.
In the comparison of dose‐intensified versus ABVD‐like chemotherapy (advanced stages), dose‐intensified chemotherapy improved Hodgkin‐free survival, compared with ABVD‐like regimens, at the cost of a greater risk of secondary leukaemia. Evidence suggesting improved survival with intensified chemotherapy was not conclusive, although escalated‐dose BEACOPP appeared to lengthen survival.
Quality of the evidence
Evidence concerning survival and Hodgkin‐free survival was of at least moderate quality, while evidence concerning second cancer risk was partly of low quality due to the small numbers of second cancers observed in the trials and too short follow‐up. Thus, conclusions on second cancer risk remain tentative until more longer‐term data are available. Since many older studies have been included, possible improvement of radiotherapy techniques must be considered when interpreting these results.
The risk of secondary leukaemia is increased among patients treated with intensified chemotherapy protocols; on the other hand these regimens improve Hodgkin‐free survival. Treatment decisions have to be tailored for the individual patients. Consolidating radiotherapy is associated with an increased rate of secondary malignancies; therefore it appears important to define a patient population that can safely be treated without radiotherapy after chemotherapy, both for early and advanced stages. For early stages, treatment optimisation methods such as use of fewer chemotherapy cycles and reduced field or reduced dose radiotherapy did not appear to markedly affect Hodgkin‐free survival or secondary malignancy risk.
Summary of findings
Summary of findings for the main comparison. Chemotherapy alone versus same chemotherapy plus radiotherapy.
| Chemotherapy alone versus same chemotherapy plus radiotherapy | ||||||
| Patient or population: Patients with untreated Hodgkin lymphoma (early and advanced stages) Settings: Typical clinical trial populations (mainly adult, non‐elderly) Intervention: Chemotherapy alone Comparison: Chemotherapy plus radiation | ||||||
| Outcomes | Illustrative comparative risks* (95% CI) | Relative effect (95% CI) | No of Participants (studies) | Quality of the evidence (GRADE) | Comments | |
| Assumed risk | Corresponding risk | |||||
| Chemotherapy plus radiation | Chemotherapy alone | |||||
| Secondary malignant neoplasms Follow‐up: median 7.8 years | Low1 | OR 0.43 (0.23 to 0.82) | 1011 (3 studies) | ⊕⊕⊝⊝ low2,5 | ||
| 4 per 100 | 2 per 100 (1 to 3) | |||||
| Moderate1 | ||||||
| 8 per 100 | 4 per 100 (2 to 7) | |||||
| High1 | ||||||
| 12 per 100 | 6 per 100 (3 to 10) | |||||
| Death Follow‐up: median 7.8 years | Low1 | HR 0.71 (0.46 to 1.11) | 1011 (3 studies) | ⊕⊕⊕⊝ moderate3 | reported as 'Overall Survival' | |
| 5 per 100 | 4 per 100 (2 to 6) | |||||
| Moderate1 | ||||||
| 10 per 100 | 7 per 100 (5 to 11) | |||||
| High1 | ||||||
| 20 per 100 | 15 per 100 (10 to 22) | |||||
| Progression/relapse Follow‐up: median 7.8 years | Low1 | HR 1.31 (0.99 to 1.73) | 1011 (3 studies) | ⊕⊕⊕⊝ moderate4 | reported as 'PFS' | |
| 15 per 100 | 19 per 100 (15 to 25) | |||||
| Moderate1 | ||||||
| 20 per 100 | 25 per 100 (20 to 32) | |||||
| High1 | ||||||
| 25 per 100 | 31 per 100 (25 to 39) | |||||
| *The basis for the assumed risk (e.g. the median control group risk across studies) is provided in footnotes. The corresponding risk (and its 95% confidence interval) is based on the assumed risk in the comparison group and the relative effect of the intervention (and its 95% CI). CI: Confidence interval; OR: Odds ratio; HR: Hazard ratio; | ||||||
| GRADE Working Group grades of evidence High quality: Further research is very unlikely to change our confidence in the estimate of effect. Moderate quality: Further research is likely to have an important impact on our confidence in the estimate of effect and may change the estimate. Low quality: Further research is very likely to have an important impact on our confidence in the estimate of effect and is likely to change the estimate. Very low quality: We are very uncertain about the estimate. | ||||||
1 'Moderate' control risks are based on overall estimated rate at median observation time. 'Low' and 'high' control risks were chosen to represent the range of risks seen in the individual studies. 2 Few SMN events: downgrade imprecision by 1 point 3 Rather few deaths: downgrade imprecision by 1 point 4 Early‐ and advanced‐stage effects qualitatively different: downgrade inconsistency by 1 point
5 Follow‐up too short, in particular for assessment of solid tumour risk: downgrade by 1 point
Summary of findings 2. Chemotherapy plus involved‐field radiation versus same chemotherapy plus extended‐field radiation.
| Chemotherapy plus involved‐field radiation versus same chemotherapy plus extended‐field radiation | ||||||
| Patient or population: Patients with untreated Hodgkin lymphoma (early stages) Settings: Typical clinical trial populations (mainly adult, non‐elderly) Intervention: Involved field radiation (after chemotherapy) Comparison: Extended‐field radiation | ||||||
| Outcomes | Illustrative comparative risks* (95% CI) | Relative effect (95% CI) | No of Participants (studies) | Quality of the evidence (GRADE) | Comments | |
| Assumed risk | Corresponding risk | |||||
| Extended‐field radiation | Involved field radiation (after chemotherapy) | |||||
| Secondary malignant neoplasms Follow‐up: median 10.8 years | Low1 | OR 0.86 (0.64 to 1.16) | 2397 (4 studies) | ⊕⊕⊝⊝ low2,3 | ||
| 5 per 100 | 4 per 100 (3 to 6) | |||||
| Moderate1 | ||||||
| 10 per 100 | 9 per 100 (7 to 11) | |||||
| High1 | ||||||
| 15 per 100 | 13 per 100 (10 to 17) | |||||
| Death Follow‐up: median 10.8 years | Low1 | HR 0.89 (0.70 to 1.12) | 2397 (4 studies) | ⊕⊕⊕⊕ high | reported as 'Overall Survival' | |
| 10 per 100 | 9 per 100 (7 to 11) | |||||
| Moderate1 | ||||||
| 15 per 100 | 13 per 100 (11 to 17) | |||||
| High1 | ||||||
| 20 per 100 | 18 per 100 (14 to 22) | |||||
| Progression/relapse Follow‐up: median 10.8 years | Low1 | HR 0.99 (0.81 to 1.21) | 2397 (4 studies) | ⊕⊕⊕⊕ high | reported as 'PFS' | |
| 15 per 100 | 15 per 100 (12 to 18) | |||||
| Moderate1 | ||||||
| 20 per 100 | 20 per 100 (17 to 24) | |||||
| High1 | ||||||
| 25 per 100 | 25 per 100 (21 to 29) | |||||
| *The basis for the assumed risk (e.g. the median control group risk across studies) is provided in footnotes. The corresponding risk (and its 95% confidence interval) is based on the assumed risk in the comparison group and the relative effect of the intervention (and its 95% CI). CI: Confidence interval; OR: Odds ratio; HR: Hazard ratio; | ||||||
| GRADE Working Group grades of evidence High quality: Further research is very unlikely to change our confidence in the estimate of effect. Moderate quality: Further research is likely to have an important impact on our confidence in the estimate of effect and may change the estimate. Low quality: Further research is very likely to have an important impact on our confidence in the estimate of effect and is likely to change the estimate. Very low quality: We are very uncertain about the estimate. | ||||||
1 'Moderate' control risks are based on overall estimated rate at median observation time. 'Low' and 'high' control risks were chosen to represent the range of risks seen in the individual studies. 2 Heterogeneous (I² = 67%): downgrade inconsistency by 1 point 3Follow‐up too short, in particular for assessment of solid tumour risk: downgrade by 1 point
Summary of findings 3. Chemotherapy plus lower‐dose radiation versus same chemotherapy plus higher‐dose radiation.
| Chemotherapy plus lower‐dose radiation versus same chemotherapy plus higher‐dose radiation | ||||||
| Patient or population: Patients with untreated Hodgkin lymphoma (early stages) Settings: Typical clinical trial populations (mainly adult, non‐elderly) Intervention: A lower radiotherapy dose | ||||||
| Outcomes | Illustrative comparative risks* (95% CI) | Relative effect (95% CI) | No of Participants (studies) | Quality of the evidence (GRADE) | Comments | |
| Assumed risk | Corresponding risk | |||||
| Control | A lower radiotherapy dose | |||||
| Secondary malignant neoplasms Follow‐up: median 7.4 years | Low1 | OR 1.03 (0.71 to 1.5) | 2962 (3 studies) | ⊕⊕⊝⊝ low2,3 | ||
| 2 per 100 | 2 per 100 (1 to 3) | |||||
| Moderate1 | ||||||
| 4 per 100 | 4 per 100 (3 to 6) | |||||
| High1 | ||||||
| 8 per 100 | 8 per 100 (6 to 12) | |||||
| Death Follow‐up: median 7.4 years | Low1 | HR 0.91 (0.65 to 1.28) | 2962 (3 studies) | ⊕⊕⊕⊕ high | reported as 'Overall Survival' | |
| 3 per 100 | 3 per 100 (2 to 4) | |||||
| Moderate1 | ||||||
| 6 per 100 | 5 per 100 (4 to 8) | |||||
| High1 | ||||||
| 12 per 100 | 11 per 100 (8 to 15) | |||||
| Progression/relapse Follow‐up: median 7.4 years | Low1 | HR 1.2 (0.97 to 1.48) | 2962 (3 studies) | ⊕⊕⊕⊕ high | reported as 'PFS' | |
| 8 per 100 | 10 per 100 (8 to 12) | |||||
| Moderate1 | ||||||
| 12 per 100 | 14 per 100 (12 to 17) | |||||
| High1 | ||||||
| 16 per 100 | 19 per 100 (16 to 23) | |||||
| *The basis for the assumed risk (e.g. the median control group risk across studies) is provided in footnotes. The corresponding risk (and its 95% confidence interval) is based on the assumed risk in the comparison group and the relative effect of the intervention (and its 95% CI). CI: Confidence interval; OR: Odds ratio; HR: Hazard ratio; | ||||||
| GRADE Working Group grades of evidence High quality: Further research is very unlikely to change our confidence in the estimate of effect. Moderate quality: Further research is likely to have an important impact on our confidence in the estimate of effect and may change the estimate. Low quality: Further research is very likely to have an important impact on our confidence in the estimate of effect and is likely to change the estimate. Very low quality: We are very uncertain about the estimate. | ||||||
1 'Moderate' control risks are based on overall estimated rate at median observation time. 'Low' and 'high' control risks were chosen to represent the range of risks seen in the individual studies. 2 Downgrade inconsistency one point due to heterogeneity (I2= 72%) 3Follow‐up too short, in particular for assessment of solid tumour risk: downgrade by 1 point
Summary of findings 4. Fewer versus more courses of chemotherapy (with or without radiotherapy in each case).
| Fewer versus more courses of chemotherapy | ||||||
| Patient or population: Patients with untreated Hodgkin lymphoma (early stages) Settings: Typical clinical trial populations (mainly adult, non‐elderly) Intervention: Fewer chemotherapy cycles | ||||||
| Outcomes | Illustrative comparative risks* (95% CI) | Relative effect (95% CI) | No of Participants (studies) | Quality of the evidence (GRADE) | Comments | |
| Assumed risk | Corresponding risk | |||||
| Control | Fewer chemotherapy cycles | |||||
| Secondary malignant neoplasms Follow‐up: median 7.8 years | Low1 | OR 1.10 (0.74 to 1.62) | 2403 (3 studies) | ⊕⊕⊕⊝ moderate2 | ||
| 2 per 100 | 2 per 100 (1 to 3) | |||||
| Moderate1 | ||||||
| 4 per 100 | 4 per 100 (3 to 6) | |||||
| High1 | ||||||
| 8 per 100 | 9 per 100 (6 to 12) | |||||
| Death Follow‐up: median 7.8 years | Low1 | HR 0.99 (0.73 to 1.34) | 2403 (3 studies) | ⊕⊕⊕⊕ high | reported as 'Overall Survival' | |
| 3 per 100 | 3 per 100 (2 to 4) | |||||
| Moderate1 | ||||||
| 6 per 100 | 6 per 100 (4 to 8) | |||||
| High1 | ||||||
| 12 per 100 | 12 per 100 (9 to 16) | |||||
| Progression/relapse Follow‐up: median 7.8 years | Low1 | HR 1.15 (0.91 to 1.45) | 2403 (3 studies) | ⊕⊕⊕⊕ high | reported as 'PFS' | |
| 8 per 100 | 9 per 100 (7 to 11) | |||||
| Moderate1 | ||||||
| 12 per 100 | 14 per 100 (11 to 17) | |||||
| High1 | ||||||
| 16 per 100 | 18 per 100 (15 to 22) | |||||
| *The basis for the assumed risk (e.g. the median control group risk across studies) is provided in footnotes. The corresponding risk (and its 95% confidence interval) is based on the assumed risk in the comparison group and the relative effect of the intervention (and its 95% CI). CI: Confidence interval; OR: Odds ratio; HR: Hazard ratio; | ||||||
| GRADE Working Group grades of evidence High quality: Further research is very unlikely to change our confidence in the estimate of effect. Moderate quality: Further research is likely to have an important impact on our confidence in the estimate of effect and may change the estimate. Low quality: Further research is very likely to have an important impact on our confidence in the estimate of effect and is likely to change the estimate. Very low quality: We are very uncertain about the estimate. | ||||||
1 'Moderate' control risks are based on overall estimated rate at median observation time. 'Low' and 'high' control risks were chosen to represent the range of risks seen in the individual studies. 2Follow‐up too short, in particular for assessment of solid tumour risk: downgrade by 1 point
Summary of findings 5. Dose‐intensified chemotherapy versus ABVD‐like chemotherapy (with or without radiotherapy in each case).
| Dose‐intensified chemotherapy versus ABVD‐like chemotherapy | ||||||
| Patient or population: Patients with untreated Hodgkin lymphoma (advanced stages) Settings: Typical clinical trial populations (mainly adult, non‐elderly) Intervention: Intensified chemotherapy Comparison: ABVD‐like chemotherapy | ||||||
| Outcomes | Illustrative comparative risks* (95% CI) | Relative effect (95% CI) | No of Participants (studies) | Quality of the evidence (GRADE) | Comments | |
| Assumed risk | Corresponding risk | |||||
| ABVD‐like chemotherapy | Intensified chemotherapy | |||||
| Secondary malignant neoplasms Follow‐up: median 6.7 years | Low1 | OR 1.37 (0.89 to 2.10) | 2996 (7 studies) | ⊕⊕⊝⊝ low2,4 | ||
| 2 per 100 | 3 per 100 (2 to 4) | |||||
| Moderate1 | ||||||
| 4 per 100 | 5 per 100 (4 to 8) | |||||
| High1 | ||||||
| 8 per 100 | 11 per 100 (7 to 15) | |||||
| Death Follow‐up: median 6.7 years | Low1 | HR 0.85 (0.70 to 1.04) | 2996 (7 studies) | ⊕⊕⊕⊝ moderate3 | reported as 'Overall Survival' | |
| 10 per 100 | 9 per 100 (7 to 10) | |||||
| Moderate1 | ||||||
| 15 per 100 | 13 per 100 (11 to 16) | |||||
| High1 | ||||||
| 20 per 100 | 17 per 100 (14 to 21) | |||||
| Progression/relapse Follow‐up: median 6.7 years | Low1 | HR 0.82 (0.70 to 0.95) | 2996 (7 studies) | ⊕⊕⊕⊝ moderate3 | reported as 'PFS' | |
| 20 per 100 | 17 per 100 (14 to 19) | |||||
| Moderate1 | ||||||
| 30 per 100 | 25 per 100 (22 to 29) | |||||
| High1 | ||||||
| 40 per 100 | 34 per 100 (30 to 38) | |||||
| *The basis for the assumed risk (e.g. the median control group risk across studies) is provided in footnotes. The corresponding risk (and its 95% confidence interval) is based on the assumed risk in the comparison group and the relative effect of the intervention (and its 95% CI). CI: Confidence interval; OR: Odds ratio; HR: Hazard ratio; | ||||||
| GRADE Working Group grades of evidence High quality: Further research is very unlikely to change our confidence in the estimate of effect. Moderate quality: Further research is likely to have an important impact on our confidence in the estimate of effect and may change the estimate. Low quality: Further research is very likely to have an important impact on our confidence in the estimate of effect and is likely to change the estimate. Very low quality: We are very uncertain about the estimate. | ||||||
1 'Moderate' control risks are based on overall estimated rate at median observation time. 'Low' and 'high' control risks were chosen to represent the range of risks seen in the individual studies. 2 Rather few SMN events: downgrade imprecision by 1 point 3 Downgrade inconsistency one point due to heterogeneity (I2 = 63% and 85%)
4 Follow‐up too short, in particular for assessment of solid tumour risk: downgrade by 1 point
Background
Description of the condition
Hodgkin's lymphoma (HL) is a malignancy of the lymph nodes and lymphatic system with possible involvement of other organs (Mauch 1999; De Vita 2000). The disease is rare, with an annual incidence of approximately 3 per 100,000 in most countries, although in certain low‐income countries the incidence in children is higher and Epstein Barr virus (EBV) association and mixed cellularity subtype are more frequent (Mueller 1999). Most sufferers are young people, the incidence being greatest in the third decade of life (Mueller 1999). The malignant cells stem from lymphocytes, but the causes of the malignancy are poorly understood (De Vita 2000). Untreated, HL is fatal within a few years in most cases, but today the large majority of patients are cured.
Description of the intervention
Treatment strategies are determined by the disease stage and other prognostic factors. Early‐stage patients without adverse factors usually receive a combination of mild chemotherapy (two to three cycles) and limited radiotherapy (GHSG HD10; EORTC H8‐U) . Early‐stage patients with adverse prognostic factors are usually treated with moderate chemotherapy (four to six cycles) combined with radiotherapy (von Treskow 2012; EORTC H8‐U). Advanced‐stage patients receive intensive chemotherapy, typically six to eight cycles, with or without additional radiation (Engert 2012; MF‐GITIL‐IIL; Canellos 2009). The optimal treatment strategy is still controversial. Relevant criteria include (a) efficacy in controlling HL; (b) options and prognosis for second‐line therapy for those for whom first‐line treatment fails; and (c) acute toxicity, late effects and quality of life. As cure rates of HL patients have dramatically improved over recent decades, so that today the great majority of even advanced‐stage patients reach a lasting complete remission, treatment toxicity and subsequent quality of life have increased in importance. Strategies to reduce late toxicity and improve long‐term quality of life include avoidance of irradiation, reduction of irradiation fields or dose, reduction of number of chemotherapy cycles and avoidance of certain drugs such as alkylating agents or bleomycin. Recently, positron emission tomography (PET) has been employed during treatment to more reliably assess tumour status and thus identify patients requiring less or further treatment, thus reducing the treatment burden for a subgroup of patients.
The carcinogenic effects of ionising radiation were demonstrated in the 1930s, and since then its potential for causing almost any kind of cancer has been demonstrated (Boice 1988). Risks appear to be higher for young people. At low doses the risk increases linearly with dose. At therapeutic doses a further increase in risk with dose was seen in certain sites but not in others. In contrast, the carcinogenicity of chemotherapy was only discovered in the 1960s with the development of effective combination regimens. Further, radiologic imaging (especially computed tomography and PET) for staging and restaging purposes may also contribute slightly to the risk of secondary malignant neoplasm (Beyan 2007). Due to the high rate of cure of HL patients and their predominantly young age at diagnosis, they have ample 'opportunity' to develop treatment‐related secondary malignancies.
How the intervention might work
Secondary malignant neoplasms are perhaps the most serious late effect of treatment (Henry‐Amar 1996). Secondary malignant neoplasms can be divided into three classes. These are acute myeloid leukaemia and myelodysplastic syndrome (AML/MDS), non‐Hodgkin lymphomas (NHL) and solid tumours. Secondary AML/MDS occur typically three to eight years after chemotherapy treatment, reaching a cumulative risk of one to three per cent in most studies. Secondary NHL occurs at a constant rate of about 0.2% per year independent of treatment type. Secondary solid tumours usually occur later, typically five to 20 years after treatment, with no evidence of a decline in incidence even after 20 years. Cumulative incidences of up to 34% have been estimated, representing a relative risk of up to five compared with the general population. Solid tumours appear to occur after both radiotherapy and chemotherapy. The impact of secondary malignant neoplasms on the long‐term survival of HL patients is considerable as long‐term survival rates especially for patients who develop therapy‐related leukaemia are poor. (Henry‐Amar 1992).
Why it is important to do this review
The effect of treatment modality on secondary malignant neoplasm rates has been investigated in several analyses of large data sets, including many analyses that were pooled over several patient cohorts. Case‐control studies have also been performed, particularly for investigations of specific types of secondary malignant neoplasm (SMN). Characteristics and key results of all identified studies which analysed at least 50 secondary malignant neoplasms or at least 20 secondary malignant neoplasms of a particular type (that is, AML, NHL or a certain solid tumour site) are summarised in Table 6 (all SMN), Table 7 (secondary solid tumours and NHL) and Table 8 (AML/MDS). Other authors, such as Aleman 2003, investigated long‐term cause‐specific mortality after HL, including the relationship between secondary malignant neoplasms and treatment modality. The relationship between treatment and secondary malignant neoplasm risk has been reviewed by Henry‐Amar 1993, Tucker 1993 and Ng 2004. Whilst it is widely accepted that AML is largely chemotherapy‐induced and NHL is largely independent of treatment modality, it is unclear which, if any, treatment modality can help to avoid solid tumours. The conclusions of the various investigators who compared solid tumour risks after various treatment modalities are far from unanimous. The situation is complicated by the large number of anatomic sites at which a solid tumour can occur as well as by the much higher risk of solid tumour in the general population compared with the very low risk of AML/MDS and NHL. Further, this risk varies widely according to age, sex and other personal and environmental factors. The quality and quantity of relevant data on solid tumour incidence is limited because of their very late occurrence.
1. Previous investigations of secondary malignant neoplasms: all types.
| Publication | Characteristics | Number of incident cases | Treatment groups | Analysis methods | Conclusions (all types) | Conclusions solid tumours | Conclusions (AML) | Conclusions (NHL) |
| Bhatia 1996 | 15 centres (USA, Manchester, Amsterdam); 1955‐1986; MFU = 11.4 yrs.; N = 1 380 (children < 16 yrs.) | 88 SMN (+9 excluded non‐melanoma skin cancers); 24 AML (+2 other leukaemias), 47 ST, 9 NHL | RT, CT, RT+CT (total treatment) | Cox regression separately for ST, AML, NHL | All ST: no differences; breast cancer only: RT dose (RR 5.9 for dose > 20 Gy) | No differences reported | Higher risk with more alkylating agents | |
| Biti 1994 | 1 centre (Florence); 1960‐1988; N = 1 121 | 73 SMN (+5 excluded basocellular skin cancers); 60 ST, 11 AML (MDS excluded), 2 NHL |
(A) RT, CT, RT+CT, CRT; total treatment. (B) RT, CT, CRT (primary treatment only), censored at relapse |
Cox regression | Higher risk after primary CT compared with IF/M alone; higher risk with CT+(S)TNI compared with IF/M alone | Same trend as for all SM | Higher risk with primary CT (±RT); higher risk with more cycles of CT | |
| Boivin 1995 | Embedded case‐control study; 14 Canadian and US centres; 1940‐1987; MFU = 7 yrs.; N = 10 472 (9 280 followed for at least one year) | 560 SMN; 403 ST, 122 AML, 35 NHL | RT, CT as time‐dependent variables, primary and salvage RT, CT | Cox regression with splenectomy, RT, CT as time‐dependent covariates | Significantly more with CT than without CT (ST and NHL analysed together) | Significantly more with CT than without CT (more with MOPP than with ABVD) | ||
| Dietrich 1994 | 1 centre (France); 1960‐1983; N = 892 (continuously disease‐free HD only) | N = 56 (first FU ‐year excluded); 37 ST (excluding bcc), 11 ANLL/MDS, 8 NHL | RT versus CRT; Mantle‐RT versus EF‐RT; SM before progression/relapse only | Cox regression; All RR compared with IF (= MF/inverted Y‐RT) | Significant excess only with MOPP+EF (RR 10.86, P < 0.001) and MOPP+IF (RR 4.99, P = 0.015). | Same tendency as for SM, but significant only for MOPP+EF | Increased risk only for MOPP+EF (RR 16.55, P = .004) | No difference in treatment |
| Dores 2002 | 16 US and European cancer registries; 1935‐1995; N = 32 591 | 2 153 SMN; 1 726 ST, 169 ANLL, 162 NHL | RT versus CT versus CRT (primary treatment) | No direct comparison between treatment groups: all results as RR according to primary treatment compared with normal population. | Significantly higher RR with CRT (95% CI 2.6‐3.6) compared with either RT alone (2.1‐2.4) or CT alone (1.5‐1.9). Digestic tract and female breast: Significantly higher risks with RT than without RT. | |||
| Foss‐Abrahamsen 1993 | 1 centre (Oslo); 1968‐1985; MFU = 8 yrs.; N = 1 152 | 68 SMN (+6 excluded non‐melanoma skin cancers); 9 AML, 8 NHL, 51 ST | RT, CT, CT+RT (total treatment) | Cox regression | Greater risk of SM for pts. who received both CT and RT | |||
| Koshy 2012 | SEER registry database; 1988.2006; N = 12 247 | ca. 650 SMN (5.3%) | RT versus no RT (primary treatment) | Kaplan‐Meier; no explicit comparison | no increase due to RT | |||
| Mauch 1996 | 1 centre (JCRT Boston, USA); 1969‐1988; N = 794 | 72 SMN; 53 ST, 8 AML, 10 NHL | RT(no relapse), RT‐relapse‐CT, CRT; total treatment | RRs compared with normal population, no direct treatment comparisons | RT alone RR 4.1, RT+CT RR 9.75, P < 0.05 | Same effect as with all SMN | Same effect as with all SMN | |
| Ng 2002 | 4 centres (all affil. to Harvard); 1969‐1997; MFU = 12 yrs.; N = 1319 (mainly early stages); (996 pts. with fu > 10 years were included in analysis of treatment effect) | 181 SMN (N = 162 for pts. with fu > 10 yrs.); 131 ST, 23 AML, 24 NHL | RT, CRT (total treatment); also separate analyses of non‐relapsed cases and relapsed cases | RRs calculated relative to normal population (age/sex‐specific); CI from Poisson distribution | RR higher with CRT than RT alone (6.1 versus 4.0, P = 0.015); (non‐relapsed cases only: 5.9 versus 3.7, P = 0.016). Analysed by radiation field size, this effect was only significant for TNI (±CT). RR higher with CT+TNI than for CT+Mantle/EF | |||
| Rodriguez 1993 | 1 centre (M.D. Anderson, Houston, USA); 1966‐1987; N = 1 013 | 66 SMN (first FU‐year excluded); 38 ST, 14 AML/MDS, 14 NHL | IF versus EF (+MOPP); CT versus CRT; RT versus CRT. Total therapy | Cox regression | RT versus CRT: no difference (P = 0.37). CT versus CRT: less SM with CRT (P = 0.001). But less courses of CT with CRT than with CT only! | |||
| Scholz 2011 | Multi‐centre (mainly Germany); 1978‐1998); N = 5 357 |
67 AML, 97 NHL | Primary: RT, conventional CT for intermediate stage, conventional CT for advanced stage, escalated BEACOPP | Parametric model; separate effects of primary and salvage treatment | Higher risk with escalated BEACOPP than conventional CT | No differences | ||
| Swerdlow 1992 | > 60 BNLI centres, UK; 1970‐1987; N = 2 846 |
113 SMN; 80 ST, 16 AML, 17 NHL | Alkyl. CT, Alkyl. CT +RT, IF‐RT (+/‐ nonalk. CT), EF‐RT (+/‐ nonalk. CT) (total treatment) | Poisson regression | No difference overall (nor for lung ca. alone) | More with CT or CRT (similar) than with RT | No differences | |
| Swerdlow 2000 | BNLI, Royal Marsden, St. Bartholomews; 1963‐1993; N = 5 519 | 322 SMN; 228 ST, 44 AML, 50 NHL | CT, RT, CRT (total treatment) | Poisson regression. RR compared with normal population, no direct treatment comparisons | Higher RR for CRT (SIR 3.9, 95% CI 3.2 ‐ 4.6) than for CT (SIR 2.6, 95% CI 2.1 ‐ 3.2) or RT (SIR 2.3, 95% CI 1.9 ‐ 2.8). | Higher risk for CRT (SIR 38.1, 95% CI 24.6‐55.9) or CT (SIR 31.6, 95% CI 19.7‐47.6) than for RT (SIR 1.2, 95% CI 0.1‐5.2) | No significant differences | |
| Swerdlow 2011 | UK, 1963‐2001 |
459 SMN; 302 ST, 75 AML, 82 NHL | CT, CRT | Higher risk for CRT than for CT alone | ||||
| Tucker 1988 | Stanford UMC; 1968 ‐ ?(year needed); N = 1 507 | 83 SMN (first FU‐year excluded); 46 ST, 28 AML, 9 NHL | RT, RT+adj. CT, RT+salvage CT, RT+intravenous‐gold, CT (total treatment) | Kaplan‐Meier, Gehan test | No differences (except: more with radiotherapy + intravenous‐gold) | Higher risk with CT than RT | No differences | |
| van Leeuwen 1994a | 2 centres (the Netherlands); 1966‐1986; MFU = 9 yrs.; N = 1 939 |
146 SMN; 93 ST, 31 AML, 23 NHL | CT, RT, CRT (total treatment) | (A) Person‐years analysis. (B) Cox regression | B: for lung cancer only: trend to more for RT (P = 0.08) or CRT (P = 0.07) than for CT. Otherwise no differences | A: AML not increased for RT; large increase for CT (CT similar to CRT). B: AML more for CT (P = 0.009) or CRT (P = 0.04) than for RT | B: trend to more for CRT than for either CT or RT (P = 0.06) |
AML = acute myeloid leukaemia; ANLL = acute nonlymphocytic leukemia; CT = chemotherapy; CRT = chemotherapy plus radiotherapy combined; NHL = non‐Hodgkin lymphoma; FU = follow‐up; HD = Hodgkins disease; MFU = median follow‐up
2. Previous investigations of secondary malignant neoplasms: solid tumours and NHL.
| Publication | Characteristics | Number of solid tumours / NHL | Treatment groups | Analysis methods | Conclusions (solid tumours) | Conclusions (NHL) |
| Behringer 2004 | Multi‐centre (mainly Germany); 1983‐98; N = 5 367 | 127 | CT, RT, CT+EF, CT+IF/local | RR compared with general population. No direct treatment comparisons. | ||
| Birdwell 1997 | Stanford UMC (USA); 1961‐1994; MFU = 10.9 yrs.; N = 2 441 | 25 gastrointestinal cancers | RT, CRT (total treatment) | RR compared with general population. No direct treatment comparisons. | Risk of gastrointestinal cancer not significantly greater with CRT (RR 3.9, 95% CI 2.2 to 5.6) than with RT (RR 2.0, CI 1.0 to 3.4) | |
| De Bruin 2009 | 5 centres (the Netherlands); 1965‐1995; N = 1 122 | 120 breast cancers | RT field and CT regimen in women under 41 years with supradiaphragmatic irradiation (N = 782) | Cox regression | Significantly greater risk of breast cancer with mantle RT than mediastinal RT | |
| Enrici 1998 | Rome, Italy; 1972‐1996; MFU = 84 months; N = 391 | 20 NHL |
(A) RT, CT, CRT (initial treatment) censored at relapse. (B) RT, CT, CRT (total treatment) |
Kaplan‐Meier and Cox regression | No difference between treatment modalities | |
| Foss‐Abrahamsen 2002 | 1 centre (Oslo); 1968‐1985; MFU = 14 yrs.; N = 1 024 | 26 lung, 23 breast, 31 NHL | RT, CT, CRT (total treatment) | RR compared with general population. No direct treatment comparison | Tendency to greater lung and breast cancer risk with RT or CRT versus CT | No difference between treatment modalities |
| Hancock 1993 | Stanford UMC (USA); 1961‐1990; MFU = 10 yrs.; N = 885 |
25 breast cancers | RT, CRT (total treatment) | RR compared with general population. No direct treatment comparisons | RT versus CRT: Tendency of more breast cancers with CRT, but not significant. RT: RR 3.5 (95% CI 1.9‐5.8), CRT: RR 5.7 (95% CI 3.1‐9.5) | |
| Hodgson 2007 | 13 cancer registries; 1970‐2001, 5‐year survivors; N = 18 862 | 1 490 ST | RT, CT, CRT (primary treatment, RT supra‐ or infradiaphragmatic according to SMN site) | RR by Poisson regression | significantly greater risk of breast cancer and other supradiaphragmatic cancer with RT or CRT versus CT | |
| Kaldor 1992 | Case‐control study; 12 cancer registries (Europe, Canada), 6 large hospitals (Europe); from 1960 onwards; N = 25 665 | 98 lung cancers | RT, CT, CRT | Standard case‐control study methods. RR compared with RT | Higher risk with CT, risk increase with number of CT cycles and RT dose to the lung. | |
| Meattini 2010 | One centre (Florence, Italy); 1060‐2003; N = 1 538 | 39 breast cancers | RT, CT, CRT (primary treatment); RT field; CT regimen | Cox regression | No significant differences (breast) | |
| Swerdlow 2001 | Nested case‐control study; multi‐centre (Britain); 1963‐1995; N = 5 519 | 88 lung cancers | RT, CT, CRT (total treatment) | Conditional logistic regression | No significant differences in lung cancer risk between RT, CT, CRT. (exception: adenocarcinomas ‐ greater risk with CT than without.) Risk greater with MOPP than without MOPP | |
| Swerdlow 2012 | UK, 1956 ‐ 2003 | 373 breast cancers | RT, CRT | Breast cancer standardised incidence ratio (SIR) is highest among patients receiving RT at a young age | ||
| Travis 2002 | Embedded case‐control study; 7 cancer registries; 1965‐1994; N = 19 046 |
222 lung cancers | RT, alkylating CT, RT with alk. CT, RT + salvage alk. CT, neither (total treatment) | Conditional logistic regression | Lung cancer risk increases with RT dose to the lung and with use of alkylating agents | |
| Travis 2003 | Embedded case‐control study; 6 cancer registries; 1965‐1994; N = 3 817 women |
105 breast cancers | RT, alkylating CT, RT with alk. CT, RT + salvage alk. CT, neither (total treatment) | Conditional logistic regression | Breast cancer risk increases with RT dose to breast and decreases with use of alkylating CT and with radiation of ovaries | |
| van Leeuwen 1995 | Embedded case‐control study; 2 centres (the Netherlands); 1966‐1986; N = 1 939 |
30 lung cancers | RT, CT, CRT. RT dose to lung (total treatment) | Conditional logistic regression | Risk of lung cancer tended to increase with increasing RT dose (P = 0.01); RR(> 9 Gy versus 0) = 9.6. No significant differences between RT, CT, CRT | |
| van Leeuwen 2003 | Embedded case‐control study; 4 centres (the Netherlands); 1965‐88; N = 2 637 |
48 breast cancers | RT, CRT. RT dose to breast, ovary. CT cycles, dose of alkylating agents | Conditional logistic regression | Breast cancer risk increases with RT dose and decreases with modality CRT; no CT dose effect |
CT = chemotherapy; CRT = chemotherapy plus radiotherapy combined; NHL = non‐Hodgkin lymphoma; FU = follow‐up; HD = Hodgkins disease; MFU = median follow‐up
3. Previous investigations of secondary malignant neoplasms: AML or MDS.
| Publication | Characteristics | Number of AML/MDS | Treatment groups | Analysis methods | Conclusions (AML/MDS) |
| Brusamolino 1998 | 2 centres (Italy); 1975‐1992; MFU = 10 yrs.; N = 1 659 | 36 AML/MDS | RT, CT, CT+RT. Total treatment | A.Log‐rank tests (univariate) to compare treatment groups B.Embedded case‐control study with conditional logistic regression analysis. | A. Higher risk after CT than RT (P = 0.04); higher risk with CT than with CRT (P = 0.05); higher risk with MOPP+RT than with MOPP/ABVD or with ABVD+RT (P = 0.002); higher risk with EF + MOPP than with IF+MOPP (P = 0.01) B. higher risk after CT than RT (OR 4.1; P = 0.05); higher risk after CRT than RT (OR 6.4; P = 0.02); higher risk after MOPP+RT than ABVD+RT (OR 5.9; P = 0.001) or MOPP/ABVD |
| Eichenauer 2014 | GHSG HD7‐HD15, PROFE, BEACOPP‐14 (1993‐2009); MFU: 72 months, N = 11 952 | 106 AML/MDS | RT, CT, CRT | Significantly higher risk after 4 or more cycles of escalated BEACOPP | |
| Josting 2003 | Multi‐centre (GHSG (Germany) HD1‐HD9); 1981‐1998; MFU = 55 months; N = 5 411 | 46 AML/MDS | CT, RT, CRT, HDCT with SCT. Primary treatment, not censored at relapse | Kaplan‐Meier. No direct treatment comparison | No significant differences between treatment protocols |
| Kaldor 1990 | Case‐control study; 12 cancer registries (Europe, Canada), 6 large hospitals (Europe); 1960‐?(year needed); N = 29 552 | 149 AML/MDS (at least one year after HD diagnosis) | RT, CT, CRT. Total treatment | Standard case‐control study methods. RR compared with RT | Higher risk with CT than with RT (RR 9.0; CI 4.1‐20); higher risk with CRT than with RT (RR 7.7; CI 3.9‐15). No difference in CT versus CRT; but there was a dose‐related increase in the risk in pts. who received RT alone |
| Koontz 2013 | Stanford (1974‐2003); N = 754 | 24 AML/MDS | RT, CT, CRT | Increased risk with higher doses of alkylating agents | |
| Pedersen‐Bjergaard 1987 | 1 centre (Copenhagen); 1970‐1981; N = 391 | 20 ANLL/preleukaemia | Low, intermediate, or high dose of alkylating agents. Total treatment | Cox regression | Risk increases with increasing (total) log dose of alkylating agents (P = 0.0024, regr. coefft. = 0.69) |
| van Leeuwen 1994b | Embedded case‐control study; 2 centres (Netherlands); 1966‐1986; N = 1 939 | 44 Leukemias (incl. 32 ANLL, 12 MDS) | RT, CT, RT+CT. Total treatment | Conditional logistic regression | More risk with CT than with RT alone; <= 6 cycles: P = 0.08, RR = 8.5; > 6 cycles: P < 0.001, RR = 44 |
AML = acute myeloid leukaemia; ANLL = acute nonlymphocytic leukemia; CT = chemotherapy; CRT = chemotherapy plus radiotherapy combined; NHL = non‐Hodgkin lymphoma; FU = follow‐up; HD = Hodgkins disease; MFU = median follow‐up
The above‐mentioned studies make non‐randomised comparisons of secondary malignant neoplasm rates between treatments since even if randomised trial data were included, the data from several trials and from non‐randomised cases were pooled. Therefore, the benefits of randomisation do not necessarily apply to the treatment comparisons made in these studies. The patients receiving different treatment modalities may be non‐comparable with respect to several known or unknown factors, which may be related to secondary malignant neoplasm risk. In short, these comparisons may be 'confounded'.
One literature‐based and two individual‐patient‐data meta‐analyses comparing the effectiveness of different treatment modalities in HL have already been published by others (Shore 1990; Loeffler 1998; Specht 1998). The results demonstrate that the use of combined modality therapy improves disease‐free survival, compared with chemotherapy alone (advanced stages) or radiotherapy alone (early stages), but the 10‐year overall survival (OS) rates were not significantly improved. Additional radiation was in fact associated with a slightly lower OS compared with the use of further chemotherapy in advanced disease. Similarly, more extensive radiotherapy improved disease‐free survival but not OS when compared with limited irradiation. Loeffler 1998 analysed leukaemia‐related deaths but the survival estimates were limited to 10 years after HL diagnosis, too early for the effect of solid tumours to be felt. Specht 1998 analysed secondary malignant neoplasm‐related deaths for patients without recurrence of HL.
The only meta‐analysis of the first occurrence of secondary malignant neoplasms after HL was performed by our group from 2000 to 2004 (Franklin 2005; Franklin 2006a) as a Cochrane systematic review using individual patient data (IPD) from randomised trials comparing chemotherapy alone, radiotherapy alone and combined chemo‐radiotherapy, and comparing extended‐field with involved‐field radiotherapy. This review largely confirmed the results of previous meta‐analyses concerning overall and progression‐free survival (PFS). Concerning secondary malignant neoplasms, the use of a combined modality, particularly in early‐stage disease, was shown to reduce secondary malignant neoplasm risk compared with radiotherapy alone. This is possibly due to the greatly improved HL tumour control and consequent reduced need for intensive salvage treatment. In contrast, eliminating additional radiotherapy, particularly in advanced‐stage patients, slightly reduced the risk of secondary malignant neoplasms. No significant reduction in secondary malignant neoplasm risk from the use of involved field (instead of extended field) could be demonstrated, although the risk of secondary breast cancer was significantly reduced. The reliability and current relevance of the results were limited due to the considerable number of trials for which no data were obtained, the inclusion of older trials with outdated treatments and the uncertain quality of secondary malignant neoplasm data.
In order to clarify the relationship between treatment modality and secondary malignant neoplasm risk, long‐term follow‐up data from large numbers of patients are required since only a small percentage will incur a secondary malignant neoplasm within a given time interval. Further, specific sites of solid tumours may have to be analysed separately, resulting in even smaller incidences. Due to the many confounding factors (age, sex, smoking habits, etc.) conclusions should be based on randomised comparisons between treatment modalities, in contrast to pooled data analyses. All these factors argue for a systematic overview of the risk of secondary malignant neoplasms. The present review aims to tailor our previous review to questions of current relevance, modern treatments and high‐quality trials.
A review of this type compares treatment 'policies', that is the choice of first‐line treatment modality, rather than the influence of radiation and drugs on a biologic level. Not only these two influences, but also accompanying diagnostic procedures, supporting medication, second‐line treatment if necessary and treatment for other late effects, may contribute to the overall secondary malignant neoplasm risk associated with a treatment policy. Conclusions concerning the biologic influence of radiation and drugs per se must remain tentative.
Due to the influence of personal factors on secondary malignant neoplasm risk, the many types of secondary malignant neoplasms and the time‐to‐event nature of the data, a meta‐analysis based on IPD makes the best possible use of the information available. We collected data on all three classes of secondary malignant neoplasms as well as on efficacy (overall and PFS). We compared the effect of treatment modality on the risk of secondary malignant neoplasms as a whole as well as AML, NHL and solid tumours, and overall and disease‐free survival. The comparison of effectiveness both updates and extends the previous IPD meta‐analyses mentioned above. Furthermore, information on effectiveness is needed to put the results concerning secondary malignant neoplasm risk into context, since all outcomes must be considered together in choosing the optimal treatment modality.
Objectives
We aimed to answer several questions concerning possible changes in the risk to develop secondary malignancies when modifying chemotherapy or radiotherapy (omission of radiotherapy, reduction of the radiation field, reduction of the radiation dose, use of fewer chemotherapy cycles, intensification of chemotherapy). In addition, we analysed whether these modifications affect the Hodgkin's lymphoma (HL) clinical outcome, i.e. progression‐free survival (PFS) and overall survival (OS)
Methods
Criteria for considering studies for this review
Types of studies
We considered only randomised controlled trials that enrolled at least 50 patients per arm and completed recruitment by 2007 (as observation times would otherwise be too short to permit secondary malignant neoplasms to be observed). Smaller studies contribute little evidence, especially concerning secondary malignant neoplasms, and are prone to early termination bias or publication bias.
Types of participants
We included trials with adult or paediatric patients treated for newly diagnosed HL.
Types of interventions
We considered trials making the following randomised treatment comparisons to be eligible.
-
Avoidance of radiotherapy:
chemotherapy alone versus same chemotherapy plus radiotherapy.
-
Smaller radiation field:
chemotherapy plus involved‐field radiation versus same chemotherapy plus extended‐field radiation.
-
Lower‐dose radiation:
chemotherapy plus lower‐dose radiation versus same chemotherapy plus higher‐dose radiation.
-
Fewer chemotherapy courses:
fewer versus more courses of chemotherapy (with or without radiotherapy in each case).
-
Intensified chemotherapy:
dose‐intensified chemotherapy versus doxorubicin, bleomycin, vinblastine, dacarbazine (ABVD)‐like chemotherapy (see below) (with or without radiotherapy in each case).
'Same' chemotherapy means the same regimen including drug doses and number of cycles (see, however, remark below concerning confounding).
We restricted 'Radiotherapy' to modern high‐energy irradiation to the involved field or less, except for the comparison between involved‐field and extended‐field irradiation. 'Extended field' includes also the more extensive subtotal and total nodal irradiation categories (STNI and TNI). We restricted 'Chemotherapy' to regimens similar to ABVD (doxorubicin, bleomycin, vinblastine, dacarbazine) (that is, at least three of these four drugs and at most two additional drugs; or four drugs of which at most two of doxorubicin, bleomycin, vinblastine and dacarbazine are substituted by closely related compounds; or an alternating or hybrid regimen including such an ABVD‐like component), except for the dose‐intensified regimens. Examples of such similar regimens are ABVPP (with procarbazine and prednisone), EBVD (with epirubicin), MOPP/ABV (with mustargen, vincristine, procarbazine and prednisone) or COPP/ABVD (with cyclophosphamide, vincristine, procarbazine and prednisone).
We specified the precise definitions of reduced and standard radiation dose, reduced and standard number of chemotherapy cycles, dose‐intensified and standard chemotherapy by considering the designs of potentially eligible trials (without knowledge of outcomes).
Ideally, the treatment arms should differ only with respect to the aspect being compared. For instance, in comparing chemotherapy alone with combined chemotherapy plus radiotherapy the chemotherapy should be identical in each arm. However, restricting the review to such 'unconfounded' trials might mean that not enough data could be obtained for reliable results. Data from 'confounded' trials, allowing minor differences in the modality common to both arms, were also included if this inclusion increased either the number of patients or the number of trials by at least 50%. 'Minor difference' is taken to mean up to two chemotherapy cycles more or less, one additional or different drug, or a different radiation dose. For instance, certain trials compare eight cycles of chemotherapy alone with six cycles of the same regimen plus radiation. The conclusions then apply to the 'mixture' of treatment comparisons analysed, for example, the elimination of additional radiotherapy accompanied in some cases by an increased volume of chemotherapy.
Types of outcome measures
Primary outcomes
The primary endpoint is the time to occurrence of a secondary malignant neoplasm (secondary malignant neoplasm‐free survival). This is an adverse event.
Secondary outcomes
Time to death of any cause (overall survival (OS)).
Time to HL progression, relapse or death of any cause (progression‐free survival (PFS)).
We analysed the primary endpoint separately for each of the three classes of secondary malignancy (solid tumours, NHL and AML), censoring occurrence of the other two classes respectively. We analysed solid tumours separately for the most frequent sites (expected to include lung, female breast and colon cancers). We repeated analyses with censoring at Hodgkin progression or relapse in order to exclude the effects of second‐line therapy.
Search methods for identification of studies
According to Chapter seven of the Cochrane Handbook for Systematic Reviews of Interventions (Higgins 2011)
Electronic searches
Electronic literature databases (initially searched in June 2010 and again in March 2015 and July 2017):
Cochrane Central Register of Controlled Trials (CENTRAL) (the Cochrane Library, latest issue);
MEDLINE;
Trials registers: ClinicalTrials.gov; WHO International Clinical Trials Registry Platform (ICTRP); www.controlled‐trials.com/mrct.
We retrieved only reports published in 1984 or later (first identified randomised trial with ABVD).
CENTRAL includes all annual meetings of the American Society of Hematology up to 2013, the American Society of Clinical Oncology up to 2014, the European Hematology Association up to 2012 and the European Society of Medical Oncology up to 2010 and the International Symposium on Hodgkin Lymphoma up to 2010 (all inclusive).
We performed searches using algorithms developed by the Information Specialist of the Cochrane Haematological Malignancies Group (CHMG), based on the then current algorithms used by Cochrane (see Appendix 1; Appendix 2).
The same search was repeated in March 2015 without collecting further IPD (one further eligible study was identified) and again in July 2017 (no further eligible studies).
Searching other resources
The following searches were performed.
Proceedings of the International Symposium on Hodgkin Lymphoma 2013 and European Hematology Association 2014 (not yet included in CENTRAL).
Reference lists of all relevant retrieved publications.
Contact with co‐operative trial groups working on HL, identified through personal contacts and identified publications.
Previous meta‐analyses in HL.
Data collection and analysis
Selection of studies
As suggested in Chapter seven of the Cochrane Handbook for Systematic Reviews of Interventions, two review authors (DAE, JF) listed the retrieved publications (Higgins 2011). The full text of all potentially relevant publications that were short‐listed by at least one review author were retrieved and assessed independently by both authors. We compared the two resulting lists of relevant studies and reached a consensus. We displayed a flow diagram as proposed in the PRISMA statement (Moher 2009) to describe the results of the search and selection process.
Data extraction and management
According to Chapter seven of the Cochrane Handbook for Systematic Reviews of Interventions (Higgins 2011), we requested pseudonymised IPD from each trial identified as meeting the inclusion criteria, including data on year of birth, sex, date of (first) Hodgkin diagnosis, stage of disease, presence or absence of systemic (B) symptoms, treatment arm by randomisation, date of randomisation, remission status at end of first‐line treatment (with date), occurrence and date of relapse, occurrence, date and type of secondary malignant neoplasms, whether secondary malignant neoplasms occurred in the radiation field (if applicable), occurrence and date of death and date of last follow‐up information.
Assessment of risk of bias in included studies
As suggested in Chapter eight of the Cochrane Handbook for Systematic Reviews of Interventions (Higgins 2011), we checked IPD for completeness and consistency. As a preparatory step, we analysed each trial separately, comparing the treatment arms with respect to recruitment times, patient characteristics, complete remission rate, length of follow‐up, PFS, OS and occurrence of secondary malignant neoplasms. This step investigates the comparability of the treatment arms and the consistency of the data with previous publications of the trial.
We assessed each trial according to the Cochrane 'Risk of bias' tool. Since this was an IPD analysis and all our targeted outcomes could be obtained from all included trials, selective reporting bias did nor occur. Further, the following special aspects were assessed.
Reliability of secondary malignant neoplasm follow‐up methods: we assessed the method of follow‐up as described by the trialists for likely completeness and accuracy.
Completeness of follow‐up: we calculated the median follow‐up time, using the Kaplan‐Meier method, to indicate average length of follow‐up. We quantified the distribution of last information dates. Both high variability (large interquartile range), in relation to the median follow‐up time, and significant differences between treatment arms indicate less reliable follow‐up. We also compared completeness of follow‐up between patients with and without secondary malignant neoplasms.
We compared the secondary malignant neoplasm rate with that expected in an age‐ and sex‐matched cohort from the general population, using data from various US, European and Australasian cancer registries as appropriate to the trial.
These special aspects were expected to be the most problematic since secondary malignant neoplasm events were not a major endpoint for most trials.
Risk of bias was considered when interpreting review results by qualitative and quantitative description as well as by a sensitivity analysis excluding incomplete follow‐up periods.
Measures of treatment effect
According to Chapter nine of the Cochrane Handbook for Systematic Reviews of Interventions (Higgins 2011), we calculated a measure (Peto's odds ratio (OR)) of the difference in cumulative secondary malignant neoplasm incidence between the treatment arms of each trial separately, together with an estimate of the variance of this quantity (EBCTCG 1988; EBCTCG 1992). For PFS and OS, we calculated the hazard ratio (HR) using Cox proportional hazards regression (the proportional hazards assumption was checked graphically and no relevant deviations were found).
Both the first‐line treatment and possible salvage therapy for progression or relapse of HL may contribute to secondary malignant neoplasm risk. The type and frequency of salvage therapy, and thus its effect on secondary malignant neoplasm risk, depend on both the nature and efficacy of the first‐line treatment. Therefore, we conducted separate analyses with and without the effect of salvage therapy. For the latter, follow‐up times are censored at HL progression or relapse and subsequent secondary malignant neoplasms do not count as events.
We intended to analyse solid tumours separately for the most common sites (lung and breast), but omitted this due to the small numbers of events.
Studies with multiple treatment groups
We included some studies with a factorial design, for instance in GHSG HD10, participants were randomised between two and four cycles of chemotherapy and simultaneously between involved field radiotherapy at 20Gy and 30Gy doses. This study was thus included in meta‐analyses of two treatment comparisons: fewer chemotherapy cycles and reduced‐dose radiation, in each case pooling participants over pairs of treatment groups. In other studies, data of a treatment group not fitting the inclusion criteria (e.g. the standard‐dose BEACOPP arm of GHSG HD9) was simply omitted from the analysis.
Dealing with missing data
We queried all missing values in IPD data sets with the trialists. If missing values of key variables (randomisation arm, outcome) persisted, we excluded the case concerned from the analysis. We report the numbers of such exclusions.
Assessment of heterogeneity
We described the heterogeneity of treatment effects between trials using the I2 statistic. For descriptive purposes, we adopted the classification of amount of heterogeneity suggested in the Cochrane Handbook for Systematic Reviews of Interventions (Higgins 2011 section 9.5.2). For the purpose of assessing quality of evidence in the 'Summary of findings' tables, 50% was used as an approximate limit for downgrading due to high heterogeneity. We calculated 95% confidence intervals (CIs) for I2 using the test‐based method described by Higgins and Thompson (Higgins 2002).
Assessment of reporting biases
If at least 10 studies were included in a particular comparison, we planned to use a funnel plot and a linear regression test for asymmetry (test of slope for regression of treatment effect size on the total number of participants in the trial) to assess whether the included trials were a biased sample of all eligible trials in terms of estimated treatment effect. This was not performed since no study question included more than seven trials.
Data synthesis
We combined the following randomised comparisons across the appropriate trials.
Chemotherapy alone versus same chemotherapy plus radiotherapy.
Chemotherapy plus involved‐field radiation versus same chemotherapy plus extended‐field radiation.
Chemotherapy plus lower‐dose radiation versus same chemotherapy plus higher‐dose radiation.
Fewer versus more courses of chemotherapy (with or without radiotherapy in each case).
Dose‐intensified chemotherapy versus ABVD‐like chemotherapy (with or without radiotherapy in each case).
In general, all comparisons were performed separately for early‐stage HL (stages I to II) and advanced‐stage HL (stages III to IV).
We combined measures of treatment effect across trials that are relevant to the comparison being made in order to assess overall differences in secondary malignant neoplasm rate (or other outcome) between modalities. We thus used a two‐step approach (i.e. first, analysis of each trial separately and second, meta‐analysis combination of estimates) based on the fixed‐effect model. Relative risks refer to randomised comparisons between treatment modalities. We calculated risks relative to the general population only for the purpose of assessing data quality. We performed analyses within trials in SAS and entered the relevant results into Review Manager (RevMan 2012).
Due to the multiplicity of endpoints and to the several subgroup analyses proposed, the danger of significant differences arising by chance alone is increased. For this reason, we employed 99% CIs for individual trials but show 95% CIs for aggregated estimates (for example, as in EBCTCG 1992).
Grading of evidence
For 'Summary of findings' tables, we assessed the quality of evidence for each study question and outcome according to the methods of the GRADE Working Group (Guyatt 2008). The following factors were considered to lower the grade of evidence by one point: high heterogeneity, low number of events, poor consistency between groups of studies.
Subgroup analysis and investigation of heterogeneity
We performed subgroup analyses to investigate whether certain types of patients or treatment types show different treatment effects. We employed the following patient‐related subgroups:
age (under 50 years; 50 years and older); and
sex.
Treatment‐related subgroups were considered for SQ5 (dose‐intensified versus ABVD‐like chemotherapy) only, grouping according to the intensified regimen (BEACOPP, Stanford V, EBVCAD, ChlVPP).
Firstly, the presence of an interaction between the relevant treatment factor (according to study question) and the subgrouping factor was tested in order to decide wether the treatment effect differed between subgroups. Treatment effects within subgroups were taken seriously only where the interaction was significant (P ≤ 0.05).
In addition, signs of a time trend according to median year of recruitment were investigated graphically.
Sensitivity analysis
As a sensitivity analysis for the outcome secondary malignant neoplasms, we analysed the data for all trials making a particular comparison of modalities together, by Cox proportional hazards regression (Cox 1972), including relevant covariates (age, sex, stage). In order to preserve the advantages of randomised comparisons in the presence of inter‐trial heterogeneity of baseline risk, we stratified analyses by trial (a one‐step approach).
We performed further sensitivity analyses to check that the results were not crucially dependent on selection criteria or analysis methods. Firstly, we repeated analyses with the exclusion of the latest, less complete follow‐up periods in each trial (that is when less than 75% of patients were still followed up). Secondly, we reran analyses excluding confounded trials. Thirdly, we repeated secondary malignant neoplasms and solid tumour analyses excluding non‐melanoma skin cancers (as in many previous investigations of secondary malignant neoplasms).
Fourthly, the Peto and the Cox methods do not allow for competing risks (deaths from other causes compete with second malignancies). The Cox regression method is valid for comparing 'cause‐specific' hazards in the presence of competing risks (Iacobelli 2013). In order to display cumulative incidence curves for the compared treatment options, we employed the cumulative incidence method (Pepe 1993; Tai 2001), which allows for competing risks, for the pooled data set (not meta‐analytically as proposed in Franklin 2006b). This analysis was not stratified by study.
Results
Description of studies
Results of the search
We screened the MEDLINE and Cochrane Central databases for clinical trials eligible for this meta‐analysis on secondary malignancies after Hodgkin's lymphoma (HL) treatment. In June 2010, a total of 3515 references published after 1984 were identified and independently reviewed with respect to their eligibility by two of the review authors (DAE and JF). The majority did not meet the predefined criteria and were excluded.
Five hundred and seventy‐eight references fulfilled the predefined general eligibility criteria and were re‐assessed concerning the exact treatment comparison. Twenty randomised clinical trials (RCTs) for the first‐line treatment of HL including at least 50 patients per study arm and comparing treatment modalities as listed above (see Types of interventions) were identified. We contacted the relevant authors and study groups and requested individual patient data IPD). Finally, data were received for 16 trials; no data were received from four trials.
The same search strategy was repeated in March 2015 to check for eligible studies published since the original search. A total of 953 non‐duplicate references were identified and again, independently evaluated by DAE and JF. There were 61 articles evaluated as fulfilling the general requirements (RCTs comparing first‐line therapies of HL patients). The majority described previously identified trials; 14 trials were new, of which two turned out to be not randomised. Of the remaining 12 trials, 11 were excluded due to < 50 patients per arm, recruitment beyond 2007 or inappropriate comparison of therapies. One study, the American Intergroup Eastern Cooperative Oncology Group (ECOG_E2496) comparing ABVD with Stanford V in locally extensive and advanced‐stage HL, was identified as eligible. Reasons for failing general eligibility criteria: 1926 references did not concern HL patients, 1311 did not report a clinical therapy trial, 212 reported on second‐line therapy, 125 reported non‐randomised trials and 255 were review articles.
The three international trials registries listed in Electronic searches were searched online after completion of the data analysis to check for missed studies: no further eligible trials were found.
The same search was repeated in July 2017: 1046 distinct articles were retrieved. Five hundred and forty‐three references did not concern HL, 156 did not report a clinical therapy trial, 135 described second‐line therapy, 109 were review articles and 19 reported not randomised trials. Eighty‐four articles were identified as describing potentially eligible studies. Of those studies not already included, none were eligible according to the full inclusion criteria.
Figure 1 displays the results of the original 2010 search and the repeated 2015 and 2017 searches together, with reasons for failing general eligibility criteria.
1.
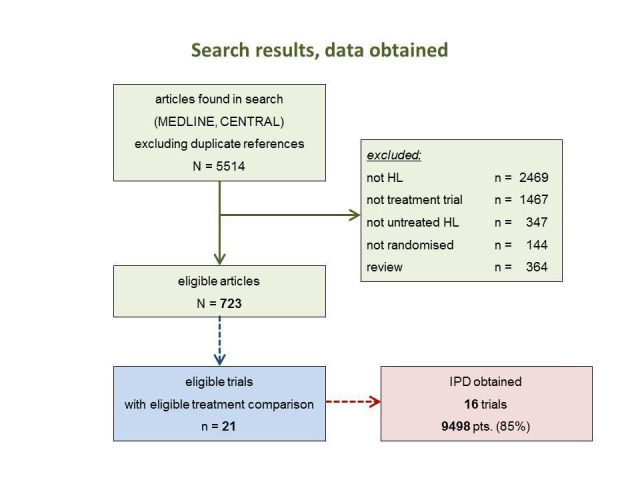
Search results and inclusion of studies (IPD = individual patient data). Numbers are cumulative over the original (2010) and repeat (2015 and 2017) searches.
Included studies
The studies included in the present meta‐analysis had randomly compared one or more of the following treatment strategies with at least 50 patients per study arm (summary of amount of data in Figure 2).
2.

Numbers of trials and patients analysed for each study question
SQ1: Chemotherapy alone versus same chemotherapy plus radiotherapy
SQ2: Chemotherapy plus involved‐field radiation versus same chemotherapy plus extended‐field radiation
SQ3: Chemotherapy plus lower‐dose radiation versus same chemotherapy plus higher‐dose radiation
SQ4: Fewer versus more courses of chemotherapy (with or without radiotherapy in each case)
SQ5: Dose‐intensified versus ABVD‐like chemotherapy (with or without radiotherapy in each case)
SQ1
In the following studies, patients were randomly assigned to no adjuvant radiotherapy or adjuvant radiotherapy
1) In the European Organisation for Research and Treatment of Cancer (EORTC) 20884 trial for patients with advanced HL (according to the EORTC definition), recruitment between 1989 and 2000, patients received either involved‐field (IF)‐RT (24 Gy to 40 Gy) or no radiotherapy after chemotherapy with six or eight cycles of MOPP/ABV (EORTC #20884). The amount of chemotherapy depended on the initial response to treatment as judged by interim staging.
2) In the EORTC‐GELA (Groupe d'Etudes des Lymphomes Adulte) H9‐F trial for patients with early favourable HL (according to the EORTC‐GELA definition), recruitment between 1998 and 2004, patients received either IF‐RT (20 Gy or 36 Gy) or no radiotherapy after six cycles of EBVP chemotherapy (EORTC H9‐F).
3) In the German Hodgkin Study Group (GHSG) HD3 trial for patients with advanced HL (according to the GHSG definition), recruitment between 1984 and 1988, patients received either 20 Gy IF‐RT or no radiotherapy after three double cycles of COPP/ABVD chemotherapy. Patients who did not receive radiotherapy had one additional double cycle of COPP/ABVD chemotherapy (GHSG HD3).
A total of 1011 patients were considered for the comparison between no additional radiotherapy and additional radiotherapy after chemotherapy (340 versus 671). Three hundred and thirty‐three patients came from the EORTC 200884 trial, 578 patients came from the H9‐F trial and 100 patients came from the HD3 trial.
SQ2
In the following studies, patients were randomly assigned to less or more extended‐radiotherapy fields
1) Within the EORTC‐GELA H8‐U trial for patients with early unfavourable HL (according to the EORTC‐GELA definition), recruitment between 1993 and 1999, patients received either IF‐RT or subtotal nodal irradiation category (STNI) after chemotherapy consisting of four or six cycles of MOPP/ABV (EORTC H8‐U).
2) Within the GHSG HD8 trial for patients with early unfavourable HL (according to the GHSG definition), recruitment between 1993 and 1998, patients received either IF‐RT or extended‐field (EF)‐RT after chemotherapy consisting of two double cycles of COPP/ABVD (GHSG HD8; Sasse 2012).
3) Within the Italian HD94 trial for patients with early unfavourable HL (as defined by study group conducting the trial), recruitment between 1994 and 1997, patients received either IF‐RT or EF‐RT after chemotherapy consisting of four cycles of ABVD (Roma_HD94).
4) Within the Milan Study for patients with early unfavourable HL (as defined by the study group conducting the trial), recruitment between 1990 and 1996, patients received either IF‐RT or STNI after chemotherapy consisting of four cycles of ABVD (Milano_STNI_IF).
A total of 2397 patients were considered for the comparison between less or more extended‐radiation fields (1371 versus 1026). 984, 1064, 209 and 140 came from the trials 1), 2), 3) and 4).
SQ3
In the following studies, patients were randomly assigned to a lower or higher radiation dose
1) In the EORTC‐GELA H9‐F trial for patients with early favourable HL (according to the EORTC‐GELA definition), recruitment between 1998 and 2004, patients received either 20 Gy IF‐RT or 36 Gy IF‐RT after six cycles of EBVP chemotherapy (EORTC H9‐F).
2) In the GHSG HD10 trial for patients with early favourable HL (according to the GHSG definition), recruitment between 1998 and 2003, patients received either 20 Gy IF‐RT or 30 Gy IF‐RT after two or four cycles of ABVD chemotherapy (2x2 design) (GHSG HD10).
3) In the GHSG HD11 trial for patients with early unfavourable HL (according to the GHSG definition), recruitment between 1998 and 2003, patients received either 20 Gy IF‐RT or 30 Gy IF‐RT after four cycles of ABVD or non‐escalated bleomycin, etoposide, adriamycin, cyclophosphamide, vincristine, procarbazine and prednisone (baseline BEACOPP) chemotherapy (2 x 2 design) (GHSG HD11).
A total of 2962 patients were considered for the comparison between a lower or a higher radiation dose (1473 versus 1489). Four hundred and forty‐eight patients came from the H9‐F trial, 1163 patients came from the HD10 trial and 1351 patients came from the HD11 trial.
SQ4
In the following studies, patients were randomly assigned to fewer or more courses of the same chemotherapy
1) In the EORTC‐GELA H8‐U trial for patients with early unfavourable HL (according to the EORTC‐GELA definition), recruitment between 1993 and 1999, patients either received four or six cycles of MOPP/ABV chemotherapy (EORTC H8‐U).
2) In the EORTC‐GELA H9‐U trial for patients with early unfavourable HL (according to the EORTC‐GELA definition), recruitment between 1998 and 2002, patients either received four or six cycles of ABVD chemotherapy (EORTC H9‐U).
3) In the GHSG HD10 trial for patients with early favourable HL (according to the GHSG definition), recruitment between 1998 and 2003, patients either received two or four cycles of ABVD chemotherapy (GHSG HD10).
A total of 2403 patients were considered for the comparison between fewer or more cycles of the same chemotherapy (1202 versus 1201). Six hundred and sixty six patients came from the H8‐U trial, 553 patients came from the H9‐U trial and 1190 patients from the HD10 trial.
SQ5
In the following studies, patients were randomly assigned to more or less (= standard) aggressive chemotherapy protocols
1) In an Italian multi‐centre trial for patients with advanced HL (as defined by the study group conducting the trial), recruitment between 2000 and 2007, patients received chemotherapy either consisting of six to eight cycles of ABVD or eight cycles of BEACOPP (four cycles in escalated dosage and four cycles in baseline dosage) (MF‐GITIL‐IIL).
2) In the Italian HD2000 trial for patients with advanced HL (as defined by the study group conducting the trial), recruitment between 2000 and 2007, patients received chemotherapy either consisting of six cycles of ABVD or six cycles of BEACOPP (four cycles in escalated dosage and two cycles in baseline dosage) or six cycles of cyclophosphamide, lomustine, vindesine, melphalan, prednisone, epidoxorubicin, vincristine, procarbazine, vinblastine, and bleomycin (COPPEBVCAD, GISL_HD2000).
3) In the GHSG HD9 trial for patients with advanced HL (according to the GHSG definition), recruitment between 1993 and 1998, patients received chemotherapy either consisting of four double cycles of COPP/ABVD or eight cycles of escalated BEACOPP (GHSG HD9; Engert 2009).
4) In the Italian HD 9601 trial for patients with advanced HL (as defined by study group conducting the trial), recruitment between 1996 and 2000, patients received chemotherapy either consisting of six cycles of ABVD or 12 weeks of a modified Stanford V schedule or six cycles of mechlorethamine, vincristine, procarbazine, prednisone (MOPP) with epidoxorubicin, bleomycin, vinblastine, lomustine, doxorubicin, and vindesine (MOPPEBVCADD; Gobbi and colleagues, J Clin Oncol, 2005; IIL_HD9601).
5) In the British LY‐09 trial for patients with advanced HL (as defined by the study group conducting the trial), recruitment between 1998 and 2001, patients received chemotherapy either consisting of at least six cycles of ABVD or a an alternating multi‐drug regimen (ChlVPP/PABIOE) (UKLG_LY09_Alt) or a hybrid multi‐drug regimen (ChlVPP/EVA) (UKLG_LY09_Hyb).
6) In the British ISRCTN 64141244 trial for patients with advanced HL (as defined by the study group conducting the trial), recruitment between 1998 and 2006, patients received chemotherapy either consisting of six to eight cycles of ABVD or 12 weeks of the Stanford V schedule (UK‐NCRI‐LG).
A total of 2996 patients were considered for the comparison between less (standard) or more aggressive chemotherapy protocols (1305 versus 1691). Three hundred and thirty‐one, 295, 727, 335, 788 (569 from UKLG_LY09_Alt, 219 from UKLG_LY09_Hyb) and 520 patients came from the trials 1), 2), 3), 4), 5) and 6), respectively.
The patients included in the trials taken into account were aged 15 to 75, the median age for the different comparisons of the meta‐analysis ranged between 31 and 34 years. Slightly more patients were male. Patients with all clinical stages (stage IA to stage IVB) at HL diagnosis were considered.
Included studies that did not contribute to the data analysis
Four studies fulfilling the eligibility criteria were excluded from the data analysis because no IPD were received from the study group which conducted the trial. In one case (Gerhartz_COPP‐ABVD), no contact could be established with the authors; in two others (CCG‐5942; POG_8625), following initial interest in participation, no further responses were received from the group; in the fourth case (Tata_India), discussions with the group took place but did not result in contribution of data.
One study (ECOG_E2496) was only identified in the second search (March 2015) and thus IPD were not sought.
Excluded studies
We excluded two studies because the extension of recruitment beyond 2007 was first revealed by communication with the study group (EORTC #20012; GHSG HD14).
Risk of bias in included studies
For two studies no publication was available (in May 2014). Therefore only the remaining 14 studies could be evaluated with respect to allocation and attrition bias. Results are summarised in Figure 3 and Figure 4. Selective reporting was not further considered since IPD were obtained for all included studies for all outcomes sought.
3.

Risk of bias graph: review authors' judgements about each risk of bias item presented as percentages across all included studies.
4.

Risk of bias summary: review authors' judgements about each risk of bias item for each included study.
(the two entries UKLG‐LY09‐Alt and UKLG‐LY09‐Hyb are in fact a single trial but were analysed as two trials)
Allocation
All included studies except one (Roma_HD94) (which used alternating assignment) were properly randomised, and the majority (10/16) described reliable methods (low risk of bias) to provide effective allocation concealment. In the remainder (5/16), randomisation methods were not fully described.
Blinding
Allocation was not blinded to either patients, treating physicians or assessors in any trial. Such blinding would be difficult or impossible. While this could allow both performance and detection bias effects, we argue that such effects would be expected to be minimal due to the serious nature of the disease, the co‐ordinated treatment approach involving diverse specialities and the severe and unequivocal nature of the outcomes. Therefore, we postulate high risk of bias due to lack of blinding of patients, treating physicians and assessment of the outcomes progression‐free survival (PFS) and secondary malignant neoplasm (SMN), but low risk of bias due to assessment of overall survival (OS) (a 'hard' endpoint).
Incomplete outcome data
Details on patients who were excluded with reasons for exclusion were adequate in almost all studies (low risk of bias).
All outcomes are time‐to‐event data and the times are censored in the majority of cases. According to the amount of, and reasons for censoring, a bias may be introduced, particularly for long‐term event rates. if the censoring mechanism differs markedly between the randomised treatment arms.
We compared the distribution of follow‐up times between treatment arms within each study. Only one such comparison (one of 16) yielded a significant difference with the logrank test (P = 0.036). Thus, acknowledging the multiple testing involved, there is no evidence of censoring patterns which differ between the treatment arms.
The median follow‐up time (MFU) ranged between 3.8 and 17.6 years in all studies, and was at least 8.0 years in half the studies.
The amount of scatter in the dates of last information within a trial is an important (inverse) marker of follow‐up quality. The interquartile range of the dates of last information (IQR‐DLI) varied among trials from 0.4 to 6.6 years (median: 3.1 years). The IQR‐DLI correlated strongly with the MFU (that is, studies with longer follow‐up tend to have more scatter); the ratio of IQR‐DLI to MFU varied between 0.05 and 0.59 (median: 0.34). Thus, in half of the trials the central 50% of last information dates stretch over a time interval of at least three years or one‐third of the median follow‐up time.
The observed numbers of SMN per trial were compared with expected numbers calculated from the (averaged) incidences reported in three large cohort studies of HL patients (Dores 2002; van Leeuwen 1994a; Foss‐Abrahamsen 2002). Calculations were performed for each five‐year interval following HL diagnosis and then summed over time. Observed and expected numbers were strongly correlated. Deviations of observed numbers of SMN from expectation ranged from 68% less than expected to 45% more than expected. Two studies had significantly (i.e. P < 0.05) less (6.0 versus 18.7 and 8.0 versus 17.4), while one had significantly more (103 versus 70.9); no significant difference for the remaining 13 trials.
Selective reporting
Individual patient data on all outcomes were received from all studies (low risk of bias), with one exception: secondary malignancy cases in the EORTC studies were not described in detail but only assigned to the categories acute myeloid leukaemia/myelodysplastic syndrome (AML/MDS), non‐Hodgkin lymphomas (NHL) or solid tumour; however, no analyses were performed which required exclusion of these studies, because particular solid tumour sites were not analysed due to the low numbers of cases.
Other potential sources of bias
No further potential biases were identified.
Effects of interventions
See: Table 1; Table 2; Table 3; Table 4; Table 5
Individual patient data (IPD) from 16 randomised clinical trials including a total of 9498 patients with newly diagnosed HL were analysed with respect to the frequency of secondary malignancies, progression‐free survival (PFS) and overall survival (OS). Patients were allocated to groups according to the five questions that were addressed in this meta‐analysis (Figure 2).
Overall, 438 (4.6%) of the 9498 patients included in the present analysis developed a secondary malignancy in the course of follow‐up. Median follow‐up of the randomised studies included ranged between 3.5 and 17.6 years. Half of the studies had a median follow‐up of at least eight years. Secondary solid tumours were seen in 276 (2.91%) patients, secondary NHL was diagnosed in 86 (0.91%) patients and secondary AML/MDS occurred in 63 (0.66%) patients. In 13 (0.14%) patients diagnosed with a secondary malignancy, it was unknown whether they had secondary AML/MDS, secondary NHL or a secondary solid tumour. Among the total of secondary solid tumours (N = 276), breast cancer (N = 39), lung cancer (N = 35), skin cancer (N = 29) and cancer of colon, sigmoid or rectum (N = 23) were most often observed (Figure 5).
5.

Frequencies of SMN types and solid tumour locations
Due to the small numbers of lung (for the individual study questions between four and 13 events) and breast cancers (between zero and 25 events), we did not analyse these individual sites. No marked differences in incidences between treatment groups were observed.
I2 as a measure of heterogeneity among studies varied between zero (in seven of the 15 main treatment comparisons) to 89%. The upper 95% confidence limits for I2 varied between 74% and 96%, reflecting the fact that heterogeneity cannot be accurately quantified where the number of studies is low.
Study question (SQ) 1) Chemotherapy alone versus same chemotherapy plus radiotherapy (three trials: two for advanced stages, one for early stages)
Secondary malignant neoplasm (SMN)
(Analysis 1.1) With a median follow‐up of 7.8 years for the 1011 patients (from three trials) eligible for this study question (671 patients assigned to consolidating radiotherapy versus 340 patients assigned to chemotherapy alone), a total of 40 secondary malignancies had occurred. Thirty patients who had received consolidating radiotherapy after chemotherapy were diagnosed with a secondary malignancy while 10 secondary malignancies occurred among patients who had no consolidating radiotherapy. This difference between the treatment groups was significant favouring the group of patients treated with chemotherapy only (P = 0.010, Peto odds ratio (OR) 0.43, 95% confidence interval (CI) 0.23 to 0.82) ‐ see Figure 6. This OR corresponds to eight‐year SMN rates of 4% with chemotherapy alone and 8% with combined treatment. This effect was confirmed in an analysis in which patients were censored at the time they had HL progress or relapse to exclude an influence of second‐line treatment on the risk to develop a secondary malignancy (P = 0.0038, Peto OR 0.34, CI 0.16 to 0.71, analysis not shown). When separately considering secondary AML/MDS, secondary NHL and secondary solid tumours, a significant difference between patients receiving consolidating radiotherapy after chemotherapy and patients receiving no radiotherapy after chemotherapy was only seen for secondary AML/MDS (P = 0.037); the incidence of secondary NHL and secondary solid tumours did not significantly differ between treatment groups (analyses not shown). Quality of evidence was low.
1.1. Analysis.

Comparison 1 additional radiotherapy, Outcome 1 secondary malignant neoplasms.
6.

SMN cumulative incidence plot (Peto estimates): avoidance of additional irradiation
When grouping patients into those with early stages and advanced stages, respectively, a significantly increased frequency of secondary malignancies was seen in patients with advanced stages assigned to additional radiotherapy as compared with patients with advanced stages not irradiated (Peto OR: 0.41, CI 0.21 to 0.81) (two studies, 433 participants) (Figure 6). In patients with early stages, no difference regarding the incidence of secondary malignancies was seen between patients who had combined‐modality treatment and patients who were treated with chemotherapy alone.
Progression‐free survival (PFS) and overall survival (OS)
(Analysis 1.3; Analysis 1.2; three studies 1011 participants) PFS and OS rates were not significantly different between those who were treated with chemotherapy followed by radiotherapy and those who were treated with chemotherapy alone, although there was a tendency to more progression/relapse (P = 0.06, HR = 1.31, CI 0.99 to 1.73; Analysis 1.3, eight‐year PFS 80% and 74%), but longer survival time (P = 0.14, HR: 0.71, CI 0.46 to 1.11; Analysis 1.2, eight‐year survival 90% and 93%) in the no‐RT group. However, there was a wide discrepancy between OS and PFS treatment effects in early‐stage compared with advanced‐stage trials. Patients with early stages treated with chemotherapy followed by radiotherapy had a significantly better PFS than patients with early stages treated with chemotherapy alone, while for advanced stages the effect tended in the opposite direction. However, there was only one early‐stage trial. Quality of evidence was moderate.
1.3. Analysis.

Comparison 1 additional radiotherapy, Outcome 3 progression‐free survival.
1.2. Analysis.

Comparison 1 additional radiotherapy, Outcome 2 overall survival.
Subgroups
For the sake of compactness we included all subgroup analyses of a particular outcome and treatment comparison in a single forest plot. Thus, tests of subgroup differences should, if switched on, be restricted to single subgroup factors by deselecting the remaining factors.
(Analysis 6.1; Analysis 6.2; Analysis 6.3) For subgroup analyses of secondary malignant neoplasms and OS, no significant interactions were seen between age or gender and treatment. For PFS, there was a significant (P = 0.020) interaction between age and treatment: PFS was significantly better for patients aged 50 or younger treated with combined‐modality approaches (P = 0.004, HR: 1.55, CI 1.15 to 2.10), while no significant difference was seen in older patients. Again, these results must be regarded with caution since they are based on only three trials, and important differences in PFS and OS treatment effects were seen between early and advanced stages.
6.1. Analysis.

Comparison 6 subgroups additional radiotherapy, Outcome 1 secondary malignant neoplasms.
6.2. Analysis.

Comparison 6 subgroups additional radiotherapy, Outcome 2 overall survival.
6.3. Analysis.

Comparison 6 subgroups additional radiotherapy, Outcome 3 progression‐free survival.
No time trend according to median recruitment time (1985 to 2001) was observed for any of the three outcomes.
SQ 2) Chemotherapy plus involved‐field radiation versus same chemotherapy plus extended‐field radiation (four trials: all four4 for early stages)
SMN
(Analysis 2.1) With a median follow‐up of 10.8 years for the 2397 patients (from four trials) eligible for this study question (1026 patients assigned to more extended radiotherapy after chemotherapy versus 1371 patients assigned to involved‐field radiotherapy after the same chemotherapy), a total of 188 secondary malignancies had occurred. Ninety‐two patients who had received more extended radiotherapy were diagnosed with a secondary malignancy while 96 secondary malignancies occurred among patients who had received involved‐field radiotherapy after the same chemotherapy. Overall, the incidence of secondary malignancies did not differ significantly between both treatment groups (P = 0.32, Peto OR: 0.86, CI 0.64 to 1.16). This was also true when secondary AML/MDS, secondary NHL and secondary solid tumours were separately considered. Quality of evidence was low.
2.1. Analysis.

Comparison 2 radiotherapy field, Outcome 1 secondary malignant neoplasms.
Progression‐free survival (PFS) and overall survival (OS)
(Analysis 2.3, Analysis 2.2) Neither PFS nor OS were significantly different between treatment groups. Eight‐year PFS was 85% for involved‐field radiotherapy and 84% after more extended radiotherapy, eight‐year OS 90% versus 89%, respectively. Quality of evidence was high.
2.3. Analysis.

Comparison 2 radiotherapy field, Outcome 3 progression‐free survival.
2.2. Analysis.

Comparison 2 radiotherapy field, Outcome 2 overall survival.
Subgroups
(Analysis 7.1; Analysis 7.2; Analysis 7.3) In subgroup analyses, there were no significant interactions between age or gender and treatment, and within these subgroups, the frequency of secondary malignancies, PFS and OS did not significantly differ between patients who had received more extended radiotherapy and patients who had involved‐field radiotherapy after the same chemotherapy. Included trials recruited early‐stage patients only.
7.1. Analysis.

Comparison 7 subgroups radiotherapy field, Outcome 1 secondary malignant neoplasms.
7.2. Analysis.

Comparison 7 subgroups radiotherapy field, Outcome 2 overall survival.
7.3. Analysis.

Comparison 7 subgroups radiotherapy field, Outcome 3 progression‐free survival.
One study recruited some four years earlier than the rest, but no time trend was visible in any outcome.
SQ 3) Chemotherapy plus lower‐dose radiation versus same chemotherapy plus higher‐dose radiation (three trials: all three for early stages)
Secondary malignant neoplasm (SMN)
(Analysis 3.1) With a median follow‐up of 7.4 years for the 2962 patients (from three trials) eligible for this study question (1489 patients assigned to standard dose radiotherapy versus 1473 patients assigned to a reduced radiotherapy dose after the same chemotherapy), a total of 110 secondary malignancies had occurred. Fifty‐four patients who had received standard dose radiotherapy after chemotherapy were diagnosed with a secondary malignancy while 56 secondary malignancies occurred in patients who had received radiotherapy at a reduced dose after the same chemotherapy. Overall, the frequency of secondary malignancies did not differ significantly between both treatment groups (P = 0.87, Peto OR: 1.03, CI 0.71 to 1.50). This was also true when secondary AML/MDS, secondary NHL and secondary solid tumours were separately considered (analyses not shown). Quality of evidence was low.
3.1. Analysis.

Comparison 3 radiotherapy dose, Outcome 1 secondary malignant neoplasms.
Progression‐free survival (PFS) and overall survival (OS)
(Analysis 3.3; Analysis 3.2) No significant differences in terms of PFS and OS were detected between patients who had standard dose radiotherapy (eight‐year PFS 87%, eight‐year OS 94%) and a reduced radiotherapy dose, respectively (eight‐year PFS 84%, eight‐year OS 95%). Quality of evidence was high.
3.3. Analysis.

Comparison 3 radiotherapy dose, Outcome 3 progression‐free survival.
3.2. Analysis.
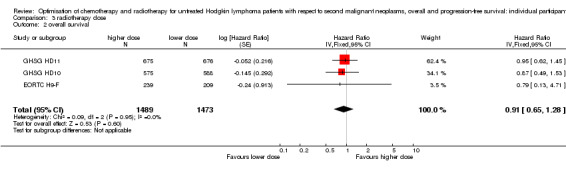
Comparison 3 radiotherapy dose, Outcome 2 overall survival.
Subgroups
(Analysis 8.1; Analysis 8.2; Analysis 8.3) In subgroup analyses, no significant interaction was observed between age or gender and treatment. Within these subgroups, the frequency of secondary malignancies, PFS and OS did not significantly differ between patients who had received standard dose radiotherapy and patients who had a reduced radiotherapy dose after the same chemotherapy. Included trials recruited early‐stage patients only.
8.1. Analysis.

Comparison 8 subgroups radiotherapy dose, Outcome 1 secondary malignant neoplasms.
8.2. Analysis.

Comparison 8 subgroups radiotherapy dose, Outcome 2 overall survival.
8.3. Analysis.

Comparison 8 subgroups radiotherapy dose, Outcome 3 progression‐free survival.
All three studies had a median recruitment time within eight months (2000/2001).
SQ 4) Fewer versus more courses of chemotherapy (three trials: all three for early stages)
Secondary malignant neoplasm (SMN)
(Analysis 4.1) With a median follow‐up of 7.8 years for the 2403 patients (from three trials) eligible for this study question (1202 patients assigned to fewer chemotherapy cycles versus 1201 patients who received more chemotherapy cycles of the same protocol), a total of 101 secondary malignancies had occurred. Fifty‐three patients who had received fewer chemotherapy cycles were diagnosed with a secondary malignancy while 48 secondary malignancies occurred in patients who had received more cycles of the same chemotherapy. Overall, the incidence of secondary malignancies did not differ significantly between both groups (P = 0.65, Peto OR: 1.10, CI 0.74; 1.62). This was also true when secondary AML/MDS, secondary NHL and secondary solid tumours were considered separately. Quality of evidence was moderate.
4.1. Analysis.

Comparison 4 chemotherapy cycles, Outcome 1 secondary malignant neoplasms.
Progression‐free survival (PFS) and overall survival (OS)
(Analysis 4.3; Analysis 4.2) No significant differences in terms of PFS (P = 0.23) and OS (P = 0.95) were detected between patients treated with fewer and more chemotherapy cycles, respectively (eight‐year PFS 85% versus 87%, eight‐year OS 92% in both groups). Quality of evidence was high.
4.3. Analysis.

Comparison 4 chemotherapy cycles, Outcome 3 progression‐free survival.
4.2. Analysis.

Comparison 4 chemotherapy cycles, Outcome 2 overall survival.
Subgroups
(Analysis 9.1; Analysis 9.2; Analysis 9.3) For subgroup analyses, patients were divided according to age (patients aged 50 or younger and patients above 50) and gender. No significant interactions between age or gender and treatment were seen. Within these subgroups, the frequency of secondary malignancies, PFS and OS did not significantly differ between patients assigned to fewer and patients assigned to more cycles. Included trials recruited early‐stage patients only.
9.1. Analysis.

Comparison 9 subgroups chemotherapy cycles, Outcome 1 secondary malignant neoplasms.
9.2. Analysis.

Comparison 9 subgroups chemotherapy cycles, Outcome 2 overall survival.
9.3. Analysis.
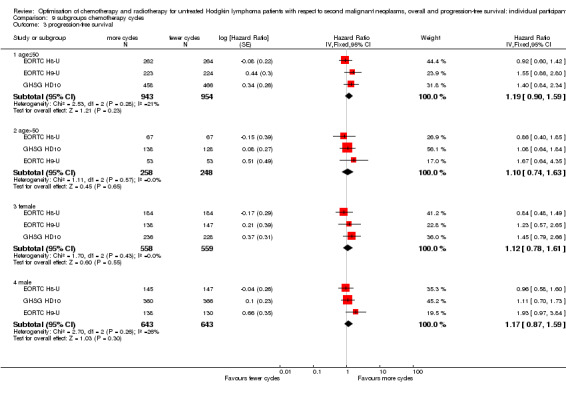
Comparison 9 subgroups chemotherapy cycles, Outcome 3 progression‐free survival.
One study recruited four years earlier than the rest, but no time trend was visible in any outcome.
SQ 5) Dose‐intensified chemotherapy versus ABVD‐like chemotherapy (six trials: all sixfor advanced stages)
Secondary malignant neoplasm (SMN)
(Analysis 5.1) With a median follow‐up of 6.7 years for the 2996 patients (from six trials) eligible for this study question (1305 patients assigned to standard dose chemotherapy versus 1691 assigned to intensified chemotherapy), a total of 91 secondary malignancies had occurred. HM: The heading states six trials but the first paragraph refers to seven trials. The total number of participants listed (1305 + 1691) agrees with the Data & analysis results. Is this due to counting UKLG_LY09_Alt and UKLG_LY09_Hyb as two studies or one study? Thirty‐one patients who had received standard dose chemotherapy were diagnosed with a secondary malignancy while 60 secondary malignancies occurred in patients who had received intensified chemotherapy. Overall, this difference was not significant (P = 0.15, Peto OR: 1.37, 95% CI 0.89 to 2.10) ‐ see Figure 7. When separately considering secondary AML/MDS, secondary NHL and secondary solid tumours, secondary AML/MDS was significantly more often observed among patients treated with intensified chemotherapy approaches (P = 0.0028). Significant differences in terms of secondary NHL and secondary solid tumours were not seen. Quality of evidence was low.
5.1. Analysis.

Comparison 5 intensified chemotherapy, Outcome 1 secondary malignant neoplasms.
7.

SMN cumulative incidence plot (Peto estimates): intensified chemotherapy
Progression‐free survival (PFS) and overall survival (OS)
(Analysis 5.3; Analysis 5.2) Tumor control was significantly better in patients treated with intensified chemotherapy protocols resulting in a superior PFS when compared with standard dose protocols (P = 0.007, HR: 0.82, CI 0.70 to 0.95, eight‐year PFS 75% and 69%). In terms of OS, patients receiving intensified protocols tended to have better prognosis but the difference was not statistically significant (P = 0.12, HR: 0.85, CI 0.70 to 1.04, eight‐year survival 85% and 82%). Quality of evidence was moderate.
5.3. Analysis.

Comparison 5 intensified chemotherapy, Outcome 3 progression‐free survival.
5.2. Analysis.

Comparison 5 intensified chemotherapy, Outcome 2 overall survival.
Subgroups
(Analysis 10.1; Analysis 10.2; Analysis 10.3) In a subgroup analysis restricted to trials comparing escalated BEACOPP with standard‐dose chemotherapy, a significantly better OS could be shown for patients treated with escalated BEACOPP (P = 0.0005, HR: 0.58, CI 0.43 to 0.79). PFS was also particularly strongly superior for the intensified regimen in the BEACOPP subgroup (P < 0.00001, HR: 0.47, CI 0.37 to 0.60). The improved clinical outcome achieved with intensified first‐line regimens was at the cost of an increased frequency of secondary malignancies. This was especially true for certain subgroups: there was a significant (P = 0.014) interaction between age and treatment for the outcome secondary malignancies. The total incidence of secondary malignancies in patients aged 50 or younger who were treated with intensified protocols was significantly higher as compared with similar patients who had received standard dose regimens (P = 0.013, Peto OR: 2.11, CI 1.17 to 3.79). In contrast, the incidence of secondary malignancies in patients older than 50 years did not significantly differ between those treated with intensified and standard dose chemotherapy protocols (P = 0.44, Peto OR: 0.78, CI 0.41 to1.47). There was no significant interaction between gender and treatment , although there was a tendency towards a greater OR for females (1.86) than for males (1.06). For PFS there was a significant interaction (P = 0.008) between age and treatment; patients aged 50 or younger treated with intensified chemotherapy protocols had an improved PFS as compared to those treated with standard dose chemotherapy (P = 0.0003, HR: 0.72, CI 0.61 to 0.86) ). In patients aged 50 or younger, this advantage in PFS translated into a superior OS for patients who had treatment with intensified protocols (P = 0.020, HR: 0.74, CI 0.58 to 0.95) ‐ however, the interaction between age and treatment for OS was not quite significant (P = 0.08).
10.1. Analysis.

Comparison 10 subgroups intensified chemotherapy, Outcome 1 secondary malignant neoplasms.
10.2. Analysis.

Comparison 10 subgroups intensified chemotherapy, Outcome 2 overall survival.
10.3. Analysis.

Comparison 10 subgroups intensified chemotherapy, Outcome 3 progression‐free survival.
Median recruitment year ranged from 1995 to 2004, studies in the analysis section are ordered by this criterion. With the exception of GHSG HD9, there is a slight time trend for PFS and OS to increasing advantage of intensified chemotherapy.
Sensitivity analyses
For the primary outcome, secondary malignant neoplasms, sensitivity analyses were performed to test the robustness of the results. Firstly, non‐melanoma skin cancers were excluded in all trials with detailed information on cancer site and type. The results are summarised in Table 9. Between zero and 17 cases were excluded per study question, and there were only negligible changes in the results compared with the main analysis.
4. Sensitivity analysis: SMN, not counting non‐melanoma skin cancers.
| Comparison |
Excluded SMN (standard arm : experimental arm) |
OR | P value |
| Avoidance of RT (after CT) | 0 : 1 | 0.398 | 0.0054 |
| Smaller RT field (after CT) | 5 : 8 | 0.824 | 0.21 |
| Lower RT dose (after CT) | 1 : 4 | 0.976 | 0.90 |
| Fewer CT cycles | 3 : 0 | 0.967 | 0.87 |
| Intensified CT regimen | 0 : 0 | no change |
SMN = secondary malignant neoplasms
Secondly, follow‐up times were censored at the calendar time at which the completeness of the observations dropped below 75%. The results are summarised in Table 10, showing no relevant difference to the main analysis (the difference in SMN risk for the additional radiotherapy question is somewhat more pronounced; P = 0.0031, Peto OR 0.35).
5. Sensitivity analysis: SMN, censoring at date where study follow‐up becomes <75% complete.
| Comparison |
Numbers of censored SMN (standard arm : experimental arm) |
Peto odds ratio | P value |
| Avoidance of RT (after CT) | 4 : 3 | 0.348 | 0.0031 |
| Smaller RT field (after CT) | 37 : 39 | 0.842 | 0.38 |
| Lower RT dose (after CT) | 4 : 4 | 1.033 | 0.87 |
| Fewer CT cycles | 8 : 10 | 0.849 | 0.46 |
| Intensified CT regimen | 10 : 19 | 1.365 | 0.24 |
CT = chemotherapy; RT = radiotherapy
It was also intended to re‐analyse with the exclusion of confounded trials. However, in only one study question were any confounded trials included: GHSG HD3 for the comparison of chemotherapy alone with chemotherapy followed by additional radiotherapy. Therefore, we decided not to present this analysis (in fact, excluding GHSG HD3 did not change the Peto OR and the P value remained significant at 0.03).
Cumulative incidences of SMN in the presence of competing risks (death without SMN) were calculated and plotted for each study question and compared visually with the Peto incidence curves from the main analysis. In all cases, the cumulative incidence curves agreed closely with the Peto curves (to within +/‐ 1%). This was to be expected since the rates of the competing event are low. For each study question except SQ5, the cumulative incidences of SMN were closely similar to those of the competing event, death without SMN; for SQ5, the only comparison chiefly involving advanced‐stage patients, death without SMN was markedly more frequent than SMN.
For OS and PFS a sensitivity analysis with follow‐up times censored at the point where completeness of observations dropped below 75% was performed. The significant results of PFS both for the additional radiotherapy (HR: 1.77) and for the intensified CT regimen (HR: 0.733) questions were slightly more distinct (Table 11). The results for both survival parameters were comparable to the main analysis, showing no differences in OS for all study questions (Table 12).
6. Sensitivity analysis: PFS, censoring at date where study follow‐up becomes <75% complete.
| Comparison | Numbers of progressions (standard arm : experimental arm) | Hazard ratio | P value |
| Avoidance of RT (after CT) | 80 : 66 | 1.77 | 0.0006 |
| Smaller RT field (after CT) | 117 : 171 | 1.08 | 0.51 |
| Lower RT dose (after CT) | 127 : 147 | 1.2 | 0.14 |
| Fewer CT cycles | 114 : 107 | 0.94 | 0.62 |
| Intensified CT regimen | 281 : 276 | 0.74 | 0.0008 |
CT = chemotherapy
7. Sensitivity analysis: OS, censoring at date where study follow‐up becomes < 75% complete.
| Comparison |
Numbers of deaths (standard arm : experimental arm) |
Hazard ratio | P value |
| Avoidance of RT (after CT) | 32 : 22 | 0.84 | 0.54 |
| Smaller RT field (after CT) | 84 : 112 | 0.97 | 0.81 |
| Lower RT dose (after CT) | 53 : 51 | 1.01 | 0.96 |
| Fewer CT cycles | 63 : 68 | 1.09 | 0.64 |
| Intensified CT regimen | 141 : 161 | 0.83 | 0.12 |
CT = chemotherapy; OS = overall survival
Main results concerning SMN are summarised in Figure 8 and Figure 9, concerning OS and PFS in Figure 10.
8.
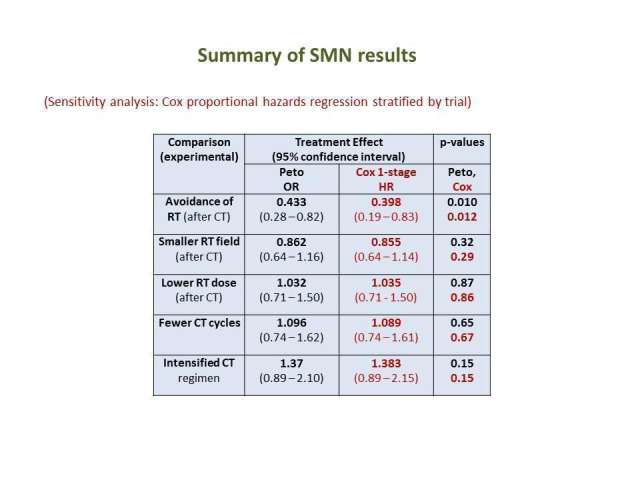
Table of main results for outcome SMN (OR odds ratio, HR hazard ratio, RT radiotherapy, CT chemotherapy)
9.

Table of results for each type of SMN (OR odds ratio, RT radiotherapy, CT chemotherapy)
10.

Table of main results for outcome OS and PFS (OR odds ratio, HR hazard ratio, RT radiotherapy, CT chemotherapy)
Discussion
Summary of main results
This meta‐analysis including a total of 9498 patients investigated and compared the risks for the development of secondary malignant neoplasms (SMN) after different first‐line treatment strategies for Hodgkin lymphoma (HL). At a median follow‐up ranging between 6.7 and 10.8 years depending on the study question, 4.6% of patients had developed an SMN.
Impact of different treatment strategies on SMN, progression‐free survival (PFS) and overall survival (OS) rates
SQ 1) Chemotherapy alone versus same chemotherapy plus radiotherapy
Patients receiving consolidating radiotherapy had a higher risk of developing SMN when compared with those receiving chemotherapy alone. This was particularly true for secondary acute myeloid leukaemia and myelodysplastic syndrome (AML/MDS). A significantly increased general risk for the development of secondary malignancies was only observed in patients with advanced disease receiving consolidating radiotherapy after chemotherapy while for early stages of HL (only one trial), the difference between these treatment groups did not reach significance.
Overall survival and PFS were not statistically significantly different in the two treatment groups.
SQ 2) Chemotherapy plus involved‐field radiation versus same chemotherapy plus extended‐field radiation
No overall effect on SMN could be detected due to confinement of radiation to the involved field.
Neither was any marked or statistically significant increase or decrease in risk of progression or risk of death observed.
SQ 3) Chemotherapy plus lower‐dose radiation versus same chemotherapy plus higher‐dose radiation
No overall effect on SMN could be detected due to reduced radiation dose.
Neither was any marked or statistically significant increase or decrease in risk of progression or risk of death observed.
SQ 4) Fewer versus more courses of chemotherapy
No overall effect on SMN could be detected due to use of fewer chemotherapy cycles.
Neither was any marked or statistically significant increase or decrease in risk of progression or risk of death observed.
SQ 5) Dose‐intensified chemotherapy versus ABVD‐like chemotherapy
Treatment with aggressive first‐line protocols such as escalated BEACOPP in advanced‐stage patients resulted in an increased secondary AML/MDS risk when compared with less intensive regimens.
However, this higher incidence of secondary AML/MDS has to be weighed against a significantly better PFS with intensified regimens and (in a subgroup analysis) a significantly better OS with the escalated BEACOPP regimen.
In addition, subgroup analyses showed a general increase in terms of SMN in patients aged 50 or younger who were treated with intensified chemotherapy regimens. This finding may in part be explained by the lower baseline incidence for malignancies in younger patients, leading to a larger treatment effect as measured by the OR. Furthermore, particularly in older patients intensified protocols are often not applied at full dose, possibly leading to a reduced potential for late effects.
Overall completeness and applicability of evidence
Individual patient data (IPD) were obtained from 16 of 21 eligible studies and these data represent 85% of eligible patients. Thus, the level of completeness is fairly high and markedly better than in our previous systematic review from 2006, where only around 63% of eligible patients could be included. This improvement is probably due to (a) the fact that we have restricted eligibility to trials employing 'modern' treatment strategies, so that most trials recruited more recently and were thus more likely to have access to the data, and (b) general improvements in data management and storage.
The published results of the four clinical trials that were not included in the present meta‐analysis due to non‐availability of IPD from the investigators do not contradict the meta‐analysed available IPD. However, the data on SMN reported in the analyses of these four trials do not allow valid conclusions. Hence, no SMN rates were reported in the final analysis of the trial conducted in India and randomly comparing six cycles of ABVD followed by radiotherapy (RT) with six cycles of ABVD alone (Tata_India). The same is true for the German study only published as an abstract by Gerhartz and colleagues evaluating the COPP/ABVD regimen at two different dose levels and different time density (Gerhartz_COPP‐ABVD). At three years, a total of three SMN were reported in the final analysis of the CCG‐5942 study conducted by the Children´s Cancer Group (CCG). Within that study, 498 paediatric and adolescent patients aged younger than 20 years were randomly assigned to either chemotherapy followed by involved field radiotherapy (IF‐RT) or chemotherapy alone (CCG‐5942). No additional SMNs were observed according to the long‐term analysis by Wolden and colleagues reporting trial outcomes at 10 years (Wolden 2012). Two SMNs (one case of t‐AML and one case of secondary non‐Hidgkin lymphoma (NHL)) occurred within the POG_8625 study conducted by the Children's Oncology Group (COG). Median observation was more than eight years. The study included a total of 159 children and adolescents aged 21 or younger who were randomised between four cycles of chemotherapy followed by IF‐RT or six cycles of chemotherapy alone (POG_8625).
In terms of tumour control and OS, no conclusive data were contained in the abstract on the study evaluating COPP/ABVD at two different doses and different dose density (Gerhartz_COPP‐ABVD). For the other three studies not included in the present meta‐analysis due to a lack of provided IPD, valid tumour control and OS results were reported in the published analyses. The Indian study published by Laskar and co‐workers (Tata_India) indicated significantly improved event‐free survival (EFS) and OS rates at eight years for patients receiving chemotherapy plus RT. This difference between patients treated with chemotherapy plus RT and patients treated with chemotherapy alone was particularly pronounced in stage III/IV disease, i.e. advanced stages. The analysis of the CCG‐5942 study also revealed improved EFS rates for patients receiving consolidating RT after chemotherapy. However, neither in the initial analysis at three years nor after extended follow‐up at 10 years did these increased EFS rates translate into an improved OS (CCG‐5942). In the POG 8625 study, EFS and OS rates of patients treated with chemotherapy alone and chemotherapy followed by RT, respectively, did not significantly differ at eight years (POG_8625).
One eligible study by Gordon and colleagues (ECOG_E2496) was not included in the meta‐analyses as it was first identified in March 2015. The publication states that (at median follow‐up 6.4 years) 15 and 19 second primary cancers were observed in the ABVD and Stanford V arms, respectively (AML/MDS: 1 versus 3; NHL 2 versus 3; ST 12 versus 13). Thus, the SMN results of this study agree qualitatively with our results. Failure‐free and overall survival rates were each closely similar in the two arms, in general agreement with our results for the Stanford V trials.
Although we do not know how many eligible studies were not found during our search or not correctly identified, we presume that the large, in general co‐operative trials which we sought will be ‐ almost without exception ‐ published in the mainstream journals or at least as conference abstracts at the main haematology/oncology meetings, which have complete and up‐to‐date records in the Cochrane CENTRAL database. Accessibility of publications has improved since the search for the previous review in 2000‐2002, and we could do without own handsearching efforts (which we performed in 2000‐2002 without revealing further eligible trials).
Therefore, we do not expect publication bias to be an issue in this review, especially as our main outcome, SMN, was not a primary endpoint of the included studies and is thus unlikely to influence whether or where a study is published.
Although not deliberately excluded, we were not able to include any paediatric trials in the review. Further, many randomised controlled trials (RCTs) have an upper age limit, which means that older patients (typically, over 70 years) are underrepresented in our review. Since the incidence of many types of malignant neoplasms in the general population differs greatly between children, young adults and the elderly, the effects of treatment choices on overall SMN rates may also differ critically. Thus, the results of this review cannot necessarily be generalised to paediatric or to older patients.
A particular limitation of our data concerns recent developments in irradiation fields and techniques. In particular, reduction of field volumes to the involved node and the currently recommended involved site radiotherapy technique may well lead to further reductions in SMN rates.
Quality of the evidence
Collection of IPD is expected to raise the evidence quality by ensuring up‐to‐date, detailed data, transparency concerning inclusion and exclusion of participants from the analysis, complete availability of all endpoints and, through contact with trials groups, less possibility of missing studies and the opportunity to clarify and query the data. Furthermore, we were able to examine follow‐up patterns and assess the completeness of follow‐up and thus the possibility of attrition bias. The included studies were, with one exception, properly randomised, although the randomisation method was unclear in five studies. Neither patients nor physicians were blinded, so there is a risk of performance and assessment bias, which however we consider to be less serious due to the limited scope for a patient to influence the course of disease and the relatively objective nature of the outcomes, especially OS. The major limitation to quality lies, in our opinion, in the possibility of attrition bias after the longer follow‐up needed for assessment of secondary malignancy risk, as well as the small numbers of SMN events.
Our main outcome of interest, SMN, is difficult to document accurately and completely for various reasons. The relevant events occur several years or even decades after first‐line treatment, necessitating long‐term follow‐up of patients. While these events are a recognised serious effect of treatment, which almost all study groups aim to assess, they were not the primary outcome of the trials. However, comparison with expected numbers of events calculated from rates observed in several large cohort studies showed that the rates observed in most of our included studies were consistent with expectations. The classification of the tumours may not always be reliable, since we did not specify any minimal diagnostic standards and follow‐up and diagnostic methods of most included trials were not reported in any detail. In summary, the quality of evidence on SMN is rated as 'low' or 'moderate' because, although the evidence is based on several well‐conducted and directly relevant RCTs, possible inaccuracies in documenting this outcome and the low number of events (leading to wide confidence intervals) reduce its reliability.
The remaining outcomes, overall and progression‐free survival, can be assumed to be documented accurately and free of bias. These are primary or important secondary endpoints of the trials and the numbers of events are adequate for precision. However, there is heterogeneity and/or a small number of studies, depending on the study question, so that the evidence from the review can be graded as 'moderate'.
Potential biases in the review process
As explained above, we expect to have identified all eligible studies. We used trial registers. Five of 21 eligible studies (and thus 15% of eligible patients) could not be included in the meta‐analysis because IPD were not supplied by the authors (in one case, the study was identified too late). This deficit represents a possible source of bias, since the results of the studies might influence the decision to provide or not provide data. However, it is considered that SMN results, for which no trial alone contributed enough events to demonstrate a treatment effect, would be very unlikely to influence this decision. But for OS or PFS a possible bias is not so implausible.
Agreements and disagreements with other studies or reviews
Secondary malignant neoplasms
With 4.6%, a lower proportion of patients than in other larger studies evaluating the incidence of SMN after first‐line treatment of HL developed a secondary haematological or solid tumour. For instance, a previous Cochrane meta‐analysis conducted by Franklin and colleagues including 9312 patients treated within randomised clinical trials for newly diagnosed HL between 1962 and 2000 and a large retrospective analysis from the UK including 5798 patients receiving treatment for HL between 1963 and 2001 reported SMN rates of 7.6% and 7.9%, respectively (Franklin 2006a; Swerdlow 2011). This difference between the present analysis and previous reports is probably due to two reasons. Firstly, the present study included patients treated between 1984 and 2007 and therefore had a shorter follow‐up than the previous Cochrane meta‐analysis and the analysis from the UK that both included patients who were treated over almost four decades. This limited follow‐up duration is important since it is known that at least a relevant proportion of secondary solid tumours occur more than 10 years after HL treatment (Dores 2002). These late SMN had not yet had time to develop in the patients included in the present meta‐analysis. Secondly, the treatment modalities used in the trials included in the present analysis probably exhibited a substantially lower risk for the development of SMN than the approaches used in the patients included in the previous analyses and treated in the 1960's and 1970's. For example, smaller radiation fields were shown to be associated with a significantly lower risk for the development of secondary breast cancer after treatment for HL as compared with more extended radiation fields such as mantle field that are outdated and no longer used (De Bruin 2009). In addition, some chemotherapeutics that were shown to be associated with an increased risk for the development of SMN are not contained in current standard protocols. Particularly the alkylating agent mechlorethamine which had been the part of the MOPP (mechlorethamine, vincristine, procarbazine, prednisone) protocol that previously had been widely used is no longer used as its use was shown to result in an unacceptably high rate of secondary AML/MDS. Among a total of 761 patients, the 15‐year secondary AML rate was 3.4% for patients treated with MOPP optionally followed by radiotherapy while only 0.7% of patients treated with ABVD (adriamycin, bleomycin, vinblastine, dacarbazine) optionally followed by radiotherapy developed secondary AML as reported by a group from France (Delwail 2002).
Secondary solid tumours were diagnosed in 2.91% of patients included in the present analysis. The most common secondary solid tumour was breast cancer followed by lung cancer, skin cancer and cancer of colon, sigmoid or rectum. Generally, this finding is comparable with the previous systematic review performed by our group in 2006. However, this previous analysis reported a higher overall incidence rate for secondary solid tumours of 5.3%. Additionally, the incidence of the secondary solid tumours according to the localisation slightly differed between the present and the previous analysis in which lung cancer represented the most often diagnosed secondary solid tumour followed by skin cancer, breast cancer and cancer of the small intestine, colon and rectum (Franklin 2006a). Lung cancer was the most common secondary solid tumour after HL treatment followed by colorectal cancer and breast cancer in a previous analysis from the German Hodgkin Study Group (GHSG) (Behringer 2004). However, as follow‐up of this GHSG study was rather short, a relevant proportion of secondary solid tumours had probably not yet occurred at the time of analysis.
In the present meta‐analysis, 0.91% of patients were diagnosed with secondary non‐Hodgkin lymphoma (NHL) after HL treatment. This is in line with the previous meta‐analysis from Franklin and colleagues from 2006 and a retrospective GHSG study from 2001 comprising 5406 patients treated within trials for newly diagnosed HL between 1981 and 1998 (Franklin 2006a; Rueffer 2001). In the previous meta‐analysis, 1.1% had developed secondary NHL. Among the patients included in the GHSG analysis, the incidence rate for secondary NHL was 0.9% at a median follow‐up of 46 months. A more recent retrospective analysis comprised 26,826 patients recorded in the SEER database who were treated for classical HL (cHL) between 1992 and 2009. Among these patients, the 15‐year cumulative incidence of secondary NHL was 2.5% (Xavier 2013). The differences regarding the incidence of secondary NHL after HL treatment between the different analyses are likely due to several factors. For instance, the duration of follow‐up substantially differed between the studies and some secondary NHL especially in the present analysis and the previous GHSG analysis likely have not yet been detected due to limited follow‐up as secondary NHL most often appear with a latency of five to 15 years. In addition, the reliability of the HL diagnosis in the patients taken into account for the present study and the GHSG analysis is probably higher than in the patients included in the report using the SEER database, as patients enrolled in the prospective trials considered for the present meta‐analysis and the GHSG analysis required a confirmation of the HL diagnosis by an expert pathologist, while in the SEER database some patients recorded as having HL may actually have already had NHL at initial diagnosis. However, in all the studies addressing the rate of secondary NHL after HL treatment including the present meta‐analysis, no association between certain treatment modalities and the occurrence of secondary NHL was detected.
Secondary AML/MDS represent particularly severe treatment‐associated late sequelae in HL survivors. Most cases occur within the first 10 years after HL treatment (Leone 2007). Within the present analysis, secondary AML/MDS were diagnosed in 0.66% of patients and were thus less common when compared with the previous Cochrane review on SMN after HL treatment (Franklin 2006a). In this former analysis, 1.0% of patients had been diagnosed with secondary AML/MDS in the course of follow‐up. Two recent analyses from the GSHG and the Stanford group reported secondary AML/MDS rates after HL treatment of 0.9% and 3.2%, respectively (Eichenauer 2014; Koontz 2013). These differences in terms of secondary AML/MDS incidences between the present analysis and the GHSG analysis on the one hand and the report from the Stanford group on the other hand may be explained by the different leukemogenic potential of the treatment approaches which the patients included in these three analyses had received. The study by the Stanford group included patients treated within prospective clinical studies between 1974 and 2003. The chemotherapy protocols applied between 1974 and 1989 included relevant doses of highly leukemogenic drugs such as the alkylating agents mechlorethamine, procarbazine and melphalan. These leukemogenic drugs were either omitted or given at reduced doses within the trial protocols used thereafter. Radiotherapy fields and doses were also continuously reduced over time. As a result, the rate of secondary AML/MDS in patients treated between 1989 and 2003 was substantially lower than in patients treated between 1974 and 1989 (1974‐1981: 5.7%; 1981‐1989: 5.2%; 1989‐2003: 0.3%). In contrast to the report from the Stanford group, the GHSG analysis included patients treated between 1993 and 2009. The majority of these patients were treated with ABVD‐based chemotherapy protocols followed by radiation to rather small fields that exhibit a lower risk for the development of secondary AML/MDS than the alkylator‐based chemotherapy protocols and the extended‐field radiotherapy that were used in the Stanford protocols applied between 1974 and 1989. However, a significantly increased risk for the development of secondary AML/MDS was seen for patients treated within GHSG trials who had received four or more cycles of escalated BEACOPP (bleomycin, etoposide, adriamycin, cyclophosphamide, vincristine, procarbazine, prednisone), an aggressive but highly effective regimen containing leukemogenic drugs such as the topoisomerase‐II‐inhibitor etoposide and the alkylating agents cyclophosphamide and procarbazine.
Effects of Interventions
The present results on SMN risk agree qualitatively with those of the previous Cochrane review (Franklin 2006a) for the two study questions common to both reviews (adjuvant radiotherapy; radiotherapy field), despite the fact that most trials from that earlier analysis were excluded from the present one and despite the major update in the follow‐up data. The remaining study questions had not been the subject of a previous meta‐analysis dealing with SMN.
SQ 1) Chemotherapy alone versus same chemotherapy plus radiotherapy
Generally, the results of the present meta‐analysis are in line with previous reports also indicating that the avoidance of radiotherapy results in a decreased rate of secondary malignancies (Swerdlow 2011). An older Italian case‐control study reported secondary AML/MDS rates of 2.8% for patients treated with chemotherapy alone and 5.4% for patients receiving combined‐modality treatment (Brusamolino 1998). As this analysis included patients receiving outdated MOPP chemotherapy, the absolute frequencies of secondary AML/MDS are not transferable to the present situation but the general finding still appears to hold true.
A previous Cochrane review (Herbst 2010) concluded that adjuvant radiation improves both tumour control and OS in early‐stage patients; in addition to the only early‐stage trial in the present analysis of this study question (EORTC H9‐F), this meta‐analysis included four trials with various chemotherapy regimens (ABVD, CVPP) with either involved or extended‐field irradiation (EF‐RT). A recent Canadian trial (Meyer 2012) showed improved long‐term OS, but reduced (short‐ and long‐term) PFS with chemotherapy alone in unfavourable early‐stage patients; however, this trial employed EF‐RT which may have led to a (compared to modern IF‐RT) higher rate of non‐HL deaths (such as SMNs) in the combined modality arm. Furthermore, the recent randomised EORTC/LYSA/FIL H10 study evaluated the possibility of a positron emission tomography (PET)‐guided omission of consolidating RT after chemotherapy in patients with early‐stage HL. The trial was closed prematurely after an interim analysis including 1137 patients revealed a significantly increased progression rate among patients who did not receive RT after chemotherapy (Raemaekers 2014).
SQ 5) Dose‐intensified chemotherapy versus ABVD‐like chemotherapy
The fact that intensified protocols are associated with an increased risk of secondary leukaemia has also been reported in previous analyses. For instance, the long‐term data of the GHSG HD9 trial reported a secondary AML rate of 3.0% for patients receiving eight cycles of escalated BEACOPP while only 0.4% of patients treated with COPP/ABVD developed a secondary AML (Engert 2009). Another retrospective GHSG analysis recently showed that patients who had four or more cycles of escalated BEACOPP have a higher risk of developing secondary AML than those treated with less than four cycles or no BEACOPP chemotherapy (Eichenauer 2014). A superior clinical outcome for patients diagnosed with advanced HL who were treated with escalated BEACOPP was shown in several randomised clinical trials as well as a recent network meta‐analysis (Skoetz 2013). While the network analysis and the GHSG HD9 trial (GHSG HD9, Engert 2009 ) demonstrated both an improved PFS and an improved OS, three others (MF‐GITIL‐IIL; GISL_HD2000; Mounier 2014) could only show a significantly superior PFS and a trend towards a superior OS for escalated BEACOPP when compared with ABVD.
Others SQs
Several retrospective studies have investigated the relationship between radiotherapy field and SMN risk but there have been few conclusive results (in our accompanying overview (additional tables) only Ng 2002 and De Bruin 2009 concluded a difference). In various case‐control studies, radiotherapy dose was found to correlate with risk of breast cancer (van Leeuwen 2003) and lung cancer (Travis 2002; van Leeuwen 1995), but this has not been confirmed in cohort studies. The effect of number of chemotherapy cycles on SMN risk has scarcely been investigated.
As recently completed and ongoing trials aim at reducing the rate of patients requiring radiotherapy after chemotherapy by using PET‐guided approaches, the rate of SMN will probably also be reduced in the future. For instance, the proportion of newly diagnosed advanced‐stage HL patients who underwent consolidating radiotherapy after intensive escalated BEACOPP chemotherapy could be reduced from 71% in the HD9 trial (1993‐1998) to 11% in the HD15 trial (2003‐2008) which was associated with a decrease in the secondary AML/MDS incidence from 2.5% among patients treated within the superior treatment arm within the HD9 study to 0.3% among patients treated with the current GHSG standard of care consisting of six cycles of escalated BEACOPP followed by localised radiotherapy to PET‐positive residual lymphoma larger than 2.5 cm within the HD15 study (GHSG HD9; Engert 2012).
Authors' conclusions
Implications for practice.
Given the increased risk of secondary acute myeloid leukaemia and myelodysplastic syndrome (AML/MDS) especially among patients aged 50 or younger treated with intensified chemotherapy protocols on the one hand but an improved efficacy with these regimens on the other hand, treatment decisions have to be tailored for the individual patients and the pros and cons of an aggressive treatment have to be well‐balanced.
The finding that there is an increased risk for the development of secondary malignancies among patients receiving consolidating radiotherapy after chemotherapy should not have immediate implications for the treatment of patients with Hodgkin's lymphoma (HL).
Given that the tumour control with chemotherapy alone is not sufficient in early‐stage HL, combined modality therapy in early‐stage HL appears to be indicated.
Implications for research.
The findings of the present meta‐analysis on secondary malignancies in HL patients underscore the need for novel treatment approaches that allow a treatment reduction for patients who are over‐treated and are thus unnecessarily at an increased risk for the development of secondary malignancies. However, before reduced‐intensity treatment can be applied in selected patients, valid methods for the identification of those who are sufficiently treated with less intensive approaches must be defined. At present, interim positron emission tomography (PET) represents the most promising tool to distinguish low‐risk from high‐risk HL patients. Treatment of low‐risk patients may consist of a reduced number of chemotherapy cycles. In addition, conventional chemotherapy may in part be replaced by novel targeted drugs exhibiting less toxicity and radiotherapy (RT) fields and doses may be decreased. Despite promising preliminary data that have recently become available, randomised studies have to confirm that such strategies are adequate for HL patients at a low risk for disease recurrence. High‐risk patients should receive aggressive standard treatment.
Meanwhile, it will be informative to update this meta‐analysis, at least with longer follow‐up of the same included trials, to allow accurate and conclusive comparison of the long‐term risks particularly of solid tumours. It is important that RCTs comparing treatment strategies in HL provide for long‐term follow‐up including reliable detection and documentation of serious late effects such as secondary malignant neoplasms.
Acknowledgements
We are grateful to the following people. Dr Nicole Skoetz, Andrea Will and other members of the Cochrane Haematological Malignancies Review Group for advice on Cochrane matters, organisation, grant application and revision of the review draft. The Bundesministerium für Bildung und Forschung (German Federal Ministry of Education and Research) supported the review financially.
Appendices
Appendix 1. MEDLINE search strategy (Jun 2010, Mar 2015 and Jul 2017)
| 1 | *Lymphoma/ |
| 2 | exp Hodgkin Disease/ |
| 3 | Germinoblastom$.tw,kf,ot. |
| 4 | Reticulolymphosarcom$.tw,kf,ot. |
| 5 | Hodgkin$.tw,kf,ot. |
| 6 | (malignan$ adj2 (lymphogranulom$ or granulom$)).tw,kf,ot. |
| 7 | or/1‐6 |
| 8 | randomized controlled trial.pt. |
| 9 | controlled clinical trial.pt. |
| 10 | randomized.ab. |
| 11 | placebo.ab. |
| 12 | clinical trials as topic.sh. |
| 13 | randomly.ab. |
| 14 | trial.ti. |
| 15 | or/8‐14 |
| 16 | humans.sh. |
| 17 | 15 and 16 |
| 18 | 7 and 17 |
| 19 | Limit 18 to ed=19840101‐20100201 |
Appendix 2. CENTRAL search strategy (Jun 2010, Mar 2015 and Jul 2017)
| #1 | MeSH descriptor Lymphoma explode all trees |
| #2 | MeSH descriptor Hodgkin Disease explode all trees |
| #3 | (germinoblastom*) |
| #4 | (reticulolymphosarcom*) |
| #5 | (Hodgkin*) |
| #6 | (malignan* near/2 lymphogranulom*) |
| #7 | (malignan* near/2 granulom*) |
| #8 | (#1 OR #2 OR #3 OR #4 OR #5 OR #6 OR #7) |
Data and analyses
Comparison 1. additional radiotherapy.
| Outcome or subgroup title | No. of studies | No. of participants | Statistical method | Effect size |
|---|---|---|---|---|
| 1 secondary malignant neoplasms | 3 | 1011 | Peto Odds Ratio (95% CI) | 0.43 [0.23, 0.82] |
| 1.1 advanced stages | 2 | 433 | Peto Odds Ratio (95% CI) | 0.41 [0.21, 0.81] |
| 1.2 early stages | 1 | 578 | Peto Odds Ratio (95% CI) | 0.67 [0.10, 4.40] |
| 2 overall survival | 3 | 1011 | Hazard Ratio (Fixed, 95% CI) | 0.71 [0.46, 1.11] |
| 2.1 advanced stages | 2 | 433 | Hazard Ratio (Fixed, 95% CI) | 0.64 [0.40, 1.02] |
| 2.2 early stages | 1 | 578 | Hazard Ratio (Fixed, 95% CI) | 1.97 [0.47, 8.22] |
| 3 progression‐free survival | 3 | 1011 | Hazard Ratio (Fixed, 95% CI) | 1.31 [0.99, 1.73] |
| 3.1 advanced stages | 2 | 433 | Hazard Ratio (Fixed, 95% CI) | 0.74 [0.51, 1.08] |
| 3.2 early stages | 1 | 578 | Hazard Ratio (Fixed, 95% CI) | 2.56 [1.70, 3.85] |
Comparison 2. radiotherapy field.
| Outcome or subgroup title | No. of studies | No. of participants | Statistical method | Effect size |
|---|---|---|---|---|
| 1 secondary malignant neoplasms | 4 | 2397 | Peto Odds Ratio (95% CI) | 0.86 [0.64, 1.16] |
| 2 overall survival | 4 | 2397 | Hazard Ratio (Fixed, 95% CI) | 0.89 [0.70, 1.12] |
| 3 progression‐free survival | 4 | 2397 | Hazard Ratio (Fixed, 95% CI) | 0.99 [0.81, 1.21] |
Comparison 3. radiotherapy dose.
| Outcome or subgroup title | No. of studies | No. of participants | Statistical method | Effect size |
|---|---|---|---|---|
| 1 secondary malignant neoplasms | 3 | 2962 | Peto Odds Ratio (95% CI) | 1.03 [0.71, 1.50] |
| 2 overall survival | 3 | 2962 | Hazard Ratio (Fixed, 95% CI) | 0.91 [0.65, 1.28] |
| 3 progression‐free survival | 3 | 2962 | Hazard Ratio (Fixed, 95% CI) | 1.20 [0.97, 1.48] |
Comparison 4. chemotherapy cycles.
| Outcome or subgroup title | No. of studies | No. of participants | Statistical method | Effect size |
|---|---|---|---|---|
| 1 secondary malignant neoplasms | 3 | 2403 | Peto Odds Ratio (95% CI) | 1.10 [0.74, 1.62] |
| 2 overall survival | 3 | 2403 | Hazard Ratio (Fixed, 95% CI) | 0.99 [0.73, 1.34] |
| 3 progression‐free survival | 3 | 2403 | Hazard Ratio (Fixed, 95% CI) | 1.15 [0.91, 1.45] |
Comparison 5. intensified chemotherapy.
| Outcome or subgroup title | No. of studies | No. of participants | Statistical method | Effect size |
|---|---|---|---|---|
| 1 secondary malignant neoplasms | 7 | 2996 | Peto Odds Ratio (95% CI) | 1.37 [0.89, 2.10] |
| 2 overall survival | 7 | 2996 | Hazard Ratio (Fixed, 95% CI) | 0.85 [0.70, 1.04] |
| 3 progression‐free survival | 7 | 2996 | Hazard Ratio (Fixed, 95% CI) | 0.82 [0.70, 0.95] |
Comparison 6. subgroups additional radiotherapy.
| Outcome or subgroup title | No. of studies | No. of participants | Statistical method | Effect size |
|---|---|---|---|---|
| 1 secondary malignant neoplasms | 3 | Peto Odds Ratio (95% CI) | Subtotals only | |
| 1.1 age≤50 | 3 | 931 | Peto Odds Ratio (95% CI) | 0.39 [0.16, 0.95] |
| 1.2 age>50 | 2 | 80 | Peto Odds Ratio (95% CI) | 0.55 [0.22, 1.41] |
| 1.3 female | 3 | 411 | Peto Odds Ratio (95% CI) | 0.25 [0.09, 0.74] |
| 1.4 male | 3 | 600 | Peto Odds Ratio (95% CI) | 0.60 [0.27, 1.34] |
| 2 overall survival | 3 | Hazard Ratio (Fixed, 95% CI) | Subtotals only | |
| 2.1 age≤50 | 3 | 930 | Hazard Ratio (Fixed, 95% CI) | 0.82 [0.48, 1.42] |
| 2.2 age>50 | 2 | 80 | Hazard Ratio (Fixed, 95% CI) | 0.62 [0.28, 1.38] |
| 2.3 female | 3 | 411 | Hazard Ratio (Fixed, 95% CI) | 0.48 [0.20, 1.18] |
| 2.4 male | 3 | 600 | Hazard Ratio (Fixed, 95% CI) | 0.88 [0.52, 1.49] |
| 3 progression‐free survival | 3 | Hazard Ratio (Fixed, 95% CI) | Subtotals only | |
| 3.1 age≤50 | 3 | 930 | Hazard Ratio (Fixed, 95% CI) | 1.55 [1.15, 2.10] |
| 3.2 age>50 | 2 | 80 | Hazard Ratio (Fixed, 95% CI) | 0.56 [0.25, 1.23] |
| 3.3 female | 3 | 411 | Hazard Ratio (Fixed, 95% CI) | 1.76 [1.08, 2.88] |
| 3.4 male | 3 | 600 | Hazard Ratio (Fixed, 95% CI) | 1.18 [0.83, 1.66] |
Comparison 7. subgroups radiotherapy field.
| Outcome or subgroup title | No. of studies | No. of participants | Statistical method | Effect size |
|---|---|---|---|---|
| 1 secondary malignant neoplasms | 4 | Peto Odds Ratio (95% CI) | Subtotals only | |
| 1.1 age≤50 | 4 | 2013 | Peto Odds Ratio (95% CI) | 0.84 [0.59, 1.21] |
| 1.2 age>50 | 4 | 384 | Peto Odds Ratio (95% CI) | 0.82 [0.48, 1.39] |
| 1.3 female | 4 | 1295 | Peto Odds Ratio (95% CI) | 1.03 [0.66, 1.59] |
| 1.4 male | 4 | 1102 | Peto Odds Ratio (95% CI) | 0.74 [0.50, 1.11] |
| 2 overall survival | 4 | Hazard Ratio (Fixed, 95% CI) | Subtotals only | |
| 2.1 age≤50 | 4 | 2013 | Hazard Ratio (Fixed, 95% CI) | 1.03 [0.76, 1.40] |
| 2.2 age>50 | 4 | 384 | Hazard Ratio (Fixed, 95% CI) | 0.69 [0.46, 1.01] |
| 2.3 female | 4 | 1295 | Hazard Ratio (Fixed, 95% CI) | 0.81 [0.54, 1.21] |
| 2.4 male | 4 | 1102 | Hazard Ratio (Fixed, 95% CI) | 0.98 [0.73, 1.32] |
| 3 progression‐free survival | 4 | Hazard Ratio (Fixed, 95% CI) | Subtotals only | |
| 3.1 age≤50 | 4 | 2013 | Hazard Ratio (Fixed, 95% CI) | 1.13 [0.88, 1.44] |
| 3.2 age>50 | 4 | 384 | Hazard Ratio (Fixed, 95% CI) | 0.69 [0.48, 1.00] |
| 3.3 female | 4 | 1295 | Hazard Ratio (Fixed, 95% CI) | 0.87 [0.63, 1.19] |
| 3.4 male | 4 | 1102 | Hazard Ratio (Fixed, 95% CI) | 1.09 [0.84, 1.42] |
Comparison 8. subgroups radiotherapy dose.
| Outcome or subgroup title | No. of studies | No. of participants | Statistical method | Effect size |
|---|---|---|---|---|
| 1 secondary malignant neoplasms | 3 | Peto Odds Ratio (95% CI) | Subtotals only | |
| 1.1 age≤50 | 3 | 2503 | Peto Odds Ratio (95% CI) | 0.97 [0.56, 1.69] |
| 1.2 age>50 | 2 | 459 | Peto Odds Ratio (95% CI) | 1.06 [0.63, 1.79] |
| 1.3 female | 3 | 1347 | Peto Odds Ratio (95% CI) | 0.84 [0.48, 1.48] |
| 1.4 male | 3 | 1615 | Peto Odds Ratio (95% CI) | 1.21 [0.73, 2.00] |
| 2 overall survival | 3 | Hazard Ratio (Fixed, 95% CI) | Subtotals only | |
| 2.1 age≤50 | 3 | 2503 | Hazard Ratio (Fixed, 95% CI) | 0.90 [0.56, 1.45] |
| 2.2 age>50 | 2 | 459 | Hazard Ratio (Fixed, 95% CI) | 0.88 [0.55, 1.41] |
| 2.3 female | 3 | 1347 | Hazard Ratio (Fixed, 95% CI) | 0.97 [0.56, 1.66] |
| 2.4 male | 3 | 1615 | Hazard Ratio (Fixed, 95% CI) | 0.90 [0.59, 1.38] |
| 3 progression‐free survival | 3 | Hazard Ratio (Fixed, 95% CI) | Subtotals only | |
| 3.1 age≤50 | 3 | 2503 | Hazard Ratio (Fixed, 95% CI) | 1.26 [0.99, 1.61] |
| 3.2 age>50 | 2 | 459 | Hazard Ratio (Fixed, 95% CI) | 0.99 [0.66, 1.49] |
| 3.3 female | 3 | 1347 | Hazard Ratio (Fixed, 95% CI) | 1.37 [0.98, 1.90] |
| 3.4 male | 3 | 1615 | Hazard Ratio (Fixed, 95% CI) | 1.11 [0.84, 1.46] |
Comparison 9. subgroups chemotherapy cycles.
| Outcome or subgroup title | No. of studies | No. of participants | Statistical method | Effect size |
|---|---|---|---|---|
| 1 secondary malignant neoplasms | 3 | Peto Odds Ratio (95% CI) | Subtotals only | |
| 1.1 age≤50 | 3 | 1897 | Peto Odds Ratio (95% CI) | 0.88 [0.51, 1.52] |
| 1.2 age>50 | 3 | 506 | Peto Odds Ratio (95% CI) | 1.44 [0.82, 2.54] |
| 1.3 female | 3 | 1117 | Peto Odds Ratio (95% CI) | 1.09 [0.61, 1.95] |
| 1.4 male | 3 | 1286 | Peto Odds Ratio (95% CI) | 1.09 [0.64, 1.86] |
| 2 overall survival | 3 | Hazard Ratio (Fixed, 95% CI) | Subtotals only | |
| 2.1 age≤50 | 3 | 1897 | Hazard Ratio (Fixed, 95% CI) | 0.94 [0.62, 1.44] |
| 2.2 age>50 | 3 | 506 | Hazard Ratio (Fixed, 95% CI) | 1.07 [0.68, 1.68] |
| 2.3 female | 3 | 1117 | Hazard Ratio (Fixed, 95% CI) | 0.86 [0.53, 1.40] |
| 2.4 male | 3 | 1286 | Hazard Ratio (Fixed, 95% CI) | 1.07 [0.72, 1.59] |
| 3 progression‐free survival | 3 | Hazard Ratio (Fixed, 95% CI) | Subtotals only | |
| 3.1 age≤50 | 3 | 1897 | Hazard Ratio (Fixed, 95% CI) | 1.19 [0.90, 1.59] |
| 3.2 age>50 | 3 | 506 | Hazard Ratio (Fixed, 95% CI) | 1.10 [0.74, 1.63] |
| 3.3 female | 3 | 1117 | Hazard Ratio (Fixed, 95% CI) | 1.12 [0.78, 1.61] |
| 3.4 male | 3 | 1286 | Hazard Ratio (Fixed, 95% CI) | 1.17 [0.87, 1.59] |
Comparison 10. subgroups intensified chemotherapy.
| Outcome or subgroup title | No. of studies | No. of participants | Statistical method | Effect size |
|---|---|---|---|---|
| 1 secondary malignant neoplasms | 7 | Peto Odds Ratio (95% CI) | Subtotals only | |
| 1.1 age≤50 | 7 | 2499 | Peto Odds Ratio (95% CI) | 2.11 [1.17, 3.79] |
| 1.2 age>50 | 7 | 497 | Peto Odds Ratio (95% CI) | 0.78 [0.41, 1.47] |
| 1.3 female | 7 | 1252 | Peto Odds Ratio (95% CI) | 1.86 [0.97, 3.58] |
| 1.4 male | 7 | 1744 | Peto Odds Ratio (95% CI) | 1.06 [0.60, 1.87] |
| 1.5 BEACOPP | 3 | 1255 | Peto Odds Ratio (95% CI) | 1.06 [0.60, 1.88] |
| 1.6 Stanford | 2 | 749 | Peto Odds Ratio (95% CI) | 0.90 [0.27, 2.95] |
| 1.7 EBVCAD | 2 | 425 | Peto Odds Ratio (95% CI) | 6.03 [1.71, 21.30] |
| 1.8 CHlVPP | 2 | 788 | Peto Odds Ratio (95% CI) | 2.14 [0.87, 5.29] |
| 2 overall survival | 7 | Hazard Ratio (Fixed, 95% CI) | Subtotals only | |
| 2.1 age≤50 | 7 | 2499 | Hazard Ratio (Fixed, 95% CI) | 0.74 [0.58, 0.95] |
| 2.2 age>50 | 7 | 497 | Hazard Ratio (Fixed, 95% CI) | 1.08 [0.78, 1.50] |
| 2.3 female | 7 | 1252 | Hazard Ratio (Fixed, 95% CI) | 0.78 [0.56, 1.07] |
| 2.4 male | 7 | 1744 | Hazard Ratio (Fixed, 95% CI) | 0.88 [0.68, 1.14] |
| 2.5 BEACOPP | 3 | 1255 | Hazard Ratio (Fixed, 95% CI) | 0.58 [0.43, 0.79] |
| 2.6 Stanford | 2 | 749 | Hazard Ratio (Fixed, 95% CI) | 1.11 [0.72, 1.71] |
| 2.7 EBVCAD | 2 | 425 | Hazard Ratio (Fixed, 95% CI) | 1.10 [0.62, 1.97] |
| 2.8 CHlVPP | 2 | 788 | Hazard Ratio (Fixed, 95% CI) | 1.23 [0.87, 1.75] |
| 3 progression‐free survival | 7 | Hazard Ratio (Fixed, 95% CI) | Subtotals only | |
| 3.1 age≤50 | 7 | 2499 | Hazard Ratio (Fixed, 95% CI) | 0.72 [0.61, 0.86] |
| 3.2 age>50 | 7 | 497 | Hazard Ratio (Fixed, 95% CI) | 1.15 [0.86, 1.55] |
| 3.3 female | 7 | 1252 | Hazard Ratio (Fixed, 95% CI) | 0.75 [0.60, 0.96] |
| 3.4 male | 7 | 1744 | Hazard Ratio (Fixed, 95% CI) | 0.85 [0.70, 1.02] |
| 3.5 BEACOPP | 3 | 1255 | Hazard Ratio (Fixed, 95% CI) | 0.47 [0.37, 0.60] |
| 3.6 Stanford | 2 | 749 | Hazard Ratio (Fixed, 95% CI) | 1.46 [1.09, 1.96] |
| 3.7 EBVCAD | 2 | 425 | Hazard Ratio (Fixed, 95% CI) | 0.96 [0.61, 1.49] |
| 3.8 CHlVPP | 2 | 788 | Hazard Ratio (Fixed, 95% CI) | 1.03 [0.79, 1.34] |
Characteristics of studies
Characteristics of included studies [ordered by study ID]
CCG‐5942.
| Methods | Late randomisation at CR after chemotherapy Recruited 1995 to 1998 |
|
| Participants | Sites: not given Stage: I, II, III, IV Age: under 21 |
|
| Interventions | (4 to 6 COPP/ABVD or 2 intensive multidrug chemotherapy) versus (4 to 6 COPP/ABVD or 2 intensive multidrug chemotherapy + IF.RT), choice of chemotherapy depending on stage | |
| Outcomes | Event‐free survival, OS, SMN | |
| Study Question | Chemotherapy alone or plus radiotherapy (SQ1) | |
| Median Year of Recruitment | ||
| Numbers of participants randomised (analysed) per arm | 250 (250) versus 251 (251) | |
| Notes | ||
| Risk of bias | ||
| Bias | Authors' judgement | Support for judgement |
| Random sequence generation (selection bias) | Unclear risk | Not reported. |
| Allocation concealment (selection bias) | Unclear risk | Patients were allocated "in a randomized fashion" |
| Blinding (performance bias and detection bias) All outcomes | High risk | No blinding of patients or treating physicians. |
| Blinding of outcome assessment (detection bias) OS | Low risk | We assume that death is objectively and completely reported. |
| Blinding of outcome assessment (detection bias) PFS, SM | High risk | These events may not be absolutely objectively and completely reported. |
| Incomplete outcome data (attrition bias) All outcomes | Low risk | No dropouts reported. |
| Other bias | Low risk | None found. |
ECOG_E2496.
| Methods | Randomised Recruited 1999 to 2006 |
|
| Participants | Multicentre US intergroup (ECOG, CALG‐B, Canadain NCIC); bulky mediastinal disease or advanced stage | |
| Interventions | 6 to 8 cycles ABVD + RT (bulky mediastinal only) versus Stanford V + RT (all bulky disease) | |
| Outcomes | SMN, OS, Failure‐free survival | |
| Study Question | Intensified CT (SQ5) | |
| Median Year of Recruitment | ||
| Numbers of participants randomised (analysed) per arm | 428 (395) versus 426 (399) | |
| Notes | Study not found in 2010 search; results summarised in review text but not included in meta‐analysis. | |
| Risk of bias | ||
| Bias | Authors' judgement | Support for judgement |
| Random sequence generation (selection bias) | Unclear risk | Randomised with two stratification factors (IPS: 0‐2 vs 3‐7; locally extensive vs advanced‐stage disease); method not stated. |
| Allocation concealment (selection bias) | Unclear risk | Method not stated. |
| Blinding (performance bias and detection bias) All outcomes | High risk | No blinding of patients or treating physicians. |
| Blinding of outcome assessment (detection bias) OS | Low risk | We assume that death is objectively and completely reported. |
| Blinding of outcome assessment (detection bias) PFS, SM | High risk | These events may not be absolutely objectively and completely reported. |
| Incomplete outcome data (attrition bias) All outcomes | High risk | 60 patients excluded after randomisation due to pathology review (21) or other ineligibility. |
| Other bias | Low risk | None found. |
EORTC #20884.
| Methods | Late randomisation at CR after 4 to 6 cycles Recruited 1989 to 2000 |
|
| Participants | Sites: multi‐centre Europe (EORTC: B, D, E, F, I, NL, PL, PT) Stage: III to IV Age: 15 to 70 |
|
| Interventions | Pts. attaining CR: (6 to 8 cycles MOPP/ABV) versus (6 to 8 cycles MOPP/ABV + IF.RT) | |
| Outcomes | SMN, OS, PFS | |
| Study Question | Chemotherapy alone or plus radiotherapy (SQ1) | |
| Median Year of Recruitment | 1994 | |
| Numbers of participants randomised (analysed) per arm | 161 (161) versus 172 (172) | |
| Notes | ||
| Risk of bias | ||
| Bias | Authors' judgement | Support for judgement |
| Random sequence generation (selection bias) | Low risk | Minimisation method. |
| Allocation concealment (selection bias) | Low risk | "...randomization performed at the Department of Biostatistics and Epidemiology....Treatment assignments were provided by telephone or fax machine." |
| Blinding (performance bias and detection bias) All outcomes | High risk | No blinding of patients or treating physicians. |
| Blinding of outcome assessment (detection bias) OS | Low risk | We assume that death is objectively and completely reported. |
| Blinding of outcome assessment (detection bias) PFS, SM | High risk | These events may not be absolutely objectively and completely reported. |
| Incomplete outcome data (attrition bias) All outcomes | Low risk | "...the diagnosis of HL was...excluded in 20 (patients)... These patients were equally distributed among the five subgroups of patients." Unclear how or whether those patients are included in the analyses. |
| Other bias | Low risk | None found. |
EORTC H8‐U.
| Methods | Randomisation to 3 groups Recruited 1993 to 1999 |
|
| Participants | Sites: multi‐centre Europe (EORTC and GELA: B, E, F, I, NL, PL, PT, SLO) Stage: I and II supradiaphragmatic unfavourable Age: 15 to 70 |
|
| Interventions | (6 MOPP/ABV + IF.RT) versus (4 MOPP/ABV + IF.RT) versus (4 MOPP/ABV + TNI) | |
| Outcomes | SMN, OS, PFS | |
| Study Question | RT field (SQ2); number of CT cycles (SQ4) | |
| Median Year of Recruitment | 1996 | |
| Numbers of participants randomised (analysed) per arm | 336 (329) versus 333 (331) versus 327 (324) | |
| Notes | Each study question used data from 2 of the 3 treatment groups | |
| Risk of bias | ||
| Bias | Authors' judgement | Support for judgement |
| Random sequence generation (selection bias) | Low risk | Block randomisation, stratified by centre. |
| Allocation concealment (selection bias) | Low risk | "central randomization by Clinical Research Unit" |
| Blinding (performance bias and detection bias) All outcomes | High risk | No blinding of patients or treating physicians. |
| Blinding of outcome assessment (detection bias) OS | Low risk | We assume that death is objectively and completely reported. |
| Blinding of outcome assessment (detection bias) PFS, SM | High risk | These events may not be absolutely objectively and completely reported. |
| Incomplete outcome data (attrition bias) All outcomes | Low risk | Few outcomes of restaging at end of chemotherapy and end of treatment are missing in all 3 study groups. No explanation given. |
| Other bias | Low risk | None found. |
EORTC H9‐F.
| Methods | Randomisation to 3 groups Recruited 1998 to 2004 |
|
| Participants | Sites: multi‐centre Europe (EORTC and GELA) Stage: I and II supradiaphragmatic favourable |
|
| Interventions | (6 EBVP + IF.RT 36 Gy) versus (6 EBVP + IF.RT 20 Gy) versus (6 EBVP) | |
| Outcomes | SMN, OS, PFS | |
| Study Question | Chemotherapy alone or plus radiotherapy (SQ1); RT dose (SQ3) | |
| Median Year of Recruitment | 2001 | |
| Numbers of participants randomised (analysed) per arm | 239 (239) versus 209 (209) versus 130 (130) | |
| Notes | Early termination of no‐RT group in 2002 due to stopping rules (poor results). SQ1 used data from all groups; SQ3 used data from the first 2 groups. |
|
| Risk of bias | ||
| Bias | Authors' judgement | Support for judgement |
| Random sequence generation (selection bias) | Unclear risk | No information. |
| Allocation concealment (selection bias) | Unclear risk | No information. Other studies with central randomisation by clinical research unit. |
| Blinding (performance bias and detection bias) All outcomes | High risk | No blinding of patients or treating physicians. |
| Blinding of outcome assessment (detection bias) OS | Low risk | We assume that death is objectively and completely reported. |
| Blinding of outcome assessment (detection bias) PFS, SM | High risk | These events may not be absolutely objectively and completely reported. |
| Incomplete outcome data (attrition bias) All outcomes | Low risk | Data complete. |
| Other bias | Low risk | None found. |
EORTC H9‐U.
| Methods | Randomisation to 3 groups Recruited 1998 to 2002 |
|
| Participants | Sites: multi‐centre Europe (EORTC and GELA) Stage: I and II supradiaphragmatic unfavourable |
|
| Interventions | (6 ABVD + IF.RT) versus (4 ABVD + IF.RT) versus (4 BEACOPP baseline + IF.RT) | |
| Outcomes | SMN, OS, PFS | |
| Study Question | Number of CT cycles (SQ4) | |
| Median Year of Recruitment | 2000 | |
| Numbers of participants randomised (analysed) per arm | 276 (276) versus 277 (277) versus 255 (‐) | |
| Notes | Used data from first 2 groups only (unconfounded) | |
| Risk of bias | ||
| Bias | Authors' judgement | Support for judgement |
| Random sequence generation (selection bias) | Unclear risk | No information. |
| Allocation concealment (selection bias) | Unclear risk | No information. Other studies with central randomisation by clinical research unit. |
| Blinding (performance bias and detection bias) All outcomes | High risk | No blinding of patients or treating physicians. |
| Blinding of outcome assessment (detection bias) OS | Low risk | we assume that death is objectively and completely reported. |
| Blinding of outcome assessment (detection bias) PFS, SM | High risk | These events may not be absolutely objectively and completely reported. |
| Incomplete outcome data (attrition bias) All outcomes | Low risk | Data complete. |
| Other bias | Low risk | None found. |
Gerhartz_COPP‐ABVD.
| Methods | Randomisation to 2 groups Recruited 1992 to 1996 |
|
| Participants | Sites: 28 sites in Germany Stage: advanced stage, IIB‐IV |
|
| Interventions | (4 double cycles standard COPP/ABVD) vs. (dose‐ and time‐intensified COPP/ABVD with growth‐factor support) | |
| Outcomes | Response rate, survival (unspecified) | |
| Study Question | Intensified CT (SQ5) | |
| Median Year of Recruitment | ||
| Numbers of participants randomised (analysed) per arm | 264 (238) in total (numbers per arm not available), 119 vs. 119 | |
| Notes | ||
| Risk of bias | ||
| Bias | Authors' judgement | Support for judgement |
| Random sequence generation (selection bias) | Unclear risk | Patients were randomised, no further information given. |
| Allocation concealment (selection bias) | Unclear risk | Patients were randomised, no further information given. |
| Blinding (performance bias and detection bias) All outcomes | High risk | No blinding of patients or treating physicians. |
| Blinding of outcome assessment (detection bias) OS | Unclear risk | OS not given. |
| Blinding of outcome assessment (detection bias) PFS, SM | High risk | These events may not be absolutely objectively and completely reported |
| Incomplete outcome data (attrition bias) All outcomes | High risk | Preliminary data were published with response rates only. 238 of 264 included patients were evaluable, reasons not given. |
| Other bias | Low risk | None found. |
GHSG HD10.
| Methods | Randomisation to 4 groups (2 x 2 factorial) Recruited 1998 to 2003 |
|
| Participants | Sites: multi‐centre (GHSG: mainly Germany) Stage: I and II favourable Age: 16 to 75 |
|
| Interventions | (4 ABVD + IF.RT 30 Gy) versus (4 ABVD + IF.RT 20 Gy) versus (2 ABVD + IF.RT 30 Gy) versus (2 ABVD + IF.RT 20 Gy) | |
| Outcomes | SMN, OS, PFS | |
| Study Question | RT dose (SQ3); number of CT cycles (SQ4) | |
| Median Year of Recruitment | 2000 | |
| Numbers of participants randomised (analysed) per arm | 346 (298) versus 340 (298) versus 341 (295) versus 343 (299) | |
| Notes | Each study question used data from all 4 treatment groups (2 versus 2). Exclusions from analysis due to wrong initial staging (133), HL not centrally confirmed (30) or other exclusion criteria (17) as described in GHSG HD10. |
|
| Risk of bias | ||
| Bias | Authors' judgement | Support for judgement |
| Random sequence generation (selection bias) | Low risk | Stratified randomisation using minimisation (site, age, B‐symptoms, infradiaphragmatic disease, albumin). |
| Allocation concealment (selection bias) | Low risk | Central randomisation by phone. |
| Blinding (performance bias and detection bias) All outcomes | High risk | No blinding of patients or treating physicians. |
| Blinding of outcome assessment (detection bias) OS | Low risk | We assume that death is objectively and completely reported. |
| Blinding of outcome assessment (detection bias) PFS, SM | High risk | These events may not be absolutely objectively and completely reported. |
| Incomplete outcome data (attrition bias) All outcomes | Low risk | Data complete. |
| Other bias | Low risk | None found. |
GHSG HD11.
| Methods | Randomisation to 4 groups (2 x 2 factorial) Recruited 1998 to 2002 |
|
| Participants | Sites: multi‐centre (GHSG: mainly Germany) Stage: I and II favourable Age: 16 to 75 |
|
| Interventions | (4 ABVD + IF.RT 30 Gy) versus (4 ABVD + IF.RT 20 Gy) versus (4 BEACOPP baseline + IF.RT 30 Gy) versus (4 BEACOPP baseline + IF.RT 20 Gy) | |
| Outcomes | SMN, OS, PFS | |
| Study Question | RT dose (SQ3) | |
| Median Year of Recruitment | 2000 | |
| Numbers of participants randomised (analysed) per arm | 386 (343) versus 395 (339) versus 394 (332) versus 395 (337) | |
| Notes | Uses data from all 4 treatment groups (2 versus 2) Exclusions from analysis due to wrong initial staging (134), HL not centrally confirmed (19), other exclusion criteria (12) or dropout before starting RT (44) as described in GHSG HD11 |
|
| Risk of bias | ||
| Bias | Authors' judgement | Support for judgement |
| Random sequence generation (selection bias) | Low risk | Minimisation method. |
| Allocation concealment (selection bias) | Low risk | Central randomisation by phone. |
| Blinding (performance bias and detection bias) All outcomes | High risk | No blinding of patients or treating physicians. |
| Blinding of outcome assessment (detection bias) OS | Low risk | We assume that death is objectively and completely reported. |
| Blinding of outcome assessment (detection bias) PFS, SM | High risk | These events may not be absolutely objectively and completely reported. |
| Incomplete outcome data (attrition bias) All outcomes | Low risk | Data complete. |
| Other bias | Low risk | None found. |
GHSG HD3.
| Methods | Late randomisation at CR after 6 cycles CT to further CT or RT Recruited 1984 to 88 |
|
| Participants | Sites: multi‐centre (GHSG: mainly Germany) Stage: IIIB and IV Age: 15 to 60 |
|
| Interventions | (6 COPP/ABVD + IF.RT) versus (8 COPP/ABVD) | |
| Outcomes | SMN, OS, PFS | |
| Study Question | Chemotherapy alone or plus radiotherapy (SQ1) | |
| Median Year of Recruitment | 1985 | |
| Numbers of participants randomised (analysed) per arm | 51 (51) versus 49 (49) | |
| Notes | Confounded | |
| Risk of bias | ||
| Bias | Authors' judgement | Support for judgement |
| Random sequence generation (selection bias) | Low risk | Stratified block randomisation. |
| Allocation concealment (selection bias) | Low risk | Central randomisation by phone. |
| Blinding (performance bias and detection bias) All outcomes | High risk | No blinding of patients or treating physicians. |
| Blinding of outcome assessment (detection bias) OS | Low risk | We assume that death is objectively and completely reported. |
| Blinding of outcome assessment (detection bias) PFS, SM | High risk | These events may not be absolutely objectively and completely reported. |
| Incomplete outcome data (attrition bias) All outcomes | Low risk | Data complete. |
| Other bias | Low risk | None found. |
GHSG HD8.
| Methods | Randomisation (at initial staging); analysis set for RT comparison restricted to Pts. starting RT. Recruited 1993 to 1998 |
|
| Participants | Sites: multi‐centre (GHSG: mainly Germany) Stage: I and II unfavourable Age: 15 to 75 |
|
| Interventions | (4 COPP/ABVD + EF.RT) versus (4 COPP/ABVD + IF.RT) | |
| Outcomes | SMN, OS, PFS | |
| Study Question | RT field (SQ2) | |
| Median Year of Recruitment | 1996 | |
| Numbers of participants randomised (analysed) per arm | 602 (532) versus 602 (532) | |
| Notes | Exclusions from analysis due to wrong initial staging (33), HL not centrally confirmed (25), other exclusion criteria (10) or dropout before starting RT (72) as described in GHSG HD8 | |
| Risk of bias | ||
| Bias | Authors' judgement | Support for judgement |
| Random sequence generation (selection bias) | Low risk | "..using a computerised random number generator", minimisation |
| Allocation concealment (selection bias) | Low risk | Central randomisation by phone. |
| Blinding (performance bias and detection bias) All outcomes | High risk | No blinding of patients or treating physicians. |
| Blinding of outcome assessment (detection bias) OS | Low risk | We assume that death is objectively and completely reported. |
| Blinding of outcome assessment (detection bias) PFS, SM | High risk | These events may not be absolutely objectively and completely reported. |
| Incomplete outcome data (attrition bias) All outcomes | Low risk | Data complete. |
| Other bias | Low risk | None found. |
GHSG HD9.
| Methods | Randomisation to 3 groups Recruited 1993 to 1998 |
|
| Participants | Sites: multi‐centre (GHSG: mainly Germany) Stage: I and II unfavourable Age: 15 to 65 |
|
| Interventions | (8 COPP/ABVD +/‐ local RT) versus (8 BEACOPP baseline +/‐ local RT) versus (8 BEACOPP escalated +/‐ local RT) | |
| Outcomes | SMN, OS, PFS | |
| Study Question | Intensified CT (SQ5) | |
| Median Year of Recruitment | 1995 | |
| Numbers of participants randomised (analysed) per arm | 288 (261) versus 496 (466) | |
| Notes | Used data from all 3 groups: (COPP/ABVD and BEACOPP baseline) versus BEACOPP escalated. Exclusions from analysis due to HL not centrally confirmed (27), other exclusion criteria (26) or loss to follow‐up (4) as described in GHSG HD9 and Engert 2009 |
|
| Risk of bias | ||
| Bias | Authors' judgement | Support for judgement |
| Random sequence generation (selection bias) | Low risk | Minimisation; randomisation probabilities repeatedly adjusted because of changing circumstances: 3. group started 1 year later because of completion of the dose‐finding‐study for medication, 1. group stopped because of inferiority after planned interim analysis. |
| Allocation concealment (selection bias) | Low risk | Central randomisation by phone and computer. |
| Blinding (performance bias and detection bias) All outcomes | High risk | No blinding of patients or treating physicians. |
| Blinding of outcome assessment (detection bias) OS | Low risk | We assume that death is objectively and completely reported. |
| Blinding of outcome assessment (detection bias) PFS, SM | High risk | These events may not be absolutely objectively and completely reported. |
| Incomplete outcome data (attrition bias) All outcomes | Low risk | Data complete. |
| Other bias | Low risk | None found. |
GISL_HD2000.
| Methods | Randomisation to 3 groups Recruited 2000 to 2007 |
|
| Participants | Sites: multi‐centre (Gruppo Italiano per la Studio dei Linfomi, Italy) Stage: IIB to IV Age: older than 16 |
|
| Interventions | (6 ABVD + local RT) versus (4 escalated + 2 baseline BEACOPP + local RT) versus (6 CEC + local RT) | |
| Outcomes | SMN, OS, PFS | |
| Study Question | Intensified CT (SQ5) | |
| Median Year of Recruitment | 2003 | |
| Numbers of participants randomised (analysed) per arm | 103 (99) versus 204 (196) | |
| Notes | Used data from all 3 groups: ABVD versus (BEACOPP and CEC). Exclusions from analysis due to revised histology (1), withdrawn consent (1) or missing data (10) as described in GISL_HD2000 |
|
| Risk of bias | ||
| Bias | Authors' judgement | Support for judgement |
| Random sequence generation (selection bias) | Unclear risk | "Randomization was stratified..." |
| Allocation concealment (selection bias) | Unclear risk | "Randomization was stratified..." |
| Blinding (performance bias and detection bias) All outcomes | High risk | No blinding of patients or treating physicians. |
| Blinding of outcome assessment (detection bias) OS | Low risk | We assume that death is objectively and completely reported. |
| Blinding of outcome assessment (detection bias) PFS, SM | High risk | These events may not be absolutely objectively and completely reported. |
| Incomplete outcome data (attrition bias) All outcomes | Low risk | Data complete. |
| Other bias | Low risk | None found. |
IIL_HD9601.
| Methods | Randomisation to 3 groups Recruited 1996 to 2000 |
|
| Participants | Sites: multi‐centre (Intergruppo Italiano Linfomi, Italy) Stage: IIB to IV Age: 15 to 65 |
|
| Interventions | (6 ABVD + local RT) versus (Stanford V + local RT) versus (6 MEC + local RT) | |
| Outcomes | SMN, OS, PFS | |
| Study Question | Intensified CT (SQ5) | |
| Median Year of Recruitment | 1998 | |
| Numbers of participants randomised (analysed) per arm | 126 (122) versus 228 (213) | |
| Notes | Used data from all 3 groups: ABVD versus (Stanford V and MEC) Exclusions from analysis due to withdrawn consent (7), emigration (1) or missing data (11) as described in IIL_HD9601 |
|
| Risk of bias | ||
| Bias | Authors' judgement | Support for judgement |
| Random sequence generation (selection bias) | Low risk | Randomisation by centrally managed lists. |
| Allocation concealment (selection bias) | Low risk | Central randomisation by phone. |
| Blinding (performance bias and detection bias) All outcomes | High risk | No blinding of patients or treating physicians. |
| Blinding of outcome assessment (detection bias) OS | Low risk | We assume that death is objectively and completely reported. |
| Blinding of outcome assessment (detection bias) PFS, SM | High risk | These events may not be absolutely objectively and completely reported. |
| Incomplete outcome data (attrition bias) All outcomes | Low risk | 19 patients reported without data after randomisation not in database. Otherwise data complete. |
| Other bias | Low risk | None found. |
MF‐GITIL‐IIL.
| Methods | Randomised Recruited 2000 to 2007 |
|
| Participants | Sites: multi‐centre (Italy, 3 cooperative groups) Stage: IIB to IV Age: 17 to 60 |
|
| Interventions | (6 to 8 ABVD +/‐ local RT) versus (4 escalated + 4 baseline BEACOPP + local RT) | |
| Outcomes | SMN, OS, PFS | |
| Study Question | Intensified CT (SQ5) | |
| Median Year of Recruitment | 2004 | |
| Numbers of participants randomised (analysed) per arm | 168 (168) versus 163 (163) | |
| Notes | ||
| Risk of bias | ||
| Bias | Authors' judgement | Support for judgement |
| Random sequence generation (selection bias) | Unclear risk | "stratified and randomised", method not stated. |
| Allocation concealment (selection bias) | Unclear risk | "stratified and randomised", method not stated. |
| Blinding (performance bias and detection bias) All outcomes | High risk | No blinding of patients or treating physicians. |
| Blinding of outcome assessment (detection bias) OS | Low risk | We assume that death is objectively and completely reported. |
| Blinding of outcome assessment (detection bias) PFS, SM | High risk | These events may not be absolutely objectively and completely reported. |
| Incomplete outcome data (attrition bias) All outcomes | Low risk | Data complete. |
| Other bias | Low risk | None found. |
Milano_STNI_IF.
| Methods | Randomised Recruited 1990 to 1996 |
|
| Participants | Sites: Milan, Italy Stage: I and IIA Age: 16 to 70 |
|
| Interventions | (4 ABVD + STNI) versus (4 ABVD + IF.RT) | |
| Outcomes | SMN, OS, PFS | |
| Study Question | RT field (SQ2) | |
| Median Year of Recruitment | 1992 | |
| Numbers of participants randomised (analysed) per arm | 68 (68) versus 72 (72) | |
| Notes | ||
| Risk of bias | ||
| Bias | Authors' judgement | Support for judgement |
| Random sequence generation (selection bias) | Unclear risk | "randomized study" with stratification |
| Allocation concealment (selection bias) | Unclear risk | Not stated. |
| Blinding (performance bias and detection bias) All outcomes | High risk | No blinding of patients or treating physicians. |
| Blinding of outcome assessment (detection bias) OS | Low risk | We assume that death is objectively and completely reported. |
| Blinding of outcome assessment (detection bias) PFS, SM | High risk | These events may not be absolutely objectively and completely reported. |
| Incomplete outcome data (attrition bias) All outcomes | Low risk | Exclusions and drop‐outs reported. Otherwise data complete. |
| Other bias | Low risk | None found. |
POG_8625.
| Methods | Late randomisation at CR/PR after CT Recruited 1986 to 1992 |
|
| Participants | Sites: 52 POG institutions Stage: I,IIA, IIIA, HD Age: 3 to 20 |
|
| Interventions | (6 MOPP/ABVD) versus (4 MOPP/ABVD + 2 IF.RT) | |
| Outcomes | Event‐free‐survival (EFS), OS, SMN | |
| Study Question | Chemotherapy alone or plus radiotherapy (SQ1) | |
| Median Year of Recruitment | ||
| Numbers of participants randomised (analysed) per arm | 169 in total, (78) versus (81) | |
| Notes | Regimen changed during study due to shortage of supply | |
| Risk of bias | ||
| Bias | Authors' judgement | Support for judgement |
| Random sequence generation (selection bias) | Low risk | Randomisation balanced by stage, M/T ratio, CR/PR response to chemotherapy. |
| Allocation concealment (selection bias) | Low risk | Allocated by call to statistical office. |
| Blinding (performance bias and detection bias) All outcomes | High risk | No blinding of patients or treating physicians. |
| Blinding of outcome assessment (detection bias) OS | Low risk | We assume that death is objectively and completely reported. |
| Blinding of outcome assessment (detection bias) PFS, SM | High risk | These events may not be absolutely objectively and completely reported. |
| Incomplete outcome data (attrition bias) All outcomes | Unclear risk | Exclusions and dropouts reported. |
| Other bias | High risk | Regimen changed during study due to shortage of supply. |
Roma_HD94.
| Methods | Late randomisation at CR/PR after CT Recruited 1998 to 2001 |
|
| Participants | Sites: Rome, Italy Stage: II and IIIA Age: 15 to under 75 |
|
| Interventions | (4 ABVD + EF.RT) versus (4 ABVD + IF.RT) | |
| Outcomes | SMN, OS, PFS | |
| Study Question | RT field (SQ2) | |
| Median Year of Recruitment | 1995 | |
| Numbers of participants randomised (analysed) per arm | 102 (102) versus 107 (107) | |
| Notes | ||
| Risk of bias | ||
| Bias | Authors' judgement | Support for judgement |
| Random sequence generation (selection bias) | High risk | Sequential randomisation: uneven/even patients in groups 1/2. A model for the selection process was analysed and showed no significant influence of known confounding or risk factors. |
| Allocation concealment (selection bias) | High risk | No concealment, see above. |
| Blinding (performance bias and detection bias) All outcomes | High risk | No blinding of patients or treating physicians. |
| Blinding of outcome assessment (detection bias) OS | Low risk | We assume that death is objectively and completely reported. |
| Blinding of outcome assessment (detection bias) PFS, SM | High risk | These events may not be absolutely objectively and completely reported. |
| Incomplete outcome data (attrition bias) All outcomes | Low risk | Data complete. |
| Other bias | Low risk | None found. |
Tata_India.
| Methods | Randomised Recruited 1993 to 1996 |
|
| Participants | Sites: Mumbai, India Stage: I to IV Age: under 70 |
|
| Interventions | (6 ABVD) versus (6 ABVD + RT) | |
| Outcomes | OS, Event‐free survival | |
| Study Question | Chemotherapy alone or plus radiotherapy (SQ1) | |
| Median Year of Recruitment | ||
| Numbers of participants randomised (analysed) per arm | 84 (84) versus 95 (95) | |
| Notes | ||
| Risk of bias | ||
| Bias | Authors' judgement | Support for judgement |
| Random sequence generation (selection bias) | Low risk | "Patients ... were randomly assigned using computer software for randomization." |
| Allocation concealment (selection bias) | Unclear risk | Not stated. |
| Blinding (performance bias and detection bias) All outcomes | High risk | No blinding of patients or treating physicians. |
| Blinding of outcome assessment (detection bias) OS | Low risk | We assume that death is objectively and completely reported. |
| Blinding of outcome assessment (detection bias) PFS, SM | High risk | These events may not be absolutely objectively and completely reported. |
| Incomplete outcome data (attrition bias) All outcomes | Low risk | Data complete. |
| Other bias | Low risk | None found. |
UK‐NCRI‐LG.
| Methods | Randomised Recruited 1998 to 2006 |
|
| Participants | Sites: multi‐centre (United Kingdom Lymphoma Group, UK) Stage: I to IIA unfavourable or IIIB‐IV Age: 18 to 60 |
|
| Interventions | (6 to 8 ABVD +/‐ local RT) versus (Stanford V +/‐ local RT) | |
| Outcomes | SMN, OS, PFS | |
| Study Question | Intensified CT (SQ5) | |
| Median Year of Recruitment | 2003 | |
| Numbers of participants randomised (analysed) per arm | 261 (261) versus 259 (259) | |
| Notes | ||
| Risk of bias | ||
| Bias | Authors' judgement | Support for judgement |
| Random sequence generation (selection bias) | Low risk | Stratified block randomisation. |
| Allocation concealment (selection bias) | Low risk | Central randomisation by phone. |
| Blinding (performance bias and detection bias) All outcomes | High risk | No blinding of patients or treating physicians. |
| Blinding of outcome assessment (detection bias) OS | Low risk | We assume that death is objectively and completely reported. |
| Blinding of outcome assessment (detection bias) PFS, SM | High risk | These events may not be absolutely objectively and completely reported. |
| Incomplete outcome data (attrition bias) All outcomes | Low risk | Data complete. |
| Other bias | Low risk | None found. |
UKLG_LY09_Alt.
| Methods | Randomised Recruited 1998 to 2001 |
|
| Participants | Sites: multi‐centre UK Stage: I to II with B‐symptoms or > 3 sites or bulky disease, and stage III to IV Age: 16 and above |
|
| Interventions | (6 or 8 ABVD +/‐ IF.RT) versus (6 or 8 alternating ChlVPP/PABlOE +/‐ IF.RT) | |
| Outcomes | SMN, OS, PFS | |
| Study Question | Intensified CT (SQ5) | |
| Median Year of Recruitment | 1999 | |
| Numbers of participants randomised (analysed) per arm | 295 (287) versus 287 (282) | |
| Notes | Centres which opted for alternating regimen a priori. Use of further cycles and/or RT depended on interim response. Exclusions from analysis due to non‐HL diagnosis (13) as described in UKLG_LY09_Alt |
|
| Risk of bias | ||
| Bias | Authors' judgement | Support for judgement |
| Random sequence generation (selection bias) | Low risk | "...minimization‐based methods with 5 stratification factors..." |
| Allocation concealment (selection bias) | Low risk | Central allocation. |
| Blinding (performance bias and detection bias) All outcomes | High risk | No blinding of patients or treating physicians. |
| Blinding of outcome assessment (detection bias) OS | Low risk | We assume that death is objectively and completely reported. |
| Blinding of outcome assessment (detection bias) PFS, SM | High risk | These events may not be absolutely objectively and completely reported. |
| Incomplete outcome data (attrition bias) All outcomes | Low risk | Data complete. |
| Other bias | Low risk | None found. |
UKLG_LY09_Hyb.
| Methods | Randomised Recruited 1998 to 2001 |
|
| Participants | Sites: multi‐centre UK Stage: I to II with B‐symptoms or > 3 sites or bulky disease, and stage III to IV Age: 16 and above |
|
| Interventions | (6 or 8 ABVD +/‐ IF.RT) versus (6 or 8 hybrid ChlVPP/EVA +/‐ IF.RT) | |
| Outcomes | SMN, OS, PFS | |
| Study Question | Intensified CT (SQ5) | |
| Median Year of Recruitment | 1999 | |
| Numbers of participants randomised (analysed) per arm | 111 (107) versus 114 (112) | |
| Notes | Centres which opted for hybrid regimen a priori. Use of further cycles and/or RT depended on interim response. Exclusions from analysis due to non‐HL diagnosis (6) as described in UKLG_LY09_Hyb |
|
| Risk of bias | ||
| Bias | Authors' judgement | Support for judgement |
| Random sequence generation (selection bias) | Low risk | "...minimization‐based methods with 5 stratification factors..." |
| Allocation concealment (selection bias) | Low risk | Central allocation. |
| Blinding (performance bias and detection bias) All outcomes | High risk | No blinding of patients or treating physicians. |
| Blinding of outcome assessment (detection bias) OS | Low risk | We assume that death is objectively and completely reported. |
| Blinding of outcome assessment (detection bias) PFS, SM | High risk | These events may not be absolutely objectively and completely reported. |
| Incomplete outcome data (attrition bias) All outcomes | Low risk | Data complete. |
| Other bias | Low risk | None found. |
CR = complete remission; Pts. = patients; HL = Hodgkin lymphoma; IF.RT = involved field radiotherapy; SMN = secondary malignant neoplasms; OS = overall survival; PFS = progression‐free survival; CT = chemotherapy; RT = radiotherapy; EF.RT = extended field radiotherapy; PR = partial remission; STNI = subtotal nodal irradiation category; TNI = total nodal irradiation category.
MOPP/ABV = mechlorethamine, vincristine, procarbazine, prednisone/adriamycin, bleomycin, vinblastine
EBVP = epirubicin, bleomycin, vinblastine, prednisone
ABVD = adriamycin, bleomycin, vinblastine, dacarbazine
BEACOPP = bleomycin, etoposide, adriamycin, cyclophosphamide, vincristine, procarbazine, prednisone
COPP/ABVD = cyclophosphamide, vincristine, procarbazine, prednisone/adriamycin, bleomycin, vinblastine, dacarbazine
CEC = COPPEBVCAD = cyclophosphamide, lomustine, vindesine, melphalan, prednisone, epidoxorubicin, vincristine, procarbazine, vinblastine, bleomycin
MEC = MOPP/EBV/CAD = mechlorethamine, vincristine, procarbazine, prednisone, epidoxorubicin, bleomycin, vinblastine, lomustine, adriamycin, vindesine
Stanford V = adriamycin, vinblastine, mechlorethamine, vincristine, bleomycin, etoposide, prednisone
ChlVPP/PABlOE = chlorambucil, vinblastine, procarbazine, prednisolone/prednisolone, adriamycin, bleomycin, vincristine, etoposide
ChlVPP/EVA = chlorambucil, vinblastine, procarbazine, prednisolone/etoposide, vincristine, adriamycin
Study Groups: EORTC = European Organisation for Research and Treatment of Cancer, GELA = Groupe d'Etudes des Lymphomes Adulte, GHSG = German Hodgkin Study Group
Countries: B = Belgium, E=Spain, F = France, I = Italy, NL = Netherlands, PL = Poland, PT = Portugal, SLO = Slovenia, UK = United Kingdom
Characteristics of excluded studies [ordered by study ID]
| Study | Reason for exclusion |
|---|---|
| EORTC #20012 | Recruited past 2007 |
| GHSG HD14 | Recruited well past 2007 |
Differences between protocol and review
Originally subgroup analyses for four age categories were planned. Since group sizes were very low in some categories (seven patients ≤ 15 years old in all studies, eight studies with less than 10 patients > 60 years old in the treatment arms), patients were divided in only two categories (≤/> 50 years old).
Treatment‐related subgroup analyses (number of chemotherapy cycles for comparisons involving radiation or +/‐ additional radiation for comparisons involving chemotherapy) were not performed as planned due to lack of relevant data or comparable treatments. For the question intensified chemotherapy (CT) regimen including seven studies a subgroup analysis for the different intensified therapies was done.
Solid tumour sites were not analysed separately due to the small numbers of even the most common cancers (35 lung and 39 breast tumours in all studies).
Contributions of authors
Franklin, Jeremy: protocol development; selection and assessment of trials (with DAE), supervision of data collection, statistical analyses, planning and chairing of collaborators' meetings, writing of review, other presentation of results.
Eichenauer, Dennis A.: selection and assessment of trials (with JF), contact with trialists, obtaining and querying IPD, scrutiny and interpretation of results, planning and organisation of collaborators' meetings, writing of review, other presentation of results.
Becker, Ingrid: data collection, preparation of final data base, statistical analyses, writing of review
Monsef, Ina: trials search strategy (development, execution and reporting).
Engert, Andreas: protocol development, contact with trialists; scrutiny and interpretation of results, writing of review, other presentation of results.
Sources of support
Internal sources
Department I of Internal Medicine, University Hospital of Cologne, Germany.
External sources
Bundesministerium für Bildung und Forschung (BMBF; Federal Ministry of Education and Research), Germany.
Declarations of interest
J. Franklin: statistician involved in planning two included studies (GHSG HD10; GHSG HD11) and in data analysis and publication of one (GHSG HD9); no further known conflict of interest.
D. A. Eichenauer: no known conflict of interest.
I. Becker: no known conflict of interest.
I. Monsef: no known conflict of interest.
A. Engert: chairman of German Hodgkin Study Group, involved in planning and publication of two included studies (GHSG HD10; GHSG HD11) and in publication of two others (GHSG HD8; GHSG HD9); no further known conflict of interest.
New
References
References to studies included in this review
CCG‐5942 {published and unpublished data}
- Nachman JB, Sposto R, Herzog P, Gilchrist GS, Wolden SL, Thomson J, et al. Randomized comparison of low‐dose involved‐field radiotherapy and no radiotherapy for children with Hodgkin's disease who achieve a complete response to chemotherapy. Journal of Clinical Oncology 2002;20(18):3765‐71. [DOI] [PubMed] [Google Scholar]
- Wolden SL, Chen L, Kelly KM, Herzog P, Gilchrist GS, Thomson J, et al. Long‐term results of CCG 5942: a randomized comparison of chemotherapy with and without radiotherpay for children with Hodgkin's lymphoma ‐ a report from the Children's Oncology Group. Journal of Clinical Oncology 2012;30(26):3174‐80. [DOI] [PMC free article] [PubMed] [Google Scholar]
ECOG_E2496 {published data only}
- Gordon LI, Hong F, Fisher RI, Bartlett NL, Connors JM, Gascoyne RD, et al. Randomized phase III trial of ABVD versus Stanford V with or without radiation therapy in locally extensive and advanced‐stage Hodgkin lymphoma: an intergroup study coordinated by the Eastern Cooperative Oncology Group (E2496). Journal of Clinical Oncology 2013;31(6):684‐91. [DOI] [PMC free article] [PubMed] [Google Scholar]
EORTC #20884 {published and unpublished data}
- Aleman BM, Raemaekers JM, Tirelli U, Bortolus R, 't Veer MB, Lybeert ML, et al. Involved‐field radiotherapy for advanced Hodgkin's lymphoma. New England Journal of Medicine 2003;348(24):2396‐406. [DOI] [PubMed] [Google Scholar]
EORTC H8‐U {published and unpublished data}
- Fermé C, Eghbali H, Meerwaldt JH, Rieux C, Bosq J, Berger F, et al. Chemotherapy plus involved‐field radiation in early‐stage Hodgkin's disease. New England Journal of Medicine 2007;357(19):1916‐27. [DOI] [PubMed] [Google Scholar]
EORTC H9‐F {published and unpublished data}
- Thomas J, Ferme C, Noordijk EM, van't Veer MB, Brice P, Divine M, et al. Results of the EORTC‐GELA H9 randomized trials: the H9‐F trial (comparing 3 radiation dose levels) and H9‐U trial (comparing 3 chemotherapy schemes) in patients with favorable or unfavorable early stage Hodgkin's lymphoma (HL). Haematologica 2007;92(Suppl. 5):27. [Google Scholar]
EORTC H9‐U {published and unpublished data}
- Thomas J, Ferme C, Noordijk EM, van't Veer MB, Brice P, Divine M, et al. Results of the EORTC‐GELA H9 randomized trials: the H9‐F trial (comparing 3 radiation dose levels) and H9‐U trial (comparing 3 chemotherapy schemes) in patients with favorable or unfavorable early stage Hodgkin's lymphoma (HL). Haematologica 2007;92(Suppl. 5):27. [Google Scholar]
Gerhartz_COPP‐ABVD {published and unpublished data}
- Gerhartz HH, Schwenke H, Bazarbashi S, Thiel E, Blau W, Huhn D, et al. Randomized comparison of COPP/ABVD versus dose‐ and time‐escalated COPP/ABVD with GM‐CSF support for advanced Hodgkin's disease. ASCO Annual Meeting Proceedings. 1997.
- Gerhartz HH, Schwenke H, Bazarbashi S, Thiel E, Blau W, Huhn D, et al. Randomized comparison of COPP/ABVD versus dose‐ and time‐escalated COPP/ABVD with GM‐CSF support for advanced Hodgkin's disease. Oncology. 1999; Vol. 13:31.
GHSG HD10 {published and unpublished data}
- Engert A, Plütschow A, Eich HT, Lohri A, Dörken B, Borchmann P, et al. Reduced treatment intensity in patients with early‐stage Hodgkin's lymphoma. New England Journal of Medicine 2010;363(7):640‐52. [DOI] [PubMed] [Google Scholar]
GHSG HD11 {published and unpublished data}
- Eich HT, Diehl V, Görgen H, Pabst T, Markova J, Debus J, et al. Intensified chemotherapy and dose‐reduced involved‐field radiotherapy in patients with early unfavorable Hodgkin's lymphoma: final analysis of the German Hodgkin Study Group HD11 trial. Journal of Clinical Oncology 2010;28(27):4199‐206. [DOI] [PubMed] [Google Scholar]
GHSG HD3 {published and unpublished data}
- Diehl V, Loeffler M, Pfreundschuh M, Ruehl U, Hasenclever D, Nisters‐Backes H, et al. Further chemotherapy versus low‐dose involved‐field radiotherapy as consolidation of complete remission after six cycles of alternating chemotherapy in patients with advanced Hodgkin's disease. Annals of Oncology 1995;6(9):901‐10. [DOI] [PubMed] [Google Scholar]
GHSG HD8 {published and unpublished data}
- Engert A, Schiller P, Josting A, Herrmann R, Koch P, Sieber M, et al. Involved‐field radiotherapy is equally effective and less toxic compared with extended‐field radiotherapy after four cycles of chemotherapy in patients with early‐stage unfavorable Hodgkin’s lymphoma: Results of the HD8 trial of the German Hodgkin’s Lymphoma Study Group. Journal of Clinical Oncology 2003;21(19):3601‐8. [DOI] [PubMed] [Google Scholar]
GHSG HD9 {published and unpublished data}
- Diehl V, Franklin J, Pfreundschuh M, Lathan B, Paulus U, Hasenclever D, et al. Standard and increased‐dose BEACOPP chemotherapy compared with COPP‐ABVD for advanced Hodgkin’s disease. New England Journal of Medicine 2003;348(24):2386‐95. [DOI] [PubMed] [Google Scholar]
GISL_HD2000 {published and unpublished data}
- Federico M, Luminari S, Iannitto E, Polimeno G, Marcheselli L, Montanini A, et al. ABVD compared with BEACOPP compared with CEC for the initial treatment of patients with advanced Hodgkin's lymphoma: results from the HD2000 Gruppo Italiano per lo Studio dei Linfomi trial. Journal of Clinical Oncology 2009;27(5):805‐11. [DOI] [PubMed] [Google Scholar]
IIL_HD9601 {published and unpublished data}
- Chisesi T, Bellei M, Luminari S, Montanini A, Marcheselli L, Levis A, et al. Long‐term follow‐up analysis of HD9601 trial comparing ABVD versus Stanford V versus MOPP/EBV/CAD in patients with newly diagnosed advanced‐stage Hodgkin's lymphoma: a study from the Intergruppo Italiano Linfomi. Journal of Clinical Oncology 2011;29(32):4227‐33. [DOI] [PubMed] [Google Scholar]
MF‐GITIL‐IIL {published and unpublished data}
- Viviani S, Zinzani PL, Rambaldi A, Brusamolino E, Levis A, Bonfante V, et al. ABVD versus BEACOPP for Hodgkin's lymphoma when high‐dose salvage is planned. New England Journal of Medicine 2011;365(3):203‐12. [DOI] [PubMed] [Google Scholar]
Milano_STNI_IF {published and unpublished data}
- Bonadonna G, Bonfante V, Viviani S, Russo A, Villani F, Valagussa P. ABVD plus subtotal nodal versus involved‐field radiotherapy in early‐stage Hodgkin's disease: long‐term results. Journal of Clinical Oncology 2004;22(14):2835‐41. [DOI] [PubMed] [Google Scholar]
POG_8625 {published and unpublished data}
- Kung FH, Schwartz CL, Ferree CR, London WB, Ternberg JL, Behm FG, et al. POG 8625: a randomized trial comparing chemotherapy with chemoradiotherapy for children and adolescents with stages I, IIA, IIIA1 Hodgkin disease: a report from the Children's Oncology Group. Journal of Pediatric Hematology/Oncology 2006;28:362‐8. [DOI] [PubMed] [Google Scholar]
Roma_HD94 {published and unpublished data}
- Anselmo AP, Cavalieri E, Osti FM, Cantonetti M, Sanctis V, Alfo M, et al. Intermediate stage Hodgkin's disease: preliminary results on 210 patients treated with four ABVD chemotherapy cycles plus extended versus involved field radiotherapy. Anticancer Research 2004;24(6):4045‐50. [PubMed] [Google Scholar]
Tata_India {published and unpublished data}
- Laskar S, Gupta T, Vimal S, Muckaden MA, Saikia TK, Pai SK, et al. Consolidation radiation after complete remission in Hodgkin's disease following six cycles of doxorubicin, bleomycin, vinblastine, and dacarbazine chemotherapy: is there a need?. Journal of Clinical Oncology 2004;22(1):62‐8. [DOI] [PubMed] [Google Scholar]
UKLG_LY09_Alt {published and unpublished data}
- Johnson PW, Radford JA, Cullen MH, Sydes MR, Walewski J, Jack AS, et al. Comparison of ABVD and alternating or hybrid multidrug regimens for the treatment of advanced Hodgkin's lymphoma: results of the United Kingdom Lymphoma Group LY09 trial (ISRCTN97144519). Journal of Clinical Oncology 2005;23(36):9208‐18. [DOI] [PubMed] [Google Scholar]
UKLG_LY09_Hyb {published and unpublished data}
- Johnson PW, Radford JA, Cullen MH, Sydes MR, Walewski J, Jack AS, et al. Comparison of ABVD and alternating or hybrid multidrug regimens for the treatment of advanced Hodgkin's lymphoma: results of the United Kingdom Lymphoma Group LY09 trial (ISRCTN97144519). Journal of Clinical Oncology 2005;23(36):9208‐18. [DOI] [PubMed] [Google Scholar]
UK‐NCRI‐LG {published and unpublished data}
- Hoskin PJ, Lowry L, Horwich A, Jack A, Mead B, Hancock BW, et al. Randomized comparison of the stanford V regimen and ABVD in the treatment of advanced Hodgkin's Lymphoma: United Kingdom National Cancer Research Institute Lymphoma Group study ISRCTN 64141244. Journal of Clinical Oncology 2009;27(32):5390‐6. [DOI] [PubMed] [Google Scholar]
References to studies excluded from this review
EORTC #20012 {published and unpublished data}
- Mounier N, Brice P, Bologna S, Briere J, Gaillard I, Heczko M, et al. ABVD (8 cycles) versus BEACOPP (4 escalated cycles ≥4 baseline): final results in stage III–IV low‐risk Hodgkin lymphoma (IPS 0–2) of the LYSA H34 randomized trial. Annals of Oncology 2014;25(8):1622‐8. [DOI] [PubMed] [Google Scholar]
GHSG HD14 {published and unpublished data}
- Tresckow B, Plütschow A, Fuchs M, Klimm B, Markova J, Lohri A, et al. Dose‐intensification in early unfavorable Hodgkin's lymphoma: final analysis of the German Hodgkin Study Group HD14 trial. Journal of Clinical Oncology 2012;30(9):907‐13. [DOI] [PubMed] [Google Scholar]
Additional references
Aleman 2003
- Aleman BMP, Belt‐Dusebout AW, Klokman WJ, van`t Veer MB, Bartelink H, Leeuwen FE. Long‐term cause‐specific mortality of patients treated for Hodgkin's disease. Journal of Clinical Oncology 2003;21(18):3431‐9. [DOI] [PubMed] [Google Scholar]
Behringer 2004
- Behringer K, Josting A, Schiller P, Eich HT, Bredenfeld H, Diehl V, et al. Solid tumors in patients treated for Hodgkin's disease: a report from the German Hodgkin Lymphoma Study Group. Annals of Oncology 2004;15(7):1079‐85. [DOI] [PubMed] [Google Scholar]
Beyan 2007
- Beyan C, Kaptan K, Ifran A, Öcal R, Ulutin C, Özturk B. The effect of radiologic imaging studies on the risk of secondary malignancy development in patients with Hodgkin lypmhoma. Clinical Lymphoma and Myeloma 2007;7(7):467‐9. [DOI] [PubMed] [Google Scholar]
Bhatia 1996
- Bhatia S, Robison L, Oberlin O, Greenberg M, Bunin G, Fossati‐Bellani F, et al. Breast cancer and other second neoplasms after childhood Hodgkin's disesase. New England Journal of Medicine 1996;334(12):745‐51. [DOI] [PubMed] [Google Scholar]
Birdwell 1997
- Birdwell SH, Hancock SL, Varghese A, Cox RS, Hoppe RT. Gastrointestinal cancer after treatment of Hodgkin's disease. International Journal of Radiation Oncology, Biology, Physics 1997;37(1):67‐73. [DOI] [PubMed] [Google Scholar]
Biti 1994
- Biti G, Cellai E, Magrini SM, Papi MG, Ponticelli P, Boddi V. Second solid tumors and leukemia after treatment for Hodgkin's disease: an analysis of 1121 patients from a single institution. International Journal of Radiation Oncology, Biology, Physics 1994;29(1):25‐31. [DOI] [PubMed] [Google Scholar]
Boice 1988
- Boice JD, Jr. Carcinogenesis ‐ a synopsis of human experience with external exposure in medicine. Health Physics 1988;55:621. [DOI] [PubMed] [Google Scholar]
Boivin 1995
- Boivin JF, Hutchison GB, Zauber AG, Bernstein L, Davis FG, Michel RP, et al. Incidence of second cancers in patients treated for Hodgkin's disease. Journal of the National Cancer Institute 1995;87(10):732‐41. [DOI] [PubMed] [Google Scholar]
Brusamolino 1998
- Brusamolino E, Anselmo AP, Klersy C, Santoro M, Orlandi E, Pagnucco G, et al. The risk of acute leukemia in patients treated for Hodgkin's disease is significantly higher after combined modality programs than after chemotherapy alone and is correlated with the extent of radiotherapy and type and duration of chemotherapy: a case‐control study. Haematologica 1998;83(9):812‐23. [PubMed] [Google Scholar]
Canellos 2009
- Canellos GP, Niedzwiecki D, Johnson JL. Long‐term follow‐up of survival in Hodgkin's lymphoma. New England Journal of Medicine 2009;361(24):2390‐1. [DOI] [PubMed] [Google Scholar]
Cox 1972
- Cox DR. Regression models and life tables. Journal of the Royal Statistical Society Series B 1972;34(2):187‐220. [Google Scholar]
De Bruin 2009
- Bruin ML, Sparidans J, van't Veer M, Noordijk E, Louwman MWJ, Zijlstra JM, et al. Breast cancer risk in female survivors of Hodgkin's lymphoma: lower risk after smaller rafiation volumes. Journal of Clinical Oncology 2009;27(26):4239‐46. [DOI] [PubMed] [Google Scholar]
De Vita 2000
- Diehl V, Harris N, Mauch P. Hodgkin's disease. In: Vita VT editor(s). Cancer: Principles and Practice of Oncology. Philadelphia: Lippincott Williams and Wilkins, 2000. [ISBN 0‐7817‐2807‐X] [Google Scholar]
Delwail 2002
- Delwail V, Jais JP, Colonna P, Andrieu JM. Fifteen‐year secondary leukaemia risk observed in 761 patients with Hodgkin's disease prospectively treated by MOPP or ABVD chemotherapy plus high‐dose irradiation. British Journal of Haematology 2002;118(1):189‐94. [DOI] [PubMed] [Google Scholar]
Dietrich 1994
- Dietrich PY, Henry‐Amar M, Cosset JM, Bodis S, Bosq J, Hayat M. Second primary cancers in patients continuously disease‐free from Hodgkin's disease: a protective role for the spleen?. Blood 1994;84(4):1209‐15. [PubMed] [Google Scholar]
Dores 2002
- Dores GM, Metayer C, Curtis RE, Lynch CF, Clarke EA, Glimelius B, et al. Second malignant neoplasms among long‐term survivors of Hodgkin's disease: a population‐based evaluation over 25 years. Journal of Clinical Oncology 2002;20(16):3484‐94. [DOI] [PubMed] [Google Scholar]
EBCTCG 1988
- Early Breast Cancer Trialists' Collaborative Group. Effects of adjuvant Tamoxifen and of cytotoxic therapy on mortality in early breast cancer. New England Journal of Medicine 1988;319:1681‐92. [DOI] [PubMed] [Google Scholar]
EBCTCG 1992
- Early Breast Cancer Triallists' Collaborative Group. Systemic treatment of early breast cancer by hormonal, cytotoxic or immune therapy. Lancet 1992;339:1‐15, 71‐85. [PubMed] [Google Scholar]
Eichenauer 2014
- Eichenauer D, Thielen I, Haverkamp H, Franklin J, Behringer K, Halbsguth T, et al. Therapy‐related acute myeloid leukemia and myelodysplastic syndromes in patients with Hodgkin lymphoma: a report from the German Hodgkin Study Group. Blood 2014;123(11):1658‐64. [DOI] [PubMed] [Google Scholar]
Engert 2009
- Engert A, Diehl V, Franklin J, Lohri A, Dörken B, Ludwig WD, et al. Escalated‐dose BEACOPP in the treatment of patients with advanced‐stage Hodgkin's lymphoma: 10 years of follow‐up of the GHSG HD9 study. Journal of Clinical Oncology 2009;27(27):4548‐54. [DOI] [PubMed] [Google Scholar]
Engert 2012
- Engert A, Haverkamp H, Kobe C, Markova J, Renner C, Ho A, et al. Reduced‐intensity chemotherapy and PET‐guided radiotherapy in patients with advanced stage Hodgkin's lymphoma (HD15 trial): a randomised, open‐label, phase 3 non‐inferiority trial. Lancet 2012;379(9828):1791‐9. [DOI] [PubMed] [Google Scholar]
Enrici 1998
- Enrici RM, Anselmo AP, Iacari V, Osti MF, Santoro M, Tombolini V, et al. The risk of non‐Hodgkin's lymphoma after Hodgkin's disease, with special reference to splenic treatment. Haematologica 1998;83(7):636‐44. [PubMed] [Google Scholar]
Foss‐Abrahamsen 1993
- Foss‐Abrahamsen J, Andersen A, Hannisdal E, Nome O, Foss‐Abrahamsen A, Kvaloey S, et al. Second malignancies after treatment of Hodgkin's disease: the influence of treatment, follow‐up time and age. Journal of Clinical Oncology 1993;11(2):255‐61. [DOI] [PubMed] [Google Scholar]
Foss‐Abrahamsen 2002
- Foss‐Abrahamsen A, Andersen A, Nome O, Jacobsen AB, Holte H, Foss‐Abrahamsen J, et al. Long‐term risk of second malignancy after treatment of Hodgkin's disease: the influence of treatment, age and follow‐up time. Annals of Oncology 2002;13(11):1786‐91. [DOI] [PubMed] [Google Scholar]
Franklin 2005
- Franklin JG, Paus MD, Pluetschow A, Specht L. Chemotherapy, radiotherapy and combined modality for Hodgkin's disease, with emphasis on second cancer risk. Cochrane Database of Systematic Reviews 2005, Issue 4. [DOI: 10.1002/14651858.CD003187.pub2] [DOI] [PMC free article] [PubMed] [Google Scholar]
Franklin 2006a
- Franklin J, Pluetschow A, Paus M, Specht L, Amselmo A‐P, Aviles A, et al. Second malignancy risk associated with treatment of Hodgkin's lymphoma: meta‐analysis of the randomised trials. Annals of Oncology 2006;17(12):1749‐60. [DOI] [PubMed] [Google Scholar]
Franklin 2006b
- Franklin J, Hozo I, Pluetschow A, Djulbegovic B. Competing risks with time‐to‐event outcomes in an individual patient data meta‐analysis. Deutsche Gesellschaft für Medizinische Informatik, Biometrie und Epidemiologie e.V. (gmds). 51. Jahrestagung der Deutschen Gesellschaft für Medizinische Informatik, Biometrie und Epidemiologie. Düsseldorf, Köln: German Medical Science, 2006; Vol. Doc 06gmds281.
Guyatt 2008
- Guyatt GH, Oxman AD, Vist GE, Kunz R, Falck‐Ytter Y, Alonso‐Coello P, et al. GRADE: an emerging consensus on rating quality of evidence and strength of recommendations. BMJ 2008;336(7650):924‐6. [DOI] [PMC free article] [PubMed] [Google Scholar]
Hancock 1993
- Hancock SL, Tucker MA, Hoppe RT. Breast cancer after treatment of Hodgkin's disease. Journal of the National Cancer Institute 1993;85(1):25‐31. [DOI] [PubMed] [Google Scholar]
Henry‐Amar 1992
- Henry‐Amar M. Second cancer after the treatment of Hodgkin's disease: a report from the International Database on Hodgkin's disease. Annals of Oncology 1992;3 Suppl 4:117‐28. [DOI] [PubMed] [Google Scholar]
Henry‐Amar 1993
- Henry‐Amar M, Dietrich PY. Acute leukemia after the treatment of Hodgkin's disease. Hematology/Oncology Clinics of North America 1993;7(2):369‐87. [PubMed] [Google Scholar]
Henry‐Amar 1996
- Henry‐Amar M, Joly F. Late complications after Hodgkin's disease. Annals of Oncology 1996;7 Suppl 4:115‐26. [DOI] [PubMed] [Google Scholar]
Herbst 2010
- Herbst C, Rehan FA, Brillant C, Bohlius J, Skoetz N, Schulz H, et al. Combined modality treatment improves tumor control and overall survival in patients with early stage Hodgkin's lymphoma: a systematic review. Haematologica 2010;95(3):494‐500. [DOI] [PMC free article] [PubMed] [Google Scholar]
Higgins 2002
- Higgins JPT, Thompson SG. Quantifying heterogeneity in meta‐analysis. Statistics in Medicine 2002;21:1539‐58. [DOI] [PubMed] [Google Scholar]
Higgins 2011
- Higgins JPT, Green S (editors). Cochrane Handbook for Systematic Reviews of Interventions (version 5.1.0). The Cochrane Collaboration (available from www.cochrane‐handbook.org), 2011. [Google Scholar]
Hodgson 2007
- Hodgson DC, Gilbert ET, Dores GM, Schonfeld SJ, Lynch CF, Storm H, et al. Long‐term solid cancer risk among 5‐year survivors of Hodgkin's lymphoma. Journal of Clinical Oncology 2007;25(12):1489‐97. [DOI] [PubMed] [Google Scholar]
Iacobelli 2013
- Iacobelli S. EBMT statistical guidelines. Suggestions on the use of statistical methodologies in studies of the European Group for Blood and Marrow Transplantation. Bone Marrow Transplantation 2013;48:S1‐S37. [DOI] [PubMed] [Google Scholar]
Josting 2003
- Josting A, Wiedenmann S, Franklin J, May M, Sieber M, Wolf J, et al. Secondary myeloid leukemia and myelodysplastic syndromes in patients treated for Hodgkin's disease: a report from the German Hodgkin's Lymphoma Study Group. Journal of Clinical Oncology 2003;21(18):3440‐6. [DOI] [PubMed] [Google Scholar]
Kaldor 1990
- Kaldor JM, Day NE, Clarke EA, Leeuwen FE, Henry‐Amar M, Fiorentino MV, et al. Leukemia following Hodgkin's disease. New England Journal of Medicine 1990;322:7‐13. [DOI] [PubMed] [Google Scholar]
Kaldor 1992
- Kaldor JM, Day NE, Bell J, Clarke EA, Langmark F, Karjalainen S, et al. Lung cancer following Hodgkin's disease: a case‐control study. International Journal of Cancer 1992;52:677‐81. [DOI] [PubMed] [Google Scholar]
Koontz 2013
- Koontz MZ, Horning S, Balise R, Greenberg PL, Rosenberg SA, Hoppe RT, et al. Risk of therapy‐related secondary leukemia in Hodgkin lymphoma: the Stanford University experience over three generations of clinical trials. Journal of Clinical Oncology 2013;31(5):592‐8. [DOI] [PMC free article] [PubMed] [Google Scholar]
Koshy 2012
- Koshy M, Rich SE, Mahmood U, Kwok Y. Declining use of radiotherapy in stage I and II hodgkin's disease and its effect on survival and secondary malignancies. International Journal of Radiation Oncology Biology Physics 2012;82(2):619‐25. [DOI] [PMC free article] [PubMed] [Google Scholar]
Leone 2007
- Leone G1, Pagano L, Ben‐Yehuda D, Voso MT. Therapy‐related leukemia and myelodysplasia: susceptibility and incidence. Haematologica 2007;92(10):1389‐98. [DOI] [PubMed] [Google Scholar]
Loeffler 1998
- Loeffler M, Brosteanu O, Hasenclever D, Sextro M, Assouline D, Bartolucci AA, et al. Meta‐analysis of chemotherapy versus combined modality treatment trials in Hodgkin's disease. Journal of Clinical Oncology 1998;16(3):818‐29. [DOI] [PubMed] [Google Scholar]
Mauch 1996
- Mauch PM, Kalish LA, Marcus KC, Coleman CN, Shulman LN, Krill E, et al. Second malignancies after treatment for laparotomy staged IA‐IIIB Hodgkin's disease: long‐term analysis of risk factors and outcome. Blood 1996;87(9):3625‐32. [PubMed] [Google Scholar]
Mauch 1999
- Mauch PM, Armitage JO, Diehl V, Hoppe RT, Weiss LM. Hodgkin's Disease. Philadelphia: Lippincott Williams and Wilkins, 1999. [Google Scholar]
Meattini 2010
- Meattini I, Livi L, Saieva C, Marrazzo L, Rampini A, Iermano C, et al. Breast cancer following Hodgkin's disease: the experience of the University of Florence. Breast Journal 2010;16(3):290‐6. [DOI] [PubMed] [Google Scholar]
Meyer 2012
- Meyer RM, Gospodarowicz MK, Connors, JM, Pearcey RG, Wells WA, Winter JN, et al. ABVD alone versus radiation‐based therapy in limited‐stage Hodgkin’s lymphoma. New England Journal of Medicine 2012;366(5):399‐408. [DOI] [PMC free article] [PubMed] [Google Scholar]
Moher 2009
- Moher D, Liberati A, Tetzlaff J, Altman DG, and the PRISMA Group. Preferred reporting items for systematic reviews and meta‐analyses: The PRISMA statement. Annals of Internal Medicine 2009;151(4):264‐9. [DOI] [PubMed] [Google Scholar]
Mounier 2014
- Mounier N, Brice P, Bologna S, Briere J, Gaillard I, Heczko M, el al. ABVD (8 cycles) versus BEACOPP (4 escalated cycles ≥4baseline): final results in stage III–IV low‐risk Hodgkinlymphoma (IPS 0–2) of the LYSA H34 randomized trial. Annals of Oncology 2014;25(8):1622‐8. [DOI] [PubMed] [Google Scholar]
Mueller 1999
- Mueller NE, Grufferman S. The epidemiology of Hodgkin's disease. In: Mauch PM, Armitage JO, Diehl V, Hoppe RT, Weiss LM editor(s). Hodgkin's Disease. Philadelphia: Lippincott Williams and Wilkins, 1999:61‐77. [Google Scholar]
Ng 2002
- Ng AK, Bernardo MVP, Weller E, Backstrand K, Silver B, Marcus KC, et al. Second malignancy after Hodgkin's disease treated with radiation therapy with or without chemotherapy: long‐term risks and risk factors. Blood 2002;100(6):1989‐96. [DOI] [PubMed] [Google Scholar]
Ng 2004
- Ng AK, Mauch PM. Late complications of therapy of Hodgkin's disease: Prevention and management. Current Hematology Reports 2004;3(1):27‐33. [PubMed] [Google Scholar]
Pedersen‐Bjergaard 1987
- Pedersen‐Bjergaard J, Specht L, Larsen SO, Ersboell J, Struck J, Hansen MM, et al. Risk of therapy‐related leukemia and preleukemia after Hodgkin's disease. Relation to age, cumulative dose of alkylating agents, and time from chemotherapy. Lancet 1987;2(8550):83‐8. [DOI] [PubMed] [Google Scholar]
Pepe 1993
- Pepe MS, Mori M. Kaplan‐Meier, marginal or conditional probability curves in summarizing competing risks failure time data?. Statistics in Medicine 1993;12:737‐51. [DOI] [PubMed] [Google Scholar]
Raemaekers 2014
- Raemaekers JM, Andre MP, Federico M, Girinsky T, Oumedaly R, Brusamolino E, et al. Omitting radiotherapy in early positron emission tomography‐negative stage I/II Hodgkin lymphoma is associated with an increased risk of early relapse: Clinical results of the preplanned interim analysis of the randomized EORTC/LYSA/FIL H10 trial. Journal of Clinical Oncology 2014;32(12):1188‐94. [DOI] [PubMed] [Google Scholar]
RevMan 2012 [Computer program]
- The Nordic Cochrane Centre. Review Manager (RevMan). Version 5.2. Copenhagen: The Cochrane Collaboration, 2012.
Rodriguez 1993
- Rodriguez MA, Fuller LM, Zimmerman SO, Allen PK, Brown BW, Munsell MF, et al. Hodgkin's disease: study of treatment intensities and incidences of second malignancies. Annals of Oncology 1993;4(2):125‐31. [DOI] [PubMed] [Google Scholar]
Rueffer 2001
- Rueffer U, Josting A, Franklin J, May M, Sieber M, Breuer K, et al. Non‐Hodgkin's lymphoma after primary Hodgkin's disease in the German Hodgkin'sLymphoma Study Group: incidence, treatment, and prognosis. Journal of Clinical Oncology 2001;19(7):2026‐32. [DOI] [PubMed] [Google Scholar]
Sasse 2012
- Sasse S, Klimm B, Gorgen H, Fuchs M, Heyden‐Honerkamp A, Lohri A, et al. Comparing long‐term toxicity and efficacy of combined modality treatment including extended‐ or involved‐field radiotherapy in early‐stage Hodgkin's lymphoma. Annals of Oncology 2012;23(11):2953‐9. [DOI] [PubMed] [Google Scholar]
Scholz 2011
- Scholz M, Engert A, Franklin J, Josting A, Diehl V, Hasenclever D, et al. Impact of first‐ and second.line treatment for Hodgkin's lymphoma on the incidence of AML/MDS and NHL ‐ experience of the German Hodgkin's Lymphoma Study Group analysed by a parametric model of carcinogenesis. Annals of Oncology 2011;22(3):681‐8. [DOI] [PubMed] [Google Scholar]
Shore 1990
- Shore T, Nelson N, Weinerman B. A Meta‐analysis of stages I and II Hodgkin's disease. Cancer 1990;65:1155‐60. [DOI] [PubMed] [Google Scholar]
Skoetz 2013
- Skoetz N, Trelle S, Rancea M, Haverkamp H, Diehl V, Engert A, et al. Effect of initial treatment strategy on survival of patients with advanced‐stage Hodgkin's lymphoma: a systematic review and network meta‐analysis. Lancet Oncology 2013;14(10):943‐52. [DOI] [PubMed] [Google Scholar]
Specht 1998
- Specht L, Gray RG, Clarke MJ, Peto R. Influence of more extensive radiotherapy and adjuvant chemotherapy on long‐term outcome of early‐stage Hodgkin's disease: a meta‐analysis of 23 randomized trials involving 3,888 patients. Journal of Clinical Oncology 1998;16(3):830‐43. [DOI] [PubMed] [Google Scholar]
Swerdlow 1992
- Swerdlow AJ, Douglas AJ, Vaughan Hudson G, Vaughan Hudson B, Bennett MH, MacLennan KA. Risk of second primary cancers after Hodgkin's disease by type of treatment: analysis of 2846 patients in the British National Lymphoma Investigation. BMJ 1992;304:1137‐43. [DOI] [PMC free article] [PubMed] [Google Scholar]
Swerdlow 2000
- Swerdlow AJ, Barber JA, Vaughan Hudson G, Cunningham D, Gupta RK, Hancock BW, et al. Risk of second malignancy after Hodgkin's disease in a collaborative British cohort: the relation to age at treatment. Journal of Clinical Oncology 2000;18:498‐509. [DOI] [PubMed] [Google Scholar]
Swerdlow 2001
- Swerdlow AJ, Schoemaker MJ, Allerton R, Horwich A, Barber JA, Cunningham D, et al. Lung cancer after Hodgkin's disease: a nested case‐control study of the relation to treatment. Journal of Clinical Oncology 2001;19(6):1610‐8. [DOI] [PubMed] [Google Scholar]
Swerdlow 2011
- Swerdlow AJ, Higgins CD, Smith P, Cunningham D, Hancock BW, Horwich A, et al. Second cancer risk after chemotherapy for Hodgkin's lymphoma: a collaborative British cohort study. Journal of Clinical Oncology 2011;29(31):4096‐104. [DOI] [PubMed] [Google Scholar]
Swerdlow 2012
- Swerdlow AJ, Cooke R, Bates A, Cunningham D, Falk SJ, Gilson D, et al. Breast cancer risk after supradiaphragmatic radiotherapy for Hodgkin’s lymphoma in England and Wales: a national cohort study. Journal of Clinical Oncology 2012;30(22):2745‐52. [DOI] [PubMed] [Google Scholar]
Tai 2001
- Tai BC, Machin D, White I, Gebski V. Competing risks analysis of patients with osteosarcoma: a comparison of four different approaches. Statistics in Medicine 2001;20:661‐84. [DOI] [PubMed] [Google Scholar]
Travis 2002
- Travis LB, Gospodarovicz M, Curtis RE, Clarke EA, Andersson M, Glimelius B, et al. Lung cancer following chemotherapy and radiotherapy for Hodgkin's disease. Journal of the National Cancer Institute 2002;94:182‐92. [DOI] [PubMed] [Google Scholar]
Travis 2003
- Travis LB, Hill DA, Dores GM, Gospodarovicz M, Leeuwen FE, Holowaty E, et al. Breast cancer following radiotherapy and chemotherapy among young women with Hodgkin's disease. JAMA 2003;290(4):465‐75. [DOI] [PubMed] [Google Scholar]
Tucker 1988
- Tucker MA, Coleman CN, Cox RS, Varghese A, Rosenberg SA. Risk of second cancers after treatment for Hodgkin's disease. New England Journal of Medicine 1988;318:76‐81. [DOI] [PubMed] [Google Scholar]
Tucker 1993
- Tucker MA. Solid second cancers following Hodgkin's disease. Hematology/Oncology Clinics of North America 1993;7(2):389‐400. [PubMed] [Google Scholar]
van Leeuwen 1994a
- Leeuwen FE, Klokman WJ, Hagenbeek A, Noyon R, Belt‐Dusebout AW, Kerkhoff EHM, et al. Second cancer risk following Hodgkin's disease: a 20‐year follow‐up study. Journal of Clinical Oncology 1994;12:312‐25. [DOI] [PubMed] [Google Scholar]
van Leeuwen 1994b
- Leeuwen FE, Chorus AMJ, Belt‐Dusebout AW, Hagenbeek A, Noyon R, Kerkhoff EHM. Leukemia risk following Hodgkin's disease: relation to cumulative dose of alkalating agents, treatment with teniposide combinations, number of episodes of chemotherapy, and bone marrow damage. Journal of Clinical Oncology 1994;12(5):1063‐73. [DOI] [PubMed] [Google Scholar]
van Leeuwen 1995
- Leeuwen FE, Klokman WJ, Stovall M, Hagenbeek A, Belt‐Dusebout AW, Noyon R, et al. Roles of radiotherapy and smoking in lung cancer following Hodgkin's disease. Journal of the National Cancer Institute 1995;87(20):1530‐7. [DOI] [PubMed] [Google Scholar]
van Leeuwen 2003
- Leeuwen FE, Klokman WJ, Stovall M, Dahler EC, van't Veer MB, Noordijk EM, et al. Roles of radiotherapy dose, chemotherapy, and hormonal status in breast cancer following Hodgkin's disease. Journal of the National Cancer Institute 2003;95(13):971‐80. [DOI] [PubMed] [Google Scholar]
von Treskow 2012
- Tresckow B, Plutschow A, Fuchs M, Klimm B, Markova J, Lohri A, et al. Dose‐intensification in early unfavorable Hodgkin's lymphoma: final analysis of the German Hodgkin Study Group HD14 trial. Journal of Clinical Oncology 2012;30(9):907‐13. [DOI] [PubMed] [Google Scholar]
Wolden 2012
- Wolden SL, Chen L, Kelly KM, Herzog P, Gilchrist GS, Thomson J, et al. Long‐term results of CCG 5942: a randomized comparison of chemotherapy with and without radiotherpay for children with Hodgkin's lymphoma ‐ a report from the Children's Oncology Group. Journal of Clinical Oncology 2012;30(26):3174‐80. [DOI] [PMC free article] [PubMed] [Google Scholar]
Xavier 2013
- Xavier AC, Armeson KE, Hill EG, Costa LJ. Risk and outcome of non‐Hodgkin lymphoma among classical Hodgkin lymphoma survivors. Cancer 2013;119(18):3385‐92. [DOI] [PMC free article] [PubMed] [Google Scholar]
References to other published versions of this review
Franklin 2010
- Franklin J, Eichenauer D, Monsef I, Engert A. Optimisation of chemotherapy and radiotherapy for untreated Hodgkin lymphoma patients with respect to second malignant neoplasms, overall and progression‐free survival. Cochrane Database of Systematic Reviews 2010, Issue 11. [DOI: 10.1002/14651858.CD008814] [DOI] [PMC free article] [PubMed] [Google Scholar]