

Abstract
Background
Excessive alcohol use contributes significantly to physical and psychological illness, injury and death, and a wide array of social harm in all age groups. A proven strategy for reducing excessive alcohol consumption levels is to offer a brief conversation‐based intervention in primary care settings, but more recent technological innovations have enabled people to interact directly via computer, mobile device or smartphone with digital interventions designed to address problem alcohol consumption.
Objectives
To assess the effectiveness and cost‐effectiveness of digital interventions for reducing hazardous and harmful alcohol consumption, alcohol‐related problems, or both, in people living in the community, specifically: (i) Are digital interventions more effective and cost‐effective than no intervention (or minimal input) controls? (ii) Are digital interventions at least equally effective as face‐to‐face brief alcohol interventions? (iii) What are the effective component behaviour change techniques (BCTs) of such interventions and their mechanisms of action? (iv) What theories or models have been used in the development and/or evaluation of the intervention? Secondary objectives were (i) to assess whether outcomes differ between trials where the digital intervention targets participants attending health, social care, education or other community‐based settings and those where it is offered remotely via the internet or mobile phone platforms; (ii) to specify interventions according to their mode of delivery (e.g. functionality features) and assess the impact of mode of delivery on outcomes.
Search methods
We searched CENTRAL, MEDLINE, PsycINFO, CINAHL, ERIC, HTA and Web of Knowledge databases; ClinicalTrials.com and WHO ICTRP trials registers and relevant websites to April 2017. We also checked the reference lists of included trials and relevant systematic reviews.
Selection criteria
We included randomised controlled trials (RCTs) that evaluated the effectiveness of digital interventions compared with no intervention or with face‐to‐face interventions for reducing hazardous or harmful alcohol consumption in people living in the community and reported a measure of alcohol consumption.
Data collection and analysis
We used standard methodological procedures expected by The Cochrane Collaboration.
Main results
We included 57 studies which randomised a total of 34,390 participants. The main sources of bias were from attrition and participant blinding (36% and 21% of studies respectively, high risk of bias). Forty one studies (42 comparisons, 19,241 participants) provided data for the primary meta‐analysis, which demonstrated that participants using a digital intervention drank approximately 23 g alcohol weekly (95% CI 15 to 30) (about 3 UK units) less than participants who received no or minimal interventions at end of follow up (moderate‐quality evidence).
Fifteen studies (16 comparisons, 10,862 participants) demonstrated that participants who engaged with digital interventions had less than one drinking day per month fewer than no intervention controls (moderate‐quality evidence), 15 studies (3587 participants) showed about one binge drinking session less per month in the intervention group compared to no intervention controls (moderate‐quality evidence), and in 15 studies (9791 participants) intervention participants drank one unit per occasion less than no intervention control participants (moderate‐quality evidence).
Only five small studies (390 participants) compared digital and face‐to‐face interventions. There was no difference in alcohol consumption at end of follow up (MD 0.52 g/week, 95% CI ‐24.59 to 25.63; low‐quality evidence). Thus, digital alcohol interventions produced broadly similar outcomes in these studies. No studies reported whether any adverse effects resulted from the interventions.
A median of nine BCTs were used in experimental arms (range = 1 to 22). 'B' is an estimate of effect (MD in quantity of drinking, expressed in g/week) per unit increase in the BCT, and is a way to report whether individual BCTs are linked to the effect of the intervention. The BCTs of goal setting (B ‐43.94, 95% CI ‐78.59 to ‐9.30), problem solving (B ‐48.03, 95% CI ‐77.79 to ‐18.27), information about antecedents (B ‐74.20, 95% CI ‐117.72 to ‐30.68), behaviour substitution (B ‐123.71, 95% CI ‐184.63 to ‐62.80) and credible source (B ‐39.89, 95% CI ‐72.66 to ‐7.11) were significantly associated with reduced alcohol consumption in unadjusted models. In a multivariable model that included BCTs with B > 23 in the unadjusted model, the BCTs of behaviour substitution (B ‐95.12, 95% CI ‐162.90 to ‐27.34), problem solving (B ‐45.92, 95% CI ‐90.97 to ‐0.87), and credible source (B ‐32.09, 95% CI ‐60.64 to ‐3.55) were associated with reduced alcohol consumption.
The most frequently mentioned theories or models in the included studies were Motivational Interviewing Theory (7/20), Transtheoretical Model (6/20) and Social Norms Theory (6/20). Over half of the interventions (n = 21, 51%) made no mention of theory. Only two studies used theory to select participants or tailor the intervention. There was no evidence of an association between reporting theory use and intervention effectiveness.
Authors' conclusions
There is moderate‐quality evidence that digital interventions may lower alcohol consumption, with an average reduction of up to three (UK) standard drinks per week compared to control participants. Substantial heterogeneity and risk of performance and publication bias may mean the reduction was lower. Low‐quality evidence from fewer studies suggested there may be little or no difference in impact on alcohol consumption between digital and face‐to‐face interventions.
The BCTs of behaviour substitution, problem solving and credible source were associated with the effectiveness of digital interventions to reduce alcohol consumption and warrant further investigation in an experimental context.
Reporting of theory use was very limited and often unclear when present. Over half of the interventions made no reference to any theories. Limited reporting of theory use was unrelated to heterogeneity in intervention effectiveness.
Keywords: Humans; Cell Phone; Computers, Handheld; Minicomputers; Alcohol Drinking; Alcohol Drinking/epidemiology; Alcohol Drinking/therapy; Alcohol‐Related Disorders; Alcohol‐Related Disorders/epidemiology; Alcohol‐Related Disorders/therapy; Behavior Therapy; Behavior Therapy/methods; Binge Drinking; Binge Drinking/epidemiology; Binge Drinking/therapy; Cost‐Benefit Analysis; Motivational Interviewing; Randomized Controlled Trials as Topic; Therapy, Computer‐Assisted; Therapy, Computer‐Assisted/methods
Plain language summary
Does personalised advice via computer or mobile devices reduce heavy drinking?
Review question
We aimed to find out if personalised advice to reduce heavy drinking provided using a computer or mobile device is better than nothing or printed information. We also compared advice provided using a computer or mobile device to advice given in a face‐to‐face conversation. The main outcome was how much alcohol people drank.
Background
Heavy drinking causes over 60 diseases, as well as many accidents, injuries and early deaths each year. Brief advice or counselling, delivered by doctors or nurses, can help people reduce their drinking by around 4 to 5 units a week. In the UK, this is around two pints (1.13 L) of beer or half a bottle of wine (375 mL) each week. However, people may be embarrassed by talking about alcohol.
Search date
Current to March 2017.
Study characteristics The studies included people in workplaces, colleges or health clinics and internet users. Everyone typed information about their drinking into a computer or mobile device ‐ which then gave half the people advice about how much they drank and the effect this has on health. This group also received suggestions about how to cut down on drinking. The other group could sometimes read general health information. Between one month and one year later, everyone was asked to confirm how much they were drinking. Drinking levels in both groups were compared to each other at these time points.
Study funding sources
Many (56%) studies were funded by government or research foundation funds. Some (11%) were funded by personal awards such as PhD fellowships. The rest did not report sources of funding.
Key results We included 57 studies comparing the drinking of people getting advice about alcohol from computers or mobile devices with those who did not after one to 12 months. Of these, 41 studies (42 comparisons, 19,241 participants) focused on the actual amounts that people reported drinking each week. Most people reported drinking less if they received advice about alcohol from a computer or mobile device compared to people who did not get this advice.
Evidence shows that the amount of alcohol people cut down may be about 1.5 pints (800 mL) of beer or a third of a bottle of wine (250 mL) each week. Other measures supported the effectiveness of digital alcohol interventions, although the size of the effect tended to be smaller than for overall alcohol consumption. Positive differences in measures of drinking were seen at 1, 6 and 12 months after the advice.
There was not enough information to help us decide if advice was better from computers, telephones or the internet to reduce risky drinking. We do not know which pieces of advice were the most important to help people reduce problem drinking. However, advice from trusted people such as doctors seemed helpful, as did recommendations that people think about specific ways they could overcome problems that might prevent them from drinking less and suggestions about things to do instead of drinking. We included five studies which compared the drinking of people who got advice from computers or mobile devices with advice from face‐to‐face conversations with doctors or nurses; there may be little or no difference between these to reduce heavy drinking.
No studies reported whether any harm came from the interventions.
Personalised advice using computers or mobile devices may help people reduce heavy drinking better than doing nothing or providing only general health information. Personalised advice through computers or mobile devices may make little or no difference to reduce drinking compared to face‐to‐face conversation.
Quality of the evidence
Evidence was moderate‐to‐low quality.
Summary of findings
Summary of findings for the main comparison. Digital intervention compared to no or minimal intervention for reducing hazardous and harmful alcohol consumption in community‐dwelling populations.
| Digital intervention compared to no or minimal intervention for reducing hazardous and harmful alcohol consumption in community‐dwelling populations | ||||||
| Patient or population: People living in the community Setting: Online, primary care, social care, educational, workplace Intervention: Digital intervention Comparison: No or minimal intervention | ||||||
| Outcomes | Anticipated absolute effects* (95% CI) | Relative effect (95% CI) | № of participants (studies) | Quality of the evidence (GRADE) | Comments | |
| Risk with no or minimal intervention | Risk with digital intervention | |||||
| Quantity of drinking (g/week), based on longest follow‐up (quantity) follow up: range 1 month to 12 months | The mean quantity of drinking (g/week), based on longest follow‐up was 176 g/week | MD 23 g/week lower (30 lower to 15 lower) | ‐ | 19,241 (41 RCTs, 42 comparisons) | ⊕⊕⊕⊝ MODERATE 1 | Heterogeneity was substantial (78%) but not unexplained; interventions differed in content and delivery. The direction of effect favoured the intervention in 88% of the studies. |
| Frequency of drinking (number of days drinking/week), based on longest follow‐up (frequency) follow up: range 1 month to 12 months | The mean frequency of drinking (number of days drinking/week), based on longest follow‐up was 2.5 drinking days/week | MD 0.16 drinking days/week lower (0.24 lower to 0.09 lower) | ‐ | 10,862 (15 RCTs, 16 comparisons) | ⊕⊕⊕⊝ MODERATE 1 | |
| Frequency of binge drinking (number of binges/week), based on longest follow‐up follow up: range 1 month to 12 months | The mean frequency of binge drinking (number of binges/week), based on longest follow‐up was 1.2 binges/week | MD 0.24 binges/week lower (0.35 lower to 0.13 lower) | ‐ | 3587 (15 RCTs) | ⊕⊕⊕⊝ MODERATE 1 | Heterogeneity was moderate (53%) but not unexplained; interventions differed in content and delivery. The direction of effect favoured the intervention in 93% of the studies. |
| Intensity of drinking (g/drinking day), based on longest follow‐up (intensity) follow up: range 1 month to 12 months | The mean intensity of drinking (g/drinking day), based on longest follow‐up was 56 g/drinking day | MD 5 g/drinking day lower (8 lower to 1 lower) | ‐ | 9791 (15 RCTs) | ⊕⊕⊕⊝ MODERATE 1 | Heterogeneity was substantial (78%) but not unexplained; interventions differed in content and delivery. The direction of effect favoured the intervention in 73% of the studies. |
| Adverse events | Not reported | Not reported | ‐ | ‐ | ‐ | No studies assessed this outcome. |
| *The risk in the intervention group (and its 95% confidence interval) is based on the assumed risk in the comparison group and the relative effect of the intervention (and its 95% CI). CI: Confidence interval; RR: Risk ratio; OR: Odds ratio; | ||||||
| GRADE Working Group grades of evidence High quality: We are very confident that the true effect lies close to that of the estimate of the effect Moderate quality: We are moderately confident in the effect estimate: The true effect is likely to be close to the estimate of the effect, but there is a possibility that it is substantially different Low quality: Our confidence in the effect estimate is limited: The true effect may be substantially different from the estimate of the effect Very low quality: We have very little confidence in the effect estimate: The true effect is likely to be substantially different from the estimate of effect | ||||||
1 Downgraded due to high risk of attrition or performance bias or both in many studies. A sensitivity analysis based on the primary meta‐analysis, which omitted studies at high risk of performance bias and contained 11 studies, suggested that the intervention led to a reduction of at least 11 g alcohol (7 to 14 g) or 1.5 UK units (Analysis 1.7).
Summary of findings 2. Digital intervention compared to face‐to‐face intervention for reducing hazardous and harmful alcohol consumption in community‐dwelling populations.
| Digital intervention compared to face‐to‐face intervention for reducing hazardous and harmful alcohol consumption in community‐dwelling populations | ||||||
| Patient or population: People living in the community Setting: Online, primary care, social care, educational, workplace Intervention: Digital intervention Comparison: Face‐to‐face intervention | ||||||
| Outcomes | Anticipated absolute effects* (95% CI) | Relative effect (95% CI) | № of participants (studies) | Quality of the evidence (GRADE) | Comments | |
| Risk with face‐to‐face intervention | Risk with digital intervention | |||||
| Quantity of drinking (g/week), based on longest follow‐up (quantity) follow up: range 1 month to 12 months | The mean quantity of drinking (g/week), based on longest follow‐up was 180 g/week | MD 0.52 g/week higher (24.59 lower to 25.63 higher) | ‐ | 390 (5 RCTs) | ⊕⊕⊝⊝ LOW 1 2 | |
| Frequency of drinking (number of days drinking/week), based on longest follow‐up (frequency) follow up: range 1 months to 12 months | The mean frequency of drinking (no. of days drinking/week), based on longest follow‐up was 1.85 drinking days/week | MD 0.05 drinking days/week higher (0.33 lower to 0.43 higher) | ‐ | 58 (1 RCT) | ⊕⊕⊝⊝ LOW 1 2 | |
| Frequency of binge drinking (number of binges/week), based on longest follow‐up | The mean frequency of binge drinking (no. of binges/week), based on longest follow‐up was 0.7 binges/week | MD 0.04 binges/week higher (0.15 lower to 0.22 higher) | ‐ | 206 (3 RCTs) | ⊕⊕⊝⊝ LOW 1 2 | |
| Intensity of drinking (g/drinking day) | Not reported | Not reported | ‐ | ‐ | ‐ | No studies assessed this outcome. |
| Adverse events | Not reported | Not reported | ‐ | ‐ | ‐ | No studies assessed this outcome. |
| *The risk in the intervention group (and its 95% confidence interval) is based on the assumed risk in the comparison group and the relative effect of the intervention (and its 95% CI). CI: Confidence interval; RR: Risk ratio; OR: Odds ratio; | ||||||
| GRADE Working Group grades of evidence High quality: We are very confident that the true effect lies close to that of the estimate of the effect Moderate quality: We are moderately confident in the effect estimate: The true effect is likely to be close to the estimate of the effect, but there is a possibility that it is substantially different Low quality: Our confidence in the effect estimate is limited: The true effect may be substantially different from the estimate of the effect Very low quality: We have very little confidence in the effect estimate: The true effect is likely to be substantially different from the estimate of effect | ||||||
1 Downgraded one level due to serious risk of bias (high risk of attrition or performance bias or both).
2 Downgraded one level due to serious imprecision (fewer than 400 participants).
Background
Description of the condition
Excessive drinking contributes significantly to physical and psychological illness, injury and death, and a wide array of social harm in all age groups (WHO 2014). Of all deaths worldwide, nearly 6% are attributable to alcohol consumption, and alcohol contributes to over 60 diseases as well as many accidents and injuries. Approximately 5% of the global burden of disease and injury is attributable to alcohol, as measured in disability‐adjusted life years (DALYs).
Alcohol contributes to 20% of deaths due to road traffic accidents, 30% of deaths caused by oesophageal and liver cancers, epilepsy and homicide, and 50% of all deaths caused by liver cirrhosis (WHO 2009). Although drinking limited amounts of alcohol has been reported to decrease the incidence of a small number of diseases and can have a positive social effect, the net effect of alcohol consumption is detrimental to health. The economic cost – including both health and social harms, such as property damage and domestic violence relating to alcohol consumption – tends to amount to more than 1% of gross domestic product in high‐ and middle‐income countries (Rehm 2009).
Excessive drinking can include hazardous, harmful and high‐intensity consumption. People drinking hazardously display a repeated pattern of drinking above recommended limits and are at risk of (but not yet experiencing) physical or psychological harm, whilst those drinking harmfully are drinking above recommended limits and currently experiencing harms (WHO 1992). Hazardous or harmful patterns of alcohol consumption can involve either regular exceeding of consumption guidelines, or high volume consumption which can be regular or infrequent and which is known by a number of terms such as single episode high‐intensity drinking, heavy episodic drinking or often as 'binge' drinking (Herring 2008). There are more people who exhibit hazardous, harmful or high‐intensity drinking than those with alcohol dependence (e.g. McManus 2009 in the UK). At a population level, the greatest impact on alcohol‐related problems can be made by addressing interventions for people who exhibit hazardous, harmful or high‐intensity drinking (McGovern 2013).
Description of the intervention
An evidence‐based strategy for reducing excessive alcohol consumption levels is to offer a brief intervention in primary care settings provided by general practitioners, nurses or other generalist health professionals; this strategy is backed up by findings from 24 systematic reviews and meta‐analyses, encompassing 56 unique trials (O'Donnell 2013). A Cochrane Review incorporating a meta‐analysis of 22 randomised controlled trials (RCTs) found that face‐to‐face brief interventions in primary care settings were consistently effective at reducing excessive drinking, producing an average reduction of 38 g (4 to 5 UK standard drink units) per week (Kaner 2007). These interventions typically comprise a conversation of anywhere between 5 and 45 minutes, include an initial screening process to identify people who are experiencing alcohol‐related risk or harm, provide personalised feedback on alcohol use and harms, identify high‐risk situations for drinking and coping strategies, suggest strategies to increase motivation for positive behaviour change, and develop a personal plan to reduce drinking. This intervention is effective when delivered by a range of health practitioners (Sullivan 2011) and a cost‐effective alcohol risk reduction strategy (Purshouse 2013). Despite clear benefits of face‐to‐face brief alcohol interventions, some heavy drinkers are reluctant to seek help or unable to attend health services, and there are various barriers to delivery from the perspective of health professionals, which results in comparatively low rates of intervention (Brown 2016). Recent technological innovations have enabled people to interact directly via computers, mobile devices or smartphones with digital interventions designed to address problem alcohol consumption using some of the same intervention content (Khadjesari 2011).
How the intervention might work
Digital interventions for alcohol consumption include some of the same features as face‐to‐face interventions to motivate the person to reduce alcohol consumption over time; for example personalised feedback, engaging the person in creating coping strategies and goal‐based plans.
Face‐to‐face brief interventions have generally been found to be effective (Kaner 2007), but various differences should be considered when translating these interventions to a digital medium:
Setting: most of the cited evidence on face‐to‐face studies of brief interventions (Kaner 2007) took place in general practice or emergency care‐based primary care, although there is a growing literature on other health settings, such as general hospital wards (McQueen 2011). However, screening for hazardous and harmful alcohol consumption may not occur or be implemented consistently or reliably in busy healthcare settings and may miss people with problems. Barriers to implementation of alcohol interventions (McAvoy 2001) include excessive drinkers not attending primary care settings, and practitioners being too busy to engage in this work (Wilson 2011). Digital interventions have been proposed as a means of accessing hard to reach groups outside health settings, and also to provide a cheaper alternative to interventions delivered by health professionals within health settings (Kaner 2011).
Modality: digital interventions differ considerably in their modality or delivery mechanism, which may present advantages and disadvantages. Some people may find disclosing excessive alcohol consumption easier if they feel anonymous, but others may feel that their data confidentiality may be at risk if entered and stored electronically. It is possible that face‐to‐face intervention outcomes may be due, at least in part, to therapist effects; greater outcome effects have been reported for delivery by physicians compared to other practitioners (Sullivan 2011). It is also plausible that a smartphone app which can be used anywhere and at any time at the user’s discretion may produce a different effect to a specific computer sited in a primary care practice, despite the actual content being very similar.
Timing: published evidence suggests that alcohol intervention effects may decay over time for face‐to‐face brief interventions (Moyer 2002), which may also apply to digital interventions. Nevertheless, the scope for repeated intervention may potentiate initial effects. Whereas a face‐to‐face intervention is often delivered as a one‐off event (although there can be several sessions), digital interventions may be used as a one‐off or more frequently and regularly over an extended time period.
Population: differences in effectiveness may arise for different population groups due to variations in enthusiasm for (e.g. technophilia versus technophobia) or access to technology; for example by age, gender, ethnicity, or socio‐economic status.
Most brief interventions are typically structured according to a FRAMES approach which includes: giving Feedback on the person's intake, impressing the Responsibility for change onto them, offering Advice, listing a Menu of options, having an Empathic approach, and building Self‐efficacy (Miller 1994). However, intervention components are more complex in that they are usually made up of several behaviour change techniques (BCTs) and may incorporate several stages. A BCT is “an observable, replicable, and irreducible component of an intervention designed to alter or redirect causal processes that regulate behaviour" (Michie 2013; Michie 2015).
To identify the ‘active ingredients’ within interventions, it is important to document the component BCTs using a reliable method. For example, an analysis of brief interventions, based on the trials in the Cochrane Review by Kaner 2007 and using a reliable taxonomy of BCTs, identified self‐monitoring as an effective component of these health promoting approaches (Michie 2012).
Economic modelling based on published studies to date has suggested that a programme of face‐to‐face brief interventions rolled out in primary care would be cost‐effective compared to no programme; providing additional health benefits at reduced health service cost (Angus 2014; Purshouse 2013). Little has yet been published on the cost‐effectiveness of digital alcohol interventions, although one study (Blankers 2012) suggested that internet‐based therapy (including a therapist) is more cost‐effective than internet self‐help. A question remains on the relative cost‐effectiveness of digital versus face‐to‐face interventions.
Why it is important to do this review
An overview of reviews (Kaner 2012) identified a large and relatively well‐designed research literature with around 35 published trials in this field around the beginning of the current decade (e.g. Carey 2009a; Khadjesari 2011; Rooke 2010; White 2010). Since this point, the number of trials has increased significantly, and a number of systematic reviews of this evidence base have reported findings often in specific population subgroups. This body of work included the use of technology to deliver alcohol interventions in educational contexts, health and social care settings, and other community‐based settings as well as via the internet or mobile phone applications. In this review we advanced upon previous reviews by taking a public health (secondary) prevention perspective and focusing on people living in the community who were not seeking formal treatment for alcohol‐related problems but nonetheless were drinking at a level which could cause them risk or harm. Participants had to have undergone a screening process to assess drinking behaviour, and risky or harmful drinkers had to engage with any digitally delivered intervention designed to help reduce alcohol consumption. We did not restrict our focus by type of digital intervention so as to capture all interventions targeting this population, and include interventions which take place on multiple platforms (e.g. text prompts to use smartphone apps). We also compared the effect of digital alcohol interventions to face‐to‐face brief alcohol interventions often delivered by health professionals. Health professionals are an established part of public health policy (e.g. UK Government 2012), but practitioners report limited time to screen and deliver alcohol intervention to patients. In addition, some people may be reluctant to disclose heavy alcohol consumption to doctors, nurses or other practitioners. Finally, the digital intervention field is a fast‐moving and rapidly evolving field, so it is crucial to keep the evidence base up to date.
Objectives
The main objective of this review was to assess the effectiveness and cost‐effectiveness of digital interventions for reducing hazardous and harmful alcohol consumption,alcohol‐related problems, or both in people living and recruited from the community. Specifically, we addressed the following questions:
Are digital interventions more effective and cost‐effective than no intervention (or minimal input) controls?
Are digital interventions at least equally as effective as face‐to‐face brief alcohol interventions?
What are the effective component behaviour change techniques (BCTs) of such interventions and their mechanisms of action?
What theories or models have been used in the development and/or evaluation of the intervention?
Secondary objectives were as follows:
To assess whether outcomes differ between trials where the digital intervention targets participants attending health, social care, education or other community‐based settings and those where it is offered remotely via the internet or mobile phone platforms.
To specify interventions according to their mode of delivery (e.g. functionality features) and assess the impact of mode of delivery on outcomes.
Methods
Criteria for considering studies for this review
Types of studies
We included randomised controlled trials (RCTs) with individual, cluster, or stepped wedge designs. We did not restrict inclusion by language or publication status.
Types of participants
Participants were people living in the community whose alcohol consumption had been screened as hazardous or harmful (WHO 1992) and who were directed toward any digital intervention including web‐based, mobile phone text messaging, smartphone apps, social networking, or stand alone computer‐based technologies (including CD‐ROMs). Recruitment was via a range of settings, including primary healthcare (including emergency departments and community midwifery services), social care, educational, workplaces or the internet. No restriction was applied to where participants interacted with the intervention, since it could be delivered through mobile devices. We did not restrict to a particular age group because we aimed to assess the effectiveness of digital alcohol interventions for all current drinkers who were likely to experience risk or harm due to alcohol consumption. Although some countries restrict the age at which people can legally purchase alcohol, this does not necessarily mean it is illegal to drink alcohol (except in very young children). As an example, in the UK it is not legally permissible for people under the age of 18 years to purchase alcohol. However, it is legal for these people to drink alcohol provided by family members in their homes; the current UK lower legal age at which alcohol can be consumed under supervision is five years of age (UK Government 2017).
Studies were excluded if:
interventions were directed mainly toward people who were seeking specialist health or social care treatment for their alcohol consumption, or who were in treatment for, or recovery from, alcohol dependence (e.g. 12‐step programmes);
interventions were directed mainly at primary prevention, i.e. preventing or delaying the onset of alcohol consumption;
interventions were delivered in a secondary or tertiary care setting;
interventions were delivered to people who were not living freely in the community (e.g. prisoners);
interventions were targeted at someone other than the drinker (e.g. at a significant other or someone serving alcohol);
participants were under obligation to complete the intervention, or had extra motivation to reduce their drinking, e.g. mandated college students (where low consumption satisfies the mandate) or interventions associated with drink driving. The effect of the mandate to complete the intervention or to reduce consumption would give participants extra motivation compared to those using the intervention freely, which might confound the results; or
participants were screened according to their alcohol consumption but it did not have to be hazardous, e.g. participants reported consuming alcohol in the last month.
Types of interventions
Interventions were digital, defined as being delivered primarily through a programmable computer or mobile device (laptop, phone or tablet), and were responsive to user input to generate personalised content which aimed to change the participants’ alcohol‐related behaviours. Interventions were not restricted to those accessible online.
Interventions targeting multiple behaviours (e.g. other substance abuse) or conditions (e.g. depression) were included if all participants were screened into the trial as risky drinkers and alcohol consumption data were reported separately.
For primary objectives 1 and 3 the control condition was no intervention (screening or screening and assessment only), printed or onscreen health or alcohol‐related information, or in a health setting the care the patient would have received anyway for their presenting complaint. For primary objective 2, the control condition was a face‐to‐face brief intervention to reduce alcohol consumption or harm.
Studies were excluded if:
the intervention was limited to replicating a real‐time talk‐based intervention (e.g. a conversation by mobile phone). Trials of real‐time interventions which were not talk‐based (e.g. instant messaging), or talk‐based interventions which were not in real time (e.g. on video/DVD/YouTube where replay was available) were included;
digital technology was used to screen participants into the study but the advice or behaviour change element was solely face‐to‐face;
two digital interventions were compared to each other with no control arm; or
the intervention did not generate feedback or other output based on the personal characteristics of the user (e.g. generic educational interventions).
Types of outcome measures
Studies were included if they measured alcohol consumption in grams of alcohol per week (and converted from other measures where possible). We included quantity (g/day), frequency (drinking days/week) and intensity (drinks/drinking day) of consumption in 'Summary of findings' tables. We assessed outcomes on the basis of the behaviour change techniques (BCTs) incorporated in the interventions, their theoretical underpinning, and mechanisms of action as reported elsewhere (Webb 2010).
Primary outcomes
Many types of outcome measures are available in the alcohol literature. Our primary outcome was quantity of alcohol consumed, which we converted into grams of alcohol per week using either definitions in the trial report where available, or from governmental definitions (listed in Kalinowski 2016). We considered trials reporting outcomes at one month or longer post‐intervention, but separated trials according to follow‐up time, as well as by longest follow‐up time.
Secondary outcomes
Other measures of consumption (e.g. number of binge episodes, frequency of drinking occasions, number of participants exceeding limits as defined by study authors).
Indices of alcohol‐related harm or social problems to the drinkers or affected others.
Cost‐effectiveness.
Any reported adverse effects.
Search methods for identification of studies
The following sources of information were used to capture studies for the review. The search was not limited by publication status, language or date (some digital interventions, such as CD‐ROMs, were available in the 1980s).
Electronic searches
We used thesaurus headings (such as MeSH headings in MEDLINE), title and abstract terms, and the Cochrane Highly Sensitive Search Strategy for randomised trials: sensitivity‐maximising version (2008 revision) (Lefebvre 2011). The search strategy was designed in MEDLINE on OVID (Appendix 1) and translated as appropriate to other databases searched.
MEDLINE (OVID) 1946 to March week 1 2017, searched 15 March 2017 (Appendix 1).
PubMed (www.ncbi.nlm.nih.gov/pubmed), searched 29 January 2016.
Cochrane Database of Systematic Reviews (CDSR) (Wiley) issue 3 2017, searched 18 March 2017 (Appendix 2).
Cochrane Central Register of Controlled Trials (CENTRAL) (Wiley) issue 2 2017, searched 18 March 2017.
Database of Abstract of Reviews of Effects (DARE) (Wiley) issue 2 2015, searched 18 March 2017.
Health Technology Assessment (HTA) (Wiley) issue 1 2017, searched 18 March 2017.
PsycINFO (OVID) 1967 to March week 1 2017, searched 15 March 2017 (Appendix 3).
CINAHL (EBSCO) 1981 to March 2017, searched 18 March 2017 (Appendix 4).
ERIC (EBSCO) 1966 to March 2017, searched 23 March 2017 (Appendix 5).
SCI Science Citation Index (Web of Knowledge) 1970 to March 2017, searched 23 March 2017 (Appendix 6).
CPCI‐S Conference Proceeding (Web of Knowledge) 1990 to March 2017, searched 23 March 2017 (Appendix 6).
International Alcohol Information Database (ICAP) www.drinksresearch.org, searched 16 January 2015 (unavailable when running update March 2017).
Index to Theses www.theses.com searched 15 April 2014.
British Library EThOS ethos.bl.uk searched 25 March 2017.
Clinicaltrials.gov searched 25 March 2017.
WHO International Clinical Trials Registry Platform (ICTRP) www.who.int/ictrp/en searched 25 March 2017.
Google Scholar searched 25 March 2017.
We searched the following websites for evaluations of digital interventions:
Beacon 2.0 beacon.anu.edu.au
Substance Abuse and Mental Health Services Administration (SAMHSA) NREPP (National Registry of Evidence‐based Programs and Practices) nrepp.samhsa.gov/Index.aspx
Drug and Alcohol Findings findings.org.uk.
Searching other resources
We checked the reference lists of all included studies and relevant reviews.
Data collection and analysis
Selection of studies
Two review authors independently screened all titles and abstracts identified from the search, using EndNote version X7 (Endnote 2014) to ensure consistency in screening approach. The full text of any studies identified as being potentially eligible for inclusion were assessed by two review authors independently. Any discrepancies were resolved by consulting a third review author.
Data extraction and management
Separate data extraction forms were developed and piloted in MS Excel for outcome extraction, BCT coding and theory coding. These were used by two independent review authors to extract data from all included studies (8 review authors extracted outcomes data and 2 review authors extracted theory and BCT data). Any discrepancies were resolved by consulting a third review author.
Outcome data
Outcome data were extracted as follows: details of the intervention (e.g. setting, duration, mode of delivery and costs), participants (size and characteristics of sample), trial design (to enable critical appraisal), and baseline and follow‐up consumption data (all reported follow‐up points).
Behaviour change techniques (BCT) data
All studies were coded for BCTs using a taxonomy of 93 distinct BCTs (BCTTv1) developed by consensus methods with input from a large group of international behaviour change experts (Michie 2015; Michie 2013). Intervention descriptions were read line‐by‐line, text that may indicate the presence of a BCT was highlighted, and highlighted text was compared to the definition for the BCT given in the taxonomy (Michie 2013). A BCT was coded as included only when it was explicitly present.
The reliability of the method was developed and assessed in iterative rounds of coding. Two review authors independently coded a sample of five studies. Coding differences were resolved through discussion and the coding manual was reviewed and updated in the light of these discussions. If agreement could not be reached, the views of a behaviour change expert were sought. Inter‐rater reliability (IRR) was assessed with both the Kappa and prevalence‐adjusted bias‐adjusted Kappa (PABAK) statistics. Cohen’s Kappa accounts for coders agreeing on the presence of codes (Landis 1977). PABAK is an adjusted Kappa statistic that accounts for coders agreeing on the presence and the absence of codes (Byrt 1993). Whilst it is important to measure levels of agreement about the absence of BCTs, using PABAK alone could result in the reporting of exaggerated levels of agreement when coding against a taxonomy of 93 BCTs, most of which were unlikely to be used in any one intervention (Direito 2014; Dombrowski 2012). Therefore, IRR was assessed with both statistics. The first round of joint coding lead to an IRR of Kappa = 0.73, PABAK = 0.95, which reflects a substantial level of agreement (Landis 1977). As this exceeded the pre‐determined threshold of Kappa = 0.70, remaining studies were coded by one review author, with the second coding 22% (8/36) of the same studies to ensure against rater drift. The IRR for all included studies that were also joint coded was Kappa = 0.73, PABAK = 0.96, n = 13 (for all joint‐coded studies prior to exclusion: Kappa = 0.70, PABAK = 0.95, n = 38/90).
Theory data
The extent to which a theory or model of behaviour was used in the development or evaluation of the intervention was investigated with the 19‐item Theory Coding Scheme (Michie 2010). Two review authors independently coded a sample of five studies and differences were resolved through discussion. The coding guidelines were amended in accordance with these discussions. If agreement was not reached, the views of a behaviour change expert were sought. IRR was assessed with the PABAK statistic as described previously (Byrt 1993). Further rounds of testing were performed until the IRR reached a substantial level of agreement (≥ 0.70; Landis 1977). After this level of agreement was achieved, the remaining studies were coded by one review author. The PABAK statistic across the five rounds of IRR checking was 0.84 which reflects a substantial level of agreement. The Theory Coding Scheme has 19 items; two of these items (quality of measures and randomisation of participants to condition) were not evaluated in this Cochrane Review because they relate to methodological issues rather than informing whether or how theory was used in an intervention. Of the 17 items coded, three had sub‐items (12a, 12b, 14a, 14b, 14c, 14d, 17a, 17b). If a theory or model of behaviour was mentioned (item 1), then the relevant name was documented. Each of the 22 items and sub‐items were dummy coded as present (1) or absent (0). If a protocol or other paper was referenced as describing the intervention, then that paper was also coded for use of theory, although only for items 1 to 11 which relate to the development of the intervention rather than the evaluation.
The Theory Coding Scheme specifies theory use in six categories (Michie 2010); reference to underpinning theory (items 1 to 3); whether any relevant theoretical constructs are targeted by the intervention (items 2, 5, and 7 to 11); whether theory was used to select recipients or tailor interventions (items 4 and 6); measurement of constructs (items 12a and 12b); whether mediation effects were tested (items 12a and 12b, 13, 14a to 14d, 15, 16); whether the results of the study were used to refine theory (items 17a and 17b). Composite scores were calculated for these six areas of theory use. A total use of theory score (sum of all items) was also calculated. These composite scores were used as a crude estimate of the extent of theory use in specific areas, or in total, as a basis of assessing the relationship between that and the effect size of the intervention.
There were two pairs of items (items 7 and 8; items 10 and 11) in the Theory Coding Scheme that refer to “all” and “at least one”, respectively. For the composite scores of theory use, if the all items (7 and 10) were coded as 1 then the at least one item was also coded as 1 (as in Webb 2010). This was to ensure that the composite scores of theory use were representative of the studies and that studies credited with linking all theoretical constructs (for example) are also credited as linking some. Otherwise, linking one theoretical construct would give the same contribution toward the use of theory score as would linking all the constructs.
Assessment of risk of bias in included studies
Risk of bias was assessed independently by two review authors using the criteria recommended in the Cochrane Handbook (Higgins 2011). The recommended approach for assessing risk of bias in studies included in Cochrane Reviews is a two‐part tool, addressing seven specific domains: sequence generation and allocation concealment (selection bias), blinding of participants and providers (performance bias), blinding of outcome assessor (detection bias), incomplete outcome data (attrition bias), selective outcome reporting (reporting bias), and other sources of bias. The first part of the tool involves describing what was reported to have happened in the study. The second part of the tool involves assigning a judgement relating to the risk of bias for that entry, in terms of low, high or unclear risk. To make these judgments we used the criteria indicated by the Handbook adapted to the addiction field (see Appendix 7 for details).
'Risk of bias' assessments were used to carry out sensitivity analyses (see Sensitivity analysis).
Measures of treatment effect
Consumption outcomes
For continuous variable outcomes (e.g. quantity of alcohol consumed) we examined mean differences (MD) with the uncertainty in each result being expressed with a 95% confidence interval (CI), and for dichotomous outcomes (e.g. participants classified as binge drinker, or drinking over set limits) we examined proportions using relative risks (RR) with 95% CI. Where outcomes had been assessed at more than one time, data for each time point were extracted. The primary analyses focused on the longest follow‐up time.
Unit of analysis issues
It had been planned that for trials with more than one – and very similar – control arms, the results for these arms would be combined in the meta‐analysis. However, this was not required since, as described in the Results section, there was only one relevant control arm for each trial included in the meta‐analysis. The same approach was planned for very similar intervention arms. However, it was not used, since for trials with more than one relevant intervention arm, the results for each arm were analysed separately because the interventions were substantively different from each other so it was not appropriate to combine them (Collins 2014 (DBF); Collins 2014 (PNF)).
Cluster randomised trials were eligible for inclusion in the meta‐analysis. If the analysis in a trial reported a standard error for the intervention effect that accounted for the cluster design, then, so data could be presented and analysed in the same manner as for non‐cluster trials, we assigned imputed standard deviations to the intervention and control groups such that the standard error of the intervention effect calculated by the weighted mean difference method in Review Manager 2014 was the same as the reported standard error. If the analysis in a trial report did not account for the cluster design, we had planned to add an external estimate of the intra‐cluster coefficient (ICC) to estimate a design effect, thus inflating the variance of the effect estimate. However, this situation did not occur in the trials included in the meta‐analysis.
Dealing with missing data
We contacted study authors to obtain missing data and seek clarification where appropriate. Where this was impossible, we estimated primary outcome measures using secondary outcome measures; for example, we estimated quantity of alcohol consumed using frequency and intensity of consumption, although it was not possible to estimate the associated standard deviation. Trials with missing standard deviations or for which the number of participants in each arm was not reported were excluded from the main analysis for the associated continuous measure, but were included in a sensitivity analysis, using imputed values for the standard deviations or the number of participants in each arm.
Assessment of heterogeneity
The magnitude of heterogeneity was assessed using the I² statistic, and the statistical significance of the heterogeneity was assessed using P values derived from Chi² tests (Deeks 2001). The cut‐off points were I² value of more than 50% and a P value for the Chi² test of less than 0.1. Heterogeneity was explored both narratively and using subgroup and sensitivity analyses. The trials were heterogeneous, due not only to the variation in delivery methods (e.g. web, app, CD‐ROM) but also to aspects of content (e.g. focus on feedback versus behaviour change, duration of exposure).
Assessment of reporting biases
We assessed whether studies appeared to have incomplete reporting bias by noting in the risk of bias assessments whether the reported outcomes matched methods sections or any published protocols. We made every effort to minimise publication bias by searching a wide range of databases and sources of grey literature and not restricting by language or publication status, but we used funnel plots to assess the potential for bias related to the size of the trials when there were at least 10 studies included in the meta‐analysis. Funnel plots and associated approximate (pseudo) 95% confidence limits were calculated using the meta‐funnel option in Stata version 14 (Stata 2015).
Data synthesis
We pooled data for each outcome using a random‐effects model in a meta‐analysis that compared intervention and control arms using Review Manager 2014. For continuous measurements, the weighted mean difference was calculated to estimate pooled effect sizes and 95% CIs. If means or standard deviations at follow‐up were not available, change scores were used instead on the proviso that their standard deviations were available. If the median and inter‐quartile range were reported in place of the mean and standard deviation, then the mean and standard deviation were estimated from the inter‐quartile range. If only the mean difference and its 95% CI were reported (e.g. as in Hansen 2012), then data were entered into Review Manager 2014 so that the reported values for the mean difference and CI were included in the meta‐analysis. For dichotomous outcomes, relative risks and 95% CIs were calculated and pooled in a meta‐analysis using Mantel‐Haenzel weighting.
Where possible, we had planned to consider key population groups such as men versus women, older versus younger participants, and different socio‐economic groups. However, the opportunity for analyses of these types was limited by the availability of relevant data.
We planned to estimate long‐term cost‐effectiveness of strategies for the use of internet, mobile phone text messaging, smart phone app interventions or computer‐based technologies by adapting the current Sheffield Alcohol Policy Model (SAPM) analysis of screening and brief interventions, but we found insufficient data. Instead, we included a summary review of the available studies with economic findings.
Behaviour change technique (BCT) analysis
The revised metareg command in Stata version 14 (Stata 2015) was used to conduct a series of random‐effects unadjusted meta‐regression models to assess the associations between individual BCTs and effect size. The regression coefficients (B) represented an estimate of effect (mean difference (MD) in quantity of drinking, expressed in grams per week) per unit increase in the covariate (dummy‐coded as 1 = used the BCT or 0 = did not use the BCT). Only BCTs uniquely present in experimental arms, i.e. not present in both experimental and control arms, were included in analyses. A negative coefficient for a BCT indicated that studies using that BCT produced a larger pooled effect than studies that did not. The approach used in a previous meta‐regression study of the BCTs contained within physical activity and healthy eating interventions was adopted (Michie 2009); to be included in analysis, each BCT needed to be used in at least four separate studies.
To assess the independent association after mutual adjustment, we created a multivariable meta‐regression model including all BCTs that had a meaningful association with effect in the unadjusted models. A meaningful association was defined a priori as B < ‐23, which in absolute terms was the lower confidence interval of the effect size reported in a meta‐analysis of the effect of brief advice on alcohol consumption (Kaner 2007). The lower confidence interval of the previous Cochrane Review by Kaner 2007 was chosen to enable comparisons between the effectiveness of face‐to‐face and digital interventions. The size and significance of the associations in the multivariable model were regarded as providing the primary indication of association between BCTs and effect.
To assess the association between the total number of BCTs included in experimental arms and effect size we created a random‐effects unadjusted meta‐regression model. Lastly, we assessed the overall fit of a model, in terms of adjusted R², containing only a theoretically derived cluster of Control Theory congruent BCTs. These BCTs were grouped into four categories: Goals (goal setting (behaviour), goal setting (outcome), review behaviour goal(s), review outcome goal(s), discrepancy between current behaviour and goal)); self‐monitoring (self‐monitoring of behaviour, self‐monitoring of outcome(s) of behaviour, monitoring of emotional consequences); feedback (feedback on behaviour, feedback on outcome(s) of behaviour, biofeedback) and action plans (action planning). Trials were dummy‐coded as 1 = used BCTs from three or four of these groupings; or 0 = used BCTs from two or less of these groupings.
Theory analysis
Frequency counts and descriptive statistics were used to describe the theoretical basis for digital interventions of alcohol reduction. The range and frequency of theories used were tabulated.
A series of random‐effects unadjusted meta‐regression analyses were conducted to examine the association between the Theory Coding Scheme covariates (individual theory items, required to be included by at least 10% of studies; categories of theory use; and total theory use), with intervention effectiveness and the percentage of the between‐study heterogeneity (adjusted R²) explained by each predictor.
The meta‐regression analyses were conducted in Stata version 14 (Stata 2015) using the metareg command. Effect sizes were based on a random‐effects model because the intervention effects were likely to have residual heterogeneity not modelled by the covariates. The effectiveness of the intervention was measured using the primary outcome measure of difference in quantity of alcohol consumption (g of ethanol) per week between the digital intervention and control arms at the longest follow‐up time point. The weighted mean difference was calculated to estimate pooled effect sizes and 95% CIs.
In these analyses, the regression coefficient (B) represented an estimate of effect (mean difference in quantity of alcohol consumption, g/week) per unit increase in the covariate. A negative coefficient for a covariate indicated that studies reporting that theory item, or with higher scores on the categories of theory use and total theory use, were associated with a larger reduction in consumption than studies that did not. The P value indicated whether the B weight was statistically significantly different from zero, based on a two‐sided test. The adjusted R² value indicates the proportion of between‐study variance explained by each predictor.
To investigate the independent associations, an adjusted meta‐regression analysis was conducted, including all of the variables that had a meaningful association with effect in the unadjusted models. As before, a meaningful association was defined as B < ‐23 as for the BCT models.
Subgroup analysis and investigation of heterogeneity
Subgroup analyses were carried out based on:
Timing of outcomes: to investigate possible decay over time, based on a pragmatic grouping of trials according to the follow‐up time points reported.
Component BCTs (Michie 2013) as a comparison for face‐to‐face brief interventions.
Theoretical basis of the interventions.
Key population subgroups: by age (adolescents and young adults) and gender.
We also planned to carry out a subgroup analysis based on socio‐economic status but insufficient information was reported in the included trials.
We planned to undertake a subgroup analysis according to mode of delivery of interventions (e.g. web sites versus smartphone app), but most were delivered via web sites and there were insufficient trials of interventions delivered via other mechanisms.
Funnel plots split by subgroups and meta‐regressions on longest period of follow‐up and on year of publication were constructed using Stata version 14 (Stata 2015).
Sensitivity analysis
We conducted sensitivity analyses by investigating the effect of omitting studies with either a high risk of attrition bias or a high risk of performance bias (due to lack of participant blinding). We also investigated the sensitivity of the analysis based on the primary outcome measure to including studies with unknown standard deviations (by inputting the median SD from studies that did report this) or unknown numbers of participants per arm (by assuming approximately equal numbers in each arm, based on the total number of participants at the time in question).
'Summary of findings' tables
We used the GRADE approach to assess the quality of the evidence.
The GRADE Working Group developed a system for grading the quality of evidence (GRADE 2004; Guyatt 2008; Guyatt 2011), which takes into account issues not only related to internal validity but also to external validity, such as directness of results. The 'Summary of findings' tables present the main findings of a review in a transparent and simple tabular format. In particular, they provide key information concerning the quality of evidence, the magnitude of effect of the interventions examined and the sum of available data on the main outcomes.
The GRADE system uses the following criteria for assigning grades of evidence:
High: We are very confident that the true effect lies close to that of the estimate of the effect.
Moderate: We are moderately confident in the effect estimate: the true effect is likely to be close to the estimate of the effect, but there is a possibility that it is substantially different .
Low: Our confidence in the effect estimate is limited: the true effect may be substantially different from the estimate of the effect.
Very low: We have very little confidence in the effect estimate: the true effect is likely to be substantially different from the estimate of effect.
GRADEpro GDT 2015 was used to import data from Review Manager 2014 for the main outcomes of quantity of drinking (g/week), frequency of drinking in terms of days/week and binges/week, and intensity of drinking (drinks/drinking day) for each of the comparisons (digital intervention versus control or minimal intervention, digital intervention versus face‐to‐face intervention). The tables were then imported back into the review (Table 1; Table 2).
Results
Description of studies
Results of the search
The search retrieved 3506 records after deduplication (Figure 1), which were screened by title and abstract in EndNote by two independent review authors. We excluded 3363 abstracts at this stage and retrieved the full text of 135 papers for further detailed evaluation, from which we selected 55 papers (reporting 57 studies) for inclusion in the review (Figure 1).
1.
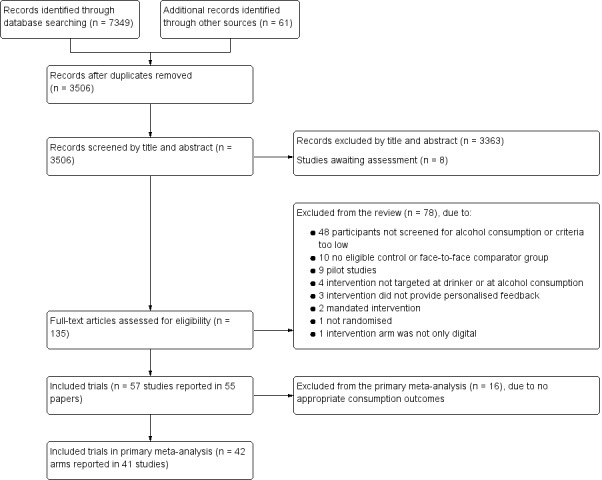
Study flow diagram
Included studies
Full details of the included studies are listed in the Characteristics of included studies section. We included 57 studies (reported in 55 papers) which randomised a total of 34,390 participants.
Of these, 33 studies were conducted in North America, 16 in mainland Europe, two in the UK, one in Japan, and five in Australasia.
One study recruited only women or girls (Delrahim‐Howlett 2011), three studies recruited only men or boys (Araki 2006; Bertholet 2015; Boon 2011), whilst another four studies recruited both but reported gender‐specific results (Chiauzzi 2005; Hansen 2012; Khadjesari 2014; Lewis 2007a). One study reported results by ethnicity (African American versus Caucasian students, Murphy 2010 (Study 1)).
Thirty‐seven studies considered teenagers, younger adults or students or both; the remaining 20 studies were specific to adults.
Thirty‐seven studies were based on interventions delivered completely online, and in 20 studies, the intervention was location specific.
Follow‐up times ranged from 1 to 24 months (median = 3 months). Fifty‐five trials compared a digital intervention to a no intervention or minimal intervention group, of which 41 reported appropriate information to be included in the primary meta‐analysis (one trial contained two substantially different intervention arms which were treated separately, so that there are 42 comparisons in the primary meta‐analysis). Seven trials included a comparison of a digital intervention versus a face‐to‐face intervention (Araki 2006; Blankers 2011; Butler 2009; Murphy 2010 (Study 1); Murphy 2010 (Study 2); Wagener 2012; Walters 2009), of which five (Butler 2009; Murphy 2010 (Study 1); Murphy 2010 (Study 2); Wagener 2012; Walters 2009) reported appropriate information to be included in the meta‐analysis. Six trials had a digital, face‐to‐face, and a no intervention control arm (Araki 2006; Blankers 2011; Butler 2009; Murphy 2010 (Study 2); Wagener 2012; Walters 2009).
A wide range of consumption outcomes was reported in the included trials, the most common were:
quantity of consumption in terms of mean or median units, drinks or grams per day, week, fortnight or month;
frequency of consumption in terms of percentage of drinking days over time or mean number of heavy drinking days;
intensity of consumption in terms of mean or median or peak drinks per drinking day or on the last or heaviest occasion;
screening tool results such as mean or median AUDIT or AUDIT‐C or FAST score, or percentage of participants over a certain score;
binge drinking percentage; and
blood alcohol concentration (BAC). BAC was reported as an estimate based on participants' self‐reported consumption rather than a direct measure so we did not use in the meta‐analysis because it was not adding to other self‐reported consumption measures.
We contacted one author because an outcome was reported differently in the tables than the text.
Study funding sources
Many (56%) studies were funded by government or research foundation funds. Some (11%) were funded by personal awards such as PhD fellowships. The rest of the studies did not report sources of funding.
Excluded studies
After checking the full text of studies we excluded 78 paper of 135 obtained (see Characteristics of excluded studies table). The most common reason for exclusion (n = 48) was that participants were not screened as hazardous or harmful drinkers ‐ including studies where participants only had to have consumed "any alcohol" or "one or two drinks" in the previous six months, and studies which aimed at primary prevention. Four studies were excluded because the target of the intervention was not the drinker themselves, or it was targeting other substances alongside alcohol and alcohol consumption could not be separated. The intervention was ineligible in six studies, including two where it was mandated (e.g. for university students who had to demonstrate reduced consumption to continue their courses). Other interventions were generic rather than personalised, or were not solely digital, or the feedback was not related to alcohol consumption. We excluded 10 studies because the comparator was either another digital intervention or the control group was not comparable to other studies. One study was excluded because it was not randomised, and nine because they were either pilot studies for which we had the full trial or aimed to test feasibility. See Characteristics of excluded studies.
Studies awaiting classification
Eight studies await classification (Characteristics of studies awaiting classification). Four studies tested digital interventions in college students (Balestrieri 2016; Bock 2016; Leeman 2016; Gajecki 2017). Balestrieri 2016 replicated the Australian College Drinkers Check‐up intervention (Hester 2012 (exp 1); Hester 2012 (exp 2)) in the USA, and reported a reduction in consumption and alcohol‐related consequences in intervention participants compared to control. Leeman 2016 reported that a multi‐component web‐based intervention called THRIVE also reduced consumption, and Gajecki 2017 found no difference between an intervention group receiving access to a skills training smartphone app and control. Bock 2016 reported that an SMS‐based intervention (TMAP) reduced heavy drinking and alcohol‐related consequences. Another USA study (Muench 2017) tested different types of SMS messages in a population recruited online, and reported that an automated daily message can reduce drinking more than weekly self‐tracking, and that a tailored adaptive text produced the greatest effect sizes. Two studies reported no difference in consumption between a computer‐assisted brief intervention and control: one delivered to patients in a French emergency department (Duroy 2016), and the other to American post‐partum women (Ondersma 2016). Finally, Acosta 2017 reported a reduction in consumption in veterans with posttraumatic stress disorder (PTSD) receiving a cognitive behavioural therapy (CBT) web‐based intervention.
Ongoing studies
Three of the ongoing studies are evaluating the use of smartphone apps for reducing hazardous or harmful alcohol consumption. Two are taking place in the UK: the SIPS Jr trial (ISRCTN45300218) is recruiting adolescents (aged 14‐18 yrs) in emergency departments, and a second trial (ISRCTN40104069) is testing the Drink Less app in a UK population of hazardous and/or harmful alcohol users. Three apps (Promillekoll, PartyPlanner and TeleCoach) are being evaluated in a further trial recruiting Swedish university students (NCT02064998). Finally, ISRCTN10323951 is a trial of a web‐based self‐help intervention for hazardous drinkers with mild to moderate depression.
Risk of bias in included studies
All reported outcomes in this review relate to self‐reported consumption of alcohol by participants, and so we have summarised the risk of bias at the study rather than the outcome level (Figure 2). Risk of bias assessments for each study are presented in Characteristics of included studies.
2.
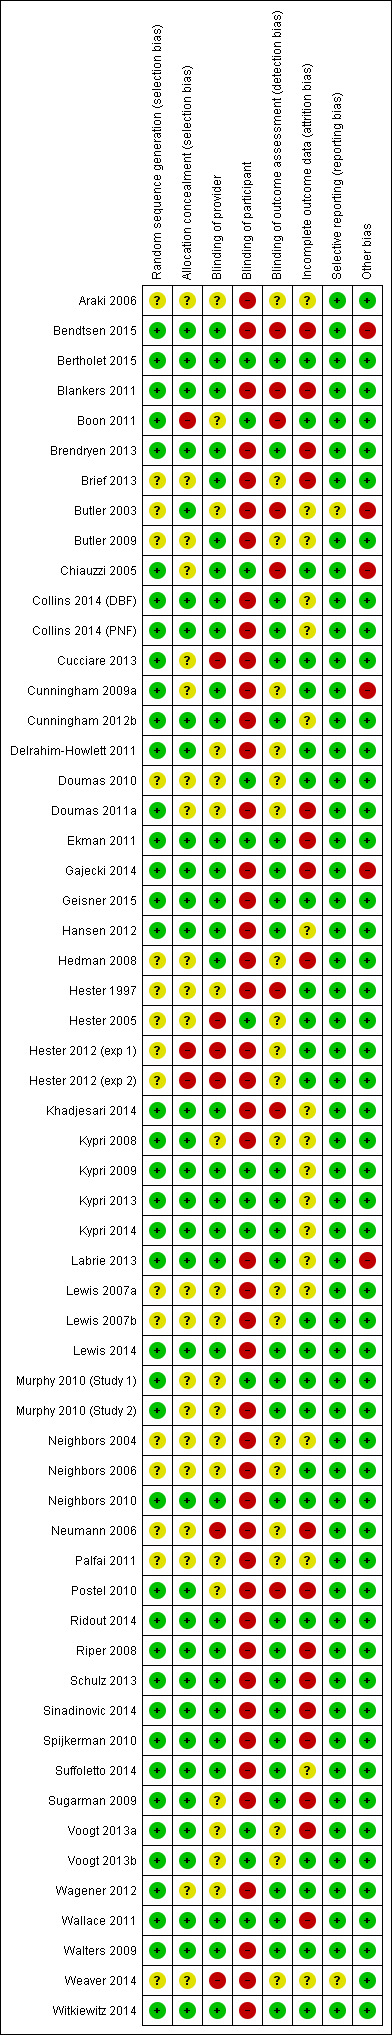
Risk of bias summary: review authors' judgements about each risk of bias item for each included study
Allocation
Random sequence generation
None of the included studies were assigned high risk of bias due to the method of randomisation. Fifteen studies were judged to have an unclear risk of bias due to randomisation because it was not clear whether the process was automated and the sequence generation process was not clearly reported. Forty‐one studies (72%) were considered to be at low risk of bias either because sequence generation took place as part of a completely automated assessment and intervention process, or because authors described using a computer‐generated sequence generation process.
Allocation concealment
It was clear from the description of the process in 29 studies that allocation was completely automated. These studies were judged to be at low risk of bias, along with an additional five studies that described allocation being conducted by someone independent of the trial, giving a total of 34 studies (60%) at low risk of bias due to allocation concealment. Two studies (4%) were judged to be at high risk of bias due to allocation concealment: Boon 2011 reported that the condition to which participants were assigned was revealed to research assistants once recruitment was complete; and in Hester 1997, a researcher was reported to log both intervention and control participants' data into the computer.
Blinding
Performance bias
Trials were judged by default to be at high risk of performance bias due to participant blinding because participants always knew that they were receiving alcohol‐related advice. However, if trials reported that there was an attempt to blind participants (e.g. by 'camouflaging' alcohol advice among other health‐related information) then the trial was assigned as low risk of bias in this respect ‐ 13 trials (23%) received this rating.
Detection bias
We judged 29 trials (51%) to be at low risk of detection bias. Eight trials (14%) (Bendtsen 2015; Blankers 2011; Boon 2011; Butler 2003; Chiauzzi 2005; Hester 1997; Khadjesari 2014; Postel 2010) were judged to be at high risk of bias because outcome assessment was not automated and researchers carrying out the assessments could have been aware of participant allocation. Outcome assessment for both intervention and control groups tended to occur by the same mechanism within individual trials, so we did not consider there was any difference in the risk of detection bias between intervention and control participants in the same trial.
Incomplete outcome data
The main source of bias in the included studies was due to attrition; follow‐up was challenging because there was often little face‐to‐face contact between trialists and participants. Trials were judged to be at high risk of attrition bias if loss to follow‐up was > 30% or if it was different between arms with no explanation to account for this; 17 trials (30%) were considered to be at high risk of attrition bias and 23 (40%) were judged to be at low risk.
Selective reporting
Selective reporting was not a major source of bias in the included studies. Most trials reported data for the same outcomes as they had specified in the protocol (where available) or methods section of the paper. Two trials (Butler 2003; Weaver 2014) were judged to be at unclear risk of bias because outcome values were not reported consistently.
Effects of interventions
1. Digital intervention versus no intervention or minimal intervention
1.1 Quantity of alcohol consumed per week: primary meta‐analysis, based on longest period of follow‐up
This analysis comprised data from 41 trials (42 comparisons; 1 trial comprised 2 digital intervention arms that were analysed separately). The remaining 16 trials could not be included in the primary meta‐analysis because they did not report consumption data. There was a total of 19,241 participants in these 41 trials (9631 randomised to a digital intervention, 9610 randomised to a control group). The longest period of follow‐up in these 41 trials varied from 1 to 12 months. Overall, participants who received a digital intervention drank 22.8 g (95% CI 15.4 to 30.3) of alcohol per week less than control group participants at the longest reported follow‐up point (see Analysis 1.1, Table 1). There was considerable heterogeneity in the estimate of the effect size among trials (I² = 78%), although the quantity of drinking was greater in the digital intervention arm than in the control arm in only four studies. The associated funnel plot (Figure 3) indicates some evidence of asymmetry, suggesting the possibility of under‐reporting of results with little or no evidence of an intervention effect. Meta‐regression showed that the effect size varied according to year of publication of the trial; specifically, for every year going forwards in time the mean difference in consumption between digital intervention and no or minimal intervention arms decreased by 6.3 g/week (95% CI 2.0 to 10.6). In other words, there was a smaller difference in consumption between intervention and comparison groups in more recent trials.
1.1. Analysis.
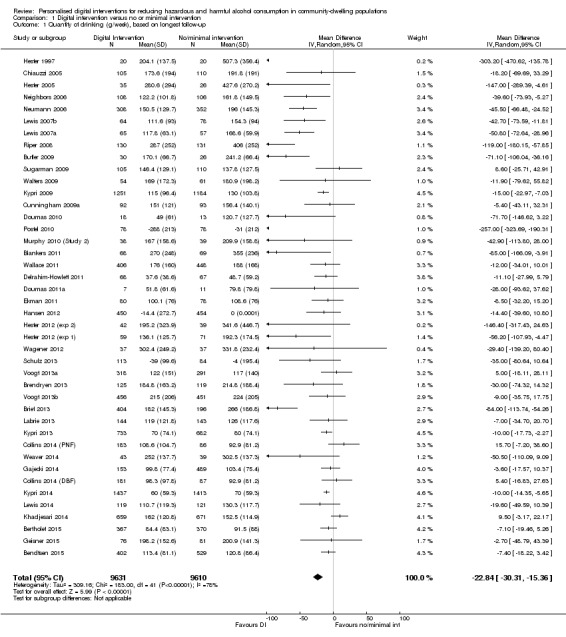
Comparison 1 Digital intervention versus no or minimal intervention, Outcome 1 Quantity of drinking (g/week), based on longest follow‐up.
3.
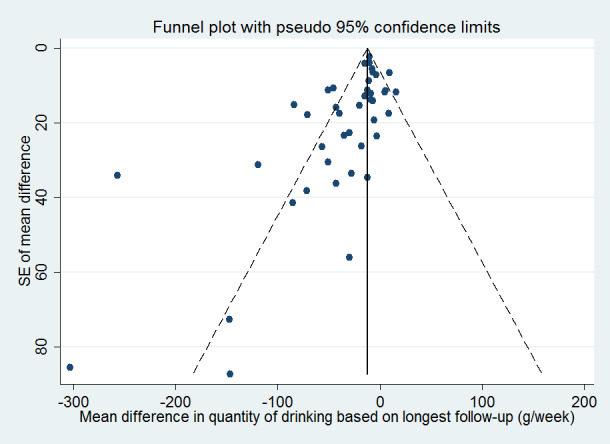
Funnel plot of comparison 1: Digital intervention vs. control, outcome 1.1: Quantity of drinking (g/week), based on longest follow‐up
The trials that could not be included in the primary meta‐analysis tended to be smaller, but did not tend to be at higher risk of bias compared to those included.
1.2 Quantity of alcohol consumed per week: subgroup analyses
Intervention modality
Trials included insufficient different types of modalities (web sites, apps, etc.) to carry out a subgroup analysis.
Timing of outcomes (using follow‐up times reported in the trials)
The follow‐up periods in the 41 trials in the primary meta‐analysis ranged from 1 to 12 months. Twenty‐six trials reported alcohol consumption at one time point only; and 15 trials reported these data at two or more time points. For the purpose of Analysis 1.2, follow‐up times were grouped as one month (17 comparisons, 7187 participants); more than 1 month and up to 2 months (6 studies, 2846 participants); more than two months and up to three months (13 studies, 3000 participants); more than three months and up to six months (19 comparisons, 12,822 participants); and 12 months (7 comparisons, 3372 participants). At each of these follow‐up time points, the estimated difference in consumption between digital intervention and no or minimal intervention arms was less than zero, ranging from ‐43.3 g/week (range = ‐73.2 to ‐13.4) at two to three months, to ‐11.5 g/week (range = ‐16.3 to ‐6.7) at three to six months (Analysis 1.2). At all follow‐up times other than 12 months, the difference in alcohol consumption between trial arms was significantly less than zero (test for subgroup differences Chi² = 6.36, df = 4, P = 0.17); they were not significantly different from each other.
1.2. Analysis.
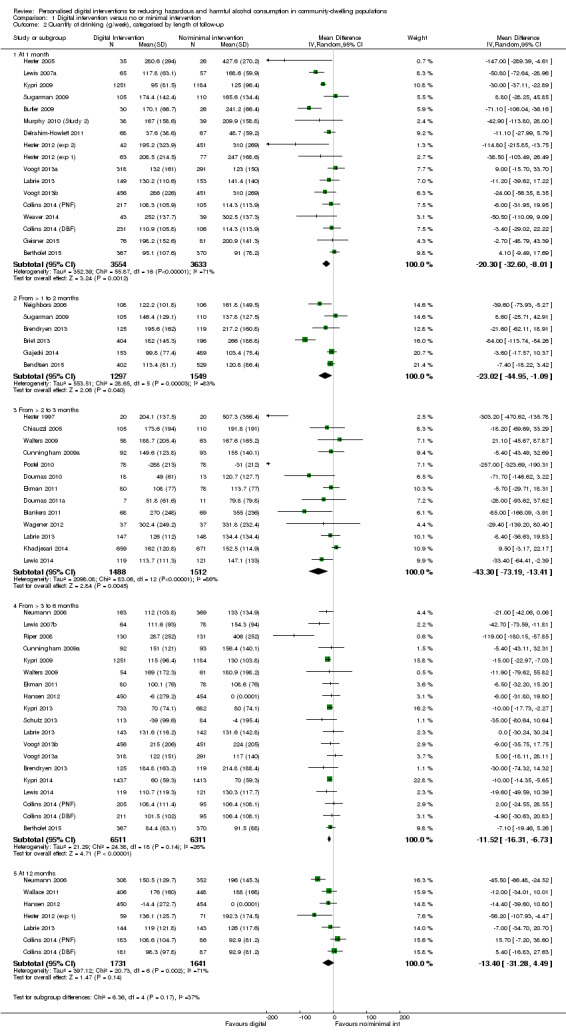
Comparison 1 Digital intervention versus no or minimal intervention, Outcome 2 Quantity of drinking (g/week), categorised by length of follow‐up.
A meta‐regression analysis of effect size on length of follow‐up could not be conducted based on data in Analysis 1.2 because some of the trials contributed to more than one follow‐up period. However, when trials were classified on the basis of their longest follow‐up using data in Analysis 1.1, the change per month of follow‐up in the difference in alcohol consumption between digital intervention and control arms was only 2.8 g/week (95% CI ‐1.0 to 6.6).
Age: trials restricted to younger people versus trials in adults
Of the 41 trials in the main meta‐analysis, 27 trials (providing 28 comparisons; one had two digital intervention arms) with 13,477 participants who were solely adolescents, young adults or college students. The age limits varied but the maximum specified age in this subgroup of trials was 29 years. Analysis 1.3 shows the results from the meta‐analysis based on the longest period of follow‐up, separately for trials restricted to younger people and those trials in adults (i.e. aged > 18 years). For adolescents or young adults, the difference between the digital intervention and no or minimal intervention arms in the quantity of alcohol consumed was smaller in magnitude than in the main analysis (‐13.4 g/week, 95% CI ‐19.3 to ‐7.6). Furthermore, this value differed significantly from the corresponding value based on 14 trials in 5764 adults (aged > 18 years) (‐56.1 g/week, 95% CI ‐82.1 to ‐30.0). The degree of heterogeneity in the effect size differed markedly between these two sets of trials: 52% for trials in adolescents and young adults and 89% for the trials in adults (aged > 18 years) (test for subgroup differences Chi² = 9.8, df = 1, P = 0.002). The associated funnel plot (Figure 4) indicated that much of the heterogeneity was associated with trials of adults (aged > 18 years).
1.3. Analysis.
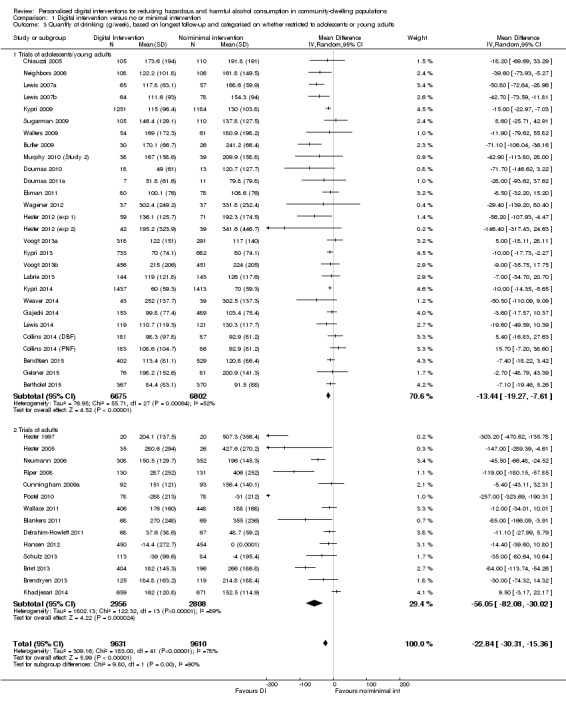
Comparison 1 Digital intervention versus no or minimal intervention, Outcome 3 Quantity of drinking (g/week), based on longest follow‐up and categorised on whether restricted to adolescents or young adults.
4.
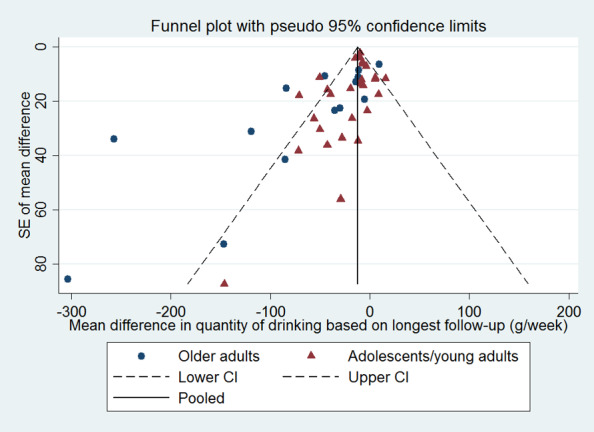
Funnel plot of comparison 1: Digital intervention vs. control, outcome 1.6: Quantity of drinking (g/week), based on longest follow‐up and categorised on whether restricted to adolescents or young adults
Age: trials restricted to younger people versus trials in adults, categorised by length of follow‐up
For follow‐up times of one month and three to six months, most participants in the main analysis were adolescents, young adults or college students. Estimates of the difference in alcohol consumption at these follow‐up times were similar in Analysis 1.2 and Analysis 1.4. For most follow‐up times, the difference in alcohol consumption between the digital intervention and no or minimal intervention arms was significantly less than zero, except at one to two months when this difference was ‐7.6 g/week (95% CI ‐19.0 to 3.8) and at 12 months when this difference was ‐2.4 g/week (95% CI ‐23.6 to 18.9).
1.4. Analysis.
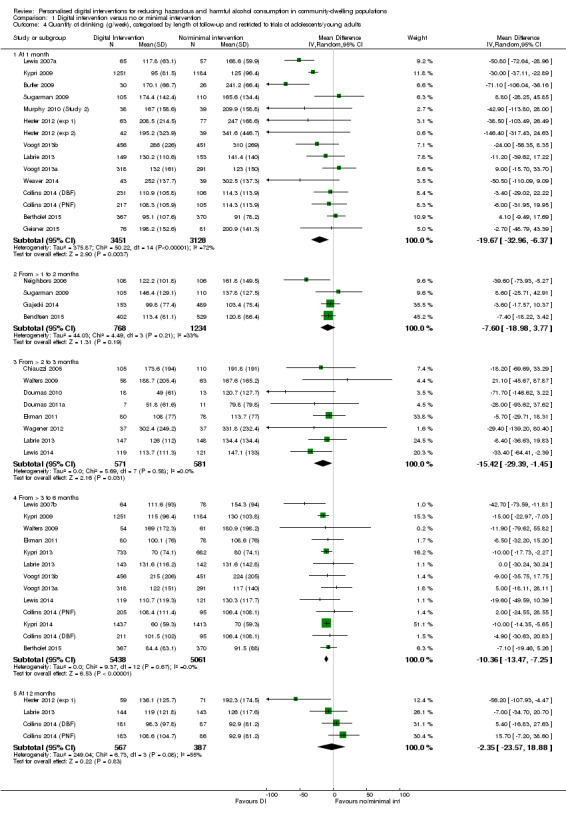
Comparison 1 Digital intervention versus no or minimal intervention, Outcome 4 Quantity of drinking (g/week), categorised by length of follow‐up and restricted to trials of adolescents/young adults.
Trials restricted by gender
Only five included trials (Bertholet 2015; Chiauzzi 2005; Delrahim‐Howlett 2011; Khadjesari 2014; Lewis 2007a; 2566 participants) provided appropriate information on alcohol consumption by gender for meta‐analysis. There was no evidence from these trials that the difference in alcohol consumption between trial arms was modified by gender. Male intervention group participants drank 8.9 g/week less (95% CI ‐32.0 to 14.3) and females drank 9.8 g/week less (95% CI ‐21.9 to 2.2) (test for subgroup differences Chi² = 0.01, df = 1, P = 0.94; Analysis 1.5). However, the data available were limited, particularly for females. A further 11 trials mentioned secondary analyses by gender but did not present corresponding data; most stated they found no evidence of a differential impact of the intervention by gender.
1.5. Analysis.
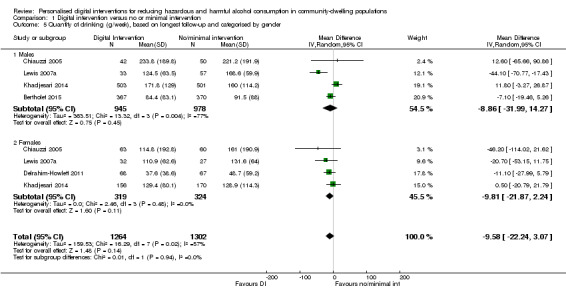
Comparison 1 Digital intervention versus no or minimal intervention, Outcome 5 Quantity of drinking (g/week), based on longest follow‐up and categorised by gender.
1.3 Quantity of alcohol consumed per week: sensitivity analyses
The sensitivity analyses demonstrated that the primary meta‐analysis is robust to the impact of potential biases and missing data. Imputing values for missing standard deviations and numbers of participants had very little impact on the effect estimate. Omitting trials at high risk of attrition and performance bias (in separate analyses) resulted in a smaller estimate of effect in each case.
Omitting trials at high risk of attrition bias
Of the 41 trials in the main meta‐analysis, 14 were judged to be at high risk of bias due to incomplete data, either through high losses to follow‐up overall or differences between trial arms in the level of follow‐up, or both. After omitting these 14 trials, the difference between the digital intervention and control arms in the quantity of alcohol consumed was slightly smaller than before, although there was still strong evidence for a reduction in consumption (difference of ‐16.2 g/week, 95% CI ‐23.4 to ‐9.1; Analysis 1.6).
1.6. Analysis.
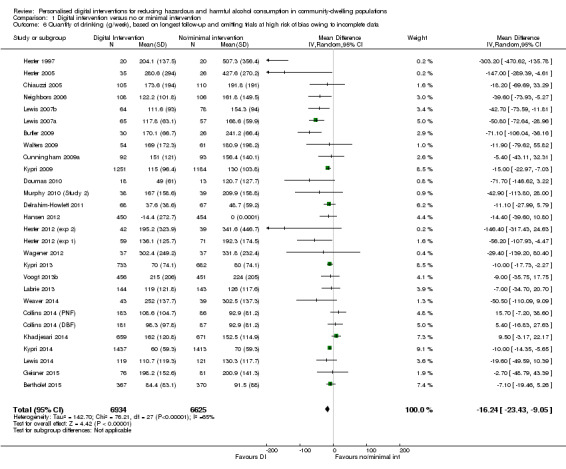
Comparison 1 Digital intervention versus no or minimal intervention, Outcome 6 Quantity of drinking (g/week), based on longest follow‐up and omitting trials at high risk of bias owing to incomplete data.
Omitting trials at high risk of performance bias
Of the 41 trials in the primary meta‐analysis, 30 were judged to be at high risk of performance bias linked to a lack of participant blinding. In an analysis based on the remaining 11 trials (10,272 participants), the difference between the digital intervention and control arms in the quantity of alcohol consumed was smaller than in the primary meta‐analysis, although there was still evidence for a reduction in consumption (difference of ‐10.5 g/week, 95% CI ‐13.7 to ‐7.4; Analysis 1.7). Note that two included studies in Figure 2 depicted as assessment at low risk of performance bias could not be included in the primary meta‐analysis, the other 11 trials appear in this sensitivity analysis.
1.7. Analysis.
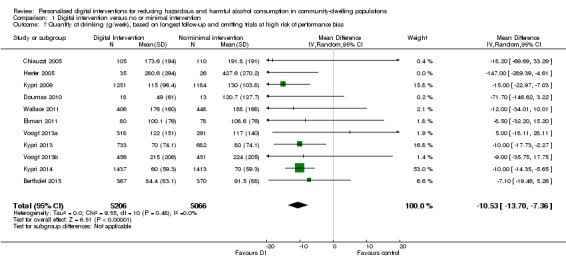
Comparison 1 Digital intervention versus no or minimal intervention, Outcome 7 Quantity of drinking (g/week), based on longest follow‐up and omitting trials at high risk of performance bias.
Imputation of missing standard deviations or unknown numbers of participants per arm
Six trials (Araki 2006; Cucciare 2013; Hedman 2008; Kypri 2008; Neighbors 2010; Ridout 2014) had unknown standard deviations for the quantity of alcohol consumed. The number of participants per arm was not reported for Neighbors 2004. Analysis 1.8 shows the results based on including these seven trials with imputed values for the unknown SDs or numbers of participants per arm (Araki 2006; Cucciare 2013; Hedman 2008; Kypri 2008; Neighbors 2004; Neighbors 2010; Ridout 2014). These results were very similar to those based on excluding these trials (Analysis 1.1). Specifically, the estimated difference in consumption between the digital intervention and control arms was ‐22.2 g/week (range = ‐29.2 to ‐15.2 g/week).
1.8. Analysis.
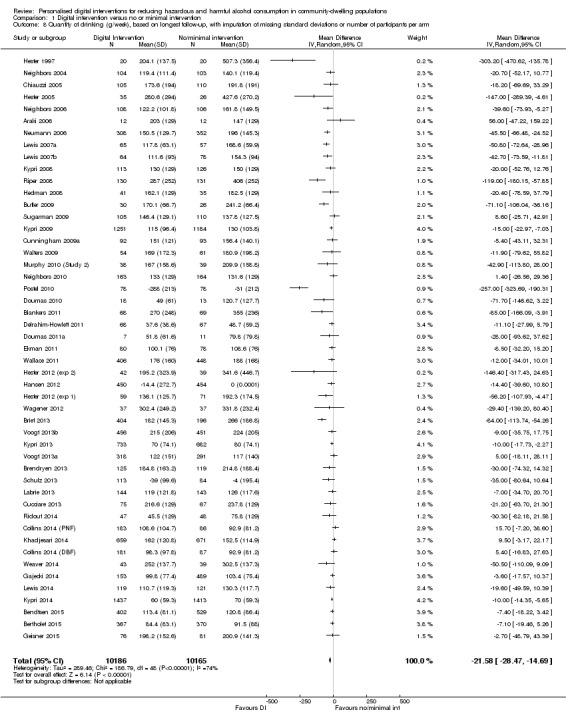
Comparison 1 Digital intervention versus no or minimal intervention, Outcome 8 Quantity of drinking (g/week), based on longest follow‐up, with imputation of missing standard deviations or number of participants per arm.
Imputation of missing standard deviations or unknown numbers of participants per arm, categorised by length of follow‐up
Analysis 1.9 shows the results by length of follow‐up, based on including the six trials with imputed values for unknown SDs or unknown numbers of participants per arm. These results are broadly similar to those based on excluding these trials (Analysis 1.2). Only one trial (Neighbors 2010) provided information for follow‐up periods over 12 months, and did not provide evidence for an effectiveness of interventions at 18 months (22.4 g/week; range = ‐5.56 to 50.36 g/week) or 24 months (1.4 g/week; range = ‐20.28 to 23.08 g/week).
1.9. Analysis.
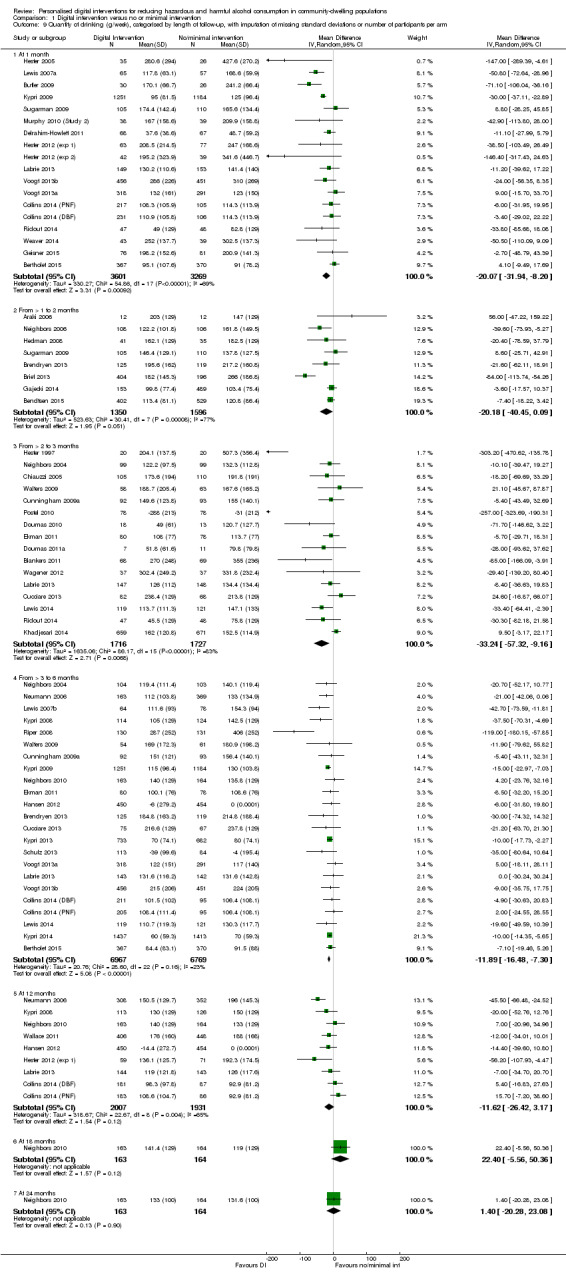
Comparison 1 Digital intervention versus no or minimal intervention, Outcome 9 Quantity of drinking (g/week), categorised by length of follow‐up, with imputation of missing standard deviations or number of participants per arm.
1.4 Frequency of drinking per week: meta‐analysis, based on longest follow‐up
This analysis was based on data from 15 trials (10,862 participants; 16 comparisons; 1 trial comprised two digital intervention arms that were analysed separately). The estimated difference between the digital intervention and no or minimal intervention arms was ‐0.16 days drinking per week (95% CI ‐0.24 to ‐0.09), which equates to less than one day fewer drinking per month linked to a digital intervention (see Analysis 1.10, Table 1). There was no evidence from a meta‐regression analysis of an association between frequency of drinking and length of longest follow‐up; specifically, the change per month of longest follow‐up in the difference between digital intervention and no or minimal intervention arms in the number of days drinking per week was 0.09 (95% CI ‐0.17 to 0.36). However, another meta‐regression analysis showed that the difference between arms was significantly smaller in magnitude for more recent trials; specifically, for every year going forwards in time the mean difference in number of days drinking per week between digital intervention and no or minimal intervention arms decreased by 0.036 days per week (95% CI 0.05 to 0.068).
1.10. Analysis.
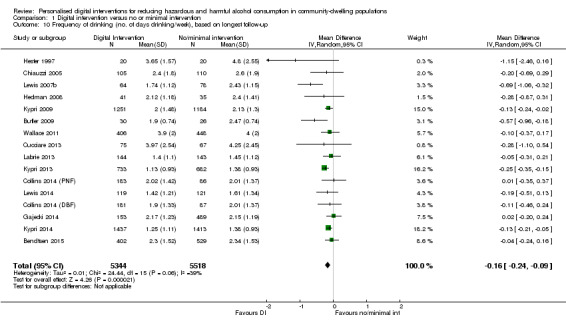
Comparison 1 Digital intervention versus no or minimal intervention, Outcome 10 Frequency of drinking (no. of days drinking/week), based on longest follow‐up.
1.5 Frequency of binges per week: meta‐analysis, based on longest follow‐up
This analysis was based on data from 15 trials (3587 participants). The definition of binge drinking varied among studies, but was most commonly at least four (for women) or five (for men) drinks in a single session. The estimated difference between the digital intervention and no or minimal intervention arms in the number of binges per week was ‐0.24 (95% CI ‐0.35 to ‐0.13), which equates to about one binge fewer per month linked to a digital intervention (see Analysis 1.11, Table 1). Meta‐regressions showed no associations with either length of longest follow‐up or year of publication.
1.11. Analysis.
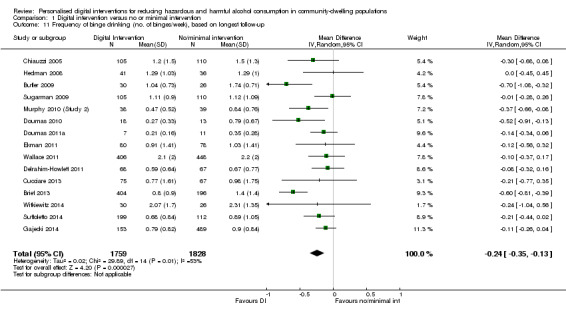
Comparison 1 Digital intervention versus no or minimal intervention, Outcome 11 Frequency of binge drinking (no. of binges/week), based on longest follow‐up.
1.6 Intensity of drinking: meta‐analysis, based on longest follow‐up
This analysis was based on data from 15 trials (9791 participants). The estimated difference between the digital intervention and no or minimal intervention arms in the intensity of drinking was ‐4.63 g/alcohol per drinking day (95% CI ‐8.02 to ‐1.23), which equates to less than one unit fewer per drinking day (see Analysis 1.12, Table 1). Meta‐regressions showed no associations with either length of longest follow‐up or year of publication.
1.12. Analysis.
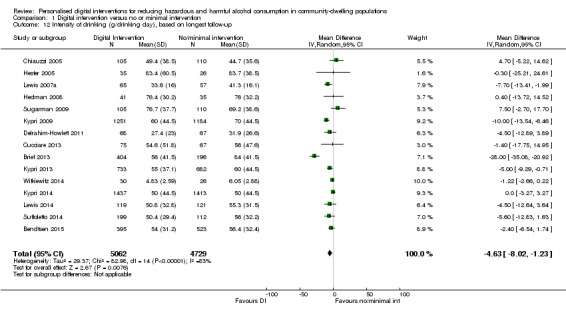
Comparison 1 Digital intervention versus no or minimal intervention, Outcome 12 Intensity of drinking (g/drinking day), based on longest follow‐up.
1.7 Binge drinkers: meta‐analysis, based on longest follow‐up
Nine trials (9417 participants) reported data on the numbers of binge drinkers per arm at follow‐up. The risk ratio of being a binge drinker at the time of longest follow‐up among those randomised to a digital intervention relative to those randomised to a control or minimal intervention condition was 0.98 (95% CI 0.97 to 1.00; Analysis 1.13). Meta‐regressions showed no associations with either length of longest follow‐up or year of publication.
1.13. Analysis.
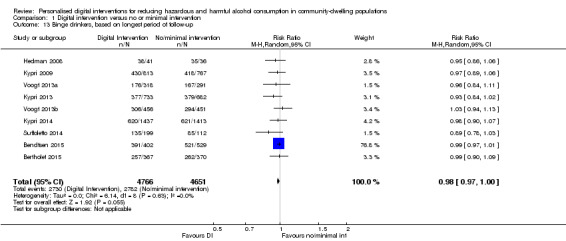
Comparison 1 Digital intervention versus no or minimal intervention, Outcome 13 Binge drinkers, based on longest period of follow‐up.
1.8 Alcohol problems and consequences
Thirteen studies reported some measure of alcohol problems or consequences, but on many different scales, so it was difficult to compare across studies. Some studies in students reported a trend toward reduction in alcohol‐related problems.
2. Digital intervention versus face‐to‐face intervention
2.1 Quantity of alcohol consumed per week: meta‐analysis, based on longest period of follow‐up
Only five trials (390 participants) reported alcohol consumption in both digital and face‐to‐face intervention arms. There was no evidence of a difference in alcohol consumption between these arms: 0.5 g/week (95% CI ‐24.6 to 25.6; Analysis 2.1, Table 2). However, the numbers of participants in this analysis were small (< 200 in each arm).
2.1. Analysis.
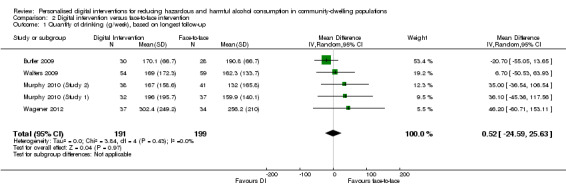
Comparison 2 Digital intervention versus face‐to‐face intervention, Outcome 1 Quantity of drinking (g/week), based on longest follow‐up.
2.2 Quantity of alcohol consumed per week: meta‐analysis, subdivided by length of follow‐up
The period of follow‐up of trials that included both digital and face‐to‐face intervention arms ranged from one month to six months. There was no indication that the difference in alcohol consumption between these arms varied according to period of follow‐up, although data were sparse (Analysis 2.2).
2.2. Analysis.
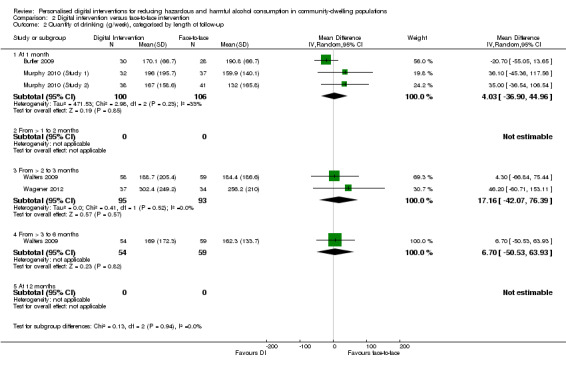
Comparison 2 Digital intervention versus face‐to‐face intervention, Outcome 2 Quantity of drinking (g/week), categorised by length of follow‐up.
2.3 Frequency of drinking per week: meta‐analysis, based on longest period of follow‐up
Only one trial with 58 participants (Butler 2009) reported frequency of drinking at follow‐up by trial arm. There was no indication of difference in frequency between the digital and face‐to‐face intervention arms: 0.05 days drinking per week (95% CI ‐0.33 to 0.43; Analysis 2.3, Table 2), but the number of participants in this trial was small.
2.3. Analysis.
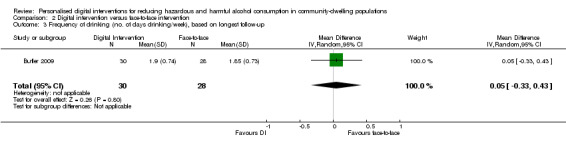
Comparison 2 Digital intervention versus face‐to‐face intervention, Outcome 3 Frequency of drinking (no. of days drinking/week), based on longest follow‐up.
2.4 Frequency of binges per week: meta‐analysis, based on longest period of follow‐up
Only three trials with 206 participants (Butler 2009; Murphy 2010 (Study 1); Murphy 2010 (Study 2)) reported frequency of binges at follow‐up by trial arm. There was no indication of difference in frequency between the digital and face‐to‐face intervention arms ‐ 0.04 binges per week (95% CI ‐0.15 to 0.22; Analysis 2.4, Table 2), but the numbers of participants in this analysis were small (about 100 in each arm).
2.4. Analysis.
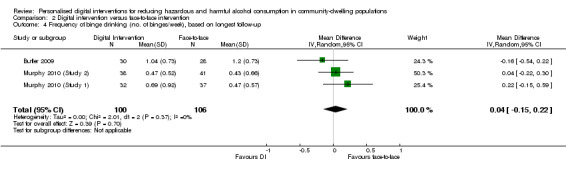
Comparison 2 Digital intervention versus face‐to‐face intervention, Outcome 4 Frequency of binge drinking (no. of binges/week), based on longest follow‐up.
Six studies were eligible for inclusion but provided no data for any meta‐analyses, because they did not report consumption outcomes that could be converted to g/week (Boon 2011; Butler 2003; Cunningham 2012b; Palfai 2011; Sinadinovic 2014; Spijkerman 2010). Only one of these studies (Boon 2011) reported a decrease in consumption in intervention participants compared to control; the others reported either that all arms of the trial had reduced their consumption, or that only a subgroup of participants (e.g. binge drinkers) had done so.
None of the studies reported whether any harms resulted from the interventions.
3. Behaviour change techniques
Prevalence of behaviour change techniques (BCTs)
The BCT content of 42 comparisons analysed on the basis of quanity of drinking (g/week) based on longest follow‐up (Analysis 1.1) was assessed. Of the BCTs uniquely present in experimental arms, i.e. not present in both experimental and control arms, the five most frequently used were: feedback on behaviour (85.7%, n = 36), social comparison (81.0%, n = 34), information about social and environmental consequences (71.4%, n = 30) feedback on outcomes of behaviour (69.0%, n = 29) and social support (unspecified) (64.3%, n = 27) (Table 3). Of the 93 possible BCTs that could have been used, 15 were used in more than 20% of trials, 44 were used at least once and 49 were never used. The mean number of BCTs used in experimental arms was 9.1 (SD = 5.3), the median was nine and the range was 1 to 21.
1. Frequency of behaviour change techniques.
| Behaviour change technique | % age (N) |
| 2.2. Feedback on behaviour | 85.7% (36) |
| 6.2. Social comparison | 81.0% (34) |
| 5.3. Information about social and environmental consequences | 71.4% (30) |
| 2.7. Feedback on outcome(s) of behaviour | 69.0% (29) |
| 3.1. Social support (unspecified) | 64.3% (27) |
| 4.1. Instruction on how to perform the behaviour | 52.4% (22) |
| 2.6. Biofeedback | 50.0% (21) |
| 5.2. Salience of consequences | 50.0% (21) |
| 9.2. Pros and cons | 35.7% (15) |
| 1.2. Problem solving | 33.3% (14) |
| 5.1. Information about health consequences | 33.3% (14) |
| 1.4. Action planning | 31.0% (13) |
| 9.1. Credible source | 31.0% (13) |
| 1.1. Goal setting (behaviour) | 28.6% (12) |
| 2.3. Self‐monitoring of behaviour | 26.2% (11) |
| 3.2. Social support (practical) | 16.7% (7) |
| 2.4. Self‐monitoring of outcome(s) of behaviour | 14.3% (6) |
| 4.2. Information about antecedents | 14.3% (6) |
| 1.3. Goal setting (outcome) | 11.9% (5) |
| 1.6. Discrepancy between current behaviour and goal | 11.9% (5) |
| 8.2. Behaviour substitution | 9.5% (4) |
| 12.2. Restructuring the social environment | 9.5% (4) |
| 15.4. Self‐talk | 9.5% (4) |
| 5.6. Information about emotional consequences | 7.1% (3) |
| 7.1. Prompts/cues | 7.1% (3) |
| 11.2. Reduce negative emotions | 7.1% (3) |
| 12.3. Avoidance/reducing exposure to cues for the behaviour | 7.1% (3) |
| 1.5. Review behaviour goal(s) | 4.8% (2) |
| 5.4. Monitoring of emotional consequences | 4.8% (2) |
| 10.3. Non‐specific reward | 4.8% (2) |
| 10.9. Self‐reward | 4.8% (2) |
| 1.7. Review outcome goal(s) | 2.4% (1) |
| 1.8. Behavioural contract | 2.4% (1) |
| 3.3. Social support (emotional) | 2.4% (1) |
| 4.4. Behavioural experiments | 2.4% (1) |
| 8.1. Behavioural practice/rehearsal | 2.4% (1) |
| 8.7. Graded tasks | 2.4% (1) |
| 10.4. Social reward | 2.4% (1) |
| 10.6. Non‐specific incentive | 2.4% (1) |
| 13.2. Framing/reframing | 2.4% (1) |
| 14.2. Punishment | 2.4% (1) |
| 15.1. Verbal persuasion about capability | 2.4% (1) |
| 15.3. Focus on past success | 2.4% (1) |
The following behaviour change techniques were not used in any digital intervention: 1.9. Commitment, 2.1. Monitoring of behaviour by others without feedback, 2.5. Monitoring of outcome(s) of behaviour without feedback, 4.3. Re‐attribution, 5.5. Anticipated regret, 6.1. Demonstration of the behaviour, 6.3. Information about others’ approval, 7.2. Cue signalling reward, 7.3. Reduce prompts/cues, 7.4. Remove access to the reward, 7.5. Remove aversive stimulus, 7.6. Satiation, 7.7. Exposure, 7.8. Associative learning, 8.3. Habit formation, 8.5. Overcorrection, 8.6. Generalisation of target behaviour, 9.3. Comparative imagining of future outcomes, 10.1. Material incentive (behaviour), 10.2. Material reward (behaviour), 10.5. Social incentive, 10.7. Self‐incentive, 10.8. Incentive (outcome), 10.10. Reward (outcome), 10.11. Future punishment, 11.1. Pharmacological support, 11.3. Conserving mental resources, 11.4. Paradoxical instructions, 12.1. Restructuring the physical environment, 12.4. Distraction, 12.5. Adding objects to the environment, 12.6. Body changes, 13.1. Identification of self as role model, 13.3. Incompatible beliefs, 13.4. Valued self‐identify, 13.5. Identity associated with changed behaviour, 14.1. Behaviour cost, 14.3. Remove reward, 14.4. Reward approximation, 14.5. Rewarding completion, 14.6. Situation‐specific reward, 14.7. Reward incompatible behaviour, 14.8. Reward alternative behaviour, 14.9. Reduce reward frequency, 14.10. Remove punishment, 15.2. Mental rehearsal of successful performance, 16.1. Imaginary punishment, 16.2. Imaginary reward, 16.3. Vicarious consequences.
Unadjusted associations between behaviour change techniques (BCTs) and intervention effectiveness
The BCTs of goal setting (B ‐43.94, SE 17.14, 95% CI ‐78.59 to ‐9.30, P = 0.01, R²adj 6.64%), problem solving (B ‐48.03, SE 14.72, 95% CI ‐77.79 to ‐18.27, P < 0.01, R²adj 25.01%), information about antecedents (B ‐74.20, SE 21.53, 95% CI ‐117.72 to ‐30.68, P < 0.01, R²adj 32.15%), behaviour substitution (B ‐123.71, SE 30.14, 95% CI ‐184.63 to ‐62.80, P < 0.001, R²adj 48.53%) and credible source (B ‐39.89, SE 16.22, 95% CI ‐72.66 to ‐7.11, P = 0.02, R²adj 15.60%) were associated with reduced alcohol consumption in unadjusted models (Table 4).
2. Unadjusted associations between behaviour change techniques and the unstandardised effect size of the intervention.
| Behaviour change technique | B (SE) | P | 95% CI | I² | Adj R² | |
| 1.1 | Goal setting (behaviour) | ‐43.94 (17.14) | 0.01 | ‐78.59 to ‐9.30 | 78.05% | 6.64% |
| 1.2 | Problem solving | ‐48.03 (14.72) | < 0.01 | ‐77.79 to ‐18.27 | 74.64% | 25.01% |
| 1.3 | Goal setting (outcome) | ‐14.43 (23.46) | 0.54 | ‐61.85 to 32.99 | 77.71% | ‐2.95% |
| 1.4 | Action planning | ‐26.21 (16.58) | 0.12 | ‐59.73 to 7.30 | 77.57% | 5.45% |
| 1.6 | Discrepancy between current behaviour and goal | ‐33.88 (24.97) | 0.18 | ‐84.35 to 16.58 | 78.24% | 0.15% |
| 2.2 | Feedback on behaviour | 12.97 (21.30) | 0.55 | ‐30.08 to 56.02 | 78.31% | ‐7.13% |
| 2.3 | Self‐monitoring of behaviour | ‐30.39 (17.14) | 0.08 | ‐65.03 to 4.26 | 78.36% | 2.07% |
| 2.4 | Self‐monitoring of outcome(s) of behaviour | ‐8.60 (22.37) | 0.70 | ‐53.81 to 36.61 | 78.52% | ‐4.67% |
| 2.6 | Biofeedback | 10.81 (15.24) | 0.48 | ‐19.99 to 41.62 | 77.85% | 1.55% |
| 2.7 | Feedback on outcome(s) of behaviour | ‐4.62 (16.45) | 0.78 | ‐37.87 to 28.63 | 78.48% | ‐5.63% |
| 3.1 | Social support (unspecified) | ‐19.55 (15.39) | 0.21 | ‐50.65 to 11.55 | 78.53% | ‐0.41% |
| 3.2 | Social support (practical) | ‐26.35 (22.59) | 0.25 | ‐72.01 to 19.31 | 77.18% | 0.29% |
| 4.1 | Instruction on how to perform the behaviour | 4.46 (15.51) | 0.78 | ‐26.89 to 35.80 | 78.55% | ‐5.77% |
| 4.2 | Information about antecedents | ‐74.20 (21.53) | <0.01 | ‐117.72 to ‐30.68 | 74.91% | 32.15% |
| 5.1 | Information about health consequences | 16.75 (15.70) | 0.29 | ‐14.99 to 48.49 | 78.42% | 0.06% |
| 5.2 | Salience of consequences | 21.99 (14.86) | 0.15 | ‐8.05 to 52.02 | 78.17% | 4.92% |
| 5.3 | Information about social and environmental consequences | 28.88 (16.56) | 0.09 | ‐4.59 to 62.34 | 77.59% | 1.01% |
| 6.2 | Social comparison | 24.25 (18.95) | 0.21 | ‐14.06 to 62.56 | 78.53% | ‐4.98% |
| 8.2 | Behaviour substitution | ‐123.71 (30.14) | < 0.001 | ‐184.63 to ‐62.80 | 72.92% | 48.53% |
| 9.1 | Credible source | ‐39.89 (16.22) | 0.02 | ‐72.66 to ‐7.11 | 75.84% | 15.60% |
| 9.2 | Pros and cons | ‐30.10 (15.77) | 0.06 | ‐61.97 to 1.78 | 77.57% | 10.15% |
| 12.2 | Restructuring the social environment | ‐22.91 (31.52) | 0.47 | ‐86.62 to 40.79 | 78.56% | ‐7.66% |
| 15.4 | Self‐talk | ‐41.53 (26.37) | 0.12 | ‐94.84 to 11.77 | 77.93% | 6.04% |
Abbreviation: B = regression coefficient
Rows in italics denote BCTs demonstrating a significant association with effect size in the unadjusted analysis
Adjusted associations between behaviour change techniques (BCTs) and intervention effectiveness
In an adjusted model that included BCTs with B > 23 in the unadjusted model, the BCTs of behaviour substitution (B ‐95.12, SE 33.09, 95% CI ‐162.90 to ‐27.34, P = 0.01), problem solving (B ‐45.92, SE 21.99, 95% CI ‐90.97 to ‐0.87, P = 0.05), and credible source (B ‐32.09, SE 13.94, 95% CI ‐60.64 to ‐3.55, P = 0.03) were significantly associated with reduced alcohol consumption (Table 5). The adjusted meta‐regression model produced relatively good indices of fit and substantially reduced heterogeneity (I² 67.24%, R²adj 59.51%, P < 0.01) compared to the I² heterogeneity of 78.0% from the main outcomes.
3. Adjusted associations between behaviour change techniques and the unstandardised effect size of the intervention.
| Behaviour change technique | B (SE) | P | 95% CI | |
| 1.1 | Goal setting (behaviour) | 0.75 (19.60) | 0.97 | ‐39.40 to 40.89 |
| 1.2 | Problem solving | ‐45.92 (21.99) | 0.05 | ‐90.97 to ‐0.87 |
| 1.4 | Action planning | 30.75 (19.50) | 0.13 | ‐9.19 to 70.68 |
| 1.6 | Discrepancy between current behaviour and goal | ‐29.86 (23.97) | 0.22 | ‐78.97 to 19.25 |
| 2.3 | Self‐monitoring of behaviour | ‐6.34 (18.35) | 0.73 | ‐43.91 to 31.24 |
| 3.2 | Social support (practical) | 33.73 (21.85) | 0.13 | ‐11.03 to 78.49 |
| 4.2 | Information about antecedents | ‐43.38 (23.93) | 0.08 | ‐92.39 to 5.63 |
| 5.2 | Salience of consequences | 13.20 (14.96) | 0.39 | ‐17.55 to 43.95 |
| 5.3 | Information about social and environmental consequences | 24.64 (12.17) | 0.05 | ‐0.30 to 49.57 |
| 8.2 | Behaviour substitution | ‐95.12 (33.09) | 0.01 | ‐162.90 to ‐27.34 |
| 9.1 | Credible source | ‐32.09 (13.94) | 0.03 | ‐60.64 to ‐3.55 |
| 9.2 | Pros and cons | 6.68 (13.68) | 0.63 | ‐21.33 to 34.69 |
| 15.4 | Self‐talk | ‐8.41 (26.69) | 0.76 | ‐63.09 to 46.27 |
Abbreviation: B = regression coefficient
Rows in italics denote BCTs demonstrating a significant association with effect size in the adjusted analysis
Neither the model containing the total number of BCTs, nor the model containing BCTs in the control BCTs group produced significant findings.
Most of the 30 most prevalent BCTs were common to both studies included in the primary meta‐analysis and studies that were ineligible for meta‐analysis. However, the order differs (e.g. 2.3 is the 7th most prevalent BCT in the former group and the 7th most prevalent in the latter group) and there are a number of highly prevalent BCTs found in one group but not the other (e.g. 1.9 is in the top 30 BCTs of excluded studies but not in the top 30 BCTs of included studies). In total, of the 30 most prevalent BCTs in each group, there are 8 unique to the excluded group and a different 8 unique to the included group.
Most of the 30 prevalent BCTs were common to both studies included in the primary meta‐analysis and studies that were ineligible for meta‐analysis.
4. Theory use and impact
Prevalence of use of theory items and areas, and individual theories
The use of theory was assessed in interventions in the 42 comparisons that were focus of Analysis 1.1 (quality of drtinking g/week, based on longest follow‐up). The most frequently reported aspects of theory were: a theory or model mentioned (n = 21, 50%), targeted constructs mentioned as a predictor of behaviour (n = 17, 40%), and theory or theoretical predictors used to select or develop intervention techniques (n = 16, 38%) (Table 6). There was no mention of theory for 21 interventions (50%), including any reference to the use of theory in either the design or evaluation of the intervention. Only three studies used theory to tailor the intervention to recipients. No intervention used a theory or predictors to select recipients for the intervention, or to refine the theory, either by adding or removing theoretical constructs or by specifying that the inter‐relationships between theoretical constructs should be changed (Table 6).
4. Number of studies in which items on the Theory Coding Scheme were present.
| Theory Coding Scheme item description (item number) | N (%) of studies where item = 1 |
| Theory/model of behaviour mentioned (I1) | 21 (50%) |
| Targeted construct mentioned as predictor of behaviour (I2) | 17 (40%) |
| Intervention based on single theory (I3) | 9 (21%) |
| Theory/predictors used to select recipients for the intervention (I4) | 0 (0%) |
| Theory/predictors used to select/develop intervention techniques (I5) | 16 (38%) |
| Theory/predictors used to tailor intervention techniques to recipients (I6) | 3 (7%) |
| All intervention techniques are explicitly linked to at least one theory‐relevant construct/predictor (I7) | 6 (14%) |
| At least one, but not all, of the intervention techniques are explicitly linked to at least one theory‐relevant construct/predictor (I8) | 11 (26%) |
| Group of techniques are linked to a group of constructs/predictors (I9) | 2 (5%) |
| All theory‐relevant constructs/predictors are explicitly linked to at least one intervention technique (I10) | 7 (17%) |
| At least one, but not all, of the theory‐relevant constructs/predictors are explicitly linked to at least one intervention technique (I11) | 10 (24%) |
| Theory‐relevant constructs are measured: post‐intervention (I12a) | 12 (29%) |
| Theory‐relevant constructs are measured: post‐ and pre‐intervention (I12b) | 10 (24%) |
| Changes in measured theory‐relevant constructs/predictor (I13) | 8 (19%) |
| Mediational analysis of constructs/ predictors: mediator predicts the dependent variable (I14a) | 6 (14%) |
| Mediational analysis of constructs/ predictors: mediator predicts dependent variable, controlling for the independent variable (I14b) | 3 (7%) |
| Mediational analysis of constructs/ predictors: intervention does not predict the dependent variable when controlling the independent variable (I14c) | 4 (10%) |
| Mediational analysis of constructs/ predictors: mediated effect is statistically significant (I14d) | 6 (14%) |
| Results discussed in relation to theory (I15) | 12 (29%) |
| Appropriate support for theory (I16) | 7 (17%) |
| Results used to refine theory: adding/ removing constructs to the theory (I17a) | 0 (0%) |
| Results used to refine theory: specifying that the interrelationships between the theoretical constructs should be changed (I17b) | 0 (0%) |
The most frequently mentioned theories or models were Motivational Interviewing Theory (8/21), Transtheoretical Model (6/21) and Social Norms Theory (6/21) (Table 7). There were 18 different theories or models mentioned. The mean total use of theory score was 4.4 out of a possible 22 which indicates that most studies did not use, report, or both use or report theory in intervention development and evaluation (Table 8).
5. Matrix of which theories mentioned (item 1) for each study (n = 20).
| Study ID | Theories (n) | Total theory use score | TM | SRT | SCT | SLT | DMT | MIT | SNT | TPB | SIT | SCompT | SImpT | SDT | ICM | HBM | TSI | ET | CBT | PBT |
| Brendryen 2013 | 3 | 6 | X | X | X | |||||||||||||||
| Collins 2014 (DBF) | 3 | 6 | X | X | X | |||||||||||||||
| Collins 2014 (PNF) | 1 | 6 | X | |||||||||||||||||
| Doumas 2010 | 1 | 15 | X | |||||||||||||||||
| Gajecki 2014 | 1 | 7 | X | |||||||||||||||||
| Geisner 2015 | 1 | 8 | X | |||||||||||||||||
| Hansen 2012 | 1 | 8 | X | |||||||||||||||||
| Kypri 2014 | 1 | 1 | X | |||||||||||||||||
| Labrie 2013 | 3 | 12 | X | X | X | |||||||||||||||
| Lewis 2007a | 4 | 16 | X | X | X | X | ||||||||||||||
| Lewis 2007b | 3 | 14 | X | X | X | |||||||||||||||
| Lewis 2014 | 2 | 15 | X | X | ||||||||||||||||
| Murphy 2010 (Study 2) | 1 | 12 | X | |||||||||||||||||
| Neighbors 2006 | 1 | 16 | X | |||||||||||||||||
| Postel 2010 | 2 | 4 | X | X | ||||||||||||||||
| Schulz 2013 | 5 | 9 | X | X | X | X | X | |||||||||||||
| Sugarman 2009 | 3 | 6 | X | X | X | |||||||||||||||
| Voogt 2013a | 3 | 5 | X | X | X | |||||||||||||||
| Voogt 2013b | 5 | 8 | X | X | X | X | X | |||||||||||||
| Wallace 2011 | 2 | 7 | X | X | ||||||||||||||||
| Weaver 2014 | 2 | 2 | X | X | ||||||||||||||||
| Number of studies: | 6 | 2 | 2 | 2 | 1 | 7 | 6 | 3 | 2 | 3 | 3 | 1 | 3 | 1 | 2 | 1 | 1 | 1 | ||
Abbreviations: CBT = cognitive‐behavioural theory; DMT = decision‐making theory; ET = expectancy theory; HBM = health belief model; ICM = I‐change model; MIT = motivational interviewing theory; PBT = problem behaviour theory; SCT = social cognitive theory; SCompT = social comparison theory; SDT = social determination theory; SImpT = social impact theory; SIT = social identity theory; SLT = social learning theory; SNT = social norms theory; SRT = self‐regulation theory; TM = transtheoretical model; TPB = theory of planned behaviour; TSI = theory of social influence
6. Descriptive statistics for categories of theory use.
| Theory Coding Scheme Categories (category number) | Items included | Maximum score | Mean (SD) | Number of studies scoring ≥ 1 |
| Reference to underpinning theory (C1) | 1, 2, 3 | 3 | 1.1 (1.23) | 20 |
| Targeting of relevant theoretical constructs (C2) | 2, 5, 6, 7, 8, 9, 10, 11 | 8 | 2.0 (2.43) | 17 |
| Using theory to select recipients or tailor interventions (C3) | 4, 6 | 2 | 0.1 (0.26) | 2 |
| Measurement of constructs (C4) | 12a, 12b | 2 | 0.5 (0.86) | 11 |
| Testing of theory: mediation effects (C5) | 12a, 12b, 13, 14a, 14b, 14c, 14d, 15, 16 | 9 | 1.6 (2.83) | 14 |
| Refining theory (C6) | 17a, 17b | 2 | ‐ | ‐ |
| Total use of theory | All items | 22 | 4.4 (5.43) | 20 |
Unadjusted associations between use of theory and intervention effectiveness
The relationship between reported theory use and intervention effectiveness is reported in Table 9 for the unadjusted meta‐regression analyses. Items 4, 6, 9, 14b, 17a and 17b were not included because the item was not present in more than 10% of the included trials.
7. Unadjusted meta‐regression analyses (unstandardised effect size) for the individual theory coding items, six categories of theory use and use of theory scores.
| Theory Coding Scheme covariates (item/category number) | B (SE) | P | 95% CI | Adj. R² | I² | |
| Lower bound | Upper bound | |||||
| Theory/model of behaviour mentioned (I1) | 9.73 (14.63) | 0.510 | ‐19.84 | 39.31 | ‐4.90% | 78.09% |
| Targeted construct mentioned as predictor of behaviour (I2) | 24.17 (14.09) | 0.094 | ‐4.30 | 52.64 | 2.27% | 78.13% |
| Intervention based on single theory (I3) | 12.92 (17.60) | 0.467 | ‐22.64 | 48.49 | ‐4.44% | 78.08% |
| Theory/predictors used to select recipients for the intervention (I4) | Not present in > 10% of studies | |||||
| Theory/predictors used to select/develop intervention techniques (I5) | 18.25 (14.57) | 0.218 | ‐11.20 | 47.69 | ‐3.43% | 78.15% |
| Theory/predictors used to tailor intervention techniques to recipients (I6) | Not present in > 10% of studies | |||||
| All intervention techniques are explicitly linked to at least one theory‐relevant construct/predictor (I7) | ‐3.73 (19.91) | 0.852 | ‐43.98 | 36.51 | ‐4.86% | 76.50% |
| At least one, but not all, of the intervention techniques are explicitly linked to at least one theory‐relevant construct/predictor (I8) | 26.39 (15.34) | 0.093 | ‐4.60 | 57.39 | 10.54% | 77.49% |
| Group of techniques are linked to a group of constructs/predictors (I9) | Not present in > 10% of studies | |||||
| All theory‐relevant constructs/predictors are explicitly linked to at least one intervention technique (I10) | 8.53 (19.81) | 0.673 | ‐31.60 | 48.46 | ‐5.82% | 78.14% |
| At least one, but not all, of the theory‐relevant constructs/predictors are explicitly linked to at least one intervention technique (I11) | 18.79 (15.99) | 0.247 | ‐13.54 | 51.11 | ‐3.45% | 78.15% |
| Theory‐relevant constructs are measured: post‐intervention (I12a) | ‐14.67 (15.81) | 0.359 | ‐46.62 | 17.28 | 1.42% | 76.37% |
| Theory‐relevant constructs are measured: post‐ and pre‐intervention (I12b) | ‐13.78 (16.88) | 0.419 | ‐47.90 | 20.33 | ‐1.67% | 76.94% |
| Changes in measured theory‐relevant constructs/predictor (I13) | ‐33.04 (17.48) | 0.066 | ‐68.37 | 2.28 | 16.92% | 74.82% |
| Mediational analysis of constructs/ predictors: mediator predicts the dependent variable (I14a) | ‐7.77 (20.24) | 0.703 | ‐48.68 | 33.15 | ‐3.13% | 76.43% |
| Mediational analysis of constructs/ predictors: mediator predicts dependent variable, controlling for the independent variable (I14b) | Not present in > 10% of studies | |||||
| Mediational analysis of constructs/ predictors: intervention does not predict the dependent variable when controlling the independent variable (I14c) | ‐21.88 (24.11) | 0.370 | ‐70.61 | 26.86 | 4.48% | 75.41% |
| Mediational analysis of constructs/ predictors: mediated effect is statistically significant (I14d) | ‐7.77 (20.24) | 0.703 | ‐48.68 | 33.14 | ‐3.13% | 76.43% |
| Results discussed in relation to theory (I15) | 1.59 (16.08) | 0.922 | ‐30.91 | 34.08 | ‐6.81% | 77.35% |
| Appropriate support for theory (I16) | ‐8.73 (19.43) | 0.656 | ‐48.01 | 30.55 | ‐2.11% | 76.33% |
| Results used to refine theory: adding/ removing constructs to the theory (I17a) | Not present in > 10% of studies | |||||
| Results used to refine theory: specifying that the interrelationships between the theoretical constructs should be changed (I17b) | Not present in > 10% of studies | |||||
| Reference to underpinning theory (C1) | 7.19 (5.89) | 0.230 | ‐4.72 | 19.10 | ‐1.55% | 78.08% |
| Targeting of relevant theoretical constructs (C2) | 3.94 (2.97) | 0.192 | ‐2.06 | 9.93 | ‐4.08% | 78.12% |
| Using theory to select recipients or tailor interventions (C3) | 13.30 (27.27) | 0.628 | ‐41.81 | 68.42 | ‐7.21% | 77.67% |
| Measurement of constructs (C4) | ‐7.58 (8.41) | 0.373 | ‐24.58 | 9.42 | 0.19% | 76.61% |
| Testing of theory: mediation effects (C5) | ‐2.09 (2.53) | 0.413 | ‐7.20 | 3.02 | 2.29% | 75.71% |
| Refining theory (C6) | No score > 0 for any studies | |||||
| Total use of theory | 0.39 (1.37) | 0.778 | ‐2.38 | 3.15 | ‐7.46% | 77.58% |
The results indicated that the Theory Coding Scheme items, categories of theory use and total use of theory score explained little of the heterogeneity observed. No significant associations were detected between the Theory Coding Scheme covariates and intervention effectiveness (P > 0.076). It should be noted that the items refer to theory use as reported in publications.
The following Theory Coding Scheme items explained the greatest amount of heterogeneity: changes in measured theory‐relevant constructs/predictor (item 13; 16.92%), at least one of the intervention techniques are explicitly linked to at least one theory‐relevant construct (item 8; 10.54%), total use of theory score (‐7.46%), using theory to select recipients or tailor interventions (category 3; ‐7.21%), and results discussed in relation to theory (item 15; ‐6.81%).
Multivariable associations between use of theory and intervention effectiveness
A multivariable model was constructed using the covariates (item 2, item 8 and item 13) that had a modest association with effect size (B > 23) in the unadjusted models. Relationships between reported theory use and intervention effectiveness are reported in Table 10 (I² = 74.3%; adjusted R² = 32.9%). Two significant independent associations were detected between intervention effectiveness and Theory Coding Scheme items; targeted construct mentioned as predictor of behaviour (item 2, B = 50.82, P = 0.020) and changes in measured theory‐relevant constructs/predictor (item 13, B = ‐61.41, P = 0.003) (Table 10). However, these are difficult to interpret in the absence of any significant associations in the unadjusted models and the pattern of results is not robust to standardised effect sizes or slight changes to studies included.
8. Adjusted meta‐regression analyses (unstandardised effect size) for the covariates with a meaningful association with effect size in unadjusted models.
| Theory Coding Scheme covariates (item number) | B (SE) | P | 95% CI | |
| Lower bound | Upper bound | |||
| Targeted construct mentioned as predictor of behaviour (I2) | 50.82 (21.00) | 0.020 | 8.31 | 93.34 |
| At least one, but not all, of the intervention techniques are explicitly linked to at least one theory‐relevant construct/predictor (I8) | ‐12.19 (20.71) | 0.560 | ‐54.12 | 29.74 |
| Changes in measured theory‐relevant constructs/predictor (I13) | ‐61.41 (19.42) | 0.003 | ‐100.71 | ‐22.10 |
There was no apparent difference among studies within and without the primary meta‐analysis in terms of prevalence of theory items.
Summary of economic studies
A narrative synthesis of economic assessment is provided because there were only few economic evaluations and significant heterogeneity in these studies.
Seven studies reporting economic data met the inclusion criteria. These fall into three categories: four studies were economic evaluations alongside clinical trials (Blankers 2012; Khadjesari 2014; Kruger 2014; Schulz 2014a), one stand‐alone modelling evaluation (Smit 2011), and two studies measured costs and benefits (Essex 2014; Hester 2006).
All seven studies took place in developed Western countries (3 in the UK, 3 in the Netherlands, and 1 discussed tools developed in the USA). The Drummond Checklist was used to assess study quality (Drummond 2005). There was some variation in study quality; with four rated at high quality, two at moderate quality, and one weak quality study. The main criticisms were insufficient economic analysis or description of an intervention.
There was significant variation in the types of intervention and control groups utilised in the studies. The four studies reporting economic evaluations alongside a clinical trial compared internet‐based therapy to internet‐based self‐help (Blankers 2012); receiving immediate personalised feedback related to alcohol consumption with opportunity for a more extended intervention to delayed feedback of three months (Khadjesari 2014); an online tool to help students in the month before they started university to access resources and information about a healthy lifestyle compared to doing nothing (Kruger 2014); and receiving personalised advice online on two health related behaviours to receiving generic advice (Schulz 2014a). The modelling study (Smit 2011) compared usual care with three different e‐health interventions related to alcohol: two self‐help and one internet‐based therapy. The study exploring the feasibility of EQ‐5D‐3L as an outcome measure (Essex 2014) compared an online tool offering enhanced psychological advice to one offering standard information related to alcohol consumption only. The EQ‐5D‐3L is a generic health‐related quality of life measure that asks individuals about five dimensions of their health: mobility, self‐care, pain/discomfort, usual activities, and anxiety. In the three level questionnaire the options are none/some/a lot. Index based values or utilities are a major feature of the EQ‐5D‐3L instrument which can be used for the calculation of quality adjusted life years (QALYs) which is used to inform economic evaluations of healthcare interventions (Devlin 2010). The study looking at costs of interventions was purely descriptive (Hester 2006). Hester 2006 listed the costs of different software programmes for delivering digital alcohol interventions and other costs such as staff training, software maintenance, and incorporating into practice that are associated with implementing this intervention. Other studies (such as Blankers 2012; Kruger 2014; Schulz 2014a; Smit 2011) used EQ‐5D as a benefit measure in an analysis of an internet‐based brief alcohol intervention and identified a meaningful change in QALYs leading to reports that the interventions had significant effects.
There was some variation in the length of the study period; one study had a three month follow‐up period (Khadjesari 2014), two studies with six months follow‐up (Blankers 2012; Kruger 2014), two studies with 12 months follow‐up (Essex 2014; Smit 2011), and one study with 24 months follow‐up (Schulz 2014a).
Of the five studies exploring cost‐effectiveness (Blankers 2012; Khadjesari 2014; Kruger 2014; Schulz 2014a; Smit 2011), all except Khadjesari 2014 found the intervention cost‐effective compared to the control group. Three studies (Blankers 2012; Kruger 2014; Schulz 2014a) performed cost‐effectiveness analyses where cost‐effectiveness was measured by incremental cost‐effectiveness ratios (ICERs) and the benefit measure was QALYs estimated from the EQ‐5D. Smit 2011 estimated cost‐effectiveness using ICERs but the benefit measure used in this study was disability‐adjusted life years. Khadjesari 2014 performed a cost‐analysis focusing only on costs of healthcare utilisation and costs to the employer, and not on benefits to the individual, which may be why this study did not find the intervention to be cost‐effective. Two studies (Schulz 2014a; Smit 2011) found that the point estimates were sensitive to how the parameters were defined in the model, although the intervention dominated in all model specifications. Essex 2014, which explored the value of EQ‐5D‐3L as an outcome measure, found it may not be an appropriate primary outcome measure for clinical and cost‐effectiveness in trials of harmful and hazardous drinking because it was only weakly correlated with the amount of alcohol consumed.
There was no evidence to suggest that the length of the intervention impacted on cost‐effectiveness. There was no evidence to suggest that the specific type of internet‐based or digital intervention impacted on cost‐effectiveness. However, the sample sizes may be too small to draw any definitive conclusions on the cost‐effectiveness by type of digital interventions.
Discussion
Summary of main results
We found moderate‐quality evidence that digital interventions may be superior to either no intervention or minimal input controls, and that digital interventions typically led to a reduction in alcohol consumption of approximately 23 g (3 UK standard drink units) per week (Table 1). There was considerable heterogeneity in these findings, although heterogeneity was lower among trials of adolescents, young adults or college students. Sensitivity analyses which removed studies at high risk of bias suggested that the reduction in consumption may be closer to 11 g (1.5 UK standard drinks) per week. We found little or no evidence of a difference in effectiveness between digital and face‐to‐face interventions (low‐quality evidence, Table 2). Limited economic evidence suggested that digital interventions may be cost‐effective compared to no intervention. No evidence was found to suggest this was dependent on duration or type of intervention, but the evidence base was too small to draw definitive conclusions.
The behaviour change techniques (BCTs) of behaviour substitution, problem solving and credible source were associated with the effectiveness of digital interventions to reduce alcohol consumption and warrant further investigation in experimental research. Behaviour substitution, defined as "prompt substitution of the unwanted behaviour with a wanted or neutral behaviour” and problem solving, defined as “analyse, or prompt the person to analyse, factors influencing the behaviour and generate or select strategies that include overcoming barriers and/or increasing facilitators” (Michie 2013), are recommended by guidance documents and treatment manuals for use in alcohol reduction (Michie 2012) and have been widely used in a variety of health behaviour change interventions (Abood 2003; Araújo‐Soares 2009; Fitzgibbon 2008; Gardner 2016; Webster 2015). These BCTs may be effective in digital alcohol interventions because they help people who are otherwise engaged in self‐directed behaviour change generate practical and specific ways of meeting their drinking reduction goals.
Credible source, defined as “present verbal or visual communication from a credible source in favour of or against the behaviour” (Michie 2013), generally consisted of advice about national guidelines for consumption, or advice about drinking provided by a member of the study. Evidence from this review and from a review of the BCTs in alcohol‐reduction apps (Crane 2015) suggests that people may value guidance from a credible source about the maximum amount of alcohol they should consume. Further investigation of the effectiveness of providing such information in digital interventions is warranted. The small number of interventions available for analysis and the infrequent use of many BCTs (70 of the 93 were used fewer than 4 times), meant that the effects of most BCTs could not be evaluated. Other BCTs were used so frequently (feedback on behaviour and social comparison were both present in more than 80% of trials) as to reduce the ability to evaluate their effectiveness.
The reporting of theory use in the development or evaluation of digital alcohol interventions was very limited and often unclear when present. Half of all interventions made no reference to any theories of behaviour and only a third used theories to develop the intervention. This limited reporting of theory use was unrelated to heterogeneity in intervention effectiveness. This meta‐regression analysis had limited power, which means the current literature is insensitive to addressing the more general question of whether good quality use of theory in designing digital alcohol interventions may be associated with more effective interventions.
The meta‐analysis of quantity of alcohol consumed was based on means, rather than (for example) medians, which might be more appropriate if the data were very heavily skewed. Whilst the distribution of alcohol consumption was skewed toward lower values, the skewness was not extreme owing to the exclusion of participants screened as abstinent or dependent drinkers.
The meta‐analysis was restricted to analyses of separate outcome measures, rather than combining results for each outcome measure. This was because it was unclear a priori whether the intervention would influence all of the outcome measures considered, nor whether ‐ as is implicit in analyses of standardised mean differences ‐ the difference in the mean outcome measure between intervention and control groups would be related to the standard deviation of the outcome measure.
Overall completeness and applicability of evidence
Findings of this review suggest that digital interventions are better than no intervention (or minimal input controls) at reducing weekly alcohol consumption in unselected or student populations who are drinking at hazardous or harmful levels. These results are not applicable to lighter or low‐risk drinkers or to treatment‐seeking populations, since the trials did not include these people. Dependent or addicted drinkers were not the focus of these trials, although in some cases, they comprised a proportion of participants due to a lack of upper consumption cut‐offs in eligibility criteria. Most included trials tested web‐based interventions, so the effectiveness of other types of interventions such as smartphone apps or SMS messages is less clear. None of the trials took place in developing countries; and although many of the trials recruited participants online, there was no evidence from study baseline characteristics that many resided in developing countries.
The primary meta‐analysis was based on the longest reported follow‐up time point of the trials, which ranged from one month to one year. When subgroup analyses based on the actual length of follow‐up were conducted, we found that the positive effect of digital interventions at reducing alcohol consumption persisted to six months but not to one year. There were fewer trials with longer term follow‐up points and so this analysis may not have had the statistical power to detect smaller effect sizes. However, it is likely that intervention effects will decay, or reduce over time. Thus repeated engagement with digital programmes may need to occur if positive effects of the intervention programmes are to be maintained over time. There was limited information reported in this literature about the extent to which participants engaged with the digital programmes or whether they returned to re‐engage after initial use.
Few trials have been carried out comparing digital interventions to face‐to‐face interventions, but those conducted to date suggest little difference in terms of their impact on consumption. More research is required to provide a more definitive conclusion; however, a non‐inferiority trial is currently underway (Struzzo 2013). Nevertheless, an ongoing qualitative systematic review investigating factors affecting whether and how people engage with digital interventions suggests that user perceptions about the usefulness and relevance of intervention content, as well as participants' preferences regarding how interventions are delivered, may influence the outcome of digital alcohol interventions (Beyer 2015). It is plausible that the overall lack of evidence of difference in effectiveness between face‐to‐face and digital interventions may mask differences between subgroups within populations ‐ some of whom tend to engage and have better outcomes when interacting with another person, and others who prefer the privacy or convenience of, and respond better to, interventions via digital devices. Face‐to‐face interventions did not feature in any of the economic studies in this review. However, it is reasonable to assume that digital interventions may be more cost‐effective than directly delivered interventions if they have a similar impact on consumption. After their initial development and set‐up are accounted for, digital interventions are likely to be cheaper to deliver at scale, more consistent in terms of content delivery, and accessible multiple times compared to a face‐to‐face intervention. Conversely, it may be challenging to ensure that users access only high‐quality digital programmes available via web‐based programmes or smartphone apps. Furthermore, it is not possible to ensure that users engage with all aspects of a remotely delivered intervention programme.
We looked for evidence that digital interventions could help to address socio‐economic inequalities in access to help for alcohol information, advice, or online counselling. We specifically looked for data relating to trial participants that directly measured or could be used as a proxy for socio‐economic status; these were income, ethnicity, employment or educational attainment. Although many trials reported one or more of these characteristics at baseline, very few reported outcomes on the basis of these characteristics at follow‐up. Thus there were insufficient data to enable subgroup analysis by socio‐economic status. Most trials (n = 29) involved university or college student participants and so were likely to reflect data for people from higher economic status backgrounds. Although ethnicity was better reported at baseline in these trials, most trial participants were categorised as white.
Quality of the evidence
The direction of evidence was broadly consistent: most (88%) of the 41 included trials in the primary meta‐analysis reported that participants using a digital intervention reduced their consumption compared to no or minimal intervention groups.
A positive feature of these digital intervention trials is that most procedures are fully automated and so there was typically a low risk of bias regarding randomisation procedures, allocation to different conditions and intervention delivery. It is impossible to blind participants to these types of behaviour change interventions, and although some trialists made attempts to counter the impact of this aspect, performance bias is an inescapable issue in trials of this kind. Although it has been argued that small effect sizes may be caused entirely by exaggerated self‐report of outcome measures by unblinded participants (Hróbjartsson 2014), the sensitivity analysis conducted in this review of studies at low risk of performance bias (Analysis 1.7) suggested that the intervention caused a real effect. Most included trials relied on self‐reported measures of alcohol use at enrolment and follow‐up, so this literature could be subject to recall bias or socially desirable responding. However, most of the trials used well validated screening tools to determine levels of alcohol consumed, typically the Alcohol Use Disorders Identification Test (AUDIT) or one of its shorter variants. These tools have been shown to have good sensitivity and specificity when measured against a range of diagnostic gold standard measures (Reinert 2007). Moreover, AUDIT has been shown to have higher sensitivity, specificity, and positive predictive value than biochemical markers in primary care (Coulton 2006). Finally, any potential bias due to self‐reported consumption will affect both intervention and control groups (particularly where control groups received alcohol‐related information) and so were unlikely to account for differential intervention effects. Blinding of providers was not an issue in most trials because outcome data collection was automated. However, this same automated procedure made it very difficult to ensure good follow‐up, and attrition is another source of bias in this group of trials (only 44% of trials were judged to be at low risk of bias for this domain). It seems likely that participants who were lost to follow‐up stopped using the intervention, but it is impossible to gauge whether these people would have been more or less likely to benefit than completers had they continued in the trial. There could be a potential risk of detection bias in the trials due to participants self‐reporting their alcohol consumption, but this was likely to have been similar between intervention and control participants in the same trial and so unlikely to differentially affect study findings. In trials which included a face‐to‐face arm, there was a higher risk of detection bias because the intervention was provided by a researcher or clinician.
We downgraded the evidence from high‐quality to moderate‐quality due to high levels of risk of performance and attrition bias. Both performance and attrition bias are very difficult to mitigate in this type of intervention because participants cannot easily be blinded to receiving this type of intervention and follow‐up is more difficult when the intervention is received remotely without any interaction with trial personnel. However, given that the direction of effect was broadly consistent (at least 88% of trials reported a decrease in consumption in the intervention compared to the control arm for quantity and frequency; 73% for intensity), and all the sensitivity analyses accounting for risk of bias suggested that the effect was real, if potentially smaller than in the primary meta‐analysis, the addition of further trials seems unlikely to alter the direction of effect. With a large body of evidence mostly pointing in the same direction, we judged the most appropriate GRADE assignment to be moderate‐quality evidence.
There were high levels of heterogeneity in the analyses for quantity and intensity of drinking, but this was explained. In large part this heterogeneity was likely due to differences in the content and delivery of the interventions ‐ some early trials included digital devices that have since become almost obsolete (e.g. CD‐ROMS) and new technologies have evolved rapidly over the last decade. Also, subgroup analysis suggested that much of this heterogeneity was associated with trials involving older adults (Analysis 1.3; Figure 4).
The trials comparing digital with face‐to‐face interventions were all very small and for each of the outcomes totaled fewer than 400 participants, so we downgraded the quality of evidence for imprecision (low‐quality evidence).
Potential biases in the review process
We made every effort to minimise the publication bias that can arise because studies reporting positive effects are more likely to be published than those with negative or equivocal results. We searched a range of bibliographic databases alongside sources of unpublished literature, but it is possible that the search strategy missed studies. We also assessed the potential bias from selective reporting by inspecting the difference between the outcomes which were stated in study protocols (where available) or methods sections, and those in the final study report; these judgements are in the Risk of Bias tables. The funnel plot suggests that smaller studies showing little or no evidence of effect may have been missed, although inspection of funnel plots may not to be a robust indication of publication bias when there is significant heterogeneity (as in the current review) (Mavridis 2014; Terrin 2005). We contacted study authors where possible to obtain missing data, and we carried out sensitivity analyses in which missing values were imputed where required. These analyses suggested that the effect of digital interventions is robust, albeit small.
Study authors were also contacted for further detail for the BCT and theory coding assessment. However, recognised issues with the incomplete reporting of intervention content (Abraham 2008) may have resulted in BCTs being incorrectly coded as present or absent. This may produce noise and undermine the power to test associations. Simply recording a BCT as present or absent does not take into account the frequency, intensity or the quality in which it was delivered. For example, it is unclear to what extent individuals may need to self‐monitor their consumption of alcohol. The quality of implementation may be particularly critical in digital interventions where different language, graphic design or usability of the BCT implementation could have a considerable effect on the degree of user engagement (Garrett 2010). To assess BCT effectiveness it may be necessary to develop methods to measure its ‘dose’ (Lorencatto 2015; Voils 2014).
Although there is no evidence that reporting of theory use is associated with substantial heterogeneity among interventions, the current literature is insensitive to addressing the more general question of whether good quality use of theory in designing digital alcohol interventions may be associated with more effective interventions. Previous simulation studies have found that more than 200 studies are required for 80% power (Hempel 2013). We cannot draw a conclusion about whether an association does not exist or whether there was insufficient power to detect one.
Funding for included studies was obtained mostly from government grants or research foundations, where reported. One third of studies did not report their source of funding.
Agreements and disagreements with other studies or reviews
Digital alcohol interventions
During the conduct of our current review we identified 19 published systematic reviews focused on digital alcohol interventions (Balhara 2014; Bewick 2008a; Bhochhibhoya 2015; Black 2016; Carey 2009a; Carey 2012; Dedert 2015; Donoghue 2014; Dotson 2015; Elliott 2008; Khadjesari 2011; Nair 2015; Newman 2011; Riper 2011; Riper 2014; Rooke 2010; Vernon 2010; White 2010; Zisserson 2007), although the precise target groups or types of technology varied among reviews. Five of these systematic reviews were published in the last two years (Bhochhibhoya 2015; Black 2016; Dedert 2015; Dotson 2015; Nair 2015). The most recent systematic review included 94 computer‐delivered interventions (Black 2016). Enrolled participants had a median age of 20 years and the median proportion of women was 55%; it was not clear how many participants were included in the analysis (Black 2016). Black 2016 reported small, significant effects across five outcomes (total consumption or quantity, e.g. drinks/week; average consumption or intensity, e.g. drinks/drinking per day; peak consumption e.g. maximum consumption/occasion; frequency of heavy episodic (binge) drinking; or frequency of drinking any amount, d + = 0.07 to 0.15) in an analysis considering all time points.
The current review differed from the most recent review (Black 2016) with respect to inclusion criteria (e.g. we excluded trials where interventions were mandated or participants were not screened as hazardous or harmful drinkers), and there are only 27 trials common to both reviews. Our primary meta‐analysis included 41 trials with 19,241 participants, whose median age was 20 years (IQR 19 to 31 years) across 28 studies that reported participants' age, and our median proportion of females was 51% across 34 studies that reported participants' gender. We found a reduction of 22.8 g (95% CI 15.4 to 30.3) of alcohol per week (approximately 2 USA or 3 UK standard drink units) less than controls. The standardised effect size calculated for this consumption change, based on longest follow‐up, was 0.20 (95% CI 0.14 to 0.27; I² = 74%). Thus, our finding of modest weekly reduction in the amount of alcohol consumed which equated to a small effect size is in line with other recent reports in terms of changes in consumption.
Black 2016 also assessed BCTs of included interventions and found that, in contrast to our review, the BCTs of commitment, social comparison, feedback and review of goals were associated with better outcomes. The more recent and extensive 93‐item taxonomy (Michie 2013; Michie 2015) used in our meta‐analysis differs in a number of ways from the 42‐item, alcohol‐specific, taxonomy (Michie 2012) used by Black 2016. The 93‐item taxonomy is more fine grained and includes a BCT of credible source (in contrast to the 42‐item taxonomy). It has three feedback BCTs, two review goal BCTs and three BCTs that provide information on negative consequences of performing a behaviour, whereas the 42‐item taxonomy only has one BCT for each of these techniques.
Our findings relating to theory also differ from Black 2016, which found that the Social Norms approach was associated with improved outcomes although no association between the extent of theory use and effectiveness was found. Black 2016 and the current review differed in terms of the criteria used for including covariates in the adjusted meta‐regression model. Black 2016 used the criterion of significant P values, which could be altered by using an unadjusted or adjusted model. The criterion we used of size of B value is more stable during adjustment and therefore a more reliable method.
All of the systematic reviews cited above which were published since 2011 reported that digital interventions can be successful in reducing hazardous alcohol consumption compared to assessment only, and two (Dotson 2015; Riper 2014) suggested that although the effect is small, large‐scale implementation may be cost‐effective from a public health perspective. Many of these reviews focused on students, but had different inclusion criteria to each other and to this review with respect to participant consumption levels, included interventions, and whether the students were mandated to 'complete' the intervention. Reviews published before 2011 were more tentative in their conclusions (presumably due to having fewer trials available), but all of them reported 'some' evidence of effectiveness or that interventions 'may' reduce alcohol consumption, except for one (Bewick 2008a) which reported inconsistent results.
Authors' conclusions
Implications for practice.
This review provides moderate‐quality evidence that digital interventions may lower alcohol consumption, at least for up to six months, with an average reduction of between one and three (UK) standard drinks per week compared to control participants. The higher end of this range is the result of the primary meta‐analysis; the lower end is suggested by sensitivity analyses accounting for the risk of attrition and performance bias. Although small, the effect appears robust. From a public health perspective, the prevalence of hazardous alcohol consumption and the low‐cost and wide reach of digital interventions mean that this small effect could have a large impact on alcohol‐related diseases, and consequently health services and costs. For heavy drinkers to derive the maximum benefit from digital alcohol intervention programmes, it may be necessary for practitioners and policy‐makers to consider strategies to promote potential user awareness of and sign‐posting to well‐designed and robustly evaluated digital programmes.
This review also provides low‐quality evidence based on fewer studies that there is little difference in impact on alcohol consumption between digital interventions and face‐to‐face interventions delivered by health professionals. However, since the effects of a digital alcohol intervention did not persist to one year following intervention, we were unable to conclude that digital interventions are equivalent to brief interventions delivered directly by practitioners since health practitioner delivered interventions have shown positive effects at the one to two year follow‐up time point (Kaner 2007). Given the relatively small number of trials comparing digital interventions versus practitioner delivered interventions, we suggest that digital interventions should be considered as a potentially shorter‐term option that can be used to help heavy drinkers become more aware of the links between alcohol consumption and health and more knowledgeable about how to reduce heavy drinking.
Regarding the components of effective digital alcohol intervention programmes, the behaviour change techniques (BCTs) of behaviour substitution and credible source were associated with the effectiveness of digital interventions to reduce alcohol consumption. Other BCTs, such as self‐monitoring, goal setting and review of behavioural/outcome goals, whilst rarely used in the included studies, have substantial evidence of effectiveness and may be effective in digital interventions to reduce excessive alcohol consumption. We believe these findings may add to existing evidence to help developers of future interventions to ensure their programmes include effective components.
These results provide support for developing and introducing digital interventions to reduce alcohol consumption in a range of contexts, whilst ensuring that, as far as possible, their effectiveness and mechanisms of action are evaluated to build a more solid evidence base in this area. We suggest that digital interventions are considered alongside face‐to‐face interventions as part of a strategy for addressing hazardous alcohol consumption; for example, in targeting hard to reach populations, or as an initial intervention.
Implications for research.
There is a large body of trial‐based evidence investigating digital interventions for reducing hazardous and harmful alcohol consumption, but its use for evidence synthesis purposes is limited by the vast range of different outcomes reported in the trials. We recommend that alcohol consumption outcomes be standardised in future trials. Future research work should focus on characterising the components of effective digital intervention programmes and use the capabilities afforded by these technologies to track, measure and characterise the extent to which participants engage with the content of programmes and also return to the programmes on repeated occasions. This information would enable a future review to consider intervention effectiveness on the basis of specific active ingredients built into digital intervention programmes and also the dose of intervention required to produce positive effects. Future trials also require better participant blinding; for example by providing other health messages alongside those about alcohol consumption.
None of the included studies reported whether adverse effects were experienced by participants ‐ or even appeared to look for them. Future studies should report adverse effects.
This review showed that the BCTs of behaviour substitution, problem solving and credible source were associated with the effectiveness of digital interventions to reduce alcohol consumption. Nevertheless, there was relatively poor reporting of the BCTs inherent in digital alcohol intervention programmes or the theoretical basis underpinning programme development. Future trials should report what interventions provide and how they are developed; this would aid intervention developers to select the components most likely to have the biggest impact (West 2015; Yardley 2016).
This systematic review highlights the need for clearer selection, application and reporting of theory use for the development of interventions so we can assess how useful theory is in this field as well as using study findings to refine the relevant theory to advance this field. Evidence synthesis would also be helped by study authors defining interventions in terms of BCTs rather than relying on post‐hoc interpretation by other researchers to address questions of effective techniques within complex interventions. A large number of behaviour change theories exist (Michie 2014) and the null findings could suggest a poor choice of theory in this literature; for example, the Stages of Change model was used by a number of studies in this review although this model lacks empirical support (West 2005).
We identified an absence of studies using their results to refine theories, and therefore, contribute to theory development. Current behaviour change theories are based mainly on limited static measures so are likely to be inadequate to inform the development of digital interventions that are more suited to dynamic, temporally sensitive theories (Riley 2011; Spruijt‐Metz 2015). The evaluation of digital interventions could help to develop this type of theory: the underpinning technology can often collect comprehensive data reflecting an individual’s behaviour over time and in different settings and contexts (Riley 2011; Saranummi 2013; Spring 2013; Spruijt‐Metz 2015). However, no existing studies reported using their results to refine theory, which highlights the need for clearer selection, application and reporting of theory use in the development and evaluation of digital behaviour change interventions.
Given the relatively few trials comparing digital alcohol intervention effects directly with those produced by brief alcohol intervention delivered by practitioners, we believe that future research should involve more head‐to‐head comparisons. Moreover, given the large body of brief alcohol intervention trials (Kaner 2007), it would be helpful to use new evidence synthesis approaches such as network meta‐analysis techniques to combine direct and indirect data and enable inferences to be made about comparative effectiveness.
Finally, we believe there is a need for more health economic work to consider the cost‐effectiveness of digital alcohol intervention programmes in comparison with control conditions and practitioner delivered interventions. This work would help local and national policy‐makers to develop efficient strategies to achieve wide scale roll out of alcohol intervention to help reduce harm. Since alcohol harms are disproportionately experienced by those in lower socio‐economic status groups (Katikireddi 2017) this work is likely to help to reduce health and social inequities.
History
Protocol first published: Issue 1, 2015 Review first published: Issue 9, 2017
| Date | Event | Description |
|---|---|---|
| 3 July 2015 | Amended | Author order amended |
| 15 January 2015 | Amended | declarations of interest |
Acknowledgements
We thank Professor Robert West for helpful advice during the drafting of the protocol.
We are grateful to Janice Armstrong and Brenda Nyakang'o for administrative support on this review.
Appendices
Appendix 1. MEDLINE (Ovid) search strategy
| # | Searches |
| 1 | exp Alcohol‐Related Disorders/ |
| 2 | exp Alcohol Drinking/ |
| 3 | (alcohol$ adj2 (drink$ or intoxicat$ or use$ or abus$ or misus$ or risk$ or consum$ or withdraw$ or detox$ or treat$ or therap$ or excess$ or reduc$ or cessation or intervention$)).tw. |
| 4 | (drink$ adj2 (excess or heavy or heavily or harm or harmful or hazard$ or binge or harmful or problem$)).tw. |
| 5 | ("alcohol use" or alcoholic$).tw. |
| 6 | or/1‐5 |
| 7 | Internet/ |
| 8 | Blogging/ |
| 9 | Social Media/ |
| 10 | Computers/ |
| 11 | exp Microcomputers/ |
| 12 | Minicomputers/ |
| 13 | Therapy, Computer‐Assisted/ |
| 14 | Computer‐Assisted Instruction/ |
| 15 | exp Cellular Phone/ |
| 16 | Electronic Mail/ |
| 17 | ((email$ or e‐mail$ or electronic mail$ or text messag$ or SMS or MMS or phone? or cellphone? or cell‐phone? or smartphone? or smart‐phone? or digital tablet? or pda or personal digital assistant? or social media or social networking or facebook or twitter or skyp$ or app?) adj3 (deliver$ or generat$ or based or provid$ or facilitat$ or support$ or treatment? or therap$ or intervention? or program$ or feedback)).ti,ab. |
| 18 | ((Internet$ or electronic$ or digital$ or technolog$ or online or on‐line or computer$ or laptop? or software or web$ or weblog$ or blog$ or CD? or CD‐ROM?) adj3 (deliver$ or generat$ or based or provid$ or facilitat$ or support$ or treatment? or therap$ or intervention? or program$ or feedback)).ti,ab. |
| 19 | (e‐BI or e‐SBI or ehealth or e‐health or electronic health or mhealth or m‐health or mobile health or virtual health or digital health or technological aid?).ti,ab. |
| 20 | or/7‐19 |
| 21 | 6 and 20 |
Appendix 2. Cochrane Library search strategy
CDSR, DARE, CENTRAL, HTA, NHS‐EED #1MeSH descriptor: [Alcohol‐Related Disorders] explode all trees #2MeSH descriptor: [Alcohol Drinking] explode all trees #3(alcohol* near/2 (drink* or intoxicat* or use* or abus* or misus* or risk* or consum* or withdraw* or detox* or treat* or therap* or excess* or reduc* or cessation or intervention*)):ti,ab #4(drink* near/2 (excess or heavy or heavily or harm or harmful or hazard* or binge or harmful or problem*)):ti,ab #5("alcohol use" or alcoholic*):ti,ab #6#1 or #2 or #3 or #4 or #5 #7MeSH descriptor: [Internet] explode all trees #8MeSH descriptor: [Computers] this term only #9MeSH descriptor: [Microcomputers] explode all trees #10MeSH descriptor: [Minicomputers] this term only #11MeSH descriptor: [Therapy, Computer‐Assisted] this term only #12MeSH descriptor: [Computer‐Assisted Instruction] this term only #13MeSH descriptor: [Cellular Phone] explode all trees #14MeSH descriptor: [Electronic Mail] this term only #15((email* or e‐mail* or electronic mail* or text messag* or SMS or MMS or phone? or cellphone? or cell‐phone? or smartphone? or smart‐phone? or digital tablet? or pda or personal digital assistant? or social media or social networking or facebook or twitter or skyp* or app?) near/3 (deliver* or generat* or based or provid* or facilitat* or support* or treatment? or therap* or intervention? or program* or feedback)):ti,ab #16((Internet* or electronic* or digital* or technolog* or online or on‐line or computer* or laptop? or software or web* or weblog* or blog* or CD? or CD‐ROM?) near/3 (deliver* or generat* or based or provid* or facilitat* or support* or treatment? or therap* or intervention? or program* or feedback)):ti,ab #17(e‐BI or e‐SBI or ehealth or e‐health or electronic health or mhealth or m‐health or mobile health or virtual health or digital health or technological aid?) .ti,ab. #18#7 or #8 or #9 or #10 or #11 or #12 or #13 or #14 or #15 or #16 or #17 #19#6 and #18
Appendix 3. PsycINFO (OVID) search strategy
| # | Searches |
| 1 | exp alcohol intoxication/ |
| 2 | exp alcohol abuse/ |
| 3 | alcohol rehabilitation/ |
| 4 | alcohol drinking patterns/ |
| 5 | (alcohol$ adj2 (drink$ or intoxicat$ or use$ or abus$ or misus$ or risk$ or consum$ or withdraw$ or detox$ or treat$ or therap$ or excess$ or reduc$ or cessation or intervention$)).ti,ab. |
| 6 | (drink$ adj2 (excess or heavy or heavily or harm or harmful or hazard$ or binge or harmful or problem$)).ti,ab. |
| 7 | ("alcohol use" or alcoholic$).ti,ab. |
| 8 | or/1‐7 |
| 9 | computer assisted therapy/ |
| 10 | computer assisted instruction/ |
| 11 | websites/ |
| 12 | internet/ |
| 13 | computer mediated communication/ |
| 14 | exp social media/ |
| 15 | exp mobile devices/ |
| 16 | ((email$ or e‐mail$ or electronic mail$ or text messag$ or SMS or MMS or phone? or cellphone? or cell‐phone? or smartphone? or smart‐phone? or digital tablet? or pda or personal digital assistant? or social media or social networking or facebook or twitter or skyp$ or app?) adj3 (deliver$ or generat$ or based or provid$ or facilitat$ or support$ or treatment? or therap$ or intervention? or program$ or feedback)).ti,ab,id. |
| 17 | ((Internet$ or electronic$ or digital$ or technolog$ or online or on‐line or computer$ or laptop? or software or web$ or weblog$ or blog$ or CD? or CD‐ROM?) adj3 (deliver$ or generat$ or based or provid$ or facilitat$ or support$ or treatment? or therap$ or intervention? or program$ or feedback)).ti,ab,id. |
| 18 | (e‐BI or e‐SBI or ehealth or e‐health or electronic health or mhealth or m‐health or mobile health or virtual health or digital health or technological aid?).ti,ab,id. |
| 19 | or/9‐18 |
| 20 | 8 and 19 |
| 21 | (control$ or random$).tw. |
| 22 | exp Treatment/ |
| 23 | 21 or 22 |
| 24 | 20 and 23 |
Appendix 4. CINAHL (EBSCO) search strategy
S18 S13 AND S17 S17 S14 OR S15 OR S16 S16 TX random* S15 (MH "Experimental Studies") S14 (MH "Treatment Outcomes+") S13 S5 AND S12 S12 S6 OR S7 OR S8 OR S9 OR S10 OR S11 S11 TI (e‐BI or e‐SBI or ehealth or e‐health or electronic health or mhealth or m‐health or mobile health or virtual health or digital health or technological aid*) OR AB (e‐BI or e‐SBI or ehealth or e‐health or electronic health or mhealth or m‐health or mobile health or virtual health or digital health or technological aid*) S10 TI ((Internet* or electronic* or digital* or technolog* or online or on‐line or computer* or laptop# or software or web* or weblog* or blog* or CD# or CD‐ROM#) N3 (deliver* or generat* or based or provid* or facilitat* or support* or treatment# or therap* or intervention# or program* or feedback)) OR AB ((Internet* or electronic* or digital* or technolog* or online or on‐line or computer* or laptop# or software or web* or weblog* or blog* or CD# or CD‐ROM#) N3 (deliver* or generat* or based or provid* or facilitat* or support* or treatment# or therap* or intervention# or program* or feedback))TI ((Internet* or electronic* or digital* or technolog* or online or on‐line or computer* or laptop# or software or web* or weblog* or blog* or CD# or CD‐ROM#) N3 (deliver* or generat* or based or provid* or facilitat* or support* or treatment# or therap* or intervention# or program* or feedback)) OR AB ((Internet* or electronic* or digital* or technolog* or online or on‐line or computer* or laptop# or software or web* or weblog* or blog* or CD# or CD‐ROM#) N3 (deliver* or generat* or based or provid$ or facilitat$ or support$ or treatment? or therap$ or intervention? or program$ or feedback) S9 TI ((email* or e‐mail* or electronic mail* or text messag* or SMS or MMS or phone# or cellphone# or cell‐phone# or smartphone# or smart‐phone# or digital tablet# or pda or personal digital assistant# or social media or social networking or facebook or twitter or skyp* or app#) N3 (deliver* or generat* or based or provid* or facilitat* or support* or treatment# or therap* or intervention# or program* or feedback)) OR AB ((email* or e‐mail* or electronic mail* or text messag* or SMS or MMS or phone# or cellphone# or cell‐phone# or smartphone# or smart‐phone# or digital tablet# or pda or personal digital assistant# or social media or social networking or facebook or twitter or skyp* or app#) N3 (deliver* or generat* or based or provid* or facilitat* or support* or treatment# or therap* or intervention# or program* or feedback)) S8 (MH "Computers, Portable+") S7 (MH "Text Messaging") OR (MH "Wireless Communications") OR (MH "Electronic Mail") OR (MH "Instant Messaging") OR (MH "Internet+") S6 (MH "Computer Assisted Instruction") OR (MH "Therapy, Computer Assisted") S5 S1 or S2 or S3 or S4 S4 TI ("alcohol use*" OR alcoholic*) OR AB ("alcohol use*" OR alcoholic*) S3 TI (drink* N2 (excess or heavy or heavily or harm or harmful or hazard* or binge or problem*)) OR AB (drink* N2 (excess or heavy or heavily or harm or harmful or hazard* or binge or problem*)) S2 TI (alcohol* N2 (drink* or intoxicat* or use* or abus* or misus* or risk* or consum* or withdraw* or detox* or treat* or therap* or excess* or reduc* or cessation or intervention*)) OR AB (alcohol* N2 (drink* or intoxicat* or use* or abus* or misus* or risk* or consum* or withdraw* or detox* or treat* or therap* or excess* or reduc* or cessation or intervention*)) S1 (MH "Alcohol‐Related Disorders") OR (MH "Alcohol Abuse") OR (MH "Alcoholic Intoxication") OR (MH "Alcoholism") OR (MH "Alcohol Drinking") OR (MH "Alcohol Rehabilitation Programs")
Appendix 5. ERIC (ProQuest) search strategy
S17 S6 AND S15 S16 S6 AND S15 S15 S7 OR S8 OR S9 OR S12 OR S13 OR S14 S14 AB,TI(e‐BI or e‐SBI or ehealth or e‐health or electronic health or mhealth or m‐health or mobile health or virtual health or digital health or technological aid?) S13 AB,TI(email* or e‐mail* or electronic mail* or text messag* or SMS or MMS or phone[*2] or cellphone[*2] or cell‐phone[*2] or smartphone[*2] or smart‐phone[*2] or digital tablet[*2] or pda or personal digital assistant[*2] or social media or social networking or facebook or twitter or skyp* or app[*2]) S12 AB,TI((Internet* or electronic* or digital* or technolog* or online or on‐line or computer* or laptop[*2] or software or web* or weblog* or blog* or CD[*2] or CD‐ROM[*2]) NEAR/3 (deliver* or generat* or based or provid* or facilitat* or support* or treatment[*2] or therap* or intervention# or program* or feedback)) S9 SU.EXACT.EXPLODE("Computers") OR SU.EXACT("Computer Assisted Instruction") OR SU.EXACT("Electronic Mail") OR SU.EXACT("Handheld Devices") OR SU.EXACT("Discussion Groups") OR SU.EXACT("Web Based Instruction") S8 SU.EXACT("Web 2.0 Technologies") S7 SU.EXACT("Internet") OR SU.EXACT("Web Based Instruction") S6 S1 OR S2 OR S4 OR S5 S5 AB,TI("alcohol use*" or alcoholic*) S4 AB,TI(drink* NEAR/2 (excess or heavy or heavily or harm or harmful or hazard* or binge or harmful or problem*)) S2 AB,TI(alcohol* NEAR/2 (drink* or intoxicat* or use* or abus* or misus* or risk* or consum* or withdraw* or detox* or treat* or therap* or excess* or reduc* or cessation or intervention*)) S1 SU.EXACT.EXPLODE("Drinking")
Appendix 6. Web of Knowledge search strategy
Science Citation Index, Social Science Citation Index, Conference Proceedings Citation Index
#13 #12 AND #11 #12 TS=(intervention* or trial* or randomi* or controlled or experiment* or treatment* or outcome* or therap*) #11 #9 NOT #10 #10 TS=(rat or rats or animal* or mouse or mice) #9 #8 AND #4 #8 #7 OR #6 OR #5 #7 TS=(e‐BI or e‐SBI or ehealth or e‐health or “electronic health” or mhealth or m‐health or “mobile health” or “virtual health” or “digital health” or “technological aid$”) #6 TS=((Internet* or electronic* or digital* or technolog* or online or on‐line or computer* or laptop$ or software or web* or weblog* or blog* or CD$ or CD‐ROM$) NEAR/3 (deliver* or generat* or based or provid* or facilitat* or support* or treatment$ or therap* or intervention$ or program* or feedback)) #5 TS=((email* or e‐mail* or “electronic mail*” or “text messag*” or SMS or MMS or phone$ or cellphone$ or cell‐phone$ or smartphone$ or smart‐phone$ or “digital tablet$” or pda or “personal digital assistant$” or “social media” or “social networking” or facebook or twitter or skyp* or app$) NEAR/3 (deliver* or generat* or based or provid* or facilitat* or support* or treatment$ or therap* or intervention$ or program* or feedback)) #4 #3 OR #2 OR #1 #3 TS=("alcohol use*" or alcoholic*) #2 TS=((drink*) NEAR/2 (excess or heavy or heavily or harm or harmful or hazard* or binge or harmful or problem*)) #1 TS=((alcohol*) NEAR/2 (drink* or intoxicat* or use* or abus* or misus* or risk* or consum* or withdraw* or detox* or treat* or therap* or excess* or reduc* or cessation or intervention*))
Appendix 7. Criteria for 'Risk of bias' assessment in RCTs, CCTs and prospective observational studies
The interventions assessed were automated, and so blinding of providers and outcome assessors was not relevant (since these roles were provided by the computer).
| Item | Judgment | Description |
| 1. Random sequence generation (selection bias) | Low risk | The investigators describe a random component in the sequence generation process such as: random number table, computer random number generator, coin tossing, shuffling cards or envelopes, throwing dice, drawing of lots, minimisation; OR randomisation took place automatically as part of digital screening, allocation and intervention. |
| High risk | The investigators describe a non‐random component in the sequence generation process such as: odd or even date of birth; date (or day) of admission; hospital or clinic record number; alternation; judgement of the clinician; results of a laboratory test or a series of tests; availability of the intervention. | |
| Unclear risk | Insufficient information to permit judgement of low or high risk. | |
| 2. Allocation concealment (selection bias) | Low risk | Investigators enrolling participants could not foresee assignment because one of the following, or an equivalent method, was used to conceal allocation: central allocation (including telephone, web‐based, and pharmacy‐controlled, randomisation); sequentially numbered, opaque, sealed envelopes. Alternatively, allocation took place automatically as part of digital screening, allocation and intervention. |
| High risk | Investigators enrolling participants could possibly foresee assignments because one of the following method was used: open random allocation schedule (e.g. a list of random numbers); assignment envelopes without appropriate safeguards (e.g. if envelopes were unsealed or nonopaque or not sequentially numbered); alternation or rotation; date of birth; case record number; any other explicitly unconcealed procedure. | |
| Unclear risk | Insufficient information to permit judgement of low or high risk. | |
| 3. Blinding of providers (performance bias) Subjective outcomes |
Low risk | Blinding of providers and unlikely that the blinding could have been broken. Trials were assigned low risk of bias if the administration of the intervention was automated. |
| High risk | No blinding or incomplete blinding, and the outcome is likely to be influenced by lack of blinding; Blinding of key study participants and personnel attempted, but likely that the blinding could have been broken, and the outcome is likely to be influenced by lack of blinding. |
|
| Unclear risk | Insufficient information to permit judgement of low or high risk. | |
| 4. Blinding of participants (performance bias) Subjective outcomes |
Low risk | Blinding of participants and unlikely that the blinding could have been broken. |
| High risk | No blinding or incomplete blinding, and the outcome is likely to be influenced by lack of blinding; Blinding of key study participants and personnel attempted, but likely that the blinding could have been broken, and the outcome is likely to be influenced by lack of blinding. Studies received "high risk" as default unless there was an explicit attempt to blind participants. |
|
| Unclear risk | Insufficient information to permit judgement of low or high risk. | |
| 5. Blinding of outcome assessors (detection bias) | Low risk | Blinding of outcome assessors and unlikely that the blinding could have been broken. Trials were assigned low risk of bias if outcome collection was automated. |
| High risk | No blinding or incomplete blinding | |
| Unclear risk | Outcome collection was not automated and insufficient information is provided to assess blinding. | |
| 6. Incomplete outcome data (attrition bias) For all outcomes except retention in treatment or drop out |
Low risk | No missing outcome data; Reasons for missing outcome data unlikely to be related to true outcome (for survival data, censoring unlikely to be introducing bias); Missing outcome data balanced in numbers across intervention groups, with similar reasons for missing data across groups; For dichotomous outcome data, the proportion of missing outcomes compared with observed event risk not enough to have a clinically relevant impact on the intervention effect estimate; For continuous outcome data, plausible effect size (difference in means or standardised difference in means) among missing outcomes not enough to have a clinically relevant impact on observed effect size; Missing data have been imputed using appropriate methods All randomised patients are reported/analysed in the group they were allocated to by randomisation irrespective of non‐compliance and co‐interventions (intention‐to‐treat). |
| High risk | Reason for missing outcome data likely to be related to true outcome, with either imbalance in numbers or reasons for missing data across intervention groups; For dichotomous outcome data, the proportion of missing outcomes compared with observed event risk enough to induce clinically relevant bias in intervention effect estimate; For continuous outcome data, plausible effect size (difference in means or standardised difference in means) among missing outcomes enough to induce clinically relevant bias in observed effect size; ‘As‐treated’ analysis done with substantial departure of the intervention received from that assigned at randomisation. |
|
| Unclear risk | Insufficient information to permit judgement of low or high risk (e.g. number randomised not stated, no reasons for missing data provided; number of drop out not reported for each group). | |
| 7. Selective reporting (reporting bias) | Low risk | The study protocol is available and all of the study’s pre‐specified (primary and secondary) outcomes that are of interest in the review have been reported in the pre‐specified way; The study protocol is not available but it is clear that the published reports include all expected outcomes, including those that were pre‐specified (convincing text of this nature may be uncommon). |
| High risk | Not all of the study’s pre‐specified primary outcomes have been reported; One or more primary outcomes is reported using measurements, analysis methods or subsets of the data (e.g. subscales) that were not pre‐specified; One or more reported primary outcomes were not pre‐specified (unless clear justification for their reporting is provided, such as an unexpected adverse effect); One or more outcomes of interest in the review are reported incompletely so that they cannot be entered in a meta‐analysis; The study report fails to include results for a key outcome that would be expected to have been reported for such a study. |
|
| Unclear risk | Insufficient information to permit judgement of low or high risk. |
Data and analyses
Comparison 1. Digital intervention versus no or minimal intervention.
| Outcome or subgroup title | No. of studies | No. of participants | Statistical method | Effect size |
|---|---|---|---|---|
| 1 Quantity of drinking (g/week), based on longest follow‐up | 42 | 19241 | Mean Difference (IV, Random, 95% CI) | ‐22.84 [‐30.31, ‐15.36] |
| 2 Quantity of drinking (g/week), categorised by length of follow‐up | 42 | Mean Difference (IV, Random, 95% CI) | Subtotals only | |
| 2.1 At 1 month | 17 | 7187 | Mean Difference (IV, Random, 95% CI) | ‐20.30 [‐32.60, ‐8.01] |
| 2.2 From > 1 to 2 months | 6 | 2846 | Mean Difference (IV, Random, 95% CI) | ‐23.02 [‐44.95, ‐1.09] |
| 2.3 From > 2 to 3 months | 13 | 3000 | Mean Difference (IV, Random, 95% CI) | ‐43.30 [‐73.19, ‐13.41] |
| 2.4 From > 3 to 6 months | 19 | 12822 | Mean Difference (IV, Random, 95% CI) | ‐11.52 [‐16.31, ‐6.73] |
| 2.5 At 12 months | 7 | 3372 | Mean Difference (IV, Random, 95% CI) | ‐13.40 [‐31.28, 4.49] |
| 3 Quantity of drinking (g/week), based on longest follow‐up and categorised on whether restricted to adolescents or young adults | 42 | 19241 | Mean Difference (IV, Random, 95% CI) | ‐22.84 [‐30.31, ‐15.36] |
| 3.1 Trials of adolescents/young adults | 28 | 13477 | Mean Difference (IV, Random, 95% CI) | ‐13.44 [‐19.27, ‐7.61] |
| 3.2 Trials of adults | 14 | 5764 | Mean Difference (IV, Random, 95% CI) | ‐56.05 [‐82.08, ‐30.02] |
| 4 Quantity of drinking (g/week), categorised by length of follow‐up and restricted to trials of adolescents/young adults | 28 | Mean Difference (IV, Random, 95% CI) | Subtotals only | |
| 4.1 At 1 month | 15 | 6579 | Mean Difference (IV, Random, 95% CI) | ‐19.67 [‐32.96, ‐6.37] |
| 4.2 From > 1 to 2 months | 4 | 2002 | Mean Difference (IV, Random, 95% CI) | ‐7.60 [‐18.98, 3.77] |
| 4.3 From > 2 to 3 months | 8 | 1152 | Mean Difference (IV, Random, 95% CI) | ‐15.42 [‐29.39, ‐1.45] |
| 4.4 From > 3 to 6 months | 13 | 10499 | Mean Difference (IV, Random, 95% CI) | ‐10.36 [‐13.47, ‐7.25] |
| 4.5 At 12 months | 4 | 954 | Mean Difference (IV, Random, 95% CI) | ‐2.35 [‐23.57, 18.88] |
| 5 Quantity of drinking (g/week), based on longest follow‐up and categorised by gender | 5 | 2566 | Mean Difference (IV, Random, 95% CI) | ‐9.58 [‐22.24, 3.07] |
| 5.1 Males | 4 | 1923 | Mean Difference (IV, Random, 95% CI) | ‐8.86 [‐31.99, 14.27] |
| 5.2 Females | 4 | 643 | Mean Difference (IV, Random, 95% CI) | ‐9.81 [‐21.87, 2.24] |
| 6 Quantity of drinking (g/week), based on longest follow‐up and omitting trials at high risk of bias owing to incomplete data | 28 | 13559 | Mean Difference (IV, Random, 95% CI) | ‐16.24 [‐23.43, ‐9.05] |
| 7 Quantity of drinking (g/week), based on longest follow‐up and omitting trials at high risk of performance bias | 11 | 10272 | Mean Difference (IV, Random, 95% CI) | ‐10.53 [‐13.70, ‐7.36] |
| 8 Quantity of drinking (g/week), based on longest follow‐up, with imputation of missing standard deviations or number of participants per arm | 49 | 20351 | Mean Difference (IV, Random, 95% CI) | ‐21.58 [‐28.47, ‐14.69] |
| 9 Quantity of drinking (g/week), categorised by length of follow‐up, with imputation of missing standard deviations or number of participants per arm | 49 | Mean Difference (IV, Random, 95% CI) | Subtotals only | |
| 9.1 At 1 month | 18 | 6870 | Mean Difference (IV, Random, 95% CI) | ‐20.07 [‐31.94, ‐8.20] |
| 9.2 From > 1 to 2 months | 8 | 2946 | Mean Difference (IV, Random, 95% CI) | ‐20.18 [‐40.45, 0.09] |
| 9.3 From > 2 to 3 months | 16 | 3443 | Mean Difference (IV, Random, 95% CI) | ‐33.24 [‐57.32, ‐9.16] |
| 9.4 From > 3 to 6 months | 23 | 13736 | Mean Difference (IV, Random, 95% CI) | ‐11.89 [‐16.48, ‐7.30] |
| 9.5 At 12 months | 9 | 3938 | Mean Difference (IV, Random, 95% CI) | ‐11.62 [‐26.42, 3.17] |
| 9.6 At 18 months | 1 | 327 | Mean Difference (IV, Random, 95% CI) | 22.40 [‐5.56, 50.36] |
| 9.7 At 24 months | 1 | 327 | Mean Difference (IV, Random, 95% CI) | 1.40 [‐20.28, 23.08] |
| 10 Frequency of drinking (no. of days drinking/week), based on longest follow‐up | 16 | 10862 | Mean Difference (IV, Random, 95% CI) | ‐0.16 [‐0.24, ‐0.09] |
| 11 Frequency of binge drinking (no. of binges/week), based on longest follow‐up | 15 | 3587 | Mean Difference (IV, Random, 95% CI) | ‐0.24 [‐0.35, ‐0.13] |
| 12 Intensity of drinking (g/drinking day), based on longest follow‐up | 15 | 9791 | Mean Difference (IV, Random, 95% CI) | ‐4.63 [‐8.02, ‐1.23] |
| 13 Binge drinkers, based on longest period of follow‐up | 9 | 9417 | Risk Ratio (M‐H, Random, 95% CI) | 0.98 [0.97, 1.00] |
Comparison 2. Digital intervention versus face‐to‐face intervention.
| Outcome or subgroup title | No. of studies | No. of participants | Statistical method | Effect size |
|---|---|---|---|---|
| 1 Quantity of drinking (g/week), based on longest follow‐up | 5 | 390 | Mean Difference (IV, Random, 95% CI) | 0.52 [‐24.59, 25.63] |
| 2 Quantity of drinking (g/week), categorised by length of follow‐up | 5 | Mean Difference (IV, Random, 95% CI) | Subtotals only | |
| 2.1 At 1 month | 3 | 206 | Mean Difference (IV, Random, 95% CI) | 4.03 [‐36.90, 44.96] |
| 2.2 From > 1 to 2 months | 0 | 0 | Mean Difference (IV, Random, 95% CI) | 0.0 [0.0, 0.0] |
| 2.3 From > 2 to 3 months | 2 | 188 | Mean Difference (IV, Random, 95% CI) | 17.16 [‐42.07, 76.39] |
| 2.4 From > 3 to 6 months | 1 | 113 | Mean Difference (IV, Random, 95% CI) | 6.70 [‐50.53, 63.93] |
| 2.5 At 12 months | 0 | 0 | Mean Difference (IV, Random, 95% CI) | 0.0 [0.0, 0.0] |
| 3 Frequency of drinking (no. of days drinking/week), based on longest follow‐up | 1 | 58 | Mean Difference (IV, Random, 95% CI) | 0.05 [‐0.33, 0.43] |
| 4 Frequency of binge drinking (no. of binges/week), based on longest follow‐up | 3 | 206 | Mean Difference (IV, Random, 95% CI) | 0.04 [‐0.15, 0.22] |
Characteristics of studies
Characteristics of included studies [ordered by study ID]
Araki 2006.
| Methods | Parallel design RCT Intention‐to‐treat analysis performed: No |
|
| Participants | Japan; participants were employees of a company recruited via email; aged 30 to 50 years; eligible if gamma‐GTP > 60 IU/L. N = 36 randomised; 100% male |
|
| Interventions |
Intervention group (N = 12) received the email GP intervention, which comprised an individually tailored email with: (i) brochure on health risks and appropriate drinking behaviours; (ii) advice to support goal setting. Participants were asked to email their goal and could ask additional questions via email. Additional contact was made after 1 month, again via email, with participants asked to self‐assess their goal achievement. Goal modification or self‐evaluation of failure was encouraged. Subjects were able to send emails at any time. Face‐to‐face group (N = 12) received 2 x 30 minute face‐to‐face counselling sessions. The sessions comprised a short lecture on health risks and appropriate drinking behaviours using a brochure. In session 1, participants were supported to set a cessation goal taking into account their personal circumstances. Session 2 was delivered after 1 month and focussed on a review of participants' cessation goal. Assessment only group (N = 12) received no intervention until after the study had ended, when they received face‐to‐face health education |
|
| Outcomes | Mean g/day assessed at 2 months | |
| Funding source | Not reported | |
| Declarations of interest | Not reported | |
| Notes | ||
| Risk of bias | ||
| Bias | Authors' judgement | Support for judgement |
| Random sequence generation (selection bias) | Unclear risk | Method of sequence generation not described |
| Allocation concealment (selection bias) | Unclear risk | Not automated, specific detail not reported |
| Blinding of provider | Unclear risk | Researcher sent intervention emails |
| Blinding of participant | High risk | No reported attempt to blind participants |
| Blinding of outcome assessment (detection bias) All outcomes | Unclear risk | Not reported |
| Incomplete outcome data (attrition bias) All outcomes | Unclear risk | Not clear how many were randomised in the first place and number lost to follow‐up not reported |
| Selective reporting (reporting bias) | Low risk | All outcomes specified in the methods are reported |
| Other bias | Low risk | No further concerns |
Bendtsen 2015.
| Methods | Parallel design RCT Intention‐to‐treat analysis performed: Yes | |
| Participants | Sweden; participants were students (age criteria not reported) recruited from university health centre list; screened with single alcohol screening test (derived from question 3 of AUDIT), eligible if 5 + (men)/4 + (women) standard drinks on 1 occasion in previous 3 months; no further exclusion criteria reported. Number randomised = 1605 | |
| Interventions | Intervention group (N = 825) received AMADEUS‐2, accessed via an email link and delivered online; single session, duration not reported; participants entered consumption information and received (i) immediate feedback summarising weekly intake, frequency of heavy episodic drinking and highest blood alcohol concentration (BAC) during the last 4 weeks; (ii) traffic light graphic of their risk level; (iii) normative feedback comparing their consumption to other Swedish university students. They received a print‐out and emailed pdf of their feedback. Waiting list control group (N = 780): received no assessment or intervention until 2 months | |
| Outcomes | Mean g/week, mean drinks/drinking day, mean drinking days/week, mean peak BAC, assessed at 2 months | |
| Funding source | The study was funded by the Swedish Council for Working Life and Social Research (FAS, in Swedish; Grant number 2010‐0024) and by a Wellcome Trust Research Career Development fellowship in Basic Biomedical Science (WT086516MA) to JM. IW was supported by the Medical Research Council (Unit Program number: U105260558) | |
| Declarations of interest | PB and MB own the company that developed the online intervention used in this study and that also develops and distributes computerised lifestyle interventions. None of the other authors have any conflicts to declare | |
| Notes | ||
| Risk of bias | ||
| Bias | Authors' judgement | Support for judgement |
| Random sequence generation (selection bias) | Low risk | Randomisation was fully computerised, and all subsequent study processes were fully automated |
| Allocation concealment (selection bias) | Low risk | Study processes were fully automated |
| Blinding of provider | Low risk | Computer administered intervention |
| Blinding of participant | High risk | "There was no blinding in this study" (Study Procedures section) |
| Blinding of outcome assessment (detection bias) All outcomes | High risk | Waiting list design: intial cases were all intervention, later follow‐up all control |
| Incomplete outcome data (attrition bias) All outcomes | High risk | Loss to follow‐up > 30% in both groups and differential loss to follow‐up between groups |
| Selective reporting (reporting bias) | Low risk | All outcomes specified in the methods are reported |
| Other bias | High risk | Underpowered study according to sample size calculation |
Bertholet 2015.
| Methods | Parallel design RCT Intention‐to‐treat analysis performed: Yes |
|
| Participants | Switzerland; participants were recruited from army recruitment centres via email; aged 19 to 21 years; eligible if AUDIT = 8 + N = 737 randomised; 100% male; mean age = 20.75 years |
|
| Interventions |
Intervention group (N = 347) received web‐based intervention comprising seven components: (1) normative feedback; (2) feedback on consequences; (3) calorific value of consumption; (4) BAC for maximum binge episode; (5) indication of risk level; (6) information on alcohol and health; (7) recommendation for low risk drinking. Control group (N = 370) were given no feedback following the initial assessment |
|
| Outcomes | Mean drinks/week, mean total AUDIT, assessed at 1 and 6 months | |
| Funding source | The study was funded by the Swiss National Science Foundation (grant 325130_135538/1, Principle Investigator (PI): NB) | |
| Declarations of interest | NB is salaried by Lausanne University Hospital, a public institution; he has received grants from the Swiss National Science Foundation, the Swiss Foundation for Alcohol Research and the Department of Community Medicine and Health from the Lausanne University Hospital. He has received no personal support from industry sources such as pharmaceutical, alcohol and tobacco companies and holds no personal stock. He has collaborated with colleagues receiving an honorarium from pharmaceutical industry sources and is senior author of two publications using data from a study sponsored by Lundbeck SAS. JAC and MF: none to declare. JG has collaborated in a study funded by Lundbeck SAS. During the past 5 years, GG has received grants from various governmental and quasi‐governmental sources, the Swiss National Science Foundation and the Swiss Foundation for Alcohol Research, and the World Health Organization. He is currently employed at Addiction Switzerland, a NGO that receives donations from the Swiss general population. He is also employed at the Alcohol Treatment Center of the Lausanne University Hospital. He has received fees from his institutes, the World Health Organization and the Swiss government for attending international meetings. He has received no personal support fromindustry sources such as pharmaceutical, alcohol and tobacco companies and holds no personal stock. He may have collaborated with colleagues receiving funds from such sources, and may have participated at conferences which were co‐sponsored by the pharmaceutical industry. BB is salaried by Lausanne University Hospital, a public institution; he is the Director of Cochrane Switzerland, a branch of Cochrane. J‐BD received an honorarium from Lundbeck SAS for conferences and advisory board meetings | |
| Notes | ||
| Risk of bias | ||
| Bias | Authors' judgement | Support for judgement |
| Random sequence generation (selection bias) | Low risk | Randomisation was at the individual level and was completely automated, with no experimenter involvement |
| Allocation concealment (selection bias) | Low risk | "Concealment of allocation was total and has been used successfully in other large internet trials" (p 1738) |
| Blinding of provider | Low risk | Computer‐administered intervention |
| Blinding of participant | Low risk | "To mask some of the study aims... all participants were asked for their opinion of online health questionnaires" (p 1738) |
| Blinding of outcome assessment (detection bias) All outcomes | Low risk | "Researchers were blind to group allocation" (p 1738) |
| Incomplete outcome data (attrition bias) All outcomes | Low risk | Loss to follow‐up around 10% |
| Selective reporting (reporting bias) | Low risk | All outcomes specified in the methods are reported |
| Other bias | Low risk | No further concerns |
Blankers 2011.
| Methods | Parallel design RCT Intention‐to‐treat analysis performed: Yes |
|
| Participants | Netherlands; participants were recruited from a substance abuse treatment centre website; aged 18 to 65 years; eligible if AUDIT > 8 or 14 + drinks/week. N = 205 randomised; 50% male; mean age = 42.2 years |
|
| Interventions |
SAO intervention group (N = 68) received the SAO (Self‐help Alcohol Online) web‐based intervention that was available across multiple platforms. Participants were encouraged to engage on a daily basis over a period of 4 weeks for 20 minutes per session. The programme comprised '4 piers': (1) monitored participants' alcohol consumption, helped them set drinking goals and identify risky situations that might lead to relapse; (2) provided feedback on current alcohol consumption and compared this to their drinking goal; (3) focused on building skills and knowledge around coping with craving, drinking lapses, peer pressure, and maintaining motivation in risky situations; (4) provided social support via a web‐based forum. Control group (N = 69) were wait‐listed, assessed at 3 months and then received the digital intervention. A second intervention group (TAO ‐ therapy alcohol online) was not included in the meta‐analysis because it incorporated both digital and face‐to‐face interventions together |
|
| Outcomes | Mean drinks/week, mean total AUDIT, assessed at 3 and 6 months | |
| Funding source | The RCT reported in this article was funded by Grant 31160006 from the ZonMw Addiction II Program (Risk Behavior and Dependency) | |
| Declarations of interest | The authors declare that they have no competing interests | |
| Notes | ||
| Risk of bias | ||
| Bias | Authors' judgement | Support for judgement |
| Random sequence generation (selection bias) | Low risk | Server‐based performance of randomisation procedures (reported in protocol) |
| Allocation concealment (selection bias) | Low risk | "Allocation procedures... were automated and server based and involved no interaction with the participants" (p 332) |
| Blinding of provider | Low risk | Computer‐administered intervention |
| Blinding of participant | High risk | No reported attempt to blind participants |
| Blinding of outcome assessment (detection bias) All outcomes | High risk | Waiting list design: intial cases were all intervention, later follow‐up all control |
| Incomplete outcome data (attrition bias) All outcomes | High risk | Loss to follow‐up > 30% |
| Selective reporting (reporting bias) | Low risk | All outcomes specified in the methods are reported |
| Other bias | Low risk | No further concerns |
Boon 2011.
| Methods | Parallel design RCT Intention‐to‐treat analysis performed: Yes |
|
| Participants | Netherlands; participants were recruited from newspaper advertisements and a national household panel; aged 18 to 65 years; eligible if > 21 units/week or 6 + units at least 1 day/week for last 3 months (men), or > 14 units/week or 4 + units at least 1 day/week for last 3 months (women). N = 450 randomised; 100% male; mean age = 40.4 years |
|
| Interventions |
Intervention group (N = 230) received web‐based brief personalised feedback via www.drinktest.nl in 2 stages. (1) Participants were asked to reflect on their weekly alcohol consumption and heavy episodic drinking and received personalised advice on the possible consequences of their drinking behaviour, including normative feedback. (2) Participants were asked additional questions on their drinking behaviour, focussed on self‐efficacy, attitudes and intentions (drawing on the transtheoretical model), and received personalised feedback on how to reduce alcohol consumption in specific situations. Control group (N = 220) received a standard brochure developed by the Netherlands Institute for Health Promotion and Disease Prevention which contained factual information on the biological effects of alcohol, as well as on healthy and unhealthy drinking patterns |
|
| Outcomes | Success rates of adherence to guidelines assessed at 6 months | |
| Funding source | This study was funded by the Netherlands Health Research Council (ZonMw) Grant # 50‐50110‐98‐235 | |
| Declarations of interest | None declared | |
| Notes | ||
| Risk of bias | ||
| Bias | Authors' judgement | Support for judgement |
| Random sequence generation (selection bias) | Low risk | "Randomisation was conducted using a computer random number generator" (Randomisation section) |
| Allocation concealment (selection bias) | High risk | "The condition to which participants were assigned was revealed to research assistants once recruitment was complete" (Randomisation section) |
| Blinding of provider | Unclear risk | Participants accessed intervention in behavioural laboratory; unclear whether researchers were present |
| Blinding of participant | Low risk | Participants were told that the purpose of the study was to judge educational materials on 3 topics; it was not revealed that inclusion was based on alcohol intake |
| Blinding of outcome assessment (detection bias) All outcomes | High risk | "The condition to which participants were assigned was revealed to research assistants once recruitment was complete" (Randomisation section) |
| Incomplete outcome data (attrition bias) All outcomes | Low risk | Loss to follow‐up around 10% |
| Selective reporting (reporting bias) | Low risk | All outcomes specified in the methods are reported |
| Other bias | Low risk | No further concerns |
Brendryen 2013.
| Methods | Parallel design RCT Intention‐to‐treat analysis performed: Yes |
|
| Participants | Norway; participants were recruited from online newspapers advertisements; aged ≥ 18 years; eligible if FAST = 3 +. N = 244 randomised; 67% male |
|
| Interventions |
Intervention group (N = 125) received Balance, a web‐based intervention combining both brief and intensive self‐help interventions. (1) Screening and feedback session based on personalised normative feedback. Participants identified as risky drinkers were recommended to sign‐up for the intensive self‐help intervention. (2) The intensive self‐help intervention comprised 62 online sessions taking up to 10 hours over 6 months. Control group (N = 119) received an e‐booklet, issued by the Norwegian Directorate of Health, which provided general information on alcohol and the potential risks and harms of drinking. Neither the screening session nor the booklet contained advice on how to achieve a change in drinking behaviour |
|
| Outcomes | Mean drinks/week assessed at 2 and 6 months | |
| Funding source | This trial was funded by the Norwegian Research Council and the Norwegian Centre for Addiction Research. The intervention was funded by The Workplace Advisory Centre for Issues Relating to Alcohol, Drugs and Addictive Gambling | |
| Declarations of interest | In 2009, HB received payments from The Workplace Advisory Centre for Issues Relating to Alcohol, Drugs and Addictive Gambling, a non‐profit organization working with prevention and recovery of addictions. The advisory centre developed and funded the current intervention, and is currently implementing it across Norway. HB has no other competing interests. IOL, ABJ, MR, SN and FD declare no financial interests in the current intervention, or any other conflicting interests | |
| Notes | ||
| Risk of bias | ||
| Bias | Authors' judgement | Support for judgement |
| Random sequence generation (selection bias) | Low risk | "A computerised automatic simple randomisation procedure was performed" (p 219) |
| Allocation concealment (selection bias) | Low risk | Automated procedure |
| Blinding of provider | Low risk | Computer‐administered intervention |
| Blinding of participant | High risk | Control participants were blinded as to nature of the intervention ("to avoid resentful demoralization in the control group", p 214), but intervention participants could not be blinded to the nature of the intervention |
| Blinding of outcome assessment (detection bias) All outcomes | Low risk | "Apart from the telephone interview, there was no person‐to‐person interaction between participant and experimenters" (p 219) |
| Incomplete outcome data (attrition bias) All outcomes | High risk | Loss to follow‐up > 20% and differential loss to follow‐up between groups |
| Selective reporting (reporting bias) | Low risk | All outcomes specified in the methods are reported |
| Other bias | Low risk | No further concerns |
Brief 2013.
| Methods | Parallel design RCT Intention‐to‐treat analysis performed: Yes |
|
| Participants | USA; participants were army veterans recruited via advertisements on Facebook; aged 18 to 65 years; may have post‐traumatic stress disorder which the intervention was also designed to address; eligible if AUDIT score was 8 to 25 (men) or 5 to 25 (women). N = 600 randomised; 87% male |
|
| Interventions |
Intervention group (N = 404) received the web‐based VetChange intervention involving 8 modules based motivational, cognitive‐behavioural, and self‐control training strategies; (1 to 3) Included personalised feedback on their drinking and post‐traumatic stress disorder (PTSD) symptoms, evaluated the importance of and readiness to change, set drinking goals, developed a change plan, and reviewed moderation or abstinence strategies; (4) introduced participants to external high risk situations (i.e. social situations, environmental reminders of combat) and helped them to develop coping plans to manage these situations; (5 to 7) focused on helping veterans learn a combination of cognitive and behavioural strategies to manage a range of internal high‐risk situations for drinking; (6 to 7) encouraged participants to select topics most relevant to their personal situation; and (8) focused on building a support system to assist with recovery efforts following completion of VetChange. VetChange was delivered over a period of 8 weeks, each session lasts 20 minutes. Control group (N = 196) received a delayed intervention. This commenced at the 8‐week post‐intervention stage of the immediate intervention group; we used only 8 week data when the control group has received nothing |
|
| Outcomes | Median drinks/week, median drinks/drinking day, assessed at 3 months | |
| Funding source | This research was supported by National Institute on Alcohol Abuse and Alcoholism Grant RC1AA019248 (principal investigator: Terence M Keane) | |
| Declarations of interest | Not reported | |
| Notes | ||
| Risk of bias | ||
| Bias | Authors' judgement | Support for judgement |
| Random sequence generation (selection bias) | Unclear risk | Method of sequence generation not reported |
| Allocation concealment (selection bias) | Unclear risk | Not reported |
| Blinding of provider | Low risk | Computer administered intervention |
| Blinding of participant | High risk | No reported attempt to blind participants |
| Blinding of outcome assessment (detection bias) All outcomes | Unclear risk | Not reported |
| Incomplete outcome data (attrition bias) All outcomes | High risk | Loss to follow‐up > 30%; participants with higher consumption were more likely to drop out |
| Selective reporting (reporting bias) | Low risk | All outcomes specified in the methods are reported |
| Other bias | Low risk | No further concerns |
Butler 2003.
| Methods | Parallel design RCT Intention‐to‐treat analysis performed: No |
|
| Participants | USA; participants were recruited via primary care clinics; aged ≥ 21 years; eligible if AUDIT > 8. N = 151 randomised; mean age = 40.8 years |
|
| Interventions |
Intervention group (N = 62) received an interactive consumer education and harm reduction program (Health Habits Survey (HHS)) delivered via a health education kiosk in primary care setting. (1) Participants were asked a range of demographic, general health and alcohol‐specific questions, including the full AUDIT screening questionnaire, then asked to select from a series of statements based on the stages‐of‐change model to classify readiness to change their drinking behaviour. HHS generated a tailored, feedback report based on both alcohol use patterns and stage‐of‐change. Control group (N = 66) initially received an assessment only, with the intervention delivered subsquently |
|
| Outcomes | Mean AUDIT‐C assessed at 6 months | |
| Funding source | This project was supported by an SBIR grant # R44AA11052 from the National Institute on Alcohol Abuse and Alcoholism | |
| Declarations of interest | Not reported | |
| Notes | ||
| Risk of bias | ||
| Bias | Authors' judgement | Support for judgement |
| Random sequence generation (selection bias) | Unclear risk | All participants in each site had assessment‐only phase followed by intervention phase |
| Allocation concealment (selection bias) | Low risk | Assessment phase followed by intervention phase meant there was no contamination between groups |
| Blinding of provider | Unclear risk | Participants carried out intervention whilst waiting for primary care consultation, but unclear whether researchers were involved |
| Blinding of participant | High risk | No reported attempt to blind participants |
| Blinding of outcome assessment (detection bias) All outcomes | High risk | Telephone follow‐up interviews were undertaken, and assessors were not blinded to condition |
| Incomplete outcome data (attrition bias) All outcomes | Unclear risk | Loss to follow‐up not reported by arm |
| Selective reporting (reporting bias) | Unclear risk | Limited reporting of data on alcohol outcomes |
| Other bias | High risk | Reporting is very poor in this trial; particularly unclear when the control group began to receive the intervention, and whether this influenced 6‐month follow‐up results |
Butler 2009.
| Methods | Parallel design RCT Intention‐to‐treat analysis performed: No |
|
| Participants | USA; participants were students (age criteria not reported); eligible if at least 2 binge episodes (5 + drinks for men, 4 + drinks for women) and 2 alcohol related problems (RAPI) in the past 28 days. N = 114 randomised; 35% male |
|
| Interventions |
Computerised group (N = 30) were provided with personalised feedback regarding their use of alcohol but did not have any contact with a clinician. A research assistant seated the participants in a private room and instructed them to review their feedback via computer in the form of a self‐paced slide presentation. On average, the session lasted 11.11 mins (SD 3.56). Face‐to‐face group (N = 28) were provided with personalised feedback regarding their use of alcohol. The specific content included in the feedback was identical in both the face‐to‐face and computerised feedback condition. Participants met with a graduate clinician to review a printed feedback form. The clinician was trained to incorporate aspects of Motivational Interviewing into each feedback session and was available to answer any questions about the information presented. On average, the session lasted 41 mins (SD 5.73). Control group (N = 26) completed the pre‐intervention assessment battery and met the inclusion criterion but did not receive personalized feedback before completing the follow‐up measures. At the conclusion of the study, participants in the control group were given the option of receiving a personalised feedback form |
|
| Outcomes | Mean drinks/week assessed at 4 weeks | |
| Funding source | Not reported | |
| Declarations of interest | This project was completed as the first author's master’s thesis | |
| Notes | ||
| Risk of bias | ||
| Bias | Authors' judgement | Support for judgement |
| Random sequence generation (selection bias) | Unclear risk | "A randomised block design was used" (p 164), but method of sequence generation was not reported |
| Allocation concealment (selection bias) | Unclear risk | Not reported |
| Blinding of provider | Low risk | "Participants in the computerised condition did not have any contact with the clinician" (p 165) |
| Blinding of participant | High risk | No reported attempt to blind participants |
| Blinding of outcome assessment (detection bias) All outcomes | Unclear risk | Not reported |
| Incomplete outcome data (attrition bias) All outcomes | Unclear risk | Loss to follow‐up is around 20% |
| Selective reporting (reporting bias) | Low risk | All outcomes specified in the methods are reported |
| Other bias | Low risk | No further concerns |
Chiauzzi 2005.
| Methods | Parallel design RCT Intention‐to‐treat analysis performed: Yes |
|
| Participants | USA; participants were students (age criteria not reported); eligible if 5 + (men) or 4 + (women) drinks per occasion at least once in last week. N = 265 randomised; 46% male; mean age = 19.9 years |
|
| Interventions |
Intervention group (N = 131) received the web‐based MSB: Alcohol intervention. Rate Myself (based on the BASICS model) was the centerpiece of the site, comprising 4 sets of questions: (1) beliefs regarding alcohol; (2) lifestyle issues; (3) drinking risks; (4) drinking consequences. Participants receiived immediate tailored feedback based on their responses, with the option of printing out a personal report. In addition, MSB: Alcohol offered: variety of college‐specific articles, strategies and interactive tools related to alcohol and drinking on campus; weekly updates of peer stories (Student Voices); Ask the Expert (answers from a college alcohol expert to frequently asked alcohol questions); and college health news. An emergency area helped participants to recognise effective ways to deal with alcohol poisoning and find local resources in the event of urgent medical problems. The intervention was delivered as 1 x 20 minute session over a period of 4 weeks. Control group (N = 134) compared the educational content found at various websites. Participants visited websites and read research‐based articles about the effects of excessive drinking once a week over 4 consecutive weeks Unlike MSB: Alcohol, the control condition did not involve any tailored, interactive, motivational, or skill‐building elements |
|
| Outcomes | Mean drinks/week assessed at 3 months | |
| Funding source | A Small Business Innovation Research Grant # 4R44AA12713‐02 from the National Institute on Alcohol Abuse and Alcoholism (NIAAA) supported this work | |
| Declarations of interest | Emil Chiauzzi is Vice President of Product Development; Traci Craig Green is the Biostatistician; Sarah Lord is Director of College Health Programs; and Christina Thum is Senior Product Manager. All are with Inflexxion, Inc, Newton, Massachusetts, a technology‐based company that specialises in developing science based health interventions and educational programs | |
| Notes | ||
| Risk of bias | ||
| Bias | Authors' judgement | Support for judgement |
| Random sequence generation (selection bias) | Low risk | "We used an urn system of random assignment to condition" (a method which reduces imbalance between arms in small trials, p 265) |
| Allocation concealment (selection bias) | Unclear risk | Research assistants provided participants with log‐in codes (p 265), not reported how allocation was concealed |
| Blinding of provider | Low risk | Computer administered intervention (not completed in the presence of the research assistant) |
| Blinding of participant | Low risk | Both arms of the trial visited an alcohol‐related website |
| Blinding of outcome assessment (detection bias) All outcomes | High risk | Research assistants not blinded to programme condition |
| Incomplete outcome data (attrition bias) All outcomes | Low risk | Loss to follow‐up around 20% |
| Selective reporting (reporting bias) | Low risk | All outcomes specified in the methods are reported |
| Other bias | High risk | 21 participants who were ineligible (no binge drinking according to the baseline screening assessment) were included in the analysis |
Collins 2014 (DBF).
| Methods | Parallel design RCT Intention‐to‐treat analysis performed: No |
|
| Participants | USA; participants were students; aged 18 to 25 years; eligible if 5 + (men) or 4 + (women) drinks per occasion in the last 30 days. N = 366 randomised |
|
| Interventions |
Intervention group (N = 251) received web‐based personalised Decisional Balance Feedback on the advantages and disadvantages of current drinking behaviour based on self‐report responses to a baseline decision‐balance worksheet comprising: (1) graphs of decision balance proportion; (2) graph and text representations of quantitative total; (3) qualitative content of advantages /disadvantages of current drinking behaviour; (4) likelihood and importance of each advantage/disadvantage. Control group (N = 231) received web‐based assessment only. After assessment, participants were shown a screen that thanked them for their time and reminded them they would be contacted in 1 month for follow‐up |
|
| Outcomes | Mean drinks/month assessed at 1, 6 and 12 months | |
| Funding source | This research was supported by National Institute on Alcohol Abuse and Alcoholism Career Transition Award K22AA018384 (to Susan E Collins) | |
| Declarations of interest | Not reported | |
| Notes | ||
| Risk of bias | ||
| Bias | Authors' judgement | Support for judgement |
| Random sequence generation (selection bias) | Low risk | Randomisation was automated (p 986) |
| Allocation concealment (selection bias) | Low risk | Allocation was automated |
| Blinding of provider | Low risk | Computer administered intervention |
| Blinding of participant | High risk | No reported attempt to blind participants |
| Blinding of outcome assessment (detection bias) All outcomes | Low risk | Automated follow‐up |
| Incomplete outcome data (attrition bias) All outcomes | Unclear risk | Loss to follow‐up around 20% |
| Selective reporting (reporting bias) | Low risk | All outcomes specified in the methods are reported |
| Other bias | Low risk | No further concerns |
Collins 2014 (PNF).
| Methods | Parallel design RCT Intention‐to‐treat analysis performed: No |
|
| Participants | USA; participants were students; aged 18 to 25 years; eligible if 5 + (men) or 4 + (women) drinks per occasion in the last 30 days. N = 358 randomised |
|
| Interventions |
Intervention group (N = 242) recevied PNF (Personalised Norms Feedback) designed to reduce overestimated perceptions about drinking in their peer group. This comprised 4 main feedback elements: (1) typical weekly quantity of perceived versus actual gender peer norms; (2) typical and peak estimated BAL versus gender norms; (3) calories consumed from alcohol in a typical week versus gender norms; (4) money spent on alcohol during a typcial week versus gender norms. Control group (N = 231) received web‐based assessment only. After assessment, participants were shown a screen that thanked them for their time and reminded them they would be contacted in 1 month for follow‐up |
|
| Outcomes | Mean drinks/month assessed at 1, 6 and 12 months | |
| Funding source | This research was supported by National Institute on Alcohol Abuse and Alcoholism Career Transition Award K22AA018384 (to Susan E Collins) | |
| Declarations of interest | Not reported | |
| Notes | ||
| Risk of bias | ||
| Bias | Authors' judgement | Support for judgement |
| Random sequence generation (selection bias) | Low risk | Randomisation was automated (p 986) |
| Allocation concealment (selection bias) | Low risk | Allocation was automated |
| Blinding of provider | Low risk | Computer administered intervention |
| Blinding of participant | High risk | No reported attempt to blind participants |
| Blinding of outcome assessment (detection bias) All outcomes | Low risk | Automated follow‐up |
| Incomplete outcome data (attrition bias) All outcomes | Unclear risk | Loss to follow‐up around 20% |
| Selective reporting (reporting bias) | Low risk | All outcomes specified in the methods are reported |
| Other bias | Low risk | No further concerns |
Cucciare 2013.
| Methods | Parallel design RCT Intention‐to‐treat analysis performed: not reported |
|
| Participants | USA; participants were veterans (age criteria not reported) recruited from primary care clinics; eligible if AUDIT‐C = 4 + (men) or 3 + (women). N = 167 randomised; 88% male |
|
| Interventions |
Intervention group (N = 89) received treatment as usual (a face‐to‐face brief alcohol intervention) in addition to a computerised brief alcohol intervention (BAI). The additional BAI intervention component lasted around 10 to 15 minutes and included the following domains: (a) typical alcohol consumption; (b) lifetime negative consequences of alcohol or other substance abuse; (c) risk factors for unsafe drinking such as combat experience and/or symptoms of PTSD; (d) lifetime use of illicit substances (other than alcohol); and (e) motivation and confidence to change substance use. A personalised feedback report was generated from the assessment content. Control group (N = 78) received a face‐to‐face brief alcohol intervention by their primary care provider as specified by VA requirements |
|
| Outcomes | Mean drinks/drinking day, mean AUDIT‐C, assessed at 3 and 6 months | |
| Funding source | Research based on work supported by a Career Development Award‐2 (CDA‐08‐004‐3) to Michael Cucciare by the Department of Veterans Affairs, Veterans Health Administration | |
| Declarations of interest | Not reported | |
| Notes | ||
| Risk of bias | ||
| Bias | Authors' judgement | Support for judgement |
| Random sequence generation (selection bias) | Low risk | "Participants were randomised... using random numbers generated by a software program" (p 429) |
| Allocation concealment (selection bias) | Unclear risk | Not reported; process not completely automated because research assistants guide participants to computer (p 429) |
| Blinding of provider | High risk | Participants accessed intervention in clinic in the presence of researchers (p 429) |
| Blinding of participant | High risk | No reported attempt to blind participants |
| Blinding of outcome assessment (detection bias) All outcomes | Low risk | "Researchers were blind to the condition when completing follow‐up assessments" (p 430) |
| Incomplete outcome data (attrition bias) All outcomes | Low risk | Loss to follow‐up < 20% |
| Selective reporting (reporting bias) | Low risk | All outcomes specified in the methods are reported |
| Other bias | Low risk | No further concerns |
Cunningham 2009a.
| Methods | Parallel design RCT Intention‐to‐treat analysis performed: Yes |
|
| Participants | Canada; participants were recruited (age criteria not reported) from an ongoing population telephone survey; eligible if AUDIT‐C = 4 +. N = 185 randomised; 53% male; mean age = 40.1 years |
|
| Interventions |
Intervention group (N = 92) received the web‐based Change Your Drinking (CYD) intervention modelled on Drinker’s Check‐up and Fostering Self‐Change. Core CYD elements were (1) normative feedback and (2i) summary of the participant’s severity of alcohol problems. In total the CYD intervention tool under 10 minutes to complete. Control group (N = 93) did not receive any feedback but were sent a list of the informational components that could be included in a computerised summary for drinkers, asked to consider how useful they might find the different components, and reminded that they would be asked for their opinions at the 3‐month follow‐up |
|
| Outcomes | Mean drinks/week, mean AUDIT‐C, assessed at 3 and 6 months | |
| Funding source | Funding for this study was provided by the National Institute on Alcohol Abuse and Alcoholism, Research Grant no. 1 R01 AA015056‐01A2. In addition, support to CAMH for salary of scientists and infrastructure has been provided by the Ontario Ministry of Health and LongTerm Care | |
| Declarations of interest | John Cunningham has acted as a paid consultant for Evolution Health Systems Inc. in the development of the Check Your Drinking screener. Trevor van Mierlo is the CEO of Evolution Health Systems Inc. Cameron Wild, Joanne Cordingley and Keith Humphreys have no conflicts of interest to declare | |
| Notes | ||
| Risk of bias | ||
| Bias | Authors' judgement | Support for judgement |
| Random sequence generation (selection bias) | Low risk | "Randomisation was conducted using a random numbers list" (p 2025) |
| Allocation concealment (selection bias) | Unclear risk | Not reported |
| Blinding of provider | Low risk | Computer administered intervention |
| Blinding of participant | High risk | No reported attempt to blind participants |
| Blinding of outcome assessment (detection bias) All outcomes | Unclear risk | Not reported; not all data collection was automated |
| Incomplete outcome data (attrition bias) All outcomes | Low risk | Loss to follow‐up around 10% |
| Selective reporting (reporting bias) | Low risk | All outcomes specified in the methods are reported |
| Other bias | High risk | The protocol specified the cut point would be AUDIT ≥ 8 for inclusion to the trial. AUDIT‐C ≥ 4 was used because the investigators were forced to use a more concise tool |
Cunningham 2012b.
| Methods | Parallel design RCT Intention‐to‐treat analysis performed: Yes |
|
| Participants | Canada; participants were students (age criteria not reported) recruited via email; eligible if AUDIT‐C = 4 +. N = 425 randomised; 53% male; mean age = 22.6 years |
|
| Interventions |
Intervention group (N = 211) received a modified version of the Change Your Drinking intervention (CYD‐U). Key changes involved: (1) incorporation of age, gender and country specific university student norms; and (2) addition of graphical elements depicting the calorific content of the amount of alcohol consumed, the amount of weight gain and exercise required to off‐set this weight gain, and alternative uses for money spent on alcohol. Control group (N = 214) were not provided with a link to the CYD‐U intervention but were thanked for their participation and told they would be contacted again in 6 weeks |
|
| Outcomes | Mean AUDIT‐C assessed at 6 weeks | |
| Funding source | Support to CAMH for salary of scientists and infrastructure has been provided by the Ontario Ministry of Health and Long Term Care. John Cunningham is supported as the Canada Research Chair in Brief Interventions for Addictive Behaviours | |
| Declarations of interest | The authors have no conflicts of interest to declare | |
| Notes | ||
| Risk of bias | ||
| Bias | Authors' judgement | Support for judgement |
| Random sequence generation (selection bias) | Low risk | Randomisation was automated |
| Allocation concealment (selection bias) | Low risk | Whole recruitment process was automated |
| Blinding of provider | Low risk | Computer administered intervention |
| Blinding of participant | High risk | No reported attempt to blind participants |
| Blinding of outcome assessment (detection bias) All outcomes | Low risk | Automated follow‐up |
| Incomplete outcome data (attrition bias) All outcomes | Unclear risk | Loss to follow‐up around 20%, all participants included through imputation and sensitivity analyses conducted |
| Selective reporting (reporting bias) | Low risk | Only one outcome specified in the methods and reported |
| Other bias | Low risk | No further concerns |
Delrahim‐Howlett 2011.
| Methods | Parallel design RCT Intention‐to‐treat analysis performed: No |
|
| Participants | USA; participants were recruited via Women Infant and Children (WIC) Special Supplemental Nutrition Clinics; aged 18 to 45 years; eligible if 3 + drinks per occasion in the previous month. N = 150 randomised; 0% male; mean age = 26.33 years |
|
| Interventions |
Intervention group (N = 68) received an adapted version of the e‐CHUG (e‐CHeckUp to Go) intervention, tailored to fit the reading and comprehension levels of participants in this trial (high‐risk women). Participants were given personalised feedback on alcohol consumption, health risks associated with unhealthy alcohol consumption (general and specific to women of childbearing age), and social norms. Participants were also provided with tips for sensible drinking and contact information for local support services. Control group (N = 67) received printed generic (non personalised) information post‐assessment. The 2‐page information sheet covered: alcohol consumption; US Surgeon General's recommendations on alcohol use for women of childbearing age; generic information about fetal alcohol syndrome; and details of local alcohol and other health behaviour resources |
|
| Outcomes | Mean drinks/drinking day assessed at 1 and 2 months | |
| Funding source | This study was funded by a Dissertation Grant from the Agency for Healthcare Research and Quality (HS018071‐01), US Department of Health and Human Services | |
| Declarations of interest | Not reported | |
| Notes | ||
| Risk of bias | ||
| Bias | Authors' judgement | Support for judgement |
| Random sequence generation (selection bias) | Low risk | "Using a random number table generated by computer software, the WIC eCHECKUP program then randomized the participant to one of 2 study groups" (p 1333) |
| Allocation concealment (selection bias) | Low risk | Automated procedure |
| Blinding of provider | Unclear risk | Computer administered intervention but it was accessed in the clinic so not clear if anyone was with the participants |
| Blinding of participant | High risk | No reported attempt to blind participants |
| Blinding of outcome assessment (detection bias) All outcomes | Unclear risk | Data collection was not automated: "...all follow‐up measures were collected via telephone interview" (p 1333) |
| Incomplete outcome data (attrition bias) All outcomes | Low risk | Loss to follow‐up around 10% |
| Selective reporting (reporting bias) | Low risk | All outcomes specified in the methods are reported |
| Other bias | Low risk | No further concerns |
Doumas 2010.
| Methods | Parallel design RCT Intention‐to‐treat analysis performed: No |
|
| Participants | USA; participants were student athletes recruited via the National Collegiate Athletics Association seminar group; aged 18 to 20 years; eligible if 5 + (men) or 4 + (women) drinks per occasion in previous 3 months. N = 113 randomised; 43% male; mean age = 18.08 years |
|
| Interventions |
Intervention group (N = 62) received the web‐based e‐CHUG intervention. Participants first completed an online assessment consisting of basic demographic details and information on alcohol consumption, drinking behaviour, and alcohol related consequences. Immediately post‐assessment, individualised feedback was provided in the following domains: (1) summary of quantity and frequency of drinking; (2) graphical comparison of their drinking to USA adult and college drinking norms; (3) estimated risk status for negative consequences/problematic drinking based on AUDIT scores; (4) genetic risk/tolerance; (5) approximate financial costs of drinking in the past year; (6) normative feedback comparing indiviudal perception of peer drinking to actual university normative data; (7) and referral information for local agencies In total, the intervention took approximately 30 minutes Control group (N = 51) received generic (non‐personalised) information only, including facts about alcohol and alcohol consumption, and guidelines on dealing with someone who has had too much alcohol to drink. Participants were asked to "surf the website" for 30 mins in total |
|
| Outcomes | Mean drinks/week assessed at 3 months | |
| Funding source | Not reported | |
| Declarations of interest | Not reported | |
| Notes | ||
| Risk of bias | ||
| Bias | Authors' judgement | Support for judgement |
| Random sequence generation (selection bias) | Unclear risk | Method of sequence generation not reported |
| Allocation concealment (selection bias) | Unclear risk | Not reported |
| Blinding of provider | Unclear risk | Computer administered intervention but it took place in the class so not clear if provider was able to interact with participants |
| Blinding of participant | Low risk | Control group accessed an alcohol education website for the same amount of time so both groups received alcohol information |
| Blinding of outcome assessment (detection bias) All outcomes | Unclear risk | Not reported |
| Incomplete outcome data (attrition bias) All outcomes | Low risk | Loss to follow‐up <10% |
| Selective reporting (reporting bias) | Low risk | All outcomes specified in the methods are reported |
| Other bias | Low risk | No further concerns |
Doumas 2011a.
| Methods | Parallel design RCT Intention‐to‐treat analysis performed: No |
|
| Participants | USA; participants were students recruited from summer orientation sections; aged 17 to 19 years; eligible if 5 + (men) or 4 + (women) drinks per occasion in previous 3 months. N = 350 randomised; 35% male; mean age = 18 years |
|
| Interventions |
Intervention group (N = 167) received the web‐based e‐CHUG intervention. Participants first completed an online assessment consisting of basic demographic details and information on alcohol consumption, drinking behaviour, and alcohol related consequences. Immediately post‐assessment, individualised feedback was provided in the following domains: (1) summary of quantity and frequency of drinking; (2) graphical comparison of their drinking to USA adult and college drinking norms; (3) estimated risk status for negative consequences/problematic drinking based on AUDIT scores; (4) genetic risk/tolerance; (5) approximate financial costs of drinking in the past year; (6) normative feedback comparing indiviudal perception of peer drinking to actual university normative data; (7) and referral information for local agencies. In total, the intervention took approximately 30 minutes. Control group (N = 183) received an assessment only and were sent an e‐mail to access e‐CHUG after the intervention phase was completed |
|
| Outcomes | Mean drinks/week assessed at 3 months | |
| Funding source | Not reported | |
| Declarations of interest | Not reported | |
| Notes | ||
| Risk of bias | ||
| Bias | Authors' judgement | Support for judgement |
| Random sequence generation (selection bias) | Low risk | "The two orientation sections were randomly assigned by coin toss to either the e‐CHUG group or assessment‐only control group" (p 7) |
| Allocation concealment (selection bias) | Unclear risk | "Members of the research team (the 4 authors) joined orientation leaders to facilitate the administration of the baseline assessment and e‐CHUG program" (p 8); unclear how much contact they had with participants |
| Blinding of provider | Unclear risk | "Members of the research team (the 4 authors) joined orientation leaders to facilitate the administration of the baseline assessment and e‐CHUG program" (p 8); unclear how much contact they had with participants |
| Blinding of participant | High risk | No reported attempt to blind participants |
| Blinding of outcome assessment (detection bias) All outcomes | Unclear risk | Not reported |
| Incomplete outcome data (attrition bias) All outcomes | High risk | Loss to follow‐up > 70% |
| Selective reporting (reporting bias) | Low risk | All outcomes specified in the methods are reported |
| Other bias | Low risk | No further concerns |
Ekman 2011.
| Methods | Parallel design RCT Intention‐to‐treat analysis performed: No |
|
| Participants | Sweden; participants were students (age criteria not reported) recruited via email; eligible if > 180 g (men) or > 120 g (women) of ethanol per typical week in past 3 months, or binging (> 60 g (men) or > 48 g (women) of ethanol on two or more occasions in the past month. N = 654 randomised; 42% male |
|
| Interventions |
Intervention group (N = 330) received e‐SBI (electronic Screening and Brief Intervention); they were screened for alcohol use, and received brief feedback consisting of three statements summarising: (1) weekly alcohol consumption; (2) frequency of heavy episodic drinking; and (3) highest BAC in past 3‐months; alongside a comparison of the respondents' drinking patterns with safe levels set by the Swedish Institute for Public Health. In addition, the intervention group received more extensive normative feedback, with information comparing their alcohol use with peers at the university, and, where applicable, advice on reducing unhealthy levels of consumption. This personalised advice consisted of 12 possible statements of suggestions about the students alcohol habits. Control group (N = 324) were screened for alcohol use, and received brief feedback only. As above, this consisted of three statements summarising: (1) weekly alcohol consumption; (2) frequency of heavy episodic drinking; and (3) highest BAC in past 3‐months; alongside a comparison of the respondents' drinking patterns with safe levels set by the Swedish Institute for Public Health |
|
| Outcomes | Mean grams/week assessed at 3 and 6 months | |
| Funding source | The study was performed within the economical frames of the author's employment at Linköping University. No specific research funding agency contributed to the study | |
| Declarations of interest | Preben Bendtsen is partner of a company that develops similar applications as the one used in this study | |
| Notes | ||
| Risk of bias | ||
| Bias | Authors' judgement | Support for judgement |
| Random sequence generation (selection bias) | Low risk | "Randomisation was achieved by computerised assignment to groups" (p 656) |
| Allocation concealment (selection bias) | Low risk | E‐mails using university‐issued addresses were distributed to all third‐semester LiU students in October 2007, inviting them to participate in an e‐SBI. Each message included a one‐time‐use‐only hyperlink to the test." (p 655) |
| Blinding of provider | Low risk | Computer administered intervention; participants accessed intervention via email link |
| Blinding of participant | Low risk | "Respondents were not told which group they had been assigned to, nor were they told that two possible types of feedback could be received" (p 656) |
| Blinding of outcome assessment (detection bias) All outcomes | Low risk | Automated follow‐up |
| Incomplete outcome data (attrition bias) All outcomes | High risk | Loss to follow‐up > 70% |
| Selective reporting (reporting bias) | Low risk | All outcomes specified in the methods are reported |
| Other bias | Low risk | No further concerns |
Gajecki 2014.
| Methods | Parallel design RCT Intention‐to‐treat analysis performed: No |
|
| Participants | Sweden; participants were students (age criteria not reported) recruited via email; eligible if AUDIT= 8 + (men) or 6 + (women). N = 1932 randomised; 48% male; mean age = 24.7 years |
|
| Interventions |
Intervention group (N = 647) accessed the web‐based Partyplanner app via smartphone for an estimated 7‐week period. The app enabled users to (1) plan their drinking in advance to a certain estimated blood alcohol concentration (eBAC), and to later compare their actual alcohol consumption to the app's simulation; (2) as a standalone option, to perform real‐time registration to monitor their eBAC levels without prior planning. Colour‐coded feedback indicated eBAC levels as drinking events progressed. Control group (N = 639) did not receive any intervention and did not have any contact in between baseline and 7‐week follow‐up assessments. A second intervention group in which participants used Promillekoll, a smartphone‐based app offering strategies to avoid risky drinking based on the user's eBAC was not used in this review |
|
| Outcomes | Mean drinks/week, mean total AUDIT, assessed at 7 weeks | |
| Funding source | This study was funded by the Alcohol Research Council of the Systembolaget, the Swedish Research Council, and the Center for Psychiatric Research at Karolinska Institutet | |
| Declarations of interest | The authors declared they had no competing interests | |
| Notes | ||
| Risk of bias | ||
| Bias | Authors' judgement | Support for judgement |
| Random sequence generation (selection bias) | Low risk | "All eligible participants were randomized... using the randomization function in the IBM SPSSStatistics for MacOS X, Version 19" (p 2 of 12) |
| Allocation concealment (selection bias) | Low risk | Automated process |
| Blinding of provider | Low risk | Delivered via mobile app |
| Blinding of participant | High risk | No reported attempt to blind participants |
| Blinding of outcome assessment (detection bias) All outcomes | Low risk | Automated follow‐up |
| Incomplete outcome data (attrition bias) All outcomes | High risk | Loss to follow‐up > 20%; differenital attrition between arms |
| Selective reporting (reporting bias) | Low risk | All outcomes specified in the methods are reported |
| Other bias | High risk | Per protocol analysis only |
Geisner 2015.
| Methods | Parallel design RCT Intention‐to‐treat analysis performed: Yes |
|
| Participants | USA; participants were students aged 18 to 24 years with depressed mood; eligible if AUDIT= 8 + and 5 + (men) or 4 + (women) drinks per occasion at least once in the past month and Beck Depression Inventory= 14 +. N = 339 randomised; 38% male; mean age = 20.14 years |
|
| Interventions |
Intervention group (N = 84) received alcohol intervention: personalised feedback with a normative component for 5 weeks. Through the feedback, (1) users could compare the frequency and quantity of their own drinking to both perceived and actual drinking norms among college students; (2) protective strategies against problematic alcohol use were suggested; (3) a brief psycho‐educational component was also provided, illustrating the potential link between alcohol and depressed mood, but no mood symptoms were targeted by the intervention. This intervention was modelled on social norms approaches and psychoeducation. Control group (N = 85) received no interventions or personalised feedback but were directed towards Internet‐based information resources on substance abuse and depression. Two arms, in which participants received web‐based feedback and strategies on treating depression or combined elements of both alcohol and depression interventions respectively, were not used in this review |
|
| Outcomes | Mean drinks/week assessed at 1 month | |
| Funding source | This research was supported by a grant from the National Institute on Alcohol Abuse and Alcoholism (NIAAA; R21AA019993) awarded to Irene Markman Geisner | |
| Declarations of interest | All authors declared they had no conflicts of interest | |
| Notes | ||
| Risk of bias | ||
| Bias | Authors' judgement | Support for judgement |
| Random sequence generation (selection bias) | Low risk | Process was automated from screening through baseline data collection to intervention |
| Allocation concealment (selection bias) | Low risk | Automated process |
| Blinding of provider | Low risk | Computer administered intervention |
| Blinding of participant | High risk | No reported attempt to blind participants |
| Blinding of outcome assessment (detection bias) All outcomes | Low risk | Automated follow‐up |
| Incomplete outcome data (attrition bias) All outcomes | Low risk | Loss to follow‐up < 10% |
| Selective reporting (reporting bias) | Low risk | All outcomes specified in the methods are reported |
| Other bias | Low risk | No further concerns |
Hansen 2012.
| Methods | Parallel design RCT Intention‐to‐treat analysis performed: Yes |
|
| Participants | Denmark; participants were respondents to the Danish Health Examination Survey (no age criteria reported) who endorsed heavy drinking and were invited by email; eligible if aged ≥ 21 years (men) or ≥ 14 years (women) drinks/week. N = 1380 randomised; 550% male; median age = 58.8 years |
|
| Interventions |
Intervention group (N = 450) received computer‐based personalised brief advice via the Internet in one session. (1) Participants were informed that their alcohol consumption exceeded the recommended maximum drinking limit and were given information on the associated health and social risks. (2) The advice also included links for further standardised self‐help material and a local alcohol treatment facility. Control group (N = 454) received no intervention but were assessed at 6 and 12 months post‐intervention. A second intervention arm in which participants received a single session of an Internet‐based brief personalised feedback intervention summarising their weekly alcohol consumption was not used in this review; the assessment only arm was more analagous to control groups in other trials |
|
| Outcomes | Mean drinks/week assessed at 6 and 12 months | |
| Funding source | The study was funded by the National Board of Health, Denmark | |
| Declarations of interest | None declared | |
| Notes | ||
| Risk of bias | ||
| Bias | Authors' judgement | Support for judgement |
| Random sequence generation (selection bias) | Low risk | "After providing their online consent, participants were automatically randomly assigned" (p 4 of 10) |
| Allocation concealment (selection bias) | Low risk | "Eligible persons were randomly assigned and enrolled... by a technician who was not involved in the recruitment process" (p 4 of 10) |
| Blinding of provider | Low risk | Computer administered intervention |
| Blinding of participant | High risk | No reported attempt to blind participants |
| Blinding of outcome assessment (detection bias) All outcomes | Low risk | Automated follow‐up |
| Incomplete outcome data (attrition bias) All outcomes | Unclear risk | Loss to follow‐up around 20% |
| Selective reporting (reporting bias) | Low risk | All outcomes specified in the methods are reported |
| Other bias | Low risk | No further concerns |
Hedman 2008.
| Methods | Parallel design RCT Intention‐to‐treat analysis performed: No |
|
| Participants | USA; participants were students aged 18 to 23 years; eligible if 5 + (men) or 4 + (women) drinks on one occasion in past 2 weeks. N = 136 randomised; 42% male; mean age = 19.46 years |
|
| Interventions |
Intervention group (N = 68) received personalised feedback and alcohol‐related health messages via email twice a week for 6 weeks. (1) Feedback was given on: (i) peak blood alcohol level, (ii) time to oxidation, (iii) estimated dollars spent, (iv) caloric intake and its relation to weight management, (v) alcohol‐related risks and (vi) sensible drinking tips. (2) The health messages pertained to risks associated with heavy alcohol consumption such as: (i) unplanned and risky sexual activity, (ii) risk of violence and (iii) drink‐driving. This intervention seemed to follow a BASICS format and emphasis was placed only on personalised feedback without the normative element or the motivational interviewing aspects. Control group (N = 63) received only general information via email; a single fact about alcohol was sent to participants twice a week for 6 weeks |
|
| Outcomes | Mean drinks/drinking day assessed at 6 weeks | |
| Funding source | Not reported | |
| Declarations of interest | Not reported | |
| Notes | ||
| Risk of bias | ||
| Bias | Authors' judgement | Support for judgement |
| Random sequence generation (selection bias) | Unclear risk | Not clear whether randomisation was carried out automatically |
| Allocation concealment (selection bias) | Unclear risk | Not clear whether allocation was carried out automatically |
| Blinding of provider | Low risk | "The experimental group received feedback... delivered via email" (p 18) |
| Blinding of participant | High risk | No reported attempt to blind participants |
| Blinding of outcome assessment (detection bias) All outcomes | Unclear risk | Not reported |
| Incomplete outcome data (attrition bias) All outcomes | High risk | Loss to follow‐up > 40% |
| Selective reporting (reporting bias) | Low risk | All outcomes specified in the methods are reported |
| Other bias | Low risk | No further concerns |
Hester 1997.
| Methods | Parallel design RCT Intention‐to‐treat analysis performed: No |
|
| Participants | USA; participants were recruited via health centres, newspaper advertisements, a screening program for drink‐driving, radio, electronic bulletin boards, flyers around community and university; aged ≥ 21 years; eligible if AUDIT=8+, or 120+ (men) or 70+ (women) drinks per month, or 6+ drinks per occasion at least once per week, or drinking at least once a week. N = 42 randomised; 60% male; mean age = 36.3 years |
|
| Interventions |
Intervention group (N = 21) received Behavioural Self‐Control Training, teaching skills in: (i) goal setting, (ii) self‐monitoring, (iii) rate control and drink refusal, (iv) behavioural contracting with rewards and penalties, (v) evaluating triggers to overdrinking and problem solving to deal with them, (vi) functional analysis of drinking, and (vi) relapse prevention. The programme was delivered via computer over 10 weeks during 8 weekly therapist sessions ranging from 15 to 45 minutes each. 2 participants opted to take the diskette home with them for self‐monitoring and upload the data during the therapist sessions. This intervention followed Miller and Munoz's protocol (MIller 1982) for self‐control training. Control group (N = 21) received the same intervention after 10 weeks of waiting |
|
| Outcomes | Mean drinks/week assessed post‐intervention and at 20 weeks and 12 months | |
| Funding source | This research was supported by Small Business Innovative Research Grant R44AA08140‐04 from the National Institute on Alcohol Abuse and Alcoholism | |
| Declarations of interest | Not reported | |
| Notes | ||
| Risk of bias | ||
| Bias | Authors' judgement | Support for judgement |
| Random sequence generation (selection bias) | Unclear risk | Method of sequence generation not described |
| Allocation concealment (selection bias) | Unclear risk | Not reported |
| Blinding of provider | Unclear risk | Intervention took place in site offices in presence of therapist, although "therapist supervision was minimal" (p 688) |
| Blinding of participant | High risk | No reported attempt to blind participants |
| Blinding of outcome assessment (detection bias) All outcomes | High risk | Waiting list design: intial cases were all intervention, later follow‐up all control |
| Incomplete outcome data (attrition bias) All outcomes | Low risk | Loss to follow‐up < 10% |
| Selective reporting (reporting bias) | Low risk | All outcomes specified in the methods are reported |
| Other bias | Low risk | No further concerns |
Hester 2005.
| Methods | Parallel design RCT Intention‐to‐treat analysis performed: not reported |
|
| Participants | USA; participants were recruited via media advertisements; aged ≥ 21 years; eligible if AUDIT = 8+. N = 61 randomised; 52% male; mean age = 46.1 years (men), 45.2 years (women) |
|
| Interventions |
Intervention group (N = 35) received a web‐based intervention (the Drinker's Check‐Up) via clinic‐based computers for 90 minutes on average, based on AUDIT scores of 'at‐risk' or higher (8+). (1) Participants were required to register their details to receive personalised responses from the program; it scored their risk, alcohol consumption and alcohol‐related consequences as low, medium, high or very high. (2) The program integrated: (i) an assessment module with a decisional balance exercise comparing good/bad in drinking; (ii) a feedback module, in which gender, height and weight were used to calculate peak blood alcohol concentration (BAC) and assessments were compared to norms; and, (iii) a decision‐making module, in which the participants' readiness to change was measured and the appropriate output provided. (3) Those that were assessed to be ready to change received assistance with planning and goal setting; those that were unsure received a second decisional balance exercise and those that were not ready only received the feedback report. Control group (N = 26) received the same web‐based intervention 4 weeks after the intervention group and were not assessed until then |
|
| Outcomes | Mean drinks/day, mean drinks/drinking day, assessed at 4 and 8 weeks and 12 months | |
| Funding source | This research was supported by Small Business Innovative Research Grant 3R44 AA11703 from the National Institute of Alcohol Abuse and Alcoholism | |
| Declarations of interest | Not reported | |
| Notes | ||
| Risk of bias | ||
| Bias | Authors' judgement | Support for judgement |
| Random sequence generation (selection bias) | Unclear risk | "...they were randomised using Permuted Blocks Randomisation Procedure" (p 164) but sequence generation method not described |
| Allocation concealment (selection bias) | Unclear risk | Not reported; did not appear to be automated |
| Blinding of provider | High risk | "Participants were seated at a computer desk located in one of our clinic offices... They were free to ask questions if they got confused or lost in the program. A research assistant sat in the room while participants used the program. Total therapist contact time during the intervention was usually less than 10 min" (p 164‐5) |
| Blinding of participant | Low risk | All participants received the same intervention and delayed group were not assessed until they received it, therefore all participants were exposed to alcohol messages |
| Blinding of outcome assessment (detection bias) All outcomes | Unclear risk | Not reported |
| Incomplete outcome data (attrition bias) All outcomes | Low risk | Loss to follow‐up < 10% |
| Selective reporting (reporting bias) | Low risk | All outcomes specified in the methods were reported |
| Other bias | Low risk | No further concerns |
Hester 2012 (exp 1).
| Methods | Parallel design RCT Intention‐to‐treat analysis performed: No |
|
| Participants | USA; participants were students recruited via college newspaper advertisements and flyers posted around campus; aged 18 to 24 years; eligible if 5+ (men) or 4+ (women) drinks at least once in the last two weeks and estimated peak BAC > 80. N = 144 randomised |
|
| Interventions |
Intervention group (N = 65) received the web‐based CDCU (College Drinkers' Check‐Up) intervention via computer for 35 minutes. The program provided an overview and also consisted of: (1) screening for heavy drinking using the AUDIT scale as well as 2 questions regarding the individual’s heaviest drinking in the last two weeks; (2) personalised feedback ‐ those who screened positive for heavy drinking were invited to use the rest of the program following registration; (3) the Look at Your Drinking module which includes: (i) a decisional balance exercise, (ii) a comprehensive assessment of drinking and drug use, (iii) alcohol‐related problems, and (iv) risk factors for future alcohol‐related problems; (4) the Get Feedback module, which applies gender‐ and university‐specific norms to provide feedback on (i) the quantity and frequency of their drinking compared to their same gender fellow students at their university, (ii) BAC feedback, and (iii) feedback on how their frequency of alcohol‐related problems compares to other, same gender students at their school. (5) the Consider Your Options module which extends the initial decisional balance exercise, asking users to rate the level of importance of the “good things” and the “not so good things” about their drinking. Through this module, users could also receive help in developing a plan of action to reduce their drinking and risk for alcohol‐related problems, provided they were ready to change their drinking. The CDCU was based on the original, face‐to‐face protocol by the same name that was developed by Miller and colleagues (Miller 1988). Control group (N = 79) received only the assessment module of the web‐based CDCU program via computer |
|
| Outcomes | Mean drinks/week assessed at 1 and 12 months | |
| Funding source | This project was supported by a SBIR grant from NIAAA, R44AA014766 | |
| Declarations of interest | Not reported | |
| Notes | ||
| Risk of bias | ||
| Bias | Authors' judgement | Support for judgement |
| Random sequence generation (selection bias) | Unclear risk | "We randomised participants by blocks" (p 4) but method of sequence generation unclear |
| Allocation concealment (selection bias) | High risk | "Once randomised, we invited participants to sit at a computer. Experimental participants were presented with the CDCU... For participants in the control group, the RA logged them into the program so that only the assessment module of the CDCU appeared" (p 4) |
| Blinding of provider | High risk | Research assistant was in the room whilst the participant was completing the intervention |
| Blinding of participant | High risk | No reported attempt to blind participants |
| Blinding of outcome assessment (detection bias) All outcomes | Unclear risk | Not reported |
| Incomplete outcome data (attrition bias) All outcomes | Low risk | Loss to follow‐up around 10% |
| Selective reporting (reporting bias) | Low risk | All outcomes specified in the methods were reported |
| Other bias | Low risk | No further concerns |
Hester 2012 (exp 2).
| Methods | Parallel design RCT Intention‐to‐treat analysis performed: No |
|
| Participants | USA; participants were students aged 18 to 24 years; eligible if 5+ (men) or 4+ (women) drinks at least once in the last two weeks and estimated peak BAC > 80. N = 82 randomised |
|
| Interventions |
Intervention group (N = 42) received the web‐based CDCU intervention via computer for 35 minutes. The program provided an overview and also consisted of: (1) screening for heavy drinking using the AUDIT scale as well as 2 questions regarding the individual’s heaviest drinking in the last two weeks; (2) personalized feedback ‐ those who screened positive for heavy drinking were invited to use the rest of the program following registration; (3) the Look at Your Drinking module which includes: (i) a decisional balance exercise, (ii) a comprehensive assessment of drinking and drug use, (iii) alcohol‐related problems, and (iv) risk factors for future alcohol‐related problems; (4) the Get Feedback module, which applies gender‐ and university‐specific norms to provide feedback on (i) the quantity and frequency of their drinking compared to their same gender fellow students at their university, (ii) BAC feedback, and (iii) feedback on how their frequency of alcohol‐related problems compares to other, same gender students at their school. (5) the Consider Your Options module which extends the initial decisional balance exercise, asking users to rate the level of importance of the “good things” and the “not so good things” about their drinking. Through this module, users could also receive help in developing a plan of action to reduce their drinking and risk for alcohol‐related problems, provided they were ready to change their drinking. The CDCU was based on the original, face‐to‐face protocol by the same name that was developed by Miller and colleagues (Miller 1988). Control group (N = 40) Participants were not assessed until the 1‐month follow‐up when data were collected on: (i) their baseline drinking for the month prior to enrolling in the study (and alcohol‐related problems in the previous year) and (ii) their drinking in the month between enrollment and follow‐up |
|
| Outcomes | Mean drinks/week assessed at 1 month | |
| Funding source | This project was supported by a SBIR grant from NIAAA, R44AA014766 | |
| Declarations of interest | Not reported | |
| Notes | ||
| Risk of bias | ||
| Bias | Authors' judgement | Support for judgement |
| Random sequence generation (selection bias) | Unclear risk | "Procedures were generally the same as Experiment 1" (p 7). "We randomised participants by blocks" (p 4) but method of sequence generation unclear |
| Allocation concealment (selection bias) | High risk | "Once randomised, we invited participants to sit at a computer. Experimental participants were presented with the CDCU... For participants in the control group, the RA logged them into the program so that only the assessment module of the CDCU appeared" (p 4) |
| Blinding of provider | High risk | Research assistant was in the room whilst the participant was completing the intervention |
| Blinding of participant | High risk | No reported attempt to blind participants |
| Blinding of outcome assessment (detection bias) All outcomes | Unclear risk | Not reported |
| Incomplete outcome data (attrition bias) All outcomes | Low risk | Loss to follow‐up around 10% |
| Selective reporting (reporting bias) | Low risk | All outcomes specified in the methods were reported |
| Other bias | Low risk | No further concerns |
Khadjesari 2014.
| Methods | Parallel design RCT Intention‐to‐treat analysis performed: not reported |
|
| Participants | UK; participants were employees aged ≥ 18 years recruited via the company web portal; eligible if AUDIT‐C = 5+. N = 1330 randomised; 75% male; median age = 48 years |
|
| Interventions |
Intervention group (N = 659) received an internet‐based lifestyle feedback intervention involving: (1) (i) screening in the form of an online health check that required details of their height and weight (for calculating body mass index (BMI)), alcohol consumption, smoking status, fruit and vegetable consumption and level of physical activity. (ii) feedback for BMI, which was grouped as underweight, healthy weight, overweight, obese or morbidly obese; this was accompanied by links to relevant NHS Choices webpages and the organisation’s own behaviour specific webpages. (iii) feedback on all health behaviours assessed in the health check including alcohol feedback, which provided criterion or risk‐based feedback on the potential harm of drinking above recommended limits. (2) Optionally, an additional web‐based resource, Down Your Drink (DYD), was provided for participants who wanted help to reduce their drinking. DYD is an extended online alcohol intervention based on the principles of motivational interviewing, cognitive behavioural therapy, behavioural self‐control, and relapse prevention (www.downyourdrink.org.uk). (3) Participants received feedback on their alcohol intake after completing the 3‐month follow‐up measures. Control group (N = 671) received feedback on all health behaviours except alcohol consumption in a wait‐list design. Participants received feedback on their alcohol intake after completing the 3‐month follow‐up measures |
|
| Outcomes | Mean drinks/week, mean AUDIT‐C, assessed at 3 months | |
| Funding source | This study was funded by a grant from the National Institute for Health Research (NIHR) School for Primary Care Research (SPCR). Zarnie Khadjesari is funded by a 3‐year National Institute for Health Research (NIHR) School for Primary Care Research (SPCR) fellowship | |
| Declarations of interest | The authors declared that no competing interests existed | |
| Notes | ||
| Risk of bias | ||
| Bias | Authors' judgement | Support for judgement |
| Random sequence generation (selection bias) | Low risk | "Respondents were... randomised by simple randomisation via computer‐generated randomisation software to experimental groups in an automated process, therefore concealing allocation" (p 3) |
| Allocation concealment (selection bias) | Low risk | "Respondents were... randomised by simple randomisation via computer‐generated randomisation software to experimental groups in an automated process, therefore concealing allocation" (p 3) |
| Blinding of provider | Low risk | Computer administered intervention |
| Blinding of participant | High risk | No reported attempt to blind participants |
| Blinding of outcome assessment (detection bias) All outcomes | High risk | Waiting list design: intial cases were all intervention, later follow‐up all control |
| Incomplete outcome data (attrition bias) All outcomes | Unclear risk | Loss to follow‐up around 20% |
| Selective reporting (reporting bias) | Low risk | All outcomes specified in the methods are reported |
| Other bias | Low risk | No further concerns |
Kypri 2008.
| Methods | Parallel design RCT Intention‐to‐treat analysis performed: Yes |
|
| Participants | New Zealand; participants were students recruited from university health centres; aged 17 to 29 years; eligible if AUDIT = 8+, and 6+ (men) or 4+ (women) drinks per occasion in last 4 weeks. N = 429 randomised |
|
| Interventions |
Intervention group (N = 138) Participants received a single session of e‐SBI ‐ web‐based assessment and personalised feedback on drinking via computer for approximately 10 minutes. (1) The assessment component included: (i) a 14‐day retrospective drinking diary; (ii) self‐reported weight; and, (iii) perceptions of peer drinking norms. (2) The feedback component consisted of: (i) a summary of recent consumption; (ii) their risk status, (iii) comparison of their consumption with upper limits, (iv) an estimate of their blood alcohol concentration for their heaviest drinking occasion in the preceding 4 weeks; (v) comparison of their consumption with that of the university and national norms, and (vi) correction of normative misperceptions. Control group (N = 146) received a leaflet containing information on the health effects of alcohol and were not assessed. Two additional arms, one in which participants received no intervention but were assessed, and another in which multiple doses of the intervention were delivered, were not used in this review |
|
| Outcomes | Median drinks/drinking day assessed at 6 and 12 months | |
| Funding source | This study was supported by the Alcohol Advisory Council of New Zealand (Drs Kypri and Langley) and the Health Research Council of New Zealand (Drs Kypri and Langley) | |
| Declarations of interest | No financial disclosure reported | |
| Notes | ||
| Risk of bias | ||
| Bias | Authors' judgement | Support for judgement |
| Random sequence generation (selection bias) | Low risk | "Participants... were randomly assigned by computer" (p 532) |
| Allocation concealment (selection bias) | Low risk | "Research staff in the trial were not informed of participants group allocations during intervention or follow‐up... The generation of the sequence and the loading of it into the server database were conducted by off‐site staff who never came into contact with study participants" (p 531‐2) |
| Blinding of provider | Unclear risk | "Screening and intervention were conducted in semi‐private cubicles in the waiting room" (p 531), but it is unclear whether research staff were able to be present |
| Blinding of participant | High risk | No reported attempt to blind participants |
| Blinding of outcome assessment (detection bias) All outcomes | Unclear risk | Not reported |
| Incomplete outcome data (attrition bias) All outcomes | Unclear risk | Loss to follow‐up around 20% |
| Selective reporting (reporting bias) | Low risk | All outcomes specified in the methods are reported |
| Other bias | Low risk | No further concerns |
Kypri 2009.
| Methods | Parallel design RCT Intention‐to‐treat analysis performed: Yes |
|
| Participants | Australia; participants were students aged 17 to 24 years; eligible if AUDIT = 8+. N = 2435 randomised; 55% male; mean age = 19.7 years |
|
| Interventions |
Intervention group (N = 1251) received an eSBI web‐based intervention consisting of: (1) (i) an AUDIT score with an explanation of the associated health risk and information about how to reduce that risk; (ii) an estimated blood alcohol concentration (BAC) for the respondent’s heaviest episode in the previous 4 weeks, with information on the behavioural and physiological sequelae of various blood alcohol concentrations and traffic crash relative risk; (iii) estimates of monetary expenditure per month and year; (iv) bar graphs comparing episodic and weekly consumption with that of other students of the same age and sex; and (v) hyperlinks for smoking cessation and help with drinking problems. Three more optional web pages offered facts about alcohol and tips for reducing the risk of alcohol‐related harm as well as provided information about where to find medical help and counselling support. (2) Following the 1‐month assessment, participants received additional feedback comparing drinking levels that they reported at 1 month with those at baseline (a form of booster intervention). Control group (N = 1184) received no intervention but were screened |
|
| Outcomes | Median drinks/week, median drinks/drinking day, assessed at 1 and 6 months | |
| Funding source | This study was funded in part by grant 15166 from the Western Australian Health Promotion Foundation (Healthway) | |
| Declarations of interest | No financial disclosure reported | |
| Notes | ||
| Risk of bias | ||
| Bias | Authors' judgement | Support for judgement |
| Random sequence generation (selection bias) | Low risk | "They were randomly assigned by the web server software..." (p 1509) |
| Allocation concealment (selection bias) | Low risk | Automated procedure |
| Blinding of provider | Low risk | Computer administered intervention |
| Blinding of participant | Low risk | "Participants were blind to the true nature of the study, which was presented as a series of surveys" (p 1510) |
| Blinding of outcome assessment (detection bias) All outcomes | Low risk | "Researchers were blind to participants’ group allocation" (p 1510) |
| Incomplete outcome data (attrition bias) All outcomes | Unclear risk | Loss to follow‐up 35% but all participants included in the analysis through imputation and sensitivity analysis carried out |
| Selective reporting (reporting bias) | Low risk | All outcomes specified in the methods are reported |
| Other bias | Low risk | No further concerns |
Kypri 2013.
| Methods | Parallel design RCT Intention‐to‐treat analysis performed: Yes |
|
| Participants | New Zealand; participants were Maori students recruited via email; aged 17 to 24 years; eligible if AUDIT = 4+. N = 1789 randomised; mean age = 20.2 years |
|
| Interventions |
Intervention group (N = 939) received eSBI web‐based assessment and personalised feedback on drinking via computer. (1) Participants' drinking habits were assessed using the AUDIT scale and the Leeds Dependency Questionnaire (LDQ). (2) Participants then received personalised feedback consisting of: (i) AUDIT score; (ii) LDQ score; (iii) explanation of associated health risk; (iv) information on how to reduce risk; (v) estimated BAC for respondents' heaviest drinking episode in the past 4‐weeks; (vi) information on behavioural and psychological sequelae of various BACs; (vii) traffic crash relative risks; (viii) estimates of monetary expenditure in past month; (ix) bar graphs comparing episodic and weekly consumption with that of other students and members of general public (of same age and gender); (x) hyperlinks for help with drinking problems; and, (xi) web pages with general info/facts/medical help. Control group (N = 850) received no intervention but were screened using the AUDIT‐C tool; they subsequently filled in a brief questionnaire at the final 5‐month follow‐up |
|
| Outcomes | Mean drinks/drinking day assessed at 5 months | |
| Funding source | The study was funded by New Zealand's Alcohol Advisory Council | |
| Declarations of interest | None declared | |
| Notes | ||
| Risk of bias | ||
| Bias | Authors' judgement | Support for judgement |
| Random sequence generation (selection bias) | Low risk | "Respondents... were assigned via simple randomisation by the web server" (p 333) |
| Allocation concealment (selection bias) | Low risk | "Researchers were blind to participants' group allocation, as randomisation and all other study procedures were fully automated and thus could not be subverted" (p 333) |
| Blinding of provider | Low risk | Computer administered intervention |
| Blinding of participant | Low risk | "This procedure was to ensure that participants were blind to the true nature of the study, which was presented as two surveys, in order to minimise the potential for performance bias" (p 333) |
| Blinding of outcome assessment (detection bias) All outcomes | Low risk | Automated follow‐up |
| Incomplete outcome data (attrition bias) All outcomes | Unclear risk | Loss to follow‐up around 20% |
| Selective reporting (reporting bias) | Low risk | All outcomes specified in the methods are reported |
| Other bias | Low risk | No further concerns |
Kypri 2014.
| Methods | Parallel design RCT Intention‐to‐treat analysis performed: Yes |
|
| Participants | New Zealand; participants were students recruited via email; aged 17 to 24 years; eligible if AUDIT = 4+. N = 3422 randomised; mean age = 20.3 years |
|
| Interventions |
Intervention group (N = 1706) received eSBI web‐based assessment and personalised feedback on drinking via computer. (1) Participants' drinking habits were assessed using the AUDIT scale and the Leeds Dependency Questionnaire (LDQ). (2) Participants then received personalised feedback consisting of: (i) AUDIT score; (ii) LDQ score; (iii) explanation of associated health risk; (iv) information on how to reduce risk; (v) estimated BAC for respondents' heaviest drinking episode in the past 4‐weeks; (vi) information on behavioural and psychological sequelae of various BACs; (vii) traffic crash relative risks; (viii) estimates of monetary expenditure in past month; (ix) bar graphs comparing episodic and weekly consumption with that of other students and members of general public (of same age and gender); (x) hyperlinks for help with drinking problems; and, (xi) web pages with general information, facts and medical help. Control group (N = 1716) received no intervention but were screened using the AUDIT‐C tool |
|
| Outcomes | Mean drinks/drinking day assessed at 5 months | |
| Funding source | The research was funded by the Alcohol Advisory Council (now the Health Promotion Agency), a statutory body of the New Zealand government. Dr Kypri’s involvement in the research was partly funded by an Australian National Health and Medical Research Council Senior Research Fellowship (APP1041867) | |
| Declarations of interest | All authors have completed and submitted the ICMJE Form for Disclosure of Potential Conflicts of Interest and none were reported. The authors have not been in receipt of alcohol or tobacco industry funding in the last 5 years. None has any other relevant financial interest | |
| Notes | ||
| Risk of bias | ||
| Bias | Authors' judgement | Support for judgement |
| Random sequence generation (selection bias) | Low risk | "Respondents... were randomly assigned by the web server" (p 1220) |
| Allocation concealment (selection bias) | Low risk | "Researchers were blind to allocation as randomisation and all other study procedures were fully automated and thus could not be subverted" (p 1220) |
| Blinding of provider | Low risk | Computer administered intervention |
| Blinding of participant | Low risk | "This procedure was used to ensure that participants were blind to the true nature of the study, which was presented as 2 surveys to minimise the potential for research participation effects" (p 1220) |
| Blinding of outcome assessment (detection bias) All outcomes | Low risk | Automated follow‐up |
| Incomplete outcome data (attrition bias) All outcomes | Unclear risk | Loss to follow‐up around 20% |
| Selective reporting (reporting bias) | Low risk | All outcomes specified in the methods are reported |
| Other bias | Low risk | No further concerns |
Labrie 2013.
| Methods | Parallel design RCT Intention‐to‐treat analysis performed: not reported |
|
| Participants | USA; participants were students recruited via email; aged 18 to 24 years; eligible if 5+ (men) or 4+ (women) drinks per occasion at least once in last month. N = 1831 randomised; 43% male; mean age = 19.9 years |
|
| Interventions |
Intervention group (condition 9) (N = 183) received web‐based feedback via email immediately after completing the 20 minute baseline survey. (1) Web‐BASICS contained a total of 26 pages of interactive comprehensive motivational information addressing: (i) quantity and frequency of alcohol use; (ii) past‐month peak alcohol consumption; (iii) estimated blood alcohol content (BAC), (iv) standard drink size, (v) how alcohol affects men and women differently, (vi) oxidation, (vii) alcohol effects, (viii) reported alcohol‐related experiences, (ix) estimated calories and financial costs based on reported weekly use, (x) estimated level of tolerance, (xi) risks based on family history, (xii) risks for alcohol problems, (xiii) tips for reducing risks while drinking and, (xiv) alternatives to drinking. (2) The feedback also included PNF using typical student drinking norms. (3) Participants were given the option to click links throughout the feedback to obtain additional information on (a) standard drink size, (b) sex differences and alcohol use, (c) oxidation, (d) biphasic tips, (e) hangovers, (f) alcohol costs, (g) tolerance, (h) protective factors, and, (i) a link to a blood alcohol concentration (BAC) calculator. Web‐BASICS was modelled from the in‐person BASICS intervention. Control group (condition 10) (N = 184) received generic nonalcohol‐related normative feedback via email immediately after completing the 20 minute baseline survey. Information was provided on the typical student’s frequency of text messaging, downloading music, and playing video games on their campus. Eight additional arms which gave normative feedback based on combinations of gender, ethnicity and Greek affiliation were not used in this review |
|
| Outcomes | Mean drinks/week assessed at 1, 3, 6 and 12 months | |
| Funding source | Data collection and manuscript preparation were supported by National Institute on Alcohol Abuse and Alcoholism Grant R01AA012547‐06A2 | |
| Declarations of interest | Not reported | |
| Notes | ||
| Risk of bias | ||
| Bias | Authors' judgement | Support for judgement |
| Random sequence generation (selection bias) | Low risk | "...students were randomly assigned to one of the 10 treatment conditions using a web‐based algorithm" (p 1077) |
| Allocation concealment (selection bias) | Low risk | Automated procedure |
| Blinding of provider | Low risk | Computer administered intervention |
| Blinding of participant | High risk | No reported attempt to blind participants |
| Blinding of outcome assessment (detection bias) All outcomes | Low risk | Automated follow‐up |
| Incomplete outcome data (attrition bias) All outcomes | Unclear risk | Loss to follow‐up around 10% but very vague about why some participants with missing data were excluded and others were included in the analysis |
| Selective reporting (reporting bias) | Low risk | All outcomes specified in the methods are reported |
| Other bias | High risk | An assessment only control group was not reported; the details of how they dealt with missing data was very vague |
Lewis 2007a.
| Methods | Parallel design RCT Intention‐to‐treat analysis performed: not reported |
|
| Participants | USA; participants were students (age criteria not reported) recruited from psychology classes; eligible if 5+ (men) or 4+ (women) drinks per occasion at least once in last month. N = 185 randomised; 45% male; mean age = 20.1 years |
|
| Interventions |
Intervention group (N = 65) received gender‐specific personalised normative feedback (PNF) via computer for 1 to 2 minutes following baseline assessment. This feedback was then provided as a printout to take away but was not further discussed, except in situations when comments were made or questions asked about PNF. (1) Information was provided on: (i) personal drinking, (ii) perceptions of typical student drinking, and (iii) actual typical student drinking norms. Information pertaining to perceptions of typical student drinking and actual typical student drinking norms provided a discrepancy suggesting to heavy‐drinking students that “most students don’t drink as much as you think they do.” Feedback relating to personal drinking behaviour and actual typical student drinking norms provided students with a discrepancy pointing out to heavy drinking students that “most students don’t drink as much as you do.” Actual typical student drinking behaviour norms were based on screening data. (2) Participants’ percentile ranking comparing their drinking with that of other students was also provided. This intervention was modelled on BASICS (Dimeff 2000). Control group (N = 57) did not receive any intervention and were only assessed. One additional intervention arm in which participants received information on gender‐neutral norms via computer as part of the PNF was not used in this review |
|
| Outcomes | Mean drinks/day, mean drinks/week, assessed at 1 month | |
| Funding source | Manuscript preparation was funded in part by National Institute on Alcohol Abuse and Alcoholism grants T32AA007455 and R01AA014576 | |
| Declarations of interest | Not reported | |
| Notes | ||
| Risk of bias | ||
| Bias | Authors' judgement | Support for judgement |
| Random sequence generation (selection bias) | Unclear risk | Method of sequence generation not described |
| Allocation concealment (selection bias) | Unclear risk | Not reported |
| Blinding of provider | Unclear risk | "...individuals completed the baseline assessment via computer in a controlled laboratory setting on campus... PNF was provided immediately after baseline assessment" (p 4); unclear whether research staff were involved |
| Blinding of participant | High risk | No reported attempt to blind participants |
| Blinding of outcome assessment (detection bias) All outcomes | Unclear risk | Not reported |
| Incomplete outcome data (attrition bias) All outcomes | Unclear risk | Loss to follow‐up not reported by arm |
| Selective reporting (reporting bias) | Low risk | All outcomes specified in the methods are reported |
| Other bias | Low risk | No further concerns |
Lewis 2007b.
| Methods | Parallel design RCT Intention‐to‐treat analysis performed: not reported |
|
| Participants | USA; participants were students (age criteria not reported) recruited from a freshman orientation class via telephone or email; eligible if 5+ (men) or 4+ (women) drinks per occasion at least once in last month. N = 245 randomised; 48% male; mean age = 18.53 years |
|
| Interventions |
Intervention group (N = 75) received gender‐specific personalised normative feedback (PNF) targeted at freshmen via the web, initially for 60 minutes (at baseline). (1) The feedback consisted of information on: (i) personal drinking behaviour, (ii) personal perceptions of typical student drinking behaviour, and (iii) actual norms for typical student drinking behaviour. Actual norms for typical student drinking behaviour creates two discrepancies for heavy‐drinking students when compared with personal drinking behaviour (i.e. most students don't drink as much as you do) and personal perceptions of typical student drinking behaviour (i.e. most students don't drink as much as you think they do). Participants in this arm received gender‐specific norms based on responses from a screening survey. (2) Students receiving PNF were also provided with the percentile rank of their drinking in comparison to other students. Control group (N = 88) did not receive any intervention and were only assessed. One additional intervention arm in which participants received web‐based information on gender‐neutral norms targeted at freshmen as part of the PNF was not used in this review |
|
| Outcomes | Mean drinks/week, mean drinking days/week, assessed at 5 months | |
| Funding source | Data collection and manuscript preparation was supported by the National Institute on Alcohol Abuse and Alcoholism Grants U18AA015885 and U01AA014742. Manuscript preparation was also supported by the National Institute on Alcohol Abuse and Alcoholism Grant T32AA07455 | |
| Declarations of interest | Not reported | |
| Notes | ||
| Risk of bias | ||
| Bias | Authors' judgement | Support for judgement |
| Random sequence generation (selection bias) | Unclear risk | Method of sequence generation not described |
| Allocation concealment (selection bias) | Unclear risk | Not reported |
| Blinding of provider | Unclear risk | "Participants were recruited to... complete a Web‐based survey in a controlled laboratory setting" (p 2498); unclear whether research staff were involved |
| Blinding of participant | High risk | No reported attempt to blind participants |
| Blinding of outcome assessment (detection bias) All outcomes | Unclear risk | Not reported |
| Incomplete outcome data (attrition bias) All outcomes | Low risk | Loss to follow‐up < 20% |
| Selective reporting (reporting bias) | Low risk | All outcomes specified in the methods are reported |
| Other bias | Low risk | No further concerns |
Lewis 2014.
| Methods | Parallel design RCT Intention‐to‐treat analysis performed: Yes |
|
| Participants | USA; participants were undergraduate students recruited via email or letter; aged 18 to 25 years; eligible if 5+ (men) or 4+ (women) drinks per occasion at least once in last month. N = 480 randomised; 42% male; mean age = 20.08 years |
|
| Interventions |
Personalised normative feedback (PNF) (alcohol) group (N = 119) All pages contained a banner with the study logo that read “How do you compare to other male/female [university name] students?” The PNF included information regarding (a) one’s own behaviour, (b) one’s perceptions of the typical same‐sex students’ behaviour, and (c) the typical same‐sex students’ actual behaviour (i.e. the campus norm). This information was presented in text and bar graph format. Each screen presented one graph and related feedback content. The final screen of the feedback provided a percentile rank for comparison between the participants’ reported drinking and that of their same‐sex peers. This intervention was extremely brief. Control group (N = 121) were shown information related to use of technology (3 screens). Technology use was broken down into three topics: (a) texting, (b) downloading music, and (c) playing video games. Each screen presented one graph and related feedback content. For each screen of the feedback, participants were provided their percentile rank for the specific technology uses. Duration 1 to 5 minutes. Two other arms were not eligible for this review, where participants received feedback on risky sexual behaviour or a combination of alcohol‐related and risky sexual behaviour feedback |
|
| Outcomes | Mean drinks/week, mean drinks/drinking day, assessed at 3 and 6 months | |
| Funding source | Data collection and manuscript preparation were supported by National Institute on Alcohol Abuse and Alcoholism Grant K01AA016966 awarded to Melissa A. Lewis. Manuscript preparation was also supported by National Institute on Alcohol Abuse and Alcoholism Grants R03AA018735 and K99AA020869 | |
| Declarations of interest | Not reported | |
| Notes | ||
| Risk of bias | ||
| Bias | Authors' judgement | Support for judgement |
| Random sequence generation (selection bias) | Low risk | "Random assignment was administered automatically using a computer algorithm" (p 433) |
| Allocation concealment (selection bias) | Low risk | Automated procedure |
| Blinding of provider | Low risk | "All measures and interventions were completed entirely via the internet" (p 432) |
| Blinding of participant | High risk | No reported attempt to blind participants |
| Blinding of outcome assessment (detection bias) All outcomes | Low risk | Automated follow‐up |
| Incomplete outcome data (attrition bias) All outcomes | Low risk | Loss to follow‐up < 20% |
| Selective reporting (reporting bias) | Low risk | All outcomes specified in the methods are reported |
| Other bias | Low risk | No further concerns |
Murphy 2010 (Study 1).
| Methods | Parallel design RCT Intention‐to‐treat analysis performed: Yes |
|
| Participants | USA; participants were students aged ≥ 18 years recruited via the university health clinic; eligible if 5+ (men) or 4+ (women) drinks per occasion at least once (for minority groups) or twice (for Caucasians) in last month. N = 74 randomised; 41% male; mean age = 21.2 years |
|
| Interventions |
Intervention group (N = 35) received the Alcohol 101 CD‐ROM which features a virtual campus that students are required to navigate. They may visit different “buildings” such as the library, the dormitories, or the quad. In each location the student may view information, watch a video depicting potential negative outcomes associated with drinking (e.g. a sexual assault or a drinking and driving arrest), or take a quiz about alcohol and its effects on the body. There is also a virtual bar on the campus in which students may enter their gender, weight, drink type, and speed of consumption and receive feedback on their BAC. Students were instructed to spend at least 50 minutes navigating the virtual campus. Face‐to‐face group (N = 39) received BASICS: (a) an introductory discussion that emphasised confidentiality, harm reduction, and the student’s autonomy/responsibility to make decisions about the information provided in the session; (b) a discussion of the student’s college and career goals, and how they might relate to decisions about substance use; (c) a decisional balance exercise; (d) personalised feedback; and (e) summary, goal setting. Duration 50 to 60 minutes |
|
| Outcomes | Mean drinks/week assessed at 1 month | |
| Funding source | This research was supported by research grants from the Alcohol Research Foundation (ABMRF; JGM), and the National Institutes of Health (AA016304 JGM) | |
| Declarations of interest | Not reported | |
| Notes | ||
| Risk of bias | ||
| Bias | Authors' judgement | Support for judgement |
| Random sequence generation (selection bias) | Low risk | "Participants were... randomly assigned to a condition using a random number table" (p 630) |
| Allocation concealment (selection bias) | Unclear risk | Not reported; not clear that it was automated |
| Blinding of provider | Unclear risk | "Participants completed the baseline measures during an individual laboratory‐based assessment appointment" (p 630); unclear whether research staff were able to be present. High risk of bias from blinding in comparator group (face‐to‐face intervention) |
| Blinding of participant | Low risk | Both groups received alcohol‐related intervention |
| Blinding of outcome assessment (detection bias) All outcomes | Low risk | "A research assistant who was blind to the intervention condition conducted the 1‐month follow‐up assessments" (p 630) |
| Incomplete outcome data (attrition bias) All outcomes | Low risk | Loss to follow‐up < 10% |
| Selective reporting (reporting bias) | Low risk | All outcomes specified in the methods are reported |
| Other bias | Low risk | No further concerns |
Murphy 2010 (Study 2).
| Methods | Parallel design RCT Intention‐to‐treat analysis performed: not reported |
|
| Participants | USA; participants were students aged ≥ 18 years recruited via the university health clinic; eligible if 5+ (men) or 4+ (women) drinks per occasion at least once (for minority groups) or twice (for Caucasians) in last month. N = 133 randomised; 50% male; mean age = 18.6 years |
|
| Interventions |
Digital intervention group (N = 45) received e‐CHUG, an interactive web‐based program that requires students to complete a brief drinking assessment (6 to 7 minutes) that is used to instantly generate personalised feedback in the following areas: (a) quantity and frequency of drinking, (b) comparison of drinking with student norms, (c) peak BAC, (d) tolerance level, (e) alcohol related consequences, (f) money spent on alcohol, (g) calories consumed from alcohol, and (h) family risk score. Students were asked to review the feedback for at least 30 minutes and completed a brief comprehension check to ensure adequate exposure to the intervention. Duration at least 35 minutes. Face‐to‐face group (N = 46) received BASICS: (a) an introductory discussion that emphasised confidentiality, harm reduction, and the student’s autonomy/responsibility to make decisions about the information provided in the session; (b) a discussion of the student’s college and career goals, and how they might relate to decisions about substance use; (c) a decisional balance exercise; (d) personalised feedback; and (e) summary, goal setting. Duration 50 to 60 minutes. Control group (N = 42) received computerised assessment only |
|
| Outcomes | Mean drinks/week assessed at 1 month | |
| Funding source | This research was supported by research grants from the Alcohol Research Foundation (ABMRF; JGM), and the National Institutes of Health (AA016304 JGM) | |
| Declarations of interest | Not reported | |
| Notes | ||
| Risk of bias | ||
| Bias | Authors' judgement | Support for judgement |
| Random sequence generation (selection bias) | Low risk | "Participants were... randomly assigned to a condition using a random number table" (p 630) |
| Allocation concealment (selection bias) | Unclear risk | Not reported; not clear that it was automated |
| Blinding of provider | Unclear risk | "Participants completed the baseline measures during an individual laboratory‐based assessment appointment" (p 630); unclear whether research staff were able to be present. High risk of bias from blinding in comparator group (face‐to‐face intervention) |
| Blinding of participant | High risk | No reported attempt to blind participants |
| Blinding of outcome assessment (detection bias) All outcomes | Low risk | "A research assistant who was blind to the intervention condition conducted the 1‐month follow‐up assessments" (p 630) |
| Incomplete outcome data (attrition bias) All outcomes | Low risk | Loss to follow‐up around 10% |
| Selective reporting (reporting bias) | Low risk | All outcomes specified in the methods are reported |
| Other bias | Low risk | No further concerns |
Neighbors 2004.
| Methods | Parallel design RCT Intention‐to‐treat analysis performed: Yes |
|
| Participants | USA; participants were students (age criteria not reported) recruited from a psychology class; eligible if 5+ (men) or 4+ (women) drinks per occasion at least once in last month. N = 252 randomised; 41% male; mean age = 18.5 years |
|
| Interventions |
Intervention group (N = 126) received personalised normative feedback (PNF) immediately following the completion of baseline assessment (which happened by computer). Participants viewed the feedback on screen for approximately 1 min as it was being printed. Participants were given the printout of this information to take with them. There was no interpersonal interaction involved in the feedback intervention. Control group (N = 126) received computerised assessment only |
|
| Outcomes | Mean drinks/week assessed at 3 and 6 months | |
| Funding source | This research was supported in part by National Institute for Alcohol Abuse and Alcoholism Grant T32AA07455 and by the Alcohol and Drug Abuse Institute at the University of Washington | |
| Declarations of interest | Not reported | |
| Notes | ||
| Risk of bias | ||
| Bias | Authors' judgement | Support for judgement |
| Random sequence generation (selection bias) | Unclear risk | Method of sequence generation not reported |
| Allocation concealment (selection bias) | Unclear risk | Not reported |
| Blinding of provider | Unclear risk | "All assessments took place in a controlled setting on campus... Immediately following the baseline assessment, individuals in the intervention group received personalised normative feedback that was delivered by computer" (p 436); unclear whether research staff were able to be present |
| Blinding of participant | High risk | No reported attempt to blind participants |
| Blinding of outcome assessment (detection bias) All outcomes | Unclear risk | Not reported |
| Incomplete outcome data (attrition bias) All outcomes | Unclear risk | Loss to follow‐up not reported by arm |
| Selective reporting (reporting bias) | Low risk | All outcomes specified in the methods are reported |
| Other bias | Low risk | No further concerns |
Neighbors 2006.
| Methods | Parallel design RCT Intention‐to‐treat analysis performed: not reported |
|
| Participants | USA; participants were students (age criteria not reported) recruited from a psychology class; eligible if 5+ (men) or 4+ (women) drinks per occasion at least once in last month. N = 214 randomised; 44% male; mean age = 19.67 years |
|
| Interventions |
Intervention group (N = 108) received personalised normative feedback (PNF) delivered via computer. All participants were thanked for their participation and were informed that they would be contacted at a later date to schedule an appointment for follow‐up assessment. Procedures for follow‐up assessment were similar, with the exception that no feedback was provided. Upon completion of follow‐up assessment, participants were provided with a written debriefing that explained the purpose and design of the study. Control group (N = 106) received computerised assessment only |
|
| Outcomes | Mean drinks/week assessed at 2 months | |
| Funding source | This research was supported in part by National Institute on Alcohol Abuse and Alcoholism Grant R01AA014576, National Center for Research Resources Grant P20RR16471, and North Dakota State University Grant in Aid NDSU 1111‐3390 | |
| Declarations of interest | Not reported | |
| Notes | ||
| Risk of bias | ||
| Bias | Authors' judgement | Support for judgement |
| Random sequence generation (selection bias) | Unclear risk | Method of sequence generation not reported |
| Allocation concealment (selection bias) | Unclear risk | Not reported |
| Blinding of provider | Unclear risk | "Participants completed all assessments in private, on computers, in a laboratory setting... After completing baseline assessment, participants in the intervention group received personalised normative feedback delivered via computer" (p 573); unclear whether research staff are able to be present |
| Blinding of participant | High risk | No reported attempt to blind participants |
| Blinding of outcome assessment (detection bias) All outcomes | Unclear risk | Not reported |
| Incomplete outcome data (attrition bias) All outcomes | Low risk | Loss to follow‐up < 20% |
| Selective reporting (reporting bias) | Low risk | All outcomes specified in the methods are reported |
| Other bias | Low risk | No further concerns |
Neighbors 2010.
| Methods | Parallel design RCT Intention‐to‐treat analysis performed: not reported (modelling) |
|
| Participants | USA; participants were freshmen students (age criteria not reported) recruited via email and letter; eligible if 5+ (men) or 4+ (women) drinks per occasion at least once in last month. N = 818 randomised; 42% male |
|
| Interventions |
Intervention (at baseline) group (N = 163) received gender‐specific feedback (GSF) regarding the students’ own drinking behaviour, the students’ reported perception of typical drinking by the average same‐sex student at his/her university, and actual typical drinking by same‐sex students at his/her university. Duration not reported. Control group (N = 164) received facts about students at the university that were generated from a recent large survey. For example, students were told that 49% of students at the university play a musical instrument and that 65% work during the school year. The layout of the attention control information mirrored the layout of the normative feedback, with text on the left and two graphs on the right. However, none of the information presented directly related to alcohol, and it was not personalised to the participant. Duration 50 min. Additional intervention arms receiving (i) GSF at each assessment, (ii) gender non‐specific feedback (GNSF) at baseline only, and (iii) GNSF at each assessment were not included ‐ GSF at baseline only is most analagous to other included trials |
|
| Outcomes | Mean drinks/week assessed at 6, 12, 18 and 24 months | |
| Funding source | Preparation of this article was supported in part by National Institute on Alcohol Abuse and Alcoholism Grants R01AA014576, K01AA016966, and T32AA007455 | |
| Declarations of interest | Not reported | |
| Notes | ||
| Risk of bias | ||
| Bias | Authors' judgement | Support for judgement |
| Random sequence generation (selection bias) | Low risk | "Random assignment was administered automatically using a computer algorithm" (p 901) |
| Allocation concealment (selection bias) | Low risk | "Those who chose to complete the baseline survey immediately were seamlessly routed to the baseline survey" (p 901) |
| Blinding of provider | Low risk | "All measures and interventions were completed entirely via the Internet" (p 901) |
| Blinding of participant | High risk | No reported attempt to blind participants |
| Blinding of outcome assessment (detection bias) All outcomes | Low risk | "All measures and interventions were completed entirely via the Internet" (p 901) |
| Incomplete outcome data (attrition bias) All outcomes | Low risk | Loss to follow‐up < 20% |
| Selective reporting (reporting bias) | Low risk | All outcomes specified in the methods are reported |
| Other bias | Low risk | No further concerns |
Neumann 2006.
| Methods | Parallel design RCT Intention‐to‐treat analysis performed: No |
|
| Participants | Germany; participants were recruited from an emergency department with subcritical injuries; aged ≥ 18 years; eligible if AUDIT = 5+. N = 1139 randomised |
|
| Interventions |
Intervention group (N = 561) received computer‐generated feedback about current drinking status based on information obtained from the AUDIT and RTC‐Q. The results were displayed on the computer, and a letter summarising the intervention was then printed and provided to the patient before discharge from the emergency department. The written intervention contained feedback about the level of alcohol consumption compared with safe drinking norms, and emphasised personal responsibility for determining the need for change. It provided clear advice about the need to change drinking patterns and to develop goals for behavioural change. A menu of alternative strategies for changing alcohol consumption patterns, including treatment assisted change or self‐change, was provided. The information was presented in a respectful, empathic manner that was meant to increase the level of motivation for change, and to increase the patient’s sense of self‐efficacy and optimism. The elements of the intervention can be summarised with the acronym FRAMES: Feedback, Responsibility, Advice, Menu, Empathy, Self‐efficacy. Feedback and information was provided concerning each positive AUDIT question. Patients’ level of motivation was also incorporated into the intervention. Additional educational information was provided regarding risky situations and drinking triggers that should be avoided, contraindications to alcohol use, and symptoms of dependence. A list of alcohol treatment services available in the community was also provided. To reduce resistance and stigmatisation, feedback concerning alcohol was embedded with information about other lifestyle risks, including diet, tobacco and drug use, and other risky behaviours. Control group (N = 575) received care for their injuries only. |
|
| Outcomes | Median grams/day assessed at 6 and 12 months | |
| Funding source | Prof Spies received a grant from the ministry of Health, Germany; Prof Tønnesen was supported by Grants from the Danish Medical Council, the Danish Ministry and Board of Health, IMK‐fund and the WHO Europe; Prof Gentilello was supported by a grant from the Robert Wood Johnson Foundation; Prof Mann was supported by an Educational Grant for the 12th World Conference on Biomedical Alcohol Research–ISBRA | |
| Declarations of interest | Not reported | |
| Notes | ||
| Risk of bias | ||
| Bias | Authors' judgement | Support for judgement |
| Random sequence generation (selection bias) | Unclear risk | Method of sequence generation not reported |
| Allocation concealment (selection bias) | Unclear risk | Not reported |
| Blinding of provider | High risk | Participants were introduced to the intervention by research staff: "Most patients (85%) were able to use the computer after receiving only brief instructions" (p 806) |
| Blinding of participant | High risk | No reported attempt to blind participants |
| Blinding of outcome assessment (detection bias) All outcomes | Unclear risk | Not reported |
| Incomplete outcome data (attrition bias) All outcomes | High risk | Loss to follow‐up > 30% |
| Selective reporting (reporting bias) | Low risk | All outcomes specified in the methods are reported |
| Other bias | Low risk | No further concerns |
Palfai 2011.
| Methods | Parallel design RCT Intention‐to‐treat analysis performed: not reported |
|
| Participants | USA; participants were students (age criteria not reported) recruited via an introductory psychology class; eligible if AUDIT = 8+, or 5+ (men) or 4+ (women) drinks per occasion at least twice in last month. N = 119 randomised; mean age = 18.6 years |
|
| Interventions |
Intervention group (number randomised not reported) received personalised feedback on norms about low‐frequency alcohol‐related consequences, costs and calories associated with use and information on peak blood alcohol levels associated with heavy drinking episodes. Control group (number randomised not reported) received guidance on health‐related information concerning sleep and vegetable intake. This paper reported two intervention groups and two control groups but merged them in the results so we have followed suit |
|
| Outcomes | Mean drinks/week assessed at 1 month | |
| Funding source | Funding for this research study was provided in part by NIAAA Grant P60 AA013759 (David Rosenbloom, PI) | |
| Declarations of interest | There were no conflicts of interest for any of the authors | |
| Notes | ||
| Risk of bias | ||
| Bias | Authors' judgement | Support for judgement |
| Random sequence generation (selection bias) | Unclear risk | Method of sequence generation not reported |
| Allocation concealment (selection bias) | Unclear risk | Not reported |
| Blinding of provider | Unclear risk | Not clear whether intervention was administered independently of researchers |
| Blinding of participant | High risk | No reported attempt to blind participants |
| Blinding of outcome assessment (detection bias) All outcomes | Unclear risk | Not reported |
| Incomplete outcome data (attrition bias) All outcomes | Unclear risk | Loss to follow‐up not reported |
| Selective reporting (reporting bias) | Low risk | All outcomes specified in the methods are reported |
| Other bias | Low risk | No further concerns |
Postel 2010.
| Methods | Parallel design RCT Intention‐to‐treat analysis performed: Yes |
|
| Participants | Netherlands; participants were recruited via advertisements on websites and national media; aged ≥ 18 years; eligible if 22 to 99 years (men) or 15 to 67 years (women) units/week. N = 156 randomised; 46% male; mean age = 45.3 years |
|
| Interventions |
Intervention group (N = 78) received a structured 2‐part e‐therapy online treatment program in which the participant and the therapist communicated asynchronously, via the internet only. Participants accessed the e‐therapy program in their personal environment. Participant and therapist were in separate or remote locations; the interaction occurred with a time delay between the responses. The aim of the e‐therapy program was to reduce or stop the participant’s alcohol intake. All communication between therapists and participants took place through a web‐based application. Part 1 of the program consisted of 2 assessments and 4 assignments, with the accompanying communication focusing on the analysis of the participants’ drinking habits. Part 2 focused on behavioural change and included 5 central concepts: (1) setting a drinking goal, which could be abstinence or moderate drinking, (2) formulating helpful and non helpful thoughts, (3) considering helpful behaviours for moments of craving, (4) identifying the moment of the decision to drink alcohol, and (5) formulating an action plan for maintaining the new drinking behaviour and for preventing relapse. Duration: participants registered daily with the program and had 2 to 3 therapist contacts a week for 3 months; therapists spent 1.5 h per week. Control group (N = 78) on waiting list; received no‐reply email messages containing alcohol‐related information, psychoeducational material, motivational messages, and references to the information website and the forum for online contact with other participants |
|
| Outcomes | Mean drinks/week assessed at 3 months | |
| Funding source | This study was funded by Tactus Addiction Treatment and the Nijmegen Institute of Scientist‐Practitioners in Addiction | |
| Declarations of interest | None declared | |
| Notes | ||
| Risk of bias | ||
| Bias | Authors' judgement | Support for judgement |
| Random sequence generation (selection bias) | Low risk | "Participants were randomly assigned... according to a computer‐generated random list (based on a random generator and algorithm)... implemented by a technician who was not involved in the recruitment process" (p 2) |
| Allocation concealment (selection bias) | Low risk | "Participants were randomly assigned... according to a computer‐generated random list (based on a random generator and algorithm)... implemented by a technician who was not involved in the recruitment process" (p 2) |
| Blinding of provider | Unclear risk | "The e‐therapy program... consisted of a structured 2‐part online treatment program in which the participant and the therapist communicated asynchronously, via the Internet only" |
| Blinding of participant | High risk | No reported attempt to blind participants |
| Blinding of outcome assessment (detection bias) All outcomes | High risk | Waiting list design: intial cases were all intervention, later follow‐up all control |
| Incomplete outcome data (attrition bias) All outcomes | High risk | Large differential in loss to follow‐up between groups |
| Selective reporting (reporting bias) | Low risk | All outcomes specified in the methods are reported |
| Other bias | Low risk | No further concerns |
Ridout 2014.
| Methods | Parallel design RCT Intention‐to‐treat analysis performed: No |
|
| Participants | Australia; participants were students recruited via email; eligible if AUDIT = 8+. N = 98 randomised; 20% male; mean age = 18.93 years |
|
| Interventions |
Intervention group (N = 47) received social norms feedback in the form of a Facebook message, including statements comparing the participants’ perceptions of classmates’ use and approval of alcohol with actual descriptive and injunctive social norms calculated from their classmates’ survey questionnaire responses; also a percentile rank of how the participant’s alcohol consumption compared with other students in their unit of study. Control group (N = 48) ‐ no description of anything they received |
|
| Outcomes | Mean drinks/month, mean drinking days/month, assessed at 1 and 3 months | |
| Funding source | Mr Brad Ridout would like to thank the donors of the DBH Scholarship that funds his PhD candidature | |
| Declarations of interest | None declared | |
| Notes | ||
| Risk of bias | ||
| Bias | Authors' judgement | Support for judgement |
| Random sequence generation (selection bias) | Low risk | "Students... were randomly allocated to either the intervention or control group using the random number function of Microsoft Excel" (p 669) |
| Allocation concealment (selection bias) | Low risk | Students were recruited via email; allocation, screening and feedback occurred online (p 668‐9) |
| Blinding of provider | Low risk | Computer administered intervention |
| Blinding of participant | High risk | No reported attempt to blind participants |
| Blinding of outcome assessment (detection bias) All outcomes | Low risk | Automated follow‐up |
| Incomplete outcome data (attrition bias) All outcomes | Low risk | Loss to follow‐up 3% |
| Selective reporting (reporting bias) | Low risk | All outcomes specified in the methods are reported |
| Other bias | Low risk | No further concerns |
Riper 2008.
| Methods | Parallel design RCT Intention‐to‐treat analysis performed: Yes |
|
| Participants | Netherlands; participants were recruited via advertisements in newspaper and health websites; aged 18 to 65 years; eligible if 21+ (men) or 14+ (women) units/week or 6+ (men) or 4+ (women) units on one occasion at least 1 day/week for the past 3 months. N = 261 randomised; 51% male; mean age = 46 years |
|
| Interventions |
Intervention group (N = 130) received the Drinking Less intervention which consists of a homepage giving information on alcohol and treatment services, and offering access to the self‐help programme via an automated sign‐up procedure, with a description indicating for whom the intervention is suitable. The self‐help program proceeds in four successive stages: preparing for action, goal setting, behavioural change, and maintenance of gains and relapse prevention. The self‐help program also contains a moderated peer‐to‐peer discussion forum. Trial participants were allowed to use the intervention for as long as they felt necessary (24 hours a day, 7 days per week access throughout the trial period). Control group (N = 131) received access to a web‐based psychoeducational brochure on the effects of alcohol use, which described the impact of alcohol use on physical and social functioning in a factual manner and took approximately 15 minutes to read |
|
| Outcomes | Mean drinks/week assessed at 6 months | |
| Funding source | This study was funded by a research grant from ZonMw, the Netherlands Organization for Health Research and Development, grant no. 2200.0140 | |
| Declarations of interest | The authors were independent of the funding body | |
| Notes | ||
| Risk of bias | ||
| Bias | Authors' judgement | Support for judgement |
| Random sequence generation (selection bias) | Low risk | "This study and intervention were conducted entirely via the internet with the exception of the informed consent form" (p 219) |
| Allocation concealment (selection bias) | Low risk | "This study and intervention were conducted entirely via the internet with the exception of the informed consent form" (p 219) |
| Blinding of provider | Low risk | Computer administered intervention |
| Blinding of participant | High risk | No reported attempt to blind participants |
| Blinding of outcome assessment (detection bias) All outcomes | Low risk | "This study and intervention were conducted entirely via the internet with the exception of the informed consent form" (p 219) |
| Incomplete outcome data (attrition bias) All outcomes | High risk | Loss to follow‐up > 40% |
| Selective reporting (reporting bias) | Low risk | All outcomes specified in the methods are reported |
| Other bias | Low risk | No further concerns |
Schulz 2013.
| Methods | Parallel design RCT Intention‐to‐treat analysis performed: Yes |
|
| Participants | Germany; participants were recruited via an online access panel (a register of people who had expressed willingness to participate in online surveys); aged 18 to 69; eligible if AUDIT>7, or >2 (men) or >1 (women) glasses/day, or drinking > 5 days/week. N = 448 randomised; 57% male; mean age = 41.72 years |
|
| Interventions | The web‐based intervention Alcohol ‐ Everything Within the Limits?! was in 5 parts: Part 1 served as a starting point of the drinking behaviour change process (premotivational phase) by addressing the concepts of knowledge and awareness: it gave information about the German alcohol guidelines and assessed whether respondents were meeting them by using comparative/normative feedback. In addition, respondents’ scores were depicted graphically using a traffic light symbol (indicating whether they met, almost met, or did not meet the guidelines). To increase the respondent’s level of knowledge, the relation between alcohol and various diseases was explained, and information tailored to the respondent’s health status was given about alcohol and pregnancy, and about the possible influence of participants’ drinking behaviour on their children (if applicable). Part 2 offered personalised feedback concerning the perceived pros and cons of alcohol drinking as perceived by the respondent, with the goal of creating a positive attitude toward not drinking more than 1 (women) or 2 (men) alcoholic drinks per day. Part 3 explained the importance of social influence in a tailored message by focusing on the respondent’s partner, family, friends, and colleagues. In the fourth part, preparatory action plans were defined to prepare the intended behavioural change. The final part focused on self‐efficacy and coping plans by identifying difficult situations and suggesting ways to cope with them. Personalised tips were given on how to deal with the perceived difficult situations to overcome potential barriers (postmotivational phase), and the situations and plans were summarised for individual respondents to help them remember these. Duration not reported. Alternating intervention group (N = 132) The feedback message was split into a series of messages discussing individual topics offered while the respondent was still completing the Web‐based session. Summative intervention group (N = 181) the entire set of materials/feedback messages was provided at one time at the end of the Web‐based session. Control group (N = 135) web‐based assessment only. The two intervention groups were reported together in the paper, and we have followed suit |
|
| Outcomes | Mean units/week assessed at 6 months | |
| Funding source | This study was funded by the CAPHRI School for Public Health and Primary Care | |
| Declarations of interest | Hein de Vries is scientific director of Vision2Health, a company that licenses evidence‐based, innovative, computer‐tailored health communication tools. No other authors reported any conflicts of interest | |
| Notes | ||
| Risk of bias | ||
| Bias | Authors' judgement | Support for judgement |
| Random sequence generation (selection bias) | Low risk | "Randomisation was carried out by a computer system" (p 3 of 11) |
| Allocation concealment (selection bias) | Low risk | "The sample received an email containing a link to either the intervention website... or control" (p 3 of 11) |
| Blinding of provider | Low risk | Computer administered intervention |
| Blinding of participant | High risk | No reported attempt to blind participants |
| Blinding of outcome assessment (detection bias) All outcomes | Low risk | Automated follow‐up |
| Incomplete outcome data (attrition bias) All outcomes | High risk | Loss to follow‐up > 30% |
| Selective reporting (reporting bias) | Low risk | All outcomes specified in the methods were reported |
| Other bias | Low risk | No further concerns |
Sinadinovic 2014.
| Methods | Parallel design RCT Intention‐to‐treat analysis performed: Yes |
|
| Participants | Sweden; participants recruited via advertisements on drug and alcohol websites and Google; aged ≥ 15 years; eligible if AUDIT = 8+ (men) or 6+ (women). N = 633 randomised; mean age = 44 years |
|
| Interventions |
Brief intervention group (N = 211) online personalised normative feedback via eScreen.se, in depth self‐report instruments to complete on alcohol and drugs ‐ 54 items each, web‐based self help info and readiness to change plus electronic diary and list of local resources/support provided. Extended intervention group (N = 212) used Alkoholhjalpen.se: a cognitive behaviour therapy‐based online extended self help input ‐ 18 modules: risk situations, diary, consequences, progress rating scale, decision balance, paths to change, formulating goals, problem solving, new solutions, things that work, miracle questions, friends and family, other support, alcohol refusal skills, coping with craving, coping with thoughts, related problems and relapse prevention. Control group (N = 210) web‐based assessment only. The interventions were treated separately in the meta analysis with a split control group |
|
| Outcomes | Mean AUDIT‐C, mean total AUDIT, assessed at 3, 6 and 12 months | |
| Funding source | This work was supported by the National Board of Health and Welfare’s Institute for Method Development in Social Work, the Swedish National Drug Policy Coordinator (grant No. MOB 238‐ 2006‐32) and the Stockholm Center for Dependency Disorders | |
| Declarations of interest | Not reported | |
| Notes | ||
| Risk of bias | ||
| Bias | Authors' judgement | Support for judgement |
| Random sequence generation (selection bias) | Low risk | "A computer‐generated list of random numbers... was created with GraphPad Software, and pre‐programmed by a technician into a fully automated allocation system on the study registration Web site" (p 307) |
| Allocation concealment (selection bias) | Low risk | "A computer‐generated list of random numbers... was created with GraphPad Software, and pre‐programmed by a technician into a fully automated allocation system on the study registration Web site" (p 307) |
| Blinding of provider | Low risk | "The entire trial, including recruitment, registration for the trial, allocation to the interventions, use of interventions, as well as the baseline and follow‐up assessments, was conducted online" (p 307) |
| Blinding of participant | High risk | No reported attempt to blind participants |
| Blinding of outcome assessment (detection bias) All outcomes | Low risk | "The entire trial, including recruitment, registration for the trial, allocation to the interventions, use of interventions, as well as the baseline and follow‐up assessments, was conducted online" (p 307) |
| Incomplete outcome data (attrition bias) All outcomes | High risk | Loss to follow‐up > 50% |
| Selective reporting (reporting bias) | Low risk | All outcomes specified in the methods are reported |
| Other bias | Low risk | No further concerns |
Spijkerman 2010.
| Methods | Parallel design RCT Intention‐to‐treat analysis performed: Yes |
|
| Participants | Netherlands; participants were recruited from an online panel; aged 15 to 20 years; eligible if > 4 (male) or > 3 (female) units/occasion 1+ times/month (15 to 16 years) or 1+ times/week (17 to 20 years). N = 575 randomised; 39% male; mean age = 18.1 years |
|
| Interventions |
Personalised intervention group (N = 192) The personalised web‐based brief alcohol interventions consisted of 2 parts: (1) a questionnaire including items addressing participants’ drinking patterns, drinking motives, and health risk status and (2) personalised feedback based on participants’ answers to the earlier posed questions on the questionnaire including advice about moderate drinking. Duration 15 minutes. Normative intervention group (N = 193) as intervention 1 plus normative feedback providing an overview of how much participants thought their age mates would drink, how much their age mates actually drank, and how much the participants drank themselves. This information was presented in a bar chart showing each participant’s own weekly alcohol use, the actual prevalence rates of Dutch adolescents’ weekly alcohol use matched according to the participant’s sex and age, and the prevalence rates of Dutch adolescents’ weekly alcohol use as estimated by participants. Duration 15 minutes. Control group (N = 190) were assessed only. The interventions were treated separately in the meta analysis with a split control group |
|
| Outcomes | Mean drinks/week assessed at 1 and 3 months | |
| Funding source | The present study was funded by ZonMw, the Dutch Organization for Health Research and Development (grant number 70000002) | |
| Declarations of interest | None declared | |
| Notes | ||
| Risk of bias | ||
| Bias | Authors' judgement | Support for judgement |
| Random sequence generation (selection bias) | Low risk | "The randomisation was generated using a randomisation function in [Microsoft] Excel" (p 4 of 10) |
| Allocation concealment (selection bias) | Low risk | "An independent research agency assigned participants randomly to the conditions" (p 4 of 10) |
| Blinding of provider | Low risk | Computer administered intervention |
| Blinding of participant | High risk | No reported attempt to blind participants |
| Blinding of outcome assessment (detection bias) All outcomes | Low risk | Automated follow‐up |
| Incomplete outcome data (attrition bias) All outcomes | High risk | Loss to follow‐up > 40% |
| Selective reporting (reporting bias) | Low risk | All outcomes specified in the methods are reported |
| Other bias | Low risk | No further concerns |
Suffoletto 2014.
| Methods | Parallel design RCT Intention‐to‐treat analysis performed: Yes |
|
| Participants | USA; participants (age criteria not reported) were recruited from an emergency department; eligible if AUDIT‐C = 4+ (men) or 3+ (women). N = 765 randomised; 36% male |
|
| Interventions |
Intervention group (N = 375) received Texting to Reduce Alcohol Consumption (TRAC), which involved SMS assessment + feedback (SA + F). Participants received a series of welcome text messages within 1 hour of enrollment, describing what to expect during the course of intervention exposure. Each Thursday, for 12 weeks, they were sent a text asking them to report their weekend drinking plans. If they reported anticipating a heavy drinking day, they were then asked whether they were willing to set a low‐risk drinking goal (< 5 drinks per occasion for men or < 4 drinks per occasion for women). Depending on the response to each query, participants were provided with real‐time text feedback to either strengthen their low‐risk drinking plan or goal, or to promote reflection on their drinking plan or decision not to set a low‐risk goal. Then, on Sunday, participants were sent a text asking them to report the most drinks they had during a single occasion during the weekend. Depending on their response, they were provided with text feedback to either support their low‐risk drinking behaviour or promote reflection on their binge‐drinking behaviour. The style and tone of messages attempted to reflect those used in motivational interviewing. Control group (N = 188) did not receive any SMS drinking assessments An additional control group (SA group) received SMS assessments but no alcohol feedback; not eligible for this review |
|
| Outcomes | Mean drinks/drinking day assessed at 12 weeks | |
| Funding source | The study was supported by an Emergency Medicine Foundation Grant. Dr Chung was supported by K02 AA018195. Dr Monti was supported by K05 AA019681 and P01 AA019072. Dr Clark was supported by R01AA016482, P50DA05605, and PA‐HEAL SPH00010 | |
| Declarations of interest | None declared | |
| Notes | ||
| Risk of bias | ||
| Bias | Authors' judgement | Support for judgement |
| Random sequence generation (selection bias) | Low risk | "Randomisation was generated... by a computer generated algorithm and allocated electronically" (p 666) |
| Allocation concealment (selection bias) | Low risk | "Randomisation was generated... by a computer generated algorithm and allocated electronically" (p 666) |
| Blinding of provider | Low risk | "Research associates were blinded to treatment allocation to minimise bias" (p 666) |
| Blinding of participant | High risk | No reported attempt to blind participants |
| Blinding of outcome assessment (detection bias) All outcomes | Low risk | "Research associates were blinded to treatment allocation to minimise bias" (p 666) |
| Incomplete outcome data (attrition bias) All outcomes | Unclear risk | Loss to follow‐up around 20% |
| Selective reporting (reporting bias) | Low risk | All outcomes specified in the methods are reported |
| Other bias | Low risk | No further concerns |
Sugarman 2009.
| Methods | Parallel design RCT: Intention‐to‐treat analysis performed: No | |
| Participants | USA; participants were students recruited in psychology classes and through flyers; aged ≥ 18 years; eligible if they drank > 5 drinks for men or > 4 drinks for women on two or more occasions in the past month. N = 393 randomised; 45% male; 83% white; 56% freshmen |
|
| Interventions |
Intervention group (N = 105) received a single session of personalised feedback on (i) the quantity and (ii) the frequency of their drinking, (iii) the frequency of heavy drinking episodes, (iv) their average BAC and (v) their peak BAC, and (vi) a list of any alcohol related problems that they reported experiencing in the past month. In addition, this information was presented in the context of (vii) national and (viii) local (Syracuse University) normative gender‐specific data. The feedback also contained (i) educational information on BAC, (ix) the effects of alcohol on the body, and (x) tips for safer drinking. Duration average 2 minutes. Control group (N = 110) received general health information |
|
| Outcomes | Average drinks/week, average drinks/drinking day, no heavy drinking days in previous month, assessed at one month and two months | |
| Funding source | Not declared; PhD thesis | |
| Declarations of interest | None declared | |
| Notes | ||
| Risk of bias | ||
| Bias | Authors' judgement | Support for judgement |
| Random sequence generation (selection bias) | Low risk | "Participants who reported two or more episodes of heavy drinking in the past 30 days were randomised by the computer program" (p 35) |
| Allocation concealment (selection bias) | Low risk | "...the participant was immediately directed [after randomisation] to view this information on the computer screen" (p 35) |
| Blinding of provider | Unclear risk | "Participants convened in small group sessions in a computer lab on the 5th floor of Huntington Hall" (p 34); unclear how much involvement research staff had |
| Blinding of participant | High risk | No reported attempt to blind participants |
| Blinding of outcome assessment (detection bias) All outcomes | Low risk | Automated follow‐up: "An e‐mail was sent to participants with a hyperlink to a log‐in page and all participants were required to enter their user name and password in order to access the assessment" (p 37) |
| Incomplete outcome data (attrition bias) All outcomes | High risk | Loss to follow‐up 45% |
| Selective reporting (reporting bias) | Low risk | All outcomes specified in the methods are reported |
| Other bias | Low risk | No further concerns |
Voogt 2013a.
| Methods | Cluster design RCT Intention‐to‐treat analysis performed: Yes |
|
| Participants | Netherlands; participants were recruited via their vocational education school; aged 15 to 20 years; eligible if 7+ drinks/week (for girls aged 15 to 16 years), 12+ (boys aged 15 to 16 years), 14+ (female 17 to 20 years), 21+ (male aged 17 to 20 years) and/or 5+ glasses of standard alcohol units per occasion at least once per month for the younger group and at least once per week for the older group. N = 609 randomised; 60% male; mean age = 17.3 years |
|
| Interventions |
Intervention group (N = 37 classes, 318 participants) received the WDYD (What Do You Drink?) intervention: a single session web‐based brief alcohol intervention to detect and reduce heavy drinking of adolescents. The WDYD intervention, developed by using the IM protocol, is based on Motivational Interviewing principles and elements of the I‐Change model. Knowledge, social norms and self‐efficacy are embedded in the intervention as the most changeable determinants of behaviour change. Duration 20 minutes. Control group (N = 36 classes, 291 participants) were assessed only |
|
| Outcomes | Mean drinks/week assessed at 1 and 6 months | |
| Funding source | The major funding agency ZonMw, the Netherlands Organization for Health Research and Development, provided a grant for this study (project no. 50‐50110‐96‐682) | |
| Declarations of interest | The authors declare that they have no competing interests | |
| Notes | ||
| Risk of bias | ||
| Bias | Authors' judgement | Support for judgement |
| Random sequence generation (selection bias) | Low risk | "...randomisation using a computerised random number generator... occurred" (p 4 of 11) |
| Allocation concealment (selection bias) | Low risk | "An independent researcher... performed the allocation before baseline assessment" (p 4 of 11) |
| Blinding of provider | Unclear risk | Not clear where participants received the intervention and if researchers were present |
| Blinding of participant | Low risk | "Participants were blinded to the aim of the study until the end of the study" (p 4 of 11) |
| Blinding of outcome assessment (detection bias) All outcomes | Unclear risk | Not reported |
| Incomplete outcome data (attrition bias) All outcomes | High risk | Loss to follow‐up > 40% |
| Selective reporting (reporting bias) | Low risk | All outcomes specified in the methods are reported |
| Other bias | Low risk | We considered the risks of bias specifically associated with cluster randomised trials. This trial was at low risk of recruitment bias because participants were already in the classes that were used as unit of randomisation prior to the randomisation process; there was no report (or likelihood) of participants joining the classes after they were randomised. The trial used block randomisation, so there is less concern about baseline incomparability. No complete clusters were lost to follow‐up. All reported analyses were adjusted for clustering |
Voogt 2013b.
| Methods | Parallel design RCT Intention‐to‐treat analysis performed: Yes |
|
| Participants | Netherlands; participants were students recruited via flyers distributed around campus; aged 18 to 24 years; eligible if 21 (men) or 14 (women) drinks/week and/or 5+ drinks/occasion during last 6 months. N = 913 randomised; 60% male; mean age = 20.8 years |
|
| Interventions |
Intervention group (N = 456) The first part of WDYD (What Do You Drink?) focuses on the motivation phase of the behaviour change process and contains a homepage and a screening test with personalised feedback. The screening test includes items addressing participants’ name, sex, age, education level, weight, alcohol use, willingness to change alcohol consumption, average expenses on consumed alcohol beverages, and descriptive social norms. After completing the screening test, participants will receive personalised feedback tailored to participants’ sex, alcohol intake, and perceived social norm. It will provide 1) advice about drinking according to the guidelines of the Dutch National Health Council. It will provide information about 2) the amount of glasses of standard alcohol units that the participant consumed in the last year, with estimates of the number of calories consumed, the amount of weight added because of drinking, and the amount of money spent on drinking. Lastly, it will depict 3) a bar chart comparing the number of glasses of standard alcohol units per week that participants think their same‐sex peers consume with the number of glasses of standard alcohol units per week that participants’ same‐sex peers actually consume. The second part of WDYD focuses on the action phase of the behaviour change process, with a general goal of reducing heavy drinking. Participants will be prompted to make decisions about the maximum amount of glasses of standard alcohol units they want to drink on every day of the week at a given point of time, preferably within the limits of low‐risk drinking. WDYD focuses on strengthening participants’ drinking refusal self‐efficacy by proving tips to resist alcohol in different drinking situations. Duration 20 minutes. Control group (N = 451) received no intervention |
|
| Outcomes | Mean drinks/week assessed at 1 and 6 months | |
| Funding source | This work was supported by ZonMw, The Netherlands Organization for Health Research and Development (grant number 50‐50110‐96‐682) | |
| Declarations of interest | Not reported | |
| Notes | ||
| Risk of bias | ||
| Bias | Authors' judgement | Support for judgement |
| Random sequence generation (selection bias) | Low risk | "They were then randomised to the experimental and the control conditions... using a computerised random number generator" (p 314) |
| Allocation concealment (selection bias) | Low risk | Automated procedure |
| Blinding of provider | Unclear risk | Not clear where participants received the intervention and if researchers were present |
| Blinding of participant | Low risk | "Students were informed that the study was about the evaluation of newly developed health education materials addressing alcohol consumption... to reduce the risk of social desirability bias" (p 314) |
| Blinding of outcome assessment (detection bias) All outcomes | Unclear risk | Not reported |
| Incomplete outcome data (attrition bias) All outcomes | Low risk | Loss to follow‐up around 10% |
| Selective reporting (reporting bias) | Low risk | All outcomes specified in the methods are reported |
| Other bias | Low risk | No further concerns |
Wagener 2012.
| Methods | Parallel design RCT Intention‐to‐treat analysis performed: No |
|
| Participants | USA; participants were student members of an online university participant pool management system; aged 18 to 26 years; eligible if 5+ (men) or 4+ (women) drinks/occasion in previous month. N = 152 randomised; 55% male; mean age = 20.9 years |
|
| Interventions |
Intervention group (N = 39) received Drinking Assessment and Feedback Tool for College Students (DrAFT‐CS), included a comprehensive assessment of alcohol use behaviours, consequences, and perceived norms followed immediately by on‐screen personalised feedback. The assessment included measures of quantity and frequency of drinking, common problems experienced by college drinkers, levels of alcohol dependence, perceptions of drinking norms, perceptions of alcohol‐related risk, overall levels of psychological distress, and motivation for change in drinking behaviours. The personalised feedback included quantity and frequency of use; typical and peak blood alcohol levels achieved on drinking occasions; perceptions of social norms; dependence criteria; alcohol‐related problems experienced; financial and caloric costs of alcohol use; familial risk for alcohol problems; perceptions of risk; alcohol expectancies; psychological problems, such as depression and anxiety, that may exacerbate or contribute to alcohol abuse; and motivation for changing current alcohol use. To simulate face‐to‐face personalised feedback interventions (PFIs) and enhance interest and engagement in the program, the DrAFT‐CS also includes a video interviewer. The interviewer appears periodically as the user progresses through the program and offers a welcome message, provides instructions for assessments, offers encouragement, and provides interpretive information for feedback screens. This interviewer is a unique component of the DrAFT‐CS that is not found in any other computer delivered PFIs that are primarily text based. The interviewer was also designed to provide information in an empathic, nonjudgmental manner consistent with principles of motivational interviewing (MI). Duration 45 minutes. Face‐to‐face group (N = 37) received face‐to‐face PFI, completing identical measures to those included in the DrAFT‐CS. The assessment was completed on a computer. Upon completion of the assessment, a printed feedback report was prepared, and the feedback was provided live by a therapist trained in MI. In addition, students in the face‐to‐face condition were allowed to take home their feedback report. Because of the enhanced interactivity of the face‐to‐face PFI condition, most students completed the intervention in 60 to 90 minutes Control group (N = 39) completed computer‐based assessment only. An additional control group (comprehensive assessment control group) is not analagous to control groups in other trials and was omitted from this review |
|
| Outcomes | Mean drinks/week assessed at 10 weeks | |
| Funding source | Study funding was provided by the Oklahoma Department of Mental Health and Substance Abuse Services Science to Service Grant (T Wagener, PI). Dr Wagener is supported by Grant T32‐HL‐076134‐05 (R Wing, PI) from the National Heart Blood and Lung Institute. Development of the DrAFT‐CS intervention was supported by a grant from the Oklahoma Center for the Advancement of Science and Technology Health Research Program (T Leffingwell, PI) | |
| Declarations of interest | Not reported | |
| Notes | ||
| Risk of bias | ||
| Bias | Authors' judgement | Support for judgement |
| Random sequence generation (selection bias) | Low risk | "...students were randomly assigned using a computerised random number generator" (p 261) |
| Allocation concealment (selection bias) | Unclear risk | Not reported; not clear that it was automated |
| Blinding of provider | Unclear risk | "[students] who were scheduled to come into the laboratory and complete baseline measures and specific condition procedures" (p 261); unclear whether research staff were able to be present |
| Blinding of participant | High risk | No reported attempt to blind participants |
| Blinding of outcome assessment (detection bias) All outcomes | Low risk | Automated: "Students completed, via in‐laboratory computers, a battery of self‐report questionnaires" (p 263) |
| Incomplete outcome data (attrition bias) All outcomes | Low risk | Loss to follow‐up < 10% |
| Selective reporting (reporting bias) | Low risk | All outcomes specified in the methods are reported |
| Other bias | Low risk | No further concerns |
Wallace 2011.
| Methods | Parallel design RCT ‐ pilot and main trial reported together; main trial data only used here. Intention‐to‐treat analysis performed: Yes |
|
| Participants | UK; participants were recruited via advertisements on the Alcohol Concern website or through finding the study via search engines; aged 18+; eligible if AUDIT‐C=5+. N = 2652 randomised |
|
| Interventions |
Intervention group (N = 1325) had access to DYD (Down Your Drink), a theoretically informed web‐based programme, based on brief intervention and psychological treatment principles. It offered three phases, each of which was divided into levels with different materials and associated exercises and tasks. If followed in order they provided a natural progression through three stages: decision making (Phase 1, It’s up to you); implementing change (Phase 2, Making the change); and relapse prevention (Phase 3, Keeping on track). However, users were free to design their own route through the programme, and could use it as often or as seldom as they wished. Phase 1 was based on the principles of motivational enhancement therapy, phase 2 used computerised cognitive behavioural therapy and behavioural self control principles, and phase 3 was based on principles of relapse prevention. There were a number of interactive e‐tools including a 'thinking drinking diary' in which users could record their alcohol consumption along with emotional and behavioural triggers and responses. Duration not reported. Control group (N = 1327) had access to a comparator website used a similar graphical design and style as the intervention website to present simple, text‐based information about the harms caused by excess alcohol consumption. It did not contain any interactive components, and users did not have access to the e‐tools. For the duration of the trial, this comparator website was also referred to as Down Your Drink so that participants were not aware whether they had access to the intervention or comparator site |
|
| Outcomes | Mean units/week assessed at 12 months (3 months also reported but this was for the pilot not the main trial) | |
| Funding source | This study was funded by the National Prevention Research Initiative, which includes the following funding partners: British Heart Foundation; Cancer Research UK; Department of Health; Diabetes UK; Economic and Social Research Council; Medical Research Council; Research and Development Office for the Northern Ireland Health and Social Services; Chief Scientist Office, Scottish Executive Health Department; and the Welsh Assembly Government. IRW and SGT are funded by the UK Medical Research Council (grant codes U.1052.00.006 and U.1052.00.001). The Alcohol Education and Research Council provided additional funding to assist with developing the intervention site | |
| Declarations of interest | Since June 2009, PGW has received payments from the charity Drinkaware in his capacity as its Chief Medical Advisor. PGW has no other competing interests and the authors confirm that this does not alter their adherence to all the PLoS One policies on sharing data and materials | |
| Notes | ||
| Risk of bias | ||
| Bias | Authors' judgement | Support for judgement |
| Random sequence generation (selection bias) | Low risk | "...randomisation procedures were automated, using centrally allocated computer‐generated random numbers. Thus there was no possibility of any of the trial team influencing the allocation of participants and concealment of allocation was complete" (p 3) |
| Allocation concealment (selection bias) | Low risk | "...randomisation procedures were automated, using centrally allocated computer‐generated random numbers. Thus there was no possibility of any of the trial team influencing the allocation of participants and concealment of allocation was complete" (p 3) |
| Blinding of provider | Low risk | Computer administered intervention |
| Blinding of participant | Low risk | "...for the duration of the trial, the comparator website was also referred to as Down Your Drink so that participants were not aware whether they had access to the intervention or comparator site" (p 3) |
| Blinding of outcome assessment (detection bias) All outcomes | Low risk | "All data were collected on‐line. At follow‐up participants were sent an automated e‐mail with an embedded hyperlink to the assessment questionnaires" (p 4) |
| Incomplete outcome data (attrition bias) All outcomes | High risk | Loss to follow‐up > 60% |
| Selective reporting (reporting bias) | Low risk | All outcomes specified in the methods are reported |
| Other bias | Low risk | No further concerns |
Walters 2009.
| Methods | Parallel design RCT Intention‐to‐treat analysis performed: Yes |
|
| Participants | USA; participants were students recruited via class presentations, email and flyers distributed across campus; aged ≥ 18 years; eligible if 5+ (male) or 4+ (female) drinks/occasion in previous 2 weeks. N = 279 randomised; 36% male; mean age = 19.8 years |
|
| Interventions |
Intervention group (N = 67) had access to e‐CHUG (electronic Check‐Up to Go). Using the information from a participant’s assessment, the feedback included: (1) a quantity/frequency summary of drinking behaviour (e.g. standard drinks consumed in the last 30‐days, estimated peak BAC, caloric intake), (2) comparison to USA adult and campus norms, (3) level of risk (e.g. AUDIT score, tolerance, estimated genetic risk), (4) estimated dollar amount and percent of income spent on alcohol, and (5) local referral resources. Duration not reported. Face‐to‐face group (N = 70) received motivational interviewing (MI) sessions according to Miller 2002 (number and duration not reported). Control group (N = 69) completed web‐based assessment only. An additional intervention arm received a combination of digital plus face‐to‐face interventions; not eligible for this review |
|
| Outcomes | Mean drinks/week assessed at 3 and 6 months | |
| Funding source | This project was supported by R01 AA016005‐01 funded by the National Institute of Alcohol Abuse and Alcoholism | |
| Declarations of interest | Not reported | |
| Notes | ||
| Risk of bias | ||
| Bias | Authors' judgement | Support for judgement |
| Random sequence generation (selection bias) | Low risk | "Randomisation... was completed automatically after students entered their screening data" (p 3) |
| Allocation concealment (selection bias) | Low risk | Automated procedure: "Participants then received an email directing them to the online consent and baseline assessment battery" (p 3) |
| Blinding of provider | Low risk | Computer administered intervention |
| Blinding of participant | High risk | No reported attempt to blind participants |
| Blinding of outcome assessment (detection bias) All outcomes | Low risk | "Measures were completed online at a baseline assessment, as well as at 3‐ and 6‐month follow‐up assessments" (p 4) |
| Incomplete outcome data (attrition bias) All outcomes | Low risk | Loss to follow‐up < 20% |
| Selective reporting (reporting bias) | Low risk | All outcomes specified in the methods are reported |
| Other bias | Low risk | No further concerns |
Weaver 2014.
| Methods | Parallel design RCT Intention‐to‐treat analysis performed: No |
|
| Participants | USA; participants were students recruited from an undergraduate psychology class; aged 18 to 25 years; eligible if 5+ (men) or 4+ (women) drinks/occasion in the past month, and 20+ drinks/month, and at least one negative alcohol‐related consequence in past month. N = 176 randomised; 51% male |
|
| Interventions |
Intervention group (N = 47) had access to DrAFT‐CS, beginning with a video clinician who explained the intent of the program. Participants were guided by the video clinician through questions that assessed a variety of variables necessary for personalised feedback. Participants answered questions that assessed quantity and frequency of alcohol use, alcohol‐related problems, alcohol dependence symptoms, perceptions of drinking norms, psychological distress, and motivation to change drinking behaviour. Once participants completed the assessment phase of the DrAFT‐CS, the video clinician introduced the feedback section of the intervention and provided personalised feedback regarding their alcohol use, alcohol‐related problems, risk for developing an alcohol use disorder, normative feedback on drinking behaviour, money spent on alcohol, and calories consumed. Unique to DrAFT‐CS, participants received this information via the video clinician who explained each piece of feedback as it was presented. Consistent with the style of motivational interviewing (Miller 2002), the video clinician presented information without suggesting a need for change in order to reduce the risk of resistance from the participant. Once the feedback was completed, the research assistant closed the program and informed the participant that they would be contacted via email with a link to complete follow‐up assessments. The DrAFT‐CS took approximately 45‐minutes to complete. Control group (N = 46) performed computer‐based assessment only. Two additional intervention arms were not eligible for this review: one received class‐based instruction in skills moderation, the other received a combination of DRAFT‐CS and skills training |
|
| Outcomes | Mean drinks/week assessed at 1 month | |
| Funding source | The project was in part supported by an NIH Ruth L Kirschstein National Research Service Award (T32 AA013526 ‐ 10) to Kenneth J Sher, PhD | |
| Declarations of interest | Not reported | |
| Notes | ||
| Risk of bias | ||
| Bias | Authors' judgement | Support for judgement |
| Random sequence generation (selection bias) | Unclear risk | Method of sequence generation not reported |
| Allocation concealment (selection bias) | Unclear risk | Not reported |
| Blinding of provider | High risk | "Following the consent process, all participants were seated at a computer by a research assistant where the baseline measures outlined above were completed online. Following completion of these measures, the participant received a prompt to signal a research assistant for further instruction" (p 25) |
| Blinding of participant | High risk | No reported attempt to blind participants |
| Blinding of outcome assessment (detection bias) All outcomes | Unclear risk | Not reported |
| Incomplete outcome data (attrition bias) All outcomes | Unclear risk | Loss to follow‐up around 20% |
| Selective reporting (reporting bias) | Unclear risk | Did not report outcome values for all groups consistently |
| Other bias | Low risk | No further concerns |
Witkiewitz 2014.
| Methods | Parallel design RCT Intention‐to‐treat analysis performed: Yes |
|
| Participants | USA; participants were students (age criteria not reported) recruited via flyers distributed around campus, advertisements in student newspapers, Facebook, and craigslist; eligible if 5+ (men) or 4+ (women) drinks/occasion in last 2 weeks. N = 94 randomised; 72% male; mean age = 20.5 years |
|
| Interventions |
Intervention group (N = 32) received the BASICS‐mobile intervention module after completing each mobile assessment (including randomly prompted assessments and event‐contingent assessments). We administered up to 31 different modules during the intervention. Each module was 13 pages (sized for a mobile phone screen) and targeted one of the following topics: normative feedback (13.7% of modules delivered), general or health information about drinking and smoking (26.4% of modules delivered), protective behavioural strategies for drinking and smoking (28.9% of modules delivered), alternative activities to drinking and smoking (6% of modules delivered), urge‐surfing (16.5% of modules delivered), or decisional balance for drinking and smoking (8.5% of modules delivered). Control group (N = 29) performed screening survey and baseline assessment on their phones. An additional control group which was monitored daily was not eligible for this review |
|
| Outcomes | Mean drinks/drinking day assessed at 1 month | |
| Funding source | Supported by the National Institute on Alcohol Abuse and Alcoholism (Grant AA018336) | |
| Declarations of interest | Not reported | |
| Notes | ||
| Risk of bias | ||
| Bias | Authors' judgement | Support for judgement |
| Random sequence generation (selection bias) | Low risk | Automated: interested individuals were emailed a link to the screening survey; those meeting the inclusion criteria were immediately linked to an online baseline survey; after completing they were randomised (p 641). |
| Allocation concealment (selection bias) | Low risk | Automated procedure |
| Blinding of provider | Low risk | Computer administered intervention |
| Blinding of participant | High risk | No reported attempt to blind participants |
| Blinding of outcome assessment (detection bias) All outcomes | Low risk | Automated follow‐up |
| Incomplete outcome data (attrition bias) All outcomes | Low risk | Loss to follow‐up < 10% |
| Selective reporting (reporting bias) | Low risk | All outcomes specified in the methods are reported |
| Other bias | Low risk | No further concerns |
Characteristics of excluded studies [ordered by study ID]
| Study | Reason for exclusion |
|---|---|
| Alessi 2013 | Intervention has no personalised behaviour change component |
| An 2013 | Screened into trial by smoking status not alcohol consumption |
| Bendtsen 2012 | Participants were not screened for hazardous or harmful consumption |
| Bersamin 2007 | Participants were not screened for hazardous or harmful consumption |
| Bewick 2008 | Pilot feasibility trial of Bewick 2013 |
| Bewick 2010 | Inclusion criterion with respect to alcohol consumption was at least one drink every six months ‐ not necessarily hazardous or harmful |
| Bewick 2013 | Inclusion criterion with respect to alcohol consumption was "a consumer of alcohol" ‐ not necessarily hazardous or harmful |
| Bingham 2010 | Participants were not screened for hazardous or harmful consumption |
| Bischof 2008 | Both intervention arms contained face‐to‐face elements; there was no digital intervention only arm |
| Bryant 2013 | Participants were not screened for hazardous or harmful consumption |
| Coleman 2010 | Participants were not screened according to their consumption and did not enter their consumption information into the intervention, which was targeted as a primary educational prevention intervention |
| Croom 2009 | Participants were not screened for hazardous or harmful consumption |
| Cunningham 2005 | All participants received the digital intervention and randomised to receive an additional booklet or not |
| Cunningham 2009b | Inclusion criterion with respect to alcohol consumption was more than two drinks in the last year ‐ not necessarily hazardous or harmful |
| Cunningham 2012 | Compared two digital intervention arms |
| Dickinson 2013 | Participants were not screened for hazardous or harmful consumption |
| Dimeff 2000 | Intervention was personalised graphic feedback that was used in a face‐to‐face intervention |
| Donohue 2004 | Inclusion criterion with respect to alcohol consumption was at least one drink in the last 30 days ‐ not necessarily hazardous or harmful |
| Doumas 2008 | Participants were not screened for hazardous or harmful consumption |
| Doumas 2009 | Participants were not screened for hazardous or harmful consumption (stratification by risk level was used for analysis but not for recruitment) |
| Doumas 2014 | Participants were not screened for hazardous or harmful consumption |
| Eltringham 1990 | Participants were required to complete the course and demonstrate compliance which may have confounded consumption outcomes |
| Epton 2014 | Participants were not screened for hazardous or harmful consumption |
| Evans 2012 | Participants were not screened for hazardous or harmful consumption |
| Evers 2012 | Inclusion criterion with respect to alcohol consumption was "ever tried alcohol" ‐ not necessarily hazardous or harmful |
| Fang 2010 | Participants were not screened for hazardous or harmful consumption |
| Farrer 2012 | Participants were screened according to psychological symptoms not alcohol consumption |
| Finfgeld‐Connett 2008 | Pilot study |
| Gregor 2003 | Intervention provided alcohol‐related scenarios but not based on participants' information, did not give personalised feedback |
| Hasin 2013 | All participants received a face‐to‐face intervention |
| Hendershot 2010 | Participants were not screened for hazardous or harmful consumption; feedback was about participants' genotypes |
| Hester 2009 | Control group was an intensive programme including face‐to‐face, group meetings and online and other resources, all focused on moderation management ‐ not a control group comparison analagous to other studies, nor was it face‐to‐face versus digital |
| Hustad 2010 | Participants were not screened for hazardous or harmful consumption |
| Jouriles 2010 | Both trial arm participants received the same intervention and were randomised to different methods of aiding recall of the information |
| Kay‐Lambkin 2009 | Participants were screened for cannabis or alcohol or both cannabis and alcohol use and were not all risky alcohol users |
| Kay‐Lambkin 2011 | Participants were screened for cannabis or alcohol or both cannabis and alcohol use and were not all risky alcohol users |
| Keurhorst 2013 | Intervention targeted health professionals not drinkers |
| Kypri 2004 | Pilot study for Kypri 2008 |
| Kypri 2005 | Participants were not screened for hazardous or harmful consumption |
| LaBrie 2008 | Participants were not screened for hazardous or harmful consumption |
| Lana 2014 | Participants were not screened for hazardous or harmful consumption; the intervention was aimed at reducing cancer risk |
| Lane 2012 | Participants were not screened for hazardous or harmful consumption |
| Lovecchio 2010 | Participants were not screened for hazardous or harmful consumption |
| Maio 2005 | Intervention targeted non‐drinkers as well as drinkers and participants not screened in accordance to consumption |
| Martens 2010 | Participants did not need to be using alcohol at baseline |
| Mason 2014 | Pilot study |
| Matano 2007 | Pilot study |
| McCambridge 2013 | Participants were not screened for hazardous or harmful consumption |
| Meier 1988 | Generic educational intervention; participants did not received tailored feedback |
| Moore 2013 | Participants were not screened for hazardous or harmful consumption |
| Moreira 2012 | Participants were not screened for hazardous or harmful consumption (stratification by risk level was used for analysis but not for recruitment) |
| Palfai 2014 | Participants were separated according to risky drinking status at recruitment but non‐risky drinkers were randomised into the trial |
| Parekh 2014 | Participants were screened by a customised combination score of multiple risk behaviours ‐ not all displayed hazardous or harmful alcohol consumption |
| Paschall 2006 | Participants were separated according to risky drinking status at recruitment but non‐risky drinkers were randomised into the trial |
| Paschall 2011 | Participants were not screened for hazardous or harmful consumption |
| Pemberton 2011 | Participants were not screened for hazardous or harmful consumption |
| Postel 2010a | Pilot study |
| Reis 2000 | Participants were not screened for hazardous or harmful consumption |
| Reis 2002 | Mandated students |
| Rhodes 2001 | Not randomised |
| Saitz 2007 | Compared two digital intervention arms |
| Schinke 2005 | Participants were not screened for hazardous or harmful consumption; primary prevention trial |
| Schinke 2005a | Participants were not screened for hazardous or harmful consumption; primary prevention trial |
| Schinke 2009 | Participants were not screened for hazardous or harmful consumption |
| Schuckit 2012 | Participants were separated according to risky drinking status at recruitment but non‐risky drinkers were randomised into the trial |
| Schulz 2014b | Participants were not screened for hazardous or harmful consumption |
| Sharmer 2001 | Participants were not screened for hazardous or harmful consumption |
| Suffoletto 2012 | Pilot feasibility trial of Suffoletto 2014 |
| Swan 2009 | Intervention involved live, synchronous chat with a counsellor |
| Tensil 2013 | Compared two digital intervention arms |
| Thombs 2007 | Intervention involved a computer but an interviewer was present |
| Trinks 2010 | Participants were not screened for hazardous or harmful consumption |
| Tzilos 2011 | Preliminary acceptability and feasibility trial |
| Vinson 2000 | Pilot study |
| Vogl 2009 | Primary prevention, intervention was a generic educational package |
| Walters 2007 | Participants were not screened for hazardous or harmful consumption |
| Walton 2010 | Inclusion criterion with respect to alcohol consumption was more than 2 to 3 drinks in the last year ‐ not necessarily hazardous or harmful |
| Weitzel 2007 | Inclusion criterion with respect to alcohol consumption was drinking once a week ‐ not necessarily hazardous or harmful |
Characteristics of studies awaiting assessment [ordered by study ID]
Acosta 2017.
| Methods | Parallel design RCT |
| Participants | USA; veterans with hazardous substance use and post traumatic stress disorder |
| Interventions | Thinking Forward: a web‐based cognitive behavioural therapy intervention accessible over 12 weeks Control group received primary care treatment as usual |
| Outcomes | Per cent drinking days, per cent heavy drinking days, assessed at 24 weeks |
| Notes |
Balestrieri 2016.
| Methods | Parallel design RCT |
| Participants | USA; students moving to off‐campus housing |
| Interventions | College Drinkers Check Up: computer‐delivered brief alcohol intervention Control group received assessment only |
| Outcomes | Drinking quantity, frequency, heavy drinking frequency, consequences, assessed at one month |
| Notes |
Bock 2016.
| Methods | Parallel design RCT |
| Participants | USA; students in community colleges |
| Interventions | Text message alcohol programme (TMAP) Control group received general motivational (not alcohol‐related) text messages |
| Outcomes | Heavy drinking, negative alcohol consequences, assessed at six weeks |
| Notes |
Duroy 2016.
| Methods | Parallel design RCT |
| Participants | France; participants attending emergency department |
| Interventions | Computer‐assisted screening, brief intervention and referral to treatment (SBIRT) Control group received a computer‐assisted nutritional education programme |
| Outcomes | Mean number of drinks/day in previous week, reported at 12 months |
| Notes |
Gajecki 2017.
| Methods | Parallel design RCT |
| Participants | Sweden; university students who had excessive alcohol consumption following participation in NCT02064998 (not yet published) |
| Interventions | TeleCoach: a skills training smart phone app Control participants were on a waiting list |
| Outcomes | Proportion of participants with excessive alcohol consumption, reported at six and 12 weeks |
| Notes |
Leeman 2016.
| Methods | Parallel design RCT |
| Participants | USA; undergraduate students |
| Interventions | THRIVE (Tertiary Health Research Intervention via Email): one of three variants on protective behavioural strategies Control group received a brochure about alcohol as a risk factor for injury and disease |
| Outcomes | Mean drinks per week and frequency of drinking, reported at one and six months |
| Notes |
Muench 2017.
| Methods | Parallel design RCT |
| Participants | USA; participants recruited through online alcohol resources |
| Interventions | Four types of alcohol reduction‐themed text messages sent daily Control group received a weekly self‐tracking assessment text |
| Outcomes | Mean drinks per week, heavy drinking days, reported at 12 weeks |
| Notes |
Ondersma 2016.
| Methods | Parallel design RCT |
| Participants | USA; postpartum women |
| Interventions | Single 20 minute online intervention based on FRAMES and motivational interviewing Control group were asked questions about their music and television preferences, shown videos and asked for their opinion of them |
| Outcomes | Seven day point prevalence alcohol abstinence, reported at three and six months |
| Notes |
Characteristics of ongoing studies [ordered by study ID]
ISRCTN10323951.
| Trial name or title | Testing the effectiveness of two web‐based interventions aiming to reduce alcohol consumption |
| Methods | Parallel design RCT |
| Participants | Netherlands, Germany, Switzerland; participants recruited from internet health portals, web sites and community newspapers |
| Interventions | Take Care of You (TCOY) is an internet‐based self help intervention which aims to reduce alcohol consumption and depression symptoms |
| Outcomes | Standard drinks consumed in previous seven days |
| Starting date | February 2016 |
| Contact information | michael.schaub@isgf.uzh.ch |
| Notes |
ISRCTN40104069.
| Trial name or title | Evaluating the effectiveness of a smartphone app to reduce alcohol consumption in hazardous and/or harmful drinkers |
| Methods | Factorial RCT |
| Participants | UK; participants who download the app, and express an interest in cutting down hazardous alcohol consumption |
| Interventions | Drink Less smart phone app |
| Outcomes | Change in past week consumption of alcohol (AUDIT‐C) |
| Starting date | March 2016 |
| Contact information | c.garnett.12@ucl.ac.uk |
| Notes |
ISRCTN45300218.
| Trial name or title | SIPS Junior |
| Methods | Parallel design RCT |
| Participants | UK; adolescents (14 to 17 years) attending emergency department |
| Interventions | Smart phone or web‐based electronic brief intervention or face‐to‐face personalised feedback Control group will receive treatment according to the injury that brought them to the emergency department |
| Outcomes | Total alcohol consumption in previous 28 days |
| Starting date | March 2014 |
| Contact information | s.coulton@kent.ac.uk |
| Notes |
NCT02064998.
| Trial name or title | Two consecutive randomized controlled trials using mobile phone applications for risky alcohol use |
| Methods | Parallel design RCT |
| Participants | Sweden, university students |
| Interventions | Smartphone app (Promillekoll) or web‐based app (PartyPlanner) Control group will be assessed only |
| Outcomes | Mean drinks per week, drinking occasions per week, number of binge drinking occasions, mean eBAC, peak eBAC |
| Starting date | September 2014 |
| Contact information | anne.h.berman@ki.se |
| Notes | Follow‐on study from Gajecki 2014; this protocol contains details an unpublished study ('Study 1') and Gajecki 2017 ('Study 2') |
Differences between protocol and review
Authorship
The following changes have been made to the authorship of the review:
Professor Michie has been made last author ‐ this was agreed before the protocol was published but erroneously left as it was.
Dr Amy O'Donnell, Dr Gregory Maniatopous and Dr James Newham helped with the data extraction and interpretation.
Dr Heather Brown is a health economist and wrote the section dealing with cost‐effectiveness.
Secondary objectives
One of the secondary objectives described in the protocol was "to develop a taxonomy of interventions according to their mode of delivery (e.g. functionality features) and assess their impact on outcomes". Early on in the conduct of the review we decided that to develop a taxonomy was beyond the scope of an effectiveness review, and this secondary objective was changed to read "to specify interventions according to their mode of delivery (e.g. functionality features) and assess the impact of mode of delivery on outcomes". In the event there were insufficient studies describing different modes of delivery to allow us to address this objective.
Participants: exclusion criteria
When we assessed the results of the search for eligibility we discovered a group of trials in which participants were mandated to complete the intervention, and where an individual's progression (e.g. at university) depended on the intervention being deemed to have been successful in reducing their alcohol consumption. We decided to exclude these trials because the results of the intervention itself were likely to be extremely confounded by the compulsory nature of the intervention and the extra pressure for it to work.
Subgroup analysis by time: immediate versus delayed outcomes
We planned a subgroup analysis according to immediate versus delayed outcomes at the protocol stage, but it became clear that the follow‐up times of the included studies did not fall into obvious immediate and delayed times. Rather than define an arbitrary (and potentially meaningless, controversial or both) dichotomy, we carried out the subgroup analysis according to the follow‐up times reported in the studies.
Sensitivity analysis imputing standard deviations and number of participants
We carried out a sensitivity analysis imputing missing standard deviations and participant numbers because we wanted to understand how much of an impact the missing data had on the overall effect estimate.
Sensitivity analysis accounting for performance bias
We carried out a sensitivity analysis, omitting studies at high risk of performance bias, to assess whether the effect of self‐reporting in unblinded studies might account for the reduction in consumption reported in the primary meta‐analysis.
Meta‐regression analyses
We carried out a meta‐regression analysis looking at the longest period of follow‐up to investigate any potential decay in effect of the intervention over time, which may be analogous to the decay noted from face‐to‐face brief interventions (Kaner 2007). We also carried out a meta‐regression analysis on year of publication; again an effect had been noticed in other alcohol interventions and we decided to investigate.
Contributions of authors
The protocol was drafted by FB, EK and SM. All authors commented on and approved the final version of the protocol.
FB and JR designed and piloted the outcome data extraction form.
FB, AOD, MH, EK, GM, JN, JR, FdV carried out outcome data extraction.
CM carried out the outcomes meta analyses and wrote up the outcomes analysis.
DC carried out data extraction for and wrote up the BCT analysis.
CG carried out data extraction for and wrote up the theory analysis.
HB wrote the summary of economic studies section.
JB, DC and CG drafted the BCT and theory analysis plans.
EK and FB wrote up the first draft of the Background, Discussion and Authors' conclusions sections; other authors added to them.
CM, DC, CG and FB wrote up the Methods section.
All authors commented on and agreed the final version of the review.
Sources of support
Internal sources
-
Newcastle University, UK.
This is the host institution for some of the authors.
-
Bristol University, UK.
This is the host institution for some of the authors.
-
University College London, UK.
This is the host institution for some of the authors.
External sources
-
NHS National Institute of Health Research, School for Public Health Research, UK.
NIHR SPHR funded salaries and consumables for this systematic review.
Declarations of interest
Eileen Kaner, Fiona Beyer and Colin Muirhead are authors on a related Cochrane Review (Kaner 2007).
Eileen Kaner is an investigator on the ongoing SIPS Junior trial (NIHR programme grant number NIHR RP‐PG‐0609‐10162), which will have an app component in one arm of the trial.
Jamie Brown, David Crane, Claire Garnett and Susan Michie are currently working on the development and evaluation of an app to reduce excessive alcohol consumption (ISRCTN40104069).
Matthew Hickman, Frank de Vocht, and James Redmore, Amy O'Donnell, James Newham, Heather Brown and Gregory Maniatopoulos have no interests to declare.
New
References
References to studies included in this review
Araki 2006 {published data only}
- Araki I, Hashimoto H, Kono K, Matsuki H, Yano E. Controlled trial of worksite health education through face‐to‐face counseling vs. e‐mail on drinking behavior modification. Journal of Occupational Health 2006;48(4):239‐45. [DOI] [PubMed] [Google Scholar]
Bendtsen 2015 {published data only}
- Bendtsen P, Bendtsen M, Karlsson N, White IR, McCambridge J. Online alcohol assessment and feedback for hazardous and harmful drinkers: findings from the AMADEUS‐2 randomized controlled trial of routine practice in Swedish universities. Journal of Medical Internet Research 2015;17(7):e170. [DOI] [PMC free article] [PubMed] [Google Scholar]
Bertholet 2015 {published data only}
- Bertholet N, Cunningham JA, Faouzi M, Gaume J, Gmel G, Burnand B, et al. Internet‐based brief intervention for young men with unhealthy alcohol use: a randomized controlled trial in a general population sample. Addiction 2015;110(11):1735‐43. [DOI] [PubMed] [Google Scholar]
Blankers 2011 {published data only}
- Blankers M, Koeter MW, Schippers GM. Internet therapy versus internet self‐help versus no treatment for problematic alcohol use: a randomized controlled trial. Journal of Consulting and Clinical Psychology 2011;79(3):330‐41. [DOI] [PubMed] [Google Scholar]
Boon 2011 {published data only}
- Boon B, Risselada A, Huiberts A, Riper H, Smit F. Curbing alcohol use in male adults through computer generated personalized advice: randomized controlled trial. Journal of Medical Internet Research 2011;13(2):e43. [DOI] [PMC free article] [PubMed] [Google Scholar]
Brendryen 2013 {published data only}
- Brendryen H, Lund IO, Johansen AB, Riksheim M, Nesvag S, Duckert F. Balance ‐ a pragmatic randomized controlled trial of an online intensive self‐help alcohol intervention. Addiction 2014;109(2):218‐26. [DOI] [PubMed] [Google Scholar]
Brief 2013 {published data only}
- Brief DJ, Rubin A, Keane TM, Enggasser JL, Roy M, Helmuth E, et al. Web intervention for OEF/OIF veterans with problem drinking and PTSD symptoms: a randomized clinical trial. Journal of Consulting and Clinical Psychology 2013;81(2):890‐900. [DOI] [PMC free article] [PubMed] [Google Scholar]
Butler 2003 {published data only}
- Butler SF, Chiauzzi E, Bromberg JI, Budman SH, Buono DP. Computer‐assisted screening and intervention for alcohol problems in primary care. Journal of Technology in Human Services 2003;21(3):1‐19. [Google Scholar]
Butler 2009 {published data only}
- Butler LH, Correia CJ. Brief alcohol intervention with college student drinkers: face‐to‐face versus computerized feedback. Psychology of Addictive Behaviors 2009;23(1):163‐7. [DOI] [PubMed] [Google Scholar]
Chiauzzi 2005 {published data only}
- Chiauzzi E, Green TC, Lord S, Thum C, Goldstein M. My student body: a high‐risk drinking prevention web site for college students. Journal of American College Health 2005;53(6):263‐74. [DOI] [PMC free article] [PubMed] [Google Scholar]
Collins 2014 (DBF) {published data only}
- Collins SE, Kirouac M, Lewis MA, Witkiewitz K, Carey KB. Randomized controlled trial of web‐based decisional balance feedback and personalized normative feedback for college drinkers. Journal of Studies on Alcohol and Drugs 2014;75(6):982‐92. [DOI] [PMC free article] [PubMed] [Google Scholar]
Collins 2014 (PNF) {published data only}
- Collins SE, Kirouac M, Lewis MA, Witkiewitz K, Carey KB. Randomized controlled trial of web‐based decisional balance feedback and personalized normative feedback for college drinkers. Journal of Studies on Alcohol and Drugs 2014;75(6):982‐92. [DOI] [PMC free article] [PubMed] [Google Scholar]
Cucciare 2013 {published data only}
- Cucciare MA, Weingardt KR, Ghaus S, Boden MT, Frayne SM. A randomized controlled trial of a web‐delivered brief alcohol intervention in Veterans Affairs primary care. Journal of Studies on Alcohol and Drugs 2013;74(3):428‐36. [DOI] [PubMed] [Google Scholar]
Cunningham 2009a {published data only}
- Cunningham JA, Wild TC, Cordingley J, Mierlo T, Humphreys K. Twelve‐month follow‐up results from a randomized controlled trial of a brief personalized feedback intervention for problem drinkers. Alcohol and Alcoholism 2010;45(3):258‐62. [DOI] [PMC free article] [PubMed] [Google Scholar]
- Cunningham JA, Wild TC, Cordingley J, Mierlo T, Humphreys K. A randomized controlled trial of an internet‐based intervention for alcohol abusers. Addiction 2009;104(2):2023‐32. [DOI] [PMC free article] [PubMed] [Google Scholar]
Cunningham 2012b {published data only}
- Cunningham JA, Hendershot CS, Murphy M, Neighbors C. Pragmatic randomized controlled trial of providing access to a brief personalized alcohol feedback intervention in university students. Addiction Science and Clinical Practice 2012;7(1):21. [DOI] [PMC free article] [PubMed] [Google Scholar]
Delrahim‐Howlett 2011 {published data only}
- Delrahim‐Howlett K, Chambers CD, Clapp JD, Xu R, Duke K, Moyer RJ 3rd, et al. Web‐based assessment and brief intervention for alcohol use in women of childbearing potential: a report of the primary findings. Alcoholism, Clinical and Experimental Research 2011;35(7):1331‐8. [DOI] [PubMed] [Google Scholar]
Doumas 2010 {published data only}
- Doumas DM, Haustveit T, Coll KM. Reducing heavy drinking among first year intercollegiate athletes: a randomized controlled trial of web‐based normative feedback. Journal of Applied Sport Psychology 2010;22(3):247‐61. [Google Scholar]
Doumas 2011a {published data only}
- Doumas DM, Kane CM, Navarro B, Roman J. Decreasing heavy drinking in first‐year students: evaluation of a web‐based personalized feedback program administered during orientation. Journal of College Counseling 2011;14(1):5‐20. [Google Scholar]
Ekman 2011 {published data only}
- Ekman DS, Andersson A, Nilsen P, Stahlbrandt H, Johansson AL, Bendtsen P. Electronic screening and brief intervention for risky drinking in Swedish university students ‐ a randomized controlled trial. Addictive Behaviors 2011;36(6):654‐9. [DOI] [PubMed] [Google Scholar]
Gajecki 2014 {published data only}
- Gajecki M, Berman AH, Sinadinovic K, Rosendahl I, Andersson C. Mobile phone brief intervention applications for risky alcohol use among university students: a randomized controlled study. Addiction Science and Clinical Practice 2014;9(1):11. [DOI] [PMC free article] [PubMed] [Google Scholar]
Geisner 2015 {published data only}
- Geisner IM, Varvil‐Weld L, Mittmann AJ, Mallett K, Turrisi R. Brief web‐based intervention for college students with comorbid risky alcohol use and depressed mood: does it work and for whom?. Addictive Behaviors 2015;42:36‐43. [DOI: 10.1016/j.addbeh.2014.10.030] [DOI] [PMC free article] [PubMed] [Google Scholar]
Hansen 2012 {published data only}
- Hansen AB, Becker U, Nielsen AS, Grønbaek M, Tolstrup JS, Thygesen LC. Internet‐based brief personalized feedback intervention in a non‐treatment‐seeking population of adult heavy drinkers: a randomized controlled trial. Journal of Medical Internet Research 2012;14(4):e98. [DOI] [PMC free article] [PubMed] [Google Scholar]
Hedman 2008 {published data only}
- Hedman AS, Akagi C. Effects of an online binge drinking intervention for college students. American Journal of Health Studies 2008;23(1):17‐26. [Google Scholar]
Hester 1997 {published data only}
- Hester RK, Delaney HD. Behavioral Self‐Control Program for Windows: results of a controlled clinical trial. Journal of Consulting and Clinical Psychology 1997;65(4):686‐93. [DOI] [PubMed] [Google Scholar]
Hester 2005 {published data only}
- Hester RK, Squires DD, Delaney HD. The drinker's check‐up: 12‐month outcomes of a controlled clinical trial of a stand‐alone software program for problem drinkers. Journal of Substance Abuse Treatment 2005;28(2):159‐69. [DOI] [PubMed] [Google Scholar]
Hester 2012 (exp 1) {published data only}
- Hester RK, Delaney HD, Campbell W. The college drinker's check‐up: outcomes of two randomized clinical trials of a computer‐delivered intervention. Psychology of Addictive Behaviors 2012;26(1):1‐12. [DOI] [PMC free article] [PubMed] [Google Scholar]
Hester 2012 (exp 2) {published data only}
- Hester RK, Delaney HD, Campbell W. The college drinker's check‐up: outcomes of two randomized clinical trials of a computer‐delivered intervention. Psychology of Addictive Behaviors 2012;26(1):1‐12. [DOI] [PMC free article] [PubMed] [Google Scholar]
Khadjesari 2014 {published data only}
- Khadjesari Z, Freemantle N, Linke S, Hunter R, Murray E. Health on the web: randomised controlled trial of online screening and brief alcohol intervention delivered in a workplace setting. PLoS One 2014;9(11):e112553. [DOI] [PMC free article] [PubMed] [Google Scholar]
Kypri 2008 {published data only}
- Kypri K, Langley JD, Saunders JB, Cashell‐Smith ML, Herbison P. Randomized controlled trial of web‐based alcohol screening and brief intervention in primary care. Archives of Internal Medicine 2008;168(5):530‐6. [DOI] [PubMed] [Google Scholar]
Kypri 2009 {published data only}
- Kypri K, Hallett J, Howat P, McManus A, Maycock B, Bowe S, et al. Randomized controlled trial of proactive web‐based alcohol screening and brief intervention for university students. Archives of Internal Medicine 2009;169(16):1508‐14. [DOI] [PubMed] [Google Scholar]
Kypri 2013 {published data only}
- Kypri K, McCambridge J, Vater T, Bowe SJ, Saunders JB, Cunningham JA, et al. Web‐based alcohol intervention for Maori university students: double‐blind, multi‐site randomized controlled trial. Addiction 2013;108(2):331‐8. [DOI] [PMC free article] [PubMed] [Google Scholar]
Kypri 2014 {published data only}
- Kypri K, Vater T, Bowe SJ, Saunders JB, Cunningham JA, Horton NJ, et al. Web‐based alcohol screening and brief intervention for university students: a randomized trial. JAMA 2014;311(12):1218‐24. [DOI] [PMC free article] [PubMed] [Google Scholar]
Labrie 2013 {published data only}
- Labrie JW, Lewis MA, Atkins DC, Neighbors C, Zheng C, Kenney SR, et al. RCT of web‐based personalized normative feedback for college drinking prevention: are typical student norms good enough?. Journal of Consulting and Clinical Psychology 2013;81(6):1074‐86. [DOI] [PMC free article] [PubMed] [Google Scholar]
Lewis 2007a {published data only}
- Lewis MA, Neighbors C. Optimizing personalized normative feedback: the use of gender‐specific referents. Journal of Studies on Alcohol and Drugs 2007;68(2):228‐37. [DOI] [PMC free article] [PubMed] [Google Scholar]
Lewis 2007b {published data only}
- Lewis MA, Neighbors C, Oster‐Aaland L, Kirkeby BS, Larimer ME. Indicated prevention for incoming freshmen: personalized normative feedback and high‐risk drinking. Addictive Behaviors 2007;32(11):2495‐508. [DOI] [PMC free article] [PubMed] [Google Scholar]
Lewis 2014 {published data only}
- Lewis MA, Patrick ME, Litt DM, Atkins DC, Kim T, Blayney JA, et al. Randomized controlled trial of a web‐delivered personalized normative feedback intervention to reduce alcohol‐related risky sexual behavior among college students. Journal of Consulting and Clinical Psychology 2014;82(3):429‐40. [DOI] [PMC free article] [PubMed] [Google Scholar]
Murphy 2010 (Study 1) {published data only}
- Murphy JG, Dennhardt AA, Skidmore JR, Martens MP, McDevitt‐Murphy ME. Computerized versus motivational interviewing alcohol interventions: impact on discrepancy, motivation, and drinking. Psychology of Addictive Behaviors 2010;24(4):628‐39. [DOI] [PMC free article] [PubMed] [Google Scholar]
Murphy 2010 (Study 2) {published data only}
- Murphy JG, Dennhardt AA, Skidmore JR, Martens MP, McDevitt‐Murphy ME. Computerized versus motivational interviewing alcohol interventions: impact on discrepancy, motivation, and drinking. Psychology of Addictive Behaviors 2010;24(4):628‐39. [DOI] [PMC free article] [PubMed] [Google Scholar]
Neighbors 2004 {published data only}
- Neighbors C, Larimer ME, Lewis MA. Targeting misperceptions of descriptive drinking norms: efficacy of a computer‐delivered personalized normative feedback intervention. Journal of Consulting and Clinical Psychology 2004;72(3):434‐47. [DOI] [PubMed] [Google Scholar]
Neighbors 2006 {published data only}
- Neighbors C, Lewis MA, Bergstrom RL, Larimer ME. Being controlled by normative influences: self‐determination as a moderator of a normative feedback alcohol intervention. Health Psychology 2006;25(5):571‐9. [DOI] [PMC free article] [PubMed] [Google Scholar]
Neighbors 2010 {published data only}
- Neighbors C, Lewis MA, Atkins DC, Jensen MM, Walter T, Fossos N, et al. Efficacy of web‐based personalized normative feedback: a two‐year randomized controlled trial. Journal of Consulting and Clinical Psychology 2010;78(6):898‐911. [DOI] [PMC free article] [PubMed] [Google Scholar]
Neumann 2006 {published data only}
- Neumann T, Neuner B, Weiss‐Gerlach E, Tønnesen H, Gentilello LM, Wernecke KD, et al. The effect of computerized tailored brief advice on at‐risk drinking in subcritically injured trauma patients. Journal of Trauma 2006;61(4):805‐14. [DOI] [PubMed] [Google Scholar]
Palfai 2011 {published data only}
- Palfai TP, Zisserson R, Saitz R. Using personalized feedback to reduce alcohol use among hazardous drinking college students: the moderating effect of alcohol‐related negative consequences. Addictive Behaviors 2011;36(5):539‐42. [DOI] [PubMed] [Google Scholar]
Postel 2010 {published data only}
- Postel MG, Haan HA, ter Huurne ED, Becker ES, Jong CA. Effectiveness of a web‐based intervention for problem drinkers and reasons for dropout: randomized controlled trial. Journal of Medical Internet Research 2010;12(4):e68. [DOI] [PMC free article] [PubMed] [Google Scholar]
Ridout 2014 {published data only}
- Ridout B, Campbell A. Using Facebook to deliver a social norm intervention to reduce problem drinking at university. Drug and Alcohol Review 2014;33(6):667‐73. [DOI] [PubMed] [Google Scholar]
Riper 2008 {published data only}
- Riper H, Kramer J, Smit F, Conijn B, Schippers G, Cuijpers P. Web‐based self‐help for problem drinkers: a pragmatic randomized trial. Addiction 2008;103(2):218‐27. [DOI] [PubMed] [Google Scholar]
Schulz 2013 {published data only}
- Schulz DN, Candel MJ, Kremers SP, Reinwand DA, Jander A, Vries H. Effects of a web‐based tailored intervention to reduce alcohol consumption in adults: randomized controlled trial. Journal of Medical Internet Research 2013;15(9):e206. [DOI] [PMC free article] [PubMed] [Google Scholar]
Sinadinovic 2014 {published data only}
- Sinadinovic K, Wennberg P, Johansson M, Berman AH. Targeting individuals with problematic alcohol use via web‐based cognitive‐behavioral self‐help modules, personalized screening feedback or assessment only: a randomized controlled trial. European Addiction Research 2014;20(6):305‐18. [DOI] [PubMed] [Google Scholar]
Spijkerman 2010 {published data only}
- Spijkerman R, Roek MA, Vermulst A, Lemmers L, Huiberts A, Engels RC. Effectiveness of a web‐based brief alcohol intervention and added value of normative feedback in reducing underage drinking: a randomized controlled trial. Journal of Medical Internet Research 2010;12(5):e65. [DOI] [PMC free article] [PubMed] [Google Scholar]
Suffoletto 2014 {published data only}
- Suffoletto B, Kristan J, Callaway C, Kim KH, Chung T, Monti PM, et al. A text message alcohol intervention for young adult Emergency Department patients: a randomized clinical trial. Annals of Emergency Medicine 2014;64(6):664‐72. [DOI] [PMC free article] [PubMed] [Google Scholar]
Sugarman 2009 {published data only}
- Sugarman, DE. Web‐based Alcohol Feedback Intervention for Heavy Drinking College Students: Does Drinking Control Strategy Use Mediate Intervention Effects? [PhD Thesis]. Syracuse (NY): Syracuse University, 2009. [Google Scholar]
Voogt 2013a {published data only}
- Voogt CV, Kleinjan M, Poelen EA, Lemmers LA, Engels RC. The effectiveness of a web‐based brief alcohol intervention in reducing heavy drinking among adolescents aged 15‐20 years with a low educational background: a two‐arm parallel group cluster randomized controlled trial. BMC Public Health 2013;13:11. [DOI: 10.1186/1471-2458-13-694] [DOI] [PMC free article] [PubMed] [Google Scholar]
Voogt 2013b {published data only}
- Voogt CV, Poelen EA, Kleinjan M, Lemmers LA, Engels RC. The effectiveness of the 'What Do You Drink' web‐based brief alcohol intervention in reducing heavy drinking among students: a two‐arm parallel group randomized controlled trial. Alcohol and Alcoholism 2013;48(3):312‐21. [DOI] [PubMed] [Google Scholar]
Wagener 2012 {published data only}
- Wagener TL, Leffingwell TR, Mignogna J, Mignogna MR, Weaver CC, Cooney NJ, et al. Randomized trial comparing computer‐delivered and face‐to‐face personalized feedback interventions for high‐risk drinking among college students. Journal of Substance Abuse Treatment 2012;43(2):260‐7. [DOI] [PubMed] [Google Scholar]
Wallace 2011 {published data only}
- Wallace P, Murray E, McCambridge J, Khadjesari Z, White IR, Thompson SG, et al. On‐line randomized controlled trial of an internet based psychologically enhanced intervention for people with hazardous alcohol consumption. PLoS ONE 2011;6(3):e14740. [DOI] [PMC free article] [PubMed] [Google Scholar]
Walters 2009 {published data only}
- Walters ST, Vader AM, Harris TR, Field CA, Jouriles EN. Dismantling motivational interviewing and feedback for college drinkers: a randomized clinical trial. Journal of Consulting and Clinical Psychology 2009;77(1):64‐73. [DOI] [PMC free article] [PubMed] [Google Scholar]
Weaver 2014 {published data only}
- Weaver CC, Leffingwell TR, Lombardi NJ, Claborn KR, Miller ME, Martens MP. A computer‐based feedback only intervention with and without a moderation skills component. Journal of Substance Abuse Treatment 2014;46(1):22‐8. [DOI] [PMC free article] [PubMed] [Google Scholar]
Witkiewitz 2014 {published data only}
- Witkiewitz K, Kirouac M, Desai SA, Bowen S, Leigh BC, Larimer ME. Development and evaluation of a mobile intervention for heavy drinking and smoking among college students. Psychology of Addictive Behaviors 2014;28(3):639‐50. [DOI] [PMC free article] [PubMed] [Google Scholar]
References to studies excluded from this review
Alessi 2013 {published data only}
- Alessi SM, Petry NM. A randomized study of cellphone technology to reinforce alcohol abstinence in the natural environment. Addiction 2013;108(5):900‐9. [DOI] [PMC free article] [PubMed] [Google Scholar]
An 2013 {published data only}
- An LC, Demers MR, Kirch MA, Considine‐Dunn S, Nair V, Dasgupta K, et al. A randomized trial of an avatar‐hosted multiple behavior change intervention for young adult smokers. Journal of the National Cancer Institute. Monographs 2013;2013(47):209‐15. [DOI] [PMC free article] [PubMed] [Google Scholar]
Bendtsen 2012 {published data only}
- Bendtsen P, McCambridge J, Bendtsen M, Karlsson N, Nilsen P. Effectiveness of a proactive mail‐based alcohol Internet intervention for university students: dismantling the assessment and feedback components in a randomized controlled trial. Journal of Medical Internet Research 2012;14(5):e142. [DOI] [PMC free article] [PubMed] [Google Scholar]
Bersamin 2007 {published data only}
- Bersamin M, Paschall MJ, Fearnow‐Kenney M, Wyrick D. Effectiveness of a web‐based alcohol‐misuse and harm‐prevention course among high‐ and low‐risk students. Journal of American College Health 2007;55(4):247‐54. [DOI] [PubMed] [Google Scholar]
Bewick 2008 {published data only}
- Bewick BM, Trusler K, Mulhern B, Barkham M, Hill AJ. The feasibility and effectiveness of a web‐based personalised feedback and social norms alcohol intervention in UK university students: a randomised control trial. Addictive Behaviors 2008;33(9):1192‐8. [DOI] [PubMed] [Google Scholar]
Bewick 2010 {published data only}
- Bewick BM, West R, Gill J, O'May F, Mulhern B, Barkham M, et al. Providing web‐based feedback and social norms information to reduce student alcohol intake: a multisite investigation. Journal of Medical Internet Research 2010;12(5):e59. [DOI] [PMC free article] [PubMed] [Google Scholar]
Bewick 2013 {published data only}
- Bewick BM, West RM, Barkham M, Mulhern B, Marlow R, Traviss G, et al. The effectiveness of a web‐based personalized feedback and social norms alcohol intervention on United Kingdom university students: randomized controlled trial. Journal of Medical Internet Research 2013;15(7):e137. [DOI] [PMC free article] [PubMed] [Google Scholar]
Bingham 2010 {published data only}
- Bingham CR, Barretto AI, Walton MA, Bryant CM, Shope JT, Raghunathan TE. Efficacy of a web‐based, tailored, alcohol prevention/intervention program for college students: initial findings. Journal of American College Health 2010;58(4):349‐56. [DOI] [PubMed] [Google Scholar]
Bischof 2008 {published data only}
- Bischof G, Grothues JM, Reinhardt S, Meyer C, John U, Rumpf HJ. Evaluation of a telephone‐based stepped care intervention for alcohol‐related disorders: a randomized controlled trial. Drug and Alcohol Dependence 2008;93(3):244‐51. [DOI] [PubMed] [Google Scholar]
Bryant 2013 {published data only}
- Bryant ZE, Henslee AM, Correia CJ. Testing the effects of e‐mailed personalized feedback on risky alcohol use among college students. Addictive Behaviors 2013;38(10):2563‐7. [DOI] [PubMed] [Google Scholar]
Coleman 2010 {published data only}
- Coleman L, Ramm J, Cooke R. The effectiveness of an innovative intervention aimed at reducing binge drinking among young people: results from a pilot study. Drugs: Education, Prevention and Policy 2010;17(4):413‐30. [Google Scholar]
Croom 2009 {published data only}
- Croom K, Lewis D, Marchell T, Lesser ML, Reyna VF, Kubicki‐Bedford L, et al. Impact of an online alcohol education course on behavior and harm for incoming first‐year college students: short‐term evaluation of a randomized trial. Journal of American College Health 2009;57(4):445‐54. [DOI] [PubMed] [Google Scholar]
Cunningham 2005 {published data only}
- Cunningham JA, Humphreys K, Koski‐Jannes A, Cordingley J. Internet and paper self‐help materials for problem drinking: is there an additive effect?. Addictive Behaviors 2005;30(8):1517‐23. [DOI] [PubMed] [Google Scholar]
Cunningham 2009b {published data only}
- Cunningham RM, Chermack ST, Zimmerman MA, Shope JT, Bingham CR, Blow FC, et al. Brief motivational interviewing intervention for peer violence and alcohol use in teens: one‐year follow‐up. Pediatrics 2012;129(6):1083‐90. [DOI] [PMC free article] [PubMed] [Google Scholar]
- Cunningham RM, Walton MA, Goldstein A, Chermack ST, Shope JT, Bingham CR, et al. Three‐month follow‐up of brief computerized and therapist interventions for alcohol and violence among teens. Academic Emergency Medicine 2009;16(11):1193‐207. [DOI] [PMC free article] [PubMed] [Google Scholar]
Cunningham 2012 {published data only}
- Cunningham JA. Comparison of two internet‐based interventions for problem drinkers: randomized controlled trial. Journal of Medical Internet Research 2012;14(4):e107. [DOI] [PMC free article] [PubMed] [Google Scholar]
Dickinson 2013 {published data only}
- Dickinson WP, Glasgow RE, Fisher L, Dickinson LM, Christensen SM, Estabrooks PA, et al. Use of a website to accomplish health behavior change: if you build it, will they come? And will it work if they do?. Journal of the American Board of Family Medicine 2013;26(2):168‐76. [DOI] [PubMed] [Google Scholar]
Dimeff 2000 {published data only}
- Dimeff LA. Brief Intervention for Heavy and Hazardous College Drinkers in a Student Primary Health Care Setting (PhD Thesis). Seattle (WA): University of Washington, 1998. [Google Scholar]
- Dimeff LA. Brief alcohol screening and intervention for college students (BASICS): A harm reduction approach. Vol. Brief Alcohol Screening and Intervention for College, Guilford Press, 1999. [Google Scholar]
- Dimeff LA, McNeely M. Computer‐enhanced primary care practitioner advice for high‐risk college drinkers in a student primary health‐care setting. Cognitive and Behavioral Practice 2000;7(1):82‐100. [Google Scholar]
Donohue 2004 {published data only}
- Donohue B, Allen DN, Maurer A, Ozols J, DeStefano G. A controlled evaluation of two prevention programs in reducing alcohol use among college students at low and high risk for alcohol related problems. Journal of Alcohol and Drug Education 2004;48(1):13‐33. [Google Scholar]
Doumas 2008 {published data only}
- Doumas DM, Haustveit T. Reducing heavy drinking in intercollegiate athletes: evaluation of a web‐based personalized feedback program. Sport Psychologist 2008;22(2):212‐28. [Google Scholar]
Doumas 2009 {published data only}
- Doumas DM, Andersen LL. Reducing alcohol use in first‐year university students: evaluation of a web‐based personalized feedback program. Journal of College Counseling 2009;12(1):18‐32. [Google Scholar]
Doumas 2014 {published data only}
- Doumas DM, Esp S, Turrisi R, Hausheer R, Cuffee C. A test of the efficacy of a brief, web‐based personalized feedback intervention to reduce drinking among 9th grade students. Addictive Behaviors 2014;39(1):231‐8. [DOI] [PubMed] [Google Scholar]
- Doumas DM, Hausheer R, Esp S, Cuffee C. Reducing alcohol use among 9th grade students: 6 month outcomes of a brief, Web‐based intervention. Journal of Substance Abuse Treatment 2014;47(1):102‐5. [DOI] [PubMed] [Google Scholar]
Eltringham 1990 {published data only}
- Eltringham A, Barber JG. Can microcomputers help the problem drinker?. Drug and Alcohol Review 1990;9(2):169‐76. [DOI] [PubMed] [Google Scholar]
Epton 2014 {published data only}
- Epton T, Norman P, Dadzie AS, Harris PR, Webb TL, Sheeran P, et al. A theory‐based online health behaviour intervention for new university students (U@Uni): results from a randomised controlled trial. BMC Public Health 2014;14:563. [DOI: 10.1186/1471-2458-14-563] [DOI] [PMC free article] [PubMed] [Google Scholar]
Evans 2012 {published data only}
- Evans WD, Wallace JL, Snider J. Pilot evaluation of the text4baby mobile health program. BMC Public Health 2012;12:1031. [DOI: 10.1186/1471-2458-12-1031] [DOI] [PMC free article] [PubMed] [Google Scholar]
Evers 2012 {published data only}
- Evers KE, Paiva AL, Johnson JL, Cummins CO, Prochaska JO, Prochaska JM, et al. Results of a transtheoretical model‐based alcohol, tobacco and other drug intervention in middle schools. Addictive Behaviors 2012;37(9):1009‐18. [DOI] [PubMed] [Google Scholar]
Fang 2010 {published data only}
- Fang L, Schinke SP, Cole KC. Preventing substance use among early Asian‐American adolescent girls: initial evaluation of a web‐based, mother‐daughter program. Journal of Adolescent Health 2010;47(5):529‐32. [DOI] [PMC free article] [PubMed] [Google Scholar]
Farrer 2012 {published data only}
- Farrer L, Christensen H, Griffiths KM, Mackinnon A. Web‐based cognitive behavior therapy for depression with and without telephone tracking in a national helpline: secondary outcomes from a randomized controlled trial. Journal of Medical Internet Research 2012;14(3):e68. [DOI] [PMC free article] [PubMed] [Google Scholar]
Finfgeld‐Connett 2008 {published data only}
- Finfgeld‐Connett D, Madsen R. Web‐based treatment of alcohol problems among rural women. Journal of Psychosocial Nursing and Mental Health Services 2008;46(9):46‐53. [DOI] [PMC free article] [PubMed] [Google Scholar]
Gregor 2003 {published data only}
- Gregor MA, Shope JT, Blow FC, Maio RF, Weber JE, Nypaver MM. Feasibility of using an interactive laptop program in the Emergency Department to prevent alcohol misuse among adolescents. Annals of Emergency Medicine 2003;42(2):276‐84. [DOI] [PubMed] [Google Scholar]
Hasin 2013 {published data only}
- Hasin DS, Aharonovich E, O'Leary A, Greenstein E, Pavlicova M, Arunajadai S, et al. Reducing heavy drinking in HIV primary care: a randomized trial of brief intervention, with and without technological enhancement. Addiction 2013;108(7):1230‐40. [DOI] [PMC free article] [PubMed] [Google Scholar]
Hendershot 2010 {published data only}
- Hendershot CS, Collins SE, Otto JM, Wall TL, Liang T. A brief web‐based feedback intervention for reducing alcohol‐related health risks associated with ALDH2 genotype. Alcoholism ‐ Clinical and Experimental Research 2010;34:255A. [DOI] [PMC free article] [PubMed] [Google Scholar]
Hester 2009 {published data only}
- Hester RK, Delaney HD, Campbell W. ModerateDrinking.Com and moderation management: outcomes of a randomized clinical trial with non‐dependent problem drinkers. Journal of Consulting and Clinical Psychology 2011;79(2):215‐24. [DOI] [PMC free article] [PubMed] [Google Scholar]
- Hester RK, Delaney HD, Campbell W, Handmaker N. A web application for moderation training: initial results of a randomized clinical trial. Journal of Substance Abuse Treatment 2009;37(3):266‐76. [DOI] [PMC free article] [PubMed] [Google Scholar]
Hustad 2010 {published data only}
- Hustad JT, Borsari B. Web‐based screening and brief motivational intervention reduces alcohol use in heavy‐drinking undergraduates at up to 6 months. Evidence Based Medicine 2010;15(1):17‐8. [DOI] [PMC free article] [PubMed] [Google Scholar]
Jouriles 2010 {published data only}
- Jouriles EN, Brown AS, Rosenfield D, McDonald R, Croft K, Leahy MM, et al. Improving the effectiveness of computer‐delivered personalized drinking feedback interventions for college students. Psychology of Addictive Behaviors 2010;24(4):592‐9. [DOI] [PubMed] [Google Scholar]
Kay‐Lambkin 2009 {published data only}
- Kay‐Lambkin FJ, Baker AL, Lewin TJ, Carr VJ. Computer‐based psychological treatment for comorbid depression and problematic alcohol and/or cannabis use: a randomized controlled trial of clinical efficacy. Addiction 2009;104(3):378‐88. [DOI] [PubMed] [Google Scholar]
Kay‐Lambkin 2011 {published data only}
- Kay‐Lambkin FJ, Baker AL, Kelly B, Lewin TJ. Clinician‐assisted computerised versus therapist‐delivered treatment for depressive and addictive disorders: a randomised controlled trial. Medical Journal of Australia 2011;195(3):S44‐50. [DOI] [PubMed] [Google Scholar]
Keurhorst 2013 {published data only}
- Keurhorst MN, Anderson P, Spak F, Bendtsen P, Segura L, Colom J, et al. Implementing training and support, financial reimbursement, and referral to an internet‐based brief advice program to improve the early identification of hazardous and harmful alcohol consumption in primary care (ODHIN): study protocol for a cluster randomized factorial trial. Implementation Science 2013;8:11. [DOI: 10.1186/1748-5908-8-11] [DOI] [PMC free article] [PubMed] [Google Scholar]
Kypri 2004 {published data only}
- Kypri K, Saunders JB, Williams SM, McGee RO, Langley JD, Cashell‐Smith ML, et al. Web‐based screening and brief intervention for hazardous drinking: a double‐blind randomized controlled trial. Addiction 2004;99(11):1410‐7. [DOI] [PubMed] [Google Scholar]
Kypri 2005 {published data only}
- Kypri K, McAnally HM. Randomized controlled trial of a web‐based primary care intervention for multiple health risk behaviors. Preventive Medicine 2005;41(3‐4):761‐6. [DOI] [PubMed] [Google Scholar]
LaBrie 2008 {published data only}
- LaBrie JW, Hummer JF, Neighbors C, Pedersen ER. Live interactive group‐specific normative feedback reduces misperceptions and drinking in college students: a randomized cluster trial. Psychology of Addictive Behaviors 2008;22(1):141‐8. [DOI] [PMC free article] [PubMed] [Google Scholar]
Lana 2014 {published data only}
- Lana A, Faya‐Ornia G, López ML. Impact of a web‐based intervention supplemented with text messages to improve cancer prevention behaviors among adolescents: results from a randomized controlled trial. Preventive Medicine 2014;59:54‐9. [DOI] [PubMed] [Google Scholar]
Lane 2012 {published data only}
- Lane DJ, Lindemann DF, Schmidt JA. A comparison of computer‐assisted and self‐management programs for reducing alcohol use among students in first year experience courses. Journal of Drug Education 2012;42(2):119‐35. [DOI] [PubMed] [Google Scholar]
Lovecchio 2010 {published data only}
- Lovecchio CP, Wyatt TM, DeJong W. Reductions in drinking and alcohol‐related harms reported by first‐year college students taking an online alcohol education course: a randomized trial. Journal of Health Communication 2010;15(7):805‐19. [DOI] [PubMed] [Google Scholar]
Maio 2005 {published data only}
- Maio RF, Shope JT, Blow FC, Gregor MA, Zakrajsek JS, Weber JE, et al. A randomized controlled trial of an emergency department‐based interactive computer program to prevent alcohol misuse among injured adolescents. Annals of Emergency Medicine 2005;45(4):420‐9. [DOI] [PubMed] [Google Scholar]
Martens 2010 {published data only}
- Martens MP, Kilmer JR, Beck NC, Zamboanga BL. The efficacy of a targeted personalized drinking feedback intervention among intercollegiate athletes: a randomized controlled trial. Psychology of Addictive Behaviors 2010;24(4):660‐9. [DOI] [PubMed] [Google Scholar]
Mason 2014 {published data only}
- Mason M, Benotsch EG, Way T, Kim H, Snipes D. Text messaging to increase readiness to change alcohol use in college students. Journal of Primary Prevention 2014;35(1):47‐52. [DOI] [PubMed] [Google Scholar]
Matano 2007 {published data only}
- Matano RA, Koopman C, Wanat SF, Winzelberg AJ, Whitsell SD, Westrup D, et al. A pilot study of an interactive web site in the workplace for reducing alcohol consumption. Journal of Substance Abuse Treatment 2007;32(1):71‐80. [DOI] [PubMed] [Google Scholar]
McCambridge 2013 {published data only}
- McCambridge J, Bendtsen M, Karlsson N, White IR, Nilsen P, Bendtsen P. Alcohol assessment and feedback by email for university students: main findings from a randomised controlled trial. British Journal of Psychiatry 2013;203(5):334‐40. [DOI] [PMC free article] [PubMed] [Google Scholar]
Meier 1988 {published data only}
- Meier ST. Alcohol education through computer‐assisted instruction. Journal of Counseling and Development 1988;66:389‐90. [Google Scholar]
Moore 2013 {published data only}
- Moore SC, Crompton K, Goozen S, Bree M, Bunney J, Lydall E. A feasibility study of short message service text messaging as a surveillance tool for alcohol consumption and vehicle for interventions in university students. BMC Public Health 2013;13:1011. [DOI: 10.1186/1471-2458-13-1011] [DOI] [PMC free article] [PubMed] [Google Scholar]
Moreira 2012 {published data only}
- Moreira MT, Oskrochi R, Foxcroft DR. Personalised normative feedback for preventing alcohol misuse in university students: Solomon three‐group randomised controlled trial. PLoS One 2012;7(9):e44120. [DOI] [PMC free article] [PubMed] [Google Scholar]
Palfai 2014 {published data only}
- Palfai TP, Winter M, Lu J, Rosenbloom D, Saitz R. Personalized feedback as a universal prevention approach for college drinking: a randomized trial of an e‐mail linked universal web‐based alcohol intervention. Journal of Primary Prevention 2014;35(2):75‐84. [DOI] [PMC free article] [PubMed] [Google Scholar]
Parekh 2014 {published data only}
- Parekh S, King D, Boyle FM, Vandelanotte C. Randomized controlled trial of a computer‐tailored multiple health behaviour intervention in general practice: 12‐month follow‐up results. International Journal of Behavioral Nutrition and Physical Activity 2014;11(1):41. [DOI] [PMC free article] [PubMed] [Google Scholar]
Paschall 2006 {published data only}
- Paschall MJ, Bersamin M, Fearnow‐Kenney M, Wyrick D, Currey D. Short‐term evaluation of a web‐based college alcohol misuse and harm prevention course (College Alc). Journal of Alcohol and Drug Education 2006;50(3):49‐65. [Google Scholar]
Paschall 2011 {published data only}
- Paschall MJ, Antin T, Ringwalt CL, Saltz RF. Evaluation of an internet‐based alcohol misuse prevention course for college freshmen: findings of a randomized multi‐campus trial. American Journal of Preventive Medicine 2011;41(3):300‐8. [DOI] [PMC free article] [PubMed] [Google Scholar]
Pemberton 2011 {published data only}
- Pemberton MR, Williams J, Herman‐Stahl M, Calvin SL, Bradshaw MR, Bray RM, et al. Evaluation of two web‐based alcohol interventions in the U.S. military. Journal of Studies on Alcohol and Drugs 2011;72(3):480‐9. [DOI] [PubMed] [Google Scholar]
Postel 2010a {published data only}
- Postel MG, Haan HA, Jong CA. Evaluation of an e‐therapy program for problem drinkers: a pilot study. Substance Use and Misuse 2010;45(12):2059‐75. [DOI] [PubMed] [Google Scholar]
Reis 2000 {published data only}
- Reis J, Riley W, Lokman L, Baer J. Interactive multimedia preventive alcohol education: a technology application in higher education. Journal of Drug Education 2000;30(4):399‐421. [DOI] [PubMed] [Google Scholar]
Reis 2002 {published data only}
- Reis J, Riley W. Assessment of a computer‐supported alcohol education intervention program. Health Education 2002;102(3):124‐32. [Google Scholar]
Rhodes 2001 {published data only}
- Rhodes KV, Lauderdale DS, Stocking CB, Howes DS, Roizen MF, Levinson W. Better health while you wait: a controlled trial of a computer‐based intervention for screening and health promotion in the emergency department. Annals of Emergency Medicine 2001;37(3):284‐91. [DOI] [PubMed] [Google Scholar]
Saitz 2007 {published data only}
- Saitz R, Palfai TP, Freedner N, Winter MR, Macdonald A, Lu J, et al. Screening and brief intervention online for college students: the ihealth study. Alcohol and Alcoholism 2007;42(1):28‐36. [DOI] [PubMed] [Google Scholar]
Schinke 2005 {published data only}
- Schinke S, Schwinn T. Gender‐specific computer‐based intervention for preventing drug abuse among girls. American Journal of Drug and Alcohol Abuse 2005;31(4):609‐16. [DOI] [PMC free article] [PubMed] [Google Scholar]
Schinke 2005a {published data only}
- Schinke SP, Schwinn TM, Ozanian AJ. Alcohol abuse prevention among high‐risk youth: computer‐based intervention. Journal of Prevention and Intervention in the Community 2005;29(1‐2):117‐30. [DOI] [PMC free article] [PubMed] [Google Scholar]
Schinke 2009 {published data only}
- Schinke SP, Fang L, Cole KC. Computer‐delivered, parent‐involvement intervention to prevent substance use among adolescent girls. Preventive Medicine 2009;49(5):429‐35. [DOI] [PMC free article] [PubMed] [Google Scholar]
Schuckit 2012 {published data only}
- Schuckit MA, Kalmijn JA, Smith TL, Saunders G, Fromme K. Structuring a college alcohol prevention program on the low level of response to alcohol model: a pilot study. Alcoholism, Clinical and Experimental Research 2012;36(7):1244‐52. [DOI] [PubMed] [Google Scholar]
Schulz 2014b {published data only}
- Schulz DN, Kremers SP, Vandelanotte C, Adrichem MJ, Schneider F, Candel MJ, et al. Effects of a web‐based tailored multiple‐lifestyle intervention for adults: a two‐year randomized controlled trial comparing sequential and simultaneous delivery modes. Journal of Medical Internet Research 2014;16(1):e26. [DOI] [PMC free article] [PubMed] [Google Scholar]
Sharmer 2001 {published data only}
- Sharmer L. Evaluation of alcohol education programs on attitude, knowledge, and self‐reported behavior of college students. Evaluation and the Health Professions 2001;24(3):336‐57. [DOI] [PubMed] [Google Scholar]
Suffoletto 2012 {published data only}
- Suffoletto B, Callaway C, Kristan J, Kraemer K, Clark DB. Text‐message‐based drinking assessments and brief interventions for young adults discharged from the emergency department. Alcoholism, Clinical and Experimental Research 2012;36(3):552‐60. [DOI] [PubMed] [Google Scholar]
Swan 2009 {published data only}
- Swan AJ, Tyssen EG. Enhancing treatment access: evaluation of an Australian web‐based alcohol and drug counselling initiative. Drug and Alcohol Review 2009;28(1):48‐53. [DOI] [PubMed] [Google Scholar]
Tensil 2013 {published data only}
- Tensil MD, Jonas B, Struber E. Two fully automated web‐based interventions for risky alcohol use: randomized controlled trial. Journal of Medical Internet Research 2013;15(6):e110. [DOI] [PMC free article] [PubMed] [Google Scholar]
Thombs 2007 {published data only}
- Thombs DL, Olds SR, Osborn CJ, Casseday S, Glavin K, Berkowitz AD. Outcomes of a technology‐based social norms intervention to deter alcohol use in freshman residence halls. Journal of American College Health 2007;55(6):325‐32. [DOI] [PubMed] [Google Scholar]
Trinks 2010 {published data only}
- Trinks A, Festin K, Bendtsen P, Nilsen P. Reach and effectiveness of a computer‐based alcohol intervention in a Swedish emergency room. International Emergency Nursing 2010;18(3):138‐46. [DOI] [PubMed] [Google Scholar]
Tzilos 2011 {published data only}
- Tzilos GK, Sokol RJ, Ondersma SJ. A randomized phase I trial of a brief computer‐delivered intervention for alcohol use during pregnancy. Journal of Women's Health 2011;20(10):1517‐24. [DOI] [PMC free article] [PubMed] [Google Scholar]
Vinson 2000 {published data only}
- Vinson DC, Devera‐Sales A. Computer‐generated written behavioral contracts with problem drinkers in primary medical care. Substance Abuse 2000;21(4):215‐22. [DOI] [PubMed] [Google Scholar]
Vogl 2009 {published data only}
- Vogl L, Teesson M, Andrews G, Bird K, Steadman B, Dillon P. A computerized harm minimization prevention program for alcohol misuse and related harms: randomized controlled trial. Addiction 2009;104(4):564‐75. [DOI] [PubMed] [Google Scholar]
Walters 2007 {published data only}
- Walters ST, Vader AM, Harris TR. A controlled trial of web‐based feedback for heavy drinking college students. Prevention Science 2007;8(1):83‐8. [DOI] [PubMed] [Google Scholar]
Walton 2010 {published data only}
- Walton MA, Chermack ST, Shope JT, Bingham CR, Zimmerman MA, Blow FC, et al. Effects of a brief intervention for reducing violence and alcohol misuse among adolescents: a randomized controlled trial. JAMA 2010;304(5):527‐35. [DOI] [PMC free article] [PubMed] [Google Scholar]
Weitzel 2007 {published data only}
- Weitzel JA, Bernhardt JM, Usdan S, Mays D, Glanz K. Using wireless handheld computers and tailored text messaging to reduce negative consequences of drinking alcohol. Journal of Studies on Alcohol and Drugs 2007;68(4):534‐7. [DOI] [PubMed] [Google Scholar]
References to studies awaiting assessment
Acosta 2017 {published data only}
- Acosta MC, Possemato K, Maisto SA, Marsch LA, Barrie K, Lantinga L. Web‐delivered CBT reduces heavy drinking in OEF‐OIF veterans in primary care with symptomatic substance use and PTSD. Behavior Therapy 2017;48(2):262‐76. [DOI] [PMC free article] [PubMed] [Google Scholar]
Balestrieri 2016 {published data only}
- Balestrieri SG, Miller MB, DiBello AM, Merrill JE, Benz MB, Lowery AD, et al. Evaluating the efficacy of a computer‐delivered brief alcohol intervention among college students living off‐campus. Alcoholism, Clinical and Experimental Research 2016;40(Suppl 1):62a. [Google Scholar]
Bock 2016 {published data only}
- Bock BC, Barnett NP, Thind H, Rosen R, Walaska K, Traficante R, et al. A text message intervention for alcohol risk reduction among community college students: TMAP. Addictive Behaviors 2016;63:107‐13. [DOI: 10.1016/j.addbeh.2016.07.012] [DOI] [PMC free article] [PubMed] [Google Scholar]
Duroy 2016 {published data only}
- Duroy D, Boutron I, Baron G, Ravaud P, Estellat C, Lejoyeux M. Impact of a computer‐assisted Screening, Brief Intervention and Referral to Treatment on reducing alcohol consumption among patients with hazardous drinking disorder in hospital Emergency Departments. The randomized BREVALCO trial. Drug and Alcohol Dependence 2016;165:236‐44. [DOI: 10.1016/j.drugalcdep.2016.06.018] [DOI] [PubMed] [Google Scholar]
Gajecki 2017 {published data only}
- Gajecki M, Andersson C, Rosendahl, Sinadinovic K, Fredriksson M, Berman AH. Skills training via smartphone app for university students with excessive alcohol consumption: a randomized controlled trial. International Journal of Behavioral Medicine 2017 Feb 21 [Epub ahead of print]. [DOI: 10.1007/s12529-016-9629-9] [DOI] [PMC free article] [PubMed]
Leeman 2016 {published data only}
- Leeman RF, DeMartini KS, Gueorguieva R, Nogueira C, Corbin WR, Neighbors C, et al. Randomized controlled trial of a very brief, multicomponent web‐based alcohol intervention for undergraduates with a focus on protective behavioral strategies. Journal of Consulting and Clinical Psychology 2016;84(11):1008‐15. [DOI] [PMC free article] [PubMed] [Google Scholar]
Muench 2017 {published data only}
- Muench F, Stolk‐Cooke K, Kuerbis A, Stadler G, Baumel A, Shao S, et al. A randomized controlled pilot trial of different mobile messaging interventions for problem drinking compared to weekly drink tracking. PLoS ONE 2017;12(2):e0167900. [DOI] [PMC free article] [PubMed] [Google Scholar]
Ondersma 2016 {published data only}
- Ondersma SJ, Svikis DS, Thacker LR, Beatty JR, Lockhart N. A randomised trial of a computer‐delivered screening and brief intervention for postpartum alcohol use. Drug and Alcohol Review 2016;35(6):710‐8. [DOI] [PMC free article] [PubMed] [Google Scholar]
References to ongoing studies
ISRCTN10323951 {published data only}
- ISRCTN10323951. Testing the effectiveness of two web‐based interventions aiming to reduce alcohol consumption. http://www.isrctn.com/ISRCTN10323951 (first received 7th September 2015).
- Schaub MP, Blankers M, Lehr D, Boss L, Riper H, Dekker J, et al. Efficacy of an internet‐based self‐help intervention to reduce co‐occurring alcohol misuse and depression symptoms in adults: study protocol of a three‐arm randomised controlled trial. BMJ Open 2016;6(5):e011457. [DOI] [PMC free article] [PubMed] [Google Scholar]
ISRCTN40104069 {published data only}
- Garnett C, Crane D, Michie S, West R, Brown J. Evaluating the effectiveness of a smartphone app to reduce excessive alcohol consumption: protocol for a factorial randomised control trial. BMC Public Health 2016;16:536. [DOI: 10.1186/s12889-016-3140-8] [DOI] [PMC free article] [PubMed] [Google Scholar]
- ISRCTN40104069. Evaluating the effectiveness of a smartphone app to reduce alcohol consumption in hazardous and/or harmful drinkers. http://www.isrctn.com/ISRCTN40104069 (first received 10 February 2016).
ISRCTN45300218 {published data only}
- Deluca P, Coulton S, Alam MF, Cohen D, Donoghue K, Gilvarry E, et al. Linked randomised controlled trials of face‐to‐face and electronic brief intervention methods to prevent alcohol related harm in young people aged 14‐17 years presenting to Emergency Departments (SIPS Junior). BMC Public Health 2015;15(1):345. [DOI] [PMC free article] [PubMed] [Google Scholar]
- ISRCTN45300218. Developing and evaluating interventions for adolescents with alcohol use disorders who present through emergency departments: randomised feasibility study and exploratory randomised controlled trial. http://www.isrctn.com/ISRCTN45300218 (first received 5th June 2014).
NCT02064998 {published data only}
- Berman AH, Gajecki M, Fredriksson M, Sinadinovic K, Andersson C. Mobile phone apps for university students with hazardous alcohol use: study protocol for two consecutive randomized controlled trials. JMIR Research Protocols 2015;4(4):e139. [DOI] [PMC free article] [PubMed] [Google Scholar]
- NCT02064998. Two consecutive randomized controlled trials using mobile phone applications for risky alcohol use. https://clinicaltrials.gov/ct2/show/NCT02064998?term=NCT02064998&rank=1 (first received 14th February 2014).
Additional references
Abood 2003
- Abood DA, Black DR, Feral D. Nutrition education worksite intervention for university staff: application of the health belief model. Journal of Nutrition Education and Behavior 2003;35(5):260‐7. [DOI] [PubMed] [Google Scholar]
Abraham 2008
- Abraham C, Michie S. A taxonomy of Behavior Change Techniques used in interventions. Health Psychology 2008;27(3):379‐87. [DOI] [PubMed] [Google Scholar]
Angus 2014
- Angus C, Latimer N, Preston L, Li J, Purshouse R. What are the implications for policy makers? A systematic review of the cost‐effectiveness of screening and brief interventions for alcohol misuse in primary care. Frontiers in Psychiatry 2014;5:114. [DOI: 10.3389/fpsyt.2014.00114] [DOI] [PMC free article] [PubMed] [Google Scholar]
Araújo‐Soares 2009
- Araújo‐Soares V, McIntyre T, MacLennan G, Sniehotta FF. Development and exploratory cluster‐randomised opportunistic trial of a theory‐based intervention to enhance physical activity among adolescents. Psychology and Health 2009;24(7):805‐22. [DOI] [PubMed] [Google Scholar]
Balhara 2014
- Balhara Y, Verma R. A review of web based interventions focusing on alcohol use. Annals of Medical and Health Sciences Research 2014;4(4):472‐80. [DOI] [PMC free article] [PubMed] [Google Scholar]
Bewick 2008a
- Bewick BM, Trusler K, Barkham M, Hill AJ, Cahill J, Mulhern B. The effectiveness of web‐based interventions designed to decrease alcohol consumption ‐ a systematic review. Preventive Medicine 2008;47(1):17‐26. [DOI] [PubMed] [Google Scholar]
Beyer 2015
- Beyer FR, Maniatopoulos G, Kaner EFS, Michie S, Hickman M. Engagement with digital interventions for reducing hazardous or harmful alcohol consumption in community‐dwelling populations: a systematic review [PROSPERO 2015:CRD42015019790]. www.crd.york.ac.uk/PROSPERO/display_record.asp?ID=CRD42015019790 (accessed prior to 14 August 2017).
Bhochhibhoya 2015
- Bhochhibhoya A, Hayes L, Branscum P, Taylor L. The use of the internet for prevention of binge drinking among the college population: a systematic review of evidence. Alcohol and Alcoholism 2015;50(5):526‐35. [DOI] [PubMed] [Google Scholar]
Black 2016
- Black N, Mullan B, Sharpe L. Computer‐delivered interventions for reducing alcohol consumption: meta‐analysis and meta‐regression using behaviour change techniques and theory. Health Psychology Review 2016;10(3):341‐57. [DOI] [PubMed] [Google Scholar]
Blankers 2012
- Blankers M, Nabitz U, Smit F, Koeter MW, Schippers GM. Economic evaluation of internet‐based interventions for harmful alcohol use alongside a pragmatic randomized controlled trial. Journal of Medical Internet Research 2012;14(5):e134. [DOI] [PMC free article] [PubMed] [Google Scholar]
Brown 2016
- Brown J, West R, Angus C, Beard E, Brennan A, Drummond C, et al. Comparison of brief interventions in primary care on smoking and excessive alcohol consumption: a population survey in England. British Journal of General Practice 2016;66(642):e1‐9. [DOI] [PMC free article] [PubMed] [Google Scholar]
Byrt 1993
- Byrt T, Bishop J, Carlin JB. Bias, prevalence and kappa. Journal of Clinical Epidemiology 1993;46(5):423‐9. [DOI] [PubMed] [Google Scholar]
Carey 2009a
- Carey KB, Scott‐Sheldon LAJ, Elliott JC, Bolles JR, Carey MP. Computer‐delivered interventions to reduce college student drinking: a meta‐analysis. Addiction 2009;104(11):1807‐19. [DOI] [PMC free article] [PubMed] [Google Scholar]
Carey 2012
- Carey KB, Scott‐Sheldon LA, Elliott JC, Garey L, Carey MP. Face‐to‐face versus computer‐delivered alcohol interventions for college drinkers: a meta‐analytic review, 1998 to 2010. Clinical Psychology Review 2012;32(8):690‐703. [DOI] [PMC free article] [PubMed] [Google Scholar]
Coulton 2006
- Coulton S, Drummond C, James D, Godfrey C, Bland JM, Parrott S, et al. Opportunistic screening for alcohol use disorders in primary care: comparative study. British Medical Journal 2006;332(7540):511‐7. [DOI] [PMC free article] [PubMed] [Google Scholar]
Crane 2015
- Crane D, Garnett C, Brown J, West R, Michie S. Behavior change techniques in popular alcohol reduction apps: content analysis. Journal of Medical Internet Research 2015;17(5):e118. [DOI] [PMC free article] [PubMed] [Google Scholar]
Dedert 2015
- Dedert EA, McDuffie JR, Stein R, McNiel J, Kosinski AS, Freiermuth CE, et al. Electronic interventions for alcohol misuse and alcohol use disorders a systematic review of e‐interventions for alcohol misuse and alcohol use disorders. Annals of Internal Medicine 2015;163(3):205‐14. [DOI] [PMC free article] [PubMed] [Google Scholar]
Deeks 2001
- Deeks JJ, Altman DG, Bradburn MJ. Chapter 15: Statistical methods for examining heterogeneity and combining results from several studies in meta‐analysis. Systematic Reviews in Health Care. 2nd Edition. London: BMJ Books, 2001:285‐312. [Google Scholar]
Devlin 2010
- Devlin N, Parkin D, Browne J. Using the EQ‐5D as a performance measurement tool in the NHS. Health Economics 2010;19(8):886‐905. [DOI] [PubMed] [Google Scholar]
Direito 2014
- Direito A, Dale LP, Shields E, Dobson R, Whittaker R, Maddison R. Do physical activity and dietary smartphone applications incorporate evidence‐based behaviour change techniques?. BMC Public Health 2014;14:1‐7. [DOI: 10.1186/1471-2458-14-646] [DOI] [PMC free article] [PubMed] [Google Scholar]
Dombrowski 2012
- Dombrowski SU, Sniehotta FF, Avenell A, Johnston M, MacLennan G, Araújo‐Soares V. Identifying active ingredients in complex behavioural interventions for obese adults with obesity‐related co‐morbidities or additional risk factors for co‐morbidities: a systematic review. Health Psychology Review 2012;6(1):7‐32. [Google Scholar]
Donoghue 2014
- Donoghue K, Patton R, Phillips T, Deluca P, Drummond C. The effectiveness of electronic screening and brief intervention for reducing levels of alcohol consumption: a systematic review and meta‐analysis. Journal of Medical Internet Research 2014;16(6):e142. [DOI] [PMC free article] [PubMed] [Google Scholar]
Dotson 2015
- Dotson KB, Dunn ME, Bowers CA. Stand‐alone personalized normative feedback for college student drinkers: a meta‐analytic review, 2004 to 2014. PLoS ONE 2015;10(10):e0139518. [DOI] [PMC free article] [PubMed] [Google Scholar]
Drummond 2005
- Drummond MF, Sculpher MJ, Torrance GW, O'Brien BJ, Syoddart GL. Methods for the Economic Evaluation of Health Care Programmes. 3rd Edition. Oxford (UK): Oxford University Press, 2005. [Google Scholar]
Elliott 2008
- Elliott JC, Carey KB, Bolles JR. Computer‐based interventions for college drinking: a qualitative review. Addictive Behaviors 2008;33(8):994‐1005. [DOI] [PMC free article] [PubMed] [Google Scholar]
Endnote 2014 [Computer program]
- Thomson Reuters. Endnote. Version X7. New York, NY: Thomson Reuters, 2014.
Essex 2014
- Essex HN, White IR, Khadjesari Z, Linke S, McCambridge J, Murray E, et al. Quality of life among hazardous and harmful drinkers: EQ‐5D over a 1‐year follow‐up period. Quality of Life Research 2014;23(2):733‐43. [DOI] [PubMed] [Google Scholar]
Fitzgibbon 2008
- Fitzgibbon ML, Stolley M, Schiffer L, Sharp L, Singh V, Horn L, et al. Obesity reduction black intervention trial (ORBIT): design and baseline characteristics. Journal of Women's Health 2008;17(7):1099‐110. [DOI] [PMC free article] [PubMed] [Google Scholar]
Gardner 2016
- Gardner B, Smith L, Lorencatto F, Hamer M, Biddle SJ. How to reduce sitting time? A review of behaviour change strategies used in sedentary behaviour reduction interventions among adults. Health Psychology Review 2016;10(1):89‐112. [DOI] [PMC free article] [PubMed] [Google Scholar]
Garrett 2010
- Garrett JJ. The Elements of User Experience: User‐centered Design for the Web and Beyond. New York, NY: Pearson Education, 2010. [Google Scholar]
GRADE 2004
- GRADE 2004. Grading quality of evidence and strength of recommendations. BMJ 2004;328:1490‐4. [DOI] [PMC free article] [PubMed] [Google Scholar]
GRADEpro GDT 2015 [Computer program]
- McMaster University (developed by Evidence Prime). GRADEpro GDT. Version accessed prior to 22 August 2017. Hamilton (ON): McMaster University (developed by Evidence Prime), 2015.
Guyatt 2008
- Guyatt GH, Oxman AD, Vist GE, Kunz R, Falck‐Ytter Y, Alonso‐Coello P, et al. GRADE: an emerging consensus on rating quality of evidence and strength of recommendations. British Medical Journal 2008;336(7560):924‐6. [DOI] [PMC free article] [PubMed] [Google Scholar]
Guyatt 2011
- Guyatt G, Oxman AD, Akl EA, Kunz R, Vist G, Brozek J, et al. GRADE guidelines 1. Introduction‐GRADE evidence profiles and summary of findings tables. Journal of Clinical Epidemiology 2011;64(4):383‐94. [DOI] [PubMed] [Google Scholar]
Hempel 2013
- Hempel S, Miles JNV, Booth MJ, Wang Z, Morton SC, Shekelle PG. Risk of bias: a simulation study of power to detect study‐level moderator effects in meta‐analysis. Systematic Reviews 2013;2(1):107. [DOI] [PMC free article] [PubMed] [Google Scholar]
Herring 2008
- Herring R, Berridge V, Thom B. Binge drinking: an exploration of a confused concept. Journal of Epidemiology and Community Health 2008;62(6):476‐9. [DOI] [PubMed] [Google Scholar]
Hester 2006
- Hester RK, Miller JH. Computer‐based tools for diagnosis and treatment of alcohol problems. Alcohol Research and Health 2006;29(1):36‐40. [PMC free article] [PubMed] [Google Scholar]
Higgins 2011
- Higgins JPT, Altman DG, Sterne JAC. Chapter 8: Assessing risk of bias in included studies. In: Higgins JPT, Green S editor(s). Cochrane Handbook for Systematic Reviews of Interventions Version 5.1.0 (updated March 2011). The Cochrane Collaboration, 2011. [Google Scholar]
Hróbjartsson 2014
- Hróbjartsson A, Emanuelsson F, Thomsen ASS, Hilden J, Brorson S. Bias due to lack of patient blinding in clinical trials. a systematic review of trials randomizing patients to blind and nonblind sub‐studies. International Journal of Epidemiology 2014;43(4):1272‐83. [DOI] [PMC free article] [PubMed] [Google Scholar]
Kalinowski 2016
- Kalinowski A, Humphreys K. Governmental standard drink definitions and low‐risk alcohol consumption guidelines in 37 countries. Addiction 2016;111(7):1293‐8. [DOI] [PubMed] [Google Scholar]
Kaner 2007
- Kaner EFS, Dickinson HO, Beyer FR, Campbell F, Schlesinger C, Heather N, et al. Effectiveness of brief alcohol interventions in primary care populations. Cochrane Database of Systematic Reviews 2007, Issue 2. [DOI: 10.1002/14651858.CD004148.pub3] [DOI] [PubMed] [Google Scholar]
Kaner 2011
- Kaner EFS, Bewick BM. Brief alcohol intervention in young people: the impact of practitioner and internet‐based approaches. In: Saunders JB, Rey JM editor(s). Young People and Alcohol: Impact, Policy, Prevention, Treatment. Hoboken (NJ): Wiley‐Blackwell, 2011:153‐69. [Google Scholar]
Kaner 2012
- Kaner EFS. Health sector responses. In: Anderson P, Moller l, Galea G editor(s). Alcohol in the European Union: Consumption, Harm and Policy Approaches. Copenhagen: World Health Organization Regional Office for Europe, 2012:40‐9. [Google Scholar]
Katikireddi 2017
- Katikireddi SV, Whitley E, Lewsey J, Gray L, Leyland AH. Socioeconomic status as an effect modifier of alcohol consumption and harm: analysis of linked cohort data. Lancet. Public Health 2017;2(6):e267‐76. [DOI] [PMC free article] [PubMed] [Google Scholar]
Khadjesari 2011
- Khadjesari Z, Murray E, Hewitt C, Hartley S, Godfrey C. Can stand‐alone computer‐based interventions reduce alcohol consumption? A systematic review. Addiction 2011;106(2):267‐82. [DOI] [PubMed] [Google Scholar]
Kruger 2014
- Kruger J, Brennan A, Strong M, Thomas C, Norman P, Epton T. The cost‐effectiveness of a theory‐based online health behaviour intervention for new university students: an economic evaluation. BMC Public Health 2014;14:1011. [DOI: 10.1186/1471-2458-14-1011] [DOI] [PMC free article] [PubMed] [Google Scholar]
Landis 1977
- Landis JR, Koch GG. The measurement of observer agreement for categorical data. Biometrics 1977;33(1):159‐74. [PubMed] [Google Scholar]
Lefebvre 2011
- Lefebvre C, Manheimer E, Glanville J. Chapter 6: Searching for studies. In: Higgins JPT, Green S editor(s). Cochrane Handbook for Systematic Reviews of Interventions Version 5.1.0 (updated March 2011). The Cochrane Collaboration, 2011. [Google Scholar]
Lorencatto 2015
- Lorencatto, F, West R, Bruguera C, Brose LS, Michie S. Assessing the quality of goal setting in behavioural support for smoking cessation and its association with outcomes. Annals of Behavioral Medicine 2016;50(2):310‐8. [DOI] [PMC free article] [PubMed] [Google Scholar]
Mavridis 2014
- Mavridis D, Salanti G. How to assess publication bias: funnel plot, trim‐and‐fill method and selection models. Evidence Based Mental Health 2014;17(1):30. [DOI] [PubMed] [Google Scholar]
McAvoy 2001
- McAvoy BR, Donovan RJ, Jalleh G, Saunders JB, Wutzke SE, Lee N, et al. General practitioners, prevention and alcohol ‐ a powerful cocktail? Facilitators and inhibitors of practising preventive medicine in general and early intervention for alcohol in particular: a 12‐nation key informant and general practitioner study. Drugs Education Prevention and Policy 2001;8(2):103‐17. [Google Scholar]
McGovern 2013
- McGovern R, Kaner EFS. Alcohol prevention and treatment: interventions for hazardous, harmful, and dependent drinkers. The Handbook of Health Behavior Change. New York (NY): Springer, 2013:211‐27. [Google Scholar]
McManus 2009
- McManus S, Meltzer H, Brugha T, Bebbington P, Jenkins R (eds). Adult psychiatric morbidity in England, 2007: results of a household survey (2009). content.digital.nhs.uk/catalogue/PUB02931/adul‐psyc‐morb‐res‐hou‐sur‐eng‐2007‐rep.pdf (accessed prior to 14 August 2017).
McQueen 2011
- McQueen J, Howe TE, Allan L, Mains D, Hardy V. Brief interventions for heavy alcohol users admitted to general hospital wards. Cochrane Database of Systematic Reviews 2011, Issue 8. [DOI: 10.1002/14651858.CD005191.pub3] [DOI] [PMC free article] [PubMed] [Google Scholar]
Michie 2009
- Michie S, Abraham C, Whittington C, McAteer J, Gupta S. Effective techniques in healthy eating and physical activity interventions: A meta‐regression. Health Psychology 2009;28(6):690‐701. [DOI] [PubMed] [Google Scholar]
Michie 2010
- Michie S, Prestwich A. Are interventions theory‐based? Development of a theory coding scheme. Health Psychology 2010;29(1):1‐8. [DOI] [PubMed] [Google Scholar]
Michie 2012
- Michie S, Whittington C, Hamoudi Z, Zarnani F, Tober G, West R. Identification of behaviour change techniques to reduce excessive alcohol consumption. Addiction 2012;107(8):1431‐40. [DOI] [PubMed] [Google Scholar]
Michie 2013
- Michie S, Richardson M, Johnston M, Abraham C, Francis J, Hardeman W, et al. The behavior change technique taxonomy (v1) of 93 hierarchically clustered techniques: building an international consensus for the reporting of behavior change interventions. Annals of Behavioral Medicine 2013;46(1):81‐95. [DOI] [PubMed] [Google Scholar]
Michie 2014
- Michie S, West R, Campbell R, Brown J, Gainforth H. ABC of Behaviour Change Theories. Sutton (UK): Silverback Publishing, 2014. [Google Scholar]
Michie 2015
- Michie S, Wood C, Johnston M, Abraham C, Francis J, Hardeman W. Behaviour change techniques: the development and evaluation of a taxonomic method for reporting and describing behaviour change interventions. Health Technology Assessment 2015;19(99):1‐188. [DOI] [PMC free article] [PubMed] [Google Scholar]
MIller 1982
- Miller W, Munoz, R. How to control your drinking: a practical guide to responsible drinking. Revised. Albuquerque, New Mexico: University of New Mexico Press, 1982. [Google Scholar]
Miller 1988
- Miller WR, Sovereign RG, Krege B. Motivational interviewing with problem drinkers: II. The Drinker's Check‐up as a preventive intervention. Behavioural and Cognitive Psychotherapy 1988;16(4):251‐68. [Google Scholar]
Miller 1994
- Miller WR, Sanchez VC. Motivating young adults for treatment and lifestyle change. In: Howard G editor(s). Issues in Alcohol Use and Misuse by Young Adults. Notre Dame, Indiana: University of Notre Dame Press, 1994. [Google Scholar]
Miller 2002
- Miller WR, Rollnick S. Motivational interviewing: preparing people to change addictive behavior. 2nd Edition. New York: Guilford Publications, 2002. [Google Scholar]
Moyer 2002
- Moyer A, Finney JW, Swearingen CE, Vergun P. Brief interventions for alcohol problems: a meta‐analytic review of controlled investigations in treatment and non‐treatment‐seeking populations. Addiction 2002;97(3):279‐92. [DOI] [PubMed] [Google Scholar]
Nair 2015
- Nair NK, Newton NC, Shakeshaft A, Wallace P, Teesson M. A systematic review of digital and computer‐based alcohol intervention programs in primary care. Current Drug Abuse Reviews 2015;8(2):111‐8. [DOI] [PubMed] [Google Scholar]
Newman 2011
- Newman MG, Szkodny LE, Llera SJ, Przeworski A. A review of technology‐assisted self‐help and minimal contact therapies for drug and alcohol abuse and smoking addiction: is human contact necessary for therapeutic efficacy?. Clinical Psychology Review 2011;31(1):178‐86. [DOI] [PubMed] [Google Scholar]
O'Donnell 2013
- O’Donnell A, Anderson P, Newbury‐Birch D, Schulte B, Schmidt C, Reimer J, et al. The impact of brief alcohol interventions in primary healthcare: a systematic review of reviews. Alcohol and Alcoholism 2013;49(1):66‐78. [DOI] [PMC free article] [PubMed] [Google Scholar]
Purshouse 2013
- Purshouse RC, Brennan A, Rafia R, Latimer NR, Archer RJ, Angus CR, et al. Modelling the cost‐effectiveness of alcohol screening and brief interventions in primary care in England. Alcohol and Alcoholism 2013;48(2):180‐8. [DOI] [PubMed] [Google Scholar]
Rehm 2009
- Rehm J, Mathers C, Popova S, Thavorncharoensap M, Teerawattananon Y, Patra J. Global burden of disease and injury and economic cost attributable to alcohol use and alcohol‐use disorders. Lancet 2009;373(9682):2223‐33. [DOI] [PubMed] [Google Scholar]
Reinert 2007
- Reinert DF, Allen JP. The alcohol use disorders identification test: an update of research findings. Alcoholism, Clinical and Experimental Research 2007;31(2):185‐99. [DOI] [PubMed] [Google Scholar]
Review Manager 2014 [Computer program]
- The Nordic Cochrane Centre, The Cochrane Collaboration. Review Manager (RevMan). Version 5.3. Copenhagen: The Nordic Cochrane Centre, The Cochrane Collaboration, 2014.
Riley 2011
- Riley WT, Rivera DE, Atienza A, Nilsen W, Allison SM, Mermelstein R. Health behavior models in the age of mobile interventions: are our theories up to the task?. Translational Behavioral Medicine 2011;1(1):53‐71. [DOI] [PMC free article] [PubMed] [Google Scholar]
Riper 2011
- Riper H, Spek V, Boon B, Conijn B, Kramer J, Martin‐Abello K, et al. Effectiveness of E‐self‐help interventions for curbing adult problem drinking: a meta‐analysis. Journal of Medical Internet Research 2011;13(2):e42. [DOI] [PMC free article] [PubMed] [Google Scholar]
Riper 2014
- Riper H, Blankers M, Hadiwijaya H, Cunningham J, Clarke S, Wiers R, et al. Effectiveness of guided and unguided low‐intensity internet interventions for adult alcohol misuse: a meta‐analysis. PloS One 2014;9(6):e99912. [DOI] [PMC free article] [PubMed] [Google Scholar]
Rooke 2010
- Rooke S, Thorsteinsson E, Karpin A, Copeland J, Allsop D. Computer‐delivered interventions for alcohol and tobacco use: a meta‐analysis. Addiction 2010;105(8):1381‐90. [DOI] [PubMed] [Google Scholar]
Saranummi 2013
- Saranummi N, Spruijt‐Metz D, Intille SS, Korhonen I, Nilsen WJ, Pavel M. Moving the science of behavioral change into the 21st century. IEEE Pulse 2013;4(6):32‐3. [DOI] [PubMed] [Google Scholar]
Schulz 2014a
- Schulz DN, Smit ES, Stanczyk NE, Kremers SP, Vries H, Evers SM. Economic evaluation of a web‐based tailored lifestyle intervention for adults: findings regarding cost‐effectiveness and cost‐utility from a randomized controlled trial. Journal of Medical Internet Research 2014;16(3):e91. [DOI] [PMC free article] [PubMed] [Google Scholar]
Smit 2011
- Smit F, Lokkerbol J, Riper H, Majo C, Boon B, Blankers M. Modeling the cost‐effectiveness of health care systems for alcohol use disorders: How implementation of eHealth interventions improves cost‐effectiveness. Journal of Medical Internet Research 2011;13(3):93‐106. [DOI] [PMC free article] [PubMed] [Google Scholar]
Spring 2013
- Spring B, Gotsis M, Paiva A, Spruijt‐Metz D. Healthy apps: mobile devices for continuous monitoring and intervention. IEEE Pulse 2013;4(6):34‐40. [DOI] [PMC free article] [PubMed] [Google Scholar]
Spruijt‐Metz 2015
- Spruijt‐Metz D, Hekler E, Saranummi N, Intille S, Korhonen I, Nilsen W, et al. Building new computational models to support health behavior change and maintenance: new opportunities in behavioral research. Translational Behavioral Medicine 2015;5(3):335‐46. [DOI] [PMC free article] [PubMed] [Google Scholar]
Stata 2015 [Computer program]
- StataCorp. Stata Statistical Software. Version 14. College Station, TX: StataCorp LP, 2015.
Struzzo 2013
- Struzzo P, Scafato E, McGregor R, Della Vedova R, Verbano L, Lygidakis C, et al. A randomised controlled non‐inferiority trial of primary care‐based facilitated access to an alcohol reduction website (EFAR‐FVG): the study protocol. BMJ Open 2013;3(2):e002304. [DOI] [PMC free article] [PubMed] [Google Scholar]
Sullivan 2011
- Sullivan L, Tetrault J, Braithwaite S, Turner BJ, Fiellin DA. A meta‐analysis of the efficacy of nonphysician brief interventions for unhealthy alcohol use: implications for the patient‐centered medical home. American Journal on Addictions 2011;20(4):343‐56. [DOI] [PubMed] [Google Scholar]
Terrin 2005
- Terrin N, Schmid CH, Lau J. In an empirical evaluation of the funnel plot, researchers could not visually identify publication bias. Journal of Clinical Epidemiology 2005;58(9):894‐901. [DOI] [PubMed] [Google Scholar]
UK Government 2012
- UK Government. The government's alcohol strategy (2012). www.gov.uk/government/uploads/system/uploads/attachment_data/file/224075/alcohol‐strategy.pdf (accessed prior to 14 August 2017).
UK Government 2017
- UK Government. Alcohol and young people (2017). www.gov.uk/alcohol‐young‐people‐law (accessed prior to 14 August 2017).
Vernon 2010
- Vernon ML. A review of computer‐based alcohol problem services designed for the general public. Journal of Substance Abuse Treatment 2010;38(3):203‐11. [DOI] [PMC free article] [PubMed] [Google Scholar]
Voils 2014
- Voils CI, King HA, Maciejewski ML, Allen KD, Yancy WS, Shaffer JA. Approaches for informing optimal dose of behavioral interventions. Annals of Behavioral Medicine 2014;48(3):392‐401. [DOI] [PMC free article] [PubMed] [Google Scholar]
Webb 2010
- Webb TL, Joseph J, Yardley L, Michie S. Using the internet to promote health behavior change: a systematic review and meta‐analysis of the impact of theoretical basis, use of behavior change techniques, and mode of delivery on efficacy. Journal of Medical Internet Research 2010;12(1):e4. [DOI] [PMC free article] [PubMed] [Google Scholar]
Webster 2015
- Webster R, Gerressu M, Michie S, Estcourt C, Anderson J, Ang Chee S, et al. Defining the content of an online sexual health intervention: the MenSS website. JMIR Research Protocols 2015;4(3):e82. [DOI: ] [DOI] [PMC free article] [PubMed] [Google Scholar]
West 2005
- West R. Time for a change: putting the transtheoretical (stages of change) model to rest. Addiction 2005;100(8):1036. [DOI] [PubMed] [Google Scholar]
West 2015
- West R, Michie S. A Guide to Development and Evaluation of Digital Behaviour Change Interventions in Healthcare. London: Silverback Publishing, 2015. [Google Scholar]
White 2010
- White A, Kavanagh D, Stallman H, Klein B, Kay‐Lambkin F, Proudfoot J, et al. Online alcohol interventions: a systematic review. Journal of Medical Internet Research 2010;12(5):e62. [DOI] [PMC free article] [PubMed] [Google Scholar]
WHO 1992
- World Health Organization. The ICD‐10 classification of mental and behavioural disorders: Clinical descriptions and diagnostic guidelines (1992). www.who.int/classifications/icd/en/GRNBOOK.pdf (accessed prior to 14 August 2017).
WHO 2009
- World Health Organization. Global health risks: mortality and burden of disease related to selected major risks (2009). www.who.int/healthinfo/global_burden_disease/GlobalHealthRisks_report_full.pdf (accessed prior to 14 August 2017).
WHO 2014
- World Health Organization. Global status report on alcohol and health 2014. www.who.int/substance_abuse/publications/global_alcohol_report/en/. Geneva: World Health Organization, (accessed prior to 14 August 2017).
Wilson 2011
- Wilson G, Lock C, Heather N, Cassidy P, Christie M, Kaner E. Intervention against excessive alcohol consumption in primary health care: a survey of GPs’ attitudes and practices in England ten years on. Alcohol and Alcoholism 2011;46(5):570‐7. [DOI] [PMC free article] [PubMed] [Google Scholar]
Yardley 2016
- Yardley L, Choudhury T, Patrick K, Michie S. Current issues and future directions for research Into digital behavior change interventions. American Journal of Preventive Medicine 2016;51(5):814‐5. [DOI] [PubMed] [Google Scholar]
Zisserson 2007
- Zisserson RN, Palfai TP, Saitz R. "No‐contact" interventions for unhealthy college drinking: efficacy of alternatives to person‐delivered intervention approaches. Substance Abuse 2007;28(4):119‐31. [DOI] [PubMed] [Google Scholar]
References to other published versions of this review
Kaner 2015
- Kaner EF, Beyer FR, Brown J, Crane D, Garnett C, Hickman M, et al. Personalised digital interventions for reducing hazardous and harmful alcohol consumption in community‐dwelling populations. Cochrane Database of Systematic Reviews 2015, Issue 1. [DOI: 10.1002/14651858.CD011479] [DOI] [PMC free article] [PubMed] [Google Scholar]