

Abstract
Background
Non‐randomised data have shown a link between hyperuricaemia and the progression or development of chronic kidney disease (CKD). If this is correct, urate lowering therapy might form an important part of chronic kidney disease care, reducing risks for cardiovascular outcomes and end‐stage kidney disease.
Objectives
This review aims to study the benefits and harms of uric acid lowering therapy on the progression of CKD and other cardiovascular endpoints.
Search methods
We searched the Cochrane Kidney and Transplant Specialised Register to 20 July 2017 through contact with the Information Specialist using search terms relevant to this review. Studies contained in the Specialised Register are identified through search strategies specifically designed for CENTRAL, MEDLINE, and EMBASE; handsearching conference proceedings; and searching the International Clinical Trials Register (ICTRP) Search Portal and ClinicalTrials.gov.
Selection criteria
All randomised controlled trials testing primary urate lowering therapy in patients with or without CKD.
Data collection and analysis
Two authors independently assessed study quality and extracted data. Statistical analyses were performed using a random effects model and results expressed as risk ratio (RR) with 95% confidence intervals (CI) for dichotomous outcomes or mean difference (MD) for continuous outcomes, or standardised mean difference (SMD) if different scales were used.
Main results
Twelve studies (1187 participants) were included in the review. Risk of bias was unclear for the majority of domains in each study.
Uric acid lowering therapy may make little or no difference in death at six months (2 studies, 498 participants: RR 1.66, 95% CI 0.61 to 4.48) or two years (2 studies, 220 participants): RR 0.13, 95% CI 0.02 to 1.06) (low certainty evidence). Uric acid lowering therapy may make little of no difference (low certainty evidence) in the incidence of ESKD at one or two years. Kidney function may be improved by uric acid lowering therapy at one year with a reduction in serum creatinine (2 studies, 83 participants: MD ‐73.35 µmol/L, 95% CI ‐107.28 to ‐39.41) and a rise in eGFR (1 study, 113 participants: MD 5.50 mL/min/1.73 m2, 95% CI 0.59 to 10.41). However it probably makes little or no difference to eGFR at two years (2 studies, 164 participants: MD 4.00 mL/min, 95% CI ‐3.28 to 11.28). Uric acid lowering therapy reduced uric acid levels at all time points (3, 4, 6, 12 and 24 months) (high certainty evidence).
There is insufficient evidence to support an effect on blood pressure, proteinuria or other cardiovascular markers by uric acid lowering therapy. It should be noted that the apparent benefits of treatment were not apparent at all time points, introducing the potential for bias.
Authors' conclusions
There is limited data which suggests uric acid lowering therapy may prevent progression of chronic kidney disease but the conclusion is very uncertain. Benefits were not observed at all time points and study quality was generally low. Larger studies are required to study the effect of uric acid lowering therapy on CKD progression. Three ongoing studies will hopefully provide much needed high quality data.
Plain language summary
Uric acid lowering therapies for preventing or delaying the progression of chronic kidney disease
What is the issue?
There is some evidence to suggest that patients with higher uric acid levels in the blood may be more at risk for either developing kidney damage or for kidney damage that they already have getting worse. This study is designed to answer the question "if we reduce uric acid levels in the blood with specific treatments, will that protect the patient from worsening kidney damage or from developing kidney damage in the first place?"
Long‐term damage to the kidney (chronic kidney disease) is an increasing problem across the world. With worse damage to the kidney, there are increasing risks of heart disease and death, as well as the increased need for dialysis treatment when kidneys finally fail. There is a great deal of research being performed aimed at reducing both the occurrence of kidney damage and the gradual worsening of damage that is present. This is aimed at reducing death, heart disease, and the need for dialysis treatment.
Uric acid, or urate, is an end product of the breakdown of DNA and is present in everyone. Increasing levels of urate are thought to be potentially damaging to the heart and blood vessels and possibly also the kidney. In kidney patients, it is well known that as kidney damage worsens, the level of urate in the blood tends to rise. There is increasing suspicion that this rise in urate levels in kidney patients is not just the result of kidney damage but may be actually making the situation worse.
What did we do?
We collected all the data from studies that consider patients treated with urate lowering medications for more than 3 months and that report data on death, blood pressure and kidney function in their outcomes.
Twelve studies comprising 1187 participants were included in the review. Duration of the studies was between four months and two years. The types of patients included varied across the studies including diabetes, heart failure, and chronic kidney disease.
What did we find?
The quality of the included studies was difficult to grade due to a lack of information. These are not, therefore, high quality studies.
We found a small amount of evidence that reducing uric acid levels may slow down damage to kidneys but no evidence that it improves blood pressure or any of the other cardiovascular markers that were investigated. The number of patients requiring dialysis treatment for complete kidney failure appears unchanged. Two measures of kidney failure (serum creatinine and glomerular filtration rate) were improved at six and 12 months but not at two years. The amount of protein in the urine was also reduced by treatment. We found no clear effect on death, blood pressure, rates of hospitalisation, or side effects of treatment.
Conclusions
There is limited data which suggests urate lowering therapy may slow down damage to the kidneys but the conclusion is very uncertain. Benefits were not observed at all time points and study quality was generally low. Larger studies are required to study the effect of uric acid lowering therapy on CKD progression.
Summary of findings
Summary of findings for the main comparison. Uric acid lowering therapies (UAR) versus placebo, no treatment or usual care for preventing or delaying the progression of chronic kidney disease (CKD).
| UAR versus to placebo, no treatment or usual care for preventing or delaying the progression of CKD | |||||
| Patient or population: CKD patients Intervention: UAR Comparison: placebo, no treatment or usual care | |||||
| Outcomes | Anticipated absolute effects* (95% CI) | Relative effect (95% CI) | No. of participants (studies) | Quality of the evidence (GRADE) | |
| Risk with placebo, no treatment or usual care | Risk with UAR | ||||
| Death at 6 months | Study population | RR 1.66 (0.61 to 4.48) | 498 (2) | ⊕⊕⊝⊝ LOW 1 2 | |
| 24 per 1,000 | 40 per 1,000 (15 to 108) | ||||
| Death at 2 years | Study population | RR 0.13 (0.02 to 1.06) | 220 (2) | ⊕⊕⊝⊝ LOW 3 | |
| 63 per 1,000 | 9 per 1,000 (1 to 68) | ||||
| Dialysis at 2 years | Study population | RR 0.40 (0.05 to 3.00) | 220 (2) | ⊕⊕⊝⊝ LOW 4 5 | |
| 36 per 1,000 | 15 per 1,000 (2 to 110) | ||||
| Serum creatinine at 1 year | Mean serum creatinine in the intervention group was 73.35 µmol/L lower (39.14 to 107.28 lower) than the control group | ‐ | 83 (2) | ⊕⊕⊝⊝ LOW 6 7 | |
| eGFR at 2 years | Mean eGFR in the intervention group was 4 mL/min higher (3.28 lower to 11.28 higher) than the control group | ‐ | 164 (2) | ⊕⊕⊕⊝ MODERATE 8 | |
| Cardiovascular events | Study population | RR 0.46 (0.20 to 1.04) | 113 (1) | ⊕⊕⊝⊝ LOW 9 10 | |
| 268 per 1,000 | 123 per 1,000 (54 to 279) | ||||
| Uric acid at 1 year | The mean uric acid level in the intervention group was 173.88 µmol/L lower (79.35 to 268.42 lower) than the control group | ‐ | 253 (4) | ⊕⊕⊕⊕ HIGH | |
| *The risk in the intervention group (and its 95% CI) is based on the assumed risk in the comparison group and the relative effect of the intervention (and its 95% CI). CI: confidence interval; eGFR: estimated glomerular filtration rate; RR: risk ratio | |||||
| GRADE Working Group grades of evidence High quality: We are very confident that the true effect lies close to that of the estimate of the effect Moderate quality: We are moderately confident in the effect estimate: The true effect is likely to be close to the estimate of the effect, but there is a possibility that it is substantially different Low quality: Our confidence in the effect estimate is limited: The true effect may be substantially different from the estimate of the effect Very low quality: We have very little confidence in the effect estimate: The true effect is likely to be substantially different from the estimate of effect | |||||
1 Poorly reported unblinded study with multiple post hoc analyses
2 One study with a high mortality
3 One unblinded study with low event rate
4 Single small unblinded study
5 Low event rate
6 Unblinded studies with poor reporting of allocation concealment, incomplete outcome data and potential reporting bias
7 High effect heterogeneity across the studies
8 Small effect with wide CI
9 Single unblinded study
10 Single study with large effect on a high event rate
Background
Description of the condition
There is increasing recognition of the links between hyperuricaemia, chronic kidney disease (CKD) and cardiovascular disease (Feig 2008). It is very difficult to disentangle association and causality. Rigorous evaluation of the evidence for the impact of lowering uric acid levels on the development and progression of CKD is essential because there could potentially be major implications for the prevention and treatment of CKD in the future.
Chronic kidney disease
Estimates from the USA suggest that the prevalence of CKD stages 1 to 4 increased from 10% (95% confidence interval (CI); 9.2% to 10.9%) in 1988 to 1994, to 13.1% (95% CI; 12% to 14.1%) in 1999 to 2004 (Coresh 2007). More recent data suggests that more than 5% of the USA population has CKD stage 3 (Levey 2012). The number of individuals worldwide undergoing renal replacement therapy (RRT) has increased very considerably over recent years, with a consequent increase in demand on health funding. In the UK, 2% of the National Health Service budget is spent on RRT (dialysis and transplantation) for 0.01% of the population (Winearls 2010). There is an increase in cardiovascular disease and all‐cause mortality associated with falling glomerular filtration rate (GFR) (Matsushita 2010). Individuals with CKD are at high risk of cardiovascular disease.
Hyperuricaemia
Uric acid is the end product of the metabolism of purine compounds. Elevated uric acid levels can result from excessive urate production and diminished kidney uric acid excretion or both. Hyperuricaemia is generally defined from the concentration at which a state of supersaturation for urate is reached in the serum (the solubility limit of urate in body fluids). There is variation between men and women in levels: the generally quoted levels are > 7 mg/dL (420 μmol/L) for men and > 6 mg/dL (360 μmol/L) for women.
The prevalence of hyperuricaemia varies considerably among populations. Historical data for white males in the USA suggests a prevalence of 4.8% (Hall 1967). More recent studies in Taiwan Chinese males gave a prevalence of 25.8% (Lin 2000), and in Thai males prevalence was 59% (Uaratanawong 2011). Significant proportions of some populations are therefore suggested as having asymptomatic hyperuricaemia. When symptoms associated with elevated uric acid levels develop they may manifest as gout, uric acid nephrolithiasis or urate nephropathy.
In patients with CKD it is well recognised that a decline in kidney function and GFR is accompanied by an increase in serum uric acid levels as a result of reduced kidney clearance (Cameron 2005) There is increasing suspicion that rising uric acid levels may be more than just a marker of kidney disease, and may be involved in the pathogenesis of CKD and its progression. A recent study has shown that serum uric acid levels are an independent risk factor for decreased kidney function in healthy normotensive individuals (Bellomo 2010). Data from animal models have demonstrated that hyperuricaemia accelerates the progression of kidney disease via mechanisms linked to high systemic blood pressure and vascular disease (Kang 2002). Other studies in rats have confirmed that hyperuricaemia is associated with both the development of glomerulosclerosis and tubulointerstitial fibrosis, and exacerbation of kidney disease in animals with remnant kidneys or chronic cyclosporin toxicity (Nakagawa 2006). In addition, lowering uric acid with allopurinol in diabetic (db/db) mice reduced albuminuria and ameliorated tubulointerstitial injury (Kosugi 2009). Therapies that reduce uric acid may therefore slow CKD progression and reduce cardiovascular morbidity.
Description of the intervention
There are a number of mechanistically different interventions that can be used to lower uric acid levels. These include xanthine oxidase inhibitors, uricosuric agents and uricase agents. These agents are classically used to lower urate levels in the treatment of gout, but the use of at least some of these agents would be viable for high urate levels in kidney patients.
The potential urate lowering therapies available (allopurinol, febuxostat, probenecid, sulfinpyrazone, benzbromarone, pegloticase and rasburicase; see Table 2) will be included for evaluation in this review according to available data.
1. Uric acid lowering therapies.
| Uric acid lowering therapy | Mechanism of action | Dosage | Considerations |
| Allopurinol | Xanthine oxidase inhibitor | Starting dose 50 to 100 mg/d, up to as much as 800 mg/d | Use with caution in kidney disease, concern about increased sensitivity Mild rash 2% patients Hypersensitivity 0.1% patients |
| Benzbromarone | Uricosuric agent | 50 to 200 mg/d | Monitor liver function: can cause fulminant liver failure |
| Febuxostat | Xanthine oxidase inhibitor | Starting dose 40 mg orally daily, increase to 80 mg once daily after 2 to 4 weeks | Insufficient data for use in patients with CrCl < 30 mL/min |
| Pegloticase | Uricase | IV administration | Infusion reactions common |
| Probenecid | Uricosuric agent | Starting dose 250 mg once/d, gradual increase to maximum 2 to 3 g/d in divided doses | Avoid in patients with history of nephrolithiasis or CrCl < 30 mL/min |
| Rasburicase | Uricase | IV administration | Used in prevention of tumour lysis syndrome, generally considered inappropriate for gout due to immunogenicity and short half‐life |
| Sulfinpyrazone | Uricosuric agent | 100 to 200 mg once/d, maximum dose 600 to 800 mg | No longer available in USA. Uricosuric action lost when GFR < 10 mL/min |
CrCl ‐ creatinine clearance; GFR ‐ glomerular filtration rate; IV ‐ intravenous
How the intervention might work
Reducing urate levels using drug treatment may reduce the ongoing damage to the kidney and allow the kidney to function for a longer period of time. The reduction in urate levels in the blood may also affect other parameters other than kidney function; the blood pressure may be reduced, and there may be other direct effects on blood vessels which help the patient and reduce other risks.
Why it is important to do this review
Given the increasing prevalence of CKD, and the associated morbidity and mortality in an aging population with increasing levels of obesity and diabetes, it is imperative that we find therapeutic ways of delaying the onset and progression of kidney disease to improve patient outcomes and reduce the global impact of CKD. This review will evaluate the accumulating evidence on the use of uric acid lowering therapy in CKD, and provide direction towards areas for further research.
Objectives
This review aims to study the benefits and harms of uric acid lowering therapy on the progression of CKD and other cardiovascular endpoints.
Methods
Criteria for considering studies for this review
Types of studies
All randomised controlled trials (RCTs) and quasi‐RCTs (RCTs in which allocation to treatment was obtained by alternation, use of alternate medical records, date of birth or other predictable methods) looking at the use of uric acid lowering therapy in individuals with both normal and impaired kidney function (CKD). Cross‐over studies were not included in the review.
Types of participants
Individuals receiving uric acid lowering therapy with either normal kidney function or CKD as defined by the studies (most commonly by eGFR) of all ages and both male and female.
Patients already receiving RRT via haemodialysis or peritoneal dialysis were to be considered as separate subgroups of the study population. They were to be assessed for cardiovascular endpoints and mortality dependent on the data available.
Types of interventions
Any therapy given primarily for lowering uric acid was considered for inclusion. This included allopurinol, febuxostat, probenecid, sulfinpyrazone, benzbromarone, pegloticase and rasburicase. Comparison was made between intervention and placebo or standard care. There is good evidence that other agents, such as atorvastatin and losartan may have the effect of lowering uric acid levels in addition to their primary effects on lipid metabolism and the renin/angiotensin system respectively (Daskalopoulou 2005). For the purposes of this systematic review, however, it would be impossible to disentangle the effects of these drugs on kidney and cardiovascular outcomes mediated via effects on uric acid and their primary mechanisms of action. Therefore, these agents were to be included in the review analysis, although relevant data may be reviewed in the discussion. Follow‐up for more than three months duration was considered appropriate for an effect on CKD, shorter studies were excluded.
Types of outcome measures
Primary outcomes
Development or progression of kidney disease as defined by change in serum creatinine (SCr), change in eGFR or start of dialysis.
End‐stage kidney disease (ESKD) as defined by study (commencement of dialysis, transplantation)
SCr level
GFR
Secondary outcomes
Mortality
Blood pressure (diastolic and systolic)
Major adverse events.
Cardiovascular events
Markers of inflammation (i.e. C‐reactive protein levels)
Cardiovascular status (surrogate measure as defined by study)
Proteinuria
Serum uric acid
Search methods for identification of studies
Electronic searches
We searched the Cochrane Kidney and Transplant Specialised Register to 20 July 2017 through contact with the Information Specialist using search terms relevant to this review. The Specialised Register contains studies identified from the following sources.
Monthly searches of the Cochrane Central Register of Controlled Trials (CENTRAL)
Weekly searches of MEDLINE OVID SP
Handsearching of kidney‐related journals and the proceedings of major kidney conferences
Searching of the current year of EMBASE OVID SP
Weekly current awareness alerts for selected kidney and transplant journals
Searches of the International Clinical Trials Register (ICTRP) Search Portal and ClinicalTrials.gov.
Studies contained in the Specialised Register are identified through search strategies for CENTRAL, MEDLINE, and EMBASE based on the scope of Cochrane Kidney and Transplant. Details of these strategies, as well as a list of handsearched journals, conference proceedings and current awareness alerts, are available in the Specialised Register section of information about Cochrane Kidney and Transplant.
See Appendix 1 for search terms used in strategies for this review.
Searching other resources
Reference lists of clinical practice guidelines, review articles and relevant studies.
Letters seeking information about unpublished or incomplete studies to investigators known to be involved in previous studies.
Data collection and analysis
Selection of studies
The search strategy described was used to obtain titles and abstracts of studies that might be relevant to the review. The titles and abstracts were screened independently by two authors, who discarded studies that were not applicable; however studies and reviews that might include relevant data or information on studies were retained initially. The authors independently assessed retrieved abstracts and, if necessary the full text, of these studies to determine which studies satisfied the inclusion criteria.
Data extraction and management
Data extraction was carried out independently by two authors using standard data extraction forms. Studies reported in non‐English language journals were to be translated before assessment. Where more than one publication of one study existed, reports were grouped together and the publication with the most complete data was included. Disagreements were resolved by consultation with all authors.
Assessment of risk of bias in included studies
The following items were independently assessed by two authors using the risk of bias assessment tool (Higgins 2011) (seeAppendix 2).
Was there adequate sequence generation (selection bias)?
Was allocation adequately concealed (selection bias)?
-
Was knowledge of the allocated interventions adequately prevented during the study?
Participants and personnel (performance bias)
Outcome assessors (detection bias)
Were incomplete outcome data adequately addressed (attrition bias)?
Are reports of the study free of suggestion of selective outcome reporting (reporting bias)?
Was the study apparently free of other problems that could put it at a risk of bias?
Measures of treatment effect
For dichotomous outcomes (mortality, commencement of RRT, transplantation) results have been expressed as risk ratios (RR) with 95% CI. Where continuous scales of measurement are used to assess the effects of treatment (blood pressure, SCr, eGFR, serum uric acid level, proteinuria), the mean difference (MD) has been used, or the standardised mean difference (SMD) if different scales have been used.
Unit of analysis issues
Any data from studies with non‐standard designs such as cross‐over studies will be reviewed, but these data are unlikely to be suitable for inclusion because the cross‐over design is not suitable for assessing delayed treatment effects. Studies with multiple intervention groups were reviewed. Groups were separated and outcomes analysed individually if data were available.
Dealing with missing data
Wherever possible, we attempted to contact original investigators to request missing data. Intention‐to‐treat analysis or available case analysis were conducted, if applicable, to address issues of missing participants. We addressed issues regarding missing data in our discussion and attempt to minimise imputation of data.
Assessment of heterogeneity
We first assessed the heterogeneity by visual inspection of the forest plot. Heterogeneity was then analysed using a Chi2 test on N‐1 degrees of freedom, with an alpha of 0.05 used for statistical significance and with the I2 test (Higgins 2003). A guide to the interpretation of I2 values is as follows.
0% to 40%: might not be important
30% to 60%: may represent moderate heterogeneity
50% to 90%: may represent substantial heterogeneity
75% to 100%: considerable heterogeneity.
The importance of the observed value of I2 depends on the magnitude and direction of treatment effects and the strength of evidence for heterogeneity (e.g. P‐value from the Chi2 test, or a confidence interval for I2) (Higgins 2011).
Assessment of reporting biases
Sufficient RCTs were not identified; therefore an attempt was not made to address publication bias by the use of funnel plots (Higgins 2011).
Data synthesis
Data was pooled using the random‐effects model but the fixed‐effect model was also used to ensure robustness of the model chosen and susceptibility to outliers.
Subgroup analysis and investigation of heterogeneity
Subgroup analysis was used to explore possible sources of heterogeneity (such as participants, interventions and study quality). Heterogeneity among participants could be related to levels of CKD, racial group, dialysis modality and transplantation. Heterogeneity in treatments could be related to prior agent(s) used and the agent, dose and duration of therapy. Adverse effects were to be tabulated and assessed using descriptive techniques because they were likely to differ among the various agents used. Where possible, the risk difference (RD) with 95% CI was to be calculated for each adverse effect, either compared with no treatment or another agent.
Sensitivity analysis
We planned to perform sensitivity analyses to explore the influence of the following factors on effect size:
Repeating the analysis excluding unpublished studies
Repeating the analysis taking account of risk of bias, as specified above
Repeating the analysis excluding any very long or large studies to establish how much they dominate the results
Due to the lack of appropriate data, these sensitivity analyses have not been performed.
'Summary of findings' tables
We presented the main results of the review in 'Summary of findings' tables. These tables present key information concerning the quality of the evidence, the magnitude of the effects of the interventions examined, and the sum of the available data for the main outcomes (Schünemann 2011a). The 'Summary of findings' tables also include an overall grading of the evidence related to each of the main outcomes using the GRADE (Grades of Recommendation, Assessment, Development and Evaluation) approach (GRADE 2008). The GRADE approach defines the quality of a body of evidence as the extent to which one can be confident that an estimate of effect or association is close to the true quantity of specific interest. The quality of a body of evidence involves consideration of within‐trial risk of bias (methodological quality), directness of evidence, heterogeneity, precision of effect estimates and risk of publication bias (Schünemann 2011b). We presented the following outcomes in the 'Summary of findings' tables.
Death at six months and two years
Dialysis at two years
SCr
GFR at two years
CVS (cardiovascular system) events
Uric acid
Results
Description of studies
Results of the search
After searching electronic databases we identified 1306 records. After duplicates were removed and titles and abstracts screened we retrieved 39 full‐text articles for further assessment. Of these, 12 studies (17 records) were included and six studies (13 records) were excluded. Three ongoing studies (CKD‐FIX Study 2011; FEATHER Study 2014; PERL Study 2013) were identified and four new potential studies were identified prior to publication (Hosoya 2014; Saag 2013; Tani 2015; Tuta 2014). These seven studies will be assessed in a future update of this review (Figure 1).
1.
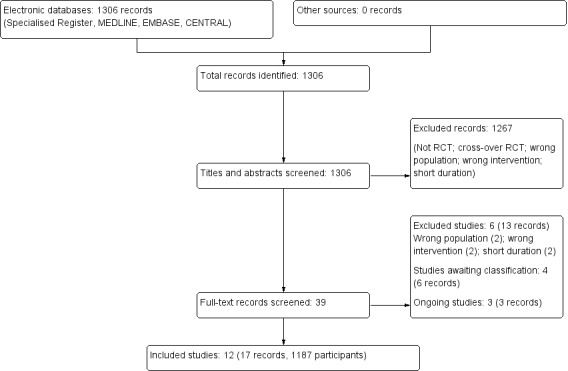
Study flow diagram.
Included studies
Twelve studies (1187 participants) were eligible for inclusion in this review (see Characteristics of included studies).
Four studies (Goicoechea 2010; OPT‐CHF Study 2004; Sircar 2015; Siu 2006) reported data on mortality
Three studies reported need for dialysis (Goicoechea 2010; Siu 2006; Tuta 2006)
Eight studies (Gibson 1980; Goicoechea 2010; Kanbay 2011; Momeni 2010; Sarris 2007; Shi 2012; Siu 2006: Sircar 2015) included data on kidney outcomes, such as SCr, eGFR and proteinuria
Five studies (Bergamini 2010; Dogan 2011; Goicoechea 2010; Kanbay 2011; OPT‐CHF Study 2004) included data on cardiovascular outcomes
Eight studies (Dogan 2011; Gibson 1980; Goicoechea 2010; Kanbay 2011; Sarris 2007; Shi 2012; Sircar 2015; Siu 2006) included data on the effect on serum uric acid
Three studies (Goicoechea 2010; Sarris 2007; Siu 2006) included specific data on other side effects.
Study design
All studies were randomised, parallel group design.
Sample sizes
Samples sizes ranged from 36 to 405 patients, five studies including 100 or more patients (Dogan 2011; Goicoechea 2010; OPT‐CHF Study 2004; Sircar 2015; Tuta 2006).
Setting
Studies were mainly conducted in single centres. Several reports were not specific as to the source of patient recruitment.
Participants
Different types of patients were included in different studies including heart failure, normotensive diabetics, diabetics with microvascular complications, gout, stable CKD, asymptomatic hyperuricaemia, and IgA nephropathy with hyperuricaemia.
Interventions
Allopurinol was the intervention in all studies except OPT‐CHF Study 2004, which used oxypurinol.
Outcomes
Kidney outcomes such as GFR, SCr and proteinuria were assessed in seven studies. Cardiovascular outcomes such as blood pressure, flow mediated dilatation and nitrate induced vascular dilatation were measured in four studies.
Excluded studies
Six studies were excluded (Characteristics of excluded studies).
Two studies were in patients with gout only (CONFIRMS Study 2012; Sundy 2011), two studies compared active treatments (NCT00174915; NU‐FLASH Study 2013), and two studies were of short duration (less than three months) (Tanaka 2015; Tausche 2014).
Risk of bias in included studies
Risk of bias data is summarised for the included studies in Figure 2. In general there was little or no data by which to assess the risk of bias.
2.

Risk of bias summary: review authors' judgements about each risk of bias item for each included study.
Allocation
Random sequence generation
Randomisation was categorised as low risk in four studies (Goicoechea 2010; Kanbay 2011; Sircar 2015; Siu 2006), all of which documented the use of computer generated lists for randomisation. The other studies gave no indication or stated "simple random allocation" as their method and were categorised as unclear.
Allocation concealment
Shi 2012 and Sircar 2015 stated methods for allocation concealment, which were opaque envelopes, and were judged to be at low risk of bias. All other studies were categorised as unclear.
Blinding
For participants and investigators (performance bias), six studies were open‐label and were classified as high risk (Goicoechea 2010; Kanbay 2011; Sarris 2007; Shi 2012; Siu 2006; Tuta 2006). Two studies reported blinding (Momeni 2010; Sircar 2015) and were classified as low risk; all other studies were unclear. Some of these included placebo treatment, but blinding remained unstated.
For outcome assessment, blinding was classified as low risk for two studies (Goicoechea 2010; Kanbay 2011). All other studies were classified as unclear.
Incomplete outcome data
Three studies were categorised as high risk for incomplete outcomes due exclusion of participants from the final analysis (Momeni 2010; Siu 2006) or more than 10% were lost to follow‐up (Sircar 2015). Seven studies were classified as low risk (Dogan 2011; Gibson 1980; Goicoechea 2010; Kanbay 2011; OPT‐CHF Study 2004; Shi 2012; Tuta 2006) as they accounted for all outcomes on all patients. Two studies were categorised as unclear (Bergamini 2010; Sarris 2007).
Selective reporting
Five studies were classified as low risk (Dogan 2011; Gibson 1980; Momeni 2010; Sircar 2015; Siu 2006). Four studies were at high risk of reporting bias; two were abstract‐only publications with no full text publication 10 years after abstracts were presented (Sarris 2007; Tuta 2006), and two did not report all data in a way that could be meta‐analysed (Goicoechea 2010; Shi 2012 ). The remaining three studies were classified as unclear.
Other potential sources of bias
Two studies were classified as high risk; one study was funded by Pharma (OPT‐CHF Study 2004) and one study author had patent pending applications related to the treatment under investigation (Shi 2012). One study clearly stated that there was no influence by Pharma on design, data collection, decision to publish or preparation of the manuscript (Sircar 2015) (low risk). The remaining nine studies were classified as unclear.
Effects of interventions
See: Table 1
Primary outcomes
End‐stage kidney failure (need for dialysis)
Uric acid lowering therapy may make little of no difference (low certainty evidence) in the incidence of ESKD at one year (Analysis 1.1.1 (1 study, 51 participants): RR 1.04, 95% CI 0.07 to 15.74), two years (Analysis 1.1.2 (2 studies, 220 participants): RR 0.40, 95% CI 0.05 to 3.00; I2 = 0%), or seven years (Analysis 1.1.3 (1 study, 116 participants): RR 0.56, 95% CI 0.24 to 1.30).
1.1. Analysis.
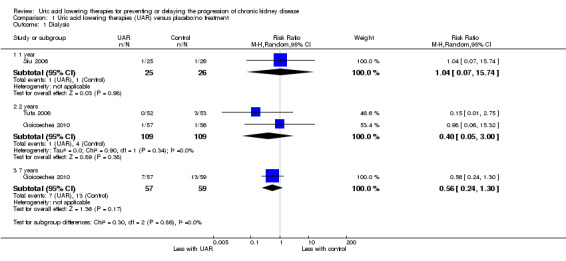
Comparison 1 Uric acid lowering therapies (UAR) versus placebo/no treatment, Outcome 1 Dialysis.
Serum creatinine
Uric acid lowering therapy may reduce SCr at one year (Analysis 1.2 (2 studies, 83 participants) MD ‐73.35 µmol/L, 95% CI ‐107.28 to ‐39.41; I2 = 0%; low certainty evidence).
1.2. Analysis.
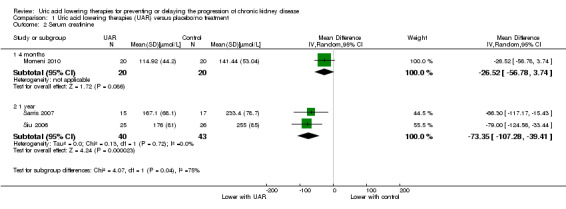
Comparison 1 Uric acid lowering therapies (UAR) versus placebo/no treatment, Outcome 2 Serum creatinine.
Glomerular filtration rate
GFR was probably increased with uric acid lowering therapy at six months (Analysis 1.3.2 (3 studies, 246 participants): MD 4.91 mL/min, 95% CI 1.06 to 8.76; I2 = 0%) and one year (Analysis 1.3.3 (1 study, 113 participants): MD 5.50 mL/min, 95% CI 0.59 to 10.41), but probably makes little or no difference at two (Analysis 1.3.4 (2 studies, 164 participants): MD 4.00 mL/min, 95% CI ‐3.28 to 11.28; I2 = 39%) or five years (Analysis 1.3.5 (1 study, 107 participants): MD 2.70 mL/min, 95% CI ‐2.55 to 7.95) (moderated certainty evidence).
1.3. Analysis.
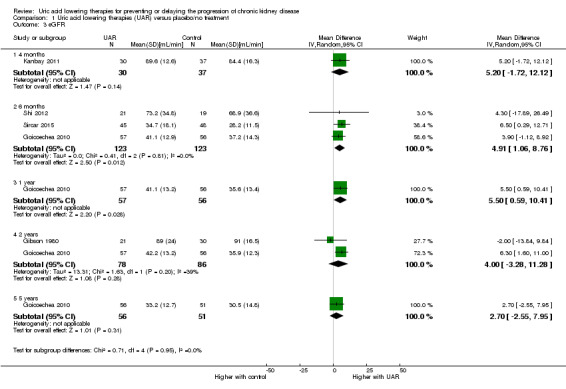
Comparison 1 Uric acid lowering therapies (UAR) versus placebo/no treatment, Outcome 3 eGFR.
Secondary outcomes
Death
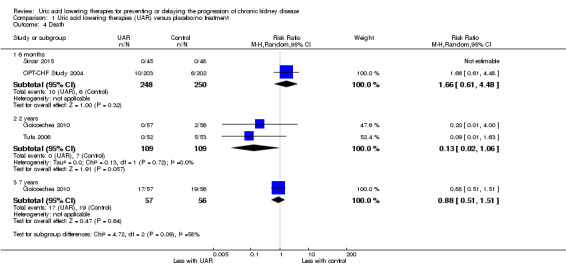
Uric acid lowering therapy may make little or no difference in death at six months (Analysis 1.4.1 (2 studies, 498 participants): RR 1.66, 95% CI 0.61 to 4.48; I2 = 0%), two years (Analysis 1.4.2 (2 studies, 220 participants): RR 0.13, 95% CI 0.02 to 1.06; I2 = 0%), or seven years (Analysis 1.4.3 (1 study, 113 participants): RR 0.88, 95% CI 0.51 to 1.51) (low certainty evidence).
1.4. Analysis.
Comparison 1 Uric acid lowering therapies (UAR) versus placebo/no treatment, Outcome 4 Death.
Blood pressure
Uric acid lowering therapy may make little or no difference blood pressure (both systolic and diastolic) at all time points (Analysis 1.5; Analysis 1.6) (low certainty evidence).
1.5. Analysis.
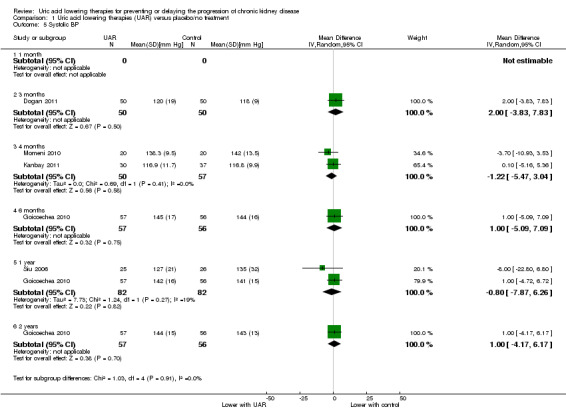
Comparison 1 Uric acid lowering therapies (UAR) versus placebo/no treatment, Outcome 5 Systolic BP.
1.6. Analysis.
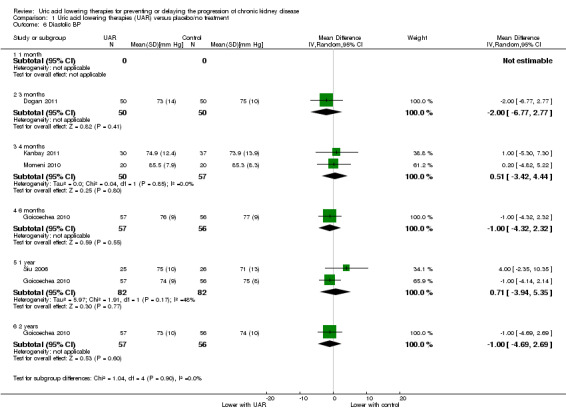
Comparison 1 Uric acid lowering therapies (UAR) versus placebo/no treatment, Outcome 6 Diastolic BP.
Shi 2012 reported more patients reduced antihypertensive therapy in the allopurinol group (7/9) compared to the control group (0/9) (P = 0.0007).
Hospitalisation
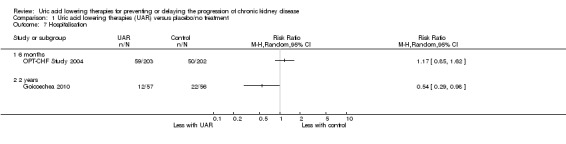
Hospitalisation may be slightly decreased with uric acid lowering therapy at two years (Analysis 1.7.2 (1 study, 113 participants): RR 0.54, 95% CI 0.29 to 0.98) but may make little of no difference at six months (Analysis 1.7.1 (1 study, 405 participants): RR 1.17, 95% CI 0.85 to 1.62) (low certainty evidence).
1.7. Analysis.
Comparison 1 Uric acid lowering therapies (UAR) versus placebo/no treatment, Outcome 7 Hospitalisation.
Adverse events
Uric acid lowering therapy may make little or no difference in the occurrence of adverse events, including cardiovascular events, gastrointestinal upset, heart failure hospitalisation, and rash (Analysis 1.8) (low certainty evidence).
1.8. Analysis.
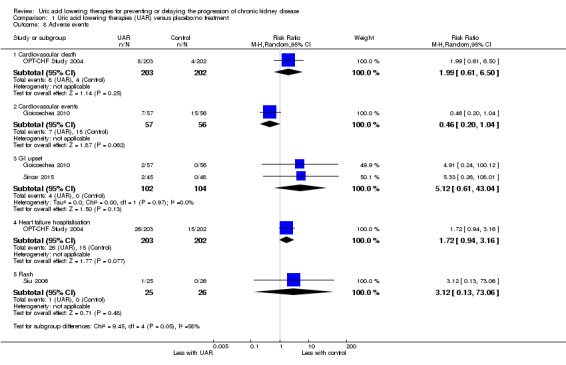
Comparison 1 Uric acid lowering therapies (UAR) versus placebo/no treatment, Outcome 8 Adverse events.
C‐reactive protein
Uric acid lowering therapy may increase CRP at one year (Analysis 1.9.3 (1 study, 51 participants): MD 7.20 mg/L, 95% CI 2.27 to 12.13) but not at three of four months (low certainty evidence).
1.9. Analysis.
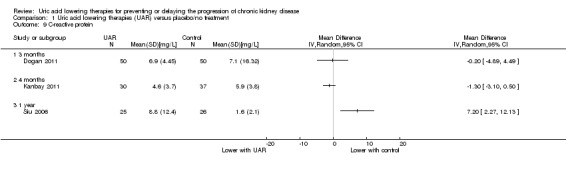
Comparison 1 Uric acid lowering therapies (UAR) versus placebo/no treatment, Outcome 9 C‐reactive protein.
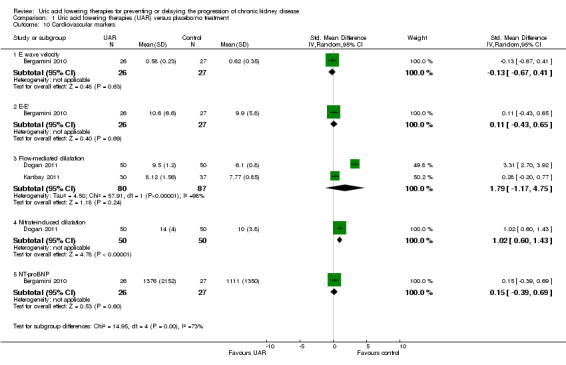
Cardiovascular markers
Uric acid lowering therapy may make little or no difference to CV markers with the exception of nitrate‐induced dilatation which improved in Dogan 2011 (Analysis 1.10.5 (100 participants): MD 4.00, 95% CI 2.47 to 5.53).
The CV marker results are difficult to interpret. Nitrate‐induced dilatation appears to be improved in a single study; however baseline measures differed between the groups with the control group starting with a higher value at 12, compared to the urate lowering therapy group's 10. During the study the results then crossed over with the urate lowering therapy group rising to 14 and the control falling to 10. With a SD of 7.5 in the uric acid lowering therapy group and 9.5 in the control group at baseline, it seems highly unlikely that there was a significant change from baseline in the subsequent results. None of the other markers gave a significant result. There were several studies whose data in this area were poorly reported giving only changes in means within groups. This limited the available data which could be analysed in this review.
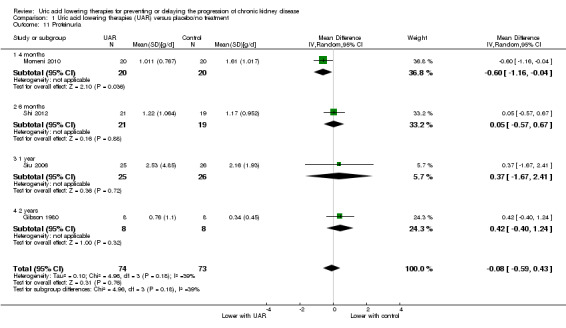
Proteinuria
Uric acid lowering therapy may make little or no difference in proteinuria across all the studies and time points (Analysis 1.11 (4 studies, 147 participants): MD ‐0.08 g/d, 95% CI ‐0.59 to 0.43; I2 = 39%) (low certainty evidence).
Uric acid
Uric acid lowering therapy reduced uric acid levels at all time points (Analysis 1.12 (2 years, 2 studies, 163 participants): MD ‐89.49 µmol/L, 95% CI ‐115.62 to ‐63.36; I2 = 0%) (high certainty evidence).
1.12. Analysis.
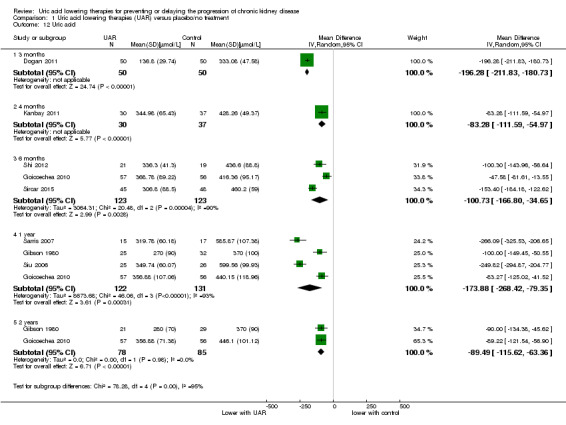
Comparison 1 Uric acid lowering therapies (UAR) versus placebo/no treatment, Outcome 12 Uric acid.
Discussion
Summary of main results
There is currently limited low quality evidence that uric acid lowering therapies prevent or delay progression of CKD. After one year of therapy SCr may be reduced by an average of 73 µmol/L and eGFR increased by approximately 5.5 mL/min. These results are based on only a small number of studies and the magnitude of the apparent benefit was clinically small. There is no evidence for an increasing effect over time with all analyses showing a similar magnitude of effect.
There is no randomised evidence suggesting uric acid lowering therapy reduces blood pressure. The data may have been compromised by the reduction of antihypertensive agents during studies. Shi 2012 medications were reduced in a significant number of patients over time but the measured blood pressures in other studies did not reflect better controlled blood pressure while on treatment.
Other measures of inflammation and cardiovascular endpoints did not reveal any therapeutic impact. The CV endpoints such as flow‐mediated dilatation are often poorly standardised tests with high variability in measurements. Several studies reported only changes in these measurements with no report of primary data to enable their comparison across studies. Several studies showed baseline data which differed markedly between the groups, with very high SD within each group (e.g. NT‐ProBNP in Bergamini 2010 and NID in Dogan 2011).
Overall completeness and applicability of evidence
This review gives a complete picture of current RCT data in the area of CKD progression and uric acid lowering therapy. There is a very limited amount of data and the applicability of the data is currently open to question. The populations included in the studies are highly varied with some studies including only patients with kidney failure, others excluding them. Uric acid lowering therapy is tests in heart failure patients to prevent hospital admission and in proteinuric patients without kidney failure to prevent progression. The data available therefore represents a range of included patients and indications for urate lowering therapy. The data represented in the review can therefore not be said to apply to a single population or clinical situation. It does however represent the current best available data to answer the current question.
Quality of the evidence
None of the studies were classified as high quality in all areas of assessment. Multiple studies appear to have at least omitted reporting the design of their study, including allocation concealment and randomisation processes. The inclusion of a placebo was evident in some studies but who was blinded and to what was not apparent in the report. In many cases the studies may have been of high quality but the report was not.
Reporting bias was evident some studies which compared outcomes within a group at the start and the end of a study. This appears to have been an attempt to show a significant result when none was otherwise apparent. These are negative studies which have managed to be reported, reducing the alternative publication bias.
Potential biases in the review process
We have not identified any major bias in our process. There is clearly the risk of publication bias, with negative studies remaining unpublished unless they selectively report a positive outcome. Other standard sources of bias in a systematic review remain a possibility including the difficulty identifying studies published in languages other than English.
Agreements and disagreements with other studies or reviews
Our conclusions are in agreement with the systematic review carried out by Bose 2013, which concluded that allopurinol treatment abrogated a rise in SCr over time in treated patients with no impact on death, ESKD, blood pressure or proteinuria.
Authors' conclusions
Implications for practice.
Currently there is no evidence supporting a change in practice in treating asymptomatic hyperuricaemia for prevention of progression of CKD.
Implications for research.
This question needs to be the subject of large high quality RCTs such as the recently launched CKD‐FIX Study 2011 from the Australian Kidney Trials Network, the PERL Study 2013 in the USA and the FEATHER Study 2014. CKD‐FIX Study 2011 is enrolling patients considered at high risk of CKD progression whilst PERL Study 2013 focuses on type I diabetes and CKD progression. The FEATHER Study 2014 is randomising CKD class III patients with hyperuricaemia but no gout.
Acknowledgements
We would like to thank the referees for their feedback and advice during the preparation of this review.
Appendices
Appendix 1. Electronic search strategies
| Database | Search terms |
| CENTRAL |
|
| MEDLINE |
|
| EMBASE |
|
Appendix 2. Risk of bias assessment tool
| Potential source of bias | Assessment criteria |
|
Random sequence generation Selection bias (biased allocation to interventions) due to inadequate generation of a randomised sequence |
Low risk of bias: Random number table; computer random number generator; coin tossing; shuffling cards or envelopes; throwing dice; drawing of lots; minimisation (minimisation may be implemented without a random element, and this is considered to be equivalent to being random) |
| High risk of bias: Sequence generated by odd or even date of birth; date (or day) of admission; sequence generated by hospital or clinic record number; allocation by judgement of the clinician; by preference of the participant; based on the results of a laboratory test or a series of tests; by availability of the intervention | |
| Unclear: Insufficient information about the sequence generation process to permit judgement | |
|
Allocation concealment Selection bias (biased allocation to interventions) due to inadequate concealment of allocations prior to assignment |
Low risk of bias: Randomisation method described that would not allow investigator/participant to know or influence intervention group before eligible participant entered in the study (e.g. central allocation, including telephone, web‐based, and pharmacy‐controlled, randomisation; sequentially numbered drug containers of identical appearance; sequentially numbered, opaque, sealed envelopes) |
| High risk of bias: Using an open random allocation schedule (e.g. a list of random numbers); assignment envelopes were used without appropriate safeguards (e.g. if envelopes were unsealed or non‐opaque or not sequentially numbered); alternation or rotation; date of birth; case record number; any other explicitly unconcealed procedure | |
| Unclear: Randomisation stated but no information on method used is available | |
|
Blinding of participants and personnel Performance bias due to knowledge of the allocated interventions by participants and personnel during the study |
Low risk of bias: No blinding or incomplete blinding, but the review authors judge that the outcome is not likely to be influenced by lack of blinding; blinding of participants and key study personnel ensured, and unlikely that the blinding could have been broken |
| High risk of bias: No blinding or incomplete blinding, and the outcome is likely to be influenced by lack of blinding; blinding of key study participants and personnel attempted, but likely that the blinding could have been broken, and the outcome is likely to be influenced by lack of blinding | |
| Unclear: Insufficient information to permit judgement | |
|
Blinding of outcome assessment Detection bias due to knowledge of the allocated interventions by outcome assessors. |
Low risk of bias: No blinding of outcome assessment, but the review authors judge that the outcome measurement is not likely to be influenced by lack of blinding; blinding of outcome assessment ensured, and unlikely that the blinding could have been broken |
| High risk of bias: No blinding of outcome assessment, and the outcome measurement is likely to be influenced by lack of blinding; blinding of outcome assessment, but likely that the blinding could have been broken, and the outcome measurement is likely to be influenced by lack of blinding | |
| Unclear: Insufficient information to permit judgement | |
|
Incomplete outcome data Attrition bias due to amount, nature or handling of incomplete outcome data. |
Low risk of bias: No missing outcome data; reasons for missing outcome data unlikely to be related to true outcome (for survival data, censoring unlikely to be introducing bias); missing outcome data balanced in numbers across intervention groups, with similar reasons for missing data across groups; for dichotomous outcome data, the proportion of missing outcomes compared with observed event risk not enough to have a clinically relevant impact on the intervention effect estimate; for continuous outcome data, plausible effect size (difference in means or standardised difference in means) among missing outcomes not enough to have a clinically relevant impact on observed effect size; missing data have been imputed using appropriate methods |
| High risk of bias: Reason for missing outcome data likely to be related to true outcome, with either imbalance in numbers or reasons for missing data across intervention groups; for dichotomous outcome data, the proportion of missing outcomes compared with observed event risk enough to induce clinically relevant bias in intervention effect estimate; for continuous outcome data, plausible effect size (difference in means or standardised difference in means) among missing outcomes enough to induce clinically relevant bias in observed effect size; ‘as‐treated’ analysis done with substantial departure of the intervention received from that assigned at randomisation; potentially inappropriate application of simple imputation | |
| Unclear: Insufficient information to permit judgement | |
|
Selective reporting Reporting bias due to selective outcome reporting |
Low risk of bias: The study protocol is available and all of the study’s pre‐specified (primary and secondary) outcomes that are of interest in the review have been reported in the pre‐specified way; the study protocol is not available but it is clear that the published reports include all expected outcomes, including those that were pre‐specified (convincing text of this nature may be uncommon) |
| High risk of bias: Not all of the study’s pre‐specified primary outcomes have been reported; one or more primary outcomes is reported using measurements, analysis methods or subsets of the data (e.g. subscales) that were not pre‐specified; one or more reported primary outcomes were not pre‐specified (unless clear justification for their reporting is provided, such as an unexpected adverse effect); one or more outcomes of interest in the review are reported incompletely so that they cannot be entered in a meta‐analysis; the study report fails to include results for a key outcome that would be expected to have been reported for such a study | |
| Unclear: Insufficient information to permit judgement | |
|
Other bias Bias due to problems not covered elsewhere in the table |
Low risk of bias: The study appears to be free of other sources of bias |
| High risk of bias: Had a potential source of bias related to the specific study design used; stopped early due to some data‐dependent process (including a formal‐stopping rule); had extreme baseline imbalance; has been claimed to have been fraudulent; had some other problem | |
| Unclear: Insufficient information to assess whether an important risk of bias exists; insufficient rationale or evidence that an identified problem will introduce bias |
Data and analyses
Comparison 1. Uric acid lowering therapies (UAR) versus placebo/no treatment.
| Outcome or subgroup title | No. of studies | No. of participants | Statistical method | Effect size |
|---|---|---|---|---|
| 1 Dialysis | 3 | Risk Ratio (M‐H, Random, 95% CI) | Subtotals only | |
| 1.1 1 year | 1 | 51 | Risk Ratio (M‐H, Random, 95% CI) | 1.04 [0.07, 15.74] |
| 1.2 2 years | 2 | 218 | Risk Ratio (M‐H, Random, 95% CI) | 0.40 [0.05, 3.00] |
| 1.3 7 years | 1 | 116 | Risk Ratio (M‐H, Random, 95% CI) | 0.56 [0.24, 1.30] |
| 2 Serum creatinine | 3 | Mean Difference (IV, Random, 95% CI) | Subtotals only | |
| 2.1 4 months | 1 | 40 | Mean Difference (IV, Random, 95% CI) | ‐26.52 [‐56.78, 3.74] |
| 2.2 1 year | 2 | 83 | Mean Difference (IV, Random, 95% CI) | ‐73.35 [‐107.28, ‐39.41] |
| 3 eGFR | 5 | Mean Difference (IV, Random, 95% CI) | Subtotals only | |
| 3.1 4 months | 1 | 67 | Mean Difference (IV, Random, 95% CI) | 5.20 [‐1.72, 12.12] |
| 3.2 6 months | 3 | 246 | Mean Difference (IV, Random, 95% CI) | 4.91 [1.06, 8.76] |
| 3.3 1 year | 1 | 113 | Mean Difference (IV, Random, 95% CI) | 5.5 [0.59, 10.41] |
| 3.4 2 years | 2 | 164 | Mean Difference (IV, Random, 95% CI) | 4.00 [‐3.28, 11.28] |
| 3.5 5 years | 1 | 107 | Mean Difference (IV, Random, 95% CI) | 2.70 [‐2.55, 7.95] |
| 4 Death | 4 | Risk Ratio (M‐H, Random, 95% CI) | Subtotals only | |
| 4.1 6 months | 2 | 498 | Risk Ratio (M‐H, Random, 95% CI) | 1.66 [0.61, 4.48] |
| 4.2 2 years | 2 | 218 | Risk Ratio (M‐H, Random, 95% CI) | 0.13 [0.02, 1.06] |
| 4.3 7 years | 1 | 113 | Risk Ratio (M‐H, Random, 95% CI) | 0.88 [0.51, 1.51] |
| 5 Systolic BP | 5 | Mean Difference (IV, Random, 95% CI) | Subtotals only | |
| 5.1 1 month | 0 | 0 | Mean Difference (IV, Random, 95% CI) | 0.0 [0.0, 0.0] |
| 5.2 3 months | 1 | 100 | Mean Difference (IV, Random, 95% CI) | 2.0 [‐3.83, 7.83] |
| 5.3 4 months | 2 | 107 | Mean Difference (IV, Random, 95% CI) | ‐1.22 [‐5.47, 3.04] |
| 5.4 6 months | 1 | 113 | Mean Difference (IV, Random, 95% CI) | 1.0 [‐5.09, 7.09] |
| 5.5 1 year | 2 | 164 | Mean Difference (IV, Random, 95% CI) | ‐0.80 [‐7.87, 6.26] |
| 5.6 2 years | 1 | 113 | Mean Difference (IV, Random, 95% CI) | 1.0 [‐4.17, 6.17] |
| 6 Diastolic BP | 5 | Mean Difference (IV, Random, 95% CI) | Subtotals only | |
| 6.1 1 month | 0 | 0 | Mean Difference (IV, Random, 95% CI) | 0.0 [0.0, 0.0] |
| 6.2 3 months | 1 | 100 | Mean Difference (IV, Random, 95% CI) | ‐2.0 [‐6.77, 2.77] |
| 6.3 4 months | 2 | 107 | Mean Difference (IV, Random, 95% CI) | 0.51 [‐3.42, 4.44] |
| 6.4 6 months | 1 | 113 | Mean Difference (IV, Random, 95% CI) | ‐1.0 [‐4.32, 2.32] |
| 6.5 1 year | 2 | 164 | Mean Difference (IV, Random, 95% CI) | 0.71 [‐3.94, 5.35] |
| 6.6 2 years | 1 | 113 | Mean Difference (IV, Random, 95% CI) | ‐1.0 [‐4.69, 2.69] |
| 7 Hospitalisation | 2 | Risk Ratio (M‐H, Random, 95% CI) | Totals not selected | |
| 7.1 6 months | 1 | Risk Ratio (M‐H, Random, 95% CI) | 0.0 [0.0, 0.0] | |
| 7.2 2 years | 1 | Risk Ratio (M‐H, Random, 95% CI) | 0.0 [0.0, 0.0] | |
| 8 Adverse events | 4 | Risk Ratio (M‐H, Random, 95% CI) | Subtotals only | |
| 8.1 Cardiovascular death | 1 | 405 | Risk Ratio (M‐H, Random, 95% CI) | 1.99 [0.61, 6.50] |
| 8.2 Cardiovascular events | 1 | 113 | Risk Ratio (M‐H, Random, 95% CI) | 0.46 [0.20, 1.04] |
| 8.3 GI upset | 2 | 206 | Risk Ratio (M‐H, Random, 95% CI) | 5.12 [0.61, 43.04] |
| 8.4 Heart failure hospitalisation | 1 | 405 | Risk Ratio (M‐H, Random, 95% CI) | 1.72 [0.94, 3.16] |
| 8.5 Rash | 1 | 51 | Risk Ratio (M‐H, Random, 95% CI) | 3.12 [0.13, 73.06] |
| 9 C‐reactive protein | 3 | Mean Difference (IV, Random, 95% CI) | Totals not selected | |
| 9.1 3 months | 1 | Mean Difference (IV, Random, 95% CI) | 0.0 [0.0, 0.0] | |
| 9.2 4 months | 1 | Mean Difference (IV, Random, 95% CI) | 0.0 [0.0, 0.0] | |
| 9.3 1 year | 1 | Mean Difference (IV, Random, 95% CI) | 0.0 [0.0, 0.0] | |
| 10 Cardiovascular markers | 3 | Std. Mean Difference (IV, Random, 95% CI) | Subtotals only | |
| 10.1 E wave velocity | 1 | 53 | Std. Mean Difference (IV, Random, 95% CI) | ‐0.13 [‐0.67, 0.41] |
| 10.2 E‐E' | 1 | 53 | Std. Mean Difference (IV, Random, 95% CI) | 0.11 [‐0.43, 0.65] |
| 10.3 Flow‐mediated dilatation | 2 | 167 | Std. Mean Difference (IV, Random, 95% CI) | 1.79 [‐1.17, 4.75] |
| 10.4 Nitrate‐induced dilatation | 1 | 100 | Std. Mean Difference (IV, Random, 95% CI) | 1.02 [0.60, 1.43] |
| 10.5 NT‐proBNP | 1 | 53 | Std. Mean Difference (IV, Random, 95% CI) | 0.15 [‐0.39, 0.69] |
| 11 Proteinuria | 4 | 147 | Mean Difference (IV, Random, 95% CI) | ‐0.08 [‐0.59, 0.43] |
| 11.1 4 months | 1 | 40 | Mean Difference (IV, Random, 95% CI) | ‐0.60 [‐1.16, ‐0.04] |
| 11.2 6 months | 1 | 40 | Mean Difference (IV, Random, 95% CI) | 0.05 [‐0.57, 0.67] |
| 11.3 1 year | 1 | 51 | Mean Difference (IV, Random, 95% CI) | 0.37 [‐1.67, 2.41] |
| 11.4 2 years | 1 | 16 | Mean Difference (IV, Random, 95% CI) | 0.42 [‐0.40, 1.24] |
| 12 Uric acid | 8 | Mean Difference (IV, Random, 95% CI) | Subtotals only | |
| 12.1 3 months | 1 | 100 | Mean Difference (IV, Random, 95% CI) | ‐196.28 [‐211.83, ‐180.73] |
| 12.2 4 months | 1 | 67 | Mean Difference (IV, Random, 95% CI) | ‐83.28 [‐111.59, ‐54.97] |
| 12.3 6 months | 3 | 246 | Mean Difference (IV, Random, 95% CI) | ‐100.73 [‐166.80, ‐34.65] |
| 12.4 1 year | 4 | 253 | Mean Difference (IV, Random, 95% CI) | ‐173.88 [‐268.42, ‐79.35] |
| 12.5 2 years | 2 | 163 | Mean Difference (IV, Random, 95% CI) | ‐89.49 [‐115.62, ‐63.36] |
1.10. Analysis.
Comparison 1 Uric acid lowering therapies (UAR) versus placebo/no treatment, Outcome 10 Cardiovascular markers.
1.11. Analysis.
Comparison 1 Uric acid lowering therapies (UAR) versus placebo/no treatment, Outcome 11 Proteinuria.
Characteristics of studies
Characteristics of included studies [ordered by study ID]
Bergamini 2010.
| Methods |
|
|
| Participants |
|
|
| Interventions | Treatment group
Control group
Co‐interventions: not reported |
|
| Outcomes |
|
|
| Notes |
|
|
| Risk of bias | ||
| Bias | Authors' judgement | Support for judgement |
| Random sequence generation (selection bias) | Unclear risk | Study was described as randomised, method of randomisation was not reported |
| Allocation concealment (selection bias) | Unclear risk | Insufficient information to permit judgement |
| Blinding of participants and personnel (performance bias) All outcomes | Unclear risk | Insufficient information to permit judgement |
| Blinding of outcome assessment (detection bias) All outcomes | Unclear risk | Insufficient information to permit judgement |
| Incomplete outcome data (attrition bias) All outcomes | Unclear risk | Insufficient information to permit judgement |
| Selective reporting (reporting bias) | Unclear risk | Insufficient information to permit judgement |
| Other bias | Unclear risk | Insufficient information to permit judgement |
Dogan 2011.
| Methods |
|
|
| Participants |
|
|
| Interventions | Treatment group
Control group
Co‐interventions
|
|
| Outcomes |
|
|
| Notes |
|
|
| Risk of bias | ||
| Bias | Authors' judgement | Support for judgement |
| Random sequence generation (selection bias) | Unclear risk | Study was described as randomised, method of randomisation was not reported |
| Allocation concealment (selection bias) | Unclear risk | Insufficient information to permit judgement |
| Blinding of participants and personnel (performance bias) All outcomes | Unclear risk | Stated single‐blinded |
| Blinding of outcome assessment (detection bias) All outcomes | Unclear risk | Stated‐single‐blinded |
| Incomplete outcome data (attrition bias) All outcomes | Low risk | All patient outcome data reported |
| Selective reporting (reporting bias) | Low risk | All expected outcomes reported |
| Other bias | Unclear risk | Insufficient information to permit judgement |
Gibson 1980.
| Methods |
|
|
| Participants |
|
|
| Interventions | Treatment group
Control group
Co‐interventions: not reported |
|
| Outcomes |
|
|
| Notes |
|
|
| Risk of bias | ||
| Bias | Authors' judgement | Support for judgement |
| Random sequence generation (selection bias) | Unclear risk | Study was described as randomised, method of randomisation was not reported |
| Allocation concealment (selection bias) | Unclear risk | Insufficient information to permit judgement |
| Blinding of participants and personnel (performance bias) All outcomes | Unclear risk | Insufficient information to permit judgement |
| Blinding of outcome assessment (detection bias) All outcomes | Unclear risk | Insufficient information to permit judgement |
| Incomplete outcome data (attrition bias) All outcomes | Low risk | One patient was withdrawn from the randomisation schedule and given allopurinol because he had large tophi ‐ all other patient data reported |
| Selective reporting (reporting bias) | Low risk | All expected outcomes reported |
| Other bias | Unclear risk | Insufficient information to permit judgement |
Goicoechea 2010.
| Methods |
|
|
| Participants |
|
|
| Interventions | Treatment group
Control group
Co‐interventions: not reported |
|
| Outcomes |
|
|
| Notes |
|
|
| Risk of bias | ||
| Bias | Authors' judgement | Support for judgement |
| Random sequence generation (selection bias) | Low risk | Computer generated list |
| Allocation concealment (selection bias) | Unclear risk | Insufficient information to permit judgement |
| Blinding of participants and personnel (performance bias) All outcomes | High risk | Open‐label study |
| Blinding of outcome assessment (detection bias) All outcomes | Low risk | The laboratory researcher was unaware of the baseline clinical status of the patients |
| Incomplete outcome data (attrition bias) All outcomes | Low risk | All patient data reported |
| Selective reporting (reporting bias) | High risk | All expected outcomes reported; SD not reported for CRP |
| Other bias | Unclear risk | Insufficient information to permit judgement |
Kanbay 2011.
| Methods |
|
|
| Participants |
|
|
| Interventions | Treatment group
Control group
Co‐interventions: not reported |
|
| Outcomes |
|
|
| Notes |
|
|
| Risk of bias | ||
| Bias | Authors' judgement | Support for judgement |
| Random sequence generation (selection bias) | Low risk | Computer generated random numbers |
| Allocation concealment (selection bias) | Unclear risk | Insufficient information to permit judgement |
| Blinding of participants and personnel (performance bias) All outcomes | High risk | Open‐label study |
| Blinding of outcome assessment (detection bias) All outcomes | Unclear risk | Flow‐mediated dilatation technician blinded |
| Incomplete outcome data (attrition bias) All outcomes | Low risk | All patients accounted for |
| Selective reporting (reporting bias) | Unclear risk | Not clear why the study has 4 month outcomes when they introduced it as a 7 month study |
| Other bias | Unclear risk | Insufficient information to permit judgement |
Momeni 2010.
| Methods |
|
|
| Participants |
|
|
| Interventions | Treatment group
Control group
Co‐interventions
|
|
| Outcomes |
|
|
| Notes |
|
|
| Risk of bias | ||
| Bias | Authors' judgement | Support for judgement |
| Random sequence generation (selection bias) | Unclear risk | "simple random allocation" so that there were 20 patients in each group |
| Allocation concealment (selection bias) | Unclear risk | Insufficient information to permit judgement |
| Blinding of participants and personnel (performance bias) All outcomes | Low risk | "Double‐blinded" |
| Blinding of outcome assessment (detection bias) All outcomes | Unclear risk | Insufficient information to permit judgement |
| Incomplete outcome data (attrition bias) All outcomes | High risk | 4 patients (2 in each group) were excluded due to non‐compliance |
| Selective reporting (reporting bias) | Low risk | All expected outcomes reported |
| Other bias | Unclear risk | Insufficient information to permit judgement |
OPT‐CHF Study 2004.
| Methods |
|
|
| Participants |
|
|
| Interventions | Treatment group
Control group
Co‐interventions |
|
| Outcomes |
|
|
| Notes |
|
|
| Risk of bias | ||
| Bias | Authors' judgement | Support for judgement |
| Random sequence generation (selection bias) | Unclear risk | Study was described as randomised, method of randomisation was not reported |
| Allocation concealment (selection bias) | Unclear risk | Insufficient information to permit judgement |
| Blinding of participants and personnel (performance bias) All outcomes | Unclear risk | Placebo used but otherwise blinding not reported |
| Blinding of outcome assessment (detection bias) All outcomes | Unclear risk | Insufficient information to permit judgement |
| Incomplete outcome data (attrition bias) All outcomes | Low risk | Last entry carried forward; "51 patients did not complete the study through to the 24‐week visit, 22 withdrew consent, 15 died, and 14 discontinued for other reasons. Where possible, every effort was made to determine the 24‐week status of all patients who withdrew from the study" |
| Selective reporting (reporting bias) | Unclear risk | All expected outcomes reported |
| Other bias | High risk | Multiple analyses performed with post hoc analyses; funded by Pharma |
Sarris 2007.
| Methods |
|
|
| Participants |
|
|
| Interventions | Treatment group
Control group
Co‐interventions
|
|
| Outcomes |
|
|
| Notes |
|
|
| Risk of bias | ||
| Bias | Authors' judgement | Support for judgement |
| Random sequence generation (selection bias) | Unclear risk | Patients "randomly assigned", method of randomisation was not reported |
| Allocation concealment (selection bias) | Unclear risk | Insufficient information to permit judgement |
| Blinding of participants and personnel (performance bias) All outcomes | High risk | Open‐label study |
| Blinding of outcome assessment (detection bias) All outcomes | Unclear risk | Insufficient information to permit judgement |
| Incomplete outcome data (attrition bias) All outcomes | Unclear risk | Insufficient information to permit judgement |
| Selective reporting (reporting bias) | High risk | No protocol published; no full text publication 10 years after abstract presented |
| Other bias | Unclear risk | Insufficient information to permit judgement |
Shi 2012.
| Methods |
|
|
| Participants |
|
|
| Interventions | Treatment group
Control group
Co‐interventions
|
|
| Outcomes |
|
|
| Notes |
|
|
| Risk of bias | ||
| Bias | Authors' judgement | Support for judgement |
| Random sequence generation (selection bias) | Unclear risk | Study was described as randomised, method of randomisation was not reported |
| Allocation concealment (selection bias) | Low risk | Sequentially numbered opaque closed envelopes |
| Blinding of participants and personnel (performance bias) All outcomes | High risk | Open‐label study |
| Blinding of outcome assessment (detection bias) All outcomes | Unclear risk | Insufficient information to permit judgement |
| Incomplete outcome data (attrition bias) All outcomes | Low risk | All patient accounted for and included in the analyses |
| Selective reporting (reporting bias) | High risk | Unable to meta‐analysed blood pressure data |
| Other bias | High risk | "Dr. Johnson has patent applications pending with the University of Florida and University of Washington related to lowering uric acid for subjects with hypertension or metabolic syndrome." |
Sircar 2015.
| Methods |
|
|
| Participants |
|
|
| Interventions | Treatment group
Control group
Co‐interventions
|
|
| Outcomes |
|
|
| Notes |
|
|
| Risk of bias | ||
| Bias | Authors' judgement | Support for judgement |
| Random sequence generation (selection bias) | Low risk | "A computer‐generated random‐number table was used for allocation of individuals to the study drug and placebo in a 1:1 ratio" |
| Allocation concealment (selection bias) | Low risk | "Allocation concealment was done by sealed sequentially numbered opaque envelopes. They were consecutively numbered and bottles were given out according to the number allocated to the participant" |
| Blinding of participants and personnel (performance bias) All outcomes | Low risk | "...given out according to the number allocated to the participant. The investigator was blinded to the allotment as the procedure was carried out by a third person" |
| Blinding of outcome assessment (detection bias) All outcomes | Unclear risk | Insufficient information to permit judgement |
| Incomplete outcome data (attrition bias) All outcomes | High risk | More than 10% of patients either withdrew or were lost to follow‐up |
| Selective reporting (reporting bias) | Low risk | All outcome data reported |
| Other bias | Low risk | Study appears free of other biases |
Siu 2006.
| Methods |
|
|
| Participants |
|
|
| Interventions | Treatment group
Control group
Co‐interventions
|
|
| Outcomes |
|
|
| Notes |
|
|
| Risk of bias | ||
| Bias | Authors' judgement | Support for judgement |
| Random sequence generation (selection bias) | Low risk | Computer generated list |
| Allocation concealment (selection bias) | Unclear risk | Insufficient information to permit judgement |
| Blinding of participants and personnel (performance bias) All outcomes | High risk | Open‐label study |
| Blinding of outcome assessment (detection bias) All outcomes | Unclear risk | Insufficient information to permit judgement |
| Incomplete outcome data (attrition bias) All outcomes | High risk | Three patients excluded |
| Selective reporting (reporting bias) | Low risk | All outcome data reported |
| Other bias | Unclear risk | Insufficient information to permit judgement |
Tuta 2006.
| Methods |
|
|
| Participants |
|
|
| Interventions | Treatment group
Control group
|
|
| Outcomes |
|
|
| Notes |
|
|
| Risk of bias | ||
| Bias | Authors' judgement | Support for judgement |
| Random sequence generation (selection bias) | Unclear risk | Insufficient information to permit judgement |
| Allocation concealment (selection bias) | Unclear risk | Insufficient information to permit judgement |
| Blinding of participants and personnel (performance bias) All outcomes | High risk | Open‐label study |
| Blinding of outcome assessment (detection bias) All outcomes | Unclear risk | Insufficient information to permit judgement |
| Incomplete outcome data (attrition bias) All outcomes | Low risk | All patients accounted for |
| Selective reporting (reporting bias) | High risk | No extractable data reported for BP, SCr, GFR, uric acid; no full text publication 10 years after abstract presented |
| Other bias | Unclear risk | Insufficient information to permit judgement |
ACEi ‐ angiotensin converting enzyme inhibitor(s); ARB ‐ angiotensin receptor blockers; AZA ‐ azathioprine; BP ‐ blood pressure; CKD ‐ chronic kidney disease; CRP ‐ C‐reactive protein; CV ‐ cardiovascular; (e)GFR ‐ (estimated) glomerular filtration rate; ED ‐ emergency department; ESKD ‐ end‐stage kidney disease; HIV ‐ human immunodeficiency virus; M/F ‐ male/female; NT‐proBNP ‐ N‐terminal pro b‐type natriuretic peptide; RCT ‐ randomised controlled trial; SCr ‐ serum creatinine; SD ‐ standard deviation
Characteristics of excluded studies [ordered by study ID]
| Study | Reason for exclusion |
|---|---|
| CONFIRMS Study 2012 | Wrong population: patients with gout; no outcomes of interest |
| NCT00174915 | Wrong intervention: comparison of allopurinol and febuxostat for gout; no outcomes related to our review |
| NU‐FLASH Study 2013 | Wrong intervention: comparison between two urate lowering therapies, not usual therapy or placebo |
| Sundy 2011 | Wrong population: patients with gout |
| Tanaka 2015 | Treatment for less than 3 months |
| Tausche 2014 | Treatment for less than 3 months |
| Whelton 2007 | This is an analysis of patients on urate lowering therapy, not a RCT of urate lowering therapy |
RCT ‐ randomised controlled trial
Characteristics of studies awaiting assessment [ordered by study ID]
Hosoya 2014.
| Methods |
|
| Participants |
|
| Interventions | Treatment group
Control group
Co‐interventions
|
| Outcomes |
|
| Notes |
Saag 2013.
| Methods |
|
| Participants |
|
| Interventions | Treatment group
Control group
Co‐interventions: not reported |
| Outcomes |
|
| Notes |
|
Tani 2015.
| Methods |
|
| Participants |
|
| Interventions | Treatment group
Control group
|
| Outcomes |
|
| Notes |
|
Tuta 2014.
| Methods |
|
| Participants |
|
| Interventions | Treatment group
Control group
|
| Outcomes |
|
| Notes |
|
ALT ‐ alanine aminotransferase; AST ‐ aspartate aminotransferase; DBP ‐ diastolic blood pressure; CRP ‐ C‐reactive protein; (e)GFR ‐ (estimated) glomerular filtration rate; HbA1c ‐ haemoglobin A1c; MDRD ‐ Modification of Diet in Renal Disease; NSAID ‐ non‐steroidal anti‐inflammatory drug(s); SBP ‐ systolic blood pressure; SCr ‐ serum creatinine; RCT ‐ randomised controlled trial
Characteristics of ongoing studies [ordered by study ID]
CKD‐FIX Study 2011.
| Trial name or title | The CKD‐FIX Trial: controlled trial of slowing of kidney disease progression from the inhibition of zanthine oxidase |
| Methods | Multicentre parallel, placebo‐controlled RCT |
| Participants | Adult (≥ 18 years); CKD stage 3 or 4 (eGFR 15 to 59 mL/min/1.73 m2); random urine albumin:Cr ratio ≥ 30 mg/mmol OR evidence of progression of CKD (decrease in eGFR ≥ 3.0 mL/min/1.73 m2 during the preceding 12 months, calculated as the difference between the first and last tests, based on minimum of 3 blood tests with each test done at least 4 weeks apart) Exclusion criteria: Past history of clinically established gout; history of hypersensitivity to allopurinol; Kidney transplant recipients; concurrent treatment with azathioprine, 6‐mercaptopurine, theophylline, cyclophosphamide, cyclosporine, probenecid, phenytoin or chlorpropamide; indication for allopurinol, including history of frequent attacks of gout, tophus or tophi on clinical examination or imaging study, uric acid nephropathy, uric acid nephrolithiasis or urolithiasis; current non‐skin cancer malignancy; unresolved acute kidney injury in last 3 months; current pregnancy, breast feeding; any psychological illness or condition which interferes with their ability to understand or comply with the requirements of the study; elective or imminent initiation of maintenance dialysis or kidney transplantation expected in the next 6 months |
| Interventions | Participants will be randomised to either allopurinol or matching placebo after informed consent. The starting dose will be 1 tablet daily of allopurinol (100mg) for 4 weeks. If tolerated, the dose will be increased to 2 tablets daily for another 4 weeks. If tolerated the dose will be further increased to 3 tablets daily thereafter. The maximally tolerated dose (1 or 2 or 3 tablets daily will be continued during the remaining follow up period (total follow up of 104 weeks). |
| Outcomes | Primary outcome: change in eGFR Secondary outcomes: reduction in GFR >30% from baseline; progression to ESKD requiring dialysis or kidney transplantation; change in Cystatin C‐based eGFR; all‐cause mortality; composite of reduction in GFR > 30% from baseline, ESKD, and death from any cause; blood pressure; proteinuria; fatal or non‐fatal cardiovascular events; all‐cause hospitalisation; QoL; uric acid; cost effectiveness and economic analyses; adverse events |
| Starting date | 21 March 2014 |
| Contact information | Correspondence: Miss Laura Robison (ckdfix@uq.edu.au); Australasian Kidney Trials Network (UQ) Level 4, Bldg 1 Princess Alexandra Hospital, 199 Ipswich Road, WOOLLOONGABBA QLD 4102; +61 7 3176 7716 |
| Notes |
FEATHER Study 2014.
| Trial name or title | FEATHER Study |
| Methods | Prospective, multicentre, double‐blind, randomised, placebo‐controlled trial of febuxostat |
| Participants | 400 Japanese patients aged 20 years or older who have hyperuricaemia without gouty arthritis, who present CKD stage 3, and whose serum uric acid concentration is 7.1 to 10.0 mg/dL (424 to 598 µmol/L) |
| Interventions | Febuxostat: 40 mg daily for 2 years |
| Outcomes | Primary: eGFR slope Secondary: amount and percent rate of change in eGFR from baseline to week 108, the amount and percent rate of change in serum uric acid concentration from baseline to week 108, the proportion of patients who achieved a serum uric acid concentration ≤ 6.0 mg/dL (358 µmol/L) |
| Starting date | 2014 |
| Contact information | Correspondence: Tatsuo Hosoya (t‐hosoya@jikei.ac.jp); Division of Nephrology and Hypertension, the Jikei University School of Medicine, 3‐25‐8, Nishishinbashi, Minato‐ku, Tokyo 105‐8461, Japan |
| Notes |
PERL Study 2013.
| Trial name or title | PERL Study |
| Methods | International multi‐centre, stratified, double‐blind, placebo‐controlled, parallel‐group randomised clinical trial |
| Participants | Four hundred type 1 diabetes subjects at high risk for GFR loss because of the presence of micro‐ or macroalbuminuria and a relatively high serum uric acid (≥ 4.5 mg/dL), who still have only mildly or moderately decreased kidney function (GFR 45 to 100 mL/min/1.73 m2) |
| Interventions | Allopurinol 100 to 400 mg/d reducing uric acid to 2.5 to 4.5 mg/dL with at least a 30% reduction from baseline for 3 years |
| Outcomes | GFR at the end of intervention measured by plasma clearance of non‐radioactive iohexol, adjusted for GFR at randomisation Secondary: GFR at end of washout period, eGFR time trajectory estimated from quarterly SCr and cystatin C measurements using the CKD‐EPI SCr and the CKD‐EPI SCr‐SCysC equations, time to doubling of baseline SCr value or ESKD, time to doubling of baseline SCr value or ESKD, median urinary AER during the last 3 months of the intervention period, adjusted for the median urinary AER at baseline, time to fatal or non‐fatal serious cardiovascular events. |
| Starting date | February 2014 |
| Contact information | Correspondence: Alessandro Doria (alessandro.doria@joslin.harvard.edu); Section on Genetics and Epidemiology, Joslin Diabetes Center, One Joslin Place, Boston, MA 02215, Phone: 617‐309‐2406, Fax: 617‐309‐2667 |
| Notes |
AER ‐ albumin excretion ratio; CKD ‐ chronic kidney disease; (e)GFR ‐ (estimated) glomerular filtration rate; ESKD ‐ end‐stage kidney disease; SCr ‐ serum creatinine
Differences between protocol and review
The search strategies were amended to increase their sensitivity, as a potentially relevant study was not retrieved using those in the protocol.
Summary findings table has been incorporated.
Contributions of authors
Draft the protocol: ALS
Study selection: ALS
Extract data from studies: ALS, RFS, GW
Enter data into RevMan: ALS, GW
Carry out the analysis: ALS, RFS, GW
Interpret the analysis: ALS, RFS, GW
Draft the final review: ALS, RFS, GW
Disagreement resolution: GW
Update the review: ALS, GW
Sources of support
Internal sources
The Canberra Hospital, Canberra ACT, Australia.
The Australian National University, Canberra, ACT, Australia.
External sources
No sources of support supplied
Declarations of interest
Anna Sampson: none known
Giles Walters: none known
Richard Singer: none known
New
References
References to studies included in this review
Bergamini 2010 {published data only}
- Bergamini C, Cicoira M, Rossi A, Cassater D, Zanolla L, Vassanelli C. Allopurinol lowers NT‐proBNP plasma levels and improves diastolic function in heart failure patients: A double‐blind, placebo‐controlled study [abstract no: P4847]. European Heart Journal 2010;31(Suppl 1):849. [EMBASE: 70282775] [Google Scholar]
Dogan 2011 {published data only}
- Dogan A, Yarlioglues M, Kaya MG, Karadag Z, Dogan S, Ardic I, et al. Effect of long‐term and high‐dose allopurinol therapy on endothelial function in normotensive diabetic patients. Blood Pressure 2011;20(3):182‐7. [MEDLINE: ] [DOI] [PubMed] [Google Scholar]
Gibson 1980 {published data only}
- Gibson T, Rodgers V, Potter C, Simmonds HA. Allopurinol treatment and its effect on renal function in gout: a controlled study. Annals of the Rheumatic Diseases 1982;41(1):59‐65. [MEDLINE: ] [DOI] [PMC free article] [PubMed] [Google Scholar]
- Gibson T, Simmonds HA, Potter C, Rogers V. A controlled study of the effect of long term allopurinol treatment on renal function in gout. Advances in Experimental Medicine & Biology 1980;122A:257‐62. [MEDLINE: ] [DOI] [PubMed] [Google Scholar]
Goicoechea 2010 {published data only}
- Goicoechea M, Garcia de Vinuesa S, Verdalles U, Verde E, Macias N, Santos A, et al. Allopurinol and progression of CKD and cardiovascular events: long‐term follow‐up of a randomized clinical trial. American Journal of Kidney Diseases 2015;65(4):543‐9. [MEDLINE: ] [DOI] [PubMed] [Google Scholar]
- Goicoechea M, Vinuesa SG, Verdalles U, Ruiz‐Caro C, Ampuero J, Rincón A, et al. Effect of allopurinol in chronic kidney disease progression and cardiovascular risk. Clinical Journal of The American Society of Nephrology: CJASN 2010;5(8):1388‐93. [MEDLINE: ] [DOI] [PMC free article] [PubMed] [Google Scholar]
Kanbay 2011 {published data only}
- Kanbay M, Huddam B, Azak A, Solak Y, Kadioglu GK, Kirbas I, et al. A randomized study of allopurinol on endothelial function and estimated glomular filtration rate in asymptomatic hyperuricemic subjects with normal renal function.[Erratum appears in Clin J Am Soc Nephrol. 2011 Dec;6(12):2901‐2]. Clinical Journal of The American Society of Nephrology: CJASN 2011;6(8):1887‐94. [MEDLINE: ] [DOI] [PMC free article] [PubMed] [Google Scholar]
Momeni 2010 {published data only}
- Momeni A, Shahidi S, Seirafian S, Taheri S, Kheiri S. Allopourinol effect on reducing proteinuria in diabetic retinopathy. Journal of Isfahan Medical School 2010;28(107):271‐8. [EMBASE: 359535811] [Google Scholar]
- Momeni A, Shahidi S, Seirafian S, Taheri S, Kheiri S. Effect of allopurinol in decreasing proteinuria in type 2 diabetic patients. Iranian Journal of Kidney Diseases 2010;4(2):128‐32. [MEDLINE: ] [PubMed] [Google Scholar]
OPT‐CHF Study 2004 {published data only}
- Freudenberger RS, Schwarz RP Jr, Brown J, Moore A, Mann D, Givertz MM, et al. Rationale, design and organisation of an efficacy and safety study of oxypurinol added to standard therapy in patients with NYHA class III ‐ IV congestive heart failure. Expert Opinion on Investigational Drugs 2004;13(11):1509‐16. [MEDLINE: ] [DOI] [PubMed] [Google Scholar]
- George J, Struthers A. The OPT‐CHF (Oxypurinol Therapy for Congestive Heart Failure) trial: a question of dose. Journal of the American College of Cardiology 2009;53(25):2405. [MEDLINE: ] [DOI] [PubMed] [Google Scholar]
- Hare JM, Mangal B, Brown J, Fisher C Jr, Freudenberger R, Colucci WS, et al. Impact of oxypurinol in patients with symptomatic heart failure. Results of the OPT‐CHF study. Journal of the American College of Cardiology 2008;51(24):2301‐9. [MEDLINE: ] [DOI] [PubMed] [Google Scholar]
Sarris 2007 {published data only}
- Sarris E, Bagiatudi G, Stavrianaki D, Salpigidis K, Siakotos M. Use of allopurinol in slowing the progression of chronic renal disease [abstract no: FP128]. Nephrology Dialysis Transplantation 2007;22(Suppl 6):vi61. [Google Scholar]
Shi 2012 {published data only}
- Shi Y, Chen W, Jalal D, Li Z, Chen W, Mao H, et al. Clinical outcome of hyperuricemia in IgA nephropathy: a retrospective cohort study and randomized controlled trial. Kidney & Blood Pressure Research 2012;35(3):153‐60. [MEDLINE: ] [DOI] [PMC free article] [PubMed] [Google Scholar]
Sircar 2015 {published data only}
- Sircar D, Chatterjee S, Waikhom R, Golay V, Raychaudhury A, Chatterjee S, et al. Efficacy of febuxostat for slowing the GFR decline in patients with CKD and asymptomatic hyperuricemia: a 6‐month, double‐blind, randomized, placebo‐controlled trial. American Journal of Kidney Diseases 2015;66(6):945‐50. [MEDLINE: ] [DOI] [PubMed] [Google Scholar]
Siu 2006 {published data only}
- Siu YP, Leung KT, Tong MK, Kwan TH. Use of allopurinol in slowing the progression of renal disease through its ability to lower serum uric acid level. American Journal of Kidney Diseases 2006;47(1):51‐9. [MEDLINE: ] [DOI] [PubMed] [Google Scholar]
Tuta 2006 {published data only}
- Tuta L, Sburian A, Voinea F. Early allopurinol therapy slows progression of renal disease in predialysis patients with hyperuricemia [abstract no: MP261]. Nephrology Dialysis Transplantation 2006;21(Suppl 4):iv386. [Google Scholar]
References to studies excluded from this review
CONFIRMS Study 2012 {published data only}
- Becker MA, Macdonald PA, Hunt BJ, Jackson RL. Diabetes and gout: efficacy and safety of febuxostat and allopurinol. Diabetes, Obesity & Metabolism 2013;15(11):1049‐55. [MEDLINE: ] [DOI] [PMC free article] [PubMed] [Google Scholar]
- Jackson RL, Hunt B, Macdonald PA. The efficacy and safety of febuxostat for urate lowering in gout patients >/=65 years of age. BMC Geriatrics 2012;12:11. [MEDLINE: ] [DOI] [PMC free article] [PubMed] [Google Scholar]
- Wells AF, MacDonald PA, Chefo S, Jackson RL. African American patients with gout: efficacy and safety of febuxostat vs allopurinol. BMC Musculoskeletal Disorders 2012;13:15. [MEDLINE: ] [DOI] [PMC free article] [PubMed] [Google Scholar]
NCT00174915 {published data only}
- NCT00174915. A phase 3, randomized, multicenter, allopurinol and placebo‐controlled study assessing the safety and efficacy of oral febuxostat in subjects with gout. clinicaltrials.gov/ct2/show/NCT00174915 (first received 9 September 2005).
NU‐FLASH Study 2013 {published data only}
- Sezai A, Soma M, Nakata K, Hata M, Yoshitake I, Wakui S, et al. Comparison of febuxostat and allopurinol for hyperuricemia in cardiac surgery patients (NU‐FLASH Trial). Circulation Journal 2013;77(8):2043‐9. [MEDLINE: ] [DOI] [PubMed] [Google Scholar]
- Sezai A, Soma M, Nakata K, Osaka S, Ishii Y, Yaoita H, et al. Comparison of febuxostat and allopurinol for hyperuricemia in cardiac surgery patients with chronic kidney disease (NU‐FLASH trial for CKD). Journal of Cardiology 2015;66(4):298‐303. [MEDLINE: ] [DOI] [PubMed] [Google Scholar]
Sundy 2011 {published data only}
- Baraf HS, Becker MA, Gutierrez‐Urena SR, Treadwell EL, Vazquez‐Mellado J, Rehrig CD, et al. Tophus burden reduction with pegloticase: results from phase 3 randomized trials and open‐label extension in patients with chronic gout refractory to conventional therapy. Arthritis Research & Therapy 2013;15(5):R137. [MEDLINE: ] [DOI] [PMC free article] [PubMed] [Google Scholar]
- Lipsky PE, Calabrese LH, Kavanaugh A, Sundy JS, Wright D, Wolfson M, et al. Pegloticase immunogenicity: the relationship between efficacy and antibody development in patients treated for refractory chronic gout. Arthritis Research & Therapy 2014;16(2):R60. [MEDLINE: ] [DOI] [PMC free article] [PubMed] [Google Scholar]
- Sundy JS, Baraf HS, Yood RA, Edwards NL, Gutierrez‐Urena SR, Treadwell EL, et al. Efficacy and tolerability of pegloticase for the treatment of chronic gout in patients refractory to conventional treatment: two randomized controlled trials. JAMA 2011;306(7):711‐20. [MEDLINE: ] [DOI] [PubMed] [Google Scholar]
- Sundy JS, Becker MS, Huang WY, Waltrip RW, Chandraker AK. Treatment failure gout: efficacy and safety of pegloticase in phase 3 trials [abstract no: 1471]. American Journal of Transplantation 2009;9(Suppl 2):600. [Google Scholar]
- Yood RA, Ottery FD, Irish W, Wolfson M. Effect of pegloticase on renal function in patients with chronic kidney disease: a post hoc subgroup analysis of 2 randomized, placebo‐controlled, phase 3 clinical trials. BMC Research Notes 2014;7:54. [MEDLINE: ] [DOI] [PMC free article] [PubMed] [Google Scholar]
Tanaka 2015 {published data only}
- Tanaka K, Nakayama M, Kanno M, Kimura H, Watanabe K, Tani Y, et al. Renoprotective effects of febuxostat in hyperuricemic patients with chronic kidney disease: a parallel‐group, randomized, controlled trial. Clinical & Experimental Nephrology 2015;19(6):1044‐53. [MEDLINE: ] [DOI] [PubMed] [Google Scholar]
Tausche 2014 {published data only}
- Tausche AK, Christoph M, Forkmann M, Richter U, Kopprasch S, Bielitz C, et al. As compared to allopurinol, urate‐lowering therapy with febuxostat has superior effects on oxidative stress and pulse wave velocity in patients with severe chronic tophaceous gout. Rheumatology International 2014;34(1):101‐9. [MEDLINE: ] [DOI] [PubMed] [Google Scholar]
Whelton 2007 {published data only}
- Whelton A, MacDonald P, Lloyd E, Lademacher C. The long‐term stability of renal function in hyperuricemic subjects with gout treated with febuxostat [abstract no: SA‐PO918]. Journal of the American Society of Nephrology 2007;18(Abstracts):545A. [Google Scholar]
- Whelton A, MacDonald PA, Hunt BJ, Joseph‐Ridge N. Febuxostat, a novel non‐purine selective inhibitor of xanthine oxidase, in patients with a history of nephrolithiasis [abstract no: F‐PO894]. Journal of the American Society of Nephrology 2006;17(Abstracts):525A. [Google Scholar]
References to studies awaiting assessment
Hosoya 2014 {published data only}
- Hosoya T, Ohno I, Nomura S, Hisatome I, Uchida S, Fujimori S, et al. Effects of topiroxostat on the serum urate levels and urinary albumin excretion in hyperuricemic stage 3 chronic kidney disease patients with or without gout. Clinical & Experimental Nephrology 2014;18(6):876‐84. [MEDLINE: ] [DOI] [PMC free article] [PubMed] [Google Scholar]
Saag 2013 {published data only}
- Saag KG, Becker MA, Whelton A, MacDonald PA, Zhou Y, Gunawardhana L. Effect of febuxostat on serum urate levels in gout subjects with hyperuricemia and moderate‐to‐severe renal impairment: A randomized controlled trial [abstract no: 1178]. Arthritis & Rheumatism 2013;65(Suppl 10):S498‐9. [EMBASE: 71318653] [Google Scholar]
Tani 2015 {published data only}
- Tani S, Nagao K, Hirayama A. Effect of febuxostat, a xanthine oxidase inhibitor, on cardiovascular risk in hyperuricemic patients with hypertension: a prospective, open‐label, pilot study. Clinical Drug Investigation 2015;35(12):823‐31. [MEDLINE: ] [DOI] [PubMed] [Google Scholar]
- Tani S, Nagao K, Hirayama A. Febuxostat, a xanthine oxidase inhibitor, may improve cardiorenal interaction: a randomized controlled pilot study [abstract]. European Heart Journal 2014;35(Suppl 1):904‐5. [EMBASE: 71650121] [Google Scholar]
- Tani S, Takahashi A, Nagao K, Hirayama A. Febuxostat ‐ a xanthine oxidase inhibitor ‐ may improve cardiorenal interaction: a randomized controlled pilot study [abstract]. Circulation 2014;130(Suppl 2):A9432. [EMBASE: 71712984] [Google Scholar]
Tuta 2014 {published data only}
- Tuta L, Stanigut A. Allopurinol therapy for hyperuricemia reduces inflammation and progression of renal disease in moderate chronic kidney disease [abstract no: SP148]. Nephrology Dialysis Transplantation 2014;29(Suppl 3). [EMBASE: 71491775] [Google Scholar]
References to ongoing studies
CKD‐FIX Study 2011 {published data only}
- The CKD‐FIX Trial: controlled trial of slowing of kidney disease progression from the inhibition of xanthine oxidase. www.anzctr.org.au/Trial/Registration/TrialReview.aspx?id=343216 (first received 19 July 2011).
FEATHER Study 2014 {published data only}
- Hosoya T, Kimura K, Itoh S, Inaba M, Uchida S, Tomino Y, et al. The effect of febuxostat to prevent a further reduction in renal function of patients with hyperuricemia who have never had gout and are complicated by chronic kidney disease stage 3: study protocol for a multicenter randomized controlled study. Trials [Electronic Resource] 2014;15(1):26. [MEDLINE: ] [DOI] [PMC free article] [PubMed] [Google Scholar]
PERL Study 2013 {published data only}
- Maahs DM, Caramori L, Cherney DZ, Galecki AT, Gao C, Jalal D, et al. Uric acid lowering to prevent kidney function loss in diabetes: the preventing early renal function loss (PERL) allopurinol study. Current Diabetes Reports 2013;13(4):550‐9. [MEDLINE: ] [DOI] [PMC free article] [PubMed] [Google Scholar]
Additional references
Bellomo 2010
- Bellomo G, Venanzi S, Verdura C, Saronio P, Esposito A, Timio M. Association of uric acid with change in kidney function in healthy normotensive individuals. American Journal of Kidney Diseases 2010;56(2):264‐72. [MEDLINE: ] [DOI] [PubMed] [Google Scholar]
Bose 2013
- Bose B, Badve SV, Hiremath SS, Boudville N, Brown FG, Cass A. Effects of uric acid‐lowering therapy on renal outcomes: a systematic review and meta‐analysis. Nephrology Dialysis Transplantation 2014;29(2):406‐13. [MEDLINE: ] [DOI] [PubMed] [Google Scholar]
Cameron 2005
- Cameron JS, Simmonds HA. Uric acid and the kidney. Oxford Textbook of Clinical Nephrology. 3rd Edition. Vol. 2, Oxford University Press, 2005:1059‐73. [Google Scholar]
Coresh 2007
- Coresh J, Selvin E, Stevens LA, Manzi J, Kusek JW, Eggers P, et al. Prevalence of chronic kidney disease in the United States. JAMA 2007;298(17):2038‐47. [MEDLINE: ] [DOI] [PubMed] [Google Scholar]
Daskalopoulou 2005
- Daskalopoulou SS, Tzovaras V, Mikhailidis DP, Elisaf M. Effect on serum uric acid levels of drugs prescribed for indications other than treating hyperuricaemia. Current Pharmaceutical Design 2005;11(32):4161‐75. [MEDLINE: ] [DOI] [PubMed] [Google Scholar]
Feig 2008
- Feig DI, Kang D, Johnson RJ. Uric acid and cardiovascular risk. New England Journal of Medicine 2008;359(17):1811‐21. [MEDLINE: ] [DOI] [PMC free article] [PubMed] [Google Scholar]
GRADE 2008
- Guyatt GH, Oxman AD, Vist GE, Kunz R, Falck‐Ytter Y, Alonso‐Coello P, et al. GRADE: an emerging consensus on rating quality of evidence and strength of recommendations. BMJ 2008;336(7650):924‐6. [MEDLINE: ] [DOI] [PMC free article] [PubMed] [Google Scholar]
Hall 1967
- Hall AP, Barry PE, Dawber TR, McNamara PM. Epidemiology of gout and hyperuricemia. A long‐term population study. American Journal of Medicine 1967;42(1):27‐37. [MEDLINE: ] [DOI] [PubMed] [Google Scholar]
Higgins 2003
- Higgins JP, Thompson SG, Deeks JJ, Altman DG. Measuring inconsistency in meta‐analyses. BMJ 2003;327(7414):557‐60. [MEDLINE: ] [DOI] [PMC free article] [PubMed] [Google Scholar]
Higgins 2011
- Higgins JPT, Green S [editors]. Cochrane Handbook for Systematic Reviews of Interventions Version 5.1.0 [updated March 2011]. The Cochrane Collaboration, 2011. Available from www.cochrane‐handbook.org.
Kang 2002
- Kang D, Nakagawa T, Feng L, Watanabe S, Han L, Mazzali M, et al. A role for uric acid in the progression of renal disease. Journal of the American Society of Nephrology 2002;13(12):2888‐97. [MEDLINE: ] [DOI] [PubMed] [Google Scholar]
Kosugi 2009
- Kosugi T, Nakayama T, Heinig M, Zhang L, Yuzawa Y, Sanchez‐Lozada LG, et al. Effect of lowering uric acid on renal disease in type 2 diabetic db/db mice. American Journal of Physiology ‐ Renal Physiology 2009;297(2):F481‐8. [MEDLINE: ] [DOI] [PMC free article] [PubMed] [Google Scholar]
Levey 2012
- Levey AS, Coresh J. Chronic kidney disease. Lancet 2012;379(9811):165‐80. [MEDLINE: ] [DOI] [PubMed] [Google Scholar]
Lin 2000
- Lin KC, Lin HY, Chou P. Community based epidemiological study on hyperuricemia and gout in Kin‐Hu, Kinmen. Journal of Rheumatology 2000;27(4):1045‐50. [MEDLINE: ] [PubMed] [Google Scholar]
Matsushita 2010
- Chronic Kidney Disease Prognosis Consortium, Matsushita K, Velde M, Astor BC, Woodward M, Levey AS, et al. Association of estimated glomerular filtration rate and albuminuria with all‐cause and cardiovascular mortality in general population cohorts: a collaborative meta‐analysis. Lancet 2010;375(9731):2073‐81. [MEDLINE: ] [DOI] [PMC free article] [PubMed] [Google Scholar]
Nakagawa 2006
- Nakagawa T, Mazzali M, Kang DH, Sanchez‐Lozada LG, Herrera‐Acosta J, Johnson RJ. Uric acid ‐ A uremic toxin?. Blood Purification 2006;24(1):67‐70. [MEDLINE: ] [DOI] [PubMed] [Google Scholar]
Schünemann 2011a
- Schünemann HJ, Oxman AD, Higgins JP, Vist GE, Glasziou P, Guyatt GH. Chapter 11: Presenting results and 'Summary of findings' tables. In: Higgins JP, Green S (editors). Cochrane Handbook for Systematic Reviews of Interventions Version 5.1.0 [updated March 2011]. The Cochrane Collaboration, 2011. Available from www.cochrane‐handbook.org.
Schünemann 2011b
- Schünemann HJ, Oxman AD, Higgins JP, Deeks JJ, Glasziou P, Guyatt GH. Chapter 12: Interpreting results and drawing conclusions. In: Higgins JP, Green S (editors). Cochrane Handbook for Systematic Reviews of Interventions Version 5.1.0 [updated March 2011]. The Cochrane Collaboration, 2011. Available from www.cochrane‐handbook.org.
Uaratanawong 2011
- Uaratanawong S, Suraamornkul S, Angkeaw S, Uaratanawong R. Prevalence of hyperuricemia in Bangkok population. Clinical Rheumatology 2011;30(7):887‐93. [MEDLINE: ] [DOI] [PubMed] [Google Scholar]
Winearls 2010
- Winearls CG, Haynes R, Glassock R. CKD staging ‐ evolution not revolution. Nefrologia 2010;30(5):493‐500. [MEDLINE: ] [DOI] [PubMed] [Google Scholar]