

Abstract
Gastric cancer is a leading cause of mortality due to neoplastic disease. Although early detection of gastric cancers can decrease the mortality rate, it remains a diagnostic challenge because of the lack of effective biomarkers. In this study, fifteen gastric cancer patients and ten healthy subjects were recruited to assess novel serum biomarkers for gastric cancer using antibody microarray technology. ELISA was utilized to validate the antibody array results. As a result, compared to the controls, eleven cytokines were found to be significantly increased in gastric cancer, including interferon gamma receptor 1 (IFNGR1), neurogenic locus notch homolog protein 3 (Notch‐3), tumor necrosis factor receptor superfamily member 19L (TNFRSF19L), growth hormone receptor (GHR), signaling lymphocytic activation molecule family 8 (SLAMF8), folate receptor beta (FR‐beta), integrin alpha 5, galectin‐8, erythropoietin‐producing hepatocellular A1 (EphA1), epiregulin, and fibroblast growth factor 12 (FGF‐12) with P < 0.05. ELISA validation supported the results of the antibody array. More importantly, most of these eleven cytokines, including IFNGR1, TNFRSF19L, GHR, SLAMF8, FR‐beta, and integrin alpha 5 were discovered to be elevated in gastric cancer serum samples for the first time in this study, suggesting that these proteins may serve as novel biomarkers for the early diagnosis and prognosis determination of gastric cancer.
Keywords: antibody array, biomarkers, gastric cancer, serum
1. INTRODUCTION
Gastric cancer is one of the most common human cancer types, poses a major public health problem globally and is particularly prevalent in Asian populations.1 Symptomatology of gastric cancer is rare and nonspecific in the early stages of the disease.2 Although surgical resection is an effective therapeutic procedure for gastric cancer and recent advances in chemotherapy have improved the progression‐free survival and overall survival rates, patient prognosis remains poor and the 5‐year survival rate is only about 20% for patients with late stage gastric cancer. Therefore, an early and precise diagnosis is beneficial and critical for ensuring early and effective treatment and for improving the survival rate of gastric cancer patients.
The primary method of diagnosis for gastric cancer is endoscopy and biopsy. However, this procedure relies on the skill of the operator, is invasive and expensive, and causes the patients discomfort and anxiety. Although there have been some advancements in the development of molecular biomarkers for the early detection of gastric cancer in recent years,3 useful diagnostic biomarkers for early diagnosis of gastric cancer remain limited. Conventional serum tumor biomarkers, such as carcinoembryonic antigen (CEA), carbohydrate antigen 19‐9 (CA19‐9), carbohydrate antigen 72‐4 (CA72‐4), and carbohydrate antigen 125 (CA125) have been reported to be useful for the early diagnosis, prognostic determination and monitoring of recurrence in gastric cancers.4, 5 However, most of these serum‐based biomarkers are not recommended for gastric cancer detection due to the limit of specificity and sensitivity in the early stages of gastric cancer.6 Thus, it is essential to identify additional biomarkers for effective early diagnosis of gastric cancer.
There are proteomic alterations in the development and progression of diseases. Antibody microarrays are a novel technology rapidly detecting multiple proteins in parallel, and have been applied in many cancers, such as breast cancer and bladder cancer, for biomarker screening.7, 8 However, no reports regarding the search for gastric cancer serum biomarkers using antibody microarrays have been found. In this study, we aimed to identify serum biomarkers for the improvement of early diagnoses and prognoses of gastric cancer using the antibody microarray technique.
2. MATERIALS AND METHODS
2.1. Patients
In this study, 15 individuals diagnosed with stage IA (T1N0M0) gastric cancer, based on biopsy specimen analysis and according to the Tumor Node Metastasis (TNM) classification, and who were hospitalized in the Gastrointestinal Surgery Department of Lishui Central Hospital (Lishui, China) in 2017 were recruited. The patients had not yet received chemotherapy or radiotherapy. 10 individuals were recruited as control subjects. The clinical information of the study participants is shown in Table 1. Between the two groups, the age and sex of the subjects were not significantly different. All participants signed informed consent forms prior to their inclusion in this study. Study approval was obtained from the Ethics Committee of the Lishui Central Hospital. Peripheral blood samples were collected from all participants and the serum was separated, frozen, and stored at −80°C according to standard laboratory protocols.
Table 1.
Clinical data of patients and controls for antibody array detection
| Patient | |
| n | 15 |
| Age (mean ± SD), y | 58.67 ± 5.84 |
| Sex | 46.67% male, 53.33% female |
| Tumor location | Tunica mucosa |
| Lymphatic metastasis | no |
| Distant metastasis | no |
| Tumor diameter | <3 cm |
| Histological type | Undifferentiated |
| Stage | IA |
| Treatment | no |
| Control | |
| n | 10 |
| Age (mean ± SD), year | 58.10 ± 6.89 |
| Sex | 50% male, 50% female |
| P‐value (age, patient vs control) | 0.833 |
2.2. Antibody array assay
A human cytokine antibody array (RayBio Human Cytokine Antibody Array Glass series 11, Cat#: GSH‐CYT‐11, RayBiotech, Norcross, GA) that simultaneously detects 40 cytokines was utilized. Briefly, serum samples were incubated with 40 primary antibodies in the arrays overnight at 4°C. The next day, the arrays were washed, a biotin‐conjugated detection antibody mix was added to the array pools and the arrays were incubated for 2 hours at room temperature. The slides were washed again, and Cy3‐conjugated streptavidin was used to bind biotin‐conjugated detection antibodies for a further 2 hours at room temperature. The slides were scanned with an InnoScan 300 Microarray Scanner (Innopsys, France). The signal values were read using Mapix software and were normalized using internal positive controls in the array using the RayBiotech analysis tool, which was specifically designed for the Human Cytokine Antibody Array Glass series 11. This experiment was performed once.
2.3. ELISA validation
In order to validate the antibody array results, serum samples from 20 control subjects and 20 gastric cancer patients (information shown in Table 2) were analyzed by ELISA for six cytokines (RayBiotech, Norcross GA, USA. Cat#: ELH‐IFNgR1‐1, ELH‐NOTCH3‐1, ELH‐GHR‐1, ELH‐RELT‐1, ELH‐FOLR2‐1 and ELH‐BLAME‐1) at a time, according to the manufacturer's instructions. Briefly, after being diluted to different dilution factors based on the different cytokines, serum was incubated in the plate wells coated with capture antibody overnight at 4°C. The samples were then washed and biotin‐conjugated detection antibody was added into the plate wells for further incubation. HRP‐conjugated streptavidin was used to bind the biotin‐conjugated detection antibody to catalyze the TMB reagent. Finally, the catalytic reaction was stopped by the addition of sulfuric acid and the optical density was determined via a microplate reader (Biotek, Winooski, VT, USA, ELx800NB).
Table 2.
Clinical data of patients and controls for ELISA
| Patient | |
| n | 20 |
| Age (mean ± SD), year | 58.85 ± 4.27 |
| Sex | 50% Male, 50% Female |
| Tumor location | Tunica mucosa |
| Lymphatic metastasis | no |
| Distant metastasis | no |
| Tumor diameter | <3 cm |
| Histological type | Undifferentiated |
| Stage | IA |
| Stage | I |
| Treatment | no |
| Control | |
| n | 20 |
| Age (mean±SD), year | 60.10 ± 6.16 |
| Sex | 50% Male, 50% Female |
| P‐value (Age, patient vs control) | 0.461 |
2.4. Statistical analysis
Statistical analysis was carried out using Mann‐Whitney U test with the Statistical Package for Social Science Statistics version 20 software (SPSS, IBM Corp., Armonk, NY). Differences between the two groups were considered significant if P values were <0.05. Data were presented as means ±SD (standard deviations). Fold change (FC) was calculated to indicate the expression tendency of cytokines in the gastric cancer group.
3. RESULTS
3.1. Differentially expressed protein analysis
The signal values of 40 proteins were statistically analyzed by Mann‐Whitney U test to seek proteins differentially expressed between the two groups. As a result, eleven cytokines were identified that were significantly increased as compared to the control group (Table 3). The gene IDs of differentially expressed cytokines, mean signal values, P values and fold changes are shown in Table 3. The levels of these differentially expressed proteins are shown as a histogram using the signal values. As shown in Figure 1, the levels of the differentially expressed proteins in gastric cancer are higher than that in the healthy controls. Additionally, the representative profiles of the arrays from the two groups are shown to indicate the differences of these cytokines in gastric cancer and the controls based on the direct proportional relationship between fluorescence intensity and expression levels. As shown in Figure 2, the fluorescent signals of these proteins (blue rectangles) were clearly stronger in gastric cancer group than that in control group. Finally, an unsupervised‐hierarchical cluster was performed to distinguish the gastric cancer group and the control group using the fluorescence values of these differentially expressed proteins. The gastric cancer group and the control group were distinguished with 100% accuracy (Figure 3), further suggesting these proteins were significantly elevated in the gastric cancer group.
Table 3.
Information about the differentially expressed cytokines
| Protein name | Gene ID | GC value | HC value | Fold change (GC/HC) | P value (U test) |
|---|---|---|---|---|---|
| IFNGR1 | 3459 | 10 653.23 | 4784.44 | 2.227 | <0.0001 |
| Notch‐3 | 4854 | 83 220.05 | 52 939.13 | 1.572 | 0.0001 |
| TNFRSF19L | 84 957 | 78 969.55 | 28 658.92 | 2.755 | 0.0001 |
| GHR | 2690 | 7735.61 | 2817.25 | 2.746 | <0.0001 |
| SLAMF8 | 56 833 | 6933.58 | 3419.79 | 2.027 | 0.0022 |
| FR‐beta | 2350 | 13 787.23 | 6881.04 | 2.004 | 0.0066 |
| Integrin alpha 5 | 3678 | 9563.02 | 6160.67 | 1.552 | 0. 0027 |
| Galectin‐8 | 3964 | 19 408.19 | 11 720.99 | 1.656 | 0.0039 |
| EphA1 | 2041 | 29 531.42 | 14 891.53 | 1.983 | 0.0013 |
| Epiregulin | 2069 | 7866.67 | 5634.43 | 1.396 | 0.0091 |
| FGF‐12 | 2257 | 24 060.81 | 9952.81 | 2.417 | 0.0198 |
GC, Gastric cancer; HC, Heathy control.
Figure 1.
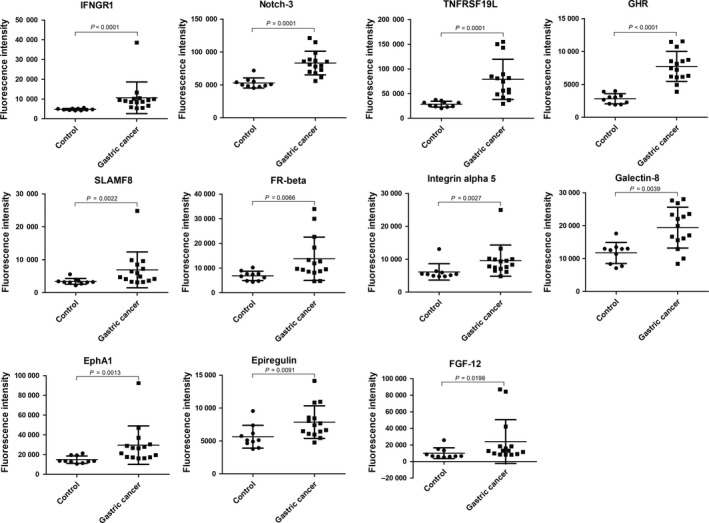
Scatter plots of differential protein levels. The levels of eleven proteins differentially expressed between gastric cancer and the control samples were detected by antibody array are shown by scatter plots with mean lines and standard deviation lines. Control group, n = 20; Gastric cancer, n = 20
Figure 2.
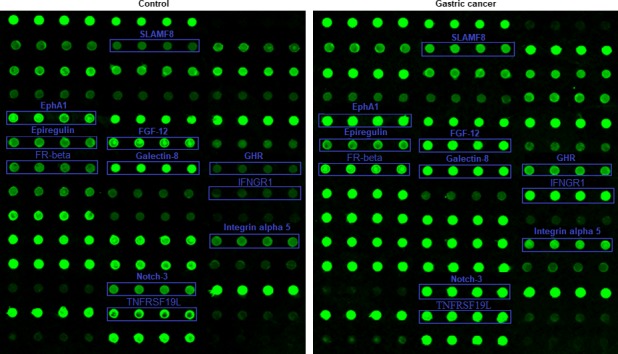
The antibody array profiles. The locations of differentially expressed proteins in the antibody array profiles are marked by blue rectangles. The levels of cytokines are shown by their fluorescence intensity which is proportional to the levels of expression
Figure 3.
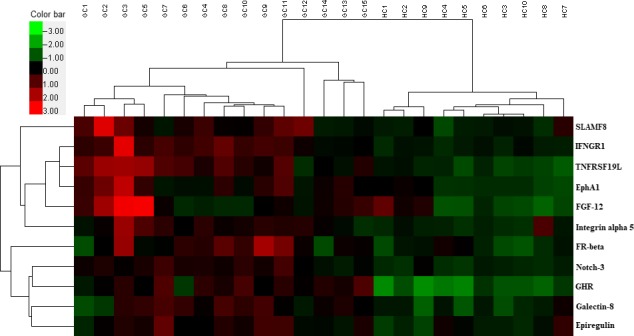
Unsupervised‐hierarchical cluster analysis. The unsupervised‐hierarchical cluster analysis accurately distinguished gastric cancer from controls, confirming differences in the expression of the eleven proteins between gastric cancer and control. Green indicates low levels of the proteins, black for median levels, and red for high levels. GC, gastric cancer; HC, healthy control
3.2. ELISA validation
Of these significantly increased cytokines, IFNGR1, Notch‐3, GHR, TNFRSF19L, FR‐beta and SLAMF8 were selected for ELISA validation due to the limits of sample volume and funding. The results of the ELISA validation are shown as a scatter plot (Figure 4), which also showed all of the six cytokines were significantly increased in patients. These results were identical to those of the microarray.
Figure 4.
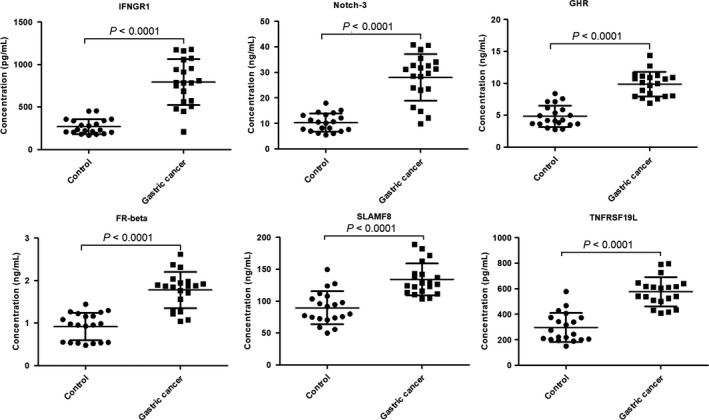
The ELISA results of six differentially expressed proteins. ELISA results of six differentially expressed proteins are shown by scatter plots with mean lines and standard deviation lines. The statistical analysis of these proteins between gastric cancer and control was performed by Mann‐Whitney U test analysis. Control group, n = 20; Gastric cancer, n = 20
4. DISCUSSION
Serum is an important aspect of clinical diagnosis, as serum is readily available and procuring it is a noninvasive procedure. The ease of access to serum simplifies clinical diagnosis of diseases, provided effective biomarkers are utilized. Because of the low specificity and sensitivity of currently available serum biomarkers for gastric cancer, identification of more clinically relevant biomarkers remains an urgent need. In this study, a high‐throughput solid antibody array was utilized to screen serum biomarkers with higher clinical specificity and sensitivity and, to our knowledge, this is the first study to use antibody array techniques to identify serum biomarkers for gastric cancer.
The antibody array utilized in this study simultaneously detected 40 cytokines and identified eleven cytokines (IFNGR1, Notch‐3, TNFRSF19L, GHR, SLAMF8, FR‐beta, Integrin alpha 5, Galectin‐8, EphA1, Epiregulin and FGF‐12) significantly elevated in gastric cancer serum when compared to the controls by Mann‐Whitney U test analysis. Additionally, the unsupervised‐hierarchical cluster analysis of the microarray data accurately differentiated the gastric cancer and control groups, further detailing the differences in cytokine expression between the gastric cancer and control groups. More importantly, the significant changes of some cytokines were validated by ELISA, using fresh samples, and found to be identical to the results of the antibody array, suggesting that these cytokines increased reliably in gastric cancer serum and that these cytokines may be used as serum biomarkers of gastric cancer.
IFNGR1 is a key molecule of the IFN‐γ signaling pathway. Canedo et al9 found that IFNGR1 −56C/T gene polymorphism is associated with an increased risk of early gastric carcinoma, but there have not been any reports on the aberrant expression of IFNGR1 in gastric cancer. However, in this study, we found the levels of IFNGR1 were obviously increased in gastric cancer. Notch‐3 is a member of the Notch family of receptors and plays both oncogenic and tumor suppressor role in malignant tumors. Notch 1 and 3 genes are known to be overexpressed in intestinal and gastric carcinomas.10, 11 Likewise, we also found Notch‐3 was overexpressed in gastric cancer. TNFRSF19L is a new member of the tumor necrosis factor receptor superfamily, and is upregulated when tumor cells undergo the epithelial‐mesenchymal transition critical for cancer development.12 However, TNFRSF19L was found to be elevated in gastric cancer for the first time in this study. GHR, as a member of the class I cytokine receptor family, is involved in multiple biological and physiological processes contributing to cell proliferation and differentiation. GHR is a risk factor for some cancers, such as colorectal carcinoma, melanoma, uterine cervical neoplasms, breast cancer, and hepatocellular carcinoma.13 However, we found GHR was elevated in gastric cancer for the first time in this study, suggesting that GHR may be a risk factor for gastric cancer as well. SLAMF8, the eighth member of the SLAMF costimulatory receptors, regulates the development and function of many immune cells.14, 15, 16 Although Zou et al17 reported SLAMF8 as an independent prognosis factor in glioma and Sasaroli et al18 found SLAMF8 was increased in ovarian cancer, there have been few reports on the relationship of SLAMF8 and gastric cancer. In this study, we discovered that SLAMF8 was elevated in serum of gastric cancer patients. FR‐beta is the β isoform of the folate receptor. Numerous studies have shown that FRα is markedly overexpressed in ovarian, kidney, lung, brain, endometrial, colorectal, pancreatic, gastric, prostate, testicular, bladder, head and neck, breast cancers, and non‐small‐cell lung cancer.19, 20, 21, 22, 23, 24, 25, 26 However, there are few reports about FR‐beta expression in variant cancers, including gastric cancer. In this study, FR‐beta was found to be elevated in gastric cancer. Integrins are involved in key developmental processes, including cell differentiation, cell adhesion, cell migration, cell proliferation, and cell survival. It was reported that some members of the integrin alpha V family (integrin alpha V beta 5, integrin alpha V beta 6, and integrin alpha V beta 8) were up‐regulated in gastric cancer, integrin alpha 5 was a prognostic factor in early stage non‐small‐cell lung cancer, and bladder cancer cell lines expressed integrin alpha 5 at high levels.27, 28, 29 However, the expression of integrin alpha 5 in gastric cancer had not been evaluated before. In our study, integrin alpha 5 was shown to be overexpressed in gastric cancer. Galectin‐8 is a galectin family protein, plays an important role in endothelial cell migration, angiogenesis, cell adhesion and migration, and functions in cancer signaling pathways.30, 31, 32 Wu et al 33 revealed that high expression of galectin‐8 was a favorable prognostic factor for patients with gastric cancer. Similarly, this study showed Galectin‐8 was elevated in gastric cancer serum. EphA1, as the first member of the Eph receptor tyrosine kinase family, derives from erythropoietin‐producing hepatocellular carcinoma cell lines. Gastric cancer patients with overexpression of EphA1 had poorer outcomes, overall survival and relapse‐free survival than those with low levels of EphA1.34, 35 Epiregulin is a member of the epidermal growth factor (EGF) family, and is overexpressed in human gastric tumor cell lines TMK1 and MKN‐45, as are other EGF family members.36 FGF‐12 is a member of the FGF family, functions in the development of the central and peripheral nervous systems, connective tissue of the skeleton and the myocardia of the heart. FGF‐12 was also overexpressed in human gastric tumor cell line MKN‐45.37 In this study, the levels of EphA1, epiregulin, and FGF‐12 were found to be higher in gastric cancer patients than in healthy population.
In conclusion, in this study, we found eleven cytokines (IFNGR1, Notch‐3, TNFRSF19L, GHR, SLAMF8, FR‐beta, integrin alpha 5, galectin‐8, EphA1, epiregulin, and FGF‐12) that were elevated in gastric cancer serum, suggesting that these cytokines may participate in the occurrence and development of gastric cancer. Among these cytokines, Notch‐3, galectin‐8, EphA1, epiregulin, and FGF‐12 have been reported to be upregulated in gastric cancer. However, the other six cytokines, including IFNGR1, TNFRSF19L, GHR, SLAMF8, FR‐beta, and integrin alpha 5 are reported to be elevated in gastric cancer for the first time in this study, suggesting that these proteins may be novel serum biomarkers for the early diagnosis and prognosis of gastric cancer.
5. ETHICS APPROVAL AND CONSENT TO PARTICIPATE
All procedures using humans in this study were approved by the Ethics Committee of the Lishui Central Hospital. All participants approved participating in the study and signed written informed consent forms.
CONFLICT OF INTEREST
The authors declare that no conflicts of interest exist.
ACKNOWLEDGMENTS
We thank the people who assisted in this study. This study was financed by the Research Fund Project of Zhejiang Provincial Traditional Chinese Medicine Administration (2017ZB099).
Wu D, Zhang P, Ma J, et al. Serum biomarker panels for the diagnosis of gastric cancer. Cancer Med. 2019;8:1576–1583. 10.1002/cam4.2055
Contributor Information
Meifen Chen, Email: 2373555352@qq.com.
Hongtao Xu, Email: 15024622762@139.com.
REFERENCES
- 1. Hartgrink HH, Jansen E, van Grieken N, van de Velde C. Gastric cancer. The Lancet. 2009;374:477‐490. [DOI] [PMC free article] [PubMed] [Google Scholar]
- 2. Hunt RH, Camilleri M, Crowe SE, et al. The stomach in health and disease. Gut. 2015;64:1650‐1668. [DOI] [PMC free article] [PubMed] [Google Scholar]
- 3. González CA, Agudo A. Carcinogenesis, prevention and early detection of gastric cancer: where we are and where we should go. Int J Cancer. 2012;130:745‐753. [DOI] [PubMed] [Google Scholar]
- 4. Emoto S, Ishigami H, Yamashita H, Yamaguchi H, Kaisaki S, Kitayama J. Clinical significance of CA125 and CA72‐4 in gastric cancer with peritoneal dissemination. Gastric Cancer. 2012;15:154‐161. [DOI] [PubMed] [Google Scholar]
- 5. Li Y, Yang Y, Lu M, Shen L. Predictive value of serum CEA, CA19‐9 and CA724 in early diagnosis of recurrence after radical resection of gastric cancer. Hepatogastroenterology. 2011;58:2166‐2170. [DOI] [PubMed] [Google Scholar]
- 6. Shimada H, Noie T, Ohashi M, Oba K, Takahashi Y. Clinical significance of serum tumor markers for gastric cancer: a systematic review of literature by the Task Force of the Japanese Gastric Cancer Association. Gastric Cancer. 2014;17:26‐33. [DOI] [PubMed] [Google Scholar]
- 7. Lin Y, Huang RC, Chen LP, et al. Identification of interleukin‐8 as estrogen receptor‐regulated factor involved in breast cancer invasion and angiogenesis by protein arrays. Int J Cancer. 2004;109:507‐515. [DOI] [PubMed] [Google Scholar]
- 8. Sanchez‐Carbayo M, Socci ND, Lozano JJ, Haab BB, Cordon‐Cardo C. Profiling bladder cancer using targeted antibody arrays. Am J Pathol. 2006;168:93‐103. [DOI] [PMC free article] [PubMed] [Google Scholar]
- 9. Canedo P, Corso G, Pereira F, et al. The interferon gamma receptor 1 (IFNGR1) 256C/T gene polymorphism is associated with increased risk of early gastric carcinoma. Gut. 2008;57:1504‐1508. [DOI] [PubMed] [Google Scholar]
- 10. Koch U, Radtke F. Notch and cancer: a double‐edged sword. Cell Mol Life Sci. 2007;64:2746‐2762. [DOI] [PMC free article] [PubMed] [Google Scholar]
- 11. Chen X, Leung SY, Yuen ST, et al. Variation in gene expression patterns in human gastric cancers. Mol Biol Cell. 2003;14:3208–3215. [DOI] [PMC free article] [PubMed] [Google Scholar]
- 12. Johansson J, Tabor V, Wikell A, Jalkanen S, Fuxe J. TGF‐beta1‐induced epithelial‐mesenchymal transition promotes monocyte/macrophage properties in breast cancer cells. Front Oncol. 2015;5:3. [DOI] [PMC free article] [PubMed] [Google Scholar]
- 13. Chhabra Y, Waters MJ, Brooks AJ. Role of the growth hormone‐IGF‐1 axis in cancer. Expert Rev Endocrinol Metab. 2011;6:71–84. [DOI] [PubMed] [Google Scholar]
- 14. Detre C, Keszei M, Romero X, Tsokos GC, Terhorst C. SLAM family receptors and the SLAM‐associated protein (SAP) modulate T cell functions. Semin Immunopathol. 2010;32:157–171. [DOI] [PMC free article] [PubMed] [Google Scholar]
- 15. Romero X, Sintes J, Engel P. Role of SLAM family receptors and specific adapter SAP in innate‐like lymphocytes. Crit Rev Immunol. 2014;34:263–299. [DOI] [PubMed] [Google Scholar]
- 16. De Calisto J, Wang N, Wang G, Yigit B, Engel P, Terhorst C. SAP‐dependent and ‐independent regulation of innate T cell development involving SLAMF receptors. Front Immunol. 2014;5:186. [DOI] [PMC free article] [PubMed] [Google Scholar]
- 17. Zou CY, Guan GF, Zhu C, et al. Costimulatory checkpoint SLAMF8 is an independent prognosis factor in glioma. CNS Neurosci Ther. 2018 https://www.ncbi.nlm.nih.gov/pubmed/?term=Costimulatory+checkpoint+SLAMF8+is+an+independent+prognosis+factor+in+glioma. [DOI] [PMC free article] [PubMed] [Google Scholar]
- 18. Sasaroli D, Gimotty PA, Pathak HB, et al. Novel surface targets and serum biomarkers from the ovarian cancer vasculature. Cancer Biol Ther. 2011;12:169–180. [DOI] [PMC free article] [PubMed] [Google Scholar]
- 19. Christoph DC, Asuncion BR, Hassan B, et al. Significance of folate receptor alpha and thymidylate synthase protein expression in patients with non‐small‐cell lung cancer treated with pemetrexed. J Thorac Oncol. 2013;8:19–30. [DOI] [PMC free article] [PubMed] [Google Scholar]
- 20. Crane LM, Arts HJ, van Oosten M, et al. The effect of chemotherapy on expression of folate receptor‐alpha in ovarian cancer. Cell Oncol. 2012;35:9–18. [DOI] [PMC free article] [PubMed] [Google Scholar]
- 21. Elnakat H, Ratnam M. Role of folate receptor genes in reproduction and related cancers. Front Biosci. 2006;11:506–519. [DOI] [PubMed] [Google Scholar]
- 22. Nunez MI, Behrens C, Woods DM, et al. High expression of folate receptor alpha in lung cancer correlates with adenocarcinoma histology and EGFR (corrected) mutation. J Thorac Oncol. 2012;7:833–840. [DOI] [PMC free article] [PubMed] [Google Scholar]
- 23. Parker N, Turk MJ, Westrick E, Lewis JD, Low PS, Leamon CP. Folate receptor expression in carcinomas and normal tissues determined by a quantitative radioligand binding assay. Anal Biochem. 2005;338:284–293. [DOI] [PubMed] [Google Scholar]
- 24. Ross JF, Chaudhuri PK, Ratnam M. Differential regulation of folate receptor isoforms in normal and malignant tissues in vivo and in established cell lines. Physiologic and clinical implications. Cancer. 1994;73:2432–2443. [DOI] [PubMed] [Google Scholar]
- 25. Toffoli G, Cernigoi C, Russo A, Gallo A, Bagnoli M, Boiocchi M. Overexpression of folate binding protein in ovarian cancers. Int J Cancer. 1997;74:193–198. [DOI] [PubMed] [Google Scholar]
- 26. Weitman SD, Lark RH, Coney LR, et al. Distribution of the folate receptor GP38 in normal and malignant cell lines and tissues. Cancer Res. 1992;52:3396–3401. [PubMed] [Google Scholar]
- 27. Kawashima A, Tsugawa S, Boku A, et al. Expression of alphav integrin family in gastric carcinomas: increased alphavbeta6 is associated with lymph node metastasis. Pathol Res Pract. 2003;199:57–64. [DOI] [PubMed] [Google Scholar]
- 28. Dingemans AM, van den Boogaart V, Vosse BA, van Suylen RJ, Griffioen AW, Thijssen VL. Integrin expression profiling identifies integrin alpha5 and beta1 as prognostic factors in early stage non‐small cell lung cancer. Mol Cancer. 2010;9:152. [DOI] [PMC free article] [PubMed] [Google Scholar]
- 29. Saito T, Kimura M, Kawasaki T, Sato S, Tomita Y. Correlation between integrin alpha 5 expression and the malignant phenotype of transitional cell carcinoma. Br J Cancer. 1996;73:327–331. [DOI] [PMC free article] [PubMed] [Google Scholar]
- 30. Troncoso MF, Fátima F, Bacigalupo ML, et al. Galectin‐8: a matricellular lectin with key roles in angiogenesis. Glycobiology. 2014;24:907–914. [DOI] [PubMed] [Google Scholar]
- 31. Arun S, Rao PS, Gupta PK, Lockman PR, Srivenugopal KS, Subrahmanyeswara Rao U. Varied expression and localization of multiple galectins in different cancer cell lines. Oncol Rep. 2008;19:587–594. [PubMed] [Google Scholar]
- 32. Hadari YR, Arbel‐Goren R, Levy Y, et al. Galectin‐8 binding to integrins inhibits cell adhesion and induces apoptosis. J Cell Sci. 2000;113:2385–2397. [DOI] [PubMed] [Google Scholar]
- 33. Wu SY, Liu H, Zhang H, et al. Galectin‐8 is associated with recurrence and survival of patients with non‐metastatic gastric cancer after surgery. Tumor Biol. 2016;37:12635–12642. [DOI] [PubMed] [Google Scholar]
- 34. Nakagawa M, Inokuchi M, Takagi Y, et al. Erythropoietin‐producing hepatocellular A1 is an independent prognostic factor for gastric cancer. Ann Surg Oncol. 2015;22:2329–2335. [DOI] [PubMed] [Google Scholar]
- 35. Wang JD, Dong YC, Wang XL, et al. Expression of EphA1 in gastric carcinomas is associated with metastasis and survival. Oncol Rep. 2010;24:1577–1584. [DOI] [PubMed] [Google Scholar]
- 36. Wu WK, Tse TT, Sung JJ, Li ZJ, Yu L, Cho CH. Expression of ErbB receptors and their cognate ligands in gastric and colon cancer cell lines. Anticancer Res. 2009;29:229–234. [PubMed] [Google Scholar]
- 37. Nakayama F, Müller K, Hagiwara A, Ridi R, Akashi M, Meineke V. Involvement of intracellular expression of FGF12 in radiation‐induced apoptosis in mast cells. J Radiat Res. 2008;49:491–501. [DOI] [PubMed] [Google Scholar]