

Abstract
Background:
Whether consumption of sugar sweetened beverages (SSBs) or artificially sweetened beverages (ASBs) is associated with risk of mortality is of public health interest.
Methods:
We examined associations between consumption of SSBs and ASBs with risk of total and cause-specific mortality among 37,716 men from the Health Professional’s Follow-up study (from 1986-2014) and 80,647 women from the Nurses’ Health study (from 1980-2014) who were free from chronic diseases at baseline. Cox proportional hazards regression was used to estimate hazard ratios (HRs) and 95% confidence intervals (95% CIs).
Results:
We documented 36,436 deaths (7,896 CVD and 12,380 cancer deaths) during 3,415,564 person-years of follow-up. After adjusting for major diet and lifestyle factors, consumption of SSBs was associated with a higher risk of total mortality; pooled HRs (95% CIs) across categories (<1/month, 1-4/month, 2-6/week, 1-<2/day and ≥2/day) were 1.00 (reference), 1.01 (0.98, 1.04), 1.06 (1.03, 1.09), 1.14 (1.09, 1.19), and 1.21 (1.13, 1.28; p-trend <0.0001). The association was observed for CVD mortality [HR comparing extreme categories was 1.31 (95% CI: 1.15, 1.50), p-trend<0.0001] and cancer mortality [1.16 (1.04, 1.29), p-trend =0.0004]. ASBs were associated with total and CVD mortality in the highest intake category only; pooled HR’s (95% CI) across categories were 1.00 (reference), 0.96 (0.93, 0.99), 0.97 (0.95, 1.00), 0.98 (0.94, 1.03) and 1.04 (1.02, 1.12) (p-trend 0.01) for total mortality and 1.00 (reference), 0.93 (0.87, 1.00), 0.95 (0.89, 1.00), 1.02 (0.94, 1.12) and 1.13 (1.02, 1.25) (p-trend 0.02) for CVD mortality. In cohort-specific analysis, ASBs were associated with mortality in NHS but not in HPFS (p-interaction, 0.01). ASBs were not associated with cancer mortality in either cohort.
Conclusions:
Consumption of SSBs was positively associated with mortality primarily through CVD mortality and showed a graded association with dose. The positive association between high intake levels of ASBs and total and CVD mortality observed among women requires further confirmation.
Keywords: Sugar sweetened beverages, low calorie beverages, artificially sweetened beverages, all-cause death, cardiovascular death
Introduction
Sugar sweetened beverages (SSBs) are the single largest source of added sugar in the US diet1, 2. They include the full spectrum of carbonated and non-carbonated soft drinks, fruit drinks and sports drinks that contain added caloric sweeteners such as high fructose corn syrup (HFCS), sucrose, or fruit juice concentrates. Although consumption of SSBs in the US has decreased in the past decade3, national survey data show a slight rebound in consumption in recent years among adults in most age groups with an average intake of 145 kcal per day, equivalent to 6.5% of energy. Among younger adults, SSB contributed 9.3% of daily calories in men and 8.2% in women4, 5. These intake levels nearly exceed dietary recommendations for consuming no more than 10% of total energy from all added sugar6. In other parts of the world, particularly developing countries, intake of SSBs is rising dramatically due to widespread urbanization and beverage marketing7.
In epidemiological studies, intake of SSBs has been associated with weight gain8 and higher risk of type 2 diabetes9, coronary heart disease10, 11 and stroke12. To date, few studies have examined the association between SSB intake and mortality. A prospective analysis of National Health and Nutrition Examination Survey (NHANES) data found positive associations between baseline intakes of added sugar and SSBs with CVD mortality13. In contrast, results from a cohort of Chinese adults in Singapore with very low intake levels found no significant association between SSBs and mortality14, while another study among elderly participants in the US found a higher risk of death associated with consumption of artificially sweetened beverages (ASBs) but not SSBs15. However, the latter finding may be due to reverse causation, switching from SSBs to ASBs because of underlying conditions, as illustrated in some studies of ASBs and risks of diabetes and heart disease11, 16. ASBs are often suggested as alternatives to SSBs and intake levels of ASBs have increased in the US17, but little is known about their long-term health effects. Thus, we investigated the associations between SSBs and ASBs with total and cause-specific mortality in two large cohorts of US men and women who were middle-aged at baseline with repeated measurements of diet over 28–34 years.
Methods
The data, analytical methods, and study materials will be made available to other researchers from the corresponding authors on reasonable request for purposes of reproducing the results or replicating the procedure.
Study Population
Our analysis was conducted in two ongoing prospective cohort studies: The Nurses’ Health Study (NHS), which was initiated in 1976 and included 121,700 women, aged 30–55 years at entry, and the Health Professionals Follow up Study (HPFS), which began in 1986 among 51,529 men aged 40–75 years. For both cohorts, mailed questionnaires were administered biennially to assess lifestyle factors and health status, with a follow-up rate exceeding 90% for each 2-year cycle. Diet was assessed using a validated self-administered food frequency questionnaire (FFQ) every 4 years. Dietary data were first collected in 1980 in the NHS and in 1986 for the HPFS; we used these years as baseline. We excluded individuals with a history of diabetes, cardiovascular disease (CVD) or cancer at baseline and those who left >70 items blank on the baseline FFQ, had missing data about SSB intake or reported implausible intakes of total energy (< 500 or >3500 kcal/d for women and <800 or >4200 kcal/day for men). After exclusions, a total of 80,647 women and 37,716 men remained for the analysis. Protocols for these studies were approved by the institutional review boards of Brigham and Women’s Hospital and the Harvard T.H. Chan School of Public Health and participants gave informed consent.
Assessment of Beverage Intake
In 1980, intake of SSB and ASB was assessed among NHS participants using a 61-item FFQ designed to assess usual diet over the previous year. A similar but expanded FFQ with 131–166 items, was administered in subsequent questionnaire cycles to NHS (1984, 1986, 1990, 1994, 1998, 2002, 2006 and 2010) and HPFS (1986, 1990, 1994, 1998, 2002, 2006 and 2010) participants. On each FFQ we asked participants how often, on average they consumed a standard portion of foods and beverages (one standard glass, bottle or can), using 9 possible responses ranging from “never or less than once per month” to “6 or more times per day. Nutrient and energy intakes were calculated by multiplying the frequency of consumption of each unit of food and beverage by nutrient and energy contents and summing across all items. Total SSBs were defined as caffeinated colas, caffeine-free colas, other (i.e. non-cola) carbonated sugar-sweetened beverages, and noncarbonated sugar-sweetened beverages (fruit punches, lemonades, or other fruit drinks). Fruit juice was not considered a SSB. ASBs were defined as caffeinated, caffeine-free, and noncarbonated low-calorie or diet beverages. The reproducibility and validity of these FFQs have been described elsewhere18, 19. Briefly, the correlation coefficients between the FFQ and multiple dietary records were 0.84 for colas, 0.36 for other carbonated soft drinks, and 0.56 for noncarbonated sweetened beverages among NHS participants19. Similar values were found in the HPFS18. SSB consumption has also been associated with biomarkers including higher plasma triglycerides and inflammatory cytokines and lower high density lipoprotein and leptin in our cohorts, providing further evidence of the validity of our measurements11, 20.
Ascertainment of Death
Deaths were identified from state vital statistics records and the National Death Index or by reports from next of kin or the postal authorities. More than 97% of deaths were identified for these cohorts21. Cause of death was determined by physician review of medical records, autopsy reports or death certificates. We used the International Classification of Diseases, Eighth Revision (ICD-8) in NHS and ICD-9 in HPFS, which was widely used at the time the cohorts began, to distinguish between deaths due to CVD (ICD codes 390 to 458 in the NHS and 390–459 in the HPFS) and cancer (ICD codes 140 to 207 in the NHS and 140 to 208 in the HPFS). For breast cancer mortality we used ICD code 174, for lung cancer mortality ICD code 162 and for colon cancer mortality ICD codes 153 and 154.
Assessment of Covariates
For both cohorts, information on lifestyle factors and medical history, including age, body weight, smoking status, physical activity, medication and supplement use, disease diagnoses and family history of chronic diseases was obtained from biennial questionnaires. Body mass index (BMI) (weight in kilograms divided by height in meters squared) was calculated from body weight reported on each follow-up questionnaire and height reported at study initiation. Information on dietary factors was obtained from updated FFQs. A modified Alternate Healthy Eating Index (AHEI) score, with SSBs removed was used as an indicator of overall diet quality. This score was calculated based on 10 foods and nutrients that are predictive of chronic disease risk including fruit, vegetables, nuts and legumes, red and processed meat, whole grains, alcohol, sodium, trans fat, long chain omega-3 and other polyunsaturated fats. 22 A higher score denotes greater adherence to the AHEI and better diet quality.
Statistical Analysis
Age-stratified Cox proportional hazards regression was used to model the associations between SSBs and ASBs with total and cause-specific mortality separately for each cohort. Person-time was calculated for each participant from baseline until the end of follow-up (June 30, 2014 for the NHS and January 31, 2014 for the HPFS), or death, whichever occurred first. Beverage intake was categorized by frequency: <1/mo (reference), 1–4/mo, 2–6/wk, 1-<2/d, and ≥2/d, and linear trends were evaluated using the Wald test on a continuous variable representing median intakes of each category. In secondary analysis, we collapsed the first two categories of intake since the majority of participants consumed <1 serving per week. We also assessed ASB using the following categories to reflect the greater frequency of intake, which was not possible for SSB because of the lower intake levels: <1/mo (reference), 1–4/mo, 2–6/wk, 1-<2/d, 2-< 4/d and ≥4/d. Given the long durations of follow-up in our cohorts and because intake levels of SSBs and ASBs have changed over time, we used dietary intake reported at the beginning of each FFQ cycle, which was updated by repeated FFQs throughout follow-up23. In secondary analysis, to better represent long-term average diet, we repeated the analysis using cumulative averages of dietary data that were created using repeated measures from the FFQs (calculated by taking the mean intake from all FFQs up to the beginning of a follow up interval). We also repeated the analysis using baseline dietary intake and with an 8-year lag, whereby exposures were evaluated in relation to outcomes 8 years later. Missing values were replaced with those from the preceding FFQ cycle. Multivariate models were adjusted for age and race (white or nonwhite) and time-varying covariates including smoking status (never, past or current [1–14, 15–24 or ≥ 25 cigarettes per day]), postmenopausal status and hormone use (NHS only), alcohol intake (0, 0.1–4.9, 5.0–14.9, or ≥15 g/d for NHS and 0, 0.1–4.9, 5.0–29.9 or ≥30 g/d for HPFS), physical activity (<3.0, 3.0–8.9, 9.0–17.9, 18.0–26.9 or ≥27.0 hours of metabolic equivalent tasks (METs) per week), multivitamin use (yes or no), aspirin use (yes or no), family history of diabetes mellitus, myocardial infarction, or cancer, baseline history of hypertension or hypercholesterolemia and intakes of total energy, whole grains, fruit, vegetables, and red and processed meat in quintiles. In secondary analysis, we replaced individual foods in the model with the AHEI score (in quintiles). All models were mutually adjusted for SSB and ASB in quintiles. BMI (<23.0, 23.0–24.9, 25.0–29.9, 30.0–34.9 or ≥35 kg/m2) was subsequently added to the models as it may partly mediate the association between SSB/ASB and risk of death.
To minimize potential reverse causation resulting from changes in SSB and ASB intakes because of illness or attempt to lose weight, we applied the lifelong maximum BMI by age-at-risk approach24, whereby the maximum value of BMI reported prior to outcome assessment is used for risk prediction. For example, the maximum value of BMI at age 18 and BMI reported in 1980 was used to predict mortality between 1980 and 1982, and the maximum value of BMI at age 18, BMI reported in 1980 and BMI reported in 1982 was used to predict mortality between 1982–1984 and so forth. To evaluate whether occurrence of an intermediate chronic condition may mediate associations, we also adjusted for hypertension, hypercholesterolemia, diabetes mellitus, CHD, stroke and cancer in sensitivity analysis. Because diagnosis of an intermediate disease might lead to changes in diet or recall bias, we stopped updating dietary variables when participants reported having diabetes mellitus, stroke, CHD or cancer. In sensitivity analysis, we repeated the analysis without stopping updating diet. Stratified analyses and potential interaction with age (<65 y vs. ≥65 y), BMI (<25 or ≥25 kg/m2), physical activity (based on median), and diet quality as assessed by the AHEI (based on median) was evaluated using the Wald test on cross-product terms based on beverage intake (continuous variable) and the stratification variables.
We also evaluated the association of substituting 1 serving per day of SSB with an equivalent amount of ASB by including both as continuous variables simultaneously in the multivariable model. The difference between beta coefficients and variance and the covariance were used to estimate hazard ratios (HRs) and 95% confidence intervals (95% CI) for the substitution association. All statistical tests were two-sided with a p-value <0.05 and performed using SAS version 9.2 for UNIX (SAS Institute, Cary, NC). Pooled HR’s were obtained by combining data from both cohorts to increase statistical power and obtain summary estimates.
Results
During 34 years of follow-up in the NHS, we documented 23,432 deaths (4,139 CVD and 8,318 cancer) and during 28 years of follow-up in the HPFS we documented 13,004 deaths (3,757 CVD and 4,062 cancer). Mean consumption of SSBs decreased in both cohorts over the course of follow-up, while intake of ASBs increased initially and then decreased (Supplemental Figure 1). Intakes of SSBs and ASBs were slightly inversely correlated in the NHS (r=−0.06, p<0.001) and HPFS (r=−0.16, p<0.001). Characteristics of participants according to frequency of SSB and ASB intake are shown in Table 1. Given the long duration of follow-up, the data shown are from 1994, which is the approximate mid-point of follow-up. Men and women with higher intakes of SSBs tended to be younger, less physically active, less likely to take a multivitamin and more likely to smoke compared to those with lower intakes (Table 1). SSB consumption was also associated with a higher intake of total energy, red and processed meat and glycemic load and with a lower intake of whole grains and vegetables. Individuals with higher intakes of ASBs were also more likely to be younger than infrequent consumers and to have hypertension, a greater BMI and tendency to be overweight. ASB intake was associated with a lower glycemic load.
Table 1:
Age-adjusted Characteristics of Nurses’ Health Study (NHS) and Health Professionals Follow-up Study (HPFS) Participants by Category of Sugar Sweetened Beverage (SSB) and Artificially Sweetened Beverage (ASB) Intake in 1994
| NHS, 1994 |
HPFS, 1994 |
|||||
|---|---|---|---|---|---|---|
| <1/mo | 2-6/wk | ≥2/d | <1/mo | 2-6/wk | ≥2/d | |
| SSB Intake (n) | 33,641 | 16,767 | 2,400 | 12,832 | 12,635 | 1,229 |
| Age* | 60.3 | 59.3 | 57.6 | 61.9 | 59.3 | 56.1 |
| Body mass index (kg/m2) | 27.4 | 27.1 | 28.4 | 26.9 | 26.6 | 26.8 |
| Body mass index (kg/m2) > 25 % | 62 | 59 | 65 | 69 | 67 | 66 |
| Physical Activity (Mets/wk) | 20.2 | 18.4 | 17.6 | 31.0 | 29.9 | 28.1 |
| White race % | 98 | 97 | 95 | 96 | 94 | 94 |
| Current smoker % | 13 | 14 | 22 | 7 | 7 | 11 |
| Hypertension % † | 14 | 15 | 18 | 20 | 18 | 20 |
| High Cholesterol % † | 5 | 4 | 5 | 11 | 9 | 12 |
| Postmenopausal hormone use % | 34 | 31 | 25 | - | - | - |
| Aspirin use % | 40 | 41 | 36 | 39 | 38 | 40 |
| Multivitamin use % | 48 | 46 | 42 | 45 | 43 | 37 |
| Alcohol (grams/day) | 6.1 | 4.6 | 4.5 | 12.3 | 10.4 | 9.7 |
| Total energy (kcal/day) | 1602 | 1867 | 2222 | 1802 | 2090 | 2594 |
| Glycemic load | 103 | 109 | 132 | 127 | 133 | 157 |
| Whole grains (grams/day) | 22.2 | 17.5 | 13.1 | 25.0 | 19.8 | 14.5 |
| Fruit (servings/day) | 2.3 | 2.4 | 2.4 | 2.4 | 2.5 | 2.3 |
| Vegetables (servings/day) | 3.5 | 3.4 | 3.2 | 3.3 | 3.1 | 2.9 |
| Red and processed meat (servings/day) | 0.80 | 1.1 | 1.3 | 0.83 | 1.14 | 1.46 |
| Alternative Healthy Eating Index | 50.6 | 47.4 | 42.7 | 53.0 | 49.7 | 44.2 |
| ASB Intake (n) | 30,698 | 18,434 | 7,128 | 16,182 | 9,607 | 2,981 |
| Age* | 60.7 | 59.5 | 57.0 | 61.3 | 60.3 | 56.2 |
| Body mass index (kg/m2) | 26.2 | 27.8 | 29.6 | 25.9 | 27.1 | 28.6 |
| Body mass index (kg/m2) > 25 % | 51 | 66 | 77 | 58 | 74 | 85 |
| Physical Activity (Mets/wk) | 19.1 | 19.9 | 17.9 | 29.4 | 30.6 | 30.4 |
| White race % | 97 | 98 | 98 | 95 | 95 | 96 |
| Current smoker % | 18 | 10 | 15 | 9 | 6 | 7 |
| Hypertension % † | 13 | 15 | 19 | 16 | 20 | 25 |
| High Cholesterol % † | 4 | 5 | 6 | 9 | 11 | 11 |
| Postmenopausal hormone use % | 30 | 36 | 30 | - | - | - |
| Aspirin use % | 38 | 42 | 40 | 36 | 41 | 43 |
| Multivitamin use % | 45 | 48 | 47 | 42 | 45 | 45 |
| Alcohol (grams/day) | 5.4 | 5.2 | 5.6 | 11.1 | 11.4 | 11.0 |
| Total energy (kcal/day) | 1749 | 1719 | 1759 | 2031 | 1954 | 2018 |
| Glycemic load | 109 | 106 | 101 | 134 | 131 | 125 |
| Whole grains (grams/day) | 19.3 | 20.7 | 17.8 | 21.4 | 22.1 | 19.7 |
| Fruit (servings/day) | 2.3 | 2.4 | 2.2 | 2.4 | 2.4 | 2.4 |
| Vegetables (servings/day) | 3.3 | 3.6 | 3.5 | 3.1 | 3.2 | 3.3 |
| Red and processed meat (servings/day) | 0.97 | 0.90 | 1.02 | 1.07 | 0.98 | 1.07 |
| Alternative Healthy Eating Index | 48.4 | 49.8 | 46.9 | 50.0 | 51.8 | 49.7 |
Values are means or percentages and are standardized to the age distribution of the study population.
not age-adjusted.
Physician-diagnosed condition (yes/no). Mets/wk, metabolic equivalent hours per week.
After adjusting for age and ASB consumption, intake of SSBs was associated with an increased risk for total mortality in both cohorts (Table 2). Compared to those who consumed SSBs less than once per month, women who consumed ≥2 servings of SSBs per day had a 63% higher risk of death (HR: 1.63; 95% CI: 1.52, 1.75) and for men the estimate was 29% (HR: 1.29; 95% CI: 1.15, 1.44). The pooled HR (95% CI) was 1.52 (1.43, 1.61). After adjusting for demographic and lifestyle factors (smoking, alcohol intake, postmenopausal hormone use (NHS), physical activity, family history of diabetes, family history of myocardial infarction, family history of cancer, multivitamin use, ethnicity, aspirin use), the association was attenuated (HR: 1.30; 95% CI: 1.22, 1.38). Additional adjustment for baseline hypertension and hypercholesterolemia, intakes of whole grains, fruit, vegetables, red and processed meat, total energy and BMI further attenuated the association (HR was 1.21 (95% CI: 1.13, 1.28; p-trend: <0.001). BMI was included in the multivariate model since results were similar if BMI was removed. Each serving per day increment in SSB was associated with a 7% higher risk of death (HR: 1.07; 95% CI: 1.05, 1.09). An interaction with sex was observed with stronger associations in the NHS than HPFS (p-interaction, 0.02). Associations were similar for different types of SSBs with a serving per day increment in risk of 7% (95% CI: 4%, 10%) for cola, 8% (3%, 13%) for non-cola carbonated beverages and 7% (4%, 10%) for non-carbonated beverages (Supplemental Table 1). After adjusting for incidence of intermediate conditions including, hypertension, hypercholesterolemia, type 2 diabetes, CHD and stroke during follow-up, the association between SSBs and mortality was attenuated but still statistically significant: (HR for one serving/day: 1.05; 95% CI: 1.03, 1.07) (not shown).
Table 2:
Total and Cause-specific Mortality According to Intake of Sugar-Sweetened Beverages (SSB) in the Nurses’ Health Study (NHS) and Health Professionals Follow-up study (HPFS)
| SSB Category |
HR (95% CI) per 1 serving per day increment |
||||||
|---|---|---|---|---|---|---|---|
| <1/mo | 1-4/mo | 2-6/wk | 1 to <2/d | ≥ 2/d | P trend | ||
| Total Mortality | |||||||
| NHS | |||||||
| Number of cases | 11149 | 5360 | 4501 | 1561 | 861 | ||
| Person years | 1127585 | 604268 | 522058 | 163412 | 84884 | ||
| Age-adjusted model | 1.0 | 1.02 (0.98, 1.05) | 1.10 (1.07, 1.14) | 1.34 (1.27, 1.42) | 1.63 (1.52, 1.75) | <0.0001 | 1.19 (1.17, 1.21) |
| Multivariate model 1 | 1.0 | 1.07 (1.04, 1.11) | 1.11 (1.07, 1.15) | 1.22 (1.16, 1.29) | 1.36 (1.27, 1.46) | <0.0001 | 1.10 (1.08 1.12) |
| Multivariate model 2 | 1.0 | 1.04 (1.00, 1.07) | 1.05 (1.01, 1.09) | 1.14 (1.08, 1.20) | 1.25 (1.16, 1.34) | <0.0001 | 1.08 (1.05, 1.10) |
| HPFS | |||||||
| Number of cases | 5604 | 2359 | 3919 | 809 | 313 | ||
| Person Years | 348582 | 168005 | 302337 | 66398 | 28035 | ||
| Age-adjusted model | 1.0 | 0.93 (0.89, 0.98) | 1.05 (1.01, 1.10) | 1.21 (1.12, 1.30) | 1.29 (1.15, 1.44) | <0.0001 | 1.12 (1.09, 1.15) |
| Multivariate model 1 | 1.0 | 0.97 (0.93, 1.02) | 1.09 (1.05, 1.14) | 1.20 (1.11, 1.29) | 1.21 (1.08, 1.36) | <0.0001 | 1.10 (1.06, 1.13) |
| Multivariate model 2 | 1.0 | 0.95 (0.91, 1.00) | 1.06 (1.01, 1.10) | 1.14 (1.05, 1.23) | 1.12 (1.00, 1.26) | <0.0001 | 1.07 (1.03, 1.10) |
| Pooled | |||||||
| Age-adjusted model | 1.0 | 0.99 (0.96, 1.01) | 1.09 (1.06, 1.12) | 1.30 (1.24, 1.35) | 1.52 (1.43, 1.61) | <0.0001 | 1.17 (1.15, 1.19) |
| Multivariate model 1 | 1.0 | 1.03 (1.00, 1.06) | 1.10 (1.07, 1.13) | 1.20 (1.15, 1.25) | 1.30 (1.22, 1.38) | <0.0001 | 1.10 (1.08, 1.11) |
| Multivariate model 2 | 1.0 | 1.01 (0.98, 1.04) | 1.06 (1.03, 1.09) | 1.14 (1.09, 1.19) | 1.21 (1.13, 1.28) | <0.0001 | 1.07 (1.05, 1.09) |
| CVD Mortality | |||||||
| NHS | |||||||
| Number of cases | 1883 | 972 | 829 | 293 | 162 | ||
| Age-adjusted model | 1.0 | 1.07 (0.99, 1.16) | 1.19 (1.10, 1.29) | 1.46 (1.29, 1.65) | 1.84 (1.57, 2.17) | <0.0001 | 1.23 (1.18, 1.28) |
| Multivariate model 1 | 1.0 | 1.12 (1.04, 1.21) | 1.19 (1.09, 1.29) | 1.31 (1.16, 1.48) | 1.51 (1.28, 1.77) | <0.0001 | 1.14 (1.09, 1.19) |
| Multivariate model 2 | 1.0 | 1.07 (0.99, 1.16) | 1.10 (1.01, 1.20) | 1.21 (1.06, 1.37) | 1.37 (1.16, 1.62) | <0.0001 | 1.11 (1.06, 1.16) |
| HPFS | |||||||
| Number of cases | 1593 | 736 | 1122 | 222 | 84 | ||
| Age-adjusted model | 1.0 | 1.02 (0.94, 1.12) | 1.09 (1.01, 1.17) | 1.22 (1.06, 1.40) | 1.33 (1.07, 1.66) | 0.0002 | 1.11 (1.05, 1.18) |
| Multivariate model 1 | 1.0 | 1.06 (0.97, 1.16) | 1.11 (1.03, 1.20) | 1.20 (1.04, 1.38) | 1.24 (1.00, 1.55) | 0.002 | 1.08 (1.02, 1.15) |
| Multivariate model 2 | 1.0 | 1.04 (0.95, 1.14) | 1.08 (1.00, 1.18) | 1.17 (1.01, 1.35) | 1.19 (0.95, 1.49) | 0.02 | 1.07 (1.01, 1.14) |
| Pooled | |||||||
| Age-adjusted model | 1.0 | 1.05 (0.99, 1.11) | 1.14 (1.08, 1.21) | 1.35 (1.23, 1.48) | 1.63 (1.43, 1.85) | <0.0001 | 1.18 (1.15, 1.22) |
| Multivariate model 1 | 1.0 | 1.09 (1.03, 1.15) | 1.15 (1.08, 1.21) | 1.25 (1.14, 1.37) | 1.39 (1.22, 1.59) | <0.0001 | 1.12 (1.08, 1.15) |
| Multivariate model 2 | 1.0 | 1.06 (1.00, 1.12) | 1.10 (1.04, 1.17) | 1.19 (1.08, 1.31) | 1.31 (1.15, 1.50) | <0.0001 | 1.10 (1.06, 1.14) |
| Cancer Mortality | |||||||
| NHS | |||||||
| Number of cases | 3873 | 2010 | 1611 | 532 | 292 | ||
| Age-adjusted model | 1.0 | 1.04 (0.98, 1.10) | 1.06 (1.00, 1.12) | 1.21 (1.10, 1.32) | 1.39 (1.23, 1.56) | <0.0001 | 1.11 (1.07, 1.15) |
| Multivariate model 1 | 1.0 | 1.10 (1.04, 1.16) | 1.08 (1.02, 1.15) | 1.14 (1.04, 1.25) | 1.22 (1.08, 1.37) | 0.0003 | 1.05 (1.02, 1.09) |
| Multivariate model 2 | 1.0 | 1.06 (1.00, 1.12) | 1.03 (0.97, 1.09) | 1.08 (0.98, 1.19) | 1.16 (1.02, 1.31) | 0.02 | 1.03 (1.00, 1.07) |
| HPFS | |||||||
| Number of cases | 1678 | 727 | 1288 | 267 | 102 | ||
| Age-adjusted model | 1.0 | 0.94 (0.86, 1.03) | 1.10 (1.02, 1.19) | 1.23 (1.08, 1.41) | 1.26 (1.03, 1.55) | <0.0001 | 1.12 (1.07, 1.18) |
| Multivariate model 1 | 1.0 | 0.98 (0.89, 1.07) | 1.14 (1.06, 1.23) | 1.24 (1.09, 1.41) | 1.22 (1.00, 1.49) | <0.0001 | 1.11 (1.05, 1.17) |
| Multivariate model 2 | 1.0 | 0.95 (0.87, 1.04) | 1.10 (1.02, 1.19) | 1.19 (1.04, 1.36) | 1.15 (0.94, 1.42) | 0.004 | 1.08 (1.03, 1.15) |
| Pooled | |||||||
| Age-adjusted model | 1.0 | 1.01 (0.97, 1.06) | 1.08 (1.03, 1.13) | 1.22 (1.13, 1.31) | 1.35 (1.22, 1.50) | <0.0001 | 1.11 (1.08, 1.14) |
| Multivariate model 1 | 1.0 | 1.06 (1.01, 1.11) | 1.10 (1.05, 1.15) | 1.16 (1.08, 1.25) | 1.20 (1.08, 1.33) | <0.0001 | 1.06 (1.03, 1.09) |
| Multivariate model 2 | 1.0 | 1.03 (0.98, 1.08) | 1.06 (1.01, 1.11) | 1.12 (1.03, 1.21) | 1.16 (1.04, 1.29) | 0.0004 | 1.05 (1.02, 1.08) |
Multivariate model 1: adjusted for: age, smoking, alcohol intake, postmenopausal hormone use (NHS), physical activity, family history of diabetes, family history of myocardial infarction, family history of cancer, multivitamin use, ethnicity, aspirin use.
Multivariate model 2: further adjusted for baseline history of hypertension and hypercholesterolemia, intakes of whole grains, fruit, vegetables, red and processed meat, total energy and body mass index.
All models adjusted for artificially sweetened beverages.
SSB intake was also associated with increased risk for CVD mortality, which was more pronounced than for cancer mortality (Table 2). In the pooled, fully adjusted analysis, compared to infrequent consumers, those who consumed ≥2 servings of SSBs per day had a 31 % (HR: 1.31; 95% CI: 1.15, 1.50; p-trend, <0.0001) higher risk of death from CVD. Estimates were greater in the NHS compared to HPFS but no interaction with sex was observed (p-interaction, 0.70). Each serving per day increment of SSBs was associated with a 10% higher risk of CVD death (HR: 1.10; 95% CI: 1.06, 1.14). Modest associations between SSB intake and cancer mortality were observed among both cohorts [HR (95 % CI): 1.16 (1.04, 1.29); p-trend: 0.0004, comparing extreme categories from the pooled analysis]. Among women, there was a positive association between intake of SSB and breast cancer mortality [HR (95 % CI): 1.34 (1.00, 1.80); p-trend: 0.02, comparing extreme categories] and a borderline positive association was observed between SSB intake and colon cancer in both cohorts (Table 3).
Table 3:
Cause-specific Cancer Mortality According to Intake of Sugar- Sweetened Beverages (SSB) and Artificially Sweetened Beverages (ASB) based on pooled data from the Nurses’ Health Study (NHS) and Health Professionals Follow-up study (HPFS)
| Category | P trend | HR (95% CI) per 1 serving per day increment |
|||||
|---|---|---|---|---|---|---|---|
| <1/mo | 1-4/mo | 2-6/wk | 1 to <2/d | ≥ 2/d | |||
| SSB | |||||||
| Total cancer | 1.0 | 1.03 (0.98, 1.08) | 1.06 (1.01, 1.11) | 1.12 (1.03, 1.21) | 1.16 (1.04, 1.29) | 0.0004 | 1.05 (1.02, 1.08) |
| Lung cancer | 1.0 | 0.96 (0.86, 1.06) | 1.04 (0.94, 1.16) | 0.86 (0.72, 1.03) | 1.07 (0.86, 1.33) | 0.73 | 1.01 (0.94, 1.07) |
| Colon cancer | 1.0 | 1.01 (0.86, 1.18) | 1.07 (0.91, 1.25) | 1.05 (0.81, 1.36) | 1.38 (0.99, 1.92) | 0.07 | 1.09 (0.99, 1.19) |
| Breast cancer in women | 1.0 | 1.10 (0.95, 1.26) | 1.12 (0.96, 1.30) | 1.23 (0.98, 1.53) | 1.34 (1.00, 1.80) | 0.02 | 1.09 (1.00, 1.18) |
| Prostate cancer in men | 1.0 | 1.00 (0.80, 1.25) | 1.14 (0.93, 1.39) | 0.73 (0.47, 1.14) | 0.77 (0.39, 1.52) | 0.43 | 1.01 (0.86, 1.19) |
| ASB | |||||||
| Total cancer | 1.0 | 1.01 (0.96, 1.07) | 0.99 (0.94, 1.04) | 1.00 (0.93, 1.07) | 1.04 (0.96, 1.12) | 0.58 | 1.01 (0.98, 1.03) |
| Lung cancer | 1.0 | 0.96 (0.85, 1.08) | 0.85 (0.76, 0.95) | 0.93 (0.80, 1.08) | 0.92 (0.77, 1.09) | 0.20 | 0.98 (0.92, 1.08) |
| Colon cancer | 1.0 | 0.97 (0.81, 1.16) | 1.01 (0.86, 1.18) | 1.11 (0.89, 1.37) | 1.01 (0.77, 1.31) | 0.69 | 1.00 (0.91, 1.07) |
| Breast cancer in women | 1.0 | 1.06 (0.91, 1.23) | 0.90 (0.78, 1.05) | 0.92 (0.76, 1.13) | 1.14 (0.92, 1.40) | 0.57 | 1.01 (0.95, 1.08) |
| Prostate cancer in men | 1.0 | 0.80 (0.61, 1.06) | 1.02 (0.84, 1.25) | 0.93 (0.66, 1.32) | 1.01 (0.67, 1.52) | 0.92 | 1.02 (0.91, 1.14) |
Adjusted for: age, smoking, alcohol intake, postmenopausal hormone use (NHS), physical activity, family history of diabetes, family history of mi, family history of cancer, multivitamin use, ethnicity, aspirin use, baseline history of hypertension and hypercholesterolemia, intakes of whole grains, fruit, vegetables, red and processed meat, total energy and BMI. ASB and SSB were mutually adjusted.
ASB intake was positively associated with risk of total and CVD mortality in the highest category in the NHS: HRs (95% CI) across categories (<1/month, 1 to 4/month, 2 to 6/week, 1 to <2/day and ≥2/day) were 1.00 (reference), 0.96 (0.93, 1.00), 0.94 (0.91, 0.98), 0.97 (0.93, 1.02), and 1.10 (1.04, 1.16), p-trend= 0.01 for total mortality and 1.00 (reference), 0.90 (0.82, 0.99), 0.89 (0.82, 0.98), 0.95 (0.84, 1.07), and 1.15 (1.01, 1.31), p-trend= 0.08 for CVD mortality (Table 4). After adjusting for incidence of intermediate conditions (hypertension, hypercholesterolemia, type 2 diabetes, CHD and stroke) during follow-up, the association between ASBs and total mortality in NHS was attenuated: (HR comparing extreme categories: 1.00; 95% CI: 0.94, 1.06) (not shown). No associations were observed between ASB and total and CVD mortality in HPFS. An interaction with sex was observed for total mortality (p-interaction, 0.01) but not CVD mortality (p-interaction, 0.14). Intake of ASB’s was not associated with cancer mortality in either cohort (Tables 3 and 4). When examining higher intake levels, we observed positive associations between ASB and total and CVD mortality at intakes ≥ 4 servings per day in the NHS (Supplemental table 2). HRs (95% CIs) across categories (<1/month, 1 to 4/month, 2 to 6/week, 1 to <2/day, 2 to <4/day and ≥4/day) were 1.00 (reference), 0.96 (0.93, 1.00), 0.94 (0.91, 0.98), 0.97 (0.93, 1.02), 1.06 (1.00, 1.13), and 1.30 (1.15, 1.46), p trend =0.0001 for total mortality and 1.00 (reference), 0.90 (0.82, 0.99), 0.89 (0.82, 0.98), 0.95 (0.84, 1.07), 1.09 (0.95, 1.26), and 1.43 (1.10, 1.87), p trend =0.02 for CVD mortality. No associations were observed in HPFS.
Table 4:
Total and Cause-specific Mortality According to Intake of Artificially Sweetened Beverages (ASB) in the Nurses’ Health Study (NHS) and Health Professionals Follow-up study (HPFS)
| ASB Category |
P trend | HR (95% CI) per 1 serving per day |
|||||
|---|---|---|---|---|---|---|---|
| <1/mo | 1-4/mo | 2-6/wk | 1 to <2/d | ≥ 2/d | |||
| Total Mortality | |||||||
| NHS | |||||||
| Number of cases | 12561 | 3550 | 3981 | 1858 | 1482 | ||
| Person years | 1122996 | 408370 | 514864 | 260369 | 195608 | ||
| Age-adjusted model | 1.0 | 0.88 (0.85, 0.91) | 0.91 (0.88, 0.94) | 1.04 (0.99, 1.09) | 1.33 (1.26, 1.41) | <0.0001 | 1.10 (1.08, 1.12) |
| Multivariate model 1 | 1.0 | 0.98 (0.94, 1.02) | 0.98 (0.95, 1.02) | 1.03 (0.98, 1.09) | 1.20 (1.14, 1.27) | <0.0001 | 1.06 (1.04, 1.07) |
| Multivariate model 2 | 1.0 | 0.96 (0.93, 1.00) | 0.94 (0.91, 0.98) | 0.97 (0.93, 1.02) | 1.10 (1.04, 1.16) | 0.01 | 1.03 (1.01, 1.05) |
| HPFS | |||||||
| Number of cases | 7037 | 1431 | 3059 | 866 | 611 | ||
| Person Years | 434859 | 96830 | 231310 | 82933 | 67424 | ||
| Age-adjusted model | 1.0 | 0.91 (0.86, 0.96) | 0.98 (0.94, 1.02) | 1.04 (0.97, 1.12) | 1.14 (1.05, 1.24) | 0.0006 | 1.05 (1.03, 1.08) |
| Multivariate model 1 | 1.0 | 0.95 (0.90, 1.01) | 1.02 (0.98, 1.06) | 1.05 (0.97, 1.12) | 1.07 (0.99, 1.17) | 0.03 | 1.03 (1.01, 1.06) |
| Multivariate model 2 | 1.0 | 0.95 (0.89, 1.00) | 1.00 (0.95, 1.04) | 0.98 (0.91, 1.06) | 0.99 (0.91, 1.07) | 0.85 | 1.01 (0.98, 1.03) |
| Pooled | |||||||
| Age-adjusted model | 1.0 | 0.89 (0.86, 0.91) | 0.94 (0.91, 0.96) | 1.04 (1.00, 1.08) | 1.27 (1.21, 1.33) | <0.0001 | 1.08 (1.07, 1.10) |
| Multivariate model 1 | 1.0 | 0.97 (0.94, 1.00) | 1.00 (0.97, 1.03) | 1.04 (1.00, 1.08) | 1.16 (1.11, 1.21) | <0.0001 | 1.05 (1.03, 1.06) |
| Multivariate model 2 | 1.0 | 0.96 (0.93, 0.99) | 0.97 (0.95, 1.00) | 0.98 (0.94, 1.03) | 1.04 (1.02, 1.12) | 0.01 | 1.03 (1.01, 1.04) |
| CVD Mortality | |||||||
| NHS | |||||||
| Number of cases | 2222 | 613 | 691 | 331 | 282 | ||
| Age-adjusted model | 1.0 | 0.87 (0.79, 0.95) | 0.92 (0.84, 1.00) | 1.10 (0.98, 1.24) | 1.59 (1.40, 1.81) | <0.0001 | 1.15 (1.11, 1.19) |
| Multivariate model 1 | 1.0 | 0.96 (0.87, 1.05) | 0.99 (0.91, 1.08) | 1.09 (0.97, 1.23) | 1.41 (1.24, 1.59) | <0.0001 | 1.10 (1.06, 1.14) |
| Multivariate model 2 | 1.0 | 0.90 (0.82, 0.99) | 0.89 (0.82, 0.98) | 0.95 (0.84, 1.07) | 1.15 (1.01, 1.31) | 0.08 | 1.04 (1.00, 1.08) |
| HPFS | |||||||
| Number of cases | 1975 | 436 | 882 | 280 | 184 | ||
| Age-adjusted model | 1.0 | 0.97 (0.88, 1.08) | 1.03 (0.95, 1.12) | 1.28 (1.13, 1.45) | 1.36 (1.17, 1.59) | <0.0001 | 1.11 (1.07, 1.16) |
| Multivariate model 1 | 1.0 | 1.01 (0.91, 1.12) | 1.06 (0.98, 1.15) | 1.27 (1.12, 1.45) | 1.27 (1.09, 1.48) | <0.0001 | 1.09 (1.05, 1.13) |
| Multivariate model 2 | 1.0 | 0.97 (0.87, 1.08) | 0.99 (0.91, 1.07) | 1.11 (0.98, 1.26) | 1.06 (0.90, 1.23) | 0.30 | 1.03 (0.98, 1.07) |
| Pooled | |||||||
| Age-adjusted model | 1.0 | 0.91 (0.85, 0.97) | 0.98 (0.92, 1.03) | 1.18 (1.08, 1.29) | 1.50 (1.36, 1.65) | <0.0001 | 1.13 (1.10, 1.16) |
| Multivariate model 1 | 1.0 | 0.98 (0.91, 1.05) | 1.02 (0.97, 1.09) | 1.17 (1.07, 1.27) | 1.35 (1.22, 1.48) | <0.0001 | 1.09 (1.07, 1.12) |
| Multivariate model 2 | 1.0 | 0.93 (0.87, 1.00) | 0.95 (0.89, 1.00) | 1.02 (0.94, 1.12) | 1.13 (1.02, 1.25) | 0.02 | 1.04 (1.01, 1.07) |
| Cancer Mortality | |||||||
| NHS | |||||||
| Number of cases | 4154 | 1334 | 1520 | 730 | 580 | ||
| Age-adjusted model | 1.0 | 0.93 (0.87, 0.99) | 0.91 (0.86, 0.97) | 1.01 (0.93, 1.09) | 1.20 (1.10, 1.32) | <0.0001 | 1.06 (1.03, 1.08) |
| Multivariate model 1 | 1.0 | 1.03 (0.97, 1.09) | 0.99 (0.93, 1.05) | 1.04 (0.96, 1.12) | 1.13 (1.03, 1.23) | 0.03 | 1.03 (1.00, 1.05) |
| Multivariate model 2 | 1.0 | 1.00 (0.94, 1.07) | 0.95 (0.90, 1.01) | 0.98 (0.91, 1.06) | 1.05 (0.96, 1.15) | 0.50 | 1.01 (0.98, 1.04) |
| HPFS | |||||||
| Number of cases | 2118 | 469 | 996 | 283 | 196 | ||
| Age-adjusted model | 1.0 | 0.99 (0.89, 1.09) | 1.01 (0.93, 1.09) | 1.01 (0.89, 1.15) | 1.05 (0.90, 1.21) | 0.54 | 1.01 (0.97, 1.06) |
| Multivariate model 1 | 1.0 | 1.02 (0.92, 1.13) | 1.05 (0.97, 1.13) | 1.03 (0.91, 1.17) | 1.01 (0.87, 1.17) | 0.83 | 1.01 (0.96, 1.05) |
| Multivariate model 2 | 1.0 | 1.01 (0.92, 1.12) | 1.03 (0.95, 1.11) | 0.99 (0.87, 1.13) | 0.95 (0.82, 1.11) | 0.51 | 0.99 (0.95, 1.03) |
| Pooled | |||||||
| Age-adjusted model | 1.0 | 0.94 (0.89, 0.99) | 0.95 (0.90, 0.99) | 1.01 (0.95, 1.08) | 1.16 (1.08, 1.25) | 0.0002 | 1.04 (1.02, 1.07) |
| Multivariate model 1 | 1.0 | 1.03 (0.97, 1.08) | 1.01 (0.97, 1.06) | 1.04 (0.97, 1.11) | 1.10 (1.02, 1.18) | 0.04 | 1.02 (1.00, 1.04) |
| Multivariate model 2 | 1.0 | 1.01 (0.96, 1.07) | 0.99 (0.94, 1.04) | 1.00 (0.93, 1.07) | 1.04 (0.96, 1.12) | 0.58 | 1.01 (0.98, 1.03) |
Multivariate model 1: adjusted for: age, smoking, alcohol intake, postmenopausal hormone use (NHS), physical activity, family history of diabetes, family history of myocardial infarction, family history of cancer, multivitamin use, ethnicity, aspirin use.
Multivariate model 2: further adjusted for baseline history of hypertension and hypercholesterolemia, intakes of whole grains, fruit, vegetables, red and processed meat, total energy and body mass index.
All models adjusted for sugar sweetened beverages.
We found significant positive associations between SSB and mortality in all categories of diet quality, physical activity, BMI and age (p-interaction > 0.10 for all) (Figure 1). For the association between ASB and mortality, positive associations were observed among some subgroups (high AHEI score, high physical activity level, BMI ≥ 25 and age 65 years or older) but not in others (low AHEI score, low physical activity level, BMI <25 and younger than 65 years) in the pooled analysis. However, significant interactions were observed only for BMI and physical activity (p-interaction, <0.05) (figure 1).
Figure 1:
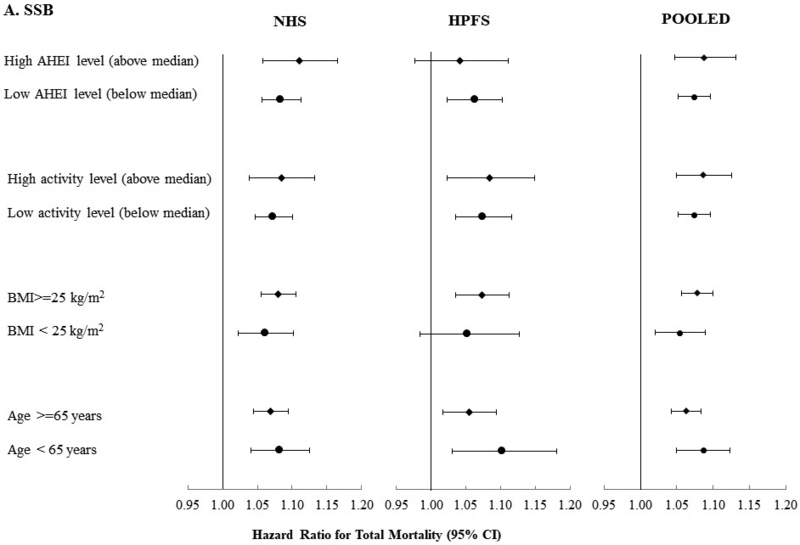
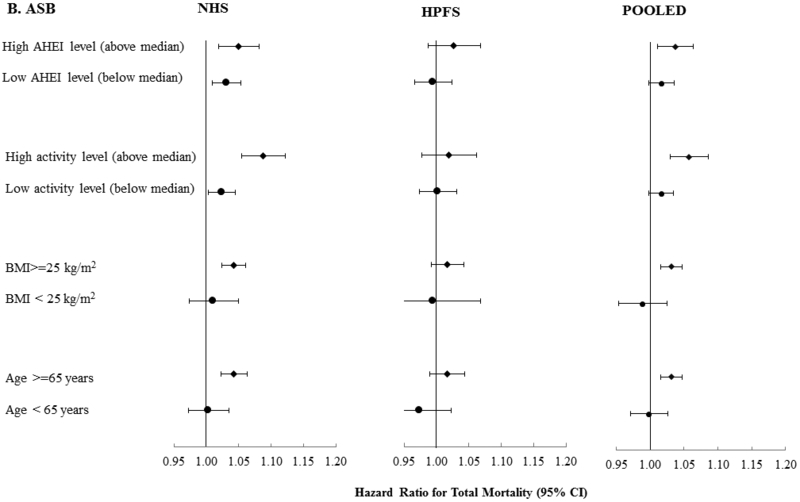
Total Mortality According to SSB Intake (Serving/Day) (A) and ASB (B) Stratified by Age, BMI, Physical Activity and Diet Quality based on pooled data from the Nurses’ Health Study (NHS) and Health Professionals Follow-up Study (HPFS) and Pooled Data from Both Cohorts.
Adjusted for: age, ASB or SSB, smoking, alcohol intake, postmenopausal hormone use (NHS), physical activity, family history of diabetes, family history of mi, family history of cancer, multivitamin use, ethnicity, aspirin use, baseline history of hypertension and hypercholesterolemia, intakes of whole grains, fruit, vegetables, red and processed meat, total energy and BMI. For SSB, all p-interaction >0.10. For ASB, p-interaction > 0.10 except for BMI (p-interaction, 0.01) and physical activity (p-interaction, 0.004) from the pooled analysis and BMI in the NHS (p-interaction, 0.002).
We estimated that replacing 1 serving per day of SSB with 1 serving per day of ASB was associated with a 4% lower risk of total mortality [HR (95 % CI): 0.96 (0.94, 0.98)], 5% lower risk of CVD mortality [HR (95 % CI): 0.95 (0.90, 0.99)] and 4 % lower risk of cancer mortality [HR (95 % CI): 0.96 (0.93, 1.00)].
In the analysis without stopping updating diet with occurrence of chronic diseases, associations with SSB were similar for total mortality, attenuated for CVD mortality and strengthened for cancer mortality (Supplemental Table 3). When using cumulative averages, associations with SSB were similar for total and CVD mortality and attenuated for cancer mortality (supplemental table 3). Associations were attenuated when baseline data and an 8-year lag were used but similar when AHEI was used instead of individual foods in the models (supplemental table 3.) For ASBs, associations for the 3 outcomes were attenuated (with positive associations for total and CVD mortality dissipated) in all sensitivity analyses except for when AHEI was used in the models instead of individual foods, which resulted in similar estimates to those reported in the primary analysis (supplemental table 3). For both SSBs and ASBs, associations for all outcomes were similar when 4 instead of 5 categories of intake were used (Supplemental Table 4).
Discussion
In these two large prospective cohorts of US men and women, we found a positive graded association with dose between intake of SSBs and risk of mortality after adjusting for diet and lifestyle factors. This association was driven by CVD mortality with a stronger association observed among women compared to men, although no significant interaction with sex was observed. We also found a modest positive association between SSB intake and risk of cancer mortality. Intake of ASBs was positively associated with total and CVD mortality at high intake levels (at least 4 servings per day) and associations were statistically significant only among women. ASB intake was not associated with cancer mortality. Substituting 1 serv/d of SSB with ASB was associated with modest reductions in total and cause-specific mortality.
SSBs are the single largest source of added sugar in the US diet1, 2. A typical 12 oz. serving of soda contains 140–150 calories and 35.0–37.5 g of sugar. Positive associations between SSB intake and weight gain, 8, 25 risk of diabetes9 and CHD10, 11 have attracted much scientific interest, but little is known about whether intake of these beverages impacts risk of mortality. However, this may be expected given their associations with the above conditions. In a previous prospective analysis of NHANES data using baseline intake levels, greater intake of added sugar and SSBs was associated with a higher risk of CVD mortality after a median of 14.6 years of follow-up13. Our study, with longer follow-up, a larger sample size and repeated measurements of diet confirm these findings. In contrast to our study, no association was observed between SSB intake and risk of mortality in the Singapore Chinese Health Study14 or in a cohort of elderly adults15. However, both of these studies were much smaller and used only baseline intake of SSB with very low intake levels.
Intake of SSBs may contribute to risk of mortality through inducing cardiometabolic and chronic disease risk. In our cohorts, SSB intake has been associated with weight gain 26 and higher risk of hypertension27, diabetes 16, 28, CHD10, 11 and stroke12. This is supported by our observation that estimates for SSB were partly attenuated after adjusting for intermediate chronic conditions. Excess adiposity is an important risk factor for these conditions as well as premature death 29, 30. However, in our analysis adjusting for BMI did not alter the estimates, suggesting that the observed associations may be independent of this factor. Because of the increasing age of participants in our cohorts, it is possible that BMI may not accurately reflect adiposity. We observed stronger associations with total and CVD mortality among women compared to men. Whether there is a biological basis for this difference is not clear but it could be due to metabolic differences between men and women. Consistent with some studies31, 32, we found a modest positive association between SSB intake and cancer mortality. Of note, this outcome included deaths from all cancers. However, our analysis of cause-specific cancer mortality suggests that the association between SSB and total cancer mortality is likely driven by diet-related cancers including breast and to a lesser extent colon. The evidence linking SSB to cancer is mixed and may depend on the etiology of specific cancer types. More research exploring the association between SSB and cancer warrants further study.
Our findings on ASBs and mortality are consistent with our previous studies of diabetes 16 and CHD 10, 11, which found attenuated associations after taking analytic steps to reduce reverse causation and support RCT’s that have found weight control benefits of substituting diet soda for regular soda at moderate intakes of 1–2 per day33, 34. In our analysis, greater intake of ASB was positively associated with BMI and hypertension, suggestive of reverse causation. After adjusting for these and other factors, there was no association between ASB intake and mortality in the HPFS and estimates were attenuated in the NHS and significant only at intakes of 4 or more per day. The borderline inverse association observed with total and CVD mortality at moderate ASB intake levels is likely due to residual confounding by other potentially healthful lifestyle choices and was observed primarily among NHS participants. Given our findings, it would be of interest to explore higher levels of ASB intake on cardiometabolic outcomes in future studies. Of note, the positive association between ASB and mortality was found only among those who were overweight or had high levels of physical activity in stratified analysis, further supporting reverse causation.
Some research has suggested that ASBs may increase body weight and contribute to cardiometabolic risk despite containing few to no calories because of the intense sweetness of artificial sweeteners, which may habituate towards a preference for sweets or stimulate a cephalic inulin response and more recently through alterations in gut microflora linked to insulin resistance 35. However, these mechanisms are not well understood and reverse causation and residual confounding may partly explain the positive associations observed with cardiometabolic outcomes in some cohort studies as well as in our study36. It should also be noted that there are no dietary interventions involving chronic ASB exposure in which ASB induced a body weight increase relative to sugar, water or habitual diet 37. Although we did not observe an association between ASBs and cancer, a previous study in our cohorts found that ASBs were associated with higher risk for non-Hodgkin lymphoma and multiple myeloma in men but not in women, and with leukemia when men and women were combined38. While the potential carcinogenicity of aspartame, the primary artificial sweetener in ASBs is biologically plausible, the findings could also be due to chance.
Strengths of our study include the large sample size, long-term and high rates of follow-up, detailed and repeated measurements of diet and lifestyle and numerous sensitivity analyses that support the robustness of the results. As with any observational study, the possibility of residual confounding cannot be ruled out despite adjusting for numerous diet and lifestyle factors in our analysis. Higher SSB intake could be a marker of a globally unhealthy diet and incomplete adjustment for various factors could lead to an overestimation of the association between SSBs and mortality. When we adjusted for individual foods, and for AHEI as a marker of diet quality in sensitivity analysis, associations were attenuated but remained significant, suggesting some positive confounding in the unadjusted estimates. However, because our results are consistent across cohorts and support a graded association with dose relationship, it is unlikely that residual confounding could explain the findings related to SSBs. For ASBs, however the weaker association and inconsistency between NHS and HPFS, suggest a higher probability of residual confounding. In our study, dietary assessment was conducted using validated FFQ’s. The use of dietary assessment in observational research has been a point of debate due to self-reported intakes and measurement error39. However, assessment of SSB/ASB may be less prone to measurement error since these beverages are relatively easy to measure. Furthermore, our FFQ’s have been validated against diet records and biomarkers with reasonable correlations and the use of repeated measures of diet and lifestyle in our analyses could further reduce random measurement error and represent long-term habits. Our study was conducted among a predominately non-Hispanic white population of health professionals, which minimizes potential confounding by socioeconomic factors but may limit generalizability.
In summary, we found that greater intake of SSBs was associated with a higher risk of mortality and showed a graded association with dose. Intake of ASBs was associated with total and CVD mortality at high intake levels mostly among women and warrants further confirmation. Replacing SSB with ASB was associated with a moderately lower risk of mortality. Our results support recommendations and policies to limit intake of SSBs and to consume ASBs in moderation to improve overall health and longevity.
Supplementary Material
Clinical Perspective.
-
1)What is new:
- The associations between long-term intake of sugar sweetened beverages (SSBs) and artificially sweetened beverages (ASBs), and risk of total and cause-specific mortality have not been well documented.
- In two large US cohorts, intake of SSBs was positively associated with total mortality showing a graded association with dose largely due to CVD mortality, and a modest association was observed for cancer mortality.
- ASB intake was positively associated with total and CVD mortality but not cancer mortality at high intake levels mostly among women and warrants further confirmation.
-
2)What are the clinical implications:
- Our results provide further support for recommendations and policies to limit intake of SSBs and to consume ASBs in moderation to improve overall health and longevity.
- ASBs could be used to replace SSBs among habitual SSB consumers but higher consumption of ASBs should be discouraged.
- Policies and recommendations should continue to call for reductions and limits on SSB intake but should also address alternative beverage options with an emphasis on water.
Acknowledgements:
The authors would like to thank the participants and staff of the Nurses’ Health Study for their valuable contributions as well as the following state cancer registries for their help: AL, AZ, AR, CA, CO, CT, DE, FL, GA, ID, IL, IN, IA, KY, LA, ME, MD, MA, MI, NE, NH, NJ, NY, NC, ND, OH, OK, OR, PA, RI, SC, TN, TX, VA, WA, WY.
Funding Sources: The study was supported by research grants UM1 CA186107, UM1 CA176726, UM1 CA167552, P01 CA87969, P01 CA055075, R01 HL034594, HL088521, HL35464 and HL60712 from the National Institutes of Health.
Footnotes
Conflict of Interest Disclosures: WCW and VSM are on a pro bono retainer for expert support for the Center for Science in the Public Interest in litigation related to sugar sweetened beverages and have served as consultants for the City of San Francisco for a case related to health warning labels on soda. None of the other authors have financial or personal conflicts of interest to disclose that are related to the contents of this paper.
References
- 1.Hu FB and Malik VS. Sugar-sweetened beverages and risk of obesity and type 2 diabetes: epidemiologic evidence. Physiol behav. 2010;100:47–54. [DOI] [PMC free article] [PubMed] [Google Scholar]
- 2.NIH. National Cancer Institute: Division of Cancer control & Population Sceinces. Epidemiology and Genomics Research Program. Sources of Calories from Added Sugars among the US population, 2005–2006. Updated April 20, 2018. http://riskfactor.cancer.gov/diet/foodsources/added_sugars/. Accessed 10/02/13. [Google Scholar]
- 3.Welsh JA, Sharma AJ, Grellinger L and Vos MB. Consumption of added sugars is decreasing in the United States. Am J Clin Nutr. 2011;94:726–734. [DOI] [PMC free article] [PubMed] [Google Scholar]
- 4.Ogden CL, Kit BK, Carroll MD and Park S. Consumption of sugar drinks in the United States, 2005–2008. NCHS data brief. 2011:1–8. [PubMed] [Google Scholar]
- 5.Rosinger A, Herrick K, Gahche J and Park S. Sugar-sweetened Beverage Consumption Among U.S. Adults, 2011–2014. NCHS data brief. 2017:1–8. [PubMed] [Google Scholar]
- 6.U.S. Department of Health and Human Services and U.S. Department of Agriculture. 2015 – 2020 Dietary Guidelines for Americans. 8th Edition. December 2015. Available at http://health.gov/dietaryguidelines/2015/guidelines/. Accessed 2/4/2019. [Google Scholar]
- 7.Malik VS, Willett WC and Hu FB. Global obesity: trends, risk factors and policy implications. Nat Rev Endocrinol. 2013;9:13–27. [DOI] [PubMed] [Google Scholar]
- 8.Malik VS, Pan A, Willett WC and Hu FB. Sugar-sweetened beverages and weight gain in children and adults: a systematic review and meta-analysis. Am J Clin Nutr. 2013;98:1084–1102. [DOI] [PMC free article] [PubMed] [Google Scholar]
- 9.Malik VS, Popkin BM, Bray GA, Despres JP, Willett WC and Hu FB. Sugar-sweetened beverages and risk of metabolic syndrome and type 2 diabetes: a meta-analysis. Diabetes care. 2010;33:2477–2483. [DOI] [PMC free article] [PubMed] [Google Scholar]
- 10.Fung TT, Malik V, Rexrode KM, Manson JE, Willett WC and Hu FB. Sweetened beverage consumption and risk of coronary heart disease in women. Am J Clin Nutr. 2009;89:1037–1042. [DOI] [PMC free article] [PubMed] [Google Scholar]
- 11.de Koning L, Malik VS, Kellogg MD, Rimm EB, Willett WC and Hu FB. Sweetened beverage consumption, incident coronary heart disease, and biomarkers of risk in men. Circulation. 2012;125:1735–1741, S1. [DOI] [PMC free article] [PubMed] [Google Scholar]
- 12.Bernstein AM, de Koning L, Flint AJ, Rexrode KM and Willett WC. Soda consumption and the risk of stroke in men and women. Am J Clin Nutr. 2012;95:1190–1199. [DOI] [PMC free article] [PubMed] [Google Scholar]
- 13.Yang Q, Zhang Z, Gregg EW, Flanders WD, Merritt R and Hu FB. Added Sugar Intake and Cardiovascular Diseases Mortality Among US Adults. JAMA intern med. 2014;174:516–524. [DOI] [PMC free article] [PubMed] [Google Scholar]
- 14.Odegaard AO, Koh WP, Yuan JM and Pereira MA. Beverage habits and mortality in Chinese adults. J Nutr. 2015;145:595–604. [DOI] [PMC free article] [PubMed] [Google Scholar]
- 15.Paganini-Hill A, Kawas CH and Corrada MM. Non-alcoholic beverage and caffeine consumption and mortality: the Leisure World Cohort Study. Prev Med. 2007;44:305–310. [DOI] [PMC free article] [PubMed] [Google Scholar]
- 16.de Koning L, Malik VS, Rimm EB, Willett WC and Hu FB. Sugar-sweetened and artificially sweetened beverage consumption and risk of type 2 diabetes in men. Am J Clin Nutr. 2011;93:1321–1327. [DOI] [PMC free article] [PubMed] [Google Scholar]
- 17.Fakhouri TH, Kit BK and Ogden CL. Consumption of diet drinks in the United States, 20092010. NCHS data brief. 2012:1–8. [PubMed] [Google Scholar]
- 18.Hu FB, Rimm E, Smith-Warner SA, Feskanich D, Stampfer MJ, Ascherio A, Sampson L and Willett WC. Reproducibility and validity of dietary patterns assessed with a food-frequency questionnaire. Am J Clin Nutr. 1999;69:243–249. [DOI] [PubMed] [Google Scholar]
- 19.Salvini S, Hunter DJ, Sampson L, Stampfer MJ, Colditz GA, Rosner B and Willett WC. Food-based validation of a dietary questionnaire: the effects of week-to-week variation in food consumption. Int J Epidemiol. 1989;18:858–867. [DOI] [PubMed] [Google Scholar]
- 20.Yu Z, Ley SH, Sun Q, Hu FB and Malik VS. Cross-sectional association between sugar-sweetened beverage intake and cardiometabolic biomarkers in US women. Br J Nutr. 2018;119:570–580. [DOI] [PMC free article] [PubMed] [Google Scholar]
- 21.Rich-Edwards JW, Corsano KA and Stampfer MJ. Test of the National Death Index and Equifax Nationwide Death Search. Am J Epidemiol. 1994;140:1016–1019. [DOI] [PubMed] [Google Scholar]
- 22.Chiuve SE, Fung TT, Rimm EB, Hu FB, McCullough ML, Wang M, Stampfer MJ and Willett WC. Alternative dietary indices both strongly predict risk of chronic disease. J Nutr. 2012;142:1009–1018. [DOI] [PMC free article] [PubMed] [Google Scholar]
- 23.Bernstein AM, Rosner BA and Willett WC. Cereal fiber and coronary heart disease: a comparison of modeling approaches for repeated dietary measurements, intermediate outcomes, and long follow-up. Eur J Epidemiol. 2011;26:877–86. [DOI] [PubMed] [Google Scholar]
- 24.Yu E, Ley SH, Manson JE, Willett W, Satija A, Hu FB and Stokes A. Weight History and All-Cause and Cause-Specific Mortality in Three Prospective Cohort Studies. Ann Intern Med. 2017;166:613–620. [DOI] [PMC free article] [PubMed] [Google Scholar]
- 25.Hu FB. Resolved: there is sufficient scientific evidence that decreasing sugar-sweetened beverage consumption will reduce the prevalence of obesity and obesity-related diseases. Obes Rev. 2013;14:606–619. [DOI] [PMC free article] [PubMed] [Google Scholar]
- 26.Mozaffarian D, Hao T, Rimm EB, Willett WC and Hu FB. Changes in diet and lifestyle and long-term weight gain in women and men. New Eng J Med. 2011;364:2392–2404. [DOI] [PMC free article] [PubMed] [Google Scholar]
- 27.Winkelmayer WC, Stampfer MJ, Willett WC and Curhan GC. Habitual caffeine intake and the risk of hypertension in women. JAMA. 2005;294:2330–2335. [DOI] [PubMed] [Google Scholar]
- 28.Schulze MB, Manson JE, Ludwig DS, Colditz GA, Stampfer MJ, Willett WC and Hu FB. Sugar-sweetened beverages, weight gain, and incidence of type 2 diabetes in young and middle-aged women. JAMA. 2004;292:927–934. [DOI] [PubMed] [Google Scholar]
- 29.Borrell LN and Samuel L. Body Mass Index Categories and Mortality Risk in US Adults: The Effect of Overweight and Obesity on Advancing Death. Am J Public Health. 2014;104:512–519. [DOI] [PMC free article] [PubMed] [Google Scholar]
- 30.Tobias DK, Pan A, Jackson CL, O’Reilly EJ, Ding EL, Willett WC, Manson JE and Hu FB. Body-mass index and mortality among adults with incident type 2 diabetes. New Eng J Med. 2014;370:233–244. [DOI] [PMC free article] [PubMed] [Google Scholar]
- 31.Zhang X, Albanes D, Beeson WL, van den Brandt PA, Buring JE, Flood A, Freudenheim JL, Giovannucci EL, Goldbohm RA, Jaceldo-Siegl K, Jacobs EJ, Krogh V, Larsson SC, Marshall JR, McCullough ML, Miller AB, Robien K, Rohan TE, Schatzkin A, Sieri S, Spiegelman D, Virtamo J, Wolk A, Willett WC, Zhang SM and Smith-Warner SA. Risk of colon cancer and coffee, tea, and sugar-sweetened soft drink intake: pooled analysis of prospective cohort studies. J Nat Cancer Inst. 2010;102:771–783. [DOI] [PMC free article] [PubMed] [Google Scholar]
- 32.Schernhammer ES, Hu FB, Giovannucci E, Michaud DS, Colditz GA, Stampfer MJ and Fuchs CS. Sugar-sweetened soft drink consumption and risk of pancreatic cancer in two prospective cohorts. Cancer Epidemiol Biomarkers Prev. 2005;14:2098–2105. [DOI] [PubMed] [Google Scholar]
- 33.de Ruyter JC, Olthof MR, Seidell JC and Katan MB. A trial of sugar-free or sugar-sweetened beverages and body weight in children. New Eng J Med. 2012;367:1397–1406. [DOI] [PubMed] [Google Scholar]
- 34.Ebbeling CB, Feldman HA, Chomitz VR, Antonelli TA, Gortmaker SL, Osganian SK and Ludwig DS. A randomized trial of sugar-sweetened beverages and adolescent body weight. New Eng J Med. 2012;367:1407–1416. [DOI] [PMC free article] [PubMed] [Google Scholar]
- 35.Swithers SE. Artificial sweeteners are not the answer to childhood obesity. Appetite. 2015;93:85–90. [DOI] [PubMed] [Google Scholar]
- 36.Malik VS and Hu FB. Fructose and Cardiometabolic Health: What the Evidence From Sugar-Sweetened Beverages Tells Us. J Am Coll Cardiol. 2015;66:1615–1624. [DOI] [PMC free article] [PubMed] [Google Scholar]
- 37.Rogers PJ, Hogenkamp PS, de Graaf C, Higgs S, Lluch A, Ness AR, Penfold C, Perry R, Putz P, Yeomans MR and Mela DJ. Does low-energy sweetener consumption affect energy intake and body weight? A systematic review, including meta-analyses, of the evidence from human and animal studies. Int J Obes (Lond). 2016;40:381–394. [DOI] [PMC free article] [PubMed] [Google Scholar]
- 38.Schernhammer ES, Bertrand KA, Birmann BM, Sampson L, Willett WC and Feskanich D. Consumption of artificial sweetener- and sugar-containing soda and risk of lymphoma and leukemia in men and women. Am J Clin Nutr. 2012;96:1419–1428. [DOI] [PMC free article] [PubMed] [Google Scholar]
- 39.Satija A, Stampfer MJ, Rimm EB, Willett W and Hu FB. Perspective: Are Large, Simple Trials the Solution for Nutrition Research? Adv Nutr. 2018;9:378–387. [DOI] [PMC free article] [PubMed] [Google Scholar]
Associated Data
This section collects any data citations, data availability statements, or supplementary materials included in this article.