Abstract
In this paper, we investigated the feasibility of using surface enhanced Raman spectroscopy (SERS) and multivariate analysis method to discriminate liver cancer and nasopharyngeal cancer from healthy volunteers. SERS measurements were performed on serum protein samples from 104 liver cancer patients, 100 nasopharyngeal cancer patients, and 95 healthy volunteers. Two dimensionality reduction methods, principal component analysis (PCA) and partial least square (PLS) were compared, and the results indicated that the performance of PLS is superior to that of PCA. When the number of components was compressed to 3 by PLS, support vector machine (SVM) with a Gaussian radial basis function (RBF) was employed to classify various cancers simultaneously. Based on the PLS-SVM algorithm, high diagnostic accuracies of 95.09% and 90.67% were achieved from the training set and the unknown testing set, respectively. The results of this exploratory work demonstrate that serum protein SERS technology combined with PLS-SVM diagnostic algorithm has great potential for the noninvasive screening of cancer.
1. Introduction
Cancer has become a major public health problem around the world. Biopsy remains the gold standard method for cancer diagnosis, but it is invasive and impractical for patient with multiple suspicious lesions. Tumor markers screening is useful for the early diagnosis, but the biomarkers test also has some limitations in sensitivity and specificity [1]. In recent years, surface-enhanced Raman scattering (SERS) has been demonstrated to be a non-invasive and label-free technique and has great potential for biomedical applications and clinical diagnosis [2–5]. Blood serum is an ideal material for noninvasive diagnosis. During the monitoring or treatment process, serum samples can be collected conveniently from the patients. In addition, at the early stage of cancer, the biomolecules such as proteins contained in serum will undergo subtle alterations which can be revealed by SERS spectroscopy [6]. Therefore, it is significant to explore serum-based SERS methods for cancer screening.
Recently, Li et al. have screened prostate cancer [7], bladder cancer [8] and esophageal cancer [9] from healthy volunteers using serum-SERS method. Feng et al. have use serum SERS technique to distinguish nasopharyngeal cancer patients from normal volunteers [10]. And we have also developed a membrane electrophoresis based serum SERS method for cancer detection. And the results show that gastric cancer samples [11], nasopharyngeal cancer samples [12] and colorectal cancer samples [13] can be distinguished well from the healthy volunteers, respectively. Moreover, the SERS analysis of serum has also been used for tumor stages detection [6]. The above studies demonstrate that noninvasive serum SERS analysis technique has great potential for cancer screening.
Usually, the differences of SERS spectra between cancer samples and normal samples are tiny, and it is difficult to differentiate them with direct observation. Therefore, the robust and effective spectral data statistical methods are needed to extract effective diagnostic information. Principal component analysis (PCA) is the most common statistical method for simplifying spectral data set and determining the key components that best explain the differences in the spectra [14]. Briefly, the main object of PCA is to reduce the high dimension of spectra into a few principal components (PCs) while retaining the most diagnostically significant information for classification. However, there are usually many PCs after PCA processing (more than 10 components) that make it difficult to understand the key differences between cancer samples and normal samples. Moreover, in PCA, the relationship between input and output variables is not considered [15]. To solve this problem, partial least square (PLS) is employed as a useful method which can detect the input variables that are related to the output variables [16]. It has been demonstrated that PLS analysis would be better than PCA for dimension reduction and spectroscopic diagnostics since it provides group affinity information (class membership) to maximize the variations between groups [17]. In addition, support vector machines (SVM), introduced by Vapnik and Burges [18], has attracted great attention due to the ability of revealing non-linear relationships and producing models that achieve better classification results than traditional methods [19,20]. The combination of PCA (or PLS) and SVM has been successfully applied in the fields of cancer screening, disease prediction, gene selection, etc [7,19–22].
Traditional analysis pays more attention to the classification ability of algorithms. By optimizing the statistical method, high diagnostic sensitivity, specificity and accuracy could be easily obtained in the classification of known samples [10]. However, the diagnostic capabilities of statistical algorithms should be assessed by the prediction accuracy of unknown testing samples. In this study, to evaluate the diagnostic capabilities of our statistical methods, a quarter of the spectra data were divided into unknown testing set. Furthermore, simultaneous screening of various cancers in a single SERS assay is a requirement of clinical application. In order to meet this demand, three groups of serum samples obtained from liver cancer patients, nasopharyngeal carcinoma patients and normal volunteers were introduced.
In this paper, we explored a data analysis method for the simultaneous screening of two different types of cancer. SERS spectra of serum proteins from 104 liver cancer patients (LC), 100 nasopharyngeal cancer patients (NC) and 95 normal volunteers were recorded using our previous method [23]. PLS and PCA were employed to extract the feature of SERS spectra, and SVM was then used to form a diagnostic algorithm and classify various cancers simultaneously. To the best of our knowledge, this is the first report on serum protein-based SERS for simultaneous screening of multi-type cancers. This exploratory work may further promote the serum SERS analysis technique into clinical applications.
2. Material and methods
2.1 Preparation of Ag nanoparticles
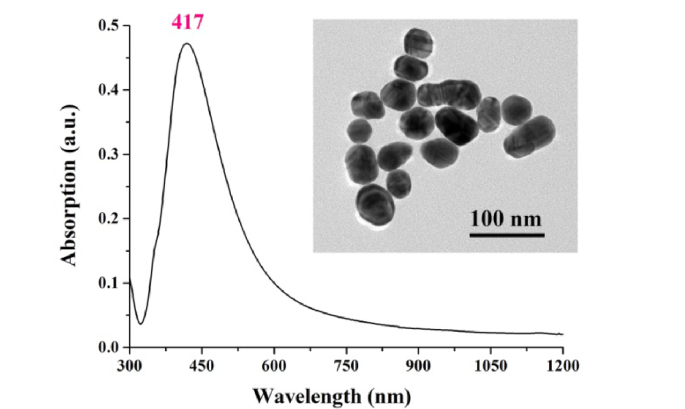
Ag nanoparticles (NPs) were prepared by the aqueous reduction of silver nitrate with hydroxylamine hydrochloride using the method developed by Leopold and Lendl [24]. Briefly, 4.5 mL sodium hydroxide (10−1 mol/L) was added to 5 mL hydroxylamine hydrochloride (6 × 10⁻² mol/L) and then the mixtures were added to 90 mL silver nitrate (1.11 × 10⁻³ mol/L). The mixture was kept stirring until a homogenous solution with a milky gray color was obtained. Figure 1 shows the transmission electron microscope (TEM) image and the UV-Vis-NIR absorption spectrum of the Ag NPs. The average size of the Ag NPs is 45 ± 6 nm. The absorption maximum was located at 417 nm.
Fig. 1.
The UV-Vis-NIR absorption spectrum of Ag NPs. The inserted picture is the TEM micrograph of Ag NPs.
2.2. Preparation of human serum samples
Ethical approval was obtained in order to study the human blood samples. Three groups of blood samples were provided by the Fujian Provincial Cancer Hospital, including 95 blood samples from healthy volunteers as the control group, 104 blood samples from LC patients and 100 blood samples from NC patients. Table 1 lists the detailed clinical diagnostic information of these patients (e.g. age, gender, and histopathological stage). After 12 hours of overnight fasting, 3 mL blood samples were collected from the subjects between 7:00-8:00 A.M.. Blood samples were stood at room temperature (27°C) for 30 min until the blood clotted. Supernatant (including some blood cells and serum) was then centrifuged (1000 rpm, 10 min) to separate blood cells from the serum. And then the serum samples were obtained.
Table 1. Clinical information of liver cancer and nasopharyngeal cancer patients.
| Liver cancer (n = 104) | Nasopharyngeal cancer (n = 100) | |
|---|---|---|
| Age | ||
| Mean | 49.7 | 54.1 |
| Median |
48.9 | 52.5 |
| Gender | ||
| Male | 95 | 71 |
| Female |
9 | 29 |
| Cancer stage | ||
| T1-T2 | 30 | 37 |
| T3-T4 | 34 | 52 |
| Undefined | 40 | 11 |
2.3 Experiment and SERS measurements
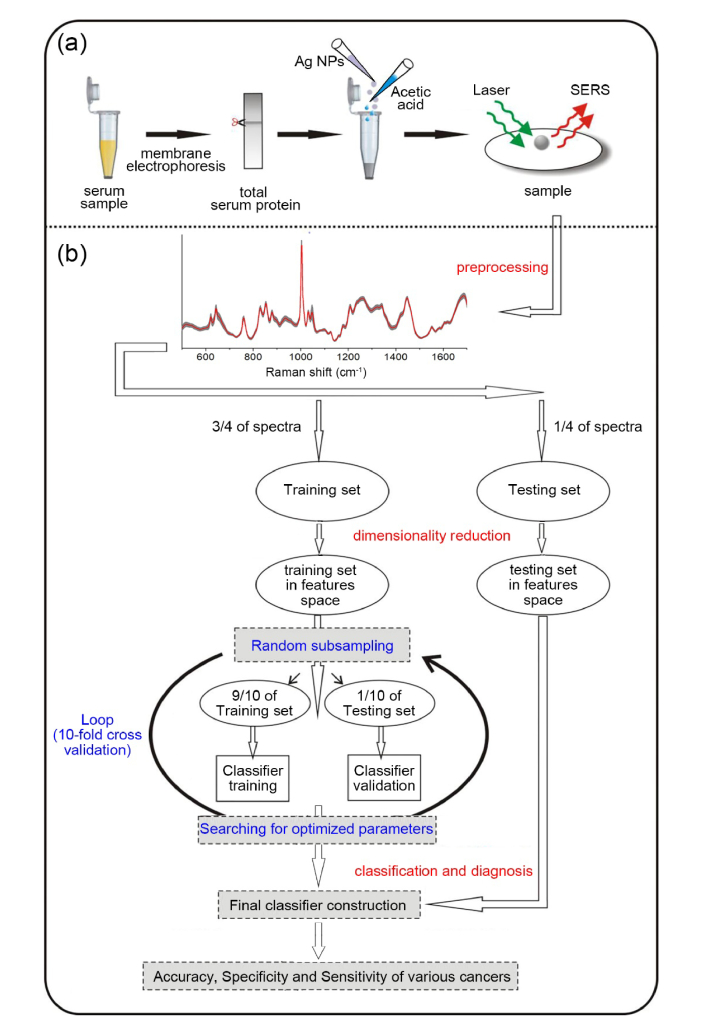
Figure 2(a) shows the schematic of membrane electrophoresis and SERS measurement. Briefly, 2.5 μL serum sample was blotted onto the cellulose acetate (CA) membrane for electrophoresis. After electrophoresis, the CA membrane was equally divided into two parts along a vertical line. Half of the CA membrane was stained to label the location of proteins for reference. And the serum proteins in the remaining half membrane were cut down according to the labeled position. The isolated band of protein was collected in a test tube. Acetic acid was added to dissolve the membrane and Ag NPs were subsequently added and mixed to enhance the Raman signal of proteins. The mixture was incubated at 37°C and kept stirred for 5 min. Then SERS measurements were performed, and the raw spectra were obtained. The pH value of the final protein-Ag NPs mixture was 2.9. The average concentration of proteins in the final solution was 368 ± 45 μg/mL (measured by the Bradford Protein Assay Kit (Order no. C503021, Sangon Biotech, Shanghai, China)). More details about the process of membrane electrophoresis can be seen in our previous study [23].
Fig. 2.
(a) Sample preparation and SERS measurement. (b) Schematic overview of the procedure for spectra classification and diagnosis.
The SERS spectra were acquired in the range of 500-1700 cm−1 with a 10 s integration time using a Renishaw confocal Raman micro-spectrometer (inVia System). A 785 nm diode laser was focused through a Leica 50 × objective (NA: 0.75) to excite the samples. The incident laser power was about 0.1 mW. The WIRE 3.4 software package (Renishaw) was employed for the spectral acquisition.
2.4 Data analysis
The schematic diagram of data analysis is shown in Fig. 2(b). The analysis of SERS spectra was performed in three steps: (1) data preprocessing; (2) dimensionality reduction; (3) classification and prediction. The raw spectra represented a composition of SERS signal and autofluorescence background signal. The autofluorescence background were removed from the raw spectra by an automated algorithm [25]. All background-removed SERS spectra were further normalized to the integrated area under the curve. This normalizing method enabled a better comparison of the spectral characteristics among the three groups [26]. The entire data set of the serum proteins SERS spectra was divided into two parts: the training set and the testing set. The training set was composed of 224 randomized spectra (NLiver = 78, NNasopharyngeal = 75, and NNormal = 71) and the testing set was composed of the remaining 75 spectra (NLiver = 26, NNasopharyngeal = 25, and NNormal = 24).
PLS was first performed to reduce the spectral dimension by extracting a set of components (latent variables). And then, SVM algorithm was used on these components for distinguishing various cancer samples from normal samples. To assess the performance of PLS-SVM approach, the traditional multivariate statistic analysis method of principal component analysis-linear discriminant analysis (PCA-LDA) was also applied to classify the same SERS data set.
2.4.1 Partial least squares
PLS can be used as a dimension reduction technique similar to PCA [27]. In this study, XN × M (N is the number of samples in the training set and M is the number of wavenumbers) is the input variables matrix and YN × 1 (grouping variable) is the output variables matrix. PLS algorithm establishes the relationship of X and Y by score vectors. For a single response variable (grouping information), the PLS model is described as
| (1) |
where SN × A and UN × A are the PLS score matrices (A is the number of PLS components); PM × A is the loading matrix of XN × M; EN × M is the residual matrix of XN × M; q is the loading matrix of y; and FN × 1 is the residuals vector of y. In this study, the PLS score matrices and loading matrices were calculated using the SIMPLS [28]. The mean squared error of prediction (MSEP) estimated by 10-fold cross-validation was used to determine the number of PLS components [29,30].
2.4.2 Support vector machine
Support vector machine (SVM), based on the foundations of Statistical Learning Theory [18], is a powerful supervised learning algorithm for classifying complex groups. As a classifier, SVM is considered to be superior over traditional linear approaches due to its capability of processing classification problem with nonlinear boundary by mapping sample data set into a higher dimensional space [31].
To obtain a SVM classifier with good classification ability, choice of an appropriate kernel function which projects data to the feature space is critical [22]. The most frequently used kernel function is the Gaussian radial basis function (RBF):
| (2) |
where xi and xj are the two generic sample data vectors; and σ is the Gaussian radial width that should be optimized. In addition, once the spectra are mapped to the feature space, there are countless separating hyperplanes, leading to the risk of over-fitting [19]. To avoid this problem, a penalty factor C is introduced to allow some training data to be misclassified. In this study, the penalty factor C and the parameter were optimized by grid search [22]. In addition, the SVM diagnostic algorithm was evaluated by the 10-flod cross validation. All SVM analyses were performed in MATLAB using the LIBSVM toolbox 3.23 developed by Chang and Lin [32].
2.4.3 Testing
To assess the diagnostic capabilities of the PLS-SVM model, a set of testing data was performed. Firstly, the testing spectra data TB × M (B is the number of samples in the testing set and M is the number of wavenumbers) was mapped to the feature space using the same linear transformation method as the training set:
| (3) |
where PM × A is the PLS loadings calculated from training set and SB × A is PLS scores of the testing set. The SB × A was then used as an input for the SVM model, and the diagnostic results were obtained. At the same time, the accuracy, sensitivity and specificity of the diagnosis were also calculated.
3. Results
3.1 Membrane electrophoresis SERS
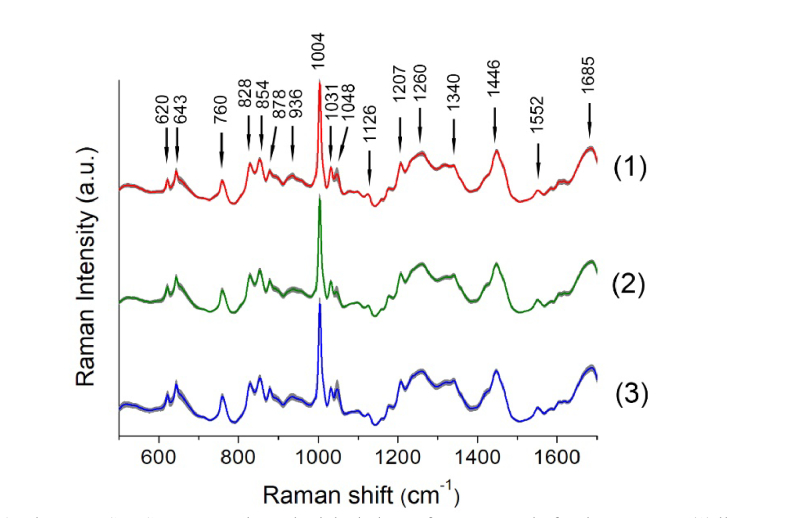
The membrane electrophoresis method was used to extract serum proteins from serum samples for cancer screening. The mean SERS spectra and standard deviations (overlying as shaded color fill) of serum proteins for each group are shown in Fig. 3. Table 2 lists tentative assignments for the SERS peaks, according to some literatures [11,12,23,33,34].
Fig. 3.
The mean SERS spectra and standard deviations of serum protein for three groups: (1) liver cancer patients (n = 104), (2) nasopharyngeal cancer patients (n = 100) and (3) healthy volunteers (n = 95).
Table 2. The Raman peak potions and tentative assignments of major vibration bands.
| Peak positions (cm−1) | Tentative assignments |
|---|---|
| 620 | Phenylalanine: C-C twisting mode |
| 643 | Tyrosine: C-C twisting mode |
| 760 | Tryptophan: ring breathing |
| 828 | Tyrosine: ring breathing; |
| 854 | Tyrosine: ring breathing |
| 878 | Hydroxyproline; Tryptophan |
| 936 | proline/valine/protein backbone (α-helix conformation): C-C stretching mode |
| 1004 | Phenylalanine: ring breathing |
| 1031 | Phenylalanine: C-H in-plane bending mode |
| 1048 | Protein: C-N / C-O stretching mode |
| 1126 | Protein: C-N stretching vibration |
| 1207 | Hydroxyproline; Tyrosine |
| 1260 | Amide III |
| 1340 | Tryptophan: CH2/CH3 wagging, twisting and/or bending mode |
| 1446 | Proteins: CH2 bending mode |
| 1552 | Tryptophan: C = C stretching mode |
| 1685 | Amide I |
All three groups have similar SERS spectral profiles, such as Raman peak positions and bandwidths. Primary Raman peaks at 620, 643, 760, 828, 854, 1004, 1207, 1260, 1446 and 1685 cm−1 can all be observed in both cancer and normal groups. However, there are still some nuances between different groups, which provides the possibility of constructing diagnostic models for cancer detection and screening.
3.2 Dimensionality reduction of SERS spectra
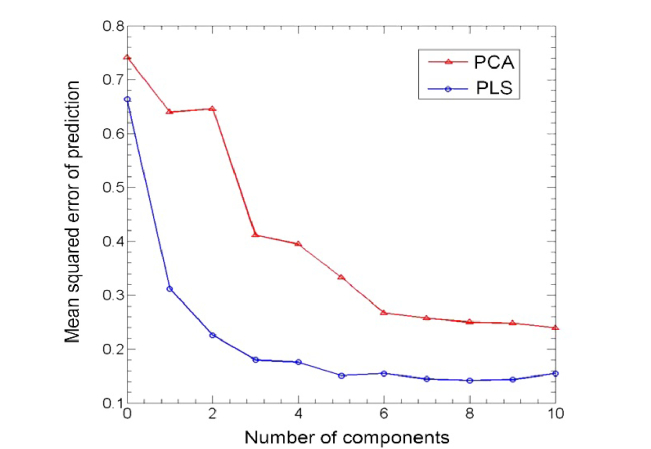
For comparably assessing the performance of PLS in the dimensionality reduction of SERS spectra, the standard multivariate analysis method of PCA was also applied in the same spectra data set. Simply using a large number of components will lead to over-fitting in the diagnostic model. The mean squared error of prediction (MSEP) estimated by 10-fold cross-validation is a more statistically sound method for choosing the number of components in either PCA or PLS [29].
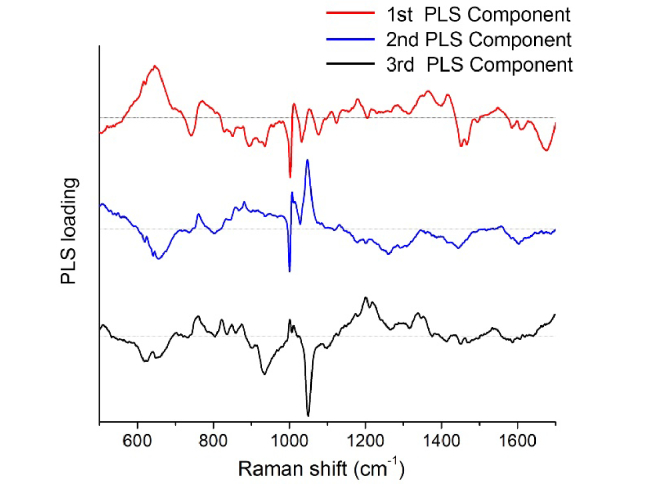
In this study, dimensionality reduction of SERS spectra is the main objective of PLS and PCA. Therefore, the adjusted Wold’s R criteria is an appropriate choice for determining the number of components [29] and this criteria states that an additional component will not be included in the model unless it provides significantly better predictions. As shown in Fig. 4, the MSEP curve of PLS shows two different phases of behavior. In the first phase, the MSEP decreases rapidly, whilst in the second phase the rate of decrease becomes quite slow. According to (N is the number of components), the 4th component should be excluded from the model. Therefore the cut-off point of the MSEP curve of PLS is located at the third PLS component. In addition, the MSEP curve of PCA also shows two different phases of behavior. According to , the 7th component should be excluded from the model and the cut-off point of PCA is located at the 6th PCA component. The cut-off point selection method is consistent with previous studies [29,35]. Figure 5 shows the PLS loadings of the first three PLS components.
Fig. 4.
The relationship between the number of components and the mean squared error of prediction (MSEP).
Fig. 5.
PLS loadings of the first three PLS components.
3.3 Model training and testing
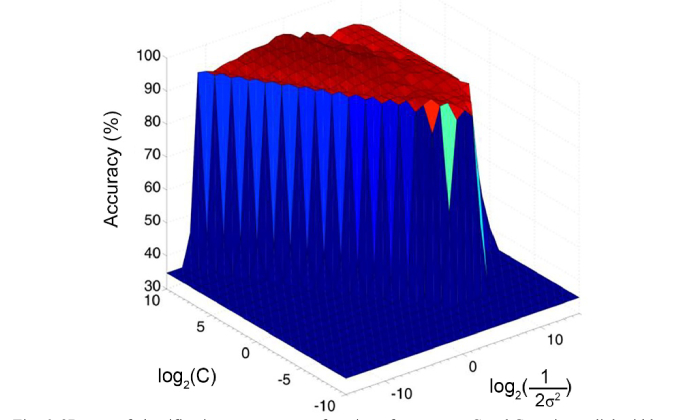
In this study, the RBF kernel SVM algorithm was used to classify serum protein SERS spectra in the feature space. In order to find the best classifier, the penalty factor C and the Gaussian radial width σ were optimized by the grid search method [19,22]. The grid search method was performed to exhaustively search optimal parameters by trying various pairs of parameters. The search range for penalty factor C was implemented from 2−10 to 210 with step of power of two. And the search range of parameter was from 2−15 to 215 with step of power of two.
Figure 6 is the 3D map of diagnostic accuracy as a function of penalty factor C and parameter . This figure clearly shows that the diagnostic accuracy changes with the penalty factor C and Gaussian radial width σ. When and , the maximum diagnostic accuracy of 95.08% is achieved.
Fig. 6.
3D map of classification accuracy as a function of parameter C and Gaussian radial width σ.
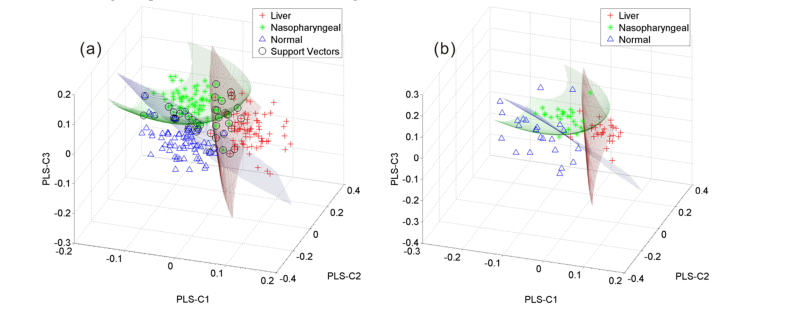
Based on the optimal parameters of C = 512 and , the classification of serum protein SERS spectra from LC, NC and normal groups in the training set could achieve a diagnostic accuracy of 95.09%. Figure 7(a) shows the classification results of the RBF kernel SVM model in the feature space. Circles represent the support vectors. And the serum protein samples from LC, NC and normal groups are marked as cross, asterisk, and triangle, respectively. A light red separating hyperplane is created in the feature space to distinguish LC samples from other samples. Similarly, a light green hyperplane and a light blue hyperplane corresponding to the NC samples and the normal samples, respectively, are also created. Figure 7(b) shows the results of classifying SERS spectra in the testing set using the diagnostic model as shown in Fig. 7(a).
Fig. 7.
(a) SVM classification results for the three groups of samples (cross: liver cancer; asterisk: nasopharyngeal cancer; triangle: normal subjects; circle: support vectors). (b) Prediction results of the testing set.
In order to evaluate the performance of the PLS-SVM method, the PCA-LDA and PCA-SVM algorithms were also performed. The classification and prediction results of PLS-SVM, PCA-LDA and PCA-SVM methods were summarized in Table 3. With the combination of LDA, the first 24 principal components accounted for 95.1% of the total variance were used to classify the SERS spectra in the training set, and the classification accuracy of 98.21% was obtained with the 10-fold cross-validation. However, the prediction accuracy of the SERS spectra in the unknown testing set using the PCA-LDA algorithm is only 85.33%, which is lower than that of PLS-SVM algorithm. This result demonstrates that including too many components in the diagnostic model may lead to over-fitting. Compared with this, PCA-SVM with 6 components performs worse. The classification accuracies of the training set and the testing set are 91.96% and 80%, respectively. With a minimum number of components (A = 3), the PLS-SVM algorithm performs well not only in the classification of the training set but also in the prediction of the testing set. As shown in Table 3, high diagnostic sensitivities of 92.31% and 96%, and specificities of 100% and 88%, respectively, were achieved for screening LC and NC simultaneously. These results indicate that SERS combined with PLS-SVM has great potential for cancer screening.
Table 3. Results of classification of SERS spectra.
| Methods | Number of components | Training accuracy | Testing accuracy | Sensitivity of LC | Specificity of LC | Sensitivity of NC | Specificity of NC |
|---|---|---|---|---|---|---|---|
| PCA-LDA | 24 | 98.21% (220/224) |
85.33% (64/75) |
92.31% (24/26) |
97.96% (48/49) |
96.00% (24/25) |
86.00% (43/50) |
| PCA-SVM | 6 | 91.96% (206/224) |
80.00% (60/75) |
92.31% (24/26) |
95.92% (47/49) |
80.00% (20/25) |
86.00% (43/50) |
| PLS-SVM | 3 | 95.09% (213/224) | 90.67% (68/75) | 92.31% (24/26) | 100.00% (49/49) | 96.00% (24/25) | 88.00% (44/50) |
Moreover, analysis of different tumor (T) stages and early detection coupled with timely and standard treatment (e.g. chemotherapy and/or radiotherapy) is critical to improving patients’ survival. Three groups of SERS spectra from the T1-T2 stage LC (or NC) group, T3-T4 stage LC (or NC) group, and the normal group were fed into the PLS-SVM model for analysis (using 10-fold cross-validation), and Table 4 summarizes the diagnostic results. For LC samples, the accuracy of the classification is 91.82%; the sensitivities of the two different cancer stage groups (T1-T2 stage and T3-T4 stage) are 83.33% and 94.12%, respectively; and the specificity is 93.68%. For NC samples, the accuracy of the classification is 90.22%; the sensitivities of T1-T2 stage group and T3-T4 stage group are 83.78% and 92.31%, respectively; and the specificity is 91.58%. Compared with the sensitivity of early stage (T1-T2) samples, a higher diagnostic sensitivity for advanced T stage (T3-T4) samples is obtained. This result is consistent with previous study of blood plasma SERS [6]. For advanced T stage of cancer (T3-T4), the abnormal metabolism is more serious than that of early stage (T1-T2). Besides, compared with the normal, advanced T stage cancer is probably with distant metastasis, thus resulting in complex changes in serum proteins.
Table 4. Classification results of the PLS-SVM method using 10-fold cross-validation.
| Diagnostic combinations | Sensitivity |
Specificity | Accuracy | |
|---|---|---|---|---|
| T1-T2 | T3-T4 | |||
| Liver cancer T1-T2 (N = 30) vs. T3-T4 (N = 34) vs. Noamal (N = 95) |
83.33% (25/30) |
94.12% (32/34) |
93.68% (89/95) |
91.82% (146/159) |
| Nasopharyngeal cancer T1-T2 (N = 37) vs. T3-T4 (N = 52) vs. Noamal (N = 95) |
83.78% (31/37) |
92.31% (48/52) |
91.58% (87/95) |
90.22% (166/184) |
4. Discussion
The main object of this paper is to develop a robust SERS spectra analysis method for the simultaneous screening of two or more different types of cancer. For this, the membrane electrophoresis method was used for the purification of serum proteins from two types of cancer subjects (liver cancer and nasopharyngeal cancer) and normal subjects. The serum proteins were then mixed with Ag NPs for SERS measurement and the PLS-SVM algorithm was employed to build the diagnostic model for SERS spectra classification and prediction. Traditional analysis of serum protein SERS is more concerned about the classification effects between cancer subjects and normal subjects. This study pays more attention to the diagnostic ability of the PLS-SVM model in the unknown testing set. Moreover, in previous studies, each type of cancer was discriminated from normal respectively (eg, liver cancer vs. noamal; colorectal cancer vs. noamal; gastric cancer vs. noamal) [11,23]. However, simultaneous detection of various cancers in a single test is a practical requirement for clinical application. In this study, three groups of serum SERS spectra belonging to LC, NC, and normal were simultaneously introduced into the PLS-SVM model as input data for analysis. And the results demonstrated that the membrane electrophoresis based SERS technique in conjunction with PLS-SVM diagnostic algorithm has great potential for simultaneous screening of different types of cancer, which is more convenient for clinical analysis and applications.
PLS and PCA methods were used for dimensionality reduction of SERS spectral data. Both of these methods map the SERS spectra to the feature space and extract a few components as a combination of the original spectra data, but they yield the components in different ways. PCA extracts a set of orthogonal principal components in the multidimensional SERS spectra data set that best explains the significant differences in the spectra. In PCA, the relationship between input and output variables is not considered, and all input variables are given the same weight in the process of normalization (the input spectra data set is often scaled to zero mean and unit variance) [36]. Compared with this, PLS pays more attention to the relationship between input and output variables and performs better in finding the input variables that have the closest relationship with the output variables. PLS can yield the PLS components (latent variables) to obtain the maximum group separation. Therefore, the PLS components could explain the diagnostic relevant variations rather than the significant differences in the spectra. Kettaneh et al. have demonstrated in simulations that PLS can achieve its minimum mean square error with fewer components than the PCA approach [37], and our findings (as shown in Fig. 4) are consistent with this report. Moreover, in Fig. 4, the second component in PCA increases the prediction error of the model, indicating that the combination of predictor variables contained in this component is not strongly correlated with respond variables. That's because PCA constructs components to explain variation in process variables, not respond variables [16].
Furthermore, as summarized in Table 3, the diagnostic performance of PLS-SVM is superior to that of PCA-LDA algorithm. There maybe two reasons: on one hand, the PCA technique missed some important diagnostic information during the process of data analysis such as the relationship between input and output variables; on the other hand, between cancer and normal serum SERS spectra, there is nonlinear boundary that could not be easily classified by linear algorithms such as LDA [7]. In addition, the analysis results show that the diagnostic accuracy of the traditional method (PCA-LDA and PCA-SVM) in the unknown testing set is between 80% and 85%, while the diagnostic accuracy of PLS-SVM is 90.67%. This result indicates that the PLS-SVM method has great potential for the diagnostic screening of new testing subjects.
5. Conclusion
In this study, the serum membrane electrophoresis based SERS technology combined with PLS-SVM was successfully implemented for the classification and prediction of subjects from normal volunteers, LC patients and NC patients. The RBF kernel SVM diagnostic model based on the PLS components classified the SERS spectra of normal and two types of cancer simultaneously with high accuracy (95.09%). In addition, a diagnostic accuracy of 90.67% was also achieved by PLS-SVM in the unknown testing set. PCA-LDA and PCA-SVM algorithms were also applied to classify the same data set for assessing the performance of PLS-SVM, and the results demonstrated that the diagnostic performance of PLS-SVM is superior to that of PCA-LDA and PCA-SVM algorithms. This exploratory study demonstrates that the membrane electrophoresis based SERS combined with PLS-SVM has great potential for non-invasive screening of cancer.
In future, we will collect more samples with different cancer stages to verify the reliability of this method and develop more powerful algorithms to improve this SERS analysis method for accurate cancer diagnosis.
Funding
National Key Basic Research Program of China (No. 2015CB352006), National Natural Science Foundation of China (Nos. 61775037, 61475036), Program for Changjiang Scholars and Innovative Research Team in University (No. IRT_15R10), Strait United Funding Project (No. U1605253), Natural Science Foundation of Fujian Province of China (No. 2017J01844), the High level joint research and construction Program of Fujian Provincial Hospital, and Special Funds of the Central Government Guiding Local Science and Technology Development (2017L3009).
Disclosures
The authors declare that there are no conflicts of interest related to this article.
References
- 1.Siegel R., Ma J., Zou Z., Jemal A., “Cancer statistics, 2014,” CA Cancer J. Clin. 64(1), 9–29 (2014). 10.3322/caac.21208 [DOI] [PubMed] [Google Scholar]
- 2.Vo-Dinh T., Wang H. N., Scaffidi J., “Plasmonic nanoprobes for SERS biosensing and bioimaging,” J. Biophotonics 3(1-2), 89–102 (2010). 10.1002/jbio.200910015 [DOI] [PMC free article] [PubMed] [Google Scholar]
- 3.Kamil Reza K., Wang J., Vaidyanathan R., Dey S., Wang Y., Trau M., “Electrohydrodynamic-induced SERS immunoassay for extensive multiplexed biomarker sensing,” Small 13(9), 1602902 (2017). 10.1002/smll.201602902 [DOI] [PubMed] [Google Scholar]
- 4.Köker T., Tang N., Tian C., Zhang W., Wang X., Martel R., Pinaud F., “Cellular imaging by targeted assembly of hot-spot SERS and photoacoustic nanoprobes using split-fluorescent protein scaffolds,” Nat. Commun. 9(1), 607 (2018). 10.1038/s41467-018-03046-w [DOI] [PMC free article] [PubMed] [Google Scholar]
- 5.Yu Y., Wang J., Lin J., Lin D., Chen W., Feng S., Huang Z., Li Y., Huang H., Shi H., Chen R., “An optimized electroporation method for delivering nanoparticles into living cells for surface-enhanced Raman scattering imaging,” Appl. Phys. Lett. 108(15), 153701 (2016). 10.1063/1.4947009 [DOI] [Google Scholar]
- 6.Lin D., Pan J., Huang H., Chen G., Qiu S., Shi H., Chen W., Yu Y., Feng S., Chen R., “Label-free blood plasma test based on surface-enhanced Raman scattering for tumor stages detection in nasopharyngeal cancer,” Sci. Rep. 4(4), 4751 (2014). [DOI] [PMC free article] [PubMed] [Google Scholar]
- 7.Li S., Zhang Y., Xu J., Li L., Zeng Q., Lin L., Guo Z., Liu Z., Xiong H., Liu S., “Noninvasive prostate cancer screening based on serum surface-enhanced Raman spectroscopy and support vector machine,” Appl. Phys. Lett. 105(9), 091104 (2014). 10.1063/1.4892667 [DOI] [Google Scholar]
- 8.Li S., Li L., Zeng Q., Zhang Y., Guo Z., Liu Z., Jin M., Su C., Lin L., Xu J., Liu S., “Characterization and noninvasive diagnosis of bladder cancer with serum surface enhanced Raman spectroscopy and genetic algorithms,” Sci. Rep. 5(1), 9582 (2015). 10.1038/srep09582 [DOI] [PMC free article] [PubMed] [Google Scholar]
- 9.Li S. X., Zeng Q. Y., Li L. F., Zhang Y. J., Wan M. M., Liu Z. M., Xiong H. L., Guo Z. Y., Liu S. H., “Study of support vector machine and serum surface-enhanced Raman spectroscopy for noninvasive esophageal cancer detection,” J. Biomed. Opt. 18(2), 027008 (2013). 10.1117/1.JBO.18.2.027008 [DOI] [PubMed] [Google Scholar]
- 10.Feng S., Chen R., Lin J., Pan J., Chen G., Li Y., Cheng M., Huang Z., Chen J., Zeng H., “Nasopharyngeal cancer detection based on blood plasma surface-enhanced Raman spectroscopy and multivariate analysis,” Biosens. Bioelectron. 25(11), 2414–2419 (2010). 10.1016/j.bios.2010.03.033 [DOI] [PubMed] [Google Scholar]
- 11.Lin J., Chen R., Feng S., Pan J., Li Y., Chen G., Cheng M., Huang Z., Yu Y., Zeng H., “A novel blood plasma analysis technique combining membrane electrophoresis with silver nanoparticle-based SERS spectroscopy for potential applications in noninvasive cancer detection,” Nanomedicine (Lond.) 7(5), 655–663 (2011). 10.1016/j.nano.2011.01.012 [DOI] [PubMed] [Google Scholar]
- 12.Lin J., Chen R., Feng S., Pan J., Li B., Chen G., Lin S., Li C., Sun L., Huang Z., Zeng H., “Surface‐enhanced Raman scattering spectroscopy for potential noninvasive nasopharyngeal cancer detection,” J. Raman Spectrosc. 43(4), 497–502 (2012). 10.1002/jrs.3072 [DOI] [Google Scholar]
- 13.Wang J., Lin D., Lin J., Yu Y., Huang Z., Chen Y., Lin J., Feng S., Li B., Liu N., Chen R., “Label-free detection of serum proteins using surface-enhanced Raman spectroscopy for colorectal cancer screening,” J. Biomed. Opt. 19(8), 087003 (2014). 10.1117/1.JBO.19.8.087003 [DOI] [PubMed] [Google Scholar]
- 14.Abdi H., Williams L. J., “Principal component analysis,” Wiley Interdiscip. Rev. Comput. Stat. 2(4), 433–459 (2010). 10.1002/wics.101 [DOI] [Google Scholar]
- 15.Duraipandian S., Zheng W., Ng J., Low J. J., Ilancheran A., Huang Z., “Simultaneous fingerprint and high-wavenumber confocal Raman spectroscopy enhances early detection of cervical precancer in vivo,” Anal. Chem. 84(14), 5913–5919 (2012). 10.1021/ac300394f [DOI] [PubMed] [Google Scholar]
- 16.Wang M., Yan G., Fei Z., “Kernel PLS based prediction model construction and simulation on theoretical cases,” Neurocomputing 165, 389–394 (2015). 10.1016/j.neucom.2015.03.028 [DOI] [Google Scholar]
- 17.Hoffmann H., Schaal S., Vijayakumar S., “Local dimensionality reduction for non-parametric regression,” Neural Process. Lett. 29(2), 109–131 (2009). 10.1007/s11063-009-9098-0 [DOI] [Google Scholar]
- 18.Vapnik V., The nature of statistical learning theory (Springer-Verlag, New York, 1995). [Google Scholar]
- 19.Li X., Yang T., Li S., Jin L., Wang D., Guan D., Ding J., “Noninvasive liver diseases detection based on serum surface enhanced Raman spectroscopy and statistical analysis,” Opt. Express 23(14), 18361–18372 (2015). 10.1364/OE.23.018361 [DOI] [PubMed] [Google Scholar]
- 20.Li X., Yang T., Li S., Yao J., Song Y., Wang D., Ding J., “Study on spectral parameters and the support vector machine in surface enhanced Raman spectroscopy of serum for the detection of colon cancer,” Laser Phys. Lett. 12(11), 115603 (2015). 10.1088/1612-2011/12/11/115603 [DOI] [Google Scholar]
- 21.Bertini I., Cacciatore S., Jensen B. V., Schou J. V., Johansen J. S., Kruhøffer M., Luchinat C., Nielsen D. L., Turano P., “Metabolomic NMR fingerprinting to identify and predict survival of patients with metastatic colorectal cancer,” Cancer Res. 72(1), 356–364 (2012). 10.1158/0008-5472.CAN-11-1543 [DOI] [PubMed] [Google Scholar]
- 22.Li X., Yang T., Li S., Wang D., Song Y., Yu K., “Different classification algorithms and serum surface enhanced Raman spectroscopy for noninvasive discrimination of gastric diseases,” J. Raman Spectrosc. 47(8), 917–925 (2016). 10.1002/jrs.4924 [DOI] [Google Scholar]
- 23.Lin J., Wang J., Xu C., Zeng Y., Chen Y., Li L., Huang Z., Li B., Chen R., “Differentiation of digestive system cancers by using serum protein based surface-enhanced Raman spectroscopy,” J. Raman Spectrosc. 48(1), 16–21 (2017). 10.1002/jrs.4982 [DOI] [Google Scholar]
- 24.Leopold N., Lendl B., “A new method for fast preparation of highly surface-enhanced Raman scattering (SERS) active silver colloids at room temperature by reduction of silver nitrate with hydroxylamine hydrochloride,” J. Phys. Chem. B 107(24), 5723–5727 (2003). 10.1021/jp027460u [DOI] [Google Scholar]
- 25.Zhao J., Lui H., McLean D. I., Zeng H., “Automated autofluorescence background subtraction algorithm for biomedical Raman spectroscopy,” Appl. Spectrosc. 61(11), 1225–1232 (2007). 10.1366/000370207782597003 [DOI] [PubMed] [Google Scholar]
- 26.Yu Y., Lin J., Lin D., Feng S., Chen W., Huang Z., Huang H., Chen R., “Leukemia cells detection based on electroporation assisted surface-enhanced Raman scattering,” Biomed. Opt. Express 8(9), 4108–4121 (2017). 10.1364/BOE.8.004108 [DOI] [PMC free article] [PubMed] [Google Scholar]
- 27.Khedher L., Ramírez J., Górriz J. M., Brahim A., Segovia F., “Early diagnosis of Alzheimer׳ s disease based on partial least squares, principal component analysis and support vector machine using segmented MRI images,” Neurocomputing 151, 139–150 (2015). 10.1016/j.neucom.2014.09.072 [DOI] [Google Scholar]
- 28.Rosipal R., Krämer N., “Overview and recent advances in partial least squares,” in International Statistical and Optimization Perspectives Workshop” Subspace, Latent Structure and Feature Selection ”, (Springer, 2005), 34–51. [Google Scholar]
- 29.Li B., Morris J., Martin E. B., “Model selection for partial least squares regression,” Chemom. Intell. Lab. Syst. 64(1), 79–89 (2002). 10.1016/S0169-7439(02)00051-5 [DOI] [Google Scholar]
- 30.Mevik B. H., Cederkvist H. R., “Mean squared error of prediction (MSEP) estimates for principal component regression (PCR) and partial least squares regression (PLSR),” J. Chemometr. 18(9), 422–429 (2004). 10.1002/cem.887 [DOI] [Google Scholar]
- 31.Chorowski J., Wang J., Zurada J. M., “Review and performance comparison of SVM-and ELM-based classifiers,” Neurocomputing 128, 507–516 (2014). 10.1016/j.neucom.2013.08.009 [DOI] [Google Scholar]
- 32.Chang C., Lin C., “LIBSVM: a library for support vector machines,” ACM Trans. Intell. Syst. Technol. 2(3), 27 (2011). 10.1145/1961189.1961199 [DOI] [Google Scholar]
- 33.Lin D., Feng S., Pan J., Chen Y., Lin J., Chen G., Xie S., Zeng H., Chen R., “Colorectal cancer detection by gold nanoparticle based surface-enhanced Raman spectroscopy of blood serum and statistical analysis,” Opt. Express 19(14), 13565–13577 (2011). 10.1364/OE.19.013565 [DOI] [PubMed] [Google Scholar]
- 34.Movasaghi Z., Rehman S., Rehman I., “Raman spectroscopy of biological tissues,” Appl. Spectrosc. Rev. 42(5), 493–541 (2007). 10.1080/05704920701551530 [DOI] [Google Scholar]
- 35.Abdi H., “Partial least squares regression and projection on latent structure regression (PLS Regression),” Wiley Interdiscip. Rev. Comput. Stat. 2(1), 97–106 (2010). 10.1002/wics.51 [DOI] [Google Scholar]
- 36.Feng S., Huang S., Lin D., Chen G., Xu Y., Li Y., Huang Z., Pan J., Chen R., Zeng H., “Surface-enhanced Raman spectroscopy of saliva proteins for the noninvasive differentiation of benign and malignant breast tumors,” Int. J. Nanomedicine 10, 537–547 (2015). 10.2147/IJN.S71811 [DOI] [PMC free article] [PubMed] [Google Scholar]
- 37.Kettaneh N., Berglund A., Wold S., “PCA and PLS with very large data sets,” Comput. Stat. Data Anal. 48(1), 69–85 (2005). 10.1016/j.csda.2003.11.027 [DOI] [Google Scholar]


