

Abstract
Background
Women with a diagnosis of breast cancer may experience short‐ and long‐term disease and treatment‐related adverse physiological and psychosocial outcomes. These outcomes can negatively impact prognosis, health‐related quality of life (HRQoL), and psychosocial and physical function. Physical activity may help to improve prognosis and may alleviate the adverse effects of adjuvant therapy.
Objectives
To assess effects of physical activity interventions after adjuvant therapy for women with breast cancer.
Search methods
We searched the Cochrane Breast Cancer Group (CBCG) Specialised Registry, the Cochrane Central Register of Controlled Trials (CENTRAL), MEDLINE, Embase, the Cumulative Index to Nursing and Allied Health Literature (CINAHL), the Physiotherapy Evidence Database (PEDro), SPORTDiscus, PsycINFO, ClinicalTrials.gov, and the World Health Organization (WHO) International Clinical Trials Registry Platform, on 18 September 2015. We also searched OpenGrey and Healthcare Management Information Consortium databases.
Selection criteria
We searched for randomised and quasi‐randomised trials comparing physical activity interventions versus control (e.g. usual or standard care, no physical activity, no exercise, attention control, placebo) after adjuvant therapy (i.e. after completion of chemotherapy and/or radiation therapy, but not hormone therapy) in women with breast cancer.
Data collection and analysis
Two review authors independently selected studies, assessed risk of bias, and extracted data. We contacted trial authors to ask for additional information when needed. We calculated an overall effect size with 95% confidence intervals (CIs) for each outcome and used GRADE to assess the quality of evidence for the most important outcomes.
Main results
We included 63 trials that randomised 5761 women to a physical activity intervention (n = 3239) or to a control (n = 2524). The duration of interventions ranged from 4 to 24 months, with most lasting 8 or 12 weeks (37 studies). Twenty‐eight studies included aerobic exercise only, 21 involved aerobic exercise and resistance training, and seven used resistance training only. Thirty studies described the comparison group as usual or standard care, no intervention, or control. One‐fifth of studies reported at least 20% intervention attrition and the average physical activity adherence was approximately 77%.
No data were available on effects of physical activity on breast cancer‐related and all‐cause mortality, or on breast cancer recurrence. Analysis of immediately postintervention follow‐up values and change from baseline to end of intervention scores revealed that physical activity interventions resulted in significant small‐to‐moderate improvements in HRQoL (standardised mean difference (SMD) 0.39, 95% CI 0.21 to 0.57, 22 studies, 1996 women; SMD 0.78, 95% CI 0.39 to 1.17, 14 studies, 1459 women, respectively; low‐quality evidence), emotional function (SMD 0.21, 95% CI 0.10 to 0.32, 26 studies, 2102 women, moderate‐quality evidence; SMD 0.31, 95% CI 0.09 to 0.53, 15 studies, 1579 women, respectively; low‐quality evidence), perceived physical function (SMD 0.33, 95% CI 0.18 to 0.49, 25 studies, 2129 women; SMD 0.60, 95% CI 0.23 to 0.97, 13 studies, 1433 women, respectively; moderate‐quality evidence), anxiety (SMD ‐0.57, 95% CI ‐0.95 to ‐0.19, 7 studies, 326 women; SMD ‐0.37, 95% CI ‐0.63 to ‐0.12, 4 studies, 235 women, respectively; low‐quality evidence), and cardiorespiratory fitness (SMD 0.44, 95% CI 0.30 to 0.58, 23 studies, 1265 women, moderate‐quality evidence; SMD 0.83, 95% CI 0.40 to 1.27, 9 studies, 863 women, respectively; very low‐quality evidence).
Investigators reported few minor adverse events.
Small improvements in physical activity interventions were sustained for three months or longer postintervention in fatigue (SMD ‐0.43, 95% CI ‐0.60 to ‐0.26; SMD ‐0.47, 95% CI ‐0.84 to ‐0.11, respectively), cardiorespiratory fitness (SMD 0.36, 95% CI 0.03 to 0.69; SMD 0.42, 95% CI 0.05 to 0.79, respectively), and self‐reported physical activity (SMD 0.44, 95% CI 0.17 to 0.72; SMD 0.51, 95% CI 0.08 to 0.93, respectively) for both follow‐up values and change from baseline scores.
However, evidence of heterogeneity across trials was due to variation in intervention components (i.e. mode, frequency, intensity, duration of intervention and sessions) and measures used to assess outcomes. All trials reviewed were at high risk of performance bias, and most were also at high risk of detection, attrition, and selection bias. In light of the aforementioned issues, we determined that the evidence was of very low, low, or moderate quality.
Authors' conclusions
No conclusions regarding breast cancer‐related and all‐cause mortality or breast cancer recurrence were possible. However, physical activity interventions may have small‐to‐moderate beneficial effects on HRQoL, and on emotional or perceived physical and social function, anxiety, cardiorespiratory fitness, and self‐reported and objectively measured physical activity. The positive results reported in the current review must be interpreted cautiously owing to very low‐to‐moderate quality of evidence, heterogeneity of interventions and outcome measures, imprecision of some estimates, and risk of bias in many trials. Future studies with low risk of bias are required to determine the optimal combination of physical activity modes, frequencies, intensities, and durations needed to improve specific outcomes among women who have undergone adjuvant therapy.
Keywords: Female; Humans; Exercise; Resistance Training; Anxiety; Anxiety/therapy; Breast Neoplasms; Breast Neoplasms/psychology; Breast Neoplasms/therapy; Chemotherapy, Adjuvant; Depression; Depression/therapy; Fatigue; Fatigue/etiology; Physical Fitness; Prognosis; Quality of Life; Radiotherapy, Adjuvant
Plain language summary
Physical activity for women with breast cancer who have completed active cancer treatment
Review question
What effects do physical activity (PA) interventions have on women with breast cancer who have completed cancer treatment?
Background
After receiving breast cancer treatment, women may experience adverse mental and physical events caused by the cancer and by its treatment. These adverse events can result in a shorter life after treatment and can have a negative impact on quality of life (QoL) and on physical and mental health. Some studies suggest that being regularly physically active after treatment might lower the chance that breast cancer may come back, or that women may die of breast cancer. Regular PA may lead to a wide range of other beneficial effects, including improved QoL, mental health, and physical function. We wanted to determine whether PA has an effect on risk of recurrence and dying from breast cancer, QoL, and other aspects of well‐being in women who had breast cancer after treatment.
Study characteristics
We included only studies consisting of women with breast cancer who had completed active cancer treatment. These studies compared outcomes of women involved in PA interventions versus outcomes of those who were offered usual care or no PA. Participants must have been assigned to a group in random or somewhat random fashion. The evidence is current to September 2015.
Key results
This review includes 63 trials involving 5761 participants. Most trials (28) consisted of aerobic exercise (e.g. walking, cycling, dance), whereas seven trials included a resistance training‐only group, and 21 trials included a combined aerobic exercise and resistance training group. One in five participants placed in a PA intervention group dropped out before the end of the study, and on average one‐quarter of target PA sessions were missed by participants. We found no studies that looked at effects of PA after cancer treatment on risk of recurrence or dying from breast cancer or any other cause. We found that participants performing PA had more favourable values by the end of the intervention and experienced greater positive changes over the intervention period in terms of QoL, views on their emotional health and physical ability, social function, feelings of worry, stamina, PA levels, body fat, and strength of muscles, compared with usual care participants. Researchers found no effects on perceived health, ability to sleep, feelings of pain, sexual function, body mass index, waist‐to‐hip girth ratio, and bone health of the upper and lower spine or hip. At least three months after completion of the intervention, actual values and changes from the start of the intervention in feelings of tiredness, stamina, and self‐reported PA levels remained more favourable in participants given PA intervention than in those given usual care. Both aerobic exercise only and combined aerobic and resistance training interventions improved QoL and stamina. Aerobic exercise improved views on perceived emotional health and physical ability, as well as social function and self‐reported PA levels, whereas resistance training resulted in greater improvement in muscle strength. Combined aerobic and resistance training interventions led to reduced feelings of tiredness. Trialists reported few minor adverse events among those given PA interventions.
Quality of the evidence
We rated the quality of evidence related to various aspects of health as very low, low, or moderate. We noted wide variation among the interventions that we looked at in terms of types of PA, frequency of sessions per week, levels of effort among participants, and session and intervention duration. Also, researchers measured aspects of health in many different ways. Other problems with eligible studies included lack of information on how study authors placed participants in groups at random, whether researchers who were carrying out the tests knew which group the person being tested belonged to, and how researchers dealt with data missing from their studies. In many aspects, we could not rule out the chance that positive effects observed were small enough that they were not important. It is also possible that smaller studies that have not found favourable effects of PA in women with breast cancer after treatment have not been published, because study authors often find it difficult to publish studies that have not found beneficial effects.
Summary of findings
Summary of findings for the main comparison. Physical activity versus control for women with breast cancer after adjuvant therapy (immediate postintervention values).
| Physical activity versus control for women with breast cancer after adjuvant therapy | |||||
| Patient or population: women with breast cancer after adjuvant therapy Settings: home‐based, facility‐based, and combined home and facility‐based Intervention: physical activity Comparison: control | |||||
| Outcomes | Illustrative comparative risks* (95% CI) | No. of participants (studies) | Quality of the evidence (GRADE) | Comments | |
| Assumed risk | Corresponding risk | ||||
| Control | Physical activity | ||||
| HRQoL at end of intervention follow‐up Follow‐up: median 12 weeks | Mean HRQoL at end of intervention follow‐up ranged across control groups from ‐2.70 to 2.72 standard deviation units | Mean HRQoL at end of intervention follow‐up in the intervention groups was 0.39 standard deviations higher (0.21 to 0.57 higher)a | 1996 (22 studies) | ⊕⊕⊝⊝ lowb,c | SMD 0.39 (0.21 to 0.57) re‐expressed using FACT‐G (0 to 104 scale); the intervention mean HRQoL was 5.9 (3.2 to 8.6) points higher than control (MID 5 to 6 points). |
| Emotional function/mental health at end of intervention follow‐up Follow‐up: median 12 weeks | Mean emotional function/mental health at end of intervention follow‐up ranged across control groups from ‐4.80 to 0.21 standard deviation units | Mean emotional function/mental health at end of intervention follow‐up in the intervention groups was 0.21 standard deviations higher (0.10 to 0.32 higher)a | 2102 (26 studies) | ⊕⊕⊕⊝ moderated | SMD 0.21 (0.10 to 0.32) re‐expressed using FACT‐EBW (0 to 24 scale); the intervention mean emotion function was 0.7 (0.3 to 1.0) points higher than control (MID 2 points). |
| Perceived physical function at end of intervention follow‐up Follow‐up: median 12 weeks | Mean physical function at end of intervention follow‐up ranged across control groups from ‐2.64 to 1.64 standard deviation units | Mean physical function at end of intervention follow‐up in the intervention groups was 0.33 standard deviations higher (0.18 to 0.49 higher)a | 2129 (25 studies) | ⊕⊕⊕⊝ moderatec,e | SMD 0.33 (0.18 to 0.49) re‐expressed using FACT‐PBW (0 to 28 scale); the intervention mean physical function was 1.7 (0.9 to 2.5) points higher than control (MID 2 points). |
| Anxiety at end of intervention follow‐up Follow‐up: median 12 weeks | Mean anxiety at end of intervention follow‐up ranged across control groups from ‐1.33 to 1.19 standard deviation units | Mean anxiety at end of intervention follow‐up in the intervention groups was 0.57 standard deviations lower (0.95 to 0.19 lower)a | 326 (7 studies) | ⊕⊝⊝⊝ very lowc,f | SMD ‐0.57 (‐0.95 to ‐0.19) re‐expressed using PROMIS (0 to 9 scale); the intervention mean anxiety was 1.9 (3.2 to 0.6) points lower than control (MID 3 to 4.5 points). |
| Depression at end of intervention follow‐up Follow‐up: median 12 weeks | Mean depression at end of intervention follow‐up ranged across control groups from ‐0.79 to 2.84 standard deviation units | Mean depression at end of intervention follow‐up in the intervention groups was 0.34 standard deviations lower (0.62 to 0.05 lower)a | 657 (12 studies) | ⊕⊕⊝⊝ lowg | SMD ‐0.34 (‐0.62 to ‐0.05) re‐expressed using BDI‐II (0 to 63 scale); the intervention mean depression was 3.8 (7.0 to 0.6) % lower than control (MID 18%). |
| Fatigue at end of intervention follow‐up Follow‐up: median 12 weeks | Mean fatigue at end of intervention follow‐up ranged across control groups from ‐1.83 to 1.69 standard deviation units | Mean fatigue at end of intervention follow‐up in the intervention groups was 0.32 standard deviations lower (0.47 to 0.18 lower)a | 2020 (26 studies) | ⊕⊕⊕⊝ moderatec,h | SMD ‐0.32 (‐0.47 to ‐0.18) re‐expressed using FACT‐F (0 to 52 scale); the intervention mean fatigue was 2.8 (4.1 to 1.6) points lower than control (MID 3 points). |
| Cardiorespiratory fitness at end of intervention follow‐up Follow‐up: median 12 weeks | Mean cardiorespiratory fitness at end of intervention follow‐up ranged across control groups from ‐0.51 to 3.59 standard deviation units | Mean cardiorespiratory fitness at end of intervention follow‐up in the intervention groups was 0.44 standard deviations higher (0.30 to 0.58 higher)1 | 1265 (23 studies) | ⊕⊕⊕⊝ moderatei | SMD 0.44 (0.30 to 0.58) re‐expressed as VO₂max (mL/kg/min); the intervention mean was 2.1 (1.4 to 2.7) mL/kg/min higher than control (MID 3.5 mL/kg/min). |
| *The basis for the assumed risk (e.g. median control group risk across studies) is provided in footnotes. The corresponding risk (and its 95% confidence interval) is based on the assumed risk in the comparison group and the relative effect of the intervention (and its 95% CI). BDI: Beck Depression Inventory; CI: confidence interval; FACT‐EBW: Functional Assessment of Cancer Therapy Emotional Wellbeing; FACT‐F: Functional Assessment of Cancer Therapy ‐ Fatigue; FACT‐G: Functional Assessment of Cancer Therapy‐General; FACT‐PBW: Functional Assessment of Cancer Therapy Physical Wellbeing; HRQoL: health‐related quality of life; MID: minimal important difference; PROMIS: Patient Reported Outcomes Measurement Information System; SMD: standardised mean difference; VO₂max: maximal oxygen uptake. | |||||
| GRADE Working Group grades of evidence. High quality: Further research is very unlikely to change our confidence in the estimate of effect. Moderate quality: Further research is likely to have an important impact on our confidence in the estimate of effect and may change the estimate. Low quality: Further research is very likely to have an important impact on our confidence in the estimate of effect and is likely to change the estimate. Very low quality: We are very uncertain about the estimate. | |||||
aAs a rule of thumb, 0.2 SD represents a small effect, 0.5 SD a moderate effect, and 0.8 SD a large effect. bWe downgraded by two levels due to evidence of inconsistency supported by presence of substantial heterogeneity (I² = 50% to 90%) and point estimates widely differed and 95% confidence intervals that did not overlap (P value Chi² < 0.01), and suspected publication bias (Egger's test, P < 0.05).
cAll trials lacked blinding of participants (performance bias), and most trials lacked blinding of outcome assessors (detection bias) and had incomplete outcome reporting and/or high attrition (attrition bias), but most were at a low risk of selection bias, reporting bias, and other bias, and therefore, we did not downgraded based on risk of bias. dWe downgraded by one level because all trials lacked blinding of participants (performance bias) and most trials lacked blinding of outcome assessors (detection bias), had incomplete outcome reporting and/or high attrition (attrition bias), and half of them had unclear or inadequate randomisation and/or allocation concealment procedures.. eWe downgraded by one level due to evidence of inconsistency supported by presence of substantial heterogeneity (I² = 50% to 90%) and point estimates widely differed and 95% confidence intervals that did not overlap (P value Chi² < 0.01). fWe downgraded by three levels due to evidence of inconsistency supported by presence of substantial heterogeneity (I² = 50% to 90%) and point estimates widely differed and 95% confidence intervals that did not overlap (P value Chi² < 0.01), suspected publication bias (Egger's test, P < 0.05), and imprecision because the 95% confidence intervals included negligible effects as well as an appreciable benefit (>0.5) and sample size did not meet the ‘‘rule of thumb’’ of approximately 400 (200 per group) participants. gWe downgraded by two levels due to evidence of inconsistency supported by presence of substantial heterogeneity (I² = 50% to 90%) and point estimates widely differed and 95% confidence intervals that did not overlap (P value Chi² < 0.01), and imprecision because the 95% confidence intervals included negligible effects as well as an appreciable benefit (>0.5). All trials lacked blinding of participants (performance bias), had incomplete outcome reporting and/or high attrition (attrition bias), and unclear or inadequate randomisation and/or allocation concealment procedures (selection bias), but because most were at a low risk of detection, reporting, and other bias, we did not downgraded based on risk of bias. hWe downgraded by one level due to evidence of inconsistency supported by presence of substantial heterogeneity (I² = 50% to 90%) and point estimates widely differed and 95% confidence intervals that did not overlap (P value Chi² < 0.01). iWe downgraded by one level because all trials lacked blinding of participants (performance bias) and most trials lacked blinding of outcome assessors (detection bias), had incomplete outcome reporting and/or high attrition (attrition bias), and had allocation concealment procedures that were inadequate or unclear (selection bias).
Summary of findings 2. Physical activity versus control for women with breast cancer after adjuvant therapy (change from baseline to end of intervention values).
| Physical activity versus control for women with breast cancer after adjuvant therapy | |||||
| Patient or population: women with breast cancer after adjuvant therapy Settings: home‐based, facility‐based, and combined home and facility‐based Intervention: physical activity Comparison: control | |||||
| Outcomes | Illustrative comparative risks* (95% CI) | No. of participants (studies) | Quality of the evidence (GRADE) | Comments | |
| Assumed risk | Corresponding risk | ||||
| Control | Physical activity | ||||
| HRQoL change from baseline to end of intervention Follow‐up: median 12 weeks | Mean HRQoL change from baseline to end of intervention ranged across control groups from ‐2.40 to 1.25 standard deviation units | Mean HRQoL change from baseline to end of intervention in the intervention groups was 0.78 standard deviations higher (0.39 to 1.17 higher)a | 1459 (14 studies) | ⊕⊕⊝⊝ lowb,c | SMD 0.78 (0.39 to 1.17) re‐expressed using FACT‐G (0 to 104 scale); the intervention mean change was 5.0 (2.5 to 7.5) points higher than control (MID 5 to 6 points) |
| Emotional function/mental health change from baseline to end of intervention Follow‐up: median 12 weeks | Mean emotional function/mental health change from baseline to end of intervention ranged across control groups from ‐0.39 to 3.47 standard deviation units | Mean emotional function/mental health change from baseline to end of intervention in the intervention groups was 0.31 standard deviations higher (0.09 to 0.53 higher)a | 1579 (15 studies) | ⊕⊕⊕⊝ lowc,d | SMD 0.31 (0.09 to 0.53) re‐expressed using FACT‐EBW (0 to 24 scale); the intervention mean change was 0.8 (0.2 to 1.3) points higher than control (MID 2 points). |
| Perceived physical function change from baseline to end of intervention Follow‐up: median 12 weeks | Mean physical function change from baseline to end of intervention ranged across control groups from ‐1.34 to 1.66 standard deviation units | Mean physical function change from baseline to end of intervention in the intervention groups was 0.60 standard deviations higher (0.23 to 0.97 higher)a | 1433 (13 studies) | ⊕⊕⊕⊝ moderatec,e | SMD 0.60 (0.23 to 0.97) re‐expressed using FACT‐PBW (0 to 28 scale); the intervention mean change was 1.3 (0.5 to 2.1) points higher than control (MID 2 points). |
| Anxiety change from baseline to end of intervention Follow‐up: median 11 weeks | Mean anxiety change from baseline to end of intervention ranged across control groups from ‐1.47 to 0.73 standard deviation units | Mean anxiety change from baseline to end of intervention in the intervention groups was 0.37 standard deviations lower (0.63 to 0.12 lower)a | 235 (4 studies) | ⊕⊕⊝⊝ lowf | SMD ‐0.37 (‐0.63 to ‐0.12) re‐expressed using PROMIS (0 to 9 scale); the intervention mean change was 4.6 (7.6 to 1.5) points lower than control (MID 3 to 4.5 points). |
| Depression change from baseline to end of intervention Follow‐up: median 12 weeks | Mean depression change from baseline to end of intervention ranged across control groups from ‐1.51 to 1.83 standard deviation units | Mean depression change from baseline to end of intervention in the intervention groups was 0.34 standard deviations lower (0.63 to 0.05 lower)a | 816 (7 studies) | ⊕⊝⊝⊝ very lowc,g |
SMD ‐0.34 (‐0.63 to ‐0.05) re‐expressed using BDI‐II (0 to 63 scale); the intervention mean change was 2.5 (4.6 to 0.4) % lower than control (MID 18%). |
| Fatigue change from baseline to end of intervention Follow‐up: median 12 weeks | Mean fatigue change from baseline to end of intervention ranged across control groups from ‐1.81 to 1.83 standard deviation units | Mean fatigue change from baseline to end of intervention in the intervention groups was 0.3 standard deviations lower (0.61 lower to 0 higher)a | 1289 (13 studies) | ⊕⊕⊝⊝ lowc,h | SMD ‐0.3 (‐0.61 to 0) re‐expressed using FACT‐F (0 to 52 scale); the intervention mean change was 2.6 (5.2 to 0) points lower than control (MID 3 units). |
| Cardiorespiratory fitness change from baseline to end of intervention Follow‐up: median 12 weeks | Mean cardiorespiratory fitness change from baseline to end of intervention ranged across control groups from ‐1.45 to 2.38 standard deviation units | Mean cardiorespiratory fitness change from baseline to end of intervention in the intervention groups was 0.83 standard deviations higher (0.4 to 1.27 higher)a | 863 (9 studies) | ⊕⊝⊝⊝ very lowi | SMD 0.83 (0.4 to 1.27) re‐expressed using VO₂max (mL/kg/min); the intervention mean change was 2.3 (1.1 to 3.4) mL/kg/min higher than control (MID 3.5 mL/kg/min). |
| *The basis for the assumed risk (e.g. median control group risk across studies) is provided in footnotes. The corresponding risk (and its 95% confidence interval) is based on the assumed risk in the comparison group and the relative effect of the intervention (and its 95% CI). BDI: Beck Depression Inventory; CI: confidence interval; FACT‐EBW: FACT‐EBW: Functional Assessment of Cancer Therapy Emotional Wellbeing; FACT‐F: Functional Assessment of Cancer Therapy ‐ Fatigue; FACT‐G: Functional Assessment of Cancer Therapy ‐ General; FACT‐PBW: Functional Assessment of Cancer Therapy Physical Wellbeing; HRQoL: health‐related quality of life; MID: minimal important difference; PROMIS: Patient Reported Outcomes Measurement Information System; SMD: standardised mean difference; VO₂max: maximal oxygen uptake. | |||||
| GRADE Working Group grades of evidence. High quality: Further research is very unlikely to change our confidence in the estimate of effect. Moderate quality: Further research is likely to have an important impact on our confidence in the estimate of effect and may change the estimate. Low quality: Further research is very likely to have an important impact on our confidence in the estimate of effect and is likely to change the estimate. Very low quality: We are very uncertain about the estimate. | |||||
aAs a rule of thumb, 0.2 SD represents a small effect, 0.5 SD a moderate effect, and 0.8 SD a large effect. bWe downgraded by two levels due to evidence of inconsistency supported by presence of considerable heterogeneity (I² = 75% to 100%) and point estimates widely differed and 95% confidence intervals that did not overlap (P value Chi² < 0.01), and suspected publication bias (Egger's test, P < 0.05). cAll trials lacked blinding of participants (performance bias), and most trials lacked blinding of outcome assessors (detection bias) and had incomplete outcome reporting and/or high attrition (attrition bias), but most were at a low risk of selection bias, reporting bias, and other bias, and therefore, we did not downgraded based on risk of bias. dWe downgraded by two levels due to evidence of inconsistency supported by presence of substantial heterogeneity (I² = 50% to 90%) and point estimates widely differed and 95% confidence intervals that did not overlap (P value Chi² < 0.01), and imprecision because the 95% confidence intervals included negligible effects as well as an appreciable benefit (>0.5). eWe downgraded by one level due to evidence of inconsistency supported by presence of considerable heterogeneity (I² = 75% to 100%) and point estimates widely differed and 95% confidence intervals that did not overlap (P value Chi² < 0.01). fWe downgraded by two levels due to suspected publication bias (Egger's test, P < 0.05), and imprecision because the 95% confidence intervals included negligible effects as well as an appreciable benefit (>0.5) and the sample size does not meet the ‘‘rule of thumb’’ of approximately 400 (200 per group) participants. The majority of trials were at a low risk of selection bias, attrition bias, reporting bias, and other bias, and therefore, we did not downgraded based on risk of bias. gWe downgraded by three levels due to evidence of inconsistency supported by presence of substantial heterogeneity (I² = 50% to 90%) and point estimates widely differed and 95% confidence intervals that did not overlap (P value Chi² < 0.01), suspected publication bias (Egger's test, P < 0.05), and imprecision because the 95% confidence intervals included negligible effects as well as an appreciable benefit (>0.5). hWe downgraded by two levels due to evidence of inconsistency supported by presence of considerable heterogeneity (I² = 75% to 100%) and point estimates widely differed and 95% confidence intervals that did not overlap (P value Chi² < 0.01), and imprecision because the 95% confidence intervals included null effects as well as an appreciable benefit (>0.5). iWe downgraded by three levels due to evidence of inconsistency supported of considerable heterogeneity (I² = 75% to 100%) and point estimates widely differed and 95% confidence intervals that did not overlap (P value Chi² < 0.01), suspected publication bias (included studies were small and the funnel plot shows asymmetry), and all trials lacked blinding of participants (performance bias) and most trials lacked blinding of outcome assessors (detection bias), had incomplete outcome reporting and/or high attrition (attrition bias), and had unclear or inadequate randomisation and/or allocation concealment procedures.
Background
Description of the condition
Worldwide, breast cancer is the most frequently diagnosed cancer among women, accounting for one in four of all new female cancer cases (1.7 million total cases) in 2012 (Ferlay 2013). Although incidence rates vary markedly across world regions, breast cancer is the most common cancer among women in both more developed and less developed regions, with slightly more cases reported in less developed (883,000 cases) than in more developed (794,000) regions (Ferlay 2013). Breast cancer is the most common cause of cancer death among women in less developed regions (324,000 deaths) and is the second most common cause of cancer death among women in more developed regions (198,000 deaths). Globally, researchers reported a 20% increase and a 14% increase in breast cancer incidence and mortality, respectively, from 2008 to 2012 (Ferlay 2013; Jemal 2011). Although incidence rates remain highest in more developed regions, mortality rates are relatively much higher in less developed countries ‐ a fact that can be attributed to lack of both early detection and access to treatment facilities (IARC 2012).
In 2012, breast cancer was the most prevalent cancer worldwide with approximately 6.3 million women alive who had received a diagnosis of breast cancer in the previous five years, representing a 17% increase from 2008 figures (Bray 2013; Ferlay 2013). Owing in particular to this rising prevalence, attention to tertiary prevention among women with breast cancer has increased. In addition to risk of cancer recurrence, women with breast cancer often experience numerous short‐ and long‐term disease‐ or treatment‐related adverse physiological and psychosocial outcomes, such as cardiotoxicity, neurotoxicity, secondary leukaemia, lymphoedema, premature menopause, sexual dysfunction, infertility, weight gain, difficulty sleeping, and fatigue (Azim 2011; Beisecker 1997; Bovelli 2010; de Jong 2002). These adverse effects would be expected to have a negative impact on health‐related quality of life (HRQoL) and physical function. In addition, these unwanted effects can be prolonged after completion of active treatment and may hinder the woman's return to normal life (Fong 2012).
Description of the intervention
Encouraging women with breast cancer after adjuvant therapy to adopt a healthy lifestyle, such as low alcohol consumption, greater fruit and vegetable consumption, and higher physical activity levels, may be important for improving quality of life and the health of survivors and, in turn, may reduce the healthcare burden (Demark‐Wahnefried 2005). In particular, higher levels of physical activity represent a modifiable health behaviour that could alleviate the sequelae related to breast cancer and assist women in returning to the health status they had before receiving the diagnosis and treatment (Fong 2012). Physical activity is defined as any bodily movement produced by contraction of skeletal muscle that increases energy expenditure above a basal level, performed as part of occupation, active transportation, household and gardening chores, and recreational activities. Exercise, a subcategory of physical activity, is defined as planned, structured, and repetitive physical activity that is aimed at improving or maintaining one or more components of physical fitness (Caspersen 1985; Physical Activity Guidelines 2008). Current recommendations for breast cancer survivors are to avoid inactivity, return to normal daily activities as quickly as possible after surgery, continue these activities during and after non‐surgical treatments, and engage in 150 minutes per week of moderate‐intensity aerobic activity (e.g. any activity, such as brisk walking, that requires a moderate amount of effort and noticeably increases heart rate) (Schmitz 2010).
How the intervention might work
Evidence from observational data suggests that higher levels of physical activity in breast cancer survivors or post diagnosis are associated with reduced risk of dying from breast cancer or from all causes (Beasley 2012; Ibrahim 2011). Increased physical activity is also associated with reduced exposure to oestrogen and androgens and increased concentrations of sex hormone‐binding globulin, as well as improved insulin sensitivity and decreased concentrations of insulin growth factor‐1 and of adipokines and inflammatory markers, with the exception of a beneficial elevation in adiponectin concentrations (Lynch 2011). These effects of increased physical activity may serve as the mechanisms that can explain associated reductions in all‐cause and breast cancer‐related mortality. Furthermore, lack of physical activity has been shown to be related to weight gain post breast cancer diagnosis, which, in turn, has been linked to poorer survival in some studies (Camoriano 1990; Kroenke 2005). More active women have been found to possess a lower body mass index (BMI) and to be less likely to gain weight after diagnosis, thus improving their survival chances (Holmes 2005; Lahmann 2005).
Evidence suggests that physical activity can promote positive physiological and psychological benefits among cancer survivors after treatment (Brown 2012; Fong 2012; Galvao 2005; Ingram 2007; Knols 2005; Speck 2010). A recent meta‐analysis revealed that physical activity was associated with important positive effects on physical function, body weight and BMI, and quality of life, which included physical and social functioning domains, among patients who had completed cancer treatment (Fong 2012). Results reported in a Cochrane review indicate that physical activity may have beneficial effects on overall HRQoL and on certain HRQoL domains, including cancer‐specific concerns (e.g. breast cancer), body image and self‐esteem, emotional well‐being, sexuality, sleep disturbance, social functioning, anxiety, fatigue, and pain at varying follow‐up periods (Mishra 2012a).
Why it is important to do this review
Despite benefits derived through physical activity, consensus has not been reached regarding the magnitude of benefit, the most effective delivery mode, and prescription of physical activity in breast cancer survivors. Physical activity interventions in this population typically are delivered under supervised ‐ Courneya 2003; Milne 2008 ‐ or self‐directed, home‐based conditions (Pinto 2005; Vallance 2008). They consist of, or serve as a way to compare, aerobic exercise training (Cadmus 2009; Herrero 2006), walking (Matthews 2007; Payne 2008), and resistance training (Schmitz 2009; Winters‐Stone 2011). Their duration can vary from less than 10 weeks ‐ Daley 2007; Fillion 2008 ‐ to six months or longer (Schmitz 2009; Winters‐Stone 2011). Previous systematic reviews and meta‐analyses have included studies involving patients with all types of cancer (Brown 2012; Cramp 2010; Fong 2012; Knols 2010; Mishra 2012a; Mishra 2012b; Speck 2010), rather than focusing on patients with breast cancer; studies of patients with cancer who received adjuvant therapy (Carayol 2013; Markes 2009; McNeely 2006; Mishra 2012b); studies that focused on a particular physical activity mode, such as walking (Knols 2010), yoga (Cramer 2013), dance (Bradt 2011), or resistance training (Cheema 2014; Cheema 2008; Cramp 2010); or studies that investigated a particular outcome, such as quality of life ‐ Cramp 2010; Mishra 2012a; Mishra 2012b ‐ and upper limb dysfunction (McNeely 2010). Therefore, a systematic review and meta‐analysis is needed to investigate effects of physical activity on the large range of outcomes reported in trials including women who have completed adjuvant therapy for breast cancer.
Objectives
To assess effects of physical activity interventions after adjuvant therapy for women with breast cancer.
Methods
Criteria for considering studies for this review
Types of studies
We considered for inclusion in this review all randomised controlled trials (RCTs), as well as quasi‐randomised controlled trials, investigating effects of physical activity interventions for women with breast cancer after adjuvant therapy.
Types of participants
We sought trials that included women with a diagnosis of breast cancer who had completed adjuvant therapy (radiotherapy or chemotherapy).
We excluded studies including cancers other than breast cancer unless separate data were available for the breast cancer subgroup. We also excluded studies including only patients with metastatic breast cancer (stage IV and above).
We excluded studies including women who were undergoing adjuvant therapy (radiotherapy and chemotherapy but not endocrine therapy) for breast cancer during the physical activity intervention.
Types of interventions
We included all trials that reported and evaluated effects of interventions such as physical activity (including exercise), as well as studies comparing a physical activity group versus a group described as receiving no physical activity and no exercise, and given control, attention control, usual or standard care, or placebo.
We excluded studies that:
included an additional treatment arm or combined intervention arm (e.g. physical activity with diet modification) for which effects of physical activity could not be isolated;
provided single exercise sessions that measured acute effects;
investigated effects of physiotherapy; and
were restricted to stretching or local muscular endurance (e.g. training of shoulders, back, or legs only) or therapeutic exercise regimens that addressed only specific impairments related to the shoulder, the arm, or both.
Types of outcome measures
For selected outcomes, we extracted:
immediately postintervention follow‐up values;
three‐month or longer postintervention follow‐up values;
change from baseline to end of intervention scores; and
change from baseline to three‐month or longer postintervention scores.
Primary outcomes Breast cancer‐related mortality, defined as time from date randomised to date of death due to primary breast cancerHRQoL domains, via a validated questionnaire, including but not limited to physical function (e.g. performance of self‐care and everyday physical activities), psychological function (e.g. emotional well‐being, anxiety, depression, self‐esteem), social and economic role function (e.g. performance of work or household responsibilities, social interactions), pain, and fatigue or vitality (e.g. energy)
Primary outcomes
Breast cancer‐related mortality, defined as time from date randomised to date of death due to primary breast cancer
HRQoL domains, via a validated questionnaire, including but not limited to physical function (e.g. performance of self‐care and everyday physical activities), psychological function (e.g. emotional well‐being, anxiety, depression, self‐esteem), social and economic role function (e.g. performance of work or household responsibilities, social interactions), pain, and fatigue or vitality (e.g. energy)
Secondary outcomes
All‐cause mortality, defined as time from date randomised to date of death (any cause)
Breast cancer recurrence, defined as time from date of randomisation to emergence of local, regional, or distant recurrence or metastasis
Cardiorespiratory fitness, defined as ability to engage in physical activities that rely on oxygen consumption as the primary source of energy, and measured directly or indirectly to obtain an individual's maximal oxygen uptake (VO₂max)
Physical activity assessed as an outcome measure, defined as any bodily movement produced by contraction of skeletal muscle that increases energy expenditure above a basal level, and measured by self‐report via questionnaires or objectively via accelerometers
Body mass, BMI, body composition (e.g. measures such as body fat percentage, fat‐free or lean mass, and fat mass) and other anthropometric measurements (e.g. waist and hip circumferences)
Muscular strength, defined as maximal force (expressed in Newtons, kilograms, or pounds) that can be generated by a specific muscle or muscle group
Bone health‐related outcomes such as bone mineral density and bone mineral content
Adverse events such as musculoskeletal injuries, lymphoedema, and illness (such as bronchitis and influenza)
Search methods for identification of studies
Electronic searches
We searched the following databases.
Cochrane Breast Cancer Group (CBCG) Specialised Register. Details of search strategies used by the CBCG for identification of studies and procedures for coding of references are outlined in the CBCG module (http://onlinelibrary.wiley.com/o/cochrane/clabout/articles/BREASTCA/frame.html). We considered for inclusion in the review retrieved trials using the following terms: 'breast cancer', 'physical activity', 'physical activity intervention', 'exercise', 'walking', 'resistance training', 'weight training', 'weight lifting' or 'fitness'.
MEDLINE (via PubMed); see Appendix 1.
Embase (via Embase.com); see Appendix 2.
Cochrane Central Register of Controlled Trials (CENTRAL; 2015, Issue 8) in the Cochrane Library; see Appendix 3.
World Health Organization (WHO) International Clinical Trials Registry Platform (ICTRP) search portal (http://apps.who.int/trialsearch/Default.aspx) for all prospectively registered and ongoing trials; see Appendix 4.
Clinicaltrials.gov (http://clinicaltrials.gov/); see Appendix 5.
Cumulative Index to Nursing and Allied Health Literature (CINAHL) (via EBSCOhost.com); see Appendix 6.
Physiotherapy Evidence Database (PEDro) (via PEDro.org.au); see Appendix 7.
SPORTDiscus (via EBSCOhost.com); see Appendix 8.
PsycINFO (via OvidSP); see Appendix 9.
Searching other resources
Bibliographic searching
We attempted to identify further studies by reviewing reference lists of identified relevant trials or reviews. We obtained a copy of the full article for each reference reporting a potentially eligible trial. When this was not possible, we attempted to contact trial authors to request additional information.
We conducted a search for relevant grey literature using OpenGrey and Healthcare Management Information Consortium (HMIC) databases.
Data collection and analysis
Selection of studies
We merged results of the searches described above and removed duplicate records on the same study. We examined titles and abstracts to remove obviously irrelevant reports. Two review authors (IML and GSM) independently screened and assessed records for eligibility. We resolved disagreements on study eligibility through consensus, and, when necessary, we met with a third review author not involved in the particular assessment (AMN) for discussion. We retrieved full‐text articles of potentially relevant reports and linked together multiple reports of the same study. We examined full‐text reports for compliance of studies with the eligibility criteria. We corresponded with investigators, when appropriate, to clarify study eligibility or to seek further information, such as missing data.
We recorded in the Characteristics of excluded studies table a list of studies that were close to inclusion but did not meet the criteria after further inspection.
We included non‐English language trials and translated them, when necessary, so that we could assess eligibility and subsequently extract study data.
Data extraction and management
We devised a checklist of items to be considered during data collection. This checklist included the source of the report; confirmation of eligibility or reason for exclusion; methods such as study design, total duration, sequence generation, allocation sequence concealment, blinding, and other sources of bias; participant information such as total numbers, diagnostic criteria, and demographic information; dates of the study; intervention details; for each outcome of interest, the definition, unit of measurement and scales, time points of assessment, results including numbers of participants allocated to groups, sample size, missing data, summary of data for each group, and effect estimates with confidence intervals; and miscellaneous information such as funding sources, key conclusions, and details of any correspondence.
IML and GSM independently extracted trial data, and AMN arbitrated any conflicts not due to extractor error. We collated multiple publications for the same trial and used the most complete report (i.e. the one with outcomes most relevant to the review or with the most recent outcomes) as the primary reference.
Assessment of risk of bias in included studies
We summarised in the Characteristics of included studies table data collected from these reports. We used the Cochrane ‘risk of bias’ tool to assess possible sources of bias in the included reports (Higgins 2011). Assessment of risk of bias was a two‐part process addressing specific domains such as sequence generation, allocation concealment, blinding, incomplete outcome data, selective reporting bias, and ‘other issues’. The first part of the process describes what was reported to have happened in a study, and the second part includes judgement related to the risk of bias for each domain in that study. Two review authors (IML and GSM) assessed risk of bias, and a third review author (AMN) arbitrated conflicts not due to assessor error. If we found evidence of heterogeneity, large risk of bias, or low quality of evidence, we interpreted trial findings cautiously.
We have displayed our assessment of risk of bias in a ‘risk of bias’ table.
Measures of treatment effect
We performed a meta‐analysis on an outcome only if at least two studies assessed that outcome; we did not perform meta‐analysis if outcomes were too diverse, studies were at risk of serious bias, or evidence suggested serious publication or reporting bias.
We combined continuous outcomes (such as cardiorespiratory fitness, physical activity, anthropometric measures, muscular strength, and bone health‐related outcomes) using mean difference (MD) when trials measured an outcome by using the same measurement method or scale to generate continuous data. We used standardised mean difference (SMD) when trials used different instruments to measure the same outcome.
For dichotomous outcomes (such as meeting physical activity guidelines), we used risk ratios (RRs) with 95% confidence intervals (CIs). We transformed data presented as odds ratios (ORs) using the method outlined in Chapter 12 of the Cochrane Handbook for Systematic Reviews of Interventions (Higgins 2011).
For this review version, no outcomes were reported as time‐to‐event. In future review versions, for time‐to‐event outcomes such as mortality and recurrence, we will use hazard ratios (HRs) with 95% CIs. We will report the ratios of treatment effects for responses, so that HRs less than 1.0 will favour the physical activity intervention and HRs greater than 1.0 will favour usual care or control. To perform meta‐analysis of time‐to‐event outcomes, we will obtain the log HR (intervention relative to control) and its standard error (SE). As outlined in Chapter 7 of the Cochrane Handbook for Systematic Reviews of Interventions (Higgins 2011), the log hazard ratio is estimated by (O ‐ E)/V, which has an SE 1/√V, where O represents the observed number of events in the intervention group, E the log‐rank expected number of events in the intervention group, O‐E the log‐rank statistic, and V variance of the log‐rank statistic. Alternatively, when trial authors analyse data using a Cox proportional hazards model, they directly report estimates of the log hazard ratio and its SE.
Unit of analysis issues
For trials that included more than one applicable physical activity group (Cormie 2014; Dolan 2016; Ergun 2013; Loh 2014; Martin 2013; Musanti 2012; Portela 2008; Short 2014; Vallance 2007) and more than one relevant control group (Daley 2007), we created, when possible, a single pair‐wise comparison by combining outcome data as recommended in the Cochrane Handbook for Systematic Reviews of Interventions (Higgins 2011).
Dealing with missing data
We requested missing data from trial authors. If variability was presented by measures other than standard deviation, we obtained an estimate of the standard deviation (SD) using standard approaches for transforming data. We transformed CIs, t values, and P values to estimate SD using methods described in the Cochrane Handbook for Systematic Reviews of Interventions (Higgins 2011); if F‐statistics were reported for comparisons of two groups, we transformed F‐statistics into T‐statistics using the following formula: T = √F, then estimated SD from the T‐statistic.
Assessment of heterogeneity
For each outcome, we first assessed study heterogeneity using Cochran’s χ² (Chi²) test (Cochran 1954), with P < 0.10 indicating evidence of heterogeneity.
We evaluated inconsistency of results across studies by using the I² statistic. I² describes the percentage of variability in point estimates that is due to heterogeneity rather than to sampling error (Higgins 2003). In accordance with Higgins 2011, we interpreted I² values of 0% to 40% as 'might not be important', 30% to 60% as 'may represent moderate heterogeneity', 50% to 90% as 'may represent substantial heterogeneity', and 75% to 100% as showing 'considerable heterogeneity'. However, the importance of the observed value of I² depends on the magnitude and direction of effects and the strength of evidence of heterogeneity (e.g. P value from the Chi² test, CI for I²).
We used a random‐effects model to determine the average effect of physical activity because, in addition to the presence of random error (i.e. chance), differences between physical studies after adjuvant breast cancer treatment can result from real differences between study populations, types of adjuvant breast cancer treatment received, and the training stimulus. The random‐effects model considers these additional sources of between‐study variability, as well as within‐study variability. We presented pooled intervention effect estimates and their 95% CIs for each outcome.
Assessment of reporting biases
To investigate publication bias, we prepared funnel plots and visually examined them for signs of asymmetry. We followed recommendations provided in the Cochrane Handbook for Systematic Reviews of Interventions (Higgins 2011) regarding statistical testing for funnel plot asymmetry. For example, if a sufficient number of trials were available in a particular analysis, we examined publication bias using Egger’s linear regression method, with P < 0.10 taken as an indication of publication bias (Egger 1997). If we noted evidence of statistically significant asymmetry, we considered interpretations other than publication bias.
Data synthesis
We have presented pooled intervention effect estimates and their 95% CIs.
For continuous outcomes, we combined data using the inverse variance random‐effects method (DerSimonian 1986).
For dichotomous outcomes, we applied the random‐effects model (DerSimonian 1986), along with the Mantel‐Haenszel method (Mantel 1959; Greenland 1985), to combine data.
For time‐to‐event outcomes, we combined study results using the generic inverse variance method. We carried out all analyses using Review Manager 5 (version 5.3) (RevMan).
IML and GSM assessed the quality of the evidence by using the GRADE system (Guyatt 2008); we have presented these results in the 'Summary of findings' tables.
Subgroup analysis and investigation of heterogeneity
We considered the following important methodological factors, physical activity programme design components, and participant characteristics as potential sources of heterogeneity: removal of the most extreme values; study quality based on risk of bias (low risk of bias vs moderate unclear/high risk of bias); menopausal status of participants (premenopausal vs postmenopausal); duration of intervention (shorter duration, i.e. ≤ 12 weeks, vs longer duration, i.e. > 12 weeks); measurement type (instrument/method used, e.g. direct vs indirect, subjective vs objective measurement); and mode of physical activity (aerobic exercise vs resistance training vs combination of aerobic and resistance exercise vs yoga, tai chi, qigong, and pilates interventions). When it was possible to inform physical activity prescription for patients with breast cancer post adjuvant therapy, we conducted subgroup analyses of treatment effect based on intervention mode (aerobic exercise vs resistance training vs combination of aerobic and resistance exercise vs yoga, tai chi, qigong, and pilates interventions), intensity (light and light‐moderate vs moderate‐high and high), duration of intervention (≤ 12 weeks vs > 12 weeks), format (individual vs group vs combined individual and group), setting (home‐based vs facility‐based vs home and facility‐based combined), participants' menopausal status (premenopausal vs postmenopausal), and treatment regimen (chemotherapy vs no chemotherapy).
Sensitivity analysis
We conducted sensitivity analyses to assess the robustness of review results by removing studies with high or unclear risk of bias.
Results
Description of studies
Results of the search
Through a comprehensive literature search, we identified 8454 potentially relevant references and screened them for retrieval. After removing duplicates, we excluded a total of 5955 references upon title and abstract review and retrieved 211 references for more detailed evaluation. From these, we excluded 86 trials as they did not meet the inclusion criteria, and identified 63 trials as appropriate for inclusion in the current review (Figure 1). In addition, we identified 10 ongoing trials (Deli‐Conwright 2014; Galiano‐Castillo 2013; IRCT2014042117379N1; KIlbreath 2011; NCT02057536; NCT02235051; NCT02332876; NCT02420249; NCT02433067; NCT02527889), as well as three trials that were awaiting classification (Lahart 2016; Lohrisch 2011; Luu 2014). We did not include these latter trials in the analysis presented below but will consider them in future updates of this review. See Characteristics of included studies; Characteristics of excluded studies; Characteristics of studies awaiting classification; and Characteristics of ongoing studies.
1.
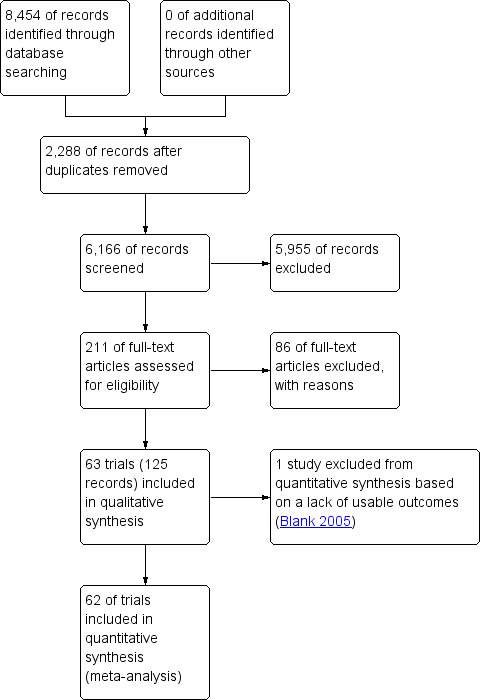
Study flow diagram.
Included studies
Final selection resulted in inclusion of 63 trials in this review (Banasik 2011; Baruth 2013; Basen‐Enquist 2006; Blank 2005; Bower 2011; Cadmus 2009; Cantarero‐Villanueva 2013; Carson 2009; Cerulli 2014; Cormie 2014; Courneya 2003; Cuesta‐Vargas 2014; Daley 2007; DeNysschen 2011; Do 2015; Dolan 2016; Duijits 2012; Ergun 2013; Fillion 2008; Guinan 2013; Hatchett 2013; Heim 2007; Herrero 2006; Irwin 2015; Kaltsatou 2011; Kiecolt‐Glaser 2014; Kim 2015; Ligibel 2008; Littman 2012; Loh 2014; Loudon 2014; Malicka 2011; Martin 2013; Matthews 2007; McKenzie 2003; Mehnert 2011; Milne 2008; Murtezani 2014; Musanti 2012; Mustian 2004; Naumann 2012; Nieman 1995; Nikander 2007; Payne 2008; Peppone 2015; Pinto 2003; Pinto 2005; Pinto 2015; Portela 2008; Rahnama 2010; Rogers 2009; Rogers 2013; Rogers 2014; Rogers 2015; Saarto 2012; Schmitz 2005; Schmitz 2009; Segar 1998; Short 2014; Taleghani 2012; Vallance 2007; Waltman 2010; Winters‐Stone 2011) (we used the earliest main publication of each trial as the trial reference). We reviewed and included information on trial characteristics and outcome‐related data from an additional 125 publications that were secondary publications of these 63 trials. We corresponded with, and requested additional data from, nine trial authors (Baruth 2013; Carson 2009; Daley 2007; Heim 2007; Loh 2014; McKenzie 2003; Payne 2008; Peppone 2015; Vallance 2007), and four of these trial authors replied to requests for additional data (Daley 2007; Loh 2014; Payne 2008; Vallance 2007). Full descriptions of the included studies can be found under Characteristics of included studies.
Study design
Of the 63 included trials, 60 (95%) were RCTs, and three studies used a quasi‐randomised design to allocate participants to treatment(s) (Cuesta‐Vargas 2014; Heim 2007; Segar 1998). Twelve trials (19%) consisted of more than one exercise intervention group (Cormie 2014; DeNysschen 2011; Dolan 2016; Duijits 2012; Ergun 2013; Loh 2014; Martin 2013; Musanti 2012; Naumann 2012; Portela 2008; Short 2014; Vallance 2007). One study consisted of two comparison arms (usual care and exercise‐placebo control in the form of stretching) (Daley 2007), and Duijits 2012 included a non‐exercise cognitive‐behaviour therapy group, while Naumann 2012 included a non‐exercise counselling group. In all, investigators allocated 5761 participants (mean 91, range 14 to 573) to a physical activity intervention group (n of participants = 3239, mean 51, range 7 to 302) or a control group (n = 2524, mean 40, range 8 to 271).
Study participants
Forty trials (63%) reported numbers of participants at each cancer stage (Baruth 2013; Basen‐Enquist 2006; Cadmus 2009; Cantarero‐Villanueva 2013; Carson 2009; Cerulli 2014; Cormie 2014; Courneya 2003; DeNysschen 2011; Do 2015; Dolan 2016; Fillion 2008; Guinan 2013; Hatchett 2013; Herrero 2006; Irwin 2015; Kiecolt‐Glaser 2014; Ligibel 2008; Littman 2012; Loh 2014; Loudon 2014; Matthews 2007; Mehnert 2011; Milne 2008; Murtezani 2014; Musanti 2012; Peppone 2015; Pinto 2003; Pinto 2005; Pinto 2015; Portela 2008; Rogers 2009; Rogers 2013; Rogers 2014; Rogers 2015; Schmitz 2005; Schmitz 2009; Short 2014; Vallance 2007; Winters‐Stone 2011). Of these 40, 18 reported numbers of participants with stage 0 breast cancer (total n = 173, mean 6, range 1 to 28) (Baruth 2013; Basen‐Enquist 2006; Cadmus 2009; Dolan 2016; Fillion 2008; Irwin 2015; Kiecolt‐Glaser 2014; Littman 2012; Loudon 2014; Pinto 2003; Pinto 2005; Pinto 2015; Rogers 2014; Rogers 2015; Schmitz 2005; Schmitz 2009; Short 2014; Winters‐Stone 2011), all 40 trials reported numbers of participants with stage I‐II breast cancer (n = 1334, mean 33, range 5 to 194, and n = 753, mean 32, range 3 to 161, respectively), and 34 trials reported numbers of patients with stage III breast cancer (n = 413, mean 12, range 1 to 69) (Baruth 2013; Basen‐Enquist 2006; Cadmus 2009; Cantarero‐Villanueva 2013; Cerulli 2014; Cormie 2014; Courneya 2003; DeNysschen 2011; Do 2015; Dolan 2016; Fillion 2008; Guinan 2013; Hatchett 2013; Irwin 2015; Kiecolt‐Glaser 2014; Ligibel 2008; Littman 2012; Loudon 2014; Matthews 2007; Mehnert 2011; Milne 2008; Murtezani 2014; Musanti 2012; Peppone 2015; Pinto 2015; Portela 2008; Rogers 2009; Rogers 2013; Rogers 2015; Schmitz 2005; Schmitz 2009; Short 2014; Vallance 2007; Winters‐Stone 2011). Kim 2015 reported the numbers of participants with stage 0‐I (n = 19) and stage II‐III (n = 28) breast cancer. Five trials included a small number of patients with metastatic breast cancer (Banasik 2011; Basen‐Enquist 2006; Hatchett 2013; Portela 2008; Short 2014).
Twenty‐four (38%) trials reported participants’ average time since cancer diagnosis (range 3.5 to 62.5 months) (Basen‐Enquist 2006; Cadmus 2009; Carson 2009; Dolan 2016; Ergun 2013; Fillion 2008; Guinan 2013; Irwin 2015; Kiecolt‐Glaser 2014; Kim 2015; Ligibel 2008; Littman 2012; Matthews 2007; Pinto 2003; Pinto 2005; Pinto 2015; Rogers 2013; Rogers 2015; Schmitz 2005; Schmitz 2009; Segar 1998; Vallance 2007; Waltman 2010; Winters‐Stone 2011). In Hatchett 2013, 60% and 40% of participants were less than 30 months and 30 to 70 months post diagnosis, respectively, and Loh 2014 reported that 14 and 71 participants were within one year and two to five years post diagnosis, respectively. Eighteen (29%) trials reported average time beyond active treatment (range 3 months to 7.1 years) (Baruth 2013; Bower 2011; Cerulli 2014; Cormie 2014; Courneya 2003; Guinan 2013; Herrero 2006; Kaltsatou 2011; Kiecolt‐Glaser 2014; Milne 2008; Naumann 2012; Nieman 1995; Peppone 2015; Pinto 2003; Rogers 2009; Schmitz 2005; Short 2014; Waltman 2010). Other studies reported that all participants were between two weeks and 30 months (Mustian 2004), two months and five years (Portela 2008), six months and four years (Irwin 2015), and 12 and 36 months (Daley 2007) post treatment; within four weeks (post surgery, Rogers 2015), six months (Cuesta‐Vargas 2014; Martin 2013; Nikander 2007), one year (Cadmus 2009; Matthews 2007; Mehnert 2011), 1.5 years (Heim 2007), and two years post treatment (Musanti 2012); or at least four weeks (Saarto 2012), eight weeks (Banasik 2011; Blank 2005; Rogers 2015), three months (Kim 2015; Ligibel 2008; Littman 2012), six months (McKenzie 2003), one year (Winters‐Stone 2011), and two years post treatment (Fillion 2008). Cantarero‐Villanueva 2013 and Duijits 2012 reported that 48.3% and 80% of participants were 12 months and less post treatment, respectively.
Forty‐eight (76%) trials reported the numbers of participants who had received chemotherapy (mean 68%, range 20% to 100%) (Baruth 2013; Basen‐Enquist 2006; Bower 2011; Cadmus 2009; Cantarero‐Villanueva 2013; Carson 2009; Cerulli 2014; Cormie 2014; Courneya 2003; Daley 2007; DeNysschen 2011; Do 2015; Dolan 2016; Duijits 2012; Ergun 2013; Fillion 2008; Guinan 2013; Hatchett 2013; Heim 2007; Herrero 2006; Irwin 2015; Kiecolt‐Glaser 2014; Kim 2015; Ligibel 2008; Loh 2014; Loudon 2014; Malicka 2011; Matthews 2007; Milne 2008; Murtezani 2014; Musanti 2012; Mustian 2004; Naumann 2012; Nikander 2007; Peppone 2015; Pinto 2003; Pinto 2005; Pinto 2015; Rahnama 2010; Rogers 2009; Rogers 2015; Saarto 2012; Schmitz 2005; Schmitz 2009; Short 2014; Vallance 2007; Waltman 2010; Winters‐Stone 2011). Five trials consisted entirely of participants who had received chemotherapy (Cerulli 2014; Ergun 2013; Guinan 2013; Herrero 2006; Rahnama 2010).
Forty‐six (73%) of the 63 trials reported participants’ hormone therapy details (Baruth 2013; Blank 2005; Bower 2011; Cadmus 2009; Cantarero‐Villanueva 2013; Carson 2009; Cerulli 2014; Cormie 2014; Courneya 2003; Daley 2007; Do 2015; Dolan 2016; Duijits 2012; Fillion 2008; Guinan 2013; Hatchett 2013; Heim 2007; Irwin 2015; Kiecolt‐Glaser 2014; Kim 2015; Ligibel 2008; Malicka 2011; Matthews 2007; Milne 2008; Murtezani 2014; Musanti 2012; Mustian 2004; Naumann 2012; Nikander 2007; Payne 2008; Peppone 2015; Pinto 2003; Pinto 2005; Pinto 2015; Rahnama 2010; Rogers 2009; Rogers 2013; Rogers 2014; Rogers 2015; Saarto 2012; Schmitz 2005; Schmitz 2009; Short 2014; Vallance 2007; Waltman 2010; Winters‐Stone 2011). The total number of participants who had received hormone therapy in these 46 trials was 3161 (mean n per study 69, range 9 to 442). Seventeen trials reported use of both selective oestrogen receptor modulators (SORMs) and aromatase inhibitors (AIs) (Cadmus 2009; Cantarero‐Villanueva 2013; Carson 2009; Dolan 2016; Guinan 2013; Kim 2015; Ligibel 2008; Naumann 2012; Rogers 2009; Rogers 2013; Rogers 2014; Rogers 2015; Schmitz 2005; Schmitz 2009; Vallance 2007; Waltman 2010; Winters‐Stone 2011). One study specifically investigated only women receiving AIs (Irwin 2015), and another reported only the number of participants receiving SORMs (Matthews 2007). A total of 690 participants (mean 38, range 5 to 182) had taken SORMs, and a total of 456 had taken AIs (mean 25, range 2 to 121).
The mean average age of participants in the 58 (92%) trials that reported this characteristic was 54 (mean age range 46 to 63) years. Heim 2007 reported the number of participants 30 to 50 years (n = 32) and 51 to 70 years (n = 31), and Blank 2005 reported the age range of participants (range 48 to 69 years). Two studies reported no age data (Hatchett 2013; Taleghani 2012). Twenty‐seven trials (43%) reported the percentage of postmenopausal participants (Cadmus 2009; Cantarero‐Villanueva 2013; Carson 2009; Courneya 2003; DeNysschen 2011; Dolan 2016; Ergun 2013; Fillion 2008; Guinan 2013; Irwin 2015; Kiecolt‐Glaser 2014; Kim 2015; Ligibel 2008; Loh 2014; Matthews 2007; Milne 2008; Payne 2008; Pinto 2003; Rogers 2009; Rogers 2013; Rogers 2014; Rogers 2015; Saarto 2012; Schmitz 2005; Vallance 2007; Waltman 2010; Winters‐Stone 2011). The mean percentage of postmenopausal participants in these trials was 78% (range 0 to 100%). Eleven (18%) trials included exclusively postmenopausal participants (Cadmus 2009; Courneya 2003; Dolan 2016; Ergun 2013; Irwin 2015; Kim 2015; Matthews 2007; Payne 2008; Rogers 2014; Waltman 2010; Winters‐Stone 2011); Bower 2011 consisted of only premenopausal and perimenopausal participants, and Heim 2007 stated the percentage of participants who reported symptoms of menopause (n = 64%), rather than menopausal status.
Thirty trials (48%) reported the ethnicity of participants (Banasik 2011; Baruth 2013; Basen‐Enquist 2006; Bower 2011; Cadmus 2009; Carson 2009; Daley 2007; DeNysschen 2011; Dolan 2016; Guinan 2013; Hatchett 2013; Irwin 2015; Kiecolt‐Glaser 2014; Littman 2012; Loh 2014; Matthews 2007; Musanti 2012; Mustian 2004; Payne 2008; Peppone 2015; Pinto 2005; Pinto 2015; Rogers 2009; Rogers 2013; Rogers 2014; Rogers 2015; Schmitz 2005; Schmitz 2009; Segar 1998; Waltman 2010). Most participants were white (mean % participants = 83%). Black participants were the next largest ethnic group (n studies = 18; mean % participants = 11%). Loh 2014 consisted of Chinese (64%), Malay (25%), and Indian (11%) participants.
Thirty‐two (51%) trials reported the education level of participants (Baruth 2013; Basen‐Enquist 2006; Bower 2011; Cadmus 2009; Cantarero‐Villanueva 2013; Carson 2009; Courneya 2003; Cuesta‐Vargas 2014; Daley 2007; DeNysschen 2011; Do 2015; Duijits 2012; Ergun 2013; Fillion 2008; Hatchett 2013; Irwin 2015; Kiecolt‐Glaser 2014; Kim 2015; Littman 2012; Loh 2014; Mehnert 2011; Murtezani 2014; Mustian 2004; Payne 2008; Pinto 2003; Pinto 2005; Pinto 2015; Schmitz 2005; Schmitz 2009; Segar 1998; Short 2014; Vallance 2007), with an average of 47% (range 22% to 70%) of participants reporting educational attainment of a university degree or higher. In addition, six trials reported the number of years in education (mean 15 years, mean range 14 to 16 years) (Matthews 2007; Rogers 2009; Rogers 2013; Rogers 2014; Rogers 2015; Saarto 2012). Twenty trials (37%) reported the sociodemographic status (i.e. earnings per week, month, or year) of participants (Banasik 2011; Bower 2011; Courneya 2003; DeNysschen 2011; Do 2015; Fillion 2008; Kiecolt‐Glaser 2014; Kim 2015; Littman 2012; Loh 2014; Mustian 2004; Payne 2008; Pinto 2003; Pinto 2005; Rogers 2009; Rogers 2013; Rogers 2014; Rogers 2015; Short 2014; Vallance 2007). Three studies reported the percentage of participants earning > USD 40K (mean 61%, range 50% to 70%) (Mustian 2004; Payne 2008; Pinto 2005), eight studies reported the percentage earning > USD 50K (mean 61%, range 39% to 76%) (Banasik 2011; Kiecolt‐Glaser 2014; Pinto 2003; Pinto 2005; Rogers 2009; Rogers 2013; Rogers 2014; Rogers 2015), three studies reported the percentage earning > USD 60K (mean 46%, range 30% to 65%) (Courneya 2003; Littman 2012; Payne 2008), one study reported that 56% of participants earned > USD 70K (DeNysschen 2011), three studies reported the percentage earning > USD 75K (mean 42%, range 17% to 55%) (Banasik 2011; Bower 2011; Kiecolt‐Glaser 2014), and two studies reported participants earning > USD 80K (mean 28%, range 26% to 29%) (Littman 2012; Vallance 2007). Short 2014 reported that 39% of participants earned > USD 1K per week, and Kim 2015 noted that 42% of participants earned ≥ USD 2K per month. One study reported the percentage of participants at low (8%), medium (81%), and high (11%) income status (no definition of income categories were given) (Do 2015).
Fourteen (22%) trials reported comorbidity data for participants (Cadmus 2009; Daley 2007; Do 2015; Irwin 2015; Kim 2015; Peppone 2015; Rogers 2013; Rogers 2014; Rogers 2015; Saarto 2012; Short 2014; Vallance 2007; Waltman 2010; Winters‐Stone 2011). Five of these 14 studies reported a comorbidity index score (mean 2.2, range 1.8 to 2.7) (Rogers 2009; Rogers 2013; Rogers 2014; Rogers 2015; Winters‐Stone 2011). In three studies all participants had lymphoedema (Cormie 2014; Loudon 2014; McKenzie 2003), and another study included an arm of participants with lymphoedema and an arm at risk of lymphoedema (Schmitz 2009). Kim 2015 consisted entirely of participants with a diagnosis of osteopenia, and Irwin 2015 included participants reporting arthralgia.
Twenty (32%) studies included physical activity‐specific eligibility criteria to recruit only ‘sedentary’, ‘inactive’, or those performing ‘no activity’ or ‘not meeting recommended physical activity guidelines’ (i.e. > 75 minutes of vigorous physical activity and > 150 minutes of moderate physical activity per week) (Baruth 2013; Basen‐Enquist 2006; Cadmus 2009; Cerulli 2014; Ergun 2013; Herrero 2006; Ligibel 2008; Matthews 2007; Milne 2008; Mustian 2004; Naumann 2012; Pinto 2003; Pinto 2005; Pinto 2015; Rahnama 2010; Rogers 2009; Rogers 2013; Schmitz 2005; Segar 1998; Taleghani 2012). Twelve studies reported the mean baseline minutes of total, walking, moderate, or moderate‐to‐vigorous physical activity per week (mean ± SD min/week 108 ± 109 minutes, range 13 to 378 minutes) (Cadmus 2009; Cantarero‐Villanueva 2013; Courneya 2003; Guinan 2013; Irwin 2015; Kiecolt‐Glaser 2014; Pinto 2005; Pinto 2015; Rogers 2009; Rogers 2014; Rogers 2015; Vallance 2007). Six studies expressed baseline physical activity in Met‐h/week‐1 (mean ± SD 19.5 ± 14.1 metabolic equivalent (MET)‐h/week‐1, range 4 to 40 MET‐h/week‐1) (Baruth 2013; Littman 2012; Matthews 2007; Musanti 2012; Saarto 2012; Schmitz 2009). Eleven studies categorised baseline physical activity to report the proportion of participants engaged in given amounts of physical activity (Daley 2007; Do 2015; Dolan 2016; Duijits 2012; Fillion 2008; Hatchett 2013; Heim 2007; Loh 2014; Mehnert 2011; Saarto 2012; Waltman 2010). A single study noted each of the following: participants’ baseline walking steps/d (Nikander 20077), energy expenditure (Winters‐Stone 2011), leisure score and sport physical activity score (Schmitz 2005), and self‐selected levels of fitness (Loudon 2014). Four trials excluded participants who engaged in any/regular prior resistance exercise at the time of enrolment (Kim 2015; Schmitz 2005; Schmitz 2009; Winters‐Stone 2011), two studies excluded participants performing regular yoga practice (Carson 2009; Peppone 2015), and one study recruited only participants with no prior practice or experience in traditional Greek dances (Kaltsatou 2011).
Twenty‐eight trials (44%) reported the mean body mass of participants (Cadmus 2009; Cerulli 2014; Cormie 2014; Courneya 2003; Daley 2007; DeNysschen 2011; Dolan 2016; Duijits 2012; Heim 2007; Herrero 2006; Irwin 2015; Ligibel 2008; Littman 2012; Malicka 2011; Martin 2013; Matthews 2007; McKenzie 2003; Murtezani 2014; Musanti 2012; Naumann 2012; Nieman 1995; Nikander 2007; Pinto 2003; Rahnama 2010; Saarto 2012; Schmitz 2009; Vallance 2007; Winters‐Stone 2011), and 38 (60%) trials reported mean BMI scores of participants (Baruth 2013; Basen‐Enquist 2006; Bower 2011; Cadmus 2009; Cerulli 2014; Cormie 2014; Courneya 2003; Daley 2007; Dolan 2016; Duijits 2012; Ergun 2013; Herrero 2006; Irwin 2015; Kiecolt‐Glaser 2014; Kim 2015; Ligibel 2008; Littman 2012; Loudon 2014; Matthews 2007; McKenzie 2003; Milne 2008; Murtezani 2014; Mustian 2004; Naumann 2012; Nikander 2007; Pinto 2003; Pinto 2005; Portela 2008; Rahnama 2010; Rogers 2009; Rogers 2013; Rogers 2014; Saarto 2012; Schmitz 2009; Short 2014; Vallance 2007; Waltman 2010; Winters‐Stone 2011). Average mean body mass in these trials was 74 kg (SD 4.4 kg, range 65.5 to 84.7 kg), and average mean BMI was 28 kg/m2 (SD 2.1 kg/m2, range 23.4 to 32.1 kg/m2). Two additional trials reported the numbers of participants who fell into particular BMI ranges (Do 2015; Heim 2007).
Intervention characteristics
Intervention length ranged from four weeks to 24 months. Most studies provided interventions lasting eight (Banasik 2011; Blank 2005; Cantarero‐Villanueva 2013; Carson 2009; Cuesta‐Vargas 2014; Daley 2007; Guinan 2013; Herrero 2006; Loh 2014; Loudon 2014; Malicka 2011; Martin 2013; McKenzie 2003; Naumann 2012; Nieman 1995; Taleghani 2012) or 12 weeks (three months) (Baruth 2013; Bower 2011; Cormie 2014; Duijits 2012; Ergun 2013; Hatchett 2013; Kiecolt‐Glaser 2014; Matthews 2007; Milne 2008; Musanti 2012; Mustian 2004; Nikander 2007; Pinto 2003; Pinto 2005; Pinto 2015; Rogers 2009; Rogers 2013; Rogers 2014; Rogers 2015; Short 2014; Vallance 2007). Four (6%) studies conducted year‐long interventions (Irwin 2015; Saarto 2012; Schmitz 2009; Winters‐Stone 2011). Seventeen (27%) trials had a follow‐up period that extended beyond completion of the intervention (Bower 2011; Cantarero‐Villanueva 2013; Carson 2009; Daley 2007; Duijits 2012; Fillion 2008; Guinan 2013; Kiecolt‐Glaser 2014; Loudon 2014; Pinto 2005; Pinto 2015; Rogers 2009; Rogers 2015; Segar 1998; Short 2014; Vallance 2007; Waltman 2010). Follow‐up duration ranged from two weeks in Carson 2009 and Segar 1998 to 12 months in Waltman 2010; the most common follow‐up duration was three months (n = 8; Bower 2011; Duijits 2012; Fillion 2008; Guinan 2013; Kiecolt‐Glaser 2014; Pinto 2015; Rogers 2009; Rogers 2015). Two trials provided follow‐up only to intervention groups (Do 2015; Dolan 2016).
Physical activity modes differed across trials. Only seven (11%) trials included a separate resistance training condition with no form of aerobic activity (i.e. any activity that uses large muscle groups, can be maintained continuously, and is rhythmical in nature) (Cormie 2014; Martin 2013; Musanti 2012; Schmitz 2005; Schmitz 2009; Waltman 2010; Winters‐Stone 2011). Twenty‐one (33%) trials involved an intervention arm that combined aerobic activity and resistance training (Cantarero‐Villanueva 2013; Cuesta‐Vargas 2014; Do 2015; Ergun 2013; Heim 2007; Herrero 2006; Irwin 2015; Kaltsatou 2011; Ligibel 2008; McKenzie 2003; Milne 2008; Musanti 2012; Naumann 2012; Nieman 1995; Pinto 2003; Portela 2008; Rahnama 2010; Rogers 2013; Rogers 2014; Short 2014; Taleghani 2012). Twenty‐eight (44%) trials consisted of an aerobic activity‐only condition (Baruth 2013; Basen‐Enquist 2006; Cadmus 2009; Cerulli 2014; Courneya 2003; Daley 2007; DeNysschen 2011; Dolan 2016; Duijits 2012; Ergun 2013; Fillion 2008; Guinan 2013; Hatchett 2013; Loh 2014; Malicka 2011; Matthews 2007; Mehnert 2011; Murtezani 2014; Musanti 2012; Nikander 2007; Payne 2008; Pinto 2005; Pinto 2015; Rogers 2009; Rogers 2015; Saarto 2012; Segar 1998; Vallance 2007). Eight studies (13%) included a yoga‐only arm (Banasik 2011; Blank 2005; Bower 2011; Carson 2009; Kiecolt‐Glaser 2014; Littman 2012; Loudon 2014; Peppone 2015), and one study provided each of the following intervention arms: pilates only (Martin 2013), tai chi only (Mustian 2004), and qigong (similar to tai chi) only (Loh 2014).
Frequency (number of days per week) of physical activity ranged from two days to seven days per week, with most studies providing physical activity at least three days per week (n = 44; Baruth 2013; Blank 2005; Cadmus 2009; Cantarero‐Villanueva 2013; Carson 2009; Courneya 2003; Cuesta‐Vargas 2014; Daley 2007; DeNysschen 2011; Do 2015; Dolan 2016; Ergun 2013; Fillion 2008; Guinan 2013; Heim 2007; Herrero 2006; Kaltsatou 2011; Littman 2012; Loh 2014; Loudon 2014; Martin 2013; Matthews 2007; McKenzie 2003; Milne 2008; Murtezani 2014; Musanti 2012; Mustian 2004; Naumann 2012; Nieman 1995; Nikander 2007; Payne 2008; Pinto 2003; Pinto 2005; Pinto 2015; Portela 2008; Rahnama 2010; Rogers 2014; Rogers 2015; Saarto 2012; Segar 1998; Short 2014; Taleghani 2012; Vallance 2007; Winters‐Stone 2011). Duration of sessions ranged from 15 minutes to longer than 95 minutes, with a modal duration of 60 minutes (n = 16; Cantarero‐Villanueva 2013; Cerulli 2014; Cormie 2014; Cuesta‐Vargas 2014; Fillion 2008; Kaltsatou 2011; Malicka 2011; Milne 2008; Mustian 2004; Naumann 2012; Nieman 1995; Nikander 2007; Saarto 2012; Schmitz 2005; Taleghani 2012; Winters‐Stone 2011). Five studies gave participants a goal total number of minutes of physical activity to achieve each week (90 minutes/week, Ligibel 2008; 150 minutes/week, Irwin 2015; Rogers 2009; Rogers 2015; 150 to 180 minutes/week, Duijits 2012). The total number of sessions for physical activity interventions ranged between 12 and 260.
Among 48 (76%) trials that consisted of aerobic physical activity, 13 provided walking only (Baruth 2013; Ergun 2013; Fillion 2008; Heim 2007; Matthews 2007; Musanti 2012; Nieman 1995; Payne 2008; Portela 2008; Rahnama 2010; Rogers 2009; Rogers 2014; Rogers 2015), four involved primarily walking (Basen‐Enquist 2006; Cadmus 2009; Irwin 2015; Vallance 2007), one involved Nordic walking (Malicka 2011), and one provided walking with gymnastics (Mehnert 2011). Other aerobic intervention modes involved arm ergometer exercise (McKenzie 2003), cycling only (Courneya 2003; Herrero 2006), deep water running (Cuesta‐Vargas 2014), deep water aquatic exercise (Cantarero‐Villanueva 2013), Greek dance (Kaltsatou 2011), horse riding (Cerulli 2014), line dancing and qigong (Loh 2014), and step aerobics and circuit training (involving steps, hops, and jumps) (Nikander 2007; Saarto 2012). In all other trials, participants performed the prescribed physical activity using a range of modes (e.g. treadmill, rowing ergometer, stair climbing).
Of the 45 studies providing an aerobic activity intervention, 39 reported frequency of aerobic activity ranging from two to seven days per week. In 33 (53%) studies, the number of aerobic activity sessions per week ranged between three and five (Baruth 2013; Cadmus 2009; Cantarero‐Villanueva 2013; Cerulli 2014; Courneya 2003; Cuesta‐Vargas 2014; Daley 2007; DeNysschen 2011; Do 2015; Dolan 2016; Ergun 2013; Fillion 2008; Herrero 2006; Kaltsatou 2011; Kim 2015; Littman 2012; Loh 2014; Matthews 2007; McKenzie 2003; Milne 2008; Murtezani 2014; Musanti 2012; Nieman 1995; Nikander 2007; Payne 2008; Pinto 2003; Pinto 2015; Portela 2008; Rogers 2014; Saarto 2012; Segar 1998; Taleghani 2012; Vallance 2007). Duration of aerobic activity ranged between 10 and 90 minutes. Twenty‐four (38%) trials included aerobic activity sessions with duration of 30 minutes or greater (Baruth 2013; Cadmus 2009; Cantarero‐Villanueva 2013; Cerulli 2014; Daley 2007; DeNysschen 2011; Do 2015; Ergun 2013; Fillion 2008; Heim 2007; Herrero 2006; Ligibel 2008; Loh 2014; Malicka 2011; Mehnert 2011; Nieman 1995; Nikander 2007; Pinto 2003; Pinto 2015; Portela 2008; Rogers 2014; Saarto 2012; Segar 1998; Vallance 2007).
Intensity of aerobic activity varied substantially between trials, as did methods used to measure and monitor intensity. Seventeen (27%) trials set intensity according to percentage of maximum heart rate (%HRmax range 40% to 80%) (Cadmus 2009; Cerulli 2014; Daley 2007; Herrero 2006; Irwin 2015; Kaltsatou 2011; Ligibel 2008; Malicka 2011; Milne 2008; Musanti 2012; Nieman 1995; Pinto 2003; Pinto 2005; Portela 2008; Rahnama 2010; Segar 1998; Taleghani 2012), four (6%) set percentage of target heart rate using the Karvonen method (Karvonen target heart rate range 35% to 80%) (Duijits 2012; Guinan 2013; Murtezani 2014; Rogers 2014), one (2%) study set intensity as heart rate at the intensity of activity that elicits a blood lactate concentration of 2 to 3 mmol, three (5%) studies used percentage of directly measured maximal oxygen uptake (% VO₂max range 45% to 75%) (Courneya 2003; Do 2015; Mehnert 2011), seven (11%) studies used rate of perceived exertion (RPE; range 10 to 16) (Baruth 2013; Daley 2007; DeNysschen 2011; Kim 2015; Matthews 2007; Nikander 2007; Saarto 2012), and 12 (19%) trials reported subjective intensity of the intervention (low to moderate, moderate, or moderate‐to‐vigorous intensity) (Basen‐Enquist 2006; Cantarero‐Villanueva 2013; Dolan 2016; Ergun 2013; Naumann 2012; Payne 2008; Pinto 2015; Rogers 2009; Rogers 2013; Rogers 2015; Short 2014; Vallance 2007). Two (3%) trials did not provide the intensity at which aerobic activity was performed (Fillion 2008; Heim 2007).
Frequency of interventions with resistance training ranged between two and five days, with a modal frequency of three days (n = 14; Ergun 2013; Heim 2007; Herrero 2006; Kaltsatou 2011; Kim 2015; Martin 2013; McKenzie 2003; Milne 2008; Musanti 2012; Naumann 2012; Nieman 1995; Pinto 2003; Taleghani 2012; Winters‐Stone 2011). Cuesta‐Vargas 2014 did not report resistance training frequency. Duration of resistance training sessions ranged between 15 and 90 minutes, with 11 studies reporting duration of 30 to 60 minutes (Cormie 2014; Ergun 2013; Herrero 2006; Ligibel 2008; Martin 2013; Milne 2008; Nieman 1995; Rahnama 2010; Schmitz 2005; Waltman 2010; Winters‐Stone 2011). Eleven (17%) studies did not report the duration of sessions (Heim 2007; Irwin 2015; Kim 2015; McKenzie 2003; Musanti 2012; Pinto 2003; Portela 2008; Rogers 2013; Rogers 2014; Short 2014; Taleghani 2012). The number of resistance exercises ranged between four and 12, with a modal exercise number of nine (n = 6; Do 2015; Heim 2007; Kim 2015; Rahnama 2010; Schmitz 2005; Schmitz 2009). Seventeen (27%) trials provided resistance training exercises for both upper and lower body (Cormie 2014; Do 2015; Ergun 2013; Herrero 2006; Irwin 2015; Kim 2015; Martin 2013; Milne 2008; Musanti 2012; Portela 2008; Rahnama 2010; Rogers 2013; Rogers 2014; Schmitz 2005; Schmitz 2009; Waltman 2010; Winters‐Stone 2011), one targeted the lower body and abdominals (Ligibel 2008), one targeted the upper body and abdominals (Pinto 2003), one described the programme as general strengthening (Cuesta‐Vargas 2014), and four targeted the upper body only (Kaltsatou 2011; McKenzie 2003; Naumann 2012; Taleghani 2012). Remaining studies did not report areas of the body targeted by exercise (Heim 2007; Nieman 1995; Short 2014). One study combined resistance training with jump exercises with added resistance up to 10% of body weight (Winters‐Stone 2011).
Ten (16%) trials used resistance machines (Irwin 2015; Kaltsatou 2011; Ligibel 2008; Portela 2008; Rahnama 2010; Schmitz 2005; Schmitz 2009; Segar 1998; Taleghani 2012; Waltman 2010), eight (13%) used free weights (i.e. dumbbells and barbells) (Cormie 2014; Pinto 2003; Portela 2008; Rahnama 2010; Schmitz 2005; Schmitz 2009; Waltman 2010; Winters‐Stone 2011), and seven (11%) used resistance (Thera) bands (Ergun 2013; Kim 2015; Musanti 2012; Portela 2008; Rogers 2013; Rogers 2014; Winters‐Stone 2011). The number of sets per resistance exercise ranged from one to four (mode 2 sets; Cuesta‐Vargas 2014; Kim 2015; Milne 2008; Nieman 1995; Portela 2008; Rogers 2014; Taleghani 2012; Waltman 2010), and the number of repetitions per set ranged from 6 to 20, with the modal repetition range of 8 to 12 (n = 4; Irwin 2015; Taleghani 2012; Waltman 2010; Winters‐Stone 2011). Intensity of resistance exercises was set according to the percentage of maximum weight a participant could lift in one repetition (%1RM range 65% to 85%) in four (6%) trials (Cormie 2014; Do 2015; Ligibel 2008; Winters‐Stone 2011), with 12 to 15 repetition maximum in one trial (Herrero 2006), and with RPE in three (5%) trials (Martin 2013; Musanti 2012; Portela 2008); participants lifted “as much as they could” in Rahnama 2010, and as much as they could achieve “with good form” in Milne 2008.
Most of the eight yoga studies employed a form of Hatha yoga (n = 6; Hatha: Kiecolt‐Glaser 2014; Peppone 2015; Iyengar: Banasik 2011; Blank 2005; Bower 2011; Viniyoga: Littman 2012); Loudon 2014 included a Satyananda yoga intervention arm, and Carson 2009 a Yoga of Awareness intervention arm. Yoga studies ranged between 4 and 24 weeks in duration, with four studies lasting eight weeks (Banasik 2011; Blank 2005; Carson 2009; Loudon 2014). Frequency of yoga practice ranged between two and seven sessions per week (mode 2 sessions/week; Banasik 2011; Bower 2011; Kiecolt‐Glaser 2014; Peppone 2015), and yoga session duration ranged between 20 and 90 minutes (mode 90 minutes; Banasik 2011; Bower 2011; Kiecolt‐Glaser 2014; Loudon 2014). Investigators in these studies described the intensity of all yoga interventions as moderate, apart from Carson 2009, which referred to gentle intensity, and Peppone 2015, which described light intensity. Light‐to‐moderate‐intensity qigong and tai chi interventions in Loh 2014 and Mustian 2004, respectively, had a duration of 8 weeks and 12 weeks, a frequency of three sessions per week, and session duration of 30 minutes (twice a week at home) or 90 minutes (once a week supervised) and 60 minutes, respectively. Martin 2013 provided the only pilates intervention, which consisted of three 50‐minute sessions per week performed within an RPE intensity range of 9 to 14 for eight weeks.
In 24 (38%) trials, the intervention arm involved a psychobehavioural component designed to promote physical activity behaviour change (Baruth 2013; Basen‐Enquist 2006; Carson 2009; Courneya 2003; Cuesta‐Vargas 2014; Daley 2007; DeNysschen 2011; Duijits 2012; Ergun 2013; Fillion 2008; Hatchett 2013; Matthews 2007; Musanti 2012; Pinto 2005; Pinto 2015; Portela 2008; Rogers 2009; Rogers 2013; Rogers 2014; Rogers 2015; Segar 1998; Short 2014; Vallance 2007; Waltman 2010). Seven studies delivered the psychobehavioural component via group discussions (Basen‐Enquist 2006; Carson 2009; Fillion 2008; Rogers 2009; Rogers 2013; Rogers 2014; Rogers 2015); some trials employed face‐to‐face counselling in a single session at the beginning of the intervention (Baruth 2013; Matthews 2007); others scheduled multiple sessions during the intervention period (Rogers 2009; Rogers 2013; Rogers 2015), mailed or emailed support (Hatchett 2013; Pinto 2005; Short 2014), or provided information booklets promoting physical activity behaviour change (Musanti 2012; Short 2014; Vallance 2007). Two studies applied cognitive‐behavioural theories (Cuesta‐Vargas 2014; Daley 2007), and one study utilised self‐efficacy theory during supervised exercise sessions with participants (Waltman 2010). Segar 1998 included a study arm that applied self‐awarded rewards to serve as reinforcements to induce physical activity behaviour change. Courneya 2003 incorporated into the intervention individual or small group meetings designed to outline goals and provide feedback on participants’ progress. Eleven studies (17%) implemented weekly or fortnightly telephone counselling or monitoring throughout the intervention period (Baruth 2013; DeNysschen 2011; Duijits 2012; Ergun 2013; Fillion 2008; Matthews 2007; Musanti 2012; Pinto 2005; Pinto 2015; Portela 2008; Waltman 2010). The number of telephone counselling sessions ranged between 4 and 26, and their duration ranged from 5 to 15 minutes. Topics covered in the psychobehavioural component included goal setting, barriers to and benefits of physical activity, physical activity adherence monitoring and safety, behaviour reinforcement, and symptom management. Several studies included an educational component at baseline that was deemed not to promote physical activity behaviour change (Heim 2007; Irwin 2015; Mehnert 2011; Schmitz 2009). Two of these studies provided participants with education related to lymphoedema and other cancer‐related topics (Irwin 2015; Schmitz 2009), one study provided education on how to perform specific exercises (Mehnert 2011), and another trial provided an educational programme, physical therapy, group exercise, and psycho‐oncological interventions for both intervention and control groups (Heim 2007).
Interventions in 32 (51%) trials involved a supervised component (Banasik 2011; Bower 2011; Cantarero‐Villanueva 2013; Cerulli 2014; Cormie 2014; Courneya 2003; Cuesta‐Vargas 2014; Daley 2007; Do 2015; Dolan 2016; Ergun 2013; Herrero 2006; Kaltsatou 2011; Kiecolt‐Glaser 2014; Littman 2012; Loudon 2014; Malicka 2011; Martin 2013; McKenzie 2003; Mehnert 2011; Milne 2008; Murtezani 2014; Mustian 2004; Naumann 2012; Nieman 1995; Peppone 2015; Portela 2008; Rahnama 2010; Schmitz 2005; Schmitz 2009; Segar 1998; Taleghani 2012); 16 (25%) trials included a home‐based physical activity component (Baruth 2013; Basen‐Enquist 2006; DeNysschen 2011; Duijits 2012; Ergun 2013; Hatchett 2013; Heim 2007; Kim 2015; Matthews 2007; Musanti 2012; Payne 2008; Pinto 2005; Pinto 2015; Portela 2008; Short 2014; Vallance 2007), and 17 (27%) studies provided an intervention that included both supervised and home‐based physical activity (Blank 2005; Cadmus 2009; Carson 2009; Fillion 2008; Guinan 2013; Irwin 2015; Ligibel 2008; Loh 2014; Nikander 2007; Pinto 2003; Rogers 2009; Rogers 2013; Rogers 2014; Rogers 2015; Saarto 2012; Waltman 2010; Winters‐Stone 2011). With regards to the format of physical activity interventions, 27 (43%) studies consisted of an individual physical activity format (Baruth 2013; Basen‐Enquist 2006; Cerulli 2014; Courneya 2003; Daley 2007; DeNysschen 2011; Duijits 2012; Ergun 2013; Hatchett 2013; Heim 2007; Kim 2015; Matthews 2007; McKenzie 2003; Musanti 2012; Naumann 2012; Payne 2008; Pinto 2003; Pinto 2005; Pinto 2015; Portela 2008; Rogers 2013; Rogers 2014; Schmitz 2005; Short 2014; Taleghani 2012; Vallance 2007; Waltman 2010), 15 (24%) studies incorporated a group physical activity format (Banasik 2011; Bower 2011; Cantarero‐Villanueva 2013; Cormie 2014; Cuesta‐Vargas 2014; Fillion 2008; Herrero 2006; Kaltsatou 2011; Malicka 2011; Mehnert 2011; Milne 2008; Murtezani 2014; Mustian 2004; Peppone 2015; Schmitz 2009), and 14 (25%) studies used a combination of group and individual physical activity interventions (Blank 2005; Cadmus 2009; Carson 2009; Guinan 2013; Irwin 2015; Kiecolt‐Glaser 2014; Ligibel 2008; Littman 2012; Loh 2014; Loudon 2014; Nikander 2007; Rogers 2009; Saarto 2012; Winters‐Stone 2011). The format employed in the intervention was unclear in seven studies (Do 2015; Dolan 2016; Martin 2013; Nieman 1995; Rahnama 2010; Rogers 2015; Segar 1998).
Most trials enlisted the services of doctorate students, exercise physiologists, exercise/sports trainers/specialists, fitness/exercise instructors, health counsellors, kinesiologists, physical and sports therapists, physiotherapists, nurses, yoga instructors, or other professionals to lead the exercise programme (n = 46, 73%; Banasik 2011; Blank 2005; Bower 2011; Cadmus 2009; Cantarero‐Villanueva 2013; Carson 2009; Cerulli 2014; Cormie 2014; Courneya 2003; Cuesta‐Vargas 2014; Daley 2007; DeNysschen 2011; Do 2015; Duijits 2012; Ergun 2013; Fillion 2008; Hatchett 2013; Heim 2007; Herrero 2006; Irwin 2015; Kaltsatou 2011; Kiecolt‐Glaser 2014; Kim 2015; Ligibel 2008; Littman 2012; Loh 2014; Loudon 2014; Matthews 2007; Mehnert 2011; Milne 2008; Mustian 2004; Naumann 2012; Peppone 2015; Pinto 2003; Portela 2008; Rogers 2009; Rogers 2013; Rogers 2014; Rogers 2015; Saarto 2012; Schmitz 2005; Schmitz 2009; Short 2014; Taleghani 2012; Waltman 2010; Winters‐Stone 2011). Pinto 2015 trained breast cancer survivors to deliver the physical activity intervention; Baruth 2013 utilised doctorate students, Martin 2013 used sport and exercise science students, and Musanti 2012,Payne 2008, and Segar 1998 used research staff.
Most trials (n = 30; 48%) described the comparison arm as “usual” or “standard” care, “no intervention”, “sedentary control”, or “control”, and 24 (38%) studies included a comparison arm that was a "waiting list" or “delayed exercise” control, wherein participants were offered a portion of or the full exercise programme at completion of the trial (Blank 2005; Cadmus 2009; Carson 2009; Cormie 2014; Courneya 2003; Cuesta‐Vargas 2014; Do 2015; Dolan 2016; Duijits 2012; Hatchett 2013; Kiecolt‐Glaser 2014; Ligibel 2008; Littman 2012; Loh 2014; Loudon 2014; Matthews 2007; Milne 2008; Peppone 2015; Pinto 2003; Pinto 2005; Rogers 2009; Rogers 2013; Schmitz 2005; Schmitz 2009). Baruth 2013 offered counselling to the usual care group at the end of the intervention period. In eight (13%) trials, the comparison group received an intervention that included health education (Bower 2011); phone calls (DeNysschen 2011); an educational programme, physical therapy, group discussion exercises, and psycho‐oncological interventions (Heim 2007); psychosocial support therapy (Mustian 2004); light‐intensity body conditioning/stretching exercises (e.g. flexibility, passive stretching) (Daley 2007; Musanti 2012; Winters‐Stone 2011); and an attention control (Milne 2008; Pinto 2005).
Trial attrition and adherence
Fifty‐five (87%) of the included trials reported attrition data. Nine trials (16%) reported no dropouts at postintervention follow‐up in both intervention and control groups (Cerulli 2014; Cuesta‐Vargas 2014; DeNysschen 2011; Ergun 2013; Malicka 2011; Martin 2013; Milne 2008; Nikander 2007; Segar 1998), and four additional trials (7%) reported no dropouts in the control group only (Baruth 2013; Mehnert 2011; Pinto 2005; Portela 2008). Twelve trials (22%) ‐ Basen‐Enquist 2006; Carson 2009; Do 2015; Herrero 2006; Ligibel 2008; Loh 2014; Loudon 2014; Mustian 2004; Nieman 1995; Pinto 2003; Portela 2008; Rogers 2013 ‐ and eight trials (15%) ‐ Do 2015; Guinan 2013; Herrero 2006; Loh 2014; Mustian 2004; Nieman 1995; Pinto 2003; Rogers 2013 ‐ reported attrition of at least 20% in the intervention and control groups, respectively. Most trials that included a postintervention follow‐up period reported greater attrition at least three months post intervention than immediately post intervention.
Fifty‐two trials (83%) reported adherence data in several different ways, including average, median, range, number, or percentage of participants completing all or a certain percentage or number of sessions, numbers meeting physical activity guidelines, and minutes of physical activity achieved per week. Furthermore, some trials provided adherence data for completers only. Among trials that reported the percentage of completed aerobic exercise and resistance training sessions, average adherence was 79% (range 36% to 163% of targeted session) and 75% (range 26% to 98%), respectively. Most trials that included postintervention follow‐up adherence data showed considerable reductions, for example, one trial reported that only 50% of intervention participants met the recommended physical activity guideline of 150 minutes of moderate‐to‐vigorous physical activity per week (Vallance 2007), and another trial observed a decrease in moderate‐to‐vigorous physical activity from 130 minutes per week at the end of intervention to 98 minutes three months later (Pinto 2015).
Outcome measures
Health‐related quality of life outcomes
Investigators performed HRQoL assessment using the Cancer Rehabilitation Evaluation System Short Form (CARES‐SF) (Schmitz 2005), the European Organization for Research and Treatment of Cancer (EORTC) Quality of Life Questionnaire‐C30 (QLQ‐C30) (Do 2015; Duijits 2012; Ergun 2013; Herrero 2006; Mehnert 2011; Saarto 2012), Functional Assessment of Cancer Therapy (FACT) ‐ Fatigue (FACT‐F) (Mustian 2004), EuroQol‐five dimensions (EQ‐5D) and EQ Visual Analogue Scale (Cuesta‐Vargas 2014), Functional Assessment of Cancer Therapy ‐ General (FACT‐G) (Cadmus 2009; Cerulli 2014; Courneya 2003; Daley 2007; Heim 2007; Littman 2012; Loh 2014; Milne 2008; Murtezani 2014; Rogers 2009; Rogers 2015; Vallance 2007), Functional Assessment of Cancer Therapy‐Breast (FACT‐B) (Courneya 2003; Daley 2007; Heim 2007; Littman 2012; Loh 2014; Milne 2008; Murtezani 2014; Naumann 2012; Pinto 2015; Portela 2008; Rogers 2009; Rogers 2015; Short 2014; Vallance 2007), International Breast Cancer Study Group (IBCSG) Quality of Life Core Questionnaire (Baruth 2013), Lymphoedema Quality of Life Tool (LYMQOL) (Loudon 2014), Medical Outcomes Study Short Form‐12 (MOS SF‐12) (Cuesta‐Vargas 2014; Fillion 2008), Medical Outcomes Study Short Form‐36 (MOS SF‐36) (Baruth 2013; Basen‐Enquist 2006; Cadmus 2009; Cormie 2014; Duijits 2012; Kiecolt‐Glaser 2014; McKenzie 2003; Mehnert 2011; Mustian 2004; Pinto 2015; Schmitz 2009; Winters‐Stone 2011), National Medical Center and Beckman Research Institute Standard Instrument of Quality of Life Breast Cancer Survivors (Taleghani 2012), and Perceived General Health (Rogers 2009). We have provided in Table 3 details of HRQoL subscales (cognitive function, emotional function/metal health, general health perspective, perceived physical function, role function, sexual function, sleep, social function) and other psychological outcomes (anxiety, depression, fatigue and vitality, pain/disability, and self‐esteem/body image) as provided in eligible studies.
1. HRQoL subscales and HRQoL‐related instruments used by investigators.
| QoL domain and instrument name | Direction of response | Trials using this scale |
| Cognitive function | ||
| Cognitive problems ‐ Breast Cancer Prevention Trial (BCPT) Symptom Checklist | Higher score indicates worse status. | Kiecolt‐Glaser 2014 |
| Cognitive function ‐ European Organization for Research and Treatment of Cancer Quality of Life Questionnaire‐C30 (EORTC QLQ‐C30) | Higher score indicates better status. |
Herrero 2006; Mehnert 2011; Saarto 2012 |
| Cognitive function ‐ Functional Assessment of Cancer Therapy‐Cognitive (FACT‐C) | Higher score indicates worse status. |
Rogers 2009 |
| Confusion ‐ Profile of Mood States (POMS) | Higher score indicates worse status. | Cantarero‐Villanueva 2013; Pinto 2003 |
| Emotional function/mental health | ||
| Psychosocial global score ‐ Cancer Rehabilitation Evaluation System Short Form (CARES‐SF) | Higher score indicates worse status. |
Schmitz 2005 |
| Emotional function ‐ EORTC QLQ‐C30 | Higher score indicates better status. | Do 2015; Herrero 2006; Mehnert 2011; Saarto 2012 |
| Emotional well‐being ‐ FACT‐General (FACT‐G) | Higher score indicates better status. | Banasik 2011; Cadmus 2009; Courneya 2003; Daley 2007; Littman 2012; Loh 2014; Milne 2008; Murtezani 2014; Naumann 2012; Rogers 2009; Rogers 2015; Vallance 2007 |
| Emotions ‐ Lymphedema Quality of Life Tool (LYMQOL) | Higher score indicates worse status. |
Loudon 2014 |
| Mental composite ‐ Medical Outcomes Study Short Form‐12 (MOS SF‐12) and MOS SF‐36 | Higher score indicates better status. | SF‐12: Cuesta‐Vargas 2014; Fillion 2008 SF‐36: (Cormie 2014; Kiecolt‐Glaser 2014; Pinto 2015; Schmitz 2009 |
| Mental health ‐ MOS SF‐12 | Higher score indicates better status. | Baruth 2013; Basen‐Enquist 2006; Cadmus 2009; Cormie 2014; Duijits 2012; Kiecolt‐Glaser 2014; McKenzie 2003; Mehnert 2011; Pinto 2015 |
| Role emotion ‐ MOS SF‐36 | Higher score indicates better status. | Baruth 2013; Basen‐Enquist 2006; Cadmus 2009; Cormie 2014; Duijits 2012; Kiecolt‐Glaser 2014; McKenzie 2003; Mehnert 2011 |
| Positive and Negative Affect Scale (PANAS) | Higher score indicates better status. | Pinto 2003 |
| Total mood disturbance score ‐ POMS | Higher score indicates worse status. | Cantarero‐Villanueva 2013; Pinto 2003; Pinto 2005 |
| Anxiety and depression ‐ POMS | Higher score indicates worse status. | Fillion 2008 |
| Anger ‐ POMS | Higher score indicates worse status. | Cantarero‐Villanueva 2013; Pinto 2003 |
| General health perspective | ||
| Global health ‐ EORTC QLQ‐C30 | Higher score indicates better status. | Do 2015; Ergun 2013; Herrero 2006; Mehnert 2011; Saarto 2012 |
| Current health ‐ International Breast Cancer Study Group (IBCSG) | Higher score indicates better status. | Baruth 2013 |
| General health ‐ MOS SF‐36 | Higher score indicates better status. | Baruth 2013; Basen‐Enquist 2006; Cadmus 2009; Cormie 2014; Duijits 2012; Kiecolt‐Glaser 2014; McKenzie 2003; Mehnert 2011; Mustian 2004 |
| Single question on perceived general health | Higher score indicates better status. | Rogers 2009 |
| Perceived physical function | ||
| Physical condition ‐ Body Esteem Scale (BES) | Higher score indicates better status. | Pinto 2003; Pinto 2005 |
| Physical strength ‐ Body Image and Relationships Scale (BIRS) | Higher score indicates worse status. | Schmitz 2009 |
| Physical global ‐ CARES‐SF | Higher score indicates worse status. | Schmitz 2005 |
| Physical function ‐ EORTC QLQ‐C30 | Higher score indicates better status. | Do 2015; Herrero 2006; Mehnert 2011; Saarto 2012 |
| Physical well‐being ‐ FACT‐G | Higher score indicates better status. | Banasik 2011; Cadmus 2009; Courneya 2003; Daley 2007; Littman 2012; Loh 2014; Milne 2008; Murtezani 2014; Naumann 2012; Rogers 2009; Rogers 2015; Vallance 2007 |
| Physical well‐being ‐ IBCSG | Higher score indicates better status. | Baruth 2013 |
| Physical function ‐ MOS SF‐12 | Higher score indicates better status. | Cuesta‐Vargas 2014; Fillion 2008 |
| Physical function composite score ‐ MOS SF‐36 | Higher score indicates better status. | Baruth 2013; Cormie 2014; Duijits 2012; McKenzie 2003; Mehnert 2011; Mustian 2004; Schmitz 2009; Winters‐Stone 2011 |
| Role function | ||
| Marital global score ‐ CARES‐SF | Higher score indicates worse status. |
Schmitz 2005 |
| Role function ‐ EORTC QLQ‐C30 | Higher score indicates better status. | Do 2015; Herrero 2006; Mehnert 2011; Saarto 2012 |
| Functional well‐being ‐ FACT‐G | Higher score indicates better status. | Banasik 2011; Cadmus 2009; Courneya 2003; Daley 2007; Littman 2012; Loh 2014; Milne 2008; Murtezani 2014; Naumann 2012; Rogers 2009; Rogers 2015; Vallance 2007 |
| Function ‐ LYMQOL | Higher score indicates worse status. |
Loudon 2014 |
| Physical role function ‐ MOS SF‐36 | Higher score indicates better status. | Baruth 2013; Basen‐Enquist 2006; Cadmus 2009; Cormie 2014; Duijits 2012; Kiecolt‐Glaser 2014; McKenzie 2003; Mehnert 2011; Mustian 2004 |
| Sexuality | ||
| Sexual attractiveness ‐ BES | Higher score indicates better status. |
Pinto 2003; Pinto 2005 |
| Appearance and sexuality ‐ BIRS | Higher score indicates worse status. |
Schmitz 2009 |
| Sexual function and sexual enjoyment ‐ EORTC QLQ‐C30 | Higher score indicates better status. |
Saarto 2012 |
| Sexual global ‐ CARES‐SF | Higher score indicates worse status. |
Schmitz 2005 |
| Sexual functioning ‐ Sexual Activity Questionnaire | Higher score indicates better status. |
Duijits 2012 |
| Sleep | ||
| Pittsburgh Sleep Quality Index (PSI) | Higher score indicates worse status. |
Bower 2011; Carson 2009; Kiecolt‐Glaser 2014; Payne 2008; Rogers 2009; Rogers 2013; Rogers 2014 |
| Sleep disturbance (0 to 9 scale) | Higher score indicates higher disturbance. |
Carson 2009 |
| Sleep objectively via accelerometers | Higher sleep time and efficiency indicate better status. | Rogers 2013; Rogers 2014 |
| Social function | ||
| Social functioning ‐ BIRS | Higher score indicates worse status. |
Schmitz 2009 |
| Body Image Questionnaire (BIQ) | Higher score indicates worse status. |
Mehnert 2011 |
| Social function ‐ EORTC QLQ‐C30 | Higher score indicates better status. | Herrero 2006; Mehnert 2011; Saarto 2012 |
| Social well‐being ‐ FACT‐G | Higher score indicates better status. | Banasik 2011; Cadmus 2009; Courneya 2003; Daley 2007; Littman 2012; Loh 2014; Milne 2008; Murtezani 2014; Naumann 2012; Rogers 2009; Rogers 2015; Vallance 2007 |
| Social support ‐ IBCSG | Higher score indicates better status. | Baruth 2013 |
| Social functioning ‐ MOS SF‐36 | Higher score indicates better status. | Baruth 2013; Basen‐Enquist 2006; Cadmus 2009; Cormie 2014; Duijits 2012; Kiecolt‐Glaser 2014; McKenzie 2003; Mehnert 2011; Mustian 2004 |
| Social Barriers Scale | Higher score indicates better status. |
Mehnert 2011 |
| Other psychological outcomes | ||
| Anxiety | ||
| Depression and Anxiety Stress Scale‐21 (DASS‐21) | Higher score indicates worse status. |
Loh 2014 |
| Hospital Anxiety and Depression scale (HADS) | Higher score indicates worse status. |
Duijits 2012; Heim 2007; Mehnert 2011; Musanti 2012 |
| Tension‐anxiety ‐ POMS | Higher score indicates worse status. |
Cantarero‐Villanueva 2013; Fillion 2008; Pinto 2003 |
| Anxiety ‐ Patient Reported Outcomes Measurement Information System (PROMIS) | Higher score indicates worse status. |
Rogers 2014 |
| Social Physique Anxiety Scale‐7 (SPAS‐7) | Higher score indicates worse status. |
Milne 2008 |
| State‐Trait Anxiety Index (STAI) | Higher score indicates worse status. |
Cadmus 2009; Segar 1998 |
| Cohen’s 10‐item perceived stress scale | Higher score indicates worse status. |
Bower 2011; Cadmus 2009 |
| Symptoms of Stress Inventory (SOSI) | Higher score indicates worse status. |
Mehnert 2011 |
| Depression | ||
| Beck Depression Inventory (BDI) | Higher score indicates worse status. |
Bower 2011; Daley 2007; Ergun 2013; Kaltsatou 2011; Naumann 2012; Saarto 2012; Segar 1998 |
| Centres for Epidemiological Studies Depression scale (CES‐D) | Higher score indicates worse status. |
Cadmus 2009; Kiecolt‐Glaser 2014; Payne 2008; Schmitz 2005 |
| DASS‐21 | Higher score indicates worse status. |
Loh 2014 |
| HADS | Higher score indicates worse status. |
Duijits 2012; Heim 2007; Mehnert 2011; Musanti 2012 |
| Depression subscale ‐ POMS | Higher score indicates worse status. |
Cantarero‐Villanueva 2013; Fillion 2008; Pinto 2003 |
| Depression ‐ PROMIS | Higher score indicates worse status. |
Rogers 2014 |
| Fatigue | ||
| Brief Fatigue Inventory | Higher score indicates worse status. |
Ergun 2013 |
| Fatigue subscale ‐ FACT‐F | Higher score indicates better status. |
Baruth 2013; Courneya 2003; Littman 2012; Loh 2014; Peppone 2015; Rogers 2009; Saarto 2012; Short 2014; Vallance 2007 |
| Likert scale responses to fatigue‐related items (0 to 4) | Higher score indicates worse status. |
Banasik 2011 |
| Linear visual analogue scale (VAS) for fatigue (0 to 10) | Higher score indicates worse status. |
Loudon 2014; Pinto 2005 |
| Multidimensional Fatigue Symptom Inventory (MFSI) | Higher score indicates worse status. |
Bower 2011; Fillion 2008; Heim 2007; Peppone 2015; Rogers 2013; Rogers 2014 |
| Fatigue subscale ‐ POMS | Higher score indicates worse status. |
Cantarero‐Villanueva 2013; Pinto 2003 |
| Fatigue ‐ PROMIS | Higher score indicates worse status. |
Rogers 2014 |
| Revised Piper Fatigue Scale (PFS) | Higher score indicates worse status. |
Cantarero‐Villanueva 2013; Cuesta‐Vargas 2014; Daley 2007; Musanti 2012; Naumann 2012; Payne 2008 |
| Schwartz Cancer Fatigue Scale (SCFS) | Higher score indicates worse status. |
Milne 2008; Winters‐Stone 2011 |
| Fatigue 0 to 9 scale | Higher score indicates worse status. |
Carson 2009 |
| Happiness/satisfaction with life | ||
| 2‐Item Fordyce Happiness Measure | Higher score indicates better status. |
Cadmus 2009 |
| Happiness measure | Higher score indicates better status. |
Courneya 2003 |
| Life Satisfaction Inventory (LSI) | Higher score indicates better status. |
Kaltsatou 2011 |
| Satisfaction With Life Scale (SWLS) | Higher score indicates better status. |
Daley 2007 |
| Pain/disability | ||
| Brief Pain Inventory (BPI) | Higher score indicates worse status. |
Cormie 2014; Fillion 2008; Irwin 2015 |
| Disabilities of the Arm, Shoulder, and Hand (DASH) | Higher score indicates worse status. |
Cormie 2014; Irwin 2015; Portela 2008 |
| Pain subscale ‐ EORTC QLQ‐C30 | Higher score indicates worse status. |
Do 2015; Mehnert 2011 |
| Pain scale ‐ MOS SF‐36 | Higher score indicates better status. |
Baruth 2013; Basen‐Enquist 2006; Cadmus 2009; Cormie 2014; Duijits 2012; Mehnert 2011; Mustian 2004 |
| University of Rochester Cancer Center Symptom Inventory (URCC SI) | Higher score indicates worse status. |
Peppone 2015 |
| Pain VAS 0 to 10 | Higher score indicates worse status. |
Loudon 2014 |
| 5‐Point Likert scale version of 24‐item Western Ontario and McMaster Universities Osteoarthritis Index (WOMAC) | Higher score indicates worse status. |
Irwin 2015; Rogers 2009 |
| Pain 0 to 9 scale | Higher score indicates worse status. |
Carson 2009 |
| Self‐esteem | ||
| BES | Higher score indicates better status. |
Pinto 2003; Pinto 2005 |
| Body Image Questionnaire (BIQ) | Higher score indicates worse status. |
Mehnert 2011 |
| Body Image and Relationships Scale (BIRS) | Higher score indicates worse status. |
Schmitz 2009 |
| Body image ‐ EORTC QLQ‐Breast‐Related 23 | Higher score indicates better status. |
Do 2015; Duijits 2012; Saarto 2012 |
| Physical Self‐Perception Profile | Higher score indicates better status. |
Daley 2007; Musanti 2012 |
| Rosenberg Self‐Esteem Scale (RSE) | Higher score indicates better status. |
Cadmus 2009; Courneya 2003; Musanti 2012; Mustian 2004; Segar 1998 |
| Social Physique Anxiety Scale 7 (SPAS‐7) | Higher score indicates worse status. |
Milne 2008 |
| Vitality/vigour | ||
| Vitality scale ‐ MOS SF‐36 | Higher score indicates better status. |
Baruth 2013; Basen‐Enquist 2006; Cadmus 2009; Cormie 2014; Duijits 2012; Kiecolt‐Glaser 2014; Mehnert 2011; Mustian 2004 |
| Vigour subscale ‐ POMS | Higher score indicates better status. |
Cantarero‐Villanueva 2013; Fillion 2008; Pinto 2003; Pinto 2005 |
| Other psychological measures | ||
| Basic Psychological Needs Satisfaction Scale (BNS) | Higher score indicates better status. |
Milne 2008 |
| Behavioral Regulation for Exercise Questionnaire 2 (BREQ‐2) | Higher score indicates higher status of each subscale. | Milne 2008 |
| Endocrine symptoms ‐ FACT‐Endocrine symptoms | Higher score indicates worse status. |
Duijits 2012; Rogers 2009 |
| Exercise role identity ‐ 9‐item, 5‐point Likert‐type instrument (Anderson and Cychosz) | Higher score indicates greater exercise role identity. |
Hatchett 2013 |
| Exercise self‐efficacy ‐ 14‐item Steinhardt and Dishman Questionnaire | Higher score indicates better status. |
Hatchett 2013 |
| Hot flashes and night sweats ‐ Hot Flush Rating Scale | Higher score indicates worse status. |
Duijits 2012; |
| Outcome expectancy value ‐ 19‐item Steinhardt and Dishman Self‐Report Questionnaire | Higher score indicates higher outcome expectancy. |
Hatchett 2013 |
| Menopausal symptoms 0 to 9 scale | Higher score indicates worse status. |
Carson 2009 |
| Menopausal symptoms ‐ Women’s Health Questionnaire (WHQ) | Higher score indicates worse status. |
Saarto 2012 |
| Self‐regulation ‐ 20‐item, 5‐point Likert‐type instrument | Higher score indicates better status. |
Hatchett 2013 |
| Symptom Checklist‐90 Revised (SCL‐90R) | Higher score indicates worse status. |
DeNysschen 2011; Mehnert 2011 |
| Urinary symptoms ‐ Bristol Female Lower Urinary Tract Symptoms Questionnaire (BFLUTS) | Higher score indicates worse status. |
Duijits 2012 |
Cardiorespiratory fitness outcomes
Investigators assessed cardiorespiratory fitness using maximal or submaximal tests for direct or indirect measurement of VO₂max/peak or by assessing the distance walked for a given time period. Six (10%) trials directly measured VO₂max/peak using a maximal exercise test (Courneya 2003; DeNysschen 2011; Dolan 2016; Herrero 2006; Irwin 2015; Mehnert 2011). Twelve (19%) studies assessed VO₂max indirectly either maximally or submaximally (Cerulli 2014; Daley 2007; Do 2015; Fillion 2008; Milne 2008; Musanti 2012; Naumann 2012; Rahnama 2010; Rogers 2009; Rogers 2013; Rogers 2014; Rogers 2015). Eleven (17%) studies assessed cardiorespiratory fitness using a field test (Basen‐Enquist 2006; Heim 2007; Kaltsatou 2011; Kim 2015; Murtezani 2014; Mustian 2004; Nieman 1995; Nikander 2007; Pinto 2005; Portela 2008; Saarto 2012). Details of these cardiorespiratory outcomes are provided in Table 4. One trial assessed only the intervention group via a peak graded exercise stress test on a cycle ergometer (Pinto 2003). Other cardiovascular measures assessed in studies included resting heart rate (Courneya 2003; Dolan 2016; Rahnama 2010), resting systolic blood pressure (Cadmus 2009; Courneya 2003; Guinan 2013; Kaltsatou 2011; Rahnama 2010), resting diastolic blood pressure (Cadmus 2009; Courneya 2003; Guinan 2013; Rahnama 2010), and heart rate reserve (Courneya 2003).
2. Physical fitness, physical activity, and body composition measurement instruments used by investigators.
| Instrument or test name | Outcome | Measurement units | Trials using this instrument or test |
| 12‐Minute walk test | Cardiorespiratory fitness | Distance covered in metres | Murtezani 2014; Portela 2008 |
| 2‐Kilometre walking test | Cardiorespiratory fitness | Time to complete in minutes | Nikander 2007; Saarto 2012 |
| 6‐Minute walk test | Cardiorespiratory fitness | Distance covered in metres | Basen‐Enquist 2006; Kaltsatou 2011; Kim 2015; Mustian 2004; Nieman 1995 |
| Aerobic Power Index cycle test | Cardiorespiratory fitness | Relative power output in W/kg | Milne 2008 |
| Astrand‐Rhyming cycle test | Cardiorespiratory fitness | Estimated maximal oxygen uptake (VO₂max) in mL/kg/min | Cerulli 2014 |
| Ebbeling 8‐minute single‐stage walking treadmill test | Cardiorespiratory fitness | Distance covered in metres | Daley 2007; Fillion 2008 |
| Graded exercise treadmill test | Cardiorespiratory fitness | Direct VO₂max in mL/kg/min | DeNysschen 2011; Dolan 2016; Irwin 2015 |
| Graded exercise cycle ergometer test | Cardiorespiratory fitness | Direct VO₂max in mL/kg/min | Courneya 2003; Herrero 2006; Mehnert 2011 |
| Harvard step test | Cardiorespiratory fitness | Heart rate in beats per minute (bpm) post test | Heim 2007 |
| Modified Bruce protocol | Cardiorespiratory fitness | Estimated VO₂max in mL/kg/min | Musanti 2012; Naumann 2012; Rahnama 2010 |
| Naughton submaximal treadmill test | Cardiorespiratory fitness | Estimated VO₂max in mL/kg/min | Do 2015; Rogers 2009; Rogers 2013; Rogers 2014; Rogers 2015 |
| Rockport 1‐mile walk test | Cardiorespiratory fitness | Time to complete in minutes | Pinto 2005 |
| 7‐Day Physical Activity Recall (PAR) | Self‐reported physical activity | Minutes/week | Basen‐Enquist 2006; Cadmus 2009; Hatchett 2013; Pinto 2005; Pinto 2015 |
| Community Health Activities Model Programme for Seniors (CHAMPS) | Self‐reported physical activity | Metabolic equivalent (MET)‐h/week | Baruth 2013; Kiecolt‐Glaser 2014; Matthews 2007; Winters‐Stone 2011 |
| International Physical Activity Questionnaire (IPAQ) | Self‐reported physical activity | MET‐h/week | Schmitz 2009 |
| Physical activity questionnaire | Self‐reported physical activity | Minutes/week | Irwin 2015; Kriska 1990 |
| Leisure Score Index (LSI) of Godin Leisure‐Time Exercise Questionnaire | Self‐reported physical activity | Minutes/week | Courneya 2003; Guinan 2013; Kim 2015; Rogers 2009; Rogers 2015; Short 2014; Vallance 2007 |
| Modifiable Activity Questionnaire | Self‐reported physical activity | MET‐h/week | Littman 2012 |
| Physical Activity Recall Questionnaire | Self‐reported physical activity | MET‐h/week | Saarto 2012 |
| Accelerometer | Objective physical activity | Counts per minute/d | Guinan 2013; Matthews 2007; Pinto 2005; Pinto 2015; Rogers 2009; Rogers 2013; Rogers 2014; Rogers 2015 |
| Pedometer | Objective physical activity | Steps/d | Cadmus 2009; Nikander 2007; Short 2014; Vallance 2007 |
| Body fat via bioelectrical impedance analysis (BIA) | Body composition | % and/or kg | Cerulli 2014; Daley 2007; Guinan 2013; Ligibel 2008; Matthews 2007; Musanti 2012; Mustian 2004; Rogers 2013; Rogers 2014 |
| Body fat and lean mass via dual‐energy X‐ray absorptiometry (DEXA) | Body composition | % and/or kg | Cadmus 2009; DeNysschen 2011; Matthews 2007; Rogers 2009; Saarto 2012; Schmitz 2005; Schmitz 2009; Winters‐Stone 2011 |
| Body fat and muscle mass via multi‐slice magnetic resonance imaging (MRI) | Body composition | % and kg | Herrero 2006 |
| Body mass index (BMI) | Anthropometric | kg/m² | Basen‐Enquist 2006; Cadmus 2009; Courneya 2003; Daley 2007; Kiecolt‐Glaser 2014; Ligibel 2008; Littman 2012; Murtezani 2014; Mustian 2004; Naumann 2012; Nikander 2007; Pinto 2003; Portela 2008; Rahnama 2010; Rogers 2009; Rogers 2013; Rogers 2014; Schmitz 2005; Schmitz 2009 |
| Body mass | Anthropometric | kg | Cadmus 2009; Courneya 2003; Daley 2007; DeNysschen 2011; Dolan 2016; Guinan 2013; Herrero 2006; Irwin 2015; Kiecolt‐Glaser 2014; Ligibel 2008; Littman 2012; Matthews 2007; Murtezani 2014; Musanti 2012; Naumann 2012; Nikander 2007; Pinto 2003; Rahnama 2010; Saarto 2012; Schmitz 2005; Schmitz 2009; Winters‐Stone 2011 |
| Skinfold thickness | Body composition | mm and/or % | Courneya 2003; Herrero 2006; Naumann 2012 |
| Hip circumference | Anthropometric | cm | Basen‐Enquist 2006; Cadmus 2009; Dolan 2016; Ligibel 2008; Littman 2012; Rahnama 2010; Rogers 2009 |
| Waist circumference | Anthropometric | cm | Basen‐Enquist 2006; Cadmus 2009; Dolan 2016; Guinan 2013; Ligibel 2008; Littman 2012; Rahnama 2010; Rogers 2009; Schmitz 2005 |
| Waist‐to‐hip ratio | Anthropometric | NA | Ligibel 2008; Rahnama 2010; Rogers 2009; Rogers 2013; Rogers 2014 |
| Handgrip strength | Muscular strength | kg | Irwin 2015; Kaltsatou 2011; Kim 2015; Mustian 2004; Portela 2008; Rogers 2009; Saarto 2012; Winters‐Stone 2011 |
| Repetition maximum (RM) bench/chest press | Muscular strength | kg | Cormie 2014; Milne 2008; Musanti 2012; Naumann 2012; Schmitz 2005; Schmitz 2009; Winters‐Stone 2011) |
| RM leg press | Muscular strength | kg | Cerulli 2014; Cormie 2014; Dolan 2016; Milne 2008; Musanti 2012; Naumann 2012; Schmitz 2005; Schmitz 2009; Winters‐Stone 2011 |
| Total bone mineral content (BMC) | Bone‐related outcomes | g/cm | Cadmus 2009; Saarto 2012 |
| BMC of distal tibia, tibial midshaft, and femoral neck | Bone‐related outcomes | g/cm | Saarto 2012 |
| Bone mineral density (BMD) via DEXA | Bone‐related outcomes | g/cm² | Cadmus 2009; Kim 2015; Rogers 2009; Saarto 2012; Waltman 2010; Winters‐Stone 2011 |
| BMD of femoral neck and lumbar spine | Bone‐related outcomes | g/cm² | Kim 2015; Rogers 2009; Saarto 2012; Waltman 2010; Winters‐Stone 2011 |
| BMD greater trochanter via DEXA | Bone‐related outcomes | g/cm² | Winters‐Stone 2011 |
| BMD total hip via DEXA | Bone‐related outcomes | g/cm² | Kim 2015; Waltman 2010; Winters‐Stone 2011 |
| BMD total radius and 33% radius via DEXA | Bone‐related outcomes | g/cm² | Waltman 2010 |
| Bone Remodeling Index (BRI) | Bone‐related outcomes | NA | Mustian 2004 |
| Serum bone‐specific alkaline phosphatase (BSAP) | Bone‐related outcomes | μg/L | Mustian 2004; Waltman 2010 |
| SerumN‐telopeptides of type I collagen (NTx) | Bone‐related outcomes | nm bone collagen equivalent (BCE) | Kim 2015; Mustian 2004; Waltman 2010 |
| Serum osteocalcin | Bone‐related outcomes | nmol | Winters‐Stone 2011 |
Physical activity outcomes
In all, 23 (37%) studies measured physical activity via self‐report and 12 (19%) studies performed objective measurements. Twenty (32%) studies reported both preintervention and postintervention physical activity (Baruth 2013; Basen‐Enquist 2006; Cadmus 2009; Courneya 2003; Guinan 2013; Hatchett 2013; Irwin 2015; Kiecolt‐Glaser 2014; Kim 2015; Littman 2012; Matthews 2007; Pinto 2005; Pinto 2015; Rogers 2009; Rogers 2015; Saarto 2012; Schmitz 2009; Short 2014; Vallance 2007; Winters‐Stone 2011). Ten (16%) studies assessed preintervention to postintervention physical activity objectively via accelerometers (Guinan 2013; Matthews 2007; Pinto 2005; Pinto 2015; Rogers 2009; Rogers 2014; Rogers 2015); Cadmus 2009,Short 2014, and Vallance 2007 used pedometers. We have provided details of these physical activity outcomes in Table 4.
Anthropometric outcomes
Anthropometric outcomes included in eligible studies consisted of body mass (n = 22; 35%), BMI (n = 19; 30%), hip circumference (n = 7; 11%), waist circumference (n = 9; 14%), and waist‐to‐hip ratio (n = 5; 8%). Nineteen (30%) studies included some body composition measure (Cadmus 2009; Cerulli 2014; Courneya 2003; Daley 2007; DeNysschen 2011; Guinan 2013; Herrero 2006; Ligibel 2008; Matthews 2007; Musanti 2012; Mustian 2004; Naumann 2012; Rogers 2009; Rogers 2013; Rogers 2014; Saarto 2012; Schmitz 2005; Schmitz 2009; Winters‐Stone 2011). We have provided details of anthropometric and body composition outcomes in Table 4.
Muscular strength outcomes
Seventeen (27%) studies assessed lower body muscular strength (Cerulli 2014; Cormie 2014; Do 2015; Dolan 2016; Heim 2007; Milne 2008; Musanti 2012; Naumann 2012; Nieman 1995; Nikander 2007; Rogers 2009; Rogers 2013; Saarto 2012; Schmitz 2005; Schmitz 2009; Waltman 2010; Winters‐Stone 2011), whereas 20 (32%) studies included a measure of upper body muscular strength (Cerulli 2014; Cormie 2014; Do 2015; Heim 2007; Irwin 2015; Kaltsatou 2011; Kim 2015; Malicka 2011; Milne 2008; Musanti 2012; Mustian 2004; Naumann 2012; Nikander 2007; Portela 2008; Rogers 2009; Saarto 2012; Schmitz 2005; Schmitz 2009; Waltman 2010; Winters‐Stone 2011). We have provided details of muscular strength outcomes in Table 4. One study reported the “maximal weight lifted for each exercise during strength training sessions” only for the intervention group (Ligibel 2008).
Bone‐related outcomes
Two (3%) studies measured total bone mineral content (BMC) using dual‐energy X‐ray absorptiometry (DEXA) (Cadmus 2009; Saarto 2012); Saarto 2012 assessed BMC of the distal tibia, tibial midshaft, and femoral neck. Six trials assessed bone mineral density (BMD) via DEXA (Cadmus 2009; Kim 2015; Rogers 2009; Saarto 2012; Waltman 2010; Winters‐Stone 2011). Saarto 2012 assessed BMC, total cross‐sectional area, cortical density, and density‐weighted polar section modulus via peripheral quantitative computed tomography (pQCT) scans of the left distal tibia and tibial midshaft. Four (6%) studies provided data for biomarkers of bone turnover (Kim 2015; Mustian 2004; Waltman 2010; Winters‐Stone 2011). We have provided details of bone‐related outcomes in Table 4.
Excluded studies
We retrieved a total of 86 studies, then excluded them after review as they did not meet the inclusion criteria. We excluded 13 (15%) studies as they used a non‐randomised controlled trial design and included no comparison group (Fernandez‐Lao 2013; Fong 2014; Galantino 2013; Hojan 2013; Hunt‐Shanks 2006; Hutnick 2005; Johnsson 2013; Lee 2010; Naumann 2012a; Sherman 2010; Speed‐Andrews 2010; Sprod 2010; Ulger 2010). We excluded 13 (15%) studies as they did not analyse populations with breast cancer separately (Buffart 2012; Burnham 2002; Culos‐Reed 2006; Demark 2006; Ibfelt 2011; LaStayo 2011; Ligibel 2012; May 2008; Oh 2010; Stevinson 2007; Tang 2010; Thorsen 2005; Van Weert 2005). We excluded two (2%) studies as they involved only patients with stage IV breast disease (Cunningham 1998; Headley 2004). We excluded one (1%) study as it involved only pretreatment patients with breast cancer (Cohen 2010), and 13 (15%) as they included patients receiving concurrent adjuvant chemotherapy and radiotherapy (Anderson 2012; Danhauer 2009; Hsiao‐Fang 2013; Hsieh 2008; Husebo 2014; Isabell 2010; Kilbreath 2012; Moadel 2007; Naraphong 2015; Sandel 2005; Segal 2001; Taso 2014; Yuen 2007). We excluded 29 (34%) studies as they did not compare a physical activity intervention versus no physical activity, another intervention, or usual care (Benton 2014; Cadmus‐Bertram 2011; Carter 2012; Cheema 2006; D'Atillio 2007; Damush 2006; De Backer 2007; Dimeo 2008; Eyigor 2010; Hanna 2008; Johansson 2005; Kovacic 2011; Noble 2012; Oldervoll 2011; Pinto 2008; Pinto 2013; Rabin 2006; Rabin 2009; Schmidt 2012; Schneider 2007; Schwartz 1999; Sprod 2005; Stan 2012; Stan 2013; Szczwpanska‐Gieracha 2010; Turner 2004; Van Puymbroeck 2011; Wong 2012; Wu 2008). We excluded 10 (12%) studies in which the effect of physical activity could not be isolated because the intervention included dietary modification (Casla 2015; Djuric 2002; Kim Soo 2011; Mefferd 2007), lifestyle interventions and/or patient education (Bloom 2008; Cho 2006), or manual therapy (Cantarero‐Villanueva 2012a; Cantarero‐Villanueva 2012; Cantarero‐Villanueva 2013a; Fernandez‐Lao 2012). We excluded seven (8%) studies as the physical activity intervention was limited to shoulder and arm training (Gordon 2005; Hayes 2013; Jeff 2012; Kilbreath 2006; Kilgour 2008; McClure 2010; Tidhar 2010). For detailed information on reasons for exclusion of retrieved studies, see the Characteristics of excluded studies table.
Risk of bias in included studies
For each trial, we have detailed risk of bias in the ’Risk of bias’ tables included under Characteristics of included studies and in the ’Risk of bias’ summary provided in Figure 2. In addition, we have presented an overall assessment of risk of bias in Figure 3.
2.
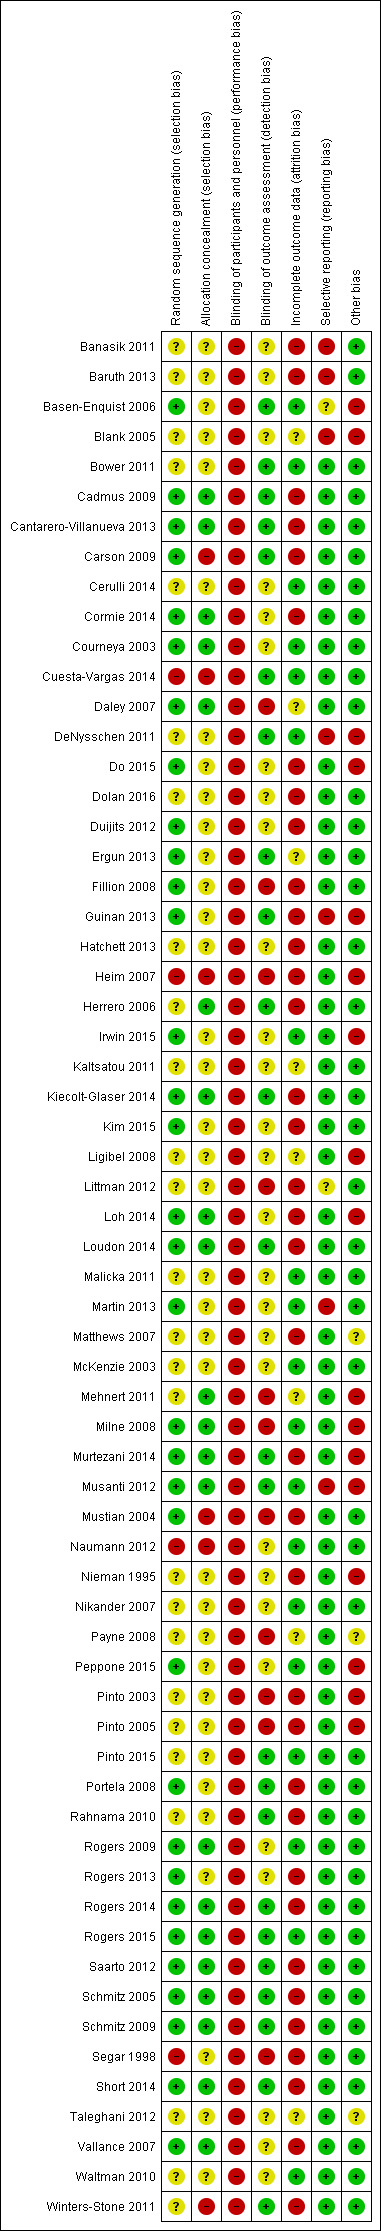
Risk of bias summary: review authors' judgements about each risk of bias item for each included study.
3.
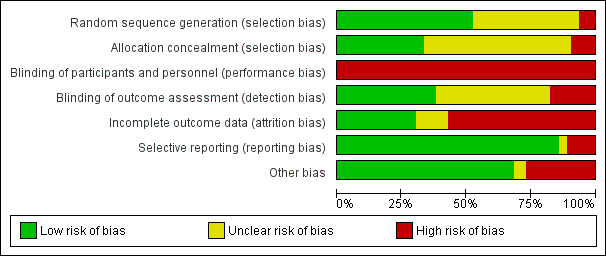
Risk of bias graph: review authors' judgements about each risk of bias item presented as percentages across all included studies.
Allocation
Thirty‐two (51%) trials were at a low risk of selection bias owing to adequate generation of the randomised sequence because these trials used a random component to generate the sequence (Cadmus 2009; Cantarero‐Villanueva 2013; Carson 2009; Cormie 2014; Courneya 2003; Daley 2007; Do 2015; Duijits 2012; Ergun 2013; Fillion 2008; Guinan 2013; Irwin 2015; Kiecolt‐Glaser 2014; Kim 2015; Loh 2014; Loudon 2014; Martin 2013; Milne 2008; Murtezani 2014; Musanti 2012; Mustian 2004; Peppone 2015; Portela 2008; Rogers 2009; Rogers 2013; Rogers 2014; Rogers 2015; Saarto 2012; Schmitz 2005; Schmitz 2009; Short 2014; Vallance 2007). Four (6%) trials had high risk of selection bias as they used a non‐random component to generate sequences (Cuesta‐Vargas 2014; Heim 2007; Naumann 2012; Segar 1998). We considered 26 (41%) trials to have unclear risk of selection bias, mainly because study authors did not describe generation of the random sequence (Banasik 2011; Baruth 2013; Blank 2005; Bower 2011; Cerulli 2014; DeNysschen 2011; Dolan 2016; Hatchett 2013; Herrero 2006; Kaltsatou 2011; Ligibel 2008; Littman 2012; Malicka 2011; Matthews 2007; McKenzie 2003; Mehnert 2011; Nieman 1995; Nikander 2007; Payne 2008; Pinto 2003; Pinto 2005; Pinto 2015; Rahnama 2010; Taleghani 2012; Waltman 2010; Winters‐Stone 2011).
Twenty‐one (33%) studies were at low risk of selection bias owing to adequate concealment of allocation to the intervention because participants and investigators could not foresee assignment to study groups (Cadmus 2009; Cantarero‐Villanueva 2013; Cormie 2014; Courneya 2003; Daley 2007; Herrero 2006; Kiecolt‐Glaser 2014; Loh 2014; Loudon 2014; Mehnert 2011; Milne 2008; Murtezani 2014; Musanti 2012; Rogers 2009; Rogers 2014; Rogers 2015; Saarto 2012; Schmitz 2005; Schmitz 2009; Short 2014; Vallance 2007). Six (10%) trials were at high risk of selection bias because it was possible that participants and/or investigators could foresee assignment to study groups (Carson 2009; Cuesta‐Vargas 2014; Heim 2007; Mustian 2004; Naumann 2012; Winters‐Stone 2011). Although participant allocation was placed in sealed, sequentially numbered envelopes, trial authors in Winters‐Stone 2011 did not report whether the envelopes were opaque. We determined that 36 (57%) studies had unclear risk of selection bias owing to allocation concealment, predominantly because investigators did not describe allocation concealment or did not describe allocation concealment in adequate detail for a decision to be made (Banasik 2011; Baruth 2013; Basen‐Enquist 2006; Blank 2005; Bower 2011; Cerulli 2014; DeNysschen 2011; Do 2015; Dolan 2016; Duijits 2012; Ergun 2013; Fillion 2008; Guinan 2013; Hatchett 2013; Irwin 2015; Kaltsatou 2011; Kim 2015; Ligibel 2008; Littman 2012; Malicka 2011; Martin 2013; Matthews 2007; McKenzie 2003; Nieman 1995; Nikander 2007; Payne 2008; Peppone 2015; Pinto 2003; Pinto 2005; Pinto 2015; Portela 2008; Rahnama 2010; Rogers 2013; Segar 1998; Taleghani 2012; Waltman 2010).
Blinding
All trials included in this review were at high risk for performance bias because the nature of the intervention (i.e. physical activity) made it impossible to blind trial personnel and participants. We considered 24 (38%) studies to be at low risk of detection bias because outcome assessors were blinded to allocation of participants to study groups (Basen‐Enquist 2006; Bower 2011; Cadmus 2009; Cantarero‐Villanueva 2013; Carson 2009; Cuesta‐Vargas 2014; DeNysschen 2011; Ergun 2013; Guinan 2013; Herrero 2006; Kiecolt‐Glaser 2014; Loudon 2014; Murtezani 2014; Musanti 2012; Pinto 2015; Portela 2008; Rahnama 2010; Rogers 2014; Rogers 2015; Saarto 2012; Schmitz 2005; Schmitz 2009; Short 2014; Winters‐Stone 2011). However, this was typically done for outcome assessors measuring physical fitness outcomes rather than in cases of self‐report outcomes, such as HRQoL and psychological outcomes. Eleven (17%) studies were at high risk of detection bias owing to lack of blinding of outcome assessment (Daley 2007; Fillion 2008; Heim 2007; Littman 2012; Mehnert 2011; Milne 2008; Mustian 2004; Payne 2008; Pinto 2003; Pinto 2005; Segar 1998). Twenty‐eight (44%) studies had unclear risk of detection bias (Banasik 2011; Baruth 2013; Bower 2011; Cerulli 2014; Cormie 2014; Courneya 2003; Do 2015; Dolan 2016; Duijits 2012; Hatchett 2013; Irwin 2015; Kaltsatou 2011; Kim 2015; Ligibel 2008; Loh 2014; Malicka 2011; Martin 2013; Matthews 2007; McKenzie 2003; Naumann 2012; Nieman 1995; Nikander 2007; Peppone 2015; Rogers 2009; Rogers 2013; Taleghani 2012; Vallance 2007; Waltman 2010).
Incomplete outcome data
Eighteen (29%) studies were at low risk of attrition bias owing to the quantity, nature, or handling of incomplete outcome data (i.e. no missing data or used an acceptable method for handling missing data, such as multiple imputation) (Basen‐Enquist 2006; Bower 2011; Cerulli 2014; Courneya 2003; Cuesta‐Vargas 2014; DeNysschen 2011; Irwin 2015; Malicka 2011; Martin 2013; McKenzie 2003; Milne 2008; Musanti 2012; Naumann 2012; Peppone 2015; Pinto 2015; Rogers 2009; Rogers 2015; Waltman 2010). Thirty‐five (56%) trials had high risk of attrition bias owing to exclusion of participants with missing data, lack of description of how missing data were handled, or inappropriate methods of handling missing data, such as use of the last observation carried forward (LOCF) method (Banasik 2011; Baruth 2013; Cadmus 2009; Cantarero‐Villanueva 2013; Carson 2009; Cormie 2014; Do 2015; Dolan 2016; Duijits 2012; Fillion 2008; Guinan 2013; Hatchett 2013; Heim 2007; Kiecolt‐Glaser 2014; Kim 2015; Littman 2012; Loh 2014; Loudon 2014; Matthews 2007; Murtezani 2014; Mustian 2004; Nieman 1995; Pinto 2003; Pinto 2005; Portela 2008; Rahnama 2010; Rogers 2013; Rogers 2014; Saarto 2012; Schmitz 2005; Schmitz 2009; Segar 1998; Short 2014; Vallance 2007; Winters‐Stone 2011). Ten (16%) studies had unclear risk of bias (Blank 2005; Daley 2007; Ergun 2013; Herrero 2006; Kaltsatou 2011; Ligibel 2008; Mehnert 2011; Nikander 2007; Payne 2008; Taleghani 2012).
Selective reporting
Most trials (n = 55; 87%) were at low risk of reporting bias, and, based on information provided by trial authors, we had no reason to believe that selective reporting of primary and secondary outcomes occurred. Owing to incomplete reporting of outcome variables, we considered six (10%) studies to be at high risk for reporting bias (Banasik 2011; Baruth 2013; DeNysschen 2011; Guinan 2013; Martin 2013; Musanti 2012), and only two (3%) studies to have unclear risk (Basen‐Enquist 2006; Littman 2012).
Other potential sources of bias
Forty‐five (71%) studies were at low risk of other biases, and we considered 16 (25%) trials to be at high risk of other biases (Basen‐Enquist 2006; Blank 2005; DeNysschen 2011; Do 2015; Heim 2007; Irwin 2015; Ligibel 2008; Loh 2014; Mehnert 2011; Milne 2008; Murtezani 2014; Musanti 2012; Nieman 1995; Peppone 2015; Pinto 2003; Pinto 2005) owing to potential contamination (i.e. increased physical activity in usual care groups), possible occurrence of ‘null bias’ due to insufficiently delivered interventions (e.g. low adherence to intervention, high dropout rates), and imbalance between groups at baseline. Two (3%) studies were at unclear risk of other biases (Matthews 2007; Payne 2008).
Effects of interventions
See Table 1 and Table 2. For detailed information on each of the outcomes, as well as on numbers of trials reporting the outcomes, numbers of participants for whom outcomes were reported, statistical methods used for analysis, and effect estimates, see Data and analyses.
Breast cancer‐related mortality
No randomised or quasi‐randomised controlled trials reported breast cancer‐related mortality.
Quality of life
Health‐related quality of life
Immediately after physical activity interventions, follow‐up values showed significant small improvement in overall HRQoL compared with control interventions (standardised mean difference (SMD) 0.39, 95% confidence interval (CI) 0.21 to 0.57, I² = 68%, 22 studies, 1996 participants; low‐quality evidence; Analysis 1.1; Table 1). This improvement did not persist at three months or longer post intervention (Analysis 1.1; Figure 4). For analysis of immediately postintervention values, exclusion of the two most extreme trials lowered heterogeneity to a level where it might not be important (I² = 18%) while maintaining the significant effect of physical activity (Cerulli 2014; Milne 2008).
1.1. Analysis.
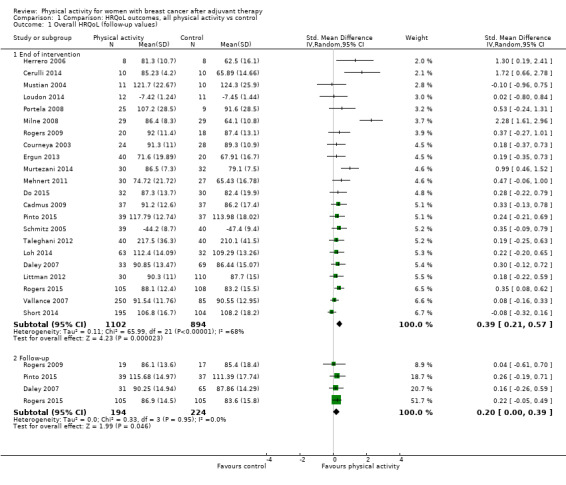
Comparison 1 Comparison: HRQoL outcomes, all physical activity vs control, Outcome 1 Overall HRQoL (follow‐up values).
4.
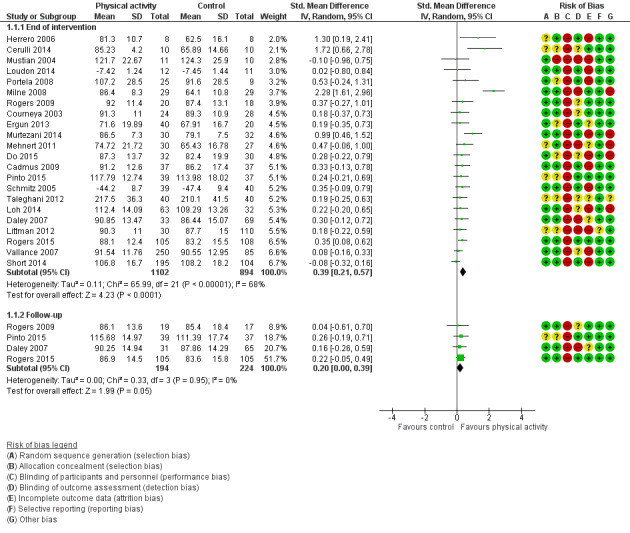
Forest plot of comparison: 1 Comparison: HRQoL outcomes, all physical activity vs control, outcome: 1.1 Overall HRQoL (follow‐up values).
Change in overall HRQoL from baseline to end of intervention revealed significant moderate improvement with physical activity compared with control (SMD 0.78, 95% CI 0.39 to 1.17, I² = 90%, 14 studies, 1459 participants; low‐quality evidence; Analysis 1.2; Figure 5; Table 2). This change in overall HRQoL persisted from baseline to three months or longer post intervention (SMD 0.52, 95% CI 0.15 to 0.88, I² = 0%, 2 studies, 132 participants; Analysis 1.2; Figure 5). Exclusion of extreme values did not reduce heterogeneity to acceptable levels for the change from baseline to end of intervention analysis.
1.2. Analysis.
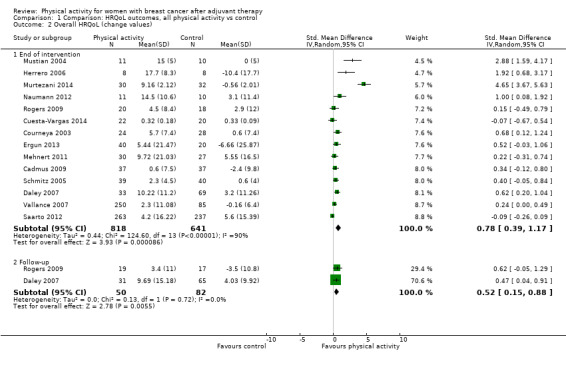
Comparison 1 Comparison: HRQoL outcomes, all physical activity vs control, Outcome 2 Overall HRQoL (change values).
5.

Forest plot of comparison: 1 Comparison: HRQoL outcomes, all physical activity vs control, outcome: 1.2 Overall HRQoL (change values).
Low versus unclear/high risk of bias studies
Data show significant small effects of physical activity on HRQoL compared with control for postintervention follow‐up values in trials with both low and unclear/high risk of bias (SMD 0.43, 95% CI 0.19 to 0.66, I² = 76%, 15 studies, 1521 participants; and SMD 0.30, 95% CI 0.06 to 0.55, I² = 32%, 7 studies, 475 participants, respectively; Analysis 18.1). A significant moderate effect on change from baseline to end of intervention scores (SMD 0.70, 95% CI 0.28 to 1.12, I² = 91%, 11 studies, 1360 participants; Analysis 18.2) with physical activity was observed compared among controls only in trials with low risk of bias.
18.1. Analysis.
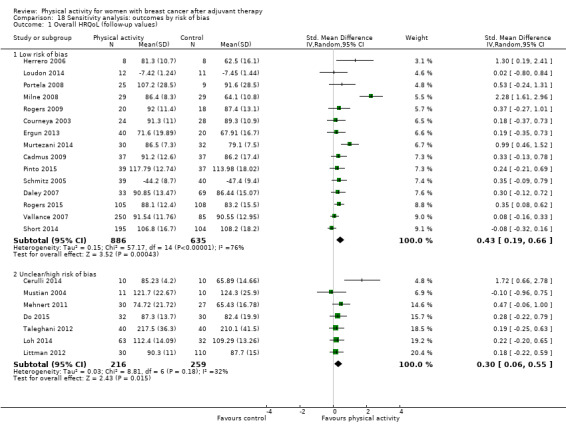
Comparison 18 Sensitivity analysis: outcomes by risk of bias, Outcome 1 Overall HRQoL (follow‐up values).
18.2. Analysis.
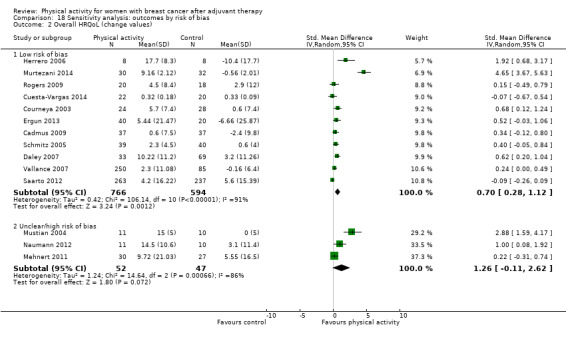
Comparison 18 Sensitivity analysis: outcomes by risk of bias, Outcome 2 Overall HRQoL (change values).
Postmenopausal only versus not postmenopausal only (i.e. premenopausal or varied menopausal statuses)
A significant small effect of physical activity versus control on immediately postintervention HRQoL values was observed only when ‘not postmenopausal only’ studies were analysed (SMD 0.42, 95% CI 0.22 to 0.63, I² = 73%, 19 studies, 1810 participants, Analysis 12.1). Significant small changes from baseline to end of intervention were found in postmenopausal only studies (SMD 0.49, 95% CI 0.19 to 0.79, I² = 0%, 3 studies, 186 participants; Analysis 12.2).
12.1. Analysis.
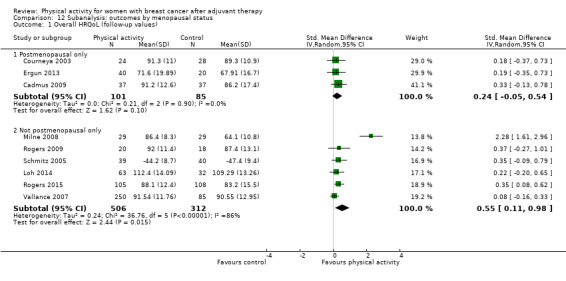
Comparison 12 Subanalysis: outcomes by menopausal status, Outcome 1 Overall HRQoL (follow‐up values).
12.2. Analysis.
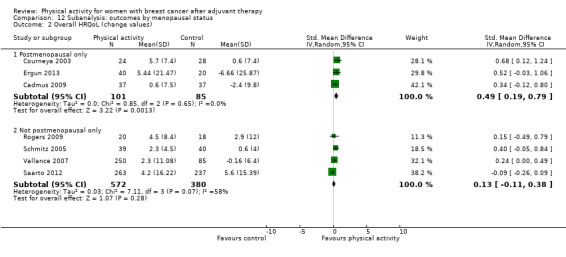
Comparison 12 Subanalysis: outcomes by menopausal status, Outcome 2 Overall HRQoL (change values).
Measurement type
Analysis was possible only for EORTC QLQ‐C30 and FACT‐G and ‐B questionnaires, as only these questionnaires were included in at least two trials. Significant improvement in immediately postintervention values was noted in physical activity groups compared with control groups for FACT‐G (mean difference (MD) 7.06, 95% CI 2.82 to 11.30, I² = 86%, 10 studies, 1094 participants) and FACT‐B (MD 6.31, 95% CI 1.15 to 11.47, I² = 87%, 11 studies, 1395 participants) and for QLQ‐C30 global health (MD 7.85, 95% CI 2.16 to 13.55, I² = 21%, 4 studies, 195 participants; Analysis 1.3; Analysis 1.5; Analysis 1.10). Between‐group differences immediately post intervention represented a meaningful clinically important difference (MCID) for FACT‐G (MCID 5 to 6 points) but not for FACT‐B (MCID 7 to 8 points) (Eton 2004).
1.3. Analysis.
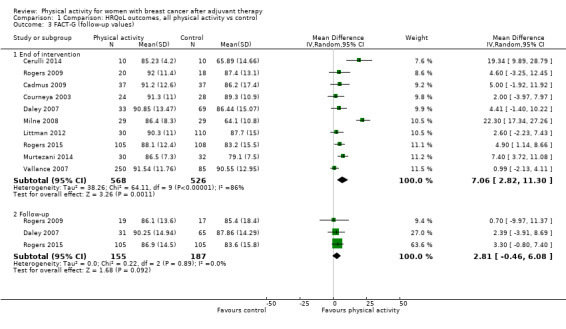
Comparison 1 Comparison: HRQoL outcomes, all physical activity vs control, Outcome 3 FACT‐G (follow‐up values).
1.5. Analysis.
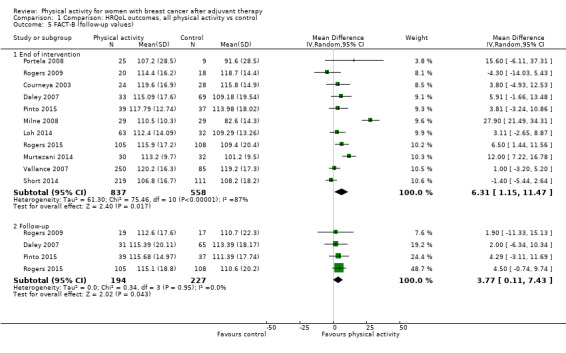
Comparison 1 Comparison: HRQoL outcomes, all physical activity vs control, Outcome 5 FACT‐B (follow‐up values).
1.10. Analysis.
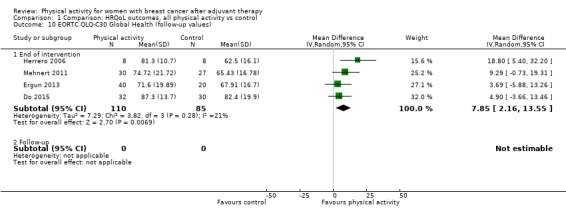
Comparison 1 Comparison: HRQoL outcomes, all physical activity vs control, Outcome 10 EORTC QLQ‐C30 Global Health (follow‐up values).
Significant changes from baseline to end of intervention scores in physical activity groups compared with control groups were found for FACT‐G (MD 5.04, 95% CI 1.32 to 8.75, I² = 91%, 6 studies, 663 participants) and FACT‐B (MD 8.16, 95% CI 2.56 to 13.76, I² = 89%, 6 studies, 605 participants), but changes in QLQ‐C30 were not significant (Analysis 1.4; Analysis 1.6; Analysis 1.11). These changes from baseline scores represented an MCID in FACT‐G and FACT‐B. The FACT‐breast cancer subscale indicated significant improvement in breast cancer symptoms in immediately postintervention follow‐up values only (MD 1.98, 95% CI 0.92 to 3.04, I² = 48%, 11 studies, 1043 participants), but these improvements were below the MCID for this subscale (MCID 2 to 3 points) (Eton 2004). FACT‐trial outcome index subscale analysis was possible only for immediately postintervention values and revealed no significant effect of physical activity compared with control.
1.4. Analysis.
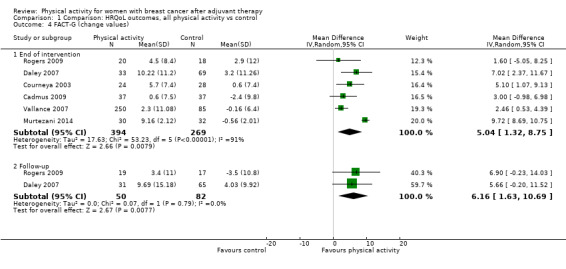
Comparison 1 Comparison: HRQoL outcomes, all physical activity vs control, Outcome 4 FACT‐G (change values).
1.6. Analysis.
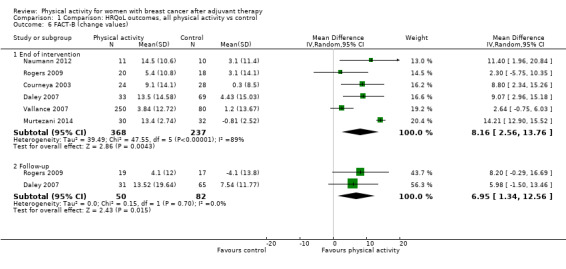
Comparison 1 Comparison: HRQoL outcomes, all physical activity vs control, Outcome 6 FACT‐B (change values).
1.11. Analysis.

Comparison 1 Comparison: HRQoL outcomes, all physical activity vs control, Outcome 11 EORTC QLQ‐C30 Global Health (change values).
Intervention mode
Compared with control, data show improvement in overall HRQoL immediately post intervention for aerobic exercise (SMD 0.41, 95% CI 0.19 to 0.63, I² = 55%, 12 studies, 971 participants) and combined aerobic and resistance exercise (SMD 0.63, 95% CI 0.08 to 1.19, I² = 87%, 7 studies, 589 participants; Analysis 13.1). No differences were found for yoga, tai chi, qigong, and pilates interventions when compared with control. Trials on resistance training were too few for subgroup analysis of immediately postintervention values. We found a significant change from baseline to end of intervention in HRQoL for aerobic exercise interventions (SMD 0.68, 95% CI 0.22 to 1.15, I² = 92%, 12 studies, 971 participants; Analysis 13.2) compared with controls, but not for combined aerobic and resistance exercise interventions. Subgroup analyses of change from baseline scores were not possible for yoga, tai chi, qigong, and pilates or resistance training interventions.
13.1. Analysis.
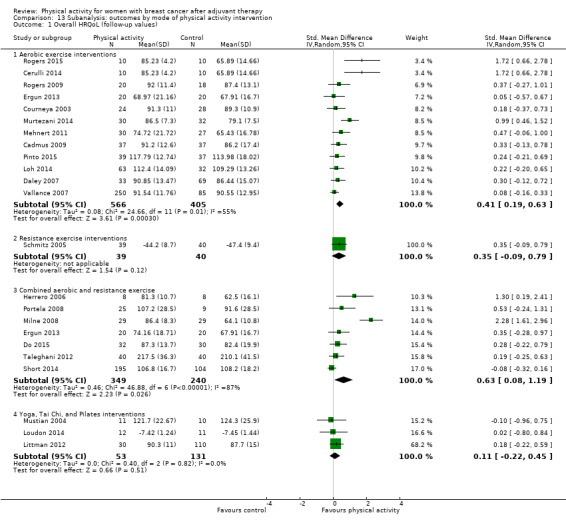
Comparison 13 Subanalysis: outcomes by mode of physical activity intervention, Outcome 1 Overall HRQoL (follow‐up values).
13.2. Analysis.
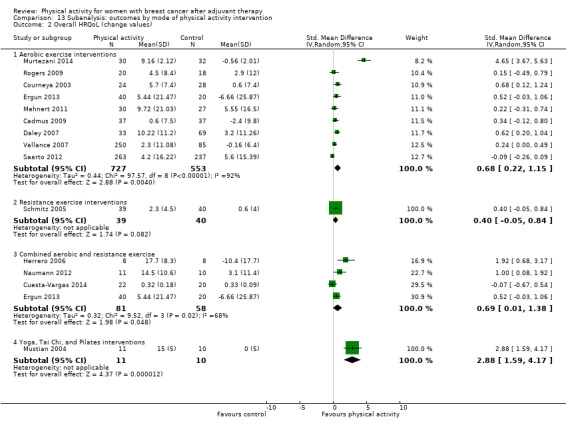
Comparison 13 Subanalysis: outcomes by mode of physical activity intervention, Outcome 2 Overall HRQoL (change values).
Intervention intensity
Compared with control, light‐to‐moderate physical activity improved HRQoL (SMD 0.51, 95% CI 0.25 to 0.77, I² = 72%, 16 studies, 983 participants; Analysis 14.1). A similar result was observed at change from baseline to end of intervention (SMD 0.99, 95% CI 0.39 to 1.60, I² = 90%, 10 studies, 534 participants; Analysis 14.2).
14.1. Analysis.
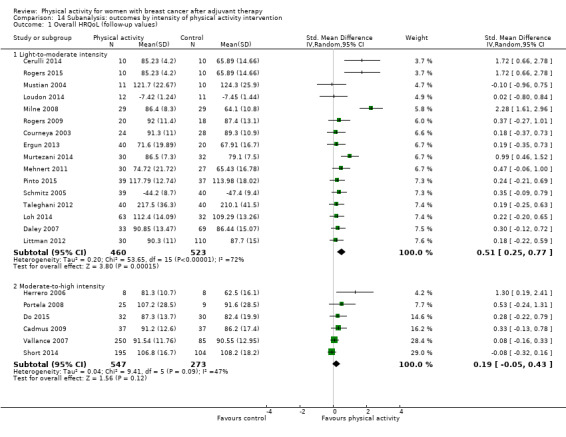
Comparison 14 Subanalysis: outcomes by intensity of physical activity intervention, Outcome 1 Overall HRQoL (follow‐up values).
14.2. Analysis.
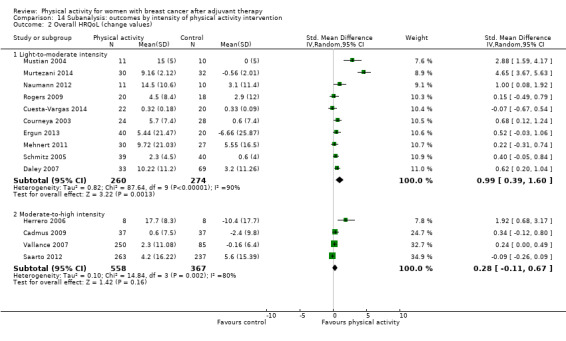
Comparison 14 Subanalysis: outcomes by intensity of physical activity intervention, Outcome 2 Overall HRQoL (change values).
Intervention duration ≤ 12 weeks versus > 12 weeks
Immediately post intervention, interventions of duration ≤ 12 weeks and > 12 weeks led to significant small improvement compared with controls (≤ 12 weeks: SMD 0.45, 95% CI 0.19 to 0.70, I² = 77%, 16 studies, 1404 participants; and > 12 weeks: SMD 0.38, 95% CI 0.10 to 0.65, I² = 35%, 6 studies, 399 participants; Analysis 15.1). However, interventions of ≤ 12 weeks but not > 12 weeks in duration led to significant large changes from baseline to end of intervention in HRQoL compared with controls (SMD 0.99, 95% CI 0.49 to 1.52, I² = 90%, 11 studies, 828 participants; Analysis 15.2).
15.1. Analysis.
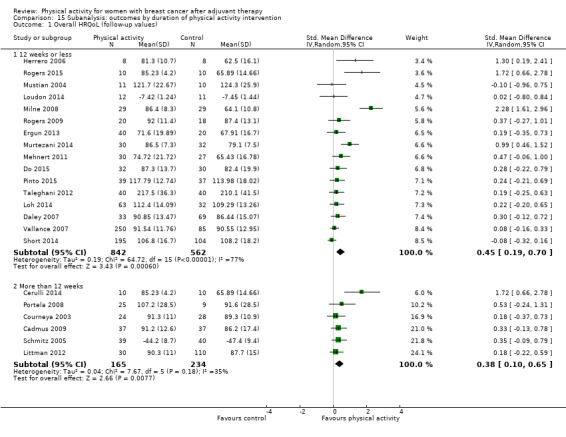
Comparison 15 Subanalysis: outcomes by duration of physical activity intervention, Outcome 1 Overall HRQoL (follow‐up values).
15.2. Analysis.
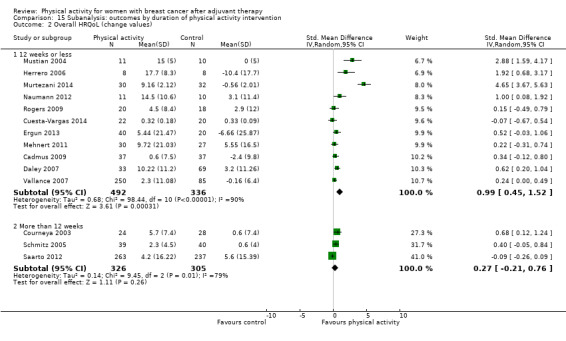
Comparison 15 Subanalysis: outcomes by duration of physical activity intervention, Outcome 2 Overall HRQoL (change values).
Intervention format
All intervention settings led to significant improvement in immediate postintervention follow‐up values compared with controls, with large effects evident for group format interventions (SMD 0.99, 95% CI 0.22 to 1.75, I² = 84%, 5 studies, 214 participants) compared with small effects for both individual and combined individual and group format interventions (SMD 0.21, 95% CI 0.03 to 0.38, I² = 39%, 10 studies, 1137 participants; and SMD 0.33, 95% CI 0.04 to 0.62, I² = 36%, 6 studies, 390 participants, respectively; Analysis 16.1). Both group and individual format interventions significantly improved change from baseline to end of intervention HRQoL scores (SMD 1.88, 95% CI 0.19 to 3.56, I² = 95%, 5 studies, 198 participants; and SMD 0.43, 95% CI 0.25 to 0.61, I² = 6%, 6 studies, 649 participants, respectively) compared with controls; combined group and individual format interventions led to no improvement (Analysis 16.2).
16.1. Analysis.
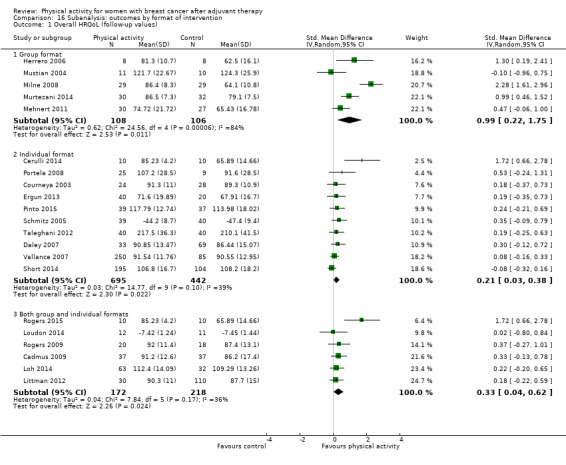
Comparison 16 Subanalysis: outcomes by format of intervention, Outcome 1 Overall HRQoL (follow‐up values).
16.2. Analysis.
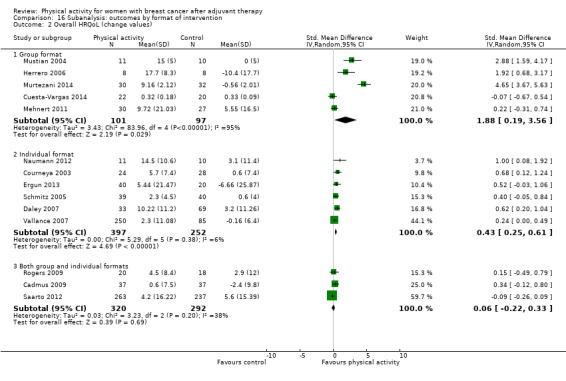
Comparison 16 Subanalysis: outcomes by format of intervention, Outcome 2 Overall HRQoL (change values).
Intervention setting
Facility‐based interventions resulted in moderate improvement in immediately postintervention follow‐up values (SMD 0.55, 95% CI 0.27 to 0.83, I² = 71%, 15 studies, 833 participants) and large effects on change from baseline to end of intervention scores of HRQoL (SMD 1.18, 95% CI 0.53 to 1.82, I² = 90%, 10 studies, 492 participants; Analysis 17.1). Compared with controls, significant small effects on immediately postintervention HRQoL values were found for combined home and facility‐based interventions (SMD 0.48, 95% CI 0.04 to 0.92, I² = 55%, 4 studies, 227 participants), and small effects were observed on change from baseline to end of intervention HRQoL scores for home‐based interventions (SMD 0.27, 95% CI 0.04 to 0.50, I² = 0%, 2 studies, 375 participants; Analysis 17.2).
17.1. Analysis.
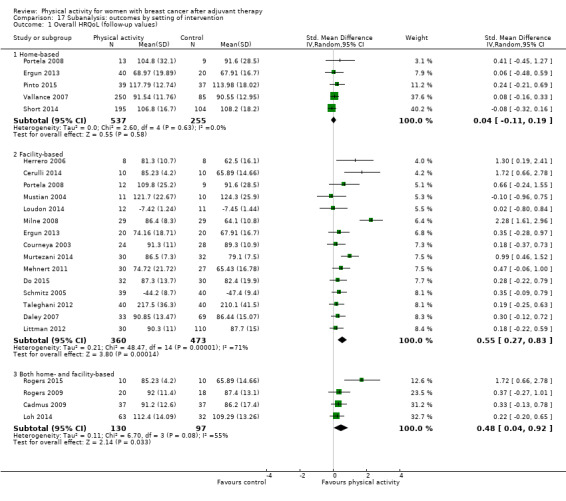
Comparison 17 Subanalysis: outcomes by setting of intervention, Outcome 1 Overall HRQoL (follow‐up values).
17.2. Analysis.
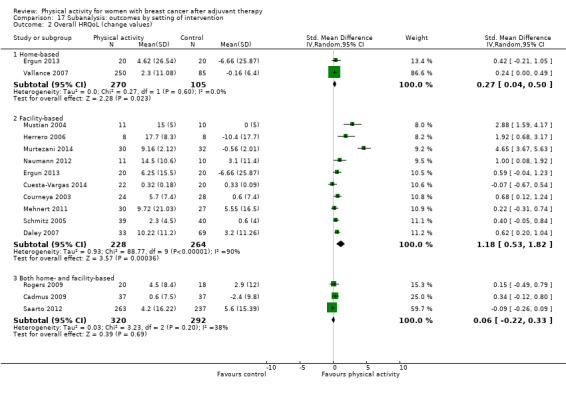
Comparison 17 Subanalysis: outcomes by setting of intervention, Outcome 2 Overall HRQoL (change values).
Studies from which data could not be extracted
Data could not be extracted from five trials that reported on HRQoL (Baruth 2013; Duijits 2012; Heim 2007; Herrero 2006; McKenzie 2003). Baruth 2013 reported their findings in Cohen d units (d < 2 indicates a trivial effect, 0.2 a small effect, 0.5 a medium effect, and ≥ 0.8 a large effect), and found that participants given a walking intervention showed improvement in indicators of QoL, such as current health (d = 0.27), as measured by the IBCSG QoL Core Questionnaire, and general health perspective (d = 0.66), as measured via MOS SF‐36, compared with those in the control group. Duijits 2012 found no significant overall group differences over time in general health perspective measured via MOS SF‐36. Heim 2007 reported that physical activity resulted in a significant group‐by‐time increase in HRQoL (P = 0.0015), measured via FACT‐G, in favour of the intervention group. Herrero 2006 reported a significant mean change on the global scale (P = 0.002) after a training programme, as measured by the EORTC QLQ‐C30, compared with a control. McKenzie 2003 found no significant group‐by‐time increases in general health (P > 0.05) measured via MOS SF‐36 in the exercise group compared with the control group.
Quality of life subscales
Emotional function
For emotional function, immediately postintervention (moderate‐quality evidence) and three months or longer postintervention follow‐up values and change from baseline to end of intervention scores (low‐quality evidence) showed small but significant effects of physical activity compared with controls, but not for change from baseline to three months or longer postintervention values (Table 1; Table 2; Table 5). Heterogeneity (I² = 72%) observed in the change from baseline to end of intervention analysis was reduced to a level that might not be important (I² = 23%) by removal of the most extreme trial value (Murtezani 2014); this could be further explained by the wide range of measurement instruments used, participants' menopausal status, and variations in study duration.
3. Meta‐analysis findings for each HRQoL subscale and secondary outcome.
| Outcome |
Immediate postintervention estimate (95% CI) |
≥ 3‐Month postintervention estimate (95% CI) |
Change from baseline to end of intervention estimate (95% CI) |
Change from baseline to ≥ 3‐month postintervention estimate (95% CI) |
| QoL subscale domain | ||||
| Cognitive function | SMD: 0.40 (0.11 to 0.69) N women (trials): 189 (5) I² = 0% |
SMD: 0.31 (‐0.09 to 0.71) N women (trials): 97 (2) I² = 0% |
SMD: ‐0.00 (‐0.27 to 0.26) N women (trials): 672 (5) I² = 35% |
SMD: 0.20 (‐0.20 to 0.60) N women (trials): 97 (2) I² = 0% |
| Emotional function/mental health | SMD: 0.21 (0.10 to 0.32) N women (trials): 2102 (26) I² = 27% |
SMD: 0.20 (0.03 to 0.36) N women (trials): 655 (7) I² = 10% |
SMD: 0.31 (0.09 to 0.53) N women (trials): 1579 (15) I² = 72% |
SMD: 0.06 (‐0.29 to 0.41) N women (trials): 179 (3) I² = 27% |
| General health perspective | SMD: 0.18 (‐0.08 to 0.45) N women (trials): 456 (1) I² = 47% |
NA | SMD: 0.17 (‐0.07 to 0.40) N women (trials): 906 (9) I² = 49% |
NA |
| Perceived physical function | SMD: 0.33 (0.18 to 0.49) N women (trials): 2129 (25) I² = 61% |
SMD: 0.21 (0.06 to 0.37) N women (trials): 637 (6) I² = 0% |
SMD: 0.60 (0.23 to 0.97) N women (trials): 1433 (13) I² = 89% |
NA |
| Role function | SMD: 0.29 (0.07 to 0.51) N women (trials): 1370 (18) I² = 69% |
SMD: 0.13 (‐0.12 to 0.38) N women (trials): 249 (2) I² = 0% |
SMD: 0.14 (‐0.05 to 0.33) N women (trials): 1315 (12) I² = 50% |
NA |
| Sexual function | SMD: 0.16 (‐0.04 to 0.35) N women (trials): 411 (5) I² = 0% |
NA | SMD: 0.22 (‐0.08 to 0.52) N women (trials): 693 (3) I² = 62% |
NA |
| Sleep | SMD: ‐0.09 (‐0.37 to 0.20) N women (trials): 188 (5) I² = 0% |
NA | SMD: 0.14 (‐0.20 to 0.48) N women (trials): 136 (3) I² = 0% |
NA |
| Social function | SMD: 0.19 (0.08 to 0.30) N women (trials): 1557 (18) I² = 11% |
NA | SMD: 0.52 (0.16 to 0.87) N women (trials): 1384 (12) I² = 87% |
NA |
| Other psychological outcomes | ||||
| Anxiety | SMD: ‐0.57 (‐0.95 to ‐0.19) N women (trials): 326 (7) I² = 60% |
NA | SMD: ‐0.37 (‐0.63 to ‐0.12) N women (trials): 235 (4) I² = 0% |
NA |
| Depression | SMD: ‐0.34 (‐0.62 to ‐0.05) N women (trials): 657 (12) I² = 63% |
SMD: ‐0.28 (‐0.51 to ‐0.05) N women (trials): 340 (4) I² = 9% |
SMD: ‐0.34 (‐0.63 to ‐0.05) N women (trials): 816 (7) I² = 62% |
NA |
| Fatigue | SMD: ‐0.32 (‐0.47 to ‐0.18) N women (trials): 2020 (26) I² = 54% |
SMD: ‐0.43 (‐0.60 to ‐0.26) N women (trials): 536 (7) I² = 0% |
SMD:‐0.30 (‐0.61 to 0.00) N women (trials): 1289 (13) I² = 80% |
SMD: ‐0.47 (‐0.84 to ‐0.11) N women (trials): 178 (4) I² = 23% |
| Happiness/satisfaction with life | SMD: 0.61 (‐0.16 to 1.37) N women (studies): 209 (4) I² = 85% |
NA | SMD: 0.28 (‐0.05 to 0.62) N women (studies): 182 (3) I² = 23% |
NA |
| Pain/disability | SMD: 0.08 (‐0.09 to 0.25) N women (trials): 535 (9) I² = 0% |
NA | SMD: ‐0.08 (‐0.33 to 0.16) N women (trials): 296 (5) I² = 5% |
NA |
| Self‐esteem | SMD: 0.27 (0.05 to 0.48) N women (trials): 667 (12) I² = 42% |
NA | SMD: 0.23 (‐0.11 to 0.58) N women (trials): 992 (9) I² = 80% |
NA |
| Vigour/vitality | SMD: 0.36 (0.21 to 0.50) N women (trials): 762 (10) I² = 0% |
SMD: 0.26 (0.04 to 0.48) N women (trials): 454 (4) I² = 24% |
SMD: 0.23 (0.00 to 0.45) N women (trials): 359 (6) I² = 10% |
SMD: 0.20 (‐0.06 to 0.46) N women (trials): 233 (2) I² = 0% |
| Cardiorespiratory fitness outcomes | ||||
| Overall cardiorespiratory fitness | SMD: 0.44 (0.30 to 0.58) N women (trials): 1265 (23) I² = 30% |
SMD: 0.36 (0.03 to 0.69) N women (trials): 362 (3) I² = 53% |
SMD: 0.83 (0.40 to 1.27) N women (trials): 863 (9) I² = 82% |
SMD: 0.42 (0.05 to 0.79) N women (trials): 115 (2) I² = 0% |
| Directly assessed VO₂peak (mL/kg/min) | MD: 1.89 (0.65 to 3.13) N women (trials): 199 (4) I² = 0% |
NA | MD: 1.31 (0.66 to 1.96) N women (trials): 166 (3) I² = 68% |
NA |
| Peak power output (W) | MD: 18.92 (9.64 to 28.20) N women (trials): 66 (2) I² = 0% |
NA | NA | NA |
| Resting heart rate (bpm) | MD: ‐4.47 (‐7.94 to ‐1.00) N women (trials): 82 (2) I² = 0% |
NA | MD: ‐1.05 (‐2.22 to 0.11) N women (trials): 86 (2) I² = 81% |
NA |
| Resting systolic blood pressure (mmHg) | MD: ‐0.83 (‐3.72 to 2.05) N women (trials): 134 (4) I² = 0% |
NA | MD: ‐1.12 (‐7.74 to 5.50) N women (trials): 143 (3) I² = 73% |
NA |
| Resting diastolic blood pressure (mmHg) | MD: 0.66 (‐2.89 to 4.21) N women (trials): 106 (3) I² = 22% |
NA | MD: 0.53 (‐1.61 to 2.68) N women (trials): 144 (3) I² = 23% |
NA |
| Physical activity outcomes | ||||
| Self‐reported physical activity | SMD: 0.52 (0.33 to 0.71) N women (trials): 2012 (17) I² = 72% |
SMD: 0.44 (0.17 to 0.72) N women (trials): 683 (4) I² = 53% |
SMD: 0.57 (0.25 to 0.90) N women (trials): 1274 (8) I² = 82% |
SMD: 0.51 (0.08 to 0.93) N women (trials): 521 (4) I² = 67% |
| Meeting recommended physical activity guidelines | OR: 8.44 (2.41 to 29.56) N women (trials): 819 (6) I² = 89% |
OR: 3.11 (1.50 to 6.46) N women (trials): 280 (2) I² = 28% |
NA | NA |
| Objective physical activity | SMD: 0.43 (0.19 to 0.66) N women (trials): 1248 (10) I² = 67% |
SMD: 0.22 (‐0.21 to 0.66) N women (trials): 305 (3) I² = 58% |
SMD: 0.71 (0.14 to 1.29) N women (trials): 508 (5) I² = 83% |
SMD: 0.23 (‐1.00 to 1.46) N women (trials): 61 (2) I² = 81% |
| Objective sedentary behaviour | SMD: ‐1.45 (‐3.68 to 0.78) N women (trials): 103 (3) I² = 95% |
NA | SMD: ‐0.01 (‐0.63 to 0.60) N women (trials): 103 (3) I² = 57% |
NA |
| Anthropometric outcomes | ||||
| Mass (kg) | MD: 0.00 (‐0.57 to 0.58) N women (trials): 1210 (16) I² = 0% |
NA | MD: ‐0.50 (‐0.98 to ‐0.01) N women (trials): 1047 (11) I² = 59% |
NA |
| BMI (kg/m2) | MD: 0.01 (‐0.19 to 0.22) N women (trials): 1481 (17) I² = 0% |
NA | MD: ‐0.22 (‐0.45 to 0.01) N women (trials): 485 (8) I² = 65% |
NA |
| Body fat | SMD: ‐0.18 (‐0.34 to ‐0.03) N women (trials): 1162 (18) I² = 35% |
NA | SMD: ‐0.62 (‐1.19 to ‐0.06) N women (trials): 499 (9) I² = 88% |
NA |
| Lean mass | MD: 0.05 (‐0.11 to 0.21) N women (trials): 612 (8) I² = 0% |
NA | MD: 0.80 (‐0.13 to 1.72) N women (trials): 760 (5) I² = 95% |
NA |
| Waist‐to‐hip ratio | MD: ‐0.03 (‐0.06 to 0.01) N women (trials): 213 (5) I² = 54% |
NA | MD: 0.00 (‐0.01 to 0.01) N women (trials): 124 (2) I² = 0% |
NA |
| Waist circumference (cm) | MD: ‐0.50 (‐3.18 to 2.18) N women (trials): 330 (6) I² = 0% |
NA | MD: ‐1.71 (‐2.56 to ‐0.86) N women (trials): 285 (5) I² = 48% |
NA |
| Hip circumference (cm) | MD: ‐0.97 (‐3.96 to 2.01) N women (trials): 249 (4) I² = 0% |
NA | MD: ‐2.37 (‐3.31 to ‐1.44) N women (trials): 115 (2) I² = 5% |
NA |
| Muscular strength outcomes | ||||
| Lower body strength | SMD: 0.44 (0.09 to 0.78) N women (trials): 637 (10) I² = 74% |
NA | SMD: 0.72 (0.38 to 1.07) N women (trials): 720 (8) I² = 73% |
NA |
| Upper body strength | SMD: 0.42 (0.08 to 0.76) N women (trials): 13 (768) I² = 79% |
NA | SMD: 0.72 (0.30 to 1.14) N women (trials): 832 (8) I² = 86% |
NA |
| Grip strength | MD: 2.37 kg (0.20 to 4.55) N women (trials): 320 (7) I² = 68% |
NA | SMD: 0.24 (‐0.09 to 0.58) N women (trials): 145 (2) I² = 0% |
NA |
| Bone health outcomes | ||||
| Bone mineral content (change and postintervention values) | SMD: 0.04 (‐0.20 to 0.27) N women (trials): 525 (2) I² = 22% |
NA | NA | NA |
| Bone mineral density – femoral neck (change and postintervention values) | SMD: 0.21 (‐0.13 to 0.55) N women (trials): 786 (4) I² = 75% |
NA | NA | NA |
| Bone mineral density – lumbar spine (change and postintervention values) | SMD: 0.22 (‐0.09 to 0.53) N women (trials): 786 (4) I² = 70% |
NA | NA | NA |
| Bone mineral density – total hip (change and postintervention values) | SMD: 0.58 (‐0.02 to 1.18) N women (trials): 329 (3) I² = 97% |
NA | NA | NA |
| Bone formation ‐ Alkaline phosphatase (change and postintervention values) | SMD: ‐0.25 (‐1.81 to 1.31) N women (trials): 239 (2) I² = 89% |
NA | NA | NA |
| Bone resorption ‐ serum NTx (change and postintervention values) | SMD: 0.38 (‐1.58 to 2.34) N women (trials): 278 (3) I² = 97% |
NA | NA | NA |
CI: confidence interval.
MD: mean difference.
NA: not applicable.
OR: odds ratio.
SMD: standardised mean difference.
Sensitivity analysis revealed that significant effects on immediately postintervention follow‐up values and on changes from baseline to end of intervention scores for emotional function were retained when only trials with low risk of bias were analysed (Analysis 18.3; Analysis 18.4). Significant improvement in emotional function was noted in immediately postintervention follow‐up values for QLQ‐C30 emotional function (Analysis 1.10), Profile of Mood States (POMS) total mood disturbance (Analysis 1.24), and POMS anger (Analysis 1.26), but not among postmenopausal only women; these effects were also observed for aerobic exercise and combined aerobic and resistance exercise interventions (interventions of low‐to‐moderate intensity, ≤ 12 weeks' duration, facility‐based, group and individual format physical activity interventions) compared with controls. Significant changes from baseline to end of intervention were found for the FACT emotional well‐being subscale (Analysis 1.15) and the MOS SF mental health scale (Analysis 1.19) among postmenopausal women (aerobic exercise only, light‐to‐moderate intensity, ≤ 12 weeks' duration, facility‐based, individual format interventions) compared with controls. Improvement in FACT emotional well‐being was below the minimum important difference of two points (Cella 2002a).
18.3. Analysis.
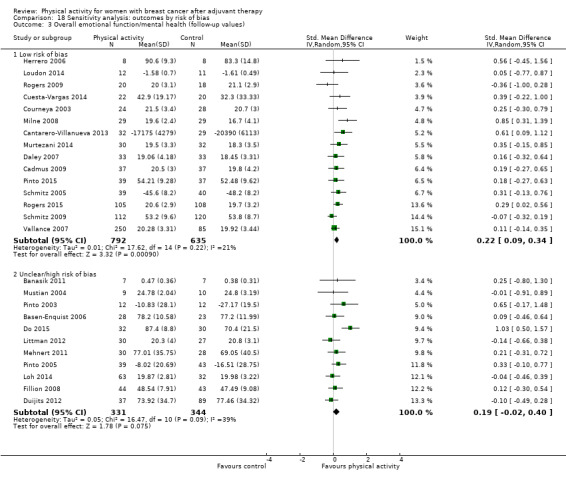
Comparison 18 Sensitivity analysis: outcomes by risk of bias, Outcome 3 Overall emotional function/mental health (follow‐up values).
18.4. Analysis.
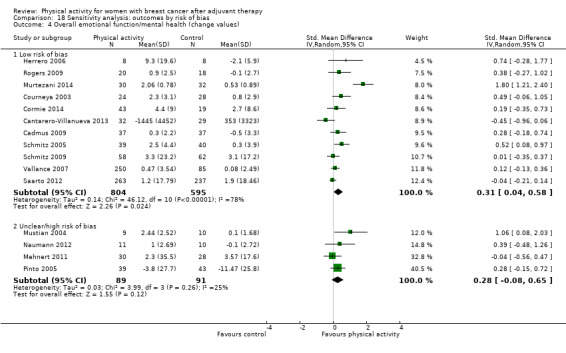
Comparison 18 Sensitivity analysis: outcomes by risk of bias, Outcome 4 Overall emotional function/mental health (change values).
1.24. Analysis.
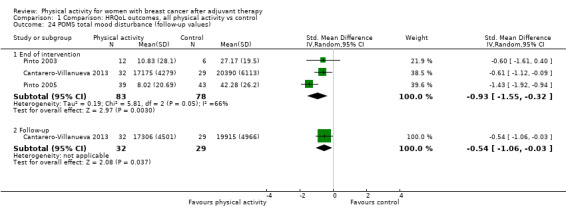
Comparison 1 Comparison: HRQoL outcomes, all physical activity vs control, Outcome 24 POMS total mood disturbance (follow‐up values).
1.26. Analysis.
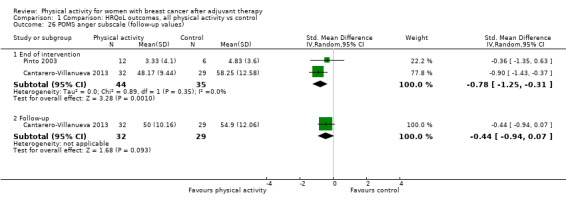
Comparison 1 Comparison: HRQoL outcomes, all physical activity vs control, Outcome 26 POMS anger subscale (follow‐up values).
1.15. Analysis.
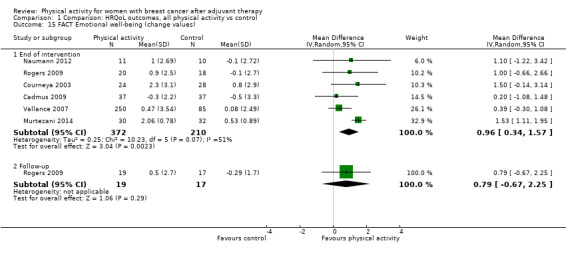
Comparison 1 Comparison: HRQoL outcomes, all physical activity vs control, Outcome 15 FACT Emotional well‐being (change values).
1.19. Analysis.

Comparison 1 Comparison: HRQoL outcomes, all physical activity vs control, Outcome 19 MOS SF Mental health (change values).
Perceived physical function
Analysis of immediately (moderate‐quality evidence) and three months or longer postintervention follow‐up values and changes from baseline to end of intervention scores (moderate‐quality evidence) was possible for perceived physical function; all analyses revealed significant effects for physical activity compared with controls (Analysis 1.29; Analysis 1.30; Table 1; Table 2; Table 5). Removal of the most extreme immediately postintervention follow‐up value ‐ from Milne 2008 ‐ reduced heterogeneity to a level that might not be considered important (I² from 61% to 18%), but removal of the most extreme change from baseline to end of intervention score ‐ from Murtezani 2014 ‐, did not substantially lower heterogeneity. However, heterogeneity could be explained by the wide range of measurement instruments used, physical activity modes, participants' menopausal status, and variations in study duration.
1.29. Analysis.
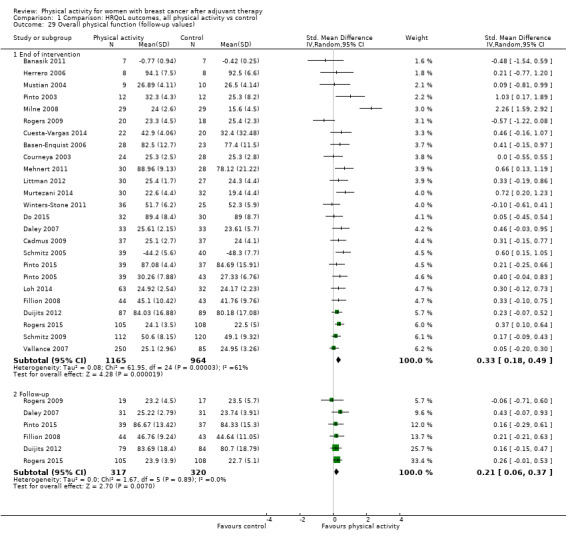
Comparison 1 Comparison: HRQoL outcomes, all physical activity vs control, Outcome 29 Overall physical function (follow‐up values).
1.30. Analysis.

Comparison 1 Comparison: HRQoL outcomes, all physical activity vs control, Outcome 30 Overall physical function (change values).
Effects on immediately postintervention follow‐up values and changes from baseline to end of intervention scores were maintained in a sensitivity analysis of studies with low risk of bias (Analysis 18.5; Analysis 18.6). Subgroup analyses showed significant effects of physical activity on immediately postintervention follow‐up physical function values for FACT physical well‐being and for MOS SF physical function composite and subscale instruments (Analysis 1.31; Analysis 1.33; Analysis 1.35), but not for postmenopausal women only; these effects were also observed for interventions consisting of aerobic exercise only (low‐to‐moderate intensity, ≤ 12 and > 12 weeks' duration, combined home and facility‐based settings, group and individual formats) compared with controls. Improvement in FACT physical well‐being was below the minimum important difference of two points (Cella 2002a). Change from baseline to end of intervention scores was significantly improved for the MOS SF physical function instrument (Analysis 1.36) and for interventions consisting of aerobic exercise only (low‐to‐moderate intensity, ≤ 12 weeks' duration, facility‐based, group format) compared with controls.
18.5. Analysis.

Comparison 18 Sensitivity analysis: outcomes by risk of bias, Outcome 5 Overall physical function (follow‐up values).
18.6. Analysis.
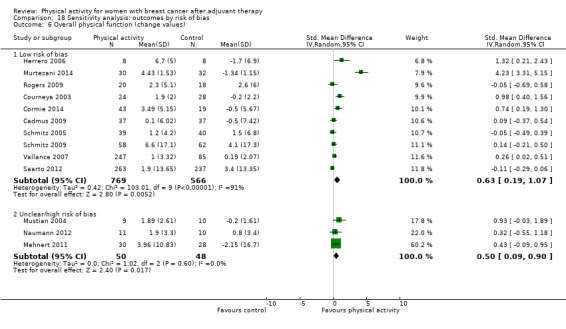
Comparison 18 Sensitivity analysis: outcomes by risk of bias, Outcome 6 Overall physical function (change values).
1.31. Analysis.

Comparison 1 Comparison: HRQoL outcomes, all physical activity vs control, Outcome 31 FACT Physical well‐being (follow‐up values).
1.33. Analysis.
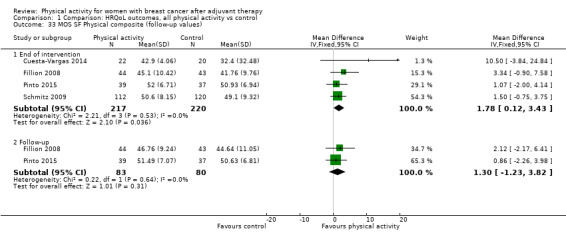
Comparison 1 Comparison: HRQoL outcomes, all physical activity vs control, Outcome 33 MOS SF Physical composite (follow‐up values).
1.35. Analysis.

Comparison 1 Comparison: HRQoL outcomes, all physical activity vs control, Outcome 35 MOS SF Physical function (follow‐up values).
1.36. Analysis.
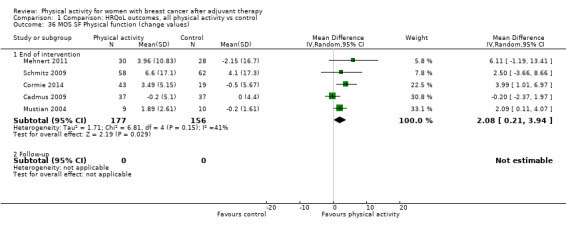
Comparison 1 Comparison: HRQoL outcomes, all physical activity vs control, Outcome 36 MOS SF Physical function (change values).
Role function
Low‐quality evidence suggests that immediately postintervention follow‐up values, but not three months or longer postintervention follow‐up values, or change from baseline to end of intervention scores (analysis of change from baseline to three months or longer postintervention scores was not possible), for role function showed a small statistically significant improvement with physical activity compared with control (Analysis 1.40; Analysis 1.41; Table 5). Heterogeneity was reduced to a level that might not be considered important (I² = 10%) by removal of the most extreme immediately postintervention follow‐up values ‐ from Milne 2008 ‐ and could be explained by the wide range of measurement instruments used, intervention mode intensity, duration, setting, format, and menopausal status.
1.40. Analysis.
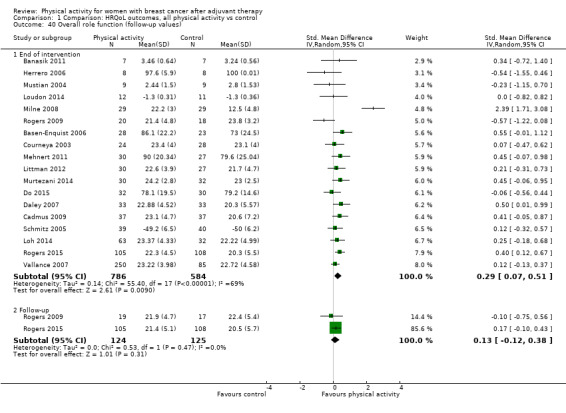
Comparison 1 Comparison: HRQoL outcomes, all physical activity vs control, Outcome 40 Overall role function (follow‐up values).
1.41. Analysis.

Comparison 1 Comparison: HRQoL outcomes, all physical activity vs control, Outcome 41 Overall role function (change values).
Sensitivity analyses revealed significant improvement in immediately postintervention role function values, but not in change from baseline to end of intervention scores, for physical activity interventions with low risk of bias compared with controls (Analysis 18.7; Analysis 18.8). Subgroup analyses revealed that the significant effect on immediately postintervention follow‐up role function values was maintained for the FACT functional well‐being measurement instrument (Analysis 1.42) and for interventions consisting of aerobic exercise only (light‐to‐moderate intensity, ≤ 12 and > 12 weeks' duration, individual format) compared with controls. Significant improvement in change from baseline to end of intervention role function scores was found in analysis of FACT functional well‐being measurement data (Analysis 1.43), but not in other subgroup analyses.
18.7. Analysis.
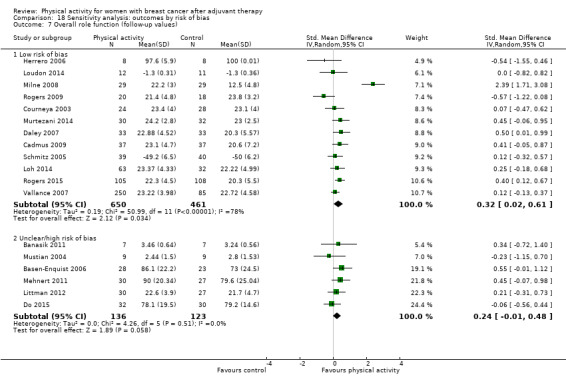
Comparison 18 Sensitivity analysis: outcomes by risk of bias, Outcome 7 Overall role function (follow‐up values).
18.8. Analysis.
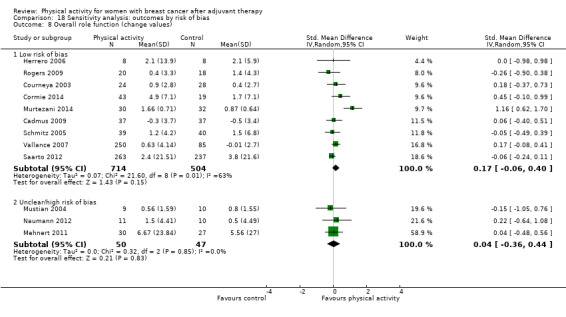
Comparison 18 Sensitivity analysis: outcomes by risk of bias, Outcome 8 Overall role function (change values).
1.42. Analysis.
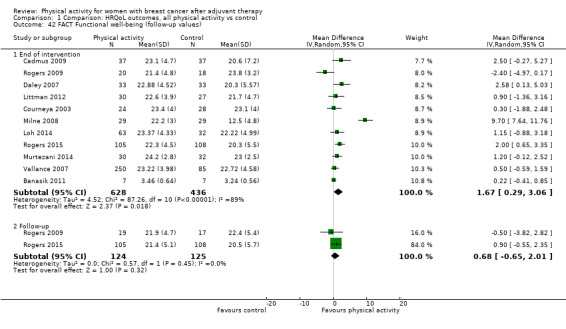
Comparison 1 Comparison: HRQoL outcomes, all physical activity vs control, Outcome 42 FACT Functional well‐being (follow‐up values).
1.43. Analysis.
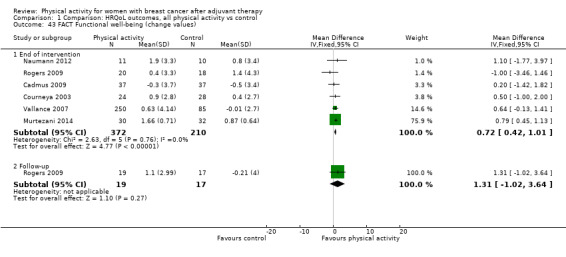
Comparison 1 Comparison: HRQoL outcomes, all physical activity vs control, Outcome 43 FACT Functional well‐being (change values).
Social function
For social function, analysis of both immediately postintervention follow‐up values and change from baseline to end of intervention scores (both moderate‐quality evidence) showed significant improvement with physical activity compared with control (Analysis 1.48; Analysis 1.49; Table 5). Data were insufficient for analyses of three months or longer postintervention follow‐up values or change scores. Heterogeneity observed in the change from baseline to end of intervention scores analysis (I² = 87%) was accounted for by removal of the three most extreme values (Murtezani 2014; Saarto 2012; Vallance 2007), without altering the significant improvement in social function. Heterogeneity in the change from baseline to end of intervention analyses was also explained by the wide range of instruments used and by menopausal status and intervention mode.
1.48. Analysis.

Comparison 1 Comparison: HRQoL outcomes, all physical activity vs control, Outcome 48 Overall social well‐being/function (follow‐up values).
1.49. Analysis.

Comparison 1 Comparison: HRQoL outcomes, all physical activity vs control, Outcome 49 Overall social well‐being/function (change values).
Sensitivity analysis revealed significant improvement in postintervention follow‐up values and in change from baseline to end of intervention scores of social function for physical activity trials with low risk of bias compared with controls (Analysis 18.9; Analysis 18.10). Significant effects on immediately postintervention social function values were maintained in analysis of the FACT social well‐being subscale measurement instrument (Analysis 1.50), and with interventions consisting of aerobic exercise (light‐to‐moderate intensity, ≤ 12 weeks' duration, facility‐based and combined home and facility‐based settings, combined group and individual format) compared with controls. Significant improvement in change from baseline to end of intervention social function scores was found for the FACT social well‐being subscale (Analysis 1.51), among postmenopausal women only, and for interventions consisting of aerobic exercise and combined aerobic and resistance exercise (light‐to‐moderate intensity, ≤ 12 weeks' duration, facility‐based, individual format) compared with controls.
18.9. Analysis.

Comparison 18 Sensitivity analysis: outcomes by risk of bias, Outcome 9 Overall social well‐being/function (follow‐up values).
18.10. Analysis.

Comparison 18 Sensitivity analysis: outcomes by risk of bias, Outcome 10 Overall social well‐being/function (change values).
1.50. Analysis.
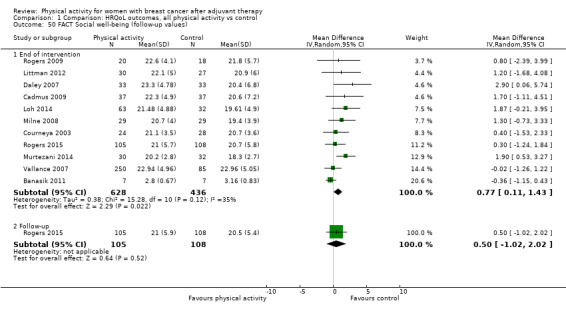
Comparison 1 Comparison: HRQoL outcomes, all physical activity vs control, Outcome 50 FACT Social well‐being (follow‐up values).
1.51. Analysis.
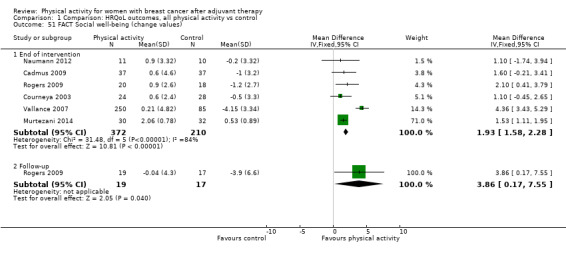
Comparison 1 Comparison: HRQoL outcomes, all physical activity vs control, Outcome 51 FACT Social well‐being (change values).
Cognitive function
We observed a significant but small effect, with no evidence of heterogeneity, of physical activity on cognitive function at immediately postintervention follow‐up (low‐quality evidence), but not at three months or longer postintervention follow‐up, or change from baseline to end of intervention or change from baseline to three months or longer postintervention scores, compared with control (Analysis 1.56; Analysis 1.57; Table 5).
1.56. Analysis.

Comparison 1 Comparison: HRQoL outcomes, all physical activity vs control, Outcome 56 Overall cognitive function (follow‐up values).
1.57. Analysis.

Comparison 1 Comparison: HRQoL outcomes, all physical activity vs control, Outcome 57 Overall cognitive function (change values).
A sensitivity analysis revealed small significant improvement in postintervention follow‐up cognitive function values with physical activity interventions at low risk of bias compared with controls (Analysis 18.11; Analysis 18.12). Subgroup analysis revealed significant improvement in postintervention follow‐up cognitive function values with the POMS confusion subscale (Analysis 1.60), not among postmenopausal women only, and for interventions consisting of combined aerobic and resistance exercise (light‐to‐moderate intensity, all studies ≤ 12 weeks' duration). We observed no significant effect on change from baseline to end of intervention score for physical activity in any of the subgroup analyses.
18.11. Analysis.
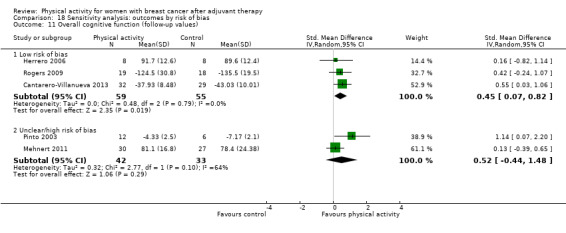
Comparison 18 Sensitivity analysis: outcomes by risk of bias, Outcome 11 Overall cognitive function (follow‐up values).
18.12. Analysis.
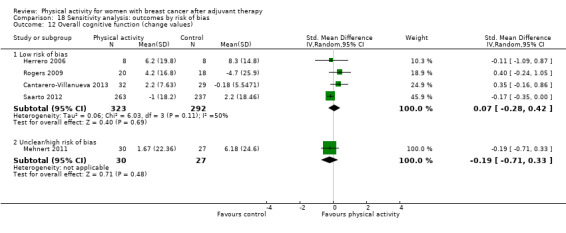
Comparison 18 Sensitivity analysis: outcomes by risk of bias, Outcome 12 Overall cognitive function (change values).
1.60. Analysis.
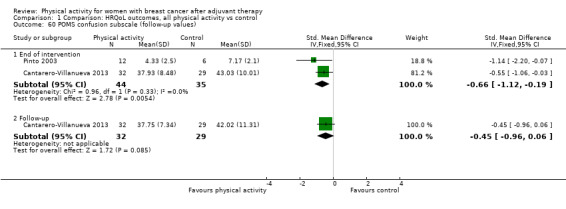
Comparison 1 Comparison: HRQoL outcomes, all physical activity vs control, Outcome 60 POMS confusion subscale (follow‐up values).
General health perspective
Data show no significant effect of physical activity compared with control on overall general health perspective, or in analyses involving individual instruments, studies with low risk of bias, or any other subgroup analysis of follow‐up values and change scores (very low‐quality evidence for both) (Analysis 1.61; Analysis 1.62; Table 5).
1.61. Analysis.
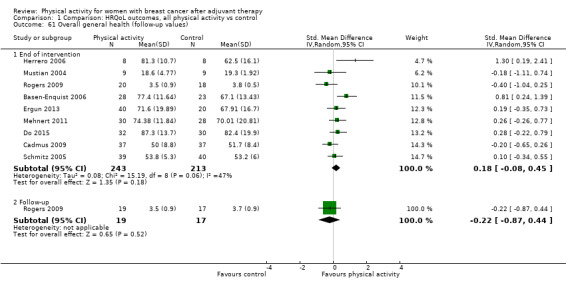
Comparison 1 Comparison: HRQoL outcomes, all physical activity vs control, Outcome 61 Overall general health (follow‐up values).
1.62. Analysis.

Comparison 1 Comparison: HRQoL outcomes, all physical activity vs control, Outcome 62 Overall general health (change values).
Sexual function
Trialists noted no significant effects of physical activity interventions compared with controls on sexual function for follow‐up values or change scores in main or subgroup analyses, or for any reported measure (very low‐quality evidence for both) (Analysis 1.65; Analysis 1.66; Table 5).
1.65. Analysis.

Comparison 1 Comparison: HRQoL outcomes, all physical activity vs control, Outcome 65 Overall sexual function (follow‐up values).
1.66. Analysis.
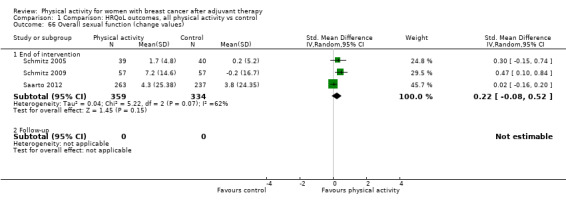
Comparison 1 Comparison: HRQoL outcomes, all physical activity vs control, Outcome 66 Overall sexual function (change values).
Sleep
We observed no significant effects of physical activity on postintervention follow‐up values and on change from baseline scores for overall sleep, any measure of sleep, sensitivity analysis by risk of bias, or subgroup analyses (low‐quality evidence for both) compared with control (Analysis 1.68; Analysis 1.69; Table 5).
1.68. Analysis.

Comparison 1 Comparison: HRQoL outcomes, all physical activity vs control, Outcome 68 Overall sleep (follow‐up values).
1.69. Analysis.

Comparison 1 Comparison: HRQoL outcomes, all physical activity vs control, Outcome 69 Overall sleep (change values).
Studies from which HRQoL subscale data could not be extracted
Data could not be extracted from four trials that reported emotional function (Baruth 2013; Carson 2009; Duijits 2012; McKenzie 2003), five trials that reported perceived physical function (Baruth 2013; Duijits 2012; Heim 2007; Herrero 2006; McKenzie 2003), four trials reporting role function (Baruth 2013; Duijits 2012; Heim 2007; McKenzie 2003), three trials that reported social functioning (Baruth 2013; Duijits 2012; McKenzie 2003), and two trials that reported general health perspective (Duijits 2012; McKenzie 2003). Baruth 2013 observed significant effects on mood (d = 0.30), role‐emotional (d = 0.14), mental health (d = 0.28), physical well‐being (d = 0.38), physical functioning (d = 0.69), and role‐physical function (d = 0.60), but not on social functioning (d = 0.04), as measured via MOS SF‐36, with a walking intervention compared with a control. Duijits 2012 observed a significant effect on physical functioning (d = 0.41) but not on mental health, role‐physical function, social functioning, or general health perspective, as measured via MOS SF‐36, with physical exercise compared with cognitive‐behavioural therapy (CBT), CBT and physical exercise combined, and control. McKenzie 2003 found no significant changes in role‐emotional and mental health, physical functioning, role‐physical function, social functioning, or general health perspective (via MOS SF‐36) in an exercise group compared with a control group. Carson 2009 found no significant postintervention differences in negative mood between yoga and control groups. Heim 2007 reported that increases in physical and functional well‐being (measured via FACT‐G) from baseline to post intervention in both physical activity and control groups were sustained in the only exercise group at three months or longer postintervention follow‐up. Herrero 2006 reported a significant mean change in physical function scale, as assessed via EORTC QLQ‐C30 (P = .04), after an exercise programme compared with a control.
In one trial from which data could not be extracted, Kiecolt‐Glaser 2014 found that cognitive complaints did not differ significantly between a yoga group and a wait‐list group immediately following the intervention (P = 0.25), but participants in the yoga group reported 23% fewer cognitive problems than wait‐list participants at three‐month postintervention follow‐up (P = 0.003). Mehnert 2011 did not report findings from analysis of sexual attractiveness, and Do 2015 did not report sexual functioning and sexual enjoyment outcomes.
Sleep data could not be extracted from two trials (Carson 2009; Payne 2008). Carson 2009 found a significant reduction in sleep disturbance (measured on a 0 to 9 scale) after a yoga intervention compared with control (P = 0.007), but this effect was not sustained after three months' follow‐up (P = 0.17). Payne 2008 found a significant improvement in sleep quality assessed via the Pittsburgh Sleep Quality Index (PSQI) with a 12‐week exercise intervention compared with a control (P =0.007). Payne 2008 also assessed sleep using Actigraph, and observed significant reductions in actual wake time (P = 0.02), actual sleep time (P = 0.05), and movement during sleep (P = 0.002), but no statistically significant improvement in sleep efficiency, with exercise compared with control.
HRQoL‐related outcomes
Anxiety
Data show a significant reduction in anxiety with physical activity interventions, compared with controls, for both immediately postintervention follow‐up values (very low‐quality evidence) and change from baseline to end of intervention scores (low‐quality evidence) (Analysis 2.1; Analysis 2.2; Table 1; Table 2; Table 5). Available data were insufficient for analysis of three months or longer follow‐up values or change scores.
2.1. Analysis.
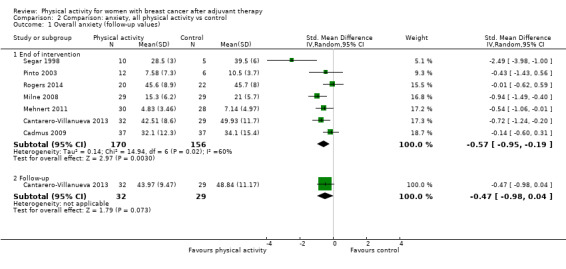
Comparison 2 Comparison: anxiety, all physical activity vs control, Outcome 1 Overall anxiety (follow‐up values).
2.2. Analysis.

Comparison 2 Comparison: anxiety, all physical activity vs control, Outcome 2 Overall anxiety (change values).
Heterogeneity observed in immediately postintervention follow‐up anxiety analysis was lowered to a level that might not be considered important (I² from 60% to 38%) by removal of the most extreme value (Segar 1998), with maintenance of the significant effect of physical activity. Heterogeneity was explained by the range of assessment instruments used, participants’ menopausal status, physical activity mode, and intervention setting and format.
Sensitivity analysis, which was possible only for immediately postintervention follow‐up values, revealed a significant but small effect in physical activity trials with low risk of bias. Subgroup analysis revealed significantly improved immediately postintervention anxiety follow‐up values for the POMS anxiety‐tension subscale (Analysis 2.3), not for postmenopausal women only, with aerobic exercise only (light‐to‐moderate intensity, ≤ 12 weeks' duration, facility‐based, group format interventions). Significant changes from baseline to end of intervention anxiety scores were noted for interventions including combined aerobic and resistance exercise (light‐to‐moderate intensity, ≤ 12 weeks' duration, facility‐based, group format interventions). When the overall effect of physical activity on anxiety was expressed via the 0 to 9 PROMIS (Patient Reported Outcomes Measurement Information System) scale, effects on change from baseline to end of intervention scores, but not on immediately postintervention follow‐up values, for anxiety revealed a minimum important difference improvement above the minimum important difference of 3 to 4.5 units (Table 1; Table 2) (Yost 2011).
2.3. Analysis.

Comparison 2 Comparison: anxiety, all physical activity vs control, Outcome 3 POMS tension ‐ anxiety (follow‐up values).
Depression (i.e. depressive symptoms)
Immediate and three months or longer post‐physical activity intervention follow‐up values (very low‐quality evidence) and change from baseline to end of intervention (low‐quality evidence) showed small significant improvement in depressive symptoms compared with controls (Analysis 3.1; Analysis 3.2; Table 1; Table 2; Table 5). Available data were insufficient for change from baseline to three months or longer postintervention analysis.
3.1. Analysis.
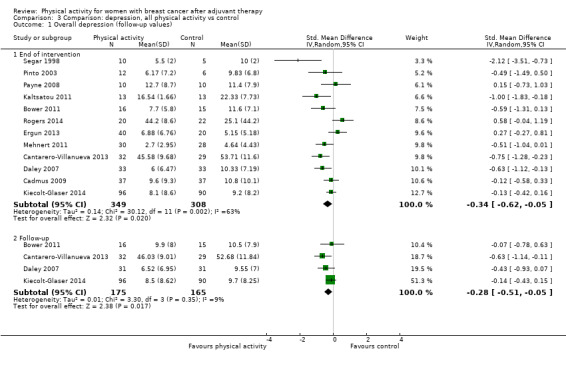
Comparison 3 Comparison: depression, all physical activity vs control, Outcome 1 Overall depression (follow‐up values).
3.2. Analysis.
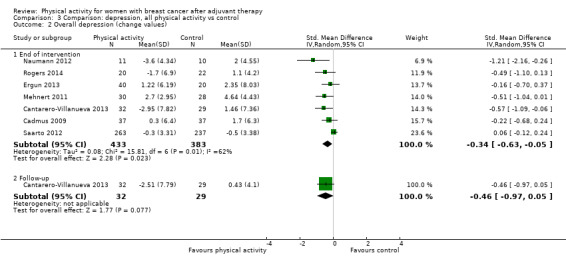
Comparison 3 Comparison: depression, all physical activity vs control, Outcome 2 Overall depression (change values).
Heterogeneity observed in analysis of immediately postintervention follow‐up values and change from baseline to end of intervention scores could be explained by the wide range of measurement instruments used, participants’ menopausal status, physical activity mode and intensity, and variations in intervention duration, setting, and format.
Sensitivity analyses of trials with low risk of bias did not reveal significant effects of physical activity on depression, compared with controls, for immediately postintervention values or change from baseline to end of intervention scores (Analysis 18.23; Analysis 18.24). Subgroup analyses revealed significant effects on immediately postintervention follow‐up depression values for Beck Depression Inventory and Profile of Mood States (POMS) depression and tension measurement instruments (Analysis 3.3; Analysis 3.6; Analysis 3.7), not for postmenopausal women only, with physical activity interventions (≤ 12 weeks' duration, facility‐based, group format) compared with controls. However, improvement on the Beck Depression Inventory was below the minimum important difference of 18% (Button 2015). For change from baseline to end of intervention depression scores, significant effects were found for interventions that consisted of combined aerobic and resistance exercise (light‐to‐moderate intensity, ≤ 12 weeks' duration, facility‐based, group format) compared with controls.
18.23. Analysis.
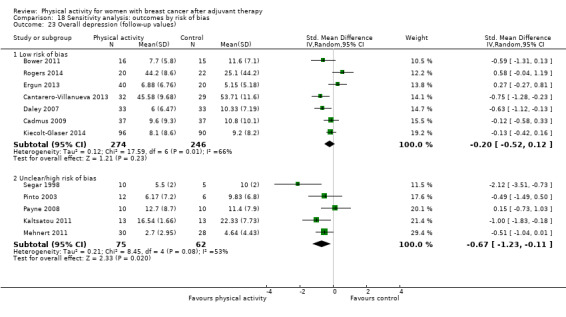
Comparison 18 Sensitivity analysis: outcomes by risk of bias, Outcome 23 Overall depression (follow‐up values).
18.24. Analysis.

Comparison 18 Sensitivity analysis: outcomes by risk of bias, Outcome 24 Overall depression (change values).
3.3. Analysis.
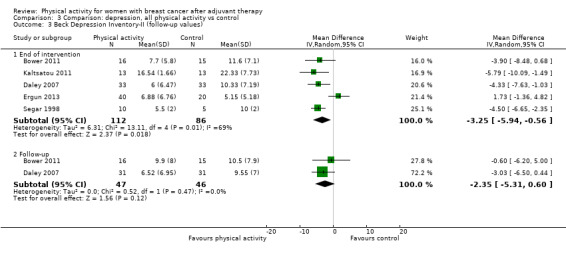
Comparison 3 Comparison: depression, all physical activity vs control, Outcome 3 Beck Depression Inventory‐II (follow‐up values).
3.6. Analysis.
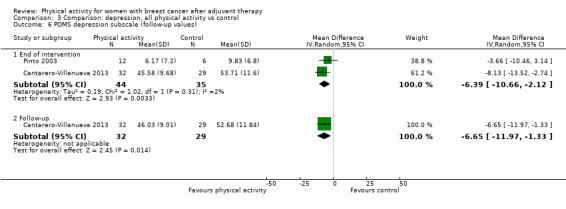
Comparison 3 Comparison: depression, all physical activity vs control, Outcome 6 POMS depression subscale (follow‐up values).
3.7. Analysis.
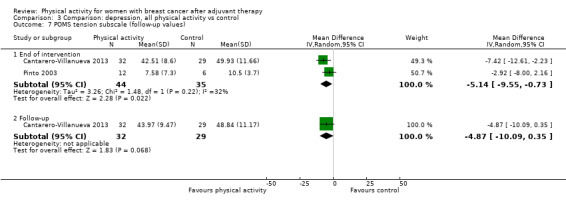
Comparison 3 Comparison: depression, all physical activity vs control, Outcome 7 POMS tension subscale (follow‐up values).
Fatigue
Both immediate (moderate‐quality evidence) and three months or longer post‐physical activity intervention follow‐up values revealed significant but small beneficial effects on fatigue compared with controls (Analysis 4.1; Table 1; Table 5). Change from baseline to three months or longer postintervention values, but not change from baseline to end of intervention scores, demonstrated significant but small improvement in fatigue with physical activity compared with control (Analysis 4.2; Table 2; Table 5).
4.1. Analysis.
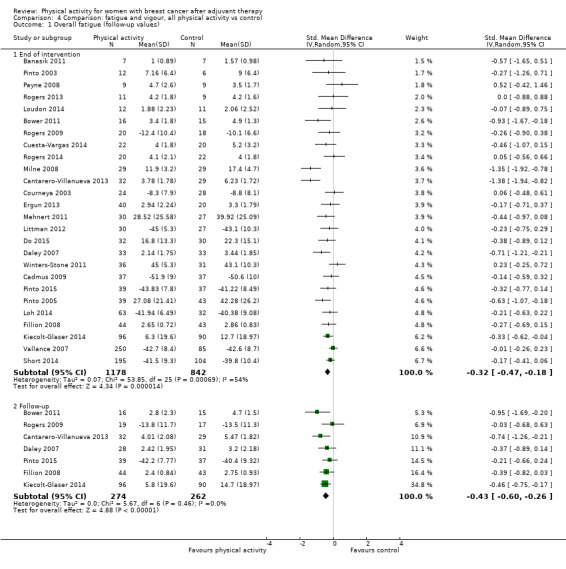
Comparison 4 Comparison: fatigue and vigour, all physical activity vs control, Outcome 1 Overall fatigue (follow‐up values).
4.2. Analysis.

Comparison 4 Comparison: fatigue and vigour, all physical activity vs control, Outcome 2 Overall fatigue (change values).
Removal of the most extreme studies for immediately postintervention follow‐up fatigue values ‐ Cantarero‐Villanueva 2013; Milne 2008 ‐ resulted in heterogeneity that might not have been important (I² = 9%). Heterogeneity was further explained by participants’ menopausal status, physical activity mode, intensity, duration, setting, and format.
For immediately postintervention values only, sensitivity analysis revealed significant effects of physical activity on overall fatigue compared with control for studies with low risk of bias (Analysis 18.25; Analysis 18.26). Subgroup analyses of fatigue revealed significant improvement in immediately postintervention follow‐up values as maintained for EORTC QLQ‐30 fatigue scale, MOS SF vitality, POMS fatigue and vigour scales, and revised Piper Fatigue Scale (PFS) affective/meaning measurement instruments (Analysis 4.5; Analysis 4.12; Analysis 4.16; Analysis 4.20; Analysis 4.22), not for postmenopausal women only, with interventions consisting of aerobic exercise only, combined aerobic and resistance training, yoga, tai chi, qigong, and pilates (light‐to‐moderate intensity, ≤ 12 weeks' duration, facility‐based, group or individual format). For change from baseline to end of intervention fatigue scores, significant effects of physical activity were maintained for combined aerobic and resistance training and for interventions ≤ 12 weeks' duration compared with control. Significant effects for revised PFS total fatigue scores were maintained at three months or longer postintervention follow‐up, whereas significant changes from baseline to three months or longer postintervention values were observed with revised PFS total fatigue scores (Analysis 4.9; Analysis 4.10). When we expressed the overall effect of physical activity on fatigue using the FACT‐F instrument, effects on fatigue immediately post intervention follow‐up values and changes from baseline to end of intervention scores were below the minimum important difference of three units (Cella 2002; Table 1; Table 2). Pooled analysis of only vigour/vitality measures revealed small but significant improvement with physical activity interventions compared with controls, for immediately postintervention and three months or longer postintervention follow‐up values, but not for change from baseline scores (Analysis 4.18; Analysis 4.19; Table 5).
18.25. Analysis.

Comparison 18 Sensitivity analysis: outcomes by risk of bias, Outcome 25 Overall fatigue (follow‐up values).
18.26. Analysis.
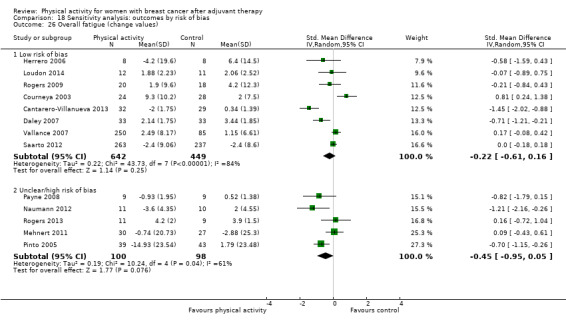
Comparison 18 Sensitivity analysis: outcomes by risk of bias, Outcome 26 Overall fatigue (change values).
4.5. Analysis.
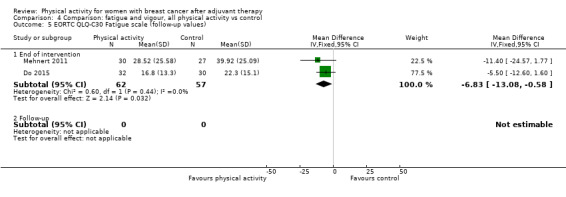
Comparison 4 Comparison: fatigue and vigour, all physical activity vs control, Outcome 5 EORTC QLQ‐C30 Fatigue scale (follow‐up values).
4.12. Analysis.

Comparison 4 Comparison: fatigue and vigour, all physical activity vs control, Outcome 12 Revised Piper Fatigue Scale affective/meaning (follow‐up values).
4.16. Analysis.
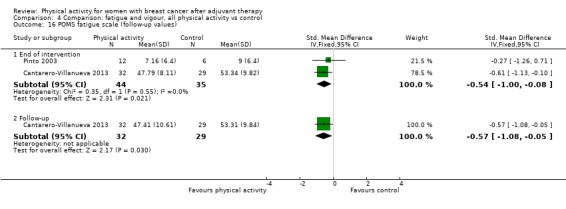
Comparison 4 Comparison: fatigue and vigour, all physical activity vs control, Outcome 16 POMS fatigue scale (follow‐up values).
4.20. Analysis.
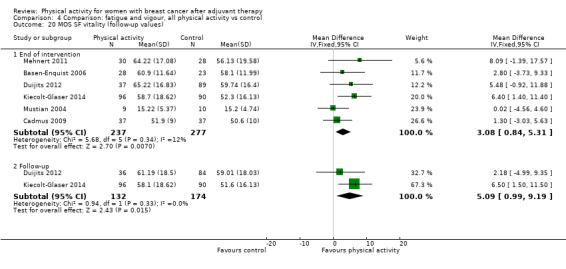
Comparison 4 Comparison: fatigue and vigour, all physical activity vs control, Outcome 20 MOS SF vitality (follow‐up values).
4.22. Analysis.

Comparison 4 Comparison: fatigue and vigour, all physical activity vs control, Outcome 22 POMS vigour scale (follow‐up values).
4.9. Analysis.

Comparison 4 Comparison: fatigue and vigour, all physical activity vs control, Outcome 9 Revised Piper Fatigue Scale total fatigue (follow‐up values).
4.10. Analysis.
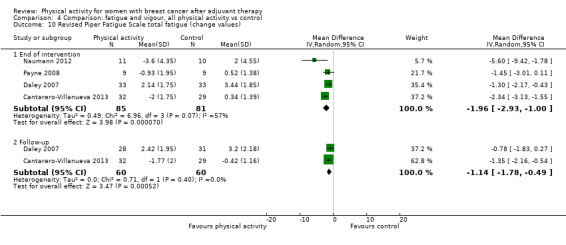
Comparison 4 Comparison: fatigue and vigour, all physical activity vs control, Outcome 10 Revised Piper Fatigue Scale total fatigue (change values).
4.18. Analysis.

Comparison 4 Comparison: fatigue and vigour, all physical activity vs control, Outcome 18 Overall vigour/vitality (follow‐up values).
4.19. Analysis.

Comparison 4 Comparison: fatigue and vigour, all physical activity vs control, Outcome 19 Overall vigour/vitality (change values).
Pain/disability
Low‐quality evidence suggests no significant effect of physical activity compared with control on pain/disability (immediately postintervention follow‐up and change from baseline to end of intervention analyses) both overall and in sensitivity analyses involving studies with low risk of bias (Analysis 5.1; Analysis 5.2; Analysis 18.27; Analysis 18.28; Table 5). No pain/disability data were available for three months or longer postintervention analysis.
5.1. Analysis.
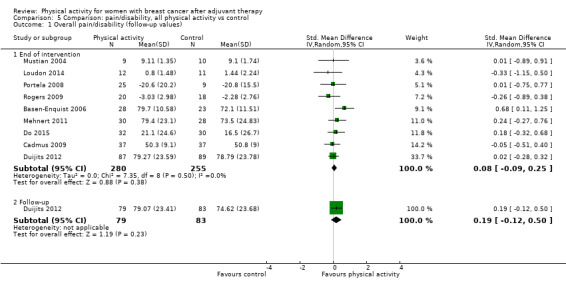
Comparison 5 Comparison: pain/disability, all physical activity vs control, Outcome 1 Overall pain/disability (follow‐up values).
5.2. Analysis.
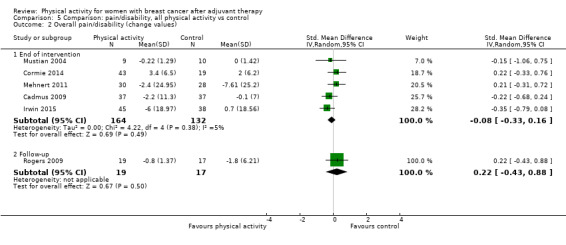
Comparison 5 Comparison: pain/disability, all physical activity vs control, Outcome 2 Overall pain/disability (change values).
18.27. Analysis.

Comparison 18 Sensitivity analysis: outcomes by risk of bias, Outcome 27 Overall pain/disability (follow‐up values).
18.28. Analysis.
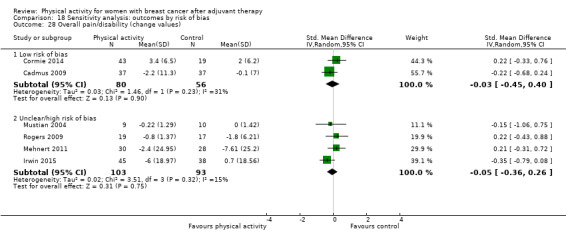
Comparison 18 Sensitivity analysis: outcomes by risk of bias, Outcome 28 Overall pain/disability (change values).
Compared with controls, physical activity led to significant effects only for change from baseline to end of intervention scores for brief pain inventory severity score and disabilities of the arm, shoulder, and hand (DASH) (combined follow‐up and change data) measurement instruments. Subgroup analyses did not reveal significant differences between groups in effects of physical activity on pain/disability for any of the analyses conducted.
Self‐esteem
A small significant effect of physical activity versus control was observed on self‐esteem scores for immediately postintervention follow‐up values (moderate‐quality evidence) but not for changes from baseline to end of intervention scores (low‐quality evidence) or sensitivity analyses of trials with low risk of bias (Analysis 6.1; Analysis 6.2; Analysis 18.21; Analysis 18.22; Table 5). Owing to insufficient data, three months or longer follow‐up or change analyses could not be performed.
6.1. Analysis.
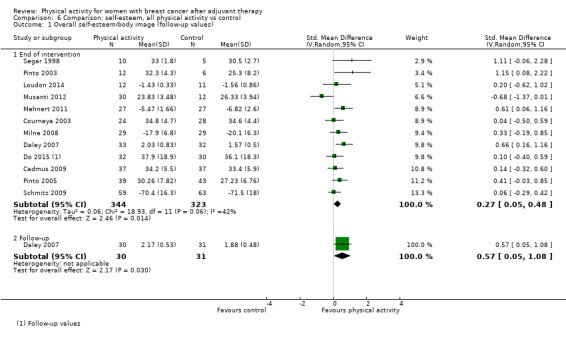
Comparison 6 Comparison: self‐esteem, all physical activity vs control, Outcome 1 Overall self‐esteem/body image (follow‐up values).
6.2. Analysis.

Comparison 6 Comparison: self‐esteem, all physical activity vs control, Outcome 2 Overall self‐esteem/body image (change values).
18.21. Analysis.

Comparison 18 Sensitivity analysis: outcomes by risk of bias, Outcome 21 Overall self‐esteem/body image (follow‐up values).
18.22. Analysis.

Comparison 18 Sensitivity analysis: outcomes by risk of bias, Outcome 22 Overall self‐esteem/body image (change values).
Heterogeneity was reduced to 13% by removal of the most extreme immediately postintervention follow‐up value (Musanti 2012); this was explained by the wide range of measurement instruments used, participants’ menopausal status, physical activity modes and intensity, and variations in intervention duration, setting, and format.
For immediately postintervention values, significant effects of physical activity on self‐esteem, compared with control, were maintained in analyses by the Physical Self‐Perception Profile‐attractiveness of body subscale (Analysis 6.4) (with interventions of light‐to‐moderate intensity, ≤ 12 weeks' duration, facility‐based). A significant effect of physical activity versus control was found for change from baseline to end of intervention scores on the Rosenberg Self‐Esteem (RSE) scale (Analysis 6.7).
6.4. Analysis.

Comparison 6 Comparison: self‐esteem, all physical activity vs control, Outcome 4 Physical self‐perception profile ‐ attractiveness of body (follow‐up values).
6.7. Analysis.
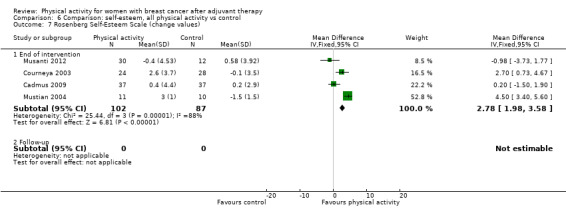
Comparison 6 Comparison: self‐esteem, all physical activity vs control, Outcome 7 Rosenberg Self‐Esteem Scale (change values).
Studies from which HRQoL‐related outcomes data could not be extracted
Five trials assessed both anxiety and depression (Duijits 2012; Fillion 2008; Heim 2007; Loh 2014; Musanti 2012), whereas one additional study measured only depression (Schmitz 2005). No significant differences were found between physical activity and control groups for anxiety assessed via the Depression, Anxiety and Stress Scale (DASS)‐21 (Loh 2014) or the Hospital Anxiety and Depression Scale (HADS) (Heim 2007), for depression assessed via HADS (Duijits 2012; Heim 2007; Loh 2014) or the Center for Epidemiologic Studies (CES) Depression Scale, or for frequency of depression (Schmitz 2005), psychological distress (assessed via HADS) (Duijits 2012), and combined anxiety and depression assessed by POM subscale scores (Fillion 2008). Musanti 2012 used combined anxiety and depression scores from HADS and observed a significant decrease over time only among participants who scored above the threshold of clinical significance on the HADS (score ≥ 11) at baseline (P = .001).
Data could not be extracted from six trials that assessed fatigue (Baruth 2013; Carson 2009; Heim 2007; Musanti 2012; Payne 2008; Peppone 2015). Baruth 2013 found significant small‐to‐moderate improvement in fatigue (d = –0.36) and moderate increases in vigour (d = 0.57) when comparing the walking intervention versus control. Musanti 2012 observed a significant reduction in clinically significant fatigue post physical activity versus control (both P < 0.000), whereas Heim 2007 found that at three months postintervention follow‐up, but not immediately post intervention, fatigue was significantly reduced with physical activity compared with control (P = 0.003). However, Payne 2008 reported no group‐by‐time differences in fatigue. Of two trials that compared yoga interventions versus control, Carson 2009 found significant improvement in fatigue and vigour assessed via 0 to 9 scales (both P < 0.01) with yoga, whereas Peppone 2015 reported significantly greater improvement in fatigue and significantly greater reduction in levels of ‘needing help finishing activities’, time spent in bed, and feelings of heaviness in the body post yoga (all P < 0.05).
We could not extract pain/disability data from three trials (Baruth 2013; Peppone 2015; Carson 2009). Baruth 2013 found no effect on pain (d = –0.04) with a walking intervention compared with control. Compared with control, yoga was found to significantly reduce musculoskeletal symptoms, such as general pain, muscle aches, and total physical discomfort (all P < 0.05) in Peppone 2015, and joint pain in Carson 2009. In the only study from which self‐esteem data could not be extracted (Mustian 2004), a significant improvement in self‐esteem was observed from baseline to post tai chi intervention compared with control (P = 0.04).
All‐cause mortality
No randomised or quasi‐randomised controlled trials reported all‐cause mortality.
Breast cancer recurrences
No randomised or quasi‐randomised controlled trials reported breast cancer recurrence as an outcome. Seven studies reported breast cancer recurrence data as a reason for dropout or as an adverse event, with similar numbers in intervention and control groups (n = 15 and 14, respectively) (Basen‐Enquist 2006; Fillion 2008; Ligibel 2008; Loudon 2014; Nieman 1995; Saarto 2012; Schmitz 2005).
Cardiorespiratory fitness
Data show significant small and large increases in cardiorespiratory fitness when all measurement methods were considered with physical activity interventions compared with controls for immediately postintervention follow‐up values and for change from baseline to end of intervention scores, respectively (SMD 0.44, 95% CI 0.30 to 0.58, I² = 30%, 23 studies, 1265 participants; moderate‐quality evidence; and SMD 0.83, 95% CI 0.40 to 1.27, I² = 82%, 9 studies, 863 participants; very low‐quality evidence, respectively) (Analysis 7.1; Analysis 7.2; Table 1; Table 2). This effect was still evident three months or longer post intervention for both follow‐up values and change from baseline scores (Table 5).
7.1. Analysis.
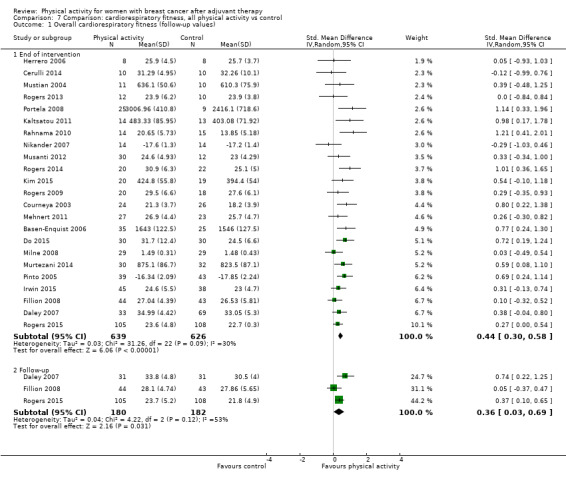
Comparison 7 Comparison: cardiorespiratory fitness, all physical activity vs control, Outcome 1 Overall cardiorespiratory fitness (follow‐up values).
7.2. Analysis.
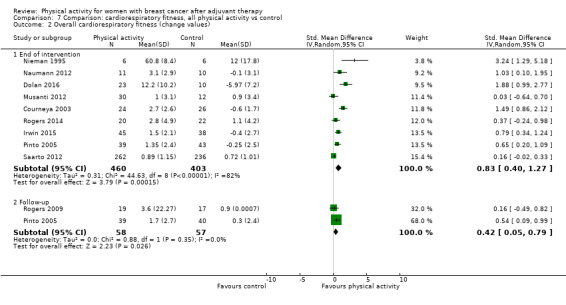
Comparison 7 Comparison: cardiorespiratory fitness, all physical activity vs control, Outcome 2 Overall cardiorespiratory fitness (change values).
Removal of the most extreme value did not reduce heterogeneity in the change from baseline to end of intervention analysis (Nieman 1995). Heterogeneity in change from baseline to end of intervention scores was explained by risk of bias, menopausal status, intervention mode, and duration.
Sensitivity analysis revealed that a significant effect of physical activity versus control was evident across trials with low risk of bias for immediately postintervention follow‐up values, but not for change from baseline to end of intervention scores (Analysis 18.29; Analysis 18.30). When separate measurement methods were considered, significant effects for physical activity, compared with control, were evident for directly assessed VO₂max/peak (mL/kg/min) for both immediate postintervention values and change from baseline to end of intervention scores, estimated VO₂max via a modified Bruce treadmill test (combined follow‐up and change from baseline data), and 6‐minute walk test performance (combined follow‐up and change from baseline data) (Table 5). The mean difference for directly measured VO₂max/peak (1.89 mL/kg/min) was below the improvement of 3.5 mL/kg/min associated with a 13% decrease in risk of all‐cause mortality in the general population (Kodama 2009). However, average improvement in walk distance (MD 54.74 m) exceeded the MCID of 32 to 34 m reported for this test in various clinical populations (Shoemaker 2013).
18.29. Analysis.
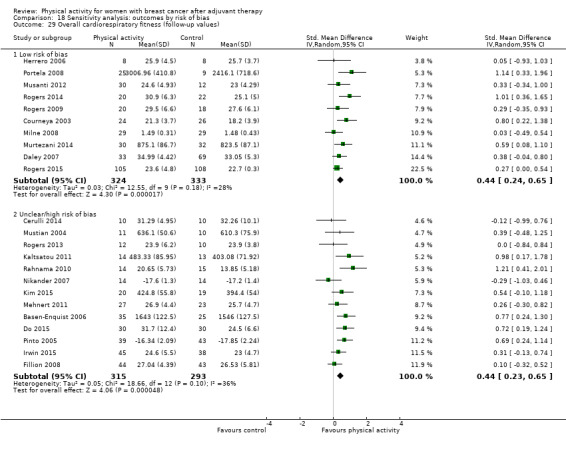
Comparison 18 Sensitivity analysis: outcomes by risk of bias, Outcome 29 Overall cardiorespiratory fitness (follow‐up values).
18.30. Analysis.
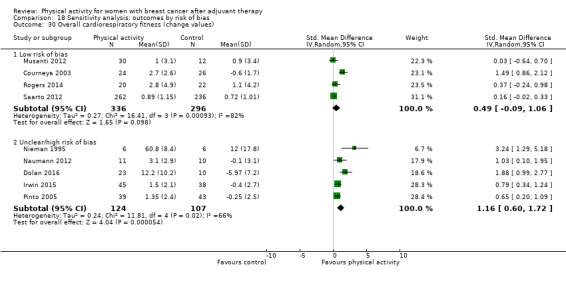
Comparison 18 Sensitivity analysis: outcomes by risk of bias, Outcome 30 Overall cardiorespiratory fitness (change values).
Significant improvement in postintervention follow‐up cardiorespiratory fitness values was maintained for physical activity compared with control in subgroup analysis for postmenopausal women only, for both aerobic exercise and combined aerobic and resistance exercise interventions, regardless of intervention intensity, duration, setting, or format. Significant changes from baseline to end of intervention for cardiorespiratory fitness with physical activity interventions compared with controls were maintained for postmenopausal women only, with both aerobic exercise and combined aerobic and resistance exercise (physical activity modes, interventions of light‐to‐moderate intensity, facility‐based, individual format, regardless of duration).
Studies from which data could not be extracted
Two trials from which we were unable to extract data also reported on cardiorespiratory fitness (DeNysschen 2011; Heim 2007). DeNysschen 2011 (via maximal exercise testing) and Heim 2007 (via the Harvard Step Test) reported no significant improvement in cardiorespiratory fitness with physical activity compared with control.
Other outcomes‐related to cardiorespiratory fitness
In a pooled analysis of just two studies, a significant increase in immediately postintervention follow‐up peak power output during cycle ergometer testing was found for physical activity compared with control (Analysis 7.7). Furthermore, significant reductions were found in immediately postintervention follow‐up values, but not in change from baseline to end of intervention scores, for resting heart rate observed with physical activity interventions compared with controls (Analysis 7.18; Analysis 7.19). Data show no significant effects for physical activity compared with control on peak heart rate and respiratory exchange ratio or resting systolic and diastolic blood pressure (Analysis 7.8; Analysis 7.9; Analysis 7.20; Analysis 7.21; Analysis 7.22; Analysis 7.23).
7.7. Analysis.

Comparison 7 Comparison: cardiorespiratory fitness, all physical activity vs control, Outcome 7 Peak Power Output ‐ cycle ergometer test (follow‐up values).
7.18. Analysis.

Comparison 7 Comparison: cardiorespiratory fitness, all physical activity vs control, Outcome 18 Resting Heart Rate (follow‐up values).
7.19. Analysis.

Comparison 7 Comparison: cardiorespiratory fitness, all physical activity vs control, Outcome 19 Resting Heart Rate (change values).
7.8. Analysis.

Comparison 7 Comparison: cardiorespiratory fitness, all physical activity vs control, Outcome 8 Peak Respiratory Exchange Ratio ‐ cycle ergometer test (follow‐up values).
7.9. Analysis.

Comparison 7 Comparison: cardiorespiratory fitness, all physical activity vs control, Outcome 9 Peak Heart Rate ‐ cycle ergometer test (follow‐up values).
7.20. Analysis.

Comparison 7 Comparison: cardiorespiratory fitness, all physical activity vs control, Outcome 20 Resting Systolic Blood Pressure (follow‐up values).
7.21. Analysis.

Comparison 7 Comparison: cardiorespiratory fitness, all physical activity vs control, Outcome 21 Resting Systolic Blood Pressure (change values).
7.22. Analysis.

Comparison 7 Comparison: cardiorespiratory fitness, all physical activity vs control, Outcome 22 Resting Diastolic Blood Pressure (follow‐up values).
7.23. Analysis.

Comparison 7 Comparison: cardiorespiratory fitness, all physical activity vs control, Outcome 23 Resting Diastolic Blood Pressure (change values).
Physical activity assessed as an outcome measure
For overall self‐reported physical activity, immediately postintervention follow‐up values and change from baseline to end of intervention scores showed significant moderate improvement in intervention groups (SMD 0.52, 95% CI 0.33 to 0.71, I² = 72%, 17 studies, 2012 participants; low‐quality evidence; and SMD 0.57, 95% CI 0.25 to 0.90, I² = 82%, 8 studies, 1274 participants; low‐quality evidence, respectively) compared with control groups (Analysis 8.1; Analysis 8.2; Table 5). These significant effects persisted for both three months or longer postintervention follow‐up values and change from baseline to three months or longer postintervention scores (Table 5).
8.1. Analysis.
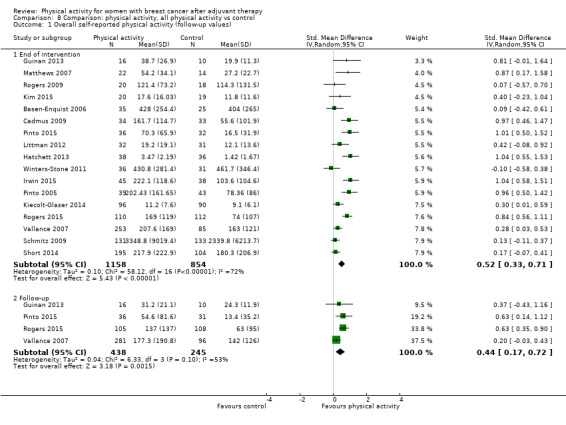
Comparison 8 Comparison: physical activity, all physical activity vs control, Outcome 1 Overall self‐reported physical activity (follow‐up values).
8.2. Analysis.

Comparison 8 Comparison: physical activity, all physical activity vs control, Outcome 2 Overall self‐reported physical activity (change values).
Heterogeneity in self‐reported physical activity analysis was explained by the intervention mode and setting for follow‐up values, participants’ menopausal status, and intervention setting and format for change scores.
For objectively measured physical activity, we found significant small and moderate effects of physical activity interventions compared with controls on both immediately postintervention follow‐up values and change from baseline to end of intervention scores, respectively (SMD 0.43, 95% CI 0.19 to 0.66, I² = 67%, 10 studies, 1248 participants; moderate‐quality evidence; and SMD 0.71, 95% CI 0.14 to 1.29, I² = 83%, 5 studies, 508 participants; low‐quality evidence, respectively) (Analysis 8.17; Analysis 8.18; Table 5). No significant effect was observed for three months or longer postintervention follow‐up values or change from baseline to three months or longer postintervention scores for objectively measured physical activity (Table 5).
8.17. Analysis.
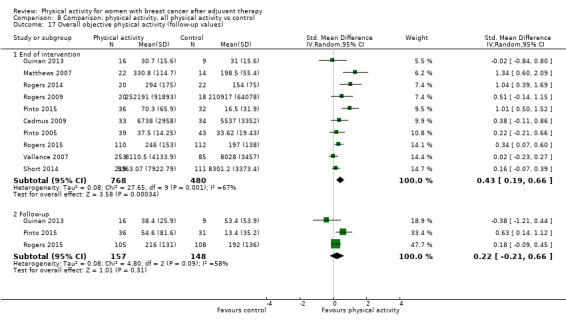
Comparison 8 Comparison: physical activity, all physical activity vs control, Outcome 17 Overall objective physical activity (follow‐up values).
8.18. Analysis.

Comparison 8 Comparison: physical activity, all physical activity vs control, Outcome 18 Overall objective physical activity (change values).
For analysis of change from baseline to end of intervention objective physical activity scores, removal of the most extreme value reduced heterogeneity to levels that might not be important (I² = 0%) (Vallance 2007), while maintaining a significant effect. Heterogeneity was explained in analysis of both immediately postintervention follow‐up and change from baseline to end of intervention by participants’ menopausal status and by intervention intensity, setting, and format.
Sensitivity analyses of trials with low risk of bias maintained significant improvement in both self‐reported and objective physical activity for immediately postintervention follow‐up values, but not for change from baseline to end of intervention scores, compared with controls (Analysis 18.31; Analysis 18.32; Analysis 18.33; Analysis 18.34).
18.31. Analysis.
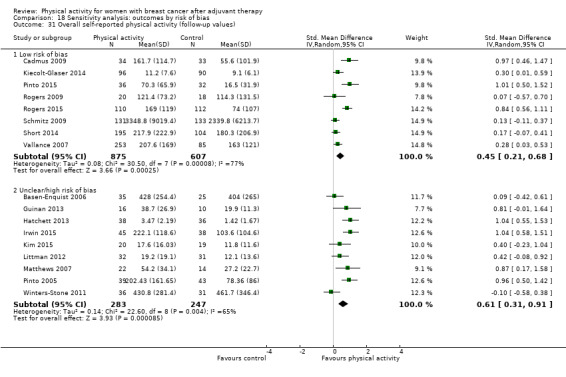
Comparison 18 Sensitivity analysis: outcomes by risk of bias, Outcome 31 Overall self‐reported physical activity (follow‐up values).
18.32. Analysis.
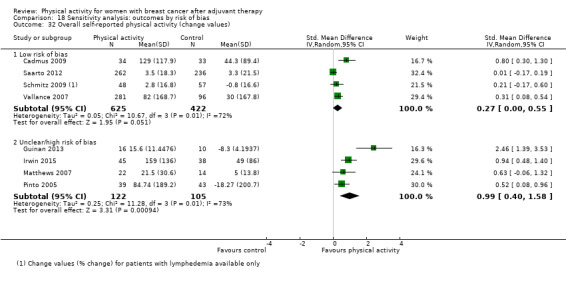
Comparison 18 Sensitivity analysis: outcomes by risk of bias, Outcome 32 Overall self‐reported physical activity (change values).
18.33. Analysis.

Comparison 18 Sensitivity analysis: outcomes by risk of bias, Outcome 33 Overall objective physical activity (follow‐up values).
18.34. Analysis.
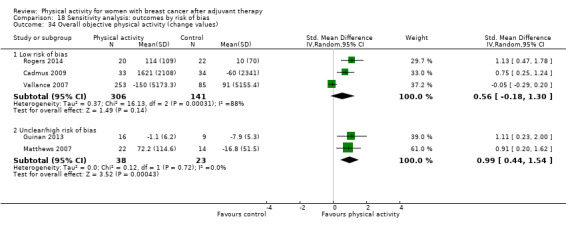
Comparison 18 Sensitivity analysis: outcomes by risk of bias, Outcome 34 Overall objective physical activity (change values).
Analysis of trials that assessed moderate and moderate‐to‐vigorous physical activity immediately postintervention follow‐up values via the self‐report, a seven‐day physical activity recall instrument revealed significant effects of interventions versus controls (Analysis 8.14). Analysis of immediately postintervention follow‐up accelerometer‐derived counts per minute also revealed significant increases with physical activity compared with control interventions (Analysis 8.22).
8.14. Analysis.
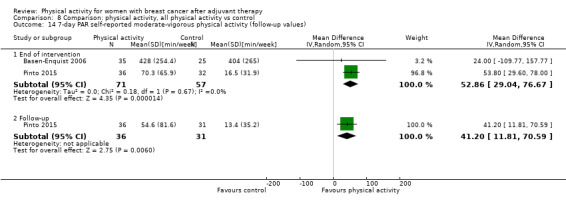
Comparison 8 Comparison: physical activity, all physical activity vs control, Outcome 14 7‐day PAR self‐reported moderate‐vigorous physical activity (follow‐up values).
8.22. Analysis.

Comparison 8 Comparison: physical activity, all physical activity vs control, Outcome 22 Accelerometer counts (follow‐up values).
In subgroup analyses, we found significant effects of physical activity compared with controls on immediately postintervention follow‐up self‐reported physical activity values with aerobic exercise and yoga, tai chi, qigong, and pilates intervention modes, with individual and group and individual intervention formats, in addition to any intervention intensity, duration, or setting. For change from baseline to end of intervention, self‐reported physical activity scores maintained significance regardless of intensity for interventions consisting of aerobic exercise only and combined aerobic and resistance exercise (≤ 12 weeks' duration, home‐based and combined home and facility‐based, individual and combined group and individual formats).
For objective physical activity, significant improvement in immediately postintervention follow‐up values was found for physical activity interventions consisting of aerobic exercise only (light‐to‐moderate intensity, ≤ 12 weeks' duration, home‐based and combined home and facility‐based settings, individual and combined group and individual formats) compared with controls. Compared with controls, interventions of light‐to‐moderate intensity with combined home and facility‐based setting and combined group and individual format maintained a significant effect on objectively measured physical activity change from baseline to end of intervention scores.
With regards to other physical activity outcomes, significant effects of interventions versus controls were found in change from baseline to end of intervention self‐reported walking scores, and in both immediate postintervention follow‐up values and change from baseline to end of intervention scores for self‐reported total and moderate‐intensity physical activity, and for objectively measured moderate‐to‐vigorous physical activity (Table 5). The odds of participants given physical activity interventions meeting recommended physical activity guidelines were significantly greater than for control participants immediately post intervention and at three months or longer post intervention (Table 5). No significant reductions in overall or objectively measured sedentary behaviour were found for physical activity interventions compared with controls (Analysis 8.25; Analysis 8.26; Analysis 8.27).
8.25. Analysis.
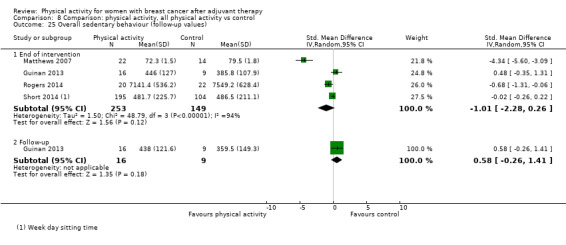
Comparison 8 Comparison: physical activity, all physical activity vs control, Outcome 25 Overall sedentary behaviour (follow‐up values).
8.26. Analysis.

Comparison 8 Comparison: physical activity, all physical activity vs control, Outcome 26 Objective sedentary behaviour (follow‐up values).
8.27. Analysis.

Comparison 8 Comparison: physical activity, all physical activity vs control, Outcome 27 Objective sedentary behaviour (change values).
Studies from which data could not be extracted
Among trials from which no data on physical activity could be extracted, one trial measured the number of walking steps during one week before and in the middle of the 12‐week intervention with a pedometer, but not post intervention (Nikander 2007), and another reported accelerometry data from baseline to post intervention in the intervention group only (Rogers 2013).
Body mass, BMI, body composition, and other anthropometric measurements
Body mass change from baseline to end of intervention, but not immediately postintervention follow‐up body mass values, showed a significant effect of physical activity compared with control (MD ‐0.05 kg, 95% CI ‐0.98 to ‐0.01, I² = 59%, 11 studies, 1047 participants; low‐quality evidence; Analysis 9.1; Analysis 9.2). However, no significant effect of physical activity was found for either follow‐up or change from baseline BMI when compared with control (Analysis 9.3; Analysis 9.4).
9.1. Analysis.
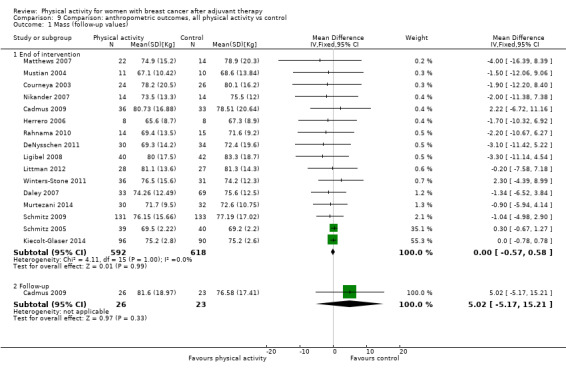
Comparison 9 Comparison: anthropometric outcomes, all physical activity vs control, Outcome 1 Mass (follow‐up values).
9.2. Analysis.

Comparison 9 Comparison: anthropometric outcomes, all physical activity vs control, Outcome 2 Mass (change values).
9.3. Analysis.
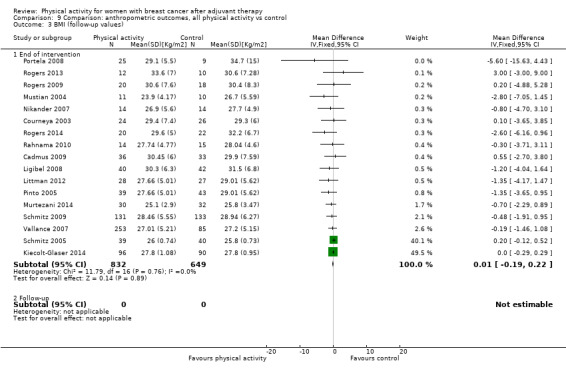
Comparison 9 Comparison: anthropometric outcomes, all physical activity vs control, Outcome 3 BMI (follow‐up values).
9.4. Analysis.
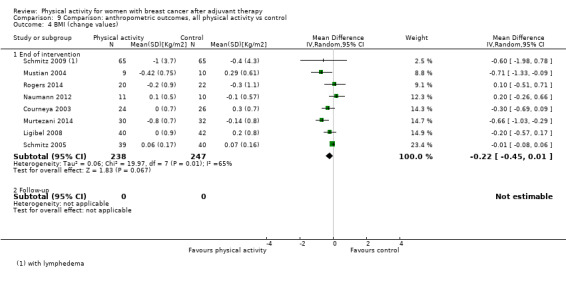
Comparison 9 Comparison: anthropometric outcomes, all physical activity vs control, Outcome 4 BMI (change values).
Physical activity also resulted in a small but statistically significant reduction in postintervention follow‐up values and in change from baseline to end of intervention body fat levels (SMD ‐0.18, 95% CI ‐0.34 to ‐0.03, I² = 35%, 18 studies, 1162 participants; moderate‐quality evidence; and SMD ‐0.62, 95% CI ‐1.19 to ‐0.06, I² = 88%, 9 studies, 499 participants; low‐quality evidence, respectively) compared with controls (Analysis 9.5; Analysis 9.6). Owing to insufficient data, three months or longer data analysis could not be performed for follow‐up values nor for change scores in body mass, BMI, or body fat.
9.5. Analysis.
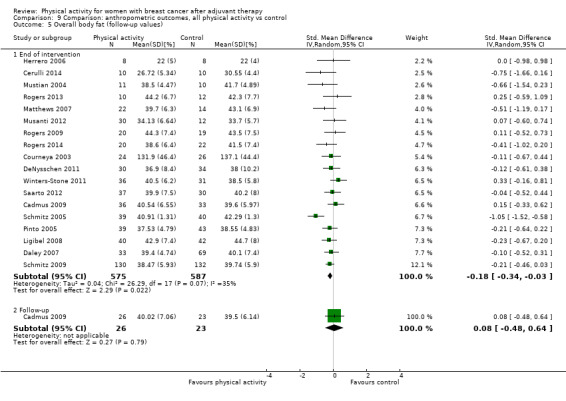
Comparison 9 Comparison: anthropometric outcomes, all physical activity vs control, Outcome 5 Overall body fat (follow‐up values).
9.6. Analysis.
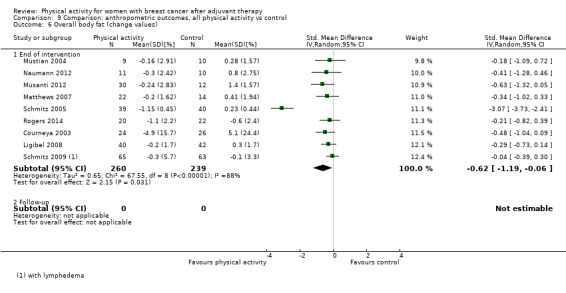
Comparison 9 Comparison: anthropometric outcomes, all physical activity vs control, Outcome 6 Overall body fat (change values).
Removal of the most extreme values reduced heterogeneity to 0% in both body mass ‐ Irwin 2015; Murtezani 2014 ‐ and body fat ‐ Schmitz 2005 ‐ analyses. Heterogeneity in analysis of body mass was explained by participants’ menopausal status and intervention mode and format, whereas heterogeneity observed in body fat analyses was explained by diversity in measurement type, participants’ menopausal status, and intervention mode, intensity, duration, setting, and format.
Sensitivity analysis of physical activity trials at low risk of bias revealed no significant effects on follow‐up nor change in body mass, BMI, and body fat when compared with controls (Analysis 18.35; Analysis 18.36; Analysis 18.37; Analysis 18.38; Analysis 18.39; Analysis 18.40). Analysis by body composition measurement type revealed significant reductions only in change in body fat %, fat mass, and lean mass from baseline to end of intervention as assessed via DEXA and immediately at postintervention follow‐up, as well as change from baseline to end of intervention body fat as measured by bioelectrical impedance analysis (BIA) (Analysis 9.7; Analysis 9.8; Analysis 9.9; Analysis 9.10). Subgroup analyses revealed no significant effects of physical activity on body mass but significant changes in BMI from baseline to end of intervention with aerobic exercise compared with control. Subgroup analyses also showed significant reduction in immediately postintervention follow‐up body fat values with interventions consisting of aerobic exercise (light‐to‐moderate intensity, facility‐based, individual format) and significant reduction in changes in body fat from baseline to end of intervention for aerobic exercise interventions (moderate‐to‐high intensity, ≤ 12 weeks' duration) compared with control.
18.35. Analysis.

Comparison 18 Sensitivity analysis: outcomes by risk of bias, Outcome 35 Mass (follow‐up values).
18.36. Analysis.

Comparison 18 Sensitivity analysis: outcomes by risk of bias, Outcome 36 Mass (change values).
18.37. Analysis.
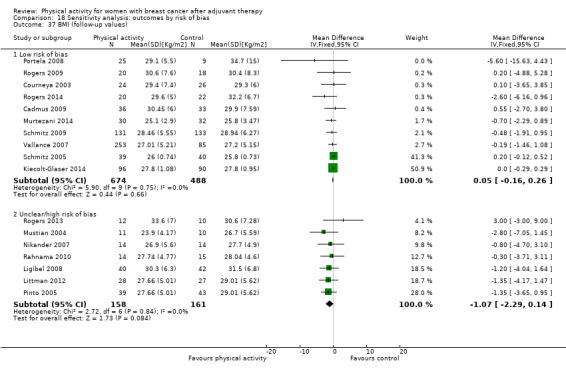
Comparison 18 Sensitivity analysis: outcomes by risk of bias, Outcome 37 BMI (follow‐up values).
18.38. Analysis.

Comparison 18 Sensitivity analysis: outcomes by risk of bias, Outcome 38 BMI (change values).
18.39. Analysis.
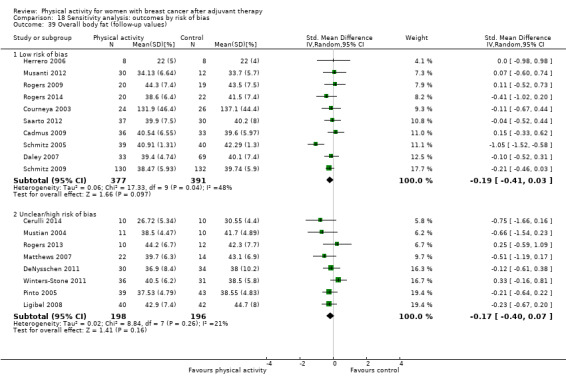
Comparison 18 Sensitivity analysis: outcomes by risk of bias, Outcome 39 Overall body fat (follow‐up values).
18.40. Analysis.
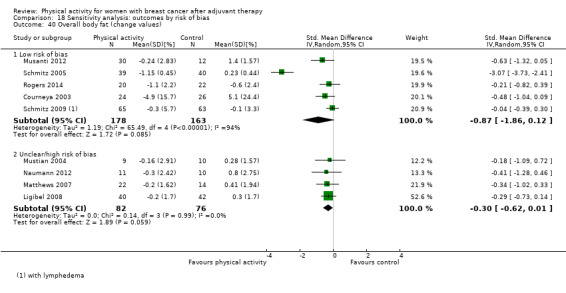
Comparison 18 Sensitivity analysis: outcomes by risk of bias, Outcome 40 Overall body fat (change values).
9.7. Analysis.

Comparison 9 Comparison: anthropometric outcomes, all physical activity vs control, Outcome 7 Percentage body fat ‐ DEXA (follow‐up values).
9.8. Analysis.
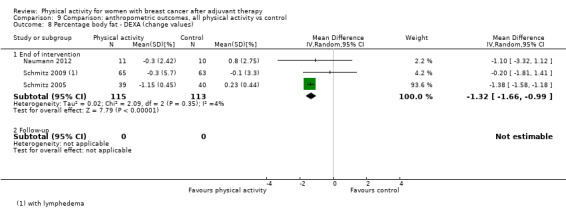
Comparison 9 Comparison: anthropometric outcomes, all physical activity vs control, Outcome 8 Percentage body fat ‐ DEXA (change values).
9.9. Analysis.
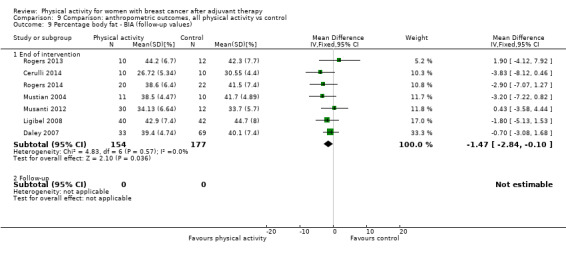
Comparison 9 Comparison: anthropometric outcomes, all physical activity vs control, Outcome 9 Percentage body fat ‐ BIA (follow‐up values).
9.10. Analysis.
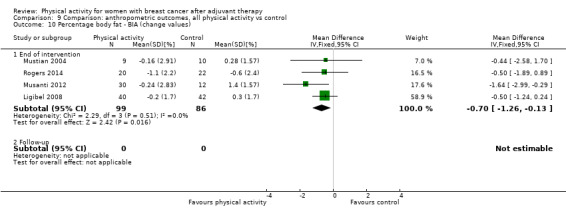
Comparison 9 Comparison: anthropometric outcomes, all physical activity vs control, Outcome 10 Percentage body fat ‐ BIA (change values).
Among other anthropometric measurements, significant effects of physical activity versus control were found for change in both waist and hip circumferences from baseline to end of intervention (MD ‐1.71 cm, 95% CI ‐2.56 to ‐0.86, I² = 48%, 5 studies, 285 participants; and MD ‐2.37 cm, 95% CI ‐3.31 to ‐1.44, I² = 5%, 2 studies, 115 participants, respectively) but not for waist‐to‐hip ratio (WHR) (Analysis 9.20; Analysis 9.21; Analysis 9.22; Analysis 9.23; Analysis 9.24; Analysis 9.25; Table 5).
9.20. Analysis.

Comparison 9 Comparison: anthropometric outcomes, all physical activity vs control, Outcome 20 Waist‐to‐hip ratio (follow‐up values).
9.21. Analysis.

Comparison 9 Comparison: anthropometric outcomes, all physical activity vs control, Outcome 21 Waist‐to‐hip ratio (change values).
9.22. Analysis.

Comparison 9 Comparison: anthropometric outcomes, all physical activity vs control, Outcome 22 Waist circumference (follow‐up values).
9.23. Analysis.
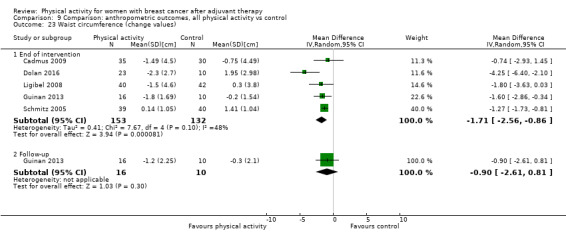
Comparison 9 Comparison: anthropometric outcomes, all physical activity vs control, Outcome 23 Waist circumference (change values).
9.24. Analysis.
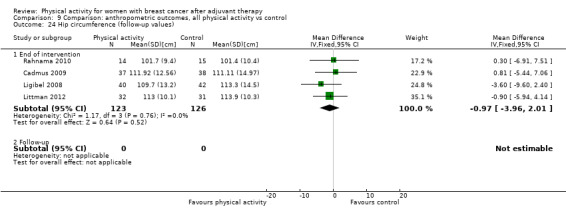
Comparison 9 Comparison: anthropometric outcomes, all physical activity vs control, Outcome 24 Hip circumference (follow‐up values).
9.25. Analysis.
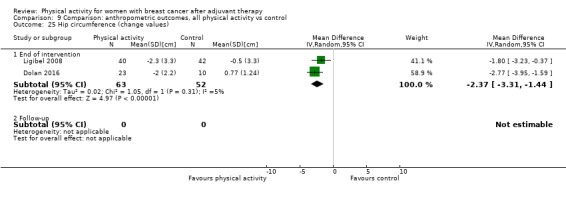
Comparison 9 Comparison: anthropometric outcomes, all physical activity vs control, Outcome 25 Hip circumference (change values).
Studies from which data could not be extracted
Of four trials from which data could not be extracted, one found no changes in body mass (P = 0.53), BMI (P = 0.43), percentage body fat (P = 0.25), or muscle mass (P = 0.46) (Guinan 2013); one observed no significant differences in BMI and body fat percentage at post intervention between supervised exercise and usual care and between supervised exercise and exercise‐placebo (Daley 2007). One trial reported no significant differences between intervention and control conditions at post intervention in BMI and in hip or waist circumference (Basen‐Enquist 2006). Another trial reported postintervention body mass values for the intervention group only (Pinto 2003).
Muscular strength
For immediate postintervention follow‐up values and change from baseline to end of intervention scores, physical activity showed significant increases in lower body (SMD 0.44, 95% CI 0.09 to 0.78, I² = 74%, 10 studies, 637 participants; low quality‐evidence; and SMD 0.72, 95% CI 0.38 to 1.07, I² = 73%, 8 studies, 720 participants; low quality‐evidence, respectively) and upper body (SMD 0.42, 95% CI 0.08 to 0.76, I² = 79%, 13 studies, 768 participants; very low quality‐evidence; and SMD 0.72, 95% CI 0.30 to 1.14, I² = 86%, 8 studies, 832 participants; moderate‐quality evidence, respectively) muscular strength compared with controls (Analysis 10.1; Analysis 10.2; Analysis 10.11; Analysis 10.12). We found insufficient three months or longer data for analysis.
10.1. Analysis.
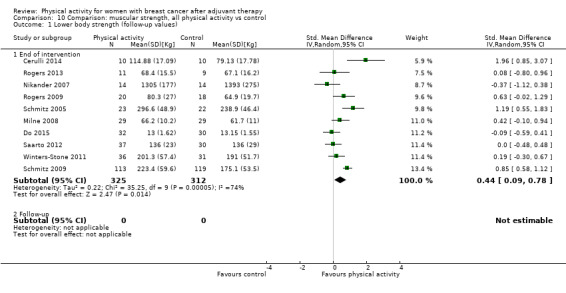
Comparison 10 Comparison: muscular strength, all physical activity vs control, Outcome 1 Lower body strength (follow‐up values).
10.2. Analysis.
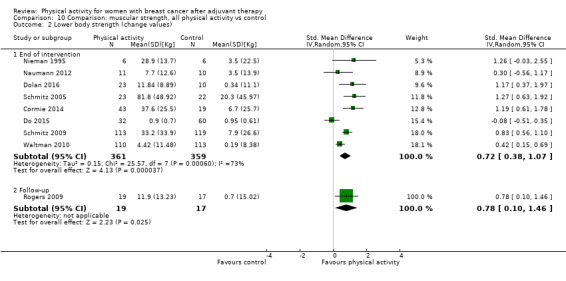
Comparison 10 Comparison: muscular strength, all physical activity vs control, Outcome 2 Lower body strength (change values).
10.11. Analysis.
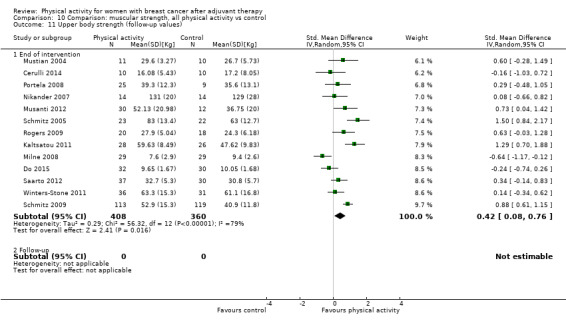
Comparison 10 Comparison: muscular strength, all physical activity vs control, Outcome 11 Upper body strength (follow‐up values).
10.12. Analysis.
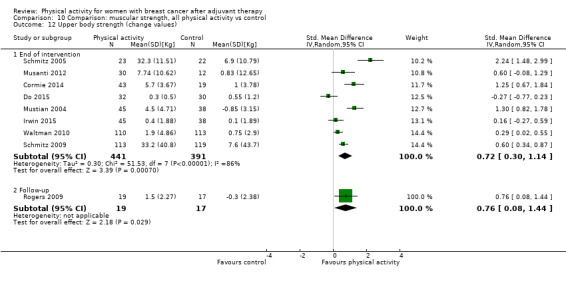
Comparison 10 Comparison: muscular strength, all physical activity vs control, Outcome 12 Upper body strength (change values).
Removal of the most extreme values did not reduce heterogeneity in any analyses. Heterogeneity was explained by intervention mode (follow‐up values and change scores), intensity (follow‐up values and change scores), setting (follow‐up values), and format (change scores) in lower body strength analysis, rather than by participants’ menopausal status (follow‐up values), intervention mode (follow‐up values), setting (follow‐up values and change scores), and format (follow‐up values).
Sensitivity analyses of studies with low risk of bias revealed significant effects for immediately postintervention follow‐up values and change from baseline to end of intervention scores on lower body and upper body strength (Analysis 18.41; Analysis 18.42; Analysis 18.43; Analysis 18.44). In subgroup analyses, we found that physical activity significantly increased immediately postintervention follow‐up lower body strength when measured via leg press (Analysis 10.3) for interventions involving resistance exercise (light‐to‐moderate intensity, > 12 weeks' duration, facility‐based, group and individual formats). Changes in lower body strength from baseline to end of intervention significantly improved when assessed via leg press and leg extension (Analysis 10.4; Analysis 10.7), and for interventions that included a resistance exercise mode (facility‐based, group and individual formats), regardless of intervention intensity and duration.
18.41. Analysis.

Comparison 18 Sensitivity analysis: outcomes by risk of bias, Outcome 41 Lower body strength (follow‐up values).
18.42. Analysis.
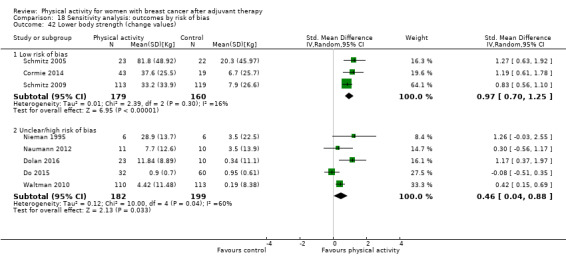
Comparison 18 Sensitivity analysis: outcomes by risk of bias, Outcome 42 Lower body strength (change values).
18.43. Analysis.
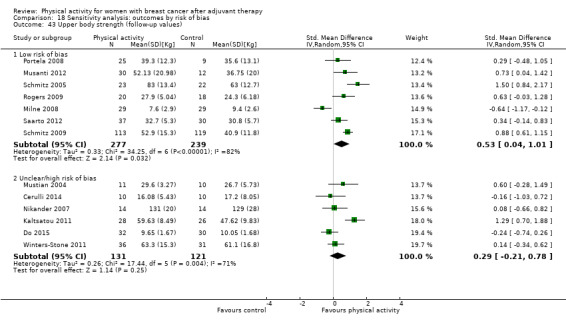
Comparison 18 Sensitivity analysis: outcomes by risk of bias, Outcome 43 Upper body strength (follow‐up values).
18.44. Analysis.
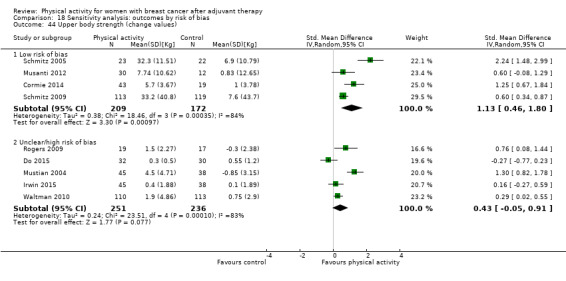
Comparison 18 Sensitivity analysis: outcomes by risk of bias, Outcome 44 Upper body strength (change values).
10.3. Analysis.
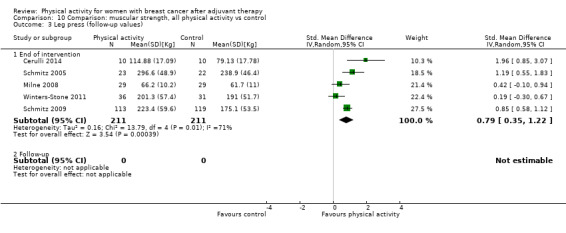
Comparison 10 Comparison: muscular strength, all physical activity vs control, Outcome 3 Leg press (follow‐up values).
10.4. Analysis.
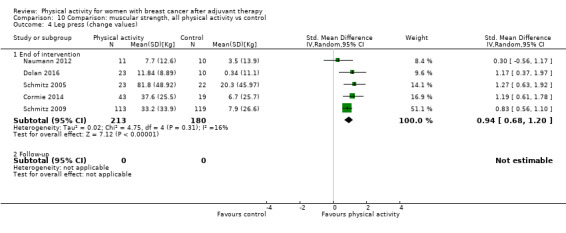
Comparison 10 Comparison: muscular strength, all physical activity vs control, Outcome 4 Leg press (change values).
10.7. Analysis.

Comparison 10 Comparison: muscular strength, all physical activity vs control, Outcome 7 Leg extension (change values).
For immediately postintervention follow‐up upper body strength, subgroup analyses revealed significant effects of physical activity on grip strength values (Analysis 10.15), with interventions involving aerobic exercise or resistance exercise (> 12 weeks' duration, home‐based and home and facility‐based combined settings, combined group and individual format). Significant effects of physical activity on change from baseline to end of intervention values were found via chest press (Analysis 10.14) for interventions consisting of resistance exercise (light‐to‐moderate intensity, > 12 weeks' duration, facility‐based and combined home and facility‐based settings, group format).
10.15. Analysis.

Comparison 10 Comparison: muscular strength, all physical activity vs control, Outcome 15 Grip strength (follow‐up).
10.14. Analysis.
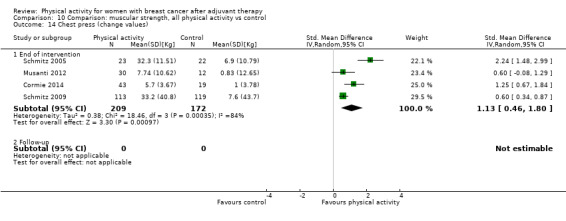
Comparison 10 Comparison: muscular strength, all physical activity vs control, Outcome 14 Chest press (change values).
Studies from which data could not be extracted
Data could not be extracted from three trials (Heim 2007; Ligibel 2008; Musanti 2012). Ligibel 2008 reported only postintervention strength outcomes (measured by recording the maximal weight lifted for each exercise during strength training sessions) for the intervention group only. Heim 2007 reported no time‐by‐group interaction effects for leg extensor and arm flexor strength values, and Musanti 2012 did not report results of analysis of leg press data.
Bone health‐related outcomes
No significant effect of physical activity, compared with control, was found for immediately postintervention follow‐up values and change from baseline to end of intervention scores for BMC, femoral neck, lumbar spine, and total hip BMD values, and alkaline phosphate and serum N‐telopeptides of type I collagen (NTx) concentrations, in the main analysis or in sensitivity analysis of low risk of bias trials (Analysis 11.1; Analysis 11.2; Analysis 11.3; Analysis 11.4; Analysis 11.5; Analysis 11.6).
11.1. Analysis.
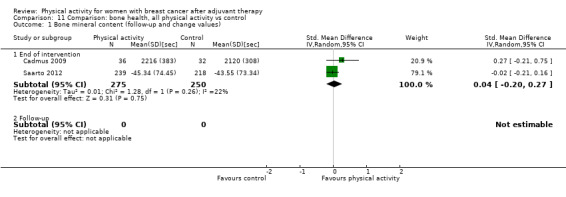
Comparison 11 Comparison: bone health, all physical activity vs control, Outcome 1 Bone mineral content (follow‐up and change values).
11.2. Analysis.

Comparison 11 Comparison: bone health, all physical activity vs control, Outcome 2 Bone mineral density ‐ femoral neck (follow‐up and change values).
11.3. Analysis.
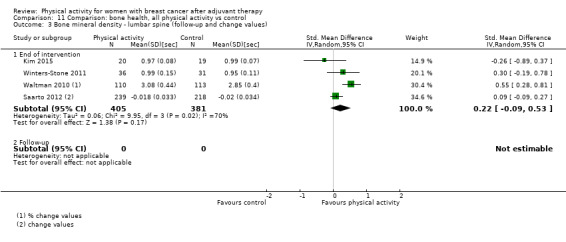
Comparison 11 Comparison: bone health, all physical activity vs control, Outcome 3 Bone mineral density ‐ lumbar spine (follow‐up and change values).
11.4. Analysis.

Comparison 11 Comparison: bone health, all physical activity vs control, Outcome 4 Bone mineral density ‐ total hip (follow‐up and change values).
11.5. Analysis.

Comparison 11 Comparison: bone health, all physical activity vs control, Outcome 5 Bone formation ‐ alkaline phosphatase (follow‐up and change values).
11.6. Analysis.
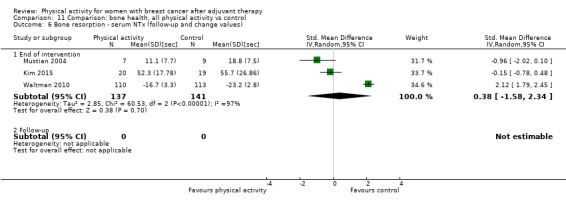
Comparison 11 Comparison: bone health, all physical activity vs control, Outcome 6 Bone resorption ‐ serum NTx (follow‐up and change values).
No significant effects on total or hip BMD were found in any subgroup analyses, whereas analysis of combined follow‐up and change from baseline to end of intervention lumbar spine BMD values revealed significant improvement only for resistance exercise interventions.
One trial from which data could be extracted found no difference for femoral neck and lumbar (L2–L4) bone mineral density (i.e. ‐0.01 change for each measure in both intervention and control groups) (Rogers 2009).
Adverse events
Of the 34 trials that provided data on adverse events, 10 trials reported no adverse events during the trial (Basen‐Enquist 2006; Dolan 2016; Ergun 2013; Herrero 2006; Kim 2015; Loudon 2014; Naumann 2012; Rogers 2009; Waltman 2010; Winters‐Stone 2011). Adverse events reported in intervention groups of the remaining studies included two instances of plantar fasciitis (Cadmus 2009), three reports of discomfort and low‐intensity stiffness (Cantarero‐Villanueva 2013), two recurrences of chronic back and shoulder problems (Irwin 2015), low back pain in one participant (Murtezani 2014), two instances of tendonitis in the shoulder and foot (Musanti 2012), one pelvis stress fracture and 14 further reports of back or lower extremity pain or injury (Rogers 2015), one instance each of chest pain and high blood pressure during a treadmill stress test (Rogers 2014), one report of intervention discontinuation due to chest pain developed during exercise (Pinto 2005), one report each of an asthma episode and a hypoglycaemia episode (Portela 2008), and an unspecified number of self‐resolving musculoskeletal issues (Schmitz 2005). One trial reported a broken hip in one participant, which was not attributed to the yoga or control intervention (Loudon 2014). Ten participants in another trial developed musculoskeletal injuries, but it was not clear how many occurred in each group (Schmitz 2009). Of four trials that reported an impact on lymphoedema as an adverse event, one trial reported that three participants in the intervention group developed lymphoedema (Murtezani 2014), and three trials reported no lymphoedema exacerbations (Cormie 2014; Schmitz 2005; Schmitz 2009). Indeed in Schmitz 2009, the intervention group experienced reduced risk.
With regards to medical complications and poor health, one study reported medical complications as an adverse event in two control participants (Daley 2007). Payne 2008 reported worsening health condition as a reason for dropping out of the trial in both intervention and control groups (no numbers per group were provided); one participant each in the intervention and control groups reported health issues during Pinto 2015, four participants in the intervention group developed poor health leading to missing data in Short 2014, one participant in the intervention group and four in the control group discontinued the study because of poor health in Winters‐Stone 2011, and in another study (Waltman 2010), continuation of health problems was a cause of missing data for two participants in the control group. Finally, one trial reported cognitive deficit leading to study discontinuation for 10 participants (Mustian 2004).
Discussion
Summary of main results
We included 63 trials with a total of 5761 women with breast cancer post adjuvant therapy randomised to physical activity intervention (n = 3239) or comparison (n = 2524) groups. Modes of physical activity interventions differed across trials and included aerobic exercise such as walking, cycling, and water‐based exercise; resistance training; and yoga, pilates, qigong, or tai chi. Investigators examined a wide and diverse range of outcomes and measures across trials, including health‐related quality of life (HRQoL), HRQoL‐related and psychological outcomes, cardiorespiratory fitness, physical activity as an outcome, anthropometric outcomes, muscular strength, and bone health outcomes. Attrition was a problem across trials, with one‐fifth of trials reporting that at least 20% of participants dropped out of the intervention group. Similarly, few trials reported that participants had complied with the amount of physical activity prescribed, and approximately one‐quarter of the targeted number of sessions were missed on average across trials reporting such data.
Physical activity interventions of a median of 12 weeks' duration resulted in significant small‐to‐moderate improvements in HRQoL, emotional function, perceived physical function, social function, anxiety, cardiorespiratory fitness, physical activity (both self‐reported and objectively measured), body fat, and lower and upper body strength in analysis of both immediately postintervention follow‐up values and change from baseline to end of intervention scores. Role function, cognitive function, depression, fatigue, vigour, and self‐esteem improved only with physical activity interventions in analysis of immediately postintervention follow‐up values, and only body mass and waist and hip circumferences were significantly reduced in the change from baseline to end of intervention scores analysis only. No significant improvements were noted in immediately postintervention follow‐up values or change from baseline to end of intervention scores for general health, sexual function, sleep, pain, body mass index (BMI), waist‐to‐hip ratio (WHR), bone mineral content (BMC), BMD of the femoral neck, lumbar spine, or hip, and measures of bone formation (alkaline phosphatase) and bone resorption (serum biomarker N‐terminal telopeptide (NTx)). Unfortunately, we could not find any evidence on effects of physical activity on breast cancer‐related mortality, breast cancer recurrence, or all‐cause mortality. Also, relatively few adverse events were reported across the included trials, suggesting that physical activity is safe for patients with breast cancer after they have received adjuvant therapy. Only HRQoL, perceived physical function, anxiety, cardiorespiratory fitness, and both self‐reported and objective physical activity were considered precise effect estimates (i.e. 95% confidence intervals (CIs) do not include a harmful effect, or show no effect or negligible effects, and effects exceed a minimal important difference) for both immediately postintervention follow‐up values and change from baseline to end of intervention score analyses, although effects on cognitive function, fatigue, and vigour were precise for immediately postintervention values alone, and social function and lower and upper body strength effects were precise for change from baseline to end of intervention scores only. When effects were re‐expressed using the most commonly employed measure, physical activity interventions led to meaningful important differences (using change from baseline scores) in only HRQoL and anxiety (Table 2).
Available evidence regarding sustainability of the benefits of physical activity was limited because only 14 studies included a follow‐up period of three months or longer beyond the end of the intervention for all conditions. Physical activity intervention improvements were sustained three months or longer post intervention for fatigue, cardiorespiratory fitness, and self‐reported physical activity for both follow‐up values and change from baseline scores. Beneficial effects on emotional health, physical function, depression, and vigour were still apparent in analysis of immediately postintervention follow‐up values, and improvements in HRQoL remained significant in analysis of change from baseline to three months or longer post intervention. However, no significant improvements were found for physical activity interventions after three months or longer post intervention in analysis of follow‐up values or change from baseline scores for cognitive function and objectively measured physical activity; or of follow‐up values for HRQoL, role function, sit‐to‐stand performance, or change from baseline scores for emotional function values. No analysis was possible for general health perspective, sexual function, sleep, anxiety, pain, self‐esteem, body mass, BMI, body fat %, WHR, waist and hip circumferences, upper and lower body strength, or bone health outcomes of three months or longer postintervention follow‐up values or change from baseline to three months or longer postintervention scores.
We performed subgroup analysis by intervention mode, intensity, duration, setting, and format, wherever possible. Caution is required when interpreting these analyses owing to small sample sizes and high heterogeneity. Regarding mode of physical activity, both aerobic exercise and combined aerobic and resistance exercise interventions improved HRQoL and cardiorespiratory fitness, and aerobic exercise interventions resulted in greater increases in HRQoL‐related outcomes, such as emotional, perceived physical, and social function, and in self‐reported physical activity. Resistance exercise interventions were superior for improving upper and lower body strength, and combined aerobic and resistance exercise interventions led to reduced fatigue. Interventions of light or light‐to‐moderate intensity appeared to be more effective than those described as moderate or moderate‐to‐high intensity for improving HRQoL, emotional function, perceived physical function, social function, anxiety, cardiorespiratory fitness, objectively measured physical activity levels, and lower body muscular strength. Physical activity interventions longer than 12 weeks in duration were more effective than interventions of 12 weeks or less for improving only upper and lower body muscular strength, but interventions of 12 weeks or less were superior in improving HRQoL, emotional function, perceived physical function, social function, anxiety, depression, and fatigue. It appears that interventions that were facility‐based were more effective than home‐based interventions and those utilising combined home and facility‐based physical activity in improving HRQoL, emotional function, perceived physical function, social function, anxiety, depression, and lower body strength. However, both home‐based and combined home and facility‐based interventions were superior in improving self‐reported physical activity, although greater increases in objectively measured physical activity and upper body strength were observed in combined home and facility‐based interventions. Group‐based and individual‐based interventions appear to be effective in improving HRQoL and lower body strength among breast cancer survivors compared with combined (both group‐ and individual‐based) interventions, whereas individual‐based and combined interventions were more effective than group‐based interventions for improving self‐reported physical activity. Group‐based interventions were more effective in improving emotional function, perceived physical function, anxiety, and depression, whereas individual‐based interventions were superior for cardiorespiratory fitness, and combined interventions were better for improving objective physical activity.
Overall completeness and applicability of evidence
The current review draws upon trials from across the world, although most trials were based in North America. This review includes 63 trials, of which 60 were randomised controlled trials (RCTs) and three were quasi‐RCTs (we excluded non‐randomised controlled trials) consisting of a total of 5761 participants. All trials included only participants with a diagnosis of breast cancer who had completed adjuvant cancer treatment (except for endocrine therapy). We excluded trials in which all participants had received a diagnosis of metastatic breast cancer (two trials), but five of the eligible trials included a small number of patients with metastatic breast cancer. Eligible trials used a wide range of intervention modes; however, most trials provided aerobic‐based activity (e.g. walking, cycling, Nordic walking, dance, water‐based exercise, horse‐riding), and only seven trials included a resistance training‐only study arm. Similarly, only one trial was available for each of pilates, qigong, and tai chi. We included trials only when it was possible to isolate effects of physical activity; therefore, we excluded interventions that combined physical activity with calorie restriction, manual therapy, or cognitive‐behavioural therapy components if studies included a no physical activity control group that did not receive the additional component. The Characteristics of included studies table provides detailed information on trial attributes.
We obtained information from several electronic databases through a comprehensive search strategy (Cochrane Breast Cancer Group Specialised Register, MEDLINE PubMed, Embase, Central Register of Controlled Trials (CENTRAL) in the Cochrane Library, Cumulative Index to Nursing and Allied Health Literature (CINAHL), Physiotherapy Evidence Database (PEDro), SPORTDiscus, PsycINFO, OpenGrey, and Health Management Information Consortium (HMIC)) and via review of reference lists of other reviews on the topic (i.e. physical activity/exercise and cancer) and reference lists of all included trials. We identified future potentially eligible trials via the World Health Organization (WHO) International Clinical Trials Registry Platform (ICTRP) and clinicaltrials.gov. We applied no language or date restrictions in our search strategy. We included all outcomes apart from those related to specific impairments in the shoulder, the arm, or both (e.g. range of motion, arm volume, arm circumference), as well as blood biomarkers, which we excluded because they were beyond the scope of the current review. See Search methods for identification of studies for details.
Regarding applicability of evidence, owing to underreporting of sociodemographic characteristics of participants (cancer stage, cancer treatment received, race/ethnicity, menopausal status, education level, annual income, and baseline physical activity levels and body mass/BMI), a thorough comparison between trials with assessment of the generalisability of findings was not possible. However, based on the characteristics reported, most patients with breast cancer who were enrolled in eligible trials had stage I‐III cancer, received chemotherapy, and were undergoing endocrine therapy. Most participants were postmenopausal and Caucasian, earned over USD 40,000, received at least a high school education (47% attained at least a University degree), and were overweight (BMI ≥ 25 kg/m²). These characteristics would potentially limit the applicability of evidence to a broader population of patients with breast cancer.
Interventions tested in eligible trials were diverse in terms of mode, frequency, intensity, and duration, as well as sessions, setting, and format. As evidenced in our subgroup analysis, a paucity of data is available regarding the efficacy of activity modes, such as yoga (n = 8), resistance training (n = 7), pilates (n = 1), qigong (n = 1), and tai chi (n = 1); settings (facility‐based vs home‐based vs facility and home‐based combined); and formats (individual‐based vs group‐based vs combined individual and group‐based) across many of the outcomes examined in the current review. Variation in these important elements required to make physical activity recommendations limits the precision of evidence‐informed decision making and applicability of findings. Furthermore, most trials were short‐term (≤ 12 weeks' duration), and only a minority of trials included postintervention follow‐up to assess the sustainability of intervention effects. Only one trial included a follow‐up assessment 12 months post intervention. Most of the remaining studies included follow‐up only at three months or less post intervention. Thus it is unclear how sustainable the beneficial effects of physical activity interventions would be.
Unfortunately, we could not provide an analysis of effects of physical activity interventions on one of our primary outcomes ‐ breast cancer‐related mortality ‐ because currently no randomised or quasi‐randomised controlled trials have reported this outcome. Similarly, physical activity interventions for breast cancer recurrence and all‐cause mortality could not be investigated owing to lack of available data. We assessed outcomes for which sufficient data were available using a wide range of instruments with varying psychometric properties (i.e. level of measurement, reliability, validity, responsiveness) (see analysis). Although analysis of outcomes by different instrument types used revealed varying intervention effects, sample size was small in many analyses. Furthermore, HRQoL and subscales and HRQoL‐related psychological outcomes were reliant on self‐report and therefore were at risk of biases such as recall and social desirability. We included analyses of both follow‐up values and change from baseline values; however, owing to underreporting, change from baseline analyses included smaller sample sizes than were included in analyses of follow‐up values. Similarly, small samples for analyses of sleep, anxiety, waist‐to‐hip ratio, and waist and hip circumferences precluded firm conclusions.
Quality of the evidence
The GRADE system revealed moderate‐quality evidence by end of intervention follow‐up for change from baseline to end of intervention values analyses of HRQoL, physical function, and social function; for follow‐up values analyses of BMI, body fat %, cardiorespiratory fitness, emotional function, fatigue, self‐esteem, and objective physical activity; and for change from baseline values analysis of upper body strength (Guyatt 2008). Low‐quality evidence was provided by the end of intervention follow‐up for change from baseline to end of intervention values analyses of cognition, sleep, pain, role function, self‐reported physical activity, and lower body strength; for follow‐up values analyses of depression and mass; and for change from baseline values analyses of anxiety, BMI, body fat %, emotional function, fatigue, objective physical activity, and self‐esteem. Although very low‐quality evidence was provided by end of intervention follow‐up for change from baseline to end of intervention values analyses of femoral neck, lumbar spine, and hip BMD, general health, and sexual function, follow‐up values analyses included anxiety and upper body strength and change from baseline values analyses of depression, cardiorespiratory fitness, and upper body strength. Specifically, all trials were at risk of performance bias owing to inability to blind study participants to administration of physical activity. Most trials were at risk of selection bias owing to inadequate or unclear allocation concealment, detection bias, lack of blinding of outcome assessors, and attrition bias due to incomplete outcome data reporting (most often as a result of high attrition and inadequate handling of missing data). However, a large number of trials were at unclear risk of selection and detection bias, which may reflect poor quality of reporting rather than poor methodological practices. When we performed sensitivity analyses of both immediately postintervention values and change from baseline to end of intervention by including only trials at lower risk of bias, we found that effects of physical activity interventions on HRQoL, emotional function, physical function, social function, anxiety, and lower body and upper body muscular strength remained significant and were of similar or higher magnitude than when all studies were included.
When considering both end of intervention follow‐up and change from baseline to end of intervention values, we found precise estimates of effects of physical activity interventions on HRQoL, self‐reported physical function, cardiorespiratory fitness, and both self‐reported and objective physical activity. In addition, precise effect estimates were provided from change values analyses of social function, lower and upper body strength, and end of intervention follow‐up fatigue. Heterogeneity was evident in all outcomes, except for sleep, cognition, pain, and self‐esteem, for both end of intervention follow‐up and baseline to end of intervention change values analyses; for BMI, body fat %, emotional function, mass, sexual function, and social function immediately postintervention values analyses; and for anxiety change from baseline to end of intervention change values analyses.
Evidence of heterogeneity might be explained by several factors including variation in participant characteristics (e.g. disease severity, treatment regimen, menopausal status, baseline levels of outcomes), components of the physical activity intervention (e.g. frequency, intensity, duration, mode of activity), and types of comparison groups used (e.g. attention control, usual care, delayed intervention), including potential variations in usual care. Both our exploration of heterogeneity and subgroup analyses were limited owing to the large number of potential heterogeneity factors, small sample sizes, and underreporting of key components (e.g. ˜ 50% of trials reported an assessment of activity intensity). For instance, variation in intervention components within each mode of intervention (i.e. aerobic, resistance, combined aerobic and resistance exercise, and interventions such as yoga, tai chi, qigong, and pilates) impacts consistency and limits confidence in our analyses by intervention mode.
Potential biases in the review process
Strengths of this review include the comprehensive search strategy, which comprised a search of 12 databases, review of reference lists of relevant reviews in the field and reference lists of all included trials, systematic appraisal of study quality through GRADE and risk of bias through the Cochrane 'Risk of bias' tool, and systematic and well‐defined data synthesis. In addition, we applied a broad definition of physical activity, which included lower intensity interventions such as tai chi, qigong, pilates, yoga, horse‐riding, and line‐dancing, as well as higher‐intensity activities such as resistance exercise and interval training. Inclusion of lighter‐intensity activities might be contentious, but application of the World Health Organization (WHO) definition of physical activity (i.e. any bodily movement produced by contraction of skeletal muscle that increases energy expenditure above a basal level) meant that interventions including these types of activities were eligible (Caspersen 1985). It is important to note that we attempted to isolate effects of physical activity as much as possible; therefore, we excluded trials that combined physical activity with another component (e.g. dietary modification), in which a potential synergistic or additive effect could not be ruled out. In particular, this criterion led to exclusion of several studies that would potentially have been eligible, including trials that combined physical activity with dietary modification (Casla 2015; Djuric 2002; Kim Soo 2011; Mefferd 2007), educational counselling (Bloom 2008; Cho 2006), or manual therapy (Cantarero‐Villanueva 2012; Cantarero‐Villanueva 2012a; Cantarero‐Villanueva 2013a; Fernandez‐Lao 2012). Although the contributions of these additional components to the overall effect of physical activity may be small, an effect could not be isolated and accounted for; therefore, the review authors believe that a more robust approach would be to exclude them from the review. We analysed effects of physical activity interventions on a broad range of outcomes, including both patient‐important outcomes, such as HRQoL, and objective outcomes related to future health, such as cardiorespiratory fitness.
The search strategy was designed and applied to ensure that review authors identified and retrieved the maximal number of eligible published and grey literature trials. We applied no language restrictions, so that all trials published in non‐English language were translated and screened for eligibility. However, although we screened several non‐English language trials for eligibility, we found none to be eligible. Similarly, we found no additional eligible trials through our searches of grey literature. In spite of our comprehensive search strategy, it is still possible that this review may have a publication bias. We have presented funnel plots for end of intervention follow‐up (Figure 6) and change from baseline to end of intervention values (no shown) from analyses of our primary outcome of overall HRQoL. Visual inspection of both figures revealed asymmetry, indicating that some publication bias for HRQoL may characterise this field of research; this was supported by Egger's test for these analyses (P = 0.06 and 0.07, respectively). To investigate publication bias in the remaining outcomes for which we identified a sufficient number of studies (n > 10), we also performed Egger's test (Egger 1997) analyses of body mass (both end of intervention follow‐up and change from baseline to end of intervention values) and BMI (immediately postintervention values), which suggested publication bias (P < 0.10). Whereas we included fewer than 10 studies in analyses of both follow‐up and change values for anxiety, BMD of femoral neck, lumbar spine, and hip, cognitive function, general health, pain, sexual function, and sleep, and in analyses of change values for depression, self‐esteem, and self‐reported and objectively measured physical activity, inspection of funnel plots revealed asymmetry, suggesting the presence of publication bias. In all cases, observed asymmetry was evident particularly because trials were lacking on the side of the plot that would suggest a negative effect of physical activity. A potential rationale for apparent publication bias in the change from baseline to postintervention values analysis may be underreporting of change values in the included trials, rather than lack of unpublished trials with negative findings. Across most analyses, fewer trials were available for analysis of these change values than were available for analysis of follow‐up values. We may have missed potentially eligible trials in our grey literature search, although it is unclear whether additional trials found only in the grey literature would meaningfully impact the results of this review, given that these types of trials typically include small samples and produce inclusive results (McAuley 2000).
6.
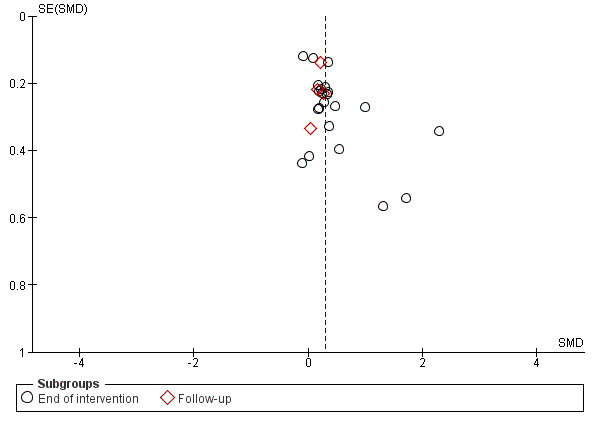
Funnel plot of comparison: 1 Comparison: HRQoL outcomes, all physical activity vs control, outcome: 1.1 Overall HRQoL (follow‐up values).
Deviations from our proposed protocol were few. However, we did not perform planned analysis of effects of physical activity on blood biomarkers because we considered these outcomes to be beyond the scope of the current review, and because uncertainty persists regarding the prognostic value of blood biomarkers in breast cancer populations (Ballard‐Barbash 2012). Therefore, future reviews are required to explore both the prognostic value and effects of physical activity on biomarkers that might be relevant to patients with a diagnosis of breast cancer, such as glucose, insulin, inflammatory cytokines, and growth factors. We originally planned to conduct subgroup analyses by participants' menopausal status (premenopausal vs postmenopausal) and treatment regimen (chemotherapy vs no chemotherapy). However, we identified insufficient numbers of trials that included premenopausal patients with breast cancer and those who had not undergone chemotherapy to perform these analyses.
We corresponded with and requested additional data from nine trial authors (Baruth 2013; Carson 2009; Daley 2007; Heim 2007; Loh 2014; McKenzie 2003; Payne 2008; Peppone 2015; Vallance 2007), four of whom (Daley 2007; Loh 2014; Payne 2008; Vallance 2007) replied to our requests. Of these four trial authors, only the authors of Vallance 2007 were able to provide data on all outcomes requested. The addition of data obtained from these trial authors allowed us to increase sample sizes in quantitative meta‐analyses and to perform more complete analyses, leading to more robust conclusions. Conversely, our inability to obtain complete data may have contributed to observed publication bias.
Agreements and disagreements with other studies or reviews
Several relatively recent systematic reviews have investigated effects of physical activity/exercise on health outcomes among patients with cancer; however, some included all cancer types (Bourke 2013; Bourke 2014; Bradt 2011; Brown 2011; Brown 2012; Buffart 2012a; Chiu 2015; Craft 2012; Cramp 2012; Ferrer 2011; Fong 2012; Knols 2010; Mishra 2012a; Speck 2010; Winters‐Stone 2010; Zimmer 2016), instead of focusing on breast cancer only (Battaglini 2014; Bluethmann 2015; Bluethmann 2016; Bourke 2013; Bourke 2014; Cheema 2014; Chung 2013; Duijts 2011; Keilani 2016; Meneses‐Echavez 2015; Nelson 2016; Pan 2015; Paramanandam 2014; Yang 2016; Zeng 2014; Zhu 2016). Most of these systematic reviews included a meta‐analysis (Bluethmann 2015; Bluethmann 2016; Bourke 2013; Bourke 2014; Bradt 2011; Brown 2011; Brown 2012; Buffart 2012a; Candy 2016; Cheema 2014; Chiu 2015; Craft 2012; Cramp 2012; Duijts 2011; Ferrer 2011; Fong 2012; Knols 2010; Lee 2010a; Meneses‐Echavez 2015; Mishra 2012a; Pan 2015; Paramanandam 2014; Speck 2010; Yang 2016; Zeng 2014; Zhu 2016). Some of the listed systematic reviews focused on specific outcomes, such as aromatase inhibitor‐associated arthralgia (Yang 2016), breast cancer‐related lymphoedema (Keilani 2016; Nelson 2016; Paramanandam 2014), bone health (Winters‐Stone 2010), cancer‐related fatigue (Brown 2011; Cramp 2010; Meneses‐Echavez 2015), cognitive impairments (Chan 2015; Zimmer 2016), depressive symptoms (Brown 2012; Craft 2012), physical activity/exercise behaviour (Bluethmann 2015; Bluethmann 2016; Bourke 2013; Bourke 2014; Knols 2010), outcome maintenance (Spark 2013), sexual function (Candy 2016), sleep (Chiu 2015), and quality of life (Ferrer 2011; Mishra 2012a; Zeng 2014). Some investigated effects of particular types of physical activity such as dance/movement therapy (Bradt 2011), physical activity interventions based on behaviour change theory (Bluethmann 2015; Bluethmann 2016), physical activity and/or dietary interventions (Spark 2013), resistance exercise (Cheema 2014; Keilani 2016; Nelson 2016; Paramanandam 2014), supervised exercise (Meneses‐Echavez 2015), tai chi (Lee 2010a; Pan 2015), walking (Chiu 2015; Knols 2010), and yoga (Buffart 2012a), and others included trials in which participants were still undergoing breast cancer treatment (Battaglini 2014; Bradt 2011; Brown 2011; Brown 2012; Buffart 2012a; Cheema 2014; Chung 2013; Cramp 2012; Duijts 2011; Fong 2012; Lee 2010a; Meneses‐Echavez 2015; Mishra 2012a; Spark 2013; Zeng 2014; Zhu 2016; Zimmer 2016).
Similar to meta‐analyses included in the current review, previous meta‐analyses investigating effects of physical activity found improvements in HRQoL in analyses that included only trials involving solely breast cancer survivors (Duijts 2011; Fong 2012; Mishra 2012a; Zeng 2014; Zhu 2016), trials including mostly (83%) breast cancer survivors (Speck 2010), and trials with female cancer survivors (Ferrer 2011). Similarly, two previous systematic reviews concluded that physical activity improves HRQoL among breast cancer survivors (Battaglini 2014; Chung 2013). Likewise, our findings of improvement in breast cancer‐specific HRQoL were similar to those of previous meta‐analyses (Mishra 2012a; Speck 2010). Although previous meta‐analyses of resistance exercise interventions found improvements in HRQoL among breast cancer survivors in Cheema 2014 and among patients with breast cancer‐related lymphoedema in Paramanandam 2014, owing to differences in review methods (both reviews included trials comprising patients with breast cancer who were undergoing adjuvant therapy, and Cheema 2014 combined overall HRQoL and physical function values in analysis), we did not identify a sufficient number of trials for investigation of this particular analysis. Similarly, in conflict with Buffart 2012a, we found no effects of yoga interventions on HRQoL among patients with breast cancer. However, Buffart 2012a included trials in which participants were undergoing breast cancer treatment. Unlike previous meta‐analyses (Lee 2010a; Pan 2015), we could not perform a meta‐analysis of only tai chi interventions owing to lack of available eligible trials. However, we found evidence of double‐counting of trials within these analyses, for instance, the six publications produced from the single trial of Mustian 2004, were included separately in analyses of Pan 2015.
Among HRQoL‐related outcomes, we observed improvement in emotional function similar to those reported in three meta‐analyses (Mishra 2012a; Zeng 2014; Zhu 2016), perceived physical function increases similar to those reported by Speck 2010, and enhanced social function similar to that described by Zhu 2016. However, Mishra 2012a found no improvements in perceived physical or social function, and Speck 2010 reported no increase in mental health or social, emotional, and role function with physical activity interventions. Unlike one previous meta‐analysis (Paramanandam 2014), we found no improvements in perceived physical function, specifically with resistance exercise. Similarly, we found no change in emotional, social, or role function with yoga, unlike Buffart 2012a, although, similar to this meta‐analysis, we found no effect on physical function among breast cancer survivors. Consistent with findings of the Mishra 2012a meta‐analysis and the Zimmer 2016 systematic review, we did not find an effect of physical activity on cognitive function among breast cancer survivors. One previous systematic review ‐ Chan 2015 ‐ concluded, based on two trials, that physical activity interventions were effective in improving executive function and self‐reported concentration among patients with breast cancer after chemotherapy. However, our findings of no effect of physical activity on sexual function of breast cancer survivors differed from those of Mishra 2012a, which reported a small effect at six months, but was in agreement with the findings of three other meta‐analyses (Candy 2016; Speck 2010; Zhu 2016). Our finding of no effect of physical activity on the general health perspectives of breast cancer survivors was consistent with that of Mishra 2012a. In agreement with two meta‐analyses (Buffart 2012a; Zhu 2016), we found no effects of physical activity interventions on sleep outcomes. However, one previous meta‐analysis found improvement in sleep disturbance with physical activity when comparing follow‐up values with those of the comparison group at 12 weeks' follow‐up (Mishra 2012a), and another meta‐analysis revealed that moderate‐intensity walking exercise improved sleep among patients with breast cancer (Chiu 2015).
Regarding other psychological outcomes, we found significant reductions in anxiety with physical activity interventions; this was consistent with the findings of two previous meta‐analyses among breast cancer survivors (Mishra 2012a; Zhu 2016), as well as one examining effects of yoga among cancer survivors (Buffart 2012a), but not with the findings of two other meta‐analyses (Duijts 2011; Speck 2010). Although we found a small decrease in depression with physical activity interventions, we failed to find a significant reduction in the change from baseline to end of intervention values analysis. Two previous meta‐analyses found no effect of physical activity on depression (Mishra 2012a; Speck 2010), and another six found a significant reduction in depression among cancer and breast cancer survivors (Brown 2012; Buffart 2012a; Craft 2012; Duijts 2011; Fong 2012; Zhu 2016). We found a significant but small decrease in fatigue in favour of physical activity interventions when we analysed immediately postintervention values; however we noted a significant reduction in fatigue in the change from baseline to at least three months follow‐up analysis, and we found that the change from baseline to end of intervention values analysis was not significant (P = 0.05). Several other meta‐analyses showed significant reduction in fatigue with physical activity among cancer survivors (Brown 2011; Buffart 2012a; Cramp 2012; Speck 2010), as well as breast cancer survivors (Duijts 2011; Fong 2012; Meneses‐Echavez 2015; Mishra 2012a); however, similar to the current review, one review did not find significant reductions in fatigue (Zhu 2016).
Our finding of no effect of physical activity on pain among breast cancer survivors is consistent with that of previous meta‐analyses (Mishra 2012a; Pan 2015; Speck 2010; Yang 2016), although Mishra 2012a observed significant effects when using follow‐up values at 12 weeks only. Similar to Mishra 2012a and Duijts 2011, we found improvements in self‐esteem/body image among breast cancer survivors, although two previous meta‐analyses could analyse only body image and reported improvement with physical activity interventions (Speck 2010; Zeng 2014).
We found improved cardiorespiratory fitness when comparing physical activity versus control groups, which was consistent with the findings of previous meta‐analyses in mixed cancer population trials (Bourke 2013; Bourke 2014; Fong 2012; Speck 2010), as well as one systematic review involving only trials of physical activity among breast cancer survivors over the previous 25 years (Battaglini 2014). However, Fong 2012 did not report significant improvement in a separate subanalysis involving only trials consisting solely of breast cancer survivors. Previous meta‐analyses of Bluethmann 2015,Bluethmann 2016, and Speck 2010 were consistent with our finding of increased physical activity (both self‐reported and objectively measured physical activity) among breast cancer survivors given physical activity interventions. Furthermore, we found that increases in self‐reported, but not objectively measured, physical activity were maintained at least three months post intervention, which is somewhat supported by a previous meta‐analysis (Spark 2013). Spark 2013 investigated the number of trials consisting of breast cancer survivors that achieved successful postintervention maintenance of physical activity and/or dietary outcomes. The authors of Spark 2013 found that four out of nine studies that targeted physical activity improvement among primarily breast cancer survivors achieved successful maintenance of physical activity at least three months post intervention, although another four trials involving only breast cancer survivors did not achieve successful maintenance.
Our finding of significant but small decreases in body mass (change from baseline to end of intervention values only) was consistent with the findings of two previous meta‐analyses (Fong 2012; Speck 2010); however, Fong 2012 found no decreases in a separate analysis of breast cancer survivors only. In agreement with the findings of Fong 2012, we found no significant reduction in BMI among breast cancer survivors. However, Speck 2010 did note reductions in BMI in physical activity trials consisting mostly of breast cancer survivors. We also found significant small reductions in body fat (both follow‐up and change values) similar to those reported by Speck 2010 but in disagreement with the findings of Fong 2012.
In agreement with previous meta‐analyses of mostly breast cancer survivors in Speck 2010 and only breast cancer survivors in Fong 2012, we found that physical activity interventions improved both upper and lower body strength and lower body strength. This finding was also supported by a previous systematic review (Battaglini 2014). Similarly, in subgroup analyses by intervention mode, we observed the greatest effect with resistance exercise. Previous meta‐analyses ‐ Cheema 2014; Paramanandam 2014 ‐ and systematic reviews ‐ Chung 2013; Keilani 2016; Nelson 2016 ‐ have concluded that resistance exercise interventions improve upper and lower body strength among breast cancer survivors, while adding that these strength gains are achieved safely without triggering changes in lymphoedema status, worsening symptoms, or increasing arm volume. Our findings of a lack of effect of physical activity on BMD is consistent with a previous systematic review of exercise interventions to improve bone health in adult cancer survivors (Winters‐Stone 2010). Winters‐Stone 2010 found that only two of eight included trials reported significant effects of aerobic exercise on preservation of BMD at the spine or in the whole body, and none reported exercise benefits at the hip.
Differences between the current review and previous reviews are likely due to variations in time and design of search strategies, as well as in eligibility criteria and their application. Specifically, previous reviews focused on certain types of interventions or outcomes and/or included mixed cancer populations at various stages of treatment.
Authors' conclusions
Implications for practice.
Physical activity may have small to moderate beneficial effects on overall health‐related quality of life (HRQoL), some HRQoL domains (such as emotional, perceived physical, and social function), anxiety, cardiorespiratory fitness, self‐reported and objectively measured physical activity, body fat, and lower and upper body muscular strength among women with breast cancer after adjuvant therapy. Furthermore, at the end of the study period, participants in physical activity interventions achieved more favourable values for role and cognitive function, depressive symptoms, fatigue, vigour, and self‐esteem compared with survivors in control groups. In addition, physical activity may lead to greater albeit modest decreases in body mass and waist and hip circumferences from the beginning to the end of the intervention. We found a small number of minor adverse events and no evidence of negative/harmful effects of physical activity interventions. Therefore, physical activity could be considered relatively safe and effective in improving HRQoL along with psychological, behavioural, and physical outcomes in breast cancer survivors.
Positive results must be interpreted cautiously owing to the heterogeneity and imprecision of observed effects, the risk of bias in many trials (primarily performance, attrition, detection, and selection bias), and very low‐to‐moderate quality of evidence. Variations in design of physical activity interventions (i.e. modes of physical activity, frequency and intensity of sessions, duration of both sessions and intervention, and level of behavioural support given), risks of bias, and diversity among instruments used to assess outcomes likely explain most of the heterogeneity observed. In addition, most statistically significant effects were small to moderate and lacked precision (i.e. 95% confidence intervals (CIs) included a harmful effect, no effect, or a negligible effect). When effects were re‐expressed via the most commonly employed measurement tool or test, physical activity interventions led to meaningful clinically important differences in overall HRQoL and anxiety only. Furthermore, intervention adherence and attrition varied greatly across trials. All of these factors limit the degree to which results are attributable to physical activity interventions, and as a result the practical application of findings.
We found limited evidence related to maintenance of outcomes beyond the period of active intervention. Only a minority of trials included data regarding outcome maintenance at least three months post intervention. Therefore, although we observed sustained favourable effects of physical activity interventions on fatigue, cardiorespiratory fitness, and self‐reported physical activity at least three months post intervention, these analyses were based on small sample sizes. Furthermore, assessments of follow‐up beyond intervention completion were affected by poorer adherence and greater attrition than were seen in assessments performed immediately post intervention. Owing to these limitations, it is difficult to draw firm conclusions regarding how sustainable effects of physical activity interventions are beyond the intervention period. Owing to insufficient available data, we could make no conclusions regarding maintenance of general health perspective, sexual function, sleep, anxiety, pain, self‐esteem, mass, body mass index (BMI), body fat, waist‐to‐hip ratio (WHR), waist and hip circumferences, upper and lower body strength, or bone health outcomes.
From a practice perspective, we need a greater understanding of which components of physical activity interventions can lead to more optimal effects on outcomes important to breast cancer survivors. Our findings appear to suggest that effects of physical activity are not transferable across all modes, and that the mode of physical activity chosen may influence potential benefits received. Therefore, practitioners would benefit from knowledge of which mode or combination of modes of physical activity (e.g. continuous aerobic exercise, high‐intensity intermittent exercise, resistance training, yoga, tai chi, pilates) coupled with physical activity prescription components (frequency, intensity and duration of sessions and programme) is optimal for improving a particular outcome. In addition, understanding which behavioural change techniques facilitate the greatest physical activity adherence would promote the sustainability of physical activity‐induced benefits.
Implications for research.
This systematic review and meta‐analysis of 63 trials investigated effects of physical activity interventions among women with breast cancer after adjuvant therapy and found that after physical activity interventions, breast cancer survivors had more favourable postintervention values and experienced greater changes during the intervention period in overall health‐related quality of life (HRQoL); in emotional, perceived physical, and social function; and in anxiety, cardiorespiratory fitness, self‐reported and objectively measured physical activity, body fat, and lower and upper body strength. Furthermore, despite a non‐significant change from baseline to end of intervention, breast cancer survivors given physical activity interventions had more favourable values post intervention for role and cognitive function, depression, fatigue, vigour, and self‐esteem compared with survivors given control interventions. Conversely, although end of intervention values in the intervention group were not different from those in the control group, breast cancer survivors experienced greater decreases in body mass and in waist and hip circumferences during the intervention period. We found no data on effects of physical activity on breast cancer‐related mortality, breast cancer recurrence, or all‐cause mortality. Therefore, future research is required to investigate effects of physical activity interventions on these as primary outcomes. Similarly, limited data are available regarding the cost‐effectiveness of physical activity interventions for women with breast cancer after adjuvant therapy. Further research is needed to determine whether physical activity interventions offer equivalent or superior health outcomes for a similar level of expenditure compared with other available interventions.
Although available data were scarce, three months or longer postintervention follow‐up values for emotional and perceived physical function, depression, fatigue, vigour, cardiorespiratory fitness, and self‐reported physical activity were more favourable among intervention groups, and intervention groups maintained greater change from baseline to three months or longer postintervention values in HRQoL, fatigue, cardiorespiratory fitness, and self‐reported physical activity, compared with control groups. Therefore, additional trials that include long‐term follow‐up assessments beyond completion of interventions are required to establish whether effects of a physical activity intervention are maintained beyond the active intervention period. In addition, future research is needed to determine the optimal duration after intervention completion at which breast cancer survivors should receive follow‐up assessments.
Future trials could help to enhance precision around effect estimates for presented outcomes by adopting more rigorous methods. A large proportion of trials included relatively small sample sizes, with 28 of the 63 trials consisting of intervention and control groups including fewer than 30 breast cancer survivors. More adequately powered trials are required for each particular outcome. Most of the outcomes included in this current meta‐analysis were secondary outcomes in the included trials. For some outcomes, such as fatigue, we found little evidence from trials that specifically targeted improvement for this outcome. Trials could ensure that appropriate randomisation and allocation concealment are performed by using computer sequence generation coupled with either telephone‐ or Internet‐based central randomisation, or at least sealed opaque envelopes. Although blinding of participants to the allocation of physical activity is not possible (even though physical activity placebo interventions may be an option), when possible, such as in non‐patient‐reported outcomes, assessments could be conducted by an independent clinician blinded to allocation. In addition, trials could limit loss to follow‐up rates by better monitoring participants during the intervention period and by using attention and delayed intervention control groups. However, when loss to follow‐up occurs, incomplete missing data could be analysed appropriately via intention‐to‐treat analysis based on a multiple imputation method. Establishing risk of bias across trials was made difficult by inadequate reporting; adherence to CONSORT reporting guidelines for randomised controlled trials (RCTs) would increase transparency in future trials and would aid their critical appraisal and interpretation (Moher 2010).
Further research is necessary to establish the optimal physical activity prescription needed to improve a particular desired outcome. Trials manipulate different modes, frequencies, intensities, and durations of both sessions and interventions to determine their effects on specific outcomes important to women with breast cancer post adjuvant therapy, and to provide more refined physical activity guidelines for breast cancer survivors. In addition, because compliance with physical activity interventions during and after the intervention period is an issue, future research is required to gain a better understanding of the most effective physical activity behaviour change techniques among breast cancer survivors. Comparisons of findings between trials were challenging owing to the heterogeneous range of measures used to assess outcomes included in the current review. Consensus on the most valid and reliable measures for assessment of each outcome would help researchers to address this issue. Similarly, when possible, researchers could utilise more objective measures to assess outcomes of interest (e.g. use of accelerometers to measure physical activity, use of functional tests to measure physical function).
Acknowledgements
The review authors would like to thank Melina Willson and Fergus Tai for their assistance in completing this current protocol.
Appendices
Appendix 1. MEDLINE
PubMed search:
1. (randomized controlled trial[pt] OR controlled clinical trial[pt] OR randomized[tiab] OR placebo[tw] OR drug therapy[sh] OR randomly[tiab] OR trial[tiab] OR groups[tiab])
2. (((Breast neoplasms[mh] OR ((breast[mh] OR breast diseases[mh]) AND neoplasms[mh])) AND humans[mh]) OR DCIS[tiab] OR LCIS[tiab] OR ductal carcinoma in situ[tiab] OR lobular carcinoma in situ[tiab] OR (breast[tiab] AND (ductal carcinoma*[ti] OR lobular carcinoma*[ti])) OR ((Breast[ti] OR mammary[ti]) AND (cancer*[ti] OR neoplas*[ti] OR tumor*[ti] OR tumour*[ti] OR carcinoma*[ti] OR malignan*[ti] OR sarcoma[ti] OR lymphoma[ti])))
3. (((Breast neoplasms[mh] OR ((breast[mh] OR breast diseases[mh]) AND neoplasms[mh])) AND humans[mh]) OR DCIS[tiab] OR LCIS[tiab] OR ductal carcinoma in situ[tiab] OR lobular carcinoma in situ[tiab] OR (breast[tiab] AND (ductal carcinoma*[ti] OR lobular carcinoma*[ti])) OR ((Breast[ti] OR mammary[ti]) AND (cancer*[ti] OR neoplas*[ti] OR tumor*[ti] OR tumour*[ti] OR carcinoma*[ti] OR malignan*[ti] OR sarcoma[ti] OR lymphoma[ti]))) AND (Neoplasm Metastasis[Mh] OR secondary[sh] OR Neoplasm Recurrence, Local[mh] OR metast*[tiab] OR advanced[tiab] OR recurren*[tiab] OR HER‐2*[tiab] OR HER2*[tiab] OR N1[tiab] OR N2[tiab] OR N2a[tiab] OR N2b[tiab] OR N3[tiab] OR N3a[tiab] OR N3b[tiab] OR N3c[tiab] OR M1[tiab] OR pN1*[tiab] OR pN2*[tiab] OR pN3*[tiab] OR stage IV[tiab] OR stage four[tiab] OR stage 4[tiab] OR local*[tiab] OR loco*[tiab] OR region*[tiab] OR LABC[tiab] OR T3[tiab] OR T4[tiab] OR Stage III*[tiab] OR Stage three*[tiab] OR stage 3*[tiab])
4. #2 NOT #3
5. (Exercise [mh] OR exercis*[tiab] OR Motor activity[mh] OR Sports[mh] OR sport*[tiab] OR Resistance training[mh] OR training[tiab] OR fitness[tiab] OR physical activity[tiab] OR physical activities[tiab] OR physical activity intervention*[tiab] OR exercise intervention* OR active[tiab])
6. #1 AND #4 AND #5
7. Animals [MH] NOT Humans [mh]
8. #6 not #7
Appendix 2. Embase
Embase.com search:
1. random* OR factorial* OR crossover* OR cross NEXT/1 over* OR placebo* OR (doubl* AND blind*) OR (singl* AND blind*) OR assign*OR allocat* OR volunteer* OR 'crossover procedure'/exp OR 'double blind procedure'/exp OR 'randomized controlled trial'/exp OR'single blind procedure'/exp
2. 'breast cancer'/exp OR 'breast cancer'
3. 'breast neoplasm'
4. 'breast carcinoma'/exp OR 'breast carcinoma'
5. 'breast tumour'
6. 'breast tumor'/exp OR 'breast tumor'
7. 'mamma carcinoma'/exp OR 'mamma carcinoma'
8. 'mammary neoplasm'
9. 'mammary carcinoma'/exp OR 'mammary carcinoma'
10. 'mammary gland carcinoma'
11. #2 OR #3 OR #4 OR #5 OR #6 OR #7 OR #8 OR #9 OR #10
12. (metastatic OR advance) AND ('breast cancer'/exp OR 'breast neoplasm' OR 'breast carcinoma'/exp OR 'breast tumour' OR 'breast tumor'/exp)
13. #11 NOT #12
14. 'exercise'/exp OR 'exercise'
15. exercis*
16. 'sport'/exp OR 'sport'
17. sport*
18. 'resistance training'/exp OR 'resistance training'
19. 'training'/exp OR training
20. 'fitness'/exp OR fitness
21. 'physical activity'/exp OR 'physical activity'
22. 'physical activities'
23. physical NEAR/6 activit*
24. 'physical activity intervention'
25. 'physical activity interventions'
26. 'exercise interventions'
27. 'exercise intervention'
28. #14 OR #15 OR #16 OR #17 OR #18 OR #19 OR #20 OR #21 OR #22 OR #23 OR #24 OR #25 OR #26 OR #27
29. #1 AND #13 AND #28
30. #29 NOT ([animals]/lim NOT [humans]/lim)
31. #30 AND [embase]/lim
Appendix 3. CENTRAL
The Cochrane Library search:
1. MeSH descriptor: [Breast Neoplasms] explode all trees
2. breast near cancer* or breast near neoplasm* or breast near carcinoma* or breast near tumour* or breast near tumor*
3. #1 or #2
4. (metastatic or advance) and (breast cancer or breast neoplasm or breast carcinoma or breast tumour or breast tumor)
5. #3 not #4
6. MeSH descriptor: [Exercise] explode all trees
7. exercis*
8. MeSH descriptor: [Motor Activity] explode all trees
9. MeSH descriptor: [Sports] explode all trees
10. sport*
11. MeSH descriptor: [Resistance Training] explode all trees
12. training
13. fitness
14. physical activit*
15. physical activity intervention*
16. exercise intervention*
17. active
18. #6 or #7 or #8 or #9 or #10 or #11 or #12 or #13 or #14 or #15 or #16 or #17
19. #5 and #18
Appendix 4. WHO ICTRP
Basic searches:
1. Physical activity for women with breast cancer after adjuvant therapy
2. Breast cancer AND physical activit*
3. Breast cancer AND physical activity intervention*
4. Breast cancer AND exercise intervention*
Advanced searches:
1. Title: Physical activity for women with breast cancer after adjuvant therapy
Recruitment: ALL
2. Condition: breast cancer
Intervention: physical activit*
Recruitment: ALL
3. Condition: breast cancer
Intervention: physical activity intervention*
Recruitment: ALL
4. Condition: breast cancer
Intervention: exercise intervention*
Recruitment: ALL
Appendix 5. Clinicaltrials.gov
Basic searches:
1. Physical activity for women with breast cancer after adjuvant therapy
2. Breast cancer AND physical activity
3. Breast cancer AND physical activities
4. Breast cancer AND physical activity intervention
5. Breast cancer AND physical activity interventions
6. Breast cancer AND exercise intervention
7. Breast cancer AND exercise interventions
Advanced searches:
1. Title: breast surgery for metastatic breast cancer
Recruitment: All studies
Study Results: All studies
Study Type: All studies
Gender: All studies
2. Condition: breast cancer NOT (advanced breast cancer OR metastatic breast cancer)
Intervention: physical activity intervention OR exercise intervention physical activity interventions OR exercise interventions
Recruitment: All studies
Study Results: All studies
Study Type: All studies
Gender: All studies
3. Condition: breast cancer NOT (advanced breast cancer OR metastatic breast cancer)
Intervention: physical activity OR physical activities
Recruitment: All studies
Study Results: All studies
Study Type: All studies
Gender: All studies
Appendix 6. CINAHL
EBSCOhost search:
S1. (MH "Clinical Trials+")
S2. PT Clinical trial
S3. TX clinic* n1 trial*
S4. TX ( (singl* n1 blind*) or (singl* n1 mask*) ) or TX ( (doubl* n1 blind*) or (doubl* n1 mask*) ) or TX ( (tripl* n1 blind*) or (tripl* n1 mask*) ) or TX ( (trebl* n1 blind*) or (trebl* n1 mask*) )
S5. TX randomi* control* trial*
S6. (MH "Random Assignment")
S7. TX random* allocat*
S8. TX placebo*
S9. (MH "Placebos")
S10. (MH "Quantitative Studies")
S11. TX allocat* random*
S12. S1 or S2 or S3 or S4 or S5 or S6 or S7 or S8 or S9 or S10 or S11
S13. (MH "Breast Neoplasms+")
S14. "breast cancer"
S15. "breast neoplasm"
S16. "breast carcinoma"
S17. "breast tumour"
S18. "breast tumor"
S19. S13 OR S14 OR S15 OR S16 OR S17 OR S18
S20. "metastatic breast cancer"
S21. "metastatic breast neoplasm"
S22. "metastatic breast carcinoma"
S23. "metastatic breast tumour"
S24. "metastatic breast tumor"
S25. "advanced breast cancer"
S26. "advanced breast neoplasm"
S27. "advanced breast carcinoma"
S28. "advanced breast tumour"
S29. "advanced breast tumor"
S30. S20 OR S21 OR S22 OR S23 OR S24 OR S25 OR S26 OR S27 OR S28 OR S29
S31. S19 NOT S30
S32. (MH "Exercise+")
S33. "exercis*"
S34. (MH "Motor Activity+")
S35. (MH "Sports+")
S36. "sport*"
S37. (MH "Resistance Training")
S38. "training"
S39. "fitness"
S40. (MH "Physical Activity")
S41. "physical activit*"
S42. "physical activity intervention*"
S43. "exercise intervention*"
S44. "active"
S45. S32 OR S33 OR S34 OR S35 OR S36 OR S37 OR S38 OR S39 OR S40 OR S41 OR S42 OR S43 OR S44
S46. S12 AND S31 AND S45
Appendix 7. PEDro
1. Abstract & Title: breast cancer AND physical activity
Method: clinical trial
2. Abstract & Title: breast cancer AND exercise
Method: clinical trial
3. Abstract & Title: breast cancer AND physical activity intervention
Method: clinical trial
4. Abstract & Title: breast cancer AND exercise intervention
Method: clinical trial
5. Abstract & Title: breast cancer AND resistance training
Method: clinical trial
6. Abstract & Title: breast cancer AND strength training
Method: clinical trial
7. Abstract & Title: breast cancer AND weight lifting
Method: clinical trial
Appendix 8. SPORT Discus
EBSCOhost search:
S1. randomized
S2. placebo
S3. randomly
S4. randomized controlled trial
S5. controlled clinical trial
S6. random*
S7. S1 OR S2 OR S3 OR S4 OR S5 OR S6
S8. breast cancer OR breast neoplasm OR breast carcinoma OR breast tumour OR breast tumor
S9. (metastatic or advance) AND (breast cancer OR breast neoplasm OR breast carcinoma OR breast tumour OR breast tumor)
S10. S8 NOT S9
S11. exercis* OR sport* OR training OR fitness OR physical activit* OR physical activity intervention* OR exercise intervention* OR active OR resistance training OR strength training OR weight lifting
S12. S7 AND S10 AND S11
Appendix 9. PsycINFO
| Searches | |
| 1 | exp Treatment Effectiveness Evaluation/ |
| 2 | exp Treatment Outcomes/ |
| 3 | exp Placebo/ |
| 4 | exp Followup Studies/ |
| 5 | placebo*.mp. |
| 6 | random*.mp. |
| 7 | comparative stud*.mp. |
| 8 | (clinical adj3 trial*).mp. |
| 9 | (research adj3 design).mp. |
| 10 | (evaluat* adj3 stud*).mp. |
| 11 | (clinical adj3 trial*).mp. |
| 12 | (research adj3 design).mp. |
| 13 | (evaluat* adj3 stud*).mp. |
| 14 | (prospectiv* adj3 stud*).mp. |
| 15 | ((singl* or doubl* or trebl* or tripl*) adj3 (blind* or mask*)).mp. |
| 16 | 1 or 2 or 3 or 4 or 5 or 6 or 7 or 8 or 9 or 10 or 11 or 12 or 13 or 14 or 15 |
| 17 | exp Breast Neoplasms/ |
| 18 | (breast adj6 cancer$).mp. |
| 19 | (breast adj6 neoplasm$).mp. |
| 20 | (breast adj6 carcinoma$).mp. |
| 21 | (breast adj6 tumour$).mp. |
| 22 | (breast adj6 tumor$).mp. |
| 23 | 17 or 18 or 19 or 20 or 21 or 22 |
| 24 | ((metastatic or advance*) and (breast cancer* or breast neoplasm* or breast carcinoma* or breast tumour* or breast tumor*)).af. |
| 25 | 23 not 24 |
| 26 | (exercis* or resistance training or training or fitness or physical activit* or physical activity intervention* or exercise intervention* or active).mp. |
| 27 | exp Exercise/ or exp Aerobic Exercise/ or exp Physical Activity/ or exp Training/ or exp Physical Fitness/ |
| 28 | 26 or 27 |
| 29 | 16 and 25 and 28 |
| 30 | Animals/ not Humans/ |
| 31 | 29 not 30 |
Data and analyses
Comparison 1. Comparison: HRQoL outcomes, all physical activity vs control.
| Outcome or subgroup title | No. of studies | No. of participants | Statistical method | Effect size |
|---|---|---|---|---|
| 1 Overall HRQoL (follow‐up values) | 22 | Std. Mean Difference (IV, Random, 95% CI) | Subtotals only | |
| 1.1 End of intervention | 22 | 1996 | Std. Mean Difference (IV, Random, 95% CI) | 0.39 [0.21, 0.57] |
| 1.2 Follow‐up | 4 | 418 | Std. Mean Difference (IV, Random, 95% CI) | 0.20 [0.00, 0.39] |
| 2 Overall HRQoL (change values) | 14 | Std. Mean Difference (IV, Random, 95% CI) | Subtotals only | |
| 2.1 End of intervention | 14 | 1459 | Std. Mean Difference (IV, Random, 95% CI) | 0.78 [0.39, 1.17] |
| 2.2 Follow‐up | 2 | 132 | Std. Mean Difference (IV, Random, 95% CI) | 0.52 [0.15, 0.88] |
| 3 FACT‐G (follow‐up values) | 10 | Mean Difference (IV, Random, 95% CI) | Subtotals only | |
| 3.1 End of intervention | 10 | 1094 | Mean Difference (IV, Random, 95% CI) | 7.06 [2.82, 11.30] |
| 3.2 Follow‐up | 3 | 342 | Mean Difference (IV, Random, 95% CI) | 2.81 [‐0.46, 6.08] |
| 4 FACT‐G (change values) | 6 | Mean Difference (IV, Random, 95% CI) | Subtotals only | |
| 4.1 End of intervention | 6 | 663 | Mean Difference (IV, Random, 95% CI) | 5.04 [1.32, 8.75] |
| 4.2 Follow‐up | 2 | 132 | Mean Difference (IV, Random, 95% CI) | 6.16 [1.63, 10.69] |
| 5 FACT‐B (follow‐up values) | 11 | Mean Difference (IV, Random, 95% CI) | Subtotals only | |
| 5.1 End of intervention | 11 | 1395 | Mean Difference (IV, Random, 95% CI) | 6.31 [1.15, 11.47] |
| 5.2 Follow‐up | 4 | 421 | Mean Difference (IV, Random, 95% CI) | 3.77 [0.11, 7.43] |
| 6 FACT‐B (change values) | 6 | Mean Difference (IV, Random, 95% CI) | Subtotals only | |
| 6.1 End of intervention | 6 | 605 | Mean Difference (IV, Random, 95% CI) | 8.16 [2.56, 13.76] |
| 6.2 Follow‐up | 2 | 132 | Mean Difference (IV, Random, 95% CI) | 6.95 [1.34, 12.56] |
| 7 FACT Breast Cancer Subscale (follow‐up values) | 11 | Mean Difference (IV, Random, 95% CI) | Subtotals only | |
| 7.1 End of intervention | 11 | 1043 | Mean Difference (IV, Random, 95% CI) | 1.98 [0.92, 3.04] |
| 7.2 Follow‐up | 4 | 386 | Mean Difference (IV, Random, 95% CI) | 3.20 [‐0.65, 7.05] |
| 8 FACT Breast Cancer Subscale (change values) | 7 | Mean Difference (IV, Random, 95% CI) | Subtotals only | |
| 8.1 End of intervention | 7 | 646 | Mean Difference (IV, Random, 95% CI) | 1.78 [‐0.14, 3.70] |
| 8.2 Follow‐up | 1 | 36 | Mean Difference (IV, Random, 95% CI) | 1.30 [‐1.56, 4.16] |
| 9 FACT Trial Outcome Index (follow‐up values) | 4 | Mean Difference (IV, Random, 95% CI) | Subtotals only | |
| 9.1 End of intervention | 4 | 658 | Mean Difference (IV, Random, 95% CI) | 7.90 [‐1.24, 17.04] |
| 9.2 Follow‐up | 1 | 213 | Mean Difference (IV, Random, 95% CI) | 3.60 [0.01, 7.19] |
| 10 EORTC QLQ‐C30 Global Health (follow‐up values) | 4 | Mean Difference (IV, Random, 95% CI) | Subtotals only | |
| 10.1 End of intervention | 4 | 195 | Mean Difference (IV, Random, 95% CI) | 7.85 [2.16, 13.55] |
| 10.2 Follow‐up | 0 | 0 | Mean Difference (IV, Random, 95% CI) | 0.0 [0.0, 0.0] |
| 11 EORTC QLQ‐C30 Global Health (change values) | 4 | Mean Difference (IV, Random, 95% CI) | Subtotals only | |
| 11.1 End of intervention | 4 | 633 | Mean Difference (IV, Random, 95% CI) | 9.53 [‐2.43, 21.49] |
| 11.2 Follow‐up | 0 | 0 | Mean Difference (IV, Random, 95% CI) | 0.0 [0.0, 0.0] |
| 12 Overall emotional function/mental health (follow‐up values) | 26 | Std. Mean Difference (IV, Random, 95% CI) | Subtotals only | |
| 12.1 End of intervention | 26 | 2102 | Std. Mean Difference (IV, Random, 95% CI) | 0.21 [0.10, 0.32] |
| 12.2 Follow‐up | 7 | 655 | Std. Mean Difference (IV, Random, 95% CI) | 0.20 [0.03, 0.36] |
| 13 Overall emotional function/mental health (change values) | 15 | Std. Mean Difference (IV, Random, 95% CI) | Subtotals only | |
| 13.1 End of intervention | 15 | 1579 | Std. Mean Difference (IV, Random, 95% CI) | 0.31 [0.09, 0.53] |
| 13.2 Follow‐up | 3 | 179 | Std. Mean Difference (IV, Random, 95% CI) | 0.06 [‐0.29, 0.41] |
| 14 FACT Emotional well‐being (follow‐up values) | 11 | Mean Difference (IV, Random, 95% CI) | Subtotals only | |
| 14.1 End of intervention | 11 | 1064 | Mean Difference (IV, Random, 95% CI) | 0.47 [0.01, 0.94] |
| 14.2 Follow‐up | 3 | 311 | Mean Difference (IV, Random, 95% CI) | 0.14 [‐0.85, 1.14] |
| 15 FACT Emotional well‐being (change values) | 6 | Mean Difference (IV, Random, 95% CI) | Subtotals only | |
| 15.1 End of intervention | 6 | 582 | Mean Difference (IV, Random, 95% CI) | 0.96 [0.34, 1.57] |
| 15.2 Follow‐up | 1 | 36 | Mean Difference (IV, Random, 95% CI) | 0.79 [‐0.67, 2.25] |
| 16 MOS SF Mental composite (follow‐up values) | 5 | Mean Difference (IV, Random, 95% CI) | Subtotals only | |
| 16.1 End of intervention | 5 | 563 | Mean Difference (IV, Random, 95% CI) | 0.49 [‐1.09, 2.06] |
| 16.2 Follow‐up | 3 | 281 | Mean Difference (IV, Random, 95% CI) | 2.27 [0.05, 4.50] |
| 17 MOS SF Mental composite (change values) | 2 | Mean Difference (IV, Fixed, 95% CI) | Subtotals only | |
| 17.1 End of intervention | 2 | 294 | Mean Difference (IV, Fixed, 95% CI) | 2.22 [‐0.95, 5.40] |
| 17.2 Follow‐up | 0 | 0 | Mean Difference (IV, Fixed, 95% CI) | 0.0 [0.0, 0.0] |
| 18 MOS SF Mental health (follow‐up values) | 7 | Mean Difference (IV, Random, 95% CI) | Subtotals only | |
| 18.1 End of intervention | 7 | 524 | Mean Difference (IV, Random, 95% CI) | 1.67 [‐0.65, 3.99] |
| 18.2 Follow‐up | 2 | 196 | Mean Difference (IV, Random, 95% CI) | 3.49 [‐0.97, 7.95] |
| 19 MOS SF Mental health (change values) | 5 | Mean Difference (IV, Fixed, 95% CI) | Subtotals only | |
| 19.1 End of intervention | 5 | 333 | Mean Difference (IV, Fixed, 95% CI) | 2.22 [0.70, 3.74] |
| 19.2 Follow‐up | 0 | 0 | Mean Difference (IV, Fixed, 95% CI) | 0.0 [0.0, 0.0] |
| 20 MOS SF Emotional role (follow‐up values) | 5 | Mean Difference (IV, Fixed, 95% CI) | Subtotals only | |
| 20.1 End of intervention | 5 | 330 | Mean Difference (IV, Fixed, 95% CI) | ‐0.00 [‐1.09, 1.09] |
| 20.2 Follow‐up | 1 | 120 | Mean Difference (IV, Fixed, 95% CI) | 3.06 [‐11.55, 17.67] |
| 21 MOS SF Emotional role (change values) | 4 | Mean Difference (IV, Fixed, 95% CI) | Subtotals only | |
| 21.1 End of intervention | 4 | 213 | Mean Difference (IV, Fixed, 95% CI) | 0.23 [‐0.79, 1.24] |
| 21.2 Follow‐up | 0 | 0 | Mean Difference (IV, Fixed, 95% CI) | 0.0 [0.0, 0.0] |
| 22 EORTC QLQ‐C30 Emotional function (follow‐up values) | 3 | Mean Difference (IV, Random, 95% CI) | Subtotals only | |
| 22.1 End of intervention | 3 | 135 | Mean Difference (IV, Random, 95% CI) | 11.53 [3.96, 19.11] |
| 22.2 Follow‐up | 0 | 0 | Mean Difference (IV, Random, 95% CI) | 0.0 [0.0, 0.0] |
| 23 EORTC QLQ‐C30 Emotional function (change values) | 3 | Mean Difference (IV, Random, 95% CI) | Subtotals only | |
| 23.1 End of intervention | 3 | 573 | Mean Difference (IV, Random, 95% CI) | 0.90 [‐5.12, 6.92] |
| 23.2 Follow‐up | 0 | 0 | Mean Difference (IV, Random, 95% CI) | 0.0 [0.0, 0.0] |
| 24 POMS total mood disturbance (follow‐up values) | 3 | Std. Mean Difference (IV, Random, 95% CI) | Subtotals only | |
| 24.1 End of intervention | 3 | 161 | Std. Mean Difference (IV, Random, 95% CI) | ‐0.93 [‐1.55, ‐0.32] |
| 24.2 Follow‐up | 1 | 61 | Std. Mean Difference (IV, Random, 95% CI) | ‐0.54 [‐1.06, ‐0.03] |
| 25 POMS total mood disturbance (change values) | 2 | Std. Mean Difference (IV, Random, 95% CI) | Subtotals only | |
| 25.1 End of intervention | 2 | 143 | Std. Mean Difference (IV, Random, 95% CI) | 0.07 [‐0.65, 0.79] |
| 25.2 Follow‐up | 2 | 143 | Std. Mean Difference (IV, Random, 95% CI) | 0.09 [‐0.23, 0.42] |
| 26 POMS anger subscale (follow‐up values) | 2 | Std. Mean Difference (IV, Random, 95% CI) | Subtotals only | |
| 26.1 End of intervention | 2 | 79 | Std. Mean Difference (IV, Random, 95% CI) | ‐0.78 [‐1.25, ‐0.31] |
| 26.2 Follow‐up | 1 | 61 | Std. Mean Difference (IV, Random, 95% CI) | ‐0.44 [‐0.94, 0.07] |
| 27 Happiness/satisfaction with life (follow‐up values) | 4 | Std. Mean Difference (IV, Random, 95% CI) | Subtotals only | |
| 27.1 End of intervention | 4 | 209 | Std. Mean Difference (IV, Random, 95% CI) | 0.61 [‐0.16, 1.37] |
| 27.2 Follow‐up | 0 | 0 | Std. Mean Difference (IV, Random, 95% CI) | 0.0 [0.0, 0.0] |
| 28 Happiness/satisfaction with life (change values) | 3 | Std. Mean Difference (IV, Random, 95% CI) | Subtotals only | |
| 28.1 End of intervention | 3 | 182 | Std. Mean Difference (IV, Random, 95% CI) | 0.28 [‐0.05, 0.62] |
| 28.2 Follow‐up | 0 | 0 | Std. Mean Difference (IV, Random, 95% CI) | 0.0 [0.0, 0.0] |
| 29 Overall physical function (follow‐up values) | 25 | Std. Mean Difference (IV, Random, 95% CI) | Subtotals only | |
| 29.1 End of intervention | 25 | 2129 | Std. Mean Difference (IV, Random, 95% CI) | 0.33 [0.18, 0.49] |
| 29.2 Follow‐up | 6 | 637 | Std. Mean Difference (IV, Random, 95% CI) | 0.21 [0.06, 0.37] |
| 30 Overall physical function (change values) | 13 | Std. Mean Difference (IV, Random, 95% CI) | Subtotals only | |
| 30.1 End of intervention | 13 | 1433 | Std. Mean Difference (IV, Random, 95% CI) | 0.60 [0.23, 0.97] |
| 30.2 Follow‐up | 1 | 36 | Std. Mean Difference (IV, Random, 95% CI) | 0.17 [‐0.48, 0.83] |
| 31 FACT Physical well‐being (follow‐up values) | 11 | Mean Difference (IV, Random, 95% CI) | Subtotals only | |
| 31.1 End of intervention | 11 | 1064 | Mean Difference (IV, Random, 95% CI) | 1.44 [0.31, 2.56] |
| 31.2 Follow‐up | 3 | 311 | Mean Difference (IV, Random, 95% CI) | 1.17 [0.22, 2.12] |
| 32 FACT Physical well‐being (change values) | 6 | Mean Difference (IV, Random, 95% CI) | Subtotals only | |
| 32.1 End of intervention | 6 | 579 | Mean Difference (IV, Random, 95% CI) | 1.60 [‐0.85, 4.05] |
| 32.2 Follow‐up | 1 | 36 | Mean Difference (IV, Random, 95% CI) | 0.9 [‐2.37, 4.17] |
| 33 MOS SF Physical composite (follow‐up values) | 4 | Mean Difference (IV, Fixed, 95% CI) | Subtotals only | |
| 33.1 End of intervention | 4 | 437 | Mean Difference (IV, Fixed, 95% CI) | 1.78 [0.12, 3.43] |
| 33.2 Follow‐up | 2 | 163 | Mean Difference (IV, Fixed, 95% CI) | 1.30 [‐1.23, 3.82] |
| 34 MOS SF Physical composite (change values) | 2 | Mean Difference (IV, Fixed, 95% CI) | Subtotals only | |
| 34.1 End of intervention | 2 | 294 | Mean Difference (IV, Fixed, 95% CI) | 2.56 [‐0.13, 5.25] |
| 34.2 Follow‐up | 0 | 0 | Mean Difference (IV, Fixed, 95% CI) | 0.0 [0.0, 0.0] |
| 35 MOS SF Physical function (follow‐up values) | 7 | Mean Difference (IV, Random, 95% CI) | Subtotals only | |
| 35.1 End of intervention | 7 | 515 | Mean Difference (IV, Random, 95% CI) | 2.09 [0.03, 4.15] |
| 35.2 Follow‐up | 2 | 239 | Mean Difference (IV, Random, 95% CI) | 2.71 [‐1.58, 6.99] |
| 36 MOS SF Physical function (change values) | 5 | Mean Difference (IV, Random, 95% CI) | Subtotals only | |
| 36.1 End of intervention | 5 | 333 | Mean Difference (IV, Random, 95% CI) | 2.08 [0.21, 3.94] |
| 36.2 Follow‐up | 0 | 0 | Mean Difference (IV, Random, 95% CI) | 0.0 [0.0, 0.0] |
| 37 EORTC QLQ‐C30 Physical function (follow‐up values) | 3 | Mean Difference (IV, Random, 95% CI) | Subtotals only | |
| 37.1 End of intervention | 3 | 135 | Mean Difference (IV, Random, 95% CI) | 2.99 [‐1.64, 7.63] |
| 37.2 Follow‐up | 0 | 0 | Mean Difference (IV, Random, 95% CI) | 0.0 [0.0, 0.0] |
| 38 EORTC QLQ‐C30 Physical function (change values) | 3 | Mean Difference (IV, Random, 95% CI) | Subtotals only | |
| 38.1 End of intrevention | 3 | 573 | Mean Difference (IV, Random, 95% CI) | 3.12 [‐3.24, 9.49] |
| 38.2 Follow‐up | 0 | 0 | Mean Difference (IV, Random, 95% CI) | 0.0 [0.0, 0.0] |
| 39 Body Esteem Scale ‐ Physical condition (follow‐up values) | 2 | Mean Difference (IV, Random, 95% CI) | Subtotals only | |
| 39.1 End of intervention | 2 | 106 | Mean Difference (IV, Random, 95% CI) | 4.41 [0.57, 8.25] |
| 39.2 Follow‐up | 0 | 0 | Mean Difference (IV, Random, 95% CI) | 0.0 [0.0, 0.0] |
| 40 Overall role function (follow‐up values) | 18 | Std. Mean Difference (IV, Random, 95% CI) | Subtotals only | |
| 40.1 End of intervention | 18 | 1370 | Std. Mean Difference (IV, Random, 95% CI) | 0.29 [0.07, 0.51] |
| 40.2 Follow‐up | 2 | 249 | Std. Mean Difference (IV, Random, 95% CI) | 0.13 [‐0.12, 0.38] |
| 41 Overall role function (change values) | 12 | Std. Mean Difference (IV, Random, 95% CI) | Subtotals only | |
| 41.1 End of intervention | 12 | 1315 | Std. Mean Difference (IV, Random, 95% CI) | 0.14 [‐0.05, 0.33] |
| 41.2 Follow‐up | 1 | 36 | Std. Mean Difference (IV, Random, 95% CI) | 0.37 [‐0.29, 1.03] |
| 42 FACT Functional well‐being (follow‐up values) | 11 | Mean Difference (IV, Random, 95% CI) | Subtotals only | |
| 42.1 End of intervention | 11 | 1064 | Mean Difference (IV, Random, 95% CI) | 1.67 [0.29, 3.06] |
| 42.2 Follow‐up | 2 | 249 | Mean Difference (IV, Random, 95% CI) | 0.68 [‐0.65, 2.01] |
| 43 FACT Functional well‐being (change values) | 6 | Mean Difference (IV, Fixed, 95% CI) | Subtotals only | |
| 43.1 End of intervention | 6 | 582 | Mean Difference (IV, Fixed, 95% CI) | 0.72 [0.42, 1.01] |
| 43.2 Follow‐up | 1 | 36 | Mean Difference (IV, Fixed, 95% CI) | 1.31 [‐1.02, 3.64] |
| 44 MOS SF Physical role (follow‐up values) | 3 | Mean Difference (IV, Fixed, 95% CI) | Subtotals only | |
| 44.1 End of intervention | 3 | 143 | Mean Difference (IV, Fixed, 95% CI) | ‐0.16 [‐1.47, 1.15] |
| 44.2 Follow‐up | 0 | 0 | Mean Difference (IV, Fixed, 95% CI) | 0.0 [0.0, 0.0] |
| 45 MOS SF Physical role (change values) | 3 | Mean Difference (IV, Random, 95% CI) | Subtotals only | |
| 45.1 End of intervention | 3 | 155 | Mean Difference (IV, Random, 95% CI) | 0.46 [‐1.52, 2.43] |
| 45.2 Follow‐up | 0 | 0 | Mean Difference (IV, Random, 95% CI) | 0.0 [0.0, 0.0] |
| 46 EORTC QLQ‐C30 Role function (follow‐up values) | 3 | Mean Difference (IV, Random, 95% CI) | Subtotals only | |
| 46.1 End of intervention | 3 | 135 | Mean Difference (IV, Random, 95% CI) | 0.44 [‐5.78, 6.66] |
| 46.2 Follow‐up | 0 | 0 | Mean Difference (IV, Random, 95% CI) | 0.0 [0.0, 0.0] |
| 47 EORTC QLQ‐C30 Role function (change values) | 3 | Mean Difference (IV, Fixed, 95% CI) | Subtotals only | |
| 47.1 End of intervention | 3 | 573 | Mean Difference (IV, Fixed, 95% CI) | ‐1.08 [‐4.52, 2.36] |
| 47.2 Follow‐up | 0 | 0 | Mean Difference (IV, Fixed, 95% CI) | 0.0 [0.0, 0.0] |
| 48 Overall social well‐being/function (follow‐up values) | 18 | Std. Mean Difference (IV, Random, 95% CI) | Subtotals only | |
| 48.1 End of intervention | 18 | 1557 | Std. Mean Difference (IV, Random, 95% CI) | 0.19 [0.08, 0.30] |
| 48.2 Follow‐up | 1 | 213 | Std. Mean Difference (IV, Random, 95% CI) | 0.09 [‐0.18, 0.36] |
| 49 Overall social well‐being/function (change values) | 12 | Std. Mean Difference (IV, Random, 95% CI) | Subtotals only | |
| 49.1 End of intervention | 12 | 1384 | Std. Mean Difference (IV, Random, 95% CI) | 0.52 [0.16, 0.87] |
| 49.2 Follow‐up | 1 | 36 | Std. Mean Difference (IV, Random, 95% CI) | 0.69 [0.01, 1.36] |
| 50 FACT Social well‐being (follow‐up values) | 11 | Mean Difference (IV, Random, 95% CI) | Subtotals only | |
| 50.1 End of intervention | 11 | 1064 | Mean Difference (IV, Random, 95% CI) | 0.77 [0.11, 1.43] |
| 50.2 Follow‐up | 1 | 213 | Mean Difference (IV, Random, 95% CI) | 0.5 [‐1.02, 2.02] |
| 51 FACT Social well‐being (change values) | 6 | Mean Difference (IV, Fixed, 95% CI) | Subtotals only | |
| 51.1 End of intervention | 6 | 582 | Mean Difference (IV, Fixed, 95% CI) | 1.93 [1.58, 2.28] |
| 51.2 Follow‐up | 1 | 36 | Mean Difference (IV, Fixed, 95% CI) | 3.86 [0.17, 7.55] |
| 52 MOS SF Social functioning (follow‐up values) | 5 | Mean Difference (IV, Fixed, 95% CI) | Subtotals only | |
| 52.1 End of intervention | 5 | 234 | Mean Difference (IV, Fixed, 95% CI) | ‐0.32 [‐1.87, 1.23] |
| 52.2 Follow‐up | 0 | 0 | Mean Difference (IV, Fixed, 95% CI) | 0.0 [0.0, 0.0] |
| 53 MOS SF Social functioning (change values) | 4 | Mean Difference (IV, Fixed, 95% CI) | Subtotals only | |
| 53.1 End of intervention | 4 | 213 | Mean Difference (IV, Fixed, 95% CI) | 1.05 [‐0.08, 2.18] |
| 53.2 Follow‐up | 0 | 0 | Mean Difference (IV, Fixed, 95% CI) | 0.0 [0.0, 0.0] |
| 54 EORTC QLQ‐C30 Social function (follow‐up values) | 2 | Mean Difference (IV, Random, 95% CI) | Subtotals only | |
| 54.1 End of intervention | 2 | 73 | Mean Difference (IV, Random, 95% CI) | 7.55 [‐11.77, 26.86] |
| 54.2 Follow‐up | 0 | 0 | Mean Difference (IV, Random, 95% CI) | 0.0 [0.0, 0.0] |
| 55 EORTC QLQ‐C30 Social function (change values) | 3 | Mean Difference (IV, Random, 95% CI) | Subtotals only | |
| 55.1 End of intervention | 3 | 573 | Mean Difference (IV, Random, 95% CI) | 2.14 [‐8.02, 12.30] |
| 55.2 Follow‐up | 0 | 0 | Mean Difference (IV, Random, 95% CI) | 0.0 [0.0, 0.0] |
| 56 Overall cognitive function (follow‐up values) | 5 | Std. Mean Difference (IV, Random, 95% CI) | Subtotals only | |
| 56.1 End of intervention | 5 | 189 | Std. Mean Difference (IV, Random, 95% CI) | 0.40 [0.11, 0.69] |
| 56.2 Follow‐up | 2 | 97 | Std. Mean Difference (IV, Random, 95% CI) | 0.31 [‐0.09, 0.71] |
| 57 Overall cognitive function (change values) | 5 | Std. Mean Difference (IV, Random, 95% CI) | Subtotals only | |
| 57.1 End of intervention | 5 | 672 | Std. Mean Difference (IV, Random, 95% CI) | ‐0.00 [‐0.27, 0.26] |
| 57.2 Follow‐up | 2 | 97 | Std. Mean Difference (IV, Random, 95% CI) | 0.20 [‐0.20, 0.60] |
| 58 EORTC QLQ‐C30 Cognitive function (follow‐up values) | 2 | Mean Difference (IV, Fixed, 95% CI) | Subtotals only | |
| 58.1 End of intervention | 2 | 73 | Mean Difference (IV, Fixed, 95% CI) | 2.43 [‐5.75, 10.61] |
| 58.2 Follow‐up | 0 | 0 | Mean Difference (IV, Fixed, 95% CI) | 0.0 [0.0, 0.0] |
| 59 EORTC QLQ‐C30 Cognitive function (change values) | 3 | Mean Difference (IV, Fixed, 95% CI) | Subtotals only | |
| 59.1 End of intervention | 3 | 573 | Mean Difference (IV, Fixed, 95% CI) | ‐3.25 [‐6.31, ‐0.18] |
| 59.2 Follow‐up | 0 | 0 | Mean Difference (IV, Fixed, 95% CI) | 0.0 [0.0, 0.0] |
| 60 POMS confusion subscale (follow‐up values) | 2 | Std. Mean Difference (IV, Fixed, 95% CI) | Subtotals only | |
| 60.1 End of intervention | 2 | 79 | Std. Mean Difference (IV, Fixed, 95% CI) | ‐0.66 [‐1.12, ‐0.19] |
| 60.2 Follow‐up | 1 | 61 | Std. Mean Difference (IV, Fixed, 95% CI) | ‐0.45 [‐0.96, 0.06] |
| 61 Overall general health (follow‐up values) | 9 | Std. Mean Difference (IV, Random, 95% CI) | Subtotals only | |
| 61.1 End of intervention | 9 | 456 | Std. Mean Difference (IV, Random, 95% CI) | 0.18 [‐0.08, 0.45] |
| 61.2 Follow‐up | 1 | 36 | Std. Mean Difference (IV, Random, 95% CI) | ‐0.22 [‐0.87, 0.44] |
| 62 Overall general health (change values) | 9 | Std. Mean Difference (IV, Random, 95% CI) | Subtotals only | |
| 62.1 End of intervention | 9 | 906 | Std. Mean Difference (IV, Random, 95% CI) | 0.17 [‐0.07, 0.40] |
| 62.2 Follow‐up | 1 | 36 | Std. Mean Difference (IV, Random, 95% CI) | 0.07 [‐0.59, 0.72] |
| 63 MOS SF General health (follow‐up values) | 5 | Mean Difference (IV, Random, 95% CI) | Subtotals only | |
| 63.1 End of intervention | 5 | 233 | Mean Difference (IV, Random, 95% CI) | 2.14 [‐2.61, 6.88] |
| 63.2 Follow‐up | 0 | 0 | Mean Difference (IV, Random, 95% CI) | 0.0 [0.0, 0.0] |
| 64 MOS SF General health (change values) | 4 | Mean Difference (IV, Fixed, 95% CI) | Subtotals only | |
| 64.1 End of intervention | 4 | 213 | Mean Difference (IV, Fixed, 95% CI) | 0.10 [‐1.26, 1.45] |
| 64.2 Follow‐up | 0 | 0 | Mean Difference (IV, Fixed, 95% CI) | 0.0 [0.0, 0.0] |
| 65 Overall sexual function (follow‐up values) | 5 | Std. Mean Difference (IV, Fixed, 95% CI) | Subtotals only | |
| 65.1 End of intervention | 5 | 411 | Std. Mean Difference (IV, Fixed, 95% CI) | 0.16 [‐0.04, 0.35] |
| 65.2 Follow‐up | 1 | 102 | Std. Mean Difference (IV, Fixed, 95% CI) | 0.19 [‐0.20, 0.58] |
| 66 Overall sexual function (change values) | 3 | Std. Mean Difference (IV, Random, 95% CI) | Subtotals only | |
| 66.1 End of intervention | 3 | 693 | Std. Mean Difference (IV, Random, 95% CI) | 0.22 [‐0.08, 0.52] |
| 66.2 Follow‐up | 0 | 0 | Std. Mean Difference (IV, Random, 95% CI) | 0.0 [0.0, 0.0] |
| 67 Body Esteem Scale ‐ sexual attractiveness (follow‐up values) | 2 | Mean Difference (IV, Fixed, 95% CI) | Subtotals only | |
| 67.1 End of intervention | 2 | 100 | Mean Difference (IV, Fixed, 95% CI) | 1.71 [‐1.41, 4.82] |
| 67.2 Follow‐up | 0 | 0 | Mean Difference (IV, Fixed, 95% CI) | 0.0 [0.0, 0.0] |
| 68 Overall sleep (follow‐up values) | 5 | Std. Mean Difference (IV, Fixed, 95% CI) | Subtotals only | |
| 68.1 End of intervention | 5 | 188 | Std. Mean Difference (IV, Fixed, 95% CI) | ‐0.09 [‐0.37, 0.20] |
| 68.2 Follow‐up | 1 | 31 | Std. Mean Difference (IV, Fixed, 95% CI) | ‐0.49 [‐1.20, 0.23] |
| 69 Overall sleep (change values) | 3 | Std. Mean Difference (IV, Random, 95% CI) | Subtotals only | |
| 69.1 End of intervention | 3 | 136 | Std. Mean Difference (IV, Random, 95% CI) | 0.14 [‐0.20, 0.48] |
| 69.2 Follow‐up | 0 | 0 | Std. Mean Difference (IV, Random, 95% CI) | 0.0 [0.0, 0.0] |
| 70 PSQI Global sleep score (follow‐up values) | 5 | Mean Difference (IV, Fixed, 95% CI) | Subtotals only | |
| 70.1 End of intervention | 5 | 317 | Mean Difference (IV, Fixed, 95% CI) | ‐0.47 [‐1.01, 0.08] |
| 70.2 Follow‐up | 1 | 31 | Mean Difference (IV, Fixed, 95% CI) | ‐1.5 [‐3.63, 0.63] |
| 71 PSQI Global sleep score (change values) | 2 | Mean Difference (IV, Fixed, 95% CI) | Subtotals only | |
| 71.1 End of intervention | 2 | 80 | Mean Difference (IV, Fixed, 95% CI) | 0.54 [‐1.11, 2.19] |
| 71.2 Follow‐up | 0 | 0 | Mean Difference (IV, Fixed, 95% CI) | 0.0 [0.0, 0.0] |
| 72 PSQI sleep quality (follow‐up values) | 2 | Mean Difference (IV, Random, 95% CI) | Subtotals only | |
| 72.1 End of intervention | 2 | 80 | Mean Difference (IV, Random, 95% CI) | ‐0.24 [‐0.81, 0.32] |
| 72.2 Follow‐up | 0 | 0 | Mean Difference (IV, Random, 95% CI) | 0.0 [0.0, 0.0] |
| 73 PSQI sleep efficiency (follow‐up values) | 3 | Mean Difference (IV, Fixed, 95% CI) | Subtotals only | |
| 73.1 End of intervention | 3 | 100 | Mean Difference (IV, Fixed, 95% CI) | 0.15 [‐0.24, 0.53] |
| 73.2 Follow‐up | 0 | 0 | Mean Difference (IV, Fixed, 95% CI) | 0.0 [0.0, 0.0] |
| 74 PSQI sleep latency (follow‐up values) | 3 | Mean Difference (IV, Fixed, 95% CI) | Subtotals only | |
| 74.1 End of intervention | 3 | 100 | Mean Difference (IV, Fixed, 95% CI) | 0.19 [‐0.16, 0.55] |
| 74.2 Follow‐up | 0 | 0 | Mean Difference (IV, Fixed, 95% CI) | 0.0 [0.0, 0.0] |
| 75 PSQI sleep duration (follow‐up values) | 2 | Mean Difference (IV, Fixed, 95% CI) | Subtotals only | |
| 75.1 End of intervention | 2 | 80 | Mean Difference (IV, Fixed, 95% CI) | 0.06 [‐0.28, 0.41] |
| 75.2 Follow‐up | 0 | 0 | Mean Difference (IV, Fixed, 95% CI) | 0.0 [0.0, 0.0] |
| 76 PSQI daytime dysfunction (follow‐up values) | 3 | Mean Difference (IV, Random, 95% CI) | Subtotals only | |
| 76.1 End of intervention | 3 | 100 | Mean Difference (IV, Random, 95% CI) | ‐0.08 [‐0.51, 0.35] |
| 76.2 Follow‐up | 0 | 0 | Mean Difference (IV, Random, 95% CI) | 0.0 [0.0, 0.0] |
| 77 PSQI medication use (follow‐up values) | 2 | Std. Mean Difference (IV, Random, 95% CI) | Subtotals only | |
| 77.1 End of intervention | 2 | 80 | Std. Mean Difference (IV, Random, 95% CI) | ‐0.06 [‐0.50, 0.38] |
| 77.2 Follow‐up | 0 | 0 | Std. Mean Difference (IV, Random, 95% CI) | 0.0 [0.0, 0.0] |
| 78 Accelerator‐derived sleep efficiency (follow‐up values) | 2 | Mean Difference (IV, Fixed, 95% CI) | Subtotals only | |
| 78.1 End of intervention | 2 | 62 | Mean Difference (IV, Fixed, 95% CI) | ‐2.25 [‐5.52, 1.01] |
| 78.2 Follow‐up | 0 | 0 | Mean Difference (IV, Fixed, 95% CI) | 0.0 [0.0, 0.0] |
| 79 Accelerator‐derived sleep latency (follow‐up values) | 2 | Mean Difference (IV, Fixed, 95% CI) | Subtotals only | |
| 79.1 End of intervention | 2 | 62 | Mean Difference (IV, Fixed, 95% CI) | ‐2.04 [‐4.78, 0.69] |
| 79.2 Follow‐up | 0 | 0 | Mean Difference (IV, Fixed, 95% CI) | 0.0 [0.0, 0.0] |
1.7. Analysis.
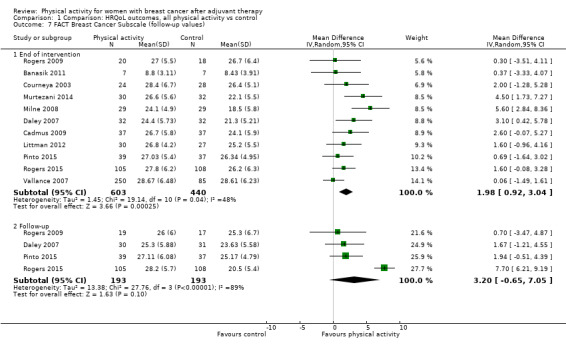
Comparison 1 Comparison: HRQoL outcomes, all physical activity vs control, Outcome 7 FACT Breast Cancer Subscale (follow‐up values).
1.8. Analysis.
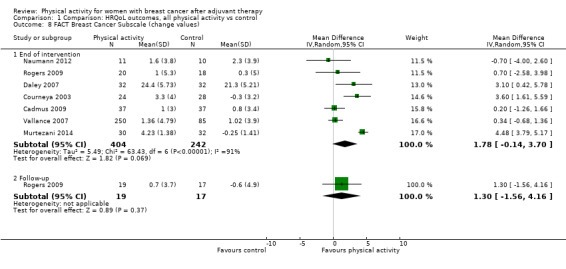
Comparison 1 Comparison: HRQoL outcomes, all physical activity vs control, Outcome 8 FACT Breast Cancer Subscale (change values).
1.9. Analysis.

Comparison 1 Comparison: HRQoL outcomes, all physical activity vs control, Outcome 9 FACT Trial Outcome Index (follow‐up values).
1.12. Analysis.
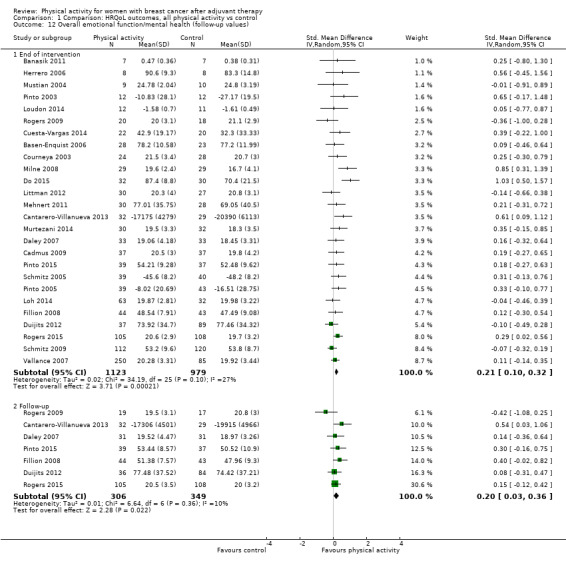
Comparison 1 Comparison: HRQoL outcomes, all physical activity vs control, Outcome 12 Overall emotional function/mental health (follow‐up values).
1.13. Analysis.
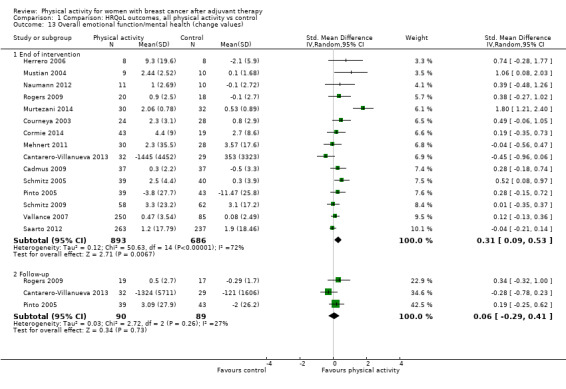
Comparison 1 Comparison: HRQoL outcomes, all physical activity vs control, Outcome 13 Overall emotional function/mental health (change values).
1.14. Analysis.
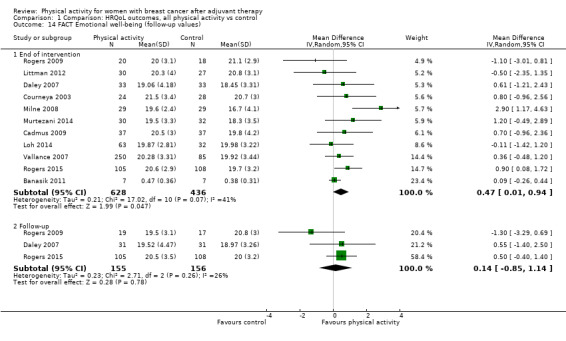
Comparison 1 Comparison: HRQoL outcomes, all physical activity vs control, Outcome 14 FACT Emotional well‐being (follow‐up values).
1.16. Analysis.

Comparison 1 Comparison: HRQoL outcomes, all physical activity vs control, Outcome 16 MOS SF Mental composite (follow‐up values).
1.17. Analysis.

Comparison 1 Comparison: HRQoL outcomes, all physical activity vs control, Outcome 17 MOS SF Mental composite (change values).
1.18. Analysis.

Comparison 1 Comparison: HRQoL outcomes, all physical activity vs control, Outcome 18 MOS SF Mental health (follow‐up values).
1.20. Analysis.
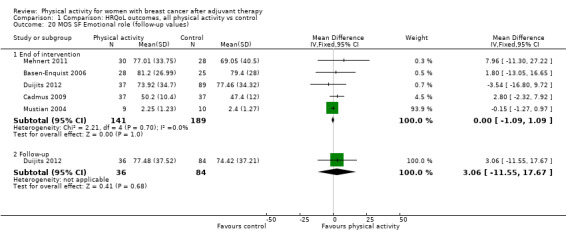
Comparison 1 Comparison: HRQoL outcomes, all physical activity vs control, Outcome 20 MOS SF Emotional role (follow‐up values).
1.21. Analysis.
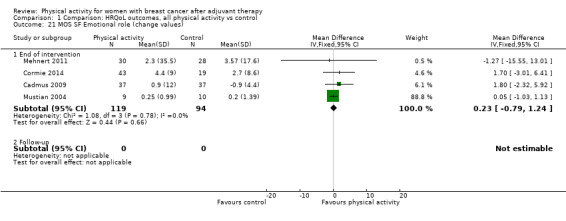
Comparison 1 Comparison: HRQoL outcomes, all physical activity vs control, Outcome 21 MOS SF Emotional role (change values).
1.22. Analysis.

Comparison 1 Comparison: HRQoL outcomes, all physical activity vs control, Outcome 22 EORTC QLQ‐C30 Emotional function (follow‐up values).
1.23. Analysis.
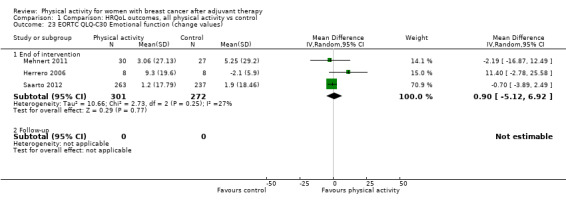
Comparison 1 Comparison: HRQoL outcomes, all physical activity vs control, Outcome 23 EORTC QLQ‐C30 Emotional function (change values).
1.25. Analysis.

Comparison 1 Comparison: HRQoL outcomes, all physical activity vs control, Outcome 25 POMS total mood disturbance (change values).
1.27. Analysis.
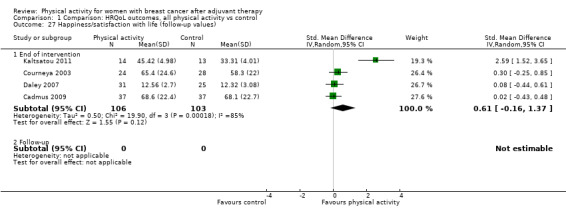
Comparison 1 Comparison: HRQoL outcomes, all physical activity vs control, Outcome 27 Happiness/satisfaction with life (follow‐up values).
1.28. Analysis.
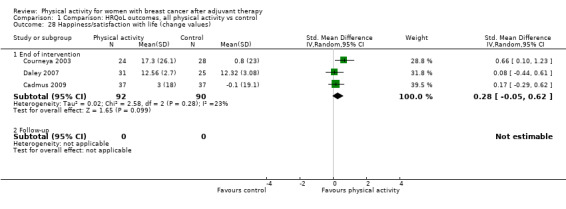
Comparison 1 Comparison: HRQoL outcomes, all physical activity vs control, Outcome 28 Happiness/satisfaction with life (change values).
1.32. Analysis.

Comparison 1 Comparison: HRQoL outcomes, all physical activity vs control, Outcome 32 FACT Physical well‐being (change values).
1.34. Analysis.
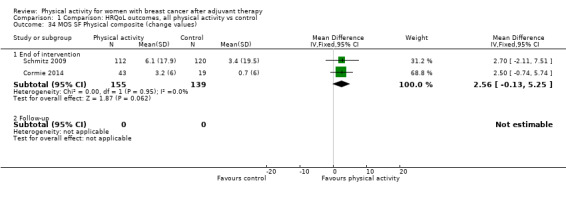
Comparison 1 Comparison: HRQoL outcomes, all physical activity vs control, Outcome 34 MOS SF Physical composite (change values).
1.37. Analysis.
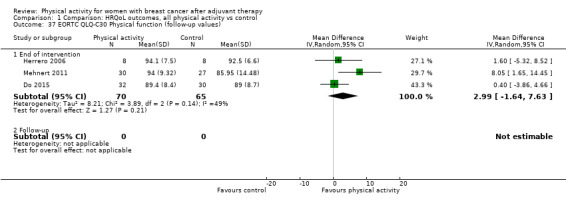
Comparison 1 Comparison: HRQoL outcomes, all physical activity vs control, Outcome 37 EORTC QLQ‐C30 Physical function (follow‐up values).
1.38. Analysis.
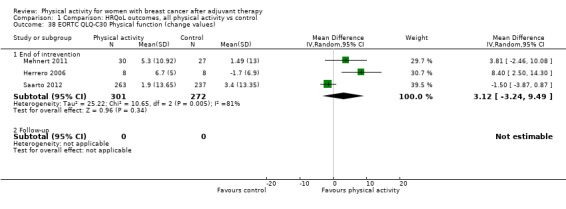
Comparison 1 Comparison: HRQoL outcomes, all physical activity vs control, Outcome 38 EORTC QLQ‐C30 Physical function (change values).
1.39. Analysis.
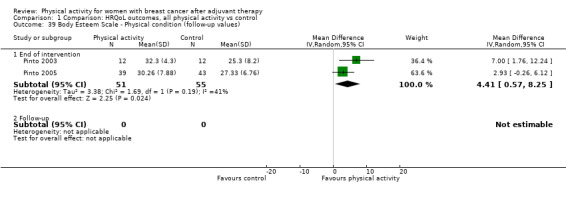
Comparison 1 Comparison: HRQoL outcomes, all physical activity vs control, Outcome 39 Body Esteem Scale ‐ Physical condition (follow‐up values).
1.44. Analysis.
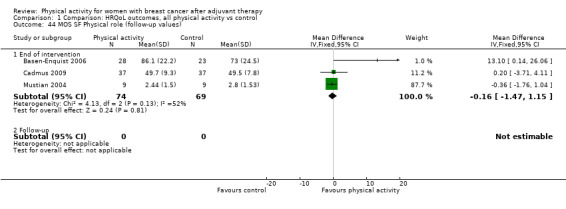
Comparison 1 Comparison: HRQoL outcomes, all physical activity vs control, Outcome 44 MOS SF Physical role (follow‐up values).
1.45. Analysis.

Comparison 1 Comparison: HRQoL outcomes, all physical activity vs control, Outcome 45 MOS SF Physical role (change values).
1.46. Analysis.
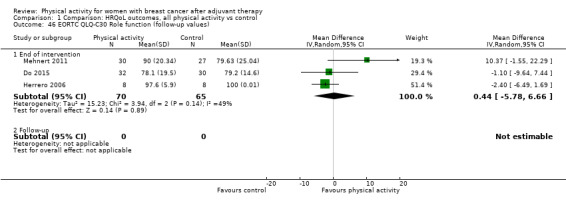
Comparison 1 Comparison: HRQoL outcomes, all physical activity vs control, Outcome 46 EORTC QLQ‐C30 Role function (follow‐up values).
1.47. Analysis.

Comparison 1 Comparison: HRQoL outcomes, all physical activity vs control, Outcome 47 EORTC QLQ‐C30 Role function (change values).
1.52. Analysis.

Comparison 1 Comparison: HRQoL outcomes, all physical activity vs control, Outcome 52 MOS SF Social functioning (follow‐up values).
1.53. Analysis.
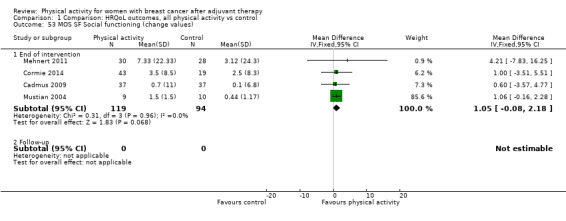
Comparison 1 Comparison: HRQoL outcomes, all physical activity vs control, Outcome 53 MOS SF Social functioning (change values).
1.54. Analysis.

Comparison 1 Comparison: HRQoL outcomes, all physical activity vs control, Outcome 54 EORTC QLQ‐C30 Social function (follow‐up values).
1.55. Analysis.

Comparison 1 Comparison: HRQoL outcomes, all physical activity vs control, Outcome 55 EORTC QLQ‐C30 Social function (change values).
1.58. Analysis.

Comparison 1 Comparison: HRQoL outcomes, all physical activity vs control, Outcome 58 EORTC QLQ‐C30 Cognitive function (follow‐up values).
1.59. Analysis.

Comparison 1 Comparison: HRQoL outcomes, all physical activity vs control, Outcome 59 EORTC QLQ‐C30 Cognitive function (change values).
1.63. Analysis.

Comparison 1 Comparison: HRQoL outcomes, all physical activity vs control, Outcome 63 MOS SF General health (follow‐up values).
1.64. Analysis.

Comparison 1 Comparison: HRQoL outcomes, all physical activity vs control, Outcome 64 MOS SF General health (change values).
1.67. Analysis.

Comparison 1 Comparison: HRQoL outcomes, all physical activity vs control, Outcome 67 Body Esteem Scale ‐ sexual attractiveness (follow‐up values).
1.70. Analysis.

Comparison 1 Comparison: HRQoL outcomes, all physical activity vs control, Outcome 70 PSQI Global sleep score (follow‐up values).
1.71. Analysis.

Comparison 1 Comparison: HRQoL outcomes, all physical activity vs control, Outcome 71 PSQI Global sleep score (change values).
1.72. Analysis.

Comparison 1 Comparison: HRQoL outcomes, all physical activity vs control, Outcome 72 PSQI sleep quality (follow‐up values).
1.73. Analysis.

Comparison 1 Comparison: HRQoL outcomes, all physical activity vs control, Outcome 73 PSQI sleep efficiency (follow‐up values).
1.74. Analysis.
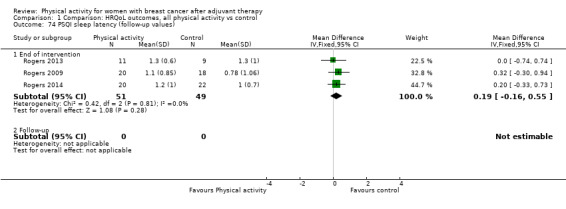
Comparison 1 Comparison: HRQoL outcomes, all physical activity vs control, Outcome 74 PSQI sleep latency (follow‐up values).
1.75. Analysis.
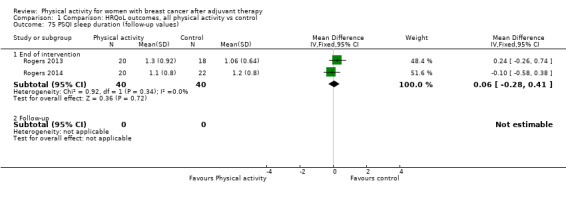
Comparison 1 Comparison: HRQoL outcomes, all physical activity vs control, Outcome 75 PSQI sleep duration (follow‐up values).
1.76. Analysis.

Comparison 1 Comparison: HRQoL outcomes, all physical activity vs control, Outcome 76 PSQI daytime dysfunction (follow‐up values).
1.77. Analysis.

Comparison 1 Comparison: HRQoL outcomes, all physical activity vs control, Outcome 77 PSQI medication use (follow‐up values).
1.78. Analysis.

Comparison 1 Comparison: HRQoL outcomes, all physical activity vs control, Outcome 78 Accelerator‐derived sleep efficiency (follow‐up values).
1.79. Analysis.

Comparison 1 Comparison: HRQoL outcomes, all physical activity vs control, Outcome 79 Accelerator‐derived sleep latency (follow‐up values).
Comparison 2. Comparison: anxiety, all physical activity vs control.
| Outcome or subgroup title | No. of studies | No. of participants | Statistical method | Effect size |
|---|---|---|---|---|
| 1 Overall anxiety (follow‐up values) | 7 | Std. Mean Difference (IV, Random, 95% CI) | Subtotals only | |
| 1.1 End of intervention | 7 | 326 | Std. Mean Difference (IV, Random, 95% CI) | ‐0.57 [‐0.95, ‐0.19] |
| 1.2 Follow‐up | 1 | 61 | Std. Mean Difference (IV, Random, 95% CI) | ‐0.47 [‐0.98, 0.04] |
| 2 Overall anxiety (change values) | 4 | Std. Mean Difference (IV, Fixed, 95% CI) | Subtotals only | |
| 2.1 End of intervention | 4 | 235 | Std. Mean Difference (IV, Fixed, 95% CI) | ‐0.37 [‐0.63, ‐0.12] |
| 2.2 Follow‐up | 1 | 61 | Std. Mean Difference (IV, Fixed, 95% CI) | ‐0.30 [‐0.81, 0.20] |
| 3 POMS tension ‐ anxiety (follow‐up values) | 2 | Std. Mean Difference (IV, Fixed, 95% CI) | Subtotals only | |
| 3.1 End of intervention | 2 | 79 | Std. Mean Difference (IV, Fixed, 95% CI) | ‐0.66 [‐1.12, ‐0.20] |
| 3.2 Follow‐up | 1 | 61 | Std. Mean Difference (IV, Fixed, 95% CI) | ‐0.47 [‐0.98, 0.04] |
| 4 State Trait Anxiety Inventory (follow‐up values) | 2 | Std. Mean Difference (IV, Random, 95% CI) | Subtotals only | |
| 4.1 End of intervention | 2 | 89 | Std. Mean Difference (IV, Random, 95% CI) | ‐1.20 [‐3.49, 1.09] |
| 4.2 Follow‐up | 0 | 0 | Std. Mean Difference (IV, Random, 95% CI) | 0.0 [0.0, 0.0] |
| 5 Cohen's Perceived Stress Scale | 2 | Mean Difference (IV, Fixed, 95% CI) | Subtotals only | |
| 5.1 End of intervention | 2 | 105 | Mean Difference (IV, Fixed, 95% CI) | ‐1.25 [‐3.99, 1.50] |
| 5.2 Follow‐up | 0 | 0 | Mean Difference (IV, Fixed, 95% CI) | 0.0 [0.0, 0.0] |
2.4. Analysis.
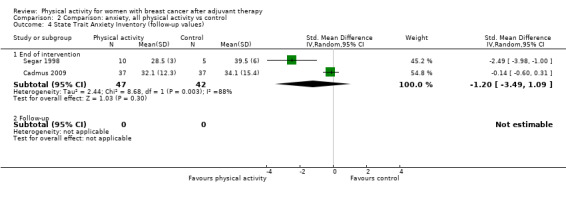
Comparison 2 Comparison: anxiety, all physical activity vs control, Outcome 4 State Trait Anxiety Inventory (follow‐up values).
2.5. Analysis.
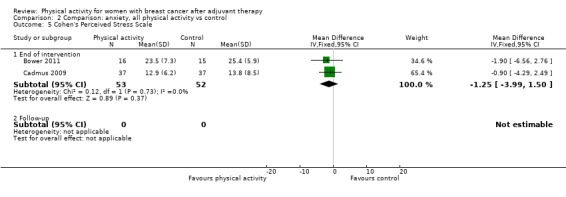
Comparison 2 Comparison: anxiety, all physical activity vs control, Outcome 5 Cohen's Perceived Stress Scale.
Comparison 3. Comparison: depression, all physical activity vs control.
| Outcome or subgroup title | No. of studies | No. of participants | Statistical method | Effect size |
|---|---|---|---|---|
| 1 Overall depression (follow‐up values) | 12 | Std. Mean Difference (IV, Random, 95% CI) | Subtotals only | |
| 1.1 End of intervention | 12 | 657 | Std. Mean Difference (IV, Random, 95% CI) | ‐0.34 [‐0.62, ‐0.05] |
| 1.2 Follow‐up | 4 | 340 | Std. Mean Difference (IV, Random, 95% CI) | ‐0.28 [‐0.51, ‐0.05] |
| 2 Overall depression (change values) | 7 | Std. Mean Difference (IV, Random, 95% CI) | Subtotals only | |
| 2.1 End of intervention | 7 | 816 | Std. Mean Difference (IV, Random, 95% CI) | ‐0.34 [‐0.63, ‐0.05] |
| 2.2 Follow‐up | 1 | 61 | Std. Mean Difference (IV, Random, 95% CI) | ‐0.46 [‐0.97, 0.05] |
| 3 Beck Depression Inventory‐II (follow‐up values) | 5 | Mean Difference (IV, Random, 95% CI) | Subtotals only | |
| 3.1 End of intervention | 5 | 198 | Mean Difference (IV, Random, 95% CI) | ‐3.25 [‐5.94, ‐0.56] |
| 3.2 Follow‐up | 2 | 93 | Mean Difference (IV, Random, 95% CI) | ‐2.35 [‐5.31, 0.60] |
| 4 Beck Depression Inventory‐II (change values) | 3 | Mean Difference (IV, Random, 95% CI) | Subtotals only | |
| 4.1 End of intervention | 3 | 581 | Mean Difference (IV, Random, 95% CI) | ‐1.84 [‐5.33, 1.65] |
| 4.2 Follow‐up | 0 | 0 | Mean Difference (IV, Random, 95% CI) | 0.0 [0.0, 0.0] |
| 5 CES‐Depression scale (follow‐up values) | 3 | Mean Difference (IV, Fixed, 95% CI) | Subtotals only | |
| 5.1 End of intervention | 3 | 280 | Mean Difference (IV, Fixed, 95% CI) | ‐1.36 [‐3.39, 0.67] |
| 5.2 Follow‐up | 1 | 186 | Mean Difference (IV, Fixed, 95% CI) | ‐1.90 [‐4.32, 0.52] |
| 6 POMS depression subscale (follow‐up values) | 2 | Mean Difference (IV, Random, 95% CI) | Subtotals only | |
| 6.1 End of intervention | 2 | 79 | Mean Difference (IV, Random, 95% CI) | ‐6.39 [‐10.66, ‐2.12] |
| 6.2 Follow‐up | 1 | 61 | Mean Difference (IV, Random, 95% CI) | ‐6.65 [‐11.97, ‐1.33] |
| 7 POMS tension subscale (follow‐up values) | 2 | Mean Difference (IV, Random, 95% CI) | Subtotals only | |
| 7.1 End of intervention | 2 | 79 | Mean Difference (IV, Random, 95% CI) | ‐5.14 [‐9.55, ‐0.73] |
| 7.2 Follow‐up | 1 | 61 | Mean Difference (IV, Random, 95% CI) | ‐4.87 [‐10.09, 0.35] |
3.4. Analysis.
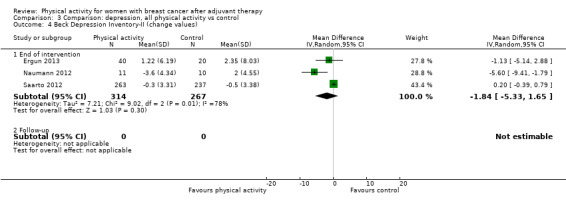
Comparison 3 Comparison: depression, all physical activity vs control, Outcome 4 Beck Depression Inventory‐II (change values).
3.5. Analysis.
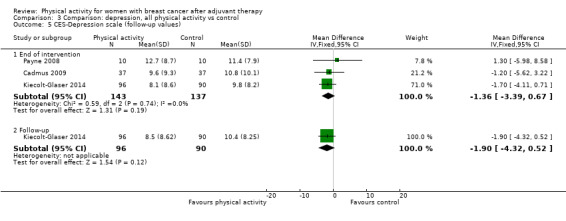
Comparison 3 Comparison: depression, all physical activity vs control, Outcome 5 CES‐Depression scale (follow‐up values).
Comparison 4. Comparison: fatigue and vigour, all physical activity vs control.
| Outcome or subgroup title | No. of studies | No. of participants | Statistical method | Effect size |
|---|---|---|---|---|
| 1 Overall fatigue (follow‐up values) | 26 | Std. Mean Difference (IV, Random, 95% CI) | Subtotals only | |
| 1.1 End of intervention | 26 | 2020 | Std. Mean Difference (IV, Random, 95% CI) | ‐0.32 [‐0.47, ‐0.18] |
| 1.2 Follow‐up | 7 | 536 | Std. Mean Difference (IV, Random, 95% CI) | ‐0.43 [‐0.60, ‐0.26] |
| 2 Overall fatigue (change values) | 13 | Std. Mean Difference (IV, Random, 95% CI) | Subtotals only | |
| 2.1 End of intervention | 13 | 1289 | Std. Mean Difference (IV, Random, 95% CI) | ‐0.30 [‐0.61, 0.00] |
| 2.2 Follow‐up | 4 | 178 | Std. Mean Difference (IV, Random, 95% CI) | ‐0.47 [‐0.84, ‐0.11] |
| 3 FACT‐Fatigue (follow‐up values) | 7 | Mean Difference (IV, Fixed, 95% CI) | Subtotals only | |
| 3.1 End of intervention | 7 | 952 | Mean Difference (IV, Fixed, 95% CI) | 1.14 [‐0.06, 2.35] |
| 3.2 Follow‐up | 2 | 112 | Mean Difference (IV, Fixed, 95% CI) | 1.49 [‐1.95, 4.93] |
| 4 FACT‐Fatigue (change values) | 4 | Mean Difference (IV, Random, 95% CI) | Subtotals only | |
| 4.1 End of intervention | 4 | 925 | Mean Difference (IV, Random, 95% CI) | ‐0.54 [‐3.23, 2.14] |
| 4.2 Follow‐up | 1 | 36 | Mean Difference (IV, Random, 95% CI) | 1.28 [‐4.11, 6.67] |
| 5 EORTC QLQ‐C30 Fatigue scale (follow‐up values) | 2 | Mean Difference (IV, Fixed, 95% CI) | Subtotals only | |
| 5.1 End of intervention | 2 | 119 | Mean Difference (IV, Fixed, 95% CI) | ‐6.83 [‐13.08, ‐0.58] |
| 5.2 Follow‐up | 0 | 0 | Mean Difference (IV, Fixed, 95% CI) | 0.0 [0.0, 0.0] |
| 6 EORTC QLQ‐C30 Fatigue scale (change values) | 2 | Mean Difference (IV, Random, 95% CI) | Subtotals only | |
| 6.1 End of intervention | 2 | 73 | Mean Difference (IV, Random, 95% CI) | ‐2.81 [‐14.98, 9.36] |
| 6.2 Follow‐up | 0 | 0 | Mean Difference (IV, Random, 95% CI) | 0.0 [0.0, 0.0] |
| 7 Multidimensional Fatigue Symptom Inventory (follow‐up values) | 5 | Mean Difference (IV, Random, 95% CI) | Subtotals only | |
| 7.1 End of intervention | 5 | 366 | Mean Difference (IV, Random, 95% CI) | ‐0.53 [‐1.35, 0.29] |
| 7.2 Follow‐up | 3 | 304 | Mean Difference (IV, Random, 95% CI) | ‐2.04 [‐4.30, 0.23] |
| 8 Multidimensional Fatigue Symptom Inventory ‐ interference (follow‐up values) | 2 | Mean Difference (IV, Random, 95% CI) | Subtotals only | |
| 8.1 End of intervention | 2 | 62 | Mean Difference (IV, Random, 95% CI) | ‐0.37 [‐1.34, 0.60] |
| 8.2 Follow‐up | 0 | 0 | Mean Difference (IV, Random, 95% CI) | 0.0 [0.0, 0.0] |
| 9 Revised Piper Fatigue Scale total fatigue (follow‐up values) | 4 | Mean Difference (IV, Random, 95% CI) | Subtotals only | |
| 9.1 End of intervention | 4 | 187 | Mean Difference (IV, Random, 95% CI) | ‐1.18 [‐2.38, 0.02] |
| 9.2 Follow‐up | 2 | 120 | Mean Difference (IV, Random, 95% CI) | ‐1.15 [‐1.86, ‐0.43] |
| 10 Revised Piper Fatigue Scale total fatigue (change values) | 4 | Mean Difference (IV, Random, 95% CI) | Subtotals only | |
| 10.1 End of intervention | 4 | 166 | Mean Difference (IV, Random, 95% CI) | ‐1.96 [‐2.93, 1.00] |
| 10.2 Follow‐up | 2 | 120 | Mean Difference (IV, Random, 95% CI) | ‐1.14 [‐1.78, ‐0.49] |
| 11 Revised Piper Fatigue Scale behavioural/severity (follow‐up values) | 3 | Mean Difference (IV, Random, 95% CI) | Subtotals only | |
| 11.1 End of intervention | 3 | 121 | Mean Difference (IV, Random, 95% CI) | ‐1.24 [‐2.49, 0.01] |
| 11.2 Follow‐up | 1 | 61 | Mean Difference (IV, Random, 95% CI) | ‐1.41 [‐2.57, ‐0.25] |
| 12 Revised Piper Fatigue Scale affective/meaning (follow‐up values) | 3 | Mean Difference (IV, Fixed, 95% CI) | Subtotals only | |
| 12.1 End of intervention | 3 | 121 | Mean Difference (IV, Fixed, 95% CI) | ‐2.11 [‐3.03, ‐1.20] |
| 12.2 Follow‐up | 1 | 61 | Mean Difference (IV, Fixed, 95% CI) | ‐2.05 [‐3.21, ‐0.89] |
| 13 Revised Piper Fatigue Scale sensory (follow‐up values) | 3 | Mean Difference (IV, Random, 95% CI) | Subtotals only | |
| 13.1 End of intervention | 3 | 121 | Mean Difference (IV, Random, 95% CI) | ‐0.44 [‐3.11, 2.22] |
| 13.2 Follow‐up | 1 | 61 | Mean Difference (IV, Random, 95% CI) | ‐1.60 [‐2.65, ‐0.55] |
| 14 Revised Piper Fatigue Scale cognitive/mood (follow‐up values) | 3 | Mean Difference (IV, Random, 95% CI) | Subtotals only | |
| 14.1 End of intervention | 3 | 121 | Mean Difference (IV, Random, 95% CI) | ‐0.72 [‐2.31, 0.87] |
| 14.2 Follow‐up | 1 | 61 | Mean Difference (IV, Random, 95% CI) | ‐1.40 [‐2.50, ‐0.30] |
| 15 Schwartz Cancer Fatigue Scale (follow‐up values) | 2 | Mean Difference (IV, Random, 95% CI) | Subtotals only | |
| 15.1 End of intervention | 2 | 125 | Mean Difference (IV, Random, 95% CI) | ‐2.01 [‐9.25, 5.23] |
| 15.2 Follow‐up | 0 | 0 | Mean Difference (IV, Random, 95% CI) | 0.0 [0.0, 0.0] |
| 16 POMS fatigue scale (follow‐up values) | 2 | Std. Mean Difference (IV, Fixed, 95% CI) | Subtotals only | |
| 16.1 End of intervention | 2 | 79 | Std. Mean Difference (IV, Fixed, 95% CI) | ‐0.54 [1.00, ‐0.08] |
| 16.2 Follow‐up | 1 | 61 | Std. Mean Difference (IV, Fixed, 95% CI) | ‐0.57 [‐1.08, ‐0.05] |
| 17 Visual analogue scale fatigue (follow‐up and change values) | 4 | Std. Mean Difference (IV, Fixed, 95% CI) | Subtotals only | |
| 17.1 End of intervention | 4 | 148 | Std. Mean Difference (IV, Fixed, 95% CI) | ‐0.51 [‐0.88, ‐0.14] |
| 17.2 Follow‐up | 1 | 22 | Std. Mean Difference (IV, Fixed, 95% CI) | 0.0 [0.0, 0.0] |
| 18 Overall vigour/vitality (follow‐up values) | 10 | Std. Mean Difference (IV, Random, 95% CI) | Subtotals only | |
| 18.1 End of intervention | 10 | 762 | Std. Mean Difference (IV, Random, 95% CI) | 0.36 [0.21, 0.50] |
| 18.2 Follow‐up | 4 | 454 | Std. Mean Difference (IV, Random, 95% CI) | 0.26 [0.04, 0.48] |
| 19 Overall vigour/vitality (change values) | 6 | Std. Mean Difference (IV, Random, 95% CI) | Subtotals only | |
| 19.1 End of intervention | 6 | 359 | Std. Mean Difference (IV, Random, 95% CI) | 0.23 [0.00, 0.45] |
| 19.2 Follow‐up | 2 | 233 | Std. Mean Difference (IV, Random, 95% CI) | 0.20 [‐0.06, 0.46] |
| 20 MOS SF vitality (follow‐up values) | 6 | Mean Difference (IV, Fixed, 95% CI) | Subtotals only | |
| 20.1 End of intervention | 6 | 514 | Mean Difference (IV, Fixed, 95% CI) | 3.08 [0.84, 5.31] |
| 20.2 Follow‐up | 2 | 306 | Mean Difference (IV, Fixed, 95% CI) | 5.09 [0.99, 9.19] |
| 21 MOS SF vitality (change values) | 4 | Mean Difference (IV, Fixed, 95% CI) | Subtotals only | |
| 21.1 End of intervention | 4 | 212 | Mean Difference (IV, Fixed, 95% CI) | 1.36 [‐0.52, 3.25] |
| 21.2 Follow‐up | 0 | 0 | Mean Difference (IV, Fixed, 95% CI) | 0.0 [0.0, 0.0] |
| 22 POMS vigour scale (follow‐up values) | 4 | Std. Mean Difference (IV, Random, 95% CI) | Subtotals only | |
| 22.1 End of intervention | 4 | 248 | Std. Mean Difference (IV, Random, 95% CI) | 0.46 [0.13, 0.79] |
| 22.2 Follow‐up | 2 | 148 | Std. Mean Difference (IV, Random, 95% CI) | 0.21 [‐0.34, 0.77] |
| 23 POMS vigour scale (change values) | 2 | Std. Mean Difference (IV, Random, 95% CI) | Subtotals only | |
| 23.1 End of intervention | 2 | 147 | Std. Mean Difference (IV, Random, 95% CI) | 0.25 [‐0.45, 0.95] |
| 23.2 Follow‐up | 2 | 233 | Std. Mean Difference (IV, Random, 95% CI) | 0.20 [‐0.06, 0.46] |
4.3. Analysis.
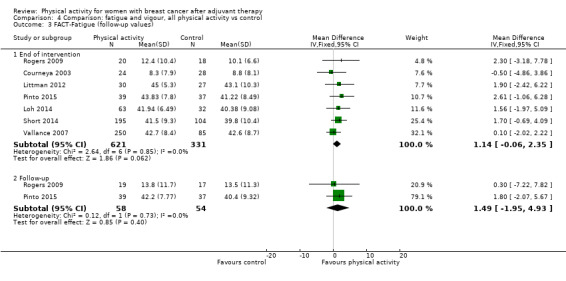
Comparison 4 Comparison: fatigue and vigour, all physical activity vs control, Outcome 3 FACT‐Fatigue (follow‐up values).
4.4. Analysis.

Comparison 4 Comparison: fatigue and vigour, all physical activity vs control, Outcome 4 FACT‐Fatigue (change values).
4.6. Analysis.

Comparison 4 Comparison: fatigue and vigour, all physical activity vs control, Outcome 6 EORTC QLQ‐C30 Fatigue scale (change values).
4.7. Analysis.
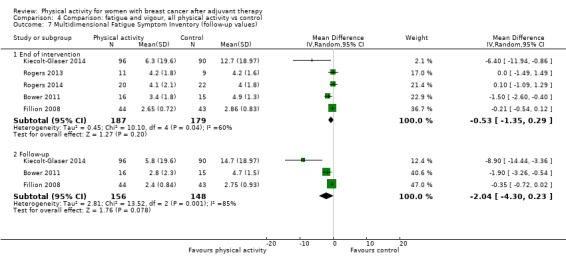
Comparison 4 Comparison: fatigue and vigour, all physical activity vs control, Outcome 7 Multidimensional Fatigue Symptom Inventory (follow‐up values).
4.8. Analysis.

Comparison 4 Comparison: fatigue and vigour, all physical activity vs control, Outcome 8 Multidimensional Fatigue Symptom Inventory ‐ interference (follow‐up values).
4.11. Analysis.
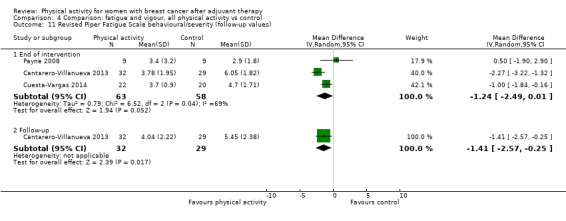
Comparison 4 Comparison: fatigue and vigour, all physical activity vs control, Outcome 11 Revised Piper Fatigue Scale behavioural/severity (follow‐up values).
4.13. Analysis.
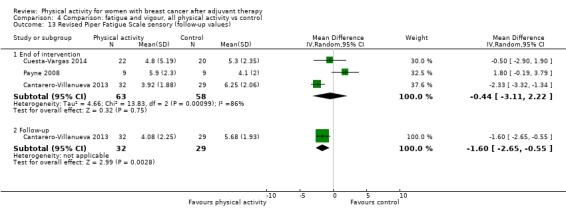
Comparison 4 Comparison: fatigue and vigour, all physical activity vs control, Outcome 13 Revised Piper Fatigue Scale sensory (follow‐up values).
4.14. Analysis.

Comparison 4 Comparison: fatigue and vigour, all physical activity vs control, Outcome 14 Revised Piper Fatigue Scale cognitive/mood (follow‐up values).
4.15. Analysis.

Comparison 4 Comparison: fatigue and vigour, all physical activity vs control, Outcome 15 Schwartz Cancer Fatigue Scale (follow‐up values).
4.17. Analysis.
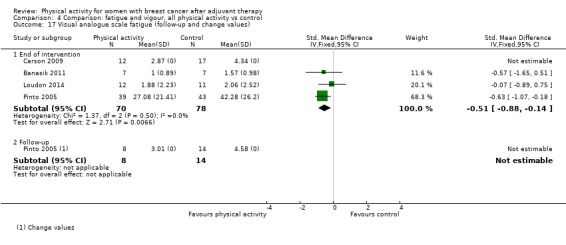
Comparison 4 Comparison: fatigue and vigour, all physical activity vs control, Outcome 17 Visual analogue scale fatigue (follow‐up and change values).
4.21. Analysis.
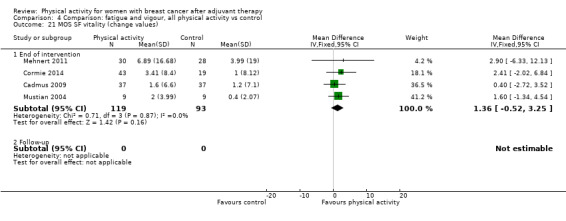
Comparison 4 Comparison: fatigue and vigour, all physical activity vs control, Outcome 21 MOS SF vitality (change values).
4.23. Analysis.

Comparison 4 Comparison: fatigue and vigour, all physical activity vs control, Outcome 23 POMS vigour scale (change values).
Comparison 5. Comparison: pain/disability, all physical activity vs control.
| Outcome or subgroup title | No. of studies | No. of participants | Statistical method | Effect size |
|---|---|---|---|---|
| 1 Overall pain/disability (follow‐up values) | 9 | Std. Mean Difference (IV, Random, 95% CI) | Subtotals only | |
| 1.1 End of intervention | 9 | 535 | Std. Mean Difference (IV, Random, 95% CI) | 0.08 [‐0.09, 0.25] |
| 1.2 Follow‐up | 1 | 162 | Std. Mean Difference (IV, Random, 95% CI) | 0.19 [‐0.12, 0.50] |
| 2 Overall pain/disability (change values) | 6 | Std. Mean Difference (IV, Random, 95% CI) | Subtotals only | |
| 2.1 End of intervention | 5 | 296 | Std. Mean Difference (IV, Random, 95% CI) | ‐0.08 [‐0.33, 0.16] |
| 2.2 Follow‐up | 1 | 36 | Std. Mean Difference (IV, Random, 95% CI) | 0.22 [‐0.43, 0.88] |
| 3 Brief Pain Inventory severity score (change values) | 2 | Mean Difference (IV, Random, 95% CI) | Subtotals only | |
| 3.1 End of intervention | 2 | 145 | Mean Difference (IV, Random, 95% CI) | ‐0.84 [‐1.92, 0.23] |
| 3.2 Follow‐up | 0 | 0 | Mean Difference (IV, Random, 95% CI) | 0.0 [0.0, 0.0] |
| 4 Brief Pain Inventory interference score (change values) | 2 | Mean Difference (IV, Random, 95% CI) | Subtotals only | |
| 4.1 End of intervention | 2 | 145 | Mean Difference (IV, Random, 95% CI) | ‐1.08 [‐1.91, ‐0.24] |
| 4.2 Follow‐up | 0 | 0 | Mean Difference (IV, Random, 95% CI) | 0.0 [0.0, 0.0] |
| 5 DASH (follow‐up and change values) | 3 | Mean Difference (IV, Fixed, 95% CI) | Subtotals only | |
| 5.1 End of intervention | 3 | 179 | Mean Difference (IV, Fixed, 95% CI) | ‐4.00 [‐9.08, ‐2.91] |
| 5.2 Follow‐up | 0 | 0 | Mean Difference (IV, Fixed, 95% CI) | 0.0 [0.0, 0.0] |
| 6 EORTC QLQ‐C30 Pain scale (follow‐up and change values) | 2 | Mean Difference (IV, Fixed, 95% CI) | Subtotals only | |
| 6.1 End of intervention | 2 | 119 | Mean Difference (IV, Fixed, 95% CI) | ‐1.04 [‐9.83, 7.75] |
| 6.2 Follow‐up | 0 | 0 | Mean Difference (IV, Fixed, 95% CI) | 0.0 [0.0, 0.0] |
| 7 MOS SF Pain (follow‐up values) | 5 | Mean Difference (IV, Random, 95% CI) | Subtotals only | |
| 7.1 End of intervention | 5 | 378 | Mean Difference (IV, Random, 95% CI) | 1.25 [‐1.40, 3.90] |
| 7.2 Follow‐up | 1 | 162 | Mean Difference (IV, Random, 95% CI) | 4.45 [‐2.80, 11.70] |
| 8 MOS SF Pain (change values) | 4 | Mean Difference (IV, Fixed, 95% CI) | Subtotals only | |
| 8.1 End of intervention | 4 | 213 | Mean Difference (IV, Fixed, 95% CI) | 0.07 [‐1.04, 1.17] |
| 8.2 Follow‐up | 0 | 0 | Mean Difference (IV, Fixed, 95% CI) | 0.0 [0.0, 0.0] |
| 9 WOMAC joint pain (follow‐up and change values) | 2 | Mean Difference (IV, Random, 95% CI) | Subtotals only | |
| 9.1 End of intervention | 2 | 121 | Mean Difference (IV, Random, 95% CI) | ‐2.36 [‐7.55, 2.82] |
| 9.2 Follow‐up | 0 | 0 | Mean Difference (IV, Random, 95% CI) | 0.0 [0.0, 0.0] |
| 10 WOMAC physical dysfunction (follow‐up and change values) | 2 | Mean Difference (IV, Random, 95% CI) | Subtotals only | |
| 10.1 End of intervention | 2 | 121 | Mean Difference (IV, Random, 95% CI) | ‐6.15 [‐16.21, 3.92] |
| 10.2 Follow‐up | 0 | 0 | Mean Difference (IV, Random, 95% CI) | 0.0 [0.0, 0.0] |
| 11 WOMAC total score (follow‐up and change values) | 2 | Mean Difference (IV, Random, 95% CI) | Subtotals only | |
| 11.1 End of intervention | 2 | 121 | Mean Difference (IV, Random, 95% CI) | ‐6.49 [‐13.57, 0.58] |
| 11.2 Follow‐up | 0 | 0 | Mean Difference (IV, Random, 95% CI) | 0.0 [0.0, 0.0] |
5.3. Analysis.
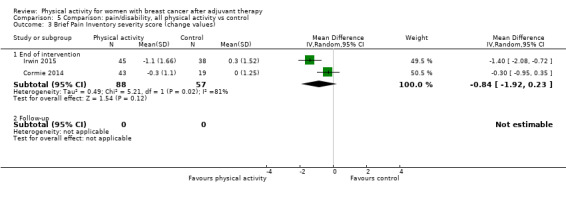
Comparison 5 Comparison: pain/disability, all physical activity vs control, Outcome 3 Brief Pain Inventory severity score (change values).
5.4. Analysis.
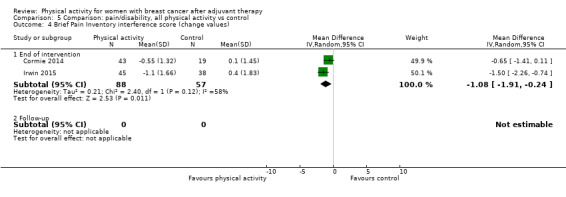
Comparison 5 Comparison: pain/disability, all physical activity vs control, Outcome 4 Brief Pain Inventory interference score (change values).
5.5. Analysis.
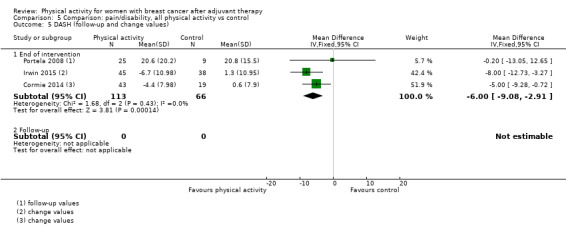
Comparison 5 Comparison: pain/disability, all physical activity vs control, Outcome 5 DASH (follow‐up and change values).
5.6. Analysis.
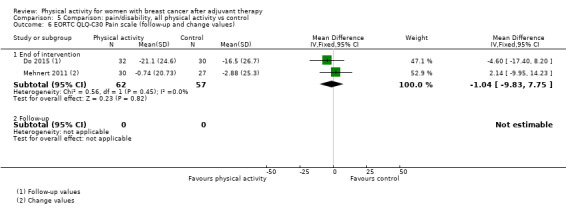
Comparison 5 Comparison: pain/disability, all physical activity vs control, Outcome 6 EORTC QLQ‐C30 Pain scale (follow‐up and change values).
5.7. Analysis.
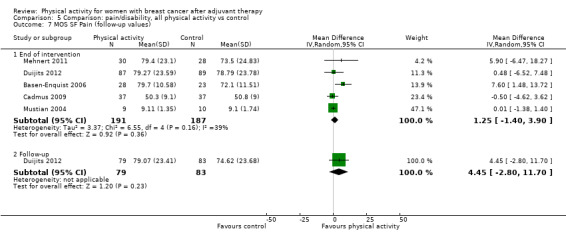
Comparison 5 Comparison: pain/disability, all physical activity vs control, Outcome 7 MOS SF Pain (follow‐up values).
5.8. Analysis.
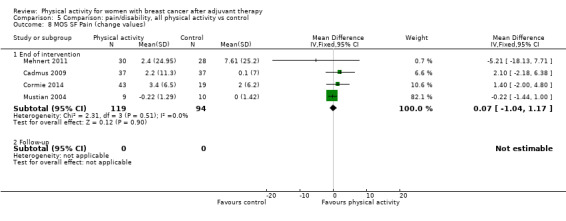
Comparison 5 Comparison: pain/disability, all physical activity vs control, Outcome 8 MOS SF Pain (change values).
5.9. Analysis.

Comparison 5 Comparison: pain/disability, all physical activity vs control, Outcome 9 WOMAC joint pain (follow‐up and change values).
5.10. Analysis.

Comparison 5 Comparison: pain/disability, all physical activity vs control, Outcome 10 WOMAC physical dysfunction (follow‐up and change values).
5.11. Analysis.
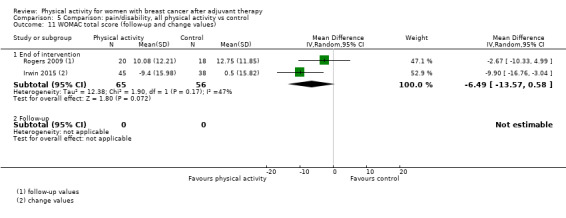
Comparison 5 Comparison: pain/disability, all physical activity vs control, Outcome 11 WOMAC total score (follow‐up and change values).
Comparison 6. Comparison: self‐esteem, all physical activity vs control.
| Outcome or subgroup title | No. of studies | No. of participants | Statistical method | Effect size |
|---|---|---|---|---|
| 1 Overall self‐esteem/body image (follow‐up values) | 12 | Std. Mean Difference (IV, Random, 95% CI) | Subtotals only | |
| 1.1 End of intervention | 12 | 667 | Std. Mean Difference (IV, Random, 95% CI) | 0.27 [0.05, 0.48] |
| 1.2 Follow‐up | 1 | 61 | Std. Mean Difference (IV, Random, 95% CI) | 0.57 [0.05, 1.08] |
| 2 Overall self‐esteem/body image (change values) | 9 | Std. Mean Difference (IV, Random, 95% CI) | Subtotals only | |
| 2.1 End of intervention | 9 | 992 | Std. Mean Difference (IV, Random, 95% CI) | 0.23 [‐0.11, 0.58] |
| 2.2 Follow‐up | 1 | 62 | Std. Mean Difference (IV, Random, 95% CI) | 0.46 [‐0.05, 0.96] |
| 3 Body Esteem Scale ‐ weight concern (follow‐up values) | 2 | Mean Difference (IV, Random, 95% CI) | Subtotals only | |
| 3.1 End of intervention | 2 | 100 | Mean Difference (IV, Random, 95% CI) | 4.22 [‐1.01, 9.45] |
| 3.2 Follow‐up | 0 | 0 | Mean Difference (IV, Random, 95% CI) | 0.0 [0.0, 0.0] |
| 4 Physical self‐perception profile ‐ attractiveness of body (follow‐up values) | 2 | Mean Difference (IV, Fixed, 95% CI) | Subtotals only | |
| 4.1 End of intervention | 2 | 107 | Mean Difference (IV, Fixed, 95% CI) | 0.46 [0.13, 0.79] |
| 4.2 Follow‐up | 1 | 61 | Mean Difference (IV, Fixed, 95% CI) | 0.29 [0.04, 0.54] |
| 5 Physical self‐perception profile ‐ attractiveness of body (change values) | 2 | Mean Difference (IV, Fixed, 95% CI) | Subtotals only | |
| 5.1 End of intervention | 2 | 108 | Mean Difference (IV, Fixed, 95% CI) | 0.26 [‐0.07, 0.59] |
| 5.2 Follow‐up | 1 | 62 | Mean Difference (IV, Fixed, 95% CI) | 0.26 [‐0.02, 0.54] |
| 6 Rosenberg Self‐Esteem Scale (follow‐up values) | 4 | Mean Difference (IV, Random, 95% CI) | Subtotals only | |
| 6.1 End of intervention | 4 | 183 | Mean Difference (IV, Random, 95% CI) | 0.24 [‐1.79, 2.26] |
| 6.2 Follow‐up | 0 | 0 | Mean Difference (IV, Random, 95% CI) | 0.0 [0.0, 0.0] |
| 7 Rosenberg Self‐Esteem Scale (change values) | 4 | Mean Difference (IV, Fixed, 95% CI) | Subtotals only | |
| 7.1 End of intervention | 4 | 189 | Mean Difference (IV, Fixed, 95% CI) | 2.78 [1.98, 3.58] |
| 7.2 Follow‐up | 0 | 0 | Mean Difference (IV, Fixed, 95% CI) | 0.0 [0.0, 0.0] |
| 8 EORTC QLQ‐C30 Body image (follow‐up and change values) | 2 | Mean Difference (IV, Fixed, 95% CI) | Subtotals only | |
| 8.1 End of intervention | 2 | 562 | Mean Difference (IV, Fixed, 95% CI) | ‐0.85 [‐4.38, 2.68] |
| 8.2 Follow‐up | 0 | 0 | Mean Difference (IV, Fixed, 95% CI) | 0.0 [0.0, 0.0] |
6.3. Analysis.
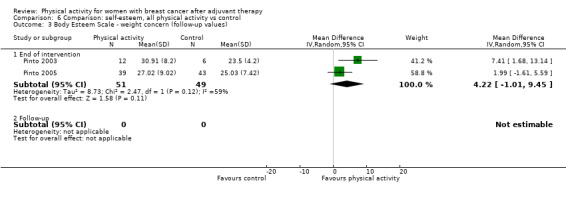
Comparison 6 Comparison: self‐esteem, all physical activity vs control, Outcome 3 Body Esteem Scale ‐ weight concern (follow‐up values).
6.5. Analysis.
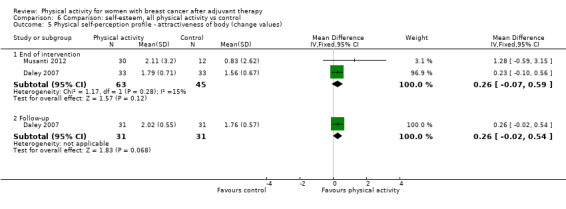
Comparison 6 Comparison: self‐esteem, all physical activity vs control, Outcome 5 Physical self‐perception profile ‐ attractiveness of body (change values).
6.6. Analysis.
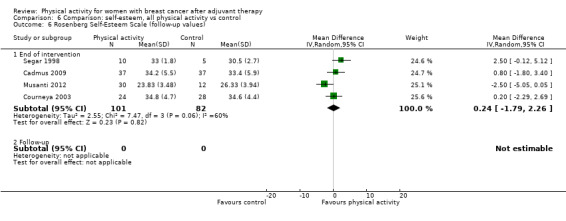
Comparison 6 Comparison: self‐esteem, all physical activity vs control, Outcome 6 Rosenberg Self‐Esteem Scale (follow‐up values).
6.8. Analysis.

Comparison 6 Comparison: self‐esteem, all physical activity vs control, Outcome 8 EORTC QLQ‐C30 Body image (follow‐up and change values).
Comparison 7. Comparison: cardiorespiratory fitness, all physical activity vs control.
| Outcome or subgroup title | No. of studies | No. of participants | Statistical method | Effect size |
|---|---|---|---|---|
| 1 Overall cardiorespiratory fitness (follow‐up values) | 23 | Std. Mean Difference (IV, Random, 95% CI) | Subtotals only | |
| 1.1 End of intervention | 23 | 1265 | Std. Mean Difference (IV, Random, 95% CI) | 0.44 [0.30, 0.58] |
| 1.2 Follow‐up | 3 | 362 | Std. Mean Difference (IV, Random, 95% CI) | 0.36 [0.03, 0.69] |
| 2 Overall cardiorespiratory fitness (change values) | 10 | Std. Mean Difference (IV, Random, 95% CI) | Subtotals only | |
| 2.1 End of intervention | 9 | 863 | Std. Mean Difference (IV, Random, 95% CI) | 0.83 [0.40, 1.27] |
| 2.2 Follow‐up | 2 | 115 | Std. Mean Difference (IV, Random, 95% CI) | 0.42 [0.05, 0.79] |
| 3 Directly assessed VO₂max/peak (follow‐up values) | 4 | Mean Difference (IV, Fixed, 95% CI) | Subtotals only | |
| 3.1 End of intervention | 4 | 199 | Mean Difference (IV, Fixed, 95% CI) | 1.89 [0.65, 3.13] |
| 3.2 Follow‐up | 0 | 0 | Mean Difference (IV, Fixed, 95% CI) | 0.0 [0.0, 0.0] |
| 4 Directly assessed VO₂max/peak (change values) | 3 | Std. Mean Difference (IV, Random, 95% CI) | Subtotals only | |
| 4.1 End of intervention | 3 | 166 | Std. Mean Difference (IV, Random, 95% CI) | 1.31 [0.66, 1.96] |
| 4.2 Follow‐up | 0 | 0 | Std. Mean Difference (IV, Random, 95% CI) | 0.0 [0.0, 0.0] |
| 5 Directly assessed VO₂max/peak ‐ treadmill (follow‐up and change values) | 2 | Std. Mean Difference (IV, Random, 95% CI) | Subtotals only | |
| 5.1 End of intervention | 2 | 116 | Std. Mean Difference (IV, Random, 95% CI) | 1.04 [‐0.49, 2.58] |
| 5.2 Follow‐up | 0 | 0 | Std. Mean Difference (IV, Random, 95% CI) | 0.0 [0.0, 0.0] |
| 6 Directly assessed VO₂max/peak ‐ cycle ergometer (follow‐up values) | 3 | Mean Difference (IV, Random, 95% CI) | Subtotals only | |
| 6.1 End of intervention | 3 | 116 | Mean Difference (IV, Random, 95% CI) | 1.99 [0.39, 3.59] |
| 6.2 Follow‐up | 0 | 0 | Mean Difference (IV, Random, 95% CI) | 0.0 [0.0, 0.0] |
| 7 Peak Power Output ‐ cycle ergometer test (follow‐up values) | 2 | Mean Difference (IV, Fixed, 95% CI) | Subtotals only | |
| 7.1 End of intervention | 2 | 66 | Mean Difference (IV, Fixed, 95% CI) | 18.92 [9.64, 28.20] |
| 7.2 Follow‐up | 0 | 0 | Mean Difference (IV, Fixed, 95% CI) | 0.0 [0.0, 0.0] |
| 8 Peak Respiratory Exchange Ratio ‐ cycle ergometer test (follow‐up values) | 2 | Mean Difference (IV, Fixed, 95% CI) | Subtotals only | |
| 8.1 End of intervention | 2 | 66 | Mean Difference (IV, Fixed, 95% CI) | ‐0.01 [‐0.04, 0.03] |
| 8.2 Follow‐up | 0 | 0 | Mean Difference (IV, Fixed, 95% CI) | 0.0 [0.0, 0.0] |
| 9 Peak Heart Rate ‐ cycle ergometer test (follow‐up values) | 2 | Mean Difference (IV, Fixed, 95% CI) | Subtotals only | |
| 9.1 End of intervention | 2 | 66 | Mean Difference (IV, Fixed, 95% CI) | 2.02 [‐5.65, 9.68] |
| 9.2 Follow‐up | 0 | 0 | Mean Difference (IV, Fixed, 95% CI) | 0.0 [0.0, 0.0] |
| 10 Ebbeling single‐stage treadmill test (follow‐up and change values) | 2 | Mean Difference (IV, Random, 95% CI) | Subtotals only | |
| 10.1 End of intervention | 2 | 189 | Mean Difference (IV, Random, 95% CI) | 1.30 [‐0.16, 2.75] |
| 10.2 Follow‐up | 2 | 149 | Mean Difference (IV, Random, 95% CI) | 1.77 [‐1.23, 4.77] |
| 11 Modified Bruce treadmill test (follow‐up and change values) | 3 | Mean Difference (IV, Random, 95% CI) | Subtotals only | |
| 11.1 End of intervention | 3 | 92 | Mean Difference (IV, Random, 95% CI) | 3.57 [0.95, 6.19] |
| 11.2 Follow‐up | 0 | 0 | Mean Difference (IV, Random, 95% CI) | 0.0 [0.0, 0.0] |
| 12 Naughton submaximal treadmill test (follow‐up and change values) | 4 | Mean Difference (IV, Random, 95% CI) | Subtotals only | |
| 12.1 End of intervention | 4 | 315 | Mean Difference (IV, Random, 95% CI) | 2.02 [‐0.33, 4.37] |
| 12.2 Follow‐up | 2 | 249 | Mean Difference (IV, Random, 95% CI) | 1.91 [0.57, 3.26] |
| 13 Cardiorespiratory fitness walk tests (follow‐up values) | 7 | Std. Mean Difference (IV, Random, 95% CI) | Subtotals only | |
| 13.1 End of intervention | 7 | 314 | Std. Mean Difference (IV, Random, 95% CI) | 0.62 [0.33, 0.91] |
| 13.2 Follow‐up | 0 | 0 | Std. Mean Difference (IV, Random, 95% CI) | 0.0 [0.0, 0.0] |
| 14 Cardiorespiratory fitness walk tests (change values) | 3 | Std. Mean Difference (IV, Random, 95% CI) | Subtotals only | |
| 14.1 End of intervention | 3 | 592 | Std. Mean Difference (IV, Random, 95% CI) | 0.72 [‐0.05, 1.49] |
| 14.2 Follow‐up | 1 | 79 | Std. Mean Difference (IV, Random, 95% CI) | 0.54 [0.09, 0.99] |
| 15 6‐Minute walk test (follow‐up and change values) | 5 | Mean Difference (IV, Random, 95% CI) | Subtotals only | |
| 15.1 End of intervention | 5 | 159 | Mean Difference (IV, Random, 95% CI) | 54.74 [33.25, 76.22] |
| 15.2 Follow‐up | 0 | 0 | Mean Difference (IV, Random, 95% CI) | 0.0 [0.0, 0.0] |
| 16 12‐Minute walk test (follow‐up values) | 2 | Mean Difference (IV, Random, 95% CI) | Subtotals only | |
| 16.1 End of intervention | 2 | 96 | Mean Difference (IV, Random, 95% CI) | 94.56 [‐24.25, 213.37] |
| 16.2 Follow‐up | 0 | 0 | Mean Difference (IV, Random, 95% CI) | 0.0 [0.0, 0.0] |
| 17 2‐Kilometer walk test (follow‐up and change values) | 2 | Mean Difference (IV, Random, 95% CI) | Subtotals only | |
| 17.1 End of intervention | 2 | 526 | Mean Difference (IV, Random, 95% CI) | ‐0.11 [‐0.46, 0.25] |
| 17.2 Follow‐up | 0 | 0 | Mean Difference (IV, Random, 95% CI) | 0.0 [0.0, 0.0] |
| 18 Resting Heart Rate (follow‐up values) | 2 | Mean Difference (IV, Fixed, 95% CI) | Subtotals only | |
| 18.1 End of intervention | 2 | 82 | Mean Difference (IV, Fixed, 95% CI) | ‐4.47 [‐7.94, ‐1.00] |
| 18.2 Follow‐up | 0 | 0 | Mean Difference (IV, Fixed, 95% CI) | 0.0 [0.0, 0.0] |
| 19 Resting Heart Rate (change values) | 2 | Std. Mean Difference (IV, Random, 95% CI) | Subtotals only | |
| 19.1 End of intervention | 2 | 86 | Std. Mean Difference (IV, Random, 95% CI) | ‐1.05 [‐2.22, 0.11] |
| 19.2 Follow‐up | 0 | 0 | Std. Mean Difference (IV, Random, 95% CI) | 0.0 [0.0, 0.0] |
| 20 Resting Systolic Blood Pressure (follow‐up values) | 4 | Mean Difference (IV, Random, 95% CI) | Subtotals only | |
| 20.1 End of intervention | 4 | 134 | Mean Difference (IV, Random, 95% CI) | ‐0.83 [‐3.72, 2.05] |
| 20.2 Follow‐up | 1 | 26 | Mean Difference (IV, Random, 95% CI) | 5.20 [‐5.35, 15.75] |
| 21 Resting Systolic Blood Pressure (change values) | 3 | Mean Difference (IV, Random, 95% CI) | Subtotals only | |
| 21.1 End of intervention | 3 | 143 | Mean Difference (IV, Random, 95% CI) | ‐1.12 [‐7.74, 5.50] |
| 21.2 Follow‐up | 1 | 26 | Mean Difference (IV, Random, 95% CI) | ‐2.70 [‐5.94, 0.54] |
| 22 Resting Diastolic Blood Pressure (follow‐up values) | 3 | Mean Difference (IV, Random, 95% CI) | Subtotals only | |
| 22.1 End of intervention | 3 | 106 | Mean Difference (IV, Random, 95% CI) | 0.66 [‐2.89, 4.21] |
| 22.2 Follow‐up | 1 | 26 | Mean Difference (IV, Random, 95% CI) | 2.10 [‐3.78, 7.98] |
| 23 Resting Diastolic Blood Pressure (change values) | 3 | 170 | Mean Difference (IV, Random, 95% CI) | ‐0.04 [‐1.82, 1.73] |
| 23.1 End of intervention | 3 | 144 | Mean Difference (IV, Random, 95% CI) | 0.53 [‐1.61, 2.68] |
| 23.2 Follow‐up | 1 | 26 | Mean Difference (IV, Random, 95% CI) | ‐1.30 [‐3.85, 1.25] |
7.3. Analysis.

Comparison 7 Comparison: cardiorespiratory fitness, all physical activity vs control, Outcome 3 Directly assessed VO₂max/peak (follow‐up values).
7.4. Analysis.

Comparison 7 Comparison: cardiorespiratory fitness, all physical activity vs control, Outcome 4 Directly assessed VO₂max/peak (change values).
7.5. Analysis.

Comparison 7 Comparison: cardiorespiratory fitness, all physical activity vs control, Outcome 5 Directly assessed VO₂max/peak ‐ treadmill (follow‐up and change values).
7.6. Analysis.
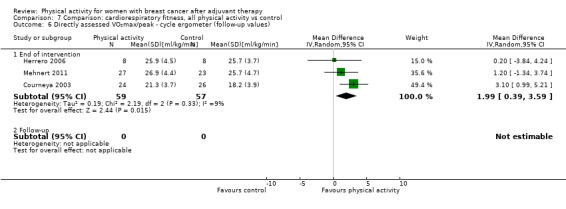
Comparison 7 Comparison: cardiorespiratory fitness, all physical activity vs control, Outcome 6 Directly assessed VO₂max/peak ‐ cycle ergometer (follow‐up values).
7.10. Analysis.

Comparison 7 Comparison: cardiorespiratory fitness, all physical activity vs control, Outcome 10 Ebbeling single‐stage treadmill test (follow‐up and change values).
7.11. Analysis.
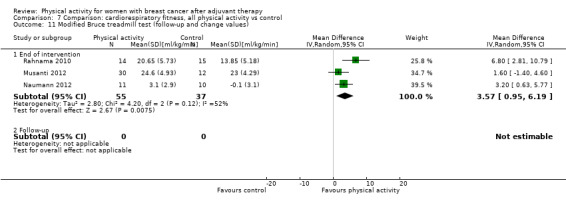
Comparison 7 Comparison: cardiorespiratory fitness, all physical activity vs control, Outcome 11 Modified Bruce treadmill test (follow‐up and change values).
7.12. Analysis.
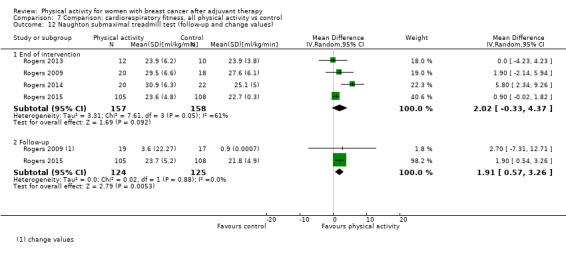
Comparison 7 Comparison: cardiorespiratory fitness, all physical activity vs control, Outcome 12 Naughton submaximal treadmill test (follow‐up and change values).
7.13. Analysis.

Comparison 7 Comparison: cardiorespiratory fitness, all physical activity vs control, Outcome 13 Cardiorespiratory fitness walk tests (follow‐up values).
7.14. Analysis.

Comparison 7 Comparison: cardiorespiratory fitness, all physical activity vs control, Outcome 14 Cardiorespiratory fitness walk tests (change values).
7.15. Analysis.

Comparison 7 Comparison: cardiorespiratory fitness, all physical activity vs control, Outcome 15 6‐Minute walk test (follow‐up and change values).
7.16. Analysis.
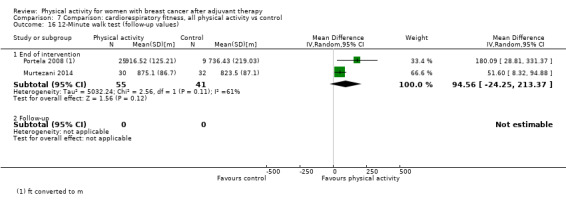
Comparison 7 Comparison: cardiorespiratory fitness, all physical activity vs control, Outcome 16 12‐Minute walk test (follow‐up values).
7.17. Analysis.

Comparison 7 Comparison: cardiorespiratory fitness, all physical activity vs control, Outcome 17 2‐Kilometer walk test (follow‐up and change values).
Comparison 8. Comparison: physical activity, all physical activity vs control.
| Outcome or subgroup title | No. of studies | No. of participants | Statistical method | Effect size |
|---|---|---|---|---|
| 1 Overall self‐reported physical activity (follow‐up values) | 17 | Std. Mean Difference (IV, Random, 95% CI) | Subtotals only | |
| 1.1 End of intervention | 17 | 2012 | Std. Mean Difference (IV, Random, 95% CI) | 0.52 [0.33, 0.71] |
| 1.2 Follow‐up | 4 | 683 | Std. Mean Difference (IV, Random, 95% CI) | 0.44 [0.17, 0.72] |
| 2 Overall self‐reported physical activity (change values) | 9 | Std. Mean Difference (IV, Random, 95% CI) | Subtotals only | |
| 2.1 End of intervention | 8 | 1274 | Std. Mean Difference (IV, Random, 95% CI) | 0.57 [0.25, 0.90] |
| 2.2 Follow‐up | 4 | 521 | Std. Mean Difference (IV, Random, 95% CI) | 0.51 [0.08, 0.93] |
| 3 Self‐reported total physical activity (follow‐up values) | 9 | Std. Mean Difference (IV, Random, 95% CI) | Subtotals only | |
| 3.1 End of intervention | 9 | 881 | Std. Mean Difference (IV, Random, 95% CI) | 0.57 [0.28, 0.86] |
| 3.2 Follow‐up | 1 | 26 | Std. Mean Difference (IV, Random, 95% CI) | 0.37 [‐0.43, 1.16] |
| 4 Self‐reported total physical activity (change values) | 5 | Std. Mean Difference (IV, Random, 95% CI) | Subtotals only | |
| 4.1 End of intervention | 5 | 332 | Std. Mean Difference (IV, Random, 95% CI) | 0.80 [0.30, 1.31] |
| 4.2 Follow‐up | 2 | 108 | Std. Mean Difference (IV, Random, 95% CI) | 0.73 [‐0.36, 1.83] |
| 5 Self‐reported moderate physical activity (follow‐up values) | 4 | Std. Mean Difference (IV, Random, 95% CI) | Subtotals only | |
| 5.1 End of intervention | 4 | 249 | Std. Mean Difference (IV, Random, 95% CI) | 0.77 [0.47, 1.07] |
| 5.2 Follow‐up | 1 | 26 | Std. Mean Difference (IV, Random, 95% CI) | 0.10 [‐0.69, 0.89] |
| 6 Self‐reported moderate physical activity (change values) | 2 | Std. Mean Difference (IV, Random, 95% CI) | Subtotals only | |
| 6.1 End of intervention | 2 | 93 | Std. Mean Difference (IV, Random, 95% CI) | 1.19 [0.27, 2.11] |
| 6.2 Follow‐up | 1 | 26 | Std. Mean Difference (IV, Random, 95% CI) | 1.20 [0.33, 2.06] |
| 7 Self‐reported moderate‐vigorous physical activity (follow‐up values) | 6 | Std. Mean Difference (IV, Random, 95% CI) | Subtotals only | |
| 7.1 End of intervention | 6 | 1025 | Std. Mean Difference (IV, Random, 95% CI) | 0.42 [0.12, 0.72] |
| 7.2 Follow‐up | 3 | 657 | Std. Mean Difference (IV, Random, 95% CI) | 0.46 [0.13, 0.78] |
| 8 Self‐reported moderate‐vigorous physical activity (change values) | 4 | Std. Mean Difference (IV, Random, 95% CI) | Subtotals only | |
| 8.1 End of intervention | 2 | 875 | Std. Mean Difference (IV, Random, 95% CI) | 0.15 [‐0.14, 0.44] |
| 8.2 Follow‐up | 3 | 495 | Std. Mean Difference (IV, Random, 95% CI) | 0.30 [0.00, 0.59] |
| 9 Self‐reported vigorous physical activity (follow‐up values) | 3 | Std. Mean Difference (IV, Random, 95% CI) | Subtotals only | |
| 9.1 End of intervention | 3 | 182 | Std. Mean Difference (IV, Random, 95% CI) | 0.74 [0.43, 1.04] |
| 9.2 Follow‐up | 1 | 26 | Std. Mean Difference (IV, Random, 95% CI) | 0.19 [‐0.61, 0.98] |
| 10 Self‐reported vigorous physical activity (change values) | 2 | Std. Mean Difference (IV, Random, 95% CI) | Subtotals only | |
| 10.1 End of intervention | 2 | 108 | Std. Mean Difference (IV, Random, 95% CI) | 1.72 [0.78, 2.66] |
| 10.2 Follow‐up | 2 | 108 | Std. Mean Difference (IV, Random, 95% CI) | ‐0.13 [‐0.92, 0.66] |
| 11 Self‐reported walking (follow‐up values) | 2 | Std. Mean Difference (IV, Random, 95% CI) | Subtotals only | |
| 11.1 End of intervention | 2 | 374 | Std. Mean Difference (IV, Random, 95% CI) | 0.40 [‐0.06, 0.86] |
| 11.2 Follow‐up | 1 | 338 | Std. Mean Difference (IV, Random, 95% CI) | 0.09 [‐0.15, 0.34] |
| 12 Self‐reported walking (change values) | 2 | Std. Mean Difference (IV, Random, 95% CI) | Subtotals only | |
| 12.1 End of intervention | 2 | 374 | Std. Mean Difference (IV, Random, 95% CI) | 0.50 [0.23, 0.77] |
| 12.2 Follow‐up | 1 | 338 | Std. Mean Difference (IV, Random, 95% CI) | 0.23 [‐0.02, 0.47] |
| 13 7‐Day PAR self‐reported moderate physical activity (follow‐up values) | 2 | Mean Difference (IV, Fixed, 95% CI) | Subtotals only | |
| 13.1 End of intervention | 2 | 149 | Mean Difference (IV, Fixed, 95% CI) | 110.44 [72.50, 148.38] |
| 13.2 Follow‐up | 0 | 0 | Mean Difference (IV, Fixed, 95% CI) | 0.0 [0.0, 0.0] |
| 14 7‐day PAR self‐reported moderate‐vigorous physical activity (follow‐up values) | 2 | Mean Difference (IV, Random, 95% CI) | Subtotals only | |
| 14.1 End of intervention | 2 | 128 | Mean Difference (IV, Random, 95% CI) | 52.86 [29.04, 76.67] |
| 14.2 Follow‐up | 1 | 67 | Mean Difference (IV, Random, 95% CI) | 41.2 [11.81, 70.59] |
| 15 Godin LSI self‐reported moderate‐vigorous physical activity (follow‐up values) | 5 | Mean Difference (IV, Random, 95% CI) | Subtotals only | |
| 15.1 End of intervention | 5 | 936 | Mean Difference (IV, Random, 95% CI) | 39.42 [‐1.51, 80.34] |
| 15.2 Follow‐up | 2 | 590 | Mean Difference (IV, Random, 95% CI) | 55.07 [17.16, 92.99] |
| 16 Meeting recommended physical activity guidelines (follow‐up values) | 6 | Odds Ratio (M‐H, Random, 95% CI) | Subtotals only | |
| 16.1 End of intervention | 6 | 819 | Odds Ratio (M‐H, Random, 95% CI) | 8.44 [2.41, 29.56] |
| 16.2 Follow‐up | 2 | 280 | Odds Ratio (M‐H, Random, 95% CI) | 3.11 [1.50, 6.46] |
| 17 Overall objective physical activity (follow‐up values) | 10 | Std. Mean Difference (IV, Random, 95% CI) | Subtotals only | |
| 17.1 End of intervention | 10 | 1248 | Std. Mean Difference (IV, Random, 95% CI) | 0.43 [0.19, 0.66] |
| 17.2 Follow‐up | 3 | 305 | Std. Mean Difference (IV, Random, 95% CI) | 0.22 [‐0.21, 0.66] |
| 18 Overall objective physical activity (change values) | 6 | Std. Mean Difference (IV, Random, 95% CI) | Subtotals only | |
| 18.1 End of intervention | 5 | 508 | Std. Mean Difference (IV, Random, 95% CI) | 0.71 [0.14, 1.29] |
| 18.2 Follow‐up | 2 | 61 | Std. Mean Difference (IV, Random, 95% CI) | 0.23 [1.00, 1.46] |
| 19 Objective moderate‐vigorous physical activity (follow‐up values) | 5 | Std. Mean Difference (IV, Random, 95% CI) | Subtotals only | |
| 19.1 End of intervention | 5 | 390 | Std. Mean Difference (IV, Random, 95% CI) | 1.49 [0.47, 2.51] |
| 19.2 Follow‐up | 2 | 280 | Std. Mean Difference (IV, Random, 95% CI) | 0.36 [‐0.08, 0.79] |
| 20 Objective moderate‐vigorous physical activity (change values) | 3 | Std. Mean Difference (IV, Random, 95% CI) | Subtotals only | |
| 20.1 End of intervention | 2 | 78 | Std. Mean Difference (IV, Random, 95% CI) | 0.92 [0.45, 1.40] |
| 20.2 Follow‐up | 1 | 36 | Std. Mean Difference (IV, Random, 95% CI) | 0.84 [0.15, 1.52] |
| 21 Objective vigorous physical activity (follow‐up values) | 2 | Std. Mean Difference (IV, Random, 95% CI) | Subtotals only | |
| 21.1 End of intervention | 2 | 63 | Std. Mean Difference (IV, Random, 95% CI) | 0.46 [‐0.05, 0.97] |
| 21.2 Follow‐up | 1 | 25 | Std. Mean Difference (IV, Random, 95% CI) | ‐0.16 [‐0.97, 0.66] |
| 22 Accelerometer counts (follow‐up values) | 2 | Std. Mean Difference (IV, Random, 95% CI) | Subtotals only | |
| 22.1 End of intervention | 2 | 74 | Std. Mean Difference (IV, Random, 95% CI) | 0.90 [0.08, 1.72] |
| 22.2 Follow‐up | 0 | 0 | Std. Mean Difference (IV, Random, 95% CI) | 0.0 [0.0, 0.0] |
| 23 Pedometer/accelerometer steps/d (follow‐up values) | 5 | Std. Mean Difference (IV, Random, 95% CI) | Subtotals only | |
| 23.1 End of intervention | 5 | 809 | Std. Mean Difference (IV, Random, 95% CI) | 0.22 [‐0.08, 0.53] |
| 23.2 Follow‐up | 0 | 0 | Std. Mean Difference (IV, Random, 95% CI) | 0.0 [0.0, 0.0] |
| 24 Pedometer/accelerometer steps/d (change values) | 3 | Std. Mean Difference (IV, Random, 95% CI) | Subtotals only | |
| 24.1 End of intervention | 3 | 441 | Std. Mean Difference (IV, Random, 95% CI) | 0.45 [‐0.18, 1.09] |
| 24.2 Follow‐up | 0 | 0 | Std. Mean Difference (IV, Random, 95% CI) | 0.0 [0.0, 0.0] |
| 25 Overall sedentary behaviour (follow‐up values) | 4 | Std. Mean Difference (IV, Random, 95% CI) | Subtotals only | |
| 25.1 End of intervention | 4 | 402 | Std. Mean Difference (IV, Random, 95% CI) | ‐1.01 [‐2.28, 0.26] |
| 25.2 Follow‐up | 1 | 25 | Std. Mean Difference (IV, Random, 95% CI) | 0.58 [‐0.26, 1.41] |
| 26 Objective sedentary behaviour (follow‐up values) | 3 | Std. Mean Difference (IV, Random, 95% CI) | Subtotals only | |
| 26.1 End of intervention | 3 | 103 | Std. Mean Difference (IV, Random, 95% CI) | ‐1.45 [‐3.68, 0.78] |
| 26.2 Follow‐up | 1 | 25 | Std. Mean Difference (IV, Random, 95% CI) | 0.58 [‐0.26, 1.41] |
| 27 Objective sedentary behaviour (change values) | 3 | Std. Mean Difference (IV, Random, 95% CI) | Subtotals only | |
| 27.1 End of intervention | 3 | 103 | Std. Mean Difference (IV, Random, 95% CI) | ‐0.01 [‐0.63, 0.60] |
| 27.2 Follow‐up | 1 | 25 | Std. Mean Difference (IV, Random, 95% CI) | 0.88 [0.02, 1.74] |
8.3. Analysis.

Comparison 8 Comparison: physical activity, all physical activity vs control, Outcome 3 Self‐reported total physical activity (follow‐up values).
8.4. Analysis.
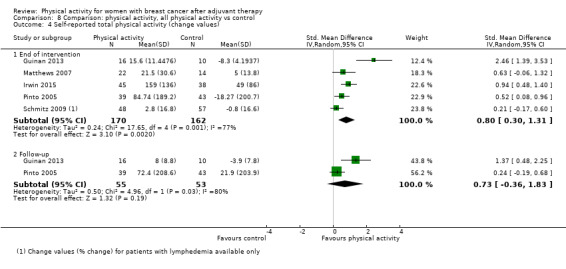
Comparison 8 Comparison: physical activity, all physical activity vs control, Outcome 4 Self‐reported total physical activity (change values).
8.5. Analysis.
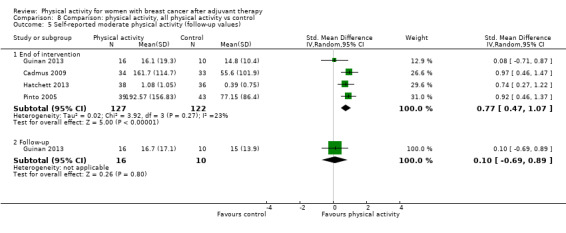
Comparison 8 Comparison: physical activity, all physical activity vs control, Outcome 5 Self‐reported moderate physical activity (follow‐up values).
8.6. Analysis.
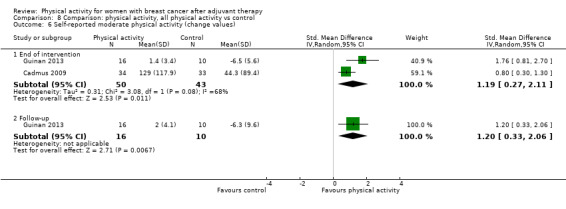
Comparison 8 Comparison: physical activity, all physical activity vs control, Outcome 6 Self‐reported moderate physical activity (change values).
8.7. Analysis.
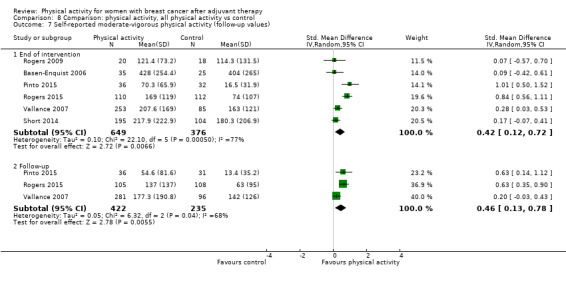
Comparison 8 Comparison: physical activity, all physical activity vs control, Outcome 7 Self‐reported moderate‐vigorous physical activity (follow‐up values).
8.8. Analysis.
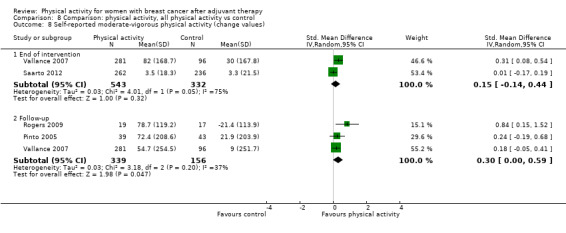
Comparison 8 Comparison: physical activity, all physical activity vs control, Outcome 8 Self‐reported moderate‐vigorous physical activity (change values).
8.9. Analysis.

Comparison 8 Comparison: physical activity, all physical activity vs control, Outcome 9 Self‐reported vigorous physical activity (follow‐up values).
8.10. Analysis.
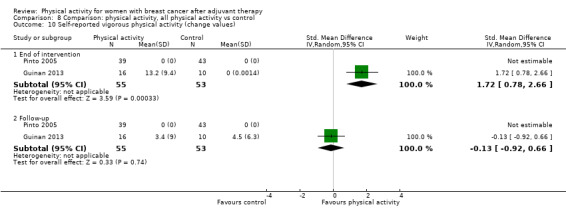
Comparison 8 Comparison: physical activity, all physical activity vs control, Outcome 10 Self‐reported vigorous physical activity (change values).
8.11. Analysis.

Comparison 8 Comparison: physical activity, all physical activity vs control, Outcome 11 Self‐reported walking (follow‐up values).
8.12. Analysis.

Comparison 8 Comparison: physical activity, all physical activity vs control, Outcome 12 Self‐reported walking (change values).
8.13. Analysis.
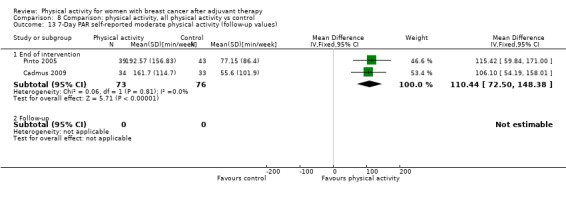
Comparison 8 Comparison: physical activity, all physical activity vs control, Outcome 13 7‐Day PAR self‐reported moderate physical activity (follow‐up values).
8.15. Analysis.

Comparison 8 Comparison: physical activity, all physical activity vs control, Outcome 15 Godin LSI self‐reported moderate‐vigorous physical activity (follow‐up values).
8.16. Analysis.
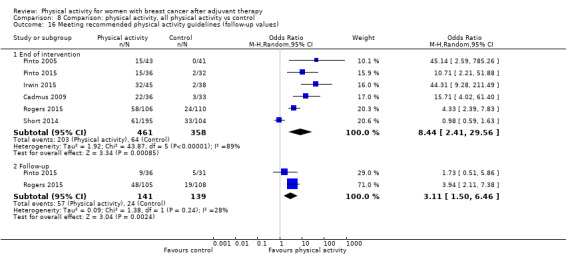
Comparison 8 Comparison: physical activity, all physical activity vs control, Outcome 16 Meeting recommended physical activity guidelines (follow‐up values).
8.19. Analysis.

Comparison 8 Comparison: physical activity, all physical activity vs control, Outcome 19 Objective moderate‐vigorous physical activity (follow‐up values).
8.20. Analysis.
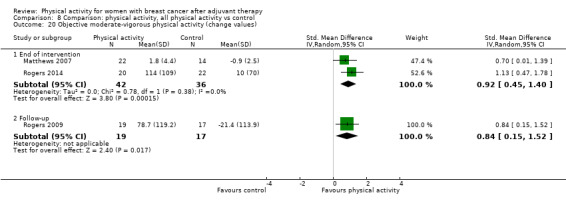
Comparison 8 Comparison: physical activity, all physical activity vs control, Outcome 20 Objective moderate‐vigorous physical activity (change values).
8.21. Analysis.

Comparison 8 Comparison: physical activity, all physical activity vs control, Outcome 21 Objective vigorous physical activity (follow‐up values).
8.23. Analysis.

Comparison 8 Comparison: physical activity, all physical activity vs control, Outcome 23 Pedometer/accelerometer steps/d (follow‐up values).
8.24. Analysis.
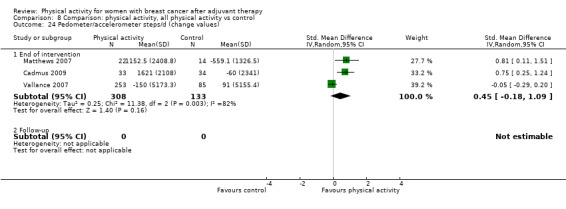
Comparison 8 Comparison: physical activity, all physical activity vs control, Outcome 24 Pedometer/accelerometer steps/d (change values).
Comparison 9. Comparison: anthropometric outcomes, all physical activity vs control.
| Outcome or subgroup title | No. of studies | No. of participants | Statistical method | Effect size |
|---|---|---|---|---|
| 1 Mass (follow‐up values) | 16 | Mean Difference (IV, Fixed, 95% CI) | Subtotals only | |
| 1.1 End of intervention | 16 | 1210 | Mean Difference (IV, Fixed, 95% CI) | 0.00 [‐0.57, 0.58] |
| 1.2 Follow‐up | 1 | 49 | Mean Difference (IV, Fixed, 95% CI) | 5.02 [‐5.17, 15.21] |
| 2 Mass (change values) | 11 | Mean Difference (IV, Random, 95% CI) | Subtotals only | |
| 2.1 End of intervention | 11 | 1047 | Mean Difference (IV, Random, 95% CI) | ‐0.50 [‐0.98, ‐0.01] |
| 2.2 Follow‐up | 0 | 0 | Mean Difference (IV, Random, 95% CI) | 0.0 [0.0, 0.0] |
| 3 BMI (follow‐up values) | 17 | Mean Difference (IV, Fixed, 95% CI) | Subtotals only | |
| 3.1 End of intervention | 17 | 1481 | Mean Difference (IV, Fixed, 95% CI) | 0.01 [‐0.19, 0.22] |
| 3.2 Follow‐up | 0 | 0 | Mean Difference (IV, Fixed, 95% CI) | 0.0 [0.0, 0.0] |
| 4 BMI (change values) | 8 | Mean Difference (IV, Random, 95% CI) | Subtotals only | |
| 4.1 End of intervention | 8 | 485 | Mean Difference (IV, Random, 95% CI) | ‐0.22 [‐0.45, 0.01] |
| 4.2 Follow‐up | 0 | 0 | Mean Difference (IV, Random, 95% CI) | 0.0 [0.0, 0.0] |
| 5 Overall body fat (follow‐up values) | 18 | Std. Mean Difference (IV, Random, 95% CI) | Subtotals only | |
| 5.1 End of intervention | 18 | 1162 | Std. Mean Difference (IV, Random, 95% CI) | ‐0.18 [‐0.34, ‐0.03] |
| 5.2 Follow‐up | 1 | 49 | Std. Mean Difference (IV, Random, 95% CI) | 0.08 [‐0.48, 0.64] |
| 6 Overall body fat (change values) | 9 | Std. Mean Difference (IV, Random, 95% CI) | Subtotals only | |
| 6.1 End of intervention | 9 | 499 | Std. Mean Difference (IV, Random, 95% CI) | ‐0.62 [‐1.19, ‐0.06] |
| 6.2 Follow‐up | 0 | 0 | Std. Mean Difference (IV, Random, 95% CI) | 0.0 [0.0, 0.0] |
| 7 Percentage body fat ‐ DEXA (follow‐up values) | 6 | Mean Difference (IV, Random, 95% CI) | Subtotals only | |
| 7.1 End of intervention | 6 | 580 | Mean Difference (IV, Random, 95% CI) | ‐0.66 [‐1.70, 0.37] |
| 7.2 Follow‐up | 1 | 49 | Mean Difference (IV, Random, 95% CI) | 0.52 [‐3.18, 4.22] |
| 8 Percentage body fat ‐ DEXA (change values) | 3 | Mean Difference (IV, Random, 95% CI) | Subtotals only | |
| 8.1 End of intervention | 3 | 228 | Mean Difference (IV, Random, 95% CI) | ‐1.32 [‐1.66, ‐0.99] |
| 8.2 Follow‐up | 0 | 0 | Mean Difference (IV, Random, 95% CI) | 0.0 [0.0, 0.0] |
| 9 Percentage body fat ‐ BIA (follow‐up values) | 7 | Mean Difference (IV, Fixed, 95% CI) | Subtotals only | |
| 9.1 End of intervention | 7 | 331 | Mean Difference (IV, Fixed, 95% CI) | ‐1.47 [‐2.84, ‐0.10] |
| 9.2 Follow‐up | 0 | 0 | Mean Difference (IV, Fixed, 95% CI) | 0.0 [0.0, 0.0] |
| 10 Percentage body fat ‐ BIA (change values) | 4 | Mean Difference (IV, Fixed, 95% CI) | Subtotals only | |
| 10.1 End of intervention | 4 | 185 | Mean Difference (IV, Fixed, 95% CI) | ‐0.70 [‐1.26, ‐0.13] |
| 10.2 Follow‐up | 0 | 0 | Mean Difference (IV, Fixed, 95% CI) | 0.0 [0.0, 0.0] |
| 11 Percentage body fat ‐ SKF (follow‐up values) | 3 | Mean Difference (IV, Random, 95% CI) | Subtotals only | |
| 11.1 End of intervention | 3 | 165 | Mean Difference (IV, Random, 95% CI) | ‐0.73 [‐2.41, 0.96] |
| 11.2 Follow‐up | 0 | 0 | Mean Difference (IV, Random, 95% CI) | 0.0 [0.0, 0.0] |
| 12 Fat mass (follow‐up values) | 5 | Mean Difference (IV, Fixed, 95% CI) | Subtotals only | |
| 12.1 End of intervention | 5 | 460 | Mean Difference (IV, Fixed, 95% CI) | ‐0.70 [‐1.40, ‐0.00] |
| 12.2 Follow‐up | 0 | 0 | Mean Difference (IV, Fixed, 95% CI) | 0.0 [0.0, 0.0] |
| 13 Fat mass (change values) | 4 | Mean Difference (IV, Random, 95% CI) | Subtotals only | |
| 13.1 End of intervention | 4 | 768 | Mean Difference (IV, Random, 95% CI) | ‐0.46 [‐1.08, 0.15] |
| 13.2 Follow‐up | 0 | 0 | Mean Difference (IV, Random, 95% CI) | 0.0 [0.0, 0.0] |
| 14 Fat mass ‐ DEXA (follow‐up values) | 3 | Mean Difference (IV, Fixed, 95% CI) | Subtotals only | |
| 14.1 End of intervention | 3 | 408 | Mean Difference (IV, Fixed, 95% CI) | ‐0.68 [‐1.39, 0.03] |
| 14.2 Follow‐up | 0 | 0 | Mean Difference (IV, Fixed, 95% CI) | 0.0 [0.0, 0.0] |
| 15 Fat mass ‐ DEXA (change values) | 2 | Mean Difference (IV, Random, 95% CI) | Subtotals only | |
| 15.1 End of intervention | 2 | 207 | Mean Difference (IV, Random, 95% CI) | ‐0.74 [‐0.93, ‐0.56] |
| 15.2 Follow‐up | 0 | 0 | Mean Difference (IV, Random, 95% CI) | 0.0 [0.0, 0.0] |
| 16 Lean mass (follow‐up values) | 8 | Std. Mean Difference (IV, Fixed, 95% CI) | Subtotals only | |
| 16.1 End of intervention | 8 | 612 | Std. Mean Difference (IV, Fixed, 95% CI) | 0.05 [‐0.11, 0.21] |
| 16.2 Follow‐up | 1 | 49 | Std. Mean Difference (IV, Fixed, 95% CI) | 0.33 [‐0.24, 0.89] |
| 17 Lean mass (change values) | 5 | Std. Mean Difference (IV, Random, 95% CI) | Subtotals only | |
| 17.1 End of intervention | 5 | 760 | Std. Mean Difference (IV, Random, 95% CI) | 0.80 [‐0.13, 1.72] |
| 17.2 Follow‐up | 0 | 0 | Std. Mean Difference (IV, Random, 95% CI) | 0.0 [0.0, 0.0] |
| 18 Lean mass ‐ DEXA (follow‐up values) | 5 | Mean Difference (IV, Fixed, 95% CI) | Subtotals only | |
| 18.1 End of intervention | 5 | 541 | Mean Difference (IV, Fixed, 95% CI) | 0.43 [‐0.54, 1.40] |
| 18.2 Follow‐up | 1 | 49 | Mean Difference (IV, Fixed, 95% CI) | 2.41 [‐1.62, 6.44] |
| 19 Lean mass ‐ DEXA (change values) | 2 | Mean Difference (IV, Random, 95% CI) | Subtotals only | |
| 19.1 End of intervention | 2 | 207 | Mean Difference (IV, Random, 95% CI) | 0.73 [0.17, 1.29] |
| 19.2 Follow‐up | 0 | 0 | Mean Difference (IV, Random, 95% CI) | 0.0 [0.0, 0.0] |
| 20 Waist‐to‐hip ratio (follow‐up values) | 5 | Mean Difference (IV, Random, 95% CI) | Subtotals only | |
| 20.1 End of intervention | 5 | 213 | Mean Difference (IV, Random, 95% CI) | ‐0.03 [‐0.06, 0.01] |
| 20.2 Follow‐up | 0 | 0 | Mean Difference (IV, Random, 95% CI) | 0.0 [0.0, 0.0] |
| 21 Waist‐to‐hip ratio (change values) | 3 | Mean Difference (IV, Fixed, 95% CI) | Subtotals only | |
| 21.1 End of intervention | 2 | 124 | Mean Difference (IV, Fixed, 95% CI) | 0.0 [‐0.01, 0.01] |
| 21.2 Follow‐up | 1 | 36 | Mean Difference (IV, Fixed, 95% CI) | 0.04 [‐0.14, 0.22] |
| 22 Waist circumference (follow‐up values) | 6 | Mean Difference (IV, Fixed, 95% CI) | Subtotals only | |
| 22.1 End of intervention | 6 | 330 | Mean Difference (IV, Fixed, 95% CI) | ‐0.50 [‐3.18, 2.18] |
| 22.2 Follow‐up | 1 | 26 | Mean Difference (IV, Fixed, 95% CI) | 1.40 [‐8.29, 11.09] |
| 23 Waist circumference (change values) | 5 | Mean Difference (IV, Random, 95% CI) | Subtotals only | |
| 23.1 End of intervention | 5 | 285 | Mean Difference (IV, Random, 95% CI) | ‐1.71 [‐2.56, ‐0.86] |
| 23.2 Follow‐up | 1 | 26 | Mean Difference (IV, Random, 95% CI) | ‐0.90 [‐2.61, 0.81] |
| 24 Hip circumference (follow‐up values) | 4 | Mean Difference (IV, Fixed, 95% CI) | Subtotals only | |
| 24.1 End of intervention | 4 | 249 | Mean Difference (IV, Fixed, 95% CI) | ‐0.97 [‐3.96, 2.01] |
| 24.2 Follow‐up | 0 | 0 | Mean Difference (IV, Fixed, 95% CI) | 0.0 [0.0, 0.0] |
| 25 Hip circumference (change values) | 2 | Mean Difference (IV, Random, 95% CI) | Subtotals only | |
| 25.1 End of intervention | 2 | 115 | Mean Difference (IV, Random, 95% CI) | ‐2.37 [‐3.31, ‐1.44] |
| 25.2 Follow‐up | 0 | 0 | Mean Difference (IV, Random, 95% CI) | 0.0 [0.0, 0.0] |
9.11. Analysis.
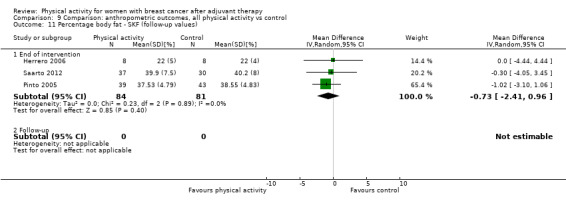
Comparison 9 Comparison: anthropometric outcomes, all physical activity vs control, Outcome 11 Percentage body fat ‐ SKF (follow‐up values).
9.12. Analysis.
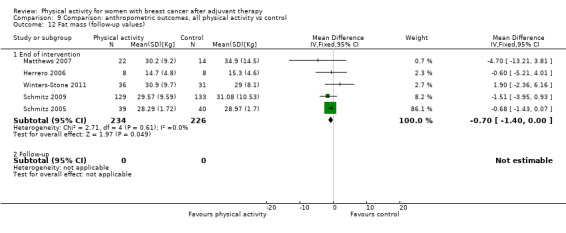
Comparison 9 Comparison: anthropometric outcomes, all physical activity vs control, Outcome 12 Fat mass (follow‐up values).
9.13. Analysis.

Comparison 9 Comparison: anthropometric outcomes, all physical activity vs control, Outcome 13 Fat mass (change values).
9.14. Analysis.
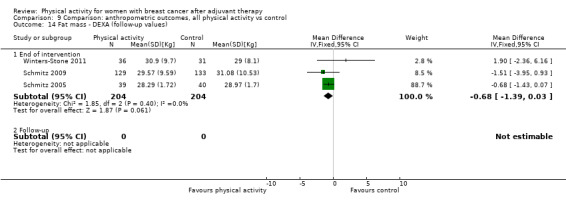
Comparison 9 Comparison: anthropometric outcomes, all physical activity vs control, Outcome 14 Fat mass ‐ DEXA (follow‐up values).
9.15. Analysis.

Comparison 9 Comparison: anthropometric outcomes, all physical activity vs control, Outcome 15 Fat mass ‐ DEXA (change values).
9.16. Analysis.

Comparison 9 Comparison: anthropometric outcomes, all physical activity vs control, Outcome 16 Lean mass (follow‐up values).
9.17. Analysis.
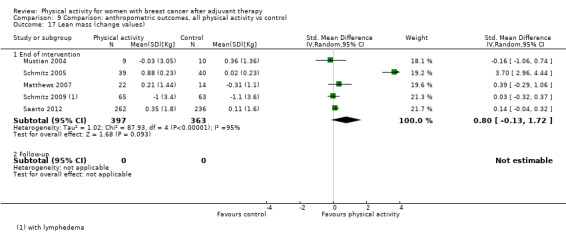
Comparison 9 Comparison: anthropometric outcomes, all physical activity vs control, Outcome 17 Lean mass (change values).
9.18. Analysis.

Comparison 9 Comparison: anthropometric outcomes, all physical activity vs control, Outcome 18 Lean mass ‐ DEXA (follow‐up values).
9.19. Analysis.
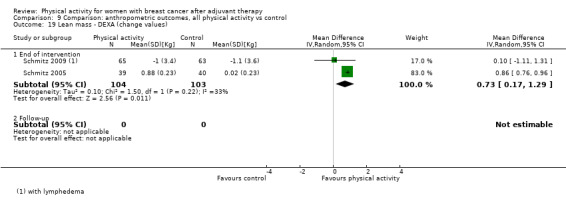
Comparison 9 Comparison: anthropometric outcomes, all physical activity vs control, Outcome 19 Lean mass ‐ DEXA (change values).
Comparison 10. Comparison: muscular strength, all physical activity vs control.
| Outcome or subgroup title | No. of studies | No. of participants | Statistical method | Effect size |
|---|---|---|---|---|
| 1 Lower body strength (follow‐up values) | 10 | Std. Mean Difference (IV, Random, 95% CI) | Subtotals only | |
| 1.1 End of intervention | 10 | 637 | Std. Mean Difference (IV, Random, 95% CI) | 0.44 [0.09, 0.78] |
| 1.2 Follow‐up | 0 | 0 | Std. Mean Difference (IV, Random, 95% CI) | 0.0 [0.0, 0.0] |
| 2 Lower body strength (change values) | 9 | Std. Mean Difference (IV, Random, 95% CI) | Subtotals only | |
| 2.1 End of intervention | 8 | 720 | Std. Mean Difference (IV, Random, 95% CI) | 0.72 [0.38, 1.07] |
| 2.2 Follow‐up | 1 | 36 | Std. Mean Difference (IV, Random, 95% CI) | 0.78 [0.10, 1.46] |
| 3 Leg press (follow‐up values) | 5 | Std. Mean Difference (IV, Random, 95% CI) | Subtotals only | |
| 3.1 End of intervention | 5 | 422 | Std. Mean Difference (IV, Random, 95% CI) | 0.79 [0.35, 1.22] |
| 3.2 Follow‐up | 0 | 0 | Std. Mean Difference (IV, Random, 95% CI) | 0.0 [0.0, 0.0] |
| 4 Leg press (change values) | 5 | Std. Mean Difference (IV, Random, 95% CI) | Subtotals only | |
| 4.1 End of intervention | 5 | 393 | Std. Mean Difference (IV, Random, 95% CI) | 0.94 [0.68, 1.20] |
| 4.2 Follow‐up | 0 | 0 | Std. Mean Difference (IV, Random, 95% CI) | 0.0 [0.0, 0.0] |
| 5 Back & leg strength (follow‐up values) | 2 | Mean Difference (IV, Fixed, 95% CI) | Subtotals only | |
| 5.1 End of intervention | 2 | 58 | Mean Difference (IV, Fixed, 95% CI) | 7.90 [‐2.31, 18.11] |
| 5.2 Follow‐up | 0 | 0 | Mean Difference (IV, Fixed, 95% CI) | 0.0 [0.0, 0.0] |
| 6 Leg extension (follow‐up values) | 4 | Std. Mean Difference (IV, Random, 95% CI) | Subtotals only | |
| 6.1 End of intervention | 4 | 177 | Std. Mean Difference (IV, Random, 95% CI) | ‐0.01 [‐0.34, 0.32] |
| 6.2 Follow‐up | 0 | 0 | Std. Mean Difference (IV, Random, 95% CI) | 0.0 [0.0, 0.0] |
| 7 Leg extension (change values) | 4 | Std. Mean Difference (IV, Random, 95% CI) | Subtotals only | |
| 7.1 End of intervention | 4 | 389 | Std. Mean Difference (IV, Random, 95% CI) | 0.57 [0.03, 1.12] |
| 7.2 Follow‐up | 0 | 0 | Std. Mean Difference (IV, Random, 95% CI) | 0.0 [0.0, 0.0] |
| 8 Hip extension (follow‐up values) | 2 | Std. Mean Difference (IV, Random, 95% CI) | Subtotals only | |
| 8.1 End of intervention | 2 | 285 | Std. Mean Difference (IV, Random, 95% CI) | 0.14 [‐0.45, 0.72] |
| 8.2 Follow‐up | 0 | 0 | Std. Mean Difference (IV, Random, 95% CI) | 0.0 [0.0, 0.0] |
| 9 Hip flexion (follow‐up values) | 2 | Std. Mean Difference (IV, Random, 95% CI) | Subtotals only | |
| 9.1 End of intervention | 2 | 285 | Std. Mean Difference (IV, Random, 95% CI) | 0.04 [‐0.76, 0.83] |
| 9.2 Follow‐up | 0 | 0 | Std. Mean Difference (IV, Random, 95% CI) | 0.0 [0.0, 0.0] |
| 10 Leg flexion (follow‐up values) | 2 | Std. Mean Difference (IV, Random, 95% CI) | Subtotals only | |
| 10.1 End of intervention | 2 | 243 | Std. Mean Difference (IV, Random, 95% CI) | 0.86 [‐0.05, 1.76] |
| 10.2 Follow‐up | 0 | 0 | Std. Mean Difference (IV, Random, 95% CI) | 0.0 [0.0, 0.0] |
| 11 Upper body strength (follow‐up values) | 13 | Std. Mean Difference (IV, Random, 95% CI) | Subtotals only | |
| 11.1 End of intervention | 13 | 768 | Std. Mean Difference (IV, Random, 95% CI) | 0.42 [0.08, 0.76] |
| 11.2 Follow‐up | 0 | 0 | Std. Mean Difference (IV, Random, 95% CI) | 0.0 [0.0, 0.0] |
| 12 Upper body strength (change values) | 9 | Std. Mean Difference (IV, Random, 95% CI) | Subtotals only | |
| 12.1 End of intervention | 8 | 832 | Std. Mean Difference (IV, Random, 95% CI) | 0.72 [0.30, 1.14] |
| 12.2 Follow‐up | 1 | 36 | Std. Mean Difference (IV, Random, 95% CI) | 0.76 [0.08, 1.44] |
| 13 Chest press (follow‐up values) | 5 | Std. Mean Difference (IV, Random, 95% CI) | Subtotals only | |
| 13.1 End of intervention | 5 | 444 | Std. Mean Difference (IV, Random, 95% CI) | 0.51 [‐0.15, 1.17] |
| 13.2 Follow‐up | 0 | 0 | Std. Mean Difference (IV, Random, 95% CI) | 0.0 [0.0, 0.0] |
| 14 Chest press (change values) | 4 | Std. Mean Difference (IV, Random, 95% CI) | Subtotals only | |
| 14.1 End of intervention | 4 | 381 | Std. Mean Difference (IV, Random, 95% CI) | 1.13 [0.46, 1.80] |
| 14.2 Follow‐up | 0 | 0 | Std. Mean Difference (IV, Random, 95% CI) | 0.0 [0.0, 0.0] |
| 15 Grip strength (follow‐up) | 7 | Mean Difference (IV, Random, 95% CI) | Subtotals only | |
| 15.1 End of intervention | 7 | 320 | Mean Difference (IV, Random, 95% CI) | 2.37 [0.20, 4.55] |
| 15.2 Follow‐up | 0 | 0 | Mean Difference (IV, Random, 95% CI) | 0.0 [0.0, 0.0] |
| 16 Grip strength (change values) | 3 | Std. Mean Difference (IV, Random, 95% CI) | Subtotals only | |
| 16.1 End of intervention | 2 | 145 | Std. Mean Difference (IV, Random, 95% CI) | 0.24 [‐0.09, 0.58] |
| 16.2 Follow‐up | 1 | 36 | Std. Mean Difference (IV, Random, 95% CI) | 0.76 [0.08, 1.44] |
| 17 Grip strength right hand (follow‐up) | 5 | Mean Difference (IV, Random, 95% CI) | Subtotals only | |
| 17.1 End of intervention | 5 | 232 | Mean Difference (IV, Random, 95% CI) | 2.30 [‐0.56, 5.16] |
| 17.2 Follow‐up | 0 | 0 | Mean Difference (IV, Random, 95% CI) | 0.0 [0.0, 0.0] |
| 18 Grip strength left hand (follow‐up) | 4 | Mean Difference (IV, Random, 95% CI) | Subtotals only | |
| 18.1 End of intervention | 4 | 198 | Mean Difference (IV, Random, 95% CI) | 2.12 [‐1.05, 5.30] |
| 18.2 Follow‐up | 0 | 0 | Mean Difference (IV, Random, 95% CI) | 0.0 [0.0, 0.0] |
| 19 Elbow flexion (follow‐up values) | 3 | Std. Mean Difference (IV, Fixed, 95% CI) | Subtotals only | |
| 19.1 End of intervention | 3 | 148 | Std. Mean Difference (IV, Fixed, 95% CI) | ‐0.08 [‐0.41, 0.24] |
| 19.2 Follow‐up | 0 | 0 | Std. Mean Difference (IV, Fixed, 95% CI) | 0.0 [0.0, 0.0] |
10.5. Analysis.
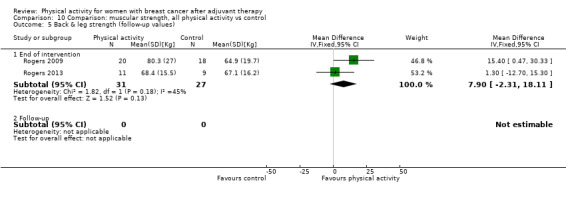
Comparison 10 Comparison: muscular strength, all physical activity vs control, Outcome 5 Back & leg strength (follow‐up values).
10.6. Analysis.
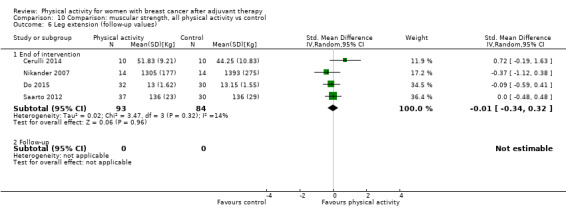
Comparison 10 Comparison: muscular strength, all physical activity vs control, Outcome 6 Leg extension (follow‐up values).
10.8. Analysis.

Comparison 10 Comparison: muscular strength, all physical activity vs control, Outcome 8 Hip extension (follow‐up values).
10.9. Analysis.

Comparison 10 Comparison: muscular strength, all physical activity vs control, Outcome 9 Hip flexion (follow‐up values).
10.10. Analysis.
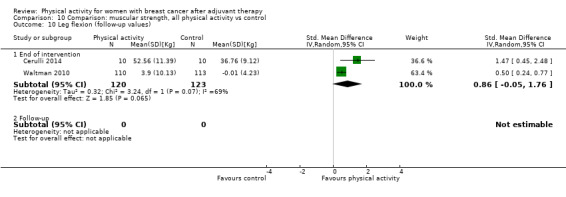
Comparison 10 Comparison: muscular strength, all physical activity vs control, Outcome 10 Leg flexion (follow‐up values).
10.13. Analysis.
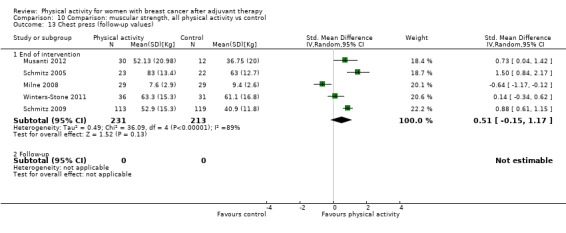
Comparison 10 Comparison: muscular strength, all physical activity vs control, Outcome 13 Chest press (follow‐up values).
10.16. Analysis.

Comparison 10 Comparison: muscular strength, all physical activity vs control, Outcome 16 Grip strength (change values).
10.17. Analysis.

Comparison 10 Comparison: muscular strength, all physical activity vs control, Outcome 17 Grip strength right hand (follow‐up).
10.18. Analysis.

Comparison 10 Comparison: muscular strength, all physical activity vs control, Outcome 18 Grip strength left hand (follow‐up).
10.19. Analysis.

Comparison 10 Comparison: muscular strength, all physical activity vs control, Outcome 19 Elbow flexion (follow‐up values).
Comparison 11. Comparison: bone health, all physical activity vs control.
| Outcome or subgroup title | No. of studies | No. of participants | Statistical method | Effect size |
|---|---|---|---|---|
| 1 Bone mineral content (follow‐up and change values) | 2 | Std. Mean Difference (IV, Random, 95% CI) | Subtotals only | |
| 1.1 End of intervention | 2 | 525 | Std. Mean Difference (IV, Random, 95% CI) | 0.04 [‐0.20, 0.27] |
| 1.2 Follow‐up | 0 | 0 | Std. Mean Difference (IV, Random, 95% CI) | 0.0 [0.0, 0.0] |
| 2 Bone mineral density ‐ femoral neck (follow‐up and change values) | 4 | Std. Mean Difference (IV, Random, 95% CI) | Subtotals only | |
| 2.1 End of intervention | 4 | 786 | Std. Mean Difference (IV, Random, 95% CI) | 0.21 [‐0.13, 0.55] |
| 2.2 Follow‐up | 0 | 0 | Std. Mean Difference (IV, Random, 95% CI) | 0.0 [0.0, 0.0] |
| 3 Bone mineral density ‐ lumbar spine (follow‐up and change values) | 4 | Std. Mean Difference (IV, Random, 95% CI) | Subtotals only | |
| 3.1 End of intervention | 4 | 786 | Std. Mean Difference (IV, Random, 95% CI) | 0.22 [‐0.09, 0.53] |
| 3.2 Follow‐up | 0 | 0 | Std. Mean Difference (IV, Random, 95% CI) | 0.0 [0.0, 0.0] |
| 4 Bone mineral density ‐ total hip (follow‐up and change values) | 3 | Std. Mean Difference (IV, Random, 95% CI) | Subtotals only | |
| 4.1 End of intervention | 3 | 329 | Std. Mean Difference (IV, Random, 95% CI) | 0.58 [‐0.02, 1.18] |
| 4.2 Follow‐up | 0 | 0 | Std. Mean Difference (IV, Random, 95% CI) | 0.0 [0.0, 0.0] |
| 5 Bone formation ‐ alkaline phosphatase (follow‐up and change values) | 2 | Std. Mean Difference (IV, Random, 95% CI) | Subtotals only | |
| 5.1 End of intervention | 2 | 239 | Std. Mean Difference (IV, Random, 95% CI) | ‐0.25 [‐1.81, 1.31] |
| 5.2 Follow‐up | 0 | 0 | Std. Mean Difference (IV, Random, 95% CI) | 0.0 [0.0, 0.0] |
| 6 Bone resorption ‐ serum NTx (follow‐up and change values) | 3 | Std. Mean Difference (IV, Random, 95% CI) | Subtotals only | |
| 6.1 End of intervention | 3 | 278 | Std. Mean Difference (IV, Random, 95% CI) | 0.38 [‐1.58, 2.34] |
| 6.2 Follow‐up | 0 | 0 | Std. Mean Difference (IV, Random, 95% CI) | 0.0 [0.0, 0.0] |
Comparison 12. Subanalysis: outcomes by menopausal status.
| Outcome or subgroup title | No. of studies | No. of participants | Statistical method | Effect size |
|---|---|---|---|---|
| 1 Overall HRQoL (follow‐up values) | 9 | Std. Mean Difference (IV, Random, 95% CI) | Subtotals only | |
| 1.1 Postmenopausal only | 3 | 186 | Std. Mean Difference (IV, Random, 95% CI) | 0.24 [‐0.05, 0.54] |
| 1.2 Not postmenopausal only | 6 | 818 | Std. Mean Difference (IV, Random, 95% CI) | 0.55 [0.11, 0.98] |
| 2 Overall HRQoL (change values) | 7 | Std. Mean Difference (IV, Random, 95% CI) | Subtotals only | |
| 2.1 Postmenopausal only | 3 | 186 | Std. Mean Difference (IV, Random, 95% CI) | 0.49 [0.19, 0.79] |
| 2.2 Not postmenopausal only | 4 | 952 | Std. Mean Difference (IV, Random, 95% CI) | 0.13 [‐0.11, 0.38] |
| 3 Overall emotional function/mental health (follow‐up values) | 11 | Std. Mean Difference (IV, Random, 95% CI) | Subtotals only | |
| 3.1 Postmenopausal only | 2 | 126 | Std. Mean Difference (IV, Random, 95% CI) | 0.21 [‐0.14, 0.56] |
| 3.2 Not postmenopausal only | 9 | 990 | Std. Mean Difference (IV, Random, 95% CI) | 0.25 [0.06, 0.44] |
| 4 Overall emotional function/mental health (change values) | 7 | Std. Mean Difference (IV, Random, 95% CI) | Subtotals only | |
| 4.1 Postmenopausal only | 2 | 126 | Std. Mean Difference (IV, Random, 95% CI) | 0.37 [0.01, 0.72] |
| 4.2 Not postmenopausal only | 5 | 1013 | Std. Mean Difference (IV, Random, 95% CI) | 0.08 [‐0.17, 0.33] |
| 5 Overall physical function (follow‐up values) | 11 | Std. Mean Difference (IV, Random, 95% CI) | Subtotals only | |
| 5.1 Postmenopausal only | 3 | 187 | Std. Mean Difference (IV, Random, 95% CI) | 0.09 [‐0.20, 0.38] |
| 5.2 Not postmenopausal only | 8 | 929 | Std. Mean Difference (IV, Random, 95% CI) | 0.50 [0.10, 0.90] |
| 6 Overall physical function (change values) | 6 | Std. Mean Difference (IV, Random, 95% CI) | Subtotals only | |
| 6.1 Postmenopausal only | 2 | 126 | Std. Mean Difference (IV, Random, 95% CI) | 0.52 [‐0.36, 1.39] |
| 6.2 Not postmenopausal only | 4 | 949 | Std. Mean Difference (IV, Random, 95% CI) | 0.03 [‐0.20, 0.25] |
| 7 Overall role function (follow‐up values) | 8 | Std. Mean Difference (IV, Random, 95% CI) | Subtotals only | |
| 7.1 Postmenopausal only | 2 | 126 | Std. Mean Difference (IV, Random, 95% CI) | 0.27 [‐0.08, 0.62] |
| 7.2 Not postmenopausal only | 6 | 818 | Std. Mean Difference (IV, Random, 95% CI) | 0.42 [‐0.07, 0.90] |
| 8 Overall role function (change values) | 6 | Std. Mean Difference (IV, Random, 95% CI) | Subtotals only | |
| 8.1 Postmenopausal only | 2 | 126 | Std. Mean Difference (IV, Random, 95% CI) | 0.11 [‐0.24, 0.46] |
| 8.2 Not postmenopausal only | 4 | 952 | Std. Mean Difference (IV, Random, 95% CI) | ‐0.00 [‐0.14, 0.13] |
| 9 Overall social well‐being/function (follow‐up values) | 8 | Std. Mean Difference (IV, Random, 95% CI) | Subtotals only | |
| 9.1 Postmenopausal only | 3 | 168 | Std. Mean Difference (IV, Random, 95% CI) | 0.43 [‐0.06, 0.91] |
| 9.2 Not postmenopausal only | 5 | 867 | Std. Mean Difference (IV, Random, 95% CI) | 0.09 [‐0.05, 0.24] |
| 10 Overall social well‐being/function (change values) | 6 | Std. Mean Difference (IV, Random, 95% CI) | Subtotals only | |
| 10.1 Postmenopausal only | 3 | 168 | Std. Mean Difference (IV, Random, 95% CI) | 0.50 [0.19, 0.80] |
| 10.2 Not postmenopausal only | 3 | 873 | Std. Mean Difference (IV, Random, 95% CI) | 0.50 [‐0.39, 1.40] |
| 11 Overall cognitive function (follow‐up values) | 3 | Std. Mean Difference (IV, Random, 95% CI) | Subtotals only | |
| 11.1 Postmenopausal only | 0 | 0 | Std. Mean Difference (IV, Random, 95% CI) | 0.0 [0.0, 0.0] |
| 11.2 Not postmenopausal only | 3 | 116 | Std. Mean Difference (IV, Random, 95% CI) | 0.58 [0.20, 0.95] |
| 12 Overall cognitive function (change values) | 3 | Std. Mean Difference (IV, Random, 95% CI) | Subtotals only | |
| 12.1 Postmenopausal only | 0 | 0 | Std. Mean Difference (IV, Random, 95% CI) | 0.0 [0.0, 0.0] |
| 12.2 Not postmenopausal only | 3 | 599 | Std. Mean Difference (IV, Random, 95% CI) | 0.12 [‐0.31, 0.55] |
| 13 Overall general health (follow‐up values) | 4 | Std. Mean Difference (IV, Random, 95% CI) | Subtotals only | |
| 13.1 Postmenopausal only | 2 | 134 | Std. Mean Difference (IV, Random, 95% CI) | ‐0.03 [‐0.41, 0.35] |
| 13.2 Not postmenopausal only | 2 | 117 | Std. Mean Difference (IV, Random, 95% CI) | ‐0.09 [‐0.57, 0.39] |
| 14 Overall general health (change values) | 5 | Std. Mean Difference (IV, Random, 95% CI) | Subtotals only | |
| 14.1 Postmenopausal only | 2 | 134 | Std. Mean Difference (IV, Random, 95% CI) | 0.27 [‐0.18, 0.71] |
| 14.2 Not postmenopausal only | 3 | 617 | Std. Mean Difference (IV, Random, 95% CI) | ‐0.01 [‐0.22, 0.21] |
| 15 Overall sexual function (follow‐up values) | 2 | Std. Mean Difference (IV, Fixed, 95% CI) | Subtotals only | |
| 15.1 Postmenopausal only | 0 | 0 | Std. Mean Difference (IV, Fixed, 95% CI) | 0.0 [0.0, 0.0] |
| 15.2 Not postmenopausal only | 2 | 161 | Std. Mean Difference (IV, Fixed, 95% CI) | 0.31 [‐0.00, 0.62] |
| 16 Overall sexual function (change values) | 2 | Std. Mean Difference (IV, Random, 95% CI) | Subtotals only | |
| 16.1 Postmenopausal only | 0 | 0 | Std. Mean Difference (IV, Random, 95% CI) | 0.0 [0.0, 0.0] |
| 16.2 Not postmenopausal only | 2 | 579 | Std. Mean Difference (IV, Random, 95% CI) | 0.08 [‐0.14, 0.30] |
| 17 Overall sleep (follow‐up values) | 4 | Std. Mean Difference (IV, Fixed, 95% CI) | Subtotals only | |
| 17.1 Postmenopausal only | 1 | 42 | Std. Mean Difference (IV, Fixed, 95% CI) | ‐0.11 [‐0.72, 0.49] |
| 17.2 Not postmenopausal only | 3 | 89 | Std. Mean Difference (IV, Fixed, 95% CI) | 0.18 [‐0.24, 0.60] |
| 18 Overall sleep (change values) | 2 | Std. Mean Difference (IV, Random, 95% CI) | Subtotals only | |
| 18.1 Postmenopausal only | 1 | 42 | Std. Mean Difference (IV, Random, 95% CI) | 0.23 [‐0.38, 0.84] |
| 18.2 Not postmenopausal only | 1 | 38 | Std. Mean Difference (IV, Random, 95% CI) | 0.05 [‐0.59, 0.68] |
| 19 Overall anxiety (follow‐up values) | 4 | Std. Mean Difference (IV, Random, 95% CI) | Subtotals only | |
| 19.1 Postmenopausal only | 2 | 116 | Std. Mean Difference (IV, Random, 95% CI) | ‐0.09 [‐0.46, 0.27] |
| 19.2 Not postmenopausal only | 2 | 79 | Std. Mean Difference (IV, Random, 95% CI) | ‐0.66 [‐1.12, ‐0.20] |
| 20 Overall anxiety (change values) | 3 | Std. Mean Difference (IV, Fixed, 95% CI) | Subtotals only | |
| 20.1 Postmenopausal only | 2 | 116 | Std. Mean Difference (IV, Fixed, 95% CI) | ‐0.23 [‐0.60, 0.13] |
| 20.2 Not postmenopausal only | 1 | 61 | Std. Mean Difference (IV, Fixed, 95% CI) | ‐0.61 [‐1.12, ‐0.09] |
| 21 Overall self‐esteem/body image (follow‐up values) | 4 | Std. Mean Difference (IV, Random, 95% CI) | Subtotals only | |
| 21.1 Postmenopausal only | 2 | 126 | Std. Mean Difference (IV, Random, 95% CI) | 0.10 [‐0.25, 0.45] |
| 21.2 Not postmenopausal only | 2 | 76 | Std. Mean Difference (IV, Random, 95% CI) | 0.60 [‐0.15, 1.35] |
| 22 Overall self‐esteem/body image (change values) | 4 | Std. Mean Difference (IV, Random, 95% CI) | Subtotals only | |
| 22.1 Postmenopausal only | 2 | 126 | Std. Mean Difference (IV, Random, 95% CI) | 0.38 [‐0.30, 1.05] |
| 22.2 Not postmenopausal only | 2 | 558 | Std. Mean Difference (IV, Random, 95% CI) | 0.08 [‐0.31, 0.47] |
| 23 Overall depression (follow‐up values) | 8 | Std. Mean Difference (IV, Random, 95% CI) | Subtotals only | |
| 23.1 Postmenopausal only | 4 | 196 | Std. Mean Difference (IV, Random, 95% CI) | 0.18 [‐0.13, 0.48] |
| 23.2 Not postmenopausal only | 4 | 296 | Std. Mean Difference (IV, Random, 95% CI) | ‐0.42 [‐0.77, ‐0.06] |
| 24 Overall depression (change values) | 5 | Std. Mean Difference (IV, Random, 95% CI) | Subtotals only | |
| 24.1 Postmenopausal only | 3 | 176 | Std. Mean Difference (IV, Random, 95% CI) | ‐0.27 [‐0.57, 0.04] |
| 24.2 Not postmenopausal only | 2 | 561 | Std. Mean Difference (IV, Random, 95% CI) | ‐0.21 [‐0.82, 0.40] |
| 25 Overall fatigue (follow‐up values) | 15 | Std. Mean Difference (IV, Random, 95% CI) | Subtotals only | |
| 25.1 Postmenopausal only | 6 | 313 | Std. Mean Difference (IV, Random, 95% CI) | 0.04 [‐0.19, 0.26] |
| 25.2 Not postmenopausal only | 9 | 834 | Std. Mean Difference (IV, Random, 95% CI) | ‐0.53 [‐0.87, ‐0.18] |
| 26 Overall fatigue (change values) | 7 | Std. Mean Difference (IV, Random, 95% CI) | Subtotals only | |
| 26.1 Postmenopausal only | 2 | 70 | Std. Mean Difference (IV, Random, 95% CI) | 0.05 [‐1.55, 1.64] |
| 26.2 Not postmenopausal only | 5 | 954 | Std. Mean Difference (IV, Random, 95% CI) | ‐0.24 [‐0.69, 0.20] |
| 27 Overall pain/disability (follow‐up values) | 2 | Std. Mean Difference (IV, Random, 95% CI) | Subtotals only | |
| 27.1 Postmenopausal only | 1 | 74 | Std. Mean Difference (IV, Random, 95% CI) | ‐0.05 [‐0.51, 0.40] |
| 27.2 Not postmenopausal only | 1 | 38 | Std. Mean Difference (IV, Random, 95% CI) | ‐0.26 [‐0.89, 0.38] |
| 28 Overall pain/disability (change values) | 3 | Std. Mean Difference (IV, Random, 95% CI) | Subtotals only | |
| 28.1 Postmenopausal only | 2 | 157 | Std. Mean Difference (IV, Random, 95% CI) | ‐0.29 [‐0.61, 0.02] |
| 28.2 Not postmenopausal only | 1 | 36 | Std. Mean Difference (IV, Random, 95% CI) | 0.22 [‐0.43, 0.88] |
| 29 Overall cardiorespiratory fitness (follow‐up values) | 9 | Std. Mean Difference (IV, Random, 95% CI) | Subtotals only | |
| 29.1 Postmenopausal only | 4 | 214 | Std. Mean Difference (IV, Random, 95% CI) | 0.61 [0.30, 0.92] |
| 29.2 Not postmenopausal only | 5 | 418 | Std. Mean Difference (IV, Random, 95% CI) | 0.19 [‐0.01, 0.38] |
| 30 Overall cardiorespiratory fitness (change values) | 5 | Std. Mean Difference (IV, Random, 95% CI) | Subtotals only | |
| 30.1 Postmenopausal only | 4 | 208 | Std. Mean Difference (IV, Random, 95% CI) | 1.07 [0.48, 1.67] |
| 30.2 Not postmenopausal only | 1 | 498 | Std. Mean Difference (IV, Random, 95% CI) | 0.16 [‐0.02, 0.33] |
| 31 Overall self‐reported physical activity (follow‐up values) | 10 | Std. Mean Difference (IV, Random, 95% CI) | Subtotals only | |
| 31.1 Postmenopausal only | 5 | 292 | Std. Mean Difference (IV, Random, 95% CI) | 0.63 [0.17, 1.10] |
| 31.2 Not postmenopausal only | 5 | 810 | Std. Mean Difference (IV, Random, 95% CI) | 0.45 [0.16, 0.75] |
| 32 Overall self‐reported physical activity (change values) | 6 | Std. Mean Difference (IV, Random, 95% CI) | Subtotals only | |
| 32.1 Postmenopausal only | 3 | 186 | Std. Mean Difference (IV, Random, 95% CI) | 0.83 [0.53, 1.13] |
| 32.2 Not postmenopausal only | 3 | 901 | Std. Mean Difference (IV, Random, 95% CI) | 0.57 [‐0.02, 1.16] |
| 33 Overall objective physical activity (follow‐up values) | 8 | Std. Mean Difference (IV, Random, 95% CI) | Subtotals only | |
| 33.1 Postmenopausal only | 3 | 145 | Std. Mean Difference (IV, Random, 95% CI) | 0.87 [0.27, 1.46] |
| 33.2 Not postmenopausal only | 5 | 645 | Std. Mean Difference (IV, Random, 95% CI) | 0.19 [‐0.03, 0.42] |
| 34 Overall objective physical activity (change values) | 5 | Std. Mean Difference (IV, Random, 95% CI) | Subtotals only | |
| 34.1 Postmenopausal only | 3 | 145 | Std. Mean Difference (IV, Random, 95% CI) | 0.89 [0.54, 1.24] |
| 34.2 Not postmenopausal only | 2 | 363 | Std. Mean Difference (IV, Random, 95% CI) | 0.45 [‐0.67, 1.58] |
| 35 Mass (follow‐up values) | 8 | Mean Difference (IV, Fixed, 95% CI) | Subtotals only | |
| 35.1 Postmenopausal only | 4 | 222 | Mean Difference (IV, Fixed, 95% CI) | 0.69 [‐3.74, 5.13] |
| 35.2 Not postmenopausal only | 4 | 411 | Mean Difference (IV, Fixed, 95% CI) | 0.08 [‐0.52, 0.68] |
| 36 Mass (change values) | 7 | Mean Difference (IV, Random, 95% CI) | Subtotals only | |
| 36.1 Postmenopausal only | 4 | 202 | Mean Difference (IV, Random, 95% CI) | ‐0.99 [‐1.96, ‐0.02] |
| 36.2 Not postmenopausal only | 3 | 613 | Mean Difference (IV, Random, 95% CI) | 0.11 [‐0.07, 0.29] |
| 37 BMI (follow‐up values) | 9 | Mean Difference (IV, Fixed, 95% CI) | Subtotals only | |
| 37.1 Postmenopausal only | 3 | 161 | Mean Difference (IV, Fixed, 95% CI) | ‐0.60 [‐2.62, 1.42] |
| 37.2 Not postmenopausal only | 6 | 745 | Mean Difference (IV, Fixed, 95% CI) | 0.08 [‐0.13, 0.29] |
| 38 BMI (change values) | 4 | Mean Difference (IV, Random, 95% CI) | Subtotals only | |
| 38.1 Postmenopausal only | 2 | 92 | Mean Difference (IV, Random, 95% CI) | ‐0.17 [‐0.54, 0.20] |
| 38.2 Not postmenopausal only | 2 | 161 | Mean Difference (IV, Random, 95% CI) | ‐0.02 [‐0.09, 0.05] |
| 39 Overall body fat (follow‐up values) | 11 | Std. Mean Difference (IV, Random, 95% CI) | Subtotals only | |
| 39.1 Postmenopausal only | 5 | 264 | Std. Mean Difference (IV, Random, 95% CI) | ‐0.06 [‐0.36, 0.25] |
| 39.2 Not postmenopausal only | 6 | 353 | Std. Mean Difference (IV, Random, 95% CI) | ‐0.22 [‐0.59, 0.15] |
| 40 Overall body fat (change values) | 5 | Std. Mean Difference (IV, Random, 95% CI) | Subtotals only | |
| 40.1 Postmenopausal only | 3 | 128 | Std. Mean Difference (IV, Random, 95% CI) | ‐0.35 [‐0.70, 0.00] |
| 40.2 Not postmenopausal only | 2 | 161 | Std. Mean Difference (IV, Random, 95% CI) | ‐1.67 [‐4.39, 1.05] |
| 41 Lower body strength (follow‐up values) | 6 | Std. Mean Difference (IV, Random, 95% CI) | Subtotals only | |
| 41.1 Postmenopausal only | 1 | 67 | Std. Mean Difference (IV, Random, 95% CI) | 0.19 [‐0.30, 0.67] |
| 41.2 Not postmenopausal only | 5 | 228 | Std. Mean Difference (IV, Random, 95% CI) | 0.46 [0.04, 0.88] |
| 42 Lower body strength (change values) | 3 | Std. Mean Difference (IV, Random, 95% CI) | Subtotals only | |
| 42.1 Postmenopausal only | 2 | 256 | Std. Mean Difference (IV, Random, 95% CI) | 0.70 [‐0.01, 1.41] |
| 42.2 Not postmenopausal only | 1 | 45 | Std. Mean Difference (IV, Random, 95% CI) | 1.27 [0.63, 1.92] |
| 43 Upper body strength (follow‐up values) | 5 | Std. Mean Difference (IV, Random, 95% CI) | Subtotals only | |
| 43.1 Postmenopausal only | 1 | 67 | Std. Mean Difference (IV, Random, 95% CI) | 0.14 [‐0.34, 0.62] |
| 43.2 Not postmenopausal only | 4 | 208 | Std. Mean Difference (IV, Random, 95% CI) | 0.44 [‐0.40, 1.28] |
| 44 Upper body strength (change values) | 4 | Std. Mean Difference (IV, Random, 95% CI) | Subtotals only | |
| 44.1 Postmenopausal only | 2 | 306 | Std. Mean Difference (IV, Random, 95% CI) | 0.25 [0.03, 0.48] |
| 44.2 Not postmenopausal only | 2 | 81 | Std. Mean Difference (IV, Random, 95% CI) | 1.49 [0.04, 2.93] |
| 45 Bone mineral density ‐ femoral neck (follow‐up and change values) | 4 | Std. Mean Difference (IV, Random, 95% CI) | Subtotals only | |
| 45.1 Postmenopausal only | 3 | 329 | Std. Mean Difference (IV, Random, 95% CI) | 0.18 [‐0.39, 0.75] |
| 45.2 Not postmenopausal only | 1 | 457 | Std. Mean Difference (IV, Random, 95% CI) | 0.18 [‐0.00, 0.37] |
| 46 Bone mineral density ‐ lumbar spine (follow‐up and change values) | 4 | Std. Mean Difference (IV, Random, 95% CI) | Subtotals only | |
| 46.1 Postmenopausal only | 3 | 329 | Std. Mean Difference (IV, Random, 95% CI) | 0.27 [‐0.16, 0.70] |
| 46.2 Not postmenopausal only | 1 | 457 | Std. Mean Difference (IV, Random, 95% CI) | 0.09 [‐0.09, 0.27] |
12.3. Analysis.
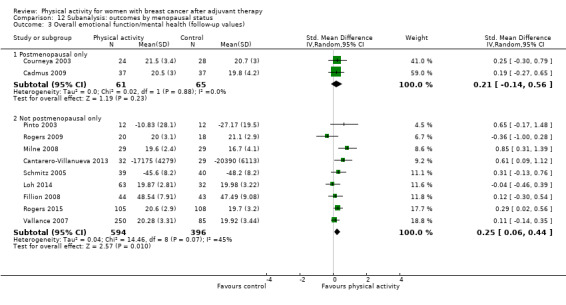
Comparison 12 Subanalysis: outcomes by menopausal status, Outcome 3 Overall emotional function/mental health (follow‐up values).
12.4. Analysis.
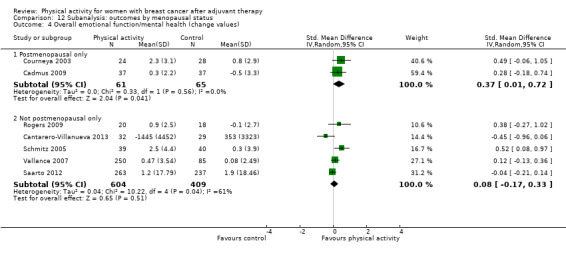
Comparison 12 Subanalysis: outcomes by menopausal status, Outcome 4 Overall emotional function/mental health (change values).
12.5. Analysis.
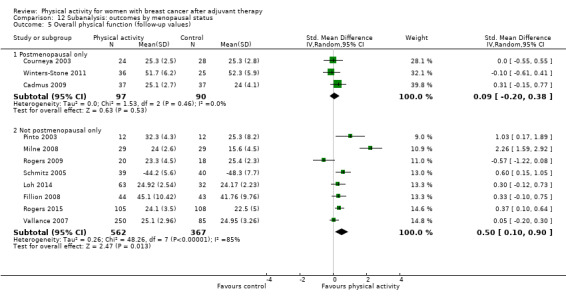
Comparison 12 Subanalysis: outcomes by menopausal status, Outcome 5 Overall physical function (follow‐up values).
12.6. Analysis.
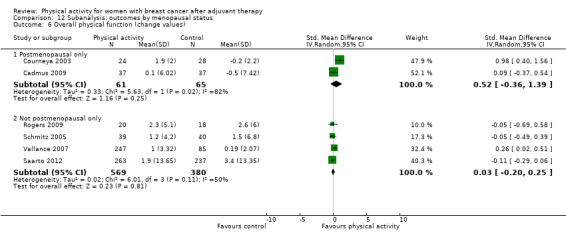
Comparison 12 Subanalysis: outcomes by menopausal status, Outcome 6 Overall physical function (change values).
12.7. Analysis.

Comparison 12 Subanalysis: outcomes by menopausal status, Outcome 7 Overall role function (follow‐up values).
12.8. Analysis.
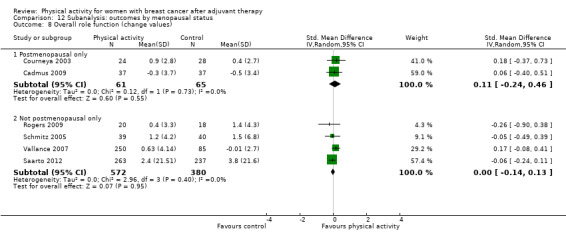
Comparison 12 Subanalysis: outcomes by menopausal status, Outcome 8 Overall role function (change values).
12.9. Analysis.
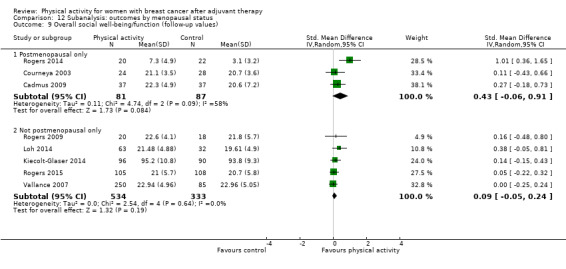
Comparison 12 Subanalysis: outcomes by menopausal status, Outcome 9 Overall social well‐being/function (follow‐up values).
12.10. Analysis.

Comparison 12 Subanalysis: outcomes by menopausal status, Outcome 10 Overall social well‐being/function (change values).
12.11. Analysis.

Comparison 12 Subanalysis: outcomes by menopausal status, Outcome 11 Overall cognitive function (follow‐up values).
12.12. Analysis.

Comparison 12 Subanalysis: outcomes by menopausal status, Outcome 12 Overall cognitive function (change values).
12.13. Analysis.

Comparison 12 Subanalysis: outcomes by menopausal status, Outcome 13 Overall general health (follow‐up values).
12.14. Analysis.
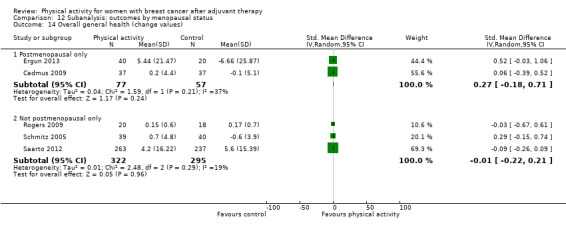
Comparison 12 Subanalysis: outcomes by menopausal status, Outcome 14 Overall general health (change values).
12.15. Analysis.

Comparison 12 Subanalysis: outcomes by menopausal status, Outcome 15 Overall sexual function (follow‐up values).
12.16. Analysis.
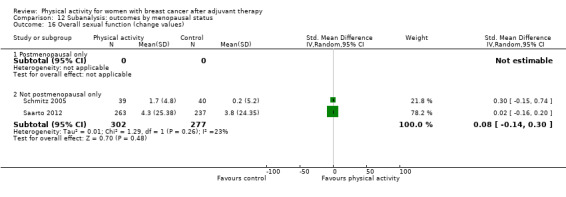
Comparison 12 Subanalysis: outcomes by menopausal status, Outcome 16 Overall sexual function (change values).
12.17. Analysis.
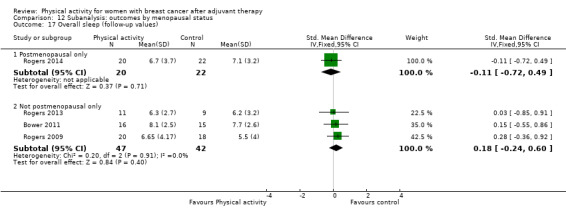
Comparison 12 Subanalysis: outcomes by menopausal status, Outcome 17 Overall sleep (follow‐up values).
12.18. Analysis.

Comparison 12 Subanalysis: outcomes by menopausal status, Outcome 18 Overall sleep (change values).
12.19. Analysis.
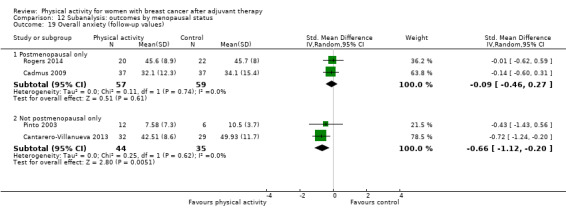
Comparison 12 Subanalysis: outcomes by menopausal status, Outcome 19 Overall anxiety (follow‐up values).
12.20. Analysis.
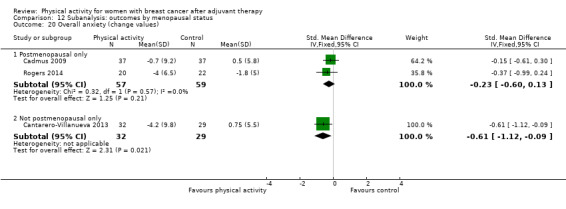
Comparison 12 Subanalysis: outcomes by menopausal status, Outcome 20 Overall anxiety (change values).
12.21. Analysis.

Comparison 12 Subanalysis: outcomes by menopausal status, Outcome 21 Overall self‐esteem/body image (follow‐up values).
12.22. Analysis.
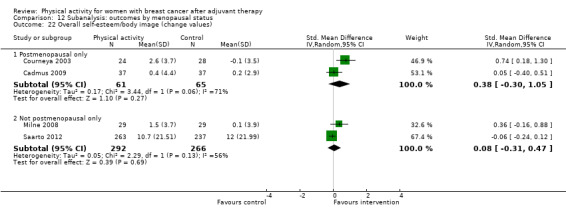
Comparison 12 Subanalysis: outcomes by menopausal status, Outcome 22 Overall self‐esteem/body image (change values).
12.23. Analysis.

Comparison 12 Subanalysis: outcomes by menopausal status, Outcome 23 Overall depression (follow‐up values).
12.24. Analysis.

Comparison 12 Subanalysis: outcomes by menopausal status, Outcome 24 Overall depression (change values).
12.25. Analysis.
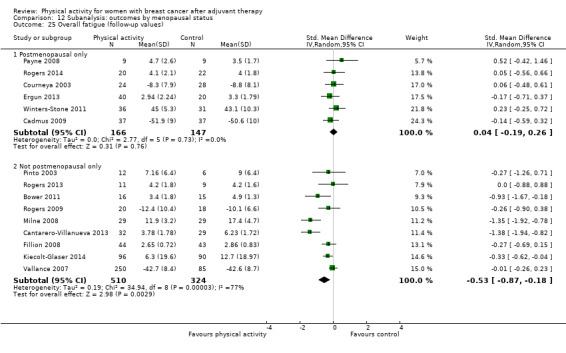
Comparison 12 Subanalysis: outcomes by menopausal status, Outcome 25 Overall fatigue (follow‐up values).
12.26. Analysis.

Comparison 12 Subanalysis: outcomes by menopausal status, Outcome 26 Overall fatigue (change values).
12.27. Analysis.
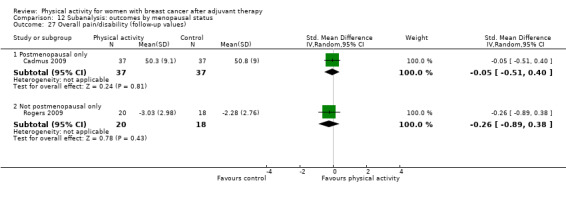
Comparison 12 Subanalysis: outcomes by menopausal status, Outcome 27 Overall pain/disability (follow‐up values).
12.28. Analysis.
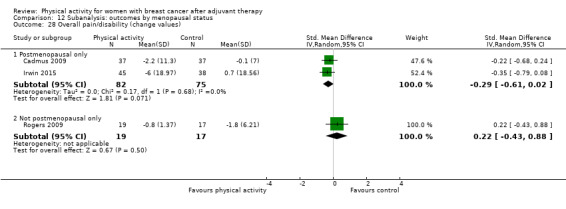
Comparison 12 Subanalysis: outcomes by menopausal status, Outcome 28 Overall pain/disability (change values).
12.29. Analysis.
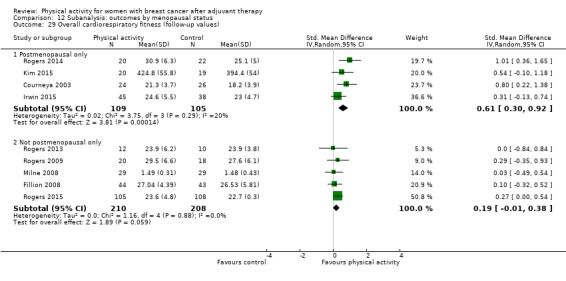
Comparison 12 Subanalysis: outcomes by menopausal status, Outcome 29 Overall cardiorespiratory fitness (follow‐up values).
12.30. Analysis.
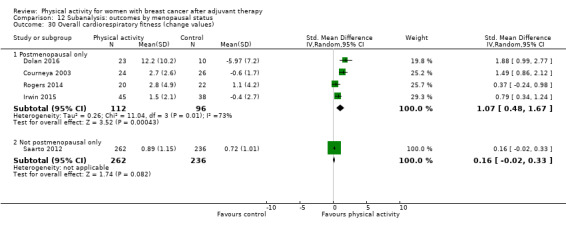
Comparison 12 Subanalysis: outcomes by menopausal status, Outcome 30 Overall cardiorespiratory fitness (change values).
12.31. Analysis.
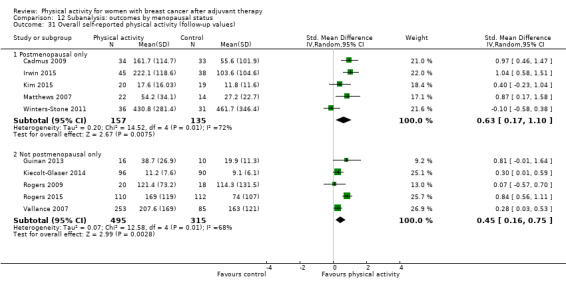
Comparison 12 Subanalysis: outcomes by menopausal status, Outcome 31 Overall self‐reported physical activity (follow‐up values).
12.32. Analysis.
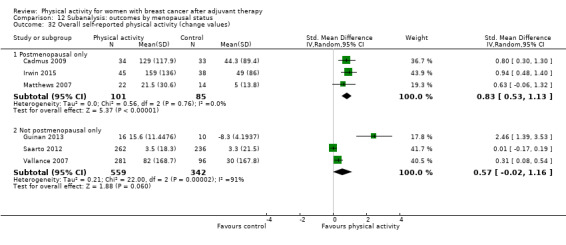
Comparison 12 Subanalysis: outcomes by menopausal status, Outcome 32 Overall self‐reported physical activity (change values).
12.33. Analysis.

Comparison 12 Subanalysis: outcomes by menopausal status, Outcome 33 Overall objective physical activity (follow‐up values).
12.34. Analysis.
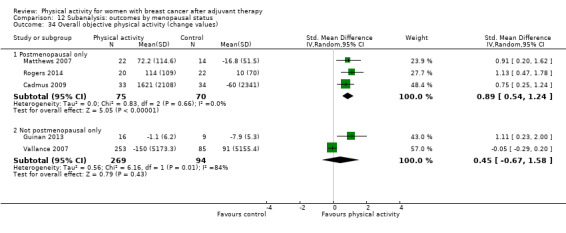
Comparison 12 Subanalysis: outcomes by menopausal status, Outcome 34 Overall objective physical activity (change values).
12.35. Analysis.

Comparison 12 Subanalysis: outcomes by menopausal status, Outcome 35 Mass (follow‐up values).
12.36. Analysis.

Comparison 12 Subanalysis: outcomes by menopausal status, Outcome 36 Mass (change values).
12.37. Analysis.

Comparison 12 Subanalysis: outcomes by menopausal status, Outcome 37 BMI (follow‐up values).
12.38. Analysis.
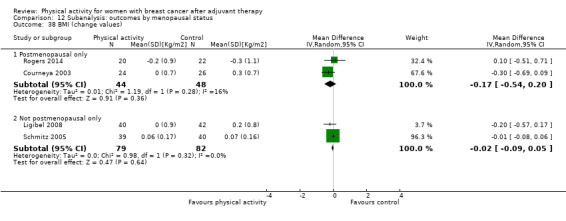
Comparison 12 Subanalysis: outcomes by menopausal status, Outcome 38 BMI (change values).
12.39. Analysis.
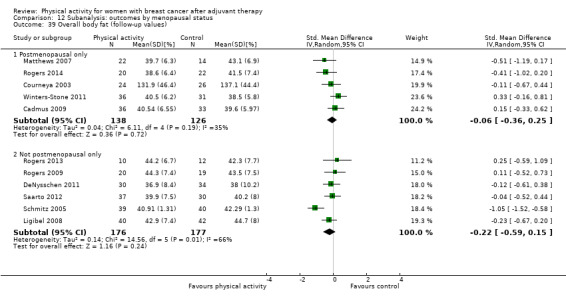
Comparison 12 Subanalysis: outcomes by menopausal status, Outcome 39 Overall body fat (follow‐up values).
12.40. Analysis.

Comparison 12 Subanalysis: outcomes by menopausal status, Outcome 40 Overall body fat (change values).
12.41. Analysis.

Comparison 12 Subanalysis: outcomes by menopausal status, Outcome 41 Lower body strength (follow‐up values).
12.42. Analysis.
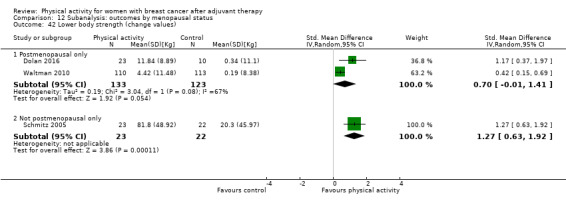
Comparison 12 Subanalysis: outcomes by menopausal status, Outcome 42 Lower body strength (change values).
12.43. Analysis.

Comparison 12 Subanalysis: outcomes by menopausal status, Outcome 43 Upper body strength (follow‐up values).
12.44. Analysis.

Comparison 12 Subanalysis: outcomes by menopausal status, Outcome 44 Upper body strength (change values).
12.45. Analysis.

Comparison 12 Subanalysis: outcomes by menopausal status, Outcome 45 Bone mineral density ‐ femoral neck (follow‐up and change values).
12.46. Analysis.
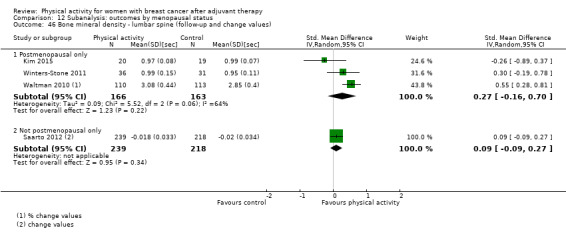
Comparison 12 Subanalysis: outcomes by menopausal status, Outcome 46 Bone mineral density ‐ lumbar spine (follow‐up and change values).
Comparison 13. Subanalysis: outcomes by mode of physical activity intervention.
| Outcome or subgroup title | No. of studies | No. of participants | Statistical method | Effect size |
|---|---|---|---|---|
| 1 Overall HRQoL (follow‐up values) | 22 | Std. Mean Difference (IV, Random, 95% CI) | Subtotals only | |
| 1.1 Aerobic exercise interventions | 12 | 971 | Std. Mean Difference (IV, Random, 95% CI) | 0.41 [0.19, 0.63] |
| 1.2 Resistance exercise interventions | 1 | 79 | Std. Mean Difference (IV, Random, 95% CI) | 0.35 [‐0.09, 0.79] |
| 1.3 Combined aerobic and resistance exercise | 7 | 589 | Std. Mean Difference (IV, Random, 95% CI) | 0.63 [0.08, 1.19] |
| 1.4 Yoga, Tai Chi, and Pilates interventions | 3 | 184 | Std. Mean Difference (IV, Random, 95% CI) | 0.11 [‐0.22, 0.45] |
| 2 Overall HRQoL (change values) | 14 | Std. Mean Difference (IV, Random, 95% CI) | Subtotals only | |
| 2.1 Aerobic exercise interventions | 9 | 1280 | Std. Mean Difference (IV, Random, 95% CI) | 0.68 [0.22, 1.15] |
| 2.2 Resistance exercise interventions | 1 | 79 | Std. Mean Difference (IV, Random, 95% CI) | 0.40 [‐0.05, 0.84] |
| 2.3 Combined aerobic and resistance exercise | 4 | 139 | Std. Mean Difference (IV, Random, 95% CI) | 0.69 [0.01, 1.38] |
| 2.4 Yoga, Tai Chi, and Pilates interventions | 1 | 21 | Std. Mean Difference (IV, Random, 95% CI) | 2.88 [1.59, 4.17] |
| 3 Overall emotional function/mental health (follow‐up values) | 26 | Std. Mean Difference (IV, Random, 95% CI) | Subtotals only | |
| 3.1 Aerobic exercise interventions | 14 | 1415 | Std. Mean Difference (IV, Random, 95% CI) | 0.15 [0.04, 0.25] |
| 3.2 Resistance exercise interventions | 2 | 311 | Std. Mean Difference (IV, Random, 95% CI) | 0.08 [‐0.28, 0.44] |
| 3.3 Combined aerobic and resistance exercise | 6 | 263 | Std. Mean Difference (IV, Random, 95% CI) | 0.72 [0.47, 0.97] |
| 3.4 Yoga, Tai Chi, and Pilates interventions | 4 | 113 | Std. Mean Difference (IV, Random, 95% CI) | ‐0.03 [‐0.40, 0.34] |
| 4 Overall emotional function/mental health (change values) | 15 | Std. Mean Difference (IV, Random, 95% CI) | Subtotals only | |
| 4.1 Aerobic exercise | 7 | 701 | Std. Mean Difference (IV, Random, 95% CI) | 0.44 [0.06, 0.82] |
| 4.2 Resistance exercise | 3 | 261 | Std. Mean Difference (IV, Random, 95% CI) | 0.22 [‐0.09, 0.54] |
| 4.3 Combined aerobic and resistance exercise | 4 | 598 | Std. Mean Difference (IV, Random, 95% CI) | ‐0.01 [‐0.38, 0.36] |
| 4.4 Yoga, Tai Chi, and Pilates | 1 | 19 | Std. Mean Difference (IV, Random, 95% CI) | 1.06 [0.08, 2.03] |
| 5 Overall physical function (follow‐up values) | 25 | Std. Mean Difference (IV, Random, 95% CI) | Subtotals only | |
| 5.1 Aerobic exercise | 14 | 1465 | Std. Mean Difference (IV, Random, 95% CI) | 0.28 [0.15, 0.41] |
| 5.2 Resistance exercise | 3 | 372 | Std. Mean Difference (IV, Random, 95% CI) | 0.23 [‐0.11, 0.57] |
| 5.3 Combined aerobic and resistance exercise | 5 | 202 | Std. Mean Difference (IV, Random, 95% CI) | 0.80 [‐0.04, 1.64] |
| 5.4 Yoga, Tai Chi, and Pilates | 3 | 90 | Std. Mean Difference (IV, Random, 95% CI) | 0.16 [‐0.26, 0.57] |
| 6 Overall physical function (change values) | 13 | Std. Mean Difference (IV, Random, 95% CI) | Subtotals only | |
| 6.1 Aerobic exercise | 7 | 1116 | Std. Mean Difference (IV, Random, 95% CI) | 0.72 [0.14, 1.30] |
| 6.2 Resistance exercise | 3 | 261 | Std. Mean Difference (IV, Random, 95% CI) | 0.24 [‐0.17, 0.65] |
| 6.3 Combined aerobic and resistance exercise | 2 | 37 | Std. Mean Difference (IV, Random, 95% CI) | 0.75 [‐0.22, 1.73] |
| 6.4 Yoga, Tai Chi, and Pilates | 1 | 19 | Std. Mean Difference (IV, Random, 95% CI) | 0.93 [‐0.03, 1.89] |
| 7 Overall role function (follow‐up values) | 18 | Std. Mean Difference (IV, Random, 95% CI) | Subtotals only | |
| 7.1 Aerobic exercise | 10 | 1043 | Std. Mean Difference (IV, Random, 95% CI) | 0.28 [0.12, 0.44] |
| 7.2 Resistance exercise | 1 | 79 | Std. Mean Difference (IV, Random, 95% CI) | 0.12 [‐0.32, 0.57] |
| 7.3 Combined aerobic and resistance exercise | 3 | 136 | Std. Mean Difference (IV, Random, 95% CI) | 0.61 [‐1.15, 2.37] |
| 7.4 Yoga, Tai Chi, and Pilates | 4 | 112 | Std. Mean Difference (IV, Random, 95% CI) | 0.11 [‐0.26, 0.48] |
| 8 Overall role function (change values) | 12 | Std. Mean Difference (IV, Random, 95% CI) | Subtotals only | |
| 8.1 Aerobic exercise | 7 | 1118 | Std. Mean Difference (IV, Random, 95% CI) | 0.16 [‐0.10, 0.43] |
| 8.2 Resistance exercise | 2 | 141 | Std. Mean Difference (IV, Random, 95% CI) | 0.17 [‐0.32, 0.65] |
| 8.3 Combined aerobic and resistance exercise | 2 | 37 | Std. Mean Difference (IV, Random, 95% CI) | 0.12 [‐0.52, 0.77] |
| 8.4 Yoga, Tai Chi, and Pilates | 1 | 19 | Std. Mean Difference (IV, Random, 95% CI) | ‐0.15 [‐1.05, 0.76] |
| 9 Overall social well‐being/function (follow‐up values) | 18 | Std. Mean Difference (IV, Random, 95% CI) | Subtotals only | |
| 9.1 Aerobic exercise | 10 | 1044 | Std. Mean Difference (IV, Random, 95% CI) | 0.18 [0.04, 0.31] |
| 9.2 Resistance exercise | 1 | 121 | Std. Mean Difference (IV, Random, 95% CI) | 0.14 [‐0.21, 0.50] |
| 9.3 Combined aerobic and resistance exercise | 3 | 116 | Std. Mean Difference (IV, Random, 95% CI) | 0.45 [‐0.16, 1.05] |
| 9.4 Yoga, Tai Chi, and Pilates | 4 | 276 | Std. Mean Difference (IV, Random, 95% CI) | 0.10 [‐0.13, 0.34] |
| 10 Overall social well‐being/function (change values) | 12 | Std. Mean Difference (IV, Random, 95% CI) | Subtotals only | |
| 10.1 Aerobic exercise | 7 | 1119 | Std. Mean Difference (IV, Random, 95% CI) | 0.60 [0.07, 1.13] |
| 10.2 Resistance exercise | 2 | 183 | Std. Mean Difference (IV, Random, 95% CI) | 0.11 [‐0.19, 0.41] |
| 10.3 Combined aerobic and resistance exercise | 2 | 63 | Std. Mean Difference (IV, Random, 95% CI) | 0.66 [0.15, 1.17] |
| 10.4 Yoga, Tai Chi, and Pilates | 1 | 19 | Std. Mean Difference (IV, Random, 95% CI) | 0.76 [‐0.18, 1.70] |
| 11 Overall cognitive function (follow‐up values) | 5 | Std. Mean Difference (IV, Random, 95% CI) | Subtotals only | |
| 11.1 Aerobic exercise | 2 | 94 | Std. Mean Difference (IV, Random, 95% CI) | 0.24 [‐0.17, 0.65] |
| 11.2 Resistance exercise | 0 | 0 | Std. Mean Difference (IV, Random, 95% CI) | 0.0 [0.0, 0.0] |
| 11.3 Combined aerobic and resistance exercise | 3 | 95 | Std. Mean Difference (IV, Random, 95% CI) | 0.57 [0.15, 0.98] |
| 11.4 Yoga, Tai Chi, and Pilates | 0 | 0 | Std. Mean Difference (IV, Random, 95% CI) | 0.0 [0.0, 0.0] |
| 12 Overall cognitive function (change values) | 5 | Std. Mean Difference (IV, Random, 95% CI) | Subtotals only | |
| 12.1 Aerobic exercise | 2 | 95 | Std. Mean Difference (IV, Random, 95% CI) | 0.08 [‐0.50, 0.65] |
| 12.2 Resistance exercise | 0 | 0 | Std. Mean Difference (IV, Random, 95% CI) | 0.0 [0.0, 0.0] |
| 12.3 Combined aerobic and resistance exercise | 3 | 577 | Std. Mean Difference (IV, Random, 95% CI) | ‐0.01 [‐0.38, 0.35] |
| 12.4 Yoga, Tai Chi, and Pilates | 0 | 0 | Std. Mean Difference (IV, Random, 95% CI) | 0.0 [0.0, 0.0] |
| 13 Overall general health (follow‐up values) | 10 | Std. Mean Difference (IV, Random, 95% CI) | Subtotals only | |
| 13.1 Aerobic exercise | 6 | 293 | Std. Mean Difference (IV, Random, 95% CI) | 0.11 [‐0.29, 0.51] |
| 13.2 Resistance exercise | 1 | 79 | Std. Mean Difference (IV, Random, 95% CI) | 0.10 [‐0.34, 0.55] |
| 13.3 Combined aerobic and resistance exercise | 3 | 118 | Std. Mean Difference (IV, Random, 95% CI) | 0.46 [0.00, 0.91] |
| 13.4 Yoga, Tai Chi, and Pilates | 1 | 18 | Std. Mean Difference (IV, Random, 95% CI) | ‐0.18 [‐1.11, 0.74] |
| 14 Overall general health (change values) | 9 | Std. Mean Difference (IV, Fixed, 95% CI) | Subtotals only | |
| 14.1 Aerobic exercise | 5 | 710 | Std. Mean Difference (IV, Fixed, 95% CI) | ‐0.02 [‐0.17, 0.13] |
| 14.2 Resistance exercise | 2 | 141 | Std. Mean Difference (IV, Fixed, 95% CI) | 0.23 [‐0.12, 0.57] |
| 14.3 Combined aerobic and resistance exercise | 2 | 76 | Std. Mean Difference (IV, Fixed, 95% CI) | 0.66 [0.17, 1.16] |
| 14.4 Yoga, Tai Chi, and Pilates | 1 | 19 | Std. Mean Difference (IV, Fixed, 95% CI) | ‐0.20 [‐1.10, 0.71] |
| 15 Overall sexual function (follow‐up values) | 5 | Std. Mean Difference (IV, Fixed, 95% CI) | Subtotals only | |
| 15.1 Aerobic exercise | 2 | 136 | Std. Mean Difference (IV, Fixed, 95% CI) | ‐0.00 [‐0.34, 0.34] |
| 15.2 Resistance exercise | 2 | 193 | Std. Mean Difference (IV, Fixed, 95% CI) | 0.21 [‐0.07, 0.49] |
| 15.3 Combined aerobic and resistance exercise | 1 | 82 | Std. Mean Difference (IV, Fixed, 95% CI) | 0.29 [‐0.14, 0.73] |
| 15.4 Yoga, Tai Chi, and Pilates | 0 | 0 | Std. Mean Difference (IV, Fixed, 95% CI) | 0.0 [0.0, 0.0] |
| 16 Overall sexual function (change values) | 3 | Mean Difference (IV, Random, 95% CI) | Subtotals only | |
| 16.1 Aerobic exercise | 1 | 500 | Mean Difference (IV, Random, 95% CI) | 0.5 [‐3.86, 4.86] |
| 16.2 Resistance exercise | 2 | 193 | Mean Difference (IV, Random, 95% CI) | 3.83 [‐1.83, 9.48] |
| 16.3 Combined aerobic and resistance exercise | 0 | 0 | Mean Difference (IV, Random, 95% CI) | 0.0 [0.0, 0.0] |
| 16.4 Yoga, Tai Chi, and Pilates | 0 | 0 | Mean Difference (IV, Random, 95% CI) | 0.0 [0.0, 0.0] |
| 17 Overall sleep (follow‐up values) | 5 | Std. Mean Difference (IV, Fixed, 95% CI) | Subtotals only | |
| 17.1 Aerobic exercise | 2 | 95 | Std. Mean Difference (IV, Fixed, 95% CI) | ‐0.18 [‐0.59, 0.23] |
| 17.2 Resistance exercise | 0 | 0 | Std. Mean Difference (IV, Fixed, 95% CI) | 0.0 [0.0, 0.0] |
| 17.3 Combined aerobic and resistance exercise | 2 | 62 | Std. Mean Difference (IV, Fixed, 95% CI) | ‐0.07 [‐0.57, 0.43] |
| 17.4 Yoga, Tai Chi, and Pilates | 1 | 31 | Std. Mean Difference (IV, Fixed, 95% CI) | 0.15 [‐0.55, 0.86] |
| 18 Overall sleep (change values) | 3 | Std. Mean Difference (IV, Random, 95% CI) | Subtotals only | |
| 18.1 Aerobic exercise | 2 | 94 | Std. Mean Difference (IV, Random, 95% CI) | 0.10 [‐0.30, 0.51] |
| 18.2 Resistance exercise | 0 | 0 | Std. Mean Difference (IV, Random, 95% CI) | 0.0 [0.0, 0.0] |
| 18.3 Combined aerobic and resistance exercise | 1 | 42 | Std. Mean Difference (IV, Random, 95% CI) | 0.23 [‐0.38, 0.84] |
| 18.4 Yoga, Tai Chi, and Pilates | 0 | 0 | Std. Mean Difference (IV, Random, 95% CI) | 0.0 [0.0, 0.0] |
| 19 Overall anxiety (follow‐up values) | 7 | Std. Mean Difference (IV, Random, 95% CI) | Subtotals only | |
| 19.1 Aerobic exercise | 4 | 205 | Std. Mean Difference (IV, Random, 95% CI) | ‐0.76 [‐1.37, ‐0.14] |
| 19.2 Resistance exercise | 0 | 0 | Std. Mean Difference (IV, Random, 95% CI) | 0.0 [0.0, 0.0] |
| 19.3 Combined aerobic and resistance exercise | 3 | 121 | Std. Mean Difference (IV, Random, 95% CI) | ‐0.40 [‐0.87, 0.07] |
| 19.4 Yoga, Tai Chi, and Pilates | 0 | 0 | Std. Mean Difference (IV, Random, 95% CI) | 0.0 [0.0, 0.0] |
| 20 Overall anxiety (change values) | 4 | Std. Mean Difference (IV, Fixed, 95% CI) | Subtotals only | |
| 20.1 Aerobic exercise | 2 | 132 | Std. Mean Difference (IV, Fixed, 95% CI) | ‐0.27 [‐0.61, 0.07] |
| 20.2 Resistance exercise | 0 | 0 | Std. Mean Difference (IV, Fixed, 95% CI) | 0.0 [0.0, 0.0] |
| 20.3 Combined aerobic and resistance exercise | 2 | 103 | Std. Mean Difference (IV, Fixed, 95% CI) | ‐0.51 [‐0.90, ‐0.12] |
| 20.4 Yoga, Tai Chi, and Pilates | 0 | 0 | Std. Mean Difference (IV, Fixed, 95% CI) | 0.0 [0.0, 0.0] |
| 21 Overall depression (follow‐up values) | 12 | Std. Mean Difference (IV, Random, 95% CI) | Subtotals only | |
| 21.1 Aerobic exercise | 6 | 273 | Std. Mean Difference (IV, Random, 95% CI) | ‐0.32 [‐0.78, 0.14] |
| 21.2 Resistance exercise | 0 | 0 | Std. Mean Difference (IV, Random, 95% CI) | 0.0 [0.0, 0.0] |
| 21.3 Combined aerobic and resistance exercise | 5 | 187 | Std. Mean Difference (IV, Random, 95% CI) | ‐0.33 [‐0.90, 0.24] |
| 21.4 Yoga, Tai Chi, and Pilates | 2 | 217 | Std. Mean Difference (IV, Random, 95% CI) | ‐0.23 [‐0.61, 0.14] |
| 22 Overall depression (change values) | 7 | Std. Mean Difference (IV, Random, 95% CI) | Subtotals only | |
| 22.1 Aerobic exercise | 4 | 672 | Std. Mean Difference (IV, Random, 95% CI) | ‐0.18 [‐0.48, 0.11] |
| 22.2 Resistance exercise | 0 | 0 | Std. Mean Difference (IV, Random, 95% CI) | 0.0 [0.0, 0.0] |
| 22.3 Combined aerobic and resistance exercise | 4 | 164 | Std. Mean Difference (IV, Random, 95% CI) | ‐0.47 [‐0.92, ‐0.02] |
| 22.4 Yoga, Tai Chi, and Pilates | 0 | 0 | Std. Mean Difference (IV, Random, 95% CI) | 0.0 [0.0, 0.0] |
| 23 Overall fatigue (follow‐up values) | 25 | Std. Mean Difference (IV, Random, 95% CI) | Subtotals only | |
| 23.1 Aerobic exercise | 11 | 925 | Std. Mean Difference (IV, Random, 95% CI) | ‐0.24 [‐0.41, ‐0.07] |
| 23.2 Resistance exercise | 1 | 67 | Std. Mean Difference (IV, Random, 95% CI) | 0.23 [‐0.25, 0.72] |
| 23.3 Combined aerobic and resistance exercise | 9 | 642 | Std. Mean Difference (IV, Random, 95% CI) | ‐0.48 [‐0.83, ‐0.13] |
| 23.4 Yoga, Tai Chi, and Pilates | 5 | 311 | Std. Mean Difference (IV, Random, 95% CI) | ‐0.36 [‐0.58, ‐0.13] |
| 24 Overall fatigue (change values) | 12 | Std. Mean Difference (IV, Random, 95% CI) | Subtotals only | |
| 24.1 Aerobic exercise | 7 | 1130 | Std. Mean Difference (IV, Random, 95% CI) | ‐0.08 [‐0.38, 0.23] |
| 24.2 Resistance exercise | 0 | 0 | Std. Mean Difference (IV, Random, 95% CI) | 0.0 [0.0, 0.0] |
| 24.3 Combined aerobic and resistance exercise | 4 | 118 | Std. Mean Difference (IV, Random, 95% CI) | ‐0.81 [‐1.57, ‐0.05] |
| 24.4 Yoga, Tai Chi, and Pilates | 1 | 23 | Std. Mean Difference (IV, Random, 95% CI) | ‐0.07 [‐0.89, 0.75] |
| 25 Overall pain/disability (follow‐up values) | 9 | Std. Mean Difference (IV, Random, 95% CI) | Subtotals only | |
| 25.1 Aerobic exercise | 5 | 397 | Std. Mean Difference (IV, Random, 95% CI) | 0.11 [‐0.15, 0.37] |
| 25.2 Resistance exercise | 0 | 0 | Std. Mean Difference (IV, Random, 95% CI) | 0.0 [0.0, 0.0] |
| 25.3 Combined aerobic and resistance exercise | 2 | 96 | Std. Mean Difference (IV, Random, 95% CI) | 0.13 [‐0.29, 0.54] |
| 25.4 Yoga, Tai Chi, and Pilates | 2 | 42 | Std. Mean Difference (IV, Random, 95% CI) | ‐0.18 [‐0.78, 0.43] |
| 26 Overall pain/disability (change values) | 5 | Std. Mean Difference (IV, Random, 95% CI) | Subtotals only | |
| 26.1 Aerobic exercise | 2 | 132 | Std. Mean Difference (IV, Random, 95% CI) | ‐0.03 [‐0.44, 0.39] |
| 26.2 Resistance exercise | 1 | 62 | Std. Mean Difference (IV, Random, 95% CI) | 0.22 [‐0.33, 0.76] |
| 26.3 Combined aerobic and resistance exercise | 1 | 83 | Std. Mean Difference (IV, Random, 95% CI) | ‐0.35 [‐0.79, 0.08] |
| 26.4 Yoga, Tai Chi, and Pilates | 1 | 19 | Std. Mean Difference (IV, Random, 95% CI) | ‐0.15 [‐1.06, 0.75] |
| 27 Overall self‐esteem/body image (follow‐up values) | 12 | Std. Mean Difference (IV, Random, 95% CI) | Subtotals only | |
| 27.1 Aerobic exercise | 7 | 364 | Std. Mean Difference (IV, Random, 95% CI) | 0.29 [‐0.07, 0.64] |
| 27.2 Resistance exercise | 2 | 143 | Std. Mean Difference (IV, Random, 95% CI) | 0.06 [‐0.27, 0.39] |
| 27.3 Combined aerobic and resistance exercise | 4 | 161 | Std. Mean Difference (IV, Random, 95% CI) | 0.14 [‐0.46, 0.74] |
| 27.4 Yoga, Tai Chi, and Pilates | 1 | 23 | Std. Mean Difference (IV, Random, 95% CI) | 0.20 [‐0.62, 1.02] |
| 28 Overall self‐esteem/body image (change values) | 9 | Std. Mean Difference (IV, Random, 95% CI) | Subtotals only | |
| 28.1 Aerobic exercise | 6 | 771 | Std. Mean Difference (IV, Random, 95% CI) | 0.14 [‐0.12, 0.39] |
| 28.2 Resistance exercise | 2 | 143 | Std. Mean Difference (IV, Random, 95% CI) | ‐0.29 [‐0.88, 0.30] |
| 28.3 Combined aerobic and resistance exercise | 2 | 81 | Std. Mean Difference (IV, Random, 95% CI) | 0.10 [‐0.54, 0.75] |
| 28.4 Yoga, Tai Chi, and Pilates | 1 | 21 | Std. Mean Difference (IV, Random, 95% CI) | 3.42 [1.99, 4.86] |
| 29 Overall cardiorespiratory fitness (follow‐up values) | 23 | Std. Mean Difference (IV, Random, 95% CI) | Subtotals only | |
| 29.1 Aerobic exercise | 12 | 814 | Std. Mean Difference (IV, Random, 95% CI) | 0.37 [0.21, 0.54] |
| 29.2 Resistance exercise | 1 | 21 | Std. Mean Difference (IV, Random, 95% CI) | 0.27 [‐0.60, 1.14] |
| 29.3 Combined aerobic and resistance exercise | 11 | 433 | Std. Mean Difference (IV, Random, 95% CI) | 0.56 [0.30, 0.81] |
| 29.4 Yoga, Tai Chi, and Pilates | 1 | 21 | Std. Mean Difference (IV, Random, 95% CI) | 0.39 [‐0.48, 1.25] |
| 30 Overall cardiorespiratory fitness (change values) | 9 | Std. Mean Difference (IV, Random, 95% CI) | Subtotals only | |
| 30.1 Aerobic exercise | 5 | 685 | Std. Mean Difference (IV, Random, 95% CI) | 0.79 [0.17, 1.42] |
| 30.2 Resistance exercise | 1 | 21 | Std. Mean Difference (IV, Random, 95% CI) | ‐0.04 [‐0.91, 0.82] |
| 30.3 Combined aerobic and resistance exercise | 5 | 181 | Std. Mean Difference (IV, Random, 95% CI) | 0.75 [0.18, 1.31] |
| 30.4 Yoga, Tai Chi, and Pilates | 0 | 0 | Std. Mean Difference (IV, Random, 95% CI) | 0.0 [0.0, 0.0] |
| 31 Overall self‐reported physical activity (follow‐up values) | 17 | Std. Mean Difference (IV, Random, 95% CI) | Subtotals only | |
| 31.1 Aerobic exercise | 10 | 1011 | Std. Mean Difference (IV, Random, 95% CI) | 0.69 [0.44, 0.94] |
| 31.2 Resistance exercise | 2 | 331 | Std. Mean Difference (IV, Random, 95% CI) | 0.08 [‐0.13, 0.30] |
| 31.3 Combined aerobic and resistance exercise | 3 | 421 | Std. Mean Difference (IV, Random, 95% CI) | 0.53 [‐0.05, 1.10] |
| 31.4 Yoga, Tai Chi, and Pilates | 2 | 249 | Std. Mean Difference (IV, Random, 95% CI) | 0.33 [0.08, 0.58] |
| 32 Overall self‐reported physical activity (change values) | 8 | Std. Mean Difference (IV, Random, 95% CI) | Subtotals only | |
| 32.1 Aerobic exercise | 6 | 1086 | Std. Mean Difference (IV, Random, 95% CI) | 0.59 [0.20, 0.97] |
| 32.2 Resistance exercise | 1 | 105 | Std. Mean Difference (IV, Random, 95% CI) | 0.21 [‐0.17, 0.60] |
| 32.3 Combined aerobic and resistance exercise | 1 | 83 | Std. Mean Difference (IV, Random, 95% CI) | 0.94 [0.48, 1.40] |
| 32.4 Yoga, Tai Chi, and Pilates | 0 | 0 | Std. Mean Difference (IV, Random, 95% CI) | 0.0 [0.0, 0.0] |
| 33 Overall objective physical activity (follow‐up values) | 11 | Std. Mean Difference (IV, Random, 95% CI) | Subtotals only | |
| 33.1 Aerobic exercise | 8 | 876 | Std. Mean Difference (IV, Random, 95% CI) | 0.43 [0.15, 0.70] |
| 33.2 Resistance exercise | 0 | 0 | Std. Mean Difference (IV, Random, 95% CI) | 0.0 [0.0, 0.0] |
| 33.3 Combined aerobic and resistance exercise | 3 | 394 | Std. Mean Difference (IV, Random, 95% CI) | 0.54 [‐0.31, 1.40] |
| 33.4 Yoga, Tai Chi, and Pilates | 0 | 0 | Std. Mean Difference (IV, Random, 95% CI) | 0.0 [0.0, 0.0] |
| 34 Overall objective physical activity (change values) | 5 | Std. Mean Difference (IV, Random, 95% CI) | Subtotals only | |
| 34.1 Aerobic exercise | 4 | 466 | Std. Mean Difference (IV, Random, 95% CI) | 0.61 [‐0.01, 1.23] |
| 34.2 Resistance exercise | 0 | 0 | Std. Mean Difference (IV, Random, 95% CI) | 0.0 [0.0, 0.0] |
| 34.3 Combined aerobic and resistance exercise | 1 | 42 | Std. Mean Difference (IV, Random, 95% CI) | 1.13 [0.47, 1.78] |
| 34.4 Yoga, Tai Chi, and Pilates | 0 | 0 | Std. Mean Difference (IV, Random, 95% CI) | 0.0 [0.0, 0.0] |
| 35 Mass (follow‐up values) | 16 | Mean Difference (IV, Fixed, 95% CI) | Subtotals only | |
| 35.1 Aerobic exercise | 7 | 411 | Mean Difference (IV, Fixed, 95% CI) | ‐1.29 [‐4.06, 1.47] |
| 35.2 Resistance exercise | 3 | 410 | Mean Difference (IV, Fixed, 95% CI) | 0.26 [‐0.67, 1.20] |
| 35.3 Combined aerobic and resistance exercise | 3 | 127 | Mean Difference (IV, Fixed, 95% CI) | ‐2.46 [‐7.24, 2.33] |
| 35.4 Yoga, Tai Chi, and Pilates | 3 | 262 | Mean Difference (IV, Fixed, 95% CI) | ‐0.01 [‐0.78, 0.76] |
| 36 Mass (change values) | 11 | Mean Difference (IV, Random, 95% CI) | Subtotals only | |
| 36.1 Aerobic exercise | 5 | 679 | Mean Difference (IV, Random, 95% CI) | ‐0.74 [‐1.58, 0.09] |
| 36.2 Resistance exercise | 2 | 209 | Mean Difference (IV, Random, 95% CI) | 0.10 [‐0.15, 0.34] |
| 36.3 Combined aerobic and resistance exercise | 3 | 140 | Mean Difference (IV, Random, 95% CI) | ‐0.55 [‐1.99, 0.90] |
| 36.4 Yoga, Tai Chi, and Pilates | 1 | 19 | Mean Difference (IV, Random, 95% CI) | ‐0.90 [‐2.40, 0.60] |
| 37 BMI (follow‐up values) | 17 | Mean Difference (IV, Fixed, 95% CI) | Subtotals only | |
| 37.1 Aerobic exercise | 6 | 639 | Mean Difference (IV, Fixed, 95% CI) | ‐0.41 [‐1.26, 0.43] |
| 37.2 Resistance exercise | 2 | 343 | Mean Difference (IV, Fixed, 95% CI) | 0.17 [‐0.15, 0.48] |
| 37.3 Combined aerobic and resistance exercise | 6 | 237 | Mean Difference (IV, Fixed, 95% CI) | ‐1.03 [‐2.63, 0.56] |
| 37.4 Yoga, Tai Chi, and Pilates | 3 | 262 | Mean Difference (IV, Fixed, 95% CI) | ‐0.03 [‐0.32, 0.26] |
| 38 BMI (change values) | 8 | Mean Difference (IV, Random, 95% CI) | Subtotals only | |
| 38.1 Aerobic exercise | 2 | 112 | Mean Difference (IV, Random, 95% CI) | ‐0.48 [‐0.84, ‐0.13] |
| 38.2 Resistance exercise | 2 | 209 | Mean Difference (IV, Random, 95% CI) | ‐0.01 [‐0.08, 0.06] |
| 38.3 Combined aerobic and resistance exercise | 3 | 145 | Mean Difference (IV, Random, 95% CI) | ‐0.02 [‐0.28, 0.24] |
| 38.4 Yoga, Tai Chi, and Pilates | 1 | 19 | Mean Difference (IV, Random, 95% CI) | ‐0.71 [‐1.33, ‐0.09] |
| 39 Overall body fat (follow‐up values) | 18 | Std. Mean Difference (IV, Random, 95% CI) | Subtotals only | |
| 39.1 Aerobic exercise | 10 | 551 | Std. Mean Difference (IV, Random, 95% CI) | ‐0.11 [‐0.28, 0.06] |
| 39.2 Resistance exercise | 4 | 429 | Std. Mean Difference (IV, Random, 95% CI) | ‐0.26 [‐0.81, 0.28] |
| 39.3 Combined aerobic and resistance exercise | 5 | 185 | Std. Mean Difference (IV, Random, 95% CI) | ‐0.13 [‐0.42, 0.16] |
| 39.4 Yoga, Tai Chi, and Pilates | 1 | 21 | Std. Mean Difference (IV, Random, 95% CI) | ‐0.66 [‐1.54, 0.23] |
| 40 Overall body fat (change values) | 9 | Std. Mean Difference (IV, Random, 95% CI) | Subtotals only | |
| 40.1 Aerobic exercise | 3 | 108 | Std. Mean Difference (IV, Random, 95% CI) | ‐0.43 [‐0.82, ‐0.05] |
| 40.2 Resistance exercise | 3 | 228 | Std. Mean Difference (IV, Random, 95% CI) | ‐1.38 [‐3.39, 0.63] |
| 40.3 Combined aerobic and resistance exercise | 4 | 168 | Std. Mean Difference (IV, Random, 95% CI) | ‐0.30 [‐0.61, 0.00] |
| 40.4 Yoga, Tai Chi, and Pilates | 1 | 19 | Std. Mean Difference (IV, Random, 95% CI) | ‐0.18 [‐1.09, 0.72] |
| 41 Lower body strength (follow‐up values) | 10 | Std. Mean Difference (IV, Random, 95% CI) | Subtotals only | |
| 41.1 Aerobic exercise | 3 | 125 | Std. Mean Difference (IV, Random, 95% CI) | 0.75 [‐0.20, 1.69] |
| 41.2 Resistance exercise | 3 | 344 | Std. Mean Difference (IV, Random, 95% CI) | 0.72 [0.22, 1.23] |
| 41.3 Combined aerobic and resistance exercise | 4 | 168 | Std. Mean Difference (IV, Random, 95% CI) | 0.05 [‐0.28, 0.38] |
| 41.4 Yoga, Tai Chi, and Pilates | 0 | 0 | Std. Mean Difference (IV, Random, 95% CI) | 0.0 [0.0, 0.0] |
| 42 Lower body strength (change values) | 8 | Std. Mean Difference (IV, Random, 95% CI) | Subtotals only | |
| 42.1 Aerobic exercise | 1 | 33 | Std. Mean Difference (IV, Random, 95% CI) | 1.17 [0.37, 1.97] |
| 42.2 Resistance exercise | 4 | 562 | Std. Mean Difference (IV, Random, 95% CI) | 0.85 [0.48, 1.22] |
| 42.3 Combined aerobic and resistance exercise | 3 | 125 | Std. Mean Difference (IV, Random, 95% CI) | 0.28 [‐0.37, 0.93] |
| 42.4 Yoga, Tai Chi, and Pilates | 0 | 0 | Std. Mean Difference (IV, Random, 95% CI) | 0.0 [0.0, 0.0] |
| 43 Upper body strength (follow‐up values) | 13 | Std. Mean Difference (IV, Random, 95% CI) | Subtotals only | |
| 43.1 Aerobic exercise | 5 | 175 | Std. Mean Difference (IV, Random, 95% CI) | 0.35 [0.05, 0.65] |
| 43.2 Resistance exercise | 4 | 365 | Std. Mean Difference (IV, Random, 95% CI) | 0.80 [0.28, 1.33] |
| 43.3 Combined aerobic and resistance exercise | 5 | 231 | Std. Mean Difference (IV, Random, 95% CI) | 0.25 [‐0.47, 0.97] |
| 43.4 Yoga, Tai Chi, and Pilates | 1 | 21 | Std. Mean Difference (IV, Random, 95% CI) | 0.60 [‐0.28, 1.49] |
| 44 Upper body strength (change values) | 8 | Std. Mean Difference (IV, Random, 95% CI) | Subtotals only | |
| 44.1 Aerobic exercise | 1 | 22 | Std. Mean Difference (IV, Random, 95% CI) | 0.36 [‐0.48, 1.21] |
| 44.2 Resistance exercise | 5 | 583 | Std. Mean Difference (IV, Random, 95% CI) | 0.96 [0.43, 1.49] |
| 44.3 Combined aerobic and resistance exercise | 3 | 168 | Std. Mean Difference (IV, Random, 95% CI) | 0.07 [‐0.34, 0.48] |
| 44.4 Yoga, Tai Chi, and Pilates | 1 | 83 | Std. Mean Difference (IV, Random, 95% CI) | 1.30 [0.82, 1.78] |
| 45 Bone mineral density ‐ femoral neck (follow‐up and change values) | 4 | Std. Mean Difference (IV, Random, 95% CI) | Subtotals only | |
| 45.1 Aerobic exercise | 1 | 457 | Std. Mean Difference (IV, Random, 95% CI) | 0.18 [‐0.00, 0.37] |
| 45.2 Resistance exercise | 2 | 290 | Std. Mean Difference (IV, Random, 95% CI) | 0.41 [‐0.09, 0.91] |
| 45.3 Combined aerobic and resistance exercise | 1 | 39 | Std. Mean Difference (IV, Random, 95% CI) | ‐0.37 [‐1.00, 0.27] |
| 45.4 Yoga, Tai Chi, and Pilates | 0 | 0 | Std. Mean Difference (IV, Random, 95% CI) | 0.0 [0.0, 0.0] |
| 46 Bone mineral density ‐ lumbar spine (follow‐up and change values) | 4 | Std. Mean Difference (IV, Random, 95% CI) | Subtotals only | |
| 46.1 Aerobic exercise | 1 | 457 | Std. Mean Difference (IV, Random, 95% CI) | 0.09 [‐0.09, 0.27] |
| 46.2 Resistance exercise | 2 | 290 | Std. Mean Difference (IV, Random, 95% CI) | 0.49 [0.25, 0.72] |
| 46.3 Combined aerobic and resistance exercise | 1 | 39 | Std. Mean Difference (IV, Random, 95% CI) | ‐0.26 [‐0.89, 0.37] |
| 46.4 Yoga, Tai Chi, and Pilates | 0 | 0 | Std. Mean Difference (IV, Random, 95% CI) | 0.0 [0.0, 0.0] |
| 47 Bone mineral density ‐ total hip (follow‐up and change values) | 3 | Std. Mean Difference (IV, Random, 95% CI) | Subtotals only | |
| 47.1 Aerobic exercise | 0 | 0 | Std. Mean Difference (IV, Random, 95% CI) | 0.0 [0.0, 0.0] |
| 47.2 Resistance exercise | 2 | 290 | Std. Mean Difference (IV, Random, 95% CI) | 0.64 [‐0.20, 1.48] |
| 47.3 Combined aerobic and resistance exercise | 1 | 39 | Std. Mean Difference (IV, Random, 95% CI) | 10.34 [7.84, 12.84] |
| 47.4 Yoga, Tai Chi, and Pilates | 0 | 0 | Std. Mean Difference (IV, Random, 95% CI) | 0.0 [0.0, 0.0] |
13.3. Analysis.
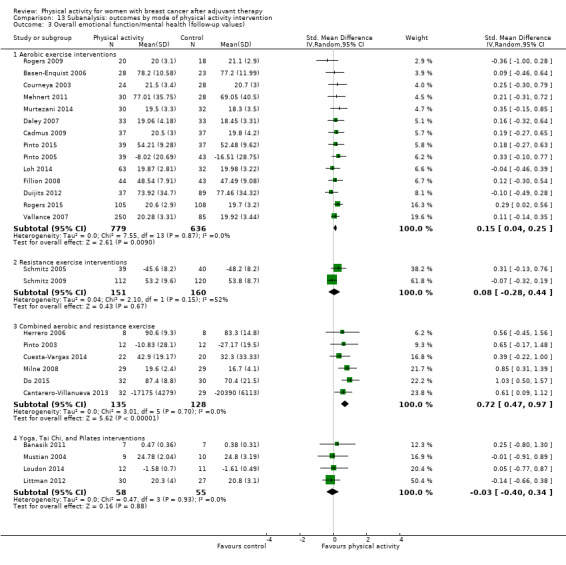
Comparison 13 Subanalysis: outcomes by mode of physical activity intervention, Outcome 3 Overall emotional function/mental health (follow‐up values).
13.4. Analysis.
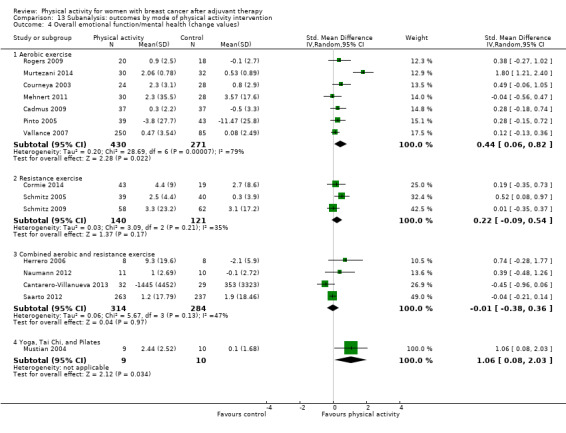
Comparison 13 Subanalysis: outcomes by mode of physical activity intervention, Outcome 4 Overall emotional function/mental health (change values).
13.5. Analysis.
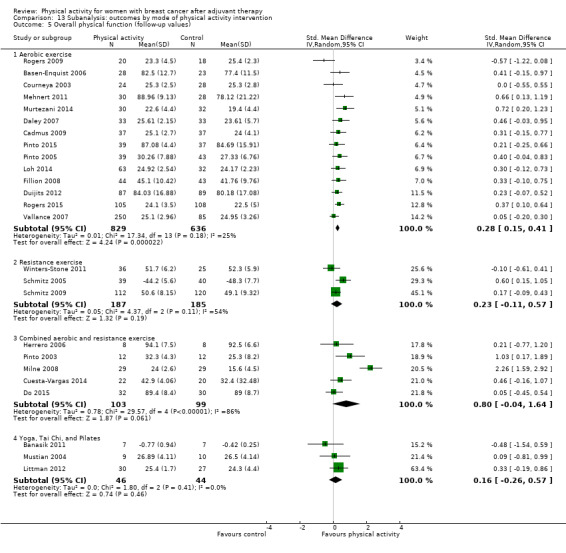
Comparison 13 Subanalysis: outcomes by mode of physical activity intervention, Outcome 5 Overall physical function (follow‐up values).
13.6. Analysis.
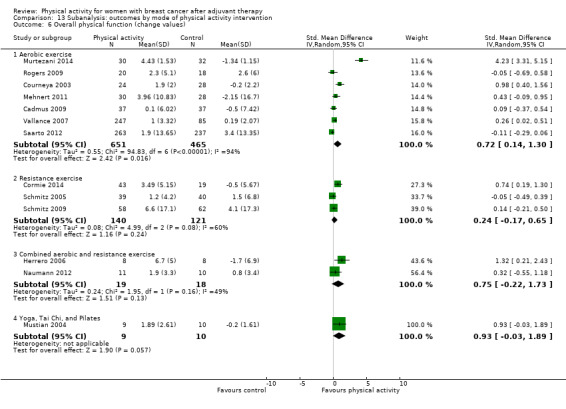
Comparison 13 Subanalysis: outcomes by mode of physical activity intervention, Outcome 6 Overall physical function (change values).
13.7. Analysis.
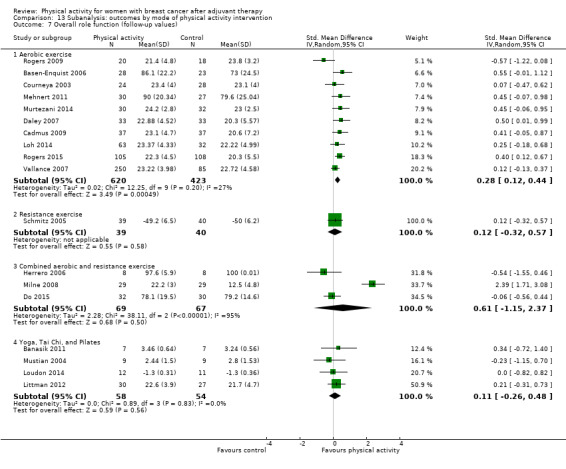
Comparison 13 Subanalysis: outcomes by mode of physical activity intervention, Outcome 7 Overall role function (follow‐up values).
13.8. Analysis.
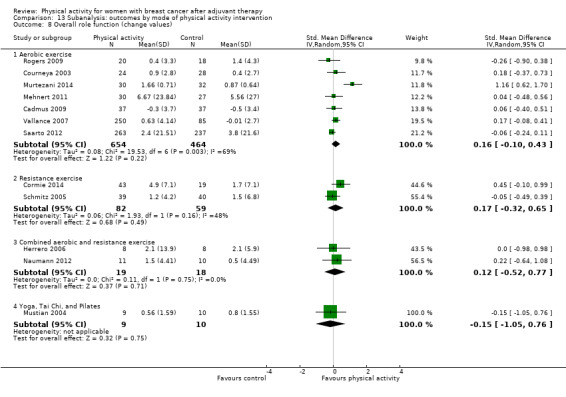
Comparison 13 Subanalysis: outcomes by mode of physical activity intervention, Outcome 8 Overall role function (change values).
13.9. Analysis.
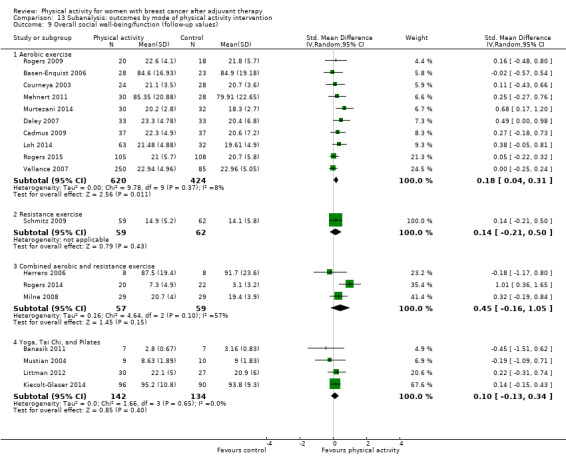
Comparison 13 Subanalysis: outcomes by mode of physical activity intervention, Outcome 9 Overall social well‐being/function (follow‐up values).
13.10. Analysis.
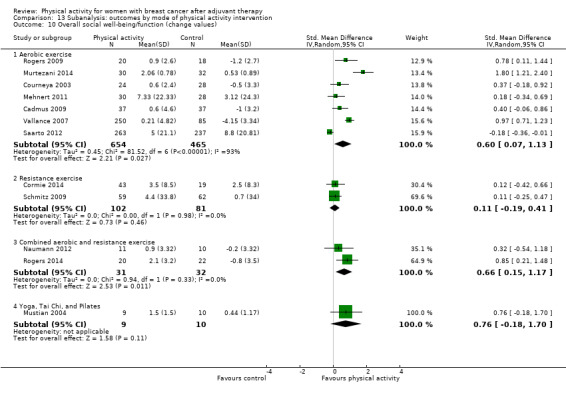
Comparison 13 Subanalysis: outcomes by mode of physical activity intervention, Outcome 10 Overall social well‐being/function (change values).
13.11. Analysis.

Comparison 13 Subanalysis: outcomes by mode of physical activity intervention, Outcome 11 Overall cognitive function (follow‐up values).
13.12. Analysis.
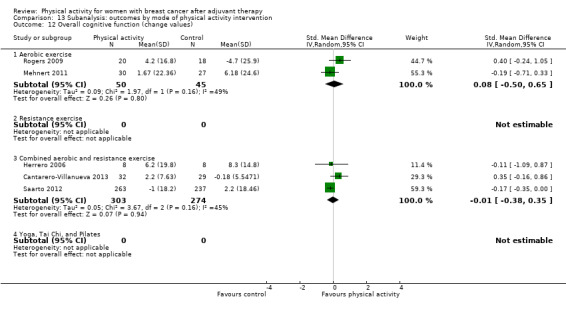
Comparison 13 Subanalysis: outcomes by mode of physical activity intervention, Outcome 12 Overall cognitive function (change values).
13.13. Analysis.

Comparison 13 Subanalysis: outcomes by mode of physical activity intervention, Outcome 13 Overall general health (follow‐up values).
13.14. Analysis.

Comparison 13 Subanalysis: outcomes by mode of physical activity intervention, Outcome 14 Overall general health (change values).
13.15. Analysis.
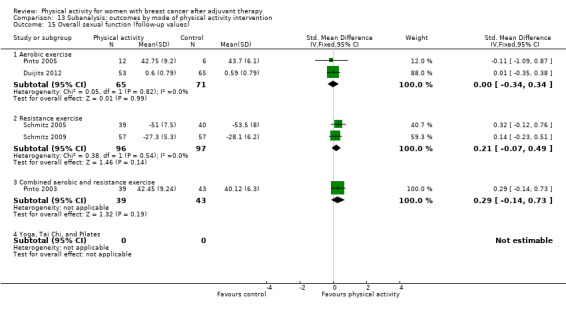
Comparison 13 Subanalysis: outcomes by mode of physical activity intervention, Outcome 15 Overall sexual function (follow‐up values).
13.16. Analysis.

Comparison 13 Subanalysis: outcomes by mode of physical activity intervention, Outcome 16 Overall sexual function (change values).
13.17. Analysis.
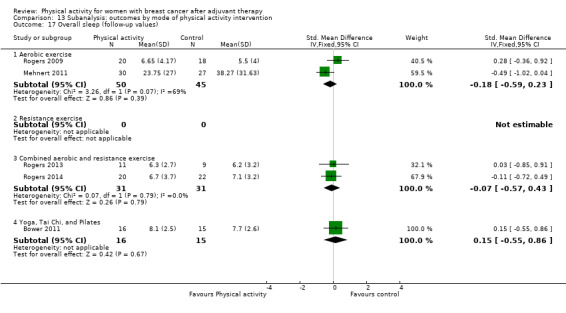
Comparison 13 Subanalysis: outcomes by mode of physical activity intervention, Outcome 17 Overall sleep (follow‐up values).
13.18. Analysis.

Comparison 13 Subanalysis: outcomes by mode of physical activity intervention, Outcome 18 Overall sleep (change values).
13.19. Analysis.

Comparison 13 Subanalysis: outcomes by mode of physical activity intervention, Outcome 19 Overall anxiety (follow‐up values).
13.20. Analysis.

Comparison 13 Subanalysis: outcomes by mode of physical activity intervention, Outcome 20 Overall anxiety (change values).
13.21. Analysis.

Comparison 13 Subanalysis: outcomes by mode of physical activity intervention, Outcome 21 Overall depression (follow‐up values).
13.22. Analysis.

Comparison 13 Subanalysis: outcomes by mode of physical activity intervention, Outcome 22 Overall depression (change values).
13.23. Analysis.

Comparison 13 Subanalysis: outcomes by mode of physical activity intervention, Outcome 23 Overall fatigue (follow‐up values).
13.24. Analysis.

Comparison 13 Subanalysis: outcomes by mode of physical activity intervention, Outcome 24 Overall fatigue (change values).
13.25. Analysis.

Comparison 13 Subanalysis: outcomes by mode of physical activity intervention, Outcome 25 Overall pain/disability (follow‐up values).
13.26. Analysis.
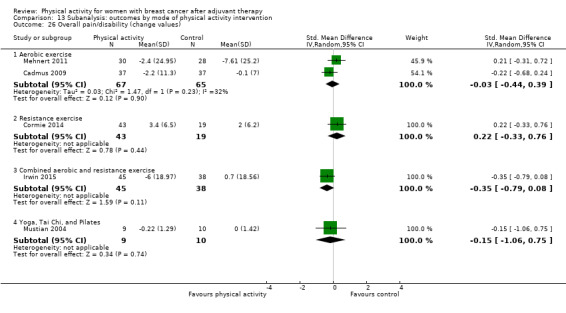
Comparison 13 Subanalysis: outcomes by mode of physical activity intervention, Outcome 26 Overall pain/disability (change values).
13.27. Analysis.
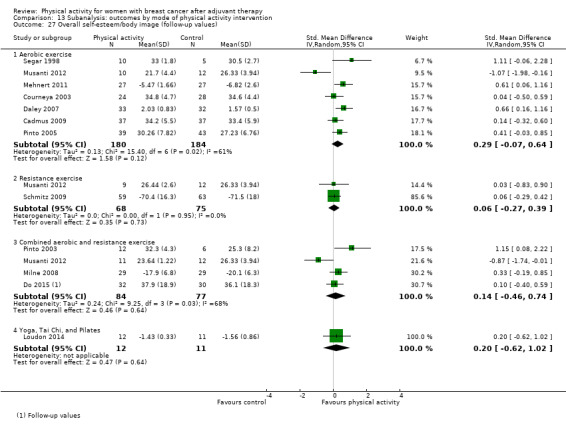
Comparison 13 Subanalysis: outcomes by mode of physical activity intervention, Outcome 27 Overall self‐esteem/body image (follow‐up values).
13.28. Analysis.

Comparison 13 Subanalysis: outcomes by mode of physical activity intervention, Outcome 28 Overall self‐esteem/body image (change values).
13.29. Analysis.

Comparison 13 Subanalysis: outcomes by mode of physical activity intervention, Outcome 29 Overall cardiorespiratory fitness (follow‐up values).
13.30. Analysis.
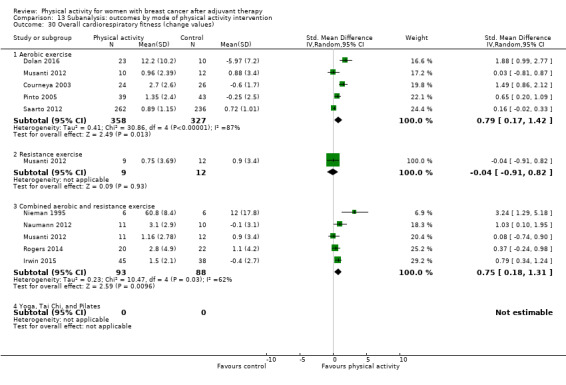
Comparison 13 Subanalysis: outcomes by mode of physical activity intervention, Outcome 30 Overall cardiorespiratory fitness (change values).
13.31. Analysis.

Comparison 13 Subanalysis: outcomes by mode of physical activity intervention, Outcome 31 Overall self‐reported physical activity (follow‐up values).
13.32. Analysis.

Comparison 13 Subanalysis: outcomes by mode of physical activity intervention, Outcome 32 Overall self‐reported physical activity (change values).
13.33. Analysis.

Comparison 13 Subanalysis: outcomes by mode of physical activity intervention, Outcome 33 Overall objective physical activity (follow‐up values).
13.34. Analysis.

Comparison 13 Subanalysis: outcomes by mode of physical activity intervention, Outcome 34 Overall objective physical activity (change values).
13.35. Analysis.

Comparison 13 Subanalysis: outcomes by mode of physical activity intervention, Outcome 35 Mass (follow‐up values).
13.36. Analysis.

Comparison 13 Subanalysis: outcomes by mode of physical activity intervention, Outcome 36 Mass (change values).
13.37. Analysis.

Comparison 13 Subanalysis: outcomes by mode of physical activity intervention, Outcome 37 BMI (follow‐up values).
13.38. Analysis.

Comparison 13 Subanalysis: outcomes by mode of physical activity intervention, Outcome 38 BMI (change values).
13.39. Analysis.

Comparison 13 Subanalysis: outcomes by mode of physical activity intervention, Outcome 39 Overall body fat (follow‐up values).
13.40. Analysis.

Comparison 13 Subanalysis: outcomes by mode of physical activity intervention, Outcome 40 Overall body fat (change values).
13.41. Analysis.
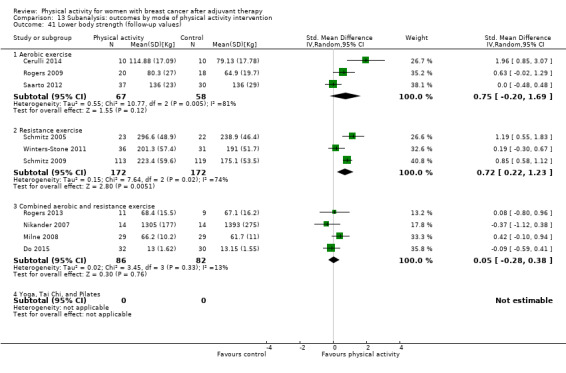
Comparison 13 Subanalysis: outcomes by mode of physical activity intervention, Outcome 41 Lower body strength (follow‐up values).
13.42. Analysis.
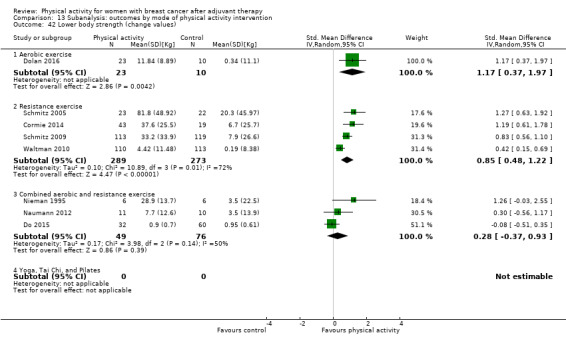
Comparison 13 Subanalysis: outcomes by mode of physical activity intervention, Outcome 42 Lower body strength (change values).
13.43. Analysis.

Comparison 13 Subanalysis: outcomes by mode of physical activity intervention, Outcome 43 Upper body strength (follow‐up values).
13.44. Analysis.

Comparison 13 Subanalysis: outcomes by mode of physical activity intervention, Outcome 44 Upper body strength (change values).
13.45. Analysis.

Comparison 13 Subanalysis: outcomes by mode of physical activity intervention, Outcome 45 Bone mineral density ‐ femoral neck (follow‐up and change values).
13.46. Analysis.

Comparison 13 Subanalysis: outcomes by mode of physical activity intervention, Outcome 46 Bone mineral density ‐ lumbar spine (follow‐up and change values).
13.47. Analysis.
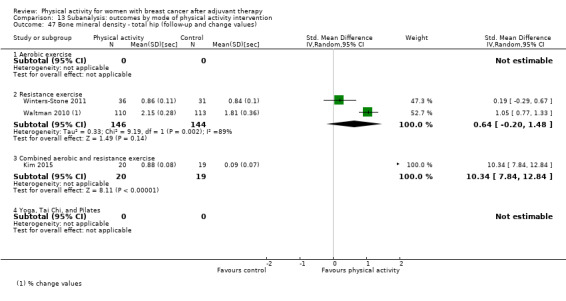
Comparison 13 Subanalysis: outcomes by mode of physical activity intervention, Outcome 47 Bone mineral density ‐ total hip (follow‐up and change values).
Comparison 14. Subanalysis: outcomes by intensity of physical activity intervention.
| Outcome or subgroup title | No. of studies | No. of participants | Statistical method | Effect size |
|---|---|---|---|---|
| 1 Overall HRQoL (follow‐up values) | 22 | Std. Mean Difference (IV, Random, 95% CI) | Subtotals only | |
| 1.1 Light‐to‐moderate intensity | 16 | 983 | Std. Mean Difference (IV, Random, 95% CI) | 0.51 [0.25, 0.77] |
| 1.2 Moderate‐to‐high intensity | 6 | 820 | Std. Mean Difference (IV, Random, 95% CI) | 0.19 [‐0.05, 0.43] |
| 2 Overall HRQoL (change values) | 14 | Std. Mean Difference (IV, Random, 95% CI) | Subtotals only | |
| 2.1 Light‐to‐moderate intensity | 10 | 534 | Std. Mean Difference (IV, Random, 95% CI) | 0.99 [0.39, 1.60] |
| 2.2 Moderate‐to‐high intensity | 4 | 925 | Std. Mean Difference (IV, Random, 95% CI) | 0.28 [‐0.11, 0.67] |
| 3 Overall emotional function/mental health (follow‐up values) | 26 | Std. Mean Difference (IV, Random, 95% CI) | Subtotals only | |
| 3.1 Light‐to‐moderate intensity | 21 | 1489 | Std. Mean Difference (IV, Random, 95% CI) | 0.19 [0.08, 0.30] |
| 3.2 Moderate‐to‐high intensity | 5 | 613 | Std. Mean Difference (IV, Random, 95% CI) | 0.29 [‐0.07, 0.65] |
| 4 Overall emotional function/mental health (change values) | 15 | Std. Mean Difference (IV, Random, 95% CI) | Subtotals only | |
| 4.1 Light‐to‐moderate intensity | 10 | 592 | Std. Mean Difference (IV, Random, 95% CI) | 0.41 [0.04, 0.77] |
| 4.2 Moderate‐to‐high intensity | 5 | 987 | Std. Mean Difference (IV, Random, 95% CI) | 0.07 [‐0.07, 0.21] |
| 5 Overall physical function (follow‐up values) | 25 | Std. Mean Difference (IV, Random, 95% CI) | Subtotals only | |
| 5.1 Light‐to‐moderate intensity | 20 | 1466 | Std. Mean Difference (IV, Random, 95% CI) | 0.38 [0.19, 0.58] |
| 5.2 Moderate‐to‐high intensity | 5 | 663 | Std. Mean Difference (IV, Random, 95% CI) | 0.14 [‐0.02, 0.30] |
| 6 Overall physical function (change values) | 13 | Std. Mean Difference (IV, Random, 95% CI) | Subtotals only | |
| 6.1 Light‐to‐moderate intensity | 8 | 449 | Std. Mean Difference (IV, Random, 95% CI) | 0.81 [0.11, 1.51] |
| 6.2 Moderate‐to‐high intensity | 5 | 984 | Std. Mean Difference (IV, Random, 95% CI) | 0.28 [‐0.06, 0.62] |
| 7 Overall role function (follow‐up values) | 18 | Std. Mean Difference (IV, Random, 95% CI) | Subtotals only | |
| 7.1 Light‐to‐moderate intensity | 14 | 883 | Std. Mean Difference (IV, Random, 95% CI) | 0.36 [0.08, 0.64] |
| 7.2 Moderate‐to‐high intensity | 4 | 487 | Std. Mean Difference (IV, Random, 95% CI) | 0.11 [‐0.13, 0.35] |
| 8 Overall role function (change values) | 12 | Std. Mean Difference (IV, Random, 95% CI) | Subtotals only | |
| 8.1 Light‐to‐moderate intensity | 7 | 328 | Std. Mean Difference (IV, Random, 95% CI) | 0.18 [‐0.19, 0.56] |
| 8.2 Moderate‐to‐high intensity | 5 | 987 | Std. Mean Difference (IV, Random, 95% CI) | 0.06 [‐0.09, 0.21] |
| 9 Overall social well‐being/function (follow‐up values) | 18 | Std. Mean Difference (IV, Random, 95% CI) | Subtotals only | |
| 9.1 Light‐to‐moderate intensity | 15 | 1132 | Std. Mean Difference (IV, Random, 95% CI) | 0.23 [0.10, 0.36] |
| 9.2 Moderate‐to‐high intensity | 3 | 425 | Std. Mean Difference (IV, Random, 95% CI) | 0.05 [‐0.16, 0.26] |
| 10 Overall social well‐being/function (change values) | 12 | Std. Mean Difference (IV, Random, 95% CI) | Subtotals only | |
| 10.1 Light‐to‐moderate intensity | 8 | 413 | Std. Mean Difference (IV, Random, 95% CI) | 0.63 [0.21, 1.04] |
| 10.2 Moderate‐to‐high intensity | 4 | 971 | Std. Mean Difference (IV, Random, 95% CI) | 0.33 [‐0.33, 0.98] |
| 11 Overall cognitive function (follow‐up values) | 5 | Std. Mean Difference (IV, Random, 95% CI) | Subtotals only | |
| 11.1 Light‐to‐moderate intensity | 4 | 173 | Std. Mean Difference (IV, Random, 95% CI) | 0.43 [0.11, 0.74] |
| 11.2 Moderate‐to‐high intensity | 1 | 16 | Std. Mean Difference (IV, Random, 95% CI) | 0.16 [‐0.82, 1.14] |
| 12 Overall cognitive function (change values) | 5 | Std. Mean Difference (IV, Random, 95% CI) | Subtotals only | |
| 12.1 Light‐to‐moderate intensity | 3 | 156 | Std. Mean Difference (IV, Random, 95% CI) | 0.17 [‐0.21, 0.55] |
| 12.2 Moderate‐to‐high intensity | 2 | 516 | Std. Mean Difference (IV, Random, 95% CI) | ‐0.17 [‐0.35, 0.00] |
| 13 Overall general health (follow‐up values) | 10 | Std. Mean Difference (IV, Random, 95% CI) | Subtotals only | |
| 13.1 Light‐to‐moderate intensity | 6 | 304 | Std. Mean Difference (IV, Random, 95% CI) | 0.17 [‐0.14, 0.48] |
| 13.2 Moderate‐to‐high intensity | 4 | 184 | Std. Mean Difference (IV, Random, 95% CI) | 0.30 [‐0.35, 0.95] |
| 14 Overall general health (change values) | 9 | Std. Mean Difference (IV, Random, 95% CI) | Subtotals only | |
| 14.1 Light‐to‐moderate intensity | 5 | 254 | Std. Mean Difference (IV, Random, 95% CI) | 0.23 [‐0.02, 0.48] |
| 14.2 Moderate‐to‐high intensity | 4 | 652 | Std. Mean Difference (IV, Random, 95% CI) | 0.20 [‐0.24, 0.64] |
| 15 Overall sexual function (follow‐up values) | 5 | Std. Mean Difference (IV, Fixed, 95% CI) | Subtotals only | |
| 15.1 Light‐to‐moderate intensity | 4 | 293 | Std. Mean Difference (IV, Fixed, 95% CI) | 0.22 [‐0.01, 0.45] |
| 15.2 Moderate‐to‐high intensity | 1 | 118 | Std. Mean Difference (IV, Fixed, 95% CI) | 0.01 [‐0.35, 0.38] |
| 16 Overall sexual function (change values) | 3 | Mean Difference (IV, Random, 95% CI) | Subtotals only | |
| 16.1 Light‐to‐moderate intensity | 2 | 193 | Mean Difference (IV, Random, 95% CI) | 3.83 [‐1.83, 9.48] |
| 16.2 Moderate‐to‐high intensity | 1 | 500 | Mean Difference (IV, Random, 95% CI) | 0.5 [‐3.86, 4.86] |
| 17 Overall anxiety (follow‐up values) | 7 | Std. Mean Difference (IV, Random, 95% CI) | Subtotals only | |
| 17.1 Light‐to‐moderate intensity | 5 | 237 | Std. Mean Difference (IV, Random, 95% CI) | ‐0.56 [‐0.88, ‐0.25] |
| 17.2 Moderate‐to‐high intensity | 2 | 89 | Std. Mean Difference (IV, Random, 95% CI) | ‐1.20 [‐3.49, 1.09] |
| 18 Overall anxiety (change values) | 4 | Std. Mean Difference (IV, Fixed, 95% CI) | Subtotals only | |
| 18.1 Light‐to‐moderate intensity | 3 | 161 | Std. Mean Difference (IV, Fixed, 95% CI) | ‐0.48 [‐0.79, ‐0.16] |
| 18.2 Moderate‐to‐high intensity | 1 | 74 | Std. Mean Difference (IV, Fixed, 95% CI) | ‐0.15 [‐0.61, 0.30] |
| 19 Overall depression (follow‐up values) | 12 | Std. Mean Difference (IV, Random, 95% CI) | Subtotals only | |
| 19.1 Light‐to‐moderate intensity | 9 | 542 | Std. Mean Difference (IV, Random, 95% CI) | ‐0.24 [‐0.53, 0.06] |
| 19.2 Moderate‐to‐high intensity | 3 | 115 | Std. Mean Difference (IV, Random, 95% CI) | ‐0.92 [‐1.95, 0.11] |
| 20 Overall depression (change values) | 6 | Std. Mean Difference (IV, Random, 95% CI) | Subtotals only | |
| 20.1 Light‐to‐moderate intensity | 4 | 182 | Std. Mean Difference (IV, Random, 95% CI) | ‐0.60 [‐0.89, ‐0.30] |
| 20.2 Moderate‐to‐high intensity | 2 | 574 | Std. Mean Difference (IV, Random, 95% CI) | 0.00 [‐0.21, 0.22] |
| 21 Overall fatigue (follow‐up values) | 25 | Std. Mean Difference (IV, Random, 95% CI) | Subtotals only | |
| 21.1 Light‐to‐moderate intensity | 21 | 1155 | Std. Mean Difference (IV, Random, 95% CI) | ‐0.38 [‐0.56, ‐0.19] |
| 21.2 Moderate‐to‐high intensity | 4 | 770 | Std. Mean Difference (IV, Random, 95% CI) | ‐0.13 [‐0.28, 0.03] |
| 22 Overall fatigue (change values) | 12 | Std. Mean Difference (IV, Random, 95% CI) | Subtotals only | |
| 22.1 Light‐to‐moderate intensity | 9 | 420 | Std. Mean Difference (IV, Random, 95% CI) | ‐0.36 [‐0.84, 0.11] |
| 22.2 Moderate‐to‐high intensity | 3 | 851 | Std. Mean Difference (IV, Random, 95% CI) | 0.05 [‐0.14, 0.24] |
| 23 Overall pain/disability (follow‐up values) | 9 | Std. Mean Difference (IV, Random, 95% CI) | Subtotals only | |
| 23.1 Light‐to‐moderate intensity | 5 | 189 | Std. Mean Difference (IV, Random, 95% CI) | 0.13 [‐0.25, 0.50] |
| 23.2 Moderate‐to‐high intensity | 4 | 346 | Std. Mean Difference (IV, Random, 95% CI) | 0.03 [‐0.18, 0.24] |
| 24 Overall pain/disability (change values) | 5 | Std. Mean Difference (IV, Random, 95% CI) | Subtotals only | |
| 24.1 Light‐to‐moderate intensity | 2 | 77 | Std. Mean Difference (IV, Random, 95% CI) | 0.12 [‐0.33, 0.56] |
| 24.2 Moderate‐to‐high intensity | 3 | 219 | Std. Mean Difference (IV, Random, 95% CI) | ‐0.15 [‐0.47, 0.16] |
| 25 Overall self‐esteem/body image (follow‐up values) | 12 | Std. Mean Difference (IV, Random, 95% CI) | Subtotals only | |
| 25.1 Light‐to‐moderate intensity | 8 | 474 | Std. Mean Difference (IV, Random, 95% CI) | 0.35 [0.14, 0.55] |
| 25.2 Moderate‐to‐high intensity | 4 | 193 | Std. Mean Difference (IV, Random, 95% CI) | 0.06 [‐0.45, 0.56] |
| 26 Overall self‐esteem/body image (change values) | 9 | Std. Mean Difference (IV, Random, 95% CI) | Subtotals only | |
| 26.1 Light‐to‐moderate intensity | 6 | 376 | Std. Mean Difference (IV, Random, 95% CI) | 0.52 [‐0.09, 1.13] |
| 26.2 Moderate‐to‐high intensity | 3 | 616 | Std. Mean Difference (IV, Random, 95% CI) | ‐0.05 [‐0.21, 0.10] |
| 27 Overall cardiorespiratory fitness (follow‐up values) | 23 | Std. Mean Difference (IV, Random, 95% CI) | Subtotals only | |
| 27.1 Light‐to‐moderate intensity | 16 | 975 | Std. Mean Difference (IV, Random, 95% CI) | 0.43 [0.27, 0.59] |
| 27.2 Moderate‐to‐high intensity | 7 | 290 | Std. Mean Difference (IV, Random, 95% CI) | 0.46 [0.13, 0.80] |
| 28 Overall cardiorespiratory fitness (change values) | 9 | Std. Mean Difference (IV, Random, 95% CI) | Subtotals only | |
| 28.1 Light‐to‐moderate intensity | 6 | 228 | Std. Mean Difference (IV, Random, 95% CI) | 1.18 [0.60, 1.77] |
| 28.2 Moderate‐to‐high intensity | 4 | 645 | Std. Mean Difference (IV, Random, 95% CI) | 0.57 [0.01, 1.14] |
| 29 Overall self‐reported physical activity (follow‐up values) | 17 | Std. Mean Difference (IV, Random, 95% CI) | Subtotals only | |
| 29.1 Light‐to‐moderate intensity | 11 | 1112 | Std. Mean Difference (IV, Random, 95% CI) | 0.47 [0.23, 0.72] |
| 29.2 Moderate‐to‐high intensity | 6 | 893 | Std. Mean Difference (IV, Random, 95% CI) | 0.65 [0.27, 1.03] |
| 30 Overall self‐reported physical activity (change values) | 8 | Std. Mean Difference (IV, Random, 95% CI) | Subtotals only | |
| 30.1 Light‐to‐moderate intensity | 4 | 249 | Std. Mean Difference (IV, Random, 95% CI) | 0.79 [0.15, 1.44] |
| 30.2 Moderate‐to‐high intensity | 4 | 1025 | Std. Mean Difference (IV, Random, 95% CI) | 0.46 [0.07, 0.85] |
| 31 Overall objective physical activity (follow‐up values) | 12 | Std. Mean Difference (IV, Random, 95% CI) | Subtotals only | |
| 31.1 Light‐to‐moderate intensity | 9 | 574 | Std. Mean Difference (IV, Random, 95% CI) | 0.58 [0.29, 0.87] |
| 31.2 Moderate‐to‐high intensity | 3 | 735 | Std. Mean Difference (IV, Random, 95% CI) | 0.12 [‐0.03, 0.28] |
| 32 Overall objective physical activity (change values) | 5 | Std. Mean Difference (IV, Random, 95% CI) | Subtotals only | |
| 32.1 Light‐to‐moderate intensity | 3 | 103 | Std. Mean Difference (IV, Random, 95% CI) | 1.05 [0.62, 1.47] |
| 32.2 Moderate‐to‐high intensity | 2 | 405 | Std. Mean Difference (IV, Random, 95% CI) | 0.32 [‐0.45, 1.09] |
| 33 Mass (follow‐up values) | 16 | Mean Difference (IV, Fixed, 95% CI) | Subtotals only | |
| 33.1 Light‐to‐moderate intensity | 12 | 1015 | Mean Difference (IV, Fixed, 95% CI) | 0.03 [‐0.56, 0.61] |
| 33.2 Moderate‐to‐high intensity | 4 | 195 | Mean Difference (IV, Fixed, 95% CI) | ‐1.34 [‐5.66, 2.98] |
| 34 Mass (change values) | 11 | Mean Difference (IV, Random, 95% CI) | Subtotals only | |
| 34.1 Light‐to‐moderate intensity | 8 | 418 | Mean Difference (IV, Random, 95% CI) | ‐0.58 [‐1.21, 0.05] |
| 34.2 Moderate‐to‐high intensity | 4 | 639 | Mean Difference (IV, Random, 95% CI) | ‐0.97 [‐2.18, 0.24] |
| 35 BMI (follow‐up values) | 17 | Mean Difference (IV, Fixed, 95% CI) | Subtotals only | |
| 35.1 Light‐to‐moderate intensity | 12 | 930 | Mean Difference (IV, Fixed, 95% CI) | 0.03 [‐0.18, 0.24] |
| 35.2 Moderate‐to‐high intensity | 5 | 551 | Mean Difference (IV, Fixed, 95% CI) | ‐0.35 [‐1.40, 0.69] |
| 36 BMI (change values) | 8 | Mean Difference (IV, Random, 95% CI) | Subtotals only | |
| 36.1 Light‐to‐moderate intensity | 7 | 403 | Mean Difference (IV, Random, 95% CI) | ‐0.23 [‐0.50, 0.05] |
| 36.2 Moderate‐to‐high intensity | 1 | 82 | Mean Difference (IV, Random, 95% CI) | ‐0.2 [‐0.57, 0.17] |
| 37 Overall body fat (follow‐up values) | 18 | Std. Mean Difference (IV, Random, 95% CI) | Subtotals only | |
| 37.1 Light‐to‐moderate intensity | 13 | 886 | Std. Mean Difference (IV, Random, 95% CI) | ‐0.24 [‐0.44, ‐0.04] |
| 37.2 Moderate‐to‐high intensity | 5 | 276 | Std. Mean Difference (IV, Random, 95% CI) | ‐0.03 [‐0.27, 0.21] |
| 38 Overall body fat (change values) | 9 | Std. Mean Difference (IV, Random, 95% CI) | Subtotals only | |
| 38.1 Light‐to‐moderate intensity | 7 | 375 | Std. Mean Difference (IV, Random, 95% CI) | ‐0.68 [‐1.44, 0.09] |
| 38.2 Moderate‐to‐high intensity | 2 | 124 | Std. Mean Difference (IV, Random, 95% CI) | ‐0.39 [‐0.76, ‐0.02] |
| 39 Lower body strength (follow‐up values) | 10 | Std. Mean Difference (IV, Random, 95% CI) | Subtotals only | |
| 39.1 Light‐to‐moderate intensity | 7 | 480 | Std. Mean Difference (IV, Random, 95% CI) | 0.69 [0.34, 1.04] |
| 39.2 Moderate‐to‐high intensity | 3 | 157 | Std. Mean Difference (IV, Random, 95% CI) | ‐0.10 [‐0.42, 0.21] |
| 40 Lower body strength (change values) | 8 | Std. Mean Difference (IV, Random, 95% CI) | Subtotals only | |
| 40.1 Light‐to‐moderate intensity | 5 | 331 | Std. Mean Difference (IV, Random, 95% CI) | 0.87 [0.64, 1.09] |
| 40.2 Moderate‐to‐high intensity | 4 | 399 | Std. Mean Difference (IV, Random, 95% CI) | 0.62 [0.07, 1.17] |
| 41 Upper body strength (follow‐up values) | 13 | Std. Mean Difference (IV, Random, 95% CI) | Subtotals only | |
| 41.1 Light‐to‐moderate intensity | 7 | 481 | Std. Mean Difference (IV, Random, 95% CI) | 0.43 [‐0.11, 0.96] |
| 41.2 Moderate‐to‐high intensity | 6 | 287 | Std. Mean Difference (IV, Random, 95% CI) | 0.41 [‐0.05, 0.87] |
| 42 Upper body strength (change values) | 8 | Std. Mean Difference (IV, Random, 95% CI) | Subtotals only | |
| 42.1 Light‐to‐moderate intensity | 3 | 360 | Std. Mean Difference (IV, Random, 95% CI) | 1.32 [0.47, 2.16] |
| 42.2 Moderate‐to‐high intensity | 5 | 472 | Std. Mean Difference (IV, Random, 95% CI) | 0.37 [‐0.05, 0.79] |
| 43 Bone mineral density ‐ femoral neck (follow‐up and change values) | 4 | Std. Mean Difference (IV, Random, 95% CI) | Subtotals only | |
| 43.1 Light‐to‐moderate intensity | 2 | 106 | Std. Mean Difference (IV, Random, 95% CI) | ‐0.08 [‐0.54, 0.37] |
| 43.2 Moderate‐to‐high intensity | 2 | 680 | Std. Mean Difference (IV, Random, 95% CI) | 0.39 [‐0.04, 0.83] |
| 44 Bone mineral density ‐ lumbar spine (follow‐up and change values) | 4 | Std. Mean Difference (IV, Random, 95% CI) | Subtotals only | |
| 44.1 Light‐to‐moderate intensity | 2 | 106 | Std. Mean Difference (IV, Random, 95% CI) | 0.06 [‐0.48, 0.60] |
| 44.2 Moderate‐to‐high intensity | 2 | 680 | Std. Mean Difference (IV, Random, 95% CI) | 0.31 [‐0.14, 0.75] |
| 45 Bone mineral density ‐ total hip (follow‐up and change values) | 3 | Std. Mean Difference (IV, Random, 95% CI) | Subtotals only | |
| 45.1 Light‐to‐moderate intensity | 2 | 106 | Std. Mean Difference (IV, Random, 95% CI) | 5.19 [‐4.76, 15.14] |
| 45.2 Moderate‐to‐high intensity | 1 | 223 | Std. Mean Difference (IV, Random, 95% CI) | 1.05 [0.77, 1.33] |
14.3. Analysis.
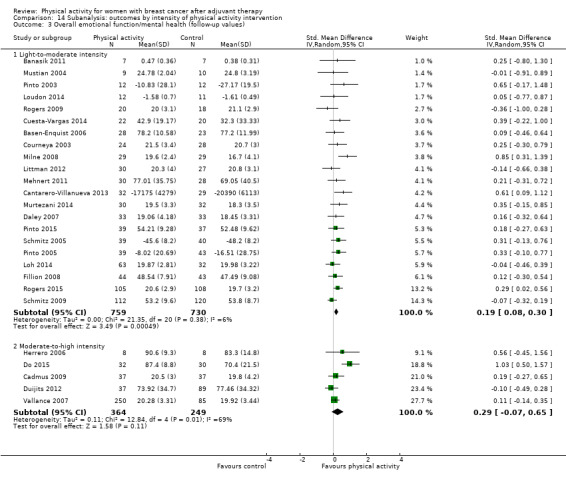
Comparison 14 Subanalysis: outcomes by intensity of physical activity intervention, Outcome 3 Overall emotional function/mental health (follow‐up values).
14.4. Analysis.
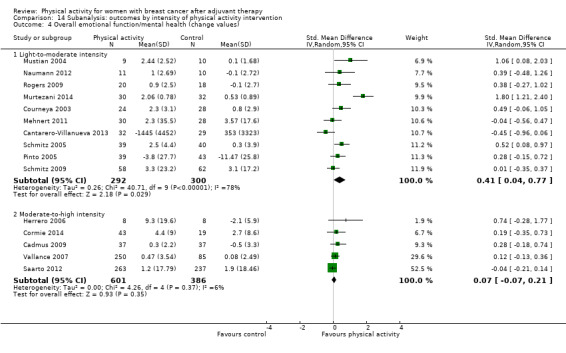
Comparison 14 Subanalysis: outcomes by intensity of physical activity intervention, Outcome 4 Overall emotional function/mental health (change values).
14.5. Analysis.
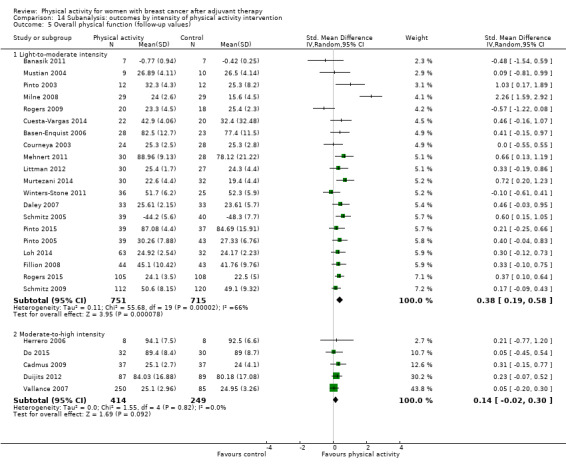
Comparison 14 Subanalysis: outcomes by intensity of physical activity intervention, Outcome 5 Overall physical function (follow‐up values).
14.6. Analysis.

Comparison 14 Subanalysis: outcomes by intensity of physical activity intervention, Outcome 6 Overall physical function (change values).
14.7. Analysis.

Comparison 14 Subanalysis: outcomes by intensity of physical activity intervention, Outcome 7 Overall role function (follow‐up values).
14.8. Analysis.
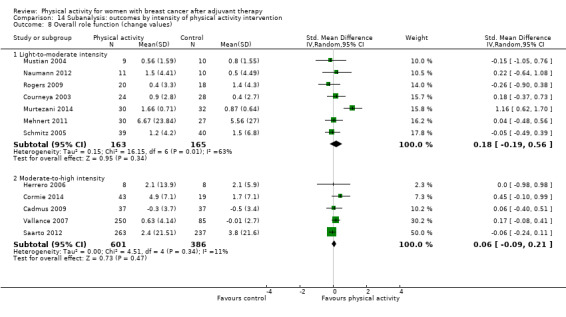
Comparison 14 Subanalysis: outcomes by intensity of physical activity intervention, Outcome 8 Overall role function (change values).
14.9. Analysis.

Comparison 14 Subanalysis: outcomes by intensity of physical activity intervention, Outcome 9 Overall social well‐being/function (follow‐up values).
14.10. Analysis.

Comparison 14 Subanalysis: outcomes by intensity of physical activity intervention, Outcome 10 Overall social well‐being/function (change values).
14.11. Analysis.

Comparison 14 Subanalysis: outcomes by intensity of physical activity intervention, Outcome 11 Overall cognitive function (follow‐up values).
14.12. Analysis.
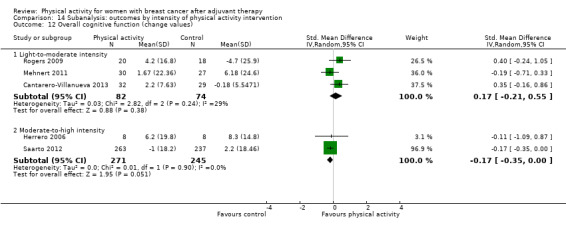
Comparison 14 Subanalysis: outcomes by intensity of physical activity intervention, Outcome 12 Overall cognitive function (change values).
14.13. Analysis.

Comparison 14 Subanalysis: outcomes by intensity of physical activity intervention, Outcome 13 Overall general health (follow‐up values).
14.14. Analysis.

Comparison 14 Subanalysis: outcomes by intensity of physical activity intervention, Outcome 14 Overall general health (change values).
14.15. Analysis.
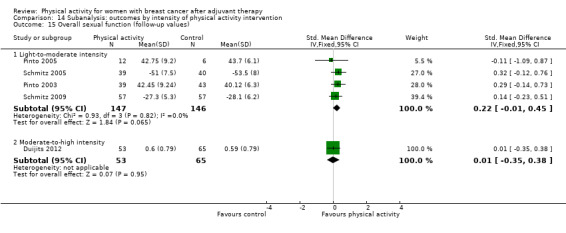
Comparison 14 Subanalysis: outcomes by intensity of physical activity intervention, Outcome 15 Overall sexual function (follow‐up values).
14.16. Analysis.

Comparison 14 Subanalysis: outcomes by intensity of physical activity intervention, Outcome 16 Overall sexual function (change values).
14.17. Analysis.

Comparison 14 Subanalysis: outcomes by intensity of physical activity intervention, Outcome 17 Overall anxiety (follow‐up values).
14.18. Analysis.

Comparison 14 Subanalysis: outcomes by intensity of physical activity intervention, Outcome 18 Overall anxiety (change values).
14.19. Analysis.
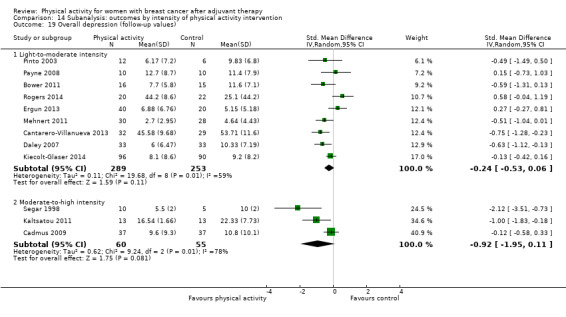
Comparison 14 Subanalysis: outcomes by intensity of physical activity intervention, Outcome 19 Overall depression (follow‐up values).
14.20. Analysis.

Comparison 14 Subanalysis: outcomes by intensity of physical activity intervention, Outcome 20 Overall depression (change values).
14.21. Analysis.

Comparison 14 Subanalysis: outcomes by intensity of physical activity intervention, Outcome 21 Overall fatigue (follow‐up values).
14.22. Analysis.

Comparison 14 Subanalysis: outcomes by intensity of physical activity intervention, Outcome 22 Overall fatigue (change values).
14.23. Analysis.
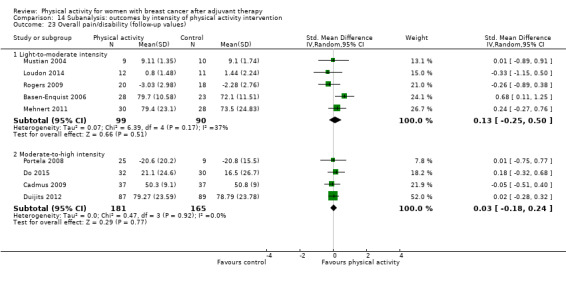
Comparison 14 Subanalysis: outcomes by intensity of physical activity intervention, Outcome 23 Overall pain/disability (follow‐up values).
14.24. Analysis.
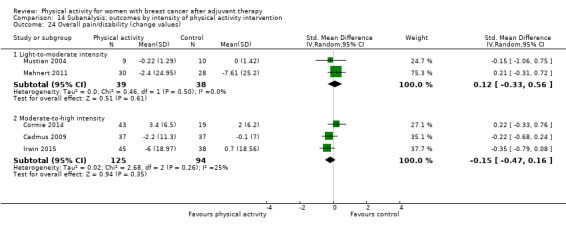
Comparison 14 Subanalysis: outcomes by intensity of physical activity intervention, Outcome 24 Overall pain/disability (change values).
14.25. Analysis.
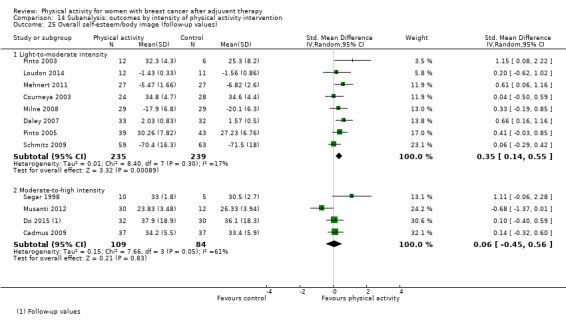
Comparison 14 Subanalysis: outcomes by intensity of physical activity intervention, Outcome 25 Overall self‐esteem/body image (follow‐up values).
14.26. Analysis.
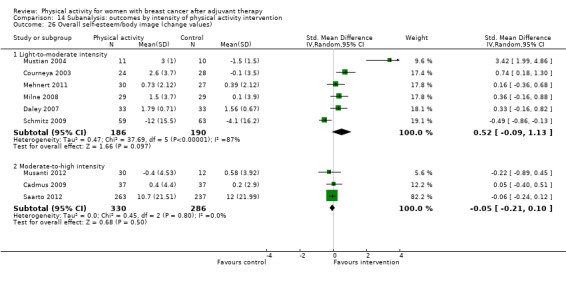
Comparison 14 Subanalysis: outcomes by intensity of physical activity intervention, Outcome 26 Overall self‐esteem/body image (change values).
14.27. Analysis.

Comparison 14 Subanalysis: outcomes by intensity of physical activity intervention, Outcome 27 Overall cardiorespiratory fitness (follow‐up values).
14.28. Analysis.

Comparison 14 Subanalysis: outcomes by intensity of physical activity intervention, Outcome 28 Overall cardiorespiratory fitness (change values).
14.29. Analysis.
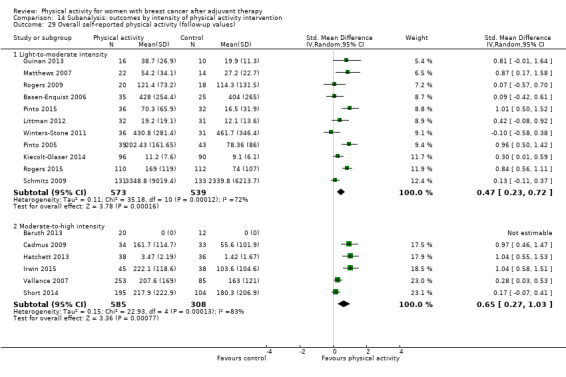
Comparison 14 Subanalysis: outcomes by intensity of physical activity intervention, Outcome 29 Overall self‐reported physical activity (follow‐up values).
14.30. Analysis.
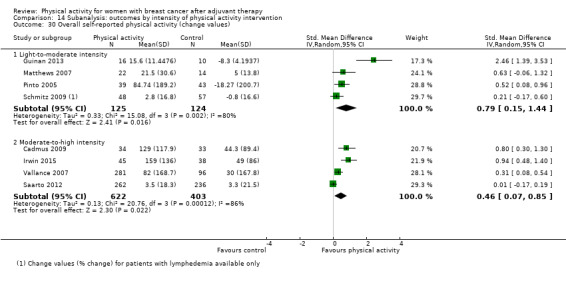
Comparison 14 Subanalysis: outcomes by intensity of physical activity intervention, Outcome 30 Overall self‐reported physical activity (change values).
14.31. Analysis.

Comparison 14 Subanalysis: outcomes by intensity of physical activity intervention, Outcome 31 Overall objective physical activity (follow‐up values).
14.32. Analysis.

Comparison 14 Subanalysis: outcomes by intensity of physical activity intervention, Outcome 32 Overall objective physical activity (change values).
14.33. Analysis.

Comparison 14 Subanalysis: outcomes by intensity of physical activity intervention, Outcome 33 Mass (follow‐up values).
14.34. Analysis.

Comparison 14 Subanalysis: outcomes by intensity of physical activity intervention, Outcome 34 Mass (change values).
14.35. Analysis.

Comparison 14 Subanalysis: outcomes by intensity of physical activity intervention, Outcome 35 BMI (follow‐up values).
14.36. Analysis.

Comparison 14 Subanalysis: outcomes by intensity of physical activity intervention, Outcome 36 BMI (change values).
14.37. Analysis.
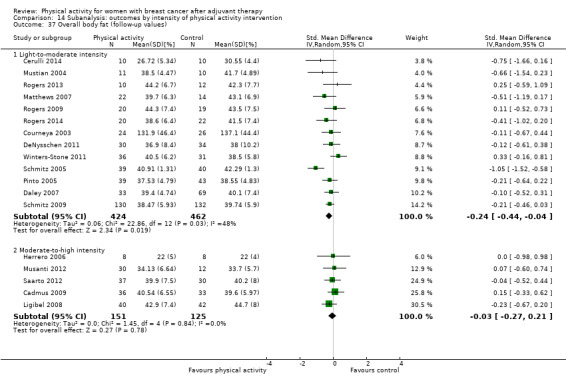
Comparison 14 Subanalysis: outcomes by intensity of physical activity intervention, Outcome 37 Overall body fat (follow‐up values).
14.38. Analysis.

Comparison 14 Subanalysis: outcomes by intensity of physical activity intervention, Outcome 38 Overall body fat (change values).
14.39. Analysis.

Comparison 14 Subanalysis: outcomes by intensity of physical activity intervention, Outcome 39 Lower body strength (follow‐up values).
14.40. Analysis.

Comparison 14 Subanalysis: outcomes by intensity of physical activity intervention, Outcome 40 Lower body strength (change values).
14.41. Analysis.

Comparison 14 Subanalysis: outcomes by intensity of physical activity intervention, Outcome 41 Upper body strength (follow‐up values).
14.42. Analysis.

Comparison 14 Subanalysis: outcomes by intensity of physical activity intervention, Outcome 42 Upper body strength (change values).
14.43. Analysis.
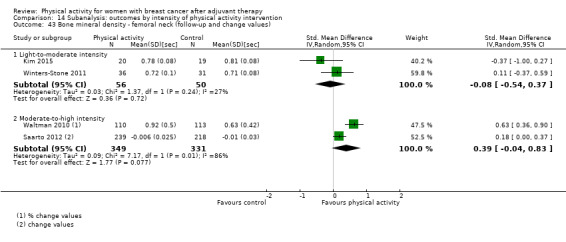
Comparison 14 Subanalysis: outcomes by intensity of physical activity intervention, Outcome 43 Bone mineral density ‐ femoral neck (follow‐up and change values).
14.44. Analysis.

Comparison 14 Subanalysis: outcomes by intensity of physical activity intervention, Outcome 44 Bone mineral density ‐ lumbar spine (follow‐up and change values).
14.45. Analysis.

Comparison 14 Subanalysis: outcomes by intensity of physical activity intervention, Outcome 45 Bone mineral density ‐ total hip (follow‐up and change values).
Comparison 15. Subanalysis: outcomes by duration of physical activity intervention.
| Outcome or subgroup title | No. of studies | No. of participants | Statistical method | Effect size |
|---|---|---|---|---|
| 1 Overall HRQoL (follow‐up values) | 22 | Std. Mean Difference (IV, Random, 95% CI) | Subtotals only | |
| 1.1 12 weeks or less | 16 | 1404 | Std. Mean Difference (IV, Random, 95% CI) | 0.45 [0.19, 0.70] |
| 1.2 More than 12 weeks | 6 | 399 | Std. Mean Difference (IV, Random, 95% CI) | 0.38 [0.10, 0.65] |
| 2 Overall HRQoL (change values) | 14 | Std. Mean Difference (IV, Random, 95% CI) | Subtotals only | |
| 2.1 12 weeks or less | 11 | 828 | Std. Mean Difference (IV, Random, 95% CI) | 0.99 [0.45, 1.52] |
| 2.2 More than 12 weeks | 3 | 631 | Std. Mean Difference (IV, Random, 95% CI) | 0.27 [‐0.21, 0.76] |
| 3 Overall emotional function/mental health (follow‐up values) | 26 | Std. Mean Difference (IV, Random, 95% CI) | Subtotals only | |
| 3.1 12 weeks or less | 20 | 1557 | Std. Mean Difference (IV, Random, 95% CI) | 0.26 [0.12, 0.39] |
| 3.2 More than 12 weeks | 6 | 545 | Std. Mean Difference (IV, Random, 95% CI) | 0.06 [‐0.11, 0.23] |
| 4 Overall emotional function/mental health (change values) | 15 | Std. Mean Difference (IV, Random, 95% CI) | Subtotals only | |
| 4.1 12 weeks or less | 10 | 754 | Std. Mean Difference (IV, Random, 95% CI) | 0.39 [0.03, 0.76] |
| 4.2 More than 12 weeks | 5 | 825 | Std. Mean Difference (IV, Random, 95% CI) | 0.19 [‐0.05, 0.43] |
| 5 Overall physical function (follow‐up values) | 25 | Std. Mean Difference (IV, Random, 95% CI) | Subtotals only | |
| 5.1 12 weeks or less | 18 | 1523 | Std. Mean Difference (IV, Random, 95% CI) | 0.37 [0.17, 0.58] |
| 5.2 More than 12 weeks | 7 | 606 | Std. Mean Difference (IV, Random, 95% CI) | 0.24 [0.08, 0.40] |
| 6 Overall physical function (change values) | 13 | Std. Mean Difference (IV, Random, 95% CI) | Subtotals only | |
| 6.1 12 weeks or less | 8 | 608 | Std. Mean Difference (IV, Random, 95% CI) | 0.97 [0.27, 1.66] |
| 6.2 More than 12 weeks | 5 | 825 | Std. Mean Difference (IV, Random, 95% CI) | 0.15 [‐0.16, 0.45] |
| 7 Overall role function (follow‐up values) | 18 | Std. Mean Difference (IV, Random, 95% CI) | Subtotals only | |
| 7.1 12 weeks or less | 13 | 1057 | Std. Mean Difference (IV, Random, 95% CI) | 0.30 [‐0.01, 0.60] |
| 7.2 More than 12 weeks | 5 | 313 | Std. Mean Difference (IV, Random, 95% CI) | 0.27 [0.04, 0.49] |
| 8 Overall role function (change values) | 12 | Std. Mean Difference (IV, Random, 95% CI) | Subtotals only | |
| 8.1 12 weeks or less | 8 | 610 | Std. Mean Difference (IV, Random, 95% CI) | 0.24 [‐0.06, 0.55] |
| 8.2 More than 12 weeks | 4 | 705 | Std. Mean Difference (IV, Random, 95% CI) | ‐0.03 [‐0.18, 0.11] |
| 9 Overall social well‐being/function (follow‐up values) | 18 | Std. Mean Difference (IV, Random, 95% CI) | Subtotals only | |
| 9.1 12 weeks or less | 13 | 1202 | Std. Mean Difference (IV, Random, 95% CI) | 0.23 [0.06, 0.39] |
| 9.2 More than 12 weeks | 5 | 355 | Std. Mean Difference (IV, Random, 95% CI) | 0.15 [‐0.05, 0.36] |
| 10 Overall social well‐being/function (change values) | 12 | Std. Mean Difference (IV, Random, 95% CI) | Subtotals only | |
| 10.1 12 weeks or less | 8 | 637 | Std. Mean Difference (IV, Random, 95% CI) | 0.73 [0.35, 1.11] |
| 10.2 More than 12 weeks | 4 | 747 | Std. Mean Difference (IV, Random, 95% CI) | 0.11 [‐0.19, 0.42] |
| 11 Overall cognitive function (follow‐up values) | 5 | Std. Mean Difference (IV, Random, 95% CI) | Subtotals only | |
| 11.1 12 weeks or less | 5 | 189 | Std. Mean Difference (IV, Random, 95% CI) | 0.40 [0.11, 0.69] |
| 11.2 More than 12 weeks | 0 | 0 | Std. Mean Difference (IV, Random, 95% CI) | 0.0 [0.0, 0.0] |
| 12 Overall cognitive function (change values) | 5 | Std. Mean Difference (IV, Random, 95% CI) | Subtotals only | |
| 12.1 12 weeks or less | 4 | 172 | Std. Mean Difference (IV, Random, 95% CI) | 0.14 [‐0.17, 0.44] |
| 12.2 More than 12 weeks | 1 | 500 | Std. Mean Difference (IV, Random, 95% CI) | ‐0.17 [‐0.35, 0.00] |
| 13 Overall general health (follow‐up values) | 9 | Std. Mean Difference (IV, Random, 95% CI) | Subtotals only | |
| 13.1 12 weeks or less | 6 | 252 | Std. Mean Difference (IV, Random, 95% CI) | 0.17 [‐0.16, 0.50] |
| 13.2 More than 12 weeks | 3 | 204 | Std. Mean Difference (IV, Random, 95% CI) | 0.21 [‐0.32, 0.75] |
| 14 Overall general health (change values) | 9 | Std. Mean Difference (IV, Random, 95% CI) | Subtotals only | |
| 14.1 12 weeks or less | 6 | 253 | Std. Mean Difference (IV, Random, 95% CI) | 0.29 [‐0.09, 0.67] |
| 14.2 More than 12 weeks | 3 | 653 | Std. Mean Difference (IV, Random, 95% CI) | 0.01 [‐0.20, 0.22] |
| 15 Overall sexual function (follow‐up values) | 5 | Std. Mean Difference (IV, Fixed, 95% CI) | Subtotals only | |
| 15.1 12 weeks or less | 3 | 218 | Std. Mean Difference (IV, Fixed, 95% CI) | 0.11 [‐0.16, 0.38] |
| 15.2 More than 12 weeks | 2 | 193 | Std. Mean Difference (IV, Fixed, 95% CI) | 0.21 [‐0.07, 0.49] |
| 16 Overall sexual function (change values) | 3 | Mean Difference (IV, Random, 95% CI) | Subtotals only | |
| 16.1 12 weeks or less | 0 | 0 | Mean Difference (IV, Random, 95% CI) | 0.0 [0.0, 0.0] |
| 16.2 More than 12 weeks | 3 | 693 | Mean Difference (IV, Random, 95% CI) | 2.44 [‐0.76, 5.64] |
| 17 Overall sleep (follow‐up values) | 5 | Std. Mean Difference (IV, Fixed, 95% CI) | Subtotals only | |
| 17.1 12 weeks or less | 5 | 188 | Std. Mean Difference (IV, Fixed, 95% CI) | ‐0.09 [‐0.37, 0.20] |
| 17.2 More than 12 weeks | 0 | 0 | Std. Mean Difference (IV, Fixed, 95% CI) | 0.0 [0.0, 0.0] |
| 18 Overall sleep (change values) | 3 | Std. Mean Difference (IV, Random, 95% CI) | Subtotals only | |
| 18.1 12 weeks or less | 3 | 136 | Std. Mean Difference (IV, Random, 95% CI) | 0.14 [‐0.20, 0.48] |
| 18.2 More than 12 weeks | 0 | 0 | Std. Mean Difference (IV, Random, 95% CI) | 0.0 [0.0, 0.0] |
| 19 Overall anxiety (follow‐up values) | 7 | Std. Mean Difference (IV, Random, 95% CI) | Subtotals only | |
| 19.1 12 weeks or less | 6 | 252 | Std. Mean Difference (IV, Random, 95% CI) | ‐0.67 [‐1.09, ‐0.25] |
| 19.2 More than 12 weeks | 1 | 74 | Std. Mean Difference (IV, Random, 95% CI) | ‐0.14 [‐0.60, 0.31] |
| 20 Overall anxiety (change values) | 4 | Std. Mean Difference (IV, Fixed, 95% CI) | Subtotals only | |
| 20.1 12 weeks or less | 3 | 161 | Std. Mean Difference (IV, Fixed, 95% CI) | ‐0.48 [‐0.79, ‐0.16] |
| 20.2 More than 12 weeks | 1 | 74 | Std. Mean Difference (IV, Fixed, 95% CI) | ‐0.15 [‐0.61, 0.30] |
| 21 Overall depression (follow‐up values) | 12 | Std. Mean Difference (IV, Random, 95% CI) | Subtotals only | |
| 21.1 12 weeks or less | 9 | 537 | Std. Mean Difference (IV, Random, 95% CI) | ‐0.36 [‐0.70, ‐0.01] |
| 21.2 More than 12 weeks | 3 | 120 | Std. Mean Difference (IV, Random, 95% CI) | ‐0.30 [‐0.90, 0.30] |
| 22 Overall depression (change values) | 6 | Std. Mean Difference (IV, Random, 95% CI) | Subtotals only | |
| 22.1 12 weeks or less | 4 | 182 | Std. Mean Difference (IV, Random, 95% CI) | ‐0.60 [‐0.89, ‐0.30] |
| 22.2 More than 12 weeks | 2 | 574 | Std. Mean Difference (IV, Random, 95% CI) | 0.00 [‐0.21, 0.22] |
| 23 Overall fatigue (follow‐up values) | 25 | Std. Mean Difference (IV, Random, 95% CI) | Subtotals only | |
| 23.1 12 weeks or less | 20 | 1657 | Std. Mean Difference (IV, Random, 95% CI) | ‐0.42 [‐0.59, ‐0.25] |
| 23.2 More than 12 weeks | 5 | 268 | Std. Mean Difference (IV, Random, 95% CI) | 0.02 [‐0.22, 0.26] |
| 24 Overall fatigue (change values) | 12 | Std. Mean Difference (IV, Random, 95% CI) | Subtotals only | |
| 24.1 12 weeks or less | 10 | 719 | Std. Mean Difference (IV, Random, 95% CI) | ‐0.44 [‐0.83, ‐0.05] |
| 24.2 More than 12 weeks | 2 | 552 | Std. Mean Difference (IV, Random, 95% CI) | 0.36 [‐0.43, 1.15] |
| 25 Overall pain/disability (follow‐up values) | 9 | Std. Mean Difference (IV, Random, 95% CI) | Subtotals only | |
| 25.1 12 weeks or less | 6 | 376 | Std. Mean Difference (IV, Random, 95% CI) | 0.03 [‐0.17, 0.23] |
| 25.2 More than 12 weeks | 3 | 159 | Std. Mean Difference (IV, Random, 95% CI) | 0.21 [‐0.27, 0.70] |
| 26 Overall pain/disability (change values) | 5 | Std. Mean Difference (IV, Random, 95% CI) | Subtotals only | |
| 26.1 12 weeks or less | 3 | 139 | Std. Mean Difference (IV, Random, 95% CI) | 0.16 [‐0.19, 0.50] |
| 26.2 More than 12 weeks | 2 | 157 | Std. Mean Difference (IV, Random, 95% CI) | ‐0.29 [‐0.61, 0.02] |
| 27 Overall self‐esteem/body image (follow‐up values) | 12 | Std. Mean Difference (IV, Random, 95% CI) | Subtotals only | |
| 27.1 12 weeks or less | 9 | 419 | Std. Mean Difference (IV, Random, 95% CI) | 0.36 [0.07, 0.66] |
| 27.2 More than 12 weeks | 3 | 248 | Std. Mean Difference (IV, Random, 95% CI) | 0.08 [‐0.17, 0.33] |
| 28 Overall self‐esteem/body image (change values) | 9 | Std. Mean Difference (IV, Random, 95% CI) | Subtotals only | |
| 28.1 12 weeks or less | 5 | 244 | Std. Mean Difference (IV, Random, 95% CI) | 0.54 [‐0.10, 1.18] |
| 28.2 More than 12 weeks | 4 | 748 | Std. Mean Difference (IV, Random, 95% CI) | 0.01 [‐0.37, 0.39] |
| 29 Overall cardiorespiratory fitness (follow‐up values) | 23 | Std. Mean Difference (IV, Random, 95% CI) | Subtotals only | |
| 29.1 12 weeks or less | 15 | 923 | Std. Mean Difference (IV, Random, 95% CI) | 0.35 [0.20, 0.49] |
| 29.2 More than 12 weeks | 8 | 342 | Std. Mean Difference (IV, Random, 95% CI) | 0.67 [0.40, 0.94] |
| 30 Overall cardiorespiratory fitness (change values) | 9 | Std. Mean Difference (IV, Random, 95% CI) | Subtotals only | |
| 30.1 12 weeks or less | 6 | 232 | Std. Mean Difference (IV, Random, 95% CI) | 0.91 [0.31, 1.52] |
| 30.2 More than 12 weeks | 3 | 631 | Std. Mean Difference (IV, Random, 95% CI) | 0.76 [0.02, 1.51] |
| 31 Overall self‐reported physical activity (follow‐up values) | 18 | Std. Mean Difference (IV, Random, 95% CI) | Subtotals only | |
| 31.1 12 weeks or less | 11 | 1401 | Std. Mean Difference (IV, Random, 95% CI) | 0.60 [0.36, 0.84] |
| 31.2 More than 12 weeks | 7 | 643 | Std. Mean Difference (IV, Random, 95% CI) | 0.41 [0.09, 0.74] |
| 32 Overall self‐reported physical activity (change values) | 8 | Std. Mean Difference (IV, Random, 95% CI) | Subtotals only | |
| 32.1 12 weeks or less | 4 | 521 | Std. Mean Difference (IV, Random, 95% CI) | 0.78 [0.20, 1.36] |
| 32.2 More than 12 weeks | 4 | 753 | Std. Mean Difference (IV, Random, 95% CI) | 0.46 [‐0.01, 0.92] |
| 33 Overall objective physical activity (follow‐up values) | 11 | Std. Mean Difference (IV, Random, 95% CI) | Subtotals only | |
| 33.1 12 weeks or less | 10 | 1203 | Std. Mean Difference (IV, Random, 95% CI) | 0.44 [0.18, 0.70] |
| 33.2 More than 12 weeks | 1 | 67 | Std. Mean Difference (IV, Random, 95% CI) | 0.38 [‐0.11, 0.86] |
| 34 Overall objective physical activity (change values) | 5 | Std. Mean Difference (IV, Random, 95% CI) | Subtotals only | |
| 34.1 12 weeks or less | 4 | 441 | Std. Mean Difference (IV, Random, 95% CI) | 0.72 [‐0.02, 1.46] |
| 34.2 More than 12 weeks | 1 | 67 | Std. Mean Difference (IV, Random, 95% CI) | 0.75 [0.25, 1.24] |
| 35 Mass (follow‐up values) | 16 | Mean Difference (IV, Fixed, 95% CI) | Subtotals only | |
| 35.1 12 weeks or less | 7 | 451 | Mean Difference (IV, Fixed, 95% CI) | ‐0.10 [‐0.85, 0.65] |
| 35.2 More than 12 weeks | 9 | 759 | Mean Difference (IV, Fixed, 95% CI) | 0.14 [‐0.76, 1.05] |
| 36 Mass (change values) | 11 | Mean Difference (IV, Random, 95% CI) | Subtotals only | |
| 36.1 12 weeks or less | 5 | 171 | Mean Difference (IV, Random, 95% CI) | ‐0.82 [‐1.81, 0.17] |
| 36.2 More than 12 weeks | 6 | 876 | Mean Difference (IV, Random, 95% CI) | ‐0.25 [‐0.73, 0.24] |
| 37 BMI (follow‐up values) | 17 | Mean Difference (IV, Fixed, 95% CI) | Subtotals only | |
| 37.1 12 weeks or less | 9 | 819 | Mean Difference (IV, Fixed, 95% CI) | ‐0.07 [‐0.35, 0.20] |
| 37.2 More than 12 weeks | 8 | 662 | Mean Difference (IV, Fixed, 95% CI) | 0.13 [‐0.18, 0.43] |
| 38 BMI (change values) | 8 | Mean Difference (IV, Random, 95% CI) | Subtotals only | |
| 38.1 12 weeks or less | 4 | 144 | Mean Difference (IV, Random, 95% CI) | ‐0.27 [‐0.76, 0.22] |
| 38.2 More than 12 weeks | 4 | 341 | Mean Difference (IV, Random, 95% CI) | ‐0.08 [‐0.22, 0.07] |
| 39 Overall body fat (follow‐up values) | 18 | Std. Mean Difference (IV, Random, 95% CI) | Subtotals only | |
| 39.1 12 weeks or less | 9 | 402 | Std. Mean Difference (IV, Random, 95% CI) | ‐0.16 [‐0.37, 0.04] |
| 39.2 More than 12 weeks | 9 | 760 | Std. Mean Difference (IV, Random, 95% CI) | ‐0.20 [‐0.45, 0.05] |
| 40 Overall body fat (change values) | 9 | Std. Mean Difference (IV, Random, 95% CI) | Subtotals only | |
| 40.1 12 weeks or less | 5 | 160 | Std. Mean Difference (IV, Random, 95% CI) | ‐0.36 [‐0.68, ‐0.04] |
| 40.2 More than 12 weeks | 4 | 339 | Std. Mean Difference (IV, Random, 95% CI) | ‐0.94 [‐2.07, 0.18] |
| 41 Lower body strength (follow‐up values) | 10 | Std. Mean Difference (IV, Random, 95% CI) | Subtotals only | |
| 41.1 12 weeks or less | 5 | 206 | Std. Mean Difference (IV, Random, 95% CI) | 0.15 [‐0.19, 0.50] |
| 41.2 More than 12 weeks | 5 | 431 | Std. Mean Difference (IV, Random, 95% CI) | 0.72 [0.20, 1.24] |
| 42 Lower body strength (change values) | 8 | Std. Mean Difference (IV, Random, 95% CI) | Subtotals only | |
| 42.1 12 weeks or less | 5 | 220 | Std. Mean Difference (IV, Random, 95% CI) | 0.71 [0.06, 1.37] |
| 42.2 More than 12 weeks | 3 | 500 | Std. Mean Difference (IV, Random, 95% CI) | 0.76 [0.36, 1.17] |
| 43 Upper body strength (follow‐up values) | 13 | Std. Mean Difference (IV, Random, 95% CI) | Subtotals only | |
| 43.1 12 weeks or less | 6 | 249 | Std. Mean Difference (IV, Random, 95% CI) | 0.15 [‐0.32, 0.62] |
| 43.2 More than 12 weeks | 7 | 519 | Std. Mean Difference (IV, Random, 95% CI) | 0.64 [0.24, 1.04] |
| 44 Upper body strength (change values) | 8 | Std. Mean Difference (IV, Random, 95% CI) | Subtotals only | |
| 44.1 12 weeks or less | 4 | 249 | Std. Mean Difference (IV, Random, 95% CI) | 0.72 [‐0.06, 1.50] |
| 44.2 More than 12 weeks | 4 | 583 | Std. Mean Difference (IV, Random, 95% CI) | 0.71 [0.17, 1.25] |
15.3. Analysis.

Comparison 15 Subanalysis: outcomes by duration of physical activity intervention, Outcome 3 Overall emotional function/mental health (follow‐up values).
15.4. Analysis.
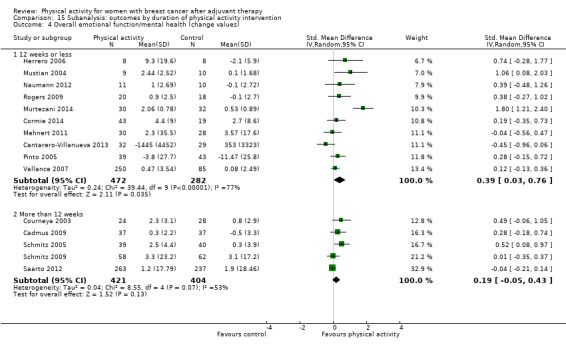
Comparison 15 Subanalysis: outcomes by duration of physical activity intervention, Outcome 4 Overall emotional function/mental health (change values).
15.5. Analysis.
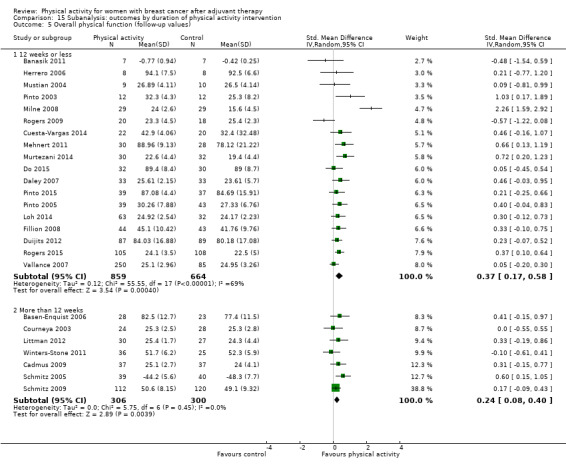
Comparison 15 Subanalysis: outcomes by duration of physical activity intervention, Outcome 5 Overall physical function (follow‐up values).
15.6. Analysis.
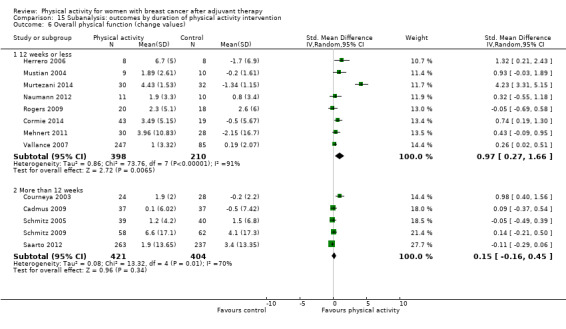
Comparison 15 Subanalysis: outcomes by duration of physical activity intervention, Outcome 6 Overall physical function (change values).
15.7. Analysis.
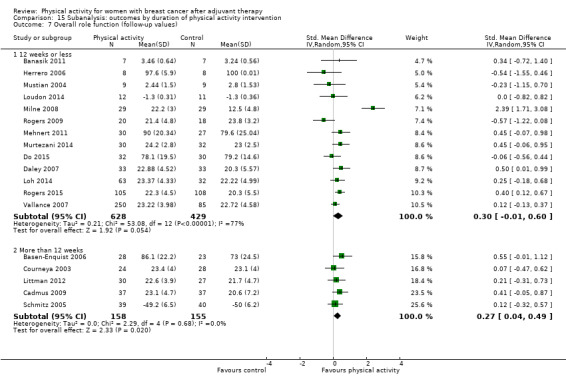
Comparison 15 Subanalysis: outcomes by duration of physical activity intervention, Outcome 7 Overall role function (follow‐up values).
15.8. Analysis.

Comparison 15 Subanalysis: outcomes by duration of physical activity intervention, Outcome 8 Overall role function (change values).
15.9. Analysis.
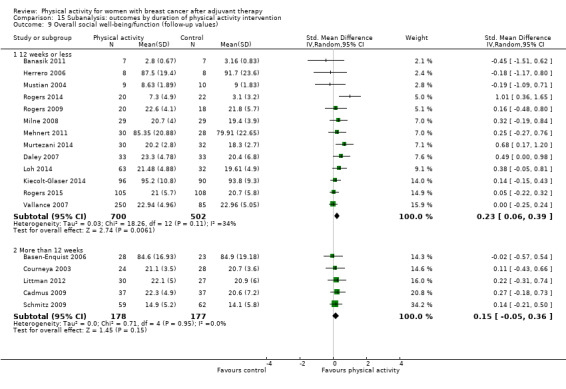
Comparison 15 Subanalysis: outcomes by duration of physical activity intervention, Outcome 9 Overall social well‐being/function (follow‐up values).
15.10. Analysis.
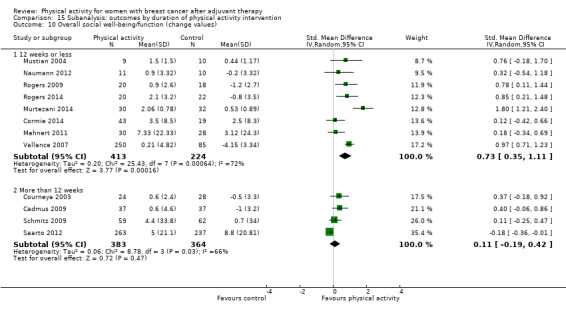
Comparison 15 Subanalysis: outcomes by duration of physical activity intervention, Outcome 10 Overall social well‐being/function (change values).
15.11. Analysis.
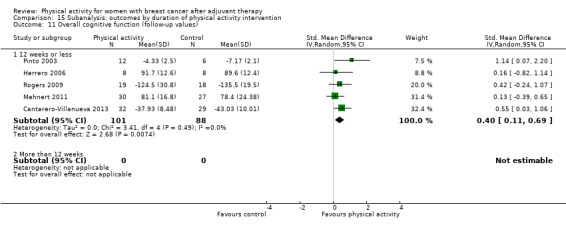
Comparison 15 Subanalysis: outcomes by duration of physical activity intervention, Outcome 11 Overall cognitive function (follow‐up values).
15.12. Analysis.
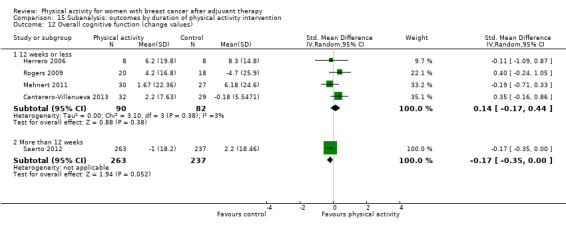
Comparison 15 Subanalysis: outcomes by duration of physical activity intervention, Outcome 12 Overall cognitive function (change values).
15.13. Analysis.
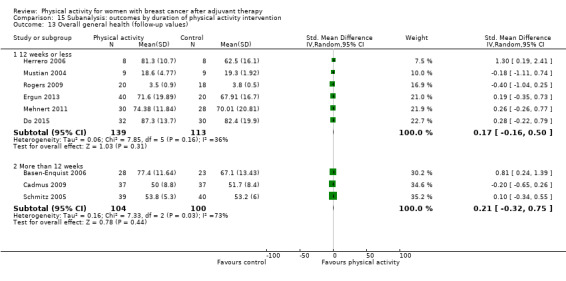
Comparison 15 Subanalysis: outcomes by duration of physical activity intervention, Outcome 13 Overall general health (follow‐up values).
15.14. Analysis.
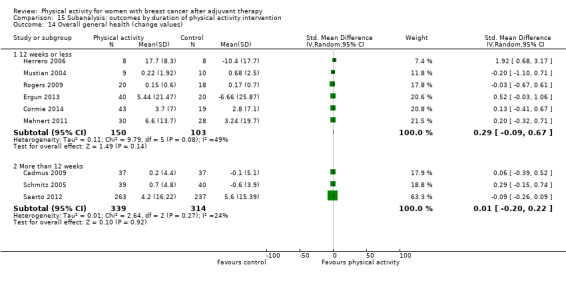
Comparison 15 Subanalysis: outcomes by duration of physical activity intervention, Outcome 14 Overall general health (change values).
15.15. Analysis.

Comparison 15 Subanalysis: outcomes by duration of physical activity intervention, Outcome 15 Overall sexual function (follow‐up values).
15.16. Analysis.
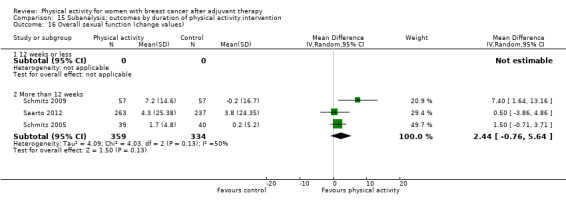
Comparison 15 Subanalysis: outcomes by duration of physical activity intervention, Outcome 16 Overall sexual function (change values).
15.17. Analysis.

Comparison 15 Subanalysis: outcomes by duration of physical activity intervention, Outcome 17 Overall sleep (follow‐up values).
15.18. Analysis.
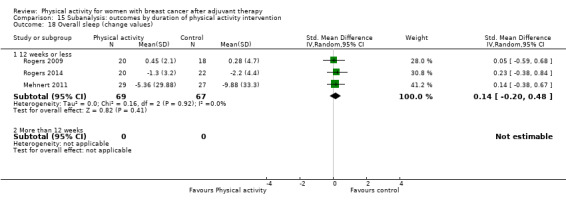
Comparison 15 Subanalysis: outcomes by duration of physical activity intervention, Outcome 18 Overall sleep (change values).
15.19. Analysis.

Comparison 15 Subanalysis: outcomes by duration of physical activity intervention, Outcome 19 Overall anxiety (follow‐up values).
15.20. Analysis.

Comparison 15 Subanalysis: outcomes by duration of physical activity intervention, Outcome 20 Overall anxiety (change values).
15.21. Analysis.

Comparison 15 Subanalysis: outcomes by duration of physical activity intervention, Outcome 21 Overall depression (follow‐up values).
15.22. Analysis.
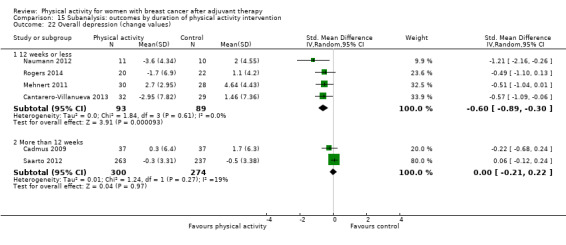
Comparison 15 Subanalysis: outcomes by duration of physical activity intervention, Outcome 22 Overall depression (change values).
15.23. Analysis.
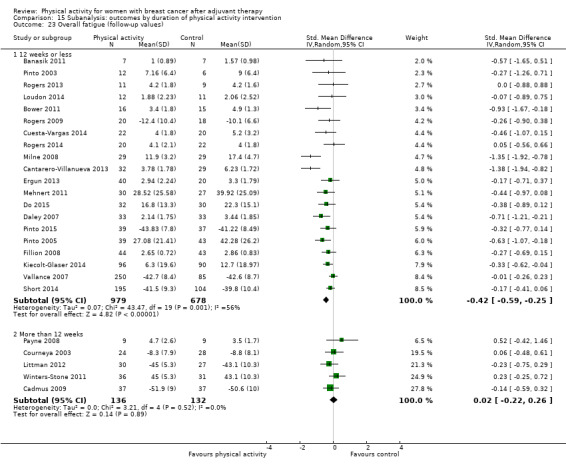
Comparison 15 Subanalysis: outcomes by duration of physical activity intervention, Outcome 23 Overall fatigue (follow‐up values).
15.24. Analysis.
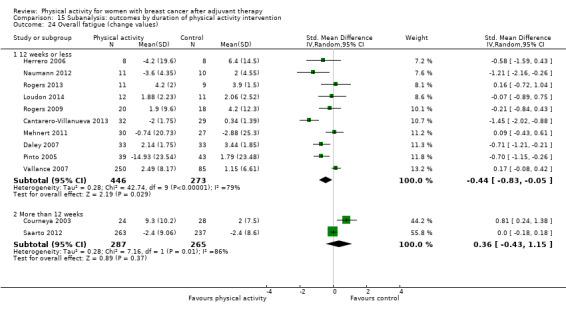
Comparison 15 Subanalysis: outcomes by duration of physical activity intervention, Outcome 24 Overall fatigue (change values).
15.25. Analysis.

Comparison 15 Subanalysis: outcomes by duration of physical activity intervention, Outcome 25 Overall pain/disability (follow‐up values).
15.26. Analysis.

Comparison 15 Subanalysis: outcomes by duration of physical activity intervention, Outcome 26 Overall pain/disability (change values).
15.27. Analysis.
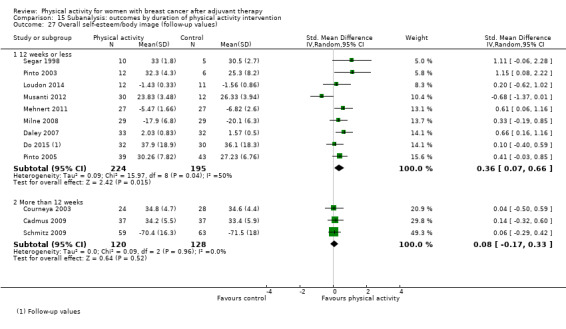
Comparison 15 Subanalysis: outcomes by duration of physical activity intervention, Outcome 27 Overall self‐esteem/body image (follow‐up values).
15.28. Analysis.
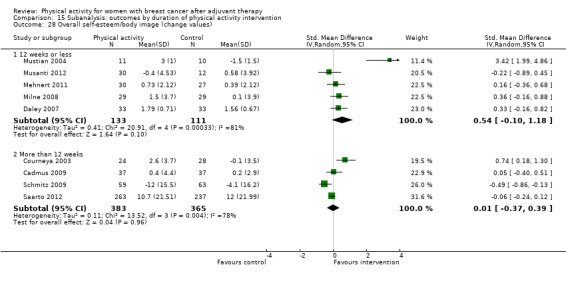
Comparison 15 Subanalysis: outcomes by duration of physical activity intervention, Outcome 28 Overall self‐esteem/body image (change values).
15.29. Analysis.

Comparison 15 Subanalysis: outcomes by duration of physical activity intervention, Outcome 29 Overall cardiorespiratory fitness (follow‐up values).
15.30. Analysis.
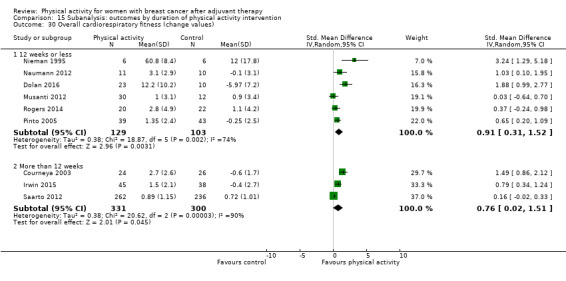
Comparison 15 Subanalysis: outcomes by duration of physical activity intervention, Outcome 30 Overall cardiorespiratory fitness (change values).
15.31. Analysis.
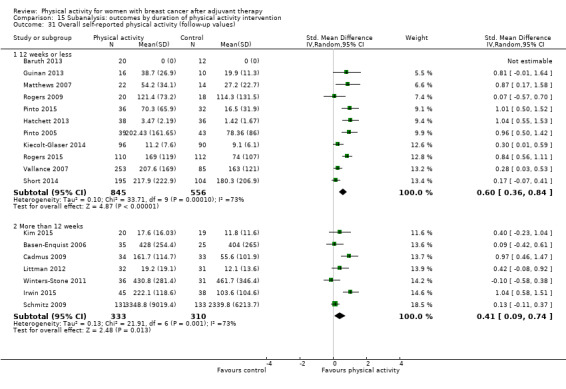
Comparison 15 Subanalysis: outcomes by duration of physical activity intervention, Outcome 31 Overall self‐reported physical activity (follow‐up values).
15.32. Analysis.

Comparison 15 Subanalysis: outcomes by duration of physical activity intervention, Outcome 32 Overall self‐reported physical activity (change values).
15.33. Analysis.
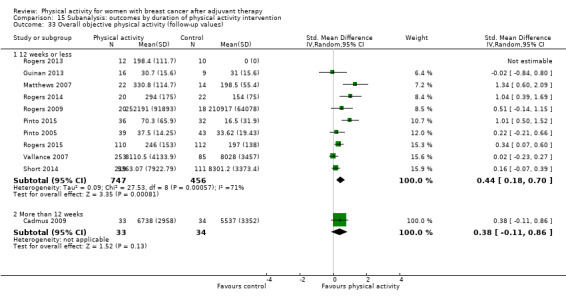
Comparison 15 Subanalysis: outcomes by duration of physical activity intervention, Outcome 33 Overall objective physical activity (follow‐up values).
15.34. Analysis.
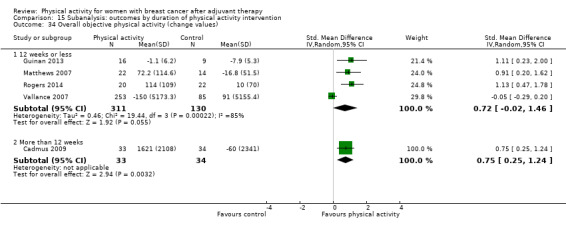
Comparison 15 Subanalysis: outcomes by duration of physical activity intervention, Outcome 34 Overall objective physical activity (change values).
15.35. Analysis.

Comparison 15 Subanalysis: outcomes by duration of physical activity intervention, Outcome 35 Mass (follow‐up values).
15.36. Analysis.
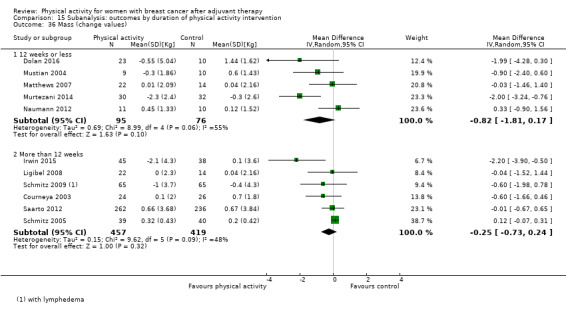
Comparison 15 Subanalysis: outcomes by duration of physical activity intervention, Outcome 36 Mass (change values).
15.37. Analysis.

Comparison 15 Subanalysis: outcomes by duration of physical activity intervention, Outcome 37 BMI (follow‐up values).
15.38. Analysis.
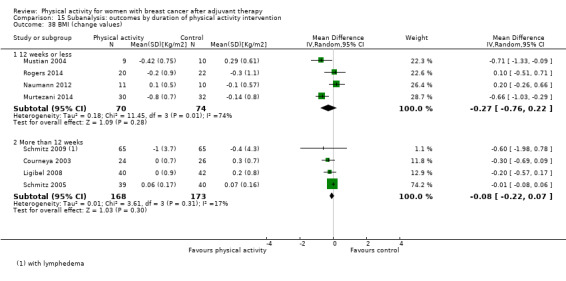
Comparison 15 Subanalysis: outcomes by duration of physical activity intervention, Outcome 38 BMI (change values).
15.39. Analysis.
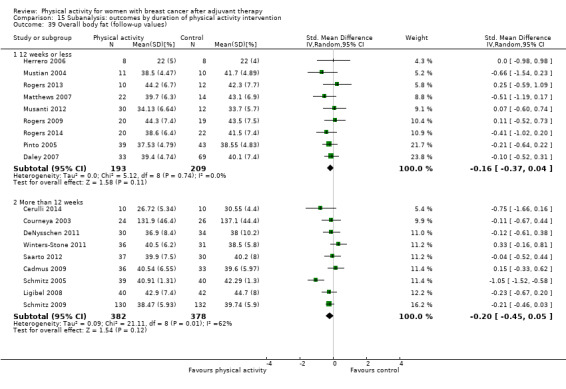
Comparison 15 Subanalysis: outcomes by duration of physical activity intervention, Outcome 39 Overall body fat (follow‐up values).
15.40. Analysis.
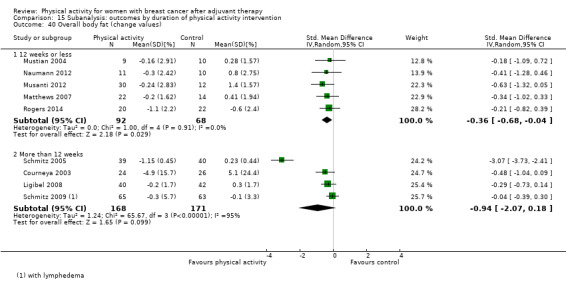
Comparison 15 Subanalysis: outcomes by duration of physical activity intervention, Outcome 40 Overall body fat (change values).
15.41. Analysis.

Comparison 15 Subanalysis: outcomes by duration of physical activity intervention, Outcome 41 Lower body strength (follow‐up values).
15.42. Analysis.
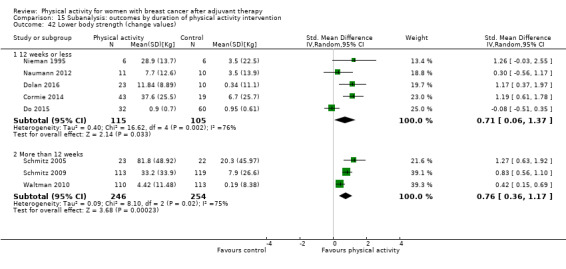
Comparison 15 Subanalysis: outcomes by duration of physical activity intervention, Outcome 42 Lower body strength (change values).
15.43. Analysis.
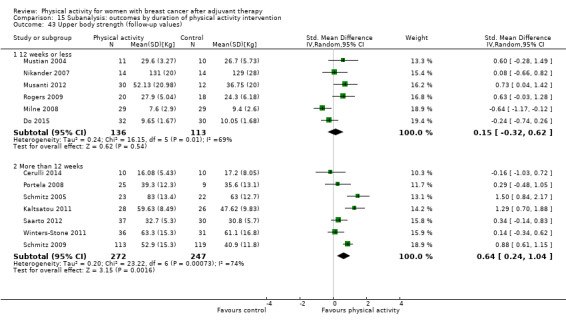
Comparison 15 Subanalysis: outcomes by duration of physical activity intervention, Outcome 43 Upper body strength (follow‐up values).
15.44. Analysis.
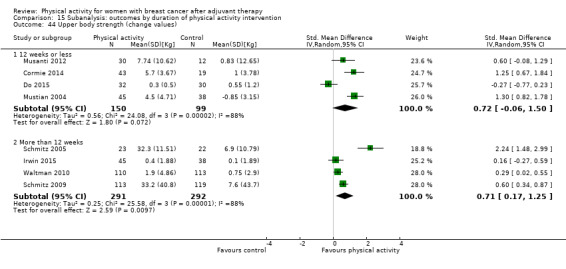
Comparison 15 Subanalysis: outcomes by duration of physical activity intervention, Outcome 44 Upper body strength (change values).
Comparison 16. Subanalysis: outcomes by format of intervention.
| Outcome or subgroup title | No. of studies | No. of participants | Statistical method | Effect size |
|---|---|---|---|---|
| 1 Overall HRQoL (follow‐up values) | 21 | Std. Mean Difference (IV, Random, 95% CI) | Subtotals only | |
| 1.1 Group format | 5 | 214 | Std. Mean Difference (IV, Random, 95% CI) | 0.99 [0.22, 1.75] |
| 1.2 Individual format | 10 | 1137 | Std. Mean Difference (IV, Random, 95% CI) | 0.21 [0.03, 0.38] |
| 1.3 Both group and individual formats | 6 | 390 | Std. Mean Difference (IV, Random, 95% CI) | 0.33 [0.04, 0.62] |
| 2 Overall HRQoL (change values) | 14 | Std. Mean Difference (IV, Random, 95% CI) | Subtotals only | |
| 2.1 Group format | 5 | 198 | Std. Mean Difference (IV, Random, 95% CI) | 1.88 [0.19, 3.56] |
| 2.2 Individual format | 6 | 649 | Std. Mean Difference (IV, Random, 95% CI) | 0.43 [0.25, 0.61] |
| 2.3 Both group and individual formats | 3 | 612 | Std. Mean Difference (IV, Random, 95% CI) | 0.06 [‐0.22, 0.33] |
| 3 Overall emotional function/mental health (follow‐up values) | 26 | Std. Mean Difference (IV, Random, 95% CI) | Subtotals only | |
| 3.1 Group format | 10 | 649 | Std. Mean Difference (IV, Random, 95% CI) | 0.28 [0.07, 0.49] |
| 3.2 Individual format | 10 | 923 | Std. Mean Difference (IV, Random, 95% CI) | 0.16 [0.02, 0.30] |
| 3.3 Both group and individual formats | 6 | 500 | Std. Mean Difference (IV, Random, 95% CI) | 0.10 [‐0.09, 0.29] |
| 4 Overall emotional function/mental health (change values) | 15 | Std. Mean Difference (IV, Random, 95% CI) | Subtotals only | |
| 4.1 Group format | 7 | 398 | Std. Mean Difference (IV, Random, 95% CI) | 0.42 [‐0.14, 0.99] |
| 4.2 Individual format | 5 | 569 | Std. Mean Difference (IV, Random, 95% CI) | 0.26 [0.08, 0.44] |
| 4.3 Both group and individual formats | 3 | 612 | Std. Mean Difference (IV, Random, 95% CI) | 0.09 [‐0.16, 0.34] |
| 5 Overall physical function (follow‐up values) | 24 | Std. Mean Difference (IV, Random, 95% CI) | Subtotals only | |
| 5.1 Group format | 9 | 588 | Std. Mean Difference (IV, Random, 95% CI) | 0.53 [0.12, 0.94] |
| 5.2 Individual format | 9 | 941 | Std. Mean Difference (IV, Random, 95% CI) | 0.28 [0.12, 0.45] |
| 5.3 Both group and individual formats | 6 | 538 | Std. Mean Difference (IV, Random, 95% CI) | 0.18 [‐0.06, 0.42] |
| 6 Overall physical function (change values) | 13 | Std. Mean Difference (IV, Random, 95% CI) | Subtotals only | |
| 6.1 Group format | 6 | 337 | Std. Mean Difference (IV, Random, 95% CI) | 1.25 [0.29, 2.21] |
| 6.2 Individual format | 3 | 432 | Std. Mean Difference (IV, Random, 95% CI) | 0.20 [‐0.01, 0.41] |
| 6.3 Both group and individual formats | 4 | 664 | Std. Mean Difference (IV, Random, 95% CI) | 0.19 [‐0.25, 0.63] |
| 7 Overall role function (follow‐up values) | 18 | Std. Mean Difference (IV, Random, 95% CI) | Subtotals only | |
| 7.1 Group format | 6 | 225 | Std. Mean Difference (IV, Random, 95% CI) | 0.52 [‐0.27, 1.30] |
| 7.2 Individual format | 7 | 689 | Std. Mean Difference (IV, Random, 95% CI) | 0.23 [0.07, 0.40] |
| 7.3 Both group and individual formats | 5 | 426 | Std. Mean Difference (IV, Random, 95% CI) | 0.15 [‐0.15, 0.45] |
| 8 Overall role function (change values) | 12 | Std. Mean Difference (IV, Random, 95% CI) | Subtotals only | |
| 8.1 Group format | 5 | 216 | Std. Mean Difference (IV, Random, 95% CI) | 0.36 [‐0.14, 0.85] |
| 8.2 Individual format | 4 | 487 | Std. Mean Difference (IV, Random, 95% CI) | 0.13 [‐0.07, 0.32] |
| 8.3 Both group and individual formats | 3 | 612 | Std. Mean Difference (IV, Random, 95% CI) | ‐0.06 [‐0.22, 0.10] |
| 9 Overall social well‐being/function (follow‐up values) | 18 | Std. Mean Difference (IV, Random, 95% CI) | Subtotals only | |
| 9.1 Group format | 7 | 348 | Std. Mean Difference (IV, Random, 95% CI) | 0.22 [0.00, 0.45] |
| 9.2 Individual format | 5 | 546 | Std. Mean Difference (IV, Random, 95% CI) | 0.27 [‐0.07, 0.61] |
| 9.3 Both group and individual formats | 6 | 663 | Std. Mean Difference (IV, Random, 95% CI) | 0.16 [0.01, 0.32] |
| 10 Overall social well‐being/function (change values) | 12 | Std. Mean Difference (IV, Random, 95% CI) | Subtotals only | |
| 10.1 Group format | 5 | 322 | Std. Mean Difference (IV, Random, 95% CI) | 0.57 [‐0.06, 1.19] |
| 10.2 Individual format | 4 | 450 | Std. Mean Difference (IV, Random, 95% CI) | 0.72 [0.38, 1.06] |
| 10.3 Both group and individual formats | 3 | 612 | Std. Mean Difference (IV, Random, 95% CI) | 0.27 [‐0.31, 0.85] |
| 11 Overall cognitive function (follow‐up values) | 5 | Std. Mean Difference (IV, Random, 95% CI) | Subtotals only | |
| 11.1 Group format | 3 | 134 | Std. Mean Difference (IV, Random, 95% CI) | 0.32 [‐0.02, 0.66] |
| 11.2 Individual format | 1 | 18 | Std. Mean Difference (IV, Random, 95% CI) | 1.14 [0.07, 2.20] |
| 11.3 Both group and individual formats | 1 | 37 | Std. Mean Difference (IV, Random, 95% CI) | 0.42 [‐0.24, 1.07] |
| 12 Overall cognitive function (change values) | 5 | Std. Mean Difference (IV, Random, 95% CI) | Subtotals only | |
| 12.1 Group format | 3 | 134 | Std. Mean Difference (IV, Random, 95% CI) | 0.06 [‐0.31, 0.43] |
| 12.2 Individual format | 0 | 0 | Std. Mean Difference (IV, Random, 95% CI) | 0.0 [0.0, 0.0] |
| 12.3 Both group and individual formats | 2 | 538 | Std. Mean Difference (IV, Random, 95% CI) | 0.03 [‐0.51, 0.57] |
| 13 Overall general health (follow‐up values) | 9 | Std. Mean Difference (IV, Random, 95% CI) | Subtotals only | |
| 13.1 Group format | 3 | 92 | Std. Mean Difference (IV, Random, 95% CI) | 0.38 [‐0.31, 1.07] |
| 13.2 Individual format | 4 | 222 | Std. Mean Difference (IV, Random, 95% CI) | 0.34 [‐0.08, 0.76] |
| 13.3 Both group and individual formats | 2 | 112 | Std. Mean Difference (IV, Random, 95% CI) | ‐0.26 [‐0.64, 0.11] |
| 14 Overall general health (change values) | 9 | Std. Mean Difference (IV, Random, 95% CI) | Subtotals only | |
| 14.1 Group format | 4 | 155 | Std. Mean Difference (IV, Random, 95% CI) | 0.35 [‐0.25, 0.95] |
| 14.2 Individual format | 2 | 139 | Std. Mean Difference (IV, Random, 95% CI) | 0.38 [0.04, 0.73] |
| 14.3 Both group and individual formats | 3 | 612 | Std. Mean Difference (IV, Random, 95% CI) | ‐0.07 [‐0.23, 0.09] |
| 15 Overall sexual function (follow‐up values) | 5 | Std. Mean Difference (IV, Fixed, 95% CI) | Subtotals only | |
| 15.1 Group format | 1 | 114 | Std. Mean Difference (IV, Fixed, 95% CI) | 0.14 [‐0.23, 0.51] |
| 15.2 Individual format | 4 | 297 | Std. Mean Difference (IV, Fixed, 95% CI) | 0.17 [‐0.06, 0.40] |
| 15.3 Both group and individual formats | 0 | 0 | Std. Mean Difference (IV, Fixed, 95% CI) | 0.0 [0.0, 0.0] |
| 16 Overall sleep (follow‐up values) | 5 | Std. Mean Difference (IV, Fixed, 95% CI) | Subtotals only | |
| 16.1 Group format | 2 | 88 | Std. Mean Difference (IV, Fixed, 95% CI) | ‐0.26 [‐0.68, 0.16] |
| 16.2 Individual format | 2 | 62 | Std. Mean Difference (IV, Fixed, 95% CI) | ‐0.07 [‐0.57, 0.43] |
| 16.3 Both group and individual formats | 1 | 38 | Std. Mean Difference (IV, Fixed, 95% CI) | 0.28 [‐0.36, 0.92] |
| 17 Overall anxiety (follow‐up values) | 6 | Std. Mean Difference (IV, Random, 95% CI) | Subtotals only | |
| 17.1 Group format | 3 | 177 | Std. Mean Difference (IV, Random, 95% CI) | ‐0.73 [‐1.03, ‐0.42] |
| 17.2 Individual format | 2 | 60 | Std. Mean Difference (IV, Random, 95% CI) | ‐0.13 [‐0.64, 0.39] |
| 17.3 Both group and individual formats | 1 | 74 | Std. Mean Difference (IV, Random, 95% CI) | ‐0.14 [‐0.60, 0.31] |
| 18 Overall anxiety (change values) | 4 | Std. Mean Difference (IV, Fixed, 95% CI) | Subtotals only | |
| 18.1 Group format | 2 | 119 | Std. Mean Difference (IV, Fixed, 95% CI) | ‐0.52 [‐0.88, ‐0.15] |
| 18.2 Individual format | 1 | 42 | Std. Mean Difference (IV, Fixed, 95% CI) | ‐0.37 [‐0.99, 0.24] |
| 18.3 Both group and individual formats | 1 | 74 | Std. Mean Difference (IV, Fixed, 95% CI) | ‐0.15 [‐0.61, 0.30] |
| 19 Overall depression (change values) | 7 | Std. Mean Difference (IV, Random, 95% CI) | Subtotals only | |
| 19.1 Group format | 2 | 119 | Std. Mean Difference (IV, Random, 95% CI) | ‐0.54 [‐0.91, ‐0.18] |
| 19.2 Individual format | 3 | 123 | Std. Mean Difference (IV, Random, 95% CI) | ‐0.51 [‐1.03, 0.01] |
| 19.3 Both group and individual formats | 2 | 574 | Std. Mean Difference (IV, Random, 95% CI) | 0.00 [‐0.21, 0.22] |
| 20 Overall depression (follow‐up values) | 11 | Std. Mean Difference (IV, Random, 95% CI) | Subtotals only | |
| 20.1 Group format | 4 | 176 | Std. Mean Difference (IV, Random, 95% CI) | ‐0.68 [‐0.98, ‐0.37] |
| 20.2 Individual format | 5 | 206 | Std. Mean Difference (IV, Random, 95% CI) | ‐0.01 [‐0.51, 0.49] |
| 20.3 Both group and individual formats | 2 | 260 | Std. Mean Difference (IV, Random, 95% CI) | ‐0.13 [‐0.37, 0.12] |
| 21 Overall fatigue (follow‐up values) | 24 | Std. Mean Difference (IV, Random, 95% CI) | Subtotals only | |
| 21.1 Group format | 7 | 350 | Std. Mean Difference (IV, Random, 95% CI) | ‐0.77 [‐1.15, ‐0.39] |
| 21.2 Individual format | 11 | 1068 | Std. Mean Difference (IV, Random, 95% CI) | ‐0.19 [‐0.36, ‐0.02] |
| 21.3 Both group and individual formats | 6 | 445 | Std. Mean Difference (IV, Random, 95% CI) | ‐0.18 [‐0.37, 0.01] |
| 22 Overall fatigue (change values) | 12 | Std. Mean Difference (IV, Random, 95% CI) | Subtotals only | |
| 22.1 Group format | 2 | 73 | Std. Mean Difference (IV, Random, 95% CI) | ‐0.10 [‐0.70, 0.50] |
| 22.2 Individual format | 7 | 637 | Std. Mean Difference (IV, Random, 95% CI) | ‐0.40 [‐0.98, 0.17] |
| 22.3 Both group and individual formats | 3 | 561 | Std. Mean Difference (IV, Random, 95% CI) | ‐0.02 [‐0.18, 0.15] |
| 23 Overall pain/disability (follow‐up values) | 8 | Std. Mean Difference (IV, Random, 95% CI) | Subtotals only | |
| 23.1 Group format | 2 | 77 | Std. Mean Difference (IV, Random, 95% CI) | 0.18 [‐0.26, 0.63] |
| 23.2 Individual format | 3 | 261 | Std. Mean Difference (IV, Random, 95% CI) | 0.22 [‐0.22, 0.65] |
| 23.3 Both group and individual formats | 3 | 135 | Std. Mean Difference (IV, Random, 95% CI) | ‐0.16 [‐0.50, 0.18] |
| 24 Overall pain/disability (change values) | 3 | Std. Mean Difference (IV, Random, 95% CI) | Subtotals only | |
| 24.1 Group format | 3 | 139 | Std. Mean Difference (IV, Random, 95% CI) | 0.16 [‐0.19, 0.50] |
| 24.2 Individual format | 0 | 0 | Std. Mean Difference (IV, Random, 95% CI) | 0.0 [0.0, 0.0] |
| 24.3 Both group and individual formats | 0 | 0 | Std. Mean Difference (IV, Random, 95% CI) | 0.0 [0.0, 0.0] |
| 25 Overall self‐esteem/body image (follow‐up values) | 10 | Std. Mean Difference (IV, Random, 95% CI) | Subtotals only | |
| 25.1 Group format | 3 | 234 | Std. Mean Difference (IV, Random, 95% CI) | 0.28 [‐0.04, 0.60] |
| 25.2 Individual format | 5 | 259 | Std. Mean Difference (IV, Random, 95% CI) | 0.27 [‐0.21, 0.76] |
| 25.3 Both group and individual formats | 2 | 97 | Std. Mean Difference (IV, Random, 95% CI) | 0.15 [‐0.25, 0.55] |
| 26 Overall self‐esteem/body image (change values) | 9 | Std. Mean Difference (IV, Random, 95% CI) | Subtotals only | |
| 26.1 Group format | 4 | 258 | Std. Mean Difference (IV, Random, 95% CI) | 0.59 [‐0.33, 1.51] |
| 26.2 Individual format | 3 | 160 | Std. Mean Difference (IV, Random, 95% CI) | 0.31 [‐0.19, 0.81] |
| 26.3 Both group and individual formats | 2 | 574 | Std. Mean Difference (IV, Random, 95% CI) | ‐0.05 [‐0.21, 0.12] |
| 27 Overall cardiorespiratory fitness (follow‐up values) | 21 | Std. Mean Difference (IV, Random, 95% CI) | Subtotals only | |
| 27.1 Group format | 7 | 321 | Std. Mean Difference (IV, Random, 95% CI) | 0.29 [0.06, 0.51] |
| 27.2 Individual format | 10 | 493 | Std. Mean Difference (IV, Random, 95% CI) | 0.59 [0.38, 0.79] |
| 27.3 Both group and individual formats | 4 | 362 | Std. Mean Difference (IV, Random, 95% CI) | 0.24 [0.03, 0.44] |
| 28 Overall cardiorespiratory fitness (change values) | 6 | Std. Mean Difference (IV, Random, 95% CI) | Subtotals only | |
| 28.1 Group format | 0 | 0 | Std. Mean Difference (IV, Random, 95% CI) | 0.0 [0.0, 0.0] |
| 28.2 Individual format | 4 | 216 | Std. Mean Difference (IV, Random, 95% CI) | 0.64 [0.08, 1.19] |
| 28.3 Both group and individual formats | 2 | 581 | Std. Mean Difference (IV, Random, 95% CI) | 0.44 [‐0.18, 1.05] |
| 29 Overall self‐reported physical activity (follow‐up values) | 17 | Std. Mean Difference (IV, Random, 95% CI) | Subtotals only | |
| 29.1 Group format | 1 | 264 | Std. Mean Difference (IV, Random, 95% CI) | 0.13 [‐0.11, 0.37] |
| 29.2 Individual format | 8 | 989 | Std. Mean Difference (IV, Random, 95% CI) | 0.59 [0.28, 0.90] |
| 29.3 Both group and individual formats | 8 | 752 | Std. Mean Difference (IV, Random, 95% CI) | 0.55 [0.25, 0.84] |
| 30 Overall self‐reported physical activity (change values) | 8 | Std. Mean Difference (IV, Random, 95% CI) | Subtotals only | |
| 30.1 Group format | 1 | 105 | Std. Mean Difference (IV, Random, 95% CI) | 0.21 [‐0.17, 0.60] |
| 30.2 Individual format | 3 | 495 | Std. Mean Difference (IV, Random, 95% CI) | 0.38 [0.18, 0.57] |
| 30.3 Both group and individual formats | 4 | 674 | Std. Mean Difference (IV, Random, 95% CI) | 0.92 [0.14, 1.70] |
| 31 Overall objective physical activity (follow‐up values) | 12 | Std. Mean Difference (IV, Random, 95% CI) | Subtotals only | |
| 31.1 Group format | 0 | 0 | Std. Mean Difference (IV, Random, 95% CI) | 0.0 [0.0, 0.0] |
| 31.2 Individual format | 8 | 957 | Std. Mean Difference (IV, Random, 95% CI) | 0.51 [0.18, 0.85] |
| 31.3 Both group and individual formats | 4 | 352 | Std. Mean Difference (IV, Random, 95% CI) | 0.34 [0.13, 0.55] |
| 32 Overall objective physical activity (change values) | 5 | Std. Mean Difference (IV, Random, 95% CI) | Subtotals only | |
| 32.1 Group format | 0 | 0 | Std. Mean Difference (IV, Random, 95% CI) | 0.0 [0.0, 0.0] |
| 32.2 Individual format | 3 | 416 | Std. Mean Difference (IV, Random, 95% CI) | 0.62 [‐0.23, 1.46] |
| 32.3 Both group and individual formats | 2 | 92 | Std. Mean Difference (IV, Random, 95% CI) | 0.83 [0.40, 1.27] |
| 33 Mass (follow‐up values) | 15 | Mean Difference (IV, Fixed, 95% CI) | Subtotals only | |
| 33.1 Group format | 4 | 363 | Mean Difference (IV, Fixed, 95% CI) | ‐1.10 [‐3.92, 1.72] |
| 33.2 Individual format | 5 | 331 | Mean Difference (IV, Fixed, 95% CI) | 0.16 [‐0.79, 1.10] |
| 33.3 Both group and individual formats | 6 | 487 | Mean Difference (IV, Fixed, 95% CI) | ‐0.00 [‐0.76, 0.76] |
| 34 Mass (change values) | 10 | Mean Difference (IV, Random, 95% CI) | Subtotals only | |
| 34.1 Group format | 3 | 211 | Mean Difference (IV, Random, 95% CI) | ‐1.23 [‐2.10, ‐0.35] |
| 34.2 Individual format | 4 | 186 | Mean Difference (IV, Random, 95% CI) | 0.10 [‐0.08, 0.28] |
| 34.3 Both group and individual formats | 3 | 617 | Mean Difference (IV, Random, 95% CI) | ‐0.58 [‐1.80, 0.63] |
| 35 BMI (follow‐up values) | 16 | Mean Difference (IV, Fixed, 95% CI) | Subtotals only | |
| 35.1 Group format | 3 | 347 | Mean Difference (IV, Fixed, 95% CI) | ‐0.71 [‐1.74, 0.32] |
| 35.2 Individual format | 7 | 647 | Mean Difference (IV, Fixed, 95% CI) | 0.13 [‐0.18, 0.44] |
| 35.3 Both group and individual formats | 6 | 458 | Mean Difference (IV, Fixed, 95% CI) | ‐0.03 [‐0.31, 0.26] |
| 36 BMI (change values) | 8 | Mean Difference (IV, Random, 95% CI) | Subtotals only | |
| 36.1 Group format | 3 | 211 | Mean Difference (IV, Random, 95% CI) | ‐0.67 [‐0.98, ‐0.36] |
| 36.2 Individual format | 3 | 150 | Mean Difference (IV, Random, 95% CI) | ‐0.03 [‐0.22, 0.15] |
| 36.3 Both group and individual formats | 2 | 124 | Mean Difference (IV, Random, 95% CI) | ‐0.12 [‐0.43, 0.20] |
| 37 Overall body fat (follow‐up values) | 18 | Std. Mean Difference (IV, Random, 95% CI) | Subtotals only | |
| 37.1 Group format | 3 | 299 | Std. Mean Difference (IV, Random, 95% CI) | ‐0.23 [‐0.46, ‐0.00] |
| 37.2 Individual format | 10 | 539 | Std. Mean Difference (IV, Random, 95% CI) | ‐0.30 [‐0.54, ‐0.06] |
| 37.3 Both group and individual formats | 5 | 324 | Std. Mean Difference (IV, Random, 95% CI) | 0.05 [‐0.17, 0.26] |
| 38 Overall body fat (change values) | 9 | Std. Mean Difference (IV, Random, 95% CI) | Subtotals only | |
| 38.1 Group format | 2 | 147 | Std. Mean Difference (IV, Random, 95% CI) | ‐0.06 [‐0.38, 0.26] |
| 38.2 Individual format | 6 | 270 | Std. Mean Difference (IV, Random, 95% CI) | ‐0.86 [‐1.74, 0.02] |
| 38.3 Both group and individual formats | 1 | 82 | Std. Mean Difference (IV, Random, 95% CI) | ‐0.29 [‐0.73, 0.14] |
| 39 Lower body strength (follow‐up values) | 9 | Std. Mean Difference (IV, Random, 95% CI) | Subtotals only | |
| 39.1 Group format | 2 | 290 | Std. Mean Difference (IV, Random, 95% CI) | 0.69 [0.29, 1.10] |
| 39.2 Individual format | 3 | 85 | Std. Mean Difference (IV, Random, 95% CI) | 1.04 [0.08, 2.00] |
| 39.3 Both group and individual formats | 4 | 200 | Std. Mean Difference (IV, Random, 95% CI) | 0.13 [‐0.22, 0.47] |
| 40 Lower body strength (change values) | 5 | Std. Mean Difference (IV, Random, 95% CI) | Subtotals only | |
| 40.1 Group format | 2 | 294 | Std. Mean Difference (IV, Random, 95% CI) | 0.92 [0.61, 1.22] |
| 40.2 Individual format | 3 | 289 | Std. Mean Difference (IV, Random, 95% CI) | 0.65 [0.09, 1.22] |
| 40.3 Both group and individual formats | 0 | 0 | Std. Mean Difference (IV, Random, 95% CI) | 0.0 [0.0, 0.0] |
| 41 Upper body strength (follow‐up values) | 12 | Std. Mean Difference (IV, Random, 95% CI) | Subtotals only | |
| 41.1 Group format | 4 | 365 | Std. Mean Difference (IV, Random, 95% CI) | 0.53 [‐0.29, 1.35] |
| 41.2 Individual format | 4 | 141 | Std. Mean Difference (IV, Random, 95% CI) | 0.63 [‐0.06, 1.32] |
| 41.3 Both group and individual formats | 4 | 200 | Std. Mean Difference (IV, Random, 95% CI) | 0.29 [0.01, 0.57] |
| 42 Upper body strength (change values) | 7 | Std. Mean Difference (IV, Random, 95% CI) | Subtotals only | |
| 42.1 Group format | 3 | 377 | Std. Mean Difference (IV, Random, 95% CI) | 1.01 [0.49, 1.53] |
| 42.2 Individual format | 3 | 310 | Std. Mean Difference (IV, Random, 95% CI) | 1.00 [‐0.08, 2.09] |
| 42.3 Both group and individual formats | 1 | 83 | Std. Mean Difference (IV, Random, 95% CI) | 0.16 [‐0.27, 0.59] |
| 43 Bone mineral density ‐ femoral neck (follow‐up and change values) | 4 | Std. Mean Difference (IV, Random, 95% CI) | Subtotals only | |
| 43.1 Group format | 0 | 0 | Std. Mean Difference (IV, Random, 95% CI) | 0.0 [0.0, 0.0] |
| 43.2 Individual format | 2 | 262 | Std. Mean Difference (IV, Random, 95% CI) | 0.17 [‐0.80, 1.14] |
| 43.3 Both group and individual formats | 2 | 524 | Std. Mean Difference (IV, Random, 95% CI) | 0.17 [0.00, 0.34] |
| 44 Bone mineral density ‐ lumbar spine (follow‐up and change values) | 4 | Std. Mean Difference (IV, Random, 95% CI) | Subtotals only | |
| 44.1 Group format | 0 | 0 | Std. Mean Difference (IV, Random, 95% CI) | 0.0 [0.0, 0.0] |
| 44.2 Individual format | 2 | 262 | Std. Mean Difference (IV, Random, 95% CI) | 0.20 [‐0.59, 0.98] |
| 44.3 Both group and individual formats | 2 | 524 | Std. Mean Difference (IV, Random, 95% CI) | 0.12 [‐0.06, 0.29] |
| 45 Bone mineral density ‐ total hip (follow‐up and change values) | 3 | Std. Mean Difference (IV, Random, 95% CI) | Subtotals only | |
| 45.1 Group format | 0 | 0 | Std. Mean Difference (IV, Random, 95% CI) | 0.0 [0.0, 0.0] |
| 45.2 Individual format | 1 | 39 | Std. Mean Difference (IV, Random, 95% CI) | 10.34 [7.84, 12.84] |
| 45.3 Both group and individual formats | 2 | 290 | Std. Mean Difference (IV, Random, 95% CI) | 0.64 [‐0.20, 1.48] |
16.3. Analysis.

Comparison 16 Subanalysis: outcomes by format of intervention, Outcome 3 Overall emotional function/mental health (follow‐up values).
16.4. Analysis.
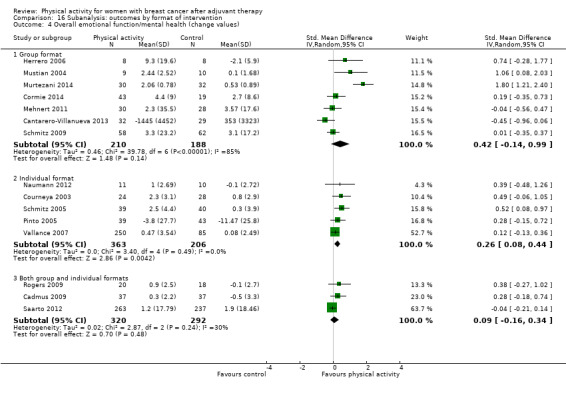
Comparison 16 Subanalysis: outcomes by format of intervention, Outcome 4 Overall emotional function/mental health (change values).
16.5. Analysis.

Comparison 16 Subanalysis: outcomes by format of intervention, Outcome 5 Overall physical function (follow‐up values).
16.6. Analysis.

Comparison 16 Subanalysis: outcomes by format of intervention, Outcome 6 Overall physical function (change values).
16.7. Analysis.

Comparison 16 Subanalysis: outcomes by format of intervention, Outcome 7 Overall role function (follow‐up values).
16.8. Analysis.
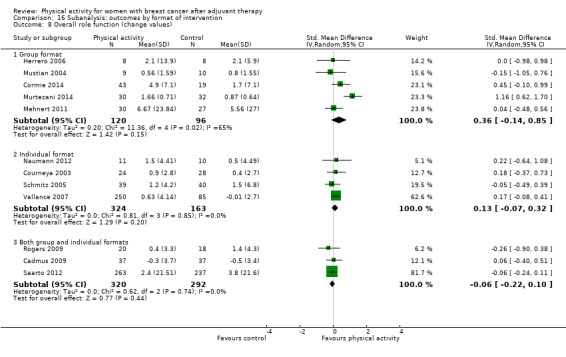
Comparison 16 Subanalysis: outcomes by format of intervention, Outcome 8 Overall role function (change values).
16.9. Analysis.

Comparison 16 Subanalysis: outcomes by format of intervention, Outcome 9 Overall social well‐being/function (follow‐up values).
16.10. Analysis.
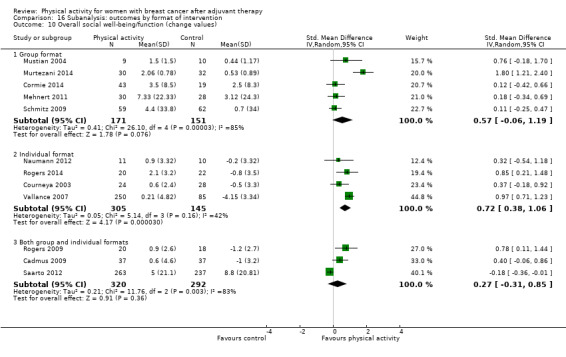
Comparison 16 Subanalysis: outcomes by format of intervention, Outcome 10 Overall social well‐being/function (change values).
16.11. Analysis.
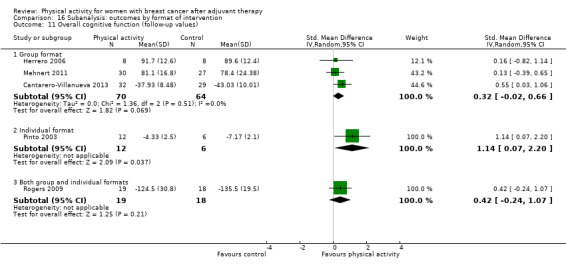
Comparison 16 Subanalysis: outcomes by format of intervention, Outcome 11 Overall cognitive function (follow‐up values).
16.12. Analysis.

Comparison 16 Subanalysis: outcomes by format of intervention, Outcome 12 Overall cognitive function (change values).
16.13. Analysis.

Comparison 16 Subanalysis: outcomes by format of intervention, Outcome 13 Overall general health (follow‐up values).
16.14. Analysis.

Comparison 16 Subanalysis: outcomes by format of intervention, Outcome 14 Overall general health (change values).
16.15. Analysis.
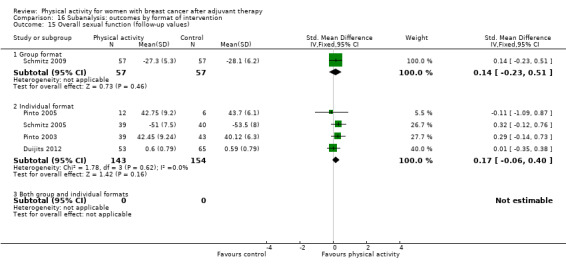
Comparison 16 Subanalysis: outcomes by format of intervention, Outcome 15 Overall sexual function (follow‐up values).
16.16. Analysis.
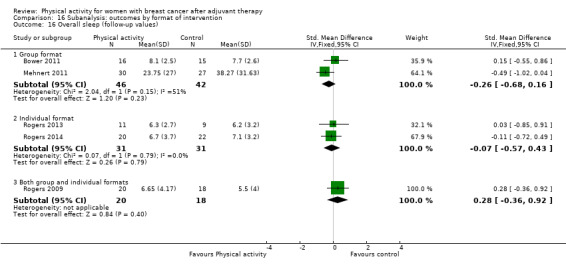
Comparison 16 Subanalysis: outcomes by format of intervention, Outcome 16 Overall sleep (follow‐up values).
16.17. Analysis.
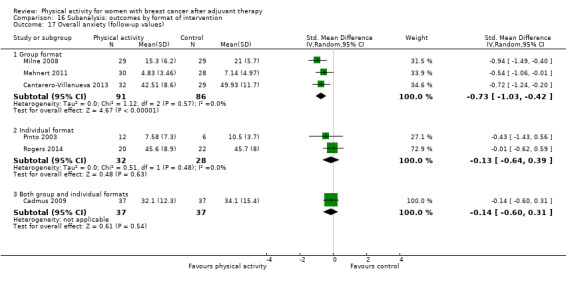
Comparison 16 Subanalysis: outcomes by format of intervention, Outcome 17 Overall anxiety (follow‐up values).
16.18. Analysis.

Comparison 16 Subanalysis: outcomes by format of intervention, Outcome 18 Overall anxiety (change values).
16.19. Analysis.
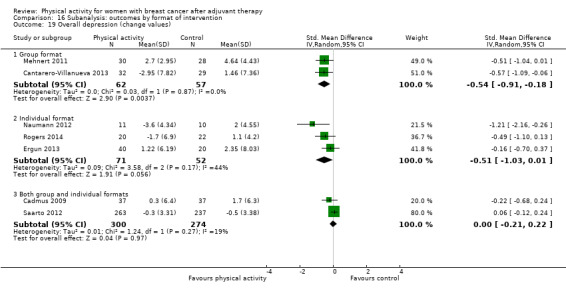
Comparison 16 Subanalysis: outcomes by format of intervention, Outcome 19 Overall depression (change values).
16.20. Analysis.
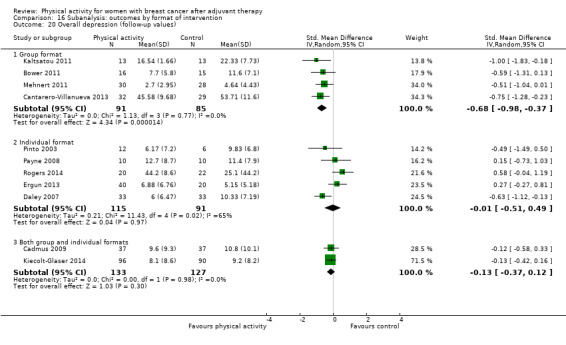
Comparison 16 Subanalysis: outcomes by format of intervention, Outcome 20 Overall depression (follow‐up values).
16.21. Analysis.
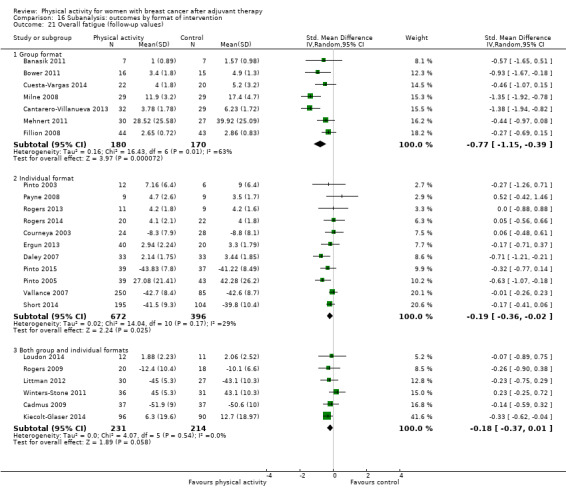
Comparison 16 Subanalysis: outcomes by format of intervention, Outcome 21 Overall fatigue (follow‐up values).
16.22. Analysis.

Comparison 16 Subanalysis: outcomes by format of intervention, Outcome 22 Overall fatigue (change values).
16.23. Analysis.

Comparison 16 Subanalysis: outcomes by format of intervention, Outcome 23 Overall pain/disability (follow‐up values).
16.24. Analysis.
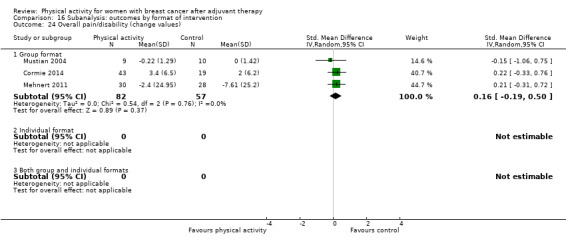
Comparison 16 Subanalysis: outcomes by format of intervention, Outcome 24 Overall pain/disability (change values).
16.25. Analysis.

Comparison 16 Subanalysis: outcomes by format of intervention, Outcome 25 Overall self‐esteem/body image (follow‐up values).
16.26. Analysis.

Comparison 16 Subanalysis: outcomes by format of intervention, Outcome 26 Overall self‐esteem/body image (change values).
16.27. Analysis.

Comparison 16 Subanalysis: outcomes by format of intervention, Outcome 27 Overall cardiorespiratory fitness (follow‐up values).
16.28. Analysis.

Comparison 16 Subanalysis: outcomes by format of intervention, Outcome 28 Overall cardiorespiratory fitness (change values).
16.29. Analysis.

Comparison 16 Subanalysis: outcomes by format of intervention, Outcome 29 Overall self‐reported physical activity (follow‐up values).
16.30. Analysis.

Comparison 16 Subanalysis: outcomes by format of intervention, Outcome 30 Overall self‐reported physical activity (change values).
16.31. Analysis.

Comparison 16 Subanalysis: outcomes by format of intervention, Outcome 31 Overall objective physical activity (follow‐up values).
16.32. Analysis.

Comparison 16 Subanalysis: outcomes by format of intervention, Outcome 32 Overall objective physical activity (change values).
16.33. Analysis.

Comparison 16 Subanalysis: outcomes by format of intervention, Outcome 33 Mass (follow‐up values).
16.34. Analysis.
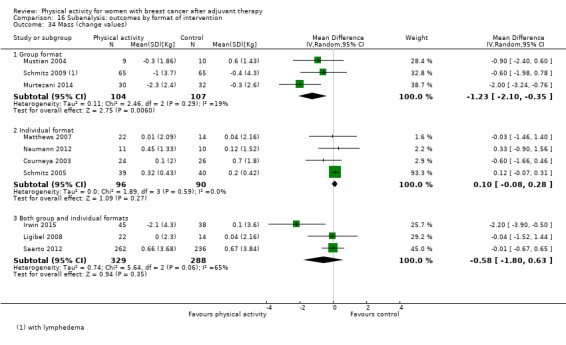
Comparison 16 Subanalysis: outcomes by format of intervention, Outcome 34 Mass (change values).
16.35. Analysis.

Comparison 16 Subanalysis: outcomes by format of intervention, Outcome 35 BMI (follow‐up values).
16.36. Analysis.

Comparison 16 Subanalysis: outcomes by format of intervention, Outcome 36 BMI (change values).
16.37. Analysis.

Comparison 16 Subanalysis: outcomes by format of intervention, Outcome 37 Overall body fat (follow‐up values).
16.38. Analysis.

Comparison 16 Subanalysis: outcomes by format of intervention, Outcome 38 Overall body fat (change values).
16.39. Analysis.
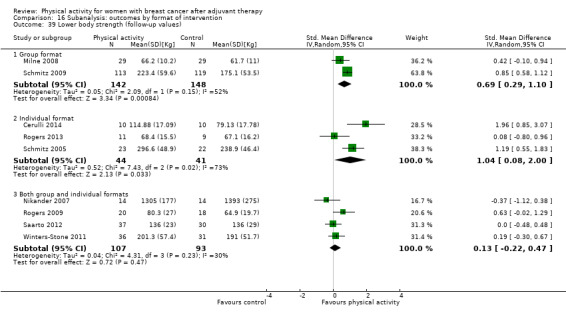
Comparison 16 Subanalysis: outcomes by format of intervention, Outcome 39 Lower body strength (follow‐up values).
16.40. Analysis.
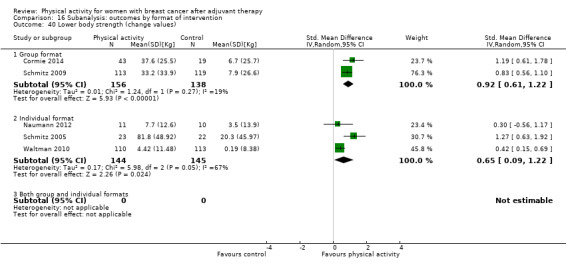
Comparison 16 Subanalysis: outcomes by format of intervention, Outcome 40 Lower body strength (change values).
16.41. Analysis.

Comparison 16 Subanalysis: outcomes by format of intervention, Outcome 41 Upper body strength (follow‐up values).
16.42. Analysis.
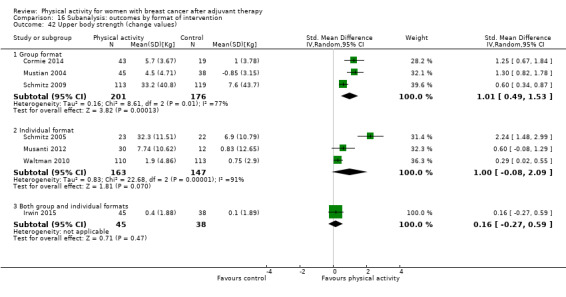
Comparison 16 Subanalysis: outcomes by format of intervention, Outcome 42 Upper body strength (change values).
16.43. Analysis.

Comparison 16 Subanalysis: outcomes by format of intervention, Outcome 43 Bone mineral density ‐ femoral neck (follow‐up and change values).
16.44. Analysis.
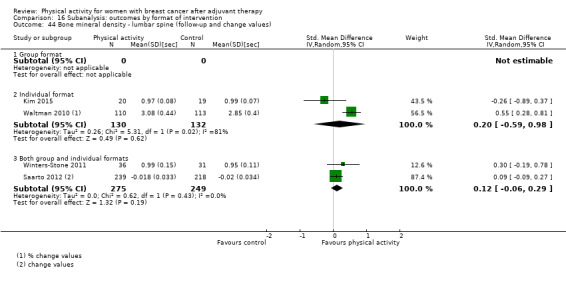
Comparison 16 Subanalysis: outcomes by format of intervention, Outcome 44 Bone mineral density ‐ lumbar spine (follow‐up and change values).
16.45. Analysis.

Comparison 16 Subanalysis: outcomes by format of intervention, Outcome 45 Bone mineral density ‐ total hip (follow‐up and change values).
Comparison 17. Subanalysis: outcomes by setting of intervention.
| Outcome or subgroup title | No. of studies | No. of participants | Statistical method | Effect size |
|---|---|---|---|---|
| 1 Overall HRQoL (follow‐up values) | 22 | Std. Mean Difference (IV, Random, 95% CI) | Subtotals only | |
| 1.1 Home‐based | 5 | 792 | Std. Mean Difference (IV, Random, 95% CI) | 0.04 [‐0.11, 0.19] |
| 1.2 Facility‐based | 15 | 833 | Std. Mean Difference (IV, Random, 95% CI) | 0.55 [0.27, 0.83] |
| 1.3 Both home‐ and facility‐based | 4 | 227 | Std. Mean Difference (IV, Random, 95% CI) | 0.48 [0.04, 0.92] |
| 2 Overall HRQoL (change values) | 14 | Std. Mean Difference (IV, Random, 95% CI) | Subtotals only | |
| 2.1 Home‐based | 2 | 375 | Std. Mean Difference (IV, Random, 95% CI) | 0.27 [0.04, 0.50] |
| 2.2 Facility‐based | 10 | 492 | Std. Mean Difference (IV, Random, 95% CI) | 1.18 [0.53, 1.82] |
| 2.3 Both home‐ and facility‐based | 3 | 612 | Std. Mean Difference (IV, Random, 95% CI) | 0.06 [‐0.22, 0.33] |
| 3 Overall emotional function/mental health (follow‐up values) | 26 | Std. Mean Difference (IV, Random, 95% CI) | Subtotals only | |
| 3.1 Home‐based | 5 | 670 | Std. Mean Difference (IV, Random, 95% CI) | 0.11 [‐0.06, 0.27] |
| 3.2 Facility‐based | 15 | 901 | Std. Mean Difference (IV, Random, 95% CI) | 0.31 [0.12, 0.50] |
| 3.3 Both home‐ and facility‐based | 6 | 531 | Std. Mean Difference (IV, Random, 95% CI) | 0.15 [‐0.04, 0.34] |
| 4 Overall emotional function/mental health (change values) | 15 | Std. Mean Difference (IV, Random, 95% CI) | Subtotals only | |
| 4.1 Home‐based | 2 | 417 | Std. Mean Difference (IV, Random, 95% CI) | 0.16 [‐0.06, 0.37] |
| 4.2 Facility‐based | 10 | 550 | Std. Mean Difference (IV, Random, 95% CI) | 0.43 [0.04, 0.82] |
| 4.3 Both home‐ and facility‐based | 3 | 612 | Std. Mean Difference (IV, Random, 95% CI) | 0.09 [‐0.16, 0.34] |
| 5 Overall physical function (follow‐up values) | 25 | Std. Mean Difference (IV, Random, 95% CI) | Subtotals only | |
| 5.1 Home‐based | 5 | 720 | Std. Mean Difference (IV, Random, 95% CI) | 0.19 [0.03, 0.34] |
| 5.2 Facility‐based | 13 | 816 | Std. Mean Difference (IV, Random, 95% CI) | 0.43 [0.14, 0.73] |
| 5.3 Both home‐ and facility‐based | 7 | 592 | Std. Mean Difference (IV, Random, 95% CI) | 0.23 [‐0.02, 0.48] |
| 6 Overall physical function (change values) | 13 | Std. Mean Difference (IV, Random, 95% CI) | Subtotals only | |
| 6.1 Home‐based | 1 | 332 | Std. Mean Difference (IV, Random, 95% CI) | 0.26 [0.02, 0.51] |
| 6.2 Facility‐based | 9 | 489 | Std. Mean Difference (IV, Random, 95% CI) | 0.95 [0.31, 1.59] |
| 6.3 Both home‐ and facility‐based | 3 | 612 | Std. Mean Difference (IV, Random, 95% CI) | ‐0.08 [‐0.24, 0.08] |
| 7 Overall role function (follow‐up values) | 18 | Std. Mean Difference (IV, Random, 95% CI) | Subtotals only | |
| 7.1 Home‐based | 2 | 386 | Std. Mean Difference (IV, Random, 95% CI) | 0.26 [‐0.14, 0.66] |
| 7.2 Facility‐based | 12 | 564 | Std. Mean Difference (IV, Random, 95% CI) | 0.33 [‐0.03, 0.69] |
| 7.3 Both home‐ and facility‐based | 4 | 420 | Std. Mean Difference (IV, Random, 95% CI) | 0.20 [‐0.14, 0.54] |
| 8 Overall role function (change values) | 12 | Std. Mean Difference (IV, Random, 95% CI) | Subtotals only | |
| 8.1 Home‐based | 1 | 335 | Std. Mean Difference (IV, Random, 95% CI) | 0.17 [‐0.08, 0.41] |
| 8.2 Facility‐based | 8 | 368 | Std. Mean Difference (IV, Random, 95% CI) | 0.26 [‐0.06, 0.58] |
| 8.3 Both home‐ and facility‐based | 3 | 612 | Std. Mean Difference (IV, Random, 95% CI) | ‐0.06 [‐0.22, 0.10] |
| 9 Overall social well‐being/function (follow‐up values) | 18 | Std. Mean Difference (IV, Random, 95% CI) | Subtotals only | |
| 9.1 Home‐based | 2 | 386 | Std. Mean Difference (IV, Random, 95% CI) | ‐0.01 [‐0.23, 0.22] |
| 9.2 Facility‐based | 11 | 709 | Std. Mean Difference (IV, Random, 95% CI) | 0.22 [0.07, 0.37] |
| 9.3 Both home‐ and facility‐based | 5 | 462 | Std. Mean Difference (IV, Random, 95% CI) | 0.31 [0.03, 0.59] |
| 10 Overall social well‐being/function (change values) | 12 | Std. Mean Difference (IV, Random, 95% CI) | Subtotals only | |
| 10.1 Home‐based | 1 | 335 | Std. Mean Difference (IV, Random, 95% CI) | 0.97 [0.71, 1.23] |
| 10.2 Facility‐based | 7 | 395 | Std. Mean Difference (IV, Random, 95% CI) | 0.50 [0.05, 0.95] |
| 10.3 Both home‐ and facility‐based | 4 | 654 | Std. Mean Difference (IV, Random, 95% CI) | 0.41 [‐0.15, 0.96] |
| 11 Overall cognitive function (follow‐up values) | 5 | Std. Mean Difference (IV, Random, 95% CI) | Subtotals only | |
| 11.1 Home‐based | 0 | 0 | Std. Mean Difference (IV, Random, 95% CI) | 0.0 [0.0, 0.0] |
| 11.2 Facility‐based | 3 | 134 | Std. Mean Difference (IV, Random, 95% CI) | 0.32 [‐0.02, 0.66] |
| 11.3 Both home‐ and facility‐based | 2 | 55 | Std. Mean Difference (IV, Random, 95% CI) | 0.65 [‐0.01, 1.31] |
| 12 Overall cognitive function (change values) | 5 | Std. Mean Difference (IV, Random, 95% CI) | Subtotals only | |
| 12.1 Home‐based | 0 | 0 | Std. Mean Difference (IV, Random, 95% CI) | 0.0 [0.0, 0.0] |
| 12.2 Facility‐based | 3 | 134 | Std. Mean Difference (IV, Random, 95% CI) | 0.06 [‐0.31, 0.43] |
| 12.3 Both home‐ and facility‐based | 2 | 538 | Std. Mean Difference (IV, Random, 95% CI) | 0.03 [‐0.51, 0.57] |
| 13 Overall general health (follow‐up values) | 9 | Std. Mean Difference (IV, Random, 95% CI) | Subtotals only | |
| 13.1 Home‐based | 2 | 111 | Std. Mean Difference (IV, Random, 95% CI) | 0.43 [‐0.32, 1.17] |
| 13.2 Facility‐based | 6 | 273 | Std. Mean Difference (IV, Random, 95% CI) | 0.25 [0.01, 0.49] |
| 13.3 Both home‐ and facility‐based | 2 | 112 | Std. Mean Difference (IV, Random, 95% CI) | ‐0.26 [‐0.64, 0.11] |
| 14 Overall general health (change values) | 5 | Std. Mean Difference (IV, Random, 95% CI) | Subtotals only | |
| 14.1 Home‐based | 1 | 40 | Std. Mean Difference (IV, Random, 95% CI) | 0.42 [‐0.21, 1.05] |
| 14.2 Facility‐based | 2 | 59 | Std. Mean Difference (IV, Random, 95% CI) | 0.27 [‐0.49, 1.03] |
| 14.3 Both home‐ and facility‐based | 3 | 612 | Std. Mean Difference (IV, Random, 95% CI) | ‐0.07 [‐0.23, 0.09] |
| 15 Overall sexual function (follow‐up values) | 5 | Std. Mean Difference (IV, Fixed, 95% CI) | Subtotals only | |
| 15.1 Home‐based | 2 | 136 | Std. Mean Difference (IV, Fixed, 95% CI) | ‐0.00 [‐0.34, 0.34] |
| 15.2 Facility‐based | 2 | 193 | Std. Mean Difference (IV, Fixed, 95% CI) | 0.21 [‐0.07, 0.49] |
| 15.3 Both home‐ and facility‐based | 1 | 82 | Std. Mean Difference (IV, Fixed, 95% CI) | 0.29 [‐0.14, 0.73] |
| 16 Overall sexual function (change values) | 3 | Mean Difference (IV, Random, 95% CI) | Subtotals only | |
| 16.1 Home‐based | 0 | 0 | Mean Difference (IV, Random, 95% CI) | 0.0 [0.0, 0.0] |
| 16.2 Facility‐based | 2 | 193 | Mean Difference (IV, Random, 95% CI) | 3.83 [‐1.83, 9.48] |
| 16.3 Both home‐ and facility‐based | 1 | 500 | Mean Difference (IV, Random, 95% CI) | 0.5 [‐3.86, 4.86] |
| 17 Overall sleep (follow‐up values) | 5 | Std. Mean Difference (IV, Fixed, 95% CI) | Subtotals only | |
| 17.1 Home‐based | 0 | 0 | Std. Mean Difference (IV, Fixed, 95% CI) | 0.0 [0.0, 0.0] |
| 17.2 Facility‐based | 2 | 88 | Std. Mean Difference (IV, Fixed, 95% CI) | ‐0.26 [‐0.68, 0.16] |
| 17.3 Both home‐ and facility‐based | 3 | 100 | Std. Mean Difference (IV, Fixed, 95% CI) | 0.06 [‐0.33, 0.46] |
| 18 Overall sleep (change values) | 3 | Std. Mean Difference (IV, Random, 95% CI) | Subtotals only | |
| 18.1 Home‐based | 0 | 0 | Std. Mean Difference (IV, Random, 95% CI) | 0.0 [0.0, 0.0] |
| 18.2 Facility‐based | 1 | 56 | Std. Mean Difference (IV, Random, 95% CI) | 0.14 [‐0.38, 0.67] |
| 18.3 Both home‐ and facility‐based | 2 | 80 | Std. Mean Difference (IV, Random, 95% CI) | 0.14 [‐0.30, 0.58] |
| 19 Overall anxiety (follow‐up values) | 7 | Std. Mean Difference (IV, Random, 95% CI) | Subtotals only | |
| 19.1 Home‐based | 0 | 0 | Std. Mean Difference (IV, Random, 95% CI) | 0.0 [0.0, 0.0] |
| 19.2 Facility‐based | 4 | 192 | Std. Mean Difference (IV, Random, 95% CI) | ‐0.87 [‐1.34, ‐0.41] |
| 19.3 Both home‐ and facility‐based | 3 | 134 | Std. Mean Difference (IV, Random, 95% CI) | ‐0.14 [‐0.48, 0.21] |
| 20 Overall anxiety (change values) | 4 | Std. Mean Difference (IV, Fixed, 95% CI) | Subtotals only | |
| 20.1 Home‐based | 0 | 0 | Std. Mean Difference (IV, Fixed, 95% CI) | 0.0 [0.0, 0.0] |
| 20.2 Facility‐based | 2 | 119 | Std. Mean Difference (IV, Fixed, 95% CI) | ‐0.52 [‐0.88, ‐0.15] |
| 20.3 Both home‐ and facility‐based | 2 | 116 | Std. Mean Difference (IV, Fixed, 95% CI) | ‐0.23 [‐0.60, 0.13] |
| 21 Overall depression (follow‐up values) | 12 | Std. Mean Difference (IV, Random, 95% CI) | Subtotals only | |
| 21.1 Home‐based | 2 | 60 | Std. Mean Difference (IV, Random, 95% CI) | 0.34 [‐0.17, 0.85] |
| 21.2 Facility‐based | 8 | 483 | Std. Mean Difference (IV, Random, 95% CI) | ‐0.55 [‐0.85, ‐0.25] |
| 21.3 Both home‐ and facility‐based | 3 | 134 | Std. Mean Difference (IV, Random, 95% CI) | 0.05 [‐0.52, 0.61] |
| 22 Overall depression (change values) | 7 | Std. Mean Difference (IV, Random, 95% CI) | Subtotals only | |
| 22.1 Home‐based | 1 | 40 | Std. Mean Difference (IV, Random, 95% CI) | ‐0.39 [‐1.02, 0.23] |
| 22.2 Facility‐based | 3 | 140 | Std. Mean Difference (IV, Random, 95% CI) | ‐0.63 [‐0.97, ‐0.29] |
| 22.3 Both home‐ and facility‐based | 3 | 616 | Std. Mean Difference (IV, Random, 95% CI) | ‐0.11 [‐0.41, 0.19] |
| 23 Overall fatigue (follow‐up values) | 25 | Std. Mean Difference (IV, Random, 95% CI) | Subtotals only | |
| 23.1 Home‐based | 6 | 850 | Std. Mean Difference (IV, Random, 95% CI) | ‐0.18 [‐0.39, 0.03] |
| 23.2 Facility‐based | 13 | 749 | Std. Mean Difference (IV, Random, 95% CI) | ‐0.53 [‐0.77, ‐0.29] |
| 23.3 Both home‐ and facility‐based | 7 | 346 | Std. Mean Difference (IV, Random, 95% CI) | ‐0.09 [‐0.30, 0.13] |
| 24 Overall fatigue (change values) | 12 | Std. Mean Difference (IV, Random, 95% CI) | Subtotals only | |
| 24.1 Home‐based | 2 | 417 | Std. Mean Difference (IV, Random, 95% CI) | ‐0.25 [‐1.10, 0.61] |
| 24.2 Facility‐based | 7 | 296 | Std. Mean Difference (IV, Random, 95% CI) | ‐0.43 [‐1.06, 0.20] |
| 24.3 Both home‐ and facility‐based | 3 | 558 | Std. Mean Difference (IV, Random, 95% CI) | ‐0.01 [‐0.17, 0.16] |
| 25 Overall pain/disability (follow‐up values) | 9 | Std. Mean Difference (IV, Random, 95% CI) | Subtotals only | |
| 25.1 Home‐based | 3 | 249 | Std. Mean Difference (IV, Random, 95% CI) | 0.24 [‐0.20, 0.68] |
| 25.2 Facility‐based | 5 | 183 | Std. Mean Difference (IV, Random, 95% CI) | 0.09 [‐0.20, 0.38] |
| 25.3 Both home‐ and facility‐based | 2 | 112 | Std. Mean Difference (IV, Random, 95% CI) | ‐0.12 [‐0.49, 0.25] |
| 26 Overall pain/disability (change values) | 5 | Std. Mean Difference (IV, Random, 95% CI) | Subtotals only | |
| 26.1 Home‐based | 0 | 0 | Std. Mean Difference (IV, Random, 95% CI) | 0.0 [0.0, 0.0] |
| 26.2 Facility‐based | 3 | 139 | Std. Mean Difference (IV, Random, 95% CI) | 0.16 [‐0.19, 0.50] |
| 26.3 Both home‐ and facility‐based | 2 | 157 | Std. Mean Difference (IV, Random, 95% CI) | ‐0.29 [‐0.61, 0.02] |
| 27 Overall self‐esteem/body image (follow‐up values) | 12 | Std. Mean Difference (IV, Random, 95% CI) | Subtotals only | |
| 27.1 Home‐based | 2 | 124 | Std. Mean Difference (IV, Random, 95% CI) | ‐0.10 [‐1.17, 0.97] |
| 27.2 Facility‐based | 8 | 451 | Std. Mean Difference (IV, Random, 95% CI) | 0.29 [0.09, 0.50] |
| 27.3 Both home‐ and facility‐based | 2 | 92 | Std. Mean Difference (IV, Random, 95% CI) | 0.52 [‐0.44, 1.48] |
| 28 Overall self‐esteem/body image (change values) | 9 | Std. Mean Difference (IV, Random, 95% CI) | Subtotals only | |
| 28.1 Home‐based | 1 | 42 | Std. Mean Difference (IV, Random, 95% CI) | ‐0.22 [‐0.89, 0.45] |
| 28.2 Facility‐based | 6 | 376 | Std. Mean Difference (IV, Random, 95% CI) | 0.52 [‐0.09, 1.13] |
| 28.3 Both home‐ and facility‐based | 2 | 574 | Std. Mean Difference (IV, Random, 95% CI) | ‐0.05 [‐0.21, 0.12] |
| 29 Overall cardiorespiratory fitness (follow‐up values) | 23 | Std. Mean Difference (IV, Random, 95% CI) | Subtotals only | |
| 29.1 Home‐based | 5 | 245 | Std. Mean Difference (IV, Random, 95% CI) | 0.66 [0.40, 0.92] |
| 29.2 Facility‐based | 13 | 603 | Std. Mean Difference (IV, Random, 95% CI) | 0.45 [0.25, 0.66] |
| 29.3 Both home‐ and facility‐based | 6 | 426 | Std. Mean Difference (IV, Random, 95% CI) | 0.29 [0.03, 0.56] |
| 30 Overall cardiorespiratory fitness (change values) | 9 | Std. Mean Difference (IV, Random, 95% CI) | Subtotals only | |
| 30.1 Home‐based | 2 | 124 | Std. Mean Difference (IV, Random, 95% CI) | 0.39 [‐0.20, 0.99] |
| 30.2 Facility‐based | 4 | 116 | Std. Mean Difference (IV, Random, 95% CI) | 1.62 [1.03, 2.21] |
| 30.3 Both home‐ and facility‐based | 3 | 623 | Std. Mean Difference (IV, Random, 95% CI) | 0.40 [‐0.02, 0.82] |
| 31 Overall self‐reported physical activity (follow‐up values) | 18 | Std. Mean Difference (IV, Random, 95% CI) | Subtotals only | |
| 31.1 Home‐based | 9 | 1028 | Std. Mean Difference (IV, Random, 95% CI) | 0.57 [0.29, 0.85] |
| 31.2 Facility‐based | 3 | 513 | Std. Mean Difference (IV, Random, 95% CI) | 0.23 [0.05, 0.40] |
| 31.3 Both home‐ and facility‐based | 6 | 503 | Std. Mean Difference (IV, Random, 95% CI) | 0.62 [0.23, 1.00] |
| 32 Overall self‐reported physical activity (change values) | 8 | Std. Mean Difference (IV, Random, 95% CI) | Subtotals only | |
| 32.1 Home‐based | 3 | 495 | Std. Mean Difference (IV, Random, 95% CI) | 0.38 [0.18, 0.57] |
| 32.2 Facility‐based | 1 | 105 | Std. Mean Difference (IV, Random, 95% CI) | 0.21 [‐0.17, 0.60] |
| 32.3 Both home‐ and facility‐based | 4 | 674 | Std. Mean Difference (IV, Random, 95% CI) | 0.92 [0.14, 1.70] |
| 33 Overall objective physical activity (follow‐up values) | 11 | Std. Mean Difference (IV, Random, 95% CI) | Subtotals only | |
| 33.1 Home‐based | 5 | 854 | Std. Mean Difference (IV, Random, 95% CI) | 0.45 [0.07, 0.82] |
| 33.2 Facility‐based | 0 | 0 | Std. Mean Difference (IV, Random, 95% CI) | 0.0 [0.0, 0.0] |
| 33.3 Both home‐ and facility‐based | 6 | 416 | Std. Mean Difference (IV, Random, 95% CI) | 0.43 [0.17, 0.68] |
| 34 Overall objective physical activity (change values) | 5 | Std. Mean Difference (IV, Random, 95% CI) | Subtotals only | |
| 34.1 Home‐based | 2 | 374 | Std. Mean Difference (IV, Random, 95% CI) | 0.37 [‐0.56, 1.30] |
| 34.2 Facility‐based | 0 | 0 | Std. Mean Difference (IV, Random, 95% CI) | 0.0 [0.0, 0.0] |
| 34.3 Both home‐ and facility‐based | 3 | 134 | Std. Mean Difference (IV, Random, 95% CI) | 0.92 [0.56, 1.28] |
| 35 Mass (follow‐up values) | 16 | Mean Difference (IV, Fixed, 95% CI) | Subtotals only | |
| 35.1 Home‐based | 2 | 100 | Mean Difference (IV, Fixed, 95% CI) | ‐3.38 [‐10.29, 3.53] |
| 35.2 Facility‐based | 10 | 864 | Mean Difference (IV, Fixed, 95% CI) | 0.03 [‐0.56, 0.61] |
| 35.3 Both home‐ and facility‐based | 4 | 246 | Mean Difference (IV, Fixed, 95% CI) | 0.04 [‐3.96, 4.04] |
| 36 Mass (change values) | 11 | Mean Difference (IV, Random, 95% CI) | Subtotals only | |
| 36.1 Home‐based | 1 | 36 | Mean Difference (IV, Random, 95% CI) | ‐0.03 [‐1.46, 1.40] |
| 36.2 Facility‐based | 7 | 394 | Mean Difference (IV, Random, 95% CI) | ‐0.61 [‐1.31, 0.08] |
| 36.3 Both home‐ and facility‐based | 3 | 617 | Mean Difference (IV, Random, 95% CI) | ‐0.58 [‐1.80, 0.63] |
| 37 BMI (follow‐up values) | 17 | Mean Difference (IV, Fixed, 95% CI) | Subtotals only | |
| 37.1 Home‐based | 3 | 442 | Mean Difference (IV, Fixed, 95% CI) | ‐0.53 [‐1.64, 0.57] |
| 37.2 Facility‐based | 9 | 767 | Mean Difference (IV, Fixed, 95% CI) | 0.04 [‐0.17, 0.26] |
| 37.3 Both home‐ and facility‐based | 6 | 281 | Mean Difference (IV, Fixed, 95% CI) | ‐0.61 [‐2.14, 0.91] |
| 38 BMI (change values) | 8 | Mean Difference (IV, Random, 95% CI) | Subtotals only | |
| 38.1 Home‐based | 0 | 0 | Mean Difference (IV, Random, 95% CI) | 0.0 [0.0, 0.0] |
| 38.2 Facility‐based | 6 | 361 | Mean Difference (IV, Random, 95% CI) | ‐0.27 [‐0.58, 0.04] |
| 38.3 Both home‐ and facility‐based | 2 | 124 | Mean Difference (IV, Random, 95% CI) | ‐0.12 [‐0.43, 0.20] |
| 39 Overall body fat (follow‐up values) | 18 | Std. Mean Difference (IV, Random, 95% CI) | Subtotals only | |
| 39.1 Home‐based | 4 | 224 | Std. Mean Difference (IV, Random, 95% CI) | ‐0.18 [‐0.45, 0.09] |
| 39.2 Facility‐based | 7 | 550 | Std. Mean Difference (IV, Random, 95% CI) | ‐0.39 [‐0.69, ‐0.08] |
| 39.3 Both home‐ and facility‐based | 7 | 388 | Std. Mean Difference (IV, Random, 95% CI) | 0.01 [‐0.19, 0.21] |
| 40 Overall body fat (change values) | 9 | Std. Mean Difference (IV, Random, 95% CI) | Subtotals only | |
| 40.1 Home‐based | 2 | 78 | Std. Mean Difference (IV, Random, 95% CI) | ‐0.48 [‐0.97, ‐0.00] |
| 40.2 Facility‐based | 5 | 297 | Std. Mean Difference (IV, Random, 95% CI) | ‐0.84 [‐1.94, 0.26] |
| 40.3 Both home‐ and facility‐based | 2 | 124 | Std. Mean Difference (IV, Random, 95% CI) | ‐0.26 [‐0.62, 0.09] |
| 41 Lower body strength (follow‐up values) | 10 | Std. Mean Difference (IV, Random, 95% CI) | Subtotals only | |
| 41.1 Home‐based | 0 | 0 | Std. Mean Difference (IV, Random, 95% CI) | 0.0 [0.0, 0.0] |
| 41.2 Facility‐based | 5 | 417 | Std. Mean Difference (IV, Random, 95% CI) | 0.75 [0.24, 1.27] |
| 41.3 Both home‐ and facility‐based | 5 | 220 | Std. Mean Difference (IV, Random, 95% CI) | 0.12 [‐0.16, 0.40] |
| 42 Lower body strength (change values) | 8 | Std. Mean Difference (IV, Random, 95% CI) | Subtotals only | |
| 42.1 Home‐based | 0 | 0 | Std. Mean Difference (IV, Random, 95% CI) | 0.0 [0.0, 0.0] |
| 42.2 Facility‐based | 7 | 497 | Std. Mean Difference (IV, Random, 95% CI) | 0.80 [0.38, 1.23] |
| 42.3 Both home‐ and facility‐based | 1 | 223 | Std. Mean Difference (IV, Random, 95% CI) | 0.42 [0.15, 0.69] |
| 43 Upper body strength (follow‐up values) | 13 | Std. Mean Difference (IV, Random, 95% CI) | Subtotals only | |
| 43.1 Home‐based | 2 | 64 | Std. Mean Difference (IV, Random, 95% CI) | 0.58 [0.05, 1.12] |
| 43.2 Facility‐based | 8 | 513 | Std. Mean Difference (IV, Random, 95% CI) | 0.43 [‐0.12, 0.98] |
| 43.3 Both home‐ and facility‐based | 4 | 200 | Std. Mean Difference (IV, Random, 95% CI) | 0.29 [0.01, 0.57] |
| 44 Upper body strength (change values) | 8 | Std. Mean Difference (IV, Random, 95% CI) | Subtotals only | |
| 44.1 Home‐based | 0 | 0 | Std. Mean Difference (IV, Random, 95% CI) | 0.0 [0.0, 0.0] |
| 44.2 Facility‐based | 6 | 526 | Std. Mean Difference (IV, Random, 95% CI) | 0.92 [0.34, 1.50] |
| 44.3 Both home‐ and facility‐based | 2 | 306 | Std. Mean Difference (IV, Random, 95% CI) | 0.25 [0.03, 0.48] |
| 45 Bone mineral density ‐ femoral neck (follow‐up and change values) | 4 | Std. Mean Difference (IV, Random, 95% CI) | Subtotals only | |
| 45.1 Home‐based | 1 | 39 | Std. Mean Difference (IV, Random, 95% CI) | ‐0.37 [‐1.00, 0.27] |
| 45.2 Facility‐based | 0 | 0 | Std. Mean Difference (IV, Random, 95% CI) | 0.0 [0.0, 0.0] |
| 45.3 Both home‐ and facility‐based | 3 | 747 | Std. Mean Difference (IV, Random, 95% CI) | 0.32 [‐0.01, 0.65] |
| 46 Bone mineral density ‐ lumbar spine (follow‐up and change values) | 4 | Std. Mean Difference (IV, Random, 95% CI) | Subtotals only | |
| 46.1 Home‐based | 1 | 39 | Std. Mean Difference (IV, Random, 95% CI) | ‐0.26 [‐0.89, 0.37] |
| 46.2 Facility‐based | 0 | 0 | Std. Mean Difference (IV, Random, 95% CI) | 0.0 [0.0, 0.0] |
| 46.3 Both home‐ and facility‐based | 3 | 747 | Std. Mean Difference (IV, Random, 95% CI) | 0.30 [‐0.02, 0.63] |
| 47 Bone mineral density ‐ total hip (follow‐up and change values) | 3 | Std. Mean Difference (IV, Random, 95% CI) | Subtotals only | |
| 47.1 Home‐based | 1 | 39 | Std. Mean Difference (IV, Random, 95% CI) | 10.34 [7.84, 12.84] |
| 47.2 Facility‐based | 0 | 0 | Std. Mean Difference (IV, Random, 95% CI) | 0.0 [0.0, 0.0] |
| 47.3 Both home‐ and facility‐based | 2 | 290 | Std. Mean Difference (IV, Random, 95% CI) | 0.64 [‐0.20, 1.48] |
17.3. Analysis.
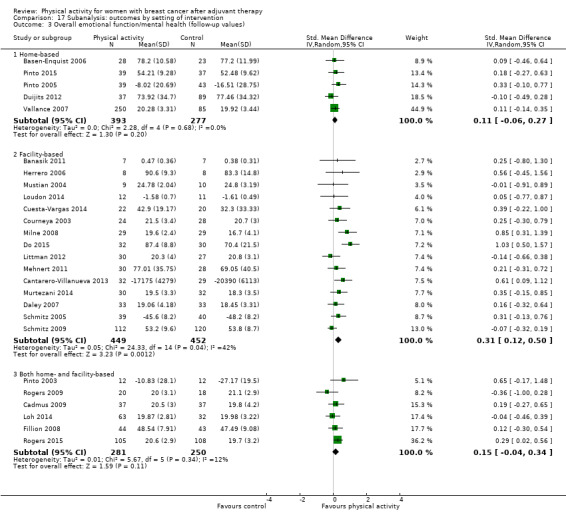
Comparison 17 Subanalysis: outcomes by setting of intervention, Outcome 3 Overall emotional function/mental health (follow‐up values).
17.4. Analysis.
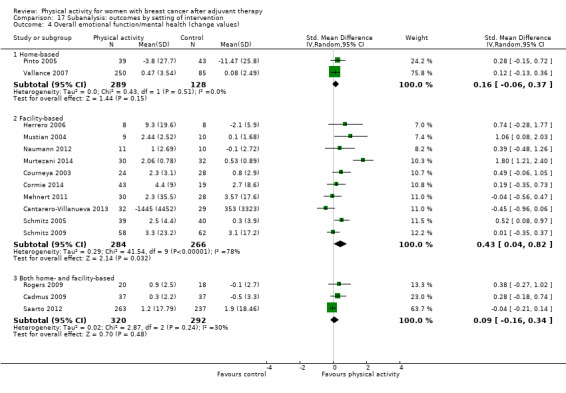
Comparison 17 Subanalysis: outcomes by setting of intervention, Outcome 4 Overall emotional function/mental health (change values).
17.5. Analysis.

Comparison 17 Subanalysis: outcomes by setting of intervention, Outcome 5 Overall physical function (follow‐up values).
17.6. Analysis.
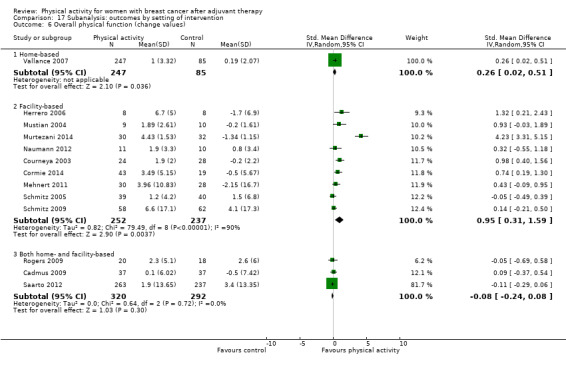
Comparison 17 Subanalysis: outcomes by setting of intervention, Outcome 6 Overall physical function (change values).
17.7. Analysis.
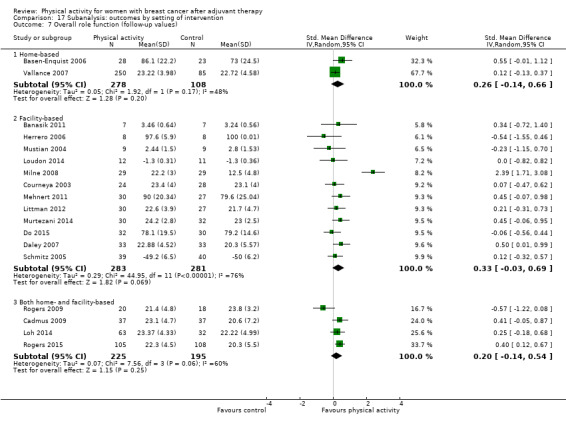
Comparison 17 Subanalysis: outcomes by setting of intervention, Outcome 7 Overall role function (follow‐up values).
17.8. Analysis.
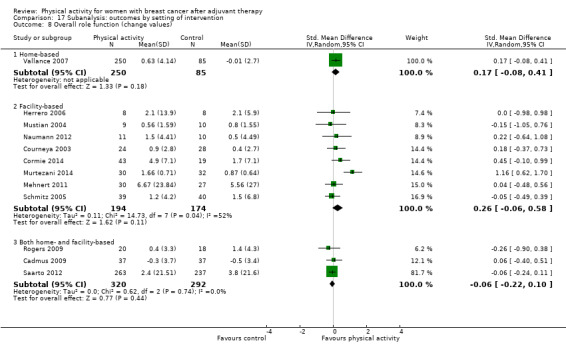
Comparison 17 Subanalysis: outcomes by setting of intervention, Outcome 8 Overall role function (change values).
17.9. Analysis.
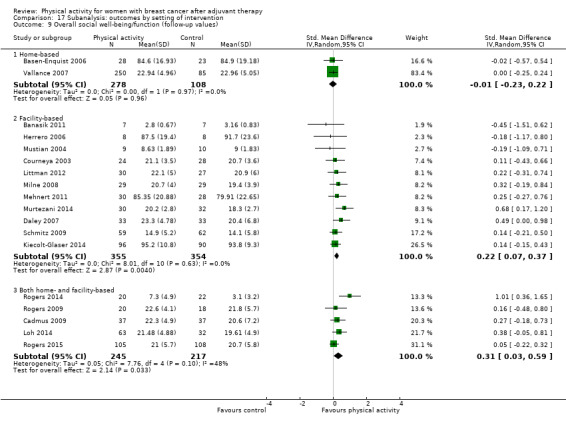
Comparison 17 Subanalysis: outcomes by setting of intervention, Outcome 9 Overall social well‐being/function (follow‐up values).
17.10. Analysis.
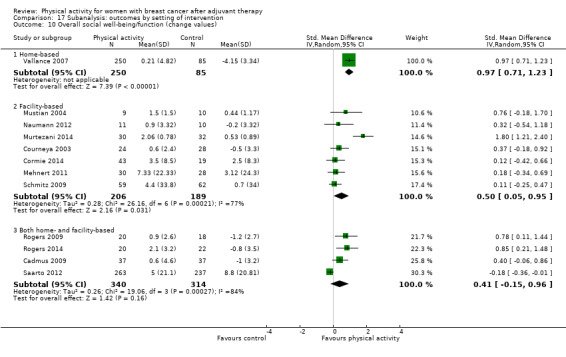
Comparison 17 Subanalysis: outcomes by setting of intervention, Outcome 10 Overall social well‐being/function (change values).
17.11. Analysis.
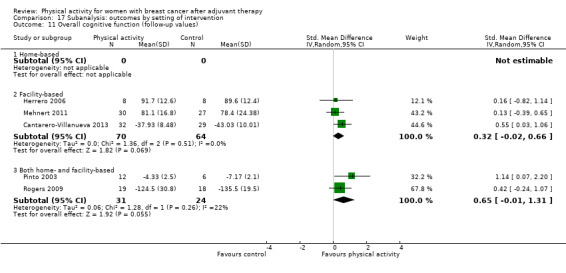
Comparison 17 Subanalysis: outcomes by setting of intervention, Outcome 11 Overall cognitive function (follow‐up values).
17.12. Analysis.
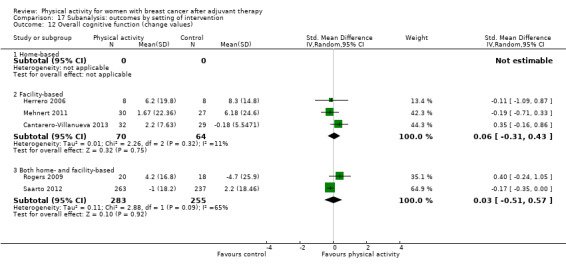
Comparison 17 Subanalysis: outcomes by setting of intervention, Outcome 12 Overall cognitive function (change values).
17.13. Analysis.

Comparison 17 Subanalysis: outcomes by setting of intervention, Outcome 13 Overall general health (follow‐up values).
17.14. Analysis.

Comparison 17 Subanalysis: outcomes by setting of intervention, Outcome 14 Overall general health (change values).
17.15. Analysis.
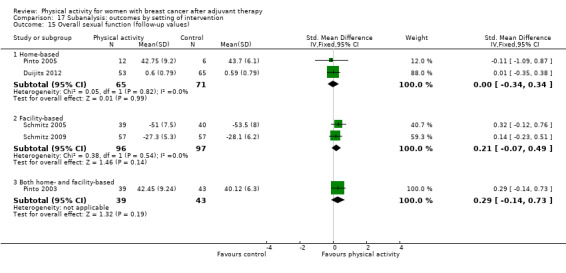
Comparison 17 Subanalysis: outcomes by setting of intervention, Outcome 15 Overall sexual function (follow‐up values).
17.16. Analysis.

Comparison 17 Subanalysis: outcomes by setting of intervention, Outcome 16 Overall sexual function (change values).
17.17. Analysis.

Comparison 17 Subanalysis: outcomes by setting of intervention, Outcome 17 Overall sleep (follow‐up values).
17.18. Analysis.
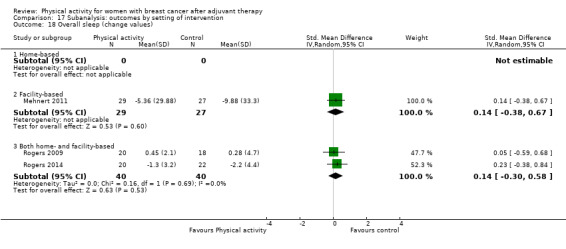
Comparison 17 Subanalysis: outcomes by setting of intervention, Outcome 18 Overall sleep (change values).
17.19. Analysis.

Comparison 17 Subanalysis: outcomes by setting of intervention, Outcome 19 Overall anxiety (follow‐up values).
17.20. Analysis.
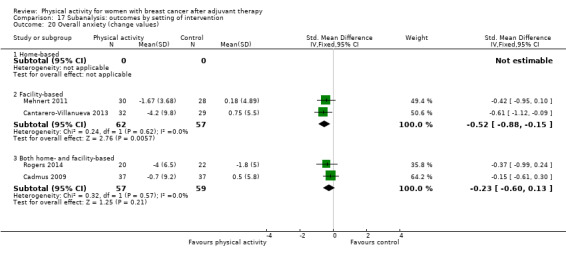
Comparison 17 Subanalysis: outcomes by setting of intervention, Outcome 20 Overall anxiety (change values).
17.21. Analysis.
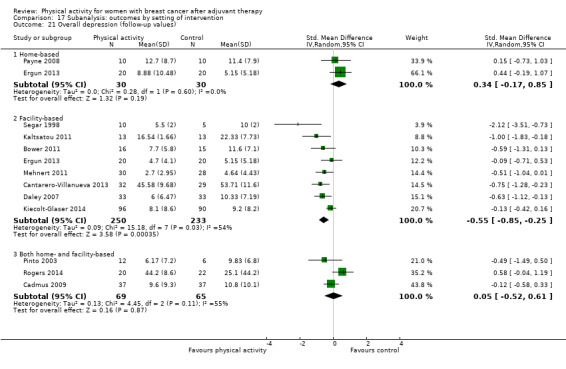
Comparison 17 Subanalysis: outcomes by setting of intervention, Outcome 21 Overall depression (follow‐up values).
17.22. Analysis.

Comparison 17 Subanalysis: outcomes by setting of intervention, Outcome 22 Overall depression (change values).
17.23. Analysis.
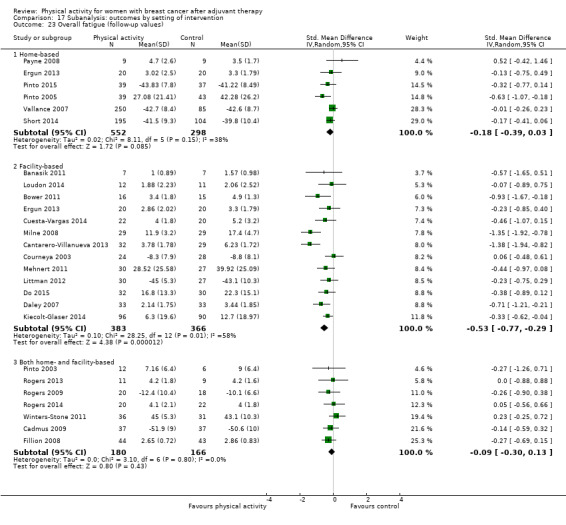
Comparison 17 Subanalysis: outcomes by setting of intervention, Outcome 23 Overall fatigue (follow‐up values).
17.24. Analysis.

Comparison 17 Subanalysis: outcomes by setting of intervention, Outcome 24 Overall fatigue (change values).
17.25. Analysis.
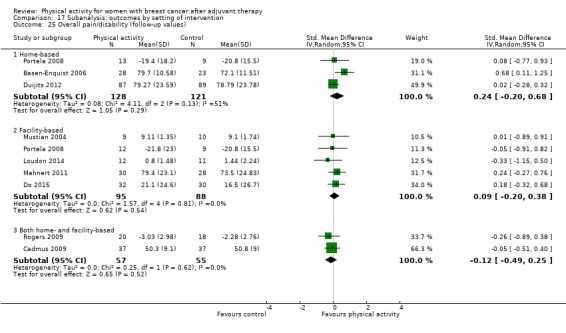
Comparison 17 Subanalysis: outcomes by setting of intervention, Outcome 25 Overall pain/disability (follow‐up values).
17.26. Analysis.

Comparison 17 Subanalysis: outcomes by setting of intervention, Outcome 26 Overall pain/disability (change values).
17.27. Analysis.
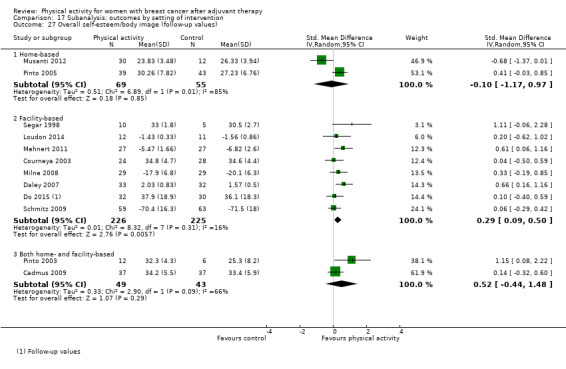
Comparison 17 Subanalysis: outcomes by setting of intervention, Outcome 27 Overall self‐esteem/body image (follow‐up values).
17.28. Analysis.

Comparison 17 Subanalysis: outcomes by setting of intervention, Outcome 28 Overall self‐esteem/body image (change values).
17.29. Analysis.

Comparison 17 Subanalysis: outcomes by setting of intervention, Outcome 29 Overall cardiorespiratory fitness (follow‐up values).
17.30. Analysis.
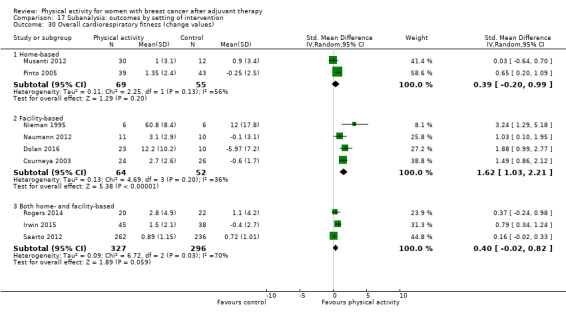
Comparison 17 Subanalysis: outcomes by setting of intervention, Outcome 30 Overall cardiorespiratory fitness (change values).
17.31. Analysis.

Comparison 17 Subanalysis: outcomes by setting of intervention, Outcome 31 Overall self‐reported physical activity (follow‐up values).
17.32. Analysis.

Comparison 17 Subanalysis: outcomes by setting of intervention, Outcome 32 Overall self‐reported physical activity (change values).
17.33. Analysis.

Comparison 17 Subanalysis: outcomes by setting of intervention, Outcome 33 Overall objective physical activity (follow‐up values).
17.34. Analysis.
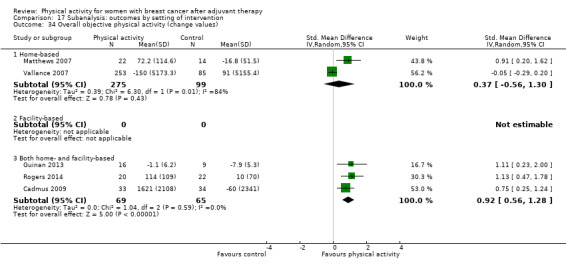
Comparison 17 Subanalysis: outcomes by setting of intervention, Outcome 34 Overall objective physical activity (change values).
17.35. Analysis.

Comparison 17 Subanalysis: outcomes by setting of intervention, Outcome 35 Mass (follow‐up values).
17.36. Analysis.

Comparison 17 Subanalysis: outcomes by setting of intervention, Outcome 36 Mass (change values).
17.37. Analysis.

Comparison 17 Subanalysis: outcomes by setting of intervention, Outcome 37 BMI (follow‐up values).
17.38. Analysis.

Comparison 17 Subanalysis: outcomes by setting of intervention, Outcome 38 BMI (change values).
17.39. Analysis.

Comparison 17 Subanalysis: outcomes by setting of intervention, Outcome 39 Overall body fat (follow‐up values).
17.40. Analysis.

Comparison 17 Subanalysis: outcomes by setting of intervention, Outcome 40 Overall body fat (change values).
17.41. Analysis.
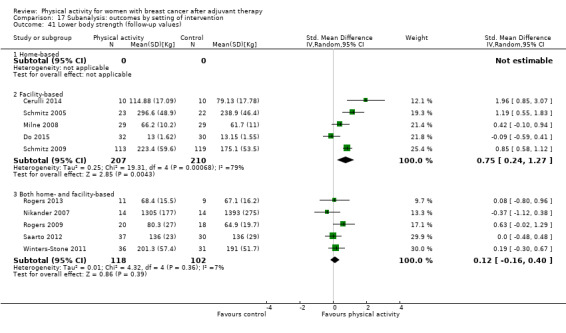
Comparison 17 Subanalysis: outcomes by setting of intervention, Outcome 41 Lower body strength (follow‐up values).
17.42. Analysis.
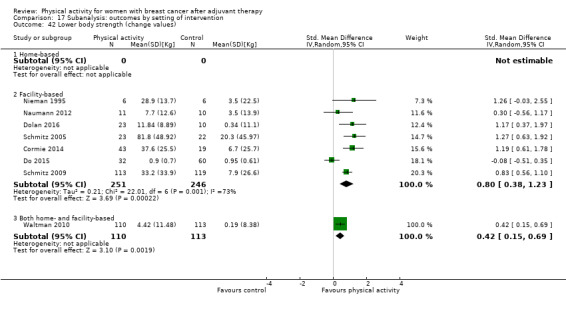
Comparison 17 Subanalysis: outcomes by setting of intervention, Outcome 42 Lower body strength (change values).
17.43. Analysis.

Comparison 17 Subanalysis: outcomes by setting of intervention, Outcome 43 Upper body strength (follow‐up values).
17.44. Analysis.

Comparison 17 Subanalysis: outcomes by setting of intervention, Outcome 44 Upper body strength (change values).
17.45. Analysis.

Comparison 17 Subanalysis: outcomes by setting of intervention, Outcome 45 Bone mineral density ‐ femoral neck (follow‐up and change values).
17.46. Analysis.

Comparison 17 Subanalysis: outcomes by setting of intervention, Outcome 46 Bone mineral density ‐ lumbar spine (follow‐up and change values).
17.47. Analysis.

Comparison 17 Subanalysis: outcomes by setting of intervention, Outcome 47 Bone mineral density ‐ total hip (follow‐up and change values).
Comparison 18. Sensitivity analysis: outcomes by risk of bias.
| Outcome or subgroup title | No. of studies | No. of participants | Statistical method | Effect size |
|---|---|---|---|---|
| 1 Overall HRQoL (follow‐up values) | 22 | Std. Mean Difference (IV, Random, 95% CI) | Subtotals only | |
| 1.1 Low risk of bias | 15 | 1521 | Std. Mean Difference (IV, Random, 95% CI) | 0.43 [0.19, 0.66] |
| 1.2 Unclear/high risk of bias | 7 | 475 | Std. Mean Difference (IV, Random, 95% CI) | 0.30 [0.06, 0.55] |
| 2 Overall HRQoL (change values) | 14 | Std. Mean Difference (IV, Random, 95% CI) | Subtotals only | |
| 2.1 Low risk of bias | 11 | 1360 | Std. Mean Difference (IV, Random, 95% CI) | 0.70 [0.28, 1.12] |
| 2.2 Unclear/high risk of bias | 3 | 99 | Std. Mean Difference (IV, Random, 95% CI) | 1.26 [‐0.11, 2.62] |
| 3 Overall emotional function/mental health (follow‐up values) | 26 | Std. Mean Difference (IV, Random, 95% CI) | Subtotals only | |
| 3.1 Low risk of bias | 15 | 1427 | Std. Mean Difference (IV, Random, 95% CI) | 0.22 [0.09, 0.34] |
| 3.2 Unclear/high risk of bias | 11 | 675 | Std. Mean Difference (IV, Random, 95% CI) | 0.19 [‐0.02, 0.40] |
| 4 Overall emotional function/mental health (change values) | 15 | Std. Mean Difference (IV, Random, 95% CI) | Subtotals only | |
| 4.1 Low risk of bias | 11 | 1399 | Std. Mean Difference (IV, Random, 95% CI) | 0.31 [0.04, 0.58] |
| 4.2 Unclear/high risk of bias | 4 | 180 | Std. Mean Difference (IV, Random, 95% CI) | 0.28 [‐0.08, 0.65] |
| 5 Overall physical function (follow‐up values) | 25 | Std. Mean Difference (IV, Random, 95% CI) | Subtotals only | |
| 5.1 Low risk of bias | 13 | 1343 | Std. Mean Difference (IV, Random, 95% CI) | 0.38 [0.13, 0.63] |
| 5.2 Unclear/high risk of bias | 12 | 786 | Std. Mean Difference (IV, Random, 95% CI) | 0.28 [0.14, 0.42] |
| 6 Overall physical function (change values) | 13 | Std. Mean Difference (IV, Random, 95% CI) | Subtotals only | |
| 6.1 Low risk of bias | 10 | 1335 | Std. Mean Difference (IV, Random, 95% CI) | 0.63 [0.19, 1.07] |
| 6.2 Unclear/high risk of bias | 3 | 98 | Std. Mean Difference (IV, Random, 95% CI) | 0.50 [0.09, 0.90] |
| 7 Overall role function (follow‐up values) | 18 | Std. Mean Difference (IV, Random, 95% CI) | Subtotals only | |
| 7.1 Low risk of bias | 12 | 1111 | Std. Mean Difference (IV, Random, 95% CI) | 0.32 [0.02, 0.61] |
| 7.2 Unclear/high risk of bias | 6 | 259 | Std. Mean Difference (IV, Random, 95% CI) | 0.24 [‐0.01, 0.48] |
| 8 Overall role function (change values) | 12 | Std. Mean Difference (IV, Random, 95% CI) | Subtotals only | |
| 8.1 Low risk of bias | 9 | 1218 | Std. Mean Difference (IV, Random, 95% CI) | 0.17 [‐0.06, 0.40] |
| 8.2 Unclear/high risk of bias | 3 | 97 | Std. Mean Difference (IV, Random, 95% CI) | 0.04 [‐0.36, 0.44] |
| 9 Overall social well‐being/function (follow‐up values) | 18 | Std. Mean Difference (IV, Random, 95% CI) | Subtotals only | |
| 9.1 Low risk of bias | 12 | 1263 | Std. Mean Difference (IV, Random, 95% CI) | 0.21 [0.07, 0.36] |
| 9.2 Unclear/high risk of bias | 6 | 294 | Std. Mean Difference (IV, Random, 95% CI) | 0.17 [‐0.06, 0.40] |
| 10 Overall social well‐being/function (change values) | 12 | Std. Mean Difference (IV, Random, 95% CI) | Subtotals only | |
| 10.1 Low risk of bias | 9 | 1286 | Std. Mean Difference (IV, Random, 95% CI) | 0.56 [0.13, 0.98] |
| 10.2 Unclear/high risk of bias | 3 | 98 | Std. Mean Difference (IV, Random, 95% CI) | 0.31 [‐0.09, 0.71] |
| 11 Overall cognitive function (follow‐up values) | 5 | Std. Mean Difference (IV, Random, 95% CI) | Subtotals only | |
| 11.1 Low risk of bias | 3 | 114 | Std. Mean Difference (IV, Random, 95% CI) | 0.45 [0.07, 0.82] |
| 11.2 Unclear/high risk of bias | 2 | 75 | Std. Mean Difference (IV, Random, 95% CI) | 0.52 [‐0.44, 1.48] |
| 12 Overall cognitive function (change values) | 5 | Std. Mean Difference (IV, Random, 95% CI) | Subtotals only | |
| 12.1 Low risk of bias | 4 | 615 | Std. Mean Difference (IV, Random, 95% CI) | 0.07 [‐0.28, 0.42] |
| 12.2 Unclear/high risk of bias | 1 | 57 | Std. Mean Difference (IV, Random, 95% CI) | ‐0.19 [‐0.71, 0.33] |
| 13 Overall general health (follow‐up values) | 9 | Std. Mean Difference (IV, Random, 95% CI) | Subtotals only | |
| 13.1 Low risk of bias | 5 | 267 | Std. Mean Difference (IV, Random, 95% CI) | 0.06 [‐0.31, 0.43] |
| 13.2 Unclear/high risk of bias | 4 | 189 | Std. Mean Difference (IV, Random, 95% CI) | 0.36 [0.02, 0.70] |
| 14 Overall general health (change values) | 9 | Std. Mean Difference (IV, Random, 95% CI) | Subtotals only | |
| 14.1 Low risk of bias | 7 | 829 | Std. Mean Difference (IV, Random, 95% CI) | 0.21 [‐0.08, 0.49] |
| 14.2 Unclear/high risk of bias | 2 | 77 | Std. Mean Difference (IV, Random, 95% CI) | 0.10 [‐0.35, 0.55] |
| 15 Overall sexual function (follow‐up values) | 5 | Std. Mean Difference (IV, Fixed, 95% CI) | Subtotals only | |
| 15.1 Low risk of bias | 2 | 193 | Std. Mean Difference (IV, Fixed, 95% CI) | 0.21 [‐0.07, 0.49] |
| 15.2 Unclear/high risk of bias | 3 | 218 | Std. Mean Difference (IV, Fixed, 95% CI) | 0.11 [‐0.16, 0.38] |
| 16 Overall sexual function (change values) | 3 | Std. Mean Difference (IV, Random, 95% CI) | Subtotals only | |
| 16.1 Low risk of bias | 3 | 693 | Std. Mean Difference (IV, Random, 95% CI) | 0.22 [‐0.08, 0.52] |
| 16.2 Unclear/high risk of bias | 0 | 0 | Std. Mean Difference (IV, Random, 95% CI) | 0.0 [0.0, 0.0] |
| 17 Overall sleep (follow‐up values) | 5 | Std. Mean Difference (IV, Fixed, 95% CI) | Subtotals only | |
| 17.1 Low risk of bias | 3 | 111 | Std. Mean Difference (IV, Fixed, 95% CI) | 0.09 [‐0.28, 0.47] |
| 17.2 Unclear/high risk of bias | 2 | 77 | Std. Mean Difference (IV, Fixed, 95% CI) | ‐0.35 [‐0.80, 0.10] |
| 18 Overall sleep (change values) | 3 | Std. Mean Difference (IV, Random, 95% CI) | Subtotals only | |
| 18.1 Low risk of bias | 2 | 80 | Std. Mean Difference (IV, Random, 95% CI) | 0.14 [‐0.30, 0.58] |
| 18.2 Unclear/high risk of bias | 1 | 56 | Std. Mean Difference (IV, Random, 95% CI) | 0.14 [‐0.38, 0.67] |
| 19 Overall anxiety (follow‐up values) | 7 | Std. Mean Difference (IV, Random, 95% CI) | Subtotals only | |
| 19.1 Low risk of bias | 4 | 235 | Std. Mean Difference (IV, Random, 95% CI) | ‐0.46 [‐0.89, ‐0.03] |
| 19.2 Unclear/high risk of bias | 3 | 91 | Std. Mean Difference (IV, Random, 95% CI) | ‐0.95 [‐1.92, 0.02] |
| 20 Overall anxiety (change values) | 4 | Std. Mean Difference (IV, Fixed, 95% CI) | Subtotals only | |
| 20.1 Low risk of bias | 3 | 177 | Std. Mean Difference (IV, Fixed, 95% CI) | ‐0.36 [‐0.66, ‐0.06] |
| 20.2 Unclear/high risk of bias | 1 | 58 | Std. Mean Difference (IV, Fixed, 95% CI) | ‐0.42 [‐0.95, 0.10] |
| 21 Overall self‐esteem/body image (follow‐up values) | 12 | Std. Mean Difference (IV, Random, 95% CI) | Subtotals only | |
| 21.1 Low risk of bias | 7 | 436 | Std. Mean Difference (IV, Random, 95% CI) | 0.14 [‐0.12, 0.40] |
| 21.2 Unclear/high risk of bias | 5 | 231 | Std. Mean Difference (IV, Random, 95% CI) | 0.48 [0.16, 0.80] |
| 22 Overall self‐esteem/body image (change values) | 9 | Std. Mean Difference (IV, Random, 95% CI) | Subtotals only | |
| 22.1 Low risk of bias | 7 | 914 | Std. Mean Difference (IV, Random, 95% CI) | 0.07 [‐0.21, 0.34] |
| 22.2 Unclear/high risk of bias | 2 | 78 | Std. Mean Difference (IV, Random, 95% CI) | 1.72 [‐1.48, 4.92] |
| 23 Overall depression (follow‐up values) | 12 | Std. Mean Difference (IV, Random, 95% CI) | Subtotals only | |
| 23.1 Low risk of bias | 7 | 520 | Std. Mean Difference (IV, Random, 95% CI) | ‐0.20 [‐0.52, 0.12] |
| 23.2 Unclear/high risk of bias | 5 | 137 | Std. Mean Difference (IV, Random, 95% CI) | ‐0.67 [‐1.23, ‐0.11] |
| 24 Overall depression (change values) | 7 | Std. Mean Difference (IV, Random, 95% CI) | Subtotals only | |
| 24.1 Low risk of bias | 5 | 737 | Std. Mean Difference (IV, Random, 95% CI) | ‐0.20 [‐0.47, 0.06] |
| 24.2 Unclear/high risk of bias | 2 | 79 | Std. Mean Difference (IV, Random, 95% CI) | ‐0.75 [‐1.39, ‐0.10] |
| 25 Overall fatigue (follow‐up values) | 25 | Std. Mean Difference (IV, Random, 95% CI) | Subtotals only | |
| 25.1 Low risk of bias | 15 | 1443 | Std. Mean Difference (IV, Random, 95% CI) | ‐0.38 [‐0.59, ‐0.18] |
| 25.2 Unclear/high risk of bias | 10 | 482 | Std. Mean Difference (IV, Random, 95% CI) | ‐0.25 [‐0.45, ‐0.05] |
| 26 Overall fatigue (change values) | 13 | Std. Mean Difference (IV, Random, 95% CI) | Subtotals only | |
| 26.1 Low risk of bias | 8 | 1091 | Std. Mean Difference (IV, Random, 95% CI) | ‐0.22 [‐0.61, 0.16] |
| 26.2 Unclear/high risk of bias | 5 | 198 | Std. Mean Difference (IV, Random, 95% CI) | ‐0.45 [‐0.95, 0.05] |
| 27 Overall pain/disability (follow‐up values) | 9 | Std. Mean Difference (IV, Random, 95% CI) | Subtotals only | |
| 27.1 Low risk of bias | 4 | 169 | Std. Mean Difference (IV, Random, 95% CI) | ‐0.13 [‐0.44, 0.18] |
| 27.2 Unclear/high risk of bias | 5 | 352 | Std. Mean Difference (IV, Random, 95% CI) | 0.25 [0.04, 0.46] |
| 28 Overall pain/disability (change values) | 6 | Std. Mean Difference (IV, Random, 95% CI) | Subtotals only | |
| 28.1 Low risk of bias | 2 | 136 | Std. Mean Difference (IV, Random, 95% CI) | ‐0.03 [‐0.45, 0.40] |
| 28.2 Unclear/high risk of bias | 4 | 196 | Std. Mean Difference (IV, Random, 95% CI) | ‐0.05 [‐0.36, 0.26] |
| 29 Overall cardiorespiratory fitness (follow‐up values) | 23 | Std. Mean Difference (IV, Random, 95% CI) | Subtotals only | |
| 29.1 Low risk of bias | 10 | 657 | Std. Mean Difference (IV, Random, 95% CI) | 0.44 [0.24, 0.65] |
| 29.2 Unclear/high risk of bias | 13 | 608 | Std. Mean Difference (IV, Random, 95% CI) | 0.44 [0.23, 0.65] |
| 30 Overall cardiorespiratory fitness (change values) | 9 | Std. Mean Difference (IV, Random, 95% CI) | Subtotals only | |
| 30.1 Low risk of bias | 4 | 632 | Std. Mean Difference (IV, Random, 95% CI) | 0.49 [‐0.09, 1.06] |
| 30.2 Unclear/high risk of bias | 5 | 231 | Std. Mean Difference (IV, Random, 95% CI) | 1.16 [0.60, 1.72] |
| 31 Overall self‐reported physical activity (follow‐up values) | 17 | Std. Mean Difference (IV, Random, 95% CI) | Subtotals only | |
| 31.1 Low risk of bias | 8 | 1482 | Std. Mean Difference (IV, Random, 95% CI) | 0.45 [0.21, 0.68] |
| 31.2 Unclear/high risk of bias | 9 | 530 | Std. Mean Difference (IV, Random, 95% CI) | 0.61 [0.31, 0.91] |
| 32 Overall self‐reported physical activity (change values) | 8 | Std. Mean Difference (IV, Random, 95% CI) | Subtotals only | |
| 32.1 Low risk of bias | 4 | 1047 | Std. Mean Difference (IV, Random, 95% CI) | 0.27 [‐0.00, 0.55] |
| 32.2 Unclear/high risk of bias | 4 | 227 | Std. Mean Difference (IV, Random, 95% CI) | 0.99 [0.40, 1.58] |
| 33 Overall objective physical activity (follow‐up values) | 11 | Std. Mean Difference (IV, Random, 95% CI) | Subtotals only | |
| 33.1 Low risk of bias | 7 | 1105 | Std. Mean Difference (IV, Random, 95% CI) | 0.41 [0.15, 0.66] |
| 33.2 Unclear/high risk of bias | 4 | 165 | Std. Mean Difference (IV, Random, 95% CI) | 0.50 [‐0.24, 1.25] |
| 34 Overall objective physical activity (change values) | 5 | Std. Mean Difference (IV, Random, 95% CI) | Subtotals only | |
| 34.1 Low risk of bias | 3 | 447 | Std. Mean Difference (IV, Random, 95% CI) | 0.56 [‐0.18, 1.30] |
| 34.2 Unclear/high risk of bias | 2 | 61 | Std. Mean Difference (IV, Random, 95% CI) | 0.99 [0.44, 1.54] |
| 35 Mass (follow‐up values) | 16 | Mean Difference (IV, Fixed, 95% CI) | Subtotals only | |
| 35.1 Low risk of bias | 8 | 828 | Mean Difference (IV, Fixed, 95% CI) | 0.05 [‐0.54, 0.64] |
| 35.2 Unclear/high risk of bias | 8 | 382 | Mean Difference (IV, Fixed, 95% CI) | ‐1.28 [‐4.26, 1.70] |
| 36 Mass (change values) | 11 | Mean Difference (IV, Random, 95% CI) | Subtotals only | |
| 36.1 Low risk of bias | 5 | 819 | Mean Difference (IV, Random, 95% CI) | ‐0.43 [‐1.05, 0.20] |
| 36.2 Unclear/high risk of bias | 6 | 228 | Mean Difference (IV, Random, 95% CI) | ‐0.62 [‐1.44, 0.19] |
| 37 BMI (follow‐up values) | 17 | Mean Difference (IV, Fixed, 95% CI) | Subtotals only | |
| 37.1 Low risk of bias | 10 | 1162 | Mean Difference (IV, Fixed, 95% CI) | 0.05 [‐0.16, 0.26] |
| 37.2 Unclear/high risk of bias | 7 | 319 | Mean Difference (IV, Fixed, 95% CI) | ‐1.07 [‐2.29, 0.14] |
| 38 BMI (change values) | 8 | Mean Difference (IV, Random, 95% CI) | Subtotals only | |
| 38.1 Low risk of bias | 5 | 363 | Mean Difference (IV, Random, 95% CI) | ‐0.24 [‐0.56, 0.08] |
| 38.2 Unclear/high risk of bias | 3 | 122 | Mean Difference (IV, Random, 95% CI) | ‐0.20 [‐0.65, 0.25] |
| 39 Overall body fat (follow‐up values) | 18 | Std. Mean Difference (IV, Random, 95% CI) | Subtotals only | |
| 39.1 Low risk of bias | 10 | 768 | Std. Mean Difference (IV, Random, 95% CI) | ‐0.19 [‐0.41, 0.03] |
| 39.2 Unclear/high risk of bias | 8 | 394 | Std. Mean Difference (IV, Random, 95% CI) | ‐0.17 [‐0.40, 0.07] |
| 40 Overall body fat (change values) | 9 | Std. Mean Difference (IV, Random, 95% CI) | Subtotals only | |
| 40.1 Low risk of bias | 5 | 341 | Std. Mean Difference (IV, Random, 95% CI) | ‐0.87 [‐1.86, 0.12] |
| 40.2 Unclear/high risk of bias | 4 | 158 | Std. Mean Difference (IV, Random, 95% CI) | ‐0.30 [‐0.62, 0.01] |
| 41 Lower body strength (follow‐up values) | 10 | Std. Mean Difference (IV, Random, 95% CI) | Subtotals only | |
| 41.1 Low risk of bias | 5 | 440 | Std. Mean Difference (IV, Random, 95% CI) | 0.61 [0.22, 1.00] |
| 41.2 Unclear/high risk of bias | 5 | 197 | Std. Mean Difference (IV, Random, 95% CI) | 0.23 [‐0.32, 0.79] |
| 42 Lower body strength (change values) | 8 | Std. Mean Difference (IV, Random, 95% CI) | Subtotals only | |
| 42.1 Low risk of bias | 3 | 339 | Std. Mean Difference (IV, Random, 95% CI) | 0.97 [0.70, 1.25] |
| 42.2 Unclear/high risk of bias | 5 | 381 | Std. Mean Difference (IV, Random, 95% CI) | 0.46 [0.04, 0.88] |
| 43 Upper body strength (follow‐up values) | 13 | Std. Mean Difference (IV, Random, 95% CI) | Subtotals only | |
| 43.1 Low risk of bias | 7 | 516 | Std. Mean Difference (IV, Random, 95% CI) | 0.53 [0.04, 1.01] |
| 43.2 Unclear/high risk of bias | 6 | 252 | Std. Mean Difference (IV, Random, 95% CI) | 0.29 [‐0.21, 0.78] |
| 44 Upper body strength (change values) | 9 | Std. Mean Difference (IV, Random, 95% CI) | Subtotals only | |
| 44.1 Low risk of bias | 4 | 381 | Std. Mean Difference (IV, Random, 95% CI) | 1.13 [0.46, 1.80] |
| 44.2 Unclear/high risk of bias | 5 | 487 | Std. Mean Difference (IV, Random, 95% CI) | 0.43 [‐0.05, 0.91] |
| 45 Bone mineral density ‐ femoral neck (follow‐up and change values) | 4 | Std. Mean Difference (IV, Random, 95% CI) | Subtotals only | |
| 45.1 Low risk of bias | 1 | 457 | Std. Mean Difference (IV, Random, 95% CI) | 0.18 [‐0.00, 0.37] |
| 45.2 Unclear/high risk of bias | 3 | 329 | Std. Mean Difference (IV, Random, 95% CI) | 0.18 [‐0.39, 0.75] |
| 46 Bone mineral density ‐ lumbar spine (follow‐up and change values) | 4 | Std. Mean Difference (IV, Random, 95% CI) | Subtotals only | |
| 46.1 Low risk of bias | 1 | 457 | Std. Mean Difference (IV, Random, 95% CI) | 0.09 [‐0.09, 0.27] |
| 46.2 Unclear/high risk of bias | 3 | 329 | Std. Mean Difference (IV, Random, 95% CI) | 0.27 [‐0.16, 0.70] |
18.13. Analysis.
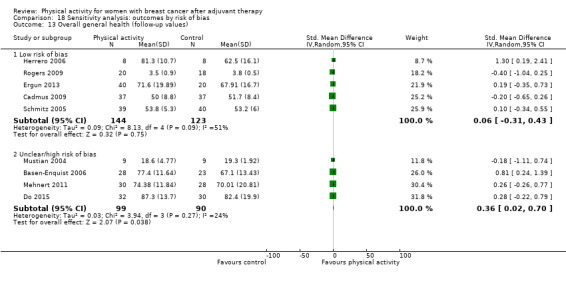
Comparison 18 Sensitivity analysis: outcomes by risk of bias, Outcome 13 Overall general health (follow‐up values).
18.14. Analysis.
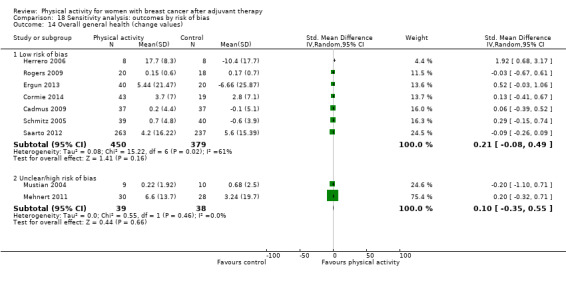
Comparison 18 Sensitivity analysis: outcomes by risk of bias, Outcome 14 Overall general health (change values).
18.15. Analysis.
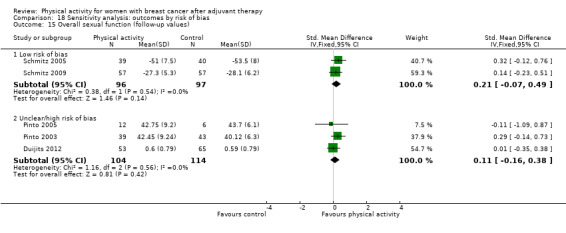
Comparison 18 Sensitivity analysis: outcomes by risk of bias, Outcome 15 Overall sexual function (follow‐up values).
18.16. Analysis.
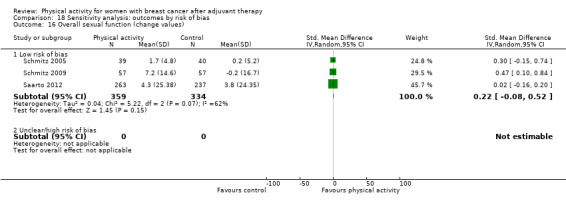
Comparison 18 Sensitivity analysis: outcomes by risk of bias, Outcome 16 Overall sexual function (change values).
18.17. Analysis.
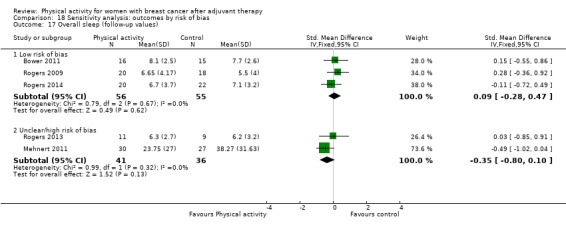
Comparison 18 Sensitivity analysis: outcomes by risk of bias, Outcome 17 Overall sleep (follow‐up values).
18.18. Analysis.

Comparison 18 Sensitivity analysis: outcomes by risk of bias, Outcome 18 Overall sleep (change values).
18.19. Analysis.
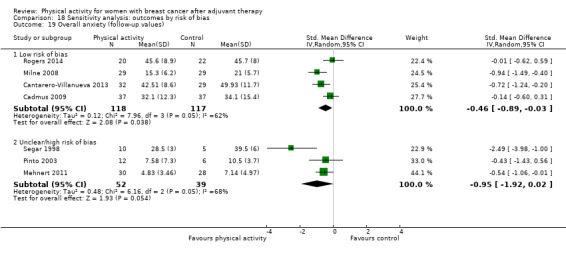
Comparison 18 Sensitivity analysis: outcomes by risk of bias, Outcome 19 Overall anxiety (follow‐up values).
18.20. Analysis.
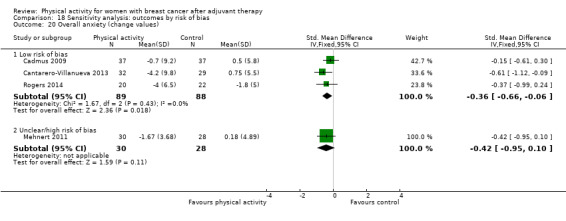
Comparison 18 Sensitivity analysis: outcomes by risk of bias, Outcome 20 Overall anxiety (change values).
18.45. Analysis.

Comparison 18 Sensitivity analysis: outcomes by risk of bias, Outcome 45 Bone mineral density ‐ femoral neck (follow‐up and change values).
18.46. Analysis.

Comparison 18 Sensitivity analysis: outcomes by risk of bias, Outcome 46 Bone mineral density ‐ lumbar spine (follow‐up and change values).
Characteristics of studies
Characteristics of included studies [ordered by study ID]
Banasik 2011.
| Methods | Study design: single‐centre RCT Number randomised: 18; 9 to yoga intervention, 9 to wait‐list control Study start: not reported; stop date: not reported Length of intervention: 8 weeks Length of follow‐up: to end of intervention Country: USA |
|
| Participants | Age, years (mean SD):
Stage, n (%):
Inclusion criteria: • Women with stage II‐IV breast cancer who were at least 2 months post treatment Exclusion criteria: • Receiving Herceptin therapy (an immune modifier). • Pregnant or lactating • Past or current history of another neoplasm • Active serious infection, or immune deficiency • History of psychiatric disorders requiring use of psychoactive medications or of documented alcohol or drug abuse • Taking current steroid therapy or other known immunomodulating medications • Physical condition preventing participation in yoga |
|
| Interventions | 9 participants assigned to exercise intervention:
Adherence: Seven participants in the yoga group who completed the study attended an average of 14 of 16 possible yoga sessions (87.5%) with a range of 12 to 15 sessions. 9 participants assigned to control:
Contamination of control group: not reported |
|
| Outcomes | Outcomes:
Numbers of participants assessed:
Adverse events: not reported |
|
| Notes | Trial registration link: none available Trial authors contacted: no Intention‐to‐treat analysis: no Funding: in part by University of Washington Center for Women’s Health and Gender Research, Washington State University Cancer Prevention and Research Center, and in part by Washington State University College of Nursing |
|
| Risk of bias | ||
| Bias | Authors' judgement | Support for judgement |
| Random sequence generation (selection bias) | Unclear risk | “Randomly assigned”; method of randomisation was not reported. |
| Allocation concealment (selection bias) | Unclear risk | Whether allocation was concealed was not reported. |
| Blinding of participants and personnel (performance bias) All outcomes | High risk | Owing to the nature of the intervention, it was not possible to conceal allocation to the intervention from participants. |
| Blinding of outcome assessment (detection bias) All outcomes | Unclear risk | Blinding of outcome assessments was not described. |
| Incomplete outcome data (attrition bias) All outcomes | High risk | Analyses included only 14 participants ‐ 7 in each group ‐ who completed the study. |
| Selective reporting (reporting bias) | High risk | Summary outcomes of FACT‐B were not provided (FACT‐B, FACT‐G, and TOI). |
| Other bias | Low risk | Trial appears to be free of other problems that could put it at high risk of bias. |
Baruth 2013.
| Methods | Study design: single‐centre RCT Number randomised: 32; 20 to intervention, 12 to control Study start: not reported; stop date: not reported Length of intervention: 12 weeks Length of follow‐up: to end of intervention Country: USA |
|
| Participants | Age, years (mean SD):
Stage, n (%):
Inclusion criteria: • Given a diagnosis of stage I‐III cancer, had completed adjuvant treatment within the previous 12 months, and were postmenopausal • Free of cardiovascular disease and major orthopaedic limitations • Not regularly active (< 5 days/week) |
|
| Interventions | 20 participants assigned to exercise intervention:
Adherence:
12 participants assigned to control:
Contamination of control group: not reported |
|
| Outcomes | Outcomes:
Numbers of participants assessed:
Adverse events: none reported |
|
| Notes | Trial registration link: none available Trial authors contacted: yes, for additional data (means and SDs for outcomes), but trial authors did not reply Intention‐to‐treat analysis: no Funding: supported by the US Army, Grant # DAMD17‐01‐1‐0628 |
|
| Risk of bias | ||
| Bias | Authors' judgement | Support for judgement |
| Random sequence generation (selection bias) | Unclear risk | "Participants were randomized 2:1 (intervention: control)". It is unclear how the allocation sequence was generated. |
| Allocation concealment (selection bias) | Unclear risk | Whether treatment assignment was concealed from study personnel and participants was not described. |
| Blinding of participants and personnel (performance bias) All outcomes | High risk | Owing to the nature of the intervention, it was not possible to conceal allocation to the intervention from participants. |
| Blinding of outcome assessment (detection bias) All outcomes | Unclear risk | Blinding of outcome assessments was not described. |
| Incomplete outcome data (attrition bias) All outcomes | High risk | Post‐test data at 12 weeks were collected on 94% of participants; only completers were analysed. |
| Selective reporting (reporting bias) | High risk | Physical activity data post intervention were not reported. |
| Other bias | Low risk | Trial appears to be free of other problems that could put it at high risk of bias. |
Basen‐Enquist 2006.
| Methods | Study design: single‐centre RCT Number randomised: 60; 30 to intervention, 25 to standard care Study start: April 2003; stop date: April 2004 Length of intervention: 6 months Length of follow‐up: to end of intervention Country: USA |
|
| Participants | Age, years (mean SD):
Stage, n (%):
Inclusion criteria: • Within 7 years of a breast cancer diagnosis • No longer receiving treatment for breast cancer (except hormone therapy) • Not engaging in focussed moderate physical activity for 30 minutes or longer a day most days of the week Exclusion criteria: • Clearance received from physician to ensure that they had no medical conditions contraindicating moderately intensive exercise |
|
| Interventions | 35 participants assigned to exercise intervention:
Adherence: Among those who started the intervention, the mean number of sessions attended was 14.6 out of 21 (SD 5.1), with a range of 2 to 21 sessions. 25 participants assigned to control:
|
|
| Outcomes | Outcomes:
Numbers of participants assessed:
Adverse events: The intervention group did not show a significantly larger number of increases in arm circumference compared with the standard care group. |
|
| Notes | Trial registration link: none available Trial authors contacted: no Intention‐to‐treat analysis: yes Funding: grants R21 CA89519 and R25 CA57730 from the National Cancer Institute |
|
| Risk of bias | ||
| Bias | Authors' judgement | Support for judgement |
| Random sequence generation (selection bias) | Low risk | “Participants were assigned to study arms using a form of adaptive randomization called minimization”. |
| Allocation concealment (selection bias) | Unclear risk | Whether the allocation was concealed is unclear. |
| Blinding of participants and personnel (performance bias) All outcomes | High risk | Owing to the nature of the intervention, it was not possible to conceal allocation to the intervention from participants. |
| Blinding of outcome assessment (detection bias) All outcomes | Low risk | Staff conducting assessments were blind to participants’ study condition. |
| Incomplete outcome data (attrition bias) All outcomes | Low risk | All participants who were randomised were included in the analysis, regardless of their attendance at intervention sessions. Data for participants who did not complete the 6‐month assessment were imputed based on regression models predicting outcomes in the remaining sample, using covariates and design variables. |
| Selective reporting (reporting bias) | Unclear risk | No selective reporting of outcomes is apparent. |
| Other bias | High risk | Imbalance between numbers allocated to intervention and control groups could potentially lead to additional bias. |
Blank 2005.
| Methods | Study design: single‐centre RCT Number randomised: 18; 9 to intervention, 9 to control Study start, not reported; stop date, not reported Length of intervention: 8 weeks Length of follow‐up: to end of intervention Country: USA |
|
| Participants | Age:
Stage:
Inclusion criteria: • Minimum of 8 weeks post chemotherapy • Oestrogen receptor positive status • Surgery for lumpectomy, modified mastectomy, or full mastectomy (with/without reconstruction) • Life expectancy greater than 6 months • Adequate blood cell counts and kidney, liver, and cardiac function • Physical and mental ability to attend all yoga training sessions Exclusion criteria: • Receiving Herceptin therapy, current steroid therapy, or other known immunomodulating medications • Pregnancy or current lactation • Past or current history of another neoplasm, active serious infection, or immune deficiency • Documented alcohol or drug abuse • History of psychiatric disorders requiring use of psychotropic medications |
|
| Interventions | 9 participants assigned to exercise intervention:
Adherence: not reported 9 participants assigned to control:
|
|
| Outcomes | Outcomes:
Numbers of participants assessed:
Adverse events: not reported |
|
| Notes | Trial registration link: none available Trial authors contacted: no Intention‐to‐treat analysis: unclear Funding: not reported |
|
| Risk of bias | ||
| Bias | Authors' judgement | Support for judgement |
| Random sequence generation (selection bias) | Unclear risk | "Women were randomized", but it was unclear how the allocation sequence was generated. |
| Allocation concealment (selection bias) | Unclear risk | Whether treatment assignment was concealed from study personnel and participants was not described. |
| Blinding of participants and personnel (performance bias) All outcomes | High risk | Owing to the nature of the intervention, it was not possible to conceal allocation to the intervention from participants. |
| Blinding of outcome assessment (detection bias) All outcomes | Unclear risk | Blinding of outcome assessments was not described. |
| Incomplete outcome data (attrition bias) All outcomes | Unclear risk | It is unclear how many participants were included in each outcome assessment. |
| Selective reporting (reporting bias) | High risk | Outcome measures were poorly described and reported. Scores for each question were not reported. |
| Other bias | High risk | Outcomes were not assessed at baseline, so it was not possible to assess whether outcomes changed as a result of intervention. |
Bower 2011.
| Methods | Study design: single‐centre RCT
Number randomised: 31; 16 to intervention, 15 to control
Study start: March 2007; stop date: July 2010
Length of intervention: 12 weeks
Length of follow‐up: to end of intervention, at 3 months post intervention Country: USA |
|
| Participants | Age, years (mean SD):
Stage, n (%):
Inclusion criteria: • Original diagnosis of stage 0‐II breast cancer • Completed local and/or adjuvant cancer therapy (with the exception of hormone therapy) at least 6 months previously • Ages 40 to 65 years • Postmenopausal • No other cancer in the past 5 years • Experiencing persistent cancer‐related fatigue Exclusion criteria: • Chronic medical conditions or regular use of medications associated with fatigue (e.g. untreated hypothyroidism, diabetes, autoimmune disease, anaemia (defined as haematocrit < 24), chronic fatigue syndrome) • Evidence that fatigue was driven primarily by a medical or psychiatric disorder other than cancer (e.g. current major depression, insomnia, sleep apnoea) • Evidence that fatigue was driven primarily by other non‐cancer‐related factors (e.g. shift work, recent change in activity or schedule) • Physical problems or conditions that could make yoga unsafe (e.g. serious neck injury, unstable joints) • Body mass index (BMI) > 31 kg/m² |
|
| Interventions | 16 participants assigned to exercise intervention:
• Iyengar yoga, a traditional form of Hatha yoga, performed in groups of 4 to 6 women for 90 minutes twice a week for 12 weeks Adherence: Over 80% of participants attending at least 20 of the 24 yoga classes offered. Mean number of classes attended was 18.9 of 24 classes (78%), and median number was 22 of 24 classes (92%). At 3‐month follow‐up, 9 of 14 women who attended the yoga classes (64%) were continuing to use techniques learned in class. Control group: 15 assigned to control: • Health education classes conducted for 120 minutes once a week for 12 weeks (24 hours) in groups of 4 to 7 women. Classes were led by a PhD‐level psychologist with clinical experience. Adherence: In the education group, the mean number of classes attended was 9.2 of 12 classes (77%), and the median number was 11 of 12 classes (92%). |
|
| Outcomes | Primary outcome:
Secondary outcomes:
Numbers of participants assessed:
.Adverse events: none reported |
|
| Notes | Trial registration link: none available Trial authors contacted: no Intention‐to‐treat analysis: yes Funding: National Center for Complementary and Alternative Medicine/National Institutes of Health (NCCAM/NIH U01‐AT003682; Iyengar Yoga for Breast Cancer Survivors with Persistent Fatigue) |
|
| Risk of bias | ||
| Bias | Authors' judgement | Support for judgement |
| Random sequence generation (selection bias) | Unclear risk | "Allocation sequence was generated independently by the study statistician", but it is unclear how the allocation sequence was generated. |
| Allocation concealment (selection bias) | Unclear risk | "Allocation was concealed in opaque envelopes" but whether "sequential" is not mentioned. |
| Blinding of participants and personnel (performance bias) All outcomes | High risk | Owing to the nature of the intervention, it was not possible to blind participants; however, it is unclear whether the outcome was influenced by lack of masking. |
| Blinding of outcome assessment (detection bias) All outcomes | Low risk | "Outcomes assessors for the performance tasks were blinded to group assignment, and all were trained in standardized testing procedures". |
| Incomplete outcome data (attrition bias) All outcomes | Low risk | "All statistical analyses were performed on an intent‐to‐treat basis". Mixed model analysis was used to account for missing data. |
| Selective reporting (reporting bias) | Low risk | No selective reporting of outcomes is apparent. |
| Other bias | Low risk | Trial appears to be free of other problems that could put it at high risk of bias. |
Cadmus 2009.
| Methods | Study design: single‐centre RCT Number randomised for 6‐month study: 75; to intervention; 37, to control, 38 Number randomised for 12‐month study: 50; to intervention, 25; to control, 25 Study start: March 2004; stop date: July 2006 Length of intervention: 6 months; subsample study: 12 months Length of follow‐up: to end of intervention Country: USA |
|
| Participants | Age, years (mean SD):
Stage, n (%):
Inclusion criteria: • Postmenopausal women • Ages 40 to 75 years • Stage 0‐IIIA breast cancer • 1 to 10 years post diagnosis • ≥ 12 months post completion of adjuvant treatment • Physically able to exercise and physician consent to begin an exercise programme • Sedentary activity pattern (< 60 minutes/week) Exclusion criteria: • Diagnosis of recurrent or other primary cancer event • Current smoker • Diabetes mellitus • Current or planned enrolment in a structured weight loss programme |
|
| Interventions | 37 participants assigned to exercise intervention:
Adherence:
38 participants assigned to control:
|
|
| Outcomes | Outcomes:
Numbers of participants assessed:
Adverse events: none reported |
|
| Notes | Trial registration link: none available Trial authors contacted: no Intention‐to‐treat analysis: yes but last observation carried forward (LOCF) Funding: Lance Armstrong Foundation, American Cancer Society, Susan G. Komen. In part by the National Center of Research Resources (NIH) |
|
| Risk of bias | ||
| Bias | Authors' judgement | Support for judgement |
| Random sequence generation (selection bias) | Low risk | Random number generator was used. |
| Allocation concealment (selection bias) | Low risk | “The randomization code for each participant was obtained by the principal investigator (who was not involved in recruitment or data collection) only after baseline measures for that individual had been completed and staff conducting clinic visits did not have access to the randomization program”. |
| Blinding of participants and personnel (performance bias) All outcomes | High risk | Owing to the nature of the intervention, it was not possible to conceal allocation to the intervention from participants. |
| Blinding of outcome assessment (detection bias) All outcomes | Low risk | Study personnel and outcome assessors were not masked or blinded to study interventions. |
| Incomplete outcome data (attrition bias) All outcomes | High risk | Last observation carried forward (LOCF) approach was used; “baseline QoL values were carried forward”. |
| Selective reporting (reporting bias) | Low risk | No selective reporting of outcomes is apparent. |
| Other bias | Low risk | Trial appears to be free of other problems that could put it at high risk of bias. |
Cantarero‐Villanueva 2013.
| Methods | Study design: single‐centre RCT Numbers allocated, 68; 34 to exercise intervention; 34 to usual care Study start: March 2009; stop date: June 2010 Length of intervention: 8 weeks Length of follow‐up: at 6 months after discharge Country: Spain |
|
| Participants | Age, years (mean SD):
Stage, n (%):
Inclusion criteria: • Between 25 and 65 years old with a diagnosis of breast cancer (stage I‐IIIA) • Finished oncology treatment except hormone therapy in the previous 18 months • Exhibit clinically significant fatigue (> 3 in total score on the Piper Fatigue Scale) Exclusion criteria: • Receiving oncology treatment at the time of the study • Physical limitations associated with orthopaedic conditions |
|
| Interventions | 34 participants assigned to exercise intervention:
Adherence:
34 participants assigned to control:
|
|
| Outcomes | Primary outcomes:
Secondary outcomes:
Numbers of participants assessed:
Adverse events: Adverse effects reported during the study included discomfort or low‐intensity pain/stiffness after an exercise session in 3 participants; nevertheless, they continued the programme. |
|
| Notes | Trial registration link: none available Trial authors contacted: no Intention‐to‐treat analysis: no Funding: Health Institute Carlos III and PN I+D+I 2008‐2011, Madrid, Spanish government (grant no. FIS PI10/02749); Research Office of the University of Granada, Spain |
|
| Risk of bias | ||
| Bias | Authors' judgement | Support for judgement |
| Random sequence generation (selection bias) | Low risk | Computer‐generated numbers produced a sequence that was entered into opaque envelopes. |
| Allocation concealment (selection bias) | Low risk | “Computer‐generated number sequence was entered into opaque envelopes. These envelopes were opened by a blinded researcher after the first outcome measurement”. |
| Blinding of participants and personnel (performance bias) All outcomes | High risk | Owing to the nature of the intervention, it was not possible to conceal allocation to the intervention from participants. |
| Blinding of outcome assessment (detection bias) All outcomes | Low risk | Assessors were blinded to treatment allocation. |
| Incomplete outcome data (attrition bias) All outcomes | High risk | Only those who completed postintervention and 6‐month assessments were included in analysis. |
| Selective reporting (reporting bias) | Low risk | No selective reporting of outcomes is apparent. |
| Other bias | Low risk | Trial appears to be free of other problems that could put it at high risk of bias. |
Carson 2009.
| Methods | Study design: single‐centre RCT Number randomised: 37; 17 to intervention, 20 to control Study start: June 2005; stop date: October 2006 Length of intervention: 8 weeks Length of follow‐up: at 8 weeks, at 3 months Country: USA |
|
| Participants | Age, years (mean SD):
Stage, n (%):
Inclusion criteria: • At least 1 hot flash per day on 4 or more days per week • No signs of active breast cancer • No current cytotoxic chemotherapy • Diagnosis of breast cancer at stage IA‐IIB ≥ 2 years before • No hormone replacement therapy currently or within prior 3 months • Stabilised on a constant regimen of menopausal symptom medications and supplements for at least 3 weeks • Taking antidepressants, stabilised at a fixed dose for at least 3 months Exclusion criteria: • Resided > 70 miles from the research site and thus were less likely to attend intervention sessions • Unavailable to attend the intervention on the day and at the time offered (most yoga groups were scheduled so as to be accessible to women holding full‐time day jobs) • Currently engaged in intensive yoga practice (> 3 days/week) • Received treatment for serious psychiatric disorders (e.g. schizophrenia) in the previous 6 months • Not English speaking |
|
| Interventions | 17 participants assigned to exercise intervention:
Adherence: On average, participants attended 6 of the 8 classes (range 0 to 8). Only 3 women attended < 4 classes. Adherence to daily yoga practice, average 30 minutes/d at post and 16 minutes at 3 months Control group: 20 assigned to control:
|
|
| Outcomes | Treatment outcomes. assessed via a brief daily diary measurement strategy
Numbers of participants assessed:
Adverse events: not reported |
|
| Notes | Trial registration link: none available Trial authors contacted: yes, for means and SDs for outcomes. However, trial authors did not provide these data. Intention‐to‐treat analysis: no Funding: Susan G. Komen Breast Cancer Foundation |
|
| Risk of bias | ||
| Bias | Authors' judgement | Support for judgement |
| Random sequence generation (selection bias) | Low risk | Random number table was used. |
| Allocation concealment (selection bias) | High risk | "Concealed in envelopes"; sequential sequencing or opaque envelopes were not mentioned. |
| Blinding of participants and personnel (performance bias) All outcomes | High risk | Owing to the nature of the intervention, it was not possible to blind participants; however, it is unclear whether the outcome was influenced by lack of masking. |
| Blinding of outcome assessment (detection bias) All outcomes | Low risk | Research assistant collecting assessment data was kept blind with regard to participant condition assignments. |
| Incomplete outcome data (attrition bias) All outcomes | High risk | No ITT, and no mention of how missing data were handled. 8 participants did not complete the intervention. |
| Selective reporting (reporting bias) | Low risk | No selective reporting of outcomes is apparent. |
| Other bias | Low risk | Trial appears to be free of other problems that could put it at high risk of bias. |
Cerulli 2014.
| Methods | Study design: single‐centre RCT
Number randomised: 20; 10 to exercise, 10 to control
Study start and stop dates: not reported
Length of intervention: 16 weeks
Length of follow‐up: to end of intervention Country: Italy |
|
| Participants | Age, years (mean SD):
Stage, n (%):
Inclusion criteria: • Age 40 to 50 years • Conclusion of all cancer‐related treatments at least 6 months previously • Mastectomy • No external physical activity for at least the preceding 12 months • Medical eligibility for non‐competitive athletic activity |
|
| Interventions | 10 participants assigned to exercise intervention:
Adherence: not reported 10 assigned to control:
|
|
| Outcomes | Outcomes:
Numbers of participants assessed:
Adverse events: none reported |
|
| Notes | Trial registration link: none available Trial authors contacted: no Intention‐to‐treat analysis: no dropouts reported Funding: not reported |
|
| Risk of bias | ||
| Bias | Authors' judgement | Support for judgement |
| Random sequence generation (selection bias) | Unclear risk | "Patients were randomly divided into two groups". It is unclear how the allocation sequence was generated. |
| Allocation concealment (selection bias) | Unclear risk | Whether treatment assignment was concealed from study personnel and participants was not described. |
| Blinding of participants and personnel (performance bias) All outcomes | High risk | Owing to the nature of the intervention, it was not possible to blind participants. |
| Blinding of outcome assessment (detection bias) All outcomes | Unclear risk | Whether study personnel and outcome assessors were masked or blinded to study interventions was not reported. |
| Incomplete outcome data (attrition bias) All outcomes | Low risk | No dropouts were reported. |
| Selective reporting (reporting bias) | Low risk | No selective reporting of outcomes is apparent. |
| Other bias | Low risk | Trial appears to be free of other problems that could put it at high risk of bias. |
Cormie 2014.
| Methods | Study design: RCT Number randomised: 62; 22 to high‐load resistance exercise, 21 to low‐load resistance exercise, 19 to control Study start: June 2010; stop date: not stated Length of intervention: 3 months Length of follow‐up: to end of intervention Country: Australia |
|
| Participants | Age, years (mean SD):
Stage, n (%):
Time since cancer diagnosis, mean (SD) years:
Inclusion criteria: • Histological diagnosis of breast cancer at least 1 year before the study • Clinical diagnosis of breast cancer‐related lymphoedema and medical clearance from general practitioner • Clinical diagnosis of lymphoedema defined as having at least a 5% inter‐limb discrepancy in volume or circumference at the point of greatest visible difference Exclusion criteria: • Unstable lymphoedema defined as receiving intensive therapy (i.e. decongestive therapy or antibiotics for infection) within the previous 3 months • Musculoskeletal, cardiovascular, and/or neurological disorder that could inhibit exercise |
|
| Interventions | 43 participants assigned to 1 of 2 resistance exercise interventions
Adherence: Exercise attendance was high for both resistance training groups, with an average of 23.2 ± 1.9 out of a possible 24 sessions attended (HLRE 23.4 ± 1.1; LLRE 22.9 ± 2.4). 19 participants assigned to control:
|
|
| Outcomes | Primary outcome:
Secondary outcomes:
Numbers of participants assessed:
Adverse events: No lymphoedema exacerbations or any other adverse events were reported. |
|
| Notes | Trial registration link: ACTRN12610000788077 (http://www.anzctr.org.au/ACTRN12610000788077.aspx) Trial authors contacted: no Intention‐to‐treat analysis: yes, but using LOCF Funding: Edith Cowan University and University of Canberra |
|
| Risk of bias | ||
| Bias | Authors' judgement | Support for judgement |
| Random sequence generation (selection bias) | Low risk | Participants were randomised in an allocation ratio of 1:1:1 by a random assignment computer programme. |
| Allocation concealment (selection bias) | Low risk | Exercise physiologists involved in assigning participants to groups were blinded to the allocation sequence. |
| Blinding of participants and personnel (performance bias) All outcomes | High risk | Owing to the nature of the intervention, it was not possible to conceal allocation to the intervention from participants. |
| Blinding of outcome assessment (detection bias) All outcomes | Unclear risk | Blinding of outcome assessments was not described. |
| Incomplete outcome data (attrition bias) All outcomes | High risk | Missing data were addressed by imputing change across time as zero. |
| Selective reporting (reporting bias) | Low risk | No selective reporting of outcomes is apparent. |
| Other bias | Low risk | Trial appears to be free of other problems that could put it at high risk of bias. |
Courneya 2003.
| Methods | Study design: single‐centre RCT Number randomised: 53; intervention, 25; control, 28 Study start: May 2001; stop date: June 2001 Length of intervention: 15 weeks Length of follow‐up: to end of intervention Country: Canada |
|
| Participants | Age, years (mean SD):
Stage, n (%):
Inclusion criteria: • Histologically confirmed stage I‐IIIB breast cancer • Diagnosis between January 1999 and June 2000 • Completed surgery, radiotherapy, and/or chemotherapy (≥ 6 months before randomisation) with or without current tamoxifen or arimidex therapy • Postmenopausal (not experiencing menstrual periods for previous 12 months) • Non‐smokers (not smoking for previous 12 months) • Between 50 and 69 years of age • English‐speaking • Willing to travel to the exercise facility Exclusion criteria: • Known cardiac disease • Uncontrolled hypertension • Uncontrolled thyroid disease • Diabetes • Mental illness • Infection • Immune or endocrine abnormality • Body weight reduction ≥ 10% in the past 6 months • Positive exercise stress test |
|
| Interventions | 25 participants assigned to exercise intervention:
Adherence: Exercise group completed 98.4% (44.3 of 45) of prescribed exercise sessions. 28 participants assigned to control:
|
|
| Outcomes | Primary outcomes:
Other outcomes:
Numbers of participants assessed:
Adverse events:
|
|
| Notes | Trial registration link: none available Trial authors contacted: no Intention‐to‐treat analysis: no Funding: NCIC, CCS, Canadian Institutes of Health Research, Izaak Walton Killiam Memorial Scholarship, Alberta Heritage Foundation for Medical Research studentship |
|
| Risk of bias | ||
| Bias | Authors' judgement | Support for judgement |
| Random sequence generation (selection bias) | Low risk | Random numbers table. Block permutation procedure was used. |
| Allocation concealment (selection bias) | Low risk | “The allocation sequence and group assignments were generated by a research assistant and then enclosed in sequentially numbered and sealed envelopes”. |
| Blinding of participants and personnel (performance bias) All outcomes | High risk | Owing to the nature of the intervention, it was not possible to conceal allocation to the intervention from participants. |
| Blinding of outcome assessment (detection bias) All outcomes | Unclear risk | Participants were not blinded for self‐report measures. Participants were blinded to their exercise test results until after the trial. Exercise physiologists were blinded for physical outcome measures. Laboratory staff and those who assessed study endpoints were blinded to treatment assignment. |
| Incomplete outcome data (attrition bias) All outcomes | Low risk | One study participant withdrew from the intervention group. Two participants withdrew from the control group and were not included in cardiopulmonary outcome analyses. Only 1 participant who had withdrawn from the exercise group was missing from QoL analyses. |
| Selective reporting (reporting bias) | Low risk | No selective reporting of outcomes is apparent. |
| Other bias | Low risk | Trial appears to be free of other problems that could put it at high risk of bias. |
Cuesta‐Vargas 2014.
| Methods | Study design: single‐centre quasi‐RCT Number randomised: 42; 22 to intervention, 20 to control Study start: September 2010; stop date: July 2012 Length of intervention: 8 weeks Length of follow‐up: to end of intervention Country: Spain |
|
| Participants | Age, years (mean SD):
Stage, n (%):
Inclusion criteria: • History of primary breast cancer • Within 1 year of cancer diagnosis • Aged 25 to 65 years • Post cancer treatment in the past 6 months (eligible if receiving hormone therapy) • Cancer‐free at the time of study enrolment Exclusion criteria: • Fear of aquatic exercise that would prevent participation in deep water running programme |
|
| Interventions | 22 participants assigned to 8‐week exercise intervention:
Adherence: 42 participants attended more than 80% of the 24 treatment sessions. Although 2 intervention participants reported ‘wake up tired in the morning’ after 1 session, this event did not impact programme completion and was not repeated. 22 participants assigned to control:
|
|
| Outcomes | Primary outcome:
Other outcomes:
Numbers of participants assessed:
Adverse events: No further adverse events were associated with participation in the intervention. |
|
| Notes | Trial registration link: none available Trial authors contacted: no Intention‐to‐treat analysis: No missing data were reported. Funding: not reported |
|
| Risk of bias | ||
| Bias | Authors' judgement | Support for judgement |
| Random sequence generation (selection bias) | High risk | Participants were allocated in order of arrival to complete each group. |
| Allocation concealment (selection bias) | High risk | Allocation was not concealed from researchers. |
| Blinding of participants and personnel (performance bias) All outcomes | High risk | Owing to the nature of the intervention, it was not possible to conceal allocation to the intervention from participants. |
| Blinding of outcome assessment (detection bias) All outcomes | Low risk | “Assessor, who was blinded to participant group allocation” |
| Incomplete outcome data (attrition bias) All outcomes | Low risk | No missing data were reported. |
| Selective reporting (reporting bias) | Low risk | No selective reporting of outcomes is apparent. |
| Other bias | Low risk | Trial appears to be free of other problems that could put it at high risk of bias. |
Daley 2007.
| Methods | Study design: single‐centre RCT Number randomised: 108; 34 to exercise therapy, 36 to exercise placebo, 38 to control Study start: January 2003; stop date: July 2005 Length of intervention: 8 weeks Length of follow‐up: at 24 weeks Country: UK |
|
| Participants | Age, years (mean SD):
Stage:
Inclusion criteria: • Women who were not regularly active • Treated for localised breast cancer 12 to 36 months • Aged 18 to 65 years • Willing to attend supervised exercise sessions 3 times per week for 8 weeks • Exercise pre‐contemplator, contemplator, or preparer as defined by the TTM Exclusion criteria: • Women with metastases • Inoperable or active locoregional disease determined ineligible by clinician • Physical or psychiatric impairment that would seriously influence physical mobility • Nausea, anorexia, or other diseases affecting health • High activity level • Contraindication to exercise, assessed by Physical Activity Readiness |
|
| Interventions | 34 participants assigned to 8‐week exercise intervention:
36 participants assigned to exercise placebo:
Adherence: Attended at least 70% (at least 17 of 24 sessions) of sessions; exercise therapy group, 77%; exercise placebo group, 88.9% 38 participants assigned to control:
|
|
| Outcomes | Primary outcomes:
Secondary outcomes:
Numbers of participants assessed:
Adverse events: not reported |
|
| Notes | Trial registration link: none available Trial authors contacted: yes, trial authors provided additional outcome data Intention‐to‐treat analysis: unclear Funding: Cancer Research UK (grant number: CE8304) |
|
| Risk of bias | ||
| Bias | Authors' judgement | Support for judgement |
| Random sequence generation (selection bias) | Low risk | “performed using stratified random permuted blocks” |
| Allocation concealment (selection bias) | Low risk | Telephone randomisations service was provided by an independent trials unit. |
| Blinding of participants and personnel (performance bias) All outcomes | High risk | Owing to the nature of the intervention, it was not possible to conceal allocation to the intervention from participants. |
| Blinding of outcome assessment (detection bias) All outcomes | High risk | “Outcome assessors were not blinded to participants’ group allocation”. |
| Incomplete outcome data (attrition bias) All outcomes | Unclear risk | “Data were analysed on an ITT basis” It is unclear how this was done. |
| Selective reporting (reporting bias) | Low risk | No selective reporting of outcomes is apparent. |
| Other bias | Low risk | Trial appears to be free of other problems that could put it at high risk of bias. |
DeNysschen 2011.
| Methods | Study design: single‐centre RCT
Number randomised: 100; 36 to exercise begun during treatment (EE), 30 to exercise begun after treatment (CE), 34 to control
Study start and stop dates: 1999 to 2006
Length of intervention: 4 to 6 months
Length of follow‐up: at 1 year from baseline Country: USA |
|
| Participants | Age, years (mean SD):
Stage, n (%):
Inclusion criteria: • Women aged 18 years or older • Confirmed diagnosis of breast cancer • Beginning second cycle of chemotherapy • Ability to read, write, and understand English • Mentally able to understand and able to provide written informed consent • Karnofsky Performance Scale (KPS) score > 60 Exclusion criteria: • Receiving concurrent radiotherapy for another disease • Had bone marrow transplantation • Uncontrolled hypertension or diabetes mellitus • Pain intensity rating ≥ 3 on a 0 to 10 numerical scale • Lytic bone lesion or other orthopaedic limitations • History of major depression or sleep disorders • Chemotherapy in the past year • Diagnosis of AIDS‐related malignancies or leukaemia • Absolute contradictions to exercise testing as established by American College of Sports Medicine (1995) |
|
| Interventions | 66 participants assigned to exercise intervention (36 to EE, 30 to CE):
30 participants assigned to control:
Adherence: EE group reported adherence rate of 74% by end of intervention and 78% by end of follow‐up; CE group reported 86% adherence at end of intervention |
|
| Outcomes | No primary outcome stated:
Outcomes measured: • EE group: n = 36 at baseline, n = 36 at 4 to 6 months (end of intervention) • CE group: n = 30 at baseline, n = 30 at 4 to 6 months (end of intervention) • Control group: n = 34 at baseline, n = 34 at 4 to 6 months (end of intervention) Adverse events: none reported |
|
| Notes | Trial registration link: none available Trial authors contacted: no Intention‐to‐treat analysis: no missing data evident in this study Funding: National Cancer Institute; Clinical & Translational Science Institute, Clinical Research Center |
|
| Risk of bias | ||
| Bias | Authors' judgement | Support for judgement |
| Random sequence generation (selection bias) | Unclear risk | Generation of random sequence was not described. |
| Allocation concealment (selection bias) | Unclear risk | Whether treatment assignment was concealed from study personnel and participants was not described. |
| Blinding of participants and personnel (performance bias) All outcomes | High risk | Owing to the nature of the intervention, it was not possible to conceal allocation to the intervention from participants. |
| Blinding of outcome assessment (detection bias) All outcomes | Low risk | "Measurements of study variables were taken by research nurses who were blinded to the participants' group assignment". |
| Incomplete outcome data (attrition bias) All outcomes | Low risk | No missing data were reported. |
| Selective reporting (reporting bias) | High risk | Data on cardiorespiratory fitness and on physical activity were not reported. |
| Other bias | High risk | Control group and intervention groups were reported as having similar activity levels as intervention groups post intervention, possible contamination. Low adherence rate of 74% by end of intervention and 78% at end of follow‐up in the intervention group |
Do 2015.
| Methods | Study design: single‐centre RCT Number randomised: 212; 106 to early exercise group (EEG), 106 to delayed exercise group (DEG) Study start: not reported; stop date, not reported Length of intervention: 4 weeks. Length of follow‐up: at 6 to 8 weeks only in early exercise group Country: South Korea |
|
| Participants | Baseline demographic and medical history variables for 32 in EEG and for 30 in DEG Age, years (mean SD):
Stage, n (%):
Inclusion criteria: • Not reported Exclusion criteria: • Evidence of recurrent disease or other musculoskeletal involvement such as low back pain, disc problems, osteoarthritis, rheumatoid arthritis, shoulder problems |
|
| Interventions | 106 participants assigned to early exercise intervention:
Adherence: not reported 106 participants assigned to control:
|
|
| Outcomes | Outcomes:
Numbers of participants assessed:
Adverse events: not reported |
|
| Notes | Trial registration link: none available Trial authors contacted: no Intention‐to‐treat analysis: no Funding: not reported |
|
| Risk of bias | ||
| Bias | Authors' judgement | Support for judgement |
| Random sequence generation (selection bias) | Low risk | "1:1 ratio using a computer‐generated allocation sequence” |
| Allocation concealment (selection bias) | Unclear risk | Whether allocation was concealed was not reported. |
| Blinding of participants and personnel (performance bias) All outcomes | High risk | Owing to the nature of the intervention, it was not possible to conceal allocation to the intervention from participants. |
| Blinding of outcome assessment (detection bias) All outcomes | Unclear risk | Not mentioned whether study personnel and outcome assessors were masked or blinded to study interventions |
| Incomplete outcome data (attrition bias) All outcomes | High risk | Analysis performed only on “completers”; withdrawals not included in analysis. |
| Selective reporting (reporting bias) | Low risk | No selective reporting of outcomes is apparent. |
| Other bias | High risk | Dropout rate was high (71%). |
Dolan 2016.
| Methods | Study design: single‐centre RCT Number randomised: 36, 12 to aerobic interval training (AIT), 12 to continuous moderate training (CMT), 12 to control Study start: February 2013; stop date: December 2014 Length of intervention: 6 weeks Length of follow‐up: at 3 months for physical activity Country: Canada |
|
| Participants | Age, years (mean SD):
Stage, n (%):
Time since cancer diagnosis, mean years:
Inclusion criteria: • Completed different combinations of surgery, chemotherapy, radiation, and hormonal therapy for early‐stage breast cancer (stage I‐IIIA) • Postmenopausal status was a set condition to minimise possible confounding factors associated with oestrogen status, treatment, and exercise response. Exclusion criteria: • Received diagnosis of metastatic disease, uncontrolled hypertension, history of cardiac disease, or pulmonary disease • Did not receive approval from physician to participate • Age > 75 years • BMI> 40 kg/m² • Could not commit to 18 exercise sessions in 6 weeks • Any other contraindications to exercise |
|
| Interventions | 23 participants assigned to 1 of 2 exercise interventions:
Adherence: CMT group (n = 11) completed 17.8 sessions that took an average of 40 minutes to complete and covered a total distance of 65.34 km. AIT group (n = 12) completed 17.8 high‐intensity interval sessions in average time of 36 minutes and covered a total distance of 64.86 km. At 3 months, 92% of women in the AIT group reported achieving or superseding the recommended weekly exercise dose according to guidelines. Only 42% of individuals in the CMT group reported meeting the recommended dose. 10 participants assigned to control:
|
|
| Outcomes | Primary outcomes:
Secondary outcomes:
Numbers of participants assessed:
Adverse events: No adverse events occurred during supervised exercise sessions or were self‐reported by participants. |
|
| Notes | Trial registration link: none available Trial authors contacted: no Intention‐to‐treat analysis: no Funding: BC Sports Medicine Research Foundation |
|
| Risk of bias | ||
| Bias | Authors' judgement | Support for judgement |
| Random sequence generation (selection bias) | Unclear risk | “Randomly assigned”; method of randomisation not reported |
| Allocation concealment (selection bias) | Unclear risk | Whether allocation was concealed was not reported. |
| Blinding of participants and personnel (performance bias) All outcomes | High risk | Owing to the nature of the intervention, it was not possible to conceal allocation to the intervention from participants. |
| Blinding of outcome assessment (detection bias) All outcomes | Unclear risk | Not mentioned whether study personnel and outcome assessors were masked or blinded to study interventions |
| Incomplete outcome data (attrition bias) All outcomes | High risk | Analysis performed only on “completers”; withdrawals not included in analysis |
| Selective reporting (reporting bias) | Low risk | No selective reporting of outcomes is apparent. |
| Other bias | Low risk | Trial appears to be free of other problems that could put it at high risk of bias. |
Duijits 2012.
| Methods | Study design: multi‐centre RCT Number randomised: 422; 109 to cognitive‐behavioural therapy (CBT); 104 to physical exercise; 106 to CBT and physical exercise combined; 103 to control group Study start: January 2008; recruitment stop date: December 2009 Length of intervention: 12 weeks Length of follow‐up: at 6 months (at 3 months post intervention) Country: Netherlands |
|
| Participants | Age, years (mean SD):
Stage:
Inclusion criteria: • Primary breast cancer (stages T1‐4, N0‐1, and M0) • Younger than 50 years and premenopausal at diagnosis • Had received adjuvant chemotherapy and/or hormonal therapy • Disease‐free at study entry • Reported at least a minimal level of menopausal symptoms • Chemotherapy had to be completed at least 4 months before but not more than 5 years before study entry (hormonal therapy could still be ongoing) Exclusion criteria: • Lack of basic proficiency in Dutch • Serious cognitive or psychiatric problems • Serious physical comorbidity • Obesity (body mass index > 35), because exercise may be contraindicated as a treatment for hot flashes in obese women • Participating in concurrent studies targeted at menopausal symptoms or involving similar interventions |
|
| Interventions | 109, 104, and 106 participants were assigned to CBT, exercise and CBT, and exercise 12‐week intervention, respectively:
Adherence:
103 participants assigned to control:
|
|
| Outcomes | Primary outcomes:
Secondary outcomes:
Numbers of participants assessed:
Adverse events: not reported |
|
| Notes | Trial registration link: https://clinicaltrials.gov/ct2/show/NCT00582244 Trial authors contacted: no Intention‐to‐treat analysis: no Funding: supported by grant No. NKI 2006‐3470 from the Dutch Cancer Society; the Integral Cancer Center, Amsterdam; the Pink Ribbon Foundation; and Polar Electro Nederland |
|
| Risk of bias | ||
| Bias | Authors' judgement | Support for judgement |
| Random sequence generation (selection bias) | Low risk | “Computerized block randomization” |
| Allocation concealment (selection bias) | Unclear risk | Whether treatment assignment was concealed from study personnel and participants was not described. Centralised randomisation was not mentioned. |
| Blinding of participants and personnel (performance bias) All outcomes | High risk | Owing to the nature of the intervention, it was not possible to conceal allocation to the intervention from participants. |
| Blinding of outcome assessment (detection bias) All outcomes | Unclear risk | No mention of whether study personnel and outcome assessors were masked or blinded to study interventions |
| Incomplete outcome data (attrition bias) All outcomes | High risk | “Missing values were replaced by the average score of the completed items in the same scale for each individual, provided that at least 50% of the items in that scale had been completed”. |
| Selective reporting (reporting bias) | Low risk | No selective reporting of outcomes is apparent. |
| Other bias | Low risk | Trial appears to be free of other problems that could put it at high risk of bias. |
Ergun 2013.
| Methods | Study design: single‐centre RCT Number randomised: 60; 20 to supervised exercise, 20 to home exercise, 20 to control Study start: not reported; stop date: not reported Length of intervention: 12 weeks Length of follow‐up: to end of intervention Country: Turkey |
|
| Participants | Age, years (mean SD):
Stage, n (%):
Inclusion criteria: • Completion of surgical therapy, radiation therapy, and chemotherapy • Postmenopausal • Not smoking in the past year • Agreeing to participate in the study • Absence of any physical condition that would prevent exercising • Having the cognitive capacity to answer the questions Exclusion criteria: • Recurrent or progressing breast cancer, lymphoedema, serious cardiac disease or unregulated hypertension, acute or chronic respiratory disease, mental disease, any infection, any immune or endocrinological disorder that would alter immune indicators, rheumatic disease, serious musculoskeletal disease (that would hinder exercising) • Loss of more than 10% of body weight in the past 6 months • Attended a regular exercise programme in the past 6 months |
|
| Interventions | 40 participants assigned to two 12‐week exercise interventions:
Adherence: No data on adherence were reported. 20 participants assigned to control:
|
|
| Outcomes | Primary outcomes:
Secondary outcomes:
Numbers of participants assessed:
Adverse events: No participants experienced any side effects or developed lymphoedema (although 1 participant developed metastasis). |
|
| Notes | Trial registration link: none available Trial authors contacted: no Intention‐to‐treat analysis: unclear Funding: supported by Ege University Medical Faculty BAP project (Project Number: 2010‐TIP‐069) |
|
| Risk of bias | ||
| Bias | Authors' judgement | Support for judgement |
| Random sequence generation (selection bias) | Low risk | Using random numbers table |
| Allocation concealment (selection bias) | Unclear risk | Whether treatment assignment was concealed from study personnel and participants was not described. |
| Blinding of participants and personnel (performance bias) All outcomes | High risk | Owing to the nature of the intervention, it was not possible to conceal allocation to the intervention from participants. |
| Blinding of outcome assessment (detection bias) All outcomes | Low risk | “Molecular biologists that performed the measurements and the oncology specialist who made the assessment were blind to the exercise groups of the patients”. |
| Incomplete outcome data (attrition bias) All outcomes | Unclear risk | Missing data handling methods were not reported. |
| Selective reporting (reporting bias) | Low risk | No selective reporting of outcomes is apparent. |
| Other bias | Low risk | Trial appears to be free of other problems that could put it at high risk of bias. |
Fillion 2008.
| Methods | Study design: single‐centre RCT Number randomised: 94; 48 to intervention group, 46 to control group Study start: not reported; stop date: not reported Length of intervention: 4 weeks Length of follow‐up: at 3 months Country: Canada |
|
| Participants | Age, years (mean SD):
Stage, n (%):
Inclusion criteria: • Diagnosis of initial non‐metastatic breast cancer • Completion of initial breast cancer treatment no longer than 2 years before enrolment • Receipt of 1 series of adjuvant treatments of radiation therapy, or had received radiation therapy in combination with other adjuvant treatments (e.g. chemotherapy, hormonal therapy) • Ability to understand and speak French • Residence near the cancer centre • Availability to take part in a series of 4 weekly sessions • Acceptance of randomisation procedure pass revised Physical Activity Readiness Medical Examination • Authorisation of supervising physician before performing fitness assessment Exclusion criteria: • Clinical levels of depression symptoms, as measured by HADS (score > 10) • Insomnia, as defined by the Diagnostic and Statistical Manual of Mental Disorders, Fourth Edition • Any symptom of cancer recurrence • Known severe health problems other than cancer |
|
| Interventions | 48 participants assigned to exercise intervention:
Adherence:
Co‐intervention: psychoeducational fatigue management 46 participants assigned to control:
|
|
| Outcomes | Primary outcome:
Other outcomes:
Numbers of participants assessed:
Adverse events: cancer recurrence: 2 in exercise group, 1 in control group |
|
| Notes | Trial registration link: none available Trial authors contacted: no Intention‐to‐treat analysis: no Funding: Fonds de Recherche en Sante du Quebec, Investigator Award |
|
| Risk of bias | ||
| Bias | Authors' judgement | Support for judgement |
| Random sequence generation (selection bias) | Low risk | Sequence of randomisation was “computer generated”. |
| Allocation concealment (selection bias) | Unclear risk | “Sealed envelopes, which were concealed to both kinesiologist and patient”; no mention of whether they were sequential or opaque |
| Blinding of participants and personnel (performance bias) All outcomes | High risk | Owing to the nature of the intervention, it was not possible to conceal allocation to the intervention from participants. |
| Blinding of outcome assessment (detection bias) All outcomes | High risk | Study personnel and outcome assessors were not masked or blinded to study interventions. |
| Incomplete outcome data (attrition bias) All outcomes | High risk | Four participants from the exercise group were not included in the analyses (withdrew, n = 1; cancer recurrence, n = 2; metastatic breast cancer diagnosis, n = 1); 3 participants from the control group were not included in the analyses (withdrew, n = 2; cancer recurrence, n = 1). |
| Selective reporting (reporting bias) | Low risk | No selective reporting of outcomes is apparent. |
| Other bias | Low risk | Trial appears to be free of other problems that could put it at high risk of bias. |
Guinan 2013.
| Methods | Study design: RCT Number randomised: 26 total; 16 to an exercise intervention, 10 to a control Study start: March 2010; stop date: January 2011 Length of intervention: 8 weeks Length of follow‐up: at 3 months post intervention Country: Ireland |
|
| Participants | Age, years (mean SD):
Stage, n (%):
Inclusion criteria: • Breast cancer survivors who had consented to the PEACH trial • Completion of adjuvant chemotherapy or radiotherapy with curative intent within the preceding 2 to 6 months • Receipt of neoadjuvant chemotherapy or chemoradiotherapy followed by surgery • Continuing onto adjuvant hormone therapy and anti‐Her2 directed therapy • Ability to understand English • Willingness to be randomised • Medical clearance to exercise • Aged 21 to 69 Exclusion criteria: • Evidence of active cancer • Chronic medical and orthopaedic conditions that would preclude exercise (e.g. uncontrolled congestive heart failure or angina, recent MI, breathing difficulties requiring oxygen use, hospitalisation) • Taking beta‐blocker medication • Prior history of another cancer in previous 5 years (exceptions: non‐melanoma skin cancer, non‐invasive cancer of the cervix) • Confirmed pregnancy • Dementia or psychiatric illness that would preclude ability to participate in study • Incomplete haematological recovery after chemotherapy (WCC < 3, Hb < 10, or platelets < 100) • BMI > 35 • LVEF post chemotherapy < 50% or > 20% deterioration of baseline compared with LVEF before systemic treatment |
|
| Interventions | 16 participants assigned to exercise intervention:
Adherence: 6/16 (37.5%) adhered to < 90% of the exercise class but completed follow‐up assessments. 10 participants assigned to control:
|
|
| Outcomes | Outcomes:
Numbers of participants assessed:
Adverse events: not reported |
|
| Notes | Trial registration link: https://clinicaltrials.gov/ct2/show/NCT01030887 Trial authors contacted: no Intention‐to‐treat analysis: yes, but LOCF used Funding: not reported |
|
| Risk of bias | ||
| Bias | Authors' judgement | Support for judgement |
| Random sequence generation (selection bias) | Low risk | Computer‐generated random numbers list |
| Allocation concealment (selection bias) | Unclear risk | Whether allocation was concealed was not reported. |
| Blinding of participants and personnel (performance bias) All outcomes | High risk | Owing to the nature of the intervention, it was not possible to conceal allocation to the intervention from participants. |
| Blinding of outcome assessment (detection bias) All outcomes | Low risk | “Assessments were completed by the same researcher at every visit who was blinded to the participants’ group assignment”. |
| Incomplete outcome data (attrition bias) All outcomes | High risk | LOCF procedure was used for missing variables. |
| Selective reporting (reporting bias) | High risk | Unlike all other outcomes, no baseline data were reported for C‐reactive protein; only change values with 95% CIs were provided. Cardiorespiratory fitness and quality of life were mentioned as outcomes in parent trial; no reasons given for omission of these data here. Only P values for body composition variables were provided. |
| Other bias | High risk | Small sample size and imbalance between numbers allocated to the intervention and control group could give rise to additional biases. |
Hatchett 2013.
| Methods | Study design: single‐centre RCT Number randomised: 87; 43 to intervention, 42 to control Study start: not stated; stop date: not stated Length of intervention: 12 weeks Length of follow‐up: to end of intervention Country: USA |
|
| Participants | Data available only for those who completed the study Age, years (mean SD):
Stage, n (%):
Inclusion criteria: • Female breast cancer survivors • Completion of cancer treatment • 18 years of age or older • Ability to access and navigate the Internet • Ability to communicate through email • Ability to complete online questionnaires • No current physical activity reported at the outset of the intervention • Ability to engage in physical activity safely |
|
| Interventions | 43 participants assigned to exercise intervention:
Adherence: For the treatment group, investigators reported 2.81 (SD 2.11) days of exercise per week at 6 weeks and 3.47 (SD 2.19) days of exercise per week at 12 weeks. 42 participants assigned to control:
|
|
| Outcomes | Outcomes:
Numbers of participants assessed:
Adverse events: not reported |
|
| Notes | Trial registration link: none available Trial authors contacted: no Intention‐to‐treat analysis: no Funding: not reported |
|
| Risk of bias | ||
| Bias | Authors' judgement | Support for judgement |
| Random sequence generation (selection bias) | Unclear risk | “Randomly assigned”; method of randomisation not reported |
| Allocation concealment (selection bias) | Unclear risk | Whether allocation was concealed was not reported. |
| Blinding of participants and personnel (performance bias) All outcomes | High risk | Owing to the nature of the intervention, it was not possible to conceal allocation to the intervention from participants. |
| Blinding of outcome assessment (detection bias) All outcomes | Unclear risk | Blinding of outcome assessments was not described. |
| Incomplete outcome data (attrition bias) All outcomes | High risk | “The final sample included 74 participants (control group n = 38, intervention group n = 36)”. Participants who dropped out were not included in analysis. |
| Selective reporting (reporting bias) | Low risk | No selective reporting of outcomes is apparent. |
| Other bias | Low risk | Trial appears to be free of other problems that could put it at high risk of bias. |
Heim 2007.
| Methods | Study design: single‐centre quasi‐RCT Number randomised: 63; 32 to intervention, 31 to control Study start: not reported; stop date: not reported Length of intervention: not reported Length of follow‐up: at 3 months post intervention Country: Germany |
|
| Participants | Age, years; n (%):
Stage:
Inclusion criteria: • Score ≥ 4 on a linear analogue scale evaluating fatigue, ranging in value from 0 to 10 Exclusion criteria: • Psychiatric condition • < 6 weeks since surgery or chemotherapy |
|
| Interventions | 32 participants assigned to exercise intervention:
Adherence:
31 participants assigned to control:
|
|
| Outcomes | Outcomes:
Numbers of participants assessed:
Adverse events: not reported |
|
| Notes | Trial registration link: none available Trial authors contacted: yes, contacted for means and s for outcomes. However, trial authors did not provide these data. Intention‐to‐treat analysis: no Funding: German Fatigue Society |
|
| Risk of bias | ||
| Bias | Authors' judgement | Support for judgement |
| Random sequence generation (selection bias) | High risk | “According to their admission to hospital; depending on the alternating weeks they were allocated to the intervention group or the control group”. |
| Allocation concealment (selection bias) | High risk | Owing to use of alternating weeks in the randomisation process, allocation was not concealed from investigators. |
| Blinding of participants and personnel (performance bias) All outcomes | High risk | Owing to the nature of the intervention, it was not possible to conceal allocation to the intervention from participants. |
| Blinding of outcome assessment (detection bias) All outcomes | High risk | Study personnel and outcome assessors were not masked or blinded to study interventions. |
| Incomplete outcome data (attrition bias) All outcomes | High risk | Complete data were available for 59 participants, but no information on missing participants was provided. “More patients in the control group (15) than in the training group (12) did not continue the study”. |
| Selective reporting (reporting bias) | Low risk | No selective reporting of outcomes is apparent. |
| Other bias | High risk | Study was poorly described, and adherence to resistance exercises was low (42%). |
Herrero 2006.
| Methods | Study design: single‐centre RCT Number randomised: 20; 10 to intervention, 10 to control Study start: recruitment started November 2003; stop date: April 2004 Length of intervention: 8 weeks Length of follow‐up: to end of intervention Country: Spain |
|
| Participants | Age, years (mean SD):
Stage, n (%):
Inclusion criteria: • Postmenopausal women surviving breast cancer • 2 to 5 years post treatment • 40 to 60 years old • Previous anticancer treatment consisting of surgery with axillary lymphadenectomy and both postsurgery radiation therapy and chemotherapy • Walking less than a total of 30 to 60 minutes 3 days per week • Performing no strenuous exercise such as running, cycling, swimming, or resistance training Exclusion criteria: • Cardiac disease (NYHA II or greater) • Uncontrolled hypertension (blood pressure > 160/90 mmHg) • Uncontrolled pain, or any other condition that contraindicated exercise training • Patients with cancer or cancer survivors, for example, increased risk of bone fracture • Severe anaemia (< 8 g/dL) • Platelet count lower than 50 × 109/μL, 7; lymphoedema |
|
| Interventions | 10 participants assigned to exercise intervention:
Adherence:
10 participants assigned to control:
|
|
| Outcomes | Primary outcomes:
Other outcomes:
Numbers of participants assessed:
Adverse events: No major adverse effects and no major health problems were noted among participants in both groups over the 8‐week period. |
|
| Notes | Trial registration link: none available Trial authors contacted: no Intention‐to‐treat analysis: no Funding: Universidad Europea de Madrid |
|
| Risk of bias | ||
| Bias | Authors' judgement | Support for judgement |
| Random sequence generation (selection bias) | Unclear risk | Generation of the random sequence was not described. |
| Allocation concealment (selection bias) | Low risk | “The treatment allocation system was set up so that the researcher who was in charge of enrolling participants did not know in advance which treatment the next person would get”. |
| Blinding of participants and personnel (performance bias) All outcomes | High risk | Owing to the nature of the intervention, it was not possible to conceal allocation to the intervention from participants. |
| Blinding of outcome assessment (detection bias) All outcomes | Low risk | “Research assistants (exercise physiologists) with no knowledge of group assignments were designated to measure the outcome variables”. |
| Incomplete outcome data (attrition bias) All outcomes | High risk | 2 participants in each group withdrew, but no information was provided on reasons for withdrawal, and their data were not included in analysis. |
| Selective reporting (reporting bias) | Low risk | No selective reporting of outcomes is apparent. |
| Other bias | Low risk | Trial appears to be free of other problems that could put it at high risk of bias. |
Irwin 2015.
| Methods | Study design: single‐centre RCT Number randomised: 121; 61 to intervention, 60 to control Study start: June 2009; stop date: June 2013 Length of intervention: 12 months Length of follow‐up: to end of intervention Country: USA |
|
| Participants | Age, years (mean SD):
Stage, %:
Inclusion criteria: • Physically inactive (i.e. < 90 minutes per week of physical activity in the past 6 months and no strength training in the past year) • Postmenopausal women given diagnosis 0.5 to 4.0 years before enrolment with hormone receptor–positive stage I to III breast cancer • Receiving an aromatase inhibitor for at least 6 months • Experiencing arthralgia at least mild in severity for at least 2 months (i.e. score of ≥ 3 of 10 for worst pain item of Brief Pain Inventory) • Arthralgia started after initiation of aromatase inhibitor therapy or when pre‐existing joint pain was exacerbated by the use of aromatase inhibitors Exclusion criteria: • None reported |
|
| Interventions | 61 participants assigned to the following intervention:
Adherence to the intervention:
60 participants assigned to control:
|
|
| Outcomes | Primary outcomes:
Secondary outcomes:
Numbers of participants assessed:
Adverse events: No adverse effects occurred as a result of the exercise programme. |
|
| Notes | Trial registration link: https://clinicaltrials.gov/ct2/show/NCT02056067 Trial authors contacted: no Intention‐to‐treat analysis: yes Funding: supported by National Cancer Institute Grant No. R01 CA132931 and in part by a grant from the Breast Cancer Research Foundation (M.L.I.), Yale Cancer Center Support Grant No. P30 CA016359, and Clinical and Translational Science Award Grant No. UL1 TR000142, from the National Center for Advancing Translational Science |
|
| Risk of bias | ||
| Bias | Authors' judgement | Support for judgement |
| Random sequence generation (selection bias) | Low risk | "Permuted block randomisation (at 1:1 ratio) with random block size was performed, stratified by joint pain before AI therapy and current bisphosphonate use". |
| Allocation concealment (selection bias) | Unclear risk | Whether treatment assignment was concealed from study personnel and participants was not described. |
| Blinding of participants and personnel (performance bias) All outcomes | High risk | Owing to the nature of the intervention, it was not possible to conceal allocation to the intervention from participants. |
| Blinding of outcome assessment (detection bias) All outcomes | Unclear risk | Blinding of outcome assessments was not described. |
| Incomplete outcome data (attrition bias) All outcomes | Low risk | Mixed‐model repeated measures analysis was employed. This approach is robust because it includes all available data and accounts for correlations between repeated measures. |
| Selective reporting (reporting bias) | Low risk | No selective reporting of outcomes is apparent. |
| Other bias | High risk | "Given funding cuts, the last 25 of the 121 women recruited were enrolled into a 6‐month rather than 12‐month trial". Therefore, participants received interventions of different durations. |
Kaltsatou 2011.
| Methods | Study design: single‐centre RCT Number randomised: 27; 14 to intervention, 13 to control Study start: not reported; stop date: not reported Length of intervention: 24 weeks Length of follow‐up: to end of intervention Country: Greece |
|
| Participants | Age, years (mean SD):
Stage:
Inclusion criteria: • Participating only in the dancing exercising programme in which none of the participants had prior physical practice or experience in traditional Greek dances • All participants had been given a diagnosis and surgically treated for breast cancer • Completed cancer therapies, including surgery, radiotherapy, and chemotherapy and stopped all medical treatments at least 3 months before beginning of the study Exclusion criteria: • Poorly controlled hypertension • Any health condition that would deter patient from performing the exercises |
|
| Interventions | 14 participants assigned to exercise intervention:
Adherence:
13 participants assigned to control:
|
|
| Outcomes | Outcome measures:
Numbers of participants assessed:
Adverse events: none reported |
|
| Notes | Trial registration link: none available Trial authors contacted: no Intention‐to‐treat analysis: no missing data reported Funding: not reported |
|
| Risk of bias | ||
| Bias | Authors' judgement | Support for judgement |
| Random sequence generation (selection bias) | Unclear risk | Generation of the random sequence was not described. |
| Allocation concealment (selection bias) | Unclear risk | Whether treatment assignment was concealed from study personnel and participants was not described. |
| Blinding of participants and personnel (performance bias) All outcomes | High risk | Owing to the nature of the intervention, it was not possible to conceal allocation to the intervention from participants. |
| Blinding of outcome assessment (detection bias) All outcomes | Unclear risk | Blinding of outcome assessments was not described. |
| Incomplete outcome data (attrition bias) All outcomes | Unclear risk | It is unclear whether any data were missing, as this was not reported. |
| Selective reporting (reporting bias) | Low risk | No selective reporting of outcomes is apparent. |
| Other bias | Low risk | Trial appears to be free of other problems that could put it at high risk of bias. |
Kiecolt‐Glaser 2014.
| Methods | Study design: RCT Number randomised: 200; 100 to the Hatha yoga intervention, 100 to wait‐list control Study start: not stated; stop date: not stated Length of intervention: 12 weeks Length of follow‐up: at 3 months Country: USA |
|
| Participants | Age, years (mean SD):
Stage, n (%):
Inclusion criteria: • Completed breast cancer treatment (except for tamoxifen/aromatase inhibitors) between 2 months and 3 years previously Exclusion criteria: • Engaged in over 5 hours of vigorous physical activity per week • Prior history of any other cancer (except basal or squamous cell skin cancer) • Major medical conditions such as anaemia, diabetes, multiple sclerosis, chronic obstructive pulmonary disease, symptomatic ischaemic heart disease, uncontrolled hypertension, or liver or kidney failure • Severe cognitive impairment (e.g. dementia, Alzheimer’s disease) or abuse of alcohol or drugs • Current yoga practice or prior yoga practice exceeding 3 months |
|
| Interventions | 100 participants assigned to exercise intervention:
Adherence: In the yoga group, participants attended a mean of 18.1 (75.4%) of 24 classes with a median of 19 (79.1%) of 24 classes and reported an average of 24.69 minutes per day of total home plus class practice across 12 weeks. 100 participants assigned to control:
|
|
| Outcomes | Outcomes:
.Numbers of participants assessed:
Adverse events: Two events appeared potentially attributable to the yoga intervention: Two women reported recurrence of chronic back and/or shoulder problems. |
|
| Notes | Trial registration link: https://clinicaltrials.gov/ct2/show/NCT00486525 Trial authors contacted: no Intention‐to‐treat analysis: no Funding: grants No. R01 CA126857, R01 CA131029, K05 CA172296, UL1RR025755, and CA016058 from the National Institutes of Health |
|
| Risk of bias | ||
| Bias | Authors' judgement | Support for judgement |
| Random sequence generation (selection bias) | Low risk | “online randomization program to obtain the block randomization sequence” |
| Allocation concealment (selection bias) | Low risk | “The data manager had no participant contact”. |
| Blinding of participants and personnel (performance bias) All outcomes | High risk | Owing to the nature of the intervention, it was not possible to conceal allocation to the intervention from participants. |
| Blinding of outcome assessment (detection bias) All outcomes | Low risk | “Participants were told not to mention their group assignment to study personnel during their post‐treatment assessments; questionnaires were administered via computer. The technicians who analysed blood samples were blind to all other data”. |
| Incomplete outcome data (attrition bias) All outcomes | High risk | No ITT analysis. Participants were excluded from analysis if they did not complete either of the post‐treatment assessments. |
| Selective reporting (reporting bias) | Low risk | No selective reporting of outcomes is apparent. |
| Other bias | Low risk | Trial appears to be free of other problems that could put it at high risk of bias. |
Kim 2015.
| Methods | Study design: single‐centre RCT Number randomised: 43; 23 to the home‐based exercise + supplement intervention, 20 to a supplement‐only control Study start: January 2012; stop date: August 2013 Length of intervention: 6 months Length of follow‐up: to end of intervention Country: South Korea |
|
| Participants | Age, years (mean SD):
Stage, n (%):
Inclusion criteria: • Women aged 20 to 70 years • Diagnosis of stage 0 to III breast cancer • Completed primary treatment at least 3 months earlier and were postmenopausal • Osteopenia diagnosed by a bone mineral density screening test Exclusion criteria: • Having other cancer(s) • Bone metastasis • Disease that could influence bone metabolism • Under treatment for osteoporosis • Condition that precluded unsupervised exercise • Participating regularly in resistance exercise (2 or more 30‐minute sessions per week) |
|
| Interventions | 23 participants assigned to exercise intervention:
Adherence: Mean adherence rate was 69.5% for walking and 48.5% for resistance exercise. 20 participants assigned to control:
|
|
| Outcomes | Primary outcomes:
Other outcomes:
Numbers of participants assessed:
Adverse events: “No injuries or adverse events and no symptoms of lymphedema were reported in either group”. |
|
| Notes | Trial registration link: none available Trial authors contacted: no Intention‐to‐treat analysis: yes, but LOCF Funding: Basic Science Research Program through the National Research Foundation of Korea funded by the Ministry of Education, Science, and Technology |
|
| Risk of bias | ||
| Bias | Authors' judgement | Support for judgement |
| Random sequence generation (selection bias) | Low risk | Computer‐generated randomisation was used. |
| Allocation concealment (selection bias) | Unclear risk | Sealed, sequentially numbered envelops were used, but trial authors did not report whether they were opaque. |
| Blinding of participants and personnel (performance bias) All outcomes | High risk | Owing to the nature of the intervention, it was not possible to conceal allocation to the intervention from participants. |
| Blinding of outcome assessment (detection bias) All outcomes | Unclear risk | Primary outcome (bone mineral density) was assessed by technicians blinded to group allocation, but trial authors did not report whether assessors of the remaining were also blinded to group allocation. |
| Incomplete outcome data (attrition bias) All outcomes | High risk | Missing data were imputed by the LOCF method. |
| Selective reporting (reporting bias) | Low risk | No selective reporting of outcomes is apparent. |
| Other bias | Low risk | Trial appears to be free of other problems that could put it at high risk of bias. |
Ligibel 2008.
| Methods | Study design: single‐centre RCT Number randomised: 101; 51 to intervention, 50 to control Study start: May 2004; stop date: October 2006 Length of intervention: 16 weeks Length of follow‐up: to end of intervention Country: USA |
|
| Participants | Age, years (mean SD):
Stage, n (%):
Inclusion criteria: • Histological evidence of stage I‐III invasive breast cancer • Completion of any chemotherapy and/or radiation therapy at least 3 months before enrolment • Absence of diabetes • No use of corticosteroids • BMI > 25 and/or body fat percentage > 30% • Baseline participation in less than 40 minutes of physical activity per week • Hormonal therapy allowed as long as participants continued therapy for duration of the study Exclusion criteria: • Evidence of persistent or recurrent breast cancer • Other malignancy • Uncontrolled heart disease • Other contraindications to exercise |
|
| Interventions | 51 participants assigned to 16‐week exercise intervention:
Adherence:
50 participants assigned to control:
Contamination of control group: not reported |
|
| Outcomes | Outcomes:
Time points of assessment: baseline, completion of the 16‐week study period Numbers of participants assessed:
Adverse events: not reported |
|
| Notes | Trial registration link: none available Trial authors contacted: no Intention‐to‐treat analysis: unclear; ITT approach was not described Funding: supported by the American Society of Clinical Oncology and the Lance Armstrong Foundation |
|
| Risk of bias | ||
| Bias | Authors' judgement | Support for judgement |
| Random sequence generation (selection bias) | Unclear risk | Generation of the random sequence was not described: “participants were randomly assigned 1:1 to an exercise intervention group or control group”. |
| Allocation concealment (selection bias) | Unclear risk | Whether treatment assignment was concealed from study personnel and participants was not described. |
| Blinding of participants and personnel (performance bias) All outcomes | High risk | Owing to the nature of the intervention, it was not possible to conceal allocation to the intervention from participants. |
| Blinding of outcome assessment (detection bias) All outcomes | Unclear risk | “although hormonal assays were performed by technicians blinded to group assignment, anthropometric measures were collected by unblinded study staff” |
| Incomplete outcome data (attrition bias) All outcomes | Unclear risk | ITT approach mentioned but not described |
| Selective reporting (reporting bias) | Low risk | No selective reporting of outcomes is apparent. |
| Other bias | High risk | High dropout numbers in intervention group (11/51; 22%) and in control group (8/50; 16%) |
Littman 2012.
| Methods | Study design: single‐centre RCT Number randomised: 63; 32 to intervention, 31 to control Study start: May 2007; stop date: April 2008 Length of intervention: 6 months Length of follow‐up: to end of 6‐month intervention Country: USA |
|
| Participants | Age, years (mean SD):
Stage, n (%):
Inclusion criteria: • Age between 21 and 75 years • Completion of breast cancer treatment (stage 0‐III) at least 3 months before (with the possible exception of ongoing hormonal therapies such as tamoxifen or aromatase inhibitors) • BMI ≥ 24 kg/m² (or ≥ 23 kg/m², if of Asian descent) Exclusion criteria: • Myocardial infarction or stroke in the previous 6 months • Diabetes • Current yoga practice • Pregnancy or plans to become pregnant • Other factors that might lead to poor retention and yoga practice, which included plans to leave the study area during the follow‐up period or any contraindications to practising yoga |
|
| Interventions | 32 participants assigned to exercise intervention:
Adherence:
14 participants assigned to control:
|
|
| Outcomes | Primary outcome measures:
Secondary outcomes:
Numbers of participants assessed:
Adverse events: not reported |
|
| Notes | Trial registration link: https://clinicaltrials.gov/ct2/show/NCT00476203 Trial authors contacted: no Intention‐to‐treat analysis: no Funding: supported in part by the Office of Research and Development Cooperative Studies Program, Department of Veterans Affairs and the Transdisciplinary Research in Energetics in Cancer (NCI 1U54 CA116847) |
|
| Risk of bias | ||
| Bias | Authors' judgement | Support for judgement |
| Random sequence generation (selection bias) | Unclear risk | Generation of the random sequence was not described, |
| Allocation concealment (selection bias) | Unclear risk | Whether treatment assignment was concealed from study personnel and participants was not described. |
| Blinding of participants and personnel (performance bias) All outcomes | High risk | Owing to the nature of the intervention, it was not possible to conceal allocation to the intervention from participants. |
| Blinding of outcome assessment (detection bias) All outcomes | High risk | "we were unable to blind assessors to group assignment" |
| Incomplete outcome data (attrition bias) All outcomes | High risk | "We used an intent‐to‐treat approach". However, "those who did not provide follow‐up values were not included in analyses". |
| Selective reporting (reporting bias) | Unclear risk | Blood was collected, but no outcome measures were specified or reported. |
| Other bias | Low risk | Trial appears to be free of other problems that could put it at high risk of bias. |
Loh 2014.
| Methods | Study design: single‐centre RCT Number randomised: 197; 66 to Qigong, 65 to group line‐dancing, 66 to control Study start: not reported; stop date: not reported Length of intervention: 8 weeks Length of follow‐up: to end of intervention (at 12 months post intervention for intervention‐only groups) Country: Malaysia |
|
| Participants | Baseline data available for 95 participants (32, Qigong; 31, line‐dancing; 32, usual care): Age, years (mean SD):
Stage, n (%):
Inclusion criteria: • Medical contraindication to exercise • Major medical condition such as epilepsy, uncontrolled hypertension, major orthopaedic problem or acute cardiovascular disease (patients given diagnosis in the past 6 months and still medically unstable) • Completed primary cancer treatment with no evidence of metastasis • At least 1 year post diagnosis Exclusion criteria: • Medical contraindication to exercise • Major medical condition such as epilepsy, uncontrolled hypertension, major orthopaedic problem or acute cardiovascular disease (patients given diagnosis in the past 6 months and still medically unstable) • Currently practising Qigong or line‐dancing • Engaging in more than 4 hours of vigorous physical activity |
|
| Interventions | 131 participants assigned to one of two 8‐week exercise interventions:
Adherence: Adherence rates were 63% for Qigong and 65% for line‐dancing. 66 participants were assigned to control. No change was made to usual management of participants assigned to this group, but they were offered the Qigong or line‐dancing programme at the end of the 8‐week intervention period. |
|
| Outcomes | Primary outcomes:
Other outcomes:
Numbers of participants assessed:
Adverse events: not reported |
|
| Notes | Trial registration link: none available Trial authors contacted: yes, trial authors provided additional means and SDs for some outcomes Intention‐to‐treat analysis: no, "Outliers more than 1.5SD, were removed, and missing data were replaced with mean‐substitution" Funding: not reported |
|
| Risk of bias | ||
| Bias | Authors' judgement | Support for judgement |
| Random sequence generation (selection bias) | Low risk | “Block randomisation (block size=six) was performed by one of the researchers”. |
| Allocation concealment (selection bias) | Low risk | “Masking of treatment allocation were conducted, with ‘matching’ active, placebo and control, using a free online Random Allocation Software”. |
| Blinding of participants and personnel (performance bias) All outcomes | High risk | Owing to the nature of the intervention, it was not possible to conceal allocation to the intervention from participants. |
| Blinding of outcome assessment (detection bias) All outcomes | Unclear risk | Blinding of outcome assessments was not described. |
| Incomplete outcome data (attrition bias) All outcomes | High risk | Inappropriate handling of missing data: “Outliers more than 1.5SD, were removed, and missing data were replaced with mean‐substitution”. |
| Selective reporting (reporting bias) | Low risk | No selective reporting of outcomes is apparent. |
| Other bias | High risk | Very high attrition. Only 48% of participants randomised at baseline completed postintervention assessments; therefore, less than half of participants received only part of the intervention. |
Loudon 2014.
| Methods | Study design: multi‐centre RCT Numbers allocated, 28; 15 to exercise intervention, 13 to control Study start: February 2011; stop date: May 2011 Length of intervention: 8 weeks Length of follow‐up: at 12 weeks Country: Tasmania, Australia |
|
| Participants | Baseline data available for 12 in intervention and 11 in control: Age, years (mean SD):
Stage, n (%):
Inclusion criteria: • Stage I unilateral secondary lymphoedema of the arm, as defined by the International Society of Lymphology and confirmed by a professional lymphoedema therapist • Completed treatment for breast cancer (surgery, radiotherapy, and chemotherapy) at least 6 months previously • Over 18 years of age • Sufficient English literacy to provide informed consent Exclusion criteria: • Recurrent cancer • Infection • Receiving complex lymphoedema therapy • Pregnancy • Wore a pacemaker, which would affect bioimpedance spectroscopy (BIS) readings • Severe psychological illness |
|
| Interventions | 15 participants assigned to exercise intervention:
Adherence: Attendance at group yoga sessions was high (97%), as was self‐reported compliance with the home practice DVD (86%). 13 participants assigned to control:
|
|
| Outcomes | Primary outcome:
Secondary outcomes:
Numbers of participants assessed:
Adverse events: No adverse events were attributable to the yoga or to the control intervention. |
|
| Notes | Trial registration link: none available Trial authors contacted: no Intention‐to‐treat analysis: no https://www.anzctr.org.au/Trial/Registration/TrialReview.aspx?ACTRN=12611000202965 Funding: Swan Research Institute (SRI) and Faculty of Health Sciences Seed Funding, UTAS. Equipment was provided by Flinders University and University of Tasmania. |
|
| Risk of bias | ||
| Bias | Authors' judgement | Support for judgement |
| Random sequence generation (selection bias) | Low risk | “randomisation based on a computer‐generated random number system” |
| Allocation concealment (selection bias) | Low risk | “An individual not associated with the trial will perform the randomisation”. “Group notification will be in a sealed envelope given to women after completion of the baseline measurement”. |
| Blinding of participants and personnel (performance bias) All outcomes | High risk | Owing to the nature of the intervention, it was not possible to conceal allocation to the intervention from participants. |
| Blinding of outcome assessment (detection bias) All outcomes | Low risk | “Measurements, based on validated instruments and protocols, were taken by trained researchers blinded to the group allocation and previous results”. |
| Incomplete outcome data (attrition bias) All outcomes | High risk | Only those who completed post‐intervention and 1‐month‐after‐cessation assessments were included in analysis. |
| Selective reporting (reporting bias) | Low risk | No selective reporting of outcomes is apparent. |
| Other bias | Low risk | Trial appears to be free of other problems that could put it at high risk of bias. |
Malicka 2011.
| Methods | Study design: single‐centre RCT Number randomised: 38; 23 to a Nordic walking intervention, 15 to control Study start: not reported; stop date: not reported Length of intervention: 8 weeks Length of follow‐up: to end of intervention Country: Poland |
|
| Participants | Age, years, mean:
Stage, n (%):
Inclusion criteria: • Women after treatment for breast cancer Exclusion criteria: • None reported |
|
| Interventions | 23 participants assigned to exercise intervention:
Adherence: Not reported 15 participants assigned to control:
|
|
| Outcomes | Outcomes:
Time points of assessment: baseline, at 8 weeks Numbers of participants assessed:
Adverse events: not reported |
|
| Notes | Trial registration link: none available Trial authors contacted: no Intention‐to‐treat analysis: yes, no missing data were reported Funding: none reported |
|
| Risk of bias | ||
| Bias | Authors' judgement | Support for judgement |
| Random sequence generation (selection bias) | Unclear risk | "The participants were randomly assigned to one of two groups". No method stated |
| Allocation concealment (selection bias) | Unclear risk | Whether treatment assignment was concealed from study personnel and participants was not described. |
| Blinding of participants and personnel (performance bias) All outcomes | High risk | Owing to the nature of the intervention, it was not possible to conceal allocation to the intervention from participants. |
| Blinding of outcome assessment (detection bias) All outcomes | Unclear risk | Blinding of outcome assessments was not described. |
| Incomplete outcome data (attrition bias) All outcomes | Low risk | No missing data (no dropouts) are apparent. |
| Selective reporting (reporting bias) | Low risk | No selective reporting of outcomes is apparent. |
| Other bias | Low risk | Trial appears to be free of other problems that could put it at high risk of bias. |
Martin 2013.
| Methods | Study design: single‐centre RCT Number randomised: 26; 8 to MVe Fitness Chair, 8 to traditional resistance training, 10 to control (no exercise) Study start: not reported but participants enrolled from January to December 2009; stop date: not reported Length of intervention: 8 weeks Length of follow‐up: to end of intervention Country: Australia |
|
| Participants | Age, years (mean SD):
Stage, n (%):
Inclusion criteria: • Female • Age 29 to 69 years • Diagnosis of stage I, II, or III breast cancer and completion of all treatments within 6 months • Consent from oncologist to participate • Underwent strict health screening Exclusion criteria: • Cardiorespiratory disease; bone, joint, or muscle pain or abnormalities that would compromise the participant’s ability to complete the exercise training protocol • Already enrolled in a formal exercise programme |
|
| Interventions | 16 participants assigned to 1 of 2 exercise interventions:
Adherence: MVe Fitness Chair group had a mean adherence rate of 83.3%. Resistance training group had an average adherence rate of 81.2%. 10 participants assigned to control:
|
|
| Outcomes | Outcomes:
Other outcomes:
Numbers of participants assessed:
Adverse events: not reported |
|
| Notes | Trial registration link: none available Trial authors contacted: no Intention‐to‐treat analysis: yes, no missing data were reported Funding: Peak Pilates donated the MVe Fitness Chairs used in this study to the Get REAL & HEEL Breast Cancer Rehabilitation Program. No other financial support was received for this project. |
|
| Risk of bias | ||
| Bias | Authors' judgement | Support for judgement |
| Random sequence generation (selection bias) | Low risk | “Simple randomization with replacement” |
| Allocation concealment (selection bias) | Unclear risk | Not described |
| Blinding of participants and personnel (performance bias) All outcomes | High risk | Owing to the nature of the intervention, it was not possible to conceal allocation to the intervention from participants. |
| Blinding of outcome assessment (detection bias) All outcomes | Unclear risk | Blinding of outcome assessments was not described. |
| Incomplete outcome data (attrition bias) All outcomes | Low risk | No data were missing. |
| Selective reporting (reporting bias) | High risk | Oxygen saturation was not reported. Composite score for all tests was reported. Data for individual tests were not provided. |
| Other bias | Low risk | Trial appears to be free of other problems that could put it at high risk of bias. |
Matthews 2007.
| Methods | Study design: single‐centre RCT Number randomised: 36; 23 to intervention, 13 to wait‐list control Study start: not reported; stop date: not reported Length of intervention: 12 weeks Length of follow‐up: to end of intervention Country: USA |
|
| Participants | Age, years (mean SD):
Stage, n (%):
Inclusion criteria: • Diagnosis of stage I–III cancer • Completed adjuvant treatment in the past 12 months • Postmenopausal • Free of cardiovascular disease and major orthopaedic limitations • Not currently exercising on a regular basis (≥ 5 days/week) Exclusion criteria: • None reported |
|
| Interventions | 22 participants assigned to exercise intervention:
Adherence:
14 participants assigned to control:
|
|
| Outcomes | Outcomes:
Time points of assessment: baseline, 6 weeks, and 12 weeks. For body composition‐dependent variables: baseline and 12 weeks Numbers of participants assessed:
Adverse events: not reported |
|
| Notes | Trial registration link: none available Trial authors contacted: no Intention‐to‐treat analysis: yes, but LOCF used Funding: Vanderbilt‐Ingram Cancer Center, South Carolina Cancer Center, and Vanderbilt General Clinical Research Center |
|
| Risk of bias | ||
| Bias | Authors' judgement | Support for judgement |
| Random sequence generation (selection bias) | Unclear risk | Generation of the random sequence was not described; “participants were randomly assigned 2:1 to an exercise intervention group or control group”. |
| Allocation concealment (selection bias) | Unclear risk | Whether treatment assignment was concealed from study personnel and participants was not described. |
| Blinding of participants and personnel (performance bias) All outcomes | High risk | Owing to the nature of the intervention, it was not possible to conceal allocation to the intervention from participants. |
| Blinding of outcome assessment (detection bias) All outcomes | Unclear risk | Blinding of outcome assessments was not described. |
| Incomplete outcome data (attrition bias) All outcomes | High risk | ITT analyses based on the last observation carried forward method; missing data not reported |
| Selective reporting (reporting bias) | Low risk | No selective reporting of outcomes is apparent. |
| Other bias | Unclear risk | Some participants were contacted via a list of participants from a breast cancer case‐control study. Therefore, these women may have been particularly motivated to adopt the walking programme. |
McKenzie 2003.
| Methods | Study design: single‐centre RCT Number randomised: 14; 7 to exercise intervention, 7 to control Study start: not reported; stop date: not reported Length of intervention: 8 weeks Length of follow‐up: to end of intervention Country: Canada |
|
| Participants | Age, years (mean SD):
Stage, n (%):
Inclusion criteria: • Underwent breast cancer treatment for stage I or II breast cancer that had been completed more than 6 months before enrolling in the study • Subsequently developed unilateral lymphoedema > 2 cm and < 8 cm for at least 1 measurement point Exclusion criteria: • Stage III lymphoedema, bilateral disease • Required medication that might affect upper extremity swelling |
|
| Interventions | 7 participants assigned to exercise intervention:
Adherence: Not reported 7 participants assigned to control:
|
|
| Outcomes | Outcomes:
Numbers of participants assessed:
Adverse events: not reported |
|
| Notes | Trial registration link: none available Trial authors contacted: Trial authors were contacted for means and SDs for outcomes. However, they did not provide these data. Intention‐to‐treat analysis: yes, no missing data were reported Funding: not reported |
|
| Risk of bias | ||
| Bias | Authors' judgement | Support for judgement |
| Random sequence generation (selection bias) | Unclear risk | “randomly assigned”, but method not mentioned |
| Allocation concealment (selection bias) | Unclear risk | Whether treatment assignment was concealed from study personnel and participants was not described. |
| Blinding of participants and personnel (performance bias) All outcomes | High risk | Owing to the nature of the intervention, it was not possible to conceal allocation to the intervention from participants. |
| Blinding of outcome assessment (detection bias) All outcomes | Unclear risk | No mention of whether study personnel and outcome assessors were masked or blinded to study interventions |
| Incomplete outcome data (attrition bias) All outcomes | Low risk | No missing data |
| Selective reporting (reporting bias) | Low risk | No selective reporting of outcomes is apparent. |
| Other bias | Low risk | Trial appears to be free of other problems that could put it at high risk of bias. |
Mehnert 2011.
| Methods | Study design: single‐centre RCT Number randomised: 63; 35 to intervention, 28 to control Study start: not reported; stop date: not reported Length of intervention: 10 weeks Length of follow‐up: to end of intervention Country: Germany |
|
| Participants | Age, years (mean SD):
Stage, n (%):
Inclusion criteria: • 18 to 65 years old • Primary non‐metastatic breast cancer • Minimum 4 weeks after completion of chemotherapy, radiation therapy, or both • Any disorder that could interfere with ability to perform the physical exercise programme Exclusion criteria: • Severe acute or chronic illness other than cancer (e.g. disorders of the musculoskeletal system) |
|
| Interventions | 35 participants assigned to exercise intervention:
Adherence: Not reported 28 participants assigned to control:
|
|
| Outcomes | Outcomes:
Numbers of participants assessed, anxiety and depression:
Numbers of individuals with data for cancer‐specific HRQoL, generic HRQoL, and psychological symptoms were not reported. Adverse events: not reported |
|
| Notes | Trial registration link: none available Trial authors contacted: no Intention‐to‐treat analysis: unclear how missing data were handled Funding: Friedrich and Louise Homann Foundation, Hamburg, Germany |
|
| Risk of bias | ||
| Bias | Authors' judgement | Support for judgement |
| Random sequence generation (selection bias) | Unclear risk | It is unclear how the allocation sequence was generated. |
| Allocation concealment (selection bias) | Low risk | Randomisation was adequately concealed through external randomisation. |
| Blinding of participants and personnel (performance bias) All outcomes | High risk | Owing to the nature of the intervention, it was not possible to conceal allocation to the intervention from participants. |
| Blinding of outcome assessment (detection bias) All outcomes | High risk | Study personnel and outcome assessors were not masked or blinded to study interventions. |
| Incomplete outcome data (attrition bias) All outcomes | Unclear risk | It is unclear how missing data were handled. Five randomised participants were reported to have “cancelled” participation in the exercise group. |
| Selective reporting (reporting bias) | Low risk | No selective reporting of outcomes is apparent. |
| Other bias | High risk | Participation in physical exercise by women (91%) in study groups before the intervention was commenced could have contributed to bias. |
Milne 2008.
| Methods | Study design: single‐centre RCT (12‐week study included here) Number randomised: 58; 29 to immediate exercise intervention, 29 to delayed exercise intervention Study start: January 2005; stop date: recruitment ended March 2005 Length of intervention: 12 weeks Length of follow‐up: to end of intervention Country: Australia |
|
| Participants | Age, years (mean SD):
Stage, n (%):
Inclusion criteria: • Women with stage I–II breast cancer • ≥ 18 years old • English speaking • Within 24 months of cancer diagnosis • Completed all treatments except hormone therapy Exclusion criteria: • Evidence of recurrent disease • Previously engaged in any formal exercise programme for 6 months before participation in this study • Failed the revised Physical Activity Readiness Questionnaire • Evidence of recurrent disease |
|
| Interventions | 29 participants assigned to exercise intervention:
Adherence:
29 participants assigned to control:
|
|
| Outcomes | Primary outcome:
Other outcomes:
Numbers of participants assessed:
Adverse events: none reported |
|
| Notes | Trial registration link: none available Trial authors contacted: no Intention‐to‐treat analysis: yes, but LOCF was used Funding: CCS and NCIC/CCS Sociobehavioral Cancer Research Network |
|
| Risk of bias | ||
| Bias | Authors' judgement | Support for judgement |
| Random sequence generation (selection bias) | Low risk | Randomisation by computer‐generated programme |
| Allocation concealment (selection bias) | Low risk | “Group assignments were concealed from the project director who recruited participants to the trial”. |
| Blinding of participants and personnel (performance bias) All outcomes | High risk | Owing to the nature of the intervention, it was not possible to conceal allocation to the intervention from participants. |
| Blinding of outcome assessment (detection bias) All outcomes | High risk | Study personnel and outcome assessors were not masked or blinded to study interventions. |
| Incomplete outcome data (attrition bias) All outcomes | Low risk | Minimal loss to follow‐up |
| Selective reporting (reporting bias) | Low risk | No selective reporting of outcomes is apparent. |
| Other bias | High risk | Intervention adherence rate was low (61.3%). |
Murtezani 2014.
| Methods | Study design: single‐centre RCT Number randomised: 73; 37 to intervention, 36 to control Study start: not reported; stop date: not reported Length of intervention: 10 weeks Length of follow‐up: to end of intervention Country: Kosovo |
|
| Participants | Characteristics data based on 62 participants (30 in exercise group, 32 in control group) Age, years (mean SD):
Stage, n (%):
Inclusion criteria: • Histologically confirmed early‐stage breast cancer with no evidence of recurrent or progressive disease • Completed surgery, radiotherapy, and/or chemotherapy with or without current hormone therapy Exclusion criteria: • Known cardiac disease • Uncontrolled hypertension • Thyroid disease, respiratory disease, diabetes, mental illness, infection, immune or endocrine abnormality |
|
| Interventions | 37 participants assigned to exercise intervention:
Adherence: Exercise adherence was 84.9%. 36 participants assigned to control:
|
|
| Outcomes | Primary outcome:
Other outcomes:
Numbers of participants assessed:
Adverse events: Three participants developed lymphoedema. |
|
| Notes | Trial registration link: none available Trial authors contacted: no Intention‐to‐treat analysis: no Funding: none |
|
| Risk of bias | ||
| Bias | Authors' judgement | Support for judgement |
| Random sequence generation (selection bias) | Low risk | "computer‐generated random allocation sequences" |
| Allocation concealment (selection bias) | Low risk | "sequences that were prepared centrally by the trial statistician" |
| Blinding of participants and personnel (performance bias) All outcomes | High risk | Owing to the nature of the intervention, it was not possible to conceal allocation to the intervention from participants. |
| Blinding of outcome assessment (detection bias) All outcomes | Low risk | The assessor was blinded with regard to allocation of participants to treatment groups. |
| Incomplete outcome data (attrition bias) All outcomes | High risk | "The data analyses included only those participants who had completed the 10 week interventional period". |
| Selective reporting (reporting bias) | Low risk | No selective reporting of outcomes is apparent. |
| Other bias | High risk | Inappropriate statistical analysis was performed (independent t‐tests done on change values). |
Musanti 2012.
| Methods | Study design: single‐centre RCT Number randomised: 55; 12 to aerobic exercise intervention, 17 to resistance exercise intervention, 13 to combined aerobic and resistance exercise intervention, 13 to flexibility control Study start: October 2004; stop date: March 2006 Length of intervention: 12 weeks Length of follow‐up: to end of intervention Country: USA |
|
| Participants | Age, years (mean SD):
Stage, n (%):
Inclusion criteria: • English‐speaking women • Stage I–IIIB breast cancer after completion of adjuvant chemotherapy at least 3 months or radiation therapy at least 6 weeks before entry • No more than 24 months beyond their last treatment • Hormonal therapy could be ongoing. Exclusion criteria: • Medical history or physical examination revealed evidence of anaemia (haemoglobin <10 mg/dL), uncontrolled hypertension, congestive heart failure, pulmonary disease, diabetes, and thyroid or musculoskeletal disease • Current enrolment in a weight loss or exercise programme • Positive response to any question on the Physical Activity Readiness Questionnaire, thus indicating the need for medical clearance before starting an exercise programme |
|
| Interventions | 42 participants assigned to aerobic, resistance, or aerobic plus resistance exercise interventions:
Adherence:
13 participants assigned to flexibility control:
|
|
| Outcomes | Outcomes:
Numbers of participants assessed:
Five women returned the survey data form but refused final fitness testing because of time constraints related to work and family obligations; therefore, fitness test participant number was 37. Adverse events: tendinitis (n = 2): 1 in the shoulder, the other in the foot |
|
| Notes | Trial registration link: none available Trial authors contacted: no Intention‐to‐treat analysis: yes Funding: award from the Greater NYC Affiliate of the Susan G. Komen Breast Cancer Foundation, Inc., New York, NY |
|
| Risk of bias | ||
| Bias | Authors' judgement | Support for judgement |
| Random sequence generation (selection bias) | Low risk | “computer‐generated randomization table generated” |
| Allocation concealment (selection bias) | Low risk | “Allocation to study group was made….by the statistical department of the cancer centre and maintained by office staff in the clinical research office". |
| Blinding of participants and personnel (performance bias) All outcomes | High risk | Owing to the nature of the intervention, it was not possible to conceal allocation to the intervention from participants. |
| Blinding of outcome assessment (detection bias) All outcomes | Low risk | Physical fitness tests: “The same research assistant, blinded to participant group allocation, preformed these measurements at the pre‐intervention and post‐intervention measurement time points”. |
| Incomplete outcome data (attrition bias) All outcomes | Low risk | “Missing data were random and were handled using multiple imputations”. Reasons for withdrawal were given. |
| Selective reporting (reporting bias) | High risk | Not all physical fitness test outcomes were reported. |
| Other bias | High risk | Small sample size was further impacted by high rate of withdrawal (24%). |
Mustian 2004.
| Methods | Study design: single‐centre RCT Number randomised: 31; 17 to Tai Chi Chuan intervention, 14 to control Study start: not reported; stop date: not reported Length of intervention: 12 weeks Length of follow‐up: to end of intervention Country: USA |
|
| Participants | Age, years (mean SD):
Stage:
Inclusion criteria: • Female • Histological diagnosis of primary breast cancer stage 0–IIIB • Between 1 week and 30 months after treatment • No drainage tubes or catheters • Not engaging in moderate‐to‐vigorous physical activity more than once a week • Physician’s clearance for fitness testing and exercise • No physical limitations prohibiting exercise • No clinical diagnosis of mental disorder, as defined by use of psychotropic drugs and self‐report Exclusion criteria: • None reported |
|
| Interventions | 17 participants assigned to exercise intervention, including Tai Chi Chuan (TCC):
Adherence:
14 participants assigned to psychosocial support:
|
|
| Outcomes | Primary outcomes:
Secondary outcomes:
Numbers of participants assessed:
16 participants had evaluable blood samples before and after the intervention for bone‐biomarker tests. 19 participants gave evaluable blood samples for IGF‐1, IGFBP‐1, IGFBP‐3, and IL‐6; 18 and 16 blood samples were evaluable for IL‐2 and 16 for IFN‐γ, respectively. Adverse events: no cancer recurrence reported; cognitive deficits reported as reason for treatment termination |
|
| Notes | Trial registration link: none available Trial authors contacted: no Intention‐to‐treat analysis: no Funding: Susan Stout Exercise Science Research Fund, Sally Schindel Cone Women’s and Gender Studies Research Fund |
|
| Risk of bias | ||
| Bias | Authors' judgement | Support for judgement |
| Random sequence generation (selection bias) | Low risk | “Randomization was achieved by flipping a coin”. |
| Allocation concealment (selection bias) | High risk | Allocation was not concealed from study personnel. |
| Blinding of participants and personnel (performance bias) All outcomes | High risk | Owing to the nature of the intervention, it was not possible to conceal allocation to the intervention from participants. |
| Blinding of outcome assessment (detection bias) All outcomes | High risk | Study personnel and outcome assessors were not masked or blinded to study interventions. |
| Incomplete outcome data (attrition bias) All outcomes | High risk | Withdrawals were not included in analyses (intervention, n = 6; control, n = 4). |
| Selective reporting (reporting bias) | Low risk | No selective reporting of outcomes is apparent. |
| Other bias | Low risk | Trial appears to be free of other problems that could put it at high risk of bias. |
Naumann 2012.
| Methods | Study design: quasi‐RCT Number randomised: 46; 11 to psychological counselling only, 12 to exercise only, 12 to combined exercise and psychological counselling, 11 to usual care Study start: not stated; stop date: not stated Length of intervention: 8 weeks Length of follow‐up: to end of intervention Country: Australia |
|
| Participants | Age, years (mean SD):
Stage, n (%):
Inclusion criteria: • Female with confirmed stage I–III invasive breast cancer within 12 months of treatment completion (except hormone therapy) • Aged 35 to 70 years • Sufficiently fluent in English • Either not participating in structured regular exercise or nutrition programmes in the past 6 months or currently not meeting American College of Sports Medicine guidelines for adequate physical activity (> 150 minutes/week) Exclusion criteria: • Acute or chronic bone, joint, or muscular abnormalities that would compromise ability to participate in exercise • Immune deficiency that would compromise ability to participate in exercise • Failure of Physical Activity Readiness Questionnaire • Presence of metastatic disease |
|
| Interventions | 24 participants assigned to 1 of 2 exercise interventions:
Adherence: Participants completed an average of 84% of all scheduled exercise sessions and 87% of all scheduled counselling sessions, with no significant differences among groups. 11 participants assigned to control:
|
|
| Outcomes | Outcomes:
Numbers of participants assessed:
Adverse events: No adverse reactions to participation in exercise or counselling intervention were reported. |
|
| Notes | Trial registration link: none available Trial authors contacted: no Intention‐to‐treat analysis: yes Funding: Foggarty grant and Health Benefits Funds, through the University of Notre Dame Australia |
|
| Risk of bias | ||
| Bias | Authors' judgement | Support for judgement |
| Random sequence generation (selection bias) | High risk | “randomized to each group on a rolling enrolment basis” |
| Allocation concealment (selection bias) | High risk | Rolling enrolment was used; therefore, allocation was not concealed. |
| Blinding of participants and personnel (performance bias) All outcomes | High risk | Owing to the nature of the intervention, it was not possible to conceal allocation to the intervention from participants. |
| Blinding of outcome assessment (detection bias) All outcomes | Unclear risk | Blinding of outcome assessments was not described. |
| Incomplete outcome data (attrition bias) All outcomes | Low risk | Baseline data for the 3 women who dropped out after randomisation were included in the intention‐to‐treat analysis. |
| Selective reporting (reporting bias) | Low risk | No selective reporting of outcomes is apparent. |
| Other bias | Low risk | Trial appears to be free of other problems that could put it at high risk of bias. |
Nieman 1995.
| Methods | Study design: single‐centre RCT Number randomised: 16; 8 to exercise intervention, 8 to control Study start: not reported; stop date: not reported Length of intervention: 8 weeks Length of follow‐up: to end of intervention Country: USA |
|
| Participants | Age, years (mean SE):
Stage:
Inclusion criteria: • All patients had been diagnosed with breast cancer • Had undergone surgery, adjuvant chemotherapy, and/or radiotherapy • Not currently receiving chemotherapy or radiation treatment Exclusion criteria: • None reported |
|
| Interventions | 8 participants assigned to exercise intervention:
Adherence:
8 participants assigned to control:
|
|
| Outcomes | Outcomes:
Numbers of participants assessed:
Adverse events: 2 recurrences of disease |
|
| Notes | Trial registration link: none available Trial authors contacted: no Intention‐to‐treat analysis: no Funding: supported in part by a grant from the National Institute of Aging |
|
| Risk of bias | ||
| Bias | Authors' judgement | Support for judgement |
| Random sequence generation (selection bias) | Unclear risk | Generation of the random sequence was not described. |
| Allocation concealment (selection bias) | Unclear risk | Whether treatment assignment was concealed from study personnel and participants was not described. |
| Blinding of participants and personnel (performance bias) All outcomes | High risk | Owing to the nature of the intervention, it was not possible to conceal allocation to the intervention from participants. |
| Blinding of outcome assessment (detection bias) All outcomes | Unclear risk | Blinding of outcome assessments was not described. |
| Incomplete outcome data (attrition bias) All outcomes | High risk | Analysis was performed only on participants who completed the intervention. |
| Selective reporting (reporting bias) | Low risk | No selective reporting of outcomes is apparent. |
| Other bias | High risk | Potential imbalances at baseline; "larger than expected baseline differences in these variables and others including NKCA" |
Nikander 2007.
| Methods | Study design: RCT Number randomised: 29; 15 to intervention, 14 to control Study start: not reported; stop date: not reported Length of intervention: 12 weeks Length of follow‐up: to end of 12‐week intervention Country: Finland |
|
| Participants | Age, years (mean SD):
Stage:
Inclusion criteria: • Histologically proven invasive breast cancer • Adjuvant chemotherapy within 6 months • Duration of endocrine therapy no longer than 6 months • Aged from 35 to 65 Exclusion criteria: • Haematogenous metastases • No systemic adjuvant therapy • Pregnancy or lactation • Severe cardiac disease (NYHA class III or higher) • Myocardial infarction within 12 months • Uncontrolled hypertension • Verified osteoporosis • Other serious illness or medical condition that could be a contraindication for exercise • Not capable of training (severe knee arthrosis, ligament or cartilage injury at lower extremity) • Residence more than 1 hour from the exercise centre • Competitive athlete |
|
| Interventions | 15 participants assigned to exercise intervention:
Adherence:
14 participants assigned to control:
|
|
| Outcomes | Outcomes:
Numbers of participants assessed:
“One participant withdrew from the study before randomization due to family reasons”. Adverse events: not reported |
|
| Notes | Trial registration link: none available Trial authors contacted: no Intention‐to‐treat analysis: no, but minimal loss to follow‐up Funding: Support from The Finnish Cancer Foundation, Pirkanmaa Cancer Society Finland, and AstraZeneca Finland is greatly appreciated. |
|
| Risk of bias | ||
| Bias | Authors' judgement | Support for judgement |
| Random sequence generation (selection bias) | Unclear risk | Generation of the random sequence was not described. |
| Allocation concealment (selection bias) | Unclear risk | Whether treatment assignment was concealed from study personnel and participants was not described. |
| Blinding of participants and personnel (performance bias) All outcomes | High risk | Owing to the nature of the intervention, it was not possible to conceal allocation to the intervention from participants. |
| Blinding of outcome assessment (detection bias) All outcomes | Unclear risk | Blinding of outcome assessments was not described. |
| Incomplete outcome data (attrition bias) All outcomes | Low risk | Loss to follow‐up was minimal. An ITT approach was stated but not described. One participant withdrew from each group after baseline assessments were taken, but these participants were not included in ITT analysis. |
| Selective reporting (reporting bias) | Low risk | No selective reporting of outcomes is apparent. |
| Other bias | Low risk | Trial appears to be free of other problems that could put it at high risk of bias. |
Payne 2008.
| Methods | Study design: single‐centre RCT Number randomised: 20; 10 to intervention, 10 to control Study start and stop dates: 9‐month period but dates not reported Length of intervention: 14 weeks Length of follow‐up: to end of intervention Country: USA |
|
| Participants | Age, years (mean SD):
Stage:
Inclusion criteria: • Postmenopausal women with diagnosis of breast cancer who were receiving hormonal therapy with tamoxifen, anastrozole, or letrozole (the 3 most frequently prescribed hormonal medications during the period of recruitment and study enrolment) • Aged 55 years and older and with complaints of fatigue • Karnofsky Performance Scale score ≥ 80 • English speaking • No documented history of neurological deficits or mental illness such as psychotic depression in the past year • No neuromuscular deficits that would contraindicate a walking exercise intervention Exclusion criteria: • None reported |
|
| Interventions | 10 participants assigned to exercise intervention:
Adherence:
10 participants assigned to control:
|
|
| Outcomes | Outcomes:
Numbers of participants assessed:
Adverse events: not reported |
|
| Notes | Trial registration link: none available Trial authors contacted: Trial authors were contacted for means and SDs for outcomes. Trial authors did provide some additional data, but not for all requested outcomes. Intention‐to‐treat analysis: unclear, no description of how missing data were handled Funding: NIH/National Institute of Nursing Research |
|
| Risk of bias | ||
| Bias | Authors' judgement | Support for judgement |
| Random sequence generation (selection bias) | Unclear risk | Generation of allocation sequence was not described. |
| Allocation concealment (selection bias) | Unclear risk | Whether treatment assignment was concealed from study personnel and participants was not described. |
| Blinding of participants and personnel (performance bias) All outcomes | High risk | Owing to the nature of the intervention, it was not possible to conceal allocation to the intervention from participants. |
| Blinding of outcome assessment (detection bias) All outcomes | High risk | Study personnel and outcome assessors were not masked or blinded to study interventions. |
| Incomplete outcome data (attrition bias) All outcomes | Unclear risk | Trial authors did not describe how missing data were handled. Participants in each group withdrew from the study. |
| Selective reporting (reporting bias) | Low risk | No selective reporting of outcomes is apparent. |
| Other bias | Unclear risk | Characteristics of participants in each group were not well described; therefore, it was difficult to assess whether groups were similar at baseline. |
Peppone 2015.
| Methods | Study design: multi‐centre RCT Number randomised: 167; 75 to Yoga intervention, 92 to control Study start: 2007; stop date: 2012 Length of intervention: 4 weeks Length of follow‐up: to end of intervention Country: USA |
|
| Participants | Age, years (mean SE):
Stage, n (%):
Inclusion criteria: • Enrolled between 2 and 24 months post surgery, chemotherapy, and/or radiation therapy. For the original study, eligible survivors were required to: • Have a confirmed diagnosis of cancer • Have undergone and completed standard treatment for cancer • Have sleep disturbance (indicated by a response ≥ 3 on a clinical symptom inventory using an 11‐point scale anchored by ‘‘0’’ = no sleep disturbance and ‘‘10’’ = worst possible sleep disturbance) • Be able to read English • Be 21 years of age or older • Be able to give written informed consent • Not have maintained a regular personal practice of yoga within the 3 months before enrolling in the study, or be planning to start yoga on their own during the time they are enrolled in the study • Not have a confirmed diagnosis of sleep apnoea • Not be receiving any form of treatment for cancer, with the exception of hormonal or monoclonal antibody therapy • Not have metastatic cancer Exclusion criteria: • Not reported |
|
| Interventions | 75 participants assigned to exercise intervention:
Adherence: Not reported 92 participants assigned to control:
|
|
| Outcomes | Outcomes: Musculoskeletal symptoms assessed via selected extracted questions from the following validated questionnaires:
Numbers of participants assessed:
Adverse events: not reported |
|
| Notes | Trial registration link: https://clinicaltrials.gov/ct2/show/NCT00397930 Trial authors contacted: Trial authors were contacted for means and SDs for outcomes. However, they did not provide these data. Intention‐to‐treat analysis: yes, no missing data were reported Funding: NCI and the Office of Cancer Complementary and Alternative Medicine |
|
| Risk of bias | ||
| Bias | Authors' judgement | Support for judgement |
| Random sequence generation (selection bias) | Low risk | "Group assignment was determined by a computer‐generated random numbers table in blocks of two and an allocation ratio of 1:1". |
| Allocation concealment (selection bias) | Unclear risk | Whether allocation was concealed was not reported. |
| Blinding of participants and personnel (performance bias) All outcomes | High risk | Owing to the nature of the intervention, it was not possible to conceal allocation to the intervention from participants. |
| Blinding of outcome assessment (detection bias) All outcomes | Unclear risk | It was not mentioned whether study personnel and outcome assessors were masked or blinded to study interventions. |
| Incomplete outcome data (attrition bias) All outcomes | Low risk | No missing data were reported; "all data were analysed using the intent‐to‐treat principle". |
| Selective reporting (reporting bias) | Low risk | No selective reporting of outcomes is apparent. |
| Other bias | High risk | This study consisted of a secondary analysis from the original study; "the original RCT was designed to test the effect of yoga on sleep quality in all cancer survivors. There was no a priori aim in the study to examine the effect of yoga on musculoskeletal symptoms in breast cancer survivors on endocrine therapy". |
Pinto 2003.
| Methods | Study design: single‐centre RCT Number randomised: 24; 12 to intervention, 12 to control Study start: not reported; stop date: not reported Length of intervention: 12 weeks Length of follow‐up: to end of intervention Country: USA |
|
| Participants | Age, years (mean SD):
Stage, n (%):
Inclusion criteria: • Sedentary women (exercised < 3 times per week for 20 minutes per session) • Received diagnosis of breast cancer (stage 0, I, or II) over the past 3 years • Postsurgery patients who had completed chemotherapy or radiation treatment Exclusion criteria: • Medical or current psychiatric illness that would make compliance with the study protocol difficult or dangerous (e.g. coronary artery disease, hypertension, diabetes) • Orthopaedic problems or neuropathies that would limit exercise training • Medications that would alter training responses (e.g. beta‐blockers) or affect distress outcomes (e.g. antidepressants) |
|
| Interventions | 12 participants assigned to exercise intervention:
Adherence:
12 participants assigned to control:
|
|
| Outcomes | Outcomes:
Numbers of participants assessed:
Nine participants in the intervention group completed exercise stress tests post intervention; 3 participants in this group withdrew but provided postintervention questionnaire data. Adverse events: not reported |
|
| Notes | Trial registration link: none available Trial authors contacted: no Intention‐to‐treat analysis: no Funding: National Institute of Mental Health |
|
| Risk of bias | ||
| Bias | Authors' judgement | Support for judgement |
| Random sequence generation (selection bias) | Unclear risk | Generation of the random sequence was not described. |
| Allocation concealment (selection bias) | Unclear risk | Whether treatment assignment was concealed from study personnel and participants was not described. |
| Blinding of participants and personnel (performance bias) All outcomes | High risk | Owing to the nature of the intervention, it was not possible to conceal allocation to the intervention from participants. |
| Blinding of outcome assessment (detection bias) All outcomes | High risk | Study personnel and outcome assessors were not masked or blinded to study interventions. |
| Incomplete outcome data (attrition bias) All outcomes | High risk | Postintervention exercise stress test and weight data were unavailable for the control group, and postintervention mood and self‐esteem data were available for only half of the control group. Six (50%) control participants were not included in the analyses. |
| Selective reporting (reporting bias) | Low risk | No selective reporting of outcomes is apparent. |
| Other bias | High risk | Small sample size was further hampered by a high dropout rate, particularly in the control group (50%). |
Pinto 2005.
| Methods | Study design: RCT Number randomised: 86; 43 to intervention, 43 to control Study start: not reported; stop date: not reported Length of intervention: 12 weeks Length of follow‐up: at 12 weeks, and at 6 months and 9 months post baseline Country: USA |
|
| Participants | Age, years (mean SD):
Stage, n (%):
Inclusion criteria: • Age ≥ 18 years • Currently sedentary (exercised < 1 time per week for 20 minutes at vigorous intensity or < 2 times per week for 30 minutes at moderate intensity for the past 6 months) • Received diagnosis of stage 0 to II breast cancer over the last 5 years and completed surgery, chemotherapy, and/or radiation • Ambulatory (able to walk a mile without assistive devices) • Willing to be randomised Exclusion criteria: • Prior history of cancer (exception: non‐melanoma skin cancer) • Medical or current psychiatric illness that could make compliance with the study protocol difficult or dangerous (e.g. cardiovascular disease, diabetes, orthopaedic problems that limit exercise training) |
|
| Interventions | 43 participants assigned to exercise intervention:
Adherence:
43 participants assigned to control:
|
|
| Outcomes | Outcomes:
Numbers of participants assessed:
Adverse events: not reported |
|
| Notes | Trial registration link: none available Trial authors contacted: no Intention‐to‐treat analysis: yes, but used LOCF Funding: National Cancer Institute grant |
|
| Risk of bias | ||
| Bias | Authors' judgement | Support for judgement |
| Random sequence generation (selection bias) | Unclear risk | Generation of the random sequence was not described. |
| Allocation concealment (selection bias) | Unclear risk | Whether treatment assignment was concealed from study personnel and participants was not described. |
| Blinding of participants and personnel (performance bias) All outcomes | High risk | Owing to the nature of the intervention, it was not possible to conceal allocation to the intervention from participants. |
| Blinding of outcome assessment (detection bias) All outcomes | High risk | Study personnel and outcome assessors were not masked or blinded to study interventions. |
| Incomplete outcome data (attrition bias) All outcomes | High risk | LOCF approach was used. Four participants withdrew from the exercise group before the end of the 12‐week intervention. Two participants withdrew from the control group before the 6‐month assessment, and another 2 participants withdrew from the control group before the 9‐month assessment. Reasons for control group withdrawals were not given. |
| Selective reporting (reporting bias) | Low risk | No selective reporting of outcomes is apparent. |
| Other bias | High risk | Adherence to physical activity was low (40.7%). |
Pinto 2015.
| Methods | Study design: multi‐centre RCT Number randomised: 76; 39 to intervention, 37 to control Study start: January 2010; stop date: April 2012 Length of intervention: 12 weeks Length of follow‐up: at 24 weeks Country: USA |
|
| Participants | Age, years (mean SD):
Stage, n (%):
Inclusion criteria: • Aged ≥ 21 years with diagnosis of stage 0–III breast cancer in the past 5 years • Completed surgery (patients receiving ongoing chemotherapy (most had completed), radiation, or hormone treatment were eligible) • Ability to read and speak English • Ability to walk a half‐mile without stopping • Sedentary: < 30 minutes/week of vigorous physical activity or < 90 minutes/week of moderate‐intensity physical activity for the past 6 months • Access to a telephone and willingness to receive calls Exclusion criteria: • Medical or psychiatric problems (e.g. myocardial infarction, orthopaedic problems) that might interfere with protocol adherence |
|
| Interventions | 39 participants assigned to physical activity intervention:
Adherence: At 12 weeks, weekly moderate‐vigorous physical activity participation in the intervention group averaged 130 minutes, and at week 24, 98 minutes. 37 participants assigned to control:
|
|
| Outcomes | Primary outcome:
Other outcomes:
Numbers of participants assessed:
Adverse events: not reported |
|
| Notes | Trial registration link: https://clinicaltrials.gov/ct2/show/NCT00948701 Trial authors contacted: no Intention‐to‐treat analysis: yes Funding: grant from the National Cancer Institute (R01CA132854) to the first trial author |
|
| Risk of bias | ||
| Bias | Authors' judgement | Support for judgement |
| Random sequence generation (selection bias) | Unclear risk | "Seventy six breast cancer survivors were randomized to PA Plus RTR or RTR Control". |
| Allocation concealment (selection bias) | Unclear risk | Whether treatment assignment was concealed from study personnel and participants was not described. |
| Blinding of participants and personnel (performance bias) All outcomes | High risk | Owing to the nature of the intervention, it was not possible to conceal allocation to the intervention from participants. |
| Blinding of outcome assessment (detection bias) All outcomes | Low risk | “A research assistant (blind to the participant’s group assignment) was responsible for collecting all data by mail or by telephone”. |
| Incomplete outcome data (attrition bias) All outcomes | Low risk | “Generalized linear models take a likelihood‐based approach to estimation and thus make use of all available data without directly imputing missing values”. |
| Selective reporting (reporting bias) | Low risk | No selective reporting of outcomes is apparent. |
| Other bias | Low risk | Trial appears to be free of other problems that could put it at high risk of bias. |
Portela 2008.
| Methods | Study design: single‐centre RCT Number randomised: 44; 16 to gym‐exercise, 19 to home‐exercise, 9 to no‐exercise control Study start: recruitment began 2004; stop date: recruitment ended 2007 Length of intervention: 26 weeks Length of follow‐up: to end of intervention Country: Puerto Rico |
|
| Participants | Data available on the 34 participants who completed postintervention testing: Age, years (mean SD):
Stage, n (%):
Inclusion criteria: • Women with new diagnosis of unilateral breast cancer who had received surgical treatment for breast cancer in the past 5 years, with or without adjuvant therapy Exclusion criteria: • Unstable cardiac disease • Coagulopathies • Active psychiatric conditions • Metastasis • Haemoglobin level < 8.0 g/dL • Absolute neutrophil count < 0.5 × 1000/mL • Platelet count < 50 × 1000/mL • Ataxia, dizziness, or peripheral sensory neuropathy • Loss of more than 35% of premorbid weight • Dyspnoea • Bone pain • Severe nausea, extreme fatigue, and extreme muscle weakness. Exclusion criteria are considered contraindications to moderate‐intensity exercise programme following cancer diagnosis. |
|
| Interventions | 35 participants assigned to 1 of 2 exercise interventions:
Adherence:
9 participants assigned to control:
|
|
| Outcomes | Outcome:
Numbers of participants assessed:
Adverse events:
|
|
| Notes | Trial registration link: none available Trial authors contacted: no Intention‐to‐treat analysis: no Funding: grant number 5P20RR011126 from the National Center for Research Resources, a component of the National Institutes of Health |
|
| Risk of bias | ||
| Bias | Authors' judgement | Support for judgement |
| Random sequence generation (selection bias) | Low risk | Randomisation of participants was performed by a computer‐generated scheme developed with the Statistical Analysis System. |
| Allocation concealment (selection bias) | Unclear risk | Whether allocation was concealed is unclear. |
| Blinding of participants and personnel (performance bias) All outcomes | High risk | Owing to the nature of the intervention, it was not possible to conceal allocation to the intervention from participants. |
| Blinding of outcome assessment (detection bias) All outcomes | Low risk | “One physical therapist, blinded to group assignment, evaluated the participants in this study. Participants were instructed not to discuss their exercise programs or group assignment with the evaluator”. |
| Incomplete outcome data (attrition bias) All outcomes | High risk | Pre‐post‐test analysis was performed only on those who completed all assessments. No information regarding handling of missing data was provided. |
| Selective reporting (reporting bias) | Low risk | No selective reporting of outcomes is apparent. |
| Other bias | Low risk | Trial appears to be free of other problems that could put it at high risk of bias. |
Rahnama 2010.
| Methods | Study design: single‐centre RCT Number randomised: 32; intervention, not specified; control, not specified Study start: not reported; stop date: not reported Length of intervention: 15 weeks Length of follow‐up: to end of intervention Country: Iran |
|
| Participants | Age, years:
Stage: stage I‐IIIB Inclusion criteria: • 50 to 65 years old • Women who received surgery, chemotherapy, and radiotherapy and currently were taking hormone therapy • Stage I‐IIIB • No specific illness in the past 6 months • No experience of a menstrual cycle • No participation in exercise training or physical activity in the past 6 months • No change in body weight during this period (last 6 months) as great as 10% of their whole body weight Exclusion criteria: • None reported |
|
| Interventions | The number of participants assigned to the exercise intervention was not specified:
Adherence: not reported Number of participants assigned to control not specified:
|
|
| Outcomes | Outcomes:
Numbers of participants assessed:
Adverse events: not reported |
|
| Notes | Trial registration link: none available Trial authors contacted: no Intention‐to‐treat analysis: no Funding: none specified |
|
| Risk of bias | ||
| Bias | Authors' judgement | Support for judgement |
| Random sequence generation (selection bias) | Unclear risk | Generation of the random sequence was not described. |
| Allocation concealment (selection bias) | Unclear risk | Whether treatment assignment was concealed from study personnel and participants was not described. |
| Blinding of participants and personnel (performance bias) All outcomes | High risk | Owing to the nature of the intervention, it was not possible to conceal allocation to the intervention from participants. |
| Blinding of outcome assessment (detection bias) All outcomes | Low risk | “All the measurements were obtained twice and recorded by one staff that was blinded to subjects in pre‐ and post‐tests”. |
| Incomplete outcome data (attrition bias) All outcomes | High risk | Three participants withdrew during the study period; reasons for withdrawals were not reported. No intention‐to‐treat analysis was performed. |
| Selective reporting (reporting bias) | Low risk | No selective reporting of outcomes is apparent. |
| Other bias | Low risk | Trial appears to be free of other problems that could put it at high risk of bias. |
Rogers 2009.
| Methods | Study design: single‐centre RCT Number randomised: 41; 21 to intervention, 20 to control Study start: April 2006; stop date: July 2007 Length of intervention: 12 weeks Length of follow‐up: immediately post intervention and at 3 months post intervention Country: USA |
|
| Participants | Age, years (mean SD):
Stage, n (%):
Inclusion criteria: • English‐speaking female breast cancer survivors between the ages of 18 and 70 years with a diagnosis of stage I, II, or IIIA disease • Currently taking aromatase inhibitors or selective estrogenic receptor modulators and expected to remain on hormonal therapy for the duration of the study (i.e. ≥ 8 months) Exclusion criteria: • Diagnosis of dementia or organic brain syndrome • Medical, psychological, or social characteristic that would interfere with ability to fully participate in programme activities and assessments (e.g. psychosis, schizophrenia) • Contraindication to participation in a regular physical activity programme (e.g. unstable angina, debilitating arthritis pain) • Breast cancer recurrence or metastatic disease; inability to ambulate; planning to relocate out of the study area during the 8‐month study period • Engaged in > 60 minutes of vigorous physical activity or > 150 minutes of moderate plus vigorous activity per week during the past month (based on self‐report) |
|
| Interventions | 21 participants assigned to exercise intervention:
Adherence:
20 participants assigned to control:
|
|
| Outcomes | Outcomes:
Numbers of participants assessed:
Adverse events: No adverse events related to the intervention nor to other study procedures occurred. The following non‐serious, non‐related events were recorded: wheezing requiring physician valuation for asthma, cholinergic urticaria, herpes zoster, sinusitis, back pain related to falling, and elective cosmetic reconstructive surgery. |
|
| Notes | Trial registration link: none available Trial authors contacted: no Intention‐to‐treat analysis: no, but minimal loss to follow‐up (n = 2) Funding: Southern Illinois University School of Medicine Excellence in Academic Medicine Award, Brooks Medical Research Fund, and Memorial Medical Center Foundation Regional Cancer Center |
|
| Risk of bias | ||
| Bias | Authors' judgement | Support for judgement |
| Random sequence generation (selection bias) | Low risk | Randomisation was computer generated. |
| Allocation concealment (selection bias) | Low risk | “Randomization was kept in sealed envelopes until randomization to prevent bias in group allocation by study personnel”. |
| Blinding of participants and personnel (performance bias) All outcomes | High risk | Owing to the nature of the intervention, it was not possible to conceal allocation to the intervention from participants. |
| Blinding of outcome assessment (detection bias) All outcomes | Unclear risk | It was not mentioned whether study personnel and outcome assessors were masked or blinded to study interventions. |
| Incomplete outcome data (attrition bias) All outcomes | Low risk | Loss to follow‐up was minimal. Reasons for exclusions were presented. |
| Selective reporting (reporting bias) | Low risk | No selective reporting of outcomes is apparent. |
| Other bias | Low risk | Trial appears to be free of other problems that could put it at high risk of bias. |
Rogers 2013.
| Methods | Study design: single‐centre RCT Number randomised, 28; 15 to intervention, 13 to control Study recruitment start: June 2008; recruitment stop date: April 2009 Length of intervention: 3 months Length of follow‐up: to end of intervention Country: USA |
|
| Participants | Age, years (mean SD):
Stage, n (%):
Inclusion criteria: • Female • Stage I, II, IIIA breast cancer survivors between the ages of 18 and 70 years • Not currently receiving (and not planning to receive during the study duration) chemotherapy or radiation therapy • ≥ 8 weeks post surgery • English speaking • Medical clearance for participation provided by physician Exclusion criteria: • Dementia or organic brain syndrome • Medical, psychological, or social characteristics that would interfere with ability to fully participate in study activities (e.g. psychosis) • Contraindication to participate in a regular physical activity programme • Metastatic or recurrent disease • Inability to ambulate • Engaging in ≥ 60 weekly minutes of vigorous physical activity or ≥ 150 weekly minutes of moderate plus vigorous activity during the past month (based on self‐report) • Anticipated elective surgery during the intervention that would interfere with participation (e.g. breast reconstructive surgery) • Did not live or work within 50 miles of study site |
|
| Interventions | 15 participants assigned to exercise intervention:
Adherence:
13 participants assigned to control:
|
|
| Outcomes | Outcomes:
Numbers of participants assessed:
Adverse events: Three adverse events were identified ‐ 2 related and non‐serious in the intervention group, and 1 non‐related and serious in the control group. |
|
| Notes | Trial registration link: https://clinicaltrials.gov/ct2/show/NCT00640666 Trial authors contacted: no Intention‐to‐treat analysis: no Funding: Simmons Cancer Institute at Southern Illinois University School of Medicine Translational Research Award. Drs. Rogers, Hopkins‐Price, Vicari, Rao, and Verhulst receive salary support from National Cancer Institute Grant 1R21CA135017. Drs. Rogers, Hopkins‐Price, Vicari, and Verhulst also receive salary support from National Cancer Institute Grant 5R01CA136859. Dr. Courneya is supported by the Canada Research Chairs Program and National Cancer Institute Grant 5R01CA136859. |
|
| Risk of bias | ||
| Bias | Authors' judgement | Support for judgement |
| Random sequence generation (selection bias) | Low risk | "Randomization was based on computer generated numbers, performed in blocks of 4, and revealed in the order in which participants completed baseline testing". |
| Allocation concealment (selection bias) | Unclear risk | Whether treatment assignment was concealed from study personnel and participants was not described. |
| Blinding of participants and personnel (performance bias) All outcomes | High risk | Owing to the nature of the intervention, it was not possible to conceal allocation to the intervention from participants. |
| Blinding of outcome assessment (detection bias) All outcomes | Unclear risk | "All assays were performed by an investigator blinded to the experimental treatment". Other outcome assessment blinding was not described. |
| Incomplete outcome data (attrition bias) All outcomes | High risk | Data analysis was based only on study participants completing both baseline and 3‐month follow‐up. 8 participants were excluded. |
| Selective reporting (reporting bias) | Low risk | No selective reporting of outcomes is apparent. |
| Other bias | Low risk | Trial appears to be free of other problems that could put it at high risk of bias. |
Rogers 2014.
| Methods | Study design: single‐centre RCT Number randomised: 46; 22 to intervention, 24 to control group Study start: not reported; stop date: not reported Length of intervention: 3 months Length of follow‐up: to end of intervention Country: USA |
|
| Participants | Baseline data available for 20 intervention and 24 control participants: Age, years (mean SD):
Stage, n (%):
Inclusion criteria: • Female • 30 to 70 years of age, ductal carcinoma in situ (DCIS), stage I or II breast cancer • At least 4 weeks status post final primary treatment administration (longer‐term therapies such as aromatase inhibitors, oestrogen receptor modulators allowed) • ≥ 8 weeks post surgical procedure • English speaking • Medical clearance for participation provided by physician • Postmenopausal • Average fatigue over the past week rated as ≥ 3 on a 1 to 10 Likert scale, or sleep dysfunction ≥ 1 on a 0 to 3 Likert scale • Willingness to abstain from “as needed” medications for 7 days before each blood draw Exclusion criteria: • Metastatic or recurrent breast cancer • Inability to ambulate without assistance • Unstable angina • New York Heart Association Class II, III, or IV congestive heart failure • Uncontrolled asthma • Interstitial lung disease • Current use of steroids • Having been told by a physician to do only exercise prescribed by a physician • Dementia or organic brain syndrome • Schizophrenia or active psychosis • Connective tissue or rheumatological disease (i.e. systemic lupus erythematosus, rheumatoid arthritis, amyloidosis, Reiter's syndrome, psoriatic arthritis, mixed connective tissue disease, Sjögren's syndrome, progressive systemic sclerosis, CREST syndrome, polymyositis, dermatomyositis, vasculitis, polymyalgia rheumatic, temporal arteritis) • Participating, on average, in more than 20 minutes of physical activity on 2 or more days per week during the past 6 months • Elective surgery planned to occur during the time of the intervention that would interfere with intervention participation (e.g. breast reconstructive surgery) • Living or working > 50 miles from study site • Lack of transportation to study site • Changes in usual medications expected during the study time period • Planning to move residence out of the local area during the 5 months of study participation • Planning to travel out of the local area for vacation during the first 4 weeks of the intervention, or planning to travel out of the local area for longer than a week during the last 8 weeks of the intervention • Contraindication to participation in exercise (i.e. moderate‐intensity walking and strength training with resistance bands) |
|
| Interventions | 22 participants allocated to exercise intervention:
Adherence (based on session record sheets):
24 participants assigned to control:
|
|
| Outcomes | Primary outcome:
Other outcomes:
Numbers of participants assessed:
Adverse events:
|
|
| Notes | Trial registration link: https://clinicaltrials.gov/ct2/show/NCT01147367 Trial authors contacted: no Intention‐to‐treat analysis: no Funding: supported by National Cancer Institute R21CA135017 |
|
| Risk of bias | ||
| Bias | Authors' judgement | Support for judgement |
| Random sequence generation (selection bias) | Low risk | "randomization in blocks of four based on computer generated numbers" |
| Allocation concealment (selection bias) | Low risk | "Participants were randomized in the order in which they completed baseline testing. Randomization numbers were kept in sealed, opaque envelopes so that study staff and participants were unaware of group allocation until all baseline testing was complete". |
| Blinding of participants and personnel (performance bias) All outcomes | High risk | Owing to the nature of the intervention, it was not possible to conceal allocation to the intervention from participants. |
| Blinding of outcome assessment (detection bias) All outcomes | Low risk | Physical measures were obtained by individuals who were blinded to participants' study group allocation. |
| Incomplete outcome data (attrition bias) All outcomes | High risk | "Intent‐to‐treat analysis was performed (i.e. differences between the study groups were assessed with all data regardless of the participant's adherence to the exercise in the intervention group or self‐initiation of exercise in the control group)". However, only participants with follow‐up data were included in analysis (4 participants were excluded). |
| Selective reporting (reporting bias) | Low risk | No selective reporting of outcomes is apparent. |
| Other bias | Low risk | Trial appears to be free of other problems that could put it at high risk of bias. |
Rogers 2015.
| Methods | Study design: multi‐centre RCT Number randomised: 222; 110 to intervention, 112 to control Study start: January 2010; stop date: September 2013 Length of intervention: 3 months Length of follow‐up: at 3 months Country: USA |
|
| Participants | Age, years (mean SD):
Stage, n (%):
Inclusion criteria: • Women aged 18 to 70 years with history of ductal carcinoma in situ (DCIS) or stage I‐IIIA breast cancer who were not currently receiving or planning to receive chemotherapy or radiation therapy • C8 weeks post surgical procedure • English speaking • Medical clearance for participation provided by physician • Participating, on average, in 30 minutes of vigorous physical activity or 60 minutes of moderate activity per week during the past 6 months Exclusion criteria: • Dementia or organic brain syndrome • Disorders that would interfere with ability to fully participate in assessments and BEAT Cancer activities (e.g. psychosis, schizophrenia) • Contraindication to participation in regular physical activity • Metastatic or recurrent breast cancer • Inability to ambulate • Elective surgery anticipated during the intervention that would interfere with participation (e.g. breast reconstructive surgery) • Travel plans interfering with scheduled study sessions • Participating in another exercise study |
|
| Interventions | 110 participants assigned to exercise intervention:
Adherence: Adherence to planned BEAT Cancer components was 98% for supervised exercise sessions, 96% for update sessions, and 91% for discussion group sessions. Only 5 BEAT Cancer participants did not receive the allocated intervention (i.e. did not complete 75% of all intervention components combined). 112 participants assigned to control:
|
|
| Outcomes | Primary outcome:
Other outcomes:
Numbers of participants assessed:
Adverse events: Only 1 related serious adverse event occurred (intervention group; pelvic stress fracture). Related expected adverse events in the BEAT Cancer group included back or lower extremity musculoskeletal pain or injury (n = 14), heart rate monitor rash (n = 1), fall while walking (n = 1), breast reconstruction (n = 3), and chest pain during treadmill fitness testing (n = 1). Related adverse events in the UC group included arm tingling (n = 1) during the treadmill test and knee tendonitis (n = 1). |
|
| Notes | Trial registration link: none available Trial authors contacted: no Intention‐to‐treat analysis: yes Funding: supported by National Cancer Institute R01CA136859 |
|
| Risk of bias | ||
| Bias | Authors' judgement | Support for judgement |
| Random sequence generation (selection bias) | Low risk | Randomisation, based on computer‐generated numbers, is performed in blocks of 4 within each site to facilitate equal distribution between the 2 study groups at each site. |
| Allocation concealment (selection bias) | Low risk | Computer generated numbers for each site; numbers were placed in sealed, opaque envelopes and were delivered to the collaborating site with a written protocol for use. |
| Blinding of participants and personnel (performance bias) All outcomes | High risk | Owing to the nature of the intervention, it was not possible to conceal allocation to the intervention from participants. |
| Blinding of outcome assessment (detection bias) All outcomes | Low risk | “Assessment tools are administered … by an exercise specialist (blinded to the participant's study group allocation) in the exercise laboratory”. |
| Incomplete outcome data (attrition bias) All outcomes | Low risk | “All analyses were intention‐to‐treat with all data available being used”. |
| Selective reporting (reporting bias) | Low risk | No selective reporting of outcomes is apparent. |
| Other bias | Low risk | Trial appears to be free of other problems that could put it at high risk of bias. |
Saarto 2012.
| Methods | Study design: single‐centre RCT
Number randomised: 573; 302 to intervention, 271 to control
Study start and stop dates: enrolment between September 2005 and September 2007
Length of intervention: 12 months
Length of follow‐up: at 6 and 12 months (end of intervention) after baseline Country: Finland |
|
| Participants | Age, years, at baseline, mean (range):
Stage:
Inclusion criteria: • Histologically confirmed newly diagnosed invasive breast cancer (T1‐4 N0‐3 M0) • Pre‐ and postmenopausal women treated with adjuvant chemotherapy or radiation therapy within last 4 months • Started endocrine therapy (anti‐oestrogens, aromatase inhibitors, luteinising hormone‐releasing hormone agonists, or a combination) no more than 4 months earlier • 35 to 68 years old • Signed informed consent before the start of protocol‐specific procedures Exclusion criteria: • Male gender • Prior malignancy except basal cell carcinoma or in situ carcinoma • Hematogenous metastases (M1) • Systemic adjuvant therapy • Postmenopausal women with anti‐oestrogens as the only adjuvant treatment (with or without radiation therapy) • Pregnancy or recent lactation (< 1 year) • Severe cardiac disease (NYHA Class III or greater) • Myocardial infarction within 12 months • Uncontrolled hypertension • Verified osteoporosis (proximal femur or lumbar spine T‐score < ‐2.5 or fracture without trauma) • Concomitant medications affecting calcium and bone metabolism such as bisphosphonates, calcitonin, parathyroid hormone, selective oestrogen receptor modulators, oral corticosteroids (over 6 months), anticonvulsants (phenytoin, carbamatsebin), and prolonged heparin therapy • Other diseases affecting calcium and bone metabolism such as hyperthyroidism, newly diagnosed hypothyroidism, primary hyperparathyroidism, renal failure, chronic hepatic diseases, organ transplant • Residency more than 1 hour from the exercise centre • Competitive athlete • Treated only with radiation therapy • Incapable of training (e.g. severe cardiac disease, osteoporosis, severe knee arthrosis, ligament or cartilage injuries at lower extremities) • Other serious illness or medical condition, which could be a contraindication to exercise |
|
| Interventions | 302 participants assigned to a 2‐component supervised 12‐month exercise training intervention, with each component performed in alternate weeks. Components included:
Adherence: Premenopausal trainees attended a median of 30/52 (58%) supervised training sessions:
Postmenopausal trainees attended a median of 33/52 (63%) training sessions:
271 participants assigned to control:
|
|
| Outcomes | No primary outcome was identified. Physical outcomes:
In subsample study of 86 participants (37 intervention and 40 control):
QoL outcomes:
Numbers of participants assessed:
Numbers of participants assessed in subsample study:
Adverse events: none reported |
|
| Notes | Trial registration link: https://clinicaltrials.gov/ct2/show/NCT00639210 Trial authors contacted: no Intention‐to‐treat analysis: no Funding: Finnish Cancer Institute; Finnish Cancer Foundation; Academy of Finland; Social Insurance Institution of Finland; Finnish Ministry of Education; Finska Läkaresällskapet; Special government grant for health science research; Helander Foundation; Gyllenberg Foundation; Paulo Foundation; Kurt and Doris Palander Foundation; Finnish Cultural Foundation and Medical Fund of the Pirkanmaa Hospital District; Finnish AstraZeneca‐sponsored step benches for the study; Finnish Breast Cancer Group |
|
| Risk of bias | ||
| Bias | Authors' judgement | Support for judgement |
| Random sequence generation (selection bias) | Low risk | "A computer‐generated randomisation schedule was used to allocate patients". |
| Allocation concealment (selection bias) | Low risk | "Study nurse performed randomisation after baseline visit". "randomisation was centralised" |
| Blinding of participants and personnel (performance bias) All outcomes | High risk | Owing to the nature of the intervention, it was not possible to conceal allocation to the intervention from participants. |
| Blinding of outcome assessment (detection bias) All outcomes | Low risk | "examiner blinded" |
| Incomplete outcome data (attrition bias) All outcomes | High risk | Incorrect ITT; "Analyses were performed on an intention‐to‐treat basis for all participants who completed the baseline and at least one follow‐up measurement" |
| Selective reporting (reporting bias) | Low risk | No selective reporting of outcomes is apparent. |
| Other bias | Low risk | Trial appears to be free of other problems that could put it at high risk of bias. |
Schmitz 2005.
| Methods | Study design: single‐centre RCT Number randomised: 86; 43 to intervention, 43 to delayed exercise control Study start: October 2001; stop date: June 2002 Length of intervention: 6 months Length of follow‐up: to end of intervention Country: USA |
|
| Participants | Age, years (mean SD):
Stage, n (%):
Inclusion criteria: • Completed all treatment except hormonal therapy for breast cancer • Body weight stable within 10% over the past year • Non‐smoker for at least the past 2 years • Sedentary to moderately physically active (no more than 3 sessions per week of no more than moderate‐intensity activity; no weight training history) Exclusion criteria: • Medical condition prohibiting participation in a weight training programme • Morbidly obese (BMI > 40 kg/m²) • Hypertensive (systolic blood pressure > 160 mmHg, diastolic blood pressure > 99 mmHg, or both) • Currently on a weight loss plan or planning to start a weight loss plan during the period of the study • Planning to move away from the area or to be away from the area for > 3 weeks during study • Not pregnant or lactating, and not planning to become pregnant during the study period |
|
| Interventions | 43 participants assigned to exercise intervention:
Adherence:
43 participants assigned to control:
|
|
| Outcomes | Primary outcomes:
Numbers of participants assessed:
Adverse events: cancer recurrence: 4 in total ‐ 2 each in intervention and control groups; some limited musculoskeletal issues that were self‐resolving |
|
| Notes | Trial registration link: none available Trial authors contacted: no Intention‐to‐treat analysis: no Funding: Susan G. Komen Foundation, grants to the UMN GCRC from the NIH |
|
| Risk of bias | ||
| Bias | Authors' judgement | Support for judgement |
| Random sequence generation (selection bias) | Low risk | “Random number table” |
| Allocation concealment (selection bias) | Low risk | “The randomization procedure used prevented investigators from influencing treatment allocation”. |
| Blinding of participants and personnel (performance bias) All outcomes | High risk | Owing to the nature of the intervention, it was not possible to conceal allocation to the intervention from participants. |
| Blinding of outcome assessment (detection bias) All outcomes | Low risk | Physiological measures were taken by trained staff blinded to participant status, with the exception of strength measures. |
| Incomplete outcome data (attrition bias) All outcomes | High risk | 4 participants were lost to follow‐up in the intervention group ‐ 2 for recurrences and 2 as the result of withdrawals; 3 participants were lost to follow‐up in the control group ‐ 2 for recurrences and 1 as the result of withdrawal; none of these were included in analyses. |
| Selective reporting (reporting bias) | Low risk | No selective reporting of outcomes is apparent. |
| Other bias | Low risk | Trial appears to be free of other problems that could put it at high risk of bias. |
Schmitz 2009.
| Methods | Study design: single‐centre RCT Number randomised: 295; 148 (71 with lymphoedema and 77 without lymphoedema) to the intervention, 147 (70 with lymphoedema and 77 without lymphoedema) to control Study start: October 2005; stop date: August 2008 Length of intervention: 12 months Length of follow‐up: to end of intervention Country: USA |
|
| Participants | Age, for women with lymphoedema, years (mean SD):
Age, for women without lymphoedema, years (mean SD):
Stage, for women with lymphoedema, n (%):
Stage, for women without lymphoedema, n (%):
Inclusion criteria: • Female • History of unilateral non‐metastatic breast cancer • Body mass index (calculated as weight in kilograms divided by height in meters squared) ≤ 50 • Currently cancer free • No medical condition that would limit participation in exercise • No weight lifting during the year before study entry • No plans for surgery or to be away for at least 1 month during the study • Currently weight stable and not actively trying to lose weight Additional inclusion criteria, for women with lymphoedema: • 1 to 15 years post diagnosis • At least 1 lymph node removed • Presence of lymphoedema Additional inclusion criteria, for women without lymphoedema: • 1 to 5 years post diagnosis • At least 2 lymph nodes removed • No prior lymphoedema diagnosis • No evidence of current lymphoedema Exclusion criteria for women with lymphoedema: • Intensive therapy in the past 3 months • Recorded 10% change in volume or circumference of affected arm in the past 3 months for ≥ 7 days • More than 1 lymphoedema‐related infection requiring antibiotics (cellulitis) in the past 3 months |
|
| Interventions | 148 participants (71 with lymphoedema and 77 without lymphoedema) assigned to the exercise intervention, consisting of progressive strength (weight) training:
Adherence:
147 participants (70 with lymphoedema and 77 without lymphoedema) assigned to control:
|
|
| Outcomes | Outcomes:
For women with lymphoedema, outcomes were measured as follows:
For women without lymphoedema, outcomes were measured as follows:
Adverse events among participants with lymphoedema:
Adverse events among participants without lymphoedema:
|
|
| Notes | Trial registration link: https://clinicaltrials.gov/ct2/show/NCT00194363 Trial authors contacted: no Intention‐to‐treat analysis: no Funding: NIH/National Cancer Institute and the Public Health Services Research Grant |
|
| Risk of bias | ||
| Bias | Authors' judgement | Support for judgement |
| Random sequence generation (selection bias) | Low risk | Allocation sequence was a computer‐generated minimisation scheme. |
| Allocation concealment (selection bias) | Low risk | “...de‐identified data for ... variables were entered after completion of all baseline measures, the study coordinator then called participants to reveal the outcome of randomization and to schedule groups for the supervised groups" |
| Blinding of participants and personnel (performance bias) All outcomes | High risk | Owing to the nature of the intervention, it was not possible to conceal allocation to the intervention from participants. |
| Blinding of outcome assessment (detection bias) All outcomes | Low risk | Measurements obtained by “trained staff who were unaware of the study‐group assignments” “Measurement staff (including CLTs) were blinded to treatment allocation”. |
| Incomplete outcome data (attrition bias) All outcomes | High risk | No evidence suggests that missing data were adequately and appropriate addressed. Large numbers of study participants withdrew; 11 women without lymphoedema withdrew from the intervention group and 9 women without lymphoedema withdrew from the control group. |
| Selective reporting (reporting bias) | Low risk | No selective reporting of outcomes is apparent. |
| Other bias | Low risk | Trial appears to be free of other problems that could put it at high risk of bias. |
Segar 1998.
| Methods | Study design: single‐centre quasi‐randomised partial cross‐over controlled trial. Only first treatment period included here Number randomised: 30; 10 to exercise intervention, 10 to exercise and behavioural intervention, 10 to control Study start: not reported; stop date: not reported Length of intervention: 10 weeks Length of follow‐up: at 12 weeks Country: USA |
|
| Participants | Age, years (mean SD):
Stage, n (%):
Inclusion criteria: • Any type of breast cancer surgery • 30 to 65 years old • Not currently participating in exercise • No contraindications to exercise • Written release from the physician Exclusion criteria: • Cardiovascular or pulmonary disease • Known physical disabilities |
|
| Interventions | 10 participants assigned to exercise intervention:
10 participants assigned to exercise and behavioural modification intervention:
Adherence:
10 participants assigned to control:
|
|
| Outcomes | Primary outcomes:
Time points of assessments: baseline, at 10 weeks Numbers of participants assessed:
Reasons for missing data:
Adverse events: none reported Subgroup analysis: none reported |
|
| Notes | Trial registration link: none available Trial authors contacted: no Intention‐to‐treat analysis: no Funding: Michigan Initiative for Women’s Health Grant |
|
| Risk of bias | ||
| Bias | Authors' judgement | Support for judgement |
| Random sequence generation (selection bias) | High risk | “Subjects were rotated sequentially into two treatment conditions and one control group”. |
| Allocation concealment (selection bias) | Unclear risk | Whether treatment assignment was concealed from study personnel and participants was not described. |
| Blinding of participants and personnel (performance bias) All outcomes | High risk | Owing to the nature of the intervention, it was not possible to conceal allocation to the intervention from participants. |
| Blinding of outcome assessment (detection bias) All outcomes | High risk | Study personnel and outcome assessors were not masked or blinded to study interventions. |
| Incomplete outcome data (attrition bias) All outcomes | High risk | 4 participants were excluded from the exercise group and 2 from the control group. Exclusion from analyses occurred because of attrition or non‐compliance with the study protocol. |
| Selective reporting (reporting bias) | Low risk | No selective reporting of outcomes is apparent. |
| Other bias | Low risk | Trial appears to be free of other problems that could put it at high risk of bias. |
Short 2014.
| Methods | Study design: single‐centre RCT Number randomised: 330; 109 to intervention tailored‐print, 110 to intervention targeted‐print, 111 to control Study start: October 2010; stop date: October 2013 Length of intervention: 3 months Length of follow‐up: at 4 and 10 months post intervention Country: Australia |
|
| Participants | Age, years, mean (range):
Stage, n (%):
Inclusion criteria: • Female breast cancer survivors over the age of 18 • Finished “active” cancer treatment (defined as surgery, chemotherapy, and/or radiotherapy) • Could read and write in English Exclusion criteria: • Not reported |
|
| Interventions | 330 participants assigned to 2 different physical activity behavioural change interventions:
Adherence:
111 participants assigned to control:
|
|
| Outcomes | Primary outcome:
Other outcomes:
Numbers of participants assessed:
Adverse events: not reported |
|
| Notes | Trial registration link: https://www.anzctr.org.au/Trial/Registration/TrialReview.aspx?ACTRN=12611001061921 Trial authors contacted: no Intention‐to‐treat analysis: yes, but LOCF Funding: funded by the Cancer Institute New South Wales Research Scholar Award (10/RSA/1‐27 ‐ Trial ID in Australian New Zealand) |
|
| Risk of bias | ||
| Bias | Authors' judgement | Support for judgement |
| Random sequence generation (selection bias) | Low risk | "computer‐generated block randomisation sequence" |
| Allocation concealment (selection bias) | Low risk | Sequence "implemented in a blinded fashion by an administrative assistant not involved in the project" |
| Blinding of participants and personnel (performance bias) All outcomes | High risk | Owing to the nature of the intervention, it was not possible to conceal allocation to the intervention from participants. |
| Blinding of outcome assessment (detection bias) All outcomes | Low risk | "All project team members were blinded to this process until allocation was complete". |
| Incomplete outcome data (attrition bias) All outcomes | High risk | Inappropriate handling of missing data in the analyses; "primary analysis was conducted using all observed data, and sensitivity analyses using the baseline observations carried forward approach were conducted to explore the impact of missing data" |
| Selective reporting (reporting bias) | Low risk | No selective reporting of outcomes is apparent. |
| Other bias | Low risk | Trial appears to be free of other problems that could put it at high risk of bias. |
Taleghani 2012.
| Methods | Study design: single‐centre RCT Number randomised: 80; 40 to intervention, 40 to control Study start: September 2009; stop date: February 2010 Length of intervention: 8 weeks Length of follow‐up: to end of intervention Country: Iran |
|
| Participants | Age, years:
Stage, n (%):
Inclusion criteria: • Women with breast cancer stages I‐III • Aged 15 to 55 years • Two years since completion of breast cancer‐related treatment (except for hormone therapy) • Performance status 0 to 4 (as determined by ECOG scale of WHO) Exclusion criteria: • Evidence of disease recurrence • Treatment with anticoagulants, signs of cardiac disease • Underwent arrhythmia or MI • Dementia or other psychotic condition • Regular exercise 2 to 3 sessions per week in the past 6 months |
|
| Interventions | 40 participants assigned to exercise intervention:
Adherence: Not reported 40 participants assigned to control:
|
|
| Outcomes | Primary outcome:
Numbers of participants assessed:
Adverse events: not reported |
|
| Notes | Trial registration link: none available Trial authors contacted: no Intention‐to‐treat analysis: unclear Funding: Isfahan University of Medical Sciences |
|
| Risk of bias | ||
| Bias | Authors' judgement | Support for judgement |
| Random sequence generation (selection bias) | Unclear risk | "randomly divided into two groups of study and control"; method not stated |
| Allocation concealment (selection bias) | Unclear risk | Whether treatment assignment was concealed from study personnel and participants was not described. |
| Blinding of participants and personnel (performance bias) All outcomes | High risk | Owing to the nature of the intervention, it was not possible to conceal allocation to the intervention from participants. |
| Blinding of outcome assessment (detection bias) All outcomes | Unclear risk | Blinding of outcome assessments was not described. |
| Incomplete outcome data (attrition bias) All outcomes | Unclear risk | Numbers of participants included in postintervention analyses were not provided. |
| Selective reporting (reporting bias) | Low risk | No selective reporting of outcomes is apparent. |
| Other bias | Unclear risk | Trial appears to be free of other problems that could put it at high risk of bias. |
Vallance 2007.
| Methods | Study design: single‐centre RCT Number randomised: 337; 94 to print material intervention (PM), 94 to pedometer intervention (PED), 93 to combination of print material and pedometers intervention (COM), 96 to control Study start: July 2005; stop date: April 2006 Length of intervention: 12 weeks Length of follow‐up: to end of intervention, at 6 months post intervention Country: Canada |
|
| Participants | Age, years, mean (range):
Stage, n (%):
Inclusion criteria: • Histologically confirmed stage I‐IIIA breast cancer • Physician approval • Freedom from chronic medical and orthopaedic conditions that would preclude physical activity (e.g. congestive heart failure, recent knee or hip replacement) • English as spoken language • Completion of adjuvant therapy except hormone therapy • Current absence of breast cancer Exclusion criteria: • None reported |
|
| Interventions | 281 (PM, 94; PED, 94; COM, 94) participants assigned to three 12‐week interventions:
Adherence to intervention materials immediately post intervention:
Adherence to intervention materials at 6‐month follow‐up:
96 participants assigned to control:
|
|
| Outcomes | Primary outcome:
Other outcomes:
Numbers of participants assessed: PM: baseline, 94; post intervention, 81; 6 months post intervention, 62 PED: baseline, 94; post intervention, 88; 6 months post intervention, 69 COM: baseline, 93; post intervention, 84; 6 months post intervention, 67 Control: baseline, 96; post intervention, 85; 6 months post intervention, 68 Adverse events: none reported |
|
| Notes | Trial registration link: https://clinicaltrials.gov/ct2/show/NCT00221221 Trial authors contacted: yes, additional data were received from trial authors Intention‐to‐treat analysis: no Funding: National Cancer Institute of Canada (NCIC) with funds from the Canadian Cancer Society (CCS) and the CCS/NCIC Sociobehavioral Cancer Research Network |
|
| Risk of bias | ||
| Bias | Authors' judgement | Support for judgement |
| Random sequence generation (selection bias) | Low risk | Computer‐generated random numbers list |
| Allocation concealment (selection bias) | Low risk | “A research assistant generated the group assignments in sequentially numbered and sealed opaque envelopes”. |
| Blinding of participants and personnel (performance bias) All outcomes | High risk | Owing to the nature of the intervention, it was not possible to conceal allocation to the intervention from participants. |
| Blinding of outcome assessment (detection bias) All outcomes | Unclear risk | It was not mentioned whether study personnel and outcome assessors were masked or blinded to study interventions. |
| Incomplete outcome data (attrition bias) All outcomes | High risk | For all analyses, an intention‐to‐treat approach was employed with LOCF. |
| Selective reporting (reporting bias) | Low risk | No selective reporting of outcomes is apparent. |
| Other bias | Low risk | Trial appears to be free of other problems that could put it at high risk of bias. |
Waltman 2010.
| Methods | Study design: multi‐centre RCT Number randomised: 249; 124 to intervention, 125 to control Study start: not reported; stop date: not reported Length of intervention: 24 months. Length of follow‐up: at 36 months Country: USA |
|
| Participants | Only baseline characteristics of sample completing the 24‐month study period were reported: Age, years (mean SD):
Stage, n (%):
Inclusion criteria: • 35 to 75 years of age • History of stage 0 (in situ), I, or II breast cancer • BMD T‐score of ‐1.0 or less at any of 3 sites (hip, spine, forearm) • At least 6 months post breast cancer treatment and 12 months postmenopausal • Residing within 100 miles of 1 of 4 research sites (Omaha, Lincoln, Kearney, and Scottsbluff, NE) • Physician's permission to participate Exclusion criteria: • Recurrence of breast cancer • Currently taking hormone therapy, bisphosphonates, glucocorticosteroids, or other drugs affecting bone • Currently engaging in strength training exercises • Body mass index ≥ 35 • Serum calcium, creatinine, or thyroid‐stimulating hormone (if on thyroid therapy) outside normal limits • Active gastrointestinal problems or other conditions that prohibited strength training exercises; risedronate, calcium, or vitamin D intake |
|
| Interventions | 124 participants allocated to strength and weight training exercise interventions:
Adherence % (self‐reported but also validated by research nurses during monthly interviews):
125 participants assigned to control:
|
|
| Outcomes | Outcomes:
Numbers of participants assessed:
Adverse events: No long‐term adverse effects from exercises were noted for any of the 110 women exercising, including women with a history of lymphoedema. |
|
| Notes | Trial registration link: https://clinicaltrials.gov/ct2/show/NCT00567606 Trial authors contacted: no Intention‐to‐treat analysis: yes Funding: National Institute of Nursing Research (1 R01NR07743–01A1) |
|
| Risk of bias | ||
| Bias | Authors' judgement | Support for judgement |
| Random sequence generation (selection bias) | Unclear risk | Participants "were randomised to exercise plus medication (n = 110) or medication only (n = 113) treatment groups, and randomisation was stratified by years of post menopause". Randomisation method was not stated. |
| Allocation concealment (selection bias) | Unclear risk | Whether treatment assignment was concealed from study personnel and participants was not described. |
| Blinding of participants and personnel (performance bias) All outcomes | High risk | Owing to the nature of the intervention, it was not possible to conceal allocation to the intervention from participants. |
| Blinding of outcome assessment (detection bias) All outcomes | Unclear risk | Blinding of outcome assessments was not described. |
| Incomplete outcome data (attrition bias) All outcomes | Low risk | "intent to treat paradigm was used where data from all participants were analysed according to randomised assignment regardless of protocol adherence" "The generalized estimating equation (GEE) method with an exchangeable structure for repeated measures data was used to fit a generalized linear model to examine factors associated with muscle strength, balance, BMD, and bone turnover including time of testing (baseline, 12 and 24 months) and group assignment (exercise or medication only)". |
| Selective reporting (reporting bias) | Low risk | No selective reporting of outcomes is apparent.. |
| Other bias | Low risk | Trial appears to be free of other problems that could put it at high risk of bias. |
Winters‐Stone 2011.
| Methods | Study design: single‐centre RCT Number randomised: 106; 52 to intervention, 54 to control Study start: October 2006; stop date: January 2009 Length of intervention: 12 months Length of follow‐up: to end of intervention Country: USA |
|
| Participants | Age, years (mean SD):
Stage, n (%):
Inclusion criteria: • Diagnosis of stage 0–IIIA breast cancer at or after age 50 • Postmenopausal • ≥ 1 year post chemotherapy or radiotherapy • Non‐osteoporotic • No bone‐altering medication other than adjuvant hormone therapy • Physician clearance to exercise • No regular participation in resistance and/or impact exercise (fewer than two 30‐minute sessions per week) in the past month • Physical and cognitive ability to complete study testing Exclusion criteria: • None reported |
|
| Interventions | 52 participants assigned to 1‐year exercise intervention:
Adherence:
54 participants assigned to control:
|
|
| Outcomes | Primary outcomes:
Other outcomes:
Numbers of participants assessed:
Adverse events: No adverse effects were associated with participation in either group. |
|
| Notes | Trial registration link: https://clinicaltrials.gov/ct2/show/NCT00591747 Trial authors contacted: no Intention‐to‐treat analysis: yes, but data were available only for per‐protocol analyses Funding: Susan G. Komen Race for the Cure and the National Cancer Institute; partial support from the Oregon Clinical and Translational Research Institute (OCTRI), National Center for Research Resources (NCRR) ‐ a component of the National Institutes of Health (NIH) ‐ and NIH Roadmap for Medical Research |
|
| Risk of bias | ||
| Bias | Authors' judgement | Support for judgement |
| Random sequence generation (selection bias) | Unclear risk | Generation of the random sequence was not described |
| Allocation concealment (selection bias) | High risk | “Group assignments were placed in sealed, sequentially numbered envelopes and opened by the participant following the completion of baseline testing”. Envelopes were not opaque. |
| Blinding of participants and personnel (performance bias) All outcomes | High risk | Owing to the nature of the intervention, it was not possible to conceal allocation to the intervention from participants. |
| Blinding of outcome assessment (detection bias) All outcomes | Low risk | “Trained technicians blinded to group assignment” carried out testing. |
| Incomplete outcome data (attrition bias) All outcomes | High risk | The intent‐to‐treat (ITT) analysis was performed via hierarchical linear modelling. However, although inferences were based on ITT analyses, data were available only for per‐protocol analyses (in table format). High attrition rate was reported in the intervention group. |
| Selective reporting (reporting bias) | Low risk | No selective reporting of outcomes is apparent. |
| Other bias | Low risk | Trial appears to be free of other problems that could put it at high risk of bias. |
1RM: 1‐repetition maximum.
7‐DPAR: 7‐day physical activity recall questionnaire.
ACSM: American College of Sports Medicine.
AIDS: acquired immunodeficiency syndrome.
AIT: aerobic interval training.
API: Aerobic Power Index.
BCE: Bone Collagen Equivalents.
BCPT: Breast Cancer Prevention Trial.
BDI: Beck Depression Inventory.
BES: Body Esteem Scale.
BFLUTS: Bristol Female Lower Urinary Tract Symptoms Questionnaire.
BIQ: Body Image Questionnaire.
BIS: bioimpedance spectroscopy.
BMI: body mass index.
BPI: Brief Pain Inventory.
BPNS: Basic Psychological Needs Satisfaction Scale.
BREQ‐2: Behavioral Regulation for Exercise Questionnaire‐2.
BRI: bone remodelling index.
BSAP: bone‐specific alkaline phosphatase.
CARES‐SF: Cancer Rehabilitation Evaluation System Short Form.
CBT: cognitive‐behavioural therapy.
CCS: Canadian Cancer Society.
CE: exercise begun after treatment.
CES‐D: Centers for Epidemiological Studies—Depression Scale.
CHAMPS: Community Health Activities Model Program for Seniors.
CI: confidence interval.
CMT: continuous moderate training.
COM: combination of print material and pedometers intervention.
CP: chemotactic protein.
CRP: C‐reactive protein.
CTACK: cutaneous T cell‐attracting chemokine.
DASH: Disability of the Arm, Shoulder, and Hand questionnaire.
DASS‐21: Depression and Anxiety Stress Scale‐21.
DCIS: ductal carcinoma in situ.
DEG: delayed exercise group.
DEXA: dual‐energy X‐ray absorptiometry.
DWR: deep water running.
ECOG: Eastern Cooperative Oncology Group.
EE: exercise begun during treatment.
EEG: early exercise group.
ELISA: enzyme‐linked immunosorbent assay.
EORTC QLQ‐BR23: European Organization for Research and Treatment of Cancer core quality of life questionnaire.
EORTC QLQ‐C30: European Organization for Research and Treatment of Cancer core quality of life questionnaire: breast cancer‐specific module.
EuroQoL‐5D: European Quality of Life 5 dimensions.
EuroQoL‐VAS: European Quality of Life visual analogue scale.
FACIT‐F: Functional Assessment of Chronic Illness Therapy ‐ Fatigue.
FACT: Functional Assessment of Cancer Therapy.
FACT‐B: Functional Assessment of Cancer Therapy ‐ Breast.
FACT‐Cog: Functional Assessment of Cancer Therapy ‐ Cognitive.
FACT‐ES: Functional Assessment of Cancer Therapy ‐ Endocrine Subscale.
FACT‐F: Functional Assessment of Cancer Therapy ‐ Fatigue.
FACT‐G: Functional Assessment of Cancer Therapy ‐ General.
FFQ: Food Frequency Questionnaire.
FGF: fibroblast growth factor.
FSI: Fatigue Symptom Inventory.
FSS: Fatigue Severity Scale.
G‐CSF: granulocyte colony‐stimulating factor.
gmCSF: granulocyte‐macrophage colony‐stimulating factor.
GRO: growth‐related oncogene.
HADS: Hospital Anxiety and Depression Scale.
HbA1c: glycosylated haemoglobin.
HDL‐C: high‐density lipoprotein cholesterol.
HF/NS: hot flashes and night sweats.
HGF: hepatocyte growth factor.
HLRE: high‐load resistance exercise.
HMWA: high‐molecular‐weight adiponectin.
HOMA: homeostatic model assessment.
HR: heart rate.
HRmax: maximum heart rate.
HRR: heart rate reserve.
IBCSG: International Breast Cancer Study Group.
ICAM: intercellular adhesion molecule.
IFN: interferon.
IGF: insulin‐like growth factor.
IGFBP: insulin‐like growth factor binding protein.
IL: interleukin.
IP: inducible protein.
IPAQ: International Physical Activity Questionnaire.
ITT: intention‐to‐treat.
KPS: Karnofsky Performance Status.
LDL‐C: low‐density lipoprotein cholesterol.
LIF: leukaemia inhibitory factor.
LLRE: low‐load resistance exercise.
LOCF: last observation carried forward.
LPS: lipopolysaccharide.
LSI: Leisure Score Index; Life Satisfaction Inventory.
LVEF: left ventricular ejection fraction.
MCS‐F: macrophage colony‐stimulating factor.
MET‐h: metabolic equivalent hours.
METs: metabolic equivalents.
MFI: Multi‐dimensional Fatigue Inventory.
MFSI: Multi‐dimensional Fatigue Symptom Inventory.
MFSI‐SF: Multi‐dimensional Fatigue Symptom Inventory Short Form.
MI: myocardial infarction.
MIG: monokine induced by IFNγ.
MIP: macrophage inflammatory protein.
MOS SF‐36: Medical Outcomes Study Short Form‐36.
MVPA: moderate‐vigorous physical activity.
NCI: National Cancer Institute.
NCIC: National Cancer Institute of Canada.
NGF: nerve growth factor.
NK: natural killer.
NKCA: natural killer cell activity.
NTx: N‐terminal telopeptide.
NYHA: New York Heart Association.
PA: physical activity.
PAL: physical activity log.
PANAS: Positive and Negative Affect Scale.
PDGF: platelet‐derived growth factor.
PE: physical education.
PED: pedometer intervention.
PFS: Piper Fatigue Scale.
PFS‐R: Revised Piper Fatigue Scale.
PHA: phytohemagglutinin.
PM: print material.
POMS: Profile of Mood States.
PPO: peak power output.
pQCT: peripheral quantitative computed tomography.
PROMIS: Patient Reported Outcomes Measurement Information System.
PSQI: Pittsburgh Sleep Quality Index.
QLQ‐BR23: quality of life questionnaire: breast cancer‐specific module.
QoL: quality of life.
RCT: randomised controlled trial.
RER: respiratory exchange ratio.
RM: repetition maximum.
RPE: rate of perceived exertion.
RSE: Rosenberg Self‐Esteem Scale.
RTR: reach‐to‐recovery.
SAQ: Sexual Activity Questionnaire.
SCF: stem cell factor.
SCGF: stem cell growth factor.
SCL‐90R: Symptom Checklist‐90 Revised.
SCT: social cognitive theory.
SD: standard deviation.
SDF: stromal cell‐derived factor.
SOC: stage of change.
SPAS‐7: Social Physique Anxiety Scale‐7.
STAI: State‐Trait Anxiety Index.
TC: total cholesterol.
TCC: Tai Chi Chuan.
TG: triglyceride.
TNF: tumour necrosis factor.
TOI: Trial Outcome Index.
TRAIL: tumour necrosis factor‐related apoptosis‐inducing ligand.
TTM: Transtheoretical model.
URCC SI: University of Rochester Cancer Center Symptom Inventory.
VCAM: vascular cell adhesion molecule.
VE/VCO₂: minute ventilation carbon dioxide production relationship.
VE/VO₂: minute ventilation oxygen production relationship.
VEGF: vascular endothelial growth factor.
VEpeak: peak ventilation.
VO₂max: maximal oxygen uptake.
VO₂peak: peak oxygen uptake.
WCC: white cell count.
WHO: World Health Organization.
WOMAC: Western Ontario and McMaster Universities Osteoarthritis Index.
YMCA: Young Men's Christian Association.
YOCAS: yoga intervention based on gentle Hatha and restorative yoga.
Characteristics of excluded studies [ordered by study ID]
| Study | Reason for exclusion |
|---|---|
| Anderson 2012 | This study was excluded because it included patients undergoing adjuvant cancer therapy. |
| Benton 2014 | This study was excluded as it did not compare physical activity vs no physical activity or usual care. |
| Bloom 2008 | This study was excluded because the effects of physical activity could not be isolated. |
| Buffart 2012 | This study was excluded because the breast cancer population was not analysed separately. |
| Burnham 2002 | This study was excluded because the breast cancer population was not analysed separately. |
| Cadmus‐Bertram 2011 | This study was excluded as it did not compare physical activity vs no physical activity, another intervention, or usual care. |
| Cantarero‐Villanueva 2012 | This study was excluded because the effects of physical activity could not be isolated (physical activity + manual therapy). |
| Cantarero‐Villanueva 2012a | This study was excluded because the effects of physical activity could not be isolated (physical activity + manual therapy). |
| Cantarero‐Villanueva 2013a | This study was excluded because the effects of physical activity could not be isolated (physical activity + manual therapy). |
| Carter 2012 | This study was excluded as it did not compare physical activity vs no physical activity or usual care. |
| Casla 2015 | This study was excluded because the effects of physical activity could not be isolated (physical activity + diet modification). |
| Cheema 2006 | This study was excluded as it did not compare physical activity vs no physical activity or usual care. |
| Cho 2006 | This study was excluded because the effects of physical activity could not be isolated (physical activity + education intervention). |
| Cohen 2010 | This study was excluded because all patients were at pretreatment stage. |
| Culos‐Reed 2006 | This study was excluded because the breast cancer population was not analysed separately. |
| Cunningham 1998 | This study was excluded because groups included all participants with metastatic disease. |
| D'Atillio 2007 | This study was excluded because it lacked a non‐physical activity comparison group. |
| Damush 2006 | This study was excluded as it did not compare physical activity vs no physical activity or usual care. |
| Danhauer 2009 | This study was excluded because some participants were receiving treatment during the study. |
| De Backer 2007 | This study was excluded as it did not compare physical activity vs no physical activity or usual care. |
| Demark 2006 | This study was excluded because it did not include a separate analysis of participants with breast cancer. |
| Dimeo 2008 | This study was excluded as it did not compare physical activity vs no physical activity or usual care. |
| Djuric 2002 | This study was excluded because the effects of physical activity could not be isolated (physical activity + diet modification). |
| Eyigor 2010 | This study was excluded because it lacked a non‐physical activity comparison group. |
| Fernandez‐Lao 2012 | This study was excluded because the effects of physical activity could not be isolated (physical activity + manual therapy). |
| Fernandez‐Lao 2013 | This study was excluded because it was a non‐randomised controlled trial. |
| Fong 2014 | This study was excluded because it was a non‐randomised controlled trial. |
| Galantino 2013 | This study was excluded because it did not include a comparison group. |
| Gordon 2005 | This study was excluded because it included exercises restricted to stretching and local muscular endurance (i.e. training of shoulders). |
| Hanna 2008 | This study was excluded as it did not compare physical activity vs no physical activity or usual care. |
| Hayes 2013 | This study was excluded because it included participants undergoing adjuvant cancer therapy. |
| Headley 2004 | This study was excluded because all included participants had metastatic disease initiating chemotherapy. |
| Hojan 2013 | This study was excluded because it did not include a comparison group. |
| Hsiao‐Fang 2013 | This study was excluded because it included participants undergoing chemotherapy. |
| Hsieh 2008 | This study was excluded because it included participants undergoing chemotherapy and radiotherapy. |
| Hunt‐Shanks 2006 | This study was excluded because it did not include a comparison group. |
| Husebo 2014 | This study was excluded because it included participants undergoing chemotherapy. |
| Hutnick 2005 | This study was excluded because it was a non‐randomised controlled trial. |
| Ibfelt 2011 | This study was excluded because the breast cancer population was not analysed separately. |
| Isabell 2010 | This study was excluded because it included participants undergoing chemotherapy and radiotherapy. |
| Jeff 2012 | This study was excluded because it included exercises restricted to stretching and local muscular endurance (i.e. training of shoulders). |
| Johansson 2005 | This study was excluded as it did not compare physical activity vs no physical activity, another intervention, or usual care. |
| Johnsson 2013 | This study was excluded because it did not include a comparison group. |
| Kilbreath 2006 | This study was excluded because it included exercises restricted to stretching and local muscular endurance (i.e. training of shoulders). |
| Kilbreath 2012 | This study was excluded because it included participants undergoing chemotherapy and radiotherapy. |
| Kilgour 2008 | This study was excluded because it included exercises restricted to stretching and local muscular endurance (i.e. training of shoulders). |
| Kim Soo 2011 | This study was excluded because the effects of physical activity could not be isolated (physical activity + diet modification). |
| Kovacic 2011 | This study did not include a physical activity intervention but used a relaxation intervention instead. |
| LaStayo 2011 | This study was excluded because the breast cancer population was not analysed separately. |
| Lee 2010 | This study was excluded because it compared exercise vs historical control (non‐randomised controlled trial). |
| Ligibel 2012 | This study was excluded because the breast cancer population was not analysed separately. |
| May 2008 | This study was excluded because the breast cancer population was not analysed separately. |
| McClure 2010 | This study was excluded because it included exercises restricted to stretching and local muscular endurance (i.e. training of shoulders). |
| Mefferd 2007 | This study was excluded because the effects of physical activity could not be isolated (physical activity + diet modification). |
| Moadel 2007 | This study was excluded because it included participants undergoing chemotherapy and radiotherapy, as well as participants with metastatic disease. |
| Naraphong 2015 | This study was excluded because it included participants undergoing chemotherapy. |
| Naumann 2012a | This study was excluded because it was a non‐randomised controlled trial. |
| Noble 2012 | This study was excluded as it did not compare physical activity vs no physical activity or usual care. |
| Oh 2010 | This study was excluded because the breast cancer population was not analysed separately. |
| Oldervoll 2011 | This study was excluded as it did not compare physical activity vs no physical activity or usual care. |
| Pinto 2008 | This study was excluded as it did not compare physical activity vs no physical activity or usual care. |
| Pinto 2013 | This study was excluded as it did not compare physical activity vs no physical activity or usual care (healthcare professional gave PA advice to both intervention groups). |
| Rabin 2006 | This study was excluded because it lacked a non‐physical activity comparison group. |
| Rabin 2009 | This study was excluded as it did not compare physical activity vs no physical activity or usual care. |
| Sandel 2005 | This study was excluded because it included participants undergoing adjuvant cancer therapy. |
| Schmidt 2012 | This study was excluded because it lacked a non‐physical activity comparison group. |
| Schneider 2007 | This study was excluded as it did not compare physical activity vs no physical activity or usual care. |
| Schwartz 1999 | This study was excluded as it did not compare physical activity vs no physical activity or usual care. |
| Segal 2001 | This study was excluded because it included participants undergoing adjuvant cancer therapy. |
| Sherman 2010 | This study was excluded because it was a controlled clinical trial (participants allocated according to patient preference and intervention availability). |
| Speed‐Andrews 2010 | This study was excluded because it did not include a comparison group. |
| Sprod 2005 | This study was excluded because it lacked a non‐physical activity comparison group. |
| Sprod 2010 | This study was excluded because it was a non‐randomised controlled trial. |
| Stan 2012 | This study was excluded as it did not compare physical activity vs no physical activity or usual care. |
| Stan 2013 | This study was excluded as it did not compare physical activity vs no physical activity or usual care. |
| Stevinson 2007 | This study was excluded because the breast cancer population was not analysed separately. |
| Szczwpanska‐Gieracha 2010 | This study was excluded as it did not compare physical activity vs no physical activity or usual care. |
| Tang 2010 | This study was excluded because the breast cancer population was not analysed separately. |
| Taso 2014 | This study was excluded because it included participants undergoing adjuvant cancer therapy. |
| Thorsen 2005 | This study was excluded because the breast cancer population was not analysed separately. |
| Tidhar 2010 | This study was excluded because it involved therapeutic exercise regimens addressing only specific impairments related to shoulder, arm, or both. |
| Turner 2004 | This study was excluded as it did not compare physical activity vs no physical activity or usual care. |
| Ulger 2010 | This study was excluded because it did not include a comparison group. |
| Van Puymbroeck 2011 | This study was excluded because it lacked a non‐physical activity comparison group. |
| Van Weert 2005 | This study was excluded because the breast cancer population was not analysed separately. |
| Wong 2012 | This study was excluded as it did not compare physical activity vs no physical activity or usual care. |
| Wu 2008 | This study was excluded as it did not compare physical activity vs no physical activity or usual care. |
| Yuen 2007 | This study was excluded because it included participants undergoing adjuvant cancer therapy. |
Characteristics of studies awaiting assessment [ordered by study ID]
Lahart 2016.
| Methods | Study design: RCT Number expected to be randomised: 80; 40 to exercise intervention, 40 to control Study start: January 2010; stop date: March 2013 Length of intervention: 6 months |
| Participants | Age, years (mean SD):
Stage: stage I–III Inclusion criteria: • Females aged 18 to 72 years • Diagnosis of invasive breast cancer (stage I‐III) within 2 years of enrolment • Post surgery and no surgery planned for at least the next 6 months • Fully completed adjuvant therapy (radiotherapy and/or chemotherapy) not including hormonal therapy • No previous malignancy • Willing to be randomised • Willing to maintain contact with investigators over 6 months Exclusion criteria: • Inability to participate in PA because of severe disability (e.g. severe arthritic conditions) • Psychiatric illness • Vulnerable individuals, such as pregnant women or any other patients for whom PA was not approved by their oncologist owing to the presence of 1 or more contraindications to exercise for patients with cancer |
| Interventions |
|
| Outcomes | Primary outcome:
Secondary outcomes:
|
| Notes | Country of trial: UK https://clinicaltrials.gov/ct2/show/NCT02408107 Dr. Ian Lahart; I.Lahart@wlv.ac.uk |
Lohrisch 2011.
| Methods | Study design: RCT Number randomised: 22; 11 to exercise intervention, 11 to control Study start: not reported; study completion: not reported Length of intervention: 48 weeks |
| Participants | Eligible women with postmenopausal early breast cancer had arthralgias/myalgias (A/M) related to adjuvant anastrozole. Among 20 evaluated participants: • Baseline median age was 62. • BMI was 26 kg/m² in Exercise and Control arms. • Median number of arthralgia/myalgia sites was 5, with a median worst score of 2 (CTC version 2 criteria). |
| Interventions | Exercise participants exercised 3 times weekly for 48 weeks: for the first 12 weeks in a supervised setting; for the second 12 weeks, supervised once weekly and independently twice weekly; for the last 24 weeks, independently via aerobic and resistance programmes tailored to their fitness. |
| Outcomes | Primary outcome:
Secondary outcomes:
|
| Notes | Study closed owing to poor accrual after 3 years, with 22 (11 exercise and 11 exercise) of the planned 72 participants enrolled at 2 sites among 98 screened. Only conference abstract is available. |
Luu 2014.
| Methods | Study design: RCT Number randomised: 38; 24 to a yoga intervention, 14 to control Study start: not reported; study completion: not reported Length of intervention: 12 weeks |
| Participants | "Urban underserved breast cancer survivors" |
| Interventions | Participants were randomised to the treatment group (1‐hour Hatha yoga classes) or the wait‐list control group. Frequency of yoga classes per week is unclear. |
| Outcomes | Outcomes:
|
| Notes | Only conference abstract is available. |
A/M: arthralgia/myalgia.
BMD: bone mineral density.
BMI: body mass index.
CTC: common toxicity criteria.
FACT‐B: Functional Assessment of Cancer Therapy ‐ Breast.
HDL‐C: high‐density lipoprotein cholesterol.
HOMA: homeostatic model assessment.
HRQoL: health‐related quality of life.
IPAQ: International Physical Activity Questionnaire.
LDL‐C: low‐density lipoprotein cholesterol.
PA: physical activity.
RCT: randomised controlled trial.
SD: standard deviation.
SF‐36: Short Form‐36.
Characteristics of ongoing studies [ordered by study ID]
Deli‐Conwright 2014.
| Trial name or title | Exercise Program for Early Breast Cancer Survivors |
| Methods | Accrual: not reported
Accrual target: 100 breast cancer survivors Multi‐centre/single‐centre: single centre, but participants will be encouraged in a home‐based exercise session over 30 to 45 minutes once weekly Phase of trial: not reported Country where trial is being conducted: USA (Los Angeles, CA) Any intended follow‐up details: 12 weeks Stated study design: RCT, efficacy study |
| Participants | Inclusion criteria: • Newly diagnosed (I‐III) first primary invasive breast cancer • Underwent lumpectomy or mastectomy • Completed neoadjuvant/adjuvant chemotherapy and able to initiate Exercise programme (if randomised to that arm) within 12 weeks of therapy completion • Body mass index (BMI) > 25 kg/m² or body fat > 30% (as determined by Dr. Dieli‐Conwright at baseline visit) • Currently participate in less than 60 minutes of physical activity per week • May use adjuvant endocrine therapy if use will be continued for duration of study period • Non‐smoker (i.e. not smoking during previous 12 months) • Willing to travel to the exercise facility and USC • Able to provide physician clearance to participate in exercise programme • Women of all racial and ethnic backgrounds to be included in the study enrolment process Exclusion criteria: • History of chronic disease including diabetes, uncontrolled hypertension, or thyroid disease • Weight reduction ≥ 10% in the past 6 months • Diagnosis of human epidermal growth factor receptor 2 (HER2)‐positive tumour (exclusion due to patient use of Herceptin medication for 1 year following chemotherapy) • Metastatic disease • Planned reconstructive surgery with flap repair during trial and follow‐up period • Cardiovascular, respiratory, or musculoskeletal disease or joint problems that preclude moderate physical activity |
| Interventions | ARM 1:
ARM 2:
|
| Outcomes | Primary outcome:
Secondary outcomes:
|
| Starting date | Start date: May 2012 Estimated completion date: May 2017 |
| Contact information | Christina Dieli‐Conwright, PhD; 323‐442‐2905 Email: cdieli@usc.edu |
| Notes | Trial registration link: https://clinicaltrials.gov/show/NCT01140282
Sponsor of the trial: University of Southern California, National Cancer Institute This study is still recruiting participants. Intention‐to‐treat analysis: not reported Funding considerations: not funded by Pharma or otherwise |
Galiano‐Castillo 2013.
| Trial name or title | Telehealth System to Improve Quality of Life in Breast Cancer Survivors |
| Methods | Accrual: 72
Accrual target: 80 breast cancer survivors Multi‐centre/single‐centre: not reported but most likely home‐based (paper or registry does not explicitly say this) Phase of trial: not reported Country where trial is being conducted: Spain Any intended follow‐up details: 8 weeks Stated study design: RCT, efficacy study |
| Participants | Inclusion criteria: • 18 to 65 years of age • Female • Diagnosis of stage I, II, or IIIA breast cancer • Medical clearance for participation • Without chronic disease or orthopaedic disease that would interfere with ability to participate in a physical activity programme • Access to Internet • Basic ability to use the computer or living with a relative who has this ability • Completion of adjuvant therapy except for hormone therapy • No history of cancer recurrence • Interest in improving lifestyle: fitness/stress level • Signed informed consent Exclusion criteria: • Not reported |
| Interventions | ARM 1:
ARM 2:
|
| Outcomes | Primary outcome:
Secondary outcomes:
|
| Starting date | Start date: March 2012 Estimated completion date: July 2014 |
| Contact information | Manuel Arroyo‐Morales Email: marroyo@ugr.es |
| Notes | Trial registration link: https://clinicaltrials.gov/ct2/show/NCT01801527 Sponsor of the trial: Universidad de Granada and Carlos III Health Institute Intention‐to‐treat analysis: not reported Funding considerations: not funded by Pharma or otherwise |
IRCT2014042117379N1.
| Trial name or title | Comparing Self‐Efficacy, Outcome Expectations for Promoting the Physical Activity of Women With Breast Cancer in Two Groups With and Without Educational Program |
| Methods | Study design: RCT Number expected to be randomised: 70 Study start: September 2014; estimated stop date: November 2015 Length of intervention: 8 weeks |
| Participants | 50 malignant neoplasms of breast cancer Inclusion criteria: • Final diagnosis of breast cancer by a physician • Individual consent and spousal consent if married • Physician’s written consent to participation in the educational programme • Ability to read and write Exclusion criteria: • Therapist’s prescription for a ban on attending sessions • Lack of desire to participate in the study • Absence for more than 1 session during educational sessions • Cognitive disorder diagnosed during the educational intervention Age: not reported |
| Interventions | Intervention 1: • The first session is devoted to identifying need for patient education in the experimental group. Participants then receive education during at least 4 90‐minute sessions with respect to the barriers to self‐efficacy in physical activity, energy management, stress management, lymphoedema prevention, and other topics mentioned in the group. Training sessions are presented in PowerPoint by relevant experts on each topic. • Educational activities are intended for promotion of self‐efficacy, brainstorming strategies, verbal persuasion, successor experience, and framing questions in the group. Usual care: • No special arrangement is made for the control group, except for normal medical care. |
| Outcomes | Primary outcomes:
Seconday outcome:
|
| Starting date | 20 March 2014 |
| Contact information | Rahele Solymani Rahelesolymani@hlth.mui.ac.ir; raheel_s59@yahoo.com |
| Notes | Country of trial: Iran, Islamic Republic of http://apps.who.int/trialsearch/Trial2.aspx?TrialID=IRCT2014042117379N1 |
KIlbreath 2011.
| Trial name or title | Exercise to Prevent Osteoporosis as a Consequence of Hormone Treatment in Post Menopausal Women Treated for Breast Cancer |
| Methods | Accrual: not reported
Accrual target: 60 Multi‐centre/single‐centre: multi‐centre Phase of trial: not reported Country where trial is being conducted: Australia Any intended follow‐up details: no follow‐up Stated study design: RCT, blinded |
| Participants | Inclusion criteria • Postmenopausal • Above 18 years of age • Mmenses history and/or surgery • Stage I‐III breast cancer • Oestrogen receptor and/or progesterone receptor positive breast cancer • Commenced taking aromatase inhibitor within 10 weeks • Eastern Collaborative Oncology Group performance status ≤ 2 (Oken et al, 1982) • Sedentary. Exclusion criteria • Any clinical or radiological evidence of distant spread of disease • Any HRT in the past 12 months • Taken bisphosphonates in the past 6 months • Prior treatment with continuous systemic glucocorticoids in the past 6 months • Current treatment with any drugs known to affect the skeleton (e.g. calcitonin, calcitriol, mithramycin, gallium nitrate) • History of diseases that influence bone metabolism, such as Paget's disease or ongoing thyroid toxicosis • Previous or concomitant malignancy (apart from breast cancer) in the past 5 years except adequately treated basal or squamous cell carcinoma of the skin or in situ carcinoma of the cervix |
| Interventions | ARM 1:
ARM 2:
|
| Outcomes | Primary outcome:
Secondary outcomes:
|
| Starting date | Start date: May 2008 Estimated completion date: not reported |
| Contact information | Prof Sharon Kilbreath Email: sharon.kilbreath@sydney.edu.au |
| Notes | Trial registration link: https://www.anzctr.org.au/Trial/Registration/TrialReview.aspx?id=82762 Sponsor of the trial: Cancer Australia Trial authors were contacted and we were informed by the authors that the study had been completed and they were preparing for publication. Intention‐to‐treat analysis: not reported Funding considerations: not funded by Pharma or otherwise |
NCT02057536.
| Trial name or title | The Effect of an Exercise Program in Breast Cancer Patients With Joint Pain While Taking Aromatase Inhibitors |
| Methods | Study design: RCT Number expected to be randomised: 30 Study start: January 2014; estimated stop date: January 2015 Length of intervention: 8 weeks |
| Participants | Stage: I‐III Time since cancer diagnosis: not specified Inclusion criteria: • Women over age 40 with histological evidence of hormone receptor positive breast cancer • Postmenopausal • Adjuvant AI therapy • Significant joint discomfort/stiffness when attempting activities of daily living, which began or significantly increased after initiation of AI therapy • Currently not in an active directed exercise programme (> 60 minutes 2×/week) • Age: 40 years or older Ethnicity: not reported |
| Interventions | 8‐Week directed exercise programme |
| Outcomes | Primary objective:
|
| Starting date | January 2014 |
| Contact information | Christiana Care/Helen F. Graham Cancer Center, Newark, DE, USA 19713 |
| Notes | Country of trial: USA https://ClinicalTrials.gov/show/NCT02057536 |
NCT02235051.
| Trial name or title | Exercise Intervention in Preventing Breast Cancer Recurrence in Postmenopausal Breast Cancer Survivors |
| Methods | Study design: RCT Number expected to be randomised: 50 Study start: May 2015; estimated stop date: November 2016 Length of intervention: 16 weeks |
| Participants | Stage: I‐IIIA Time since cancer diagnosis: within first 3 years post treatment Inclusion criteria: • Women with diagnosis of first primary invasive oestrogen receptor (ER) positive (+) breast cancer (stage I‐IIIA) within first 3 years post treatment • Postmenopausal women • Women of childbearing potential and men must agree to use adequate contraception (hormonal or barrier method of birth control or abstinence) before study entry and for 6 months following duration of study participation; should a woman become pregnant or suspect that she is pregnant while participating in the trial, she should inform her treating physician immediately • Any body mass index (BMI) • Sedentary (has not participated in a regular exercise programme in the past 12 months) • Non‐smoker (not smoking during previous 12 months) • Willing and able to travel to the exercise facility • Diagnosis of first primary invasive ER+ breast cancer (stage I‐IIIA) • Has undergone a lumpectomy or mastectomy • Completed adjuvant chemotherapy and/or radiation within 3 years before study enrolment (when cytokine levels are predicted to be high) and able to initiate an exercise programme • May use adjuvant endocrine therapy if use will be continued for duration of study period • Must have the ability to understand and the willingness to sign a written informed consent Age: 56 years and older Ethnicity: not reported |
| Interventions | Patients participate in a supervised Curves exercise programme 3 days a week for 16 weeks. The circuit‐style workout consists of 14 exercises constructed with pneumatic or hydraulic resistance that target opposing muscle groups in a concentric‐only fashion. Each session at a Curves facility will include 2 complete circuits, which corresponds to exercising for approximately 30 minutes, followed by a standardised stretching routine. |
| Outcomes | Primary objectives:
Secondary objectives:
|
| Starting date | May 2015 |
| Contact information | Principal Investigator: Jessica Clague DeHart Contact: Jessica Clague DeHart; 800‐826‐4673; jclague@coh.org |
| Notes | Country of trial: USA https://ClinicalTrials.gov/show/NCT02235051 |
NCT02332876.
| Trial name or title | Physical Activity and Neuropsychological Outcomes in a Cancer Population |
| Methods | Study design: RCT Number expected to be randomised: 87 Study start: August 2014; estimated stop date: August 2017 Length of intervention: 12 weeks |
| Participants | Stage: I‐III Time since cancer diagnosis: less than 5 years Inclusion criteria: • Breast cancer survivors; diagnosis at stage I, II, or III less than 5 years ago • Not scheduled for or currently undergoing chemotherapy; sedentary, defined as engaging in less than 60 minutes of moderate‐to‐vigorous physical activity each week • Accessible geographically and by telephone • Access to the Internet • Endorse experience difficulties with thinking abilities • Participants on adjuvant therapy (e.g. tamoxifen, aromatase inhibitors) must be able and willing to remain on that treatment for the 3‐month intervention period to prevent confounding of biomarker concentrations by treatment. Age: 21 to 85 years Ethnicity: not reported |
| Interventions | 12‐Week individually tailored phone and email‐based exercise programme |
| Outcomes | Primary objective:
|
| Starting date | August 2014 |
| Contact information | Sheri Hartman, Assistant Professor, University of California, San Diego |
| Notes | Country of trial: USA https://ClinicalTrials.gov/show/NCT02332876 |
NCT02420249.
| Trial name or title | Qigong for Breast Cancer Survivors |
| Methods | Study design: RCT Number expected to be randomised: 60 Study start: March 2015; estimated stop date: May 2017 Length of intervention: 3 months |
| Participants | Stage: not reported Time since cancer diagnosis: not reported Inclusion criteria: • History of a breast malignancy at any stage • History of mastectomy or lumpectomy with or without adjuvant chemotherapy or radiotherapy • Completed conventional cancer treatment and medically stable • No known neurological deficits resulting from breast cancer treatment or other neurological disorders • Persistent lymphoedema defined as a circumference difference > 2 cm at any point between the surgical upper limb and the contralateral upper limb • Female aged 18 or above Age: 18 years or above Ethnicity: Chinese |
| Interventions | Participants assigned to the Qigong group will receive Qigong training. The Qigong training programme will be run for 3 months with 2 supervised 1‐hour sessions per week. Participants will learn the 18 Forms of Tai Chi Internal Qigong. Training sessions will be conducted by a qualified Qigong instructor from the Natural Health Qigong Association. |
| Outcomes | Primary objectives:
Secondary objective:
|
| Starting date | March 2015 |
| Contact information | Shirley SM Fong, PT, PhD; 852‐970‐90337; smfong@hku.hk |
| Notes | Country of trial: Hong Kong https://ClinicalTrials.gov/show/NCT02420249 |
NCT02433067.
| Trial name or title | Physical Activity Intervention on Myocardial Function in Patients With HER2 + Breast Cancer (CARDAPAC) |
| Methods | Study design: RCT Number expected to be randomised: 117 Study start: April 2015; estimated stop date: April 2017 Length of intervention: 12 weeks |
| Participants | Stage: not specified Time since cancer diagnosis: receiving adjuvant trastuzumab after undergoing surgery for breast cancer Inclusion criteria:
Ethnicity: not reported |
| Interventions | Participants will participate in a physical activity intervention 3 times per week for 3 months and an interval training programme on a cycle‐ergometer. |
| Outcomes | Primary objective:
Secondary objectives: To measure any changes in the following from baseline to 3 months and 6 months:
|
| Starting date | April 2015 |
| Contact information | Contact: Fabienne Mougin‐Guillaume, PhD; fabienne.mougin‐guillaume@univ‐fcomte.fr Principal Investigator: Nathalie Meneveau |
| Notes | Country of trial: France https://clinicaltrials.gov/show/NCT02433067 |
NCT02527889.
| Trial name or title | The Effect of Resistive Exercise on Forearm Blood Flow and Tissue Oxygenation Among Breast Cancer Survivors With or at Risk for Breast Cancer‐Related Lymphoedema (BCRL) |
| Methods | Study design: RCT Number expected to be randomised: 150 Study start: July 2015; estimated stop date: December 2016 Length of intervention: 8 weeks |
| Participants | Stage: not reported Time since cancer diagnosis: not reported Inclusion criteria: • Female breast cancer survivors • Remained disease free, as defined by unremarkable clinical examination within recent 6 months, with a clinical diagnosis of stable lymphoedema and without lymphoedema Age: 18 to 70 years Ethnicity: Chinese |
| Interventions | Participants assigned to the exercise group will receive a supervised resistive exercise programme, which includes 1‐hour physiotherapist‐supervised small group‐based exercise sessions twice a week for 8 weeks. Before resistive exercises, participants will perform warm‐up with movements of large joints and shoulder girdle for 15 minutes. Resistive exercises will focus on the major muscle groups in the upper body. Loading of resistive exercises will be prescribed and progressed according to individual capacity and will reach a level of moderate‐to‐high loading (6 to 12 repetition maximum); these will be followed by stretching exercises specific to the muscle groups trained after the session. Control group: no intervention; all 30 participants recruited |
| Outcomes | Primary objectives:
Secondary objectives: To measure changes at 20 weeks in:
|
| Starting date | July 2015 |
| Contact information | Rufina Lau; (852)27666718; Rufina.Lau@polyu.edu.hk |
| Notes | Country of trial: Hong Kong https://clinicaltrials.gov/ct2/show/NCT02527889 |
ALT: alanine aminotransferase.
AST: aspartate aminotransferase.
BMI: body mass index.
CES‐D: Centers for Epidemiological Studies—Depression Scale.
DASH: Disability of the Arm, Shoulder, and Hand questionnaire.
DEXA: dual‐energy X‐ray absorptiometry.
ELISA: enzyme‐linked immunosorbent assay.
FACT‐B: Functional Assessment of Cancer Therapy ‐ Breast.
HADS: Hospital Anxiety and Depression Scale.
HER2: human epidermal growth factor receptor 2.
LVEF: left ventricular ejection fraction.
PFS: Piper Fatigue Scale.
PSS: Penn Shoulder Scale.
RCT: randomised controlled trial.
RM: repetition maximum.
USC: University of Southern California.
WHO: World Health Organization.
Differences between protocol and review
Review authors did not perform planned analysis of effects of physical activity on blood biomarkers because we considered these outcomes to be beyond the scope of the current review, and because the prognostic value of blood biomarkers for breast cancer populations remains uncertain (Ballard‐Barbash 2012). We originally planned to conduct a subgroup analysis by treatment regimen (chemotherapy vs no chemotherapy). However, the numbers of trials conducted with patients who had not undergone chemotherapy were insufficient for performance of this analysis.
Contributions of authors
Drafting the protocol: IML, GSM, ANM, ARC.
Selecting studies: IML, GSM.
Extracting data from studies: IML, GSM.
Entering data into RevMan: IML.
Carrying out the analysis: IML, GSM, ANM.
Interpreting the analysis: IML, GSM, ANM.
Drafting the final review: IML, GSM, ANM, ARC.
Resolving disagreements: ANM, ARC.
Updating the review: IML, GSM.
Sources of support
Internal sources
No support provided, UK.
External sources
No support provided, UK.
Declarations of interest
None known.
New
References
References to studies included in this review
Banasik 2011 {published data only}
- Banasik J, Williams H, Haberman M, Blank SE, Bendel R. Effect of Iyengar yoga practice on fatigue and diurnal salivary cortisol concentration in breast cancer survivors. Journal of the American Academy of Nurse Practitioners 2011;23(3):135‐42. [DOI] [PubMed] [Google Scholar]
Baruth 2013 {published data only}
- Baruth M, Wilcox S, Der AC, Heiney S. Effects of home‐based walking on quality of life and fatigue outcomes in early stage breast cancer survivors: a 12‐week pilot study. Journal of Physical Activity and Health 2015;12 Suppl 1:S110‐S8. [DOI] [PubMed] [Google Scholar]
Basen‐Enquist 2006 {published data only}
- Basen‐Engquist K, Taylor CL, Rosenblum C, Smith MA, Shinn EH, Greisinger A, et al. Randomized pilot test of a lifestyle physical activity intervention for breast cancer survivors. Patient Education & Counseling 2006;64(1‐3):225‐34. [DOI] [PubMed] [Google Scholar]
Blank 2005 {published data only}
- Blank SE, Kittel J, Haberman MR. Active practice of Iyengar yoga as an intervention for breast cancer survivors. International Journal of Yoga Therapy 2003;13(1):51‐9. [Google Scholar]
Bower 2011 {published data only}
- Bower JE, Garet D, Sternlieb B, Ganz PA, Irwin MR, Olmstead R, et al. Yoga for persistent fatigue in breast cancer survivors: a randomized controlled trial. Cancer 2012;118(15):3766‐75. [DOI] [PMC free article] [PubMed] [Google Scholar]
- Bower JE, Greendale G, Crosswell AD, Garet D, Sternlieb B, Ganz PA, et al. Yoga reduces inflammatory signalling in fatigued breast cancer survivors: a randomized controlled trial. Psychoneuroendocrinology 2014;43:20‐9. [DOI] [PMC free article] [PubMed] [Google Scholar]
Cadmus 2009 {published data only}
- Cadmus LA, Salovey P, Yu H, Chung G, Kasl S, Irwin ML. Exercise and quality of life during and after treatment for breast cancer: results of two randomized controlled trials. Psycho‐Oncology 2009;18(4):343‐52. [DOI] [PMC free article] [PubMed] [Google Scholar]
- Cadmus‐Bertram L, Littman AJ, Ulrich CM, Stovall R, Ceballos RM, McGregor BA, et al. Predictors of adherence to a 26‐week Viniyoga intervention among post‐treatment breast cancer survivors. Journal of Alternative and Complementary Medicine 2013;19(9):751‐8. [DOI] [PMC free article] [PubMed] [Google Scholar]
- Irwin ML, Cadmus L, Alvarez‐Reeves M, O'Neil M, Mierzejewski E, Latka R, et al. Recruiting and retaining breast cancer survivors into a randomized controlled exercise trial: the Yale Exercise and Survivorship Study. Cancer 2008;112(11 Suppl):2593‐606. [DOI] [PMC free article] [PubMed] [Google Scholar]
- Irwin ML, Varma K, Alvarez‐Reeves M, Cadmus L, Wiley A, Chung GG, et al. Randomized controlled trial of aerobic exercise on insulin and insulin‐like growth factors in breast cancer survivors: the Yale Exercise and Survivorship Study. Cancer Epidemiology Biomarkers and Prevention 2009;18(1):306‐13. [DOI] [PMC free article] [PubMed] [Google Scholar]
- Irwin ML, varez‐Reeves M, Cadmus L, Mierzejewski E, Mayne ST, Yu H, et al. Exercise improves body fat, lean mass, and bone mass in breast cancer survivors. Obesity 2009;17(8):1534‐41. [DOI] [PMC free article] [PubMed] [Google Scholar]
- Jones SB, Thomas GA, Hesselsweet SD, Alvarez‐Reeves M, Yu H, Irwin ML. Effect of exercise on markers of inflammation in breast cancer survivors: the Yale Exercise and Survivorship Study. Cancer Prevention Research 2013;6(2):109‐18. [DOI] [PMC free article] [PubMed] [Google Scholar]
- Latka RN, varez‐Reeves M, Cadmus L, Irwin ML. Adherence to a randomized controlled trial of aerobic exercise in breast cancer survivors: the Yale Exercise and Survivorship Study. Journal of Cancer Survivorship 2009;3(3):148‐57. [DOI] [PubMed] [Google Scholar]
Cantarero‐Villanueva 2013 {published data only}
- Cantarero‐Villanueva I, Fernandez‐Lao C, Cuesta‐Vargas AI, Moral‐Avila R, Fernandez‐De‐Las‐Penas C, Arroyo‐Morales M. The effectiveness of a deep water aquatic exercise program in cancer‐related fatigue in breast cancer survivors: a randomized controlled trial. Archives of Physical Medicine and Rehabilitation 2013;94(2):221‐30. [DOI] [PubMed] [Google Scholar]
Carson 2009 {published data only}
- Carson JW, Carson KM, Porter LS, Keefe FJ, Seewaldt VL. Yoga of Awareness program for menopausal symptoms in breast cancer survivors: results from a randomized trial. Supportive Care in Cancer 2009;17(10):1301‐9. [DOI] [PubMed] [Google Scholar]
Cerulli 2014 {published data only}
- Cerulli C, Minganti C, Santis C, Tranchita E, Quaranta F, Parisi A. Therapeutic horseback riding in breast cancer survivors: a pilot study. Journal of Alternative & Complementary Medicine 2014;20(8):623‐9. [DOI] [PubMed] [Google Scholar]
Cormie 2014 {published data only}
- Cormie P, Pumpa K, Galvao DA, Turner E, Spry N, Saunders C, et al. Is it safe and efficacious for women with lymphedema secondary to breast cancer to lift heavy weights during exercise: a randomised controlled trial. Journal of Cancer Survivorship 2013;7(3):413‐24. [DOI] [PubMed] [Google Scholar]
Courneya 2003 {published data only}
- Courneya KS, Jones LW, Mackey JR, Fairey AS. Exercise beliefs of breast cancer survivors before and after participation in a randomized controlled trial. International Journal of Behavioral Medicine 2006;13(3):259‐64. [DOI] [PubMed] [Google Scholar]
- Courneya KS, Mackey JR, Bell GJ, Jones LW, Field CJ, Fairey AS. Randomized controlled trial of exercise training in postmenopausal breast cancer survivors: cardiopulmonary and quality of life outcomes. Journal of Clinical Oncology 2003;21(9):1660‐8. [DOI] [PubMed] [Google Scholar]
- Fairey AS, Courneya KS, Field CJ, Bell GJ, Jones LW, Mackey JR. Effects of exercise training on fasting insulin, insulin resistance, insulin‐like growth factors, and insulin‐like growth factor binding proteins in postmenopausal breast cancer survivors: a randomized controlled trial. Cancer Epidemiology, Biomarkers & Prevention 2003;12(8):721‐7. [PubMed] [Google Scholar]
- Fairey AS, Courneya KS, Field CJ, Bell GJ, Jones LW, Mackey JR. Randomized controlled trial of exercise and blood immune function in postmenopausal breast cancer survivors. Journal of Applied Physiology 2005;98(4):1534‐40. [DOI] [PubMed] [Google Scholar]
- Fairey AS, Courneya KS, Field CJ, Bell GJ, Jones LW, Martin BS, et al. Effect of exercise training on C‐reactive protein in postmenopausal breast cancer survivors: a randomized controlled trial. Brain, Behavior, & Immunity 2005;19(5):381‐8. [DOI] [PubMed] [Google Scholar]
Cuesta‐Vargas 2014 {published data only}
- Cuesta‐Vargas AI, Buchan J, Arroyo‐Morales M. A multimodal physiotherapy programme plus deep water running for improving cancer‐related fatigue and quality of life in breast cancer survivors. European Journal of Cancer Care 2014;23(1):15‐21. [DOI] [PubMed] [Google Scholar]
Daley 2007 {published data only}
- Daley AJ, Crank H, Mutrie N, Saxton JM, Coleman R. Determinants of adherence to exercise in women treated for breast cancer. European Journal of Oncology Nursing 2007;11(5):392‐9. [DOI] [PubMed] [Google Scholar]
- Daley AJ, Crank H, Mutrie N, Saxton JM, Coleman R. Patient recruitment into a randomised controlled trial of supervised exercise therapy in sedentary women treated for breast cancer. Contemporary Clinical Trials 2007;28(5):603‐13. [DOI] [PubMed] [Google Scholar]
- Daley AJ, Crank H, Saxton JM, Mutrie N, Coleman R, Roalfe A. Randomized trial of exercise therapy in women treated for breast cancer. Journal of Clinical Oncology 2007;25(13):1713‐21. [DOI] [PubMed] [Google Scholar]
- Daley AJ, Mutrie N, Crank H, Coleman R, Saxton J. Exercise therapy in women who have had breast cancer: design of the Sheffield women's exercise and well‐being project. Health Education Research 2004;19(6):686‐97. [DOI] [PubMed] [Google Scholar]
DeNysschen 2011 {published data only}
- DeNysschen CA, Brown JK, Cho MH, Dodd MJ. Nutritional symptom and body composition outcomes of aerobic exercise in women with breast cancer. Clinical Nursing Research 2011;20(1):29‐46. [DOI] [PubMed] [Google Scholar]
Do 2015 {published data only}
- Do J, Cho Y, Jeon J. Effects of a 4‐week multimodal rehabilitation program on quality of life, cardiopulmonary function, and fatigue in breast cancer patients. Journal of Breast Cancer 2015;18:87‐96. [DOI] [PMC free article] [PubMed] [Google Scholar]
Dolan 2016 {published data only}
- Dolan LB, Campbell K, Gelmon K, Neil‐Sztramko S, Holmes D, McKenzie DC. Interval versus continuous aerobic exercise training in breast cancer survivors ‐ a pilot RCT. Supportive Care in Cancer 2016;24(1):119‐27. [DOI] [PubMed] [Google Scholar]
Duijits 2012 {published data only}
- Duijts SF, Oldenburg HS, Beurden M, Aaronson NK. Cognitive behavioral therapy and physical exercise for climacteric symptoms in breast cancer patients experiencing treatment‐induced menopause: design of a multicenter trial. BMC Women's Health 2009;9:15. [DOI] [PMC free article] [PubMed] [Google Scholar]
- Duijts SFA, Beurden M, Oldenburg HSA, Hunter MS, Kieffer JM, Stuiver MM, et al. Efficacy of cognitive behavioral therapy and physical exercise in alleviating treatment‐induced menopausal symptoms in patients with breast cancer: results of a randomized, controlled, multicenter trial. Journal of Clinical Oncology 2012;30(33):4124‐33. [DOI] [PubMed] [Google Scholar]
- Mewes JC, Steuten LM, Duijts SF, Oldenburg HS, Beurden M, Stuiver MM, et al. Cost‐effectiveness of cognitive behavioral therapy and physical exercise for alleviating treatment‐induced menopausal symptoms in breast cancer patients. Journal of Cancer Survivorship 2015;9(1):126‐35. [DOI] [PubMed] [Google Scholar]
Ergun 2013 {published data only}
- Ergun M, Eyigor S, Karaca B, Kisim A, Uslu R. Effects of exercise on angiogenesis and apoptosis‐related molecules, quality of life, fatigue and depression in breast cancer patients. European Journal of Cancer Care 2013;22(5):626‐37. [DOI] [PubMed] [Google Scholar]
Fillion 2008 {published data only}
- Fillion L, Gagnon P, Leblond F, Gelinas C, Savard J, Dupuis R, et al. A brief intervention for fatigue management in breast cancer survivors. Cancer Nursing 2008;31(2):145‐59. [DOI] [PubMed] [Google Scholar]
Guinan 2013 {published data only}
- Guinan EM, Hussey JM, Walsh JM, Kennedy MJ, Connolly EM. The effect of aerobic exercise on the metabolic risk profile of breast cancer survivors 2‐6 months post chemotherapy. Journal of Clinical Oncology 2011;29(27):1983–92. [Google Scholar]
Hatchett 2013 {published data only}
- Hatchett A, Hallam JS, Ford MA. Evaluation of a social cognitive theory‐based email intervention designed to influence the physical activity of survivors of breast cancer. Psycho‐Oncology 2013;22:829–36. [DOI] [PubMed] [Google Scholar]
Heim 2007 {published data only}
- Heim ME, Malsburg ML, Niklas A. Randomized controlled trial of a structured training program in breast cancer patients with tumor‐related chronic fatigue. Onkologie 2007;30(8‐9):429‐34. [DOI] [PubMed] [Google Scholar]
Herrero 2006 {published data only}
- Gómez AM, Martinez C, Fiuza‐Luces C, Herrero F, Pérez M, Madero L, et al. Exercise training and cytokines in breast cancer survivors. International Journal of Sports Medicine 2011;32:461‐7. [DOI] [PubMed] [Google Scholar]
- Herrero F, San Juan AF, Fleck SJ, Balmer J, Pérez M, Cañete S, et al. Combined aerobic and resistance training in breast cancer survivors: a randomized, controlled pilot trial. International Journal of Sports Medicine 2006;27(7):573‐80. [DOI] [PubMed] [Google Scholar]
Irwin 2015 {published data only}
- Irwin ML, Cartmel B, Gross CP, Ercolano E, Li F, Yao X, et al. Randomized exercise trial of aromatase inhibitor‐induced arthralgia in breast cancer survivors. Journal of Clinical Oncology 2015;33(10):1104‐11. [DOI] [PMC free article] [PubMed] [Google Scholar]
Kaltsatou 2011 {published data only}
- Kaltsatou A, Mameletzi D, Douka S. Physical and psychological benefits of a 24‐week traditional dance program in breast cancer survivors. Journal of Bodywork and Movement Therapies 2011;15(2):162‐7. [DOI] [PubMed] [Google Scholar]
Kiecolt‐Glaser 2014 {published data only}
- Derry HM, Jaremka LM, Bennett JM, Peng J, Andridge R, Shapiro C, et al. Yoga and self‐reported cognitive problems in breast cancer survivors: a randomized controlled trial. Psycho‐Oncology 2015;24(8):958‐66. [DOI] [PMC free article] [PubMed] [Google Scholar]
- Kiecolt‐Glaser JK, Bennett JM, Andridge R, Peng J, Shapiro CL, Malarkey WB, et al. Yoga's impact on inflammation, mood, and fatigue in breast cancer survivors: a randomized controlled trial. Journal of Clinical Oncology 2014;32(10):1040‐9. [DOI] [PMC free article] [PubMed] [Google Scholar]
Kim 2015 {published data only}
- Kim SH, Cho YU, Kim SJ, Hong S, Han MS, Choi E. The effect on bone outcomes of adding exercise to supplements for osteopenic breast cancer survivors: a pilot randomized controlled trial. Cancer Nursing 2016;39(2):144‐52. [DOI] [PubMed] [Google Scholar]
Ligibel 2008 {published data only}
- Ligibel JA, Campbell N, Partridge A, Chen WY, Salinardi T, Chen H, et al. Impact of a mixed strength and endurance exercise intervention on insulin levels in breast cancer survivors. Journal of Clinical Oncology 2008;26(6):907‐12. [DOI] [PubMed] [Google Scholar]
- Ligibel JA, Giobbie‐Hurder A, Olenczuk D, Campbell N, Salinardi T, Winer EP, et al. Impact of a mixed strength and endurance exercise intervention on levels of adiponectin, high molecular weight adiponectin and leptin in breast cancer survivors. Cancer Causes & Control 2009;20(8):1523‐8. [DOI] [PubMed] [Google Scholar]
Littman 2012 {published data only}
- Littman AJ, Bertram LC, Ceballos R, Ulrich CM, Ramaprasad J, McGregor B, et al. Randomized controlled pilot trial of yoga in overweight and obese breast cancer survivors: effects on quality of life and anthropometric measures. Supportive Care in Cancer 2012;20(2):267‐77. [DOI] [PMC free article] [PubMed] [Google Scholar]
Loh 2014 {published data only}
- Loh SY, Lee SY, Murray L. The Kuala Lumpur Qigong trial for women in the cancer survivorship phase‐efficacy of a three‐arm RCT to improve QOL. Asian Pacific Journal of Cancer Prevention 2014;15(19):8127‐34. [DOI] [PubMed] [Google Scholar]
Loudon 2014 {published data only}
- Loudon A, Barnett T, Piller N, Immink MA, Visentin D, Williams AD. The effect of yoga on women with secondary arm lymphoedema from breast cancer treatment. BMC Complementary and Alternative Medicine 2012;12:66. [DOI] [PMC free article] [PubMed] [Google Scholar]
- Loudon A, Barnett T, Piller N, Immink MA, Visentin D, Williams AD. Yoga management of breast cancer‐related lymphoedema: a randomised controlled pilot‐trial. BMC Complementary and Alternative Medicine 2014;14:214. [DOI] [PMC free article] [PubMed] [Google Scholar]
Malicka 2011 {published data only}
- Malicka I, Stefanska M, Rudziak M, Jarmoluk P, Pawlowska K, Szczepanska‐Gieracha J, et al. The influence of Nordic walking exercise on upper extremity strength and the volume of lymphoedema in women following breast cancer treatment. Isokinetics and Exercise Science 2011;19(4):295‐304. [Google Scholar]
Martin 2013 {published data only}
- Martin E, Battaglini C, Groff D, Naumann F. Improving muscular endurance with the MVe Fitness Chair™ in breast cancer survivors: a feasibility and efficacy study. Journal of Science & Medicine in Sport 2013;16(4):372‐6. [DOI] [PubMed] [Google Scholar]
Matthews 2007 {published data only}
- Matthews CE, Wilcox S, Hanby CL, Ananian C, Heiney SP, Gebretsadik T, et al. Evaluation of a 12‐week home‐based walking intervention for breast cancer survivors. Supportive Care in Cancer 2007;15(2):203‐11. [DOI] [PubMed] [Google Scholar]
McKenzie 2003 {published data only}
- McKenzie DC, Kalda AL. Effect of upper extremity exercise on secondary lymphedema in breast cancer patients: a pilot study. Journal of Clinical Oncology 2003;21(3):463‐6. [DOI] [PubMed] [Google Scholar]
Mehnert 2011 {published data only}
- Mehnert A, Veers S, Howaldt D, Braumann KM, Koch U, Schulz KH. Effects of a physical exercise rehabilitation group program on anxiety, depression, body image, and health‐related quality of life among breast cancer patients. Onkologie 2011;34(5):248‐53. [DOI] [PubMed] [Google Scholar]
Milne 2008 {published data only}
- Milne HM, Wallman KE, Gordon S, Courneya KS. Effects of a combined aerobic and resistance exercise program in breast cancer survivors: a randomized controlled trial. Breast Cancer Research and Treatment 2008;108(2):279‐88. [DOI] [PubMed] [Google Scholar]
- Milne HM, Wallman KE, Gordon S, Courneya KS. Impact of a combined resistance and aerobic exercise program on motivational variables in breast cancer survivors: a randomized controlled trial. Annals of Behavioral Medicine 2008;36(2):158‐66. [DOI] [PubMed] [Google Scholar]
Murtezani 2014 {published data only}
- Murtezani A, Ibraimi Z, Bakalli A, Krasniqi S, Disha ED, Kurtishi I. The effect of aerobic exercise on quality of life among breast cancer survivors: a randomized controlled trial. Journal of Cancer Research and Therapeutics 2014;10(3):658‐64. [DOI] [PubMed] [Google Scholar]
Musanti 2012 {published data only}
- Musanti R. A study of exercise modality and physical self‐esteem in breast cancer survivors. Medicine & Science in Sports & Exercise 2012;44(2):352‐61. [DOI] [PubMed] [Google Scholar]
Mustian 2004 {published data only}
- Janelsins MC, Davis PG, Wideman L, Katula JA, Sprod LK, Peppone LJ, et al. Effects of Tai Chi Chuan on insulin and cytokine levels in a randomized controlled pilot study on breast cancer survivors. Clinical Breast Cancer 2011;11(3):161‐70. [DOI] [PMC free article] [PubMed] [Google Scholar]
- Mustian KM, Katula JA, Gill DL, Roscoe JA, Lang D, Murphy K. Tai Chi Chuan, health‐related quality of life and self‐esteem: a randomized trial with breast cancer survivors. Supportive Care in Cancer 2004;12(12):871‐6. [DOI] [PubMed] [Google Scholar]
- Mustian KM, Katula JA, Zhao H. A pilot study to assess the influence of tai chi chuan on functional capacity among breast cancer survivors. Journal of Supportive Oncology 2006;4(3):139‐45. [PubMed] [Google Scholar]
- Peppone LJ, Mustian K, Rosier RN, Piazza KM, Hicks DG, Palesh OG, et al. The effect of tai chi chuan on bone remodeling and cytokines among breast cancer survivors: a feasibility trial. Journal of Clinical Oncology 2009;27(15):9610. [Google Scholar]
- Peppone LJ, Mustian KM, Janelsins MC, Palesh OG, Rosier RN, Piazza KM, et al. Effects of a structured weight‐bearing exercise program on bone metabolism among breast cancer survivors: a feasibility trial. Clinical Breast Cancer 2010;10:224‐9. [DOI] [PMC free article] [PubMed] [Google Scholar]
- Sprod LK, Janelsins MC, Palesh OG, Carroll JK, Heckler CE, Peppone LJ, et al. Health‐related quality of life and biomarkers in breast cancer survivors participating in tai chi chuan. Journal of Cancer Survivorship 2012;6(2):146‐54. [DOI] [PMC free article] [PubMed] [Google Scholar]
Naumann 2012 {published data only}
- Naumann F, Martin E, Philpott M, Smith C, Groff D, Battaglini C. Can counselling add value to an exercise intervention for improving quality of life in breast cancer survivors? A feasibility study. Journal of Supportive Oncology 2012;10(5):188‐94. [DOI] [PubMed] [Google Scholar]
Nieman 1995 {published data only}
- Nieman DC, Cook VD, Henson DA, Suttles J, Rejeski WJ, Ribisl PM, et al. Moderate exercise training and natural killer cell cytotoxic activity in breast cancer patients. International Journal of Sports Medicine 1995;16(5):334‐7. [DOI] [PubMed] [Google Scholar]
Nikander 2007 {published data only}
- Nikander R, Sievänen H, Ojala K, Oivanen T, Kellokumpu‐Lehtinen P, Saarto T. Effect of a vigorous aerobic regimen on physical performance in breast cancer patients ‐ a randomized controlled pilot trial. Acta Oncologica 2007;46(2):181‐6. [DOI] [PubMed] [Google Scholar]
Payne 2008 {published data only}
- Payne JK, Held J, Thorpe J, Shaw H. Effect of exercise on biomarkers, fatigue, sleep disturbances, and depressive symptoms in older women with breast cancer receiving hormonal therapy. Oncology Nursing Forum 2008;35(4):635‐42. [DOI] [PubMed] [Google Scholar]
Peppone 2015 {published data only}
- Peppone LJ, Janelsins MC, Kamen C, Mohile SG, Sprod LK, Gewandter JS, et al. The effect of YOCAS© yoga for musculoskeletal symptoms among breast cancer survivors on hormonal therapy. Breast Cancer Research and Treatment 2015;150(3):597‐604. [DOI] [PMC free article] [PubMed] [Google Scholar]
Pinto 2003 {published data only}
- Pinto BM, Clark MM, Maruyama NC, Feder SI. Psychological and fitness changes associated with exercise participation among women with breast cancer. Psycho‐Oncology 2003;12(2):118‐26. [DOI] [PubMed] [Google Scholar]
Pinto 2005 {published data only}
- Pinto BM, Frierson GM, Rabin C, Trunzo JJ, Marcus BH. Home‐based physical activity intervention for breast cancer patients. Journal of Clinical Oncology 2005;23(15):3577‐87. [DOI] [PubMed] [Google Scholar]
- Pinto BM, Rabin C, Dunsiger S. Home‐based exercise among cancer survivors: adherence and its predictors. Psycho‐Oncology 2009;18(4):369‐76. [DOI] [PMC free article] [PubMed] [Google Scholar]
- Pinto BM, Rabin C, Papandonatos GD, Frierson GM, Trunzo JJ, Marcus BH. Maintenance of effects of a home‐based physical activity program among breast cancer survivors. Supportive Care in Cancer 2008;16(11):1279‐89. [DOI] [PMC free article] [PubMed] [Google Scholar]
- Pinto BM, Trunzo JJ, Rabin C, Cady B, Fenton MA, Herman A, et al. Recruitment strategies for a home‐based physical activity intervention for breast cancer patients. Journal of Clinical Psychology in Medical Settings 2004;11(3):171‐8. [Google Scholar]
- Rabin C, Pinto BM, Frierson G. Mediators of a randomized controlled physical activity intervention for breast cancer survivors. Journal Sport Exercise Psychology 2006;28:269‐84. [Google Scholar]
Pinto 2015 {published data only}
- Pinto B, Stein K, Dunsiger S. Peer mentorship to promote physical activity among cancer survivors: effects on quality of life. Psycho‐Oncology 2015;24:1295‐302. [DOI] [PMC free article] [PubMed] [Google Scholar]
- Pinto BM, Stein K, Dunsiger S. Peers promoting physical activity among breast cancer survivors: a randomized controlled trial. Health Psychology 2015;34(5):463‐72. [DOI] [PMC free article] [PubMed] [Google Scholar]
Portela 2008 {published data only}
- Portela A, Santaella C, Gómez C, Burch A. Feasibility of an exercise program for Puerto Rican women who are breast cancer survivors. Rehabilitation Oncology 2008;2(26):20‐31. [DOI] [PMC free article] [PubMed] [Google Scholar]
Rahnama 2010 {published data only}
- Nuri R, Kordi MR, Moghaddasi M, Rahnama N, Damirchi A, Rahmani‐Nia F, et al. Effect of combination exercise training on metabolic syndrome parameters in postmenopausal women with breast cancer. Journal of Cancer Research and Therapeutics 2012;8(2):238‐42. [DOI] [PubMed] [Google Scholar]
- Rahnama N, Nouri R, Rahmaninia F, Damirchi A, Emami H. The effects of exercise training on maximum aerobic capacity, resting heart rate, blood pressure and anthropometric variables of postmenopausal women with breast cancer. Journal of Research in Medical Sciences 2010;15(2):78‐83. [PMC free article] [PubMed] [Google Scholar]
Rogers 2009 {published data only}
- Rogers LQ, Hopkins‐Price P, Vicari S, Markwell S, Pamenter R, Courneya KS, et al. Physical activity and health outcomes three months after completing a physical activity behavior change intervention: persistent and delayed effects. Cancer Epidemiology Biomarkers and Prevention 2009;8(5):1410‐8. [DOI] [PubMed] [Google Scholar]
- Rogers LQ, Hopkins‐Price P, Vicari S, Pamenter R, Courneya KS, Markwell S, et al. A randomized trial to increase physical activity in breast cancer survivors. Medicine and Science in Sports and Exercise 2009;41(4):935‐46. [DOI] [PubMed] [Google Scholar]
- Rogers LQ, Markwell S, Hopkins‐Price P, Vicari S, Courneya KS, Hoelzer K, et al. Reduced barriers mediated physical activity maintenance among breast cancer survivors. Journal of Sport & Exercise Psychology 2011;33(2):235‐54. [DOI] [PMC free article] [PubMed] [Google Scholar]
- Rogers LQ, McAuley E, Anton PM, Courneya KS, Vicari S, Hopkins‐Price P, et al. Better exercise adherence after treatment for cancer (BEAT Cancer) study: rationale, design, and methods. Contemporary Clinical Trials 2012;33.(1):124‐37. [DOI] [PMC free article] [PubMed] [Google Scholar]
Rogers 2013 {published data only}
- Rogers LQ, Fogleman A, Trammell R, Hopkins‐Price P, Vicari S, Rao K, et al. Effects of a physical activity behavior change intervention on inflammation and related health outcomes in breast cancer survivors: pilot randomized trial. Integrative Cancer Therapies 2013;12(4):323‐35. [DOI] [PMC free article] [PubMed] [Google Scholar]
Rogers 2014 {published data only}
- Rogers LQ, Fogleman A, Trammell R, Hopkins‐Price P, Spenner A, Vicari S, et al. Inflammation and psychosocial factors mediate exercise effects on sleep quality in breast cancer survivors: pilot randomized controlled trial. Psycho‐Oncology 2015;24(3):302‐10. [DOI] [PMC free article] [PubMed] [Google Scholar]
- Rogers LQ, Vicari S, Trammell R, Hopkins‐Price P, Fogleman A, Spenner A, et al. Biobehavioral factors mediate exercise effects on fatigue in breast cancer survivors. Medicine & Science in Sports & Exercise 2014;46(6):1077‐88. [DOI] [PMC free article] [PubMed] [Google Scholar]
Rogers 2015 {published data only}
- Rogers LQ, Courneya KS, Anton PM, Hopkins‐Price P, Verhulst S, Vicari SK, et al. Effects of the BEAT Cancer physical activity behavior change intervention on physical activity, aerobic fitness, and quality of life in breast cancer survivors: a multicenter randomized controlled trial. Breast Cancer Research and Treatment 2015;149(1):109‐19. [DOI] [PMC free article] [PubMed] [Google Scholar]
Saarto 2012 {published data only}
- Luoma ML, Hakamies‐Blomqvist L, Blomqvist C, Nikander R, Gustavsson‐Lilius M, Saarto T. Experiences of breast cancer survivors participating in a tailored exercise intervention ‐ a qualitative study. Anticancer Research 2014;34(3):1193‐9. [PubMed] [Google Scholar]
- Nikander R, Sievanen H, Ojala K, Kellokumpu‐Lehtinen PL, Palva T, Blomqvist C, et al. Effect of exercise on bone structural traits, physical performance and body composition in breast cancer patients ‐ a 12‐month RCT. Journal of Musculoskeletal Neuronal Interactions 2012;12(3):127‐35. [PubMed] [Google Scholar]
- Saarto T, Penttinen HM, Sievanen H, Kellokumpu‐Lehtinen PL, Hakamies‐Blomqvist L, Nikander R, et al. Effectiveness of a 12‐month exercise program on physical performance and quality of life of breast cancer survivors. Anticancer Research 2012;32(9):3875‐84. [PubMed] [Google Scholar]
- Saarto T, Sievanen H, Kellokumpu‐Lehtinen P, Nikander R, Vehmanen L, Huovinen R, et al. Effect of supervised and home exercise training on bone mineral density among breast cancer patients. A 12‐month randomised controlled trial. Osteoporosis International 2012;23:1601–12. [DOI] [PubMed] [Google Scholar]
Schmitz 2005 {published data only}
- Ahmed RL, Thomas W, Yee D, Schmitz KH. Randomized controlled trial of weight training and lymphedema in breast cancer survivors. Journal of Clinical Oncology 2006;24(18):2765‐72. [DOI] [PubMed] [Google Scholar]
- Ohira T, Schmitz KH, Ahmed RL, Yee D. Effects of weight training on quality of life in recent breast cancer survivors: the Weight Training for Breast Cancer Survivors (WTBS) study. Cancer 2006;106(9):2076‐83. [DOI] [PubMed] [Google Scholar]
- Schmitz KH, Ahmed RL, Hannan PJ, Yee D. Safety and efficacy of weight training in recent breast cancer survivors to alter body composition, insulin, and insulin‐like growth factor axis proteins. Cancer Epidemiology Biomarkers & Prevention 2005;14(7):1672‐80. [DOI] [PubMed] [Google Scholar]
Schmitz 2009 {published data only}
- Brown JC, Schmitz KH. Weight lifting and physical function among survivors of breast cancer: a post hoc analysis of a randomized controlled trial. Journal of Clinical Oncology 2015;33(19):2184‐9. [DOI] [PMC free article] [PubMed] [Google Scholar]
- Brown JC, Troxel AB, Schmitz KH. Safety of weightlifting among women with or at risk for breast cancer‐related lymphedema: musculoskeletal injuries and health care use in a weightlifting rehabilitation trial. Oncologist 2012;17(8):1120‐8. [DOI] [PMC free article] [PubMed] [Google Scholar]
- Hayes SC, Speck RM, Reimet E, Stark A, Schmitz KH. Does the effect of weight lifting on lymphedema following breast cancer differ by diagnostic method: results from a randomized controlled trial. Breast Cancer Research and Treatment 2011;130(1):227‐34. [DOI] [PubMed] [Google Scholar]
- Schmitz KH, Ahmed RL, Troxel A, Cheville A, Smith R, Lewis‐Grant L, et al. Weight lifting in women with breast‐cancer‐related lymphedema. New England Journal of Medicine 2009;361(7):664‐73. [DOI] [PubMed] [Google Scholar]
- Schmitz KH, Ahmed RL, Troxel AB, Cheville A, Lewis‐Grant L, Smith R, et al. Weight lifting for women at risk for breast cancer‐related lymphedema: a randomized trial. JAMA 2010;304(24):2699‐705. [DOI] [PubMed] [Google Scholar]
- Schmitz KH, Troxel AB, Cheville A, Grant LL, Bryan CJ, Gross CR, et al. Physical Activity and Lymphedema (the PAL trial): assessing the safety of progressive strength training in breast cancer survivors. Contemporary Clinical Trials 2009;30(3):233‐45. [DOI] [PMC free article] [PubMed] [Google Scholar]
- Speck RM, Gross CR, Hormes JM, Ahmed RL, Lytle LA, Hwang WT, et al. Changes in the Body Image and Relationship Scale following a one‐year strength training trial for breast cancer survivors with or at risk for lymphedema. Breast Cancer Research and Treatment 2010;121:421‐30. [DOI] [PubMed] [Google Scholar]
- Winters‐Stone KM, Laudermilk M, Woo K, Brown JC, Schmitz KH. Influence of weight training on skeletal health of breast cancer survivors with or at risk for breast cancer‐related lymphedema. Journal of Cancer Survivorship: Research and Practice 2014;8(2):260‐8. [DOI] [PMC free article] [PubMed] [Google Scholar]
Segar 1998 {published data only}
- Segar ML, Katch VL, Roth RS, Garcia AW, Portner TI, Glickman SG, et al. The effect of aerobic exercise on self‐esteem and depressive and anxiety symptoms among breast cancer survivors. Oncology Nursing Forum 1998;25(1):107‐13. [PubMed] [Google Scholar]
Short 2014 {published data only}
- Short CE, James EL, Girgis A, D’Souza MI, Plotnikoff RC. Main outcomes of the Move More for Life Trial: a randomised controlled trial examining the effects of tailored‐print and targeted‐print materials for promoting physical activity among post‐treatment breast cancer survivors. Psycho‐Oncology 2014;24(7):771‐8. [DOI] [PubMed] [Google Scholar]
- Short CE, James EL, Girgis A, McElduff P, Plotnikoff RC. Move more for life: the protocol for a randomised efficacy trial of a tailored‐print physical activity intervention for post‐treatment breast cancer survivors. BMC Cancer 2012;12:172. [DOI] [PMC free article] [PubMed] [Google Scholar]
- Short CE, James EL, Plotnikoff RC. Theory‐ and evidence‐based development and process evaluation of the Move More for Life program: a tailored‐print intervention designed to promote physical activity among post‐treatment breast cancer survivors. International Journal of Behavioral Nutrition and Physical Activity 2013;10:124. [DOI] [PMC free article] [PubMed] [Google Scholar]
Taleghani 2012 {published data only}
- Taleghani F, Karimain J, Babazadeh S, Mokarian F, Tabatabaiyan M, Samimi MA, et al. The effect of combined aerobic and resistance exercises on quality of life of women surviving breast cancer. Iranian Journal of Nursing and Midwifery Research 2012;17(1):47‐51. [PMC free article] [PubMed] [Google Scholar]
Vallance 2007 {published data only}
- Vallance J, Plotnikoff RC, Karvinen KH, Mackey JR, Courneya KS. Understanding physical activity maintenance in breast cancer survivors. American Journal of Health Behavior 2010;34(2):225‐36. [DOI] [PubMed] [Google Scholar]
- Vallance JK, Courneya KS, Plotnikoff RC, Dinu I, MacKey JR. Maintenance of physical activity in breast cancer survivors after a randomized trial. Medicine and Science in Sports and Exercise 2008;40(1):173‐80. [DOI] [PubMed] [Google Scholar]
- Vallance JK, Courneya KS, Plotnikoff RC, Mackey JR. Analyzing theoretical mechanisms of physical activity behavior change in breast cancer survivors: results from the Activity Promotion (ACTION) trial. Annals of Behavioral Medicine 2008;35(2):150‐8. [DOI] [PubMed] [Google Scholar]
- Vallance JK, Courneya KS, Plotnikoff RC, Yasui Y, Mackey JR. Randomized controlled trial of the effects of print materials and step pedometers on physical activity and quality of life in breast cancer survivors. Journal of Clinical Oncology 2007;25(17):2352‐9. [DOI] [PubMed] [Google Scholar]
- Vallance JKH. Promoting physical activity in breast cancer survivors: a randomized controlled trial. Dissertation Abstracts International Section A: Humanities and Social Sciences [Internet] 2008;68(7):2877. [Google Scholar]
Waltman 2010 {published data only}
- McGuire R, Waltman N, Zimmerman L. Intervention components promoting adherence to strength training exercise in breast cancer survivors with bone loss. Western Journal of Nursing Research 2011;33(5):671‐89. [DOI] [PubMed] [Google Scholar]
- Ott C, Waltman N, Twiss J, Gross G, Lindsey A, Moore T. Predictors of adherence to strength training at six months in breast cancer survivors at risk for osteoporosis. Oncology Nursing Forum 2007;34(1):200‐1. [Google Scholar]
- Ott CD, Twiss JJ, Waltman NL, Gross GJ, Lindsey AM. Challenges of recruitment of breast cancer survivors to a randomized clinical trial for osteoporosis prevention. Cancer Nursing 2006;29(1):21‐33. [DOI] [PubMed] [Google Scholar]
- Twiss JJ, Waltman NL, Berg K, Ott CD, Gross GJ, Lindsey AM. An exercise intervention for breast cancer survivors with bone loss. Journal of Nursing Scholarship 2009;41(1):20‐7. [DOI] [PubMed] [Google Scholar]
- Waltman NL, Twiss JJ, Ott CD, Gross GJ, Lindsey AM, Moore TE, et al. The effect of weight training on bone mineral density and bone turnover in postmenopausal breast cancer survivors with bone loss: a 24‐month randomized controlled trial. Osteoporosis International 2010;21(8):1361‐9. [DOI] [PubMed] [Google Scholar]
Winters‐Stone 2011 {published data only}
- Dobek J, Winters‐Stone KM, Bennett JA, Nail L. Musculoskeletal changes after 1 year of exercise in older breast cancer survivors. Journal of Cancer Survivorship: Research and Practice 2014;8(2):304‐11. [DOI] [PubMed] [Google Scholar]
- Winters‐Stone KM, Dobek J, Bennett JA, Nail LM, Leo MC, Schwartz A. The effect of resistance training on muscle strength and physical function in older, postmenopausal breast cancer survivors: a randomized controlled trial. Journal of Cancer Survivorship 2012;6(2):189‐99. [DOI] [PMC free article] [PubMed] [Google Scholar]
- Winters‐Stone KM, Dobek J, Nail L, Bennett JA, Leo MC, Naik A, et al. Strength training stops bone loss and builds muscle in postmenopausal breast cancer survivors: a randomized, controlled trial. Breast Cancer Research and Treatment 2011;127(2):447‐56. [DOI] [PMC free article] [PubMed] [Google Scholar]
- Winters‐Stone KM, Dobek J, Nail LM, Bennett JA, Leo MC, Torgrimson‐Ojerio B, et al. Impact + resistance training improves bone health and body composition in prematurely menopausal breast cancer survivors: a randomized controlled trial. Osteoporosis International 2013;24(5):1637‐46. [DOI] [PMC free article] [PubMed] [Google Scholar]
- Winters‐Stone KM, Leo MC, Schwartz A. Exercise effects on hip bone mineral density in older, post‐menopausal breast cancer survivors are age dependent. Archives of Osteoporosis 2012;7(1‐2):301‐6. [DOI] [PMC free article] [PubMed] [Google Scholar]
References to studies excluded from this review
Anderson 2012 {published data only}
- Anderson RT, Kimmick GG, McCoy TP, Hopkins J, Levine E, Miller G, et al. A randomized trial of exercise on well‐being and function following breast cancer surgery: the RESTORE trial. Journal of Cancer Survivorship 2012;6(2):172‐81. [DOI] [PMC free article] [PubMed] [Google Scholar]
Benton 2014 {published data only}
- Benton MJ, Schlairet MC, Gibson DR. Change in quality of life among breast cancer survivors after resistance training: is there an effect of age?. Journal of Aging and Physical Activity 2014;22(2):178‐85. [DOI] [PubMed] [Google Scholar]
Bloom 2008 {published data only}
- Bloom JR, Stewart SL, D'Onofrio CN, Luce J, Banks PJ. Addressing the needs of young breast cancer survivors at the 5 year milestone: can a short‐term, low intensity intervention produce change?. Journal of Cancer Survivorship: Research and Practice 2008;2(3):190‐204. [DOI] [PubMed] [Google Scholar]
Buffart 2012 {published data only}
- Buffart L, Ross W, Chinapaw M, Brug J, Knol D, Korstjens I, et al. How does exercise improve cancer survivors' quality of life?. Journal of Science and Medicine in Sport 2012;15:S333‐S4. [Google Scholar]
Burnham 2002 {published data only}
- Burnham TR, Wilcox A. Effects of exercise on physiological and psychological variables in cancer survivors. Medicine & Science in Sports & Exercise 2002;34(12):1863‐7. [DOI] [PubMed] [Google Scholar]
Cadmus‐Bertram 2011 {published data only}
- Cadmus Bertram LA, Pierce JP, Patterson RE, Ojeda‐Fournier H, Newman VA, Parker BA. Training overweight/obese older women at high risk for breast cancer to use web‐based weight loss tools: the HELP pilot study. Journal of Clinical Oncology 2011;29(27):233. [Google Scholar]
Cantarero‐Villanueva 2012 {published data only}
- Cantarero‐Villanueva I, Fernandez‐Lao C, Fernandez‐de‐las‐Penas C, Lopez‐Barajas IB, Del‐Moral‐Avila R, la‐Llave‐Rincon AI, et al. Effectiveness of water physical therapy on pain, pressure pain sensitivity, and myofascial trigger points in breast cancer survivors: a randomized, controlled clinical trial. Pain Medicine (United States) 2012;13(11):1509‐19. [DOI] [PubMed] [Google Scholar]
Cantarero‐Villanueva 2012a {published data only}
- Cantarero‐Villanueva I, Fernandez‐Lao C, Moral‐Avila R, Fernandez‐de‐Las‐Penas C, Feriche‐Fernandez‐Castanys MB, Arroyo‐Morales M. Effectiveness of core stability exercises and recovery myofascial release massage on fatigue in breast cancer survivors: a randomized controlled clinical trial. Evidence‐Based Complementary and Alternative Medicine 2012;2012:1‐9. [DOI: 10.1155/2012/620619] [DOI] [PMC free article] [PubMed] [Google Scholar]
- Cantarero‐Villanueva I, Fernandez‐Lao C, Diaz‐Rodriguez L, Fernandez‐de‐las‐Penas C, Moral‐Avila R, Arroyo‐Morales M. A multimodal exercise program and multimedia support reduce cancer‐related fatigue in breast cancer survivors: a randomised controlled clinical trial. European Journal of Integrative Medicine 2011;3(3):e189‐e200. [Google Scholar]
Cantarero‐Villanueva 2013a {published data only}
- Cantarero‐Villanueva I, Fernández‐Lao C, Caro‐Morán E, Morillas‐Ruiz J, Galiano‐Castillo N, Díaz‐Rodríguez L, et al. Aquatic exercise in a chest‐high pool for hormone therapy‐induced arthralgia in breast cancer survivors: a pragmatic controlled trial. Clinical Rehabilitation 2013;27(2):123‐32. [DOI] [PubMed] [Google Scholar]
Carter 2012 {published data only}
- Carter CL, Onicescu G, Cartmell KB, Sterba KR, Tomsic J, Alberg AJ. The comparative effectiveness of a team‐based versus group‐based physical activity intervention for cancer survivors. Supportive Care in Cancer 2012;20(8):1699‐707. [DOI] [PubMed] [Google Scholar]
Casla 2015 {published data only}
- Casla S, Lopez‐Tarruella S, Jerez Y, Marquez‐Rodas I, Galvao DA, Newton RU, et al. Supervised physical exercise improves VO2max, quality of life, and health in early stage breast cancer patients: a randomized controlled trial. Breast Cancer Research and Treatment 2015;153(2):371‐82. [DOI] [PubMed] [Google Scholar]
Cheema 2006 {published data only}
- Cheema BSB, Gaul CA. Full‐body exercise training improves fitness and quality of life in survivors of breast cancer. Journal of Strength & Conditioning Research 2006;20(1):14‐21. [DOI] [PubMed] [Google Scholar]
Cho 2006 {published data only}
- Cho OH, Yoo YS, Kim NC. Efficacy of comprehensive group rehabilitation for women with early breast cancer in South Korea. Nursing & Health Sciences 2006;8(3):140‐6. [DOI] [PubMed] [Google Scholar]
Cohen 2010 {published data only}
- Cohen L, Chen Z, Arun B, Shao Z, Dryden M, Xu L, et al. External Qigong therapy for women with breast cancer prior to surgery. Integrative Cancer Therapies 2010;9(4):348‐53. [DOI] [PubMed] [Google Scholar]
Culos‐Reed 2006 {published data only}
- Culos‐Reed S, Carlson LE, Daroux LM, Hately‐Aldous S. A pilot study of yoga for breast cancer survivors: physical and psychological benefits. Psycho‐Oncology 2006;15(10):891‐7. [DOI] [PubMed] [Google Scholar]
Cunningham 1998 {published data only}
- Cunningham AJ, Edmonds CV, Jenkins GP, Pollack H, Lockwood GA, Warr D. A randomized controlled trial of the effects of group psychological therapy on survival in women with metastatic breast cancer. Psycho‐Oncology 1998;7(6):508‐17. [DOI] [PubMed] [Google Scholar]
D'Atillio 2007 {published data only}
- D'Attilio MG, Angelillo A, Fochitto M, Sorrentino P, Capelli G, Federico B, et al. Adapted physical activity for breast cancer patients. Can the quality of life be enhanced?. Igiene Moderna 2007;128(5):167‐78. [Google Scholar]
Damush 2006 {published data only}
- Damush TM, Perkins A, Miller K. The implementation of an oncologist referred, exercise self‐management program for older breast cancer survivors. Psycho‐Oncology 2006;15(10):884‐90. [DOI] [PubMed] [Google Scholar]
Danhauer 2009 {published data only}
- Danhauer SC, Mihalko SL, Russell GB, Campbell CR, Felder L, Daley K, et al. Restorative yoga for women with breast cancer: finding from a randomized pilot study. Psycho‐Oncology 2009;18(4):360‐8. [DOI] [PMC free article] [PubMed] [Google Scholar]
De Backer 2007 {published data only}
- Backer IC, Breda E, Vreugdenhil A, Nijziel MR, Kester AD, Schep G. High‐intensity strength training improves quality of life in cancer survivors. Acta Oncologica 2007;46(8):1143‐51. [DOI] [PubMed] [Google Scholar]
Demark 2006 {published data only}
- Demark WW, Clipp EC, Morey MC, Pieper CF, Sloane R, Snyder DC, et al. Lifestyle intervention development study to improve physical function in older adults with cancer: outcomes from project LEAD. Journal of Clinical Oncology 2006;24:3465‐73. [DOI] [PMC free article] [PubMed] [Google Scholar]
Dimeo 2008 {published data only}
- Dimeo F, Schwartz S, Wesel N, Voigt, Thiel E. Effects of an endurance and resistance exercise program on persistent cancer‐related fatigue after treatment. Annals of Oncology 2008;19(8):1495‐9. [DOI] [PubMed] [Google Scholar]
Djuric 2002 {published data only}
- Djuric Z, DiLaura NM, Jenkins I, Darga L, Jen CK, Mood D, et al. Combining weight‐loss counseling with the weight watchers plan for obese breast cancer survivors. Obesity Research 2002;10(7):657‐65. [DOI] [PubMed] [Google Scholar]
Eyigor 2010 {published data only}
- Eyigor S, Karapolat H, Yesil H, Uslu R, Durmaz B. Effects of pilates exercises on functional capacity, flexibility, fatigue, depression and quality of life in female breast cancer patients: a randomized controlled study. European Journal of Physical & Rehabilitation Medicine 2010;46(4):481‐7. [PubMed] [Google Scholar]
Fernandez‐Lao 2012 {published data only}
- Fernandez‐Lao C, Cantarero‐Villanueva I, Fernandez‐De‐Las‐Penas C, Moral‐Avila R, Castro‐Sanchez AM, Arroyo‐Morales M. Effectiveness of a multidimensional physical therapy program on pain, pressure hypersensitivity, and trigger points in breast cancer survivors: a randomized controlled clinical trial. Clinical Journal of Pain 2012;28(2):113‐21. [DOI] [PubMed] [Google Scholar]
Fernandez‐Lao 2013 {published data only}
- Fernandez‐Lao C, Cantarero‐Villanueva I, Ariza‐Garcia A, Courtney C, Fernandez‐De‐Las‐Penas C, Arroyo‐Morales M. Water‐ versus land‐based multimodal exercise program effects on body composition in breast cancer survivors: a controlled clinical trial. Supportive Care in Cancer 2013;21(2):521‐30. [DOI] [PubMed] [Google Scholar]
Fong 2014 {published data only}
- Fong SSM, Ng SSM, Luk WS, Chung JWY, Ho JSC, Ying M, et al. Effects of qigong exercise on upper limb lymphedema and blood flow in survivors of breast cancer: a pilot study. Integrative Cancer Therapies 2014;13(1):54‐61. [DOI] [PubMed] [Google Scholar]
Galantino 2013 {published data only}
- Galantino ML, Callens ML, Cardena GJ, Piela NL, Mao JJ. Tai chi for well‐being of breast cancer survivors with aromatase inhibitor‐associated arthralgias: a feasibility study. Alternative Therapies in Health and Medicine 2013;19(6):38‐44. [PubMed] [Google Scholar]
Gordon 2005 {published data only}
- Gordon LG, Battistutta D, Scuffham P, Tweeddale M, Newman B. The impact of rehabilitation support services on health‐related quality of life for women with breast cancer. Breast Cancer Research & Treatment 2005;93(3):217‐26. [DOI] [PubMed] [Google Scholar]
Hanna 2008 {published data only}
- Hanna LR, Avila PF, Meteer JD, Nicholas DR, Kaminsky LA. The effects of a comprehensive exercise program on physical function, fatigue, and mood in patients with various types of cancer. Oncology Nursing Forum 2008;35(3):461‐9. [Google Scholar]
Hayes 2013 {published data only}
- Hayes SC, Rye S, Disipio T, Yates P, Bashford J, Pyke C, et al. Exercise for health: a randomized, controlled trial evaluating the impact of a pragmatic, translational exercise intervention on the quality of life, function and treatment‐related side effects following breast cancer. Breast Cancer Research and Treatment 2013;137(1):175‐86. [DOI] [PubMed] [Google Scholar]
Headley 2004 {published data only}
- Headley JA, Ownby KK, John LD. The effect of seated exercise on fatigue and quality of life in women with advanced breast cancer. Oncology Nursing Forum 2004;31(5):977‐83. [DOI] [PubMed] [Google Scholar]
Hojan 2013 {published data only}
- Hojan K, Molinska‐Glura M, Milecki P. Physical activity and body composition, body physique, and quality of life in premenopausal breast cancer patients during endocrine therapy ‐ a feasibility study. Acta Oncologica (Stockholm, Sweden) 2013;52(2):319‐26. [DOI] [PubMed] [Google Scholar]
Hsiao‐Fang 2013 {published data only}
- Hsiao‐Fang H, Tsai‐Chung L, Liang‐Chih L, Chien‐Teng W, Ya‐Jung W. Effects of a walking program on fatigue and exercise capacity in post‐surgery breast cancer women [Chinese]. Journal of Nursing 2013;60(5):53‐63. [DOI] [PubMed] [Google Scholar]
Hsieh 2008 {published data only}
- Hsieh CC, Sprod LK, Hydock DS, Carter SD, Hayward R, Schneider CM. Effects of a supervised exercise intervention on recovery from treatment regimens in breast cancer survivors. Oncology Nursing Forum 2008;35(6):909‐15. [DOI] [PMC free article] [PubMed] [Google Scholar]
Hunt‐Shanks 2006 {published data only}
- Hunt‐Shanks TT, Blanchard CM, Baker F, Hann D, Roberts CS, McDonald J, et al. Exercise use as complementary therapy among breast and prostate cancer survivors receiving active treatment: examination of exercise intention. Integrative Cancer Therapies 2006;5(2):109‐16. [DOI] [PubMed] [Google Scholar]
Husebo 2014 {published data only}
- Husebo AM, Dyrstad SM, Mjaaland I, Soreide JA, Bru E. Effects of scheduled exercise on cancer‐related fatigue in women with early breast cancer. ScientificWorldJournal 2014;2014:271828. [DOI] [PMC free article] [PubMed] [Google Scholar]
Hutnick 2005 {published data only}
- Hutnick NA, Williams NI, Kraemer WJ, Orsega‐Smith E, Dixon RH, Bleznak AD, et al. Exercise and lymphocyte activation following chemotherapy for breast cancer. Medicine and Science in Sports and Exercise 2005;37(11):1827‐35. [DOI] [PubMed] [Google Scholar]
Ibfelt 2011 {published data only}
- Ibfelt E, Rottmann N, Kjaer T, Hoybye MT, Ross L, Frederiksen K. No change in health behavior, BMI or self‐rated health after a psychosocial cancer rehabilitation: results of a randomized trial. Acta Oncologica 2011;50(2):289‐98. [DOI] [PubMed] [Google Scholar]
Isabell 2010 {published data only}
- Isabell UB, Maja R. Yoga supports physical and mental well‐being after breast cancer surgery. Journal of Psychosomatic Obstetrics and Gynecology 2010;31:125. [Google Scholar]
Jeff 2012 {published data only}
- Jeffs E, Wiseman T. Randomised controlled trial to determine the benefit of daily home‐based exercise in addition to self‐care in the management of breast cancer‐related lymphoedema: a feasibility study. Supportive Care in Cancer 2012;21(4):1013‐23. [DOI] [PubMed] [Google Scholar]
Johansson 2005 {published data only}
- Johansson K, Tibe K, Weibull A, Newton RU. Low intensity resistance exercise for breast cancer patients with arm lymphedema with or without compression sleeve. Lymphology 2005;38(4):167‐80. [PubMed] [Google Scholar]
Johnsson 2013 {published data only}
- Johnsson A, Johnsson A, Johansson K. Physical activity during and after adjuvant chemotherapy in patients with breast cancer. Physiotherapy 2013;99(3):221‐7. [DOI] [PubMed] [Google Scholar]
Kilbreath 2006 {published data only}
- Kilbreath S, Refshauge K, Beith J, Lee M. Resistance and stretching shoulder exercises early following axillary surgery for breast cancer. Rehabilitation Oncology 2006;24(2):9‐14. [Google Scholar]
Kilbreath 2012 {published data only}
- Kilbreath SL, Refshauge KM, Beith JM, Ward LC, Lee M, Simpson JM, et al. Upper limb progressive resistance training and stretching exercises following surgery for early breast cancer: a randomized controlled trial. Breast Cancer Research and Treatment 2012;133(2):667‐76. [DOI] [PubMed] [Google Scholar]
Kilgour 2008 {published data only}
- Kilgour RD, Jones DH, Keyserlingk JR. Effectiveness of a self‐administered, home‐based exercise rehabilitation program for women following a modified radical mastectomy and axillary node dissection: a preliminary study. Breast Cancer Research and Treatment 2008;109(2):285‐95. [DOI] [PubMed] [Google Scholar]
Kim Soo 2011 {published data only}
- Kim SH, Shin MS, Lee HS, Lee ES, Ro JS, Kang HS, et al. Randomized pilot test of a simultaneous stage‐matched exercise and diet intervention for breast cancer survivors. Oncology Nursing Forum 2011;38(2):E97‐E106. [DOI] [PubMed] [Google Scholar]
Kovacic 2011 {published data only}
- Kovacic T, Kovacic M. Impact of relaxation training according to Yoga in Daily Life system on perceived stress after breast cancer surgery. Integrative Cancer Therapies 2011;10(1):16‐26. [DOI] [PubMed] [Google Scholar]
LaStayo 2011 {published data only}
- LaStayo PC, Marcus RL, Dibble LE, Smith SB, Beck SL. Eccentric exercise versus usual‐care with older cancer survivors: the impact on muscle and mobility ‐ an exploratory pilot study. BMC Geriatrics 2011;11:5. [DOI] [PMC free article] [PubMed] [Google Scholar]
Lee 2010 {published data only}
- Lee SA, Kang J, Kim YD, An AR, Kim S, Kim Y, et al. Effects of a scapula‐oriented shoulder exercise programme on upper limb dysfunction in breast cancer survivors: a randomized controlled pilot trial. Clinical Rehabilitation 2010;24(7):600‐13. [DOI] [PubMed] [Google Scholar]
Ligibel 2012 {published data only}
- Ligibel JA, Meyerhardt J, Pierce JP, Najita J, Shockro L, Campbell N, et al. Impact of a telephone‐based physical activity intervention upon exercise behaviors and fitness in cancer survivors enrolled in a cooperative group setting. Breast Cancer Research and Treatment 2012;132(1):205‐13. [DOI] [PMC free article] [PubMed] [Google Scholar]
May 2008 {published data only}
- May AM, Weert E, Korstjens I, Hoekstra‐Weebers JEHM, Schans CP, Zonderland ML, et al. Improved physical fitness of cancer survivors: a randomised controlled trial comparing physical training with physical and cognitive‐behavioural training. Acta Oncologica 2008;47(5):825‐34. [DOI] [PubMed] [Google Scholar]
McClure 2010 {published data only}
- McClure MK, McClure RJ, Day R, Brufsky AM. Randomized controlled trial of the Breast Cancer Recovery Program for women with breast cancer‐related lymphedema. American Journal of Occupational Therapy 2010;64(1):59‐72. [DOI] [PubMed] [Google Scholar]
Mefferd 2007 {published data only}
- Mefferd K, Nichols JF, Pakiz B, Rock CL. A cognitive behavioral therapy intervention to promote weight loss improves body composition and blood lipid profiles among overweight breast cancer survivors. Breast Cancer Research and Treatment 2007;104(2):145‐52. [DOI] [PubMed] [Google Scholar]
Moadel 2007 {published data only}
- Moadel AB, Shah C, Wylie‐Rosett J, Harris MS, Patel SR, Hall CB, et al. Randomized controlled trial of yoga among a multiethnic sample of breast cancer patients: effects on quality of life. Journal of Clinical Oncology 2007;25(28):4387‐95. [DOI] [PubMed] [Google Scholar]
Naraphong 2015 {published data only}
- Naraphong W, Lane A, Schafer J, Whitmer K, Wilson BR. Exercise intervention for fatigue‐related symptoms in Thai women with breast cancer: a pilot study. Nursing Health Science 2015;17(1):33–41. [DOI] [PubMed] [Google Scholar]
Naumann 2012a {published data only}
- Naumann F, Munro A, Martin E, Magrani P, Buchan J, Smith C, et al. An individual‐based versus group‐based exercise and counselling intervention for improving quality of life in breast cancer survivors: a feasibility and efficacy study. Psycho‐Oncology 2012;21(10):1136‐9. [DOI] [PubMed] [Google Scholar]
Noble 2012 {published data only}
- Noble M, Russell C, Kraemer L, Sharratt M. UW WELL‐FIT: the impact of supervised exercise programs on physical capacity and quality of life in individuals receiving treatment for cancer. Supportive Care in Cancer 2012;20(4):865‐73. [DOI] [PubMed] [Google Scholar]
Oh 2010 {published data only}
- Oh B, Butow P, Mullan B, Clarke S, Beale P, Pavlakis N, et al. Impact of Medical Qigong on quality of life, fatigue, mood and inflammation in cancer patients: a randomized controlled trial. Annals of Oncology 2010;21(3):608‐14. [DOI] [PMC free article] [PubMed] [Google Scholar]
Oldervoll 2011 {published data only}
- Oldervoll LM, Loge JH, Lydersen S, Paltiel H, Asp MB, Nygaard UV, et al. Physical exercise for cancer patients with advanced disease: a randomized controlled trial. Oncologist 2011;16(11):1649‐57. [DOI] [PMC free article] [PubMed] [Google Scholar]
Pinto 2008 {published data only}
- Pinto BM, Rabin C, Abdow S, Papandonatos GD. A pilot study on disseminating physical activity promotion among cancer survivors: a brief report. Psycho‐Oncology 2008;17(5):517‐21. [DOI] [PubMed] [Google Scholar]
Pinto 2013 {published data only}
- Pinto BM, Dunsiger S, Waldemore M. Physical activity and psychosocial benefits among breast cancer patients. Psycho‐Oncology 2013;22(10):2193‐9. [DOI] [PubMed] [Google Scholar]
- Pinto BM, Papandonatos GD, Goldstein MG. A randomized trial to promote physical activity among breast cancer patients. Health Psychology 2013;32(6):616‐26. [DOI] [PubMed] [Google Scholar]
Rabin 2006 {published data only}
- Rabin CS, Pinto BM, Trunzo JJ, Frierson GM, Bucknam LM. Physical activity among breast cancer survivors: regular exercisers vs participants in a physical activity intervention. Psycho‐Oncology 2006;15(4):344‐54. [DOI] [PubMed] [Google Scholar]
Rabin 2009 {published data only}
- Rabin C, Pinto B, Dunsiger S, Nash J, Trask P. Exercise and relaxation intervention for breast cancer survivors: feasibility, acceptability and effects. Psycho‐oncology 2009;18(3):258‐66. [DOI] [PubMed] [Google Scholar]
Sandel 2005 {published data only}
- Sandel SL, Judge JO, Landry N, Faria L, Ouellette R, Majczak M. Dance and movement program improves quality‐of‐life measures in breast cancer survivors. Cancer Nursing 2005;28(4):301‐9. [DOI] [PubMed] [Google Scholar]
Schmidt 2012 {published data only}
- Schmidt T, Weisser B, Jonat W, Baumann FT, Mundhenke C. Gentle strength training in rehabilitation of breast cancer patients compared to conventional therapy. Anticancer Research 2012;32(8):3229‐33. [PubMed] [Google Scholar]
Schneider 2007 {published data only}
- Schneider CM, Hsieh CC, Sprod LK, Carter SD, Hayward R. Effects of supervised exercise training on cardiopulmonary function and fatigue in breast cancer survivors during and after treatment. Cancer 2007;110(4):918‐25. [DOI] [PubMed] [Google Scholar]
Schwartz 1999 {published data only}
- Schwartz AL. Fatigue mediates the effects of exercise on quality of life. Quality of Life Research 1999;8(6):529‐38. [DOI] [PubMed] [Google Scholar]
Segal 2001 {published data only}
- Segal R, Evans W, Johnson D, Smith J, Colletta S, Gayton J, et al. Structured exercises improves physical functioning in women with stages I and II breast cancer: results of a randomized controlled trial. Journal of Clinical Oncology 2001;19(3):657‐65. [DOI] [PubMed] [Google Scholar]
Sherman 2010 {published data only}
- Sherman KA, Heard G, Cavanagh KL. Psychological effects and mediators of a group multi‐component program for breast cancer survivors. Journal of Behavioral Medicine 2010;33(5):378‐91. [DOI] [PubMed] [Google Scholar]
Speed‐Andrews 2010 {published data only}
- Speed‐Andrews AE, Stevinson C, Belanger LJ, Mirus JJ, Courneya KS. Pilot evaluation of an Iyengar yoga program for breast cancer survivors. Cancer Nursing 2010;33(5):369‐81. [DOI] [PubMed] [Google Scholar]
Sprod 2005 {published data only}
- Sprod LK, Drum SN, Bentz AT, Carter SD, Schneider CM. The effects of walking poles on shoulder function in breast cancer survivors. Integrative Cancer Therapies 2005;4(4):287‐93. [DOI] [PubMed] [Google Scholar]
Sprod 2010 {published data only}
- Sprod LK, Palesh OG, Janelsins MC, Peppone LJ, Heckler CE, Jacob Adams M, et al. Exercise, sleep quality, and mediators of sleep in breast and prostate cancer patients receiving radiation therapy. Community Oncology 2010;7(10):463‐71. [DOI] [PMC free article] [PubMed] [Google Scholar]
Stan 2012 {published data only}
- Stan DL, Rausch SM, Sundt K, Cheville AL, Youdas JW, Krause DA, et al. Pilates for breast cancer survivors: Impact on physical parameters and quality of life after mastectomy. Clinical Journal of Oncology Nursing 2012;16(2):131‐41. [DOI] [PubMed] [Google Scholar]
Stan 2013 {published data only}
- Stan D, Cheville A, Croghan I, Pruthi S. Randomized controlled study of yoga versus strengthening exercises in breast cancer survivors with persistent fatigue. Supportive Care in Cancer 2013;21:S261‐S2. [DOI] [PubMed] [Google Scholar]
Stevinson 2007 {published data only}
- Stevinson C. Exercise programme improves functional outcomes during breast cancer therapy. Focus on Alternative & Complementary Therapies 2007;12(3):202‐3. [Google Scholar]
Szczwpanska‐Gieracha 2010 {published data only}
- Szczepanska‐Gieracha J, Malicka I, Figula M, Rymaszewska J, Wozniewski M. The influence of eight‐week Nordic walking exercise on life quality of women after mastectomy. Onkologia Polska 2010;13(2):90‐5. [Google Scholar]
Tang 2010 {published data only}
- Tang M, Liou T, Lin C. Improving sleep quality for cancer patients: benefits of a home‐based exercise intervention. Supportive Care in Cancer 2010;18(10):1329‐39. [DOI] [PubMed] [Google Scholar]
Taso 2014 {published data only}
- Taso CJ, Lin HS, Lin WL, Chen SM, Huang WT, Chen SW. The effect of yoga exercise on improving depression, anxiety, and fatigue in women with breast cancer: a randomized controlled trial. Journal of Nursing Research 2014;22(3):155‐64. [DOI] [PubMed] [Google Scholar]
Thorsen 2005 {published data only}
- Thorsen L, Skovlund E, Stromme SB, Hornslien K, Dahl AA, Fossa SD. Effectiveness of physical activity on cardiorespiratory fitness and health‐related quality of life in young and middle‐aged cancer patients shortly after chemotherapy. Journal of Clinical Oncology 2005;23(10):2378‐88. [DOI] [PubMed] [Google Scholar]
Tidhar 2010 {published data only}
- Tidhar D, Katz‐Leurer M. Aqua lymphatic therapy in women who suffer from breast cancer treatment‐related lymphedema: a randomized controlled study. Supportive Care in Cancer 2010;18(3):383‐92. [DOI] [PubMed] [Google Scholar]
Turner 2004 {published data only}
- Turner J, Hayes S, Reul‐Hirche H. Improving the physical status and quality of life of women treated for breast cancer: a pilot study of a structured exercise intervention. Journal of Surgical Oncology 2004;86(3):141‐6. [DOI] [PubMed] [Google Scholar]
Ulger 2010 {published data only}
- Ulger O, Yagli NV. Effects of yoga on the quality of life in cancer patients. Complementary Therapies in Clinical Practice 2010;16(2):60‐3. [DOI] [PubMed] [Google Scholar]
Van Puymbroeck 2011 {published data only}
- Puymbroeck M, Schmid A, Shinew KJ, Hsieh PC. Influence of Hatha yoga on physical activity constraints, physical fitness, and body image of breast cancer survivors: a pilot study. International Journal of Yoga Therapy 2011;21:49‐60. [PubMed] [Google Scholar]
Van Weert 2005 {published data only}
- Weert E, Hoekstra‐Weebers J, Grol B, Otter R, Arendzen H, Postema K, et al. A multidimensional cancer rehabilitation program for cancer survivors ‐ effectiveness on health‐related quality of life. Journal of Psychosomatic Research 2005;58(6):485‐96. [DOI] [PubMed] [Google Scholar]
Wong 2012 {published data only}
- Wong P, Muanza T, Hijal T, Masse L, Pillay S, Chasen M, et al. Effect of exercise in reducing breast and chest‐wall pain in patients with breast cancer: a pilot study. Current Oncology 2012;19(3):e129‐e35. [DOI] [PMC free article] [PubMed] [Google Scholar]
Wu 2008 {published data only}
- Wu H, Dodd MJ, Cho MH. Patterns of fatigue and effect of exercise in patients receiving chemotherapy for breast cancer. Oncology Nursing Forum 2008;35(5):E90‐E9. [Google Scholar]
Yuen 2007 {published data only}
- Yuen HK, Sword D. Home‐based exercise to alleviate fatigue and improve functional capacity among breast cancer survivors. Journal of Allied Health 2007;36:e257‐e75. [PubMed] [Google Scholar]
References to studies awaiting assessment
Lahart 2016 {published data only}
- Lahart IM, Metsios GS, Nevill AM, Kitas GD, Carmichael AR. Randomised controlled trial of a home‐based physical activity intervention in breast cancer survivors. BMC Cancer 2016;16:234. [DOI: 10.1186/s12885-016-2258-5] [DOI] [PMC free article] [PubMed] [Google Scholar]
Lohrisch 2011 {published data only}
- Lohrisch CA, McKenzie D, Truong P, Jesperson D, Gelmon KA, Premji S. Randomized trial of exercise versus control for musculoskeletal symptoms from adjuvant anastrozole for postmenopausal early breast cancer. Journal of Clinical Oncology 2011;29(S15):636. [Google Scholar]
Luu 2014 {published data only}
- Luu X, Rifkind K, Dhage S, Castaneda M, Zeng X, Joseph KAP. The effects of yoga on urban underserved breast cancer patients. Journal of Clinical Oncology 2014;32:e17557. [Google Scholar]
References to ongoing studies
Deli‐Conwright 2014 {published data only}
- Dieli‐Conwright CM, Mortimer JE, Schroeder ET, Courneya K, Demark‐Wahnefried W, Buchanan TA. Randomized controlled trial to evaluate the effects of combined progressive exercise on metabolic syndrome in breast cancer survivors: rationale, design, and methods. BMC Cancer 2014;14(1):238. [DOI] [PMC free article] [PubMed] [Google Scholar]
Galiano‐Castillo 2013 {published data only}
- Galiano‐Castillo N, Ariza‐Garcia A, Cantarero‐Villanueva I, Fernandez‐Lao C, Diaz‐Rodriguez L, Legeren‐Alvarez M. Telehealth system (e‐CUIDATE) to improve quality of life in breast cancer survivors: rationale and study protocol for a randomized clinical trial. Trials 2013;14(1):187. [NCT01801527] [DOI] [PMC free article] [PubMed] [Google Scholar]
IRCT2014042117379N1 {published data only}
- IRCT2014042117379N1. Comparing self‐efficacy, outcome expectations for promoting the physical activity of the women with breast cancer in two groups with and without educational program. http://apps.who.int/trialsearch/Trial2.aspx?TrialID=IRCT2014042117379N1 (accessed 16 July 2016).
KIlbreath 2011 {published data only}
- Kilbreath S, Refshauge KM, Beith J, Ward L, Sawkins K, Paterson R, et al. Prevention of osteoporosis as a consequence of aromatase inhibitor therapy in postmenopausal women with early breast cancer: rationale and design of a randomized controlled trial. Contemporary Clinical Trials 2011;32(5):704‐9. [ACTRN12608000220369] [DOI] [PubMed] [Google Scholar]
NCT02057536 {published data only}
- NCT02057536. The Effect of an Exercise Program in Breast Cancer Patients With Joint Pain While Taking Aromatase Inhibitors. https://clinicaltrials.gov/show/NCT02057536 (accessed 16 July 2016).
NCT02235051 {published data only}
- NCT02235051. Exercise Intervention in Preventing Breast Cancer Recurrence in Postmenopausal Breast Cancer Survivors. https://clinicaltrials.gov/show/NCT02235051 (accessed 16 July 2016).
NCT02332876 {published data only}
- NCT02332876. Physical Activity and Neuropsychological Outcomes in a Cancer Population. https://ClinicalTrials.gov/show/NCT02332876 (accessed 16 July 2016).
NCT02420249 {published data only}
- NCT02420249. Qigong for Breast Cancer Survivors. https://ClinicalTrials.gov/show/NCT02420249 (accessed 16 July 2016).
NCT02433067 {published data only}
- NCT02433067. Physical Activity Intervention on Myocardial Function in Patients With HER2 + Breast Cancer (CARDAPAC). https://clinicaltrials.gov/show/NCT02433067 (accessed 16 July 2016).
NCT02527889 {published data only}
- NCT02527889. The Effect of Resistive Exercise on Forearm Blood Flow and Tissue Oxygenation Among Breast Cancer Survivors With or at Risk for Breast Cancer‐related Lymphoedema (BCRL). https://clinicaltrials.gov/show/NCT02527889 (accessed 16 July 2016).
Additional references
Azim 2011
- Azim HA Jr, Azambuja E, Colozza M, Bines J, Piccart MJ. Long‐term toxic effects of adjuvant chemotherapy in breast cancer. Annals of Oncology 2011;22(9):1939‐47. [DOI] [PubMed] [Google Scholar]
Ballard‐Barbash 2012
- Ballard‐Barbash R, Friedenreich CM, Courneya KS, Siddiqi SM, McTiernan A, Alfano CM. Physical activity, biomarkers, and disease outcomes in cancer survivors: a systematic review. Journal of the National Cancer Institute 2012;104(11):815‐40. [DOI] [PMC free article] [PubMed] [Google Scholar]
Battaglini 2014
- Battaglini CL, Mills RC, Phillips BL, Lee JT, Story CE, Nascimento MG, et al. Twenty‐five years of research on the effects of exercise training in breast cancer survivors: a systematic review of the literature. World Journal of Clinical Oncology 2014;5(2):177‐90. [DOI] [PMC free article] [PubMed] [Google Scholar]
Beasley 2012
- Beasley JM, Kwan ML, Chen WY, Weltzien EK, Kroenke CH, Lu W, et al. Meeting the physical activity guidelines and survival after breast cancer: findings from the after breast cancer pooling project. Breast Cancer Research and Treatment 2012;131(2):637‐43. [DOI] [PMC free article] [PubMed] [Google Scholar]
Beisecker 1997
- Beisecker A, Cook MR, Ashworth J, Hayes J, Brecheisen M, Helmig L, et al. Side effects of adjuvant chemotherapy: perceptions of node‐negative breast cancer patients. Psycho‐Oncology 1997;6(2):85‐93. [DOI] [PubMed] [Google Scholar]
Bluethmann 2015
- Bluethmann SM, Vernon SW, Gabriel KP, Murphy CC, Bartholomew LK. Taking the next step: a systematic review and meta‐analysis of physical activity and behavior change interventions in recent post‐treatment breast cancer survivors. Breast Cancer Research and Treatment 2015;149(2):331‐42. [DOI] [PMC free article] [PubMed] [Google Scholar]
Bluethmann 2016
- Bluethmann SM, Bartholomew LK, Murphy CC, Vernon SW. Use of theory in behavior change interventions: an analysis of programs to increase physical activity in posttreatment breast cancer survivors. Health Education & Behavior 2016;May 25:[Epub ahead of print]. [DOI: 10.1177/1090198116647712] [DOI] [Google Scholar]
Bourke 2013
- Bourke L, Homer KE, Thaha MA, Steed L, Rosario DJ, Robb KA, et al. Interventions for promoting habitual exercise in people living with and beyond cancer. Cochrane Database of Systematic Reviews 2013, Issue 9. [DOI: 10.1002/14651858.CD010192.pub2] [DOI] [PubMed] [Google Scholar]
Bourke 2014
- Bourke L, Homer KE, Thaha MA, Steed L, Rosario DJ, Robb KA, et al. Interventions to improve exercise behaviour in sedentary people living with and beyond cancer: a systematic review. British Journal of Cancer 2014;110(4):831‐41. [DOI] [PMC free article] [PubMed] [Google Scholar]
Bovelli 2010
- Bovelli D, Plataniotis G, Roila F, ESMO Guidelines Working Group. Cardiotoxicity of chemotherapeutic agents and radiotherapy‐related heart disease: ESMO Clinical Practice Guidelines. Annals of Oncology 2010;21(Suppl 5):277‐82. [DOI] [PubMed] [Google Scholar]
Bradt 2011
- Bradt J, Goodill SW, Dileo C. Dance/movement therapy for improving psychological and physical outcomes in cancer patients. Cochrane Database of Systematic Reviews 2011, Issue 10. [DOI: 10.1002/14651858.CD007103.pub2] [DOI] [PubMed] [Google Scholar]
Bray 2013
- Bray F, Ren J‐S, Masuyer E, Ferlay J. Global estimates of cancer prevalence for 27 sites in the adult population in 2008. International Journal of Cancer 2013;132:1133‐45. [DOI] [PubMed] [Google Scholar]
Brown 2011
- Brown JC, Huedo‐Medina TB, Pescatello LS, Pescatello SM, Ferrer RA, Johnson BT. Efficacy of exercise interventions in modulating cancer‐related fatigue among adult cancer survivors: a meta‐analysis. Cancer Epidemiology Biomarkers and Prevention 2011;20(1):123‐33. [DOI] [PubMed] [Google Scholar]
Brown 2012
- Brown JC, Huedo‐Medina TB, Pescatello LS, Ryan SM, Pescatello SM, Moker E, et al. The efficacy of exercise in reducing depressive symptoms among cancer survivors: a meta‐analysis. PLoS ONE 2012;7(1):e30955. [DOI] [PMC free article] [PubMed] [Google Scholar]
Buffart 2012a
- Buffart LM, Uffelen JG, Riphagen II, Brug J, Mechelen W, Brown WJ, et al. Physical and psychosocial benefits of yoga in cancer patients and survivors: a systematic review and meta‐analysis of randomized controlled trials. BMC Cancer 2012;12:559. [DOI] [PMC free article] [PubMed] [Google Scholar]
Button 2015
- Button KS, Kounali D, Thomas L, Wiles NJ, Peters TJ, Welton NJ, et al. Minimal clinically important difference on the Beck Depression Inventory‐II according to the patient's perspective. Psychological Medicine 2015;45(15):3269‐79. [DOI] [PMC free article] [PubMed] [Google Scholar]
Camoriano 1990
- Camoriano JK, Loprinzi CL, Ingle JN, Therneau TM, Krook JE, Veeder MH. Weight change in women treated with adjuvant therapy or observed following mastectomy for node‐positive breast cancer. Journal of Clinical Oncology 1990;8(8):1327‐34. [DOI] [PubMed] [Google Scholar]
Candy 2016
- Candy B, Jones L, Vickerstaff V, Tookman A, King M. Interventions for sexual dysfunction following treatments for cancer in women. Cochrane Database of Systematic Reviews 2016;2:Cd005540. [DOI] [PMC free article] [PubMed] [Google Scholar]
Carayol 2013
- Carayol M, Bernard P, Boiché J, Riou F, Mercier B, Cousson‐Gélie F, et al. Psychological effect of exercise in women with breast cancer receiving adjuvant therapy: what is the optimal dose needed?. Annals of Oncology 2013;24:291‐300. [DOI] [PubMed] [Google Scholar]
Caspersen 1985
- Caspersen CJ, Powell KE, Christenson GM. Physical activity, exercise, and physical fitness: definitions and distinctions for health‐related research. Public Health Reports 1985;100(2):126–31. [PMC free article] [PubMed] [Google Scholar]
Cella 2002
- Cella D, Eton DT, Lai JS, Peterman AH, Merkel DE. Combining anchor and distribution‐based methods to derive minimal clinically important differences on the Functional Assessment of Cancer Therapy (FACT) anemia and fatigue scales. Journal of Pain and Symptom Management 2002;24(6):547‐61. [DOI] [PubMed] [Google Scholar]
Cella 2002a
- Cella D, Hahn EA, Dineen K. Meaningful change in cancer‐specific quality of life scores: differences between improvement and worsening. Quality of Life Research 2002;11(3):207‐21. [DOI] [PubMed] [Google Scholar]
Chan 2015
- Chan RJ, McCarthy AL, Devenish J, Sullivan KA, Chan A. Systematic review of pharmacologic and non‐pharmacologic interventions to manage cognitive alterations after chemotherapy for breast cancer. European Journal of Cancer 2015;51(4):437‐50. [DOI] [PubMed] [Google Scholar]
Cheema 2008
- Cheema B, Gaul CA, Lane K, Fiatarone Singh MA. Progressive resistance training in breast cancer: a systematic review of clinical trials. Breast Cancer Research and Treatment 2008;109(1):9‐26. [DOI] [PubMed] [Google Scholar]
Cheema 2014
- Cheema BS, Kilbreath SL, Fahey PP, Delaney GP, Atlantis E. Safety and efficacy of progressive resistance training in breast cancer: a systematic review and meta‐analysis. Breast Cancer Research and Treatment 2014;148(2):249‐68. [DOI] [PubMed] [Google Scholar]
Chiu 2015
- Chiu HY, Huang HC, Chen PY, Hou WH, Tsai PS. Walking improves sleep in individuals with cancer: a meta‐analysis of randomized, controlled trials. Oncology Nursing Forum 2015;42(2):E54‐E62. [DOI] [PubMed] [Google Scholar]
Chung 2013
- Chung C, Lee S, Hwang S, Park E. Systematic review of exercise effects on health outcomes in women with breast cancer. Asian Nursing Research 2013;7(3):149‐59. [DOI] [PubMed] [Google Scholar]
Cochran 1954
- Cochran WG. The combination of estimates from different experiments. Biometrics 1954;10(1):101‐29. [Google Scholar]
Craft 2012
- Craft LL, Vaniterson EH, Helenowski IB, Rademaker AW, Courneya KS. Exercise effects on depressive symptoms in cancer survivors: a systematic review and meta‐analysis. Cancer Epidemiology Biomarkers and Prevention 2012;21(1):3‐19. [DOI] [PMC free article] [PubMed] [Google Scholar]
Cramer 2013
- Cramer H, Lauche R, Klose P, Lange S, Langhorst J, Dobos GJ. Yoga for women diagnosed with breast cancer. Cochrane Database of Systematic Reviews 2013, Issue 10. [DOI: 10.1002/14651858.CD010802] [DOI] [PMC free article] [PubMed] [Google Scholar]
Cramp 2010
- Cramp F, James A, Lambert J. The effects of resistance training on quality of life in cancer: a systematic literature review and meta‐analysis. Supportive Care in Cancer 2010;18(11):1367‐76. [DOI] [PubMed] [Google Scholar]
Cramp 2012
- Cramp F, Byron‐Daniel J. Exercise for the management of cancer‐related fatigue in adults. Cochrane Database of Systematic Reviews 2012;11:Cd006145. [DOI] [PMC free article] [PubMed] [Google Scholar]
de Jong 2002
- Jong N, Courtens AM, Abu‐Saad HH, Schouten HC. Fatigue in patients with breast cancer receiving adjuvant chemotherapy: a review of the literature. Cancer Nursing 2002;25(4):283‐97. [DOI] [PubMed] [Google Scholar]
Demark‐Wahnefried 2005
- Demark‐Wahnefried W, Aziz NM, Rowland JH, Pinto BM. Riding the crest of the teachable moment: promoting long‐term health after the diagnosis of cancer. Journal of Clinical Oncology 2005;23(24):5814‐30. [DOI] [PMC free article] [PubMed] [Google Scholar]
DerSimonian 1986
- DerSimonian R, Laird N. Meta‐analysis in clinical trials. Controlled Clinical Trials 1986;7:177‐88. [DOI] [PubMed] [Google Scholar]
Duijts 2011
- Duijts SF, Faber MM, Oldenburg HS, Beurden M, Aaronson NK. Effectiveness of behavioral techniques and physical exercise on psychosocial functioning and health‐related quality of life in breast cancer patients and survivors ‐ a meta‐analysis. Psycho‐Oncology 2011;20(2):115‐26. [DOI] [PubMed] [Google Scholar]
Eastell 1993
- Eastell R, Robins SP, Colwell T. Evaluation of bone turnover in type I osteoporosis using biochemical markers specific for both bone formation and bone resorption. Osteoporosis International 1993;3:255‐260. [DOI] [PubMed] [Google Scholar]
Egger 1997
- Egger M, Davey Smith G, Schneider M, Minder C. Bias in meta‐analysis detected by a simple, graphical test. BMJ 1997;315(7109):629‐34. [DOI] [PMC free article] [PubMed] [Google Scholar]
Eton 2004
- Eton DT, Cella D, Yost KJ, Yount SE, Peterman AH, Neuberg DS, et al. A combination of distribution‐ and anchor‐based approaches determined minimally important differences (MIDs) for four endpoints in a breast cancer scale. Journal of Clinical Epidemiology 2004;57(9):898‐910. [DOI] [PubMed] [Google Scholar]
Ferlay 2013
- Ferlay J, Soerjomataram I, Ervik M, Dikshit R, Eser S, Mathers C, et al. GLOBOCAN 2012 v1.0, Cancer Incidence and Mortality Worldwide: IARC CancerBase No. 11 [Internet]. Lyon, France: International Agency for Research on Cancer; 2013. Available from http://globocan.iarc.fr (accessed April 2014).
Ferrer 2011
- Ferrer RA, Huedo‐Medina TB, Johnson BT, Ryan S, Pescatello LS. Exercise interventions for cancer survivors: a meta‐analysis of quality of life outcomes. Annals of Behavioral Medicine 2011;41(1):32‐47. [DOI] [PMC free article] [PubMed] [Google Scholar]
Fong 2012
- Fong DY, Ho JW, Hui BP, Lee AM, Macfarlane DJ, Leung SS, et al. Physical activity for cancer survivors: meta‐analysis of randomised controlled trials. BMJ 2012;344:e70. [DOI] [PMC free article] [PubMed] [Google Scholar]
Galvao 2005
- Galvao DA, Newton RU. Review of exercise intervention studies in cancer patients. Journal of Clinical Oncology 2005;23(4):899‐909. [DOI] [PubMed] [Google Scholar]
Greenland 1985
- Greenland S, Robins JM. Estimation of common effect parameter from sparse follow up data. Biometrics 1985;41:55‐68. [PubMed] [Google Scholar]
Guyatt 2008
- Guyatt GH, Oxman AD, Vist G, Kunz R, Falck‐Ytter Y, Alonso‐Coello P, et al. Rating quality of evidence and strength of recommendations. GRADE: an emerging consensus on rating quality of evidence and strength of recommendations. BMJ 2008;336:924‐6. [DOI] [PMC free article] [PubMed] [Google Scholar]
Higgins 2003
- Higgins JPT, Thompson SG, Deeks JJ, Altman DG. Measuring inconsistency in meta‐analyses. BMJ 2003;327:557‐60. [DOI] [PMC free article] [PubMed] [Google Scholar]
Higgins 2011
- Higgins JPT, Green S (editors). Cochrane Handbook for Systematic Reviews of Interventions Version 5.1.0 (updated March 2011). The Cochrane Collaboration, 2011. Available from www.cochrane‐handbook.org.
Holmes 2005
- Holmes MD, Chen WY, Feskanich D, Kroenke CH, Colditz GA. Physical activity and survival after breast cancer diagnosis. JAMA 2005;293(20):2479‐86. [DOI] [PubMed] [Google Scholar]
IARC 2012
- International Agency for Research on Cancer. Latest World Cancer Statistics. Lyon, France: International Agency for Research on Cancer; 2013; Vol. Press release no. 223.
Ibrahim 2011
- Ibrahim EM, Al‐Homaidh A. Physical activity and survival after breast cancer diagnosis: meta‐analysis of published studies. Medical Oncology 2011;28(3):753‐65. [DOI] [PubMed] [Google Scholar]
Ingram 2007
- Ingram C, Visovsky C. Exercise intervention to modify physiologic risk factors in cancer survivors. Seminars in Oncology Nursing 2007;23(4):275‐84. [DOI] [PubMed] [Google Scholar]
Jemal 2011
- Jemal A, Bray F, Center MM, Ferlay J, Ward E, Forman D. Global cancer statistics. CA: A Cancer Journal for Statistics 2011;61(2):69‐90. [DOI] [PubMed] [Google Scholar]
Keilani 2016
- Keilani M, Hasenoehrl T, Neubauer M, Crevenna R. Resistance exercise and secondary lymphedema in breast cancer survivors ‐ a systematic review. Supportive Care in Cancer 2016;24(4):1907‐16. [DOI] [PubMed] [Google Scholar]
Knols 2005
- Knols R, Aaronson NK, Uebelhart D, Fransen J, Aufdemkampe G. Physical exercise in cancer patients during and after medical treatment: a systematic review of randomized and controlled clinical trials. Journal of Clinical Oncology 2005;23(16):3830‐42. [DOI] [PubMed] [Google Scholar]
Knols 2010
- Knols RH, Bruin ED, Shirato K, Uebelhart D, Aaronson NK. Physical activity interventions to improve daily walking activity in cancer survivors. BMC Cancer 2010;10:406. [DOI] [PMC free article] [PubMed] [Google Scholar]
Kodama 2009
- Kodama S, Saito K, Tanaka S, Maki M, Yachi Y, Asumi M, et al. Cardiorespiratory fitness as a quantitative predictor of all‐cause mortality and cardiovascular events in healthy men and women: a meta‐analysis. JAMA 2009;301(19):2024‐35. [DOI] [PubMed] [Google Scholar]
Kriska 1990
- Kriska AM, Knowler WC, LaPorte RE. Development of a questionnaire to examine relationship of physical activity and diabetes in Pima Indians. Diabetes Care 1990;13:401‐11. [DOI] [PubMed] [Google Scholar]
Kroenke 2005
- Kroenke CH, Chen WY, Rosner B, Holmes MD. Weight, weight gain, and survival after breast cancer diagnosis. Journal of Clinical Oncology 2005;23(7):1370‐8. [DOI] [PubMed] [Google Scholar]
Lahmann 2005
- Lahmann PH, Schulz M, Hoffmann K, Boeing H, Tjonneland A, Olsen A, et al. Long‐term weight change and breast cancer risk: the European prospective investigation into cancer and nutrition (EPIC). British Journal of Cancer 2005;93:582‐9. [DOI] [PMC free article] [PubMed] [Google Scholar]
Lee 2010a
- Lee MS, Choi TY, Ernst E. Tai chi for breast cancer patients: a systematic review. Breast Cancer Research and Treatment 2010;120(2):309‐16. [DOI] [PubMed] [Google Scholar]
Lynch 2011
- Lynch BM, Neilson HK, Friedenreich CM. Physical activity and breast cancer prevention. Recent Results in Cancer Research 2011;186:13‐42. [DOI] [PubMed] [Google Scholar]
Mantel 1959
- Mantel N, Haenszel W. Statistical aspects of the analysis of data from retrospective studies. Journal of the National Cancer Institute 1959;22:719‐48. [PubMed] [Google Scholar]
Markes 2009
- Markes M, Brockow T, Resch KL. Exercise for women receiving adjuvant therapy for breast cancer. Cochrane Database of Systematic Reviews 2006, Issue 4. [DOI: 10.1002/14651858.CD005001.pub2] [DOI] [PubMed] [Google Scholar]
McAuley 2000
- McAuley L, Pham B, Tugwell P, Moher D. Does the inclusion of grey literature influence estimates of intervention effectiveness reported in meta‐analyses?. Lancet 2000;356:1228–31. [DOI] [PubMed] [Google Scholar]
McNeely 2006
- McNeely ML, Campbell KL, Rowe BH, Klassen TP, Mackey JR, Courneya KS. Effects of exercise on breast cancer patients and survivors: a systematic review and meta‐analysis. Canadian Medical Association Journal 2006;175(1):34‐41. [DOI] [PMC free article] [PubMed] [Google Scholar]
McNeely 2010
- McNeely ML, Campbell K, Ospina M, Rowe BH, Dabbs K, Klassen TP, et al. Exercise interventions for upper‐limb dysfunction due to breast cancer treatment. Cochrane Database of Systematic Reviews 2010, Issue 6. [DOI: 10.1002/14651858.CD005211.pub2] [DOI] [PubMed] [Google Scholar]
Meneses‐Echavez 2015
- Meneses‐Echavez JF, Gonzalez‐Jimenez E, Ramirez‐Velez R. Effects of supervised exercise on cancer‐related fatigue in breast cancer survivors: a systematic review and meta‐analysis. BMC Cancer 2015;15:77. [DOI] [PMC free article] [PubMed] [Google Scholar]
Mishra 2012a
- Mishra SI, Scherer RW, Geigle PM, Berlanstein DR, Topaloglu O, Gotay CC, et al. Exercise interventions on health‐related quality of life for cancer survivors. Cochrane Database of Systematic Reviews 2012, Issue 8. [DOI: 10.1002/14651858.CD007566.pub2] [DOI] [PMC free article] [PubMed] [Google Scholar]
Mishra 2012b
- Mishra SI, Scherer RW, Snyder C, Geigle PM, Berlanstein DR, Topaloglu O. Exercise interventions on health‐related quality of life for people with cancer during active treatment. Cochrane Database of Systematic Reviews 2012, Issue 8. [DOI: 10.1002/14651858.CD008465.pub2] [DOI] [PMC free article] [PubMed] [Google Scholar]
Moher 2010
- Moher D, Hopewell S, Schulz KF, Montori V, Gotzsche PC, Devereaux PJ, et al. CONSORT 2010 explanation and elaboration: updated guidelines for reporting parallel group randomised trials. BMJ 2010;340:c869. [DOI] [PMC free article] [PubMed] [Google Scholar]
Nelson 2016
- Nelson NL. Breast cancer‐related lymphedema and resistance exercise: a systematic review. Journal of Strength & Conditioning Research 2016;Jan 29:[Epub ahead of print]. [DOI: 10.1519/JSC.0000000000001355] [DOI] [PubMed] [Google Scholar]
Pan 2015
- Pan Y, Yang K, Shi X, Liang H, Zhang F, Lv Q. Tai chi chuan exercise for patients with breast cancer: a systematic review and meta‐analysis. Evidence‐Based Complementary and Alternative Medicine 2015;2015:535237. [DOI] [PMC free article] [PubMed] [Google Scholar]
Paramanandam 2014
- Paramanandam VS, Roberts D. Weight training is not harmful for women with breast cancer‐related lymphoedema: a systematic review. Journal of Physiotherapy 2014;60(3):136‐43. [DOI] [PubMed] [Google Scholar]
Physical Activity Guidelines 2008
- Physical Activity Guidelines Advisory Committee. Physical Activity Guidelines Advisory Committee Report, 2008. Washington: US Department of Health and Human Services. Available at http://www.health.gov/paguidelines/Report/pdf/CommitteeReport.pdf (accessed 09 January 2018) 2008.
RevMan [Computer program]
- Nordic Cochrane Centre, The Cochrane Collaboration. Review Manager 5 (RevMan 5). Version 5.3. Copenhagen: Nordic Cochrane Centre, The Cochrane Collaboration, 2014.
Schmitz 2010
- Schmitz KH, Courneya KS, Matthews C, Demark‐Wahnefried W, Galvão D, Pinto BM, et al. American College of Sports Medicine roundtable on exercise guidelines for cancer survivors. Medicine and Science in Sport and Exercise Science 2010;42(7):1409‐26. [DOI] [PubMed] [Google Scholar]
Shoemaker 2013
- Shoemaker MJ, Curtis AB, Vangsnes E, Dickinson MG. Clinically meaningful change estimates for the six‐minute walk test and daily activity in individuals with chronic heart failure. Cardiopulmonary Physical Therapy Journal 2013;24(3):21‐9. [PMC free article] [PubMed] [Google Scholar]
Spark 2013
- Spark LC, Reeves MM, Fjeldsoe BS, Eakin EG. Physical activity and/or dietary interventions in breast cancer survivors: a systematic review of the maintenance of outcomes. Journal of Cancer Survivorship: Research and Practice 2013;7(1):74‐82. [DOI] [PubMed] [Google Scholar]
Speck 2010
- Speck RM, Courneya KS, Masse LC, Duval S, Schmitz KH. An update of controlled physical activity trials in cancer survivors: a systematic review and meta‐analysis. Journal of Cancer Survivorship: Research and Practice 2010;4(2):87‐100. [DOI] [PubMed] [Google Scholar]
Vallance 2008
- Vallance JK, Courneya KS, Plotnikoff RC, Yasui Y, Mackey JR. Randomized controlled trial of the effects of print materials and step pedometers on physical activity and quality of life in breast cancer survivors. Journal of Clinical Oncology 2007;25(17):2352‐9. [DOI] [PubMed] [Google Scholar]
Winters‐Stone 2010
- Winters‐Stone KM, Schwartz A, Nail LM. A review of exercise interventions to improve bone health in adult cancer survivors. Journal of Cancer Survivorship: Research and Practice 2010;4(3):187‐201. [DOI] [PubMed] [Google Scholar]
Yang 2016
- Yang GS, Kim HJ, Griffith KA, Zhu S, Dorsey SG, Renn CL. Interventions for the treatment of aromatase inhibitor‐associated arthralgia in breast cancer survivors: a systematic review and meta‐analysis. Cancer Nursing 2016;Jun 21:[Epub ahead of print]. [DOI: 10.1097/NCC.0000000000000409] [DOI] [PubMed] [Google Scholar]
Yost 2011
- Yost KJ, Eton DT, Garcia SF, Cella D. Minimally important differences were estimated for six Patient‐Reported Outcomes Measurement Information System‐Cancer scales in advanced‐stage cancer patients. Journal of Clinical Epidemiology 2011;64(5):507‐16. [DOI] [PMC free article] [PubMed] [Google Scholar]
Zeng 2014
- Zeng Y, Huang M, Cheng AS, Zhou Y, So WK. Meta‐analysis of the effects of exercise intervention on quality of life in breast cancer survivors. Breast Cancer (Tokyo, Japan) 2014;21(3):262‐74. [DOI] [PubMed] [Google Scholar]
Zhu 2016
- Zhu G, Zhang X, Wang Y, Xiong H, Zhao Y, Sun F. Effects of exercise intervention in breast cancer survivors: a meta‐analysis of 33 randomized controlled trials. OncoTargets and Therapy 2016;9:2153‐68. [DOI] [PMC free article] [PubMed] [Google Scholar]
Zimmer 2016
- Zimmer P, Baumann FT, Oberste M, Wright P, Garthe A, Schenk A, et al. Effects of exercise interventions and physical activity behavior on cancer related cognitive impairments: a systematic review. BioMed Research International 2016;2016:1820954. [DOI] [PMC free article] [PubMed] [Google Scholar]
References to other published versions of this review
Lahart 2014
- Lahart IM, Metsios GS, Nevill AM, Carmichael AR. Physical activity for women with breast cancer after adjuvant therapy. Cochrane Database of Systematic Reviews 2014, Issue 9. [DOI: 10.1002/14651858.CD011292] [DOI] [PMC free article] [PubMed] [Google Scholar]