Summary
Aim
Jasminoidin and ursodeoxycholic acid are 2 bioactive compounds extracted from Chinese medicine that have been proven to exert a synergistic effect as a combined administration for the treatment of stroke. The aim of this study was to reveal the pharmacogenomic mechanism of this synergistic effect of jasminoidin and ursodeoxycholic acid.
Methods
One hundred and fifteen mice with brain damage, induced by focal cerebral ischemia/reperfusion, were divided into 5 groups: jasminoidin‐treated, ursodeoxycholic acid–treated, combination‐treated, vehicle group, and sham‐operated group. Comparative analysis of stroke‐related gene expression profiles and Kyoto Encyclopedia of Genes and Genomes pathways among the 3 treatment groups were performed to reveal the mechanism of this synergistic effect.
Results
This study demonstrated that (1) treatment with jasminoidin alone caused similar changes in the pattern of gene expression as those treated with the combination; (2) jasminoidin treatment and the combination treatment had more overlapping changes in gene expression and activated pathways than the ursodeoxycholic acid treatment; (3) Hspa1a and Ppm1e were only up‐regulated in the combination‐treated group; (4) the nonoverlapping genes Fgf12, Rarα, Map3k4, paxillin (PXN) in the combination‐treated group were markedly expressed, and P53 pathway was obviously activated in the combination‐treated group.
Conclusion
These findings may suggest that jasminoidin is the major component of the combination, and the combination plays an important role of the synergistic effect in up‐regulating expression of gene Hspa1a, genes Fgf12, Rarα, Map3k4 and down‐regulating gene PXN, as well as activating P53 pathway.
Keywords: Ischemia/reperfusion, Jasminoidin, Pharmacogenomics, Synergistic mechanism, Ursodeoxycholic acid
Introduction
Ischemic stroke is a substantial cause of death and disability worldwide. There is good evidence from preclinical studies 1, 2 and randomized control trials 3, 4 that combination therapy offers a survival advantage and increases the effectiveness of treatment for ischemic stroke without substantially increasing the side effects. Millennia‐old traditional Chinese medicine (TCM) treats stroke with many combination therapies involving multiple ingredients used in clinical practice. Because of its complex chemical ingredients, however, it is becoming a substantial bottleneck to determine the mechanism of interaction among the ingredients for treating ischemic stroke.
Jasminoidin and ursodeoxycholic acid (Figure S1) are the 2 bioactive compounds extracted from the Chinese medicine, Zhi Zi, and artificial Niu Huang in TCM 5, 6, respectively. These 2 Chinese medicines have been used for the treatment of stroke for thousands of years. In previous studies, it has been demonstrated that ursodeoxycholic acid administered in high doses can be delivered to different tissues outside the liver, including the brain 7, and is a potent neuroprotective agent in acute ischemic stroke. The mechanism of this protection may be mediated by the inhibition of mitochondrial perturbation and subsequent caspase activation leading to apoptotic cell death 8. Moreover, our previous study showed that jasminoidin could also decrease the infarction area in the rat brain with therapeutic effects against ischemic stroke 9, 10. However, interestingly, in our previous studies, we found that although the individual effects of jasminoidin and ursodeoxycholic acid were not very strong, the combined administration of jasminoidin and ursodeoxycholic acid could significantly improve their effectiveness, such as decreasing the neurological scores 11. These findings were accordant with our clinical practice of TCM where Zhi Zi and artificial Niu Huang were often used together, especially for stroke treatment. Furthermore, our recent study reported that the combination of jasminoidin and ursodeoxycholic acid had a synergic effect on reducing the infarct volume based on the median‐effect method 12.
Despite favorable findings in our previous studies, we only compared the global genomic expression profiles and the relevant altered pathways among jasminoidin, ursodeoxycholic acid, and their combination treatment groups, and we did not determine specific gene expression profile changes and pathways that correlate with stroke after treatment with the 2 compounds alone and in combination. Therefore, we continued to use a specific microarray made from a collection of 374 cDNAs that are related to stroke and performed a comparative analysis of the effects, the gene expression profiles, and the significantly activated pathways in Kyoto Encyclopedia of Genes and Genomes (KEGG) pathway analysis. The models were treated by individual or combined jasminoidin and ursodeoxycholic acid for focal cerebral ischemia–reperfusion injury, so as to reveal the synergistic mechanism between jasminoidin and ursodeoxycholic acid.
Methods
Animal Model
Animal experiments were carried out in accordance with the Prevention of Cruelty to Animals Act (1986) and National Institutes of Health (NIH) guidelines for the care and use of laboratory animals for experimental procedures. The experimental protocol was approved by a local committee review. The focal cerebral ischemia/reperfusion mouse models were induced as previously described 12.
Drug Administration
Kunming mice (n = 115), 12 weeks of age and weighing 38–48 g, were obtained from the Experimental Animal Center at the Health Science Center of Peking University, China, and were randomly divided into 5 groups(each consisting of 23 subjects): jasminoidin‐treated group (jasminoidin; 25 mg/mL), ursodeoxycholic acid–treated group (ursodeoxycholic acid 7 mg/mL), combination‐treated group (the combination of jasminoidin and ursodeoxycholic acid at the ratio of 1:1), vehicle group (0.9% NaCl), and sham‐operated group (0.9% NaCl).
The drug preparation used was a chemically standardized product obtained from the National Institutes for Food and Drug Control, which was validated by fingerprint chromatographic methodologies. The drug was dissolved in 0.9% NaCl just before use. All drugs in the form of injection were injected into the tail vein 1.5 h after the induction of focal cerebral ischemia at 2 mL/kg mouse body weight.
Histological Analysis and Measurement of the Cerebral Infarct Size by TTC Staining
A total of 6 mice from each group were selected for histological analysis after 24‐h reperfusion. Another 9 mice from each group were used to calculate the infarction ratio after 24‐h reperfusion. The methods for histological analysis and measurement of the cerebral infarct size by 2,3,5‐triphenyltetrazolium chloride (TTC) staining were conducted as previously described 12.
RNA Isolation and Microarray Analysis
The left hippocampus of 5 mice from each group was prepared for RNA isolation and microarray analysis. The procedures for RNA isolation, microarray preparation, and microarray data analysis were conducted as previously described 12. Microarrays were constructed from a collection of 374 cDNAs (Clontech atlas 1.2 mouse brain microarray, “Biostar40S” 4065, and 16,463 mouse oligo chip). The 374 genes consisted of 114 stroke‐related genes identified in the previous studies 9, 13 and 260 other genes from 9 cerebral ischemia‐related pathways (ERK, MAPK, Wnt, GnRH, CaMK, VEGF, JAK, EGF, and PDGF) screened from 4 databases: Science Signal Transduction Knowledge Environment, KEGG, Biocarta, and Reactome.
Quantitative Real‐Time Polymerase Chain Reaction (RT‐PCR) Analysis
Another 3 animals from each group were anesthetized with chloral hydrate (400 mg/kg) and decapitated. The total RNA from the hippocampus tissue was extracted, and cDNAs were synthesized from 200 ng total RNA using TaqMan reverse transcription reagents (Applied Biosystems, Foster City, CA, USA). PCR was carried out using 2 μL cDNAs in the SYBR Green PCR Core reagent kit and analyzed by an ABI Prism 7000 Sequence Detection System (Applied Biosystems). Reactions containing no cDNA, or no primers served as negative controls. PCR primers for each gene were designed in adjacent exons and the fluorogenic probe spanning the junction between them. The relative expression levels of Hspa1a (primer: GCGCGACCTGAACAAGAGCATC; TCCGCTGATGATGGGGTTACAC) and Rarα (primer: CAGATGCACAACGCTGGC; CCGACTGTCGGCTTAGAG) were analyzed using the comparative C T method for relative quantitation and the formula 2−ΔΔCt method by normalizing to GAPDH gene expression. Results were presented as the percent changes compared with matched controls.
Cluster and Principal Components Analysis (PCA)
Normalized data were clustered and applied for visualization by ArrayTrack software (National Center for Toxicological Research, FDA, Jefferson, AR, USA). The expression level of the involved genes was indicated by different colors: red representing up‐regulation and green representing down‐regulation. Multidimensional scaling using the principal components was performed based on the covariance matrix of the normalized gene expression values. PCA reduced the complexity of high‐dimensional data structures by projecting them into a low‐dimensional subspace that accounted for the majority of data variance.
Gene Ontology (GO) Analysis
The functional annotation of the differentially expressed genes was obtained from the Gene Ontology database (http://www.geneontology.org/) and NCBI Gene database (http://www.ncbi.nlm.nih.gov/gene/), based on their respective molecular function, biological process, or cellular component. Functional categories were enriched within genes that were differentially expressed among the 3 treatment groups. Twelve GO functional categories that genes mainly involved in were selected for specific analysis: apoptosis, cell adhesion, cell cycle, cell differentiation, cell motility, cell organization, development, metabolism, response to stress, signal transduction, transcription regulator, and transport.
KEGG Analysis
All differentially expressed genes were uploaded to the KEGG (http://www.genome.jp/kegg/) database, and one of the main features of KEGG is the collection of pathway maps that computerize the network information of molecular interactions, such as for metabolism and signal transduction. This approach can be helpful for revealing information that is not easily visible from the changes of individual genes. Based on the KEGG database that can provide searchable pathways to the uploaded genes, pathways that had significant changes of P < 0.05 and fold change >1.5 were identified for further analysis.
Results
Variation of Infarct Volumes in Different Groups
Neurons of CA1 with normal structure and plaque‐like or granule‐like Nissl bodies were seen in the sham‐operated group (Figure 1A); whereas in the model group, the Nissl bodies in neurons were considerably depleted (Figure 1B). As for the hippocampus in the jasminoidin, ursodeoxycholic acid, and combination‐treated groups, the loss in the neuron Nissl bodies was significantly alleviated, but no abundant Nissl bodies were observed (Figure 1C–E). The combination‐treated group showed a significant reduction in infarction volume compared with the jasminoidin and ursodeoxycholic acid–treated groups (Figure 1F).
Figure 1.
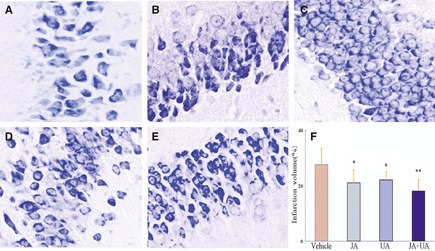
The changes of pathomorphology in mouse hippocampus and the effects on the infarction volume among the 5 groups. (A) Hippocampus in the sham‐operated group with normal structure and plaque‐like or granule‐like Nissl bodies (n = 6, magnification × 400). (B) In the vehicle group, Nissl bodies in neurons nearly got lost completely (n = 6, magnification × 400); (C–E) Hippocampus with different loss degrees in neuron Nissl bodies in jasminoidin (JA)‐, ursodeoxycholic acid (UA)‐, and the combination (JA + UA)‐treated groups, respectively (n = 6, magnification × 400). (F) Variation of infarction volumes between different treatment groups versus vehicle group (n = 9, *p < 0.05; **p < 0.01 vs. vehicle group, ANOVA; Values are the mean ± SD).
Cluster Analysis and PCA
Cluster analysis and PCA indicated that the data were more clustered in the combination‐treated and ursodeoxycholic acid–treated groups compared with those of jasminoidin‐treated group, which were relatively dispersed. Overall, the accuracy and credibility of the data were high. Two‐way cluster analysis indicated that the pattern of gene expression in the combination group was similar to the jasminoidin‐treated group than the ursodeoxycholic acid–treated group, and the combination–jasminoidin treatment comparisons had more overlapping up‐regulated and down‐regulated genes (Figure 2A,B).
Figure 2.
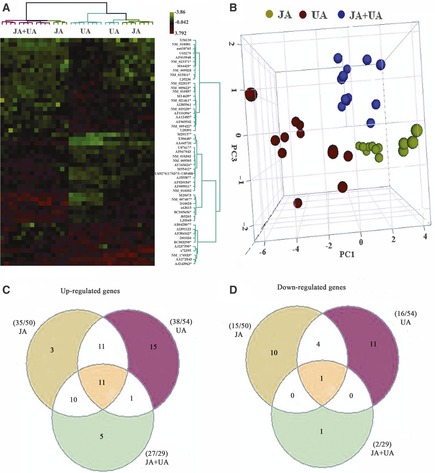
The comparative analysis results of stroke‐related gene expression profiles among jasminoidin‐, ursodeoxycholic acid‐, and the combination‐treated groups. (A) Cluster analysis of altered genes among the 3 treatment groups, which indicates that the profiles of gene expression in jasminoidin (JA)‐ and the combination (JA + UA)‐treated groups have some similarities, compared with those of ursodeoxycholic acid (UA)–treated group. (B) Principal components analysis (PCA) of altered genes among jasminoidin‐, ursodeoxycholic acid‐, and the combination‐treated groups, which shows the data in jasminoidin (blue)‐, ursodeoxycholic acid (red)‐, and the combination‐treated (green) groups are clustered, respectively, and the combination and jasminoidin‐treated groups are relatively close to each other. (C) Up‐regulated differentially expressed genes overlapping and nonoverlapping among the 3 treatment groups, which shows that (1) 11 up‐regulated differentially expressed genes overlapped among the 3 groups; (2) 10 up‐regulated differentially expressed genes overlapped between jasminoidin‐ and the combination‐treated groups, only 1 up‐regulated differentially expressed gene overlapped between ursodeoxycholic acid‐ and the combination‐treated groups, and 11 up‐regulated differentially expressed gene overlapped between jasminoidin‐ and ursodeoxycholic acid–treated groups; (3) 3, 15, or 5 differentially expressed genes were only up‐regulated in jasminoidin‐treated, ursodeoxycholic acid–treated, or combination‐treated group, respectively. (D) Down‐regulated differentially expressed genes overlapping and nonoverlapping among the 3 treatment groups, which demonstrated that (1) only 1 down‐regulated differentially expressed gene overlapped among the 3 groups; (2) none down‐regulated differentially expressed gene overlapped between jasminoidin‐ and the combination‐treated groups or between ursodeoxycholic acid‐ and the combination‐treated groups, and 4 down‐regulated differentially expressed genes overlapped between jasminoidin‐ and ursodeoxycholic acid–treated groups; (3) 10, 9, or 1 differentially expressed genes were only down‐regulated in jasminoidin‐treated group, ursodeoxycholic acid–treated or, combination‐treated group, respectively.
Differentially Altered Gene Expression Profiles
A total of 107 altered genes were significantly expressed in the sham group, with 103 (96.33%) up‐regulated genes and 4 (3.67%) down‐regulated genes. The jasminoidin‐treated group had 50 differentially expressed genes, with 35 (70.00%) up‐regulated genes and 15 (30%) down‐regulated genes. Fifty‐four differentially expressed genes were identified in the ursodeoxycholic acid–treated group, with 38 (70.37%) up‐regulated genes and 16 (29.63%) down‐regulated genes. The combination‐treated group had 50 differentially expressed genes, with 27 (93.10%) up‐regulated genes and 2 (6.90%) down‐regulated genes. In addition, these data show that the overlapping altered genes, Hspa1a and Ppm1e, in the ursodeoxycholic acid–combination treatment comparisons were up‐regulated in the combination‐treated group but down‐regulated in the ursodeoxycholic acid–treated group (Table S1 and Figure 2C,D).
According to the ratio of up‐regulated and down‐regulated levels, the most up‐regulated genes were Ccnal (ratio = 3.3891), F5 (ratio = 4.6549), and Arf1 (ratio = 2.8709) in the jasminoidin‐, ursodeoxycholic acid‐, and combination‐treated groups, respectively. Conversely, the most down‐regulated genes were Pou3f1 (ratio = 0.4651), Hspa1a (ratio = 0.3669), and Cdc42 (ratio = 0.6343) in jasminoidin‐, ursodeoxycholic acid‐, and combination‐treated groups, respectively. The top 10 ratio values of the up‐regulated or down‐regulated differential genes in each group are shown in Table S2 (based on the up‐regulated level >2 or down‐regulated level <0.5 except for combination‐treated group with only 2 down‐regulated genes identified).
GO Categories of Differentially Expressed Genes
According to the GO analysis, the functional annotations of the most differentially expressed genes among the 3 treatment groups were related to metabolism, signal transduction, and development (Figure 3A). Based on the function of the 29 differentially expressed genes in the combination‐treated group, 14 were related to metabolism, 13 related to signal transduction, and 5 related to development or the cell cycle. Among the 50 differentially expressed genes in jasminoidin‐treated group, 23 were related to metabolism, 20 related to signal transduction, and 14 related to development. The same distribution was also identified in the 54 differentially expressed genes in the ursodeoxycholic acid–treated group, of which 28 were related to metabolism, 22 related to signal transduction, and 10 related to development (Figure 3). The functions of the overlapping differentially expressed genes among all 3 treatment groups were primarily related to signal transduction and secondarily to metabolism. However, although “development” was the third functional annotation to which the differentially expressed genes were related, there was only 1 overlapping gene among the 3 treatment groups (Figure 3B).
Figure 3.
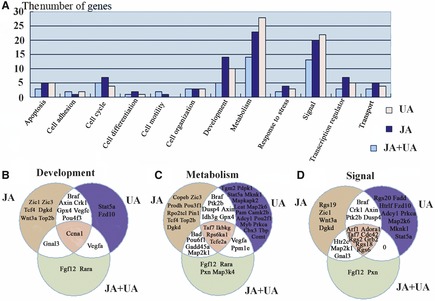
Distribution of differentially expressed genes based on GO analysis. (A) it illustrates the number of differentially expressed genes in each group based on GO analysis. (B) it shows the overlapping and nonoverlapping genes related to development, metabolism, and signal based on GO analysis among the 3 treatment groups.
RT‐PCR Validation
The drug‐induced changes in Hspa1a and Rarα expression obtained by the cDNA microarray analysis were further verified by RT‐PCR (Figure 4). RT‐PCR analysis of Hspa1a gene expression in drug‐treated mouse brains showed a progressive increase in the combination‐treated group while decrease in ursodeoxycholic acid–treated group. The expression of Rarα mRNA was significantly increased in the combination‐treated group, as examined by RT‐PCR analysis. The outcome of RT‐PCR analyses indicated that broad, array‐based gene expression measurements were reliable for the determination of gene expression patterns in the brain.
Figure 4.
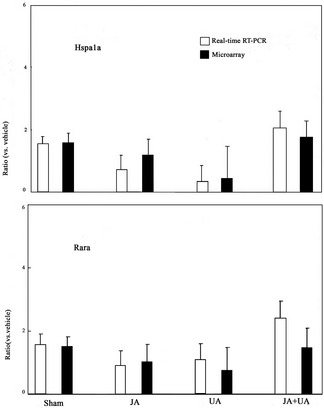
Independent experiments to identify gene expression using real‐time polymerase chain reaction (RT‐PCR). The expression of Hspa1a and Rarα in real‐time RT‐PCR compared with that in microarray. Values are the mean ± SD.
KEGG Database Analysis
Using the KEGG database, 22 overlapping pathways were identified among the 3 groups, as well as 4 and 2 overlapping pathways noted between the combination–jasminoidin treatment comparisons and jasminoidin–ursodeoxycholic acid treatment comparisons, respectively. However, no overlapping pathway between the combination–ursodeoxycholic acid treatment comparisons was identified (Figure 5A). Moreover, 3 pathways were significantly activated in only the jasminoidin‐treated group in addition to 3 pathways in the ursodeoxycholic acid–treated group and only 1 pathway in the combination‐treated group (Figure 5B–G). The P53 signaling pathway was identified as one of the pathways related to cerebral ischemia (Figure 6), which was only activated in the combination‐treated group.
Figure 5.
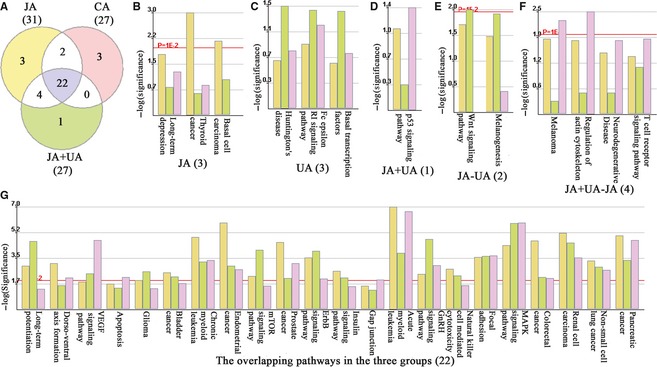
The results of Kyoto Encyclopedia of Genes and Genomes (KEGG) pathway analysis. (A) the Wayne map about the significant pathways distribution of the 3 treatment groups; (B) the 3 significant pathways only activated in jasminoidin‐treated group (JA): long‐term depression, thyroid cancer, basal cell carcinoma; (C) the 3 significant pathways only activated in ursodeoxycholic acid–treated group (UA): Huntington's disease, Fc epsilon RI signaling pathway, basal transcription factors; (D) the 1 significant pathway only activated in the combination‐treated group (JA + UA): P53 signaling pathway; (E) the 2 overlapping pathways both activated in jasminoidin‐treated group and ursodeoxycholic acid–treated group (JA − UA): Wnt signaling pathway, melanogenesis; (F) the 4 overlapping pathways both activated in jasminoidin‐treated group and the combination‐treated group (JA + UA − JA): melanoma, regulation of actin cytoskeleton, neurodegenerative diseases, T cell receptor signaling pathway; (H) the 22 overlapping pathways all activated in the 3 treatment groups: long‐term potentiation, dorso–ventral axis formation, VEGF signaling pathway, apoptosis, glioma, bladder cancer, chronic myeloid leukemia, endometrial cancer, mTOR signaling pathway, prostate cancer, ErbB signaling pathway, insulin signaling pathway, gap junction, acute myeloid leukemia, GnRH signaling pathway, natural killer cell–mediated cytotoxicity, focal adhesion, MAPK signaling pathway, colorectal cancer, renal cell carcinoma, non–small cell lung cancer, pancreatic cancer.
Figure 6.
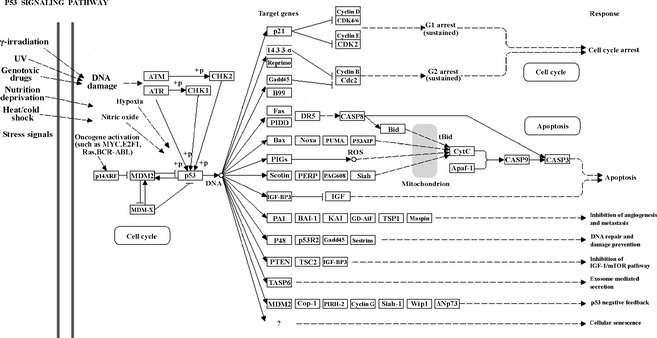
The significant pathway only activated in the combination‐treated group: P53 signal pathway in the Kyoto Encyclopedia of Genes and Genomes (KEGG) database.
Discussion
In this study, the pharmacological effects for reducing the infarction volume and the changes of pathomorphology in the mouse hippocampus among the 3 treatment groups were similar to data reported in our previous study 12. According to the analysis of the differential gene expression profiles, significantly up‐regulated or down‐regulated genes were consistently the overlapping altered genes in the 3 treatment groups, such as Ccna1, Rgs6, F5, Rgs18, Bid, Tcfe2a, Taf7, Ikbkg, Adora1, Arf1, Rps6ka1, and Cdc42. This indicates that the mechanism of action determined in the 3 study groups were similar and may be the basis for their pharmacological effects. Based on the results of GO analysis, the functions of most differentially regulated genes were related to metabolism, signal transduction, and development. Therefore, the therapeutic mechanism for ischemic stroke in the 3 groups (jasminoidin, ursodeoxycholic acid, and their combination) may be related to their effects on cerebral metabolism, signal transduction, and nervous development.
According to the cluster analysis, PCA, and gene expression profile analysis, it was demonstrated that the pattern of gene expression in the combination‐treated group was more similar to the jasminoidin‐treated group than the ursodeoxycholic acid–treated group, and the combination–jasminoidin treatment comparisons had more overlapping up‐regulated and down‐regulated genes. Based on GO analyses, there were more overlapping altered genes between the combination–jasminoidin comparisons than those between the combination–ursodeoxycholic acid treatment comparisons. Furthermore, according to the KEGG analysis, there were more overlapping significant pathways between the combination–jasminoidin treatment comparisons than between the combination–ursodeoxycholic acid treatment comparisons. When combined with the result of their pharmacological effects, these data suggest that jasminoidin possibly contributes more important pharmacological effects when given in the combination, which is consistent with our recent findings 12.
The current study suggested that the synergistic effect in the combination‐treated group may be related to 3 aspects as following:
-
1
The overlapping genes, Hspa1a and Ppm1e, in the ursodeoxycholic acid–combination treatment comparisons were up‐regulated in the combination‐treated group (Hspa1a: ratio = 1.7337; Ppm1e: ratio = 1.6699) but down‐regulated in the ursodeoxycholic acid–treated group (Hspa1a: ratio = 0.3669; Ppm1e: ratio = 0.6337). The up‐regulation of these 2 genes has been associated with apoptosis 14, 15. In particular, the neuroprotective effects of Hspa1a (Hsp72) overexpression have been reported in numerous studies during ischemia‐like conditions in neuronal cells 16, 17, 18, in vivo 17, 19, 20, and in vitro models of ischemia 21, 22. Moreover, transgenic mice overexpressing the Hspa1a gene show significant protection during focal cerebral ischemia 19, 20, and injection of a vector carrying the Hsp72 gene into the rat hippocampal CA1 region provided protection to cells in the vicinity of the injection site following 10 min of global ischemia 23.Thus, in our study, the up‐regulation of Hspa1a in the combination‐treated group may demonstrate synergism.
-
2
The nonoverlapping altered genes expressed in the combination‐treated group, which were up‐regulated (Fgf12, Rarα, Map3k4) and those that were down‐regulated gene (paxillin, PXN), may also be involved with the synergistic effect of the drugs. Fgf12 (ratio = 1.9774), as a member of the fibroblast growth factor (FGF) family, was expressed in the developing, and adult nervous systems and gene transcripts have been detected in the developing of central nervous system in cells outside the proliferating ependymal layer, suggesting that it is likely related to nervous system development and function 24, 25. Rarα, as a member of retinoic acid receptors (RARs) family, which is indispensable for morphogenesis and differentiation of several tissues, including the nervous system 26, 27, 28, can be found in the cortex and hippocampus 29, 30. In addition, Rarα (ratio = 1.6951) may be critically involved in this form of retinoic acid signaling that is considered a synaptic signaling pathway and plays an important role in the homeostatic synaptic plasticity by activating dendritic GluR1 synthesis 31. Additionally, Rarα may be preferentially involved in the generation of neural crest–derived arterial smooth muscle cells 32.
Despite no previous reports that Map3k4 has any direct relevance with cerebral ischemia, Map3k4 (MEKK4; ratio = 1.5293) function is critical for some congenital malformation of human cerebral cortex, such as periventricular heterotopia 33 and neural tube defects 34. Previous reports demonstrate that mice deficient in MEKK4 or possessing kinase‐deficienct MEKK4 (MEKK4K1361R) develop central nervous system phenotypes, including severe neural tube closure defects and massive neuroepithelial apoptosis 34, 35. Moreover, MEKK4 may be required for cytoskeletal stability or integrity of the ventricular surface lining the developing forebrain, which could influence neuronal migration away from the proliferative zone. MEKK4 contributes to the integrity of the ventricular zone surface, regulates the amount of filamin, and mediates cell migration during forebrain development 33.
The current study identified that the PXN gene was down‐regulated (ratio = 0.6579) in the combination‐treated group. It has been reported that the knockdown of this gene induces morphological changes of various neuronal cells and potentially inhibits oligodendrocyte differentiation 36. PXN acts as a positive regulator in oligodendrocyte differentiation and has been found to bind to the antiapoptosis protein, Bcl2, and is thought to protect cells from apoptosis 37. Although there are no reports of the effect of PXN in cerebral ischemia, we determined that PXN was down‐regulated after combination drug treatment in our study.
-
3
The only significantly activated pathway in the combination‐treated group, the P53 signaling pathway, is one of the pathways related to cerebral ischemia that may be correlated with the synergistic effect. The activation of the P53 signaling pathway is induced by a number of stress signals, including DNA damage, oxidative stress, and activated oncogenes. Previous reports suggest that the neuroprotective effect of drugs is related to the suppression of the P53 signaling pathway 38. Cerebral ischemia injury involves cell apoptosis and low‐level chronic inflammation, and P53 is also a well‐known transcription factor that mediates apoptosis by transactivation of proapoptotic gene expression, including bax, apaf‐1, and caspase‐6 39. Previous studies have demonstrated that p53 transcriptional activity is enhanced in ischemia–reperfusion injury 40, 41. Moreover, the stress‐activated signaling pathway, p53, plays a major role in the regulation of low‐level chronic inflammation via the activities of wild‐type p53‐induced phosphatase 1 (WIP1) and macrophage migration inhibitory factor (MIF) 42. Therefore, these data suggest that treatment with the combination of jasminoidin and ursodeoxycholic acid, opposed to the independent use of either drug, may activate a novel P53 signaling pathway that plays an important role in cerebral ischemia. The synergistic effects of jasminoidin and ursodeoxycholic acid may be linked to the pharmacological effect through the P53 pathway, different from the independent use of either jasminoidin or ursodeoxycholic acid.
In conclusion, our findings indicate that jasminoidin contributes a more important pharmacological effect in the combination treatment, which is consistent with our recent study 12. The synergistic effect of the combination treatment may correlate with the following mechanisms: (1) the overlapping genes, Hspa1a and Ppm1e, in ursodeoxycholic acid–combination treatment comparisons were only up‐regulated in the combination‐treated group; (2) the nonoverlapping overexpressed genes Fgf12, Rarα, Map3k4, and PXN in the combination‐treated group may be associated with cerebral ischemia; (3) P53 signaling pathway, which plays an important role in cerebral ischemia, was only significantly activated in the combination‐treated group. Nevertheless, these data did not determine the relationship between these altered genes and the pathway and could not provide a complete understanding of this synergistic effect. Thus, further studies on multiple and subpathways may be needed to validate the mechanism of the synergistic effect associated with cerebral ischemia–reperfusion injury. The P53 pathways identified here should also be further analyzed in the hope of gaining a more comprehensive understanding of the pharmacological mechanism of cerebral ischemia–reperfusion injury.
Conflict of Interest
The authors declare no conflict of interest.
Supporting information
Fig. S1 The chemical structure of jasminoidin (JA) and ursodeoxycholic acid (UA).
Acknowledgments
This study was supported by the 47th Postdoctoral Fund in China (20100470521), National Natural Science Foundation of China (90209015), and National 11th Five‐year plan Supporting R&D Project (2006BAI08B04‐06).
References
- 1. Nonaka Y, Shimazawa M, Yoshimura S, Iwama T, Hara H. Combination effects of normobaric hyperoxia and edaravone on focal cerebral ischemia‐induced neuronal damage in mice. Neurosci Lett 2008;441:224–228. [DOI] [PubMed] [Google Scholar]
- 2. Faure S, Oudart N, Javellaud J, Fournier A, Warnock DG, Achard JM. Synergistic protective effects of erythropoietin and olmesartan on ischemic stroke survival and post‐stroke memory dysfunctions in the gerbil. J Hypertens 2006;24:2255–2261. [DOI] [PubMed] [Google Scholar]
- 3. Els T, Oehm E, Voigt S, Klisch J, Hetzel A, Kassubek J. Safety and therapeutical benefit of hemicraniectomy combined with mild hypothermia in comparison with hemicraniectomy alone in patients with malignant ischemic stroke. Cerebrovasc Dis 2006;21:79–85. [DOI] [PubMed] [Google Scholar]
- 4. Smadja D, Chausson N, Joux J, et al. A new therapeutic strategy for acute ischemic stroke: Sequential combined intravenous tpa‐tenecteplase for proximal middle cerebral artery occlusion based on first results in 13 consecutive patients. Stroke 2011;42:1644–1647. [DOI] [PubMed] [Google Scholar]
- 5. Zhu XL, Zhang N, Li PT, Jiang YF, Xu Y. Protective effect of jasminoidin on cascade of damage of cerebral ischemia in rats. Zhongguo Zhong Yao Za Zhi 2004;29:1065–1068. [PubMed] [Google Scholar]
- 6. Yan SK, Xin WF, Luo GA, Wang YM, Cheng YY. Simultaneous determination of major bioactive components in qingkailing injection by high‐performance liquid chromatography with evaporative light scattering detection. Chem Pharm Bull (Tokyo) 2005;53:1392–1395. [DOI] [PubMed] [Google Scholar]
- 7. Sola S, Aranha MM, Steer CJ, Rodrigues CM. Game and players: Mitochondrial apoptosis and the therapeutic potential of ursodeoxycholic acid. Curr Issues Mol Biol 2007;9:123–138. [PubMed] [Google Scholar]
- 8. Rodrigues CM, Spellman SR, Sola S, et al. Neuroprotection by a bile acid in an acute stroke model in the rat. J Cereb Blood Flow Metab 2002;22:463–471. [DOI] [PubMed] [Google Scholar]
- 9. Zhang ZJ, Wang Z, Zhang XY, Ying K, Liu JX, Wang YY. Gene expression profile induced by oral administration of baicalin and gardenin after focal brain ischemia in rats. Acta Pharmacol Sin 2005;26:307–314. [DOI] [PubMed] [Google Scholar]
- 10. Zhang ZJ, Li P, Wang Z, et al. A comparative study on the individual and combined effects of baicalin and jasminoidin on focal cerebral ischemia‐reperfusion injury. Brain Res 2006;1123:188–195. [DOI] [PubMed] [Google Scholar]
- 11. Zhang ZJ, Wang Z, Li PT, Zhang WS, Wang YY. Application of magnetic resonance dw imaging technique in studying treatment of cerebral ischemia in rats by single or combined use of jasminoidin and cholalic acid. Zhongguo Zhong Xi Yi Jie He Za Zhi 2006;26:332–336. [PubMed] [Google Scholar]
- 12. Wang Z, Jing ZW, Zhou CX, et al. Fusion of core pathways reveals a horizontal synergistic mechanism underlying combination therapy. Eur J Pharmacol 2011;667:278–286. [DOI] [PubMed] [Google Scholar]
- 13. Wang Z, Du Q, Wang F, et al. Microarray analysis of genes related spatial learning memory in the mouse brain after global cerebral ischemia reperfusion. J Neurochem 2004;88:1406–1415. [DOI] [PubMed] [Google Scholar]
- 14. Gupta S, Deepti A, Deegan S, Lisbona F, Hetz C, Samali A. Hsp72 protects cells from er stress‐induced apoptosis via enhancement of ire1alpha‐xbp1 signaling through a physical interaction. PLoS Biol 2010;8:e1000410. [DOI] [PMC free article] [PubMed] [Google Scholar]
- 15. Bianchini M, Martinelli G, Renzulli M, Gonzalez CidM, Larripa I. Cdna microarray study to identify expression changes relevant for apoptosis in k562 cells co‐treated with amifostine and imatinib. Cancer Chemother Pharmacol 2007;59:349–360. [DOI] [PubMed] [Google Scholar]
- 16. Matsumori Y, Hong SM, Aoyama K, et al. Hsp70 overexpression sequesters aif and reduces neonatal hypoxic/ischemic brain injury. J Cereb Blood Flow Metab 2005;25:899–910. [DOI] [PubMed] [Google Scholar]
- 17. Yenari MA, Giffard RG, Sapolsky RM, Steinberg GK. The neuroprotective potential of heat shock protein 70 (hsp70). Mol Med Today 1999;5:525–531. [DOI] [PubMed] [Google Scholar]
- 18. Giffard RG, Yenari MA. Many mechanisms for hsp70 protection from cerebral ischemia. J Neurosurg Anesthesiol 2004;16:53–61. [DOI] [PubMed] [Google Scholar]
- 19. Plumier JC, Krueger AM, Currie RW, Kontoyiannis D, Kollias G, Pagoulatos GN. Transgenic mice expressing the human inducible hsp70 have hippocampal neurons resistant to ischemic injury. Cell Stress Chaperones 1997;2:162–167. [DOI] [PMC free article] [PubMed] [Google Scholar]
- 20. Rajdev S, Hara K, Kokubo Y, et al. Mice overexpressing rat heat shock protein 70 are protected against cerebral infarction. Ann Neurol 2000;47:782–791. [PubMed] [Google Scholar]
- 21. Xu L, Lee JE, Giffard RG. Overexpression of bcl‐2, bcl‐xl or hsp70 in murine cortical astrocytes reduces injury of co‐cultured neurons. Neurosci Lett 1999;277:193–197. [DOI] [PubMed] [Google Scholar]
- 22. Papadopoulos MC, Sun XY, Cao J, Mivechi NF, Giffard RG. Over‐expression of hsp‐70 protects astrocytes from combined oxygen‐glucose deprivation. NeuroReport 1996;7:429–432. [DOI] [PubMed] [Google Scholar]
- 23. Kelly S, Zhang ZJ, Zhao H, et al. Gene transfer of hsp72 protects cornu ammonis 1 region of the hippocampus neurons from global ischemia: Influence of bcl‐2. Ann Neurol 2002;52:160–167. [DOI] [PubMed] [Google Scholar]
- 24. Smallwood PM, Munoz‐Sanjuan I, Tong P, et al. Fibroblast growth factor (fgf) homologous factors: New members of the fgf family implicated in nervous system development. Proc Natl Acad Sci USA 1996;93:9850–9857. [DOI] [PMC free article] [PubMed] [Google Scholar]
- 25. Hartung H, Feldman B, Lovec H, Coulier F, Birnbaum D, Goldfarb M. Murine fgf‐12 and fgf‐13: Expression in embryonic nervous system, connective tissue and heart. Mech Dev 1997;64:31–39. [DOI] [PubMed] [Google Scholar]
- 26. Zile MH. Function of vitamin a in vertebrate embryonic development. J Nutr 2001;131:705–708. [DOI] [PubMed] [Google Scholar]
- 27. Panchision DM, McKay RD. The control of neural stem cells by morphogenic signals. Curr Opin Genet Dev 2002;12:478–487. [DOI] [PubMed] [Google Scholar]
- 28. Malaspina A, Pearce RK, Graeber MB. Nuclear hormone and orphan receptors: Their role in neuronal differentiation and cytoprotection and in the pathogenesis of parkinson's disease. Dev Neurosci 2003;25:375–383. [DOI] [PubMed] [Google Scholar]
- 29. Zetterstrom RH, Lindqvist E, Mata de Urquiza A, et al. Role of retinoids in the cns: Differential expression of retinoid binding proteins and receptors and evidence for presence of retinoic acid. Eur J Neurosci 1999;11:407–416. [DOI] [PubMed] [Google Scholar]
- 30. Krezel W, Kastner P, Chambon P. Differential expression of retinoid receptors in the adult mouse central nervous system. Neuroscience 1999;89:1291–1300. [DOI] [PubMed] [Google Scholar]
- 31. Maghsoodi B, Poon MM, Nam CI, Aoto J, Ting P, Chen L. Retinoic acid regulates raralpha‐mediated control of translation in dendritic rna granules during homeostatic synaptic plasticity. Proc Natl Acad Sci USA 2008;105:16015–16020. [DOI] [PMC free article] [PubMed] [Google Scholar]
- 32. Mark M, Ghyselinck NB, Kastner P, et al. Mesectoderm is a major target of retinoic acid action. Eur J Oral Sci 1998;106(Suppl 1) :24–31. [DOI] [PubMed] [Google Scholar]
- 33. Sarkisian MR, Bartley CM, Chi H, et al. Mekk4 signaling regulates filamin expression and neuronal migration. Neuron 2006;52:789–801. [DOI] [PMC free article] [PubMed] [Google Scholar]
- 34. Chi H, Sarkisian MR, Rakic P, Flavell RA. Loss of mitogen‐activated protein kinase kinase kinase 4 (mekk4) results in enhanced apoptosis and defective neural tube development. Proc Natl Acad Sci USA 2005;102:3846–3851. [DOI] [PMC free article] [PubMed] [Google Scholar]
- 35. Abell AN, Rivera‐Perez JA, Cuevas BD, et al. Ablation of mekk4 kinase activity causes neurulation and skeletal patterning defects in the mouse embryo. Mol Cell Biol 2005;25:8948–8959. [DOI] [PMC free article] [PubMed] [Google Scholar]
- 36. Yamauchi J, Miyamoto Y, Sanbe A, Tanoue A. Jnk phosphorylation of paxillin, acting through the rac1 and cdc42 signaling cascade, mediates neurite extension in n1e‐115 cells. Exp Cell Res 2006;312:2954–2961. [DOI] [PubMed] [Google Scholar]
- 37. Sorenson CM, Sheibani N. Focal adhesion kinase, paxillin, and bcl‐2: Analysis of expression, phosphorylation, and association during morphogenesis. Dev Dyn 1999;215:371–382. [DOI] [PubMed] [Google Scholar]
- 38. Shin WH, Park SJ, Kim EJ. Protective effect of anthocyanins in middle cerebral artery occlusion and reperfusion model of cerebral ischemia in rats. Life Sci 2006;79:130–137. [DOI] [PubMed] [Google Scholar]
- 39. Fridman JS, Lowe SW. Control of apoptosis by p53. Oncogene 2003;22:9030–9040. [DOI] [PubMed] [Google Scholar]
- 40. Crow MT, Mani K, Nam YJ, Kitsis RN. The mitochondrial death pathway and cardiac myocyte apoptosis. Circ Res 2004;95:957–970. [DOI] [PubMed] [Google Scholar]
- 41. Zhang Y, Kohler K, Xu J, et al. Inhibition of p53 after acute myocardial infarction: Reduction of apoptosis is counteracted by disturbed scar formation and cardiac rupture. J Mol Cell Cardiol 2011;50:471–478. [DOI] [PubMed] [Google Scholar]
- 42. Salminen A, Kaarniranta K. Control of p53 and nf‐kappab signaling by wip1 and mif: Role in cellular senescence and organismal aging. Cell Signal 2011;23:747–752. [DOI] [PubMed] [Google Scholar]
Associated Data
This section collects any data citations, data availability statements, or supplementary materials included in this article.
Supplementary Materials
Fig. S1 The chemical structure of jasminoidin (JA) and ursodeoxycholic acid (UA).


