Abstract
Objectives: Somatic stem cells can be obtained from a variety of adult human tissues. However, it was not clear whether human parathyroid glands, which secrete parathyroid hormones and are essential in maintaining homeostasis levels of calcium ions in the circulation, contained stem cells. We aimed to investigate the possibility of isolating such parathyroid‐derived stem cells (PDSC).
Materials and methods: Surgically removed parathyroid glands were obtained with informed consent. Cell cytogenetics was used to observe chromosomal abnormalities. Surface phenotypes were characterized by flow cytometry. Telomerase repeat amplification protocol (TRAP) assay was performed to observe the telomerase activity. RT‐PCR and real‐time PCR was was used to detect gene expressions. Real‐time calcium uptake imaging was performed for extent of calcium uptake and transmission electron microscopy and immunofluorecent staining for smooth muscle actin.
Results: After enzymatic digestion and primary culture, plastic‐adherent, fibroblast‐like cells appeared in culture and a morphologically homogeneous population was derived from subsequent limiting dilution and clonal expansion. Karyotyping was normal and doubling time of clonal cell growth was estimated to be 70.7 ± 14.5 h (mean ± standard deviation). The surface phenotype of the cells was positive for CD73, CD166, CD29, CD49a, CD49b, CD49d, CD44, CD105, and MHC class I, and negative for CD34, CD133, CD117, CD114, CD31, CD62P, EGF‐R, ICAM‐3, CD26, CXCR4, CD106, CD90 and MHC class II, similar to mesenchymal stem cells (MSC). Detectable levels of telomerase activity along with pluripotency Sall4 gene expression were observed from the isolated PDSCs. Expression of calcium‐sensing receptor gene along with alpha‐smooth muscle actin was induced and cellular uptake of extracellular calcium ions was observed. Furthermore, PDSCs possessed osteogenic, chondrogenic and adipogenic differentiation potentials.
Conclusions: Our results reveal that PDSCs were similar phenotypically to MSCs and further studies are needed to formulate induction conditions to differentiate PDSCs into parathyroid hormone‐secreting chief cells.
Introduction
During early mammalian developmental processes, the parathyroid forms from the third and fourth pharyngeal pouches derived from the foregut endoderm, and then migrates to its final position along the ventral midline of the pharyngeal and upper thoracic region (1). Several genes have been implicated in development of the parathyroid. The transcription factor Hoxa3 gene is expressed in the third pharyngeal pouch endoderm (2) and inactivation of Pax9 results in failure of parathyroid formation. Normal parathyroid development is also compromised by reduced Gcm2 expression by E11.5 due to Pax−/– mutants (3) and Eyes absent 1 (Eya1) mutants in mice fail to form the parathyroid.
Parathyroid glands are the primary regulators of blood calcium level through its detection then secretion of parathyroid hormone within a controlled physiological range (4). This tight regulation is specifically managed by eosinophilic chief cells arranged in semi‐acinar structures and dense cords around abundant capillaries in the parathyroid that detect calcium by its trans‐membrane calcium‐sensing receptors (CaSR) and subsequently secretes parathyroid hormone. Parathyroid hormone regulates blood calcium levels by several processes, including the induction of calcium release from bone into the circulation, enhancing calcium absorption from the small intestine, and suppression of calcium loss in urine (5).
It has been demonstrated that stem cells exist in a number of human postnatal tissues, including the bone marrow (6, 7, 8, 9), adipose tissue (10), synovium (11), umbilical cord blood (12), heart (13, 14), brain (15), skeletal muscles (16), pancreas (17), skin (18), and dental pulp (19). However, there are no literature reports on identification and isolation of stem cells from human parathyroid tissue. For this reason, we set out to isolate and characterize putative stem cells capable of self‐renewal and multi‐differentiational ability, from human parathyroid gland. We hypothesized that parathyroid‐derived stem cells (PDSC) could be obtained by the same techniques used to isolate stem cells from other adult somatic tissues (12, 20).
Materials and method
Cell isolation and culture
Surgically removed human parathyroid glands were obtained from patients after institutional review board approval and informed consent. Tissues were minced and digested with type II collagenase (Sigma‐Aldrich, St. Louis, MO, USA) for 30 min at 37 °C and cultured in expansion medium consisting of Iscove's modified Dulbecco medium (IMDM; Sigma‐Aldrich) with 10% foetal bovine serum (HyClone, Logan, UT, USA), supplemented with 10 ng/ml basic fibroblast growth factor (R&D Systems, Minneapolis, MN, USA), 100 U penicillin, 1000 U streptomycin, and 2 mm l‐glutamine (Invitrogen, Carlsbad, CA, USA).
Limiting dilutions
To obtain single cell‐derived, clonally expanded cells, plastic adherent cells were serially diluted and cultured in to 96‐well plates (Becton Dickinson, Franklin Lakes, NJ, USA) in expansion medium at a final density of 30 cells per 96‐well plate. Colonies that grew were culture‐expanded and tested for their differentiation potential. Cells were either maintained in expansion medium or cultured in keratinocyte medium (Invitrogen) with or without additional calcium (0.5 µm) and/or vitamin D (20 nm) for 3 weeks. Media were changed twice a week.
Cytogenetic analysis
Five hundred thousand PDSCs were harvested when cells reached 30 population doublings and karyotyped by the Giemsa method using a standard protocol (21).
Flow cytometry
For cell surface phenotyping, fifth‐passage cells were detached, stained with fluorescein‐ or phycoerythrin‐coupled antibodies, and analysed using a FACSCalibur (Becton Dickinson) flow cytometer. Antibodies against human antigen CD26, CD29, CD31, CD34, CD44, CD49a, CD49b, CD49d, CD50, CD62P, CD73, CD105, CD106, CD114, CD117, CD166, EGF‐R, HLA‐ABC, HLA‐DPDQDR were purchased from Becton Dickinson. Antibodies against CD133 were purchased from Miltenyi Biotec (Bergisch Gladbach, Germany).
Telomere repeat amplification protocol assay
Cell extracts were assayed for telomerase activity with a telomere repeat amplification protocol (TRAP) based on polymerase chain reaction (PCR) (22) with slight modifications, and prepared by lysing 1 × 10⁶ cells with 1× CHAPS lysis buffer. Cell extracts were first reacted with TSG4 primer (5′‐GGGATTGGGATTGGGATTGGGTT‐3′; 0.05 µg/µl) at 30 °C for 30 min, 94 °C for 3 min in 10× TRAP buffer (Chemicon International Inc., Temecula, CA, USA), dNTP (10 mm), and Taq polymerase. Reaction was paused and Cx primer (0.05 µg/µl), NT primer (0.05 µg/µl) and TSNT primer (10−3µM) were then added as control to a total volume of 50 µl. PCR amplification was continued for 50 cycles at 94 °C for 30 s, 50 °C for 30 s, and 72 °C for 45 s. Reaction products were analysed using 5% acrylamide gel.
Real‐time calcium imaging
Real‐time calcium (Ca) ion imaging was carried out by staining cells with 5 µm Fura‐2 dye for 30 min and covering with phosphate‐buffered solution containing 0.5 µm CaCl2, before they were observed by real‐time fluorescence microscopy (Olympus, Center Valley, PA, USA) in which emission wavelengths were measured and calculated as a ratio of 340/380 nm. Ratiometric calcium levels were measured by using 10‐nm‐wide filters centred on 340 and 380 nm, capturing emitted light (485–540 nm) at each excitation wavelength by microscopy at ×400 and directing it to a cooled CCD camera on the microscope. The ratio within each cell was computed using SimplePCI software (Hamamatsu, Sewickley, PA, USA) from images obtained at 340 and 380 nm excitation wavelengths and subtracting the appropriate background fluorescence at each wavelength. Ratios were computed every second for a duration of 2 min.
Transmission electron microscopy
Cells were fixed in 2.5% glutaraldehyde (30 min) and 3% osmium tetroxide (20 min), and were then dehydrated in increasing concentrations of ethanol before routine embedding in Spur resin (Electron Microscopy Science, Fort Washington, PA, USA). Ultrathin sections were viewed by transmission electron microscopy (JEM‐1230, JEOL, Tokyo, Japan) and photomicrographs were taken using a multiscan CCD camera (791 MSC, Gatan, Pleasanton, CA, USA).
In vitro differentiation
Osteogenic differentiation. Fifth‐ to sixth‐passage cells were treated with osteogenic medium for 4 weeks in which medium was changed twice weekly. Osteogenesis was assessed at the second and fourth weeks. Osteogenic medium consists of IMDM supplemented with 0.1 µm dexamethasone (Sigma‐Aldrich), 10 mm beta‐glycerol phosphate (Sigma‐Aldrich), and 0.2 mm ascorbic acid (Sigma‐Aldrich).
Chondrogenic differentiation. Fifth‐ to sixth‐passage cells were transferred to 15‐ml polypropylene tubing and centrifuged at 0.2 g for 5 min to form a pelleted micromass at the bottom of the tube, which was then treated with chondrogenic medium for 4 weeks. Medium was changed twice weekly, and this consisted of high‐glucose IMDM (Sigma‐Aldrich) supplemented with 0.1 µm dexamethasone, 50 µg/ml ascorbic acid, 100 µg/ml sodium pyruvate (Sigma‐Aldrich), 40 µg/ml proline (Sigma‐Aldrich), 10 ng/ml transforming growth factor‐β1, and 50 mg/ml ITS+ premix (Becton Dickinson; 6.25 µg/ml insulin, 6.25 µg/ml transferrin, 6.25 ng/ml selenious acid, 1.25 mg/ml bovine serum albumin, and 5.35 mg/ml linoleic acid).
Adipogenic differentiation. To induce adipogenic differentiation, fifth‐ to sixth‐passage cells were treated with adipogenic medium for 18 days. Adipogenic medium consisted of IMDM supplemented with 0.5 mm 3‐isobutyl‐1‐methylxanthine (Sigma‐Aldrich), 1 µm hydrocortisone (Sigma‐Aldrich), and 0.1 mm indomethacin (Sigma‐Aldrich). Medium was changed twice weekly.
Cytochemical and immunocytochemical staining
For von Kossa staining, cells were washed in PBS and fixed in 3.7% formaldehyde, washed in water and covered with 1% silver nitrate (Sigma‐Aldrich) and put under ultraviolet light for 45 min. Cells were then washed in water for 10 min, and covered with 3% sodium thiosulphate for 5 min. Cell pellets from chondrogenic differentiation were paraffin wax embedded, sectioned, and stained with 3% alcian blue solution for 30 min after dehydration in increasing concentrations of ethanol. For oil red O staining, cells were fixed in 3.7% formaldehyde and stained with oil red O (Sigma‐Aldrich) for 10 min. For immunofluorescence staining, cells were washed in PBS and fixed in 3.7% formaldehyde (Sigma‐Aldrich) for 15 min at room temperature, then permeabilized with 1% Triton X‐100 (Sigma‐Aldrich) for 5 min. After several washes, cells were blocked with 5% foetal bovine serum for 1 h at 37 °C, then incubated with mouse primary antibodies against alpha‐smooth muscle actin (1 : 400; Sigma‐Aldrich) or human albumin (1 : 50; Sigma‐Aldrich) for 1 h at 37 °C. After washing, cells were incubated with Cy‐5‐labelled goat anti‐mouse immunoglobulin G secondary antibody for 1 h (1 : 100; Santa Cruz Biotechnology, Santa Cruz, CA, USA); 4′‐6‐diamidino‐2‐phenylindole (DAPI; Santa Cruz Biotechnology) was used to stain nuclear DNA at 1 : 1000 for 1 h.
Reverse transcriptase–PCR
Total RNA was extracted from 3 × 10⁵ differentiated cells using RNeasy Kit (Qiagen, Stanford, Valencia, CA, USA) according to the manufacturer's instructions. Concentration of RNA samples was quantified using a spectrophotometer (Eppendorf, Hamburg, Germany) at OD260/280 and RNA samples were reverse‐transcribed using reagents (Genemark Technology, Tainan, Taiwan) according to the manufacturer's instructions. cDNA was amplified after initial denaturation at 94 °C for 2 min using Nucleic Acid Purification/Amplification Kit (Genemark Technology) at 94 °C for 1 min, 61.9 °C for 1 min, and 72 °C for 2 min for 32 cycles for osteocalcin, osteopontin and osteonectin, 35 cycles for CaSR, and 28 cycles for GAPDH. Primers used for amplification are osteocalcin: ACATCTATCCGGGAGGAAATC (sense), CTGGCGGTCTCCTCACTC (anti‐sense); osteonectin: AGGTATCTGTGGGAGCTAATC (sense), ATTGCTGCA CACCTTCTC (anti‐sense); osteopontin: GACCTGACA TCCAGTACCC (sense), GTTTCAGCACTCTGGTCATC (anti‐sense); type I collagen: GTGATGCTGGTGCTAAA GG (sense), GGTCCAGCATTTCCAGAG (anti‐sense); type II collagen: GCTGTCCTTCGGTGTCAG (sense), CCAGCTTCACCATCATCAC (anti‐sense); CaSR: GCAC TGGCATCTGTCTCATC (sense), GTTCTCCAGGGAGC CACTC (anti‐sense); fatty acid‐binding protein: GGAAA GTCAAGAGCACCATAAC (sense), CATGACGCATTCC ACCAC (anti‐sense); peroxisome proliferator‐activated receptor: CTTCTCCAGCATTTCTACTCC (sense), GAA GAAACCCTTGCATCC (anti‐sense); and GAPDH: GAGTCCACTGGCGTCTTC (sense), GACTGTGGTCAT GAGTCCTTC (anti‐sense).
Real‐time PCR
Two hundred nanograms of PDSC cDNA was used for relative quantification of Sall4 gene expression with SyBr green as a reporter. Primer sequences were designed by Applied Biosystems software Primer Express 3.0 and amplified by ABI 7700. Sequences were Sall4: GGTGG ATGTCAAACCCAAAGAC (sense), AGTCCCAAAAA CCTTGCTACAGTACT (anti‐sense); and GAPDH: CCAGGTGGTCTC CTCTGACTTC (sense), GTGGTC GTTGAGGGCAATG (anti‐sense).
Results
Cell morphology and population growth kinetics
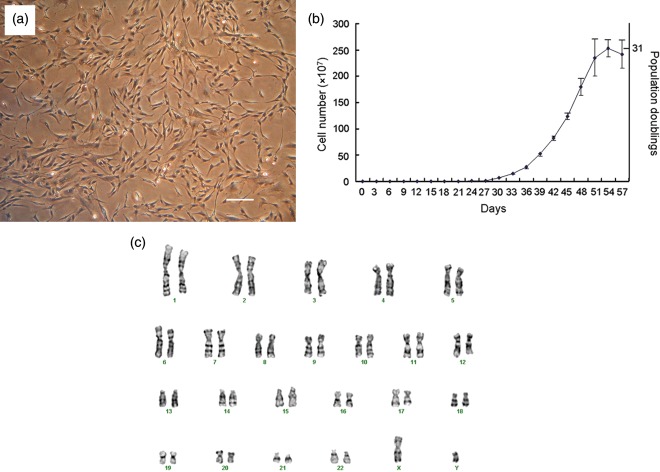
Over the course of the study, surgical specimens of partial parathyroid glands were obtained from five donors. All of the specimens were enzymatically digested and plated with an average of 30 cells onto each 96‐well plate after limiting dilution. On average, only 2–3 cells out of 30 per plate proliferated and expanded into colonies. We obtained a total of 55 proliferating clones from five donors and randomly chose 10 clones for further differentiation into mesodermal lineages. However, not all the clones differentiated and, thus, did not possess stem cell characteristics. Out of the 10 clones, only six differentiated into all three mesodermal cell types. Subsequently, we used only clones that underwent differentiation for further characterization studies. We analysed four clones from two different donors (two clones per donor) for cell population growth kinetics. Clonally expanded cells were plate‐adherent and spindle‐shaped (Fig. 1a). Population doubling times of single cell colonies were calculated to be 70.7 ± 14.5 h (mean ± standard deviation) and were able to be passaged at least 19 times from 1 to 3 flasks upon 60% confluence, before reaching a maximum number of 2.5 × 10⁹ cells and corresponding to 31 population doublings over 53 days in vitro culture (Fig. 1b). Cell cytogenetic karyotypes of isolated clonally expanded cells from a male donor revealed one X and one Y chromosome and normal diploid complement of autosomes (Fig. 1c) with no obvious chromosomal rearrangements, as judged by Giemsa banding after in vitro cell culture.
Figure 1.
Cell morphology, population growth kinetics and karyotype. Cells clonally expanded by limiting dilution were plate‐adherent and spindle‐shaped (a; scale bar: 100 µm). Single cells rapidly proliferated and reached 31 population doublings in 53 days (b). Giemsa band karyogram showing chromosomes with a normal karyotype (c).
Cell surface phenotyping
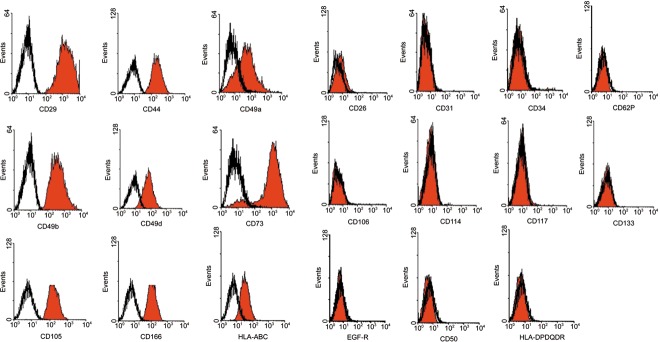
Surface phenotype of the cells was characterized by flow cytometric analysis and was positive for integrins CD29 (beta1 integrin), CD49a (alpha1 integrin), CD49b (alpha2 integrin) and CD49d (alpha4 integrin); positive for matrix receptors CD44 (hyaluronate receptor) and CD105 (endoglin); and positive for CD73, CD166 and HLA‐ABC. Cells were negative for CD34, CD133, CD117 (c‐kit) and CD114, indicating that these cells were not of haematopoietic origin. Cells were also negative for matrix receptors CD31 (PECAM‐1) and CD62P (P‐selectin), and negative for EGF‐R, CD26, CD50, CD106 and HLA‐DR (Fig. 2).
Figure 2.
Cell surface phenotypes. Cells are positive for CD29, CD49a, CD49b, CD49d, CD44, CD105, CD73, CD166 and HLA‐ABC and negative for CD34, CD133, CD117, CD114, CD31,CD62P, EGF‐R, CD26, CD50, CD106 and HLA‐DR.
Telomerase activity and pluripotent gene expression
Fifth‐passage PDSCs cultured in expansion medium were harvested and cell lysates were analysed by TRAP assay to demonstrate the level of telomerase activity. Cells expressed higher levels of telomerase activity (Fig. 3a) than FS‐5 (a foreskin fibroblast cell line) under gel electrophoresis which correlated to an earlier result that PDSCs could be sub‐cultured for a prolonged period of time. Real‐time PCR analysis revealed that PDSCs exhibited higher levels of Sall4 expression (Fig. 3b) than FS‐5 cells. Student's t‐test statistical analysis was performed.
Figure 3.
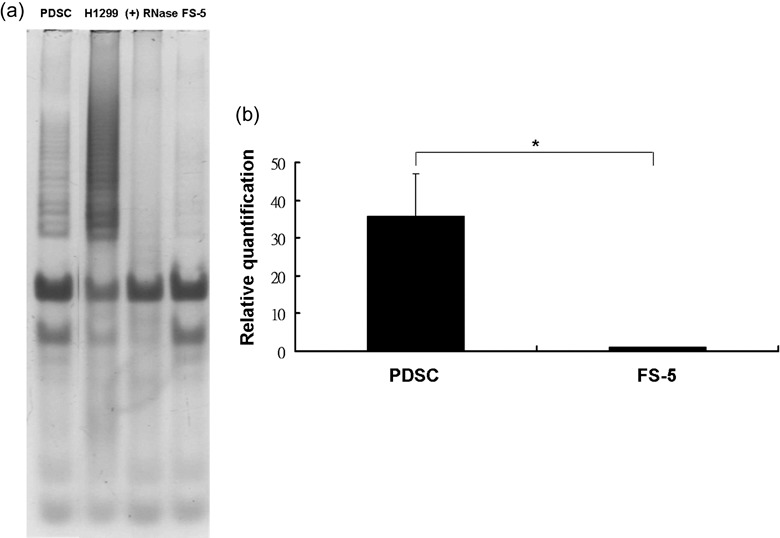
Telomerase activity and Sall4 gene expression of parathyroid‐derived stem cells (PDSC). Clonally derived cells demonstrated a level of telomerase activity by TRAP assay (a). H1299 (lung carcinoma cells; positive control). (+) RNase (PDSC with RNase treatment). FS‐5 (foreskin fibroblasts). Sall‐4 gene expression of PDSCs was significantly higher compared to foreskin fibroblasts (FS‐5) (b).
Real‐time imaging of cellular uptake of extracellular calcium
After staining live cells in serum‐free medium with 5 µm Fura‐2 dye for 30 min, cells were washed and covered with PBS containing 0.5 µm CaCl2. A total of 24 PDSCs from two different donors (12 cells per donor, two clones per donor) were observed for real‐time calcium uptake. Representative imaging of four different cells is shown, graph Fig. 4(a) where each cell is represented by a different coloured line. During a time course of 2 min, the ratio of 340/380 nm was altered as cells took up extracellular calcium and this corresponded to an increase in peak ratio due to increase in 340 nm intensity (Fig. 4a). The first cell that demonstrated uptake did so at around 45 s after immersing cells with calcium, the second cell at around 60 s, and the third cell at around 100 s. No response was recorded for the fourth cell in the 2‐min cut‐off observation period; however, calcium uptake was eventually observed after 3 min. Of the 24 PDSCs, all demonstrated calcium influx within 3 min, although at different time points. Change in 340/380 nm ratio could be observed by immunofluoresecence microscopy, in which cells were yellow before calcium uptake (Fig. 4b) but turned red after uptake (Fig. 4c).
Figure 4.
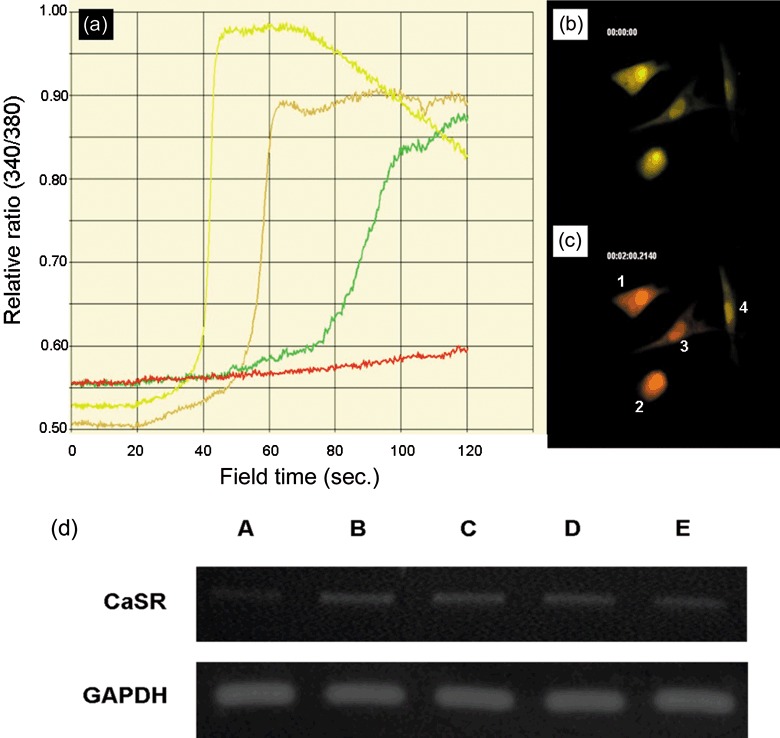
Extracellular calcium (Ca) ion uptake by parathyroid‐derived stem cells (PDSC) and expression of Ca‐sensing receptor. Representative real‐time cellular uptake of extracellular Ca ion over 2 min (a). All treated cells demonstrated Ca uptake by 3 min. Cells numbered 1 to 4 in (c) correspond to yellow, brown, green and red lines in (a), respectively. Yellow cell fluorescence before Ca uptake (b). Red cell fluorescence after Ca uptake (c). CaSR gene expression (d). CaSR gene was upregulated after 3 weeks culture in keratinocyte medium with vitamin D and Ca (lane B), keratinocyte medium with Ca (lane C), and keratinocyte medium with vitamin D (lane D) compared to keratinocyte medium only (lane A). An osteosarcoma cell line SaOS2 was used as positive control (lane E).
Upregulation of calcium‐sensing receptor gene expression
After culturing cells in keratinocyte medium with or without vitamin D or calcium for 3 weeks, cells were analysed by RT‐PCR for CaSR gene expression (Fig. 4d). Cells cultured in keratinocyte medium with calcium (0.5 µm) and vitamin D (20 nm; lane B), with calcium only (0.5 µm; lane C), or with vitamin D (20 nm) only (lane D) all demonstrated upregulation of CaSR when compared to cells cultured in keratinocyte medium only (lane A).
Presence of intracellular alpha‐smooth muscle actin
Cells cultured in keratinocyte medium with (Fig. 5d,e) or without calcium (Fig. 5a–c) were trypsinized and centrifuged at 600 r.p.m. and grown as pellet culture in a 15‐ml tube for 3 days prior to sectioning for transmission electron microscopy. Cells demonstrated possible alpha‐smooth muscle actin (red arrows) in multiple, intense dark regions. Antibody to alpha‐smooth muscle actin was used at fluorescence microscope level (Fig. 5a) and presence of the fibres was demonstrated, expressed as red immunofluorescence. Blue fluorescence indicates DAPI staining of DNA.
Figure 5.
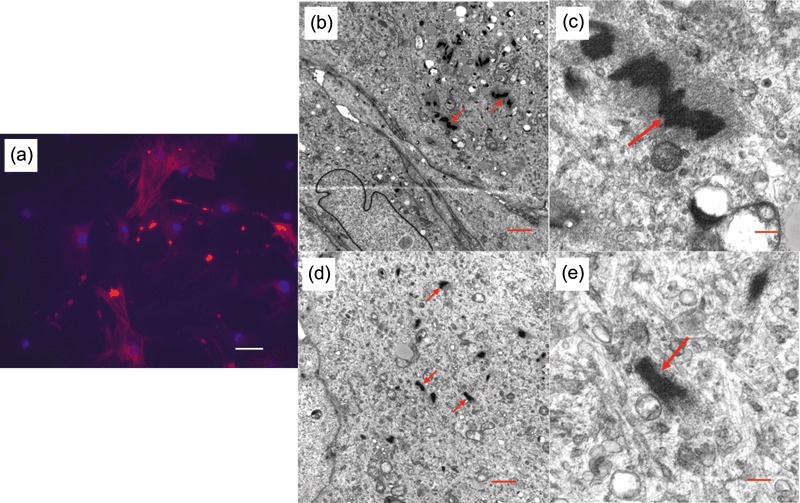
Alpha‐smooth muscle actin. Red immunofluorescence staining of alpha‐smooth muscle actin (a). DAPI stains DNA blue. Parathyroid‐derived stem cells (PDSC) cultured in keratinocyte medium only (a–c) or with calcium (d,e) demonstrates alpha‐smooth mucle actin in the cytoplasm (red arrows). Scale bars: A (50 µm), B (1 µm), C (0.2 µm), D (1 µm), E (0.2 µm).
In vitro differentiation
Cells were induced to differentiate in osteogenic media for 4 weeks and RT‐PCR analysis revealed upregulation in gene expression of osteogenic genes for osteocalcin, osteonectin, osteopontin and type I collagen compared to undifferentiated PDSCs after 2 and 4 weeks of induction (Fig. 6a). Calcium mineralization was also apparent after 4 weeks induction, revealed by von Kossa staining (Fig. 6b). Increase in type II collagen expression was observed by RT‐PCR after 2 weeks chondrogenic induction (Fig. 6c), and presence of acidic proteoglycans was demonstrated by alcian blue stain (Fig. 6d,e). Upregulation of fatty acid‐binding protein and peroxisome proliferator‐activated receptor gamma gene expression (Fig. 6f) and presence of fat droplets (Fig. 6g) was evident after 18 days adipogenic differentiation.
Figure 6.
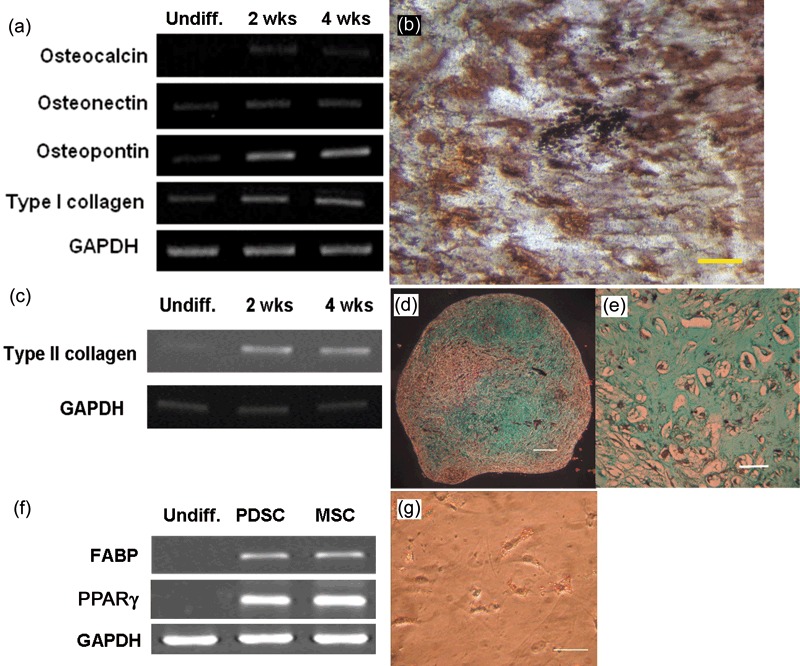
Osteogenic, chondrogenic and adipogenic differentiation of parathyroid‐derived stem cells (PDSC). Upregulation of osteogenic gene expression after 2 and 4 weeks of osteogenic differentiation (a) and presence of Ca mineralization by von Kossa stain (b; scale bar: 50 £gm) after 4 weeks of osteogenic induction. Upregulation of type II collagen gene expression after 2 and 4 weeks of chondrogenic differentiation (c) and alcian blue stain in (d) (scale bar: 200 £gm) and (e) (scale bar: 50 £gm). Upregulation of adipogenic gene expression fatty acid‐binding protein (FABP) and peroxisome proliferator‐activated receptor‐gamma (PPARγ; f) and presence of fat droplets after just 18 days of adipogenic induction in (g) (scale bar: 50 £gm).
Discussion
In this study, we successfully isolated stem cells from the parathyroid gland that were capable of self‐renewal and could differentiate into mesenchymal lineages. PDSCs also had normal chromosomal karyotyping after in vitro culture. In order to achieve a relatively homogeneous population of cells for further characterization, we clonally expanded single cells for this study. Our results demonstrate strikingly similar cell population growth characteristics to previously reported postnatal mesenchymal stem cells (MSC) from bone marrow (20) and umbilical cord blood (12) in in vitro culture. Cells were spindle‐shaped, plate‐adherent, and were able to be substantially sub‐cultured in vitro. Cell surface phenotype characterization by flow cytometry showed them to be similar to those of previously reported MSCs, in which a set of MSC‐related markers, such as CD73 and CD105, were apparent while endothelial and haematopoietic lineage markers were absent. Presence of telomerase activity in the isolated cells showed their distinction from terminally differentiated somatic cells, which would otherwise not be detected. In addition, telomerase activity in PDSCs was found from passage 5 PDSCs but not from passage 11 PDSCs (data not shown). Adding further to the evidence, cells expressed a pluripotent marker Sall4, this has recently found to be a transcriptional activator of Oct4 and plays an important role in maintenance of embryonic stem cell pluripotency by modulating Oct4 expression (23, 24). In addition, it was found that the Bmi‐1 promoter is activated by Sall4 in a dose‐dependent manner in the adult haematopoietic system (25).
A previous report has demonstrated that parathyroid cells can be isolated and cultured in vitro and are able to regulate parathyroid hormone secretion through the presence of CaSR responding to extracellular calcium (26). The different time of response of individual PDSCs to extracellular calcium is an interesting phenomenon and must be further investigated as to whether time of response would correspond to differentiation ability into potential parathyroid hormone‐secreting cells. CaSR gene expression in PDSCs was evident under culture in keratinocyte medium with or without calcium or vitamin D. This suggests that under our culture conditions, cells may be induced to express CaSR on their cell membranes and respond to extracellular calcium. Surprisingly, cells cultured in keratinocyte medium with or without calcium also expressed alpha‐smooth muscle actin, which is a common mesodermal marker of skeletal myoblasts, smooth muscle precursors and pericytes (27, 28, 29), and suggests that these cells may originate from the mesodermal lineage. Furthermore, under in vitro induction, we were able to differentiate PDSC cell fates into mesodermal lineages, such as osteoblasts, chondrocytes and adipocytes. From our results, PDSCs display a variety of characteristics that are highly similar to MSCs. This leads to the question as to whether isolated PDSCs occured as a result of culture artefact or in fact supports the accumulating evidence of stem cells residing in almost all postnatal tissues. Several previous studies reporting isolation of stem cells in adult human tissues, such as bone marrow (20, 30, 31), brain (32), cornea (33), and thyroid (34), all support the presence of stem cells in postnatal tissues and one study took a step further to transplant umbilical cord blood‐derived MSCs into patients with Buerger's disease (35). PDSCs with their mesodermal fate under in vitro induction conditions correlate to a recent finding in mice which implicates MSCs as residing in virtually all postnatal organs including brain, spleen, liver, kidney, lung, bone marrow, muscle, thymus and pancreas (36). However, under current culture conditions, it is possible that the cells may be reprogrammed from a relatively mature state into one with greater differentiation potential and therefore, facilitating differentiation into mesodermal lineages. Another postulation remains to be validated for resemblance of PDSCs to MSCs, is whether these cells originate from the perivascular region as suggested by many studies on MSCs (19, 37, 38). Nevertheless, it would be difficult to de‐differentiate highly differentiated cells, and our results suggest that there are stem/progenitor cells in the parathyroid tissue.
Apart from determining the origin of PDSCs and their role in postnatal tissues, future efforts will focus on establishing in vitro induction conditions of PDSCs into functional cells that secrete parathyroid hormone in response to extracellular calcium ion regulation.
Acknowledgement
This work was supported by intramural research grants from Taipei Veterans General Hospital, Taiwan (V95E1‐009 and V96E1‐005).
References
- 1. Xu PX, Zheng W, Laclef C, Maire P, Maas RL, Peters H et al (2002) Eya1 is required for the morphogenesis of mammalian thymus, parathyroid and thyroid. Development 129, 3033–3044. [DOI] [PMC free article] [PubMed] [Google Scholar]
- 2. Krumlauf R (1994) Hox genes in vertebrate development. Cell 78, 191–201. [DOI] [PubMed] [Google Scholar]
- 3. Peters H, Neubuser A, Kratochwil K, Balling R (1998) Pax9‐deficient mice lack pharyngeal pouch derivatives and teeth and exhibit craniofacial and limb abnormalities. Genes Dev. 12, 2735–2747. [DOI] [PMC free article] [PubMed] [Google Scholar]
- 4. Brown EM (1991) Extracellular Ca2+ sensing, regulation of parathyroid cell function, and role of Ca2+ and other ions as extracellular (first) messengers. Physiol. Rev. 71, 371–411. [DOI] [PubMed] [Google Scholar]
- 5. Potts JT (2005) Parathyroid hormone: past and present. J. Endocrinol. 187, 311–325. [DOI] [PubMed] [Google Scholar]
- 6. Pittenger MF, Mackay AM, Beck SC, Jaiswal RK, Douglas R, Mosca JD et al (1999) Multilineage potential of adult human mesenchymal stem cells. Science 284, 143–147. [DOI] [PubMed] [Google Scholar]
- 7. Song L, Webb NE, Song Y, Tuan RS (2006) Identification and functional analysis of candidate genes regulating mesenchymal stem cell self‐renewal and multipotency. Stem Cells 24, 1707–1718. [DOI] [PubMed] [Google Scholar]
- 8. Yen ML, Chien CC, Chiu IM, Huang HI, Chen YC, Hu HI et al (2007) Multilineage differentiation and characterization of the human fetal osteoblastic 1. 19 cell line: a possible in vitro model of human mesenchymal progenitors. Stem Cells 25, 125–131. [DOI] [PubMed] [Google Scholar]
- 9. Zannettino AC, Harrison K, Joyner CJ, Triffitt JT, Simmons PJ (2003) Molecular cloning of the cell surface antigen identified by the osteoprogenitor‐specific monoclonal antibody, HOP‐26. J. Cell Biochem. 89, 56–66. [DOI] [PubMed] [Google Scholar]
- 10. Rehman J, Traktuev D, Li J, Merfeld‐Clauss S, Temm‐Grove CJ, Bovenkerk JE et al (2004) Secretion of angiogenic and antiapoptotic factors by human adipose stromal cells. Circulation 109, 1292–1298. [DOI] [PubMed] [Google Scholar]
- 11. Mochizuki T, Muneta T, Sakaguchi Y, Nimura A, Yokoyama A, Koga H et al (2006) Higher chondrogenic potential of fibrous synovium‐ and adipose synovium‐derived cells compared with subcutaneous fat‐derived cells: distinguishing properties of mesenchymal stem cells in humans. Arthritis Rheum. 54, 843–853. [DOI] [PubMed] [Google Scholar]
- 12. Lee OK, Kuo TK, Chen WM, Lee KD, Hsieh SL, Chen TH (2004) Isolation of multipotent mesenchymal stem cells from umbilical cord blood. Blood 103, 1669–1675. [DOI] [PubMed] [Google Scholar]
- 13. Hierlihy AM, Seale P, Lobe CG, Rudnicki MA, Megeney LA (2002) The post‐natal heart contains a myocardial stem cell population. FEBS Lett. 530, 239–243. [DOI] [PubMed] [Google Scholar]
- 14. Urbanek K, Quaini F, Tasca G, Torella D, Castaldo C, Nadal‐Ginard B et al (2003) Intense myocyte formation from cardiac stem cells in human cardiac hypertrophy. Proc. Natl. Acad. Sci. USA 100, 10440–10445. [DOI] [PMC free article] [PubMed] [Google Scholar]
- 15. Pagano SF, Impagnatiello F, Girelli M, Cova L, Grioni E, Onofri M et al (2000) Isolation and characterization of neural stem cells from the adult human olfactory bulb. Stem Cells 18, 295–300. [DOI] [PubMed] [Google Scholar]
- 16. Deasy BM, Jankowski RJ, Huard J (2001) Muscle‐derived stem cells: characterization and potential for cell‐mediated therapy. Blood Cells Mol. Dis. 27, 924–933. [DOI] [PubMed] [Google Scholar]
- 17. Bonner‐Weir S, Taneja M, Weir GC, Tatarkiewicz K, Song KH, Sharma A et al (2000) In vitro cultivation of human islets from expanded ductal tissue. Proc. Natl. Acad. Sci. USA 97, 7999–8004. [DOI] [PMC free article] [PubMed] [Google Scholar]
- 18. Roh C, Tao Q, Lyle S (2004) Dermal papilla‐induced hair differentiation of adult epithelial stem cells from human skin. Physiol. Genomics 19, 207–217. [DOI] [PubMed] [Google Scholar]
- 19. Gronthos S, Mankani M, Brahim J, Robey PG, Shi S (2000) Postnatal human dental pulp stem cells (DPSCs) in vitro and in vivo . Proc. Natl. Acad. Sci. USA 97, 13625–13630. [DOI] [PMC free article] [PubMed] [Google Scholar]
- 20. Lee KD, Kuo TK, Whang‐Peng J, Chung YF, Lin CT, Chou SH et al (2004) In vitro hepatic differentiation of human mesenchymal stem cells. Hepatology 40, 1275–1284. [DOI] [PubMed] [Google Scholar]
- 21. Ronne M (1990) Chromosome preparation and high resolution banding. In Vivo 4, 337–365. [PubMed] [Google Scholar]
- 22. Kim NW, Piatyszek MA, Prowse KR, Harley CB, West MD, Ho PL et al (1994) Specific association of human telomerase activity with immortal cells and cancer. Science 266, 2011–2015. [DOI] [PubMed] [Google Scholar]
- 23. Rodda DJ, Chew JL, Lim LH, Loh YH, Wang B, Ng HH et al (2005) Transcriptional regulation of nanog by OCT4 and SOX2. J. Biol. Chem. 280, 24731–24737. [DOI] [PubMed] [Google Scholar]
- 24. Zhang J, Tam WL, Tong GQ, Wu Q, Chan HY, Soh BS et al (2006) Sall4 modulates embryonic stem cell pluripotency and early embryonic development by the transcriptional regulation of Pou5f1. Nat. Cell Biol. 8, 1114–1123. [DOI] [PubMed] [Google Scholar]
- 25. Yang J, Chai L, Liu F, Fink LM, Lin P, Silberstein LE et al (2007) Bmi‐1 is a target gene for SALL4 in hematopoietic and leukemic cells. Proc. Natl. Acad. Sci. USA 104, 10494–10499. [DOI] [PMC free article] [PubMed] [Google Scholar]
- 26. Roussanne MC, Gogusev J, Hory B, Duchambon P, Souberbielle JC, Nabarra B et al (1998) Persistence of Ca2+ ‐sensing receptor expression in functionally active, long‐term human parathyroid cell cultures. J. Bone Miner. Res. 13, 354–362. [DOI] [PubMed] [Google Scholar]
- 27. Springer ML, Ozawa CR, Blau HM (2002) Transient production of α‐smooth muscle actin by skeletal myoblasts during differentiation in culture and following intramuscular implantation. Cell Motil. Cytoskeleton 51, 177–186. [DOI] [PubMed] [Google Scholar]
- 28. Schlingemann RO, Rietveld FJ, Kwaspen F, Van De Kerkhof PC, De Waal RM, Ruiter DJ (1991) Differential expression of markers for endothelial cells, pericytes, and basal lamina in the microvasculature of tumors and granulation tissue. Am. J. Pathol. 138, 1335–1347. [PMC free article] [PubMed] [Google Scholar]
- 29. Hirschi KK, D’Amore PA (1996) Pericytes in the microvasculature. Cardiovasc. Res. 32, 687–698. [PubMed] [Google Scholar]
- 30. Bhatia M, Wang JC, Kapp U, Bonnet D, Dick JE (1997) Purification of primitive human hematopoietic cells capable of repopulating immune‐deficient mice. Proc. Natl. Acad. Sci. USA 94, 5320–5325. [DOI] [PMC free article] [PubMed] [Google Scholar]
- 31. Rafii S, Shapiro F, Rimarachin J, Nachman RL, Ferris B, Weksler B et al (1994) Isolation and characterization of human bone marrow microvascular endothelial cells: hematopoietic progenitor cell adhesion. Blood 84, 10–19. [PubMed] [Google Scholar]
- 32. McKay R (1997) Stem cells in the central nervous system. Science 276, 66–71. [DOI] [PubMed] [Google Scholar]
- 33. Daniels JT, Dart JK, Tuft SJ, Khaw PT (2001) Corneal stem cells in review. Wound Repair Regen 9, 483–494. [DOI] [PubMed] [Google Scholar]
- 34. Thomas T, Nowka K, Lan L, Derwahl M (2006) Expression of endoderm stem cell markers: evidence for the presence of adult stem cells in human thyroid glands. Thyroid 16, 537–544. [DOI] [PubMed] [Google Scholar]
- 35. Kim SW, Han H, Chae GT, Lee SH, Bo S, Yoon JH et al (2006) Successful stem cell therapy using umbilical cord blood‐derived multipotent stem cells for Buerger's disease and ischemic limb disease animal model. Stem Cells 24, 1620–1626. [DOI] [PubMed] [Google Scholar]
- 36. Da Silva Meirelles L, Chagastelles PC, Nardi NB (2006) Mesenchymal stem cells reside in virtually all post‐natal organs and tissues. J. Cell Sci. 119, 2204–2213. [DOI] [PubMed] [Google Scholar]
- 37. Bianco P, Riminucci M, Gronthos S, Robey PG (2001) Bone marrow stromal stem cells: nature, biology, and potential applications. Stem Cells 19, 180–192. [DOI] [PubMed] [Google Scholar]
- 38. Farrington‐Rock C, Crofts NJ, Doherty MJ, Ashton BA, Griffin‐Jones C, Canfield AE (2004) Chondrogenic and adipogenic potential of microvascular pericytes. Circulation 110, 2226–2232. [DOI] [PubMed] [Google Scholar]


