

Abstract
Background
South Asians have a relatively high prevalence of coronary artery calcium (CAC) compared with other race/ethnic groups. We determined CAC incidence and progression among South Asians, and compared them with 4 race/ethnic groups.
Methods and Results
Data from the MASALA (Mediators of Atherosclerosis in South Asians Living in America) study were used to calculate CAC incidence and progression rates and any CAC change. Data from the MESA (Multi‐Ethnic Study of Atherosclerosis) were used to compare the CAC incidence and progression rates. A total of 698 South Asians had repeat CAC measurements after 4.8±0.8 years. Among those with no CAC at baseline, the age‐adjusted CAC incidence was 8.8% (95% CI, 6.8–10.8%) in men and 3.6% (2.5–4.8%) in women. The median annual CAC progression was 26 (interquartile range, 11–62) for men and 13 (interquartile range, 4–34) for women. Compared with MESA, age‐adjusted CAC incidence was similar in South Asian men compared with white, black, and Latino men, but significantly higher than Chinese men (11.1% versus 5.7%, P=0.008). After adjusting for age, diabetes mellitus, hypertension, and statin medication use, Chinese, black, and Latino men had significantly less CAC change compared with South Asian men, but there were no differences between South Asian and white men. There was no difference in CAC incidence or progression between South Asian women and women in MESA.
Conclusions
South Asian men had greater CAC change than Chinese, black, and Latino men but similar change to that of whites after adjusting for traditional risk factors.
Keywords: coronary artery calcium, epidemiology, ethnic differences
Subject Categories: Epidemiology, Race and Ethnicity
Clinical Perspective
What Is New?
South Asian men had higher incidence and progression of coronary artery calcium (CAC) than South Asian women.
After accounting for other risk factors for cardiovascular disease, South Asian men had greater change in CAC compared with men from other ethnic minority groups (blacks, Latinos, and Chinese Americans), but similar change in CAC compared with white men.
What Are the Clinical Implications?
The relatively high burden of CAC and change in CAC among South Asian men may be an important prognostic marker of cardiovascular disease.
Introduction
South Asians have a higher risk of myocardial infarction1, 2 and higher proportionate mortality from cardiovascular disease compared with most other race/ethnic groups in the United States.3, 4 A recent American Heart Association review of South Asians concluded that a majority of the atherosclerotic cardiovascular disease risk can be explained by the increased prevalence of known risk factors, and that no unique risk factors have been found in this population.5 Yet the fact remains that there are high atherosclerotic cardiovascular disease event rates in South Asians, and there are few prospective cohort studies in the world that have focused on determining the risk factors associated with atherosclerotic cardiovascular disease.
Coronary artery calcification (CAC) is a novel risk marker and independent predictor of atherosclerotic cardiovascular disease in whites and other US race/ethnic groups.6, 7 Moreover, the progression of CAC measured by serial computed tomography (CT) scans has also been independently associated with incident heart disease and mortality in US populations.8, 9, 10 CAC burden differs among different race/ethnic groups with whites having higher CAC prevalence and progression than blacks, Latinos, and Chinese Americans in the MESA (Multi‐Ethnic Study of Atherosclerosis)11, 12, 13 and in other samples.14, 15 However, no studies have conducted repeat CAC measurements in South Asians to determine the incidence and progression of CAC.
We have been studying the prevalence and progression of subclinical atherosclerosis among South Asians in the MASALA (Mediators of Atherosclerosis in South Asians Living in America) study.16 In analyses of baseline data, we found that South Asian men had similar CAC prevalence compared with white men but higher CAC prevalence than the other 3 race/ethnic minority men in MESA, while South Asian women had similar CAC prevalence as all women in MESA.17 In the present study, we used data from the second MASALA examination to determine the overall incidence and progression of CAC among South Asians and the covariates associated with any change in CAC in this ethnic group. In an age‐restricted sample, we compared the annual age‐adjusted incidence and progression of CAC among South Asian men and women with that of the 4 race/ethnic groups in MESA and determined whether adjustment for traditional cardiovascular risk factors attenuated any race/ethnic differences in CAC change.
Methods
The data that support the findings of this study are available from the corresponding author upon reasonable request.
The MASALA study is a community‐based prospective cohort of South Asian men and women from 2 clinical sites (San Francisco Bay Area at the University of California, San Francisco and the greater Chicago area at Northwestern University). The baseline examination was conducted from October 2010 through March 2013, and a total of 906 participants were enrolled. Study recruitment, eligibility criteria, and procedures and tests have been reported previously.16 Briefly, to be eligible for MASALA, participants had to be between ages 40 to 84 years, have South Asian ancestry, and be able to speak, read, and write in English, Hindi, or Urdu. We created MASALA to be parallel in methods and measures to the MESA to compare South Asians with 4 different US race/ethnic groups, using identical exclusion criteria.16, 18 All surviving cohort participants were invited for the second clinical examination during September 2015 through March 2018 and 749 (83%) participants completed this examination. The institutional review boards of University of California, San Francisco and Northwestern University approved the protocol, and all participants gave written informed consent.
Trained, bilingual research coordinators conducted both examination visits. We obtained data on sociodemographic information, tobacco and alcohol use, physical activity,19 and medication use at both examinations. Seated blood pressure was measured 3 times using an automated blood pressure monitor and the average of the last 2 readings was used for analysis. Hypertension was defined as self‐reported treatment for hypertension or a systolic blood pressure ≥140 mm Hg or diastolic blood pressure ≥90 mm Hg. Participant weight was measured on a digital weighing scale and height using a stadiometer. Waist circumference was measured using a flexible tape measure tape at the site of maximum circumference midway between the lower ribs and the anterior superior iliac spine. Fasting blood tests were obtained after a 12‐hour fast. Fasting plasma glucose was measured by the hexokinase method; total cholesterol, triglycerides, and high‐density lipoprotein cholesterol were measured by enzymatic methods (Quest, San Jose, CA) and low‐density lipoprotein cholesterol was calculated.20 Diabetes mellitus was defined if a participant was using a glucose‐lowering medication or had a fasting plasma glucose ≥126 mg/dL.21
At examination 1, we measured ectopic fat depots from abdominal and cardiac CT scans using standardized protocols. For the abdominal measurements of visceral fat area, a trained radiology technician used a lateral scout image of the spine to establish the correct position (between the L4 and L5 vertebrae) as previously reported.22, 23 We used the cardiac CT images to measure pericardial fat volume and hepatic fat attenuation.23
CAC Measurements
Cardiac‐gated CT scans were performed at both clinical examinations using CT scanners as previously described.16 Participants were in a supine position and a scout image was taken to determine the level of the carina. Scanning was performed from superior to inferior, and a total of 46 images were obtained. All CT scans were sent to the Reading Center at the Los Angeles Biomedical Research Center, Torrance, CA, where they were read with Rephot Imaging software according to published methods.24 Agatston scores were reported for each of the 4 major coronary arteries and the sum of the unadjusted score was used. A total of 701 participants had CAC scores from both examination 1 and 2. We excluded 3 participants who had prevalent heart disease at examination 1, resulting in 698 MASALA participants included in this analysis.
MESA Methods
MESA is a longitudinal cohort of 6814 community‐dwelling participants from 4 different race/ethnic groups recruited from 6 different clinical centers that has determined the prevalence and progression of subclinical atherosclerosis.18 The eligibility criteria required no prior history of cardiovascular disease, and age between 45 and 84 years at baseline.18 Examination 1 was conducted from 2000 to 2002, examination 2 was conducted from 2002 to 2004, and examination 3 was conducted from 2004 to 2006. All MESA participants gave informed consent and the institutional review board at each site approved the study protocol.
Identical questionnaires and procedures for anthropometric, blood pressure, and laboratory measurements were used in MESA as described above for MASALA. CAC was measured at examination 1 and follow‐up CAC measurements were performed on approximately half the cohort at examination 2 (n=2953) and the other half of the cohort at examination 3 (n=2806).13, 25 Both MESA and MASALA used the same cardiac CT reading center, and all images were interpreted at the Los Angeles Biomedical Research Center for measurements of CAC. We used total Agatston scores for CAC measures from both studies, without phantom adjustment.
For our comparison of the 2 study populations, we used data from the MASALA study participants in the age range represented in the MESA study (ages 45–84 years) at baseline, and only include participants from both studies who had a repeat CAC measurement, and no prevalent cardiovascular disease.
Statistical Analyses
We classified incident CAC as any CAC at examination 2 (or examination 3 in MESA) in a participant who had no CAC at examination 1, then calculated age‐adjusted incidence rates for any new CAC per 100 person‐years. We also examined annualized change in CAC among those with any CAC at examination 1, again adjusting for age. All analyses were stratified by sex.
We determined which traditional, metabolic, and ectopic fat measurements were associated with CAC progression within the MASALA population. We modeled CAC change using data from the entire cohort including those with zero CAC scores at examination 1. We coded 13 participants with negative change scores as having no CAC change, and log‐transformed change in CAC+1. We used linear regression models both for univariate analyses and for a multivariable model including variables selected a priori (age, sex, and current smoking) from selected groups (lipids, blood pressure, diabetes mellitus, body composition, behaviors, and medications used).
We compared the incidence of new CAC and progression of CAC among the South Asian men and women with the 4 race/ethnic groups in MESA, adjusting for age. In a subgroup analysis of incident CAC and CAC progression among men, we excluded all participants who were using statins. We also created linear models for log annualized change in CAC to compare the South Asian men (reference group) with men in the 4 race/ethnic groups in MESA. We adjusted these models for age (linear and nonlinear), hypertension, diabetes mellitus, and statin medication use.
We used SAS, version 9.3 (SAS Institute) and STATA 15.1 (College Station, TX) for our analyses.
Results
There were 698 MASALA study participants (57% men) without any prevalent cardiovascular disease who had a repeat cardiac CT scan at examination 2, after ≈4.8±0.8 years of follow‐up. Characteristics of the MASALA study population at examination 1 and 2 are shown in Table 1. Men were older, more likely to smoke and drink alcohol, and had a worse risk factor profile than women. Both men and women experienced significant increases in body mass index, waist circumference, systolic and diastolic blood pressure, and fasting glucose levels between examination 1 and examination 2. Approximately 72 (41%) men and 37 (16%) women with no detectable CAC at examination 1 developed incident CAC, with an age‐adjusted annual incidence rate of 8.8% (6.8–10.8%) in men and 3.6% (2.5–4.8%) in women. Among the 290 participants who had CAC detected at examination 1, the median annual CAC progression was 26 (interquartile range 11–62) for South Asian men and 13 (interquartile range 4–34) for women.
Table 1.
Characteristics of the MASALA Study Participants by Sex at Examination 1 and Examination 2*
| Men (n=395) | Women (n=303) | |||||
|---|---|---|---|---|---|---|
| Examination 1 | Examination 2 | P Value | Examination 1 | Examination 2 | P Value | |
| Age, y | 56±10 | 60±10 | <0.001 | 54±8 | 58±9 | <0.001 |
| Current smoker | 21 (5) | 18 (5) | 0.62 | 3 (1) | 2 (1) | 0.65 |
| Alcohol use ≥1 drink/d | 188 (48) | 195 (49) | 0.62 | 63 (21) | 69 (23) | 0.55 |
| Exercise, MET‐min/wk | 1050 (420–1965) | 1260 (472–2190) | 0.05 | 840 (315–1875) | 1155 (465–2100) | 0.01 |
| BMI, kg/m2 | 25.8±3.7 | 26.3±3.7 | 0.001 | 25.8±4.2 | 26.7±4.3 | 0.001 |
| Waist circumference, cm | 95.8±9.4 | 97.2±9.6 | <0.001 | 88.5±9.8 | 91.4±10.8 | <0.001 |
| Systolic blood pressure, mm Hg | 126±14 | 130±16 | <0.001 | 122±17 | 125±18 | <0.001 |
| Diastolic blood pressure, mm Hg | 76±9 | 77±9 | <0.001 | 69±10 | 73±9 | <0.001 |
| Hypertension† | 168 (43) | 221 (56) | <0.001 | 101 (33) | 117 (39) | 0.18 |
| Diabetes mellitus ‡ | 106 (27) | 128 (32) | 0.10 | 56 (19) | 66 (22) | 0.32 |
| LDL‐cholesterol, mmol/L | 2.8±0.8 | 2.8±0.9 | 0.96 | 2.9±0.8 | 3.0±0.8 | 0.96 |
| HDL‐cholesterol, mmol/L | 1.1 (1.0–1.3) | 1.2 (1.0–1.3) | 0.42 | 1.4 (1.2–1.7) | 1.5 (1.2–1.7) | 0.41 |
| Triglycerides, mmol/L | 1.4 (1.0–1.9) | 1.3 (1.0–1.8) | 0.04 | 1.2 (0.9–1.6) | 1.3 (1.0–1.7) | 0.11 |
| Fasting glucose, mmol/L | 5.9±1.4 | 6.3±1.4 | <0.001 | 5.4±1.1 | 5.7±1.0 | <0.001 |
| Statin medication use | 121 (31%) | 148 (37%) | 0.04 | 61 (20%) | 67 (27%) | 0.55 |
| CAC score | ||||||
| Zero | 174 (44.1) | 102 (25.8) | <0.001 | 234 (77.2) | 197 (65.0) | <0.001 |
| 1–100 | 115 (29.1) | 132 (33.4) | 46 (15.2) | 67 (22.1) | ||
| 101–400 | 63 (16.0) | 77 (19.5) | 14 (4.6) | 23 (7.6) | ||
| >400 | 43 (10.9) | 87 (21.3) | 9 (3.0) | 16 (5.3) | ||
BMI indicates body mass index; CAC, coronary artery calcium; HDL, high‐density lipoprotein; LDL, low‐density lipoprotein; MET, metabolic equivalent task.
Values are presented as n (%), or mean±SD, or median (interquartile range), as appropriate; P values compare examination 1 and examination 2 values within each sex.
Hypertension was defined as systolic blood pressure ≥140 mm Hg and/or diastolic blood pressure ≥90 mm Hg and/or use of any antihypertension medication.
Diabetes mellitus was defined as fasting glucose ≥126 mg/dL and/or use of an antidiabetes mellitus medication.
Several baseline covariates including age, sex, smoking, alcohol intake, family history of heart disease, hypertension and statin medication use, glucose tolerance status, and many adiposity measures were univariately associated with log annualized change in CAC (Table 2). In a prespecified multivariable model, only older age, male sex, current smoking, statin use, hypertension medication use, and diabetes mellitus remained significantly associated with any change in CAC.
Table 2.
Baseline Factors Associated With Any CAC Change (Modeled as Log Change in CAC+1) Among MASALA Participants, Ages 40 to 84 Years at Baseline
| Baseline Characteristic | Univariate Model (n=698) | P Value | Multivariable Model (n=694) | P Value |
|---|---|---|---|---|
| Fold Change (95% CI)* | Fold Change (95% CI)* | |||
| Male sex | 6.80 (4.92–9.38) | <0.001 | 4.45 (3.19–6.22) | <0.001 |
| Age, per SD (y) | 2.90 (2.48–3.39) | <0.001 | 2.17 (1.88–2.51) | <0.001 |
| Years lived in the United States | ||||
| Tertile 1 | 1.00 | |||
| Tertile 2 | 1.57 (1.04–2.37) | 0.03 | ||
| Tertile 3 | 4.50 (2.93–6.90) | <0.001 | ||
| Education, ≤High school | 1.00 | |||
| <Bachelor's degree | 0.81 (0.28–2.36) | 0.70 | ||
| =Bachelor's degree | 1.01 (0.46–2.24) | 0.98 | ||
| >Bachelor's degree | 1.13 (0.53–2.39) | 0.76 | ||
| Family income, <$40 000 | 1.00 | |||
| $40 000–75 000 | 0.66 (0.31–1.40) | 0.28 | ||
| $75 001–100 000 | 0.56 (0.25–1.27) | 0.17 | ||
| >$100 000 | 0.46 (0.25–0.86) | 0.01 | ||
| Current smoker | 4.08 (1.57–10.59) | 0.004 | 2.35 (1.10–5.02) | 0.03 |
| Alcohol consumption, none | 1.00 | |||
| 1– to 7 drinks/wk | 1.97 (1.35–2.88) | <0.001 | ||
| >7 drinks/wk | 3.04 (1.36–6.76) | 0.007 | ||
| Exercise, per SD (MET‐min/wk) | 1.07 (0.90–1.28) | 0.42 | ||
| Total caloric intake, per SD (kcal/d) | 1.01 (0.85–1.21) | 0.88 | 0.91 (0.79–1.05) | 0.18 |
| Family history of heart disease | 1.44 (1.01–2.04) | 0.04 | 1.22 (0.92–1.61) | 0.17 |
| Statin medication use | 4.58 (3.13–6.71) | <0.001 | 1.71 (1.22–2.41) | 0.002 |
| Hypertension medication use | 6.70 (4.67–9.60) | <0.001 | 2.27 (1.61–3.21) | <0.001 |
| Systolic blood pressure, <120 mm Hg | 1.00 | |||
| 120–140 | 3.16 (2.19–4.55) | <0.001 | ||
| >140 | 4.60 (2.78–7.64) | <0.001 | ||
| Diastolic blood pressure, <80 mm Hg | 1.00 | |||
| 80–90 | 2.07 (1.34–3.19) | 0.001 | ||
| >90 | 1.13 (0.48–2.68) | 0.78 | ||
| Glucose tolerance, normal† | 1.00 | 1.00 | ||
| Prediabetes | 1.73 (1.17–2.56) | 0.006 | 1.07 (0.78–1.48) | 0.68 |
| Diabetes mellitus | 4.65 (3.00–7.20) | <0.001 | 1.46 (0.99–2.15) | 0.06 |
| BMI, per SD (kg/m2) | 1.14 (0.95–1.35) | 0.15 | ||
| Waist‐to‐hip ratio, per SD | 2.18 (1.85–2.58) | <0.001 | 1.07 (0.90–1.26) | 0.44 |
| Visceral fat area, cm2 | ||||
| Tertile 1 | 1.00 | |||
| Tertile 2 | 1.40 (0.92–2.12) | 0.12 | ||
| Tertile 3 | 3.85 (2.54–5.84) | <0.001 | ||
| Hepatic fat attenuation, HU | ||||
| Tertile 1 | 1.00 | |||
| Tertile 2 | 0.78 (0.51–1.19) | 0.24 | ||
| Tertile 3 | 0.39 (0.26–0.60) | <0.001 | ||
| Pericardial fat volume, cm3 | ||||
| Tertile 1 | 1.00 | |||
| Tertile 2 | 2.30 (1.53–3.47) | <0.001 | ||
| Tertile 3 | 5.34 (3.54–8.05) | <0.001 | ||
| Total cholesterol, mmol/L | ||||
| <4.14 | 1.00 | |||
| 4.14–4.91 | 0.40 (0.25–0.64) | <0.001 | ||
| >4.9 | 0.34 (0.22–0.53) | <0.001 | ||
| HDL‐cholesterol, mmol/L | ||||
| >1.68 | 1.00 | |||
| 0.90–1.68 | 1.39 (0.81–2.39) | 0.23 | ||
| <90 | 3.05 (1.48–6.28) | 0.003 | ||
| Log triglycerides, mmol/L | 1.13 (0.77–1.65) | 0.54 | ||
| Lp(a), mmol/L | ||||
| ≤0.50 | 1.00 | |||
| 0.50–1.78 | 0.87 (0.57–1.32) | 0.52 | ||
| >1.78 | 0.99 (0.64–1.52) | 0.95 | ||
| Log hsCRP, μg/mL | 0.87 (0.73–1.03) | 0.10 | ||
| Fasting insulin, per SD (pmol/L) | 1.25 (1.04–1.49) | 0.02 | ||
BMI indicates body mass index; CAC, coronary artery calcium; HDL, high‐density lipoprotein; hsCRP, high sensitivity C‐reactive protein; HU, Hounsfield units; LDL, low‐density lipoprotein; Lp(a), MASALA, Mediators of Atherosclerosis in South Asians Living in America; MET, metabolic equivalent task.
With log of CAC change as the outcome in the linear model, the exponentiated regression coefficient for each predictor is interpretable as the fold‐change in the expected value of the outcome for a 1‐unit increase in the predictor.
Defined using fasting plasma glucose (FPG) and 2‐h postchallenge glucose (2 h PG); diabetes if FPG ≥7.0 mmol/L or 2 h PG ≥11.1 mmol/L or use of a diabetes mellitus medication; prediabetes if FPG 5.6–6.9 mmol/L or 2 h PG 7.8–11.0 mmol/L; normal if FPG <5.6 mmol/L and 2 h PG <7.8 mmol/L.
After excluding 75 MASALA participants who were younger than age 45 years at baseline, we compared baseline characteristics with the 5759 MESA participants (Table S1). The MASALA study population was younger, had more men, fewer current smokers, the lowest exercise levels and highest diabetes mellitus prevalence, and more statin use. Of the 2926 MESA participants with undetectable CAC at baseline, 484 (16.5%) developed incident CAC after an overall 2.4±0.8 years of follow‐up. After adjusting for age, there was a trend of a higher incidence of CAC among South Asian men and white men compared with the other MESA groups (Figure). South Asian men had a significantly higher incidence of CAC only compared with Chinese men. After excluding all statin users, the age‐adjusted incidence of any new CAC was 10.1% (6.3–13.9%) among South Asian men, which was significantly higher than Chinese men (5.1%, 2.7–7.6%, P=0.03).
Figure 1.
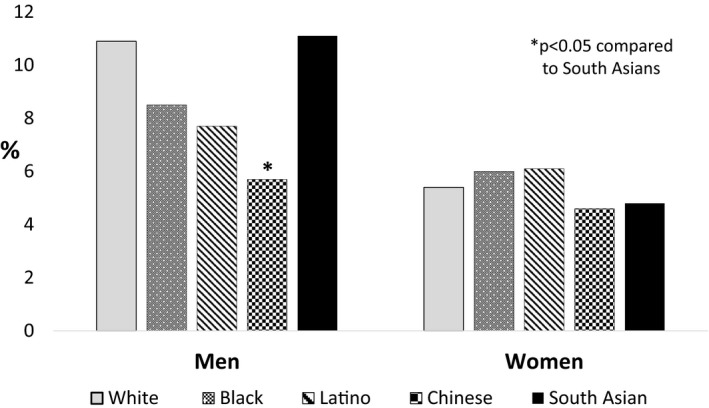
Any incident CAC (per 100 person‐years) among those with no evidence of CAC at baseline, comparing MASALA South Asians with the 4 race/ethnic groups in MESA, adjusted by age. CAC indicates coronary artery calcium; MASALA, Mediators of Atherosclerosis in South Asians Living in America; MESA, Multi‐Ethnic Study of Atherosclerosis.
Among men, CAC progression in those with prevalent CAC at baseline was significantly higher among South Asians than each MESA group (Table 3). Even after excluding participants from both studies who were using statins at the follow‐up examination, South Asian men had significantly faster CAC progression than men in all 4 MESA race/ethnic groups. There were no race/ethnic differences in CAC progression among women.
Table 3.
Annualized CAC Progression Among Those With Any Detectable CAC at Baseline, Comparing South Asians in MASALA to the 4 MESA Race/Ethnic Groups Separately by Sex, Adjusted by Age
| CAC Progression | South Asian | White | Black | Latino | Chinese American |
|---|---|---|---|---|---|
| Men: | n=210 | n=771 | n=348 | n=336 | n=199 |
| <0 | 3.0 (0.8–5.2) | 12.5 (10.2–14.8) | 13.1 (9.6–16.6) | 13.5 (9.9–17.1) | 9.9 (5.8–14.0) |
| 0 to 9 | 16.3 (11.7–21.0) | 21.1 (18.3–23.9) | 22.1 (17.8–26.4) | 26.5 (21.8–31.1) | 21.2 (15.6–26.8) |
| 10 to 99 | 60.8 (54.1–67.6) | 49.9 (46.3–53.4) | 47.2 (42.0–52.4) | 44.6 (39.3–49.9) | 59.1 (52.3–65.9) |
| 100 to 199 | 13.2 (8.2–18.2) | 10.9 (8.7–13.1) | 10.5 (7.3–13.7) | 9.8 (6.6–13.0) | 6.2 (2.8–9.6) |
| 200+ | 6.7 (2.7–10.6) | 5.6 (4.0–7.2) | 7.1 (4.4–9.8) | 5.6 (3.1–8.1) | 3.6 (1.0–6.3) |
| P‐value | Ref. | 0.001* | <0.001* | <0.001* | 0.004* |
| Men (not taking statins)† | n=107 | n=495 | n=253 | n=252 | n=152 |
| <0 | 5.4 (1.2–9.6) | 12.9 (10.0–15.9) | 15.5 (11.0–19.9) | 15.0 (10.6–19.4) | 12.5 (7.2–17.7) |
| 0 to 9 | 14.9 (8.7–21.2) | 24.3 (20.5–28.0) | 22.3 (17.3–27.4) | 28.7 (23.2–34.2) | 24.4 (17.7–31.1) |
| 10 to 99 | 61.2 (51.7–70.8) | 50.6 (46.2–55.0) | 49.0 (42.8–55.1) | 44.8 (38.7–51.0) | 56.0 (48.1–63.8) |
| 100 to 199 | 11.5 (4.9–18.2) | 8.0 (5.7–10.3) | 8.6 (5.2–12.1) | 8.7 (5.2–12.1) | 5.2 (1.7–8.8) |
| 200+ | 6.9 (1.1–12.6) | 4.2 (2.5–5.9) | 4.6 (2.1–7.2) | 2.7 (0.8–4.7) | 2.0 (0.0–4.1) |
| P‐value | Ref. | 0.02* | 0.02* | 0.001* | 0.01* |
| Women: | n=67 | n=507 | n=302 | n=228 | n=142 |
| <0 | 7.6 (1.2–14.0) | 13.1 (10.2–16.1) | 13.7 (9.8–17.6) | 16.8 (11.9–21.7) | 17.9 (11.6–24.2) |
| 0–9 | 32.2 (21.4–43.0) | 29.9 (25.9–33.9) | 24.2 (19.4–29.1) | 30.6 (24.6–36.6) | 29.6 (22.2–37.1) |
| 10–99 | 54.4 (42.6–66.4) | 46.7 (42.3–51.0) | 52.8 (47.2–58.4) | 46.1 (39.7–52.5) | 42.1 (35.0–51.2) |
| 100–199 | 5.7 (0–11.8) | 7.7 (5.5–9.9) | 4.4 (2.1–6.6) | 5.7 (2.8–8.6) | 5.4 (1.8–9.0) |
| 200+ | 0 | 2.6 (1.3–3.9) | 4.8 (2.5–7.1) | 0.8 (0–1.9) | 4.0 (0.9–7.1) |
| P value | Ref. | 0.67 | 0.57 | 0.48 | 0.39 |
CAC indicates coronary artery calcium; MASALA, Mediators of Atherosclerosis in South Asians Living in America; MESA, Multi‐Ethnic Study of Atherosclerosis.
P‐value comparing the distribution of CAC progression among each MESA race/ethnic group to South Asians.
This subgroup of men excludes those who were taking any statin medications at the follow‐up exam for each study.
Finally, we created a linear model to determine whether the difference in any CAC change between South Asian men and MESA male participants could be explained by traditional cardiovascular risk factors. After adjusting for age, current smoking, hypertension, diabetes mellitus, and statin use, there was no difference between South Asian men and white men for any CAC change, but the other ethnic minority groups in MESA had significantly less CAC change than South Asian men (Table 4). Adding baseline measures of CAC to the model did not materially change these results.
Table 4.
Multivariable Linear Regression Model of the Effect of Race/Ethnicity on Any CAC Change (Modeled as Log CAC Change+1) Comparing South Asian Men With Men in the 4 Race/Ethnic Groups in MESA
| Fold Change (95% CI)* | P Value | |
|---|---|---|
| Race/ethnicity: South Asian (reference) | ||
| White | 1.06 (0.82–1.36) | 0.65 |
| Black | 0.45 (0.34–0.58) | <0.001 |
| Latino | 0.61 (0.46–0.79) | <0.001 |
| Chinese American | 0.65 (0.48–0.88) | 0.005 |
| Age, y (linear) | 1.10 (1.08–1.12) | <0.001 |
| Age, y (nonlinear) | 0.97 (0.95–1.00) | 0.02 |
| Current smoker | 1.37 (1.11–1.69) | 0.004 |
| Diabetes mellitus† | 2.11 (1.68–2.63) | <0.001 |
| Hypertension‡ | 1.76 (1.51–2.06) | <0.001 |
| Statin medication use | 1.68 (1.38–2.04) | <0.001 |
CAC indicates coronary artery calcium; MESA, Multi‐Ethnic Study of Atherosclerosis.
With log of CAC change as the outcome in the linear model, the exponentiated regression coefficient for each predictor is interpretable as the fold‐change in the expected value of the outcome for a 1‐unit increase in the predictor. Fold changes are related 1 to 1 to percent changes: 1.5‐, 2‐, and 5‐fold changes are equivalent to 50%, 100%, and 400% increases.
Defined if fasting plasma glucose ≥7.0 mmol/L or use of a diabetes mellitus medication.
Defined if systolic blood pressure ≥140 mm Hg or diastolic blood pressure ≥90 mm Hg or use of an antihypertensive medication.
Discussion
In this community‐based sample of South Asians in the United States followed for ≈5 years, South Asian men had higher incidence and progression of CAC compared with South Asian women, and traditional cardiovascular risk factors were associated with change in CAC among South Asians. South Asian men had greater annual CAC progression compared with men in MESA from all 4 race/ethnic groups. However, after controlling for traditional cardiovascular risk factors, South Asian men had similar annual rates of change in CAC as white men, but significantly higher rates than black, Latino, and Chinese American men. There were no differences in CAC incidence or progression between South Asian women and MESA women.
We previously reported that South Asian men had similar CAC prevalence compared with white men,17 confirming results from a prior study from a referral population in the United States26 and in a population‐based study from the United Kingdom.27 We also found that South Asian men had significantly higher CAC prevalence compared with black, Latino, and Chinese American men after adjusting for traditional cardiovascular disease risk factors.17 The current study furthers this line of evidence that South Asian men have similar rates of incident CAC and progression of CAC as compared with white men and higher rates of CAC progression than other race/ethnic minority groups in the United States. We are unaware of any prior studies that have studied incident CAC or CAC progression in South Asian men or women.
Comparing change in CAC across different studies with different populations is challenging because of the differing methods of analysis that have been used.13 We were able to compare South Asians directly to the 4 race/ethnic groups in MESA using total CAC scores from sequential study visits in both cohorts, with identical CAC measurement protocols and reading centers used in both studies. However, the mean time between the baseline and second CT scan was longer for the MASALA participants (4.8 years) compared with the MESA participants (2.4 years). We did not use data from examination 4 or 5 in MESA because of fewer participants in each race/ethnic group with CAC results, and to avoid possible bias with healthier participants who had these follow‐up scans.25 Additionally, MESA participants were on average 4 years older than MASALA participants (62 years in MESA versus 58 years in MASALA). To control for these differences, we age‐adjusted our comparisons, calculated annualized rates of incident CAC and CAC progression, and included log follow‐up time in the linear models. While incident CAC appears to have a linear relationship with age,13 CAC progression may increase nonlinearly. We modeled relative change using a logarithmic transformation of annual change in CAC plus a constant, a method less susceptible to influence by outliers. Further adjustment for diabetes mellitus and hypertension attenuated the difference for the relative change in CAC in South Asians compared with white men, but the differences between South Asian men and other ethnic minority men remained significant. Further adjusting for baseline CAC scores, which are known to be higher among South Asians than ethnic minorities in MESA, did not alter these findings.
Investigators have previously reported that the white men in MESA had greater incident CAC and CAC progression compared with the 3 race/ethnic minority groups after full adjustment for other baseline risk factors.13 A study in active duty soldiers confirmed that black men have lower CAC prevalence than white men, but they had similar CAC progression after adjusting for risk factors.15 The ERA JUMP (Japanese and US Men in the Post World War II Birth Cohort) study comparing third and fourth generation Japanese American men with white men found somewhat similar results to our findings; in unadjusted analyses, Japanese American men had greater CAC progression than white men, which was attenuated with risk factor adjustment.28
We examined an array of sociodemographic, behavioral, body composition, novel biomarkers, and clinical risk factors for associations, but found that they were not independently associated with change in CAC. Longer duration of residence in the United States, smoking, and higher alcohol consumption were all associated with greater CAC change, while higher family income was associated with lower CAC change, and exercise and total caloric intake had no association. Greater visceral fat and pericardial fat volume were associated with greater CAC change while higher liver fat attenuation was inversely associated. Both high‐sensitivity C‐reactive protein and lipoprotein (a) were not associated with change in CAC. However, after adjusting for traditional cardiovascular risk factors in our a priori model, all of these other sociodemographic, behavioral, and body composition factors were no longer associated with any CAC change. Short‐term13 and longer‐term follow‐up25 of MESA also found similar independent associations between traditional risk factors and CAC progression.
CAC burden and CAC progression have both been shown to be independent predictors of incident coronary heart disease events in all 4 of the MESA race/ethnic groups.7, 10 While no studies to date have determined whether CAC burden or progression independently predicts cardiovascular disease events in South Asians, our findings of the relatively high CAC burden and progression suggest that CAC will be an important predictor of future events. South Asians have been acknowledged to be a particularly high‐risk ethnic population with higher proportionate mortality from ischemic heart disease4, 5 and higher myocardial infarction risk1, 2 than other race/ethnic groups. CAC presence and change may be useful for risk prediction in this ethnic population, and may better guide the judicious use of statin and other preventive therapies. Longitudinal follow‐up of events in MASALA will determine whether CAC measures improve discrimination and prediction of cardiovascular disease compared with traditional risk factors.
A limitation of the MASALA study is the relatively small cohort size, which is drawn from only 2 geographic centers in the United States. Moreover, a majority of MASALA participants are first‐generation immigrants, mostly from India, with high socioeconomic attainment, which limits the generalizability of these findings to all South Asians in the United States and globally. Additionally, since we excluded participants with any existing cardiovascular disease from this cohort, South Asians in MASALA are relatively healthier than those from the same demographic group in the United States. The sample limitations for MASALA imply that our findings may represent a healthy proportion of South Asians, and the results may be significantly worse in a more general South Asian population.
South Asian men have greater change in CAC than Chinese, black, and Latino men but similar CAC change compared with white men after adjusting for traditional cardiovascular risk factors. There were no differences in CAC incidence or progression among South Asian women compared with the 4 race/ethnic groups of women in MESA. Prospective follow‐up of the MASALA cohort will determine whether CAC burden and/or progression will provide independent prognostic information for cardiovascular disease events.
Sources of Funding
The MASALA study was supported by grants 1R01HL093009, 2R01HL093009, R01HL120725, K24HL112827, and at UCSF with grants UL1RR024131, UL1TR001872, and P30DK098722. The MESA study was funded by contracts N01‐HC‐95159, N01‐HC‐95160, N01‐HC‐95161, N01‐HC‐95162, N01‐HC‐95163, N01‐HC‐95164, N01‐HC‐95165, N01‐HC‐95166, N01‐HC‐95167, N01‐HC‐95168, and N01‐HC‐95169 from the National Heart, Lung, and Blood Institute and by grants UL1‐TR‐000040 and UL1‐TR‐001079 from the National Center for Research Resources.
Disclosures
None.
Supporting information
Table S1. Characteristics of the MASALA Study and MESA Participants at examination 1, Age 45 to 84 Years*
Acknowledgments
The authors thank the study participants and other members of the MASALA and MESA study teams.
(J Am Heart Assoc. 2019;8:e011053 DOI: 10.1161/JAHA.118.011053.)
References
- 1. Lee J, Heng D, Chia KS, Chew SK, Tan BY, Hughes K. Risk factors and incident coronary heart disease in Chinese, Malay and Asian Indian males: the Singapore Cardiovascular Cohort Study. Int J Epidemiol. 2001;30:983–988. [DOI] [PubMed] [Google Scholar]
- 2. Hajra A, Li Y, Siu S, Udaltsova N, Armstrong MA, Friedman GD, Klatsky AL. Risk of coronary disease in the South Asian American population. J Am Coll Cardiol. 2013;62:644–645. [DOI] [PubMed] [Google Scholar]
- 3. Palaniappan L, Wang Y, Fortmann SP. Coronary heart disease mortality for six ethnic groups in California, 1990–2000. Ann Epidemiol. 2004;14:499–506. [DOI] [PubMed] [Google Scholar]
- 4. Jose PO, Frank AT, Kapphahn KI, Goldstein BA, Eggleston K, Hastings KG, Cullen MR, Palaniappan LP. Cardiovascular disease mortality in Asian Americans. J Am Coll Cardiol. 2014;64:2486–2494. [DOI] [PMC free article] [PubMed] [Google Scholar]
- 5. Volgman AS, Palaniappan LS, Aggarwal NT, Gupta M, Khandelwal A, Krishnan AV, Lichtman JH, Mehta LS, Patel HN, Shah KS, Shah SH, Watson KE. Atherosclerotic cardiovascular disease in South Asians in the United States: epidemiology, risk factors, and treatments. A scientific statement from the American Heart Association. Circulation. 2018;138:e1–e34. [DOI] [PubMed] [Google Scholar]
- 6. Greenland P, LaBree L, Azen SP, Doherty TM, Detrano RC. Coronary artery calcium score combined with Framingham score for risk prediction in asymptomatic individuals. JAMA. 2004;291:210–215. [DOI] [PubMed] [Google Scholar]
- 7. Detrano R, Guerci AD, Carr JJ, Bild DE, Burke G, Folsom AR, Liu K, Shea S, Szklo M, Bluemke DA, O'Leary DH, Tracy R, Watson K, Wong ND, Kronmal RA. Coronary calcium as a predictor of coronary events in four racial or ethnic groups. N Engl J Med. 2008;358:1336–1345. [DOI] [PubMed] [Google Scholar]
- 8. Shemesh J, Apter S, Stolero D, Itzchak Y, Motro M. Annual progression of coronary artery calcium by spiral computed tomography in hypertensive patients without myocardial ischemia but with prominent atherosclerotic risk factors, in patients with previous angina pectoris or healed acute myocardial infarction, and in patients with coronary events during follow‐up. Am J Cardiol. 2001;87:1395–1397. [DOI] [PubMed] [Google Scholar]
- 9. Budoff MJ, Hokanson JE, Nasir K, Shaw LJ, Kinney GL, Chow D, Demoss D, Nuguri V, Nabavi V, Ratakonda R, Berman DS, Raggi P. Progression of coronary artery calcium predicts all‐cause mortality. JACC Cardiovasc Imaging. 2010;3:1229–1236. [DOI] [PubMed] [Google Scholar]
- 10. Budoff MJ, Young R, Lopez VA, Kronmal RA, Nasir K, Blumenthal RS, Detrano RC, Bild DE, Guerci AD, Liu K, Shea S, Szklo M, Post W, Lima J, Bertoni A, Wong ND. Progression of coronary calcium and incident coronary heart disease events: MESA (Multi‐Ethnic Study of Atherosclerosis). J Am Coll Cardiol. 2013;61:1231–1239. [DOI] [PMC free article] [PubMed] [Google Scholar]
- 11. Bild DE, Folsom AR, Lowe LP, Sidney S, Kiefe C, Westfall AO, Zheng ZJ, Rumberger J. Prevalence and correlates of coronary calcification in black and white young adults: the Coronary Artery Risk Development in Young Adults (CARDIA) Study. Arterioscler Thromb Vasc Biol. 2001;21:852–857. [DOI] [PubMed] [Google Scholar]
- 12. Budoff MJ, Nasir K, Mao S, Tseng PH, Chau A, Liu ST, Flores F, Blumenthal RS. Ethnic differences of the presence and severity of coronary atherosclerosis. Atherosclerosis. 2006;187:343–350. [DOI] [PubMed] [Google Scholar]
- 13. Kronmal RA, McClelland RL, Detrano R, Shea S, Lima JA, Cushman M, Bild DE, Burke GL. Risk factors for the progression of coronary artery calcification in asymptomatic subjects: results from the Multi‐Ethnic Study of Atherosclerosis (MESA). Circulation. 2007;115:2722–2730. [DOI] [PubMed] [Google Scholar]
- 14. Kawakubo M, LaBree L, Xiang M, Doherty TM, Wong ND, Azen S, Detrano R. Race‐ethnic differences in the extent, prevalence, and progression of coronary calcium. Ethn Dis. 2005;15:198–204. [PubMed] [Google Scholar]
- 15. Taylor AJ, Wu H, Bindeman J, Bauer K, Byrd C, O'Malley PG, Feuerstein I. Comparison of coronary artery calcium progression in African American and white men. J Cardiovasc Comput Tomogr. 2009;3:71–77. [DOI] [PubMed] [Google Scholar]
- 16. Kanaya AM, Kandula N, Herrington D, Budoff MJ, Hulley S, Vittinghoff E, Liu K. Mediators of Atherosclerosis in South Asians Living in America (MASALA) study: objectives, methods, and cohort description. Clin Cardiol. 2013;36:713–720. [DOI] [PMC free article] [PubMed] [Google Scholar]
- 17. Kanaya AM, Kandula NR, Ewing SK, Herrington D, Liu K, Blaha MJ, Srivastava S, Dave SS, Budoff MJ. Comparing coronary artery calcium among U.S. South Asians with four racial/ethnic groups: the MASALA and MESA studies. Atherosclerosis. 2014;234:102–107. [DOI] [PMC free article] [PubMed] [Google Scholar]
- 18. Bild DE, Bluemke DA, Burke GL, Detrano R, Diez Roux AV, Folsom AR, Greenland P, Jacob DR Jr, Kronmal R, Liu K, Nelson JC, O'Leary D, Saad MF, Shea S, Szklo M, Tracy RP. Multi‐Ethnic Study of Atherosclerosis: objectives and design. Am J Epidemiol. 2002;156:871–881. [DOI] [PubMed] [Google Scholar]
- 19. Ainsworth BE, Irwin ML, Addy CL, Whitt MC, Stolarczyk LM. Moderate physical activity patterns of minority women: the Cross‐Cultural Activity Participation Study. J Womens Health Gend Based Med. 1999;8:805–813. [DOI] [PubMed] [Google Scholar]
- 20. Friedewald WTLR, Fredrickson DS. Estimation of the concentration of low‐density lipoprotein cholesterol in plasma, without use of the preparative ultracentrifuge. Clin Chem. 1972;18:499–502. [PubMed] [Google Scholar]
- 21. ADA . Diagnosis and classification of diabetes mellitus. Diabetes Care. 2004;27(suppl 1):S5–S10. [DOI] [PubMed] [Google Scholar]
- 22. Shah AD, Kandula NR, Lin F, Allison MA, Carr J, Herrington D, Liu K, Kanaya AM. Less favorable body composition and adipokines in South Asians compared with other US ethnic groups: results from the MASALA and MESA studies. Int J Obes (Lond). 2016;40:639–645. [DOI] [PMC free article] [PubMed] [Google Scholar]
- 23. Garg SK, Lin F, Kandula N, Ding J, Carr J, Allison M, Liu K, Herrington D, Vaidya D, Vittinghoff E, Kanaya AM. Ectopic fat depots and coronary artery calcium in South Asians compared with other racial/ethnic groups. J Am Heart Assoc. 2016;5:e004257 DOI: 10.1161/JAHA.116.004257. [DOI] [PMC free article] [PubMed] [Google Scholar]
- 24. Carr JJ, Nelson JC, Wong ND, McNitt‐Gray M, Arad Y, Jacobs DR Jr, Sidney S, Bild DE, Williams OD, Detrano RC. Calcified coronary artery plaque measurement with cardiac CT in population‐based studies: standardized protocol of Multi‐Ethnic Study of Atherosclerosis (MESA) and Coronary Artery Risk Development in Young Adults (CARDIA) study. Radiology. 2005;234:35–43. [DOI] [PubMed] [Google Scholar]
- 25. Gassett AJ, Sheppard L, McClelland RL, Olives C, Kronmal R, Blaha MJ, Budoff M, Kaufman JD. Risk factors for long‐term coronary artery calcium progression in the Multi‐Ethnic Study of Atherosclerosis. J Am Heart Assoc. 2015;4:e001726 DOI: 10.1161/JAHA.114.001726. [DOI] [PMC free article] [PubMed] [Google Scholar]
- 26. Hatwalkar A, Agrawal N, Reiss DS, Budoff MJ. Comparison of prevalence and severity of coronary calcium determined by electron beam tomography among various ethnic groups. Am J Cardiol. 2003;91:1225–1227. [DOI] [PubMed] [Google Scholar]
- 27. Jain P, Kooner JS, Raval U, Lahiri A. Prevalence of coronary artery calcium scores and silent myocardial ischaemia was similar in Indian Asians and European whites in a cross‐sectional study of asymptomatic subjects from a U.K. population (LOLIPOP‐IPC). J Nucl Cardiol. 2011;18:435–442. [DOI] [PubMed] [Google Scholar]
- 28. Ahuja V, Masaki K, Vishnu A, Ye L, Wilcox B, Wassel C, Fujiyoshi A, Barinas‐Mitchell EJ, Miura K, Ueshima H, Rodriguez BL, Edmundowicz D, Sekikawa A. Progression of coronary artery calcium in Japanese American men and white men in the ERA JUMP study. Int J Cardiol. 2017;228:672–676. [DOI] [PubMed] [Google Scholar]
Associated Data
This section collects any data citations, data availability statements, or supplementary materials included in this article.
Supplementary Materials
Table S1. Characteristics of the MASALA Study and MESA Participants at examination 1, Age 45 to 84 Years*