Abstract
The fish olfactory receptor ORA family is orthologous to the mammalian vomeronasal receptors type 1. It consists of six highly conserved chemosensory receptors expected to be essential for survival and communication. We deorphanized the zebrafish ORA family in a heterologous cell system. The six receptors responded specifically to lithocholic acid (LCA) and closely related C24 5β-bile acids/salts. LCA attracted zebrafish as strongly as food in behavioral tests, whereas the less potent cholanic acid elicited weaker attraction, consistent with the in vitro results. The ORA-ligand recognition patterns were probed with site-directed mutagenesis guided by in silico modeling. We revealed the receptors' structure–function relationship underlying their specificity and selectivity for these compounds. Bile acids/salts are putative fish semiochemicals or pheromones sensed by the olfactory system with high specificity. This work identified their receptors and provided the basis for probing the roles of ORAs and bile acids/salts in fish chemosensation.
Keywords: site-directed mutagenesis, receptor structure–function, molecular docking, molecular dynamics, homology modeling, behavioral assay, fish ORA, olfactory receptor
Introduction
Semiochemicals such as pheromones play vital roles in survival and behavioral functions, such as mating preferences, aggression control, individual recognition, and migration. In mammals, the pheromonal signals are detected by vomeronasal receptors type 1 and 2 (V1Rs and V2Rs)5 (1). V1Rs respond to low molecular weight molecules (2, 3), whereas V2Rs recognize peptides (4, 5). Fish orthologs of V1Rs are named ORAs, olfactory receptors related to class A G protein–coupled receptors (GPCRs).
The ORA gene family has only six genes (ORA1–ORA6) that code for chemosensory receptors expected to detect pheromones (6, 7). Compared with the rapidly evolving mammalian V1R genes, the ORA genes are strikingly conserved among teleost species (7–11). The high conservation of ORA suggests possible co-evolution with a conserved ligand repertoire of functional importance. Zebrafish ORA1 has been found to detect 4-hydroxyphenylacetic acid, a biogenic compound showing pheromonal effects on reproductive behavior with high specificity and sensitivity (12). Otherwise, little is known by far about the ligands or the functions of ORAs (7). Deorphanization of these receptors is thus an essential step toward decoding their structure–function relationships as well as their chemosensory function.
Structurally, ORAs are G protein–coupled and likely conserve the typical three-dimensional structure of class A GPCRs, which span the cell membrane with seven transmembrane helices (TM1–TM7) connected by intracellular and extracellular loops (13). Within this family, the 7-TM bundle houses a canonical ligand-binding pocket that may extend ∼10 Å from the extracellular membrane boundary. Across different GPCR families, several sequence motifs are conserved in the TM domain, consistent with a common mechanism of signal transmission toward the inside of the cell. However, the residues within the ligand-binding pocket generally show high sequence divergence to accommodate varied stimuli from the external environment (14). Conserved features in class A GPCR structures enable molecular modeling of olfactory receptors whose structures are so far unknown. The in silico approach combined with in vitro assays has led to significant insights into human and mouse olfaction in our previous work (15–18).
In this study, we deorphanized all the six zebrafish ORAs by in vitro screening of steroid compounds. The ORAs selectively responded to nine bile acids/salts, showing general preference for those sharing the same steroid ring as lithocholic acid (LCA). Alternation in the ligands' steroid ring structure or the side chain resulted in complementary ORA-subtype selectivity. Subtype-selective and nonselective ORA ligands both elicited attraction to zebrafish in behavioral tests. We modeled the three-dimensional structures of the ORAs, as well as their interaction patterns with the ligands, which were assessed by site-directed mutagenesis and functional assays. The results revealed discrepancies within the ligand-binding pocket that correspond to the receptors' differential responses to the ligands. However, an anchor for acids turned out to be conserved in the pocket of all the six ORAs, despite the high sequence variation. A focus on ORA5 and ORA6 identified the specific residues within the pocket that control ORA6's selectivity and specificity for ChA. The in silico models provided detailed and accurate descriptions of the receptor–ligand interactions, which enabled reprogramming ORA5 to gain the function to recognize ChA.
The results demonstrated that zebrafish ORAs detected bile acids/salts with high selectivity and specificity. Variation within their ligand-binding pocket results in complementary recognitions of these structurally similar steroid molecules. Combinatorial activation is common in chemosensory receptors (particularly in olfactory receptors) to generate highly specific and sensitive signaling codes. Therefore, the ORAs may be specialized to detect the “molecular fingerprints” of mixtures of such putative fish semiochemicals (reviewed in Ref. 19) in the environment. Indeed, fishes are sensitive to steroids and rich evidence supports pheromonal roles of excreted steroids in modulating/guiding fish behaviors such as reproduction, migration, and communication (reviewed in Ref. 20). In particular, olfactory receptor neurons of sharks and rays had been found to distinguish bile acids/salts with a high degree of specificity (21). However, the steroid-detecting receptors in fish remained unknown (20). Here, we have demonstrated for the first time a specific steroid-sensitive chemosensory receptor family in zebrafish. The work is expected to advance the investigation of fish chemosensation to excreted steroids and the function of the highly conserved fish ORA genes.
Results
ORAs show differential responses to similar bile acids in vitro
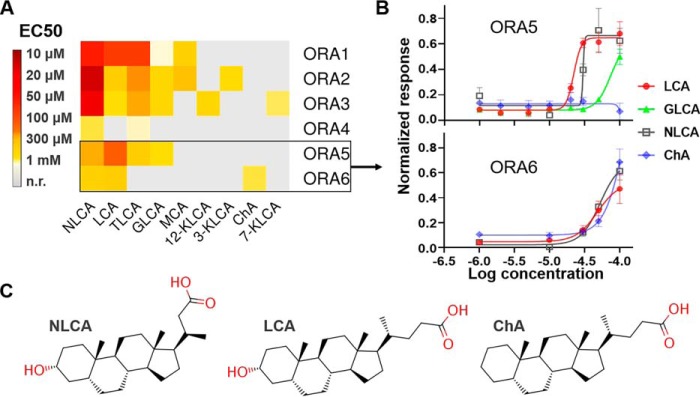
We screened 30 different steroid compounds (Table S1) in the heterologous Hana3A cell line, and identified 9 potential ORA ligands whose EC50 values ranged from 10 μm to 1 mm (Fig. 1A, Fig. S1, and Table S2). All the ligands identified are C24 5β-bile acids or their conjugate salts sharing a common steroid ring structure, with no more than two hydroxyl or carbonyl groups on the ring (Table S1). The side chain varies, so do their molecular size and solubility (Table S1). In fact, C24 5β-bile acids/salts are the most common profile of bile acids/salts found in teleost fishes (22). All the six zebrafish ORAs turned out to respond to both norlithocholic acid (NLCA) and LCA with different potency (Fig. 1A and Fig. S1). NLCA was the most potent ligand for ORA1–ORA4 (the most responsive being ORA2 with an EC50 value of 11 μm), as LCA was for ORA5 (22 μm) and ORA6 (48 μm). Note that the receptors' sensitivities in heterologous systems are often much lower than in vivo because of various factors, such as compromised cell viability, low cell-surface receptor expression, inefficient coupling with stimulatory G proteins, and stimulus application (23, 24). We used rhodopsin tags (Rho tags, the first 20 residues of rhodopsin) to facilitate the surface expression of the receptors (Fig. S2, A and B), following a protocol developed with mammalian olfactory receptors (23). This influenced to some extent the receptors' responses to a few compounds (Fig. S2, C–H). All the ORAs except ORA6 also responded to the conjugate salts of LCA, taurolithocholic acid and glycolithocholic acid. Therefore, the ring structure of LCA/NLCA (with only one 3α-hydroxyl group) appeared to be generally recognized, suggesting conserved ligand profile for the ORA family (Fig. 1A). Intriguingly, ChA differs from LCA by only the 3α-hydroxyl group but was unable to activate the receptors except for ORA6 (Fig. 1B and C). Also, none of the receptors responded to iso-LCA (with a 3β-hydroxyl group) or any of the compounds with a 3β-hydroxyl, suggesting their specificity for 3α-hydroxyl bile acids/salts.
Figure 1.
Deorphanization of zebrafish ORAs with bile acids/salts. A, heat map of the steroid compounds' potency for zebrafish ORAs in Hana3A cells. The data are provided in Table S2. n.r., no response. B, dose-response curves for ORA5 and ORA6. Error bars indicate S.E. C, molecular structures of NLCA, LCA, and ChA.
Zebrafish are attracted by ORA ligands in vivo
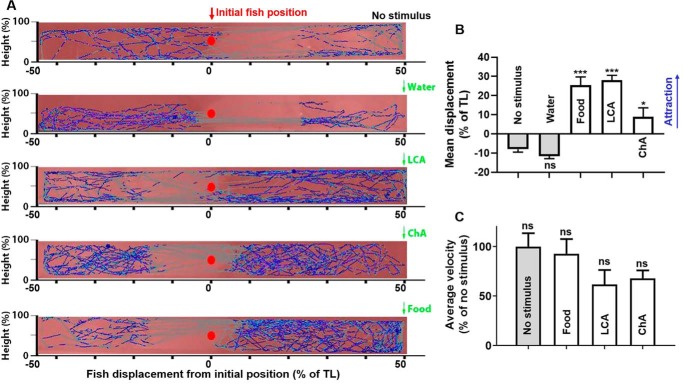
We examined the behavioral responses of zebrafish to LCA and ChA using a valence assay (see “Materials and methods”) developed by Korsching and co-workers (24). They previously demonstrated that food odor and repulsive odors elicited strong attraction and aversion on zebrafish, respectively (24), whereas an ORA1 ligand, 4-hydroxyphenylacetic acid, modified the fish's reproductive behavior without apparent attraction or aversion effects (12). We tested the odorants at a concentration in nanomolar to low micromolar range, by adding 180 μl of 1 mm odorant solutions into a fish tank with 9 liters of water (final concentration 20 nm). LCA and ChA both evoked displacements of the fish toward the odorant adding site. The attractive effect of LCA was as strong as food, whereas that of ChA was modest but significant compared with the negative control (tank water) (Fig. 2, A and B, and Table S3). The fish's average traveling velocity showed no significant change after the stimuli addition, indicating that the displacements were not because of mobility loss (Fig. 2C and Table S3). The compounds' degrees of attraction correlated with their in vitro potency and activation spectrum for the ORAs (Fig. 1A), suggesting that ORAs are central to their detection in vivo.
Figure 2.
Zebrafish behavioral responses to LCA and ChA. A, zebrafish traveling tracks (blue trajectories) recorded before and after adding stimuli. Red dots indicate the initial placement of the fish. Green arrows indicate the site of stimulus addition. B, attraction was quantified by mean displacements from initial position as a percentage of tank length (TL). Addition of tank water showed no apparent effect, whereas food, LCA, and ChA elicited attraction. C, average velocities of the fish before and after stimuli addition. Error bars indicate S.E. Significance was tested by one-way analysis of variance (ANOVA) and corrected with Holm-Sidak multiple comparison test: ns, not significant; *, p < 0.05; ***, p < 0.001. n = 5, 6, 12, and 11 for water, food, LCA, and ChA, respectively. Data are available in Table S3.
The detection thresholds of the odorants in vivo were difficult to determine because of their rapid dilution in the tank. We estimated it to be similar to that of the putative reproductive hormone, 4-hydroxyphenylacetic acid, tested by Korsching and co-workers at the same concentration (12), which should be one order of magnitude lower than typical food odors (e.g. amino acids, in vivo EC50 values in 10–100 μm range (25)). These data confirm that bile acids are potent semiochemicals for zebrafish.
ORA selectivity for bile acids is controlled by few residues within the binding pocket
To elucidate the structural basis of the ORAs' selectivity and specificity for these compounds, we studied the binding of LCA and ChA to ORA5 and ORA6, using molecular modeling assessed by site-directed mutagenesis.
Fish ORAs are GPCRs and are related to the class A (7, 26). Indeed, sequence alignment of the six ORAs reveals several conserved motifs/residues similar to those in class A GPCRs (Fig. S3), including the “GN” motif in TM1, residue P5.50 in TM5 (superscript refers to the Ballesteros-Weinstein notation (27)), F6.44 and W6.48 in TM6, P7.50 (of the NPXXY motif in class A GPCRs) in TM7, and two cysteines that correspond to the conserved TM3–ECL2 disulfide bond in class A GPCRs. Given the well-conserved packing of the TM region and the conserved motifs, GPCR homology modeling has been successful even for low sequence similarities (down to 20%) (14). Similarly, we used the above conserved motifs to verify the multiple sequence alignment of the ORAs' seven TM helices to the structural template, human angiotensin II receptor type1 (hAGTR1), a class A GPCR (Fig. S3 and Table S4). The homology models obtained (Fig. 3A) were then used for docking the ligands to the canonical ligand-binding pocket.
Figure 3.
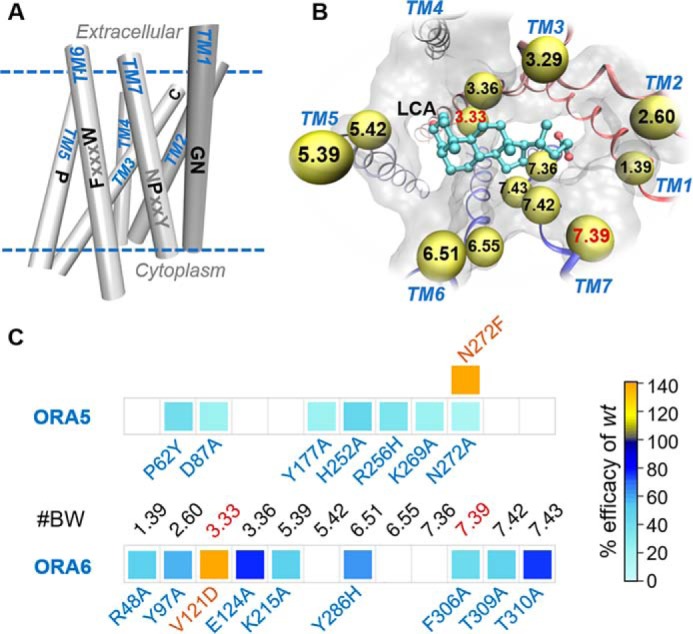
In silico ORA models verified by site-directed mutagenesis. A, simplified presentation of ORA transmembrane helices. Conserved motifs in class A GPCRs are indicated on each helix, with those conserved in ORAs colored in black. B, extracellular view of LCA-binding pose in ORA5. Residues within 3 Å proximity to LCA are shown in balls and labeled with Ballesteros-Weinstein numbers. C, mutations in the predicted binding pocket remarkably affected the efficacy of LCA on ORA5 and ORA6. We initially confirmed that the altered responses in the mutants were not because of changes in receptor surface expression, because live cell immunostaining demonstrated no significantly different expression level for the mutants and the WT (Fig. S4). Shown here is a heat map colored by LCA's efficacy for each mutant relative to the WT receptor (in %). Blank cells indicate “not tested.” The mutant/WT efficacy ratio and statistical significance are given in Table S5.
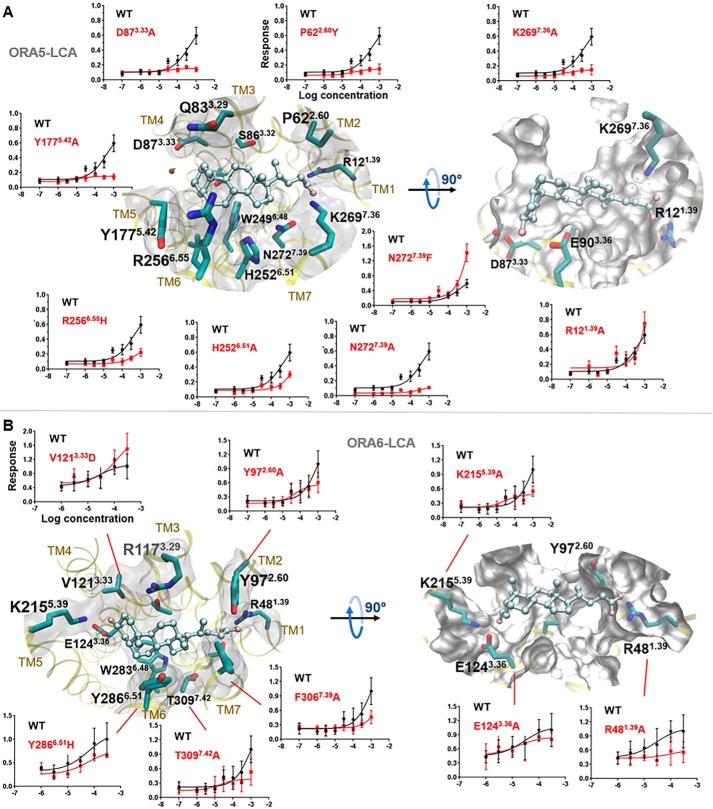
The models predicted similar orientation of LCA in the pocket of ORA5 and ORA6 (Figs. 3, B and C, and 4). Major differences were in the residues interacting with the carboxyl and the 3α-hydroxyl groups of the ligand. In ORA5, the carboxyl was predicted to bind between R121.39 and K2697.36. Site-directed mutagenesis showed that the former is rather dispensable whereas the latter is critical for the response (Fig. 4A). In ORA6, only R481.39 is present around the position of the carboxyl, and the R481.39A mutation nearly abolished the receptor's response in vitro (Figs. 3C and 4B). The 3α-hydroxyl group of LCA was predicted to form hydrogen bonds (H-bonds) with D873.33 and E903.36 in ORA5 (Fig. 4A). In ORA6, the 3α-hydroxyl was located at the same position forming hydrogen bonds with E1243.36 and K2155.40 (Fig. 4B). It made, however, unfavorable contacts with residue V1213.33. Consistently, substitution of V1213.33 in ORA6 with the negatively charged aspartic acid (V1213.33D) notably increased ORA6's response to LCA in vitro (Figs. 3C and 4B). Likewise, in ORA5, N2727.39 was predicted to be one of the major LCA-interacting residues; however, the polar end of its side chain appeared unfavorable for the hydrophobic part of LCA. Consistently, the N2727.39A mutation reduced the receptor's response in vitro, whereas substitution with a bulky phenylalanine (N2727.39F) enhanced it (Figs. 3C and 4A). More generally, in vitro dose-dependent responses assessed the functional role of residues predicted to be within 3 Å of the ligand in both ORAs (Figs. 3, B and C, and 4). Control mutations of residues predicted around the binding pocket but not in contact with LCA showed marginal or no effects on the receptors' response to the ligand (Fig. S5).
Figure 4.
Predicted binding mode of LCA in WT ORA5 and ORA6. A, LCA (balls and sticks)-binding mode in ORA5 (yellow ribbons). B, LCA-binding mode in ORA6. Left and right panels represent extracellular view and side view, respectively. Residues within 3 Å of LCA are shown in sticks and molecular surface (white). Dose-response curves of mutants versus the WT receptors confirm the predicted binding pose. The mutant/WT efficacy ratio and statistical significance are given in Table S5.
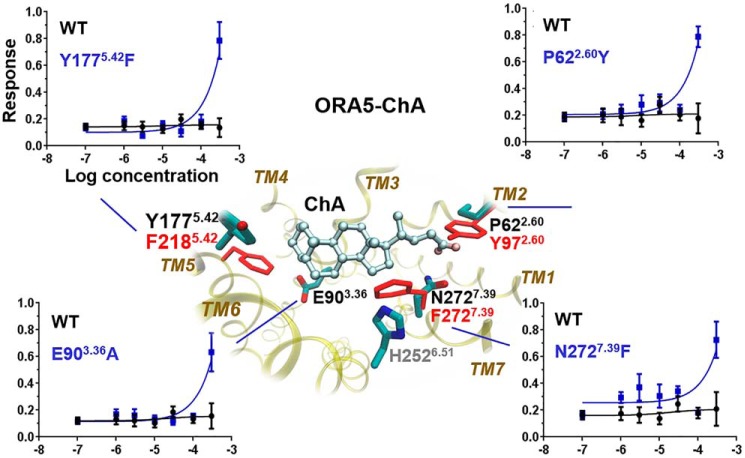
The models were finally assessed by their predictive power to reprogram ORA5 into a ChA-responsive receptor. The binding poses of ChA in ORA5 and ORA6 were predicted to be very similar to LCA, which was expected given its nearly identical structure to the latter (Fig. S6). Without the 3α-hydroxyl group, ChA fit better in the more hydrophobic pocket of ORA6 (AutoDock Vina score −10.1 kcal·mol−1, Haddock score −96.8 ± 2.7) than in ORA5 (AutoDock Vina score −6.7 kcal.mol−1, Haddock score −68.4 ± 0.6). Based on the models, we designed point mutations in the ORA5 pocket to optimize the interactions with the ligand. Four reprogrammed ORA5 mutants gained the function to recognize ChA in vitro (Fig. 5), suggesting the accuracy of the in silico models.
Figure 5.
Rational reprogramming of ORA5 gained the function of recognizing ChA. Predicted ChA-binding pose revealed unfavorable contacts with four ORA5 residues (P622.60, E903.36, Y1775.42, and N2727.39, in cyan), three of which were mutated to the corresponding ones in ORA6 (Y972.60, F2185.42, and F2727.39, in red) that are more favorable. E903.36 was mutated to alanine to eliminate their unfavorable interactions with the ligand's hydrophobic ring. In vitro dose-response curves (normalized to the maximum response) demonstrate the gain of function in the mutants. The mutant/WT efficacy ratio and statistical significance are given in Table S5.
Ligand-binding pockets in ORAs are diverse and complementary with conserved patterns
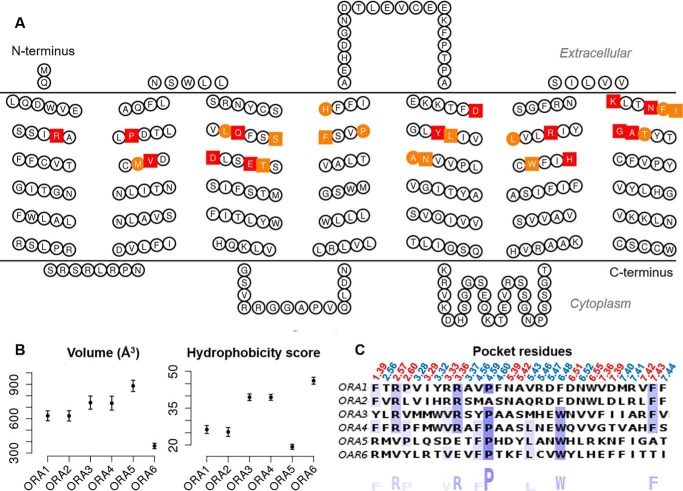
The site-directed mutagenesis data have verified the in silico models of the binding pocket in ORA5 and ORA6 (Fig. 6A). We then assessed and compared the pocket properties in all the six ORAs. The pocket turned out to vary significantly in volume and hydrophobicity within the family (Fig. 6B). The ORA5 pocket is the largest and the most hydrophilic. The one of ORA6 is the smallest and the most hydrophobic, consistent with its distinct ligand selectivity: high response to ChA (small and hydrophobic) and no response to taurolithocholic acid or glycolithocholic acid (both large and hydrophilic). ORA1 and ORA2 showed most similarities in the pocket, in terms of sequence (62% identity) and physiochemical properties (Fig. 6C). These two receptors also respond to the same ligands among those tested here, with different potencies (Fig. 1A). ORA3 and ORA4also possess relatively similar pockets (52% sequence identity) (Fig. 6). However, their responses to the ligands differed remarkably in selectivity and potency (Fig. 1A).Phylogenetically the six ORAs divide into three pairs, ORA1-ORA2, ORA3-ORA4, and ORA5-ORA6 (7), which is reflected to some extent in their pocket profiles.
Figure 6.
ORA pocket residues and properties. A, snake-plot of ORA5 with pocket residues colored: those predicted to be within 3 Å of LCA are squares, whereas those verified by mutagenesis are colored in red. B, pocket volume and hydrophobicity assessed with 100 in silico models of each ORA. Error bars represent mean ± S.E. C, pocket residues of the six ORAs with Ballesteros-Weinstein notation above and consensus sequence logo underneath.
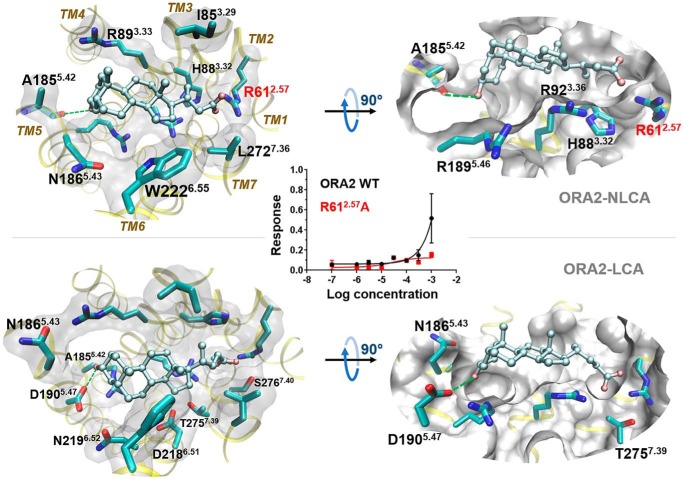
The acid anchor residues identified in ORA5 (K2697.36) and ORA6 (R481.39) turned out to be not conserved in the ORA sequences. However, ORA1–ORA4 all share a positively charged R2.57 (Fig. 6C), which is located near K2697.36 and R481.39 in the three-dimensional models. In the predicted binding pose of NLCA and LCA in ORA2 (Fig. 7), R612.57 indeed appeared to play the same role of an acid anchor. Consistently, the ORA2 R612.57A mutant was unable to respond to LCA in vitro (Fig. 7). Thus, R2.57 is likely the conserved acid anchor in ORA1–ORA4, where its slightly shifted location compared with ORA5 and ORA6 may explain why the former respond more strongly to NLCA than LCA. The two ligands have the same steroid ring structure but with a differently positioned acid moiety. These findings emphasize how ORAs conserved the capacity to recognize bile acids whereas the pocket diversity enables differentiation of distinct ligand structures.
Figure 7.
NLCA and LCA adopt similar binding poses in ORA2. In both cases, residue R612.57 is the anchor for the ligand carboxyl group. The hydrogen bond acceptor for the ligands' 3α-hydroxyl group differs. The steroid ring of LCA appears to make less favorable contacts with several polar residues on TM6 and TM7, which may account for LCA's lower activity than NLCA. The dose-response curves show that the R612.57A mutation diminished the receptor's response to LCA. The mutant/WT efficacy ratio and statistical significance are given in Table S5.
Discussion
Bile acids/salts are major end-metabolites of cholesterol. They are putative fish semiochemicals carrying information about foraging, migration, reproduction, nearby fish populations, risk, and so on (19). Similar to mammals, fish release steady compositions and amounts of bile acids/salts, mostly in their feces (28). Our assays in a heterologous system showed that zebrafish ORAs detect specifically C24 5β-bile acids/salts with EC50 values in 10 μm–1 mm range. Behavioral tests indicated that the ORAs' sensitivity to bile acids/salts is much higher than this threshold, likely in nanomolar to low micromolar range. The ORAs' detection spectrum may not be limited to the C24 5β profile. This remains to be assessed with extensive screening of more compounds of diverse structures. C24 bile acids and their conjugate salts are the most common type of bile acids/salts in fish species (22). Fish bile acids/salts have been found to be less variable (independent of diets) than in other vertebrate species (22, 29). Therefore, the high conservation of fish ORA genes likely reflects their specialized function to detect bile acids/salts, because the latter preserve stable profiles. The identification of ORAs as the specific receptors for bile acids/salts is an important step forward in the research of fish chemosensation.
The molecular modeling combined with site-directed mutagenesis decrypted how the zebrafish ORAs recognize these bile acids/salts and differentiate among them. We pinpointed the receptor residues outlining the ligand-binding pocket and could reprogram the receptors' selectivity and specificity with gain-of-function mutations. The ligand-binding pocket shows high variation yet a relatively conserved acid anchor within the family, indicating their common capacity to recognize acidic compounds. We hypothesize that the six ORAs have evolved with complementary selectivity for such odorants, so that different odorant mixtures could be discriminated through combinatorial activation of multiple ORAs. This is a common strategy in odor detection throughout the animal kingdom, where numerous olfactory receptors enable precise detection of the immense chemical space of olfactory cues for survival and communication. These GPCRs comprise various families that sense odor molecules, pheromones, and diverse other chemicals. Decoding the structure–function relationship of olfactory receptors is key to understanding their functions and their remarkable discriminatory capacity for chemosignals. In fishes, the ORA family is ancestral to the mammalian pheromone receptors V1Rs. Here we found that zebrafish ORAs are selective for a class of steroid compounds known to have pheromonal effects on fishes. This study opened the way to in-depth investigations of the physiological roles of these important receptors and the molecular mechanisms controlling fish detection and responses to semiochemicals.
Materials and methods
Chemicals
All bile acids used in this study were kind gifts from Dr. Matthew Krasowski (University of Iowa). Bile acids were first dissolved in DMSO to make stock solution, then freshly diluted in Opti-MEM (Thermo Fisher) just before the experiment. The bile acid concentration in dose-dependent assays ranged from 0.1 μm to 300 μm.
Cell culture and transfection
We used Hana3A cells, a HEK293T-derived cell line that stably expresses receptor-transporting proteins (RTP1L and RTP2), receptor expression-enhancing protein 1 (REEP1) and olfactory G protein (Gαolf) (23). Cells were grown in MEM (Corning) supplemented with 10% (v/v) FBS (Thermo Fisher), added with 100 μg/ml penicillin-streptomycin, 1.25 μg/ml amphotericin, and 1 μg/ml puromycin.
Our plasmid construction was based on the plasmids of the mouse olfactory receptor Olfr62 from the Matsunami laboratory. The coding regions of the ORAs were cloned from the cDNA of zebrafish olfactory tissue and ligated into pCI vector with Rho tag at the N terminus. ORA sequences were confirmed by sequencing using both forward and reverse primers. All constructs were transfected into cells by using Lipofectamine 2000 (Thermo Fisher) according to the product manual. Hana3A cells, were plated on 96-well plates (NEST) and incubated overnight in MEM with 10% FBS at 37 °C and 5% CO2. The following day, cells were transfected using Lipofectamine 2000. For each 96-well plate, 2.4 μg of pRL-SV40, 2.4 μg of CRE-Luc, 2.4 μg of mouse RTP1S, and 12 μg of receptor plasmid DNA were transfected.
Live cell immunostaining
Cells were seeded into 24-well plates at 105 cells per well. To monitor the transfection efficiency, 0.14 μg of GFP was co-transfected with 0.14 μg of RTP1s and 0.72 μg of ORA in each well. Twenty-four h after transfection, cells were incubated with primary antibody solution (mouse anti-rhodopsin, Rho 4D2, Abcam) on ice for 1 h. After rinsing the cells three times, secondary antibody solution (Alexa Fluor 568–conjugated anti-mouse IgG) was added onto the cells. After 45 min of incubation on ice, the cells were fixed with 2% paraformaldehyde, and mounted with VECTASHIELD mounting medium (Vector Laboratories). After mounting, a confocal laser-scanning microscope (Zeiss LSM 510) was used to examine immunofluorescence.
The surface expression of each ORA was quantified by the Rho/GFP intensity ratio. For each plate, the total fluorescence intensity (after background subtraction) was measured for both red (Rho) and green (GFP) channels.
Luciferase assay
Luciferase assay was performed with the Dual-Glo Luciferase Assay kit (Promega) following the protocol in Ref. 23. ORA activation triggers the olfactory G protein–driven AC-cAMP-PKA signaling cascade and phosphorylates cAMP-response element-binding protein. Activated cAMP-response element-binding protein induces luciferase gene expression, which can be quantified luminometrically (measured here with a bioluminescence plate reader (BioTek)). Cells were co-transfected with firefly and Renilla luciferases where firefly luciferase served as the cAMP reporter. Renilla luciferase is driven by a constitutively active SV40 promoter (pRL-SV40; Promega), which served as a control for cell viability and transfection efficiency. Therefore, normalized ORA activity is calculated as (LN − Lmin)/(Lmax − Lmin), where LN is the luminescence of firefly luciferase in response to the steroids, and Lmin and Lmax are the minimum and maximum luminescence values on a plate, respectively. The assay was carried out as follows: 24 h after transfection, medium was replaced with 100 μl of odorant solution (at different doses) diluted in Opti-MEM (Thermo Fisher), and cells were further incubated for 4 h at 37 °C and 5% CO2. After incubation in lysis buffer for 15 min, 20 μl of Dual-Glo™ Luciferase Reagent was added to each well of 96-well plate and firefly luciferase luminescence was measured. Next, 20 μl Stop-Glo Luciferase Reagent was added to each well and Renilla luciferase luminescence was measured. Data analysis followed the published procedure in Ref. 23. Dose-response curves were fitted by GraphPad Prism with the four-parameter logistic regression. Hana3A cells, GFP, RTP1S, CRE-Luciferase, and SV40-Renilla constructs were kind gifts from Dr. Hiroaki Matsunami (Duke University).
Zebrafish behavioral assay
Adult zebrafish between 6 and 12 months of age (Ab/Tü strain) were habituated for 45 min in an elongated tank (10 cm × 10 cm × 100 cm length) filled with 9 liters fresh filtered water. Individual fish movements were recorded using EthoVision® (Noldus, Beijing, China) at 30 frames per second for 5 min before and after stimulation with 180 μl of tank water (negative control) or 1 mm LCA, ChA, or food extract.
The animal experiments were approved by the Shanghai Medical Experimental Animal Administrative Committee (Permit Number: 2009–0082). All efforts were made to minimize suffering and reduce the number of animals used.
Molecular modeling
Homology modeling and docking
The HHpred webserver (30) was used to determine the structure template and the sequence alignments. We built 100 models for each ORA with Modeler v9.15 (31) using the crystal structure of human angiotensin II receptor type 1 (PDB ID 4ZUD) (32) as template. MDpocket (33) was used to statistically assess the pocket properties using the 100 models. For docking, we chose the model with the lowest DOPE score for each ORA. AutoDock Vina (34) and the Haddock 2.2 webserver (35) were used to identify a common top-ranked binding pose. Residues in the putative ligand-binding pocket were set flexible during docking.
Molecular dynamics
The Desmond-Maestro (v2016.1, noncommercial distribution) tools (36) were used to predict the protonation states and to embed the receptor in a bilayer of POPC, the most abundant phospholipid in animal cell membranes (37). The system was solvated in a periodic 75 × 75 × 105 Å3 box of explicit water and neutralized with 0.15 m Na+ and Cl− ions. Finally, each simulation system consisted of ∼50,000 atoms, including ∼10,000 water molecules, 31 Na+ and 39 Cl− ions. The Amber lipid 14 (38), Amber99SB-ildn (39), TIP3P (40), and the Joung-Cheatham (41) force field parameters were used for the lipids, the protein, the water molecules, and the ions, respectively. After energy minimization, each system was gradually heated to 310 K with 200 kcal·mol−1·Å−1 restraints on the protein atoms. Bonds involving hydrogen atoms were constrained using the SHAKE algorithm (42), allowing for a 2-fs time step. van der Waals and short-range electrostatic interactions were cut off at 8 Å. Long-range electrostatic interactions were computed using particle mesh Ewald summation. Two phases of 200-ps equilibration with 15 and 5 kcal·mol−1·Å−1 restraints on the protein, respectively, were performed in the NPT-ensemble (p = 1 bar, T = 310 K) using the Langevin thermostat and anisotropic pressure coupling (43), followed by 1 ns of nonrestrained MD for each system. Cluster analysis of the ligand-binding pose was carried out on the nonrestrained trajectory using g_cluster in Gromacs tools with the GROMOS method (44). The middle structure of the most populated cluster was selected as the final binding pose.
Author contributions
X. C., S. F., C. Z., H. Y., J. G., and Y. Y. conceptualization; X. C., Q. Z., W. R., J.-B. C., T. W., and Y. Y. data curation; X. C. and J.-B. C. software; X. C., Q. Z., W. R., J.-B. C., T. W., and Y. Y. formal analysis; X. C., C. Z., H. Y., J. G., and Y. Y. funding acquisition; X. C., J. G., and Y. Y. validation; X. C., Q. Z., W. R., J.-B. C., T. W., J. G., and Y. Y. investigation; X. C., Q. Z., J.-B. C., and Y. Y. visualization; X. C., J.-B. C., S. F., and Y. Y. methodology; X. C., J.-B. C., J. G., and Y. Y. writing-original draft; X. C., S. F., J. G., and Y. Y. writing-review and editing; S. F., C. Z., J. G., and Y. Y. supervision; H. Y. and Y. Y. resources; H. Y. and Y. Y. project administration.
Supplementary Material
Acknowledgment
We (J. G. and X. C.) acknowledge GENCI/CINES (France) for providing access to the supercomputer OCCIGEN.
This work was supported by National Natural Science Foundation of China Grants 81700894 and 31771155 (to Y. Y.); Shanghai Municipal Education Commission, the Shanghai Eastern Scholar Program (to Y. Y.); Shanghai Municipal Human Resources and Social Security Bureau, Shanghai Talent Development Fund (to Y. Y.); the EENT Hospital of Fudan University, the Startup Fund (to Y. Y.); Shanghai University, the Startup Fund (to Y. Y.); the French National Research Agency (Agence Nationale de la Recherche, ANR), Project NEUROLF (to J. G.) as part of the ANR-NSF-NIH Collaborative Research in Computational Neuroscience; the French government, through the UCAJEDI Investments in the Future project managed by the ANR Grant ANR-15-IDEX-01 (to X. C. and J. G.); the German Research Foundation (Deutsche Forschungsgemeinschaft Grant CO 1715/1-1) (to X. C.); the Shanghai Municipal Commission of Heath and Family Planning Grant 201740187 (to H. Y.); the Shanghai Natural Science Foundation Grant 16ZR1405100 (to H. Y.). This work was also supported by National Institutes of Health Grant DC011650 (to C. Z.). The authors declare that they have no conflicts of interest with the contents of this article. The content is solely the responsibility of the authors and does not necessarily represent the official views of the National Institutes of Health.
This article contains Figs. S1–S6 and Tables S1–S5.
- V1R
- vomeronasal receptors type 1
- V2R
- vomeronasal receptors type 2
- GPCR
- G protein–coupled receptor
- ORA
- olfactory receptor related to class A GPCR
- TM
- transmembrane
- LCA
- lithocholic acid
- ChA
- cholinic acid
- NLCA
- norlithocholic acid
- MEM
- minimum essential medium.
References
- 1. Isogai Y., Si S., Pont-Lezica L., Tan T., Kapoor V., Murthy V. N., and Dulac C. (2011) Molecular organization of vomeronasal chemoreception. Nature 478, 241–245 10.1038/nature10437 [DOI] [PMC free article] [PubMed] [Google Scholar]
- 2. Leinders-Zufall T., Ishii T., Mombaerts P., Zufall F., and Boehm T. (2009) Structural requirements for the activation of vomeronasal sensory neurons by MHC peptides. Nat. Neurosci. 12, 1551–1558 10.1038/nn.2452 [DOI] [PubMed] [Google Scholar]
- 3. Haga S., Hattori T., Sato T., Sato K., Matsuda S., Kobayakawa R., Sakano H., Yoshihara Y., Kikusui T., and Touhara K. (2010) The male mouse pheromone ESP1 enhances female sexual receptive behaviour through a specific vomeronasal receptor. Nature 466, 118–122 10.1038/nature09142 [DOI] [PubMed] [Google Scholar]
- 4. Boschat C., Pélofi C., Randin O., Roppolo D., Lüscher C., Broillet M. C., and Rodriguez I. (2002) Pheromone detection mediated by a V1r vomeronasal receptor. Nat. Neurosci. 5, 1261–1262 10.1038/nn978 [DOI] [PubMed] [Google Scholar]
- 5. Del Punta K., Leinders-Zufall T., Rodriguez I., Jukam D., Wysocki C. J., Ogawa S., Zufall F., and Mombaerts P. (2002) Deficient pheromone responses in mice lacking a cluster of vomeronasal receptor genes. Nature 419, 70–74 10.1038/nature00955 [DOI] [PubMed] [Google Scholar]
- 6. Johnstone K. A., Lubieniecki K. P., Chow W., Phillips R. B., Koop B. F., and Davidson W. S. (2008) Genomic organization and characterization of two vomeronasal 1 receptor-like genes (ora1 and ora2) in Atlantic salmon Salmo salar. Mar. Genomics 1, 23–31 10.1016/j.margen.2008.04.003 [DOI] [PubMed] [Google Scholar]
- 7. Saraiva L. R., and Korsching S. I. (2007) A novel olfactory receptor gene family in teleost fish. Genome Res. 17, 1448–1457 10.1101/gr.6553207 [DOI] [PMC free article] [PubMed] [Google Scholar]
- 8. Ota T., Nikaido M., Suzuki H., Hagino-Yamagishi K., and Okada N. (2012) Characterization of V1R receptor (ora) genes in Lake Victoria cichlids. Gene 499, 273–279 10.1016/j.gene.2012.03.002 [DOI] [PubMed] [Google Scholar]
- 9. Zhu G., Tang W., Wang L., Wang C., and Wang X. (2016) Identification of a uniquely expanded V1R (ORA) gene family in the Japanese grenadier anchovy (Coilia nasus). Mar. Biol. 163, 126 10.1007/s00227-016-2896-9 [DOI] [PMC free article] [PubMed] [Google Scholar]
- 10. Pfister P., and Rodriguez I. (2005) Olfactory expression of a single and highly variable V1r pheromone receptor-like gene in fish species. Proc. Natl. Acad. Sci. U.S.A. 102, 5489–5494 10.1073/pnas.0402581102 [DOI] [PMC free article] [PubMed] [Google Scholar]
- 11. Pfister P., Randall J., Montoya-Burgos J. I., and Rodriguez I. (2007) Divergent evolution among teleost V1r receptor genes. PLoS One 2, e379 10.1371/journal.pone.0000379 [DOI] [PMC free article] [PubMed] [Google Scholar]
- 12. Behrens M., Frank O., Rawel H., Ahuja G., Potting C., Hofmann T., Meyerhof W., and Korsching S. (2014) ORA1, a zebrafish olfactory receptor ancestral to all mammalian V1R genes, recognizes 4-hydroxyphenylacetic acid, a putative reproductive pheromone. J. Biol. Chem. 289, 19778–19788 10.1074/jbc.M114.573162 [DOI] [PMC free article] [PubMed] [Google Scholar]
- 13. Cong X., Topin J., and Golebiowski J. (2017) Class A GPCRs: Structure, function, modeling and structure-based ligand design. Curr. Pharm. Des. 23, 4390–4409 10.2174/1381612823666170710151255 [DOI] [PubMed] [Google Scholar]
- 14. Cvicek V., Goddard W. A. 3rd, Abrol R. (2016) Structure-based sequence alignment of the transmembrane domains of all human GPCRs: Phylogenetic, structural and functional implications. PLoS Comput. Biol. 12, e1004805 10.1371/journal.pcbi.1004805 [DOI] [PMC free article] [PubMed] [Google Scholar]
- 15. de March C. A., Topin J., Bruguera E., Novikov G., Ikegami K., Matsunami H., and Golebiowski J. (2018) Odorant receptor 7D4 activation dynamics. Angew Chem. Int. Ed. Engl. 57, 4554–4558 10.1002/anie.201713065 [DOI] [PMC free article] [PubMed] [Google Scholar]
- 16. de March C. A., Yu Y., Ni M. J., Adipietro K. A., Matsunami H., Ma M., and Golebiowski J. (2015) Conserved residues control activation of mammalian G protein-coupled odorant receptors. J. Am. Chem. Soc. 137, 8611–8616 10.1021/jacs.5b04659 [DOI] [PMC free article] [PubMed] [Google Scholar]
- 17. Yu Y., de March C. A., Ni M. J., Adipietro K. A., Golebiowski J., Matsunami H., and Ma M. (2015) Responsiveness of G protein-coupled odorant receptors is partially attributed to the activation mechanism. Proc. Natl. Acad. Sci. U.S.A. 112, 14966–14971 10.1073/pnas.1517510112 [DOI] [PMC free article] [PubMed] [Google Scholar]
- 18. Charlier L., Topin J., Ronin C., Kim S. K., Goddard W. A. 3rd, Efremov R., and Golebiowski J. (2012) How broadly tuned olfactory receptors equally recognize their agonists. Human OR1G1 as a test case. Cell Mol. Life Sci. 69, 4205–4213 10.1007/s00018-012-1116-0 [DOI] [PMC free article] [PubMed] [Google Scholar]
- 19. Buchinger T. J., Li W., and Johnson N. S. (2014) Bile salts as semiochemicals in fish. Chem. Senses 39, 647–654 10.1093/chemse/bju039 [DOI] [PubMed] [Google Scholar]
- 20. Doyle W. I., and Meeks J. P. (2018) Excreted steroids in vertebrate social communication. J. Neurosci. 38, 3377–3387 10.1523/JNEUROSCI.2488-17.2018 [DOI] [PMC free article] [PubMed] [Google Scholar]
- 21. Meredith T. L., Caprio J., and Kajiura S. M. (2012) Sensitivity and specificity of the olfactory epithelia of two elasmobranch species to bile salts. J. Exp. Biol. 215, 2660–2667 10.1242/jeb.066241 [DOI] [PubMed] [Google Scholar]
- 22. Hofmann A. F., Hagey L. R., and Krasowski M. D. (2010) Bile salts of vertebrates: Structural variation and possible evolutionary significance. J. Lipid Res. 51, 226–246 10.1194/jlr.R000042 [DOI] [PMC free article] [PubMed] [Google Scholar]
- 23. Zhuang H., and Matsunami H. (2008) Evaluating cell-surface expression and measuring activation of mammalian odorant receptors in heterologous cells. Nat. Protoc. 3, 1402–1413 10.1038/nprot.2008.120 [DOI] [PMC free article] [PubMed] [Google Scholar]
- 24. Hussain A., Saraiva L. R., Ferrero D. M., Ahuja G., Krishna V. S., Liberles S. D., and Korsching S. I. (2013) High-affinity olfactory receptor for the death-associated odor cadaverine. Proc. Natl. Acad. Sci. U.S.A. 110, 19579–19584 10.1073/pnas.1318596110 [DOI] [PMC free article] [PubMed] [Google Scholar]
- 25. Fuss S. H., and Korsching S. I. (2001) Odorant feature detection: Activity mapping of structure response relationships in the zebrafish olfactory bulb. J. Neurosci. 21, 8396–8407 10.1523/JNEUROSCI.21-21-08396.2001 [DOI] [PMC free article] [PubMed] [Google Scholar]
- 26. Oka Y., Saraiva L. R., and Korsching S. I. (2012) Crypt neurons express a single V1R-related ora gene. Chem. Senses 37, 219–227 10.1093/chemse/bjr095 [DOI] [PubMed] [Google Scholar]
- 27. Ballesteros J. A., and Weinstein H. (1995) Integrated methods for the construction of three-dimensional models and computational probing of structure-function relations in G protein-coupled receptors. Methods Neurosci. 25, 366–428 10.1016/S1043-9471(05)80049-7 [DOI] [Google Scholar]
- 28. Zhang C., Brown S. B., and Hara T. J. (2001). Biochemical and physiological evidence that bile acids produced and released by lake char (Salvelinus namaycush) function as chemical signals. J. Comp. Physiol. B, 171, 161–171. 10.1007/s003600000170 [DOI] [PubMed] [Google Scholar]
- 29. Hagey L. R., Møller P. R., Hofmann A. F., and Krasowski M. D. (2010) Diversity of bile salts in fish and amphibians: Evolution of a complex biochemical pathway. Physiol. Biochem. Zool. 83, 308–321 10.1086/649966 [DOI] [PMC free article] [PubMed] [Google Scholar]
- 30. Söding J., Biegert A., and Lupas A. N. (2005) The HHpred interactive server for protein homology detection and structure prediction. Nucleic Acids Res. 33, W244–W248 10.1093/nar/gki408 [DOI] [PMC free article] [PubMed] [Google Scholar]
- 31. Eswar N., Webb B., Marti-Renom M. A., Madhusudhan M. S., Eramian D., Shen M.-Y., Pieper U., and Sali A. (2006) Comparative protein structure modeling using Modeller. Curr. Protoc. Bioinformatics 15, 5.6.1–5.6.30 10.1002/0471250953.bi0506s15 [DOI] [PMC free article] [PubMed] [Google Scholar]
- 32. Zhang H., Unal H., Desnoyer R., Han G. W., Patel N., Katritch V., Karnik S. S., Cherezov V., and Stevens R. C. (2015) Structural basis for ligand recognition and functional selectivity at angiotensin receptor. J. Biol. Chem. 290, 29127–29139 10.1074/jbc.M115.689000 [DOI] [PMC free article] [PubMed] [Google Scholar]
- 33. Schmidtke P., Bidon-Chanal A., Luque F. J., and Barril X. (2011) MDpocket: Open-source cavity detection and characterization on molecular dynamics trajectories. Bioinformatics 27, 3276–3285 10.1093/bioinformatics/btr550 [DOI] [PubMed] [Google Scholar]
- 34. Trott O., and Olson A. J. (2010) AutoDock Vina: Improving the speed and accuracy of docking with a new scoring function, efficient optimization, and multithreading. J. Comput. Chem. 31, 455–461 10.1002/jcc.21334 [DOI] [PMC free article] [PubMed] [Google Scholar]
- 35. van Zundert G. C. P., Rodrigues J. P. G. L. M., Trellet M., Schmitz C., Kastritis P. L., Karaca E., Melquiond A. S. J., van Dijk M., de Vries S. J., and Bonvin A. M. J. J. (2016) The HADDOCK2.2 web server: User-friendly integrative modeling of biomolecular complexes. J. Mol. Biol. 428, 720–725 10.1016/j.jmb.2015.09.014 [DOI] [PubMed] [Google Scholar]
- 36. Weng P. L., Vinjamuri M., and Ovitt C. E. (2016) Ascl3 transcription factor marks a distinct progenitor lineage for non-neuronal support cells in the olfactory epithelium. Sci. Rep. 6, 38199 10.1038/srep38199 [DOI] [PMC free article] [PubMed] [Google Scholar]
- 37. Tattrie N. H., Bennett J. R., and Cyr R. (1968) Maximum and minimum values for lecithin classes from various biological sources. Can. J. Biochem. 46, 819–824 [DOI] [PubMed] [Google Scholar]
- 38. Dickson C. J., Madej B. D., Skjevik A. A., Betz R. M., Teigen K., Gould I. R., and Walker R. C. (2014) Lipid14: The Amber Lipid Force Field. J. Chem. Theory Comput. 10, 865–879 10.1021/ct4010307 [DOI] [PMC free article] [PubMed] [Google Scholar]
- 39. Lindorff-Larsen K., Piana S., Palmo K., Maragakis P., Klepeis J. L., Dror R. O., and Shaw D. E. (2010) Improved side-chain torsion potentials for the Amber ff99SB protein force field. Proteins 78, 1950–1958 10.1002/prot.22711 [DOI] [PMC free article] [PubMed] [Google Scholar]
- 40. Jorgensen W. L., Chandrasekhar J., Madura J. D., Impey R. W., and Klein M. L. (1983) Comparison of simple potential functions for simulating liquid water. J. Chem. Phys. 79, 926–935 10.1063/1.445869 [DOI] [Google Scholar]
- 41. Joung I. S., and Cheatham T. E. 3rd. (2008) Determination of alkali and halide monovalent ion parameters for use in explicitly solvated biomolecular simulations. J. Phys. Chem. B 112, 9020–9041 10.1021/jp8001614 [DOI] [PMC free article] [PubMed] [Google Scholar]
- 42. Ryckaert J.-P., Ciccotti G., and Berendsen H. J. C. (1977) Numerical integration of the Cartesian equations of motion of a system with constraints: Molecular dynamics of n-alkanes. J. Comput. Phys. 23, 327–341 10.1016/0021-9991(77)90098-5 [DOI] [Google Scholar]
- 43. Loncharich R. J., Brooks B. R., and Pastor R. W. (1992) Langevin dynamics of peptides: The frictional dependence of isomerization rates of N-acetylalanyl-N′-methylamide. Biopolymers 32, 523–535 10.1002/bip.360320508 [DOI] [PubMed] [Google Scholar]
- 44. Van Der Spoel D., Lindahl E., Hess B., Groenhof G., Mark A. E., and Berendsen H. J. (2005) GROMACS: Fast, flexible, and free. J. Comput. Chem. 26, 1701–1718 10.1002/jcc.20291 [DOI] [PubMed] [Google Scholar]
Associated Data
This section collects any data citations, data availability statements, or supplementary materials included in this article.


