

Abstract
Metabolic dysfunction, commonly a result of diets high in saturated fats and sugar, is associated with impaired cognitive function and an increased risk of age-related cognitive decline (ACD) and Alzheimer’s disease (AD). Compared to the E3 isoform of apolipoprotein (apoE), the E4 isoform is a major genetic risk factor for ACD, AD, and for developing cognitive impairments following various environmental challenges, including dietary challenges such as a high-fat diet (HFD). Both insulin resistance (IR) and E4 are associated with metabolic and vascular impairments. Deficits in cerebral metabolism and cerebrovascular function have been proposed as initiating events leading to these impairments. In the current study, we employed a model of human apoE targeted replacement mice and HFD-induced obesity to study the potential link between E4 and IR, at rest and following a postprandial challenge. HFD-induced IR was associated with impaired cognition, reduced cerebral blood volume and decreased glucose uptake. These effects were more profound in E4 than E3 mice. Furthermore, the cognitive, metabolic and cerebrovascular responses to an exogenous glucose load showed an apoE isoform-dependent response, with E4, but not E3 mice, acutely benefiting from a spike in blood glucose.
Keywords: Apolipoprotein, cerebral blood flow, cognition, insulin resistance, glucose
Introduction
The elderly population is expanding rapidly, and by 2050, the percentage of the world population aged 65 years or older will more than double to 1.6 billion individuals.1 Concurrently, diabetes has reached epidemic proportions worldwide.2 Projected rates of diabetes over the next two decades are staggering; a 165% increase in the number of patients with diabetes, with the largest increase in individuals over 75 years of age.3 Type 2 diabetes (T2D) accounts for over 90% of all diabetes incidence and is characterized by obesity and insulin resistance (IR).4 The major modifiable risk factor for T2D is obesity, while the primary contributors to obesity are sedentary lifestyle and caloric excess, particularly in the form of “Western” style diets high in saturated fat.5 Obesity, IR, and T2D increase the risk of developing vascular disease, including both atherosclerosis and vascular dementia.4 Diabetes is also associated with an increased incidence of Alzheimer’s Disease (AD),6–9 and it is hypothesized that the two disorders are linked.10,11
Apolipoprotein E (apoE) is associated with circulating lipoproteins, specifically very low-density lipoproteins (VLDL) and high-density lipoproteins (HDL).12 The APOE gene encodes for three isoforms in the human population (E2, E3, and E4).12 Compared to E3, E4 is associated with higher LDL cholesterol levels and an increased risk of cardiovascular disease.13–14 E4 also dramatically increases the risk for developing AD,15–17 and genome-wide association studies confirm that E4 is the strongest genetic risk factor for AD.18,19
Cerebrovascular impairment has been proposed as an initiating event leading to neuronal degeneration,20 and both IR and E4 have been linked to vascular impairments. Individuals with T2D show lower resting blood flow in the brain and a reduced ability to maintain stable and sufficient cerebral blood flow (CBF) compared to controls.21,22 The microvasculature within peripheral tissues is particularly sensitive to insulin, and this sensitivity is impaired by obesity and IR.23 Insulin has many important actions in the brain, and brain IR has been proposed to contribute to the progression of AD.24 Furthermore, administration of intranasal insulin results in enhanced cognition in T2D patients that is related to regional vasoreactivity.22
Reduced CBF is seen in elderly E4 carriers relative to non-carriers in multiple brain regions.25 Cognitively, normal E4 individuals also show accelerated declines in regional CBF during aging,26 and the association between cognitive function and age-related changes in CBF is modified by APOE genotype.27 In addition to these differences in resting CBF, several studies have shown differences in functional activation, as measured by blood oxygen level dependent (BOLD), functional magnetic resonance imaging (fMRI), in middle aged and older E4 individuals.28 Importantly, E4-associated alterations in brain physiology occur early in life and in the absence of gross neuropathological changes and preceding cognitive impairments.29 For instance, functional differences in CBF are present as early as the second decade of life, with E4 carriers showing lower or higher activation in different regions of the temporal gyrus during a nonverbal memory task relative to non-carriers.30
Cerebral metabolism is a primary determinant of regional blood flow, and because metabolic rate and CBF are coupled, changes in brain metabolism are likely to affect CBF.31 AD is associated with a specific pattern of regional glucose hypometabolism,32,33 and glucose metabolism decreases during normal aging, particularly aerobic glycolysis.34 Interestingly, a consistent pattern of brain glucose hypometabolism – similar to that seen in AD – has been noted in elderly individuals with E4.35,36 Even cognitively normal E4 carriers demonstrate this pattern of glucose hypometabolism,37,38 and these metabolic deficits are present decades in advance of AD onset in E4 individuals.39
Despite the evidence linking IR and E4, very few studies have focused on examining the potential neurobiological pathways that lie at the intersection of these two critical risk factors. In the periphery, however, there are established effects of E4 on metabolism that may indirectly affect the brain.40 Recent studies suggest that these peripheral metabolic effects may affect cognitive function in E4 individuals by influencing glucose tolerance or modulating the response to a dietary challenge.41–43 In addition to the chronic effects of glucose dysregulation, as in IR, acute changes in glucose concentrations are also known to affect cognitive function, and these acute effects can also be apoE isoform-dependent.43 Therefore, in the current study, we employed a model of human apoE-targeted replacement mice and HFD-induced obesity to study the potential link between E4 and IR, at rest and following a postprandial challenge.
Methods
Experimental animals and diet
Female homozygous human E3- and E4-targeted replacement mice44,45 were fed an HFD ad libitum (60% kcal from fat, Research Diets D12492) or an ingredient-matched LFD (10% kcal from fat, D12450B) beginning at 9 months of age. Prior to administration of the HFD or LFD, mice consumed a standard chow diet ad libitum (PicoLab Rodent Diet 20, #5053; PMI Nutrition International, St. Louis, MO). All measures were conducted following six months of specialized diet (15 months of age). All procedures complied with the National Institutes of Health Guide for the Care and Use of Laboratory Animals and with IACUC approval at Oregon Health & Sciences University (OHSU), and were in compliance with ARRIVE (Animal Research: Reporting in Vivo Experiments) guidelines.
Metabolic and biochemical measurements
For the glucose tolerance test, mice were administered an oral gavage of glucose solution (2 mg/g body weight). For the insulin tolerance test, mice were intravenously injected with 0.75 U/kg of human insulin (Gibco). Blood glucose was measured using a glucometer (One Touch Ultra) at indicated time points. For resting glucose uptake, mice were injected following a 4-h fast with 0.75 μCi of 2-[1,2-3H (N)]-deoxy-d-glucose (Perkin Elmer) diluted in glucose solution (2 mg/d body weight) via the tail vein. For glucose uptake during the water maze test (see below), mice were administered an oral gavage (8 μl/g body weight) of 2-[1,2-3H (N)]-deoxy-d-glucose (0.06 μCi/g body weight) diluted in glucose solution (2 mg/g body weight) 14 min prior to a 1-min long memory trial (see Cognitive Testing for details). Tissue glucose uptake was adjusted to plasma values to adjust for variations in injection volumes and dietary absorption. Fifteen minutes after injection or gavage, mice were intraperitoneally administered a lethal dose of ketamine–xylazine–acepromazine cocktail (0.01 ml/g of 25 mg/ml ketamine (Sigma), 0.625 mg/ml acepromazine (Vetus Animal Health), 3.125 mg/ml xylazine (Sigma)). To flush out remaining blood, mice were intracardially perfused with 20 ml of 0.9% phosphate-buffered saline (PBS) and tissue was collected. Approximately 100 mg of tissue was homogenized in 4 ml of PBS. Brain and skeletal muscle homogenates were transferred to a scintillation vial, 1 ml of Optiphase scintillation fluid (Perkin Elmer) was added, and samples were measured on a liquid scintillation counter (Beckman).
Cognitive testing
Spatial learning and memory were assessed using the water maze test. The water maze consisted of a circular pool (diameter 140 cm), filled with opaque water (white chalk added, 24℃) divided conceptually into four quadrants. Mice were given two sessions per day (separated by three hours) consisting of two trials each (separated by 5 min), over the course of five days (two days “Visible Platform” followed by three days “Hidden Platform”). Mice were first trained to locate an escape platform submerged below the surface of the water, by the use of a cue during the “Visible Platform” trials. Mice were removed from the pool after locating the platform and remaining on it for 3 s. Mice were inserted in the maze at varying locations during each trial to avoid procedural bias, and during the Visible Platform trials, the location of the platform was moved for each session between the four quadrants to avoid procedural biases in task learning. Subsequent to the “Visible Platform” trials, mice were trained to locate the platform hidden beneath opaque water during the “Hidden Platform” trials, which required the mice to rely on extra-maze cues for spatial reference and orientation. Extra-maze cues consisted of four large (50 × 50 cm) cues of different shapes and color combinations, positioned at the borders of the four quadrants. The platform was not rotated during the Hidden Platform trials, remaining in the same location in the “Target” quadrant. Spatial memory retention was assessed 72 h following the final “Hidden Platform” training session. The submerged platform was removed and spatial memory retention assessed during these “Probe” trials by calculating the cumulative distance to the target and the time spent searching in each quadrant. For assessing effects of acute glucose supplementation on cognitive function, mice were given an oral gavage of glucose solution (2 mg/g body weight) 15 min prior to testing during the 72 h probe trial.
Cerebral blood volume measurement
To measure vascular perfusion (volume of blood-perfused vessels, referred to as cerebral blood volume (CBV)) in vivo, we employed optical microangiography (OMAG), as previously described.46,47 Briefly, mice were anesthetized with ketamine (50 mg/kg) and body temperature was maintained at 37 ± 0.5℃ using a warm water pad. The skin over the skull was reflected, the cortex illuminated through the intact skull at 1310 nm, and the resulting backscattered and reference light detected to produce spectral interferograms. CBV was measured in three branch areas of the middle cerebral artery (MCA) at positions centered approximately 0.0 to −1.0 mm caudal to bregma, and 1.0 to 2.0 mm lateral from the midline suture through the skull. For measures of the effects of glucose supplementation on CBV, the third area was measured at 0 min, and again at 15 min, post intravenous injection of 250 µl of a 0.25 mg/ml glucose solution. Vessel diameters were measured for each branching segment of the MCA within the 1 mm3 scan area, and pixel intensity histograms were generated using Amira software (FEI) at the Multiscale Microscopy Core (MMC) with technical support from the OHSU-FEI Living Lab and the OHSU Center for Spatial Systems Biomedicine (OCSSB).
Statistical analyses
Data are expressed as mean ± standard error. Multiple groups and/or multiple time points were analyzed using analysis of variance (ANOVA) (groups = E3 LFD, E4 LFD, E3 HFD, E4 HFD) using Graph Pad Prism software (San Diego, CA), or repeated measures ANOVA (time × groups) using SPSS software (Chicago, IL). Statistically significant correlations were determined using an error probability level of p < 0.05 corrected by a false discovery rate (FDR) analysis (Benjamini Hochberg method).
Results
E4 HFD mice gain less weight than E3 HFD mice but show similar degree of IR
While HFD led to increased body weight and adipose tissue in both E3 and E4 mice, E4 HFD mice gained less weight and less adipose tissue than E3 HFD mice (Figure 1(a) and (b)). HFD also led to elevated fasting plasma glucose concentrations and deficits in glucose tolerance and insulin sensitivity, with a similar degree of impairment observed in E3 and E4 HFD mice (Figure 1(c) to (e)). LFD-fed E3 and E4 mice did not differ in any of the measured markers of peripheral metabolism (Figure 1(a) to (e)).
Figure 1.

E4 HFD mice gain less weight than E3 HFD mice but show similar degree of insulin resistance. (a) E4 mice gain less weight when fed an HFD than E3 mice fed an HFD. n = 5–9. (b) E4 HFD mice accumulate less visceral adipose tissue than E3 HFD mice following six months of HFD (n = 5–9). (c) HFD leads to hyperglycemia in E3 and E4 mice. Blood glucose was measured following a 4-h fast. n = 20–26. (d) Glucose intolerance is exaggerated in HFD mice. Mice were administered an oral gavage of glucose following a 4-hour fast. n = 11–14. (e) Insulin sensitivity is diminished in HFD mice. Insulin was injected following a 4-h fast and blood glucose was measured. n = 9–10. (a, d–e, ** p < 0.01, E3 vs. E4; # p < 0.05, ## p < 0.01, HFD vs. LFD; repeated measures ANOVA) (b–c, ** p < 0.01, E3 vs. E4; # p < 0.05, ## p < 0.01, HFD vs. LFD; two-way ANOVA followed by t-test).
E4 and HFD reduce CBV
A potential physiological link between HFD-induced and E4-associated cognitive dysfunction is the regulation of CBF. To determine whether the observed cognitive impairments are associated with alterations in cerebrovascular function, we quantified CBV, a measure of vascular perfusion. Using OMAG, we measured CBV within pial vessel branches of the MCA (Figure 2(a) and (b)). Total CBV showed a significant effect of diet and genotype (p = 0.002 and p = 0.026, respectively, two-way ANOVA), with E4 HFD mice having the lowest rates of CBV (Figure 2(c)). HFD mice showed lower CBV in microvessels (<10 µM diameter) and small-sized vessels (20–40 µM diameter), with E4 HFD mice showing the lowest CBV within vessels of these diameters (Figure 2(d)). The changes in CBV appear unrelated to differences in vessel morphology, with all groups showing a similar number of blood vessels, total vessel length, and degree of branching (Suppl Figure 1(a) to (c)).
Figure 2.
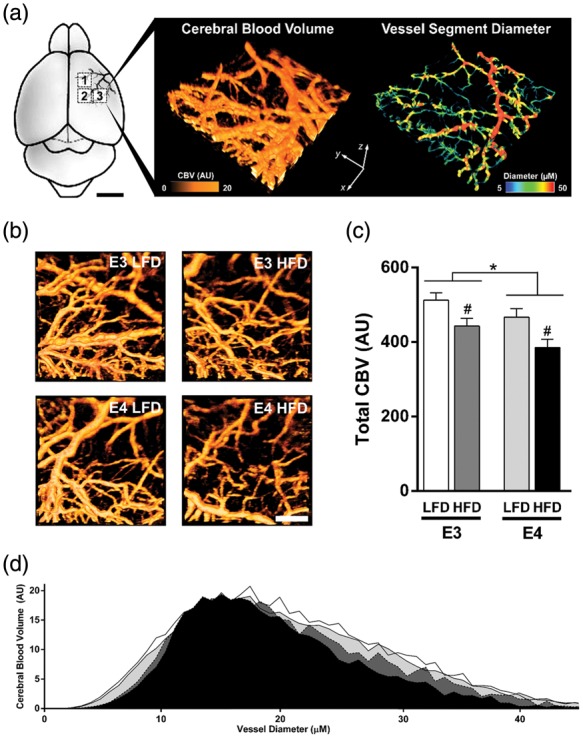
E4 and HFD reduce cerebral blood volume, a measure of vascular perfusion. (a–b) Diagram of vascular beds imaged and representative image of cerebral blood volume (CBV) and measures of vessel diameter. CBV was measured within pial vessel branches of the middle cerebral artery (MCA) using optical microangiography. CBV was measured within three distinct 1 mm3 scan regions (boxed areas, 1–3) for each mouse, and vessel diameter determined and CBV was quantified. (c) Total CBV (each mouse = average of three scans). n = 7–8. (d) Histogram of CBV across small vessels of varying diameters. *p < 0.05, E3 vs. E4; #p < 0.05, HFD vs. LFD; two-way ANOVA followed by t-test.
A bolus of glucose improves spatial memory in E4 HFD mice
Previous studies demonstrated measurable changes in cognitive performance following acute meal interventions, including a variable response to low versus high glycemic index (GI) meals.48 Recent work suggests that these acute dietary effects are modulated by apoE isoform, with E4+, but not E4−, individuals displaying cognitive gains immediately following a high GI meal.43 Therefore, we next asked whether E4 mice would similarly benefit more than E3 mice from a postprandial spike in pure glucose (GI = 100; standard value). To assess cognitive function, we measured spatial memory retention in the water maze. Fifteen minutes prior to a 72-h memory probe trial, mice were given a gavage of either glucose or saline. In saline-gavaged HFD mice, spatial memory retention was impaired in both E3 and E4 mice, as shown by a lack of spatial bias and a lack of spending more time in the target quadrant than any other quadrant (Figure 3(a), open bars). However, in HFD mice orally administered glucose prior to the memory probe, the cognitive effects differed depending on APOE genotype despite similar increases in blood glucose concentrations (Suppl Figure 2(a)). Compared to E3 LFD mice given a gavage of saline, E3 LFD mice given a gavage of glucose showed significant impairments in spatial memory retention, as measured by time spent searching in the target quadrant (Figure 3(a)) and cumulative distance from the target (Figure 3(b)). Conversely, E4 HFD mice showed significant improvement in spatial memory retention following an oral gavage of glucose (Figure 3(a) and (b)). Additionally, when compared to their saline-treated counterparts, E3 mice receiving a glucose gavage prior to the memory probe searched further from the target location over the course of the memory probe trial, while E4 mice receiving a glucose gavage searched substantially closer to the platform location (Figure 3(c)). Together, these data demonstrate that a bolus of glucose differentially affects acute cognitive performance based on APOE genotype, with E3 mice suffering, and E4 mice benefitting, from a spike in dietary glucose.
Figure 3.

A bolus of glucose improves spatial memory in E4 HFD mice. (a) A glucose gavage differentially affects acute cognitive performance based on APOE genotype. Spatial memory retention was measured as the percent time spent searching in the target quadrant a 72-h probe trial. (Quadrants: T: target; R: right; L: left; O: opposite). n = 7–13. (* p < 0.05, ** p < 0.01, Target compared to all other targets, ANOVA followed by t-tests). (b) E3 LFD mice show impaired memory retention in the water maze following a glucose gavage, while E4 HFD shows improved memory retention. Spatial memory was analyzed by calculating the cumulative distance to the target, a measure of search accuracy during the 72-h memory probe trial. n = 7–13. (* p < 0.05, t-test). (c) Change in cumulative distance to the target platform location compared to genotype- and diet-matched mice gavaged with saline. The mean change in cumulative distance was calculated for each group (mean of the glucose gavage group minus the mean of the saline gavage group). Compared to saline-treated E3 mice, E3 LFD and E3 HFD mice receiving a glucose gavage prior to the memory probe searched further from the target location over the course of the memory probe trial, suggesting a relative impairment in spatial memory. Conversely, E4 LFD and E4 HFD mice receiving a glucose gavage searched closer to the target location, suggesting a relative improvement in spatial memory. (* p < 0.05 compared to all other targets, ANOVA).
A bolus of glucose increases CBV in E4 HFD mice
To determine whether the postprandial changes in spatial memory retention were associated with cerebrovascular function, we measured CBV in E3 and E4 mice before and 15 min after an injection of a glucose solution (Figure 4(a)). While all groups showed similar increases in blood glucose concentrations following injection (Suppl Figure 2(b)), only E4 HFD mice demonstrated a significant CBV response to the acute hyperglycemia. There was a significant genotype effect on post-glucose CBV (p = 0.028, ANOVA) and a trend towards genotype × diet interaction (p = 0.0526, two-way ANOVA), with E4 mice showing larger increases. Total CBV was significantly increased in E4 HFD mice compared to E3 HFD mice (p = 0.018, t-test) (Figure 4(b)), and these increases were observed across small vessels of varying diameters (Figure 4(c)).
Figure 4.
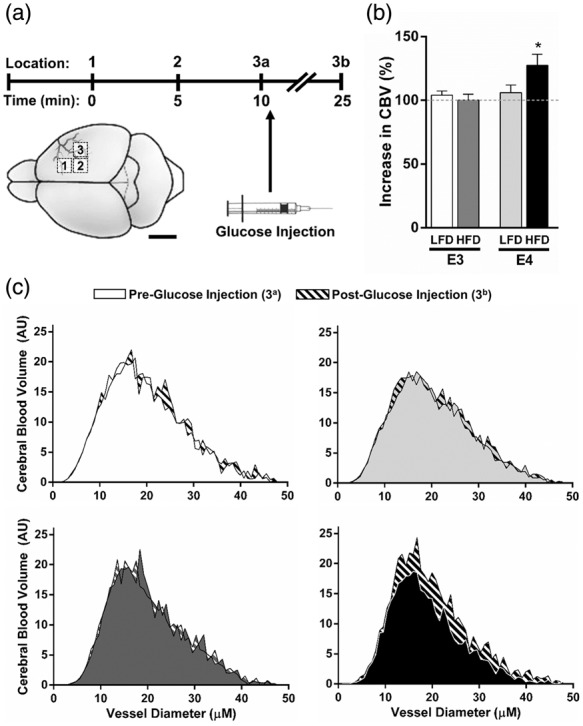
A bolus of glucose increases CBV in E4 HFD mice. (a) CBV was measured in E3 and E4 mice using OMAG at 0 and 15 min after an injection of a glucose solution. (b–c) Glucose increases CBV in E4 HFD mice. (b) Percent increase in total CBV following the glucose injection. (c) CBV at 0 and 15 min post-glucose injection across small vessels of varying diameters. n = 6–7. (* p < 0.05, two-way ANOVA followed by t-test).
E4 and HFD decrease brain glucose uptake at rest and during a memory task
We next asked whether the cognitive benefits observed in E4 HFD mice following a bolus of glucose were associated with an increase in tissue glucose uptake. To answer this, mice were administered radiolabeled 2-deoxyglucose (2DG) at rest, or prior to a memory test, and glucose uptake in the two primary organs expected to be activated during the water maze – brain and skeletal muscle – was assessed. While there was no significant effect of APOE or diet on resting glucose uptake in skeletal muscle, E4 was associated with reduced brain glucose uptake at rest (p = 0.0274, two-way ANOVA) (Figure 5(a) and (b)). To determine glucose uptake during a cognitive challenge, mice were given an oral gavage of 3H-2DG 14 min prior to a water maze probe and tissue uptake was assessed immediately following the 1-min long memory test. Glucose uptake during the cognitive challenge was significantly reduced by both E4 and HFD in brain and skeletal muscle (APOE, p = 0.0466 brain, p < 0.01 muscle; Diet p < 0.01, both tissues; two-way ANOVA) (Figure 5(c) and (d)). Together, these data show that E4 and HFD are associated with lower brain glucose uptake, and that these effects are magnified during a cognitive challenge.
Figure 5.
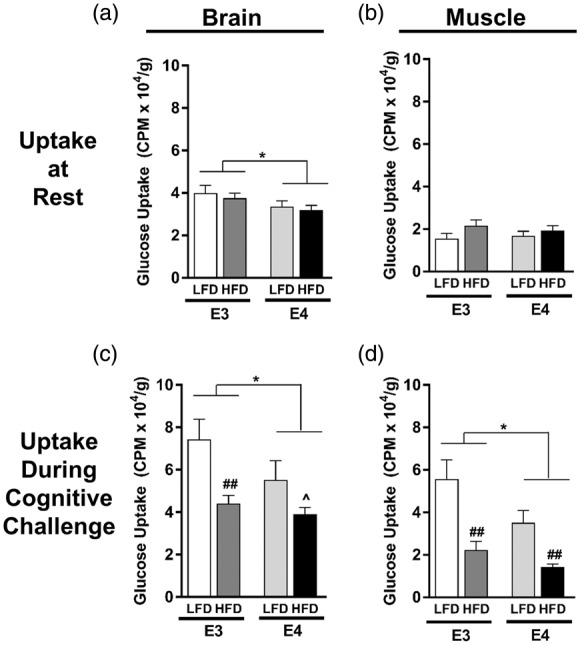
E4 and HFD decrease brain glucose uptake at rest and during a cognitive task. (a–b) Resting glucose uptake in brain (a) and skeletal muscle (b). Following a 4-h fast, tissue uptake of 3H-2-deoxyglucose was measured 15 min following an i.v. injection of glucose solution. n = 13–19. (c–d) Glucose uptake in brain (c) and skeletal muscle (d) during a cognitive challenge. Following a 4-h fast, mice were administered an oral gavage of glucose solution containing 3H-2-deoxyglucose and 14 min later were subjected to a 1-min long water maze memory probe. n = 4–9. (*p < 0.05, ^p = 0.06, E3 vs. E4; ## p < 0.01, HFD vs. LFD; two-way ANOVA followed by t-test).
Discussion
Increasing evidence suggests that cognitive impairments as a result of both IR and E4 share common pathological features and involve similar changes in metabolism and cerebrovascular function. For instance, there is overlap between the cerebrovascular pathologies observed in diabetic patients and in individuals with E4,49 and both IR and possession of E4 have been independently associated with inefficient brain glucose hypometabolism and reduced cerebral blood flow.25–27,50,51 Furthermore, these two factors may interact to impair cognition and promote neurodegeneration.7,52–54 In the current study, we further examined this potential interaction, and whether the effects are mediated via cerebrovascular function and can be modified by changes in postprandial glucose. Here, we show that both E4 and HFD-induced IR reduce CBV and glucose uptake, primarily in an additive fashion. However, the cognitive, metabolic and cerebrovascular responses to an exogenous glucose load varied considerably depending on APOE genotype, with E4, but not E3 mice, acutely benefiting from a spike in blood glucose.
ACD and AD share several key risk factors with cerebrovascular disease, such as hypertension, cerebral hypoperfusion, diabetes, hypercholesterolemia, and E4 carriage.55 Establishing the role of cerebrovascular dysfunction in ACD and AD has become even more important following recent studies that suggest a majority of clinically diagnosed AD is mixed pathology or vascular disease.56 APOE genotype itself has clear effects on several risk factors for dementia noted above, such as obesity,57–61 hypercholesterolemia,13,14 and peripheral vascular disease.62–64 Increasing in vivo and in vitro evidence also points to multiple cerebrovascular effects of APOE in the brain.65–70
Cerebral blood flow (CBF) is decreased in ACD and in AD patients.71,72 However, it remains unclear whether cerebral hypoperfusion drives the neurodegenerative process, or whether these deficits simply reflect diminished demand as a result of aging and/or neurodegeneration. In the case of E4, both lower25,26,30 and higher27,73 CBF have been observed in individuals with E4, with results differing depending on the age of the carriers.25 Still, some research suggests that hypoperfusion precedes, and possibly contributes to, the onset of dementia,74 and in fact decreased resting CBF is observed in E4+ individuals as young as their early twenties.30 Given that cognitive function relies on an efficient and responsive vascular system, it has been further speculated that the accelerated ACD and AD pathogenesis associated with E4 may result from its harmful effects on the cerebrovasculature.75
In the current study, we assessed CBV, a measure of vascular perfusion, using OMAG, which allows for in vivo, 3D, volumetric quantification of blood-perfused vessels with capillary resolution.47 While historically CBF was believed to be regulated strictly at the level of penetrating arterioles, it has recently been shown that capillaries are first to respond via neuron-pericyte signaling,76 and results suggest that human imaging studies relying on BOLD may largely reflect capillary function.77 Our group also recently highlighted the importance of cerebral microvessel function in vivo, linking microvascular perfusion and cognitive performance in a mouse model of diet-induced obesity and IR.46 Similarly, in the current study, we observed a significant decrease in CBV in HFD fed mice. Here, we also observed a significant decrease in CBV in E4, compared to E3 mice, in the absence of overt changes in vessel morphology. These results are contrary to that observed by Bell et al.65 showing E4-associated reductions in microvascular length. This discrepancy could be due to experimental methods; using OMAG, we can only visualize vessels with an active flow component (i.e. moving red blood cells (RBCs)), and therefore non-patent vessels would not be visualized and counted using our methodology. Future experiments aimed at carefully detailing potential structural differences in an apoE model – across age and according to diet or metabolic status – would be valuable. Finally, E4 HFD mice were the only group to show a CBV response to an acute increase in blood glucose. This group was also the only group to significantly improve in cognitive performance following a bolus of glucose. However, glucose uptake during the cognitive challenge in E4 HFD mice remained significantly lower than E3 HFD or LFD mice, which may speak to a potential uncoupling of CBF and glucose uptake. Perhaps the increase in CBV in E4 HFD mice following a glucose gavage, in the absence of increased glucose uptake, reflects an inability of E4 cells to take up glucose in the face of pro-uptake signaling. In other words, perhaps neural activity is able to stimulate CBV in E4 mice, but a dearth of glucose transporter expression or impaired function limits glucose uptake. The exact mechanism behind this potential apoE-specific glucose uptake and CBF uncoupling, however, remains unknown, and warrants future studies.
Evidence from other in vivo studies also highlights CBF as a potential link between E4 and impaired cognition. For example, using a flow-sensitive MRI technique, Wiesmann et al.70 recently showed that 18-month-old E4 mice had reduced CBF compared to WT mice. Similarly, Lin et al.68 showed that E4 mice have reduced CBF compared to WT mice using MRI. Furthermore, they showed CBF improvements in E4 mice following treatment with rapamycin, a pleiotropic compound with various metabolic effects, and provided evidence that the blood–brain barrier (BBB) is involved in mediating the effects of E4 on CBF.68 BBB dysfunction can lead to microvascular impairments, and thus represents a plausible neurovascular pathway leading to neurodegeneration and AD.78 Interestingly, APOE genotype has recently been associated with BBB function in multiple studies, with E4 leading to increased BBB permeability, reductions in cerebral vascularization, thinner vessel walls and reduced CBF.65,66 Importantly, vascular defects have been observed as early as two weeks of age in E4 mice,65 well preceding the neuronal and synaptic dysfunction that is observed in these mice at later ages. These early-life BBB defects highlight an important variable between studies, namely the age at which the measurements were conducted. Age is an important contributor to cerebral metabolic and vascular function, and APOE may modify these age-related changes.27,34,71 For instance, changes in the relationship between cognitive function and CBF during normal aging are modified by APOE genotype.27 While our own study demonstrated E4-associated cerebrovascular deficits at 15 months of age, Bell et al.65showed reduced CBF in E4 mice at 9 months of age, Wiesmann et al.70 at 18-months of age, and Lin et al.68 at 1, 2, 4 and 7 months of age. While the various imaging modalities employed makes comparisons difficult, taken together, these studies show that E4-associated reductions in CBF are present across the lifespan in mice. Finally, reductions in microvascular length and decreased brain capillary density have been reported in several animal models of AD,79–81 again stressing the overlap of AD and cerebrovascular disease risk factors such as E4 and IR.
While possession of E4 is a clear genetic risk factor for AD, environmental influences also contribute to disease risk and progression. In particular, ‘Western style diets’, high in saturated fats and high GI foods, show a consistent association with increased AD pathology.82–86 Rodent studies also support the idea that high saturated fat diets and high GI diets lead to cognitive dysfunction, insulin dysregulation, increase inflammation, and exacerbate levels and accumulation of the hallmark neurotoxic AD protein amyloid-β (Aβ).53,87–89 Additionally, APOE genotype appears to modify the effects of diet on AD risk, as well as the response to various diet interventions.90 For instance, epidemiological studies generally suggest that diets high in saturated fat and simple sugars increase the risk of AD, but less so in individuals with E4,91–94 while intervention trials involving ketogenic diets and omega-3 fatty acid supplementation show muted benefits in E4+ participants.48,83,95 This gene-diet interaction is seen in mice as well, with diet-induced obesity differentially affecting E4 and E3 mice in terms of tau phosphorylation,96 as well as glial activation and amyloid deposition.97 Additionally, a recent study by our group showed that compared to mice with E3, mice expressing E4 are particularly sensitive to HFD-associated cognitive impairments.53 In addition to an exacerbation of cognitive impairment in E4 mice fed a HFD, we also highlighted multiple changes in metabolic pathways either directly or indirectly tied to glucose metabolism.53 Finally, diet-induced IR may induce a bioenergetic shift away from glucose as the primary cerebral fuel source to alternative sources of energy such as fatty acids 98,99 – a bioenergetic shift that we and others recently suggested may be an inherent feature of E4.58,60
Despite the epidemiological evidence suggesting that APOE genotype modifies the effects of diet on AD risk, long-term diet interventions are challenging to conduct and interpret. Therefore, studies designed to examine acute cerebral responses to specific diets and/or supplements may provide a clearer path to identifying the mechanisms which underlie APOE-diet interactions. Acute, single meal interventions are able to produce measurable cognitive effects,48 and while the results are oftentimes equivocal, the effects of acute hyperglycemia on mood and cognition have been relatively well studied. In elderly subjects, the majority of studies show improvements in episodic memory following a glucose load, while other cognitive domains such as working memory, semantic memory and visual memory, showing less frequent evidence.100 The effects of acute hyperglycemia in people with IR or diabetes are likewise ambiguous, with both detrimental and beneficial effects on mood and cognition being reported.101
Hanson et al.43 recently took an acute dietary approach in a clinical research study in which subjects with varying APOE genotype were administered acute dietary challenges, and their metabolic and cognitive responses measured. Interestingly, cognitively normal subjects carrying E4 showed higher memory scores following a meal with a high GI and high in saturated fat (HIGH meal), while subjects who did not have E4 had lower memory scores as compared to genotype-matched controls.43 Additionally, cognitively impaired individuals with E4 had enhanced executive function following the HIGH meal, while cognitively normal E4-subjects showed reduced executive function.43 Similarly, we report here that mice expressing E4, but not those with E3, showed improvements in cognitive performance, as well as increases in CBV, following acute administration of a high GI load (glucose, GI = 100). Taken together, our studies suggest that a spike in blood glucose from a high GI meal is acutely beneficial for cognitive performance in E4+, but not E4-, individuals, and that the observed improvements may be mediated by increased cerebral blood flow. Increased efforts are warranted to assess the effect of IR in E4 carriers, particularly mechanistic studies to clarify the relationship between APOE genotype, cerebral glucose metabolism, CBF, and their interactive effects on cognitive function.
Supplementary Material
Acknowledgements
The authors would like to thank Mahaba Eiwaz, Massarra Eiwaz, Tessa Marzulla, Amelia Mulford, Damian Zuloaga and Kristin Zuloaga for their invaluable assistance.
Funding
The author(s) disclosed receipt of the following financial support for the research, authorship, and/or publication of this article: LAJ was supported by NIH grant T32-HL094294, NSF grant SMA-1408653, the Oregon Tax Check-off Program for Alzheimer’s Research administered by the Layton Aging & Alzheimer’s Disease Center at OHSU, the Collins Medical Trust in Portland, OR, and an Institutional Development Award (IDeA) from the National Institute of General Medical Sciences of the National Institutes of Health under grant number P20GM103527. NJA was supported by NIH R21AG043857. JR is supported by 1R56AG057495-01. Its contents are solely the responsibility of the authors and do not necessarily represent the official views of the funding agencies.
Declaration of conflicting interests
The author(s) declared no potential conflicts of interest with respect to the research, authorship, and/or publication of this article.
Authors’ contributions
LAJ and JR designed the experiments and wrote the manuscript. ET, SWB, EP and TA assisted with cognitive testing, tissue collection and analyses. NJA provided the equipment, technical expertise and training for the cerebral blood volume measurements. All authors read and approved the final version of the manuscript.
Supplementary material
Supplementary material for this paper can be found at the journal website: http://journals.sagepub.com/home/jcb
References
- 1.He W and Goo D. An aging world: 2015 International Population Reports. US Census Bureau Report. Issued March 2016, P95/16-1.
- 2.NCD Risk Factor Collaboration (NCD-RisC). Worldwide trends in diabetes since 1980: a pooled analysis of 751 population-based studies with 4*4 million participants. Lancet 2016; 387: 1513–1530. [DOI] [PMC free article] [PubMed] [Google Scholar]
- 3.Imperatore G, et al. SEARCH for Diabetes in Youth Study Group. Projections of type 1 and type 2 diabetes burden in the U.S. population aged 20 years through 2050: dynamic modeling of incidence, mortality, and population growth. Diab Care 2012; 35: 2515–2520. [DOI] [PMC free article] [PubMed] [Google Scholar]
- 4.DeFronzo RA, Ferrannini E, Groop L, et al. Type 2 diabetes mellitus. Nat Rev Dis Primers 2015; 1: 15019. [DOI] [PubMed] [Google Scholar]
- 5.Van Dam RM, Rimm EB, Willett WC, et al. Dietary patterns and risk for type 2 diabetes mellitus in U.S. men. Ann Intern Med 2002; 136: 201–209. [DOI] [PubMed] [Google Scholar]
- 6.Luchsinger JA, Tang MX, Stern Y, et al. Diabetes mellitus and risk of Alzheimer's disease and dementia with stroke in a multiethnic cohort. Am J Epidemiol 2001; 154: 635–641. [DOI] [PubMed] [Google Scholar]
- 7.Peila R, Rodriguez BL, Launer LJ. Honolulu-Asia aging study. T2D, APOE gene, and the risk for dementia and related pathologies: the Honolulu-Asia Aging Study. Diabetes 2002; 51: 1256–1262. [DOI] [PubMed] [Google Scholar]
- 8.Irie F, Fitzpatrick AL, Lopez OL, et al. Enhanced risk for Alzheimer disease in persons with type 2 diabetes and APOE epsilon4: the Cardiovascular Health Study Cognition Study. Arch Neurol 2008; 65: 89–93. [DOI] [PMC free article] [PubMed] [Google Scholar]
- 9.Ahtiluoto S, Polvikoski T, Peltonen M, et al. Diabetes, Alzheimer disease, and vascular dementia: a population-based neuropathologic study. Neurology 2010; 75: 1195–1202. [DOI] [PubMed] [Google Scholar]
- 10.Craft S. The role of metabolic disorders in Alzheimer's disease and vascular dementia: two roads converged? Arch Neurol 2009; 66: 300–305. [DOI] [PMC free article] [PubMed] [Google Scholar]
- 11.de la Monte SM, Wands JR. Alzheimer's disease is type 3 diabetes-evidence reviewed. J Diabetes Sci Technol 2008; 2: 1101–1113. [DOI] [PMC free article] [PubMed] [Google Scholar]
- 12.Mahley RW. Apolipoprotein E: from cardiovascular disease to neurodegenerative disorders. J Mol Med 2016; 94: 739–746. [DOI] [PMC free article] [PubMed] [Google Scholar]
- 13.Wilson PWF, Schaefer EJ, Larson MG, et al. Apolipoprotein E alleles and risk of coronary disease: a meta-analysis. Arterioscler Thromb Vasc Biol 1996; 16: 1250–1255. [DOI] [PubMed] [Google Scholar]
- 14.Bennet AM, Di Angelantonio E, Ye Z, et al. Association of apolipoprotein E genotypes with lipid levels and coronary risk. JAMA 2007; 298: 1300–1311. [DOI] [PubMed] [Google Scholar]
- 15.Raber J, Huang Y, Ashford JW. ApoE genotype accounts for the vast majority of AD risk and AD pathology. Neurobiol Aging 2004; 25: 641–650. Review. [DOI] [PubMed] [Google Scholar]
- 16.Strittmatter WJ, Saunders AM, Schmechel D, et al. Apolipoprotein E: high-avidity binding to beta-amyloid and increased frequency of type 4 allele in late-onset familial Alzheimer disease. Proc Natl Acad Sci U S A 1993; 90: 1977–1981. [DOI] [PMC free article] [PubMed] [Google Scholar]
- 17.Corder EH, Saunders AM, Strittmatter WJ, et al. Gene dose of apolipoprotein E type 4 allele and the risk of Alzheimer's disease in late onset families. Science 1993; 261: 921–923. [DOI] [PubMed] [Google Scholar]
- 18.Harold D, et al. Genome-wide association study identifies variants at CLU and PICALM associated with Alzheimer's disease. Nat Genet 2009; 41: 1088–1093. [DOI] [PMC free article] [PubMed] [Google Scholar]
- 19.Bertram L, Tanzi R. Genome-wide association studies in Alzheimer's disease. Hum Mol Genet 2009; 18: R137–R145. [DOI] [PMC free article] [PubMed] [Google Scholar]
- 20.Zlokovic BV. Neurovascular pathways to neurodegeneration in Alzheimer’s disease and other disorders. Nat Rev Neurosci 2011; 12: 723–738. [DOI] [PMC free article] [PubMed] [Google Scholar]
- 21.Jansen JF, van Bussel FC, van de Haar HJ, et al. Cerebral blood flow, blood supply, and cognition in Type 2 Diabetes Mellitus. Sci Rep 2016; 6: 10. [DOI] [PMC free article] [PubMed] [Google Scholar]
- 22.Novak V, Milberg W, Hao Y, et al. Enhancement of vasoreactivity and cognition by intranasal insulin in type 2 diabetes. Diab Care 2014; 37: 751–759. [DOI] [PMC free article] [PubMed] [Google Scholar]
- 23.Belcik JT, Davidson BP, Foster T, et al. Contrast-enhanced ultrasound assessment of impaired adipose tissue and muscle perfusion in insulin-resistant mice. Circ Cardiovasc Imaging 2015; 4: pii: e002684. [DOI] [PMC free article] [PubMed] [Google Scholar]
- 24.de la Monte SM. Brain insulin resistance and deficiency as therapeutic targets in Alzheimer's disease. Curr Alzheimer Res 2012; 9: 35–66. [DOI] [PMC free article] [PubMed] [Google Scholar]
- 25.Filippini N, Ebmeier KP, MacIntosh BJ, et al. Differential effects of the APOE genotype on brain function across the lifespan. Neuroimage 2011; 54: 602–610. [DOI] [PubMed] [Google Scholar]
- 26.Thambisetty M, Beason-Held L, An Y, et al. APOE epsilon4 genotype and longitudinal changes in cerebral blood flow in normal aging. Arch Neurol 2010; 67: 93–98. [DOI] [PMC free article] [PubMed] [Google Scholar]
- 27.Wierenga CE, Clark LR, Dev SI, et al. Interaction of age and APOE genotype on cerebral blood flow at rest. J Alzheimer's Dis 2013; 34: 921–935. [DOI] [PMC free article] [PubMed] [Google Scholar]
- 28.Scarmeas N, Stern Y. Imaging studies and APOE genotype in persons at risk for Alzheimer's disease. Curr Psychiatr Rep 2006; 8: 11–17. [DOI] [PMC free article] [PubMed] [Google Scholar]
- 29.DiBattista AM, Heinsinger NM, William Rebeck G. Alzheimer's disease genetic risk factor APOE-ɛ4 also affects normal brain function. Curr Alzheimer Res 2016; 13: 1200–1207. [DOI] [PMC free article] [PubMed] [Google Scholar]
- 30.Scarmeas N, Habeck C, Hilton J, et al. APOE related alterations in cerebral activation even at college age. J Neurol Neurosurg Psychiatry 2005; 76: 1440–1444. [DOI] [PMC free article] [PubMed] [Google Scholar]
- 31.Koehler RC, Roman RJ, Harder DR. Astrocytes and the regulation of cerebral blood flow. Trends Neurosci 2009; 32: 160–169. [DOI] [PubMed] [Google Scholar]
- 32.Kato T, Inui Y, Nakamura A, et al. Brain fluorodeoxyglucose (FDG) PET in dementia. Ageing Res Rev 2016; 30: 73–84. [DOI] [PubMed] [Google Scholar]
- 33.Mosconi L, De Santi S, Rusinek H, et al. Magnetic resonance and PET studies in the early diagnosis of Alzheimer's disease. Expert Rev Neurother 2004; 4: 831–849. [DOI] [PubMed] [Google Scholar]
- 34.Goyal MS, Vlassenko AG, Blazey TM, et al. Loss of brain aerobic glycolysis in normal human aging. Cell Metab 2017; 26: 353–360.e3. [DOI] [PMC free article] [PubMed] [Google Scholar]
- 35.Reiman EM, Caselli RJ, Yun LS, et al. Preclinical evidence of Alzheimer's disease in persons homozygous for the epsilon 4 allele for apolipoprotein E. N Engl J Med 1996; 334: 752–758. [DOI] [PubMed] [Google Scholar]
- 36.Altmann A, Ng B, Landau SM, et al. Regional brain hypometabolism is unrelated to regional amyloid plaque burden. Brain 2015; 138(Pt 12): 3734–3746. [DOI] [PMC free article] [PubMed] [Google Scholar]
- 37.Reiman EM, Caselli RJ, Chen K, et al. Declining brain activity in cognitively normal apolipoprotein E epsilon 4 heterozygotes: a foundation for using positron emission tomography to efficiently test treatments to prevent Alzheimer's disease. Proc Natl Acad Sci U S A 2001; 98: 3334–3339. [DOI] [PMC free article] [PubMed] [Google Scholar]
- 38.Small GW, Ercoli LM, Silverman DH, et al. Cerebral metabolic and cognitive decline in persons at genetic risk for Alzheimer's disease. Proc Natl Acad Sci U S A 2000; 97: 6037–6042. [DOI] [PMC free article] [PubMed] [Google Scholar]
- 39.Reiman EM, Chen K, Alexander GE, et al. Functional brain abnormalities in young adults at genetic risk for late-onset Alzheimer's dementia. Proc Natl Acad Sci U S A 2004; 101: 284–289. [DOI] [PMC free article] [PubMed] [Google Scholar]
- 40.Pendse AA, Arbones-Mainar JM, Johnson LA, et al. Apolipoprotein E knock-out and knock-in mice: atherosclerosis, metabolic syndrome, and beyond. J Lipid Res 2009; April(50 Suppl): S178–S182. [DOI] [PMC free article] [PubMed] [Google Scholar]
- 41.Hanson AJ, Bayer-Carter JL, Green PS, et al. Effect of apolipoprotein E genotype and diet on apolipoprotein E lipidation and amyloid peptides: randomized clinical trial. JAMA Neurol 2013; 70: 972–980. [DOI] [PMC free article] [PubMed] [Google Scholar]
- 42.Hanson AJ, Banks WA, Hernandez Saucedo H, et al. Apolipoprotein E genotype and sex influence glucose tolerance in older adults: a cross-sectional study. Dement Geriatr Cogn Dis Extra 2016; 6: 78–89. [DOI] [PMC free article] [PubMed] [Google Scholar]
- 43.Hanson AJ, Bayer JL, Baker LD, et al. Differential effects of meal challenges on cognition, metabolism, and biomarkers for apolipoprotein E ɛ4 carriers and adults with mild cognitive impairment. J Alzheimers Dis 2015; 48: 205–218. [DOI] [PubMed] [Google Scholar]
- 44.Sullivan PM, Mezdour H, Aratani Y, et al. Targeted replacement of the mouse apolipoprotein E gene with the common human APOE3 allele enhances diet-induced hypercholesterolemia and atherosclerosis. J Biol Chem 1997; 272: 17972–17980. [DOI] [PubMed] [Google Scholar]
- 45.Knouff C, Hinsdale ME, Mezdour H, et al. ApoE structure determines VLDL clearance and atherosclerosis risk in mice. J Clin Invest 1999; 103: 1579–1586. [DOI] [PMC free article] [PubMed] [Google Scholar]
- 46.Johnson LA, Zuloaga KL, Kugelman TL, et al. Amelioration of metabolic syndrome-associated cognitive impairments in mice via a reduction in dietary fat content or infusion of non-diabetic plasma. eBiomedicine 2016; 15: 26–42. [DOI] [PMC free article] [PubMed] [Google Scholar]
- 47.Jia Y, Grafe MR, Gruber A, et al. In vivo optical imaging of revascularization after brain trauma in mice. Microvasc Res 2011; 81: 73–80. [DOI] [PMC free article] [PubMed] [Google Scholar]
- 48.Papanikolaou Y, Palmer H, Binns MA, et al. Better cognitive performance following a low-glycaemic-index compared with a high-glycaemic-index carbohydrate meal in adults with type 2 diabetes. Diabetologia 2006; 49: 855–862. [DOI] [PubMed] [Google Scholar]
- 49.Walker JM, Harrison FE. Shared neuropathological characteristics of obesity, type 2 diabetes and Alzheimer's disease: impacts on cognitive decline. Nutrients 2015; 7: 7332–7357. [DOI] [PMC free article] [PubMed] [Google Scholar]
- 50.Chung CC, Pimentel D, Jor'dan AJ, et al. Inflammation-associated declines in cerebral vasoreactivity and cognition in type 2 diabetes. Neurology 2015; 85: 450–458. [DOI] [PMC free article] [PubMed] [Google Scholar]
- 51.Pallas F, Larson DF. Cerebral blood flow in the diabetic patient. Perfusion 1996; 11: 363–370. [DOI] [PubMed] [Google Scholar]
- 52.Dore GA, Elias MF, Robbins MA, et al. Presence of the APOE epsilon4 allele modifies the relationship between T2D and cognitive performance: the Maine-Syracuse Study. Diabetologia 2009; 52: 2551–2560. [DOI] [PubMed] [Google Scholar]
- 53.Johnson LA, Torres ER, Impey S, et al. Apolipoprotein E4 and insulin resistance interact to impair cognition and alter the epigenome and metabolome. Sci Rep 2017; 7: 43701. [DOI] [PMC free article] [PubMed] [Google Scholar]
- 54.Salameh TS, Rhea EM, Banks WA, et al. Insulin resistance, dyslipidemia, and apolipoprotein E interactions as mechanisms in cognitive impairment and Alzheimer's disease. Exp Biol Med 2016; 241: 1676–1683. [DOI] [PMC free article] [PubMed] [Google Scholar]
- 55.Honjo K, Black SE, Verhoeff NP. Alzheimer’s disease, cerebrovascular disease, and the β-amyloid cascade. Can J Neurol Sci 2012; 39: 712–728. [DOI] [PubMed] [Google Scholar]
- 56.Snyder HM, Corriveau RA, Craft S, et al. Vascular contributions to cognitive impairment and dementia including Alzheimer's disease. Alzheimers Dement 2015; 11: 710–717. [DOI] [PMC free article] [PubMed] [Google Scholar]
- 57.Arbones-Mainar JM, Johnson LA, Altenburg MK, et al. Differential modulation of diet-induced obesity and adipocyte functionality by human apolipoprotein E3 and E4 in mice. Int J Obes 2008; 32: 1595–1605. [DOI] [PMC free article] [PubMed] [Google Scholar]
- 58.Arbones-Mainar JM, Johnson LA, Torres-Perez E, et al. Metabolic shifts toward fatty-acid usage and increased thermogenesis are associated with impaired adipogenesis in mice expressing human APOE4. Int J Obes 2016; 40: 1574–1581. [DOI] [PMC free article] [PubMed] [Google Scholar]
- 59.Elosua R, Demissie S, Cupples LA, et al. Obesity modulates the association among APOE genotype, insulin, and glucose in men. Obesity Res 2003; 11: 1502–1508. [DOI] [PubMed] [Google Scholar]
- 60.Huebbe P, Dose J, Schloesser A, Campbell G, et al. Apolipoprotein E (APOE) genotype regulates body weight and fatty acid utilization-Studies in gene-targeted replacement mice. Mol Nutr Food Res 2015; 59: 334–343. [DOI] [PubMed] [Google Scholar]
- 61.Tejedor MT, Garcia-Sobreviela MP, Ledesma MA, et al. The apolipoprotein E polymorphism rs7412 associates with body fatness independently of plasma lipids in middle aged men. PLoS One 2014; 9: e108605. [DOI] [PMC free article] [PubMed] [Google Scholar]
- 62.Minihane AM, Jofre-Monseny L, Olano-Martin E, et al. ApoE genotype, cardiovascular risk and responsiveness to dietary fat manipulation. Proc Nutr Soc 2007; 66: 183–197. [DOI] [PubMed] [Google Scholar]
- 63.Johnson LA, Kim HS, Knudson MJ, et al. Diabetic atherosclerosis in APOE*4 mice: synergy between lipoprotein metabolism and vascular inflammation. J Lipid Res 2013; 54: 386–396. [DOI] [PMC free article] [PubMed] [Google Scholar]
- 64.Johnson LA, Arbones-Mainar JM, Fox RG, et al. Apolipoprotein E4 exaggerates diabetic dyslipidemia and atherosclerosis in mice lacking the LDL receptor. Diabetes 2011; 60: 2285–2294. [DOI] [PMC free article] [PubMed] [Google Scholar]
- 65.Bell RD, Winkler EA, Singh I, et al. Apolipoprotein E controls cerebrovascular integrity via cyclophilin A. Nature 2012; 485: 512–516. [DOI] [PMC free article] [PubMed] [Google Scholar]
- 66.Alata W, Ye Y, St-Amour I, et al. Human apolipoprotein E ɛ4 expression impairs cerebral vascularization and blood-brain barrier function in mice. J Cereb Blood Flow Metab 2015; 35: 86–94. [DOI] [PMC free article] [PubMed] [Google Scholar]
- 67.Nishitsuji K, Hosono T, Nakamura T, et al. Apolipoprotein E regulates the integrity of tight junctions in an isoform-dependent manner in an in vitro blood-brain barrier model. J Biol Chem 2011; 286: 17536–17542. [DOI] [PMC free article] [PubMed] [Google Scholar]
- 68.Lin AL, Jahrling JB, Zhang W, et al. Rapamycin rescues vascular, metabolic and learning deficits in apolipoprotein E4 transgenic mice with pre-symptomatic Alzheimer's disease. J Cereb Blood Flow Metab 2017; 37: 217–226. [DOI] [PMC free article] [PubMed] [Google Scholar]
- 69.Schilling S, DeStefano AL, Sachdev PS, et al. APOE genotype and MRI markers of cerebrovascular disease: systematic review and meta-analysis. Neurology 2013; 81: 292–300. [DOI] [PMC free article] [PubMed] [Google Scholar]
- 70.Wiesmann M, Zerbi V, Jansen D, et al. A dietary treatment improves cerebral blood flow and brain connectivity in aging apoE4 mice. Neural Plast 2016; 2016: 6846721. [DOI] [PMC free article] [PubMed] [Google Scholar]
- 71.Celsis P, Agniel A, Cardebat D, et al. Age related cognitive decline: a clinical entity? A longitudinal study of cerebral blood flow and memory performance. J Neurol Neurosurg Psychiatry 1997; 62: 601–608. [DOI] [PMC free article] [PubMed] [Google Scholar]
- 72.Roher AE, Debbins JP, Malek-Ahmadi M, et al. Cerebral blood flow in Alzheimer's disease. Vasc Health Risk Manag 2012; 8: 599–611. [DOI] [PMC free article] [PubMed] [Google Scholar]
- 73.Zlatar ZZ, Wierenga CE, Bangen KJ, et al. Increased hippocampal blood flow in sedentary older adults at genetic risk for Alzheimer's disease. J Alzheimers Dis 2014; 41: 809–817. [DOI] [PMC free article] [PubMed] [Google Scholar]
- 74.Ruitenberg A1, den Heijer T, Bakker SL, et al. Cerebral hypoperfusion and clinical onset of dementia: the Rotterdam Study. Ann Neurol 2005; 57: 789–794. [DOI] [PubMed] [Google Scholar]
- 75.Tai LM, Thomas R, Marottoli FM, et al. The role of APOE in cerebrovascular dysfunction. Acta Neuropathol 2016; 131: 709–723. [DOI] [PMC free article] [PubMed] [Google Scholar]
- 76.Sweeney MD, Ayyadurai S, Zlokovic BV. Pericytes of the neurovascular unit: key functions and signaling pathways. Nat Neurosci 2016; 19: 771–783. [DOI] [PMC free article] [PubMed] [Google Scholar]
- 77.Hall CN, Reynell C, Gesslein B, et al. Capillary pericytes regulate cerebral blood flow in health and disease. Nature 2014; 508: 55–60. [DOI] [PMC free article] [PubMed] [Google Scholar]
- 78.Zlokovic BV. Cerebrovascular effects of apolipoprotein E: implications for Alzheimer disease. JAMA Neurol 2013; 70: 440–444. [DOI] [PMC free article] [PubMed] [Google Scholar]
- 79.Kim J, Basak JM, Holtzman DM. The role of apolipoprotein E in Alzheimer's disease. Neuron 2009; 63: 287–303. [DOI] [PMC free article] [PubMed] [Google Scholar]
- 80.Lee GD, Aruna JH, Barrett PM, et al. Stereological analysis of microvascular parameters in a double transgenic model of Alzheimer's disease. Brain Res Bull 2005; 65: 317–322. [DOI] [PubMed] [Google Scholar]
- 81.Paris D, Patel N, DelleDonne A, et al. Impaired angiogenesis in a transgenic mouse model of cerebral amyloidosis. Neurosci Lett 2004; 366: 80–85. [DOI] [PubMed] [Google Scholar]
- 82.Liu CC, Kanekiyo T, Xu H, et al. Apolipoprotein E and Alzheimer disease: risk, mechanisms and therapy. Nat Rev Neurol 2013; 9: 106–118. [DOI] [PMC free article] [PubMed] [Google Scholar]
- 83.Barberger-Gateau P, Raffaitin C, Letenneur L, et al. Dietary patterns and risk of dementia: the Three-City cohort study. Neurology 2007; 69: 19211930. [DOI] [PubMed] [Google Scholar]
- 84.Gustaw-Rothenberg K. Dietary patterns associated with Alzheimer’s disease: population based study. Int J Environ Res Public Health 2009; 6: 1335–1340. [DOI] [PMC free article] [PubMed] [Google Scholar]
- 85.Laitinen MH, Ngandu T, Rovio S, et al. Fat intake at midlife and risk of dementia and Alzheimer’s disease: a population-based study. Dement Geriatr Cogn Disord 2006; 22: 99–107. [DOI] [PubMed] [Google Scholar]
- 86.Ramesh BN, Rao TS, Prakasam A, et al. Neuronutrition and Alzheimer’s disease. J Alzheimers Dis 2010; 19: 1123–1139. [DOI] [PMC free article] [PubMed] [Google Scholar]
- 87.Stranahan AM, Norman ED, Lee K, et al. Diet-induced insulin resistance impairs hippocampal synaptic plasticity and cognition in middle-aged rats. Hippocampus 2008; 18: 1085–1088. [DOI] [PMC free article] [PubMed] [Google Scholar]
- 88.Walker JM, Dixit S, Saulsberry AC, et al. Reversal of high fat diet-induced obesity improves glucose tolerance, inflammatory response, β-amyloid accumulation and cognitive decline in the APP/PSEN1 mouse model of Alzheimer's disease. Neurobiol Dis 2017; 100: 87–98. [DOI] [PMC free article] [PubMed] [Google Scholar]
- 89.Winocur G, Greenwood CE, Piroli GG, et al. Memory impairment in obese Zucker rats: an investigation of cognitive function in an animal model of insulin resistance and obesity. Behav Neurosci 2005; 119: 1389–1395. [DOI] [PubMed] [Google Scholar]
- 90.Hanson AJ, Craft S, Banks WA. The APOE genotype: modification of therapeutic responses in Alzheimer's disease. Curr Pharm Des 2015; 21: 114–120. [DOI] [PubMed] [Google Scholar]
- 91.Rubin J, Berglund L. Apolipoprotein E and diets: a case of gene-nutrient interaction? Curr Opin Lipidol 2002; 13: 2532. [DOI] [PubMed] [Google Scholar]
- 92.Barberger-Gateau P, Samieri C, Feart C, et al. Dietary omega 3 polyunsaturated fatty acids and Alzheimer’s disease: interaction with apolipoprotein E genotype. Curr Alzheimer Res 2011; 8: 479491. [DOI] [PMC free article] [PubMed] [Google Scholar]
- 93.Huang TL, Zandi PP, Tucker KL, et al. Benefits of fatty fish on dementia risk are stronger for those without APOE epsilon4. Neurology 2005; 65: 14091414. [DOI] [PubMed] [Google Scholar]
- 94.Kivipelto M, Rovio S, Ngandu T, et al. Apolipoprotein E epsilon4 magnifies lifestyle risks for dementia: a population-based study. J Cell Mol Med 2008; 12: 27622771. [DOI] [PMC free article] [PubMed] [Google Scholar]
- 95.Benton D, Ruffin MP, Lassel T, et al. The delivery rate of dietary carbohydrates affects cognitive performance in both rats and humans. Psychopharmacology 2003; 166: 8690. [DOI] [PubMed] [Google Scholar]
- 96.To AW, Ribe EM, Chuang TT, et al. The ɛ3 and ɛ4 alleles of human APOE differentially affect tau phosphorylation in hyperinsulinemic and pioglitazone treated mice. PLoS One 2011; 6: e16991. [DOI] [PMC free article] [PubMed] [Google Scholar]
- 97.Moser VA, Pike CJ. Obesity accelerates Alzheimer-related pathology in APOE4 but not APOE3 mice. eNeuro 2017; 4 pii: ENEURO.0077-17.2017. [DOI] [PMC free article] [PubMed] [Google Scholar]
- 98.Ding F, Yao J, Rettberg JR, et al. Early decline in glucose transport and metabolism precedes shift to ketogenic system in female aging and Alzheimer’s mouse brain: implication for bioenergetic intervention. PLoS One 2013; 8: e79977. [DOI] [PMC free article] [PubMed] [Google Scholar]
- 99.Karmi A, Iozzo P, Viljanen A, et al. Increased brain fatty acid uptake in metabolic syndrome. Diabetes 2010; 59: 2171–2177. [DOI] [PMC free article] [PubMed] [Google Scholar]
- 100.Van der Zwaluw NL, van de Rest O, Kessels RP, et al. Effects of glucose load on cognitive functions in elderly people. Nutr Rev 2015; 73: 92–105. [DOI] [PubMed] [Google Scholar]
- 101.Pais I, Hallschmid M, Jauch-Chara K, et al. Mood and cognitive functions during acute euglycaemia and mild hyperglycaemia in type 2 diabetic patients. Exp Clin Endocrinol Diab 2007; 115: 42–46. [DOI] [PubMed] [Google Scholar]
Associated Data
This section collects any data citations, data availability statements, or supplementary materials included in this article.