

Abstract
Objectives
The primary aim of the present study was to investigate if changes in physical fitness, body composition and weight are associated with exercise attendance and dropout among fitness club members. Secondary, we wanted to identify motives for fitness club membership and exercise.
Setting
New members at 25 fitness clubs in Oslo, Norway.
Participants
In total, 125 new fitness club members were recruited. Eligible criteria were <4 weeks of membership, untrained (exercising <60 min once a week) and ≥18 years. At inclusion, and after 3 (n=87) and 12 months (n=64), participants answered a questionnaire (including motives for membership and exercise, and attendance) and performed measurements of maximum oxygen uptake (VO2max), one repetition maximum (bench press and leg press), body composition and weight. In total, 56 participants underwent measurements at all time points. Based on self-reported attendance, participants were divided into three groups: regular attendance (≥2 sessions per week), low attendance (<2 sessions per week) and exercise dropout (no sessions the last month).
Results
At 3 months, regular attendees had significantly higher VO2max than dropout (6.54 mL/min/kg, 95% CI 2.00 to 11.07, p=0.003). At 12 months, a difference in VO2max of 5.32 mL/min/kg (95% CI −0.08 to 10.72, p=0.054) was found between regular attendees and dropout, and between regular and low exercise attendance (6.17 mL/min/kg, 95% CI 0.19 to 12.15, p=0.042). VO2max was the only factor showing an association with attendance. No differences or associations were observed in maximal muscle strength or body composition between the three groups. Primary motive for fitness club membership and exercise was increase in physical fitness (92.8%).
Conclusions
VO2max was the only factor associated with exercise attendance at two time points. Increased physical fitness was primary motive for fitness club membership and exercise.
Keywords: exercise attendance, exercise drop-out, fitness club membership, exercise motivation
Strengths and limitations of this study.
The use of a longitudinal prospective study design for long-term follow-up.
Valid and reliable measurement methods.
The use of an electronic questionnaire based on previously validated surveys.
The high dropout from the study.
Self-reported attendance at the fitness club.
Introduction
The scientific evidence linking regular physical activity to health benefits is well established.1 2 In fitness clubs, members predominantly exercise for health benefits.3 However, 40%–65% of individuals initiating exercise are predicted to drop out the first 3–6 months.4 5 This rate is similar independently of supervised or non-supervised exercise, across age and gender.6 Based on these numbers, it is of importance to investigate if changes in physiological factors are associated with exercise attendance, as well as exercise dropout.
Several studies have demonstrated physiological and appearance-related motives in initiation of physical activity.7–9 To increase the probability of physical activity maintenance, achievement of a goal may be desired, that might produce a conscious experience of pleasure.10 11 Sperandei et al 7 showed that a goal achievement in relation to exercise may be physiological factors such as weight loss, increase in muscle mass or aerobic capacity.7 It is shown that goal reaching (eg, increase in physical fitness or weight loss) may motivate people to sustained participation in exercise, and that individuals are prone to dropout if their goals and expectations are not met within a reasonable time.7 10 12 13 Hence, we may assume that positive changes in physical fitness, including maximal oxygen uptake (VO2max) and maximal muscle strength, body composition and weight, will contribute to the probability of exercise maintenance.
To our knowledge, this is the first prospective longitudinal study examining long-term changes in physical fitness, body composition and weight in fitness club members. In addition, the literature is scant regarding motivational factors for fitness club participation. Therefore, the primary aim of the present study was to investigate if physical fitness (VO2max and maximal muscle strength), body composition and weight are associated with exercise attendance and dropout after 3 and 12 months of fitness club membership. Secondary, we wanted to identify motivational factors for fitness club participation.
Materials and methods
Design
The present study was part of a longitudinal prospective study, following up a group of new members at 25 fitness clubs in Oslo, Norway, to gather repeated measures of physical activity level and health status, including a wide range of psychosocial and physiological parameters, financed by and conducted at the Norwegian School of Sports Sciences in Oslo, during the period October 2015 to November 2018. In accordance with the Declaration of Helsinki, all participants received written information about the project’s purpose and procedures, and gave consent to participate. No economic compensation was given.
Participants
Participants were recruited by an email invitation from the local fitness club. Eligibility criteria were <4 weeks membership, untrained (exercising <60 min once a week at moderate or vigorous intensity), ≥18 years, healthy (no chronic serious disease or pathology, ie, heart disease or severe hypertension) and not pregnant. In Europe, September and January are two important months for recruiting new fitness club members. Hence, the participants for the present study were mainly enrolled during those two key periods (group 1: October/November 2015: n=75, group 2: January/February 2016: n=50).
To date, it is scientific evidence that higher levels of VO2max are associated with a lower risk of mortality from cardiovascular disease, independent of age, smoking and body composition.14 Hence, power calculation of sample size was conservatively based on the results of VO2max in other studies,15 16 as well as clinically relevant changes in physiological variables during an exercise period of 12 months. For example, in healthy adults starting a regular exercise regimen, it is estimated an increase in VO2max of 3%–10% the first 10–12 weeks, depending on exercise volume, intensity and method.17 Therefore, with a power of 85% at a 0.05 level, a total of 55 participants would be needed to detect a change of 4% in VO2max. However, studies have shown high losses to follow-up in a group of new beginning exercisers (25%–30%).18 19 In addition, among those who start to exercise regularly, about 50% dropout from their exercise programme within 6–12 months.5 20–22 For that reason, we aimed to include 125 participants, equally men and women.
In total, 275 men and women contacted the research group. Of these, 146 were excluded due to exercising regularly, and 4 due to cardiovascular disease and hypertension. Outline of the measurements throughout the study is shown in figure 1. At inclusion, 125 participants answered the questionnaire regarding motives for fitness club membership and exercise. In total, 87 participants (42 men and 45 women) and 64 participants (33 men and 31 women) answered the questionnaire and performed physiological measurements, at 3 and 12 months, respectively. For all 3 time points, 56 participants underwent all measurements. A flow diagram of the participants throughout the study is shown in figure 2.
Figure 1.
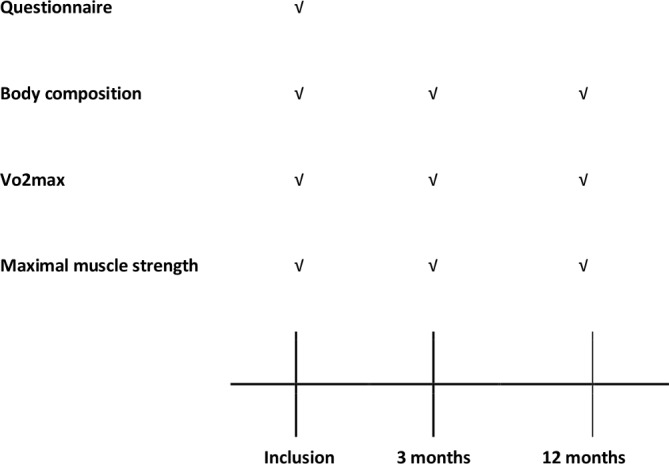
Outline of the measurements throughout the study.
Figure 2.

Flow diagram of the participants throughout the study.
Patient and public involvement
Participants and public were not involved in the development of research questions, study design or recruitment.
Measurements
To investigate if changes in physical fitness, body composition and weight were associated with exercise attendance and dropout among fitness club members, data were collected at inclusion and after 3 and 12 months, by answering a standardised electronic questionnaire, before physiological measurements. All measurements were performed by qualified personnel following standardised measurement procedures and lasted approximately 60 min for each participant.
Body composition
Body composition was measured with Inbody 720 (Biospace, USA). This method appears to adequately assess lean body mass compared with dual-energy X-ray absorptiometry, when adhering to strict pretest guidelines.23 The measurement was done in light clothing without shoes and after 2 hours fasting. Before each measurement, the device was set to subtract 0.5 kg for the participant’s clothes. Height was measured with a fixed stadiometer (Seca scale, Mod: 8777021094, S/N: 5877248124885) to the nearest 0.5 cm and body weight was measured with Inbody 720 to the nearest 0.1 kg, respectively.
Maximal oxygen uptake
Cardiorespiratory fitness was measured as VO2max with a cardiopulmonary exercise test (CPET).24 CPET was conducted on a treadmill using an incremental modified Balke protocol until exhaustion.25 26 VO2max was measured with indirect calorimetry (Oxycon Pro, Jaeger, Hoechberg, Germany) with the ‘breath-by-breath’ method. The participants breathed through a Hans Rudolph two-way breathing mask (2700 series; Hans Rudolph, Kansas City, Kansas, USA), connected to the gas analyser. Prior to each test day, all analysers were calibrated after the manufacturer’s guidelines and all exercise tests were supervised by the same research fellow. The Borg scale (range 6–20) was used for rating of perceived exertion.27 The exercise test was stopped when the participants reached maximal exhaustion (≥19 on the Borg scale), and an additional criterion was a respiratory exchange ratio (RER) between 1.10 and 1.30 according to age.26 The highest VO2max and the highest RER corresponding to the highest minute ventilation were reported.
Maximal muscle strength
Maximal muscle strength was measured as one repetition maximum (1RM), the most common method to assess maximal muscle strength in non-laboratory situations.28 29 In the current study, 1RM was measured in bench press (Smith machine) and leg press. Participants received verbal instructions and a practical demonstration of the exercises, before test procedures were initiated. The test protocol in both exercises started with three warm-up series with decreasing repetitions (ie, 7-5-3), while the load was gradually increased (on an individual basis) Thereafter, the load for each participant was increased by 2%–5% until failure. Resting periods between attempts were 1 to 2 min with a maximum of four attempts. The highest load with an appropriate technique was registered as 1RM.
Questionnaire
An electronic questionnaire was used to identify motives for fitness club membership and exercise, exercise attendance, dropout and membership dropout. A pilot testing was done among four volunteers and four research group members. At all time points (inclusion, 3 and 12 months), the questionnaire took approximately 30 min to complete.
At 3-month and 12-month follow-up, the participants reported on exercise attendance, dropout or membership dropout the last 4 weeks. The questions and response options were: (1) ‘Have you been a member at the fitness club during the last 4 weeks?’: ‘yes’ or ‘no’, (2) ‘Have you exercised at the fitness club the last 4 weeks?’: ‘yes’ or ‘no’, (3) ‘How many times have you exercised per week at the fitness club on average during the past 4 weeks?’: ‘one per week’, ‘two per week’, ‘three per week’, ‘four per week’, ‘five per week’, ‘six per week’ or ‘seven or more per week’. Exercise was defined as physical activity that was planned, repetitive and with the purpose to improve or maintain physical fitness, health or performance.30
Motives for fitness club membership and exercise were based on the validated questionnaire ‘Reasons for Exercise Inventory’ (Exercise Motivations Inventory—2 [EMI-2]).11 Due to a comprehensive questionnaire in the current research project, 36 out of 51 statements were chosen prior to inclusion. The chosen statements were taken into account as appropriate for physically inactive new fitness club members. Further, two statements were added to the questionnaire section: (1) ‘Increase in physical fitness’ and (2) ‘To prevent pain in my body’. The participants read each statement and indicated to what degree (0 [not true for me] to 5 [very true for me]) the statement was a motive for new fitness club membership and exercise. In the statistical analysis, a score of 5 was defined as an important motive for fitness club membership and exercise. Based on the structure of EMI-2, main motives (>40%) were divided into six subscales: strength and endurance, positive health, revitalisation, health avoidance, appearance and weight management.
Statistical analysis
Data were analysed using SPSS Statistical Software V.24.0 and STATA V.15.0 for Windows. Analyses were based on participants who completed the questionnaire and physiological measurements at inclusion (n=125), 3 months (n=87) and 12 months (n=64). Level of significance was set as p≤0.05. Physiological measurements and main motives for fitness club membership and exercise are presented as means with SD, or frequencies (n) and percentages. To compare gender, age and group differences (study participants versus study dropouts), in selected variables, including physical fitness, a one-way between-group analysis of variance, independent t-tests or χ2 were used as appropriate. A linear random effects regression model was conducted to investigate if physical fitness (VO2max and maximal muscle strength), body composition and weight were associated with exercise attendance and dropout at two time points (3 and 12 months). In the analysis, time from inclusion was set as the repeated factor and attendance was set as the second factor, where baseline values were set as neutral by a separate code. Standard errors were computed by a robust estimator taking the within-person dependency into account.
According to self-reported exercise sessions at the fitness club the last 4 weeks, the participants were divided into three groups: regular exercise attendance: visiting the fitness club ≥two times a week, low exercise attendance: visiting the fitness club ≤once a week and exercise dropout: no exercise the last month. Few had membership dropout at 3 and 12 months; hence, no analyses were done for this specific outcome. For any baseline differences in physical fitness, body composition and weight, self-reported exercise attendance at 3 months was used for group comparisons.
Results
Fitness club members (n=125) from a European city with a population of approximately 673 500 were predominantly Caucasian (96.8%), with 7.2% aged 18–24, 59.2% aged 25–39, 30.4% aged 40–64 and 3.2% aged 65 plus. Background variables and health factors are described elsewhere.31 Physical fitness, body composition and weight at inclusion are given in table 1.
Table 1.
Physical fitness (VO2max and maximal muscle strength), body composition and weight for all participants, and between men and women at inclusion (n=125)
| Variable | All participants (n=125) | Men (n=62) | Women (n=63) |
| Body weight (kg) | 77.0±14.8 | 85.5 (±12.0) | 68.8 (±12.5) |
| BMI (kg/m2) | 25.0±3.9 | 25.6 (±3.2) | 24.6 (±4.5) |
| FM (%) | 25.4±8.6 | 20.0 (±5.4) | 30.5 (±7.9) |
| MM (kg) | 32.0±7.8 | 38.6 (±4.4) | 25.6 (±4.0) |
| FFM (kg) | 57.3±12.2 | 67.9 (±7.4) | 47.0 (±4.9) |
| WHR | 0.89±0.04 | 0.90 (±0.03) | 0.87 (±0.05) |
| VO2max (mL/min/kg) | 37.7±7.1 | 40.5±7.2 | 35.0±6 |
| VO2max (L/min) | 2.8±0.7 | 3.41 (±0.6) | 2.37 (±0.4) |
| 1RM in leg press | 178.1±92.1 | 211.3 (±47.0) | 145.6 (±112.5) |
| 1RM in bench press | 46.9±23.7 | 64.6 (±18.5) | 28.9 (±11.9) |
Data are presented as mean (SD).
BMI, body mass index; FFM, fat free mass; FM, fat mass;
MM, muscle mass; WHR, waist hip ratio; VO2max, maximal oxygen uptake; 1RM, 1 repetition maximum.
At 3 (104 responders) and 12 months (91 responders), 2 participants (two men) and 13 participants (5 men and 8 women) reported membership dropout, respectively. In addition, 25.0% (11 men and 15 women) at 3 months and 36.3% (16 men and 17 women) at 12 months reported exercise dropout, although still being a member. No gender or age differences were seen between groups at any measurements points (data not shown). Self-reported weekly exercise sessions at 3 and 12 months were in mean 2.0 (±1.0) and 2.2 (±1.4), with no differences between men and women (p=0.391, p=0.152). At 3 and 12 months, 51.7% and 42.2% reported regular exercise attendance, with no gender differences (p=0.775, p=0.371).
At 3 months, regular attendees had a significantly higher VO2max than exercise dropout (6.54 mL/min/kg, 95% CI 2.00 to 11.07, p=0.003). At 12 months, a difference in VO2max of 5.32 mL/min/kg (95% CI −0.08 to 10.72, p=0.054) was found between regular exercise attendance and exercise dropout, as well as between regular and low exercise attendance (6.17 mL/min/kg, 95% CI 0.19 to 12.15, p=0.042). The linear random effects regression model showed an association between VO2max (mL/min/kg and L/min) and exercise attendance (z=−2.37 and −2.16). Otherwise, no differences or associations were observed in longitudinal data of maximal muscle strength or body composition between regular and low attendance and exercise dropout (table 2). The nature of the association is shown in figure 3.
Table 2.
Physical fitness (VO2max and maximal muscle strength), body composition and weight at 3 and 12 months of fitness centre membership for regular attendance (≥2 sessions per week), low attendance (<2 sessions per week) and exercise dropout (no exercise sessions the last month)
| Variable | 3 months | 12 months | ||||||
| Regular attendance (n=45) |
Low attendance (n=23) |
Exercise dropout (n=18) |
P value | Regular attendance (n=27) |
Low attendance (n=15) |
Exercise dropout (n=21) |
P value | |
| Mean (SD) | Mean (SD) | Mean (SD) | Mean (SD) | Mean (SD) | Mean (SD) | |||
| VO2max (mL/min/kg) | 40.6 (6.9)* | 37.2 (7.1) | 34.0 (6.7)* | 0.003 | 42.9 (6.4)* | 36.7 (9.8)* | 37.6 (7.6)* | 0.019 |
| VO2max (L/min) | 3.1 (0.8)* | 2.9 (0.7) | 2.6 (0.6)* | 0.061 | 3.6 (0.8)* | 2.8 (0.9)* | 2.8 (0.7)* | 0.044 |
| 1RM in leg press (kg) | 187.6 (68.9) | 174.4 (54.6) | 168.4 (53.7) | 0.477 | 197.2 (67.6) | 179.1 (57.1) | 180.0 (57.4) | 0.552 |
| 1RM in bench press (kg) | 56.5 (28.4) | 48.9 (18.6) | 47.8 (18.7) | 0.314 | 55.9 (25.6) | 45.9 (21.0) | 50.9 (22.7) | 0.432 |
| Body weight (kg) | 76.5 (13.3) | 77.9 (15.3) | 78.0 (18.3) | 0.891 | 77.9 (11.5) | 76.1 (17.8) | 75.5 (14.1) | 0.833 |
| BMI (kg/m2) | 24.8 (2.7) | 25.7 (4.0) | 26.7 (5.6) | 0.189 | 24.6 (2.7) | 25.5 (5.6) | 24.7 (3.8) | 0.803 |
| FM (%) | 23.5 (8.6) | 26.1 (9.6) | 29.6 (10.4) | 0.064 | 20.8 (9.7) | 25.3 (11.0) | 24.9 (7.9) | 0.237 |
| MM (kg) | 33.0 (8.0) | 32.8 (7.5) | 30.2 (6.8) | 0.395 | 34.9 (8.1) | 31.7 (8.6) | 31.5 (6.1) | 0.246 |
| FFM (kg) | 58.7 (13.2) | 58.6 (12.5) | 54.2 (11.1) | 0.403 | 61.9 (13.3) | 56.4 (13.9) | 56.2 (10.2) | 0.226 |
| WHR | 0.88 (0.04) | 0.89 (0.04) | 0.90 (0.05) | 0.479 | 0.87 (0.04) | 0.89 (0.06) | 0.88 (0.05) | 0.465 |
Data are presented as mean (SD). The p value shows group differences.
*Groups who significantly differ.
BMI, body mass index; FFM, fat free mass; FM, fat mass; MM, muscle mass; WHR, waist hip ratio; VO2max, maximal oxygen uptake; 1RM, 1 repetition maximum.
Figure 3.

The nature of association between VO2max (mL/min/kg) and attendance (z=−2.37).
Table 3 shows main motives (>40%) for fitness club membership and exercise. The majority of participants reported physical fitness as a main motive, followed by health factors. Few reported psychosocial motives for fitness club membership and exercise (such as social recognition and affiliation, data not shown).
Table 3.
Main motives for fitness club membership and exercise at inclusion (n=125). Data are presented as n (%). The main motives (>40%) are categorised based on Exercise Motivations Inventory—2: strength and endurance, positive health, revitalisation, health avoidance, appearance and weight management
| Strength and endurance | n (%) | Positive health | n (%) |
| Increase in physical fitness | 116 (92.8) | To have a healthy body | 83 (66.4) |
| To increase my endurance | 63 (50.4) | To feel more healthy | 80 (64.0) |
| To develop my muscles | 54 (43.2) | ||
| Revitalisation | Health avoidance | ||
| Because after exercising I feel refreshed | 81 (64.8) | To avoid ill health | 74 (59.2) |
| Because it makes me feel good | 67 (53.6) | To prevent health problems | 69 (55.2) |
| Appearance | Weight management | ||
| To look more attractive | 73 (58.4) | To stay slim | 59 (47.2) |
| To improve my appearance | 52 (41.6) | To lose weight | 57 (45.6) |
Based on self-reported exercise attendance at 3 months, no baseline differences in physical fitness, body composition and weight were observed between regular attendance, low attendance and exercise dropout. Analysing completers only (participants who underwent testing at all time points, n=56) did not change the present findings. In addition, independent t-tests and χ2 revealed no baseline differences in physical fitness, body composition and weight, or motives for fitness club membership and exercise between completers and study dropouts at 3 and 12 months (data not shown).
Discussion
In the present study, an association was shown between VO2max (both in absolute values and relative to body weight) and attendance. On the other side, we cannot conclude that the participants were motivated to continue exercising because of improved VO2max, or whether this was an effect of exercising regularly. However, from a public health perspective, a significantly higher VO2max in those who exercised ≥2 sessions per week is of clinical relevance with respect to cardiovascular health. No differences were seen in maximal muscle strength or body composition between groups. Identified main motives for fitness club membership and exercise were mostly related to physiological factors, with increase in physical fitness (92.8%) most frequently cited, followed by health related motives.
The present study showed no differences between regular attendance, low attendance and exercise dropout in maximal muscle strength and body composition after 3 and 12 months of fitness club membership. At a fitness club, most members are left to exercise on their own if they do not participate in group exercise classes or pay for additional services such as hire personal trainers. Studies have shown that few manage to exercise with a recommended dosage.7 12 32–34 In addition, it is shown that individuals who exercise for a very short period, especially resistance exercise, may not even reach the desired physiological changes (ie, increase in muscle mass and strength).35 Moreover, the metabolism may be higher after exercise, and increased appetite may limit weight-loss goals.36 Lack of improvement may also affect the individual’s motivation for continuation of regular exercise and may have contributed to exercise dropout and total dropout from the current study. We found no differences between groups in maximal muscle strength. This may be due to that participants, who regularly performed resistance exercise in our study, did not perform the exercises used for testing of 1RM. Hence, it might be that no differences were found due to the exercise principle of specificity.37 For example, if an individual wants to improve leg press, he or she must practice leg press, even though other exercises employ the same muscles. In addition, it may be due to a small number of exercise sessions per week (mean of 2.0 and 2.1 at 3 and 12 months, respectively) and/or insufficient workload during resistance exercise.38–42 Studies have shown that it may be challenging for an individual to choose a sufficient workload during resistance exercise,43 44 especially in a non-supervised setting or in group exercise sessions.19 On the other hand, it may be easier to exercise at an appropriate intensity during endurance performance, due to that perceived exertion compares well with heart rate.45 46 In the present study, the participants were given instructions on intensity during the CPET test. Hence, they were somewhat familiar with heart rate responses during uphill walking, comparable to other endurance activities. Unfortunately, intensity score and workload were not included in the questionnaire and we did not register heart rate during exercise sessions. However, total exercise time per week at the fitness club seems appropriate (mean of 139.2 and 155.8 min at 3 and 12 months, respectively) and is according to the current recommendations for physical activity.47 Yet, total exercise time was based on self-report; therefore, social desirability may have potentially affected the risk of over-reporting.48 It is also likely that members reported time spent at the fitness club, rather than time spent exercising, although we emphasised that the participants should report exercise time only. Our initial hypothesis was that access to exercise equipment and group exercise classes could contribute to regular exercise attendance and increase in physical fitness (such as maximal muscle strength). Yet, we did not find that fitness club membership contributed to changes in maximal muscle strength and body composition. Hence, from a public health perspective, it may be important that the staff help and support fitness club members to exercise with a recommended dosage, which in turn may lead to positive changes in physical fitness and body composition.
The present study showed an association between VO2max and attendance, with the highest increase in regular attendees. Among exercise dropouts, from 3 to 12 months of fitness club membership, an increase in VO2max was also shown. This may present the phenomenon of exercise relapse, an individual maintaining exercise for a period, dropout for a short-term, and then relapse into previous exercise behaviour.49 Therefore, we may assume that some of these participants exercised between 3 and 11 months and achieved a long-term increase in VO2max, despite reporting no exercise the last month.
The participants were defined as untrained at study enrolment and may be considered representative for new members at a fitness club, as well as comparable to the general population.32–34 50 Measurements of VO2max at inclusion (38.8 and 34.8 mL/min/kg for men and women, respectively) were similar to Norwegian adults in the same age groups (39.5 for men and 32.3 mL/min/kg for women).15
Despite the known benefits of regular exercise,51–58 overall participation rates are low and those who initiate an exercise programme have trouble maintaining it.5 20 21 In the current study, a limitation was that attendance was measured by self-report only, with no information about the actual individual attendance at the fitness club. It is well known that individuals have a tendency to overestimate the number of exercise sessions because of social desirability, and therefore the measure may be imprecise.59 60 Studies have shown that about 50% of those who start exercising regularly dropout from their exercise programme within the first 6–12 months.5 20–22 In addition, Sperandei et al 7 suggested that 63% of new members at a fitness club will dropout before the third month and less than 4% will remain for more than 12 months of regular exercise.7 In our study, the exercise dropout rate was lower (21.0% and 30.5% at 3 and 12 months, respectively), but the numbers are most likely more similar to the literature, due to high dropout from the study itself (30.4% at 3 months and 50.4% at 12 months). Others have reported that primary reasons for exercise dropout are failure, lack of improvement and changes in motivation.21 35 This is in accordance with the findings of the current study. In total, 44.2% dropped out from the previous fitness club due to lack of motivation, which may be explained by little or no change in physiological factors.
Consistent with our findings, Mullen and Whaley8 also reported physical and aesthetic goals as important motives for exercise at a fitness club.8 A challenge with such goals is that the focus is mainly on the outcome itself and not on activities that are fun and maximise exercise enjoyment. It is possible that physical and aesthetic goals may contribute to lower attendance, especially if positive changes in physical fitness, body composition and weight are lacking. Further, in our study, 59.2% also reported intrinsic motives (such as ‘exercise makes me feel good’) for participation at the fitness club. Two cross-sectional studies have reported that fitness club members with intrinsic motives are more likely to maintain exercise attendance than those with extrinsic motives (such as aesthetic goals).61 62 However, findings from the present study showed that few managed to maintain long-term exercise attendance. A healthy level of physical fitness, body composition and weight is not a sprint to a finish line, it is a lifetime commitment. Hence, it is important to motivate individuals to enjoy exercise in the present, and not focus on ‘future goals’ (ie, weight loss).63–65 Lastly, the literature regarding exercise maintenance is scarce.66 67 Hence, more research is needed for an increased understanding of factors that contribute to long-term exercise behaviour.
Measurements
Accurate measurement of body composition and reliability is dependent on the instrument itself and standardised procedures prior to the test (ie, fasting, abstain from exercise, toilet visit prior to test).68 69 To ensure this, the participants in our study were informed about the standardised procedures prior to each test day. A limitation in bioelectrical impedance analysis is an underestimation of fat mass and an overestimation of lean body mass.70 71 However, the study of Völgyi et al showed that the underestimation of fat mass was lower in individuals with overweight and obesity (body mass index >25 and>30), especially in men.70 About half of the participants (46.7% men and 47.6% women) in the present study had a fat percentage above recommended values, and were classified as overweight. Hence, the underestimation of fat mass may not be an important limitation. Despite the potential underestimation of fat mass, bioelectrical impedance analysis is cheap, easy to use and thus an alternative to more expensive methods.69
CPET is considered the ‘gold standard’ for measuring VO2max. In addition, a major strength in the present study is that the same personnel conducted all CPETs. However, the method may not be suitable for individuals who have different fitness challenges related to pain or fatigue, and the method requires exercise to volitional exhaustion, as well as being expensive and time consuming.24 Several participants reported that the CPET was painful due to exercise to volitional exhaustion. This feedback may be one of the explanation of our high dropout rate.
Testing of 1RM is the most reliable test for evaluating maximal muscle strength and considered the ‘gold standard’.28 29 In the present study, all participants were untrained at inclusion and had no experience with the test exercises. Unfortunately, we had no familiarisation sessions prior to baseline testing in our study, and we used different test leaders for practical reasons. Familiarisation sessions are recommended to achieve reliable 1RM measurements.72 However, all test leaders were qualified and followed standardised measurement procedures.
Strengths and limitations
In this study, the use of a longitudinal prospective design, a sample size with a wide range in age (18–71 years), equal number of men and women, and valid and reliable measurement methods may be considered major strengths. Another strength was the use of an electronic questionnaire based on previously validated surveys.11 73–81 An electronic questionnaire is able to gather responses quickly, and eliminate the costs associated with printing and distributing paper-based questionnaires. The high dropout from the study itself may be considered a limitation. Still, we had a sufficient number of participants with respect to a priory power calculation for all physiological measurements at 3 and 12 months. Self-reported attendance at the fitness club may also be considered a limitation, since individuals have a tendency to overestimate due to social desirability.59 60 In addition, despite increasing Internet use in the general adult population, the use of an electronic questionnaire in this study may have contributed to study dropout of older participants, due to limited technical skills.
Conclusion
Our results showed that VO2max was associated with regular attendance at the fitness club at 3 and 12 months. No differences were found in body composition, weight and maximal muscle strength between study groups (regular and low attendance, exercise dropout). Lastly, physiological factors, with increase in physical fitness was the main motive for fitness club membership and exercise, followed by health and appearance-related motives.
Supplementary Material
Acknowledgments
The authors thank Ingar Holme and Morten Fagerland, professors in biostatistics, Norwegian School of Sports Sciences, for important guidance with the statistical analysis. Thanks to Hege Heiestad, Fredrik Kristiansen, Charlotte Jakobsen and Lasse Bækken for assistance regarding testing of body composition and maximal muscle strength.
Footnotes
Contributors: CG plotted all data, developed the questionnaire together with LAHH, and outlined the manuscript. TS developed the tread mill protocol together with CG and LAHH and supervised the testing. CG and LAHH were responsible for data collection and recruited the participants. LAHH originated the idea for the present study and supervised the project. All authors participated in discussing the design of the study, read and corrected draft versions of the manuscript and approved the final manuscript.
Funding: The project was financed by and conducted at the Norwegian School of Sports Sciences.
Competing interests: None declared.
Ethics approval: The project was reviewed by the Regional Committee for Medical and Health Research Ethics (REK 2015/1443 A), who concluded that, according to the Act on medical and health research (the Health Research Act 2008), the study did not require full review by REK. The project was approved by the Norwegian Social Science Data Service (NSD 44135).
Provenance and peer review: Not commissioned; externally peer reviewed.
Data sharing statement: All data are fully available without restriction. Data are from the ‘Physical activity at fitness clubs. -A venue for public health’-study whose authors may be contacted at the Norwegian School of Sports Sciences. christina.gjestvang@nih.no.
Patient consent for publication: Not required.
References
- 1. Rhodes RE, Janssen I, Bredin SSD, et al. Physical activity: Health impact, prevalence, correlates and interventions. Psychol Health 2017;32:942–75. 10.1080/08870446.2017.1325486 [DOI] [PubMed] [Google Scholar]
- 2. Andersson C, Lyass A, Larson MG, et al. Physical activity measured by accelerometry and its associations with cardiac structure and vascular function in young and middle-aged adults. J Am Heart Assoc 2015;4:e001528 10.1161/JAHA.114.001528 [DOI] [PMC free article] [PubMed] [Google Scholar]
- 3. Baart de la Faille M, Middelkamp J, Steenbergen J. The state of research in the global fitness industry. The Netherlands: Black Box Publishers, 2012. [Google Scholar]
- 4. Middelkamp J, van Rooijen M, Wolfhagen P, et al. The Effects of a Self-Efficacy Intervention on Exercise Behavior of Fitness Club Members in 52 Weeks and Long-Term Relationships of Transtheoretical Model Constructs. J Sports Sci Med 2017;16:163–71. [PMC free article] [PubMed] [Google Scholar]
- 5. Annesi J. Effects of a cognitive behavioral treatment package on exercise attendance and drop out in fitness centers. Eur J Sport Sci 2003;3:1–16. 10.1080/17461390300073206 [DOI] [Google Scholar]
- 6. Dishman RK, Buckworth J. Adherence to physical activity Morgan WP, Series in health psychology and behavioral medicine. Physical activity and mental health (Reprinted in modified form from W. P. Morgan et al (Eds.), "Exercise and Mental Health," Washington, DC: Hemisphere. Philadelphia, US: Taylor & Francis, 1997:63–80. [Google Scholar]
- 7. Sperandei S, Vieira MC, Reis AC. Adherence to physical activity in an unsupervised setting: Explanatory variables for high attrition rates among fitness center members. J Sci Med Sport 2016;19:916–20. 10.1016/j.jsams.2015.12.522 [DOI] [PubMed] [Google Scholar]
- 8. Mullen SP, Whaley DE. Age, gender, and fitness club membership: Factors related to initial involvement and sustained participation . Int J Sport Exerc Psychol 2010;8:24–35. 10.1080/1612197X.2010.9671931 [DOI] [Google Scholar]
- 9. Molanorouzi K, Khoo S, Morris T. Motives for adult participation in physical activity: type of activity, age, and gender. BMC Public Health 2015;15:66 10.1186/s12889-015-1429-7 [DOI] [PMC free article] [PubMed] [Google Scholar]
- 10. Bandura A. Health promotion by social cognitive means. Health Educ Behav 2004;31:143–64. 10.1177/1090198104263660 [DOI] [PubMed] [Google Scholar]
- 11. Markland D, Ingledew DK. The measurement of exercise motives: Factorial validity and invariance across gender of a revised Exercise Motivations Inventory. Br J Health Psychol 1997;2:361–76. 10.1111/j.2044-8287.1997.tb00549.x [DOI] [Google Scholar]
- 12. Teixeira PJ, Carraça EV, Markland D, et al. Exercise, physical activity, and self-determination theory: a systematic review. Int J Behav Nutr Phys Act 2012;9:78 10.1186/1479-5868-9-78 [DOI] [PMC free article] [PubMed] [Google Scholar]
- 13. Poag K, McAuley E. Goal Settings Self-Efficacy, and Exercise Behavior. J Sport Exerc Psychol 1992;14:352–60. 10.1123/jsep.14.4.352 [DOI] [Google Scholar]
- 14. Lee DC, Artero EG, Sui X, et al. Mortality trends in the general population: the importance of cardiorespiratory fitness. J Psychopharmacol 2010;24(4 Suppl):27–35. 10.1177/1359786810382057 [DOI] [PMC free article] [PubMed] [Google Scholar]
- 15. Edvardsen E, Hansen BH, Holme IM, et al. Reference values for cardiorespiratory response and fitness on the treadmill in a 20- to 85-year-old population. Chest 2013;144:241–8. 10.1378/chest.12-1458 [DOI] [PubMed] [Google Scholar]
- 16. Aspenes ST, Nilsen TI, Skaug EA, et al. Peak oxygen uptake and cardiovascular risk factors in 4631 healthy women and men. Med Sci Sports Exerc 2011;43:1465–73. 10.1249/MSS.0b013e31820ca81c [DOI] [PubMed] [Google Scholar]
- 17. Montero D, Diaz-Canestro C, Lundby C. VO2max: Role of Maximal Cardiac Output and Oxygen Extraction. Med Sci Sports Exerc 2015;47:2024–33. [DOI] [PubMed] [Google Scholar]
- 18. Suresh K, Chandrashekara S. Sample size estimation and power analysis for clinical research studies. J Hum Reprod Sci 2012;5:7–13. 10.4103/0974-1208.97779 [DOI] [PMC free article] [PubMed] [Google Scholar] [Retracted]
- 19. Rustaden AM, Haakstad LAH, Paulsen G, et al. Effects of BodyPump and resistance training with and without a personal trainer on muscle strength and body composition in overweight and obese women-A randomised controlled trial. Obes Res Clin Pract 2017;11:728–39. 10.1016/j.orcp.2017.03.003 [DOI] [PubMed] [Google Scholar]
- 20. Annesi JJ. Effects of computer feedback on adherence to exercise. Percept Mot Skills 1998;87:723–30. 10.2466/pms.1998.87.2.723 [DOI] [PubMed] [Google Scholar]
- 21. Marcus BH, Dubbert PM, Forsyth LH, et al. Physical activity behavior change: issues in adoption and maintenance. Health Psychol 2000;19(1S):32–41. 10.1037/0278-6133.19.Suppl1.32 [DOI] [PubMed] [Google Scholar]
- 22. Weinberg RS, Gold D. Exercise Behavior and Adherence. Foundations of sport and exercise. Champaign: Human Kinetics, 2003. [Google Scholar]
- 23. Anderson LJ, Erceg DN, Schroeder ET. Utility of Multifrequency Bioelectrical Impedance Compared to DEXA for Assessment of Regional Lean Mass. Medicine & Science in Sports & Exercise 2011;43:316 10.1249/01.MSS.0000400870.47008.e9 [DOI] [Google Scholar]
- 24. Evans HJ, Ferrar KE, Smith AE, et al. A systematic review of methods to predict maximal oxygen uptake from submaximal, open circuit spirometry in healthy adults. J Sci Med Sport 2015;18:183–8. 10.1016/j.jsams.2014.03.006 [DOI] [PubMed] [Google Scholar]
- 25. Balke B, Ware RW. An experimental study of physical fitness of Air Force personnel. U S Armed Forces Med J 1959;10:675–88. [PubMed] [Google Scholar]
- 26. Edvardsen E, Hem E, Anderssen SA. End criteria for reaching maximal oxygen uptake must be strict and adjusted to sex and age: a cross-sectional study. PLoS One 2014;9:e85276 10.1371/journal.pone.0085276 [DOI] [PMC free article] [PubMed] [Google Scholar]
- 27. Borg G. Perceived exertion as an indicator of somatic stress. Scand J Rehabil Med 1970;2:92–8. [PubMed] [Google Scholar]
- 28. McMaster DT, Gill N, Cronin J, et al. A brief review of strength and ballistic assessment methodologies in sport. Sports Med 2014;44:603–23. 10.1007/s40279-014-0145-2 [DOI] [PubMed] [Google Scholar]
- 29. Verdijk LB, van Loon L, Meijer K, et al. One-repetition maximum strength test represents a valid means to assess leg strength in vivo in humans. J Sports Sci 2009;27:59–68. 10.1080/02640410802428089 [DOI] [PubMed] [Google Scholar]
- 30. Caspersen CJ, Powell KE, Christenson GM. Physical activity, exercise, and physical fitness: definitions and distinctions for health-related research. Public Health Rep 1985;100:126–31. [PMC free article] [PubMed] [Google Scholar]
- 31. Gjestvang C, Stensrud T, Haakstad LAH. How is rating of perceived capacity related to VO2max and what is VO2max at onset of training? BMJ Open Sport Exerc Med 2017;3:e000232 10.1136/bmjsem-2017-000232 [DOI] [PMC free article] [PubMed] [Google Scholar]
- 32. Dumith SC, Hallal PC, Reis RS, et al. Worldwide prevalence of physical inactivity and its association with human development index in 76 countries. Prev Med 2011;53(1-2):24–8. 10.1016/j.ypmed.2011.02.017 [DOI] [PubMed] [Google Scholar]
- 33. Scarborough P, Bhatnagar P, Wickramasinghe KK, et al. The economic burden of ill health due to diet, physical inactivity, smoking, alcohol and obesity in the UK: an update to 2006-07 NHS costs. J Public Health 2011;33:527–35. 10.1093/pubmed/fdr033 [DOI] [PubMed] [Google Scholar]
- 34. Colley RC, Garriguet D, Janssen I, et al. Physical activity of Canadian adults: accelerometer results from the 2007 to 2009 Canadian Health Measures Survey. Health Rep 2011;22:7–14. [PubMed] [Google Scholar]
- 35. Phillips EM, Schneider JC, Mercer GR. Motivating elders to initiate and maintain exercise. Arch Phys Med Rehabil 2004;85(7 Suppl 3):S52–7. [DOI] [PubMed] [Google Scholar]
- 36. Shamlan G, Bech P, Robertson MD, et al. Acute effects of exercise intensity on subsequent substrate utilisation, appetite, and energy balance in men and women. Appl Physiol Nutr Metab 2017;42:1247–53. 10.1139/apnm-2017-0280 [DOI] [PubMed] [Google Scholar]
- 37. Hoffmann J. Physiological aspects of sport training and performance: Human Kinetics, Champaign, 2014. [Google Scholar]
- 38. Huang G, Wang R, Chen P, et al. Dose-response relationship of cardiorespiratory fitness adaptation to controlled endurance training in sedentary older adults. Eur J Prev Cardiol 2016;23:518–29. 10.1177/2047487315582322 [DOI] [PubMed] [Google Scholar]
- 39. Scribbans TD, Vecsey S, Hankinson PB, et al. The Effect of Training Intensity on VO2max in Young Healthy Adults: A Meta-Regression and Meta-Analysis. Int J Exerc Sci 2016;9:230–47. [DOI] [PMC free article] [PubMed] [Google Scholar]
- 40. Silva NL, Oliveira RB, Fleck SJ, et al. Influence of strength training variables on strength gains in adults over 55 years-old: a meta-analysis of dose-response relationships. J Sci Med Sport 2014;17:337–44. 10.1016/j.jsams.2013.05.009 [DOI] [PubMed] [Google Scholar]
- 41. Borde R, Hortobágyi T, Granacher U. Dose-Response Relationships of Resistance Training in Healthy Old Adults: A Systematic Review and Meta-Analysis. Sports Med 2015;45:1693–720. 10.1007/s40279-015-0385-9 [DOI] [PMC free article] [PubMed] [Google Scholar]
- 42. American College of Sports Medicine. American College of Sports Medicine position stand. Progression models in resistance training for healthy adults. Med Sci Sports Exerc 2009;41:687–708. 10.1249/MSS.0b013e3181915670 [DOI] [PubMed] [Google Scholar]
- 43. Focht BC. Perceived exertion and training load during self-selected and imposed-intensity resistance exercise in untrained women. J Strength Cond Res 2007;21:183–7. 10.1519/00124278-200702000-00033 [DOI] [PubMed] [Google Scholar]
- 44. Cotter JA, Garver MJ, Dinyer TK, et al. Ratings of Perceived Exertion During Acute Resistance Exercise Performed at Imposed and Self-Selected Loads in Recreationally Trained Women. J Strength Cond Res 2017;31:2313–8. 10.1519/JSC.0000000000001782 [DOI] [PubMed] [Google Scholar]
- 45. Johnson EC, Pryor RR, Casa DJ, et al. Precision, Accuracy, and Performance Outcomes of Perceived Exertion vs. Heart Rate Guided Run-training. J Strength Cond Res 2017;31:630–7. 10.1519/JSC.0000000000001541 [DOI] [PubMed] [Google Scholar]
- 46. Tang LH, Zwisler AD, Berg SK, et al. Is the cardiovascular response equivalent between a supervised center-based setting and a self-care home-based setting when rating of perceived exertion is used to guide aerobic exercise intensity during a cardiac rehabilitation program?. Am J Phys Med Rehabil 2017;96:381–7. 10.1097/PHM.0000000000000628 [DOI] [PubMed] [Google Scholar]
- 47. Haskell WL, Lee IM, Pate RR, et al. Physical activity and public health: updated recommendation for adults from the American College of Sports Medicine and the American Heart Association. Med Sci Sports Exerc 2007;39:1423–34. 10.1249/mss.0b013e3180616b27 [DOI] [PubMed] [Google Scholar]
- 48. Sallis JF, Saelens BE. Assessment of physical activity by self-report: status, limitations, and future directions. Res Q Exerc Sport 2000;71 Suppl 2:1–14. 10.1080/02701367.2000.11082780 [DOI] [PubMed] [Google Scholar]
- 49. Reed GR. Bull S, Adherence to exercise and the transtheoretical model of behavior change. England: John Wiley & Sons Ltd, 2001:19–45. [Google Scholar]
- 50. Anderssen SA, Andersen LB. Fysisk aktivitetsnivå i Norge 2003. Data basert på spørreskjemaet”International Physical Activity Questionnaire”. IS-1254 Sosial- og helsedirektoratet 2004. [Google Scholar]
- 51. Goodman JM, Burr JF, Banks L, et al. The acute risks of exercise in apparently healthy adults and relevance for prevention of cardiovascular events. Can J Cardiol 2016;32:523–32. 10.1016/j.cjca.2016.01.019 [DOI] [PubMed] [Google Scholar]
- 52. Després JP. Obesity and cardiovascular disease: weight loss is not the only target. Can J Cardiol 2015;31:216–22. 10.1016/j.cjca.2014.12.009 [DOI] [PubMed] [Google Scholar]
- 53. Ardisson Korat AV, Willett WC, Hu FB. Diet, lifestyle, and genetic risk factors for type 2 diabetes: a review from the Nurses' Health Study, Nurses' Health Study 2, and Health Professionals' Follow-up Study. Curr Nutr Rep 2014;3:345–54. 10.1007/s13668-014-0103-5 [DOI] [PMC free article] [PubMed] [Google Scholar]
- 54. Barrès R, Zierath JR. The role of diet and exercise in the transgenerational epigenetic landscape of T2DM. Nat Rev Endocrinol 2016;12:441–51. 10.1038/nrendo.2016.87 [DOI] [PubMed] [Google Scholar]
- 55. Walker JR, Soroush A, Ainsworth BE, et al. U.S. Cohort Differences in Body Composition Outcomes of a 6-Month Pedometer-Based Physical Activity Intervention: The ASUKI Step Study. Asian J Sports Med 2014;5 10.5812/asjsm.25748 [DOI] [PMC free article] [PubMed] [Google Scholar]
- 56. Backus R, Wara A. Development of obesity: Mechanisms and physiology. Vet Clin North Am Small Anim Pract 2016;46 10.1016/j.cvsm.2016.04.002 [DOI] [PubMed] [Google Scholar]
- 57. Friedenreich CM, Neilson HK, Lynch BM. State of the epidemiological evidence on physical activity and cancer prevention. Eur J Cancer 2010;46:2593–604. 10.1016/j.ejca.2010.07.028 [DOI] [PubMed] [Google Scholar]
- 58. Eime RM, Young JA, Harvey JT, et al. A systematic review of the psychological and social benefits of participation in sport for adults: informing development of a conceptual model of health through sport. Int J Behav Nutr Phys Act 2013;10:135 10.1186/1479-5868-10-135 [DOI] [PMC free article] [PubMed] [Google Scholar]
- 59. Sallis JF, Saelens BE. Assessment of physical activity by self-report: status, limitations, and future directions. Res Q Exerc Sport 2000;71(2 Suppl):1–14. 10.1080/02701367.2000.11082780 [DOI] [PubMed] [Google Scholar]
- 60. Kesaniemi YK, Danforth E, Jensen MD, et al. Dose-response issues concerning physical activity and health: an evidence-based symposium. Med Sci Sports Exerc 2001;33:S351–S358. [DOI] [PubMed] [Google Scholar]
- 61. Kathrins BP, Turbow DJ. Motivation of fitness center participants toward resistance training. J Strength Cond Res 2010;24:2483–90. 10.1519/JSC.0b013e3181e27488 [DOI] [PubMed] [Google Scholar]
- 62. Thøgersen-Ntoumani C, Ntoumanis N. The role of self-determined motivation in the understanding of exercise-related behaviours, cognitions and physical self-evaluations. J Sports Sci 2006;24:393–404. 10.1080/02640410500131670 [DOI] [PubMed] [Google Scholar]
- 63. Wilson K, Brookfield D. Effect of goal setting on motivation and adherence in a six‐week exercise program. Int J Sport Exerc Psychol 2009;7:89–100. 10.1080/1612197X.2009.9671894 [DOI] [Google Scholar]
- 64. Field LK, Steinhardt MA. The relationship of internally directed behavior to self-reinforcement, self-esteem, and expectancy values for exercise. Am J Health Promot 1992;7:21–7. 10.4278/0890-1171-7.1.21 [DOI] [PubMed] [Google Scholar]
- 65. Ryan RM, Frederick CM, Lepes D, et al. Intrinsic motivation and exercise adherence. International Journal of Sport Psychology 1997;28:335–54. [Google Scholar]
- 66. Kendrick D, Orton E, Lafond N, et al. Keeping active: maintenance of physical activity after exercise programmes for older adults. Public Health 2018;164:118–27. 10.1016/j.puhe.2018.08.003 [DOI] [PubMed] [Google Scholar]
- 67. Amireault S, Godin G, Vézina-Im L-A. Determinants of physical activity maintenance: a systematic review and meta-analyses. Health Psychol Rev 2013;7:55–91. 10.1080/17437199.2012.701060 [DOI] [Google Scholar]
- 68. Kyle UG, Bosaeus I, De Lorenzo AD, et al. Bioelectrical impedance analysis-part I: review of principles and methods. Clin Nutr 2004;23:1226–43. 10.1016/j.clnu.2004.06.004 [DOI] [PubMed] [Google Scholar]
- 69. Sergi G, De Rui M, Stubbs B, et al. Measurement of lean body mass using bioelectrical impedance analysis: a consideration of the pros and cons. Aging Clin Exp Res 2017;29 10.1007/s40520-016-0622-6 [DOI] [PubMed] [Google Scholar]
- 70. Völgyi E, Tylavsky FA, Lyytikäinen A, et al. Assessing body composition with DXA and bioimpedance: effects of obesity, physical activity, and age. Obesity 2008;16:700–5. 10.1038/oby.2007.94 [DOI] [PubMed] [Google Scholar]
- 71. Faria SL, Faria OP, Cardeal MD, et al. Validation study of multi-frequency bioelectrical impedance with dual-energy X-ray absorptiometry among obese patients. Obes Surg 2014;24:1476–80. 10.1007/s11695-014-1190-5 [DOI] [PubMed] [Google Scholar]
- 72. Amarante do Nascimento M, Januário RS, Gerage AM, et al. Familiarization and reliability of one repetition maximum strength testing in older women. J Strength Cond Res 2013;27:1636–42. 10.1519/JSC.0b013e3182717318 [DOI] [PubMed] [Google Scholar]
- 73. Hausenblas HA, Downs DS. Exercise Dependence Scale-21 Manual, 2002. [PubMed]
- 74. Cash T. The Multidimensional Body-Self Relations Questionnaire. Test Manual. Norfolk, Virginia: Old Dominion University; 1990. [Google Scholar]
- 75. Pavot W, Diener E, Colvin CR, et al. Further validation of the Satisfaction with Life Scale: evidence for the cross-method convergence of well-being measures. J Pers Assess 1991;57:149–61. 10.1207/s15327752jpa5701_17 [DOI] [PubMed] [Google Scholar]
- 76. Pavot W, Diener E. Review of the Satisfaction With Life Scale. Psychol Assess 1993;5:164–72. 10.1037/1040-3590.5.2.164 [DOI] [Google Scholar]
- 77. Park H, Suh BS, Kim WS, et al. Character profiles and life satisfaction. Compr Psychiatry 2015;58:172–7. 10.1016/j.comppsych.2014.12.013 [DOI] [PubMed] [Google Scholar]
- 78. Eriksen HR, Ihlebaek C, Ursin H. A scoring system for subjective health complaints (SHC). Scand J Public Health 1999;27:63–72. 10.1177/14034948990270010401 [DOI] [PubMed] [Google Scholar]
- 79. Sallis JF, Grossman RM, Pinski RB, et al. The development of scales to measure social support for diet and exercise behaviors. Prev Med 1987;16:825–36. 10.1016/0091-7435(87)90022-3 [DOI] [PubMed] [Google Scholar]
- 80. Lorentzen C, Ommundsen Y, Holme I. Psychosocial correlates of stages of change in physical activity in an adult community sample. Eur J Sport Sci 2007;7:93–106. 10.1080/17461390701456122 [DOI] [Google Scholar]
- 81. Sørensen M, Gill DL. Perceived barriers to physical activity across Norwegian adult age groups, gender and stages of change. Scand J Med Sci Sports 2008;18:651–63. 10.1111/j.1600-0838.2007.00686.x [DOI] [PubMed] [Google Scholar]
Associated Data
This section collects any data citations, data availability statements, or supplementary materials included in this article.