Abstract
This study used radiomics image analysis to examine the differences of texture feature values extracted from oropharyngeal and hypopharyngeal cancer positron emission tomography (PET) images on various tumor segmentations, and finds the proper and stable feature groups. A total of 80 oropharyngeal and hypopharyngeal cancer cases were retrospectively recruited. Radiomics method was applied to the PET image for the 80 oropharyngeal and hypopharyngeal cancer cases to extract texture features from various defined metabolic volumes. Kruskal-Wallis one-way analysis of variance method was used to test whether feature value difference exists between groups, which were grouped by stage, response to treatment, and recurrence. If there was a significant difference, the corresponding feature cutoff value was applied to the Kaplan–Meier estimator to estimate the survival functions. For the various defined metabolic volumes, there were 16 features that had significant differences between early (T1, T2) and late tumor stages (T3, T4). Five images and 2 textural features were found to be able to predict the tumor response and recurrence, respectively, with the areas under the receiver operating characteristic curves reaching 0.7. The histogram entropy was found to be a good predictor of overall survival (OS) and primary relapse-free survival (PRFS) of oropharyngeal and hypopharyngeal cancer patients. Textural features from PET images provide predictive and prognostic information in tumor staging, tumor response, recurrence, and have the potential to be a prognosticator for OS and PRFS in oropharyngeal and hypopharyngeal cancer.
Keywords: metabolic tumor volume, oropharyngeal and hypopharyngeal cancer, PET image, radiomics, textural analysis
1. Introduction
As development in medical computational technologies advances, analysis in gene sequence or protein composition in a disease lesion can provide helpful information in personalized treatment plan. However, the collection of the specimen of lesion tissues for such analysis is always invasive, and the analysis itself requires certain hardware and software. Thus, there are some limitations for applying the technologies clinically.[1] In addition, the specimen is from a small part of the lesion, of which, the results cannot reflect the characteristics of the whole lesion. On the other hand, medical imaging is noninvasive and can provide information of the whole lesion both anatomically and functionally. Currently, medical imaging has been widely applied in clinical lesion diagnosis and treatment response monitoring.
Positron emission tomography (PET) has been clinically used in cancer diagnosis, cancer staging, detection of necrosis, tumor heterogeneity, tumor location and size, and treatment response evaluation.[2] Some studies demonstrated that the standardized uptake value (SUV) of fluorodeoxyglucose (18F-FDG) in tumors can predict the treatment response and survival rate.[3] An example of such studies showed that for oropharyngeal and hypopharyngeal cancer patients, if the mean SUV value (SUVmean) is high in the primary tumor, the survival rate would be low.[4] Because the SUV is affected by multiple factors, such as the patient weight, blood sugar level, FDG injection timing, dose correction, and image reconstruction algorithm,[5] SUV cannot accurately provide quantitative information, and thus it cannot accurately predict patients’ treatment outcome. More robust image analysis techniques are needed to provide quantitative information to help clinical diagnosis and treatment evaluation.
The emerging image analysis method, radiomics, extracts a large amount of information from medical images, including quantitative values in tumors’ physical pattern, texture features based on the intensity distribution in the image voxels, and analyzes the relationship to other medical information. This method has been clinically applied in image identification, segmentation, contouring, and tumor heterogeneity analysis.[6] Tumor characteristic parameters, such as shape, size, texture features and heterogeneity, have been extracted from PET/computed tomography (CT) images,[7,8] with the texture features and heterogeneity being discussed more often. Many groups reported that the texture features and tumor heterogeneity extracted from PET/CT could provide more tumor phenotypic information in addition to SUV measurement.[9–11] El Naqa et al[9] reported that PET image features could give very good specificity and sensitivity for oropharyngeal and hypopharyngeal cancer patients’ prognosis. Additionally, the extra information extracted from clinical images using radiomics method not only can be used alone as reference indices, but can also be combined with other information, such as genomics, metabolomics, proteomics, to enhance the discrimination ability in phenotypic information and prediction ability in treatment outcome and prognosis.
Although many reports proposed that radiomics features are effective predictors of treatment outcome and diagnosis for various cancers, it is still a big challenge to pick proper ones from the large options of the texture features. This study used radiomics image analysis to examine the differences of texture feature values extracted from oropharyngeal and hypopharyngeal cancer PET images on various tumor segmentations, and found the proper and stable feature groups, based on statistics and correlation to the clinical data (phenotype, stage), response to treatment and survival rate. These feature groups were then applied in clinical diagnosis and survival correlation. The purpose of this study was to establish robust and suitable image texture features for clinical diagnosis and treatment evaluation for oropharyngeal and hypopharyngeal cancer patients.
2. Methods and materials
2.1. Patient data
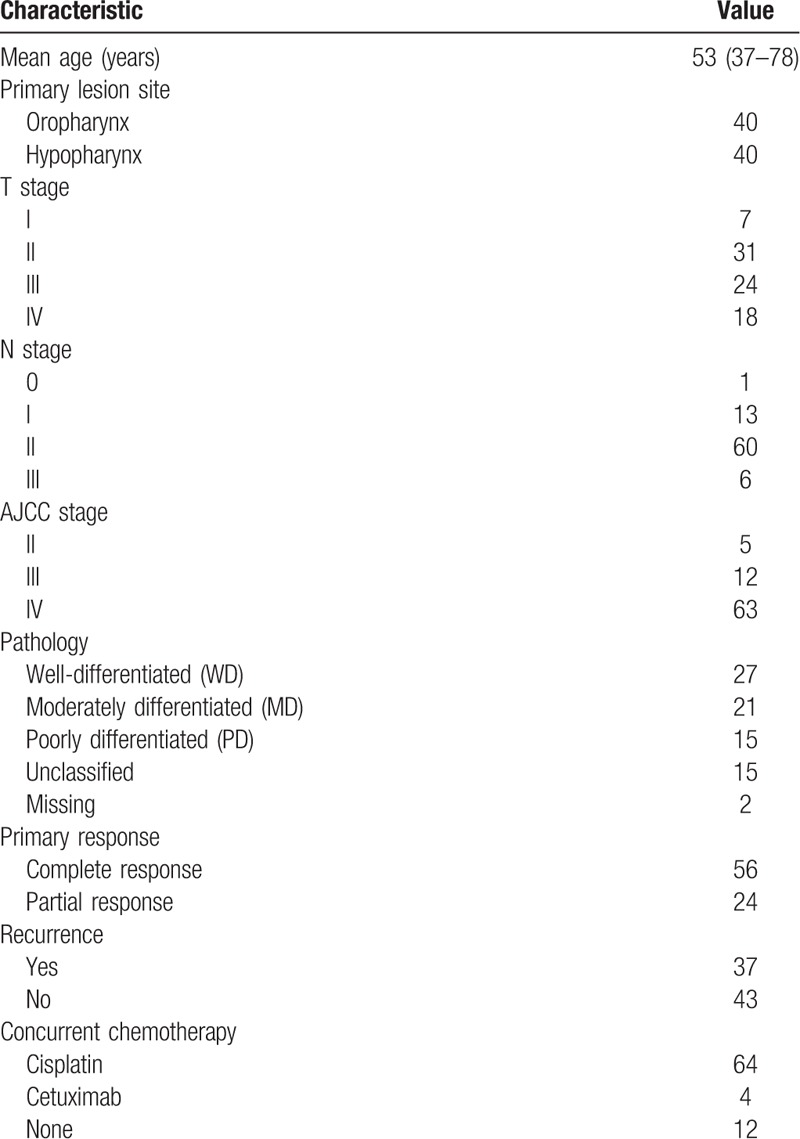
The requirement to obtain institutional review board (IRB) approval was waived for this retrospective study (certificate number of local IRB, DMR99-IRB-010-1). A total of 80 oropharyngeal and hypopharyngeal cancer cases treated during 2009 and 2013 in the department of radiation oncology in China Medical University Hospital, were retrospectively recruited (Fig. 1). All patients were male, and the mean age was 53 years. In 80 patients, 40 patients had primary tumors located in the oropharynx, and 40 patients had primary tumors located in the hypopharynx. All patients were treated with radiotherapy combined with chemotherapy. In all cases, PET images were taken and clinically relevant information was recorded, such as gender, cancer stage and tumor differentiation, whether or not surgery was done, tumor location, and number of lesions, etc. The collected information also included the treatment results and prognosis, including overall survival (OS), disease-free survival (DFS), and primary relapse-free survival (PRFS). The voxel size in all the PET images was 5.5 × 5.5 × 3.3 mm3 where 3.3 mm was the slice thickness. The relevant information is listed in Table 1. All PET images were loaded to the Eclipse treatment planning system (version 11.0, Varian Medical Systems, Inc, Palo Alto, CA) to get metabolic tumor volume (MTV) defined.
Figure 1.
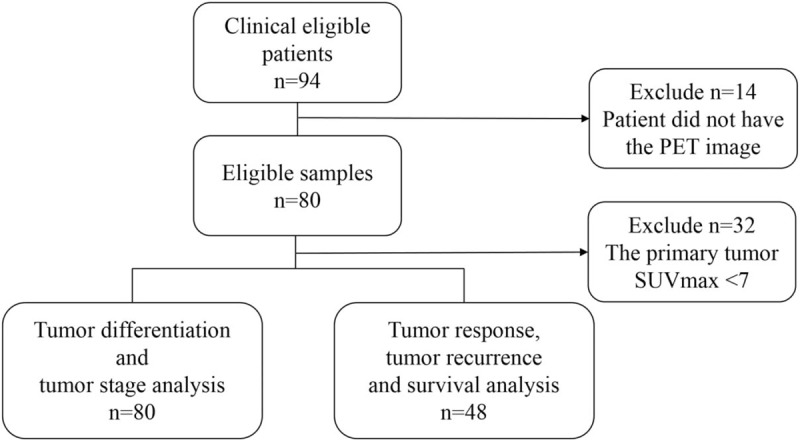
The STARD (Standard for Reporting Diagnostic Accuracy) diagram of the 80 patients selected for analysis.
Table 1.
Patient characteristic.
2.2. PET/CT image acquisition
All patients had undergone the standard procedure of PET/CT (PET/CT-16 slice, Discovery STE, GE Medical System, Milwaukee, WI) scanning. Patients were injected with 370 MBq of 18F-FDG and rested during the pharmacokinetics uptake period. The original data included a low-radiation dose CT scan and PET emission images. Low-radiation dose CT images were obtained with 120 kVp, variable mA with AutomA (GE Medical Systems, Milwaukee, WI) technique, 1.75:1 pitch, and 3.75 mm slice thickness, which were acquired for anatomic reference and attenuation correction. PET data were acquired at the 1.5 min per field of view in 3-dimensional acquisition mode. The PET images were reconstructed by 3-dimensional iterative algorithms (VUE Point, GE Medical Systems, Milwaukee, WI).
2.3. Target delineation
The MTV was semi-automatically defined using various SUV threshold values of the primary tumor, including MTV2.5, MTV3.0, MTV40%, and MTV50%, where MTV2.5 means the MTV defined with the threshold SUV value being 2.5, MTV40% means the MTV defined with the threshold SUV value being 40% of the maximum value (Fig. 2).[12] The texture features were extracted from the various MTVs using software developed by our team.
Figure 2.
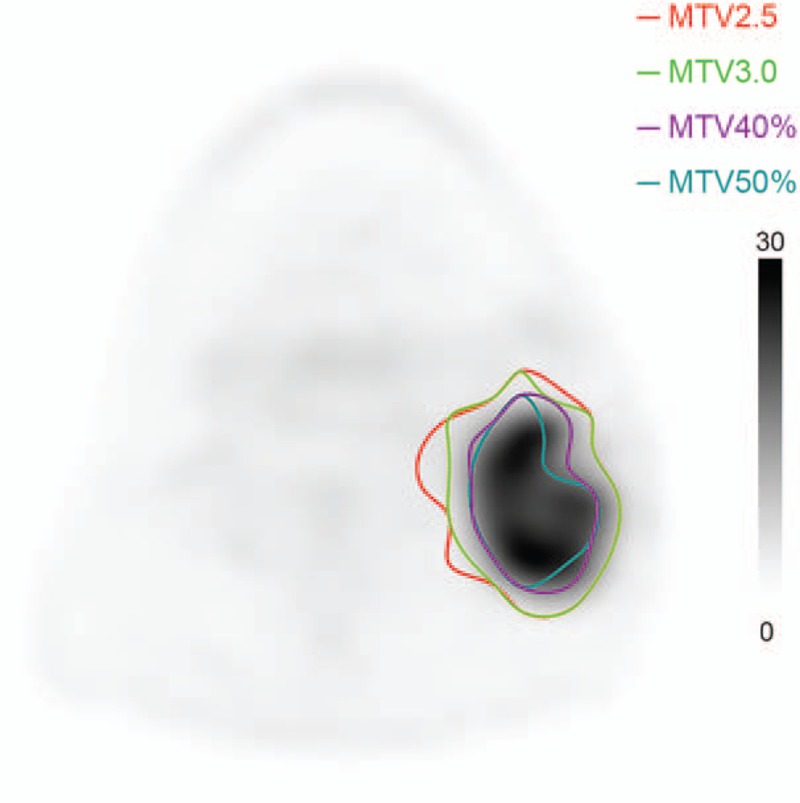
Metabolic tumor volume definitions of various SUV threshold values in PET image. Red = MTV2.5, lime = MTV3.0, plum = MTV40%, teal = MTV50%. PET = positron emission tomography, SUV = standardized uptake value.
2.4. Radiomics texture analysis
The feature extraction software developed by our team calculates values of radiomics features of shape, intensity based, gray level co-occurrence matrix (GLCM), run length matrix (RLM), and gray level size zone matrix (GLSZM) based on the MTVs. Image feature values were obtained by statistics, modeling, and conversion. The statistical features were calculated using the regional intensity distribution in the image. The feature values were determined by the relationship between the neighboring voxels, can be divided into 1st order, 2nd order, and higher order features.[13] An example of the feature extraction process is shown in Figure 3.
Figure 3.
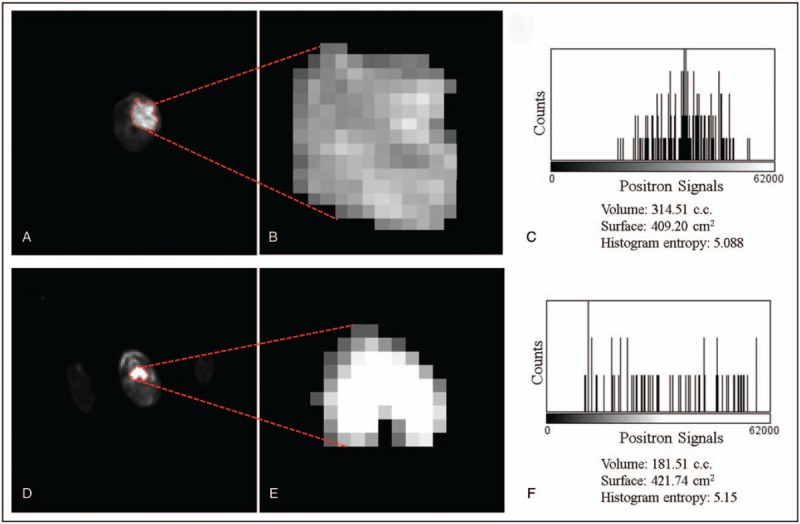
Two slices of PET which show the FDG uptake from 2 patients with oropharynx (A–C) and hypopharynx (D–F) tumors, respectively. A and D show the original PET images with the delineation (red dashed lines). B and E show the zoomed images of the segmented tumor. C and F show the histogram of the positron signal versus the photon counting. FDG = fluorodeoxyglucose, PET = positron emission tomography.
The 1st order features describe the intensity distribution inside the region of interest (ROI). They are often calculated using the intensity histogram, including mean intensity value, maximum and minimum intensity values, standard deviation, skewness, kurtosis, uniformity, and entropy.[11] With the extension of the intensity histogram concept, the intensity-volume histogram (IVH) simplifies the 3-dimensional information into a curve which is easy to understand and analogous to the concept of dose-volume histogram widely used in radiotherapy treatment planning. One can easily obtain the correspondence between the volume and intensity value from the IVH. For example, I30 means the intensity value that 30% of the ROI volume is under it, V40 means the volume inside the ROI that is under 40% of the maximum intensity.[9]
The GLCM-based features are 2nd order features, initially proposed by Haralick and Shanmugam[6] and Haralick [14] and introduced into 3-dimensional clinical image data by Liang.[15] The matrix is generated using the intensity relationship in the proximity space in the ROI. In this study, the intensity values in PET image data were binned into 256 levels, which defined the 2-dimensional co-occurrence matrix to be 256 × 256 in dimension. The co-occurrence matrix was calculated in 13 directions in the 3-dimensional PET data and the final matrix was an average over the 13 directions and converted to a probability matrix. All the GLCM-based features were calculated using the probability matrix. The 2nd order features based on GLCM include entropy, uniformity, contrast, homogeneity, and correlation, etc.[13,16] RLM is an L × R matrix, with L being the number of gray levels (256 in this study) and R being the possible runs which should be case dependent. A run is defined as the group of voxels with the same gray level in a certain direction. It was calculated in 13 directions in the 3-dimensional PET data. The final matrix is normalized for the feature calculation.
GLSZM and neighborhood gray-tone difference matrix (NGTDM)-based features are also 2nd order features. Similar to GLCM and RLM, these matrices are also based on the intensity relationship between neighboring voxels in ROI, but different relationship is used. The features include coarseness, contrast, busyness, and complexity, where coarseness is a feature similar to granularity, contrast describes the intensity variation range and regional intensity variation, busyness is related to intensity variation rate, complexity is the sum of the normalized intensity variation.[17]
This study applied statistical image feature analysis to calculate 6 categories of image texture features in PET images including intensity-based, co-occurrence, run-length, gray-level size-zone, NGTDMs based features and fractal dimension features, 94 features in total (Table 2).
Table 2.
Features.

3. Statistical analysis
The texture features were examined if they followed normal distribution using Kolmogorov–Smirnov test. Those that followed normal distributions were analyzed using one-way analysis of variance, ANOVA, and independent samples T test to evaluate if the feature average values differed significantly between groups of tumor differentiations, tumor stages, treatment responses, and recurrences. Kruskal-Wallis test and Mann–Whitney U test were applied to those non-normal distributed features to examine if the median values differed significantly between the groups. Receiver operating characteristic (ROC) curves using different MTVs were generated for feature values. The typical feature groups that had discrimination power for tumor differentiation and/or tumor stage were selected, and the cut values that best distinguishing the groups were obtained from the ROC curve analysis. Kaplan–Meier survival analysis was performed using the cut values to evaluate if the differences in OS, DFS, and PRFS were significant or not between the patient groups with feature value higher/lower than the cut values. The P value less than .05 was considered to indicate a significant difference in all statistical methods.
4. Results
Using MTV2.5, 4 features had significant differences between groups of tumor differentiations, while with MTV3.0, only 1 feature, and no feature when MTV40% and MTV50% were used. Figure 4 shows the distribution values of the 4 features that had the discriminatory power with MTV2.5.
Figure 4.
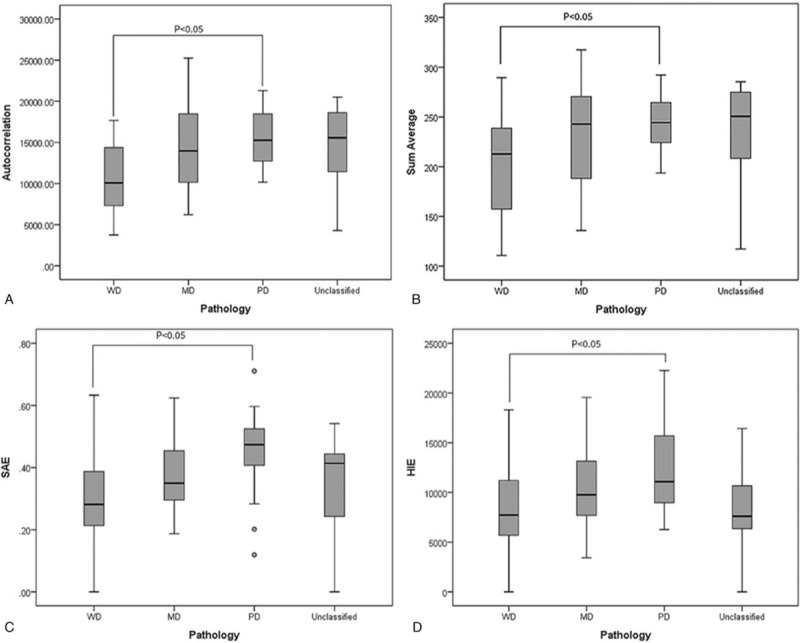
Features that had significant differences between different tumor differentiation groups in MTV2.5. (A) Coefficient of variance (B) Sum average (C) Small Area Emphasis (SAE), (D) High Intensity Emphasis (HIE). WD = well differentiated, MD = moderately differentiated, PD = poorly differentiated.
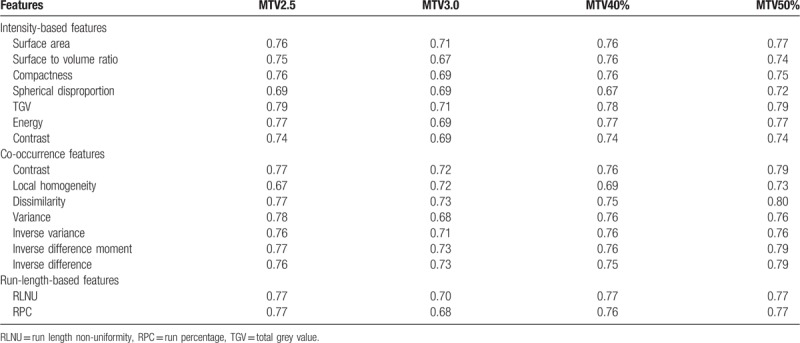
In the tumor stage analysis, this study used the feature values of the primary tumor volume and compared with the T stage results to look for the features that had significant differences between early stages (T stage = 1 or 2) and late stages (T stage = 3 or 4). There were 29 features that had significant differences. Additionally, ROC curves were applied to determine the discriminatory power. The area under curve (AUC) was used to quantitatively judge the power, with less than 0.6 being poor, between 0.6 and 0.75 being moderate, greater than 0.75 being high. Table 3 lists the features with moderate or high discriminatory power, 16 in total.
Table 3.
Features that had moderate or high discrimination power for tumor stages (early or late).
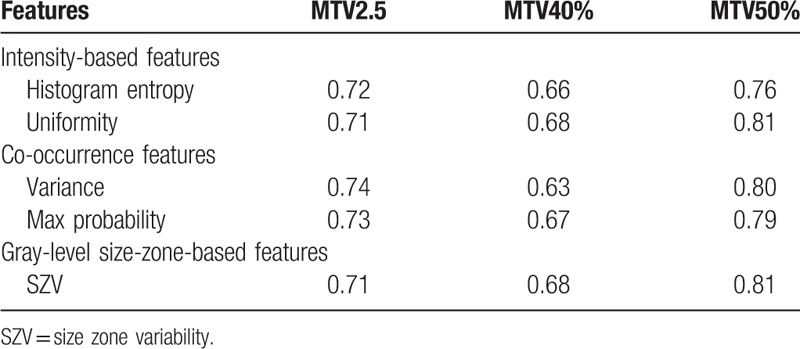
To avoid the effects of different medicine treatments and degree of seriousness of the lesion on the treatment response, those treated with Cisplatin chemotherapy combined with radiotherapy, and having an SUV value higher than 7 in the primary tumor were selected from the 80 cases, for a total of 48 cases. Except for MTV3.0, a few features were found to have significant differences between groups of complete response and partial response in MTV2.5, MTV40%, and MTV50%. Table 4 lists those features with the AUC values in the ROC analysis.
Table 4.
Features that predict treatment response.
In the recurrence analysis, there were 26 features that can be used to predict the recurrence risk with MTV2.5. With MTV3.0 and MTV40%, only 1 feature each was found, which were inverse variance (AUC = 0.70) and V10-V90 (AUC = 0.74), respectively. Two features, V10-V90 (AUC = 0.73) and coarseness, could be used to predict recurrence risk when MTV50% was used. Inverse variance was also in the features with MTV2.5 (AUC = 0.71). Figure 5 shows inverse variance and V10-V90 in ROC analysis for recurrence.
Figure 5.
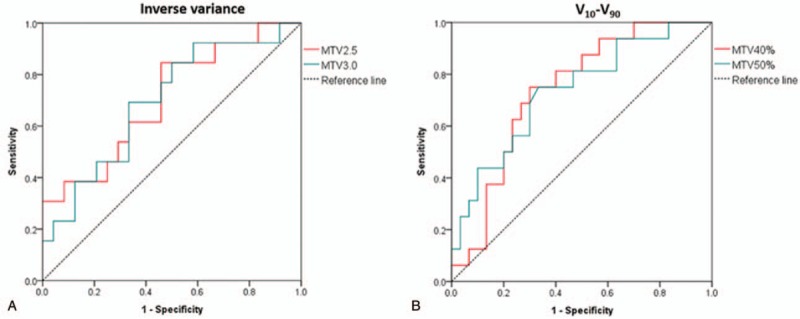
ROC curves in recurrence analysis. (A) Inverse variance and (B) V10-V90. ROC = receiver operating characteristic.
In the prognosis analysis, Kaplan–Meier survival analysis shows a common feature, histogram entropy, which has OS prediction power when MTV2.5 or MTV40% was used. The OS difference between the groups of greater/lower than the cut value of the feature was significant. Variance was the common feature for MTV2.5 MTV50%. When the variance value was higher than the cut point, the OS rate was lower than the group with the variance value lower than the cut point. Features SZV and V10-V90 were also common for MTV40% and MTV50% for OS prediction. Figure 6 shows the OS curves for features histogram entropy and variance.
Figure 6.
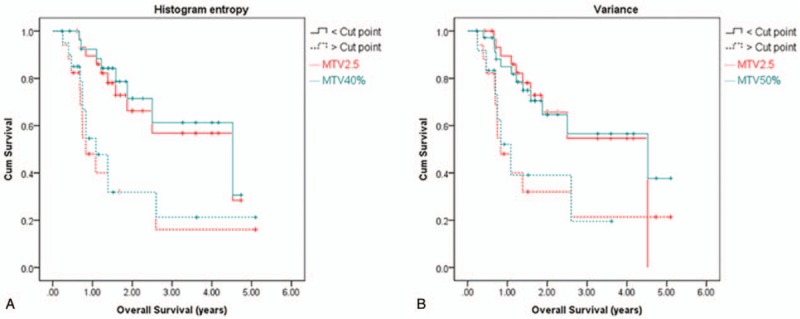
Overall survival curves. (A) Histogram entropy and (V) variance.
In the PRFS counterpart, feature histogram entropy demonstrated significant differences for all 4 MTVs, while feature variance showed differences for 3 of the 4 MTVs (MTV2.5, MTV3.0, and MTV50%). Feature SZV was significant for 2 of the 4 MTVs (MTV2.5 and MTV3.0), and V10-V90 for another 2 MTVs (MTV40% and MTV50%). Figure 7 shows the PRFS curves with feature histogram entropy for different MTVs.
Figure 7.
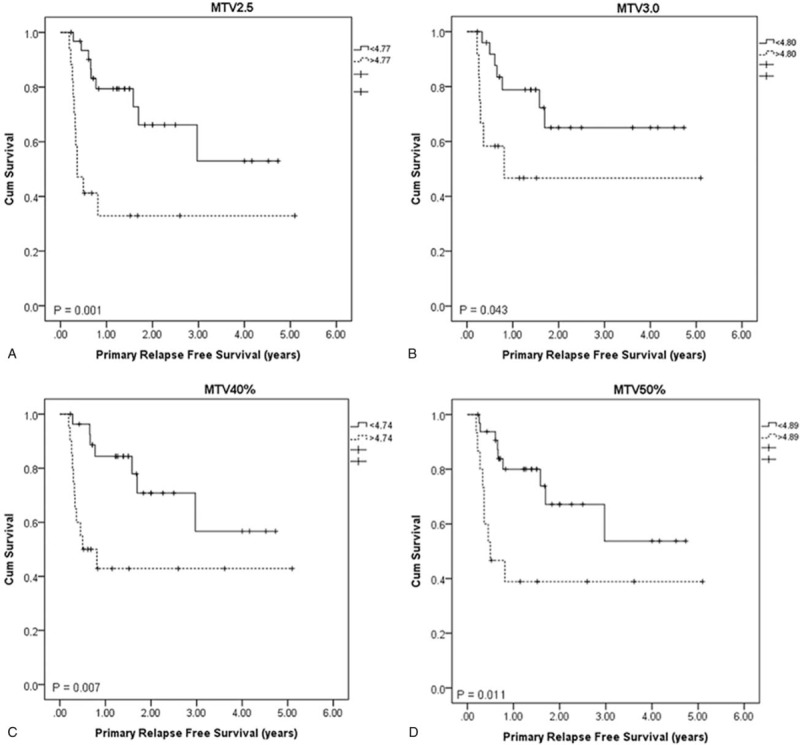
PRFS curves with feature histogram entropy. (A) MTV2.5 (B) MTV3.0 (C) MTV40% (D) MTV50%. PRFS = primary relapse free survival.
5. Discussion
In this study, to statistically select proper image features as image biomarkers that correlate well with tumor differentiation, tumor stage, and prognosis for oropharyngeal and hypopharyngeal cancer, radiomics features in 6 categories were extracted via image processing techniques. As demonstrated by the results, there were no common features that correlated well with the tumor differentiation over all the different definitions MTV. However, as shown in Figure 4, the features that showed significant differences between the WD and PD groups were those heterogeneity descriptors. The heterogeneity inside ROI should be highly correlated to the degree of tumor differentiation, with higher heterogeneity for poorly differentiated tumors and lower for well differentiated.
In the correlation analysis between tumor T stage and image feature, 16 features were found that were able to distinguish between early (T1 and T2) and late (T3 and T4) stages. However, no feature was found to further distinguish individual stages. The possible reason for this is that image features are more on the intensity variation pattern side while the traditional T staging is just based on the tumor size. Some of the features that had good correlation to T stage, such as surface area, which is the tumor total surface area, surface to volume ratio, which gives the ratio of surface area to volume, and compactness, which describes the tumor shape, are indirectly related to the tumor size. Some other features, such as entropy, local homogeneity, and dissimilarity, fundamentally describe the intensity variations and are not closely related to the tumor size. The correlation between those features to tumor size should not be strong enough to distinguish the individual stages in detail. Using a support vector machine (SVM) with a radial basis function kernel combines and maps the features into a nonlinear high dimensional function. This in turn achieves a higher AUC of 0.81 for tumor stage analysis using leave-one-out cross-validation (LOOCV). The best features picked for the classification task were dissimilarity and Run Percentage under MTV2.5 combined with contrast and variance under MTV40%. The SVM model fitted with the original data using all features was tested with 10 new patient data, and the resulting AUC was 0.75.
In the prognosis prediction analysis, image features were found to have prediction power in all MTV definitions except for MTV3.0. This was especially the case for MTV50% in which all 5 features had discriminatory powers over 0.75 (Table 4), while only moderate discrimination power was obtained for MTV2.5 and MTV40%. In the recurrence analysis, no common feature that correlated in all 4 MTV definitions was found, while a common feature, inverse variance, was found between MTV2.5 and MTV3.0 and another common feature, V10-V90, between MTV40% and MTV50% (Fig. 5). Using SVM, the features could be used individually or combined to reach an AUC of 1.0 using LOOCV. Using the model created by SVM fitting on all the features and the original data, testing a new set of 5 patients out of the 10 that fit the criteria of SUV greater than 7 and underwent cisplatin chemotherapy combined with radiotherapy, an AUC of 0.875 was achieved, with only 1 new patient incorrectly classified.
In the OS and PRFS analysis, a common feature was found to correlate with OS for MTV2.5 and MTV40% and another feature for MTV2.5 and MTV50% (Fig. 6). A common feature was found to correlate with PRFS for all the 4 MTV definitions (Fig. 7). The feature histogram entropy was found to correlate with both OS and PRFS. This feature describes the complexity of the intensity variation inside ROI, with higher value representing higher degree of complexity or higher degree of heterogeneity. Based on the analysis, patients with higher than the cut point of this feature had a lower OS or PRFS than those with lower feature value. In this study, feature V10-V90 was found to correlate OS and PRFS for MTV50%, which contradicts with the study by Naqa et al.[9] In their study, this feature had a very low correlation with OS (Spearman's rank correlation = 0.087) and the AUC of the ROC was 0.5. This difference could mostly be due the difference in patient population distribution. Only 9 oropharyngeal and hypopharyngeal cases were studied by Naqa et al[9] while 48 cases were studied in our analysis.
Additionally, the correlation between the 4 MTV definitions and the primary tumor volume delineated by clinical physicians was performed. The correlation between the delineated gross tumor volume (GTV) and MTV2.5, MTV3.0, MTV40%, MTV50% was 0.62, 0.54, 0.73, and 0.73, respectively, (P < .001). Except MTV3.0, all other 3 MTV definitions had a moderate and above correlation with GTV, which indicates that the 3 MTV definitions are closely similar to the real GTV and the extracted features can approximately represent those from the GTV. Because of the lower correlation between MTV3.0 and GTV, the image features from MTV3.0 cannot represent what from the GTV. This could be the reason that significant differences of feature values between the patient groups were hard to find for MTV3.0. MTV40% and MTV50% showed highest correlation to GTV, and features from MTV50% showed highest tumor stage and prognosis prediction power. Based on Table 3, feature dissimilarity as a discriminator of tumor stage, its AUC was 0.80, higher than that of MTV2.5 (AUC = 0.77). In prognosis analysis, features uniformity, variance, and SZV from MTV50% were obviously higher than those from MTV2.5 (Table 4). In the recurrence prediction, feature V10-V90 from MTV50% and MTV40% had similar power, with AUC being 0.73 and 0.74, respectively. Clinically, it is thus recommended that features dissimilarity, uniformity, variance, and SZV based on MTV50% can be used as tumor stage and prognosis predictors.
In this study, image features were extracted from PET images of oropharyngeal and hypopharyngeal cancer cases. Features as indicators in tumor differentiation, tumor stage and predictors in treatment outcome, prognosis were selected. Feature value varies with ROI, which makes it difficult to find common indicators and predictors with different ROIs. Image features, representing various characteristics of the ROI, such as heterogeneity, can be obtained via noninvasive methods, which provide advantages in clinical applications and the clinical application potential is high. The disadvantage in this study is that the number of cases recruited is still a little bit too small. With such a relatively small sample size, the numbers of cases in the subgroups, such as stages and differentiations, were very different. In the future, more cases will be recruited to enhance the confidence of the study.
6. Conclusions
In this study, PET image features from oropharyngeal and hypopharyngeal cancer cases were applied in correlation analysis with clinical tumor characteristics and prognosis after radiotherapy combined with chemotherapy. The results indicated that 16 image features demonstrated significant differences between early and late stages in various MTV definitions; 5 and 2 features had AUC in ROC greater than 0.7 for prediction of treatment response and recurrence, respectively, indicating good predictors; feature histogram entropy correlated with both OS and PRFS well. Image features have clinical potential in tumor phenotypic diagnosis, staging, prediction of treatment response, recurrence, and OS and PRFS in oropharyngeal and hypopharyngeal cancer prognosis.
Author contributions
Conceptualization: Ken Ying-Kai Liao, Chuang-Chien Chiu, Wan-Chi Chiang, Geoffrey Zhang, Shih-Neng Yang, Tzungchi Huang.
Data curation: Ken Ying-Kai Liao, Wan-Chi Chiang.
Investigation: Yu-Rou Chiou, Geoffrey Zhang.
Methodology: Chuang-Chien Chiu, Yu-Rou Chiou.
Software: Ken Ying-Kai Liao.
Supervision: Tzungchi Huang.
Validation: Ken Ying-Kai Liao, Chuang-Chien Chiu, Wan-Chi Chiang.
Writing – original draft: Ken Ying-Kai Liao, Tzungchi Huang.
Writing – review & editing: Ken Ying-Kai Liao, Chuang-Chien Chiu, Tzungchi Huang.
Footnotes
Abbreviations: 18F-FDG = fluorodeoxyglucose, AUC = area under curve, CT = computed tomography, DFS = disease free survival, DVH = dose-volume histogram, GLCM = gray level co-occurrence matrix, GLNU = gray level non-uniformity, GLSZM = gray level size zone matrix, GTV = gross tumor volume, HIE = high intensity emphasis, IRB = institutional review board, IV = intensity variability, IVH = intensity-volume histogram, LOOCV = leave-one-out cross-validation, LRE = long run emphasis, MD = moderately differentiated, MTV = metabolic tumor volume, NGTDM = neighborhood gray-tone difference matrix, OS = overall survival, PD = poorly differentiated, PET = positron emission tomography, PRFS = primary relapse-free survival, RBF = radial basis function, RLM = run length matrix, RLNU = run length non-uniformity, ROC = receiver operating characteristic, ROI = region of interest, RPC = run percentage, SAE = small area emphasis, SD = standard deviation, SRE = short run emphasis, STARD = standard for reporting diagnostic accuracy, SUV = standardized uptake value, SUVmean = mean SUV value, SVM = support vector machine, SZV = size zone variability, T1 = tumor stage 1, T2 = tumor stage 2, T3 = tumor stage 3, T4 = tumor stage 4, WD = well-differentiated, ZP = zone percentage.
C-CC and W-CC contributed equally to the article.
This study was financially supported by China Medical University Hospital (DMR-106-060) and Chang Bing Show Chwan Memorial Hospital (RD107041).
The authors have no conflicts of interest to disclose.
References
- [1].Chung CH, Levy S, Chaurand P, et al. Genomics and proteomics: emerging technologies in clinical cancer research. Crit Rev Oncol Hematol 2007;61:1–25. [DOI] [PubMed] [Google Scholar]
- [2].Shreve P, Townsend DW. Clinical PET-CT in radiology: integrated imaging in oncology. New York, NY: Springer-Verlag; 2010. [Google Scholar]
- [3].Gupta T, Jain S, Agarwal JP, et al. Diagnostic performance of response assessment FDG-PET/CT in patients with oropharyngeal and hypopharyngeal squamous cell carcinoma treated with high-precision definitive (chemo) radiation. Radiother Oncol 2010;97:194–9. [DOI] [PubMed] [Google Scholar]
- [4].Higgins KA, Hoang JK, Roach MC, et al. Analysis of pretreatment FDG-PET SUV parameters in oropharyngeal and hypopharyngeal cancer: tumor SUV mean has superior prognostic value. Int J Radiat Oncol Biol Phys 2012;82:548–53. [DOI] [PubMed] [Google Scholar]
- [5].Kumar V, Nath K, Berman CG, et al. Variance of standardized uptake values for FDG-PET/CT greater in clinical practice than under ideal study settings. Clin Nuclear Med 2013;38:175. [DOI] [PMC free article] [PubMed] [Google Scholar]
- [6].Haralick RM, Shanmugam K. Textural features for image classification. IEEE Transactions on Systems, Man, and Cybernetics 1973. 610–21. [Google Scholar]
- [7].Davnall F, Yip CS, Ljungqvist G, et al. Assessment of tumor heterogeneity: an emerging imaging tool for clinical practice? Insights Imaging 2012;3:573–89. [DOI] [PMC free article] [PubMed] [Google Scholar]
- [8].Chicklore S, Goh V, Siddique M, et al. Quantifying tumour heterogeneity in 18 F-FDG PET/CT imaging by texture analysis. Eur J Nucl Med Mol Imaging 2013;40:133–40. [DOI] [PubMed] [Google Scholar]
- [9].El Naqa I, Grigsby P, Apte A, et al. Exploring feature-based approaches in PET images for predicting cancer treatment outcomes. Pattern Recognition 2009;42:1162–71. [DOI] [PMC free article] [PubMed] [Google Scholar]
- [10].Tixier F, Le Rest CC, Hatt M, et al. Intratumor heterogeneity characterized by textural features on baseline 18F-FDG PET images predicts response to concomitant radiochemotherapy in esophageal cancer. J Nucl Med 2011;52:369–78. [DOI] [PMC free article] [PubMed] [Google Scholar]
- [11].Vaidya M, Creach KM, Frye J, et al. Combined PET/CT image characteristics for radiotherapy tumor response in lung cancer. Radiother Oncol 2012;102:239–45. [DOI] [PubMed] [Google Scholar]
- [12].Shih-Neng Yang, Yu-Rou Chiou, Geoffrey G, et al. The clinical outcome correlations between radiation dose and pretreatment metabolic tumor volume for radiotherapy in oropharyngeal and hypopharyngeal cancer. Medicine (Baltimore) 2017;96:e7186. [DOI] [PMC free article] [PubMed] [Google Scholar]
- [13].Cook GJ, Siddique M, Taylor BP, et al. Radiomics in PET: principles and applications. Clin Transl Imag 2014;3:269–76. [Google Scholar]
- [14].Haralick RM. Statistical and structural approaches to texture. Proc IEEE 1979;67:786–804. [Google Scholar]
- [15].Liang M. 3D co-occurrence matrix based texture analysis applied to cervical cancer screening. [master's thesis]. Uppasala, SE: Uppasala University; 2012. [Google Scholar]
- [16].Oliver JA, Budzevich M, Zhang GG, et al. Variability of image features computed from conventional and respiratory-gated PET/CT images of lung cancer. Transl Oncol 2015;8:524–34. [DOI] [PMC free article] [PubMed] [Google Scholar]
- [17].Amadasun M, King R. Textural features corresponding to textural properties. IEEE Transactions on Systems, Man, and Cybernetics 1989;19:1264–74. [Google Scholar]


