 Carbon quantum dots (CQDs) and their derivatives have potential applications in the field of biomedical imaging.
Abstract
Carbon quantum dots (CQDs) and their derivatives have potential applications in the field of biomedical imaging. Toxicity is one of the critical parameters that can hamper their success in biological applications. In this context, our goal was to systematically investigate both in vivo and in vitro toxicity of nitrogen doped carbon quantum dots (NCQDs). In vivo toxic effects were evaluated for 30 days in Swiss albino mice at two different concentrations (5.0 mg per kg body weight (BW) and 10.0 mg per kg BW) of NCQDs. Results of haematological, serum biochemical, antioxidant and histopathological parameters showed no noteworthy defects at both of these concentrations. An in vitro assessment was performed against the human cervical cancer cell line (HeLa cells) at the concentration of 0–400 μg ml–1. The LDH profile, DNA fragmentation, apoptosis, and growth cycle of cells showed no apparent toxicity of NCQDs. The overall study offers highly biocompatible N-doped carbon quantum dots, which may be considered as an attractive material for future biomedical applications.
Introduction
The potential use of different fluorescent nanomaterials as theranostic (therapeutic and diagnostic) agents in the biomedical field is of great interest.1–6 During the last few decades, semiconductor quantum dots (QDs) have gained wide popularity in different research areas such as sensors, photovoltaics, electronic/optoelectronic devices and in vitro/in vivo diagnostics.7–14 Unfortunately, they have also been the object of criticism of late, due to their inherent constituent of heavy metal elements, which is responsible for their low stability, a gamut of environmental hazards and their potential toxicity to biological systems. In the meantime, a new class of QDs of carbon, i.e. CQDs, came into focus serendipitously during purification of SWCNTs through electrophoresis in 2004,15 and have become popular in nanocarbon research due to their favourable attributes such as abundant and inexpensive nature and superior electronic characteristics leading to their high possibilities in applications like optoelectronics, catalysis and sensors.16,17 Due to their excellent electrochemical luminescence properties, high solubility, resistance to photo bleaching, and negligible toxicity, CQDs have attracted the interest of several research groups as an attractive material for diverse biological and non-biological applications.18–21 Although carbon is not considered to be an intrinsically toxic element, the enhanced surface area and functional groups of C-dots may pose potential risks that can hamper the success of CQDs in bioimaging and biomedical applications.
Various toxicological studies have been conducted in different carbon nanomaterials in the last few years and the results were inconspicuous.22,23 Chong et al. have studied in vitro and in vivo the toxicity of GQDs as well as GO, and found GQDs biocompatible, while GO shows toxicity in mice.24 Blood parameter analysis is also a major contributory factor towards toxicity evaluation of any material. It has been reported that the haemolysis rate and rheological alterations of red blood cells (RBC) were insignificant at concentrations less than 500 μg ml–1.25 Recently, hydrothermally synthesized carbon dots (CDs) were reported to show minimal cytotoxicity on MDCK and HeLa cells.26 An in vitro study on mouse fibroblast (NIH/3T3) cells claimed that negatively charged CDs arrested the G2/M phase of the cell cycle, stimulated proliferation and enhanced oxidative stress, while neutral CDs did not induce any abnormalities in cells at concentrations up to 300 μg ml–1.27 Most of the toxicology studies showed CQDs to be minimally toxic at different concentrations.28,29 The results from these studies necessitated further in vitro and in vivo cytotoxicity evaluation; however, there has not been a single study reported so far which has sufficiently demonstrated the phenomena of in vitro cyto- and genotoxicity of CQDs, including a thorough analysis of haematological, biochemical and histopathological analysis in vivo.
Doping creates additional functionalities on the surface of CQDs. Data on the impact of doping on the toxicity of CQDs are scarce. P-Doped CQDs synthesised via the solvothermal method have demonstrated low cell toxicity.27 Over the last few years, derivatives of CQDs (doped counterpart) have gained wide popularity due to enhanced fluorescence for bioimaging applications. However, only a small number of toxicological evaluations of NCQDs have been reported. Therefore, to understand the toxicity of CQDs and their derivatives further investigation is needed. To the best of our knowledge, this is the first ever study conducted to report a systemic biodistribution and toxicity evaluation of NCQDs obtained through microwave irradiation via in vivo and in vitro approaches.
The present study significantly emphasized economical and benign synthetic routes for the bulk volume of NCQDs by microwave irradiation. The NCQDs were synthesized by carbonization of the organic precursor via pyrolysis, ultimately retaining basic carbon containing residues with nitrogen groups. The NCQDs (5.0 mg per kg BW and 10 mg per kg BW) were administered in vivo while NCQDs at concentrations up to 400 μg ml–1 were administered to HeLa cells. Biochemical, histopathological, haematological, cell cycle and cell apoptosis parameters were analysed.
Experimental
Materials
d-Glucose was purchased from Sigma Aldrich, Bangalore, India. Dulbecco's modified Eagle's medium (DMEM), trypsin, RNase and foetal bovine serum (FBS) were purchased from Himedia Laboratories, Mumbai, India. Antibiotics such as penicillin and streptomycin were procured from Life Technologies (India) Pvt. Ltd, Delhi, India. Acridine orange (AO), ethylene diamine (EDA), glacial acetic acid, sulphuric acid, sodium hydrogen phosphate, sodium dihydrogen phosphate, diethyl ether, propidium iodide, ethidium bromide (EtBr), agarose and DMSO were purchased from Merck, Mumbai, India. 3-[4,5-Dimethylthiazol-2-yl]-2,5-diphenyltetrazolium bromide (MTT), alanine transaminase (ALT), aspartate aminotransferase (AST), alkaline phosphatase (ALP) enzyme activity assay kits and 2′,7′-dichlorofluorescin diacetate (DCFH-DA) were obtained from Sigma Aldrich, India. EDTA-coated and non-coated tubes were procured from a medical shop from a local market in Varanasi. All chemicals and reagents utilized were of analytical grade and used as such without further purification. All solutions were prepared using Milli-Q water.
Synthesis of nitrogen doped carbon quantum dots (NCQDs)
The NCQDs were synthesized by the microwave irradiation method. 500 mg of d-glucose was dissolved in 10 mL Milli-Q water to make a uniformly dissolved solution. 1 mL of ethylene diamine was added to the solution. The pH of the solution was adjusted to pH 7 utilising acetic acid. This solution was then irradiated by microwave radiation for 10 minutes in a domestic 700 W microwave oven (IFB, 17PM-MECI). Finally, a dark brown colour solid was obtained after carbonization. To further study NCQDs, NCQDs were dissolved in Milli-Q water and centrifuged at 40 000 rpm for 10 minutes to avoid untreated moieties and agglomerated particles.
Characterization of nitrogen doped carbon quantum dots (NCQDs)
A transmission electron microscope (TEM, Tecnaii-G2F30 STWIN) operated at an accelerating voltage of 200 keV was used for the structural characterization of NCQDs. The UV-visible absorbance spectra of NCQD solutions were measured with a PerkinElmer UV-Visible-Lambda 25 spectrophotometer. Fourier transform infrared (FT-IR) spectra were recorded on a FT-IR spectrometer (NICOLET 6700, Thermo Fisher Scientific, USA). The photoluminescence (PL) spectra were recorded with the help of a fluorescence spectrophotometer (PerkinElmer). The elemental analysis of the NCQDs was performed using an X-ray photoelectron spectroscope (XPS) (Omicron EA 125) and the result has been published (ESI Fig. S1†).16
Quantum yield measurement
The quantum yield of NCQDs was calculated by measuring the fluorescence intensity in aqueous dispersion using the following equation where quinine sulphate in 0.1 M H2SO4 (literature quantum yield 0.54 at 360 nm) was used as a standard reference, where ‘φ’ is the quantum yield, ‘I’ is the intensity of luminescence spectra, ‘A’ is the absorbance at the excited wavelength and ‘η’ is the refractive index of the solvent used. The subscript ‘R’ is used in the equation to denote reference. The quantum yield of NCQDs was measured at an excitation wavelength of 360 nm, and the yield was found to be 35.76%.
In vitro analysis
Cell culture
The HEK 293, HePG2, A549 and HeLa cells were maintained at 37° C under 5% CO2 in RPMI-1640 supplemented with 10% foetal bovine serum, penicillin (100 U ml–1) and streptomycin (100 mg ml–1).
Cell viability assay
The MTT assay was employed to evaluate the cell viability of HEK 293, HePG2, A549 and HeLa cell treated with NCQDs. Briefly, HeLa cells were seeded in each well of a 96-well plate at a density of 1 × 10⁴ cells per well, and cultured in a humidified 5% CO2 incubator at 37 °C for 24 h. The cells were then treated with NCQDs at various test concentrations (0, 6.5, 12.5,50, 100, 200, and 400 μg ml–1) in culture medium, and cells cultured without NCQDs acted as the control. Thereafter, 20 μl of a 5 mg ml–1 MTT solution was added to each well. The cells were further incubated for another 4 hours. After incubation, the culture medium with MTT was removed and 100 μl of DMSO was added. The resulting mixture was then shaken for 10 min at room temperature. Finally, the optical density (OD) of the mixture was measured at 450 nm using a spectrophotometer (PerkinElmer Victor 4 microplate reader). The cell viability was estimated according to the following equation: where ODc was the absorbance value estimated from cells in the absence of NCQDs and ODt was the absorbance estimated in the presence of NCQDs.
In vitro LDH release and oxidative stress test
For the LDH (lactate dehydrogenase) assay, HeLa cells seeded in a 96-well plate were incubated with different concentrations (0, 6.5, 12.5, 50.0, 100.0, 200.0, and 400.0 μg ml–1) of NCQD at 37 °C for 24 h, and then 1 mL of LDH standard solution was added to the supernatant of cells and the absorbance of the supernatant was examined at 490 nm to analyse the level of LDH release.
ROS (reactive oxygen species) were measured with a procedure similar to the LDH assay. After incubating with NCQDs at various concentrations, the cells were washed three times and mixed with 1 mL of 10 mM DCFH-DA for an additional incubation for 20 min. Next, the cells were washed three times with DMEM without FBS to eliminate the DCFH-DA outside the cell membrane, and then collected in suspension and measured with a flow cytometer (excitation at 488 nm and emission at 525 nm).
Haemolytic analysis
Haemolytic activities of NCQDs were evaluated by detecting the haemoglobin release from human red blood cells. 2 ml of human blood was collected from healthy donors after written consent and ethical approval from the Human Ethical Committee, Institute of Medical Sciences, Banaras Hindu University, and Varanasi, India. The blood was centrifuged at 3000 rpm at 4 °C for 10 min and washed three times with PBS solution (pH 7.4). Red blood cells (RBCs) were obtained and the previous volume was maintained using PBS solution. Then, the RBC suspension was diluted ten times to a concentration of 10% (v/v) with PBS. Furthermore, 1.5 mL of the RBC suspension was taken in 8 autoclaved 2 ml centrifuge tubes. Then 0.5 ml of 1.6 mg ml–1 NCQDs were added to 6 tubes to maintain 400 μg ml–1 final concentration and the remaining 2 tubes were taken as controls. PBS solution and distilled water were used as the negative (0% lysis) and positive (100% lysis) controls, respectively. The RBC suspensions were incubated at 37 °C for different time intervals, namely 0, 1, 3, 6, 12 and 24 hours, respectively. Subsequently, all the suspensions were centrifuged at 3000 rpm at 4 °C for 10 min, and the absorbance at 541 nm was taken using a UV–Vis spectrophotometer. The percentage haemolysis was expressed by the formula given below. where Asample, Anegative, and Apositive represent the absorbance of the samples and negative and positive controls, respectively.
Cell apoptosis detection
Morphological analysis of apoptosis was performed by the acridine orange(AO)/ethidium bromide (EtBr) dual staining procedure.30 Briefly, HeLa cells at a concentration of approximately 1 × 10⁵ cells were seeded in a 96-well plate and incubated with different concentrations (0, 50.0, 100.0, 200.0 and 400.0 μg ml–1) of NCQDs at 37 °C for 24 h. After incubation, the plates were centrifuged. 10 μl of 1 mg ml–1 AO and EtBr mixture was added to each well. Nuclei were visualized and photographed under the fluorescent microscope. On the 30th day, splenocytes of the control, group I, and group II were also spotted via AO/EtBr double staining.30
Cell cycle analysis
HeLa cells (1 × 10⁵) were treated with different concentrations (0, 50.0, 100.0, 200.0, and 400.0 μg ml–1) of CQDs for 24 h. After incubation, the cells were trypsinized and suspended in ice-cold ethanol (70%) and stored at –20 °C for 4 h. The cells were washed with PBS, and suspended in 250 μL of PBS. 10 μL propidium iodide (1 mg ml–1) and 10 μl RNase A (10 mg ml–1) were added and the mixture was incubated at room temperature in the dark for 30 min. The cell cycle distribution was analysed using an FACSCalibur instrument (Becton Dickinson). Data were analysed using FACSDiva 6.1 software.
Animal studies in Swiss albino mice
Maintenance of experimental mice
All the in vivo experiments were carried out in compliance with the institutional ethics committee regulations and guidelines on animal welfare (Animal Care and Use Program Guidelines of IMS, BHU), and were approved by the Government of India. 3–4 week old male Swiss albino mice (∼22 g) were procured from the animal house of Institute of Medical Science, BHU. Mice were kept in cages (three mice per cage) and maintained under a 12 : 12 hour light and darkness photo period. Mice were fed with ad libitum and water.
Weekly body weight
A sensitive balance method was adopted to measure the body weight of each mouse during the acclimatization period as well as the whole experimental duration after NCQD administration as after 24 hours.31
Acute toxicity evaluations
Forty-five (45) adult male Swiss albino mice (∼22 g) were divided into three different groups, Group-I (control), Group-II (treated) & Group-III (treated) consisting of 15 mice in each group. Different doses of 5.0 mg per kg BW and 10.0 mg per kg BW were administered via tail vein injections once to test the acute toxicity to groups II and III while the control group was treated with 0.9% saline solution. The body weights of the mice were monitored up to 30 days. At various time points (1, 3, 7, 15 and 30 days after exposure) mice were sacrificed. Blood samples were collected from each mouse for blood chemistry analysis and complete blood count (CBC). Statistical calculations were based on the standard error of 3 mice per group, once on the day of sacrifice.
Preparation of homogenates
Different organs (liver, kidney and spleen) were excised out on ice and cleaned with physiological saline. The tissues were used to prepare a 10% homogenate separately in 0.1 M phosphate buffer (pH 7.4) containing 0.1 mM EDTA using a motor driven Teflon-pestle homogenizer (Fischer), and centrifuged at 12 000 rpm for 5 min at 4 °C. The supernatant was collected and stored at –80° C for further assay.
Haematology study
A haematology and clinical chemistry study was performed on blood samples obtained during autopsy. Blood was collected in EDTA-coated tubes. The haematological parameters included white blood cell (WBC) count, red blood cell (RBC) count, haemoglobin (Hb), hematocrit (Ht), mean corpuscular volume (MCV), mean corpuscular haemoglobin (MCH), mean corpuscular haemoglobin concentration (MCHC), red blood cell distribution width (RDW), haemoglobin distribution width (HDW), platelet (PLT) count, and mean platelet volume (MPV). All haematology parameters in the blood samples were determined using an Advia 120 Haematology Analyser (Siemens, Germany). In addition, blood smears were prepared for visual evaluation.
Biochemical assay of serum
For serum analysis, the mice were anaesthetized using diethyl ether and decapitated at the 1st, 3rd, 7th, 15th and 30th day. The whole blood (1.0 ml) was collected in polypropylene tubes without the anti-coagulant ethylene diamine tetra acetic acid (EDTA). Simultaneously, the serum was separated by centrifugation of clotted blood (37 °C for 30 min) at 3000 rpm for 10 min from whole blood at 4 °C. The serum was used to measure the level of different enzymes including alanine aminotransferase (ALT), aspartate aminotransferase (AST), and alkaline phosphatase (ALP) using colorimetric assay kits from Beacon Pvt. Ltd, India.
Protein content analysis
The protein concentration was measured by the Bradford method using bovine serum albumin as a standard.32
Lipid peroxidation assay
The levels of lipid peroxidation (MDA) in different tissues were measured using TBA as described by Ohkawa et al.33
Antioxidant enzyme assay
10% homogenates of different tissues were prepared and processed for the estimation of the antioxidant enzyme SOD and catalase activity following a standard protocol described by Das34 and Sinha,35 respectively.
Histopathological analysis
The organs (liver, kidney and spleen) were surgically removed from the mice under diethyl ether anaesthesia. To determine the toxicity of the NCQDs, a histological analysis of organs was performed to determine whether the NCQDs caused tissue damage and/or any pathologic impacts such as inflammation or necrosis.
Skin toxicity test
A skin toxicity test was also performed in mice in order to check for sensitivity toward the NCQDs. For this study, two groups of Swiss albino mice (A and B) were selected with three mice in each group. The backs of the mice were shaven and disinfected with a 70% alcohol solution using a cotton swab. The first group was treated with 500 μl of Milli-Q water and the other group was treated with 500 μl of NCQDs (10 mg ml–1) for 3 successive days.
Statistical analysis
A statistical analysis was performed using SPSS 16.0 software. Data were expressed as the means ± SE. One-way analysis of variance (ANOVA) with p-values less than 0.05 was considered to be statistically significant.
Results and discussion
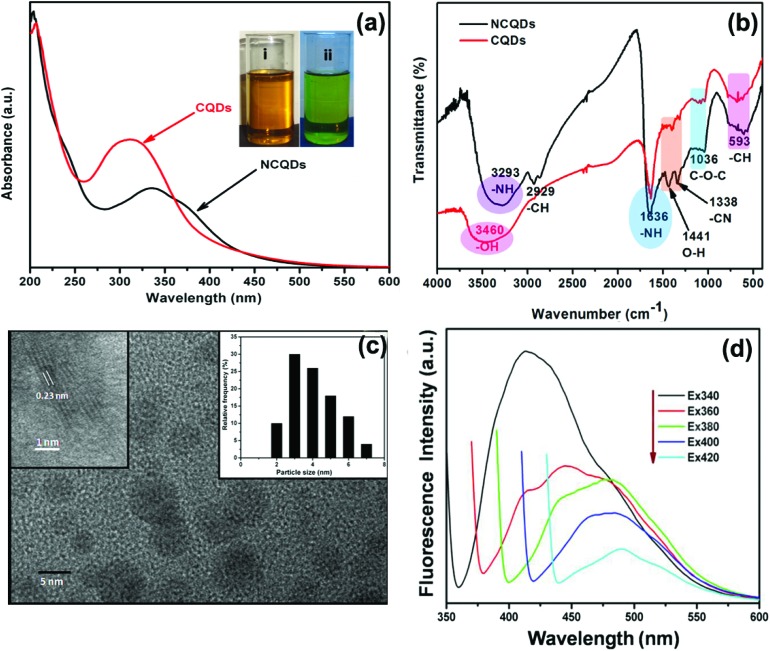
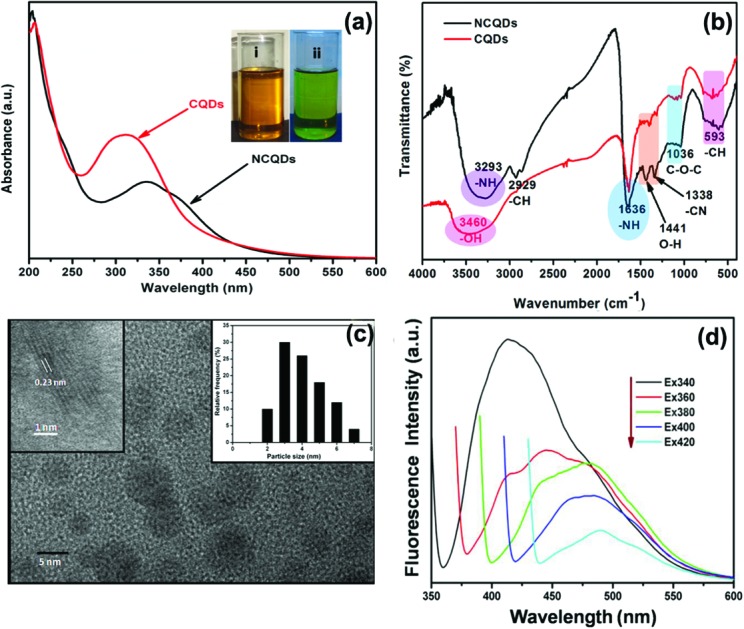
Carbon quantum dots, due to their versatile applications, have generated significant interest since their discovery in 2004 in the field of nanotechnology. A variety of research groups have published their work regarding CQDs, focussing on their synthesis and applications. However, their toxicity has proved to be a serious impediment towards their usage in the development of in vivo diagnostic applications and therapies. Very few reports have been published on the toxicity of carbon quantum dots.27,28 The purpose of this study is to present for the very first time a detailed analysis of in vitro and in vivo toxicity of nitrogen doped carbon dots. d-Glucose and EDA were taken as carbon and nitrogen sources, respectively, to synthesize nitrogen doped carbon quantum dots (NCQDs) rich in odd atoms via a microwave-assisted method. UV-Vis, FTIR, TEM and photoluminescence (PL) methods were carried out for the characterization of the NCQDs. TEM images of the as synthesized NCQDs via a microwave assisted method are shown in Fig. 1(c). The TEM image revealed that NCQDs are monodisperse in aqueous medium and possess spherical morphology with an average diameter of the order of ∼3.7 nm. High resolution transmission electron microscopy (HRTEM) images clearly reveal well resolved lattice fringes with a lattice spacing of about 0.23 nm corresponding to the (001) planes of graphitic carbon. FTIR studies were carried out to determine the functional groups present at the surface of the NCQDs. The spectra of the CQDs and NCQDs have been presented in Fig. 1(b) and possess several characteristic peaks. The peak at 3293 cm–1, 1636 cm–1 and 1338 cm–1 corresponds to stretching vibration of –NH, stretching vibration of amide-I and stretching vibration of –CN, respectively. In addition, the vibration peaks at absorption bands of 2929 cm–1, 1441 cm–1, 1036 cm–1 and 593 cm–1 could be ascribed to –CH (alkyl), –C O (carbonyl), and C–OH (hydroxyl), –C–O–C (epoxy) and C–H (alkyl) group vibrations respectively. Therefore, the FTIR study confirmed the presence of amine, acid and hydroxyl moieties on the surface of the synthesized N-CQDs. Further UV-visible and corresponding photoluminescence spectra of these NCQDs were recorded at neutral pH to understand the optical properties of the NCQDs (Fig. 1a). The aqueous solution of NCQDs is pale yellow in colour under day light while it emits green fluorescence under UV light, which can be easily observed with the naked eye (inset figure). The UV-visible absorption spectra reveal that NCQDs show a peak of approximately 334 nm the tail of which extends across the visible region. This could be attributed to π–π* transition and n–π* transition of the nonbonding electron of the nitrogen group or carbonyl groups passivating the NCQDs, respectively.16
Fig. 1. (a) TEM images, (b) FTIR spectrum and (c) UV-visible absorption spectrum (the inset shows the optical images of NCQDs in daylight and after being irradiated with a UV lamp at a wavelength of 356 nm and (d) excitation dependent PL spectra of NCQDs.
Generally, CQDs show relatively low quantum yields. Hence, doping with nitrogen (a heteroatom) was carried out to enhance the quantum yields of CQDs. It is evident from the XPS data (Fig. S1†) that N content was highly doped. Hence, it resulted in enhanced quantum yield of NCQDs which is equivalent to 35.76%. The most interesting feature of carbon dots is its photoluminescence. The classic signature of the carbon dots is wavelength dependent PL behaviour. Excitation dependence emission spectra of NCQDs at pH 7 have been recorded and presented in Fig. 1(d). A strong PL emission peak located at 413 nm was observed at an excitation wavelength of 340 nm. The fluorescence emission wavelength was also found to be red shifted with an increase of the excitation wavelength from 270 nm to 390 nm, which is evident from emission spectra shown in Fig. 1(d). The plausible reasons for the PL behaviour in carbon dots are variable particle size and different surface energy traps. The difference in the position of emission peaks with variable excitation wavelength is due to the variable size of the carbon dots. The energy gap of the carbon dots increases with the decrease in the particle size of carbon dots and vice versa due to quantum confinement. Hence, it is possible that smaller size CDs get excited at a lower wavelength, whereas those with a larger size get excited at higher wavelengths.36 It is also observed that the PL of CDs decreases as the wavelength increases, which can be attributed to the excitation of different size CDs at different wavelengths. Another reason for the excitation dependent PL behaviour can be ascribed to the presence of various functional groups on the surface of the CDs that result in a series of emissive traps.36
In vitro toxicity study
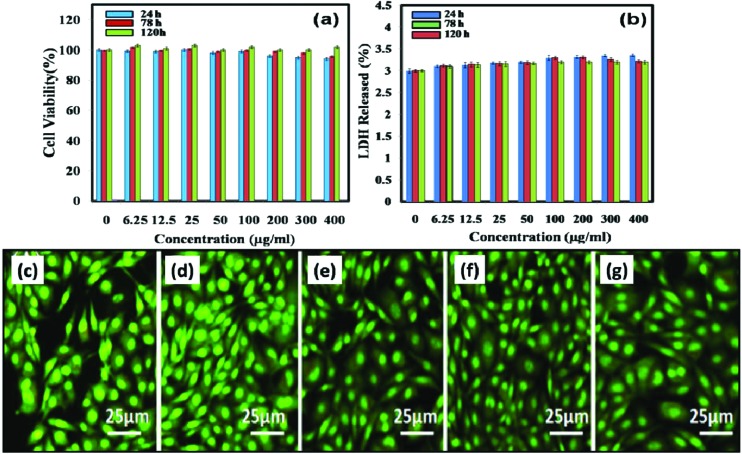
An in vitro cytotoxicity study was also carried out against the HeLa cell line at different concentrations of NCQDs (0, 6.5, 12.5, 50.0, 100.0, 200.0, and 400.0 μg mL–1) for 24 h, 78 h and 120 h. The cell viability was measured by the MTT assay. The cell viability test demonstrates that the NCQDs did not exert any significant toxicity as the cell viability was high even after 120 h treatment with NCQDs at a concentration of 400.0 μg mL–1 (Fig. 2a.). The LDH level produced in cell culture reflects cell membrane integrity. In the case of cell membrane damage, intracellular LDH molecules are released into culture medium. In our study, LDH release profiles were monitored as a function of the NCQD concentration. From the result presented in Fig. 2b, it was evident that LDH release is directly proportional to the concentration of NCQDs. The results of cell toxicity and LDH release profiles revealed that the nonspecific NCQDs do not show any potential toxicity, showing a low LDH release amount (below 4%) and high cell viability after treatment. The results were in agreement with earlier reports that used PEG-GQDs for toxicity evaluation.24,28
Fig. 2. In vitro cytotoxicity tests: (a) MTT assay of HeLa cells and (b) lactate dehydrogenase (LDH) release study. Figures (c)–(g) show the AO/EtBr staining of HeLa cells treated with 0, 50.0 and 100.0, 200.0, 400.0 μg mL–1 NCQDs respectively.
The characteristic trait of an apoptotic cell is cell shrinkage with chromatin condensation and fragmentation of nuclei. Such features can be visualised by AO/EB staining. In the case of apoptotic cells and dead cells, EB enters the cells and emits orange-red fluorescence, while normal cells with intact membranes fluoresce green due to AO. The result for AO/EB staining has been presented in Fig. 2c–g. It is evident from staining that no orange-red stained cells were observed. All the cells were fluorescing green for untreated and treated groups at different concentrations: 0, 50.0 and 100.0, 200.0, and 400.0 μg mL–1 respectively. The results clearly indicate that there were no apoptotic cells, suggesting negligible toxicity of NCQDs at applied concentrations. Considering the importance of NCQDs for cell culture applications, we also tested the viability of these doped QDs into liver, lungs and kidney cell lines; however, we did not find any qualitative and quantitative differences in viability and AO/EB staining (ESI Fig. S2–4†).
Haemolysis assay
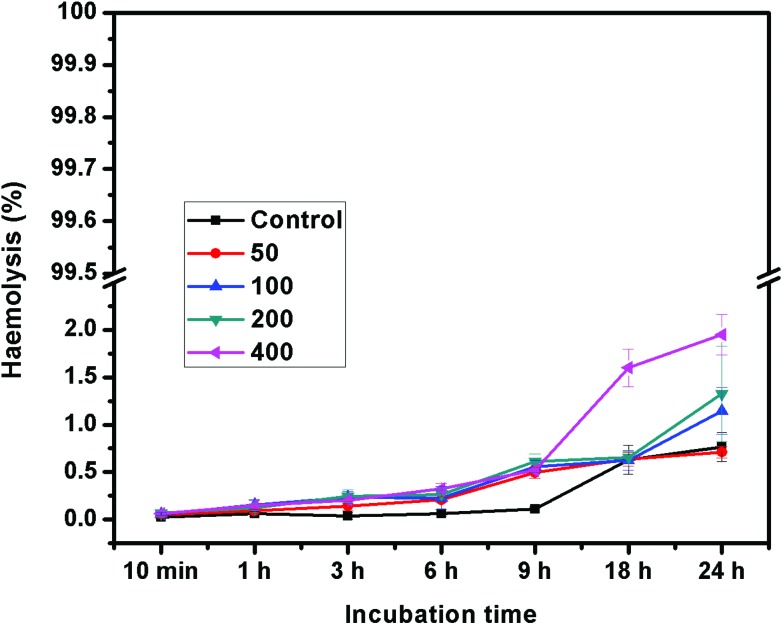
The hemocompatibility of any nanomaterial with human blood components is a crucial toxicological consideration for the successful application of nanomaterials for biomedical applications. To address the concern of blood compatibility, a haemolysis assay was also performed against different concentrations of NCQDs (50–400 μg ml–1) for variable times up to 24 h and the result has been presented in Fig. 3. The haemolysis parameter has been widely used in the biosafety evaluation of materials.37 It represents the health status of RBC cells. The result clearly shows that the haemolysis percentage of RBCs exposed to 400 μg ml–1 of the NCQDs was negligible. Hence, the result infers an excellent compatible material for the intravenous route.
Fig. 3. The haemolysis assay of NCQDs.
Cell apoptotic analysis
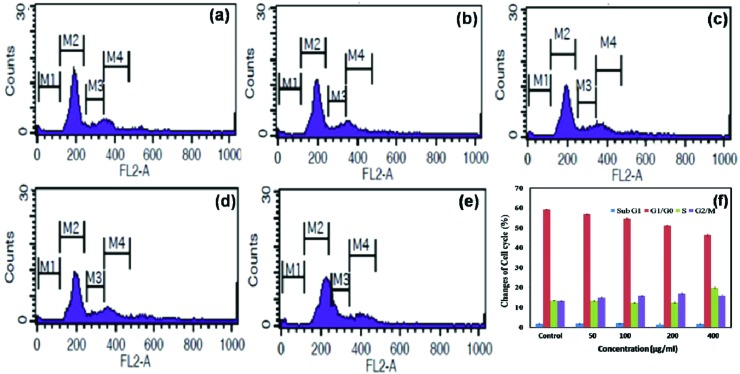
Flow cytometry or fluorescence activated cell sorting (FACS) is a standard method to detect cell apoptosis with high sensitivity and can be simultaneously used for cell cycle analysis.30 HeLa cells were grown in the presence of different concentrations of NCQDs for 24 hours. The cell cycle status of ∼10 000 cells of both treated and untreated HeLa cells was analysed and classified into G0/G1, S or G2/M phases (Fig. 4a–e). Treatment of HeLa cells with different concentrations of NCQDs for 24 hours induced a small increase of the number of cells in the G2/M phase and a decrease of the number of cells in the G0/G1 phase when compared with the control cells (Fig. 4f). Analysis of the results revealed that 13.5% of the untreated control cells were in the G2/M phase while treatment with NCQDs caused an increment in the fraction of cells in the G2/M phase to 13.37%, 14.98%, 15.83%, 17.13% and 15.9% at 0.0 μg ml–1, 50.0 μg ml–1, 100.0 μg ml–1, 200.0 μg ml–1 & 400.0 μg ml–1 concentrations, respectively. In the case of untreated cells, 59.22% of cells were in the G1/G0 phase while the treated fraction of cells in the G1/G0 phase was 57.08%, 54.74%, 51.19% and 46.43% respectively. A cell cycle study reveals that NCQDs did not cause apoptosis, as indicated by the absence of sub-G1 cell population. In both untreated and treated groups neither M-phase arrest nor G1 disruption was observed significantly.
Fig. 4. Flow cytometric analysis of HeLa cells: (a) the control without treatment; (b) 50.0 μg ml–1, (c) 100.0 μg ml–1, (d) 200.0 μg ml–1 and (e) 400.0 μg ml–1 of NCQD treatments (where M1 – sub G1 phase; M2 – G1 phase; M3 – S phase change; M4 – G2 phase change). (f) Changes induced by NCQD treatment at different phases of the cell cycle such as Sub G1 and G1/G0 phase changes, S phase changes and G2/M phase changes.
In vivo toxicity analysis in Swiss albino mice
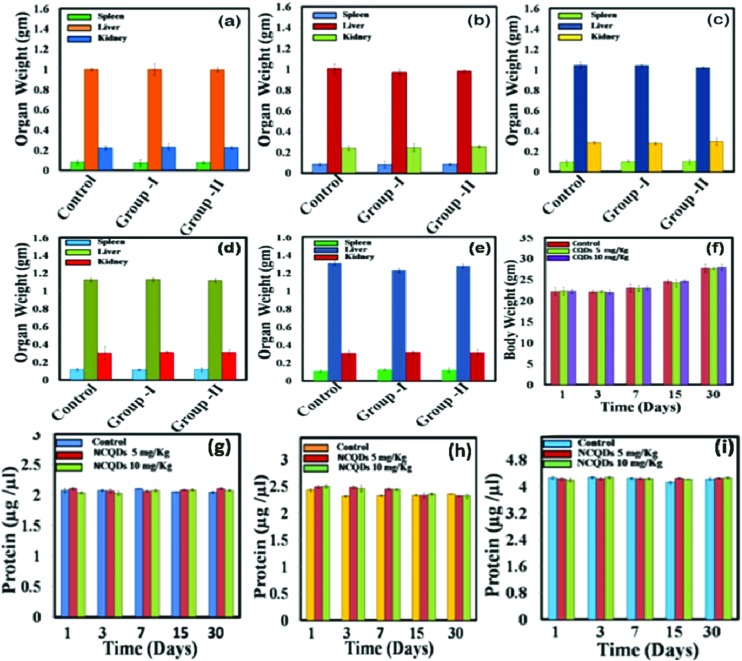
The body weight and the organ weight of the mice were noted at different time points after the administration of NCQDs and the results are presented in Fig. 5f. Fluctuation in body weight is recognised as an initial useful indicator for assessing in vivo toxicity of any material. The dose of NCQDs applied in this study is within the safe limits to as to not interfere with regular animal growth. The organ weight results of different days (Fig. 5a–e) suggest that intravenous administration of NCQDs did not cause any significant change in the weight of the liver, spleen and kidney of the treated group as compared to the control group. Apart from organ weight, protein content was also estimated in different tissues and the results are shown in Fig. 5g–i. The results illustrated that protein content in the tissues was not significantly altered.
Fig. 5. Organ weight of the NCQD treated mice at (a) the 1st day, (b) 3rd day, (c) 7th day, (d) 15th day and (e) 30th day of injection. Groups I and II represent experimental groups treated with 5 and 10 mg kg–1 of NCQDs. (f) Body weight of mice recorded at different time points as a function of different doses of NCCQs. Total protein content of the NCQD treated mice at the 1st, 3rd, 7th, 15th and 30th day of treated and control groups, (g) spleen extract, (h) kidney extract and (i) liver extract.
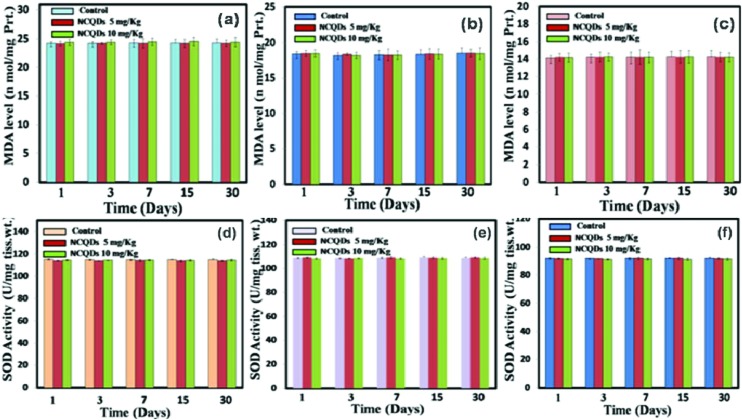
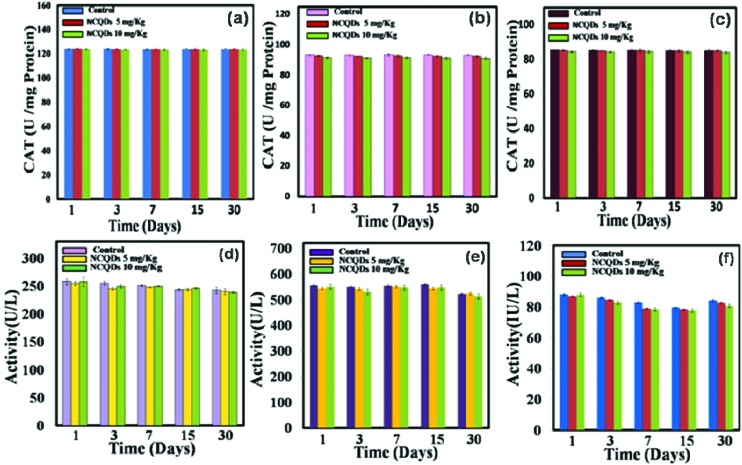
Oxidative stress plays a leading role in generating nanomaterial based toxicity. As a result of nanomaterial administration, it is possible that various oxidative stress enzymes may appear in order to nullify the toxic effect of nanomaterials. Different enzymes responsible for the downregulation of free radical formation in the body are lipid peroxidase (LPO), catalase (CAT), and super oxidase dismutase (SOD). In the case of toxicity assessment based on lipid peroxidation, lipid peroxidases play a major role. In the present study these important enzyme activities are measured in different tissues of treated mice with untreated reference mice as the control. Results suggest that there were no significant changes in LPO (Fig. 6a–c), SOD (Fig. 6d–f), and CAT (Fig. 7a–c) levels in the liver, kidney and spleen homogenates.
Fig. 6. The bar diagram represents the levels of MDA in (a) the liver, (b) kidney, and (c) spleen and the levels of SOD antioxidants in (d) the liver, (e) kidney and (f) spleen homogenates.
Fig. 7. The levels of catalase antioxidants in (a) the liver, (b) kidney, and (c) spleen and the levels of (d) ALT, (e) AST, and (f) ALP in the serum of treated and control groups.
We then carried out the serum biochemistry analysis in which serum parameters like alanine aminotransferase (ALT), aspartate aminotransferase (AST) and alkaline phosphatase (ALP) were measured periodically in mice treated with NCQDs at the 1st, 3rd, 7th, 15th and 30th day. The results for serum biochemistry analysis have been presented in Fig. 7d–f. The hepatic factors indicated the normal liver function, as the values of parameters were within normal ranges and were similar to the values for control animals (treated with saline solution). The serum biochemical assay results clearly reveal that the activities of ALT, AST and ALP enzymes did not significantly change as compared to each control group. The results of serum analysis showed no sign of liver injury.
Haematological analysis
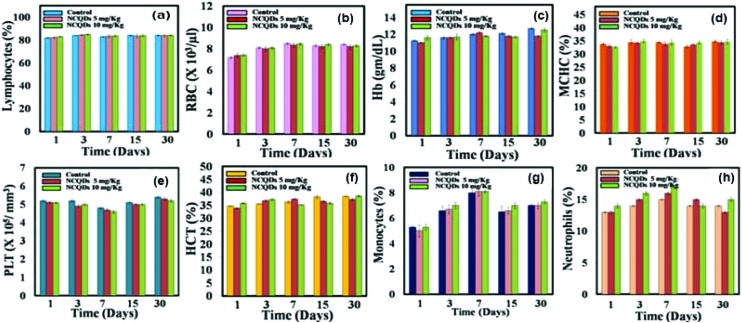
In the toxicity study, immunological parameters also play an important role. Any foreign material when administrated to the body may affect the immune system or induce an inflammatory response, which would be indicated by changes in haematological factors, such as red and white blood cell counts. Herein, we have also performed the complete blood count (CBC) for a NCQD treated mouse model for 30 days (Fig. 8). Standard haematological and biochemical markers were monitored. In the haematology analysis, the following important markers were tested: lymphocytes/white blood cells (WBC), red blood cell (RBC), haemoglobin (Hb), mean corpuscular haemoglobin (MCH), mean corpuscular haemoglobin concentration (MCHC), platelets (PLT), haematocrit (HCT), monocytes, and neutrophils. All the above parameters in mice treated with different concentrations of NCQDs at different time points appeared to be normal compared with control groups. The results did not suggest any acute toxicity.
Fig. 8. Haematology results of the NCQD treated mice post 1, 3, 7, 15 and 30 days of injection. These results show the mean and standard deviation of (a) lymphocytes, (b) RBC, (c) Hb, (d) MCHC, (e) PLT, (f) HCT, (g) monocytes and (h) neutrophils.
Histopathological analysis allows for the detailed microscopic evaluation and histological assessment of tissue interactions. From the histological analysis of animal tissues, there are no apparent histopathological abnormalities or lesions observed in the liver, kidney and spleen. H&E staining of such organs showed the same properties as those of control sections. Histological examination did not show any adverse symptoms of toxicity on the kidney, liver or spleen (Fig. 9). Hepatocytes in the liver samples were observed to be normal, and there were no signs of inflammatory response. The glomerulus structure in the kidney section was observed with normal texture. Necrosis was not found in any of the histological samples which were analysed. Body weights were monitored every other day, and the fluctuations were not greater compared to those of the control group.
Fig. 9. H&E stained tissue slices (liver, kidney, and spleen) of mice injected with NCQDs (IV route) at the doses of 5.0 mg per kg BW and 10 mg per kg BW once. Control group (a, d, g); group I – 5.0 mg per kg BW (b, e, and h), group II – 10 mg per kg BW (c, f, i) (CV = central vein; HP = hepatocytes, glomerulus, Bowman's space, white pulp and red pulp).
Skin sensitivity test
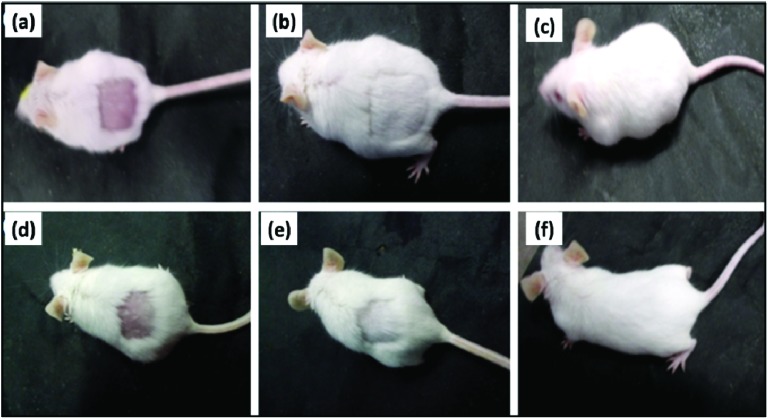
Furthermore, the synthesized NCQDs were tested for skin sensitivity. The NCQDs were uniformly spread onto the exposed skin of mice. The local conditions of the treated skin area and the overall state of the mice were observed continuously for 30 days after outer skin exposure to NCQDs. There was no local inflammation found in the skin area exposed to NCQDs. Hair were also recovered smoothly (Fig. 10).
Fig. 10. The skin toxicity of the synthesized NCQDs on adult male mice. The overall and local states of the mice after being treated with PBS pH 7.4 (a–c) and after treatment with 10.0 mg ml–1 NCQDs (d–f) for 1 d, 12 d, and 30 d are presented.
Conclusions
Here, we have synthesized nitrogen-doped carbon dots using d-glucose and ethylene diamine as raw materials and studied their toxicity both in vitro and in vivo. Our results showed that the as-prepared NCQDs were highly hydrophilic in nature and possessed excellent fluorescent properties, excitation dependent fluorescence emission with good quantum yield. Furthermore, an in vivo toxicity study of NCQDs revealed no acute toxicity and morphological changes were observed for the experimental dosages of 5 and 10 mg per kg BW. Also, blood biochemistry and haematological analysis suggested no significant toxicity of NCQDs up to 30 days. No inflammation and disruption were observed in the liver, kidney and spleen at the 30th day after the administration of the NCQDs. In vitro results corroborated in vivo results. The NCQDs did not show apoptosis, confirming the nontoxic nature of NCQDs. Superficial application of NCQDs on the skin also showed a positive response. Overall, both in vivo and in vitro results suggest that NCQDs are safe for application via intravenous routes and are nontoxic up to the tested concentration of 400 μg mL–1. Our results are encouraging and provide substantial evidence of the safety of NCQDs for biomedical applications.
Conflicts of interest
The authors have no conflict of interest to declare.
Supplementary Material
Acknowledgments
The authors acknowledge financial support from the CAS program of the Zoology & Physics Department, BHU, Varanasi, and the DST-PURSE (5050) programme of the DST, New Delhi, India. The authors also acknowledge the Biophysics laboratory, Department of Physics, BHU, Varanasi, for extending their laboratory facilities. The authors also acknowledge the University Scientific Instrumentation Centre for extending their laboratory facilities. We would like to thank Dr Vaibhav Pandit for proofreading the manuscript for grammar and textual errors.
Footnotes
†Electronic supplementary information (ESI) available. See DOI: 10.1039/c8tx00260f
References
- Medintz I. L., Uyeda H. T., Goldman E. R., Mattoussi H. Nat. Mater. 2005;4:435–446. doi: 10.1038/nmat1390. [DOI] [PubMed] [Google Scholar]
- Chu M., Pan X., Zhang D., Wu Q., Peng J., Hai W. Biomaterials. 2012;33:7071–7083. doi: 10.1016/j.biomaterials.2012.06.062. [DOI] [PubMed] [Google Scholar]
- Wegner K. D., Jin Z., Lindén S., Jennings T. L., Hildebrandt N. ACS Nano. 2013;7:7411–7419. doi: 10.1021/nn403253y. [DOI] [PubMed] [Google Scholar]
- Madani S. Y., Shabani F., Dwek M. V., Seifalian A. M. Int. J. Nanomed. 2013;8:941–950. doi: 10.2147/IJN.S36416. [DOI] [PMC free article] [PubMed] [Google Scholar]
- Nargish P., Tapas K. M., Roy P. J. Nanosci. Nanotechnol. 2013;13:6499–6505. doi: 10.1166/jnn.2013.7916. [DOI] [PubMed] [Google Scholar]
- Wang B., Chen N., Wei Y., Li J., Sun L., Wu J., Huang Q., Liu C., Fan C., Song H. Sci. Rep. 2012;2:563. doi: 10.1038/srep00563. [DOI] [PMC free article] [PubMed] [Google Scholar]
- Menon J. U., Jadeja P., Tambe P., Vu K., Yuan B., Nguyen K. T. Theranostics. 2013;3:152–166. doi: 10.7150/thno.5327. [DOI] [PMC free article] [PubMed] [Google Scholar]
- Zhang M.-Z., Yu Y., Yu R.-N., Wan M., Zhang R.-Y., Zhao Y.-D. Small. 2013;9:4183–4193. doi: 10.1002/smll.201300994. [DOI] [PubMed] [Google Scholar]
- Saha A., Chellappan K. V., Narayan K. S., Ghatak J., Datta R., Viswanatha R. J. Phys. Chem. Lett. 2013;4:3544–3549. [Google Scholar]
- Amirav L., Alivisatos A. P. J. Phys. Chem. Lett. 2010;1:1051–1054. [Google Scholar]
- Zhu H., Song N., Lv H., Hill C. L., Lian T. J. Am. Chem. Soc. 2012;134:11701–11708. doi: 10.1021/ja303698e. [DOI] [PubMed] [Google Scholar]
- Han Z., Qiu F., Eisenberg R., Holland P. L., Krauss T. D. Science. 2012;338:1321–1324. doi: 10.1126/science.1227775. [DOI] [PubMed] [Google Scholar]
- Wang C., Thompson R. L., Baltrus J., Matranga C. J. Phys. Chem. Lett. 2010;1:48–53. [Google Scholar]
- Chaudhary Y. S., Woolerton T. W., Allen C. S., Warner J. H., Pierce E., Ragsdale S. W., Armstrong F. A. Chem. Commun. 2012;48:58–60. doi: 10.1039/c1cc16107e. [DOI] [PMC free article] [PubMed] [Google Scholar]
- Xu X., Ray R., Gu Y., Ploehn H. J., Gearheart L., Raker K., Scrivens W. A. J. Am. Chem. Soc. 2004;126:12736–12737. doi: 10.1021/ja040082h. [DOI] [PubMed] [Google Scholar]
- Singh V., Kumar V., Yadav U., Srivastava R. K., Singh V. N., Banerjee A., Chakraborty S., Shukla A. K., Misra D. K., Ahuja R., Srivastava A., Saxena P. S. ISSS J. Micro Smart Syst. 2017;6:109–117. [Google Scholar]
- Singh R., Kashayap S., Singh V., Kayastha A. M., Mishra H., Saxena P. S., Srivastava A., Singh R. K. Biosens. Bioelectron. 2018;101:103–109. doi: 10.1016/j.bios.2017.10.017. [DOI] [PubMed] [Google Scholar]
- Liu H., Ye T., Mao C. Angew. Chem., Int. Ed. 2007;46:6473–6475. doi: 10.1002/anie.200701271. [DOI] [PubMed] [Google Scholar]
- Baker S. N., Baker G. A. Angew. Chem., Int. Ed. 2010;49:6726–6744. doi: 10.1002/anie.200906623. [DOI] [PubMed] [Google Scholar]
- Das R., Bandyopadhyay R., Pramanik P. Mater. Today Chem. 2018;8:96–109. [Google Scholar]
- Wang W., Cheng L., Liu W. Sci. China: Chem. 2014;57:522–539. [Google Scholar]
- Martinez Paino I. M., Santos F., Zucolotto V. J. Biomed. Mater. Res., Part A. 2017;105:728–736. doi: 10.1002/jbm.a.35946. [DOI] [PubMed] [Google Scholar]
- Zhang Y., Petibone D., Xu Y., Mahmood M., Karmakar A., Casciano D., Ali S., Biris A. S. Drug Metab. Rev. 2014;46:232–246. doi: 10.3109/03602532.2014.883406. [DOI] [PubMed] [Google Scholar]
- Chong Y., Ma Y., Shen H., Tu X., Zhou X., Xu J., Dai J., Fan S., Zhang Z. Biomaterials. 2014;35:5041–5048. doi: 10.1016/j.biomaterials.2014.03.021. [DOI] [PubMed] [Google Scholar]
- Kim J., Nafiujjaman M., Nurunnabi M., Lee Y.-K., Park H.-K. Food Chem. Toxicol. 2016;97:346–353. doi: 10.1016/j.fct.2016.09.034. [DOI] [PubMed] [Google Scholar]
- Edison T. N., Atchudan R., Sethuraman M. G., Shim J. J., Lee Y. R. J. Photochem. Photobiol., B. 2016;161:154–161. doi: 10.1016/j.jphotobiol.2016.05.017. [DOI] [PubMed] [Google Scholar]
- Havrdova M., Hola K., Skopalik J., Tomankova K., Petr M., Cepe K., Polakova K., Tucek J., Bourlinos A. B., Zboril R. Carbon. 2016;99:238–248. [Google Scholar]
- Wang K., Gao Z., Gao G., Wo Y., Wang Y., Shen G., Cui D. Nanoscale Res. Lett. 2013;8:122. doi: 10.1186/1556-276X-8-122. [DOI] [PMC free article] [PubMed] [Google Scholar]
- Wang W., Lu Y.-C., Huang H., Feng J.-J., Chen J.-R., Wang A.-J. Analyst. 2014;139:1692–1696. doi: 10.1039/c3an02098c. [DOI] [PubMed] [Google Scholar]
- Liu K., Liu P., Liu R., Wu X. Med. Sci. Monit. Basic Res. 2015;21:15–20. doi: 10.12659/MSMBR.893327. [DOI] [PMC free article] [PubMed] [Google Scholar]
- Gerdin A.-K., Igosheva N., Roberson L.-A., Ismail O., Karp N., Sanderson M., Cambridge E., Shannon C., Sunter D., Ramirez-Solis R., Bussell J., White J. K. Physiol. Behav. 2012;106:602–611. doi: 10.1016/j.physbeh.2012.03.026. [DOI] [PMC free article] [PubMed] [Google Scholar]
- Bradford M. M. Anal. Biochem. 1976;72:248–254. doi: 10.1016/0003-2697(76)90527-3. [DOI] [PubMed] [Google Scholar]
- Ohkawa H., Ohishi N., Yagi K. J. Lipid Res. 1978;19:1053–1057. [PubMed] [Google Scholar]
- Das K., Samanta L., Chainy G. B. N. Indian J. Biochem. Biophys. 2000;37:201–204. [Google Scholar]
- Sinha A. K. Anal. Biochem. 1972;47:389–394. doi: 10.1016/0003-2697(72)90132-7. [DOI] [PubMed] [Google Scholar]
- De B., Karak N. RSC Adv. 2013;3:8286–8290. [Google Scholar]
- Li S., Guo Z., Zhang Y., Xue W., Liu Z. ACS Appl. Mater. Interfaces. 2015;7:19153–19162. doi: 10.1021/acsami.5b04866. [DOI] [PubMed] [Google Scholar]
Associated Data
This section collects any data citations, data availability statements, or supplementary materials included in this article.


