

Abstract
This Review illustrates the evaluation of permeability of lipid membranes from molecular dynamics (MD) simulation primarily using water and oxygen as examples. Membrane entrance, translocation, and exit of these simple permeants (one hydrophilic and one hydrophobic) can be simulated by conventional MD and permeabilities can be evaluated directly by Fick’s First Law, transition rates, and a global Bayesian analysis of the inhomogeneous solubility-diffusion model. The assorted results, many of which are applicable to simulations of non-biological membranes, highlight the limitations of the homogeneous solubility diffusion model; support the utility of inhomogeneous solubility diffusion and compartmental models; underscore the need for comparison with experiment for both simple solvent systems (such as water/hexadecane) and well characterized membranes; and demonstrate the need for microsecond simulations for even simple permeants like water and oxygen. Undulations, subdiffusion, fractional viscosity dependence, periodic boundary conditions, and recent developments in the field are also discussed. Lastly, while enhanced sampling methods and increasingly sophisticated treatments of diffusion add substantially to the repertoire of simulation-based approaches, they do not address directly the critical need for force fields with polarizability and multipoles, and constant pH methods.
GRAPHICAL ABSTRACT
1. INTRODUCTION
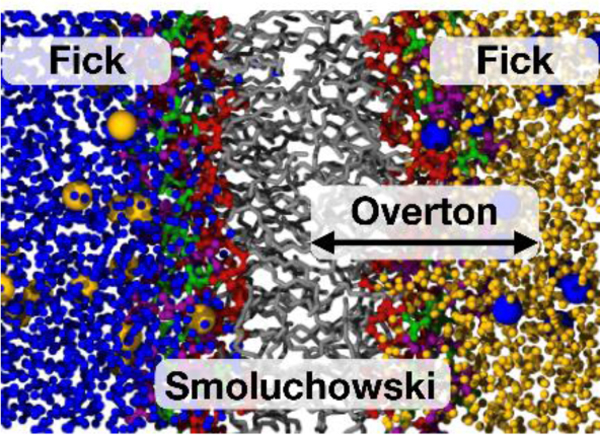
The permeability of membranes was being investigated before it was known that membranes were bilayers. In fact, three critical advances were published in the 19th century:1–2 Pfeffer’s experimental observations of osmosis in plant cells (1877); van’t Hoff’s development of osmotic theory (1887); and Overton’s formulation of the relationship between the passive membrane transport of a permeant and its solubility in oil (1898). Fick’s laws of diffusion and the Smoluchowski equation, the essential mathematical formulations for describing the rates of flow across membranes, were published in 1855 and 1915, respectively. In contrast, the bilayer structure of cell membranes was proposed in 1925 by Gorter and Grendel.3 While correct, their conclusion was based on flawed data and assumptions.4 It was not until 1960 that the bilayer architecture was firmly established by electron microscopy images.5
The 1960s was also the decade when molecular dynamics (MD) simulations began to provide insight into the structure and dynamics of simple and complex fluids.6 Simulations of proteins started in the 1970s,7 followed by simple bilayer models (hydrocarbon chains and soaps) in the 1980s, and phospholipid bilayers in the early 1990s.8 The first atomistic simulation of water permeability in a lipid bilayer was published in 1994 by Marrink and Berendsen.9 Hundreds more atomistic and coarse-grained simulations of passive transport of permeants in assorted lipid bilayers and artificial membranes have been published since. See Tables A1 and A2 in the outstanding review by Awoonor-Williams and Rowley10 for a comprehensive list of those focusing on lipid bilayers through mid-2015, and Section 9 of this review for the more recent ones.
This review concerns MD simulations of passive transport, with emphasis on developments since 2015. Recent studies have benefited from faster computers, improved potential energy functions, and other developments in methodology. Use of additional forces or other enhanced methods required to effect membrane translocation are no longer necessary for many small permeants, and their passive transport can presently be directly observed in conventional MD simulations.
Modern MD simulations provide details that aid in the interpretation of experiment. As an example, Overton’s Rule is remarkably accurate over 6 orders of magnitude (details in Section 2.2). However, 10-fold deviations in the permeabilities for water in different bilayers are not easily explained by Overton’s Rule because their acyl chain regions are very similar. Nagle and coworkers observed a correlation with surface area per lipid,11 and proposed a model12 based on differences in the structure of the interface. Refining such a model is a natural application of simulation. As a second example, diffusion models, starting with the Smoluchowski equation, are mainstays of analysis of permeation. However, it is essential to appreciate that a diffusion equation only approximates the dynamics of a solute in a homogeneous molecular solvent. This approximation becomes less justifiable for the dynamics of a solute in a complex heterogenous environment such as a membrane. The applicability of dynamical models (including ones going beyond diffusion) can be determined by comparing the results of trajectories with those predicted by the model.
By way of outline, Section 2 begins with a brief review of Fick’s First Law, Overton’s Law, the homogeneous solubility diffusion (HSD) model, the inhomogeneous solubility diffusion (ISD) model, and compartmental models. The parameters for a HSD model of water permeability, wherein the membrane is treated as a single slab of hexadecane or similar organic solvent, are estimated for a range of assumptions and the results are compared with experiment. While the limitations of the HSD model are well known,12 the exercise provides a good motivation for the ISD model and simulation.
Section 3 concerns a range of practical issues of simulation methodology, including the potential energy functions (commonly called force fields), fractional viscosity dependence, and the effects of periodic boundary conditions. This section also presents the results of simulations of permeants in bulk alkanes and alkane/water slabs. These systems provide important benchmarks when comparing the results of a membrane simulation with experiment. For example, if a simulation approach does not yield the experimental partition coefficient of a permeant in water/hexadecane, it is unlikely to yield the experimental permeability in a membrane. If it does, there is cancellation of error.
Sections 4 and 5 describe two complementary ways to estimate permeability from simulation: monitoring the total concentrations of permeant in the solvent outside the membrane; and calculating the free energy and diffusion profiles inside the membrane. More specifically, Section 4 relates both the flux and the transition rate across the membrane to the concentration changes predicted by Fick’s Law (suitably cast to apply to simulation-sized systems with periodic boundary conditions). The permeabilities obtained from this analysis are relatively “model-free” (Fick’s Law is still a model). Explicit results are shown for a primary cell with two bilayers (and therefore two distinct water compartments) and the more usual system with a single bilayer. Section 5 begins with the ISD model. As opposed to analysis based on Fick’s Law, the ISD model relies on highly specific local information provided by simulation. This approach yields significantly more precise, but not necessarily more accurate, estimates of permeability. Section 5 also reviews an extension of the Smoluchowski equation to include lateral diffusion of permeants in the membrane and a Bayesian analysis (BA) method to extract diffusion tensors from trajectories.13–14
Sections 6 and 7 test approaches based on Fick’s Law and the ISD equation for water and oxygen using simulations of 12 and 7 different bilayers, respectively. Effects of undulations (Section 6.1), periodic boundary conditions (6.2), the validity of the ISD model (Section 7.1), and agreement with experiment (7.2) are considered. Section 8 revisits the ISD model and shows that an acceptable model for water permeability requires 3 compartments, while one for oxygen requires 5; the HSD (i.e., a single compartment model), moreover, is particularly unsuitable for oxygen.
The theory and methods presented in Sections 2–8 focus on water and oxygen permeability and are illustrated using the results of conventional MD simulations. It is hoped that this approach provides a helpful entry point to the field, which is now focused on more medically relevant permeants and increasingly sophisticated simulation methods. Section 9 discusses developments published between 2015 and 2018. These include both technical advances and specific applications. Section 10 summarizes this review. Table 1 provides the abbreviations and chain structures for the assorted lipids noted here.
Table 1.
Name, abbreviations, and chain structure of lipids noted in this review.
| lipid name | abbreviation | sn1 | sn2 |
|---|---|---|---|
| 1,2-dilauroyl-sn-glycero-3-phosphocholinea | DLPC | 12:0 | 12:0 |
| 1,2-dilauroyl-sn-glycero-3-phosphoethanolamine | DLPE | 12:0 | 12:0 |
| 1,2-dimyristoyl-sn-glycero-3-phosphocholine | DMPC | 14:0 | 14:0 |
| 1,2-dipalmitoyl-sn-glycero-3-phosphocholine | DPPC | 16:0 | 16:0 |
| 1,2-distearyl-sn-glycero-3-phosphocholine | DSPC | 18:0 | 18:0 |
| N-palmitoyl sphingomyelin | PSM | SM | 16:0 |
| 1-palmitoyl-2-oleoyl-sn-glycero-3-phosphocholine | POPC | 16:0 | 18:1 |
| 1-stearoyl-2-oleoyl-sn-glycero-3-phosphocholine | SOPC | 18:0 | 18:1 |
| 1,2-dioleoyl-sn-glycero-3-phosphocholine | DOPC | 18:1 | 18:1 |
| 1-palmitoyl-2-oleoyl-sn-glycero-3-phosphoethanolamine | POPE | 16:0 | 18:1 |
| 1,2-dioleoyl-sn-glycero-3-phosphoethanolamine | DOPE | 18:1 | 18:1 |
| 1-palmitoyl-2-oleoyl-sn-glycero-3-phosphoglycerol | POPG | 16:0 | 18:1 |
| 1-palmitoyl-2-oleoyl-sn-glycero-3-phosphoserine | POPS | 16:0 | 18:1 |
| 1,2-dioleoyl-sn-glycero-3-phosphoserine | DOPS | 18:1 | 18:1 |
| 1-palmitoyl-2-docosahexaenoyl-sn-glycero-3-phosphocholine | PDPC | 16:0 | 22:6 |
| 1-palmitoyl-2-docosahexaenoyl-sn-glycero-3-phosphoethanolamine | PDPE | 16:0 | 22:6 |
| 1-stearoyl-2-docosahexaenoyl-sn-glycero-3-phosphoethanolamine | SDPE | 18:0 | 22:6 |
sn-glycero-3-phosphocholine is also commonly written as phosphatidylcholine, and likewise for the other headgroups.
2. THE BASICS
2.1. Fick’s First Law
Consider the sketch below, which depicts two compartments with concentrations c1 and c2 of a solute separated by a uniform slab (membrane for here) of thickness h.
The net number of particles n per unit area diffusing across the slab with cross-section area A compartment 1 into compartment 2 is the flux
| (1) |
In the absence of other forces, Fick’s first law of diffusion relates the flux and the concentration difference as15–17
| (2) |
where P is the permeability of the membrane, and a critical modulator of the flux. Eq. (2) assumes that the solutes in each compartment are well-mixed; i.e. the permeant distribution in water is statistically uniform. This is an issue in experiment, where effects of an “unstirred layer” must be taken into account.1 It is typically not a concern in simulation, where the water compartments are comparable in size to the bilayer. Furthermore, diffusion in water is usually much faster than through the membrane, so that equilibration of permeant concentrations inside each water compartment occurs on a faster time scale than equilibration of the two compartments.
Combining Eqs. (1) and (2) and defining the concentration in each compartment as the number of particles per volume gives
| (3) |
Assuming that both water compartments are equal in volume , Eq. (3) simplifies to
| (4) |
If the number of solute particles in the membrane is negligible with respect to the number in the water compartment, the solution to the initial value problem with is
| (5) |
where is the total number of particles. The preceding relation for N holds when the volumes of the compartments are very large compared to the volume of the membrane. If the relative amount of permeant in the membrane is non-negligible (as in MD simulations where the volumes of membrane and solvent are comparable), N in the above formula is replaced by
| (6) |
where is the total volume of the water compartments, is the volume of the membrane, and K is the water/membrane partition coefficient. K is the ratio of the solubilities in each phase ( for membrane and for water), and is related to , the free energy of transfer from the water to the membrane, as follows:
| (7) |
where R is the gas constant and T is temperature.
Note again that Eq. (2) does not contain any details of the membrane and thereby provides no explicit insight into the origin of the permeability. So far P is just a proportionality constant.
2.2. Overton’s Rule
Overton’s seminal contribution to biology is the recognition that the permeability of cells to many different solutes is proportional to the solutes’ partition coefficients from water into organic phases; i.e.,. As Kleinzeller points out in his excellent historical review,2 Overton developed this finding, called “Overton’s Rule”, in a series of publications between 1895 and 1907. Overton also noted a similar relation between and general anesthesia (then termed narcosis) in a 1901 paper based on experimental work he presented in lectures in 1895 and 1899. He was apparently not aware at the time that Meyer had independently published the same observation regarding narcosis in 1899. Hence, it is appropriate to refer to the “Meyer-Overton theory of narcosis”, but not historically accurate to call the “Meyer-Overton Rule”.
It is not surprising that the partition coefficient in the traditional statement of Overton’s Rule is somewhat vague, given the level of fundamental knowledge of cell membranes and experimental techniques around 1900. Finkelstein18 provided clarifying comments on the range of solvents used to model the water/lipid partition coefficient, and proposed that hexadecane (the length of a palmitoyl chain of a lipid) is the most reasonable. He also commented that a mixture of hydrocarbons is more representative of a lipid bilayer, and that “olive oil would serve almost as well (and taste much better)”. Walter and Gutknecht19 subsequently demonstrated the superiority of hexadecane and olive oil over octanol for a set of 22 small nonelectrolytes. This is sensible in that octanol forms inverse micelles with water in the center and is therefore not representative of the usually quite dry interior of the bilayer. That stated, permeants such as amino acids and peptides are highly hydrated and distort the bilayer when translocating.20 In these cases, water/octanol captures the underlying interactions more accurately than does water/hexadecane.21 Hence, the optimal solvent system depends on the permeant and mechanism of permeation. See Section 9.1.5 for a review of recent work on this subject.
2.3. The Homogeneous Solubility-Diffusion Model
To turn into an equation, assume that the free energy and diffusion profiles are uniform in the bilayer (as consistent with the model of a homogeneous slab). It is now possible to apply Fick’s Second Law:
| (8) |
where is the probability distribution in z of the particle at time t, and D is the diffusion constant in the membrane. Assume further that the distribution in the membrane is in a quasi-steady state with both compartments, so the concentration profile in the membrane is linear
| (9) |
where and are the (spatially constant) concentrations of permeant in the two water compartments. This step brings in the all-important partition coefficient. Expressing the flux as
| (10) |
and inserting Eq. (9) leads to:
| (11) |
Comparing Eqns. (2) and (11) links the permeability with physical properties of the membrane:
| (12) |
Equation (12) is called the homogeneous solubility-diffusion (HSD) Model. Though approximate (neither the free energy nor the diffusion profile is constant in the membrane), the HSD model provides a valuable entry point to assessing permeability. It was used for the first quantitative studies of water permeation in the 1960s.22–24 Figure 6–2 in Finkelstein’s monograph1 is a convincing demonstration of Overton’s Rule: a double logarithmic plot of the permeability coefficients in egg phosphatidylcholine membranes vs DK is linear over 6 orders of magnitude (where D is the diffusion constant of the permeant in water and K is its hexadecane/water partition coefficient). While deviations have been noted,25 the most significant ones are associated with facilitated transport.26 In fact, this had been recognized by Overton, and he proposed a non-passive mechanism for transport of inorganic ions.2
Figure 6.

for water in a POPC bilayer from Bayesian model (see Section 7).
Figure 2.

Density distributions of groups in a POPC bilayer from simulation. The potential of mean force for water is shown with a dashed line, with the axis scale on the right side of the plot.
2.4. The Inhomogeneous Solubility-Diffusion Model
The next step in understanding permeability within the context of a diffusion model is to allow for variation of diffusion constant and free energy of the membrane interior, which leads to the inhomogeneous solubility diffusion (ISD) model. This is done through the Smoluchowski equation in one-dimension:27
| (13) |
where and are the diffusion and free energy profiles respectively along the bilayer normal, , and is Boltzmann’s constant. Eq. (13) leads to the following expression for the permeability:
| (14) |
where the reference free energy represents the (constant) value of the free energy profile in the water phase and the origin z=0 defines the center of the membrane. Detailed derivations of Eq. (14) are provided in the Appendix of ref. 28, the original simulation paper by Marrink and Berendsen,9 the recent review by Awoonor-Williams and Rowley,10 and by Votapka et al.29 and are not reproduced here. The assumptions underlying the ISD model and the determination of the free energy and diffusion profiles from simulation are reviewed in Section 5.1.
2.5. Compartmental Models
If the bilayer of total thickness h is divided into i slabs (or compartments) of thickness each with constant and , Eq. (14) becomes by simple quadrature,
| (15) |
Eq. (15) is a compartmental model. The HSD is obtained by setting i=1, and the ISD is the infinitesimal limit. Section 8 develops compartmental models for water and oxygen permeation based on and from simulations.
Eq. (15) can be also thought of as representing a series of resistances,12 and therefore not necessarily dependent on the assumptions underlying the ISD model; i.e., a permeant could in principle move between compartments by non-diffusive mechanisms. Compartmental models can also be defined by rate constants between compartments, as in 1949 paper by Zwolinski, Eyring and Reese30 and more recently by Dickson et al.31 and references therein.
2.6. The HSD Model for Water
The following subsections assemble the parameters h, , and D for water in bilayers and compare the results with experiment. While the focus is on water, many of the conclusions of this exercise are general, and should also be considered when developing compartmental models for permeation.
2.6.1. Bilayer Thickness.
Even assigning the bilayer thickness is not straightforward. Bilayers are heterogenous and highly fluid in the biologically relevant liquid crystalline (Lα) phase. Consequently, it is difficult to determine structure at a detailed atomic level from experiment, as in x-ray diffraction of proteins. Rather, analyses of x-ray and neutron scattering of bilayers rely on models which develop electron densities (either total or by groups) with respect to the bilayer normal from the experimentally observed structure factors.32–33 The reviews by Nagle and Tristram-Nagle34 and Kučerka et al.35 summarize the results of x-ray measurements of different bilayers. The thickness of the hydrocarbon regions (2DC) for those of more biological interest is approximately 27–29 Å, and the total thickness (DB′) is 45–47 Å. The tails of the headgroup distributions (which include some bound water) extend to approximately 50 Å. Hence, from experiment, the “pure” hydrocarbon region of a bilayer is only 60% of the thickness, about 30 Å.
Distributions from current MD simulations show excellent agreement with x-ray for DMPC36 and DPPC,37 and it is reasonable to turn to simulations for additional details. The compilation by Venable et al.38 from simulations of 12 bilayers indicates a range of 27–31 Å for hydrocarbon thickness (excluding the 14 and 24 carbon chain lipids), further supporting the notion that 30 Å is a good “one-significant figure” value. The value of 40 Å sometimes assumed for the membrane thickness is the average distance between the phosphate planes on the two leaflets.38 Fig. 2 plots the distributions for the atom groups in a POPC bilayer, and Fig. 3 shows a snapshot of the lipid/water interface in detail. It is clear that water mixes with the polar head group region of POPC and interacts with the carbonyl oxygens of the chains but is largely excluded from the bilayer interior. The level of exclusion is quantified by the potential of mean force (PMF), which is calculated from the probability of finding water in a slab centered at z as
| (16) |
Figure 3.

Detail of the lipid/water interface from a simulation of a POPC bilayer with 648 lipids.38 Brass-colored lines show the C2:C2 (lower) and phosphate (upper) planes. The colors of molecular groups are based on those in Figure 2 (green for the phosphate groups, purple for choline, blue for water, red for acyl tail oxygens, and gray for remaining lipid carbons).
The PMF from a simulation is an average over all other (i.e., orthogonal) degrees of freedom and can be considered the effective potential governing the dynamics of the solute; it corresponds to in the inhomogeneous solubility equation (Eq. 13) and similar theoretical models utilizing a local free energy. is used for transfer energies as are measured from experiment; the difference in when a suitable reference is defined can be related to an experimentally obtained . Fig. 2 includes (dashed black line, scaled to kcal/mol, and set to zero in the bulk water region). indicate that water is mostly excluded at this depth, and that a thickness of 30 Å is a plausible initial estimate. However, the constant region of is only between approximately ± 6 Å, demonstrating that even the hydrocarbon region is heterogenous, and that 30 Å may be too large. The modeling of this system is continued in Section 8.1.
Hence, plausible values of h range from 50 to somewhat less than 30 Å. While these considerations only introduce a factor of 2 in an estimate for the single-slab model, they highlight the problem of choosing a single solvent to model a membrane. They also imply that the relevant thickness may be different for different permeants.
2.6.2. Transfer Free Energy.
The next parameter is . Returning to Fig. 2,. This can be taken to be the transfer free energy from the water to the center of the bilayer. How does this compare with hexadecane, the solvent of choice proposed by Finkelstein?18 The experimental value of the transfer free energy of water to hexadecane, , is 5.98 kcal/mol at 25 °C,39 suggesting that hexadecane is not an optimal model solvent for the membrane interior. However, this inference assumes that the potential energy function (or force field, FF) used for the simulation yields the experimental value for water into hexadecane. Consequently, the PMF of water from a simulation of a water/hexadecane slab must be carried out in the same way (identical program, methods, and force field) as the membrane simulation for a proper comparison. Fig. 4 (top) shows a snapshot from such a simulation, and Fig. 4 (bottom) plots . The free energy of transfer for water to hexadecane, kcal/mol; i.e., 1 kcal/mol higher than experiment. Errors in the FF (and remedies) are considered further in Section 3. For here, the important conclusion is that simulated transfer free energies for water to a POPC bilayer (6.8 kcal/mol) and to hexadecane (7.0 kcal/mol) are nearly equal.
Figure 4.

Water (blue)/hexadecane (grey) system for evaluating partition coefficients (top panel). This snapshot shows a single water in the alkane phase. Such a configuration is relatively uncommon (only 1 in approximately 200 frames contains waters in the central 8 Å slab). Bottom panel shows the potential of mean force for water evaluated directly from the trajectory. The value at z=0 (the center of the hexadecane layer) is , the free energy of transfer from water to hexadecane.
However, it is important to consider more than just one lipid. The interleaflet space in a bilayer is not identical to bulk hexadecane, and fully saturated lipids are only a small fraction of cell membranes.4, 40 Fig. 5 plots for 12 different bilayers. While these bilayers are not all at the same temperature (temperatures and further details of these are presented in Section 6), a comparison yields a sense of the effects of bilayer structure and composition. None of the PMF equal 7.0 kcal/mol at the midplane, but some with longer chains do reach 7.0 kcal/mol in the methyl region and then drop slightly when approaching the midplane. Values at the midplane range from 6.15 kcal/mol for PDPE (which contains one saturated chain and one chain with 6 double bonds) to 6.85 kcal/mol for DMPC (two fully saturated 14 carbon chains). The difference is 0.7 kcal/mol. for POPC (one double bond) is 0.2 kcal/mol higher than DOPC (2 double bonds). These results can be compared with the transfer free energies of water to a series of hydrocarbon chains with increasing unsaturation at 25 °C from free energy MD simulations of Carl and Feller:41 7.4 for hexadecane; 7.1 for 8-hexadecene; 6.7 for 5,8,11-hexadecatriene; and 6.2 for 2,5,8,11,14-hexadecapentaene (in kcal/mol). Carl and Feller used an earlier version of the CHARMM parameters, so their value of hexadecane is different from the 7.0 obtained here, but the trend is similar: the free energy of transfer is reduced by 0.2–0.3 kcal/mol per double bond. In summary, while the transfer free energy to hexadecane is an excellent entry point, it is reasonable for this estimate to allow for approximately 0.5 kcal/mol variation in to take lipid diversity into account. Bilayers with a large percentage of polyunsaturated lipids further expand the range. However, the experimental (not the simulation) value should be used in the HSD model for back of the envelope estimates, at least for now; i.e., at 25 °C. The 0.5 kcal/mol difference is exponentiated, leading to a factor of 2.3 in permeability in the HSD model. This uncertainty should be added to the factor of 2 uncertainty in the thickness estimated in Section 2.6.1. The physical origin of the differences in solubilities and permeabilities associated with unsaturation remains unclear and should be investigated thoroughly when more accurate force fields are available.
Figure 5.

Symmetrized potentials of mean force for water evaluated directly from the trajectories of 12 different lipid bilayers. The horizontal line at 7 kcal/mol is the free energy of transfer of water to hexadecane for the CHARMM36 (C36) FF.
2.6.3. Diffusion Constant.
Recent measurements of diffusion of water in alkanes by Su et al.42 at 22 °C indicate D = 1.1 × 10⁻⁵ cm2/s in n-hexadecane. Earlier measurements43 yielded 4.16 × 10⁻⁵ cm2/s at (25 °C) and 4.59 × 10⁻⁵ cm2/s (30 °C), close to the 4.31 × 10⁻⁵ cm2/s (25 °C) obtained in recent MD simulations.44 The diffusion constants of similarly-sized O2 and methane in hexadecane at 22 °C are 2.49 × 10⁻⁵ cm2/s (22 °C) and 2.66 × 10⁻⁵ cm2/s (26 °C), respectively.45 Hence, it is possible that the value obtained for water by Su et al. contains a contribution from some hydrogen bonded clusters. (An estimate of the cluster size is difficult because of the differences in hydrodynamics between small and large particles in alkanes. See Section 3.3.2 for details.)
As for the potential of mean force, simulations indicate a large variation in D(z) for water in the bilayer, with a minimum at the headgroup and a maximum in the center. As examples, Marrink and Berendsen9 estimated a range of 1–14 × 10−5 cm2/s in DPPC in their 1994 study, and, more recently, Riahi and Rowley46 obtained 0.5–2.5 × 10⁻⁵ cm2/s. Fig. 6 shows the result for for water in POPC that will be discussed further in Section 5.1.3. While these values will not be used for the present estimates, their ranges highlight the drawbacks of a HSD model.
2.6.4. Comparison with Experiment.
The parameter values estimated from the previous 3 subsections are 30–50 Å for h, 5.5–6.0 kcal/mol for , and 1.1–4.2 × 10⁻⁵ cm2/s for D. Table 2 lists the permeabilities calculated from Eq. (12) for these ranges. The lowest is 0.0009 cm/s and the highest is 0.013 cm/s, spanning more than an order of magnitude.
Table 2.
Permeabilities of water from Eq. (1) through hydrocarbon slabs of different thicknesses h, and diffusion constants D; T= 25 °C.
| h (Å) | D (10−5 cm2/s) | P (cm/s) | |
|---|---|---|---|
| 50 | 1.10 | 6.0 | 0.0009 |
| 50 | 4.16 | 6.0 | 0.0034 |
| 30 | 1.10 | 6.0 | 0.0015 |
| 30 | 4.16 | 6.0 | 0.0056 |
| 50 | 1.10 | 5.5 | 0.0021 |
| 50 | 4.16 | 5.5 | 0.0078 |
| 30 | 1.10 | 5.5 | 0.0034 |
| 30 | 4.16 | 5.5 | 0.0130 |
Experimental values of water permeability in bilayers also vary over an order of magnitude, depending on the method, the temperature, and the lipid. Those on the lower end are 0.0022 cm/s for egg lecithin (a mixture composed mostly of PCs of different chain lengths47) at 25 °C,18 and 0.0021 cm/s for DLPE at 35 °C.48 Most values determined recently are higher. In particular those of Mathai et al.11 for 6 different pure PC bilayers at 30 °C range from 0.0083 for DMPC to 0.016 cm/s for DOPC. The range of estimated permeabilities in Table 2 approximately brackets the preceding experimental values. The permeabilities measured by Huster et al.49 on highly polyunsaturated bilayers are larger, but can be reasonably reproduced by reducing used above to reflect the additional polyunsaturated chains.
Hence, the HSD model with a suitably broad range of parameter values yields permeabilities for water that bracket most of the above experimental results. This exercise provides useful insights into some of the underlying physics. Nevertheless, more detailed treatments are required for better than order-of-magnitude estimates of permeability.
3. SIMULATION PRELIMINARIES
Subsection 3.1 provides a brief critique of additive force fields for membrane simulations. Section Subsections 3.2 and 3.3 present simple simulation tests that lend insight to effects of the force field on the transfer free energy (water/hexadecane slabs) and diffusion constant (O2 in alkanes). It would be advisable to carry out such simulations and compare the results with experiment to help interpret the results of simulations with bilayers.
3.1. The Force Field
Classical MD simulations are propagated from Newton’s Law and thereby require a potential energy function, or force field. (The abbreviation FF is used here for both one or many force fields and should be clear from the context.) Force fields can be additive or polarizable.50–55 In the former, partial atomic charges on each atom are fixed throughout the trajectory. Consequently, a solute cannot adjust to different environments (vacuum to water, water to hydrocarbon). In the latter, the charge distributions can vary, allowing molecular dipoles to change during a simulation. The membrane simulations reviewed here utilized additive FF, although results from simulations of simpler systems using polarizable FF are also discussed. There are hybrid methods that include quantum mechanics to describe part of the system (e.g., an active site of an enzyme, or proton transport across a membrane) that are collectively termed QM/MM.56–60 Small systems can be simulated entirely quantum mechanically,61–65 but such simulations of full-sized membranes are not yet feasible.
The FF used for membrane simulations in the early 1990s contained significant flaws. However, these were unintentionally masked by lack of computer power (typical simulations spanned only several hundred picoseconds), and the use of constant volume ensembles (constant pressure methods allowing the height and area of the simulation cell to vary were not available in biomolecular simulations programs until the mid-1990s). As computer power increased and constant pressure algorithms were introduced, contractions in the surface areas of bilayers from their experimental values were observed.66 Such area contractions (and expansions) arise from a mismatch in the lateral pressure profile where the negative pressure in the head group region is not cancelled by the positive pressure in the bilayer midplane.50 The absolute values of these pressures are hundreds of atm at their extrema (see Fig. 7 for examples from three different sorts of lipids). In effect, two very large numbers must cancel at the target surface area to yield the physically correct value of zero for the surface tension.
Figure 7.

Pressure profiles for DPPC, PSM, and SDPE. Adapted with permission from Ref. 38. Copyright 2015 Elsevier Ireland Ltd.
This mismatch typically has specific causes including: partial charges;37, 67 dihedral angle potentials;68––69 Lennard-Jones interactions among chains70 and between ions and lipids.71 A global adjustment of a particular term is rarely (if ever) optimal, though it may be expedient. While the basic components of the FF (bond, angle, torsion, Lennard-Jones, and electrostatic) have not changed since the 1980s, the tuning has improved considerably. The common additive FF can presently generate stable bilayers with surface areas, densities, and other mechanical properties38 that are close to experiment for a wide range of lipids, and parametrization of additional lipids is ongoing.72
Nevertheless, additive FF have an inherent flaw that is accentuated when considering permeability: the permeant cannot adjust its charge distribution when leaving the water phase and entering the bilayer. This potentially corrupts the transfer free energy from the water layer into the bilayer, which, from Eqs. (7) and (12), is a critical contribution in the permeability. As is also clear from Eq. (12), the permeability is sensitive to the diffusion constant. Hence, a good model of a pure bilayer is no guarantee that the permeability of a particular solute is well described. Polarizable FF for lipids have been developed,73–74 and in principle they are more appropriate for simulating permeability than additive FF.
Both additive and polarizable force fields depend on their water models. The CHARMM additive FF were developed with TIP3P75 (a 3-center model which is a slight variant of TIP376), and this water model was used with simulations using the CHARMM lipid FF C36 discussed here. The flaws of the 1980s style TIP3P, especially the 3-fold underestimate of bulk viscosity, are well documented.52, 77–81 The viscosity error is reflected in a 3-fold overestimate of the self-diffusion constant which is evident in the water region in Fig. 6; errors in the water diffusion constant in the bilayer (critical for an evaluation of permeability) have been examined by Sajadi and Rowley.82 However, replacing TIP3P with a more accurate water model without extensive reparameterization is not advisable. Otherwise, the balance of a large number of complex interactions will not be preserved. Hopefully automated approaches83–87 will allow efficient replacement of outdated components in future FF, including the water model.
While not directly linked to force fields, another shortcoming of most simulation studies is that the charge of individual molecules is fixed; i.e., a molecule cannot change protonation states during a trajectory in response to the local environment. A variety of constant pH methods have been developed to address this issue. These include using a combination of molecular dynamics and Monte Carlo moves,88–90 lambda dynamics (where fractional charges are allowed),91 enveloping distribution sampling,92 and the virtual mixture approach.93 Though difficult to apply to membranes because of system size and potentially large numbers of titratable groups, membrane simulations at constant pH are starting to appear.94–95 These methods will be helpful for many applications, including those involving permeability of charged and neutral amino acids (Section 5.1.1) and drugs (Sections 9.1.3 and 9.2.1).
3.2. Transfer Free Energies of Permeants from Water/Hexadecane Slabs
Section 2.6 used the results of simulations of different bilayers and a water/hexadecane slab to support the use of hexadecane as a reasonable model solvent for the interior of bilayers. This subsection examines partitioning of water and ethane in simulations of water/hexadecane slabs to understand deficiencies in the C36 additive force field.
Table 3 shows that from C36 overestimates experiment by 1 kcal/mole (17% error); i.e., the TIP3P water is insufficiently soluble in hexadecane. A 1 kcal/mol error in is serious. Assuming that the permeability of water is dominated by terms in the center of the bilayer, P is reduced by , or approximately a factor of 5.
Table 3.
Transfer free energy of permeants from water to hexadecane, (kcal/mol), at 25 °C from simulation44 and experiment.39
Calculated from partition coefficient PH as
2159 water and 126 hexadecane (see Fig. 4 for C36).
10 ethane, 2159 water and 126 hexadecane.
Other permeants can be added to the water/hexadecane systems, and the transfer free energies can be evaluated directly from the simulation provided both phases are adequately sampled. Fig. 8 (bottom) shows F(z) for a simulation with ethane, and Table 3 lists . Ethane prefers the alkane phase over the water as expected, but is too negative by 0.4 kcal. The error is similar for methane (not shown).
Figure 8.

Potentials of mean force for water (top) and ethane (bottom) from trajectories of a water/hexadecane system with 10 ethane molecules. The PMF “ref” in the top panel is for water in pure water/hexadecane simulated with C36 (Fig 4). The similarity of these two water PMF indicates that the perturbation by the doped ethane is negligible.
The preceding result motivates application of the CHARMM polarizable model, referred to as “Drude”52, 96 (based on the method used to introduce polarizability); trajectories were generated with CHARMM97 using the polarizable alkane98 and SWM4 water96 potentials. The for water and ethane from F(z) in Fig. 8 and listed in Table 3 are nearly equal to experiment. However, the interfacial tensions of water/hexadecane for C36 (45.9 dyn/cm) and Drude (46.1 dyn/cm) both underestimate experiment99 (53.3 dyn/cm). (Interfacial tension is only indirectly related to permeability.) This indicates that the Drude, while superior to the additive C36 FF, still requires refinement.
One such refinement involves treatment of long-range Lennard-Jones (LJ) forces. Both C36 and Drude share the approximation that LJ interactions are set to 0 at a finite distance. This is computationally convenient, though physically incorrect because LJ interactions at long distances are always attractive. Methods developed for simulating isotropic systems with long-range LJ terms based on radial distribution functions6 or pressure adjustments100 are not applicable to interfaces; others that are, such as the Isotropic Periodic Sum (IPS),101–102 are computationally demanding. A satisfactory solution to this problem sums LJ long-range interactions to infinity utilizing the same underlying approach as Particle Mesh Ewald (PME) for electrostatics.103 This method, called LJ-PME, has recently been implemented into biomolecular simulation programs.104–105 The application of LJ-PME increases densities, compressibility moduli, and viscosities for C36 alkanes105 and other organic liquids106 when simulations are carried out with existing FF, as expected from the addition of exclusively attractive terms. In general, some reparameterization to an existing FF will be required when long-range LJ terms are included, though ultimately FF will simply be developed with this feature. In addition to more realistic modeling, simulating with LJ-PME removes the arbitrariness in assigning cutoffs and smoothing functions that frequently confound comparison of simulations using different programs and FF just as the introduction of PME did for electrostatics. See Krämer et al.44 for a more extensive comparison of simulations of water/alkane interfaces with additive and polarizable FF, and strategies for reparameterization of existing FF.
Another refinement to FF involves adding multipoles. See Ichiye80 for a discussion of multipoles on water models, Meuwly and coworkers for multipolar FF of a range of solutes,107 and Javanainen et al.108 for an analysis of O2 models which highlights the importance of including a quadrupole moment.
Lastly, a methodological comment with regards to . The approach just described, wherein is obtained from a PMF calculated from a long trajectory of a water/hexadecane interface (Fig. 8, top) is easy to understand, free of assumptions regarding clustering, and adequate for water in hexadecane. This “brute force” method also works well for ethane (Fig. 8 bottom) and oxygen.13 However, for less soluble permeants it may be more efficient (or necessary) to obtain from umbrella sampling109–111 (where the particle is restrained to a particular z, and the PMF is assembled from the distributions at different z). may also be obtained from more advanced free energy methods.112–115 These are further reviewed in Section 9.1.1.
3.3. Diffusion Constants of Permeants in Alkanes and Water
This subsection discusses issues related to obtaining diffusion constants of membrane permeants in simulation.
3.3.1. Temperature Dependent Viscosity.
The diffusion constant of a particle is inversely related to the friction constant f by the Einstein relation
| (17) |
The functional form of the friction constant is not specified in the preceding equation, but it typically tracks the viscosity of the solvent. Hence, a natural first step in evaluating the ability of a FF to describe diffusion in a bilayer involves calculating the viscosity of hexadecane. Fig. 9 (top) compares the results for C36, Drude, and experiment (solid line) for three temperatures in the range relevant for most bilayer studies, 30, 37 and 50 °C. While C36 captures the temperature dependence, it underestimates experiment by 21%. The simulated viscosity falls between that of pentadecane (dashed line) and tetradecane (dotted). The viscosity for the polarizable hexadecane in CHARMM (Drude) is larger than that of C36, but still underestimates experiment.
Figure 9.

Calculated viscosities at three temperatures for hexadecane simulated with C36 and Drude (symbols) with a cutoff Lennard-Jones (top) and with LJ-PME (bottom).105 Experimental values for hexadecane (C16), pentadecane (C15) and tetradecane (C14) in lines.
Including long-range LJ interactions (LJ-PME) increases the viscosity for both FF (Fig. 9 bottom). The additive FF remains slightly below experiment, while the polarizable is in excellent agreement.
Calculated diffusion constants of permeants in bilayers simulated with C36 (with or without LJ-PME) would therefore be expected to be somewhat larger than experiment, at least in the acyl chain region, and only considering the contribution of solvent viscosity to the friction constant. How much larger depends on the relationship of the friction constant and the viscosity.
3.3.2. Fractional Viscosity Dependence for O2 in Alkanes.
Stokes’ Law relates the friction constant of a sphere of radius a in a continuum viscous fluid of viscosity η for stick and slip boundary conditions as:
| (18a) |
| (18b) |
Remarkably, Stokes’ Law extends to the molecular level for many fluids. Diffusion of spherical proteins in water is well described by the combination of Eqns. (17) and (18a), provided a hydration shell is included when specifying hydrodynamic radius.116–118 The friction constants of molecules whose sizes are comparable to the solvent are better described by Eq. (18b).119–120 In fact, one of the early successes of MD simulation involved Zwanzig and Bixon’s analysis of Rahman’s121 simulations of liquid argon, which demonstrated the applicability of slip boundary conditions.122 However, the physics changes when the solute is small with respect to the solvent, for example gases in alkanes.42, 123–124 In this case, the relation between friction and viscosity is fractional:
| (19) |
where α is typically between 0.5 and 0.7. This is intuitively reasonable in that a small particle does not necessarily need to displace a solvent such as hexadecane when translating. It can hop between voids. A similar effect is observed in simulations of a series of neat alkanes,125 where the isomerization rates of the common torsion angles are independent of alkane length; in contrast, rotational diffusion of the long axis of each alkane is proportional to . “Non-Kramers” (i.e., fractional viscosity) behavior has also been observed experimentally for isomerization rates of solutes in alkane solvents.126
To determine the ability of C36 to describe fractional viscosity, and to explore the effects of periodic boundary conditions (PBC) (Section 3.3.3), a series of simulations of O2 in octane, dodecane, hexadecane, and water were carried out in boxes with edge-lengths L ≈ 30 (3 O2), 60 (24 O2) and 100 Å (111–190 O2). The trajectories were generated using CHARMM at constant volume and a temperature of 25 °C with time step, PME grid, and piston masses the same as reference 13; averages were evaluated following 20 ns for equilibration. Table 4 lists specific input parameters, calculated viscosities, and diffusion constants for the trajectories. Only diffusion constants directly from the simulation at the largest value of L are considered in this subsection.
Table 4.
Diffusion constants (×10−5 cm2/s) of O2 in alkanes and water from simulations in box length L and total length trun. is calculated directly, and with Yeh-Hummer correction127 for periodic boundary conditions. Viscosities η from simulation; experimental viscosities for pure alkanes99 and water128 in parentheses.
| octane | dodecane | hexadecane | water | |||||||||
|---|---|---|---|---|---|---|---|---|---|---|---|---|
| L (Å) | 29.7 | 59.2 | 101 | 30.2 | 60.4 | 107 | 28.3 | 55.7 | 103 | 25.1 | 54.3 | 109 |
| # O2 | 3 | 24 | 118 | 3 | 24 | 111 | 3 | 24 | 140 | 3 | 24 | 192 |
| trun(ns) | 300 | 100 | 100 | 200 | 200 | 200 | 500 | 300 | 200 | 300 | 100 | 100 |
| η (cP)a | 0.386 (0.5151) | 1.06 (1.378) | 2.09 (3.095) | 0.334 (0.8904) | ||||||||
| 8.09 | 8.70 | 8.55 | 4.80 | 5.11 | 5.10 | 3.22 | 3.55 | 3.59 | 4.84 | 5.39 | 5.54 | |
| se(%)b | 1.8 | 1.7 | 1.3 | 1.2 | 0.3 | 0.3 | 0.4 | 0.5 | 0.4 | 2.0 | 1.3 | 1.3 |
| 8.61 | 8.97 | 8.71 | 4.99 | 5.21 | 5.15 | 3.32 | 3.60 | 3.62 | 5.60 | 5.74 | 5.71 | |
Average from all three sizes, except for hexadecane where the smallest was excluded; note that O2 is included in simulation system.
From standard deviations over five time blocks.
The experimental data124 is for odd-numbered alkanes at temperatures 19–23 °C, so a direct comparison of diffusion constants is not straightforward. Additionally, it has already been noted in Section 3.3.1 that simulations with C36 underestimate the viscosity for hexadecane. The viscosities listed in Table 4 indicate that other alkane viscosities are also underestimated.
Nevertheless, a comparison of simulated and experimental diffusion constants as a function of viscosity can be used to determine the form of the friction constant. Specifically, if holds over the range of interest, the slope of vs. yields α. Fig. 10 plots the results from the largest simulation box for each alkane and experiment.124 The dependence is linear, and the values of α from simulation (0.51 ± 0.02) and experiment (0.52 ± 0.02) agree. Hence, even though the viscosities of individual alkanes underestimate experiment in the simulation (Fig. 9), the underlying fractional dynamics is captured.
Figure 10.

Log-log plots of the inverse of the oxygen diffusion constant in alkanes vs. alkane viscosity from simulation and experiment; linear fits in dotted lines.
From these results it is possible to make a first estimate on the error in D of O2 in bilayer simulations. While the viscosity (averaged over a temperature range 30–50 °C) of hexadecane is 22% low, the diffusion constant of a permeant would only be approximately 10% higher. This is because rather than . However, as shown in following sections, dynamics in the bilayer is even more complicated.
Fractional viscosity dependence is associated with highly nonlinear behavior of the mean squared displacement (msd) at short times (Fig. 11): the msd for the alkane solvent has a rapid rise in the first ps before reverting to linear behavior at longer times (the diffusion constants presented in Table 4 were all evaluated from the linear region). The msd for O2 in water is substantially more linear at short times, implying that the dynamics are different. Note also that the simulated diffusion constant for O2 in octane is 50% higher than obtained for water, even though the octane viscosity in the simulations is 20% higher. This also implies different diffusion mechanisms. (As shown in the next subsection, the simulated diffusion constants require correction for PBC, but the correction is small and does not change the preceding conclusion.)
Figure 11.

Mean squared displacement of oxygen diffusion constant in alkanes and water at long (top) and short (bottom) time.
3.3.3. Periodic Boundary Condition Artifacts in Homogeneous Systems.
The next topic regarding diffusion concerns the effects of periodic boundary conditions in simulations. Essentially all molecular dynamics simulations are carried out with periodic boundary conditions.6 The primary cell is replicated in all directions, yielding an infinite lattice. In most (but not all129) implementations a particle diffusing out of one side emerges through the opposite side. The technique allows the simulation of a very large system with a relatively small number of particles without the perturbing effect of hard wall. However, the effects of system size are not the same on all properties, and translational diffusion is among the most notorious.
It is clear from Table 4 that there are PBC effects: for each of the 4 solvents, O2 diffusion constants in the 30 Å boxes are lower than those where L = 100 Å (5% for octane, 6% for tetradecane, 10% for hexadecane, and 12% for water). These are all higher than the standard errors in D (second row from bottom in Table 4). In contrast, the differences at L = 60 and 100 Å are close to zero for the alkanes (−2% for octane, 0.2% for tetradecane, 1% for hexadecane), and only slightly larger (3%) for water.
It is instructive to compare these results with those from a correction formula derived from classical hydrodynamics by Yeh and Hummer127 for a homogenous system in a cubic box of length L:
| (20) |
where is the value of the diffusion constant in an infinite system, is the value obtained from a simulation in a finite system, η is the viscosity, and . Eq. (20) has been shown to be accurate for self-diffusion of CHARMM alkanes,68 TIP3P water,102 and, more recently, a larger collection of molecules at assorted pressures.130
Before proceeding, a note on the viscosity is necessary. Viscosity is obtained here in the usual way, by integrating the autocorrelation function of the off-diagonal elements of the pressure tensor P from simulations at constant volume V:
| (21) |
The approach to the long-time value of the preceding integral is often slow and not easily fit with a simple function, so it is convenient to estimate the value from the incomplete integral:
| (22) |
Fig. 12 plots I(t) for the water and hexadecane systems listed in Table 4 for all three system sizes. The three curves are nearly superimposable for water (Fig. 12, top). PBC effects on viscosity can usually be ignored, and this is the case here. Similar results were obtained for octane and dodecane (not shown). In contrast, η for L=28.3 Å is significantly higher than for the two larger sizes (Fig. 12, bottom) for hexadecane. In effect, an individual hexadecane, which is nearly 20 Å when fully extended, can interact with its image when the box size is only 28 Å. Based on this analysis, the viscosities listed in Table 4 for hexadecane are only for the two larger boxes; for other systems they are the averages of all three sizes.
Figure 12.

Integral of the off-diagonal elements of the pressure tensor (Eq. 22) for the three different sized boxes of water (top) and hexadecane (bottom). The long-time (or plateau) value is the viscosity.
Returning to diffusion constants, Eq. (20) works well and is necessary for O2 in water: increases with increasing box sizes, and differs from even at L=100 Å. However, the finite size effect is substantially smaller in the alkanes and is not well captured by Eq. (20). This is not surprising because the Yeh-Hummer treatment was derived using conventional hydrodynamics , while diffusion of O2 in alkanes follows a fractional viscosity dependence. An analytical treatment of finite size effects for systems of this type does not appear to be presently available. Nevertheless, given that simulation boxes for membrane simulations are no smaller than L= 50 Å, these results imply that PBC effects for small permeants such as O2 can be expected to be small. Explicit results for bilayers are discussed in Section 6.2. The following subsection considers hydrodynamic modeling of O2 in water in more detail.
3.3.4. Viscosity Dependence for O2 in Water.
Part of the permeation process involves diffusion through water. The well-known77, 131 low viscosity of TIP3P water is evident from Table 4, and scaling is advised when attempting to relate the translational or rotational diffusion constant of larger molecules (such as sugars, for example) with experiment.77 Given that O2 is comparable in size to water, it is not clear what kind of scaling is required. A simple estimate entails modeling O2 as a sphere, determining the effective hydrodynamic radius, and testing whether Stokes’ Law yields agreement with the simulated diffusion constant.
The O2 model used for the simulations presented in Table 4 consists of two Lennard-Jones particles with radii σ = 1.512 Å and bond length . The surface area of overlapping spheres is
| (23) |
Equating this area to that of an equivalent sphere yields an effective radius . This approach follows Pastor and Karplus,132 who showed that the surface area of an ellipsoid can be mapped onto an equivalent sphere to obtain the average friction constant; this observation was later placed on firmer theoretical ground by Hubbard and Douglas.133 Inserting as the hydrodynamic radius of molecular oxygen and the viscosity of water calculated from the simulation into Eq. (18b) (sphere with slip boundary conditions) yields D = 5.59 × 10⁻⁵ cm2/s, a value quite close to the and obtained from simulation. None of these results are particularly close to experiment, where D = 2.11 × 10⁻⁵ cm2/s at 22 °C,45 but this is expected: the experimental viscosity of water at this temperature is 0.9548 cP. Scaling by the ratio of the experimental and simulated viscosities (0.326/0.9548) yields D = 1.95 × 10⁻⁵ cm2/s, in good agreement with the experimental diffusion constant. Hence, in contrast to alkanes, diffusion of O2 in water appears to be well described by conventional hydrodynamics.
4. PERMEABILITY FROM MEMBRANE SIMULATIONS: COUNTING
This section introduces the evaluation of permeability from what could be considered a naive viewpoint: ignoring the theory that is used to analyze most simulations and simply counting the number of permeants that crossed the bilayers, as if performing an experiment. Two approaches are presented: Flux-Based (FB), where the concentration of permeants in the solvent compartments are counted (so recrossings reduce the concentration); and Transition-Based (TB), where the total number of bilayer crossings are enumerated (and recrossings add to the count). While both methods can be applied to a simulation of only a single bilayer, the double bilayer system is easier to understand and is therefore presented first. Double bilayers have also been used to simulate ion gradients and pore formation.134–137
Of course, some theory is necessary to connect to the model of passive permeability, and this model is Fick’s Law. For example, rapid flow through a transient pore would not be consistent with Fick’s Law, and a proper analysis would show this, much the same way as non-passive permeability is determined from experiment.
4.1. Flux-Based Counting
4.1.1. Connection to Fick’s Law.
Fig. 13 sketches the primary cell for a double bilayer simulation system. The dashed lines indicate periodic boundaries so that, for example, a particle in the central compartment (1) exiting at the top of the cell, reenters 1 at the bottom. Likewise, a particle leaving compartment 2 from the right reenters from the left. The only way for a particle to transit from 1 to 2 is to cross a bilayer. Hence, the double bilayer system is equivalent to the two-compartment system sketched in Fig. 1 and can be treated directly with Fick’s Law. However, because a particle can exit 1 through either bilayer, the area term in Eq. (5) must be doubled (keeping the definition of the area as that of one surface):
| (24) |
where is the thickness of each water compartment. Recall from Section 2.1 that if there is a significant population of permeant in the bilayer N is replaced by (Eq. 6). Lastly, it is useful to define the decay time in the exponential . This is the characteristic mixing time in a typical simulation system, where the permeants quickly diffuse in the water compartments after crossing the bilayer. Experimentally, the mixing times are larger because compartments are large with respect to the diffusion time scale.
Figure 13.

A two-bilayer system suitable for simulation. Concentrations of permeant in the central (1) and outer (2) compartments are c1 and c2, respectively, and the thickness of each water layer is L. Periodic boundaries are denoted with dashed lines.
Figure 1.

Permeants (green disks) at different concentrations separated by a membrane (blue slab).
4.1.2. Permeability of Water in a DLPC Double Bilayer.
This subsection considers the permeability of water in a DLPC bilayer using the double bilayer model introduced above. It is well suited to this method because all the waters are permeants, and their concentration in the bilayer is near 0 (N is essentially equal to ) so Eq. (24) can be used directly.
Four trajectories of 400 ns each were generated with the protocol described in Venable et al,38 and used for the simulations presented in Section 2.6. Fig. 14 shows the initial configuration of replica C (top), and a snapshot at 400 ns (bottom). Waters (2880 in each compartment) are colored blue and orange for the illustration and numbered sequentially for bookkeeping of the trajectory but are otherwise identical. It is evident that permeation has occurred: after 400 ns there are 28 orange waters in the central compartment, and 19 blue waters in the outer compartment.
Figure 14.

Snapshots at t=0 (top) and 400 ns (bottom) for a double bilayer of DLPC (each with 72 lipids) and 2880 waters in each compartment. Lipid coloring is the same as Fig. 4. Waters (only oxygens are included) originally in the central compartment are blue and those in the outer are orange; waters that have transited between compartments are rendered with larger radii.
To begin the quantitative analysis, the surface area per lipid for DLPC using the C36 FF is 63.8 Å2, and the molecular volume of TIP3P water at 30 °C is 29.7 Å3. Assuming that the partial molar volume of water is not altered by the bilayers, the preceding values imply that . As a first estimate of time scale, if the simulated permeability equals experiment11 (10.3 ± 0.5 × 10⁻³ cm/s),. Hence, it would take 20 μs (approximately 2 decay times) for the two compartments to be reasonably mixed, a trajectory too long to generate for this example. On the other hand, for t = 400 ns, so the short-time expansion of the exponential term in Eq. (24)
| (25) |
is applicable and the slope of the line vs. t yields P. If the trajectories were longer, recrossings would reduce and the short-time expansion would not be applicable. In fact, there was one such recrossing in one of the replicates.
The top panel of Fig. 15 shows the time evolution of replica C (the one shown in Fig. 14). Each replicate yields 2 fluxes, one from the center to the outer compartment, and one from the outer to the center (the same equations are applicable, with and switched). A transition from “reactant” to “product” compartment was registered as described in Section 4.4.1. The middle panel of Fig. 15 shows the average of the 4 replicates and the best fit line. The y-intercept was constrained to 0, and the result of the fit is included in the figure. The occasional downward spikes in the counts arise when a particle passes the dividing surface, briefly recrosses the surface, and then continues on its downward path to the product compartment.
Figure 15.

Time series for number of waters that have entered into compartment 1 from compartment 2 (red lines) and into compartment 2 from compartment 1 (green) for one of the four replicates for the double bilayer (top) and the average (middle). Number of waters exiting the primary cell vs. time for the single bilayer (bottom). Linear fits with the y-intercept constrained to 0 (blue) are shown for the lower two panels.
Inserting the slope from the average line, Eq. (25) yields P = 3.6 ± 0.4 × 10⁻³ cm/s, where the standard error was obtained from the standard deviation of fits of the fluxes from the replicates. The simulated result underestimates the experimental value noted above, as expected from the 1 kcal/mol overestimate of the free energy of transfer of water to hexadecane for the CHARMM additive force field (Section 3.2). The comparison of simulation and experiment for water is discussed in more detail in Sections 6 and 7.
4.1.3. Permeability of Water in a DLPC Single Bilayer.
The bottom panel of Fig. 15 plots the counts for a 400 ns trajectory of a single bilayer of DLPC. Though the trajectory length is the same as those for the double bilayers, the statistics are not as good because passage is only across one bilayer. The image cell functions as a separate compartment from the point of view of Fick’s law if the trajectory is recentered around the water compartment (Fig. 16), but it does not provide an independent set of transitions. The difference in the permeabilities, 4.2 ± 1.2 × 10⁻³ cm/s for the single bilayer and 3.6 ± 0.4 × 10⁻³ cm/s for the double is not statistically significant. Hence, with marginal extra bookkeeping Fick’s Law can be illustrated for water from a simulation of a single bilayer.
Figure 16.

DLPC and images cells on the right and left showing waters that have permeated (large blue spheres); waters that have not permeated are shown as small blue spheres and lipids in the image cells are rendered with reduced intensity.
4.1.4. Limitations of Flux-Based Counting.
The FB counting method just described was designed to illustrate permeability in a pedagogical manner. Although a similar demonstration could have been carried out using Brownian or Langevin Dynamics, MD simulations provide direct insight into the time scales of equilibration and what is possible with present day computers; i.e., why such calculations were not possible until recently (the double bilayer was run for 1.6 μs) and why they are still not entirely satisfactory (the 400 ns simulation of a bilayer with 72 POPG presented in Section 6 only had 6 water transits).
However, FB counting is not generally practical for extracting permeability from simulations. At longer timescales the linear fit must be replaced by an exponential fit which requires more sampling for accuracy. After equilibrium has been reached the flux is zero and no further information can be obtained from the FB method. Furthermore, in contrast to water, most permeants of interest are highly soluble in the membrane and therefore at relatively low concentration in the solvent. To take oxygen as an example, Ghysels et al.13 simulated two different 72-lipid bilayers, each with approximately 30 waters/lipid and 10 O2. The relative concentrations of O2 in membrane to water equaled 20:1, indicating that the water compartment contained, on average, 0.5 O2 (i.e., the number fluctuated between 0 and 1 with an occasional 2). Evaluating the flux from such a simulation is not possible. A 100-fold increase in all components yields 50 O2 in solution (a workable number for evaluating the flux), but the nearly 20 million atom system is too large to simulate.
Fortunately, the preceding problems disappear by a subtle change: Instead of evaluating the concentrations of permeants, count the number of crossings and determine the crossing rate. This rate is directly related to permeability, as shown in the following subsection.
4.2. Transition Rate-Based Counting
4.2.1. Derivation and Comparison to Flux-Based Counting.
To derive the relation between transition rate and permeability, assume that each permeant has an equal probability of crossing the bilayer, and that crossings are independent events that occur at a constant rate r (per unit time and unit membrane area). Under these assumptions, the average number of particles in the target compartment evolves as
| (26) |
For generality, formulas are henceforth written explicitly in terms of (defined by Eq. 6). Here, the two terms in parentheses denote the probabilities of a crossing to go either direction (from compartment 1 to 2, or back). The resulting differential equation is
| (27) |
Comparing Eq. (27) with a slightly rewritten version of Eq. (4):
| (28) |
is it clear that . Now recall the initial picture from Section 2 where two water compartments (each of volume V) containing an average of permeants are divided by a membrane. In this case the concentration of permeants in the water at equilibrium is . Therefore,
| (29) |
An attractive aspect of Eq. (29) is that it is agnostic regarding periodic boundary conditions and applies to systems with single or double bilayers.
For single bilayers the transition rate r is evaluated as the number of crossings in both directions divided by the length of the simulation and the cross-section area of the bilayer, i.e. the surface area of one leaflet. The equilibrium concentration is calculated as the average number of permeants in water divided by the volume of the water compartment.
For double bilayers the transition rate is the number of crossings over any bilayer in any direction divided by the length of the simulation and the total membrane area, i.e. twice the cross-section area of one bilayer. The concentration is the average number of permeants in water, divided by the total volume of the water compartments.
Note that Eq. (29) directly reflects Fick’s First Law on short time scales, where all permeants are located in the source compartment ( and ). In this situation, all crossings take place only in one direction, so that the transition rate equals the flux and Eq. (29) reduces to , the TB counting is equivalent to the FB counting. The TB counting also works for systems with little permeant in water (where the net flux is low) and is therefore generally more applicable than the FB counting. FB counting may still be preferable for trajectories with a low output frequency (less than 20 frames/ns for water permeation), where individual transition events may be missed, confounding the TB counting.
Results for the TB counting method for water permeability for 12 different lipid bilayers are presented in Sections 6 and 7 (see Tables 7 and 9), and for oxygen in two bilayers (Table 10). For here it suffices to state that this method yields P = 3.7 ± 0.8 × 10⁻³ cm/s for DLPC, the same as that obtained by the FB method.
Table 7.
Number of number of transits # and permeability P (cm/s ×10−3) for large and small systems specified in Table 6.
| Small | Large | |||||||
|---|---|---|---|---|---|---|---|---|
| lipid | # | 95% CI | P | se | # | 95% CIa | P | se |
| DLPC | 23 | 15–35 | 3.6 | 0.8 | 105 | 86–127 | 3.8 | 0.4 |
| DMPC | 11 | 5–20 | 1.8 | 0.6 | 28 | 19–40 | 2.1 | 0.4 |
| DOPC | 16 | 9–26 | 2.2 | 0.6 | 79 | 63–98 | 1.3 | 0.1 |
| DOPE | 8 | 3–16 | 1.3 | 0.5 | 45 | 33–60 | 0.9 | 0.1 |
| DPPC | 49 | 36–65 | 8.2 | 1.2 | 245 | 215–278 | 6.1 | 0.4 |
| POPC | 9 | 4–17 | 1.4 | 0.5 | 35 | 24–49 | 1.2 | 0.2 |
| POPE | 9 | 4–17 | 1.4 | 0.5 | 21 | 13–32 | 1.5 | 0.3 |
| POPG | 6 | 2–13 | 0.9 | 0.4 | 53 | 40–69 | 1.8 | 0.3 |
| PSM | 16 | 9–26 | 3.0 | 0.8 | 74 | 58–93 | 3.1 | 0.4 |
| SDPE | 19 | 11–30 | 3.1 | 0.8 | 49 | 36–65 | 3.6 | 0.5 |
| PDPC | 28 | 19–40 | 4.1 | 0.8 | 75 | 59–94 | 4.9 | 0.6 |
| PDPE | 28 | 19–40 | 4.5 | 0.9 | 41 | 29–56 | 2.9 | 0.5 |
95% confidence intervals CI and standard errors se calculated as described in text.
Table 9.
Permeability (×10−3 cm/s) of water obtained from simulations for 12 different bilayers by counting (a weighted average and se of the small and large systems) and from the inhomogeneous diffusion equation (ISD) including 95% CI.
| Counting | ISD | |||
|---|---|---|---|---|
| lipid | P | 2 × se | P | 95% CI |
| DLPC | 3.7 | 0.7 | 2.5 | 1.1 – 4.2 |
| DMPC | 2.0 | 0.7 | 1.7 | 0.6 – 4.0 |
| DOPC | 1.5 | 0.4 | 1.6 | 0.4 – 4.0 |
| DOPE | 1.0 | 0.4 | 1.7 | 0.8 – 3.5 |
| DPPC | 6.7 | 0.8 | 7.4 | 2.7 – 16.5 |
| POPC | 1.3 | 0.4 | 2.1 | 0.4 – 5.8 |
| POPE | 1.5 | 0.6 | 2.1 | 0.6 – 3.4 |
| POPG | 1.6 | 0.5 | 1.0 | 0.1 – 3.4 |
| PSM | 3.1 | 0.7 | 2.7 | 0.17 – 6.9 |
| SDPE | 3.4 | 0.9 | 3.4 | 0.8 – 7.0 |
| PDPC | 4.6 | 0.9 | 4.2 | 0.4 – 5.8 |
| PDPE | 3.6 | 0.8 | 3.3 | 1.0 – 6.5 |
Table 10.
Specifications for systems with O2: total trajectory length Trun (ns), number of waters Nw, area/leaflet A (10−13 cm2), average number of O2 in water N, concentration of O2 in water , crossing rate r (1020 cm−2s−1), number of crossings with 95% confidence interval, and permeabilities (cm/s) from Transition-Based counting P (count) with 95% CI, and Bayesian Analysis P (BA)13; the standard error in the BA results is 3%.
| System | Trun | Nw | A | N | cw | counts | r | P (count) | P (BA) |
|---|---|---|---|---|---|---|---|---|---|
| POPC | 612 | 2242 | 2.31 | 0.452 | 10.9 | 52 (39–68) | 3.68 | 17 (13–22) | 26 |
| MITO | 329 | 2890 | 2.75 | 0.583 | 10.8 | 44 (32–59) | 4.87 | 23 (16–30) | 36 |
4.2.2. Relation to Other Counting Methods.
Others138–140 have developed expressions for obtaining permeability from simulations by counting that are essentially equivalent to Eq. (29). All have the form where is a rate and n is an integer that depends on whether is evaluated from: full crossings in either direction (n = 2); escapes from the center to either side (n = 4); crossings of a single leaflet (n = 8). As evident from Eq. (29), n = 2 for the present treatment; Zhu et al.139 also set n = 2 in their study of water transport through Aquaporin-1. De Groot and coworkers138 (n = 8) originally formulated their expressions to evaluate permeation through gramicidin channels, and later applied it to passive permeation though bilayers.141–142 Yang and Kindt140 (n = 4) developed theirs expressly to calculate the permeability of a bilayer with a gel and fluid phase boundary.
In a steady state there are on average twice as many escapes as full crossings (half of the permeants that reach the center of the membrane return to their side of origin). In principle, the statistical precision can be increased by by counting escapes in addition to full crossings because there are twice as many independent events. Both escapes and full crossings are composed of two semipermeation events (one crossing to the center, and one from the center). However, these two crossings are not independent, so the escape and semipermeation methods are of comparable statistical accuracy. A potential drawback of counting partial crossings is that the midplane region must be defined in a narrow range to avoid overcounting, and trajectory frames must be saved frequently to avoid undercounting. Multidimensional reaction surfaces may also complicate the analysis, because the bilayer normal does not provide a complete specification of the transition state. Hence, the precision lost by only counting full crossings is arguably balanced by its simplicity.
4.2.3. Evaluating Crossings.
Evaluating transition rates from simulations requires a definition of a dividing surface that clearly demarks the passage from “reactant” to “product”. The natural location is the transition state. However, because the potential energy at the barrier is flat, rapid recrossings can confound the analysis and lead to an overestimate of the rates. This problem can be circumvented using number correlation functions, where the initial rapid drop in the correlation function is ignored in subsequent fitting and a rate constant can be rigorously obtained.143 When counting the transitions explicitly the dividing surface must be placed well away from the transition state to reduce the possibility that the particle returns to the reactant state before it is stabilized in the product state.144–145
For the determinations of water permeability by counting discussed in this and later sections, the dividing surface was specified to be the phosphate plane of the product leaflet; the center of the bilayer would be a poor choice for water as noted above. The appropriate dividing surface depends on the permeant. As discussed in Sections 5–7, the PMF for O2 in bilayers contains a minimum in the interleaflet region and a maximum in the phosphate plane (essentially the opposite of water). Hence, the dividing surface for assessing O2 exits from membranes is best placed several Å into the water layer.
The following procedure was used here to compute water crossings:
A pre-screening step to identify waters that had visited the bilayer interior as a means of reducing the number of waters to be evaluated for transits.
The system was divided into 5 regions along the z axis, with two bulk water regions at the +z and -z ends of the unit cell, a central midplane region (typically ca. 8 Å wide), and two regions inside the bilayer on either side of the midplane. The phosphate plane was used to define the bulk water boundary.
Each time point for a water was classified into one of the five regions; at t=0, a logical flag was set to indicate the current state based on the region. There are four logical flags, as the two water regions are considered equivalent.
For each successive time point, a change in the region is evaluated, and additional logical flags may be set or cleared, based on the direction of the region change.
For a transit to be counted, the particle must cross into a water region with all three bilayer interior logical flags set to true thereby indicating that the particle entered through the opposing leaflet and passed through the midplane.
4.2.4. Transit Times.
In addition to yielding an accurate value of the number of crossings, this procedure also provides the transit times for the water. DPPC has the largest number of transitions of the 12 bilayers presented in Section 6.6.2 and is best to use for a discussion of the crossing times. While transitions are rare, they are rapid once they begin: the average transit time is 0.51 ns for the bilayer with 72 lipids (denoted small) and 0.58 ns for one with 649 lipids (large). Fig. 17 plots the distribution of crossing times for each. 9 of 49 (18%) transit times for the small system and 49/245 (12%) for the large system are less than 250 ps. The results for the other 11 bilayers are comparable, with approximately 8% of transits requiring less than 250 ps. Fig. 17 includes the transit time distributions for dividing surfaces defined by carbon 2 (C2) of the acyl chains. More than half of the C2-C2 transits are less than 250 ps for DPPC, and 45–50% are under 250 ps for the other 11.
Figure 17.
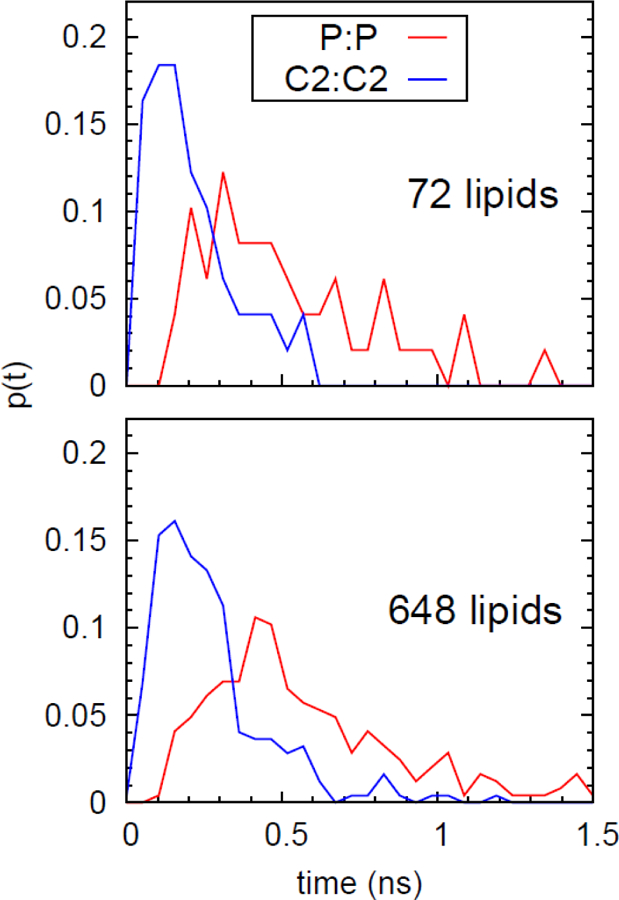
Probability distribution of transit times for waters in bilayers containing 72 (top) and 648) (bottom) lipids, for dividing surfaces placed at the phosphate (red) and C2 (blue) planes.
These rapid transit times are relevant to analyzing simulations run on modern supercomputers, where trajectory frames are saved at relatively widely spaced intervals to reduce storage space. For example, frames are typically saved at 250 ps intervals on Anton146 and Anton 2.147 Consequently, a significant fraction of transitions might be missed with the TB counting method used here.
5. PERMEABILITY FROM MEMBRANE SIMULATIONS: MODELING THE MEMBRANE INTERIOR
Fick’s First Law, which provides theoretical foundation for the counting method used in the preceding section, makes no assumptions regarding the structure of the bilayer: the membrane simply provides a proportionality constant relating the flux and the concentration gradient. The application of Fick’s Second Law to derive the homogenous solubility-diffusion (HSD) model relies on the assumption that the bilayer is a homogeneous slab of material. Of course, the bilayer is not homogeneous, and neither the free energy nor the diffusion rate is constant as a permeant crosses the bilayer. These features limit the kinds of information that can be obtained from measurements that are only interpreted using Fick’s Laws. This section returns to the inhomogeneous solubility-diffusion (ISD) model (Eq. 14) and related theoretical methods that explicitly take the inhomogeneity of the bilayer into account and are commensurate with the length and time scales of atomistic simulations.
5.1. Assumptions and Determining Parameters for the ISD Model
5.1.1. Critical Assumptions.
The first critical assumption of the ISD model is that a diffusion (or Smoluchowski) equation is an accurate model for a particular permeant. It might be helpful to step back and consider the dynamics of a solute of mass in a bath of solvent particles of mass in three extreme cases: (i); (ii); (iii). Case (i) yields a diffusion equation when the collision frequency is infinite and the solute velocity relaxation time is instantaneous; physically, motion can be modeled as diffusive if the momentum relaxation time is very small with respect to the time scale for the displacements of interest. When the velocity relaxation time increases, inertial effects (or drift) become relevant. The diffusion equation is replaced by the Fokker-Planck-Langevin Equation,148–149 and simulations should be carried out with Langevin dynamics rather than Brownian (or diffusive) dynamics.150 Case (ii) is most relevant for modeling the dynamics of dense gases,119, 151 while Case (iii) is applicable for modeling the dynamics of a very small particle trapped in a lattice of large particles. Clearly Case (i) is an idealization, and it would be anticipated that elements of theory developed for Cases (ii) and (iii), including slow relaxation of solvent modes and rapid recoils in local cages made by acyl chains, would be relevant to permeation of small solutes in lipid bilayers.
Returning to permeants in membranes, it was shown in Section 3.3 that the translational dynamics of O2 in hexadecane is clearly not entirely diffusive. Specifically, the mean squared displacement vs. time (Fig. 11) would be entirely linear for purely diffusive dynamics; similar deviations from linearity were observed for oxygen13 and methanol152 in bilayers. Non-diffusive behavior, or anomalous diffusion,153–156 can arise from different sources, including inertial effects (where the dynamics is underdamped at short times), memory effects (where the solvent relaxes slowly with respect to critical dynamical modes, such as barrier crossing), and complexity of the medium (substructures on different length scales). An accurate description of these effects requires extensions of the Smoluchowski equation such as the generalized Fokker-Planck equation (equivalently, the generalized Langevin equation)157 and the fractional Smoluchowski equation.158
The second critical assumption is that F and only depend on z (i.e., the lateral dimensions x and y are averaged). This is a severe approximation for membranes with more than one phase (e.g., liquid ordered and liquid disordered), and the liquid ordered phase itself has substructure159 that would introduce x and y dependence in F and . Hence, Yang and Kindt140 used a transition counting method (see Section 4.2) when estimating permeabilities from the simulations of a DPPC fluid/gel system. However, the lipid/water interface of even a single component fluid phase bilayer might contain many pathways for entrance and exit of permeants that are poorly approximated by a one-dimensional potential of mean force. As already illustrated by Fig. 3, there is considerable, local roughness at the water/bilayer interface. The complexity is not restricted to the interface. For example, cholesterol is oriented along the bilayer normal with the hydroxyl near the lipid surface, but readily translocates (or “flip-flops”) between leaflets.160–161 MD simulations indicate the transition state is in the bilayer midplane with the cholesterol orientation parallel to the surface, and therefore the PMF describing the transition pathway requires two variables, depth in bilayer and tilt.162 Parisio et al.163 used such a 2-D PMF in their extension of the ISD model. Protonation is also relevant, and a 2-D PMF is required to represent the translocation pathway of a lysine analogue.164 The permeation pathway of trimethoprim is also multidimensional.165–166 The permeation of ions across bilayers is not well described by solubility diffusion models,167 which is not surprising: ions, even when hydrated, are virtually insoluble in hydrocarbons. Rather, as shown by Allen and coworkers,167 ions can cross bilayers by distorting the surface to create water filled defects reminiscent of defects induced by charged amino acid side chains.168 The simulation of ion-induced and other defects, transient pores, and stable pores is somewhat outside the scope of this review (see Gurtovenko et al.169 for background), though some recent literature is summarized in Section 9. For here, the relevant point is that pores and defects complicate the description of transition paths.
5.1.2. Determination of F(z).
The simplest way to determine the potential of mean force for a permeant in a bilayer is to run a long simulation and average over many crossings, with the caveat that undulations should be small, suppressed, or otherwise considered. This is presently practical for small solutes such as oxygen and water, but many permeants cross the bilayer too infrequently for a brute force approach to be effective. A straightforward way to sample states not easily accessible by direct simulation is umbrella sampling.109 This was used by Marrink and Berendsen in their original study,9 and by many others in subsequent work. (The more recent ones are discussed in Section 9.) In this method the permeant is restrained to specified locations along the bilayer normal, the positional distributions are obtained, and the distributions are combined to yield a PMF with the bias removed, usually by the Weighted Histogram Analysis Method (WHAM).110–111
A disadvantage of umbrella sampling is that the rate of convergence in each window is comparable to conventional MD, and collective variables can be overlooked. Numerous rigorous enhanced sampling methods have been developed and applied to membranes.170 Replica exchange (REX)171–172 involves simulating the system in multiple baths (usually at different temperatures, but sometimes a term in the Hamiltonian such as the surface tension173 or the umbrellas themselves174) and allowing exchanges between the baths based on a Monte Carlo criteria. REX has been used to accelerate peptide insertion173, 175–176 and lipid mixing,177 and to generate PMF of permeants.178
Metadynamics179–180 and milestoning181–183 are recently developed and promising methods. In the former biasing potentials are added during the trajectory to force the system to sample new regions on the potential energy surface. Metadynamics has been applied to translocation pathways of cell-penetrating peptides184 and a lysine analogue. Milestoning involves generating numerous trajectories at specified “anchor domains” and determining the mean first passage times (milestones) between these domains. It has been used to simulate peptide185 and water186 permeation though DOPC. More recent applications of both these methods to permeability are discussed in Section 9.
As a note of caution relevant to some sampling methods, the membrane surface area is sensitive to temperature. For example, simulations of DOPC yield surface areas (in Å2/lipid) of 68.9 ± 0.7, 70.8 ± 0.8, 73.3 ± 0.8, and 86.2 ± 0.5 for 25, 45, 65, and 150 °C, respectively. The area expansion leads to thinning, as is reflected in the water PMFs (Fig. 18). Pores also spontaneously form in the membrane at high surfaces areas and would corrupt estimates of permeability. The boiling point of TIP3P is 92 °C (estimated from the vapor pressure calculations of Vega et al.187) and vapor bubbles will be expected to form as this temperature is approached. Boiling might not readily occur because of periodic boundary conditions and small system size but is also a concern. The preceding effects reduce the efficiency of transfer of configurations among baths in a method like REX and limit the temperature range that can be sampled. Membrane area expansion, bubble formation, and boiling could be avoided by running at constant volume, but at the cost of increasing the pressure and thereby decreasing conformational sampling. Another sampling method is to run conventional MD at elevated temperatures. This can be useful for exploratory studies and has the advantage of simplicity. For example, trajectories carried out at 140 °C on the antimicrobial peptides alamethicin188 and piscidin 1189 effectively distinguished their ability to form pores in membranes, and high temperature simulations (80–160 °C) of other antimicrobial peptides have led to mechanistic significant insights regarding translocation and defect formation.190–192 However, conclusions from high temperature MD studies are likely compromised by the considerations noted above, and more rigorous methods are recommended for quantitative studies.
Figure 18.

PMF for water in DOPC at 4 different temperatures.
5.1.3. Determination of D⊥(z).
As noted above, insufficient sampling is challenging when extracting thermodynamic properties like free energy profiles, and sampling considerations remain a concern for dynamic properties. Determination of the z-dependent diffusion constant for a permeant in a membrane is further complicated by two factors. The first is that the potential of mean force can be a rapidly varying function of position; this makes averaging over a short time optimal, where is relatively constant. The second is that the short-time dynamics contains contributions from inertial and solvent memory effects, as already shown in Section 3.3.2; this makes averaging over a long time optimal, where diffusive motion dominates. The same considerations hold for determination of lateral diffusion. Diffusion on a flat potential energy surface is traditionally pictured by analogy to a random walker. The walker is now on an icy ski-slope.
The preceding considerations rule out determining the diffusion constant from the long-time slope of the mean squared displacement as for homogeneous fluids. One class of methods utilizes a local approximation. Marrink and Berendsen9 used the fluctuation dissipation theorem193 to obtain from the integral of the force autocorrelation function
| (30) |
where . is then obtained from the Einstein relation (Eq. 17). Because the water was restrained to a specified location using umbrella sampling, the resultant diffusion constant contains some contribution from both the restraining potential and underlying PMF of the bilayer. These artifacts can be mitigated by constraining the permeants at z positions, rather than using a harmonic restraint,194 so that the PMF and diffusion profile are evaluated from separate sets of simulations.
Others have used the framework of the generalized Langevin equation (GLE), estimating position-dependent diffusion constants from autocorrelation functions in restrained MD simulations. In these methods, the membrane is modeled as a frictional bath that acts on the permeant, which is modeled as a harmonic oscillator. The method by Roux and co-workers195–197 uses the Laplace transform ℒ(s) of the velocity autocorrelation function and determines the local diffusion coefficient in the limit s = 0 by extrapolation. Hummer198 proved an equivalent expression which instead uses the position autocorrelation function, avoiding Laplace transform and extrapolation. Although theoretically equivalent, these two methods perform differently in simulations. Gaalswyk et al.199 observed that Roux’s method was sensitive to the restraining potential’s force constant and overestimated water diffusivity inside a DPPC bilayer by 15%. In contrast, Hummer’s method underestimated diffusivity by 50%, due to long-lived correlations of the position autocorrelation function. Similar issues with these methods were found by Lee et al.178
If there is sufficient sampling of permeant in the membrane, diffusivities may also be obtained from unrestrained conventional MD simulations. Im and Roux200 developed a simple to implement method based on the mean squared deviation of local displacements:
| (31) |
where , and is a suitably small interval (several ps). For diffusive motion on a linear free energy profile, theoretically follows a Gaussian distribution, where the mean and variance represent the slope of the free energy profile and local diffusion constant, respectively. Eq. (31) has been used for ions in channels.200–201 However, for applications to bilayer permeation, would need to be small enough to justify the assumption of a locally linear free energy. On this time scale, the behavior of quickly diffusing permeants may no longer be diffusive. This dilemma motivated the development of a methods that model local displacements by taking into account local variations of the free energy. These are discussed in the following paragragraphs.
A global method for obtaining a position dependent diffusion constant was developed by Hummer198 using Bayesian analysis. This approach discretizes the simulation domain into equidistant bins and counts particle transitions between these bins. To find the diffusion and free energy profiles that optimally explains the observed transition counts, , trial profiles are randomly sampled using a Monte Carlo procedure. The plausibly of each pair of profiles (which in turn defines a likelihood for the Monte Carlo sampling) is assessed by relating the free energy and diffusion constant to a matrix R of transitions via a (Smoluchowski) diffusion equation. This set of transition rates between adjacent bins determines the temporal evolution of the particle distribution
| (32) |
which can be used to define an appropriate log-likelihood function as
| (33) |
By sampling profiles according to Eq. (33), the averages provide the optimal solution for the free energy and diffusion profiles that underlie the observed transition counts. In effect, the model (Smoluchowski Equation with and ) becomes the optimal representation of the more detailed all-atom model.
Hummer’s initial application was to the torsion angle of a peptide in water. The approach was later adapted by Carpenter et al.202 to membranes where the natural coordinate is the normal, and further extended by Ghysels et al.13 to analyze diffusion parallel to the surface (see following subsection). While Hummer’s original approach is restricted to simulations that provide sufficient sampling of permeant in the membrane, Chipot, Comer and co-workers incorporated time-dependent adaptive biasing forces203 and applied this extension to calculate diffusion constants in biased simulations of urea, benzoic acid, and codeine in DMPC bilayers.178 They identified subdiffusive behavior of small permeants in the bilayer interior152 and adapted the Bayesian analysis to capture this position-dependent fractional diffusivity.152, 158 This feature of their BA is absent in all other methods to obtain membrane diffusivities. They also found that the BA and the GLE method produced diffusion profiles in rough agreement, where the BA consistently yielded slightly larger values. Both methods depend on non-trivial parameters (the lag time for the BA, and harmonic force constant of the umbrella window for the GLE) that may compromise the permeability estimate if not chosen carefully.
5.2. Lateral Diffusion of Permeants
The extension of Hummer’s method by Ghysels et al.13 involved solving the Smoluchowski equation with radial terms in the presence of a potential along the bilayer normal to self-consistently obtain , , and :
| (34) |
where is the spatial probability distribution of the particle at time t and is the diffusion tensor at position . Now assume translational symmetry in the xy-plane, so and are only functions of z (the bilayer normal). The diffusion tensor simplifies:
| (35) |
where and are the components of the tensor in the xy-plane and normal to the bilayer, respectively. Eq. (35) may now be separated into radial and normal parts
| (36) |
where, for notational convenience,.
Fig. 19 shows the results for oxygen in POPC. The PMF (top panel), now referred to as , varies qualitatively from that of water, in POPC (Figs. 2 and 5). O2 is highly soluble in the center of the bilayer, as would be anticipated from its hydrophobicity. Upon crossing the barrier region near the head groups, it rapidly diffuses to the center of the bilayer. The two diffusion constants (middle panel) are similar, with a little larger than . is also similar to that of water in a bilayer calculated by the same method (Fig. 6). In both cases diffusion is slow near the head group, and rapid (approximately the same as in hexadecane) in the bilayer center. This is consistent with the electron density and fractional free volume (bottom panel of Fig. 19).
Figure 19.

Bayesian analysis for oxygen diffusion in POPC at 37 °C: (a) potential of mean force ; (b) and ; (c) free volume and electron density of the lipid bilayer. Adapted with permission from Ref. 13. Copyright 2017 American Chemical Society.
The potential energy minima and high value of in the bilayer center imply that O2 can travel substantial distances within the bilayer before exiting. To quantify this dynamics Ghysels and coworkers14 developed explicit expressions for characteristic times and lengths for normal and lateral diffusion within the context of the ISD model. As shown in Fig. 20, these are:, the average time to reach the center of the bilayer from the water layer;, the time to exit the bilayer from the center;, the time between entering the bilayer on one side and exiting the other side;, , and , the average lateral distance travelled during each of the preceding times. These are listed for POPC in Table 5. As expected from , and by construction . A particularly important observation is that is approximately 3 times the bilayer thickness. As consistent with the Poisson nature of the escape process (and thereby exponential distribution of escape times), there is a large spread in and . The largest observed in the simulations (4 replicates of bilayers with 10 O2) are 297 ns and 437 Å, respectively. These are approximately 3 times the averages, so the maximum is 10 times the bilayer thickness.
Figure 20.

Sketch of a membrane of height h, with schematic trajectories (in red) illustrating the three different characteristic times and lengths of a permeant: entrance, escape, and crossing. Adapted with permission from Ref. 14. Copyright 2018 American Chemical Society.
Table 5.
Selected characteristic times (τ ) and lengths for O2 in POPC 37 °C from Bayesian analysis.14
| Property | enter | escape | cross |
|---|---|---|---|
| 0.5 | 22.7 | 23.2 | |
| 14.6 | 145 | 147 |
The preceding results inform the modeling of a critical step in energy transduction in cells: the capture of oxygen by the intrinsic membrane protein cytochrome c oxidase (COX).204–205 After entering the mitochondrial (or bacterial) membrane, an oxygen molecule can either laterally diffuse to the binding site of COX located near the membrane center or exit on either side without binding. The simulations reveal how the bilayer structure helps provide adequate time for O2 to locate the binding site. The potential energy barrier at the surface and minimum in the center trap the oxygen in the plane of the binding site, and the large free volume in the center leads to a high lateral diffusion constant. The permeabilities of O2 in DOPC and other bilayers computed with the ISD method are presented in Section 7.
6. SYSTEM SIZE EFFECTS IN MEMBRANE SIMULATIONS
This Section concerns the effects of undulations and periodic boundary conditions (PBC) on evaluating membrane permeability of water and oxygen from simulation using the methods described in Sections 4 and 5.
6.1. Undulations
6.1.1. The General Problem.
Undulations in the membrane surface increase with system size. They can in principle affect the placement of dividing surfaces required for counting of transitions, and the evaluation of the potential of mean force required for the inhomogeneous solubility diffusion model.
Consider the sketches in Fig. 21. The top figure depicts a small system (approximately 72 lipids) which is globally flat. The center of the bilayer (dotted line) is equidistant from the average water/bilayer surface (blue lines), and there is no ambiguity of the meaning of with respect to the surface. When system size increases (Fig. 21, bottom), the local and average global surfaces differ in position, and, in this (exaggerated) example, the midplane extends beyond the average global surface. The potential of mean force calculated with respect to the average midplane (z = 0) will clearly not be representative of the system. While it is possible to remove the undulations,206–207 as is required when comparing simulations of large bilayers with x-ray scattering data, it is not trivial and not commonly done in other studies.
Figure 21.

Sketches of small (top) and large (bottom) bilayers (green) of thickness h in water (light blue), with bilayer midplanes in dashed black lines, and the water/bilayer interfaces in blue lines. The small bilayer, representative of simulation with 72 lipids is locally and globally flat. The large one has undulations and is locally flat but globally curved.
6.1.2. Water.
The warning concerning undulations is not hypothetical. Fig. 22 plots for DPPC for water from different sized systems (the N=72 result is included in Fig. 5). Water is only sparingly soluble in bilayers, so has a maximum in the center of the bilayer. For small systems, is close to flat for |z| < 5 Å. Undulations in the larger systems bring the local water/lipid interface below the average global interface, and thereby narrow the PMF. The local structure of the bilayer remains the same for all sizes (e.g., the thickness h is constant), but the PMF calculated from a simulation will be corrupted if used without correction.
Figure 22.
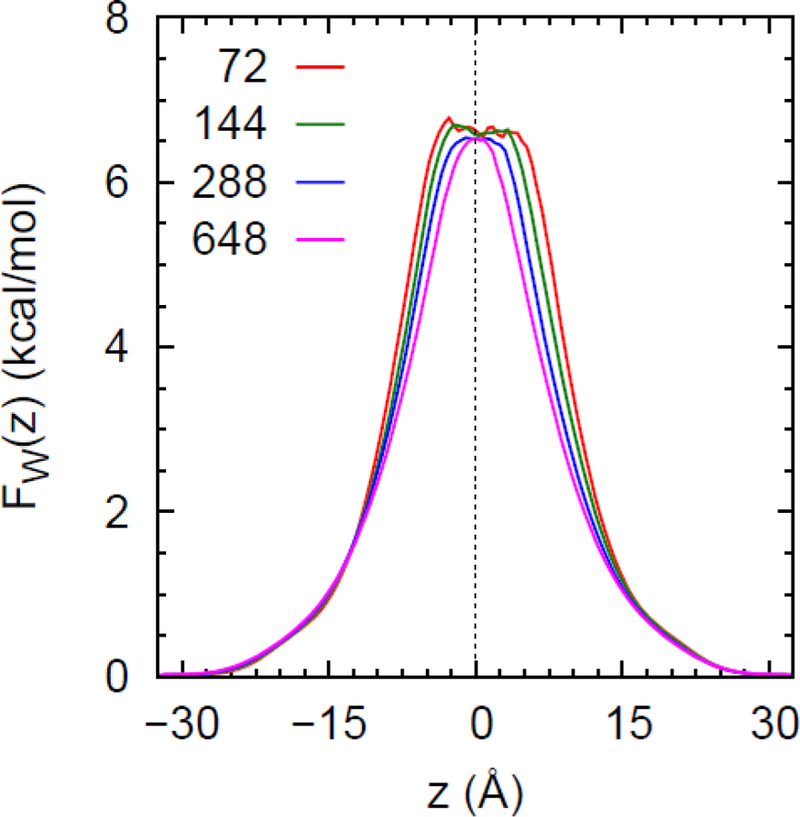
Potentials of mean force for water (calculated without removing undulations) in DPPC bilayers of 4 sizes.
To assess the effect of undulations on MD simulation-based estimates of water permeability the results from trajectories of 12 different lipid bilayers at two different sizes, denoted small (mostly 72 lipids) and large (mostly 648), are compared here. The simulation protocols are reported in ref 38, which focused on the mechanical properties of these bilayers. Some of the simulations were extended and DLPC was added. The relevant system parameters are listed in Table 6.
Table 6.
Specifications for small and large systems: temperature T (°C), trajectory length Trun (ns), number lipids NL, number of waters Nw, and area/leaflet A (nm2).
| Small | Large | ||||||||
|---|---|---|---|---|---|---|---|---|---|
| lipid | T | Trun | NL | Nw | A | Trun | NL | Nw | A |
| DLPC | 30 | 400 | 72 | 2880 | 22.9 | 200 | 648 | 25920 | 206.6 |
| DMPC | 30 | 400 | 72 | 1848 | 22.3 | 100 | 648 | 16635 | 199.2 |
| DOPC | 25 | 400 | 80 | 3040 | 27.6 | 400 | 648 | 24624 | 223.1 |
| DOPE | 25 | 400 | 72 | 2304 | 22.4 | 350 | 648 | 20736 | 202.0 |
| DPPC | 50 | 400 | 72 | 2189 | 22.7 | 300 | 648 | 19701 | 204.1 |
| POPC | 30 | 400 | 72 | 2242 | 23.8 | 200 | 648 | 20178 | 213.4 |
| POPE | 37 | 400 | 80 | 2561 | 23.5 | 100 | 720 | 20744 | 211.2 |
| POPG | 30 | 400 | 72 | 3240 | 24.4 | 200 | 648 | 29160 | 218.6 |
| PSM | 48 | 400 | 72 | 2092 | 20.0 | 200 | 648 | 18828 | 178.6 |
| SDPE | 30 | 400 | 72 | 2880 | 23.0 | 100 | 648 | 25920 | 201.1 |
| PDPC | 30 | 400 | 72 | 2592 | 25.6 | 100 | 648 | 23328 | 229.3 |
| PDPE | 30 | 400 | 72 | 2880 | 23.3 | 100 | 648 | 25920 | 208.3 |
Table 7 lists the number of transitions and permeabilities obtained from each trajectory. The 95% confidence intervals (CI) for the number of transitions assume a Poisson distribution;208 the standard errors on the permeabilities were estimated as the average 95% CI of the counts divided by 2. The number of counts ranges from 6 (POPG) to 49 (DPPC) for the small systems, which leads to standard errors of 15–46%. There are more counts in the large systems, and the standard errors in P are smaller, 6% for DPPC to 23% for POPE. The highest number of counts is for the DPPC, which is simulated at 50 °C, a temperature significantly higher than most of the other bilayers; PSM is simulated at 48 °C but is more tightly packed that DPPC and its permeability is much lower. A comparison of permeabilities from the large and small bilayer for each lipid shows the following: (1) the 95% confidence intervals for small systems bracket the means for the large systems for all 12 bilayers; (2) values of P are higher for the small systems in 7 cases and lower in 5; (3) a paired t-test between the two sized systems yields p = 0.46. All three measures indicate no statistically significant difference between the small (72–80 lipid) and large (648–720) systems, even though the calculated varies with system size (Fig 22). This is because the dividing surfaces used to register transitions are placed outside of the region where varies.
The situation for the Bayesian analysis (BA) described in Section 5.2 is not the same as for a counting method. Here the BA must develop and consistent with the Smoluchowski Equation (or ISD model) over the entire range of z. The resulting for POPC plotted in Fig. 23 obtained by BA (solid lines) are close to those obtained by direct evaluation (dotted lines) for both large and small systems and show the same narrowing as systems size increases. This implies a potential problem with the analysis for larger systems. However, as will be shown in Section 7, because of poor sampling the statistical uncertainty in the permeabilities obtained from the BA is too large to allow satisfactory comparison of the small and large systems.
Figure 23.

Potentials of mean force for water (calculated without removing undulations) from Bayesian analysis (solid lines) and directly from the trajectory (dotted lines) of POPC bilayers consisting of 72 (area per leaflet A = 27.6 nm2) and 648 (A = 213.4 nm2) lipids.
6.1.3. Oxygen.
O2 is highly soluble in the bilayer, but there is a barrier separating the water and the interior (Fig. 19, top), as opposed to a barrier in the bilayer center for water. Fig. 24 plots the PMF for O2 from simulations of POPC bilayers with 72 (L=5 nm) and 288 lipids (L=10 nm). Here the undulations reduce the barrier as the system size increases.
Figure 24.
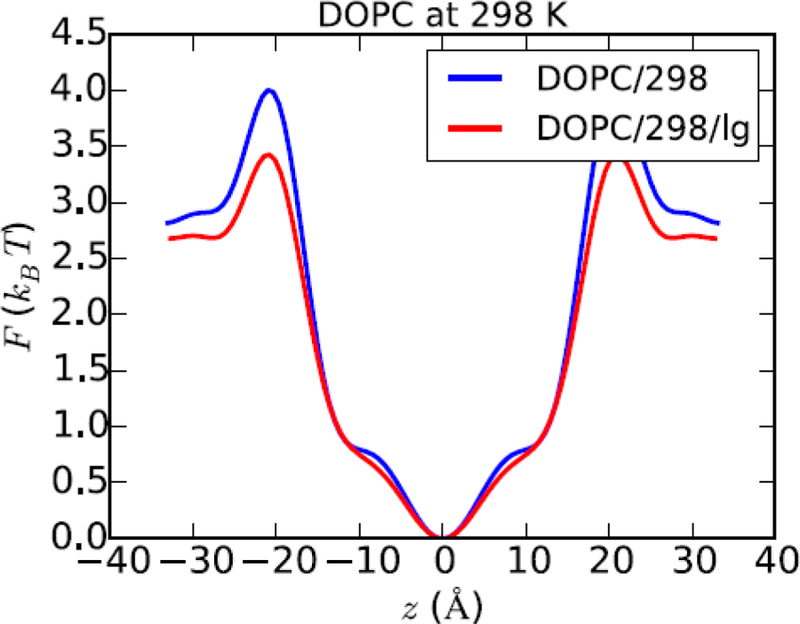
Potentials of mean force for oxygen in DOPC bilayers of 72 (blue) and 188 (red) lipids. Adapted with permission from Ref. 14. Copyright 2018 American Chemical Society
Table 8 compares and (see Fig. 20) evaluated directly from the trajectory and with BA at two different dividing surfaces for the two system sizes. Though the averages calculated directly from the trajectory contain high uncertainty, their differences are not statistically significant; i.e., the average over the 4 simulations and are within the error range of each simulation. from the BA differ by over 20%, well above the 3% errors for the method, and as would be expected from the lowered barrier. The difference in are slightly less, but still larger than the statistical errors. Hence, as for water, direct evaluation of the properties which involves placing a “physically reasonable” dividing surface is relatively insensitive to the size variation examined here for counting methods. Much larger systems, as is commonly simulated using coarse grained models, would require more care. The Bayesian methods, while leading to higher precision, are also more sensitive to the effects of undulations.
Table 8.
Escape times and lengths for O2 in DOPC bilayers of two different sizes L evaluated directly from the trajectory and from Bayesian analysis (BA) for 2 different cutoffs . Adapted with permission Ref. 14. Copyright 2018 American Chemical Society.
| Trajectory | BA | ||||
|---|---|---|---|---|---|
| Property | L=5 nm | L=10 nm | L=5 nm | L=10 nm | |
| 25 | 40 ± 10 | 35 ± 9 | 31.7a | 24.2 | |
| 35 | 45 ± 11 | 42 ± 10 | 34.9 | 27.2 | |
| 25 | 146 ± 57 | 106 ± 36 | 146 | 120 | |
| 35 | 157 ± 60 | 146 ± 65 | 153 | 127 | |
statistical errors for BA approximately 3%
The effect of undulations can be reduced by raising the dividing surface with respect to the bilayer/water interface so that the local dividing surface is always below the global one. This increases average escape times because some particles will need to travel through solvent before being counted as exiting the bilayer.
6.2. Periodic Boundary Conditions
6.2.1. The General Problem.
It was shown in Section 3 that effect of periodic boundary conditions on the diffusion of oxygen in simulations of neat octane, dodecane, and hexadecane is negligible when the edge lengths of the cubic cells are increased from L= 5 to 10 nm). However, as will be reviewed below, effects of PBC on lipid and protein diffusion are huge for simulations of lipid bilayers of these sizes. Hence, the importance of these effects on diffusion of permeant-size solutes must be ascertained.
For a quick estimate of the PBC effect on diffusion in a homogeneous medium it is useful to write Eq. (20) as follows:
| (37) |
where is the correction. Assuming that the object is a sphere with friction described by Stokes’ Law with stick boundary conditions,
| (38) |
Eqs. (37 and 38) yield the simple relationship:
| (39) |
Hence, for a particle with a = 1.6 Å (water-sized) in a 50 Å box, the Yeh-Hummer correction is approximately 10%. The correction is nearly 50%, for a lipid-sized particle (a ≈ 8 Å), but it can be reduced to 10% by a four-fold increase in L.
No such easy solution is available for diffusion in membranes. Here the hydrodynamics is 2-dimensional, and the interactions are very long-ranged. It is well established that the diffusion of large membrane proteins209 is described by the Saffman-Delbrück (SD) model:210
| (40) |
where a is the radius of the protein (assumed to be a cylinder spanning the membrane), ηm is the membrane surface viscosity, is the bulk viscosity of the surrounding fluid, and γ is Euler’s constant. A generalization of the SD model for lipids (where the cylinder spans only half the bilayer) includes the value of the interleaflet friction.211 2-D hydrodynamics dominates below the Saffman-Delbrück length LSD = ηm/2ηf. Inserting parameters that are consistent with observed diffusion constants of lipids and proteins yields LSD = 100–200 nm. This is vastly larger than the size of membranes in simulations, where L = 5–10 nm for all-atom systems. Camley et al.211 developed a theoretical treatment for the PBC effect for lipids and proteins in bilayers based on the SD model. While a thorough validation of the model is difficult, all-atom and CG simulations by Venable et al.212 and Zgorski and Lyman213 provide strong support. The results are sobering: diffusion constants of lipids are underestimated by a factor of 3 when L = 5 nm, and the underestimate for a large protein such as galactose transferase (R = 4 nm) is a factor of 10. An independently derived treatment by Vögele and Hummer214 predicts similar underestimates, and subsequent tests Vögele et al.215 on assorted large (>108 coarse-grained particles) systems further confirm the effects.
6.2.2. Water and Oxygen.
While the preceding results are of concern for large permeants, they are not necessarily relevant for small ones such as water or oxygen. Furthermore, as already shown in Section 3.3.2, the behavior of O2 in alkanes is not even well described by continuum hydrodynamics. Since a theory for PBC effects on normal and lateral diffusion of small permeants in membrane is not presently available, the level of artifacts must be determined empirically; i.e. the relevant properties must be evaluated for different system sizes and compared.
Hydrodynamic treatments for periodic boundary conditions such as those noted above predict that diffusion constants should increase as system size increases, which would increase permeability. The results in Table 7 indicate that there is no significant difference in permeabilities of water in 12 different bilayers when the system size is increased from L ≈ 5 nm to 15 nm. Table 8 shows simulation results for O2 for an increase of L from 5 to 10 nm when and are calculated directly from the trajectory.
Hence, on basis of this arguably limited data set, it can be concluded that PBC effects are small for diffusion of water and oxygen in membranes. These results do not follow a priori from those obtained in Section 3 for oxygen diffusion in neat alkanes because membranes are not isotropic.
7. COUNTING, ISD, AND EXPERIMENT
This section presents tests of the inhomogeneous solubility-diffusion model for water and oxygen and comparisons with experiment.
Permeabilities for water and oxygen were obtained from the Transition-Based counting method described in Section 4.2. ISD-derived permeabilities for oxygen were calculated according the Bayesian analysis method reviewed in Section 5.2 and involved a joint refinement of and .13 This approach did not work well for water, where sampling in the hydrocarbon core was sparse. The BA was therefore adapted as follows: Firstly, the Monte-Carlo sampling was replaced by a maximum-likelihood estimation, allowing more efficient optimizations of the diffusion profiles. These optimizations were performed using an efficient derivative-free optimization method, the Covariance Matrix Adaptation-Evolution Strategy (CMA-ES).216 Secondly, the free energy profiles were excluded from the optimization and obtained directly from the water distributions, in order to use the available transition data solely for determining the diffusion profiles. Thirdly, the diffusion profiles were approximated by low-order cosine series (4 to 6 cosine terms), avoiding unreasonable oscillations due to insufficient sampling. Finally, the diffusion profiles were extrapolated to infinite lag times over the range of six lag times ranging from 10 to 60 ps. Including six data points into this linear fit led to robust estimates for each of the twelve bilayers. Statistics of the permeabilities were obtained over four replicas per bilayer (100 ns each) and over the three different numbers of cosine basis functions.
Escape times and lateral distances of oxygen are obtained directly from the trajectory and from BA as described in ref. 14. The , , and obtained from BA presented here are appropriate to insert into the ISD model (Eq. (14)) for this test because they were obtained by globally optimizing the fit to the Smoluchowski equation, as opposed to, for example, a local method using umbrella sampling at selected points along the bilayer normal.
7.1. Comparison of Counting and ISD
7.1.1. Water.
Table 9 and Fig. 25 compare the permeabilities of the set of 12 bilayers as determined by counting and the BA. The 95% CI for BA are huge, extending from half to twice the average in most cases, and overlap the values from counting in all cases. No trend is evident. There is no evidence from this comparison that the ISD model is inaccurate, though it will be of interest to compare the methods using data from much longer trajectories.
Figure 25.

Comparison of permeabilities from counting and Bayesian analysis (BA) for 12 lipid bilayers. The 95% confidence intervals for each method are plotted in separate panels for clarity.
7.1.2. Oxygen.
Table 10 compares the permeabilities for two bilayers as obtained from Transition-Based Counting and the BA for POPC and a model of the lipid composition of the inner mitochondrial membrane, is denoted MITO. Four replicates were generated for each, and the simulations continued until each O2 exited the bilayer at least once. Here the permeabilities from the BA are quite precise because the bilayer interior is well sampled. The permeabilities from counting are somewhat lower than those from the BA reported in ref. 13, though the 95% confidence intervals are large.
In addition to the POPC (at 37 °C), MITO (37 °C), and DOPC (25 °C) bilayers containing oxygen just presented, De Vos et al.14 simulated 5 other bilayer/oxygen systems: DOPC (37 °C), and DOPC, POPC, and DPPC (50 °C) using the same protocol (4 replicates with 10 O2).
As shown in Fig. 26, the 95% CI of (a quantity related to P) and obtained directly from each system (labelled TRAJ) bracket the values obtained from BA (where the statistical errors are comparable with the size of the symbol). Hence, the results for from any individual system would not allow the inference that there are systematic errors in the BA. However, note that the values of for the BA are lower than those of TRAJ in 7 of 7 cases. The nonparametric Wilcoxon sign-rank test217 indicates that the probability of this result occurring by chance is less than 0.05 (comparable to the probability of flipping 7 heads in a row), indicating a statistically significant difference. While the average difference, approximately 20%, is relatively small, it does imply a systematic flaw in the ISD model for the permeability of oxygen and is thereby consistent with the underestimate for P shown in Table 10. As is evident from the potential of mean force shown in Fig. 19 top, O2 must cross a relatively narrow barrier in the head group region when exiting the bilayer. This is a case where a diffusion equation with a 1-dimensional potential along the bilayer normal might not adequately represent the underlying physics of the barrier crossing: the pathway might be multi-dimensional, and relaxation of the head group positions might be slow with respect to the oxygen. These effects could, in principle, confound accurate fitting by Bayesian analysis based on the ISD model. In contrast, values of show no such trend. This is because for O2 measures a distance which is mostly accumulated in the bilayer center, and complications at the interface do not change the average significantly.
Figure 26.

Comparison of escape times (top) and travelled radial distance (bottom) for 7 bilayers from Bayesian analysis and simulation (with 95% confidence intervals). Adapted with permission from Ref. 14. Copyright 2018 American Chemical Society.
7.2. Comparison of Simulation and Experiment
7.2.1. Water.
Table 11 compares the simulation and experiment for 5 of the bilayers. As anticipated from the too large free energy transfer of water to hexadecane, for the C36 FF (Section 3.3, Table 3), the permeability in bilayers simulated with the additive FF C36 substantially underestimates experiment. The errors range from a factor of 3 (DLPC, the shortest tails) to 4 (DMPC and DPPC, longer saturated tails) to 10 (DOPC and POPC, unsaturated chains).
Table 11.
Comparison of permeability (×10−3 cm/s) of water from simulation (Counting) and available experimental values.11 Temperatures for the simulated systems are listed in Table 7; the experimental results are presented with standard errors; P for DPPC222 was determined at 50 °C (the same temperature of the simulation) and the others11 are at 30 °C (at or close to the simulations).
| Counting | Expt | ||
|---|---|---|---|
| lipid | P | 2 × se | |
| DLPC | 3.7 | 0.7 | 10.4 ± 0.5 |
| DMPC | 2.0 | 0.7 | 8.3 ± 0.76 |
| DOPC | 1.5 | 0.4 | 15.8 ± 0.58 |
| DPPC | 6.7 | 0.8 | 27 ± 4 |
| POPC | 1.3 | 0.4 | 13.0 ± 0.44 |
The large difference between simulation and experiment could, in principle, be explained by the presence of transient pores in the experiment. The significant water and ion leakage in bilayers has been observed experimentally near phase transitions has been attributed to such defects,218–219 and pores in bilayers can be generated by ultrasound electric fields (see Section 9.1.5). That stated, there is a strong consensus from experiment1, 16 that water permeation in non-stressed fluid phase bilayers is diffusive and single-molecule. Simulations, including the ones presented here, all arrive at the same conclusion. Water wires explicitly constructed in bilayers for exploratory simulations220–221 were shown to be energetically very unfavorable and short-lived. Hence, it is reasonable to attribute the discrepancies in Table 11 to simulation.
As will be shown for POPC in Section 8.1 with compartmental models, reducing the PMF in a manner consistent with the Drude polarizable FF considerably improves agreement with experiment. Additionally, Krämer et al.44 obtained the water permeability for DOPC in good agreement with experiment by modifying the water-alkane interactions in the C36 FF to match the free energy of transfer of water to hexadecane.
The permeability for DPPC from simulation listed in Table 11, 6.7 ± 0.4 ×10⁻³ cm/s, is approximately half that obtained with recent values obtained with other additive FF and methods (see Table 1 of ref. 223); i.e., these underestimate experiment by a factor of 2. It is worth revisiting the water permeability, 70 ± 30 ×10−3 cm/s at 77 °C, determined by Marrink and Berendsen9 in 1994. A united atom FF was utilized for the lipids which would be expected to lead to an overestimate of the water diffusion constant in the bilayer. The free energy maximum in the bilayer center, 26 kJ/mol (6.05 kcal/mol) is lower and more accurate than C36. The preceding factors (higher temperature, higher diffusion constant, and lower barrier) increase permeability. All things considered, their result is in impressive agreement with the others given the vintage.
While a satisfactory analysis must await simulations generated with a more accurate, likely polarizable, FF, the present results do yield insight into the observation of Nagle and coworkers12 that water permeability is proportional to lipid surface area. Fig. 27 plots the P versus surface area for the 10 of the 12 bilayers simulated here and the corresponding values obtained from experiment (DPPC and PSM are not included because they were simulated at higher temperatures than the others). While the simulated values are scattered, they do follow the trend. Fig. 28 plots the average number of water-carbonyl hydrogen bonds as a function of surface area for the bilayers shown in Fig. 27. From here it is clear that waters bind more readily to carbonyl groups at higher membrane surface area, including DOPG. The carbonyl frequently fluctuates below the C2 plane, facilitating direct contact of its associated water with the hydrocarbon interior of the membrane (see Fig. 3), and thereby lowering and increasing the permeability.
Figure 27.

Permeability vs. surface area from simulation (colored symbols) and experiment (black triangles).
Figure 28.

Average number of hydrogen bonds to water per carbonyl oxygen for the lipids shown in Figure 27.
7.2.2. Oxygen.
The simulated permeability of oxygen in a POPC bilayer is 26 cm/s at 37 °C (Table 10). It substantially underestimates the experimental value224 of 157 cm/s at 35 °C. While the latter is on the high side of experimental values225 in fluid phase bilayers, it is comparable to those obtained by Subczynski et al.226 for DMPC (125 cm/s at 29 °C) and DOPC (114 cm/s at 29 °C), and by Dzikovski et al.227 for DMPC (210 cm/s at 39 °C). Here the transfer free energy into the bilayer center is not the only problem. The water/hexadecane partition coefficients of O2 from simulation (at 37 °C) and experiment45 (22 °C) are 17 and 8.2, respectively. Assuming that the partition coefficient (as opposed to the solubilities) is relatively insensitive to temperature, the simulated permeability should be too high, not too low. has a barrier at the bilayer/water interface (Fig. 19, top), and it is shown in Section 8.2 that the height of this barrier has a dramatic impact on the permeability.
Recent simulations of Pias and coworkers228 using an oxygen model based on the General Amber FF229 (an additive force field qualitatively similar to C36) also underestimated the permeability of O2 in POPC relative to electron paramagnetic resonance (EPR) estimates.224, 226–227 They also raise the possibility of probe-related artifacts associated with the EPR oximetry measurements.228, 230 Marrink and Berendsen231 obtained 200 ± 50 cm/s at 77 °C for the permeability of O2 in DPPC in 1996, as would be expected given the higher temperature and united atom FF. The oxygen model used for these simulations is quite simple, two uncharged Lennard-Jones spheres. The realism of the model would be increased by adding a quadrupole moment108 as well as polarizability.
8. COMPARTMENTAL MODELS FOR WATER AND OXYGEN PERMEABILITY
Compartment models, introduced inSection 2.5, allow a quick estimate of permeability by dividing the bilayer into a small number of slabs with fixed permeant free energies and diffusion constants. The homogeneous solubility diffusion model is a single compartment model, and as shown in Section 2.2, a hexadecane slab provides an entry point for order-of-magnitude modeling of the permeability in membranes. However, 1-compartment models are limited by the difficulty in assigning parameters that represent an average of the contributions from the head groups and chains, and 3-compartment models have been used in numerous studies.12, 28, 30, 232–234 This section develops a 3-compartment model for water and a 5-comparment one for oxygen to illustrate this style of modeling. A POPC bilayer is used for both examples. It useful to specify two critical dimensions obtained from simulations for this bilayer at 30 °C:38
. This is the distance between the C2 carbons on the acyl chains on opposite leaflets which serves as an approximate measure of the hydrocarbon thickness in a bilayer. This quantity is close to defined by Nagle and coworkers.34, 235 It is not equivalent because is obtained from the Gibbs dividing surface236–237 (specifically, the methylene volume component at the bilayer/water interface is divided near its inflection point, as is easy to see in Fig. 3 of ref. 34).
. The distance between the phosphate groups on the headgroups on opposite leaflets.
Hence, when the bilayer center is placed at z = 0, the acyl chains of POPC are primarily located between ± 13.75 Å. The densest portion of the headgroup is the slab between the C2 and P planes, and the outer edge of the bilayer is at ± 25 Å (Fig. 2).
8.1. Water
Figure 29 compares the PMFs (top) and diffusion constants (bottom) for water in the hexadecane slab and the 72-lipid POPC bilayer. While the heights and shapes of the two are very similar in the center of the hydrocarbon regions (z = 0), the PMF in the bilayer is substantially broader. As already shown in Fig. 2, a POPC bilayer is highly solvated between the C2 and phosphate planes, and there is some water in the hydrocarbon region between the C2 planes. The peaks at z = 0 are approximately 2.5 × 10⁻⁵ cm2/s, though the confidence intervals are broad (as anticipated from the results in Section 7.1.1); these peak values are nearly half that of water in hexadecane, 4.31 × 10⁻⁵ cm2/s. However, while for water remains relatively constant in the hexadecane, for water in the bilayer drops to approximately 0.5 × 10⁻⁵ cm2/s between . These bilayer profiles are similar to those obtained in many previous simulations,9–10, 238–239 though not identical as expected from differences in the FF and methods, including uncertainties in the BA.
Figure 29.

Potentials of mean force (top) and diffusion profiles (bottom) normal to the interface for water in POPC and a water/hexadecane slab.
The preceding observations suggest that a 1-comparment model
| (41) |
is sufficient to describe the permeability of water through the hexadecane slab simulated here but not the POPC bilayer ( for the models used in this Section). Obvious parameter choices for the water/hexadecane system yield agreement with simulation (first row of Table 12). The first two models for POPC are:
Table 12.
Water permeabilities (×10−3 cm/s) from 1 and 3-compartment models using values of , D (×10−5 cm2/s), and h (Å) obtained from simulations of a water/hexadecane slab and a POPC bilayer. P(sim) for water/hexadecane is from the Bayesian analysis, and P(sim) for the bilayer is from counting.
| Model | F1 | F2 | D1 | D2 | h1 | h2 | P | sim | expt |
|---|---|---|---|---|---|---|---|---|---|
| water/hexadecane | 11.5 | - | 2.5 | - | 10.0 | - | 2.5 | 2.6 | - |
| M1. POPC (h1 = dCC) | 11.3 | - | 1.5 | - | 27.5 | - | 0.7 | 1.3 | - |
| M2. POPC (reduce h1) | 11.3 | - | 2.5 | - | 11.5 | - | 2.7 | 1.3 | - |
| M3. POPC (add compartment) | 11.3 | 8.3 | 2.5 | 0.4 | 11.5 | 16.0 | 1.4 | 1.3 | - |
| M4. POPC (reduce F) | 9.6 | 5.0 | 2.5 | 0.4 | 11.5 | 16.0 | 12.8 | - | 13.0 |
M1:; in Fig. 27;
M2: as for M1, but
As shown in the next two rows of Table 12, the permeability for POPC is 50% too low from M1 and 100% too high for M2.
While agreement with simulation can be forced by assigning a compartment width between that of M1 and M2, it is physically reasonable to propose a 3-compartment model. Models M3 and M4 have the form:
| (42) |
The two additional compartments (both labelled with subscript 2) are identical and describe the Gaussian-like drop off in between the C2 plane and compartment 1. Perhaps unintuitively, the head group region is not explicitly included in the model. outside the hydrocarbon region is near 0, and when exponentiated its contribution to the sum is negligible. However, the outer compartments are in direct contact with the headgroup region and mix with ester oxygens (and their associated water molecules). Consequently, these compartments are somewhat wet while compartment 1 is virtually dry.
M3 retains M2 parameters for compartment 1. The and were set as (the remainder of the hydrocarbon-rich region), and the average value of over this range. is the effective free energy contribution from the “wet hydrocarbon” but is difficult to assign a priori because is rapidly varying and exponentiated when calculating P. yields a permeability equal to that of the simulation (M3 entry in Table 12). The main point of this exercise is to demonstrate that a 3-compartment model is a more natural fit for water than a 1-compartment model, and that all three compartments are located in the hydrocarbon region.
Armed with this analysis tool it is now useful to consider the experimental permeability of POPC, 13.0 ×10⁻³ cm/s, a value 10 times higher than obtained from the simulation using models M1, M2, and M3. As already discussed in Section 3.2, the present simulation was based on an additive force field and yields a free energy of transfer of water to hexadecane 1.0 kcal/mol higher than experiment (Table 3). Hence, the natural first step is to lower the barrier in the center of the bilayer by 1 kcal/mol in a 1-comparment model. This leads to P = 14.2 × 10⁻³ cm/s, slightly overshooting experiment. However, a second set of compartments with yields agreement with experiment (M4, last row of Table 12.)
Fitting the other 11 bilayers discussed in previous sections to simulated and available experimental permeabilities using a 3-compartment model yields similar conclusions as those obtained for POPC: a 1-compartment model is not adequate; addition of two additional compartments allows physically reasonable fitting to target data.
8.2. Oxygen
Fig. 30 plots and in water/hexadecane and a POPC bilayer, both simulated at 37 °C.13 While the diffusion profile in POPC is similar to water (high in the bilayer center and low in the head groups), the PMF indicates that a compartment model for O2 permeability will require 5 separate compartments to represent 3 distinct regions: (1) the bilayer center, where is low and is high; and (2) the regions between the center and the headgroups, where is low; and (3) the head groups, where is high. As expected, is essentially opposite in sign to in the water/hexadecane slab; it also contains a shallow minimum at the water/hexadecane interface, like that found for ethane (Fig. 8 bottom). This is consistent with a density minimum and free volume maximum (Fig. 19 bottom). The models for both systems are of the form:
| (43) |
It is instructive to develop a series of compartmental models for oxygen permeability in membranes by mapping the transformation from the water/hexadecane slab to a POPC bilayer; the permeabilities for these two systems were determined in ref. 13 to be 277 and 26 cm/s, respectively. Now consider the following 5 models sketched in Fig. 31 and parameters and P listed in Table 13:
M1: Water/hexadecane slab. The model includes the dip in at the interface. Compartment 3 is water so that the net width is the same as the bilayer but contributes little to P. M1 captures water/hexadecane but is an unquestionably poor representation of a POPC bilayer.
M2: Replace the minimum at the water/hexadecane interface with a barrier comparable to that in the POPC bilayer. This reduces P by a factor 3.
M3: Increase to match the overall thickness of POPC. This barely perturbs P. (The barrier region is now described by and )
M4: Reduce . Reducing the diffusion constant at the interface reduces P by a factor of 4 and provides a near perfect match to the value for POPC obtained from the simulation.
M5: Increase and decrease . These minor adjustments to the chain regions to match the POPC profiles have negligible effect on P.
Figure 30.

The potentials of mean force (top) and diffusion constant normal to surface for O2 in water/hexadecane slab and a POPC bilayer. Adapted with permission from Ref. 13. Copyright 2017 American Chemical Society.
Figure 31.

Compartmental models for permeability of O2 illustrating the transformation of a water/hexadecane slab (M1) to a POPC bilayer (M5). The different compartments are labeled with circled numbers and green text, and their properties are specified in Table 13. Water regions in the range are not included in the estimate of permeability and are shown in blue background.
Table 13.
Potentials of mean force Fi (in kBT), diffusion constants Di (10−5 cm2/s), and slab widths for compartmental models for O2 sketched in Fig. 31, and permeabilities P (cm/s) from Eq. (43).
| Model | F1 | F2 | F3 | D1 | D2 | D3 | h1 | h2 | h3 | P |
|---|---|---|---|---|---|---|---|---|---|---|
| M1. water/hexadecane | −3.0 | −3.3 | 0 | 4.6 | 4.6 | 6.0 | 20 | 5 | 10 | 276 |
| M2. barrier at interface | −3.0 | 1.0 | 0 | 4.6 | 4.6 | 6.0 | 20 | 5 | 10 | 106 |
| M3. increase thickness | −3.0 | −3.0 | 1.0 | 4.6 | 4.6 | 6.0 | 5 | 12.5 | 10 | 107 |
| M4. reduce D at interface | −3.0 | −3.0 | 1.0 | 4.6 | 4.6 | 1.5 | 5 | 12.5 | 10 | 27 |
| M5. POPC model | −3.0 | −2.0 | 1.0 | 1.5 | 3.0 | 1.5 | 5 | 12.5 | 10 | 25 |
Hence, while the solubility of a permeant in the oily acyl chain region remains a crucial factor in permeability, the presence of a barrier at the membrane/water interface and the diffusion constant in the barrier region provide critical modulation.
9. RECENT DEVELOPMENTS
Table 14 is a compilation of papers reporting simulations of passive permeability published from 2015 (but not included in ref. 10) to 2018. The major topics, lipids, and methods are listed. At the risk of oversimplifying, the studies are divided into two broad categories, Theory and Methods, and Applications, and then various subcategories. The five reviews10, 178, 240–242 published in 2016 are excellent, and each provides a different focus as noted in Table 14.
Table 14.
Simulations of permeability of lipid bilayers from 2015–2018,a with citation, brief description, lipids in system, primary method, and last author.
| Yr | Ref | Subject | Lipidb | Methodd | Last author |
|---|---|---|---|---|---|
| 2015 | 270 | Nanoparticle induced water and ion leakage | DPPC (CG) | PMF | Murad |
| 276 | Translocation of amphiphilic copolymers | DPPC-like (CG) | PMF, FPT | Sommer | |
| 258 | Position and orientation of amitriptyline and clozapine | Assorted PC | PMF | Biggin | |
| 315 | Insertion of imidazolium-based cations | POPE, POPG | ISDE | Klahn | |
| 265 | water permeation by collapse of cavitation bubbles | POPC (AA and CG) | density | Chipot | |
| 275 | Serine-based surfactants as permeation enhancers | DPPC | density | Veiga | |
| 294 | Menthol effects on the stratum corneum | SCc (CG) | density | Qiao | |
| 293 | Effect of length of CER on water partition | SC (AA and CG) | density | Berka | |
| 2016 | 10 | Review (background, compellation of sims to 2015) | Rowley | ||
| 242 | Review (sampling errors in PMF) | Pomes | |||
| 178 | Review (methods for ISDE) | Gumbart | |||
| 240 | Review (alternatives to ISDE) | Shinoda | |||
| 241 | Review (drug partitioning) | Trouillas | |||
| 29 | Method development: first passage times, milestoning | Single particles | ISDE+FPT | Amaro | |
| 152 | Subdiffusion of methanol | POPC | FSE | Chipot | |
| 247 | Line tension and permeation | CG DPPC | CT | Kindt | |
| 199 | GLE for diffusion constant of O2 and H2O | DPPC | ISDE+GLE | Rowley | |
| 255 | Bias exchange metadynamics to explore Caco-2 assay | POPC | J | Lattanzi | |
| 280 | Aromatic peptides; expt and sim | DOPC | ISDE | Jas | |
| 299 | Assorted permeants through stratum corneum | SC | ISDE | Rai | |
| 259 | Naratriptan forms pore-like structures | POPC | density | Pickholz | |
| 314 | Small molecules though E coli outer membrane | LPS,PG/PE,PG,CL | PMF, D(z) | Khalid | |
| 271 | PEGylated gold nanoparticle | DPPC (CG) | density | Murad | |
| 296 | Transdermal delivery of borneol | SC (CG) | density | Qiao | |
| 272 | Gold nanoparticles through skin | SC (CG) | ISDE | Rai | |
| 300 | Effects of ceramide chain lengths | CER12–24 | ISDE | Rai | |
| 249 | Monovalent ions (need collective variables) | POPC | 2D-US | Wei | |
| 165 | Trimethoprim with transition-tempered metadynamics | POPC | ISDE | Voth | |
| 246 | Accelerating PMFs (including system size) | POPC | US | Hub | |
| 284 | Bisphenol A permeation and pore formation | DPPC | US | Wang | |
| 282 | Aliphatic amine and carboxylic acid drugs | DPPC | ISDE | Sezer | |
| 2017 | 269 | Review (focus on nanoparticles) | Murad | ||
| 158 | Short chain alcohols | POPC | FSE | Chipot | |
| 13 | Bayesian method to obtain diffusion tensor of O2 | POPC, mitochondrial | ISDE | Hummer | |
| 31 | Multiscale modeling of ring systems | POPC | ISDE | Duca | |
| 228 | Cholesterol effect on O2 | POPC + chol | CT | Pias | |
| 230 | Comparison with EPR measurements of O2 | POPC + chol | CT | Pias | |
| 302 | Cholesterol effect on reactive oxygen (H2O2 + others) | DOPC + chol | US | Bogaerts | |
| 266 | Electric fields on permeation of reactive oxygen | DOPC | US | Bogaerts | |
| 301 | In-silico skin model; fentanyl, caffeine, napthol | SC (UA) | multiscale | Rai | |
| 278 | Fullerene C60 though skin | SC (CG) | ISDE | Rai | |
| 273 | Effect of size and charge of gold nanoparticles | SC (CG) | ISDE | Rai | |
| 274 | Proteins with gold nanoparticles | SC (CG) | US | Rai | |
| 137 | Na+ and Cl- with E field | POPC | NC(2 layer) | Matthai | |
| 283 | Piracetam | DOPC | US | Fernandes | |
| 245 | Flooding method for accelerating PMF estimates | DMPC | PMF | Ramos | |
| 319 | Calibrating PMF using experimental permeability assay | DOPC | ISDE | Carpenter | |
| 254 | Salt dependence of water flux from vesicles | PA+C16-trilysine (CG) | CT | Shi | |
| 264 | Sampling stratum corneum using steered MD | SC | ISDE | Pedretti | |
| 320 | Effect of hydrophobicity of nanoparticles | DPPC (CG) | CT, PMF | Sommer | |
| 316 | Mercury complexes though bacterial membrane | POPE+POPG | ISDE | Parks | |
| 261 | High-throughput screening | water/octanol (CG) | PMF | Bereau | |
| 295 | Menthol effects on the stratum corneum | SC (UA) | density | Ming | |
| 257 | Effect of protonation state/polarizable models | POPC | PMF | Ma | |
| 317 | Extraction of fatty acyls from microbial hosts | Yeast + dodecane layer | Crowley | ||
| 2018 | 298 | lateral domains in stratum corneum hinder diffusion | SC | ISDE | Notman |
| 311 | Effect of charged state of d-sotalol | POPC, POPS | ISDE | Vorobyov | |
| 303 | Cholesterol effects in O2 transport in eye lens | POPC+chol | density, D | Pasenkiewicz-Gierula | |
| 244 | Methods for free energy profiles | DOPC | PMF | Maibaum | |
| 277 | Nanoparticles for enhanced permeation | SC (CG) | PMF | Rai | |
| 313 | Water through multicomponent gel-phase bilayers | DSPC + alcohols (UA) | ISDE | McCabe | |
| 262 | Biomimetic models, expt vs COSMOmic | DMPC, HePC | Density | Alfonso | |
| 267 | Electroporation of stratum corneum | SC (UA) | Density | Rai | |
| 285 | Ethanol, acetone, DMSO effects on PSM H-bonding | PSM | PMF | Kashyap | |
| 166 | Multidimensional PMF for trimethoprim | POPC | 2D PMF | Voth | |
| 14 | Lateral diffusion of O2; test of diffusion equation | POPC and 6 others | ISDE | Ghysels | |
| 253 | Effect of unsaturation and temperature on O2 | DPPC, POPC, DOPC | ISDE | Ghysels | |
| 164 | Protonation state of a lysine analog in membrane | POPC | PMF | Tarek | |
| 82 | Permeability for TIP3P and related water models | POPC | ISDE | Rowley | |
| 248 | Water and ions at phase boundaries | DPPC, PE, POPC, chol | PMF | Cordeiro | |
| 305 | Effects of lipid composition on 13 permeants | DOPC, DOPC:DOPE | ISDE | Orsi | |
| 318 | Extraction of terpenoids from microbial hosts | Yeast + dodecane layer | ISDE | Crowley | |
| 304 | Effect of potassium channel on O2 | POPC+chol + K+ chan | CT | Pias |
2015 entries do not include those cited in Reference 10; 2018 entries only include those published at time of submission.
Systems are all-atom otherwise noted; CG is coarse-grained; UA is united atom.
SC denotes models of the stratum corneum.
This column specifies the primary method utilized. Inhomogeneous solubility-diffusion equation for P (ISDE); fractional Smoluchowski equation for P (FSE); counting for P (CT); calculating flux (J) for P; umbrella sampling for PMF (US); first passage times (FPT); generalized Langevin equation for D (GLE); estimate of position dependent diffusion constant, but not used directly in inhomogeneous diffusion equation (D(z)); partition coefficient (K)
9.1. Theory and Methods
9.1.1. PMF.
The simulations of oxygen and water presented as examples in this review were generated with conventional MD simulations; enhanced sampling was not required to obtain sufficiently converged PMFs (see Section 5.1.2 and Eq. (16)). However, this is not the case for many permeants of interest, and it remains essential to improve sampling. Sun et al.165 demonstrated agreement of the PMFs of ethanol generated with umbrella sampling, well-tempered metadynamics180 and transition-tempered243 metadynamics, and concluded that convergence with the latter is quicker and more robust. The more complicated “triple-flip” 2-D permeation pathway of the drug trimethoprim was also readily determined by transition-tempered metadynamics165 and further analyzed.166 Pokhrel and Maibaum244 compared metadynamics, umbrella sampling, and replica exchange umbrella sampling. All methods were satisfactory for charge-neutral permeants, but replica exchange was superior for charged ones because of bottlenecks arising from head group interactions. Coimbra et al.245 demonstrated that “flooding” prior to umbrella sampling improved convergence of PMFs for 4 different drug molecules by providing more representative sets of conformations and orientations in each window.
Votapka et al.29 developed two results focused on obtaining permeability from milestoning, a method that naturally yields an estimate of the average first passage time for a permeant to cross the bilayer,. The first relates to the permeability and the PMF within the context of the ISD equation, thereby avoiding the need to calculate the position dependent diffusion constant. The second removes the assumption of overdamped dynamics. The formalism was tested using Langevin dynamics on a model system.
Nitschke et al.246 explored the sensitivity of the PMF to energy cutoffs in the force field and system size, and showed that effects of undulations can be reduced by using a center of mass definition based on a cylinder around the solute.
Yang and Kindt247 compared the free energy pathway for translocation of a large permeant though a uniform fluid phase bilayer, a fluid phase surrounded by a gel phase, and a “striped” two-phase system. In both two-phase systems the fraction of gel phase increased to accommodate the permeant, but differences in line tension at the gel/fluid phase boundary led to different free energy profiles. This result helps to explain the enhanced permeability of bilayers near their gel-fluid transition temperatures. More recent simulations by Cordeiro248 explored modulation of permeation of water and ions by the hydrophobic mismatch at the boundaries of gel-like and fluid phases. Water permeation was shown to be diffusive and single-particle, and not significantly different from the fluid region of either DPPC or DPPE. Na+ transport was strongly facilitated by transient pores at the boundaries. These results help to reconcile the seemingly inconsistent experimental data regarding water permeability discussed in Section 7.2.1. A second set of simulations showed significant leakiness at the boundary of liquid ordered (DPPC and chol) and fluid (POPC) phases and informs the analysis of permeation in cells.
Zhang et al.249 determined the PMF of Na+, K+ and Cl- across POPC using 2D umbrella sampling. The permeation pathways are defined by collective variable involving the ions, water and lipids. Both cations translocate by a pore-like pathway, with P = 0.8 × 10⁻¹⁵ cm/s for Na+ and 3.3 × 10⁻¹⁵ cm/s for K+; the bilayers, however, were relatively unperturbed. These permeabilities substantially underestimate the experimental range16, 250–252 of 0.02–3.5 × 10⁻¹² cm/s. This discrepancy is partially explained by the work of Vorobyov et al.,167 who showed that large distortions of the bilayer surface are required to obtain reasonable agreement of simulation and experiment. The lack of polarizability might also be a factor. In contrast, the simulations revealed two pathways for the chloride: one along a water wire spanning the bilayer (P = 0.6 × 10⁻¹⁵ cm/s) and one in a small cluster of waters (P = 16 × 10−16 cm/s). The latter is within the range 6.5–55 × 10−12 cm/s obtained by most of the experiments and supports the cluster mechanism. It will be important to revisit the mechanism of ion permeation with polarizable force fields.
9.1.2. Diffusion.
The other term in the ISD model is the position dependent diffusion tensor. Many of the recent findings and challenges in diffusion calculations are summarized in more detail in Sections 5.1.3 and 5.2. Gaalswyk et al.199 compared methods that are based on the generalized Langevin equation and thereby allow a more accurate description of the underlying inhomogeneity in the lipid bilayer. GLE methods incorporate, for example, the effects of fractional viscosity-dependence on diffusion of small solutes described in Section 3.3.2. Chipot and Comer152 presented evidence of subdiffusion of small permeants in membranes, and proposed a fractional Smoluchowski equation to model this dynamics. Ghysels et al.13 extended Hummer’s198 Bayesian method to determine both and , and De Vos et al.14 developed a formalism to evaluate characteristic time and lengths within the context of the ISD model (see Section 5.2). De Vos et al.253 also used the preceding Bayesian methods to determine the effects of unsaturation and temperature on oxygen diffusion in DPPC, POPC, and DOPC bilayers. and are highest at the midplane for DPPC and lowest for DOPC, as consistent with their electron density profiles; i.e., the interface between leaflets is sharper for the saturated lipids.
Su et al.254 simulated large vesicles with asymmetric salt concentration; the flux depended on the location of the salt (inside or outside of the vesicle) and the flux ratio varied significantly with salt concentration. Salih and Matthai137 used a double bilayer similar to that presented in Section 4 in their study of ion permeation and pore formation under electrochemical gradients.
In a more application-oriented study, Ghaemi et al.255 evaluated the time-dependent flux of anti-HIV drugs efavirenz and etravirine, and ethanol through a POPC bilayer with bias exchange metadynamics, and demonstrated a significant difference in the two quantities. This result indicates that a retention factor should be included in the interpretation of the Caco-2 assay, which is used to evaluate the ability of compounds to cross the intestine-blood barrier based on the initial rate of concentration change as opposed to the steady state flux.
9.1.3. Force Field.
As discussed in Section 3.1, an accurate lipid force field is critical for simulations of membrane permeability. Sajadi and Rowley82 tested the effects of replacing TIP3P water by the more refined TIP3P-FB and TIP4P-FB models256 in simulations of POPC using the C36 FF (which was developed with TIP3P). While some membrane properties were relatively unchanged, the better models did not improve agreement with experiment regarding permeability, highlighting the difficulty of changing an already highly tuned force field.
Using simulations based on explicit and implicit polarization, and a thermodynamic cycle to estimate a position-dependent pKa, Zhu et al.257 predicted that 2-aminoethoxydiphenyl (2-APB) borate changes protonation state along the path of membrane permeation. The authors further explored the balance of entropy and polarity in 54 analogs of 2-APB. The protonation state was also found to have a substantial effect on the PMFs for amitriptyline and clozapine,258 and the partitioning of naratriptan.259 These results provide additional motivation for the application of constant pH methods (see Section 3.1) to simulation studies of membrane permeation.
Krämer et al.44 showed how the Lennard-Jones interactions between water and hydrocarbons in assorted additive models can be rapidly optimized to yield the experimentally observed using water/hexadecane slabs similar to those described in Section 3.2 and free energy methods. Such tuning of individual interaction pairs provides a means of accounting for changes to the local environment in an additive FF, and thereby captures a critical aspect of polarizability. In a proof of concept, applying the modification to TIP3P leads to agreement with experiment for water permeability in a DOPC bilayer, rectifying the factor-of-10 underestimate obtained by the unmodified version of C36 (see Section 7.2.1). This approach provides a low-cost, though admittedly incomplete alternative to polarizable FF. Transferability of parameters is not assured, and is should be confirmed that other properties (e.g., the bilayer surface area) have not been overly perturbed by the modification.
9.1.4. Kinetic Models.
As reviewed in Section 2.5, the ISD model can be discretized into a small number of compartments spanning the entire membrane. However, the individual compartments are still defined by the diffusion constants and free energies, the fundamental parameters of the ISD model. Kinetic models also divide the membrane into compartments but, rather, develop rate constants for passage between the compartments. This flexibility is attractive because it allows a focus on the underlying physics of each set of rate constants. Dickson et al.31 developed their model to capture the three critical processes: membrane entry (partitioning), flip-flop across the hydrophobic membrane core, and membrane exit. Potentials of mean force and diffusion constants for 7 different aromatic drug compounds were obtained by MD simulation, and the rate constants for these events were determined by Markov State modeling. (See Pande et al.260 for an introduction to Markov State modeling in simulations). For each permeant, 200 unbiased simulations of approximately 25 ns were initialized at metastable states in the bilayer core and water phase to obtain transition probabilities and mean first passage times between these states. The resulting mechanistic model was then used to develop structure-kinetic relationships for passive permeation.
9.1.5. Drug Development.
This subsection combines high-throughput screening, and accelerated delivery methods.
Effective high-throughput screening requires simple solvent systems that effectively mimic the partition coefficients of cells. Menichetti et al.261 used simulations of CG models of water/octanol and a DOPC bilayer to develop linear relationships between the partition coefficient and key features of the PMF. This enabled a rapid screen for over 400,000 compounds. The study of Bannan et al.114 on calculating partition coefficients of small molecules in water/octanol and water/cyclohexane provides useful background for those planning such studies. In their combined experimental and simulation study, Loureiro et al.262 show that liposomes are superior to micelles, and both are superior to the traditional water/octanol system. The authors also demonstrate good agreement with the experimental partition coefficients predicted using the program COSMOmic, an extension of COSMO-RS for anisotropic systems such as micelles and membranes.263 Rocco et al.264 developed an in silico screen for skin permeability using the relatively old simulation technique of steered molecular dynamics to rapidly probe the response of SC model bilayers to different permeants. Using a learning set of 80 compounds and, in essence, determining the average parameters for the homogenous solubility-diffusion model yielded good correlation of predicted and experimentally determined permeabilities. Correlative analysis showed the importance the water/lipid interface and temperature effects in the predictive power of the model.
Permeation can be enhanced by ultrasound, electric fields, gold nanoparticles, and polymers. To understand the underlying mechanics of sonoporation, Fu et al.265 simulated the effect of the collapse of different sized bubbles in contact with a POPC bilayer. The resultant shock waves lead to a substantial invagination of the bilayer and increased water permeation. Bogaerts and coworkers266 determined that electroporation is enhanced in bilayers containing native and oxidized DOPC. They also demonstrated that permeation of reactive oxygen species (OH, H2O, H2O2, and O2) is increased in these bilayers even without an applied electric field. Gupta and Rai267 presented a systematic study of electroporation on models of the stratum corneum (the outer layer human skin). Variables included system size, lipid composition, and field strength.
Gold nanoparticles can pass though membranes, and therefore functionalized nanoparticles (NPs) are under development for targeted drug delivery.268–269 To understand the mechanism of entry and reduce the cytotoxic effects of NPs, Oroskar et al. carried out CG simulations of alkanethiol270 and polyethylene glycol (PEG)271 functionalized gold particles (AuNPs); the PEGylated NPs were shown to reduce water and ion permeation and lipid flip-flop. Rai and coworkers investigated permeation of AuNPs though a CG lipid bilayer serving as a model of the stratum corneum. They determined that the optimal AuNPs are 2–3 nm in diameter272 with neutral hydrophobic functional groups.273 Further simulations274 showed ready permeation of horseradish peroxidase conjugated to a 3 nm AuNP, but an unconjugated protein was blocked. Permeability of the stratum corneum is reviewed further in Section 9.2.3.
The combined experimental and simulation study of Teixeria et al.275 explored the enhancement of permeability of local anesthetics through skin by serine-based surfactants. The simulations were used to locate the positions in the bilayer of the different surfactants and to compare their effects on the lateral diffusion of the lipids (a probe of overall mobility of permeants in the bilayer).
Another consideration in the general design of nanoparticles is the ratio of hydrophobic and hydrophilic surface area. Werner and Sommer276 estimated the permeability of random block copolymers with mixtures of hydrophobic and hydrophilic beads in a DPPC-like CG bilayer from lattice-based Monte Carlo simulations. Optimal partitioning to both sides of the bilayer was obtained with a hydrophobic fraction of approximately 0.6. This study informs the design of drug “carriers” as well as the translocation of peptides. Similarly, Gupta and Rai277 determined that a 2:1 hydrophobic/hydrophilic ratio is optimal for nanoparticles used for transdermal delivery. These authors also explored the use of fullerene as a candidate for delivery across the stratum corneum.278 However, aggregation became a concern as concentration increased, supporting the proposal that a nonnegligible faction of the nanoparticle surface should be hydrophilic.
9.2. Applications
9.2.1. Homogeneous Bilayers.
Chipot and coworkers158 applied their recently developed treatment of the fractional Smoluchowski Eq. to the permeation of 4 short-chain alcohols in POPC bilayers. Their permeabilities followed the order (methanol < ethanol < propanol < butanol) in good agreement with notion that solubility in the bilayer increases with chain length. Subdiffusion contributed substantially to the permeability, providing another example of the limitation of the ISD model. Of concern is that the simulated permeabilities are 3–4 orders of magnitude larger than experimental values obtained in SOPC bilayers.279 This discrepancy is difficult to explain by force field and other technical issues related to the simulation, and the differences between POPC and DOPC. It is possible that differences between the experimental and simulated systems are at play. For example, alcohols expand the bilayer in a concentration dependent manner, and the kinetics in the experiment involves transients that could confound the interpretation.
Lee et al.280 carried out an experimental and simulation study of blocked forms of three aromatic dipeptides. The peptides adjusted their conformation to the environment and carried waters into the bilayer center; side chain rotation was especially restricted in the membrane/water interface. Experimental values of permeability ranged from 6–55 × 10−7 cm/s. A much wider range (3 × 10⁻⁷ to 1 × 10⁻⁴ cm/s) was obtained by simulation, thereby providing good targets for future theoretical studies.
The next three studies focused on known drug molecules. Orally active drugs commonly contain aliphatic amines (AA) and carboxylic acids (CA),281 both of which can be charged or neutral. Oruc et al.282 compared the permeability of the neutral vs. ionized forms of dyclonine (a representative AA) and phenylbutyrate (a CA) and nicely demonstrate how the dual nature of these classes of compounds supports their function: the ionized states are soluble in water but only the neutral states freely cross the membrane (P > 1 cm/s). The PMFs were also found to be 2-dimensional, further supporting that notion that alternatives to the simple ISD model are required. In contrast to dyclonine and phenylbutyrate, Ribeiro et al.283 showed how the highly polar drug piracetam changes its solution conformation by forming an internal hydrogen bond when in the hydrophobic core of the bilayer. Chen et al.284 showed that the permeation pathway of bisphenol begins with a monomer state bound to the bilayer/water interface. As concentration increases, bisphenol clusters, migrates to the bilayer center, and forms a pore. Bisphenol is highly cytotoxic and its method of permeation into cells is therefore of considerable interest. It is possible that the pores are related to the toxicity of this compound.
N-palmitoyl-sphingomyelin (PSM) bilayers have extensive intramolecular hydrogen-bond networks67 making them substantially more rigid than bilayers composed of most other lipids.38 Kumari et al.285 showed that ethanol expands the PSM bilayers (partly by disrupting the H-bond network), increases water permeability, and ruptures the bilayer at the highest concentrations. In contrast, acetone and DMSO have little effect at low concentration, and stabilize PSM bilayers at higher concentration. PSM is an important component in liquid ordered phases of lipids,286–287 and these results lend insight as to how small molecules modulate the stability of lipid rafts288 in cells.
9.2.2. Stratum Corneum Models.
The stratum corneum (SC) is the outermost layer of the epidermis (skin). Its thickness is generally 10–30 μm,289 though, not surprisingly, it is much thicker (~200 μm) in the palm. The SC is organized in a “brick and mortar” arrangement consisting of dead cells with no nuclei or organelles (the “bricks) in a multilamellar lipid matrix composed of a mixture of ceramide (CER) of many different chain lengths, free fatty acids, and cholesterol in a gel-like phase (the mortar).290
Simulating the stratum corneum is particularly challenging. To begin, the lipid matrix multilayer appears to be an arrangement of “long” and “short” periodicity phases in a sandwich-like arrangement,291 but many molecular-level details required to initiate simulations remain unclear. Hence, most simulations to date have been based on the bilayer arrangement. Secondly, the layers contain regions of gel-like phases. Gel phases of even pure lipids are difficult to simulate because chains and headgroups are tightly packed (gel surface areas are approximately 25% lower than that of fluid phases34) and small errors in initial conditions can lead to unphysical chain tilting.292 Furthermore, while accurate experimental data are available for the gel-phase chains,32 there is little information on head group orientation. Finally, the dry and condensed nature of the SC greatly increases the time scale of diffusion. All the simulation studies described in this subsection used approximately the same lipid composition for their model SC, though they ranged from coarse-grained, to united, to all-atom. The screening tool for permeability in the SC developed by Rocco et al.264 was already described in Section 9.1.5.
Paloncyova et al.293 examined the experimental observation that the maximum permeability for SC composed of CER with 4–8 carbon chains. It is shown that these shorter chains do not incorporate into the lipid matrix and thereby disrupt the surface. The disruption is removed by either increasing or decreasing the chain length.
Two separate studies294–295 focused on how menthol ((1R,2S,5R)-2-ispropyl-5-methylcyclohexanol) increases permeability of skin. Both show that menthol readily enters bilayer and locally fluidizes the interior. At higher concentrations (easy and sufficiently interesting to simulate), it disrupts bilayer structure. Qiao and coworkers296 examined borneol, another natural permeation enhancer, using a similar approach. Borneol also segregates to the bilayer center and enhances permeation at low concentration. However, at high concentration it promotes pores and reverse micelles, reminiscent of the “carpet mechanism” for antimicrobial peptides.297
Del Regno and Notman298 present a novel and interesting model for the low permeability of water and other polar compounds though the SC based on three important observations from their simulations. First, water is trapped in discontinuous pools at the lipid headgroups in the low hydration (2 waters per lipid) environment of the SC and is therefore unable to form a continuous phase between lamella. Consequently, there are “dry regions” between the bilayers. Second, cholesterol-rich domains (spontaneously formed in the simulations) show higher permeation than the surrounding regions, as consistent with their higher free volume. Third, lateral diffusion of the permeant in the interleaflet plane is relatively unhindered (see Section 5.2 for a related discussion of O2 dynamics in the bilayer midplane). The authors propose that the most probable permeation path for a small polar molecule starting from the center of a particular layer is: (i) diffuse laterally until reaching a cholesterol rich domain; (ii) diffuse to the head groups along the surface normal; (iii) diffuse to the next layer through a dry region in what is the rate limiting step.
In addition to their work using electroporation267 and nanoparticles272–274, 277–278 for delivery of permeants through the SC, the Rai group examined three other topics related to permeability in the SC. In an outstanding comparative study, Gupta et al.299 calculated the permeability for 12 different permeants, and compared the results of 10 with experiment (experimental values for DMSO and O2 were not available). While simulations reproduce the general trend (the hydrophobic set is more permeable than the hydrophilic set), except for urea the quantitative agreement is poor. Experimental values are approximately 10−5 – 10−8 cm/s for the hydrophilic compounds, and the simulated values are 100 times larger. P for the hydrophobic compounds are ~10−4 dyn/cm from experiment and order 1 from simulation. The 25 dyn/cm reported for O2 is close to values obtained in fluid phase bilayers by recent simulations (see Section 7.7.2). These substantial overestimates of P appear to support the model of Del Regno and Notman described in the preceding paragraph; i.e., the simulations under discussion may not have had have the length, size, or composition to form local domains. Gupta et al.300 also examined effect on permeability when leaflets contain CER of different chain length. Shorter chains do not interdigitate, and thereby form voids in the bilayer center that increase permeability. Permeability is reduced for combinations of chain lengths that allow indigitation. Lastly, Gajula et al.301 developed a multiscale approach wherein diffusion constants obtained from simulations are used as input for macroscopic models to predict permeability. Results for caffeine, fentanyl, and naphthol agree well with experiment.
9.2.3. Other Mixed Bilayers.
Three different groups228, 302–303 published simulations on the effect of cholesterol on oxygen permeability and arrived at very similar conclusions. As cholesterol content increases the barrier in the PMF at the bilayer/water interface increases and the minimum at the bilayer center deepens, and the permeability decreases. This result can be rationalized by the compartmental model of O2 presented in Section 8.2, where the barrier height was shown to be a strong modulator of permeability. Plesnar et al.303 showed that the permeability is reduced 20-fold in pure cholesterol domains, an important consideration regarding eye-lens membranes. Conversely, Van der Paal et al.302 point out that the low cholesterol concentration in cancer cells is consistent with their increased permeability to reactive oxygen species. These authors also present results for water, hydrogen peroxide, and hydroxyl ion. Dotson and Pias304 showed how the presence of a potassium channel reduces the permeability of oxygen by altering the diffusion path and local diffusivity. The effects of integral membrane proteins must ultimately be considered when modeling oxygen diffusion in the protein rich mitochondrial membranes.
Palaiokostas et al.305 calculated permeabilities of 13 molecules in two different bilayers, DOPC and a 3:1 DOPC:DOPE mixture. Their simulations show that the presence of DOPE reduces permeability for the smaller molecules but increases permeability for the larger ones. It is tempting to relate this result to differences in the spontaneous curvatures of the two bilayers. By way of background, DOPE is called a “non-lamellar” lipid because it favors highly curved inverse hexagonal phase over the lamellar (bilayer) phase.306 Bilayers with DOPE and similar lipids have negative spontaneous curvature,307 which is the propensity of the leaflets to form concave (inward-curving) surfaces relative to the head groups. Such “curvature frustration” is associated with remodeling of cell membranes.308 In contrast, the spontaneous curvatures of leaflets in DOPC bilayers are near zero (they prefer to be flat).307 However, continuum-style modeling of these results will need to include the contribution from compression forces.309 This is because DOPE reduces the surface area310 which correlates with reduced permeability.11
DeMarco et al.311 obtained partition coefficients and permeabilities for the antiarrhythmic drug d-sotalol in its cationic and neutral forms in POPC and POPC/POPS bilayers. Facile passive translocation is predicted for the neutral form, but not the charged. Of note is that the barrier for translocation of the neutral permeant is raised by nearly 1 kcal/mol when POPS is added to the bilayer. This speaks to the importance of simulating with lipids mixtures more resembling the target cellular membrane.
Permeability though gel phase bilayers is typically 1 to 2 orders of magnitude lower than in fluid phases.24, 219, 312 Gel phases provide an important point of reference for x-ray analysis34 and their tight chain packing can provide insight to liquid ordered phases.159 Hartkamp et al.313 simulated mixtures of DSPC gel phase, and the emollient isostearyl isosterate (ISIS) or assorted long-chain long alcohols to examine the relative importance of hydrogen bonding and chain packing on water permeation. The permeability in pure DSPC is 1.4 ×10⁻⁸ cm/s at 32 °C (dramatically lower than fluid phase values, as expected) and approximately 60 times lower than experiment219 at 20 °C (again pointing to likely problems in the FF). The response to added components varies: permeability is reduced in 7:1 DSPC:ISIS and increased in a 1:1 mixture; permeability is also reduced by 12 carbon alcohols but not changed by those with 18 and 24 carbon chains. A hydrogen bond analysis indicates that the head group region is a critical modulator of water permeability for these systems.
Gram-negative bacteria have two membranes.4 The outer membrane is asymmetric, with the lipid composition of the outermost leaflet primarily lipopolysaccharides (LPS) and some phospholipids, including cardiolipin (a lipid with two phosphate groups and 4 acyl chains); the composition of the inner leaflet is mostly glycerophospholipids (as opposed to glycolipids). The inner (or cytoplasmic) membrane is primarily a mixture of PE and PG. Transport of solutes though the outer membrane is primarily though protein channels because passive permeability is much lower than that of the inner membrane. As would be expected, there is considerable interest in designing antibiotics that can passively diffuse through both the outer and inner membranes. There are three simulation studies of lipid only models of these membranes to report here.
Carpenter et al.314 modeled the asymmetric outer membrane with 8:1 LPS:cardiolipin on the outer leaflet, and 9:1 PE:PG on the inner leaflet. They evaluated PMF for three hydrophobic (hexane, ethane, benzene) and two hydrophilic (ethanol, and acetic acid) permeants. Those for the hydrophobic set are very asymmetric, with shallow minima at the phospholipid headgroups, broad minima in the interior, and large barriers at the LPS headgroups. The hydrophilic set shows less asymmetry, with a barrier in the bilayer center and minima on both sides. The PMF for ethanol in the inner leaflet is shown to be close to that of a pure DOPC bilayer. Turning to the Gram-negative inner membrane, Lim et al.315 simulated the effects of 1-octyl-3-methylimidaxolium (OMIM+) on the structure and permeability of a model composed of 4:1 POPE:POPG. It is shown that OMIM+ readily binds to and thins the membrane and thereby facilitates a 7-fold increase in its permeability to ammonia. Zhou et al.316 modeled the membrane with a similar composition, 3:1 POPE:POPG, and obtained permeabilities for thiols and thiol/mercury complexes. P = 8.1 × 10⁻⁵ and 1.6 × 10⁻⁵ cm/s for CH3Hg-SCH3 and CH3S-HgII-SCH3, respectively, supporting the proposal that nonionized mercury containing compounds can permeate the bacterial inner membrane.
The simulations of Vermaas et al.317–318 focus on an important industrial application: nondestructive product recovery from genetically engineered microbes into an organic phase. Their simulation system contains a bilayer composed of PC, PE, PS, phosphatidyl inositol, phosphatidic acid, and sterols (a mixture modeling the composition of a yeast membrane) in contact with a dodecane sublayer (the solvent used for extraction). The methods combined biased and unbiased simulations, a detailed analysis of PMF and diffusion constants, and permeabilities calculated from the preceding profiles. The simulations of assorted fatty acyl permeants (acids, alcohols, aldehydes, alkanes, and alkenes)317 showed that oxidation facilitates extraction into the dodecane layer. Independent considerations of reactivity and toxicity lead to the conclusion fatty alcohols are optimal. Subsequent simulations on terpenoids318 indicated that extraction into organic phases is relatively oxidization independent, though oxidation does accelerate permeation into aqueous phases.
10. SUMMARY AND CONCLUSIONS
The underlying theme of this Review is that simulations can contribute to the understanding of membrane permeability as long as one understands the simulations.
Section 2 reviewed the framework for describing permeability. Fick’s First and Second Law lead to the homogeneous solubility-diffusion (HSD) model, , where the essential elements, the permeant partition coefficient K and diffusion constant D, and the membrane thickness h, are constants. Overton’s observations provided the critical link between the membrane permeability and the partition coefficient in organic solvents over 50 years before the structure of membrane was established. The Smoluchowski Equation leads to the inhomogeneous solubility-diffusion (ISD) model, where the constants in the HSD are replaced by detailed profiles in the membrane. Section 2 closed with an analysis of the HSD for water. Simple simulation techniques for calculating the free energy and electron density profiles reveal the limitations of this assumption for K and h, and more advanced techniques show the limitation for D. As shown in Table 2, plausible ranges in each of the three parameters lead to a water permeabilities that range from 0.0009 to 0.013 cm/s. While the preceding factor of 14 range brackets relevant experimental results for most fluid phase bilayers (those with polyunsaturated lipids or cholesterol are not included), it demonstrates that the HSD model is not generally reliable for better than order-of-magnitude estimates.
Section 3 presents results from simulations of simple systems to provide insight into three issues relevant to studies of permeability: errors in the force field (FF); fractional viscosity dependence of small molecules in alkanes; and periodic boundary condition (PBC) artifacts. Following a brief review of additive and polarizable FF, Section 3.2 considers a water/hexadecane slab, a primitive model of a bilayer. The analysis is mostly for the CHARMM additive force field, C36, though some is for the CHARMM polarizable force field, denoted “Drude”. The most fundamental problem to emerge for C36 is that the water to hexadecane transfer free energy for water overestimates experiment by 1 kcal/mol, and that of ethane underestimates experiment by 0.4 kcal/mol (Table 3). Hence, water is not sufficiently soluble in alkane, and alkane is not sufficiently soluble in water for C36. The immediate implication of these errors is that permeabilities calculated for water will be too low and for ethane too high, assuming no cancellation of errors. A more fundamental concern is that the balance of interactions, carefully tuned when developing C36, overestimates the hydrophobic effect, that manifestation of the mutual dislike of hydrocarbons and water. This result might be anticipated for additive FF such as C36. The charge distributions on atoms are fixed, and thereby remain the same when a polar molecule such as water enters the acyl chain regions of membranes. Polarizable force fields allow such adjustments, and calculated using Drude for water and ethane are much closer to experiment (Table 3). The next generation of lipid FF, which will include polarizability, long range Lennard-Jones interactions, and possibly higher order charge distributions (quadrupole and octupole), will lead to much needed improvements. In the meantime, simulators evaluating permeability would be wise to compare from simulation and experiment when possible.
The examination of FF continues in Section 3.3.1, with an evaluation of the viscosity of hexadecane at 30, 37 and 50 °C, a temperature range that brackets most bilayer studies. The C36 FF reproduces the experimental temperature dependence (Fig. 9), but underestimates experiment by approximately 20% (falling between pentadecane and tetradecane). The addition of long-range Lennard-Jones interactions improves agreement, especially for the Drude FF. While viscosity is an important determinant of diffusion, the diffusion constant only enters linearly into the permeability. Hence, even the 20% error in viscosity for C36 is a substantially smaller concern than the 1 kcal/mol error in . Furthermore, improvements in the FF related to viscosity are relatively easier to implement by adding long range Lennard-Jones terms.
Section 3.3.2 presents simulations of oxygen in homogeneous systems of octane, dodecane, hexadecane, and water using the C36 FF. The simulations reproduce the experimentally observed fractional viscosity dependence (Fig. 10), and thereby provide good support for the potential, despite the issues with water solubility noted above. Furthermore, fractional viscosity dependence indicates the presence of subdiffusion, and is reflected in the mean-squared-displacement (msd) of O2 at short times (Fig. 11). This short-time dynamics must be taken into account when using the msd to estimate diffusion constants of small permeants in bilayers.
The last topic in Section 3 concerns the effects of periodic boundary conditions (PBC) on diffusion, and therefore permeability. Section 3.3.3 begins testing on homogeneous systems noted in the preceding paragraph. Table 4 indicates that PBC effects are present for oxygen diffusion in all four solvents for box-length L = 30 Å but are near negligible for L= 50 Å and 100 Å (the typical sizes of bilayer lengths in all-atom simulations). The Yeh-Hummer (YH) correction based on classical hydrodynamics does not appear to apply to O2 diffusion in alkanes, a likely ramification of subdiffusion. In contrast, as shown in Section 3.3.4, the YH correction holds for water, a less porous solvent. These results set the stage for the discussion of membrane PBC effects in Section 6.
Section 4 shows how permeability of water can be calculated from simulations by directly evaluating the flux or the transition rate of a permeant though the membrane, and relating to experiment using Fick’s Law. The former, or Flux-Based (FB) method, involves monitoring the numbers of permeants in a second compartment for a double bilayer setup (Figs. 13 and 14) or in an image cell (Fig. 15) for a single bilayer. The latter, or Transition-Based (TB) method, involves counting transits in either direction. Both methods work well for water. The TB is more generally applicable, as shown here for oxygen (which is highly soluble in the bilayer and thereby confounds the FB method). Nevertheless, simulations of a double bilayer and analysis with the FB method has pedagogical value, and this geometry will be increasingly practical as computer power increases. The FB method may indeed be preferable for systems far from equilibrium, and in cases where trajectory frames are saved at infrequent intervals.
Section 5 reviews theoretical methods that relate to the dynamics of the permeant in the membrane via the inhomogeneous solubility equation, including new work related to lateral diffusion in the bilayer and a Bayesian Analysis (BA) method that was applied to water and oxygen permeation. The accurate calculation of potentials of mean force and position dependent diffusion constants and of permeants in membranes remains an active topic of research. Results for both vary substantially among different methods, and it will therefore be helpful to compare the calculated permeabilities to the model-free estimates from the counting methods when feasible.
The methods described in Sections 4 and 5 have different advantages and disadvantages. Counting is “model-free” to the extent that Fick’s Law is not considered a model. The permeability can be determined from simulation without knowledge of the free energy or diffusion profiles. However, the number of counts in a present-day simulation may be low or non-existent for many permeants of interest, and counting methods provide little insight into the underlying reasons for permeability. Theoretical models like the ISD allow precise evaluations of permeability from simulations, and explicitly relate microscopic quantities to macroscopic observables. The preceding quantities could be used as input to refine compartmental models of bilayers (Section 8), develop models of dramatically different structures such as lipid droplets, or to understand processes like oxygen capture by cytochrome oxidase.
Before accessing a model, it is critical to determine whether the analysis of the model is valid. Section 6 considers two effects that could confound the analysis, undulations (Fig. 21) and periodic boundary conditions. Section 6.1 showed that PMFs evaluated without correction from simulations of large and small systems will be different (Figs. 22 and 23), and those from large systems will yield incorrect escape times (and therefore permeabilities) when inserted into the inhomogeneous solubility model (Table 9). This result does not imply that the ISD model is incorrect. Rather, it indicates that the fluctuations must be removed from the large system before processing with the current BA method. Otherwise, only small systems can be examined with confidence when calculating water permeability. The effects of undulations on the PMFs are different for water (the barrier in the bilayer midplane is thinned) and oxygen (the barriers at the phosphate planes are reduced). Dividing surfaces necessary for counting based methods can also become poor markers of transitions. Simulating at several system sizes provides an estimate of the effect of undulations and a strategy of analysis can be formulated. Shifting the location of the dividing surface away from the bilayer surface is a reasonable strategy for counting, though may lead to underestimates of crossing rates for certain systems. A more far reaching approach might be to remove the undulations before processing even for counting-based estimates. Lastly, effects of undulations can differ for different properties. The lateral distance travelled before escape, , for O2 is relatively unperturbed because it reflects dynamics in the bilayer center. The effect on escape time is greater because undulations reduce the barrier height at the bilayer/water interface, and passage over this barrier is an essential determinant of .
Section 6.2.1 outlines the problem of periodic boundary condition effects on diffusion in a bilayer. While these are substantial for the lateral diffusion of lipids and proteins, Section 6.2.2 shows that PBC effects on permeability are small for water and oxygen in assorted bilayers of L ≥ 50 Å. However, this should not be assumed to hold for larger permeants. Hydrodynamic effects in the bilayer can be large and testing on different sized systems should become standard. Furthermore, it is unwise to assume that errors will cancel and that trends can be trusted. Hydrodynamic parameters such as surface viscosity and interleaflet friction vary among bilayers. While there are satisfactory methods for estimating the effects of PBC for lateral diffusion of lipids and proteins in membrane simulations, analogous treatments for normal and lateral diffusion of small and large permeants (which are not confined to the headgroup region) are not presently available. Development of such methods will be welcomed.
The results of Section 6 indicate that the Bayesian analysis method reviewed in Section 5 is satisfactory for 72-lipid sized systems. Section 7.1 tested the ISD model using permeabilities obtained by the BA for water and oxygen, and and for oxygen. The tentative conclusion is that the ISD model: (1) is not obviously incorrect for water permeabilities (Table 10, Fig. 25), though this issue requires further analysis with longer trajectories; (2) successfully captures for oxygen (Fig. 26 bottom); (3) underestimates for oxygen by approximately 20% on average (Fig. 26 top).
Section 7.2 presented a profoundly negative result: simulations with the additive FF C36 underestimate the experimentally determined permeabilities of water by factors of 4–10 for most lipids (Table 11 and Fig. 27), and molecular oxygen by a factor of 5 (though the experimental data for this comparison is less extensive). The attribution of the error to lack of polarizability for water had already been anticipated in Section 2.6.2, where the transfer free energy of water to hexadecane was shown to be overestimated by 1 kcal/mol (thereby substantially reducing the partition coefficient in the bilayer). The absence of electrostatic structure and polarizability might explain the errors in the permeability of O2, though it is also possible that an improved additive model could be formulated. These results and others described in the review strongly motivate the further development of force fields with polarizability and multipoles, and constant pH methods. In the meantime, the C36 additive FF remains attractive for investigating numerous membrane properties, and processes in the membrane wherein exposure to water or charge state is not dramatically changed over the course of the trajectory. On a more positive note, the present simulations show a strong correlation of water-carbonyl hydrogen bonds (which reduce the potential of mean force for water) with bilayer surface area (Fig. 28). This observation lends some insight to the experimental observation that permeability is a strong function of bilayer surface area (Fig. 27), as opposed to the bilayer thickness predicted by the HSD model.
The compartmental models developed in Section 8 provided further insight to the water and oxygen systems. The “wetting” of the hydrocarbon region between the head groups and midplane is an important factor in water permeability, and the barrier in the phosphate plane is a critical modulator of oxygen permeability. From this perspective the “fence” that head groups provide to water permeation as the surface area decreases is more nuanced than that of a rigid barrier.
Section 9 reviews the literature from 2015–2018. We hope that the background provided in Sections 1–8 enables readers to understand the remarkable variety of approaches and applications currently underway in the field, and to participate in future progress.
ACKNOWLEDGEMENTS
We thank An Ghysels, Attila Szabo, Gerhard Hummer, Frank Brown, John Nagle, Eric Wang, Josh Vermass, Jeffery Klauda, and Alison Leonard for helpful discussions. This research was supported by the Intramural Research Program of the NIH, National Heart, Lung and Blood Institute, and used the high-performance computational capabilities at the National Institutes of Health, Bethesda, MD (NHLBI LoBoS and CIT Biowulf clusters).
Biographies
Richard Venable is a Staff Scientist at the National Heart, Lung, and Blood Institute (NHLBI) at the National Institutes of Health (NIH). He obtained a B.S. degree in chemistry from the Pennsylvania State University in 1969, and a research M.S. in theoretical organic chemistry from the University of Maryland in 1973. He worked in pharmaceutical analysis method development for the U.S. Food and Drug Administration (FDA) from 1974 to 1985, which included applications of computer technology for data collection, retrieval, and analysis. In 1985, he joined the research group of Richard Pastor and became a computational chemist, performing complex studies of biological systems, esp. molecular dynamics simulations of lipid bilayers. He became adept at the use of the CHARMM program and has contributed to its development, as well as the development of the CHARMM force fields for lipids and carbohydrates. In 2006, the group moved from the FDA to the National Heart, Lung, and Blood Institute, continuing the research into simulating the biophysical properties of an expanding variety of lipid membrane systems.
Andreas Krämer is a postdoctoral researcher at NHLBI/NIH. He obtained his Dipl.-Math. from the University of Trier, Germany, in 2012, while exploring the use of numerical optimization methods for optimizing molecular force fields at Fraunhofer Institute for Algorithms and Scientific Computing (SCAI). At Fraunhofer SCAI, he also worked on optimization methods to automatically generate phase diagrams for alloys. He then joined the Bonn-Rhein-Sieg University of Applied Sciences in Sankt Augustin, Germany, developing simulation techniques for Computational Fluid Dynamics. In 2017, he received a Ph.D. from the Department of Mechanical Engineering at University of Siegen, Germany. His current research focusses on automated optimization of force fields for molecular dynamics simulations.
Richard Pastor is a Senior Investigator at NHLBI/NIH. Following a B.A. in philosophy from Hamilton College in 1973, he obtained an M.S. at Syracuse University in 1977, exploring theories of surface tension with Jerry Goodisman, and a Ph.D. at Harvard University in 1984 with Martin Karplus, beginning with polymer dynamics and ending with a mean field model for lipid chain dynamics in membranes. He used this mean field model to analyze NMR relaxation times with Attila Szabo as a postdoctoral Fellow at NIH, and then to generate initial conditions for early all-atom MD simulations of lipid bilayers. He worked at the FDA from 1984–2005 and returned to the NIH in 2006. His research remains focused on computer simulations of membranes at the interface between theory and experiment.
REFERENCES
- (1).Finkelstein A, Water Movement through Lipid Bilayers, Pores, and Plasma Membranes: Theory and Reality John Wiley & Sons: New York, 1987; Vol. 4. [Google Scholar]
- (2).Kleinzeller A, Charles Ernest Overton’s Concept of a Cell Membrane. Curr. Top. Membr 1999, 48, 1–22. [Google Scholar]
- (3).Gorter E; Grendel F, On Bimolecular Layers of Lipoids on the Chromocytes of the Blood. J. Exp. Med 1925, 41, 439–443. [DOI] [PMC free article] [PubMed] [Google Scholar]
- (4).Yeagle PL, The Membranes of Cells Third ed.; Elsevier: London, 2016. [Google Scholar]
- (5).Robertson JD, The Molecular Structrure and Contact Relationships of Cell Membranes Prog. Biophys. Mol. Biol 1960, 10, 343–418. [PubMed] [Google Scholar]
- (6).Allen MP; Tildesley DJ, Computer Simulations of Liquids Clarendon Press: Oxford, 1987. [Google Scholar]
- (7).Brooks CL III; Karplus M; Pettitt BM, Proteins: A Theoretical Perspective of Dynamics, Structure, and Thermodynamics Wiley-Interscience: New York, 1988; Vol. 71. [Google Scholar]
- (8).Pastor RW, Molecular Dynamics and Monte Carlo Simulations of Lipid Bilayers. Curr. Opin. Struct. Biol 1994, 4, 486–492. [Google Scholar]
- (9).Marrink SJ; Berendsen HJC, Simulation of Water Transport through a Lipid-Membrane. J. Phys. Chem 1994, 98, 4155–4168. [Google Scholar]
- (10).Awoonor-Williams E; Rowley CN, Molecular Simulation of Nonfacilitated Membrane Permeation. Biochim. Biophys. Acta-Biomembr 2016, 1858, 1672–1687. [DOI] [PubMed] [Google Scholar]
- (11).Mathai JC; Tristram-Nagle S; Nagle JF; Zeidel ML, Structural Determinants of Water Permeability through the Lipid Membrane. J. Gen. Physiol 2008, 131, 69–76. [DOI] [PMC free article] [PubMed] [Google Scholar]
- (12).Nagle JF; Mathai JC; Zeidel ML; Tristram-Nagle S, Theory of Passive Permeability through Lipid Bilayers. J. Gen. Physiol 2008, 131, 77–85. [DOI] [PMC free article] [PubMed] [Google Scholar]
- (13).Ghysels A; Venable RM; Pastor RW; Hummer G, Position-Dependent Diffusion Tensors in Anisotropic Media from Simulation: Oxygen Transport in and through Membranes. J. Chem. Theory Comput 2017, 13, 2962–2976. [DOI] [PMC free article] [PubMed] [Google Scholar]
- (14).De Vos A; Venable RM; Van Henke T; Hummer G; Pastor RW; Ghysels A, Membrane Permeability: Characteristic Times and Lengths for Oxygen, and a Simulation-Based Test of the Inhomogeneous Solubility-Diffusion Model. J. Chem. Theory Comput 2018, 14, 3811–3824. [DOI] [PMC free article] [PubMed] [Google Scholar]
- (15).Lodish H; Berk A; Zipursky SL; Matsudaira P; Baltimore D; Darnell J, Molecular Cell Biology 4th ed.; W. H. Freeman: New York, 2000. [Google Scholar]
- (16).Paula S; Deamer DW, Membrane Permeability Barriers to Ionic and Polar Solutes. Curr. Top. Membr 1999, 48, 77–95. [Google Scholar]
- (17).Truskey GA; Yuan F; Katz DF, Transport Phenonoma in Biological Systems Pearson Education, Inc: London, 2009. [Google Scholar]
- (18).Finkelstein A, Water and Nonelectrolyte Permeability of Lipid Bilayer Membranes. J. Gen. Physiol 1976, 68, 127–135. [DOI] [PMC free article] [PubMed] [Google Scholar]
- (19).Walter A; Gutknecht J, Permeability of Small Nonelectrolytes through Lipid Bilayer Membranes. J. Membr. Biol 1986, 90, 207–217. [DOI] [PubMed] [Google Scholar]
- (20).MacCallum JL; Bennett WFD; Tieleman DP, Distribution of Amino Acids in a Lipid Bilayer from Computer Simulations. Biophys. J 2008, 94, 3393–3404. [DOI] [PMC free article] [PubMed] [Google Scholar]
- (21).Roux B, Lonely Arginine Seeks Friendly Environment. J. Gen. Physiol 2007, 130, 233–236. [DOI] [PMC free article] [PubMed] [Google Scholar]
- (22).Hanai T; Haydon DA, Pemeablity to Water of Biomolecular Lipid Membranes J. Theor. Biol 1966, 11, 370–&. [DOI] [PubMed] [Google Scholar]
- (23).Cass A; Finkelstein A, Water Permeability of Thin Lipid Membranes J. Gen. Physiol 1967, 50, 1765–1784. [DOI] [PMC free article] [PubMed] [Google Scholar]
- (24).Finkelstein A; Cass A, Permeability and Electrical Propeties of Thin Lipid Membranes. J. Gen. Physiol 1968, 52, 145–173. [PMC free article] [PubMed] [Google Scholar]
- (25).Al-Awqati Q, One Hundred Years of Membrane Permeability: Does Overton Still Rule? Nat. Cell Biol 1999, 1, E201–E202. [DOI] [PubMed] [Google Scholar]
- (26).Missner A; Pohl P, 110 Years of the Meyer-Overton Rule: Predicting Membrane Permeability of Gases and Other Small Compounds. ChemPhysChem 2009, 10, 1405–1414. [DOI] [PMC free article] [PubMed] [Google Scholar]
- (27).Doi M; Edwards SF, The Theory of Polymer Dynamics Clarendon Press: Oxford, 1986. [Google Scholar]
- (28).Diamond JM; Katz Y, Interpretation of Nonelectrolyte Partition-Coefficients Between Dimyristroyl Lecithin and Water J. Membr. Biol 1974, 17, 121–154. [DOI] [PubMed] [Google Scholar]
- (29).Votapka LW; Lee CT; Amaro RE, Two Relations to Estimate Membrane Permeability Using Milestoning. J. Phys. Chem. B 2016, 120, 8606–8616. [DOI] [PMC free article] [PubMed] [Google Scholar]
- (30).Zwolinski BJ; Eyring H; Reese CE, Diffusion and Membrane Permeability. 1. J. Phys. Colloid. Chem 1949, 53, 1426–1453. [Google Scholar]
- (31).Dickson CJ; Hornak V; Pearlstein RA; Duca JS, Structure-Kinetic Relationships of Passive Membrane Permeation from Multiscale Modeling. J. Am. Chem. Soc 2017, 139, 442–452. [DOI] [PubMed] [Google Scholar]
- (32).Wiener MC; Suter RM; Nagle JF, Structure of the Fully Hydrated Gel Phase of Dipalmitoylphosphatidylcholine. Biophys. J 1989, 55, 315–325. [DOI] [PMC free article] [PubMed] [Google Scholar]
- (33).Wiener MC; White SH, Fluid Bilayer Structure Determination by the Combined Use of X-ray and Neutron-Diffraction Ii. Composition-Space Refinement Method. Biophys. J 1991, 59, 174–185. [DOI] [PMC free article] [PubMed] [Google Scholar]
- (34).Nagle JF; Tristram-Nagle S, Structure of Lipid Bilayers. Biochim. Biophys. Acta-Rev. Biomembr 2000, 1469, 159–195. [DOI] [PMC free article] [PubMed] [Google Scholar]
- (35).Kucerka N; Nieh MP; Katsaras J, Fluid Phase Lipid Areas and Bilayer Thicknesses of Commonly Used Phosphatidylcholines as a Function of Temperature. BBA-Biomembranes 2011, 1808, 2761–2771. [DOI] [PubMed] [Google Scholar]
- (36).Klauda JB; Kučerka N; Brooks BR; Pastor RW; Nagle JF, Simulation-Based Methods for Interpreting X-ray Data from Lipid Bilayers. Biophys. J 2006, 90, 2796–2807. [DOI] [PMC free article] [PubMed] [Google Scholar]
- (37).Klauda JB; Venable RM; Freites JA; O’Connor JW; Tobias DJ; Mondragon-Ramirez C; Vorobyov I; MacKerell AD Jr.; Pastor RW, Update of the Charmm All-Atom Additive Force Field for Lipids: Validation on Six Lipid Types. J. Phys. Chem. B 2010, 114, 7830–7843. [DOI] [PMC free article] [PubMed] [Google Scholar]
- (38).Venable RM; Brown FLH; Pastor RW, Mechanical Properties of Lipid Bilayers from Molecular Dynamics Simulation. Chem. Phys. Lipids 2015, 192, 60–74. [DOI] [PMC free article] [PubMed] [Google Scholar]
- (39).Abraham MH; Whiting GS; Fuchs R; Chambers EJ, Thermodynamics of Solute Transfer from Water to Hexadecane J. Chem. Soc., Perkin Trans 1 1990, 291–300. [Google Scholar]
- (40).van Meer G; Voelker DR; Feigenson GW, Membrane Lipids: Where They Are and How They Behave. Nat. Rev. Mol. Cell Biol 2008, 9, 112–124. [DOI] [PMC free article] [PubMed] [Google Scholar]
- (41).Carl DR; Feller SE, Free Energy of Water Transfer into a Hydrophobic Medium: Effect of Polyunsaturation. Langmuir 2003, 19, 8560–8564. [Google Scholar]
- (42).Su JT; Duncan PB; Momaya A; Jutila A; Needham D, The Effect of Hydrogen Bonding on the Diffusion of Water in n-Alkanes and n-Alcohols Measured with a Novel Single Microdroplet Method. J. Chem. Phys 2010, 132, 44506. [DOI] [PMC free article] [PubMed] [Google Scholar]
- (43).Schatzberg P, Diffusion of Water through Hydrocarbon Liquids. J Polym. Sci, Part C: Polym. Symp 1965, 87–92.
- (44).Krämer A; Pickard FC IV; Huang J; Venable RM; Reith D; Kirschner KN; Pastor RW; Brooks BR, Interactions of Water and Alkanes: Modifying Force Fields to Account for Polarizability. submitted for publication 2019. [DOI] [PMC free article] [PubMed]
- (45).Ju LK; Ho CS, Oxygen Diffusion Coefficient and Solubility in n-Hexadecane Biotechnol. Bioeng 1989, 34, 1221–1224. [DOI] [PubMed] [Google Scholar]
- (46).Riahi S; Rowley CN, Why Can Hydrogen Sulfide Permeate Cell Membranes? J. Am. Chem. Soc 2014, 136, 15111–15113. [DOI] [PubMed] [Google Scholar]
- (47).Fettiplace R; Andrews DM; Haydon DA, Thickness, Composition and Structure of Some Lipid Bilayers and Natural Membranes. J. Membr. Biol 1971, 5, 277–296. [DOI] [PubMed] [Google Scholar]
- (48).McIntosh TJ; Simon SA, Area Per Molecule and Distribution of Water in Fully Hydrated Dilauroylphosphatidylethanolamine Bilayers. Biochemistry 1986, 25, 4948–4952. [DOI] [PubMed] [Google Scholar]
- (49).Huster D; Jin AJ; Arnold K; Gawrisch K, Water Permeability of Polyunsaturated Lipid Membranes Measured by O-17 NMR. Biophys. J 1997, 73, 855–864. [DOI] [PMC free article] [PubMed] [Google Scholar]
- (50).Klauda JB; Venable RM; MacKerell AD; Pastor RW, Considerations for Lipid Force Field Development. In Computational Modeling of Membrane Bilayers, Feller SE, Ed. 2008; Vol. 60, pp 1–48. [Google Scholar]
- (51).Warshel A; Kato M; Pisliakov AV, Polarizable Force Fields: History, Test Cases, and Prospects. J. Chem. Theory Comput 2007, 3, 2034–2045. [DOI] [PubMed] [Google Scholar]
- (52).Lemkul JA; Huang J; Roux B; MacKerell AD, An Empirical Polarizable Force Field Based on the Classical Drude Oscillator Model: Development History and Recent Applications. Chem. Rev 2016, 116, 4983–5013. [DOI] [PMC free article] [PubMed] [Google Scholar]
- (53).Ponder JW; Wu C; Ren P; Pande VS; Chodera JD; Schnieders MJ; Haque I; Mobley DL; Lambrecht DS; DiStasio RA, et al. , Current Status of the Amoeba Polarizable Force Field. J. Phys. Chem. B 2010, 114, 2549–2564. [DOI] [PMC free article] [PubMed] [Google Scholar]
- (54).Cisneros GA; Karttunen M; Ren P; Sagui C, Classical Electrostatics for Biomolecular Simulations. Chem. Rev 2014, 114, 779–814. [DOI] [PMC free article] [PubMed] [Google Scholar]
- (55).Huang J; Simmonett AC; Pickard FC IV; MacKerell AD Jr.; Brooks BR, Mapping the Drude Polarizable Force Field onto a Multipole and Induced Dipole Model. J. Chem. Phys 2017, 147, 161702. [DOI] [PMC free article] [PubMed] [Google Scholar]
- (56).Warshel A; Levitt M, Theoretical Studies of Enzymic Reactions: Dielectric, Electrostatic and Steric Stabilization of the Carbonium Ion in the Reaction of Lysozyme. J. Mol. Biol 1976, 103, 227–249. [DOI] [PubMed] [Google Scholar]
- (57).Senn HM; Thiel W, QM/MM Methods for Biomolecular Systems. Angew. Chem. Int. Ed 2009, 48, 1198–1229. [DOI] [PubMed] [Google Scholar]
- (58).Brunk E; Rothlisberger U, Mixed Quantum Mechanical/Molecular Mechanical Molecular Dynamics Simulations of Biological Systems in Ground and Electronically Excited States. Chem. Rev 2015, 115, 6217–6263. [DOI] [PubMed] [Google Scholar]
- (59).Boulanger E; Harvey JN, QM/MM Methods for Free Energies and Photochemistry. Curr. Opin. Struct. Biol 2018, 49, 72–76. [DOI] [PubMed] [Google Scholar]
- (60).König G; Pickard FC; Huang J; Simmonett AC; Tofoleanu F; Lee J; Dral PO; Prasad S; Jones M; Shao Y, et al. , Calculating Distribution Coefficients Based on Multi-Scale Free Energy Simulations: An Evaluation of MM and QM/MM Explicit Solvent Simulations of Water-Cyclohexane Transfer in the Sampl5 Challenge. J. Comput.-Aided Mol. Des 2016, 30, 989–1006. [DOI] [PubMed] [Google Scholar]
- (61).Kohn W; Sham LJ, Self-Consistent Equations Including Exchange and Correlation Effects. Phys. Rev 1965, 140, A1133–A1138. [Google Scholar]
- (62).Bartlett RJ; Musiał M, Coupled-Cluster Theory in Quantum Chemistry. Rev. Mod. Phys 2007, 79, 291–352. [Google Scholar]
- (63).Christensen AS; Kubař T; Cui Q; Elstner M, Semiempirical Quantum Mechanical Methods for Noncovalent Interactions for Chemical and Biochemical Applications. Chem. Rev 2016, 116, 5301–5337. [DOI] [PMC free article] [PubMed] [Google Scholar]
- (64).Cui Q, Perspective: Quantum Mechanical Methods in Biochemistry and Biophysics. J. Chem. Phys 2016, 145, 140901. [DOI] [PMC free article] [PubMed] [Google Scholar]
- (65).Mardirossian N; Head-Gordon M, Thirty Years of Density Functional Theory in Computational Chemistry: An Overview and Extensive Assessment of 200 Density Functionals. Mol. Phys 2017, 115, 2315–2372. [Google Scholar]
- (66).Feller SE; Pastor RW, On Simulating Lipid Bilayers with an Applied Surface Tension: Periodic Boundary Conditions and Undulations. Biophys. J 1996, 71, 1350–1355. [DOI] [PMC free article] [PubMed] [Google Scholar]
- (67).Venable RM; Sodt AJ; Rogaski B; Rui H; Hatcher E; MacKerell AD Jr.; Pastor RW; Klauda JB, Charmm All-Atom Additive Force Field for Sphingomyelin: Elucidation of Hydrogen Bonding and of Positive Curvature. Biophys. J 2014, 107, 134–145. [DOI] [PMC free article] [PubMed] [Google Scholar]
- (68).Klauda JB; Brooks BR; MacKerell AD; Venable RM; Pastor RW, An Ab Initio Study on the Torsional Surface of Alkanes and Its Effect on Molecular Simulations of Alkanes and a Dppc Bilayer. J. Phys. Chem. B 2005, 109, 5300–5311. [DOI] [PubMed] [Google Scholar]
- (69).Klauda JB; Monje V; Kim T; Im W, Improving the CHARMM Force Field for Polyunsaturated Fatty Acid Chains. J. Phys. Chem. B 2012, 116, 9424–9431. [DOI] [PubMed] [Google Scholar]
- (70).Lim JB; Rogaski B; Klauda JB, Update of the Cholesterol Force Field Parameters in CHARMM. J. Phys. Chem. B 2012, 116, 203–210. [DOI] [PubMed] [Google Scholar]
- (71).Venable RM; Luo Y; Gawrisch K; Roux B; Pastor RW, Simulations of Anionic Lipid Membranes: Development of Interaction-Specific Ion Parameters and Validation Using NMR Data. J. Phys. Chem. B 2013, 117, 10183–10192. [DOI] [PMC free article] [PubMed] [Google Scholar]
- (72).Khakbaz P; Klauda JB, Probing the Importance of Lipid Diversity in Cell Membranes Via Molecular Simulation. Chem. Phys. Lipids 2015, 192, 12–22. [DOI] [PubMed] [Google Scholar]
- (73).Chowdhary J; Harder E; Lopes PEM; Huang L; MacKerell AD Jr.; Roux B, A Polarizable Force Field of Dipalmitoylphosphatidylcholine Based on the Classical Drude Model for Molecular Dynamics Simulations of Lipids. J. Phys. Chem. B 2013, 117, 9142–9160. [DOI] [PMC free article] [PubMed] [Google Scholar]
- (74).Li H; Chowdhary J; Huang L; He X; MacKerell AD; Roux B, Drude Polarizable Force Field for Molecular Dynamics Simulations of Saturated and Unsaturated Zwitterionic Lipids. J. Chem. Theory Comput 2017, 13, 4535–4552. [DOI] [PMC free article] [PubMed] [Google Scholar]
- (75).Durell SR; Brooks BR; Bennaim A, Solvent-Induced Forces between Two Hydrophilic Groups. J. Phys. Chem 1994, 98, 2198–2202. [Google Scholar]
- (76).Jorgensen WL; Chandrasekhar J; Madura JD; Impey RW; Klein ML, Comparison of Simple Potential Functions for Simulating Liquid Water. J. Chem. Phys 1983, 79, 926–935. [Google Scholar]
- (77).Venable RM; Hatcher E; Guvench O; MacKerell AD; Pastor RW, Comparing Simulated and Experimental Translation and Rotation Constants: Range of Validity for Viscosity Scaling. J. Phys. Chem. B 2010, 114, 12501–12507. [DOI] [PMC free article] [PubMed] [Google Scholar]
- (78).Vega C; Abascal JLF, Simulating Water with Rigid Non-Polarizable Models: A General Perspective. Phys. Chem. Chem. Phys 2011, 13, 19663–19688. [DOI] [PubMed] [Google Scholar]
- (79).Wang LP; Head-Gordon T; Ponder JW; Ren PY; Chodera JD; Eastman PK; Martinez TJ; Pande VS, Systematic Improvement on the Classical Molecular Model of Water. Abstr. Pap. Am. Chem. Soc 2013, 246. [DOI] [PMC free article] [PubMed] [Google Scholar]
- (80).Ichiye T, Water in the Liquid State: A Computational Viewpoint In Advances in Chemical Physics, Vol 155, Rice SA; Dinner AR, Eds. 2014; Vol. 155, pp 161–199. [Google Scholar]
- (81).Tran KN; Tan ML; Ichiye T, A Single-Site Multipole Model for Liquid Water. J. Chem. Phys 2016, 145. [DOI] [PubMed] [Google Scholar]
- (82).Sajadi F; Rowley CN, Simulations of Lipid Bilayers Using the Charmm36 Force Field with the TIP3P-Fb and TIP-4P Water Models. PeerJ 2018, 6, e5472. [DOI] [PMC free article] [PubMed] [Google Scholar]
- (83).Kramer A; Hulsmann M; Koddermann T; Reith D, Automated Parameterization of Intermolecular Pair Potentials Using Global Optimization Techniques. Comput. Phys. Commun 2014, 185, 3228–3239. [Google Scholar]
- (84).Bereau T; Andrienko D; von Lilienfeld OA, Transferable Atomic Multipole Machine Learning Models for Small Organic Molecules. J. Chem. Theory Comput 2015, 11, 3225–3233. [DOI] [PubMed] [Google Scholar]
- (85).Li ZW; Kermode JR; De Vita A, Molecular Dynamics with on-the-Fly Machine Learning of Quantum-Mechanical Forces. Phys. Rev. Lett 2015, 114. [DOI] [PubMed] [Google Scholar]
- (86).Huan TD; Batra R; Chapman J; Krishnan S; Chen L; Ramprasad R, A Universal Strategy for the Creation of Machine Learning-Based Atomistic Force Fields. npj comput. mater 2017, 3. [Google Scholar]
- (87).Glielmo A; Sollich P; De Vita A, Accurate Interatomic Force Fields Via Machine Learning with Covariant Kernels. Phys. Rev. B 2017, 95. [Google Scholar]
- (88).Baptista AM; Teixeira VH; Soares CM, Constant-pH Molecular Dynamics Using Stochastic Titration. J. Chem. Phys 2002, 117, 4184–4200. [Google Scholar]
- (89).Mongan J; Case DA; McCammon JA, Constant pH Molecular Dynamics in Generalized Born Implicit Solvent. J. Comput. Chem 2004, 25, 2038–2048. [DOI] [PubMed] [Google Scholar]
- (90).Chen YJ; Roux B, Constant-pH Hybrid Nonequilibrium Molecular Dynamics Monte Carlo Simulation Method. J. Chem. Theory Comput 2015, 11, 3919–3931. [DOI] [PMC free article] [PubMed] [Google Scholar]
- (91).Lee MS; Salsbury FR; Brooks CL, Constant-pH Molecular Dynamics Using Continuous Titration Coordinates. Proteins 2004, 56, 738–752. [DOI] [PubMed] [Google Scholar]
- (92).Lee J; Miller BT; Damjanovic A; Brooks BR, Constant pH Molecular Dynamics in Explicit Solvent with Enveloping Distribution Sampling and Hamiltonian Exchange. J. Chem. Theory Comput 2014, 10, 2738–2750. [DOI] [PMC free article] [PubMed] [Google Scholar]
- (93).Wu XW; Brooks BR, A Virtual Mixture Approach to the Study of Multistate Equilibrium: Application to Constant pH Simulation in Explicit Water. PLoS Comput. Biol 2015, 11. [DOI] [PMC free article] [PubMed]
- (94).Santos HAF; Vila-Viçosa D; Teixeira VH; Baptista AM; Machuqueiro M, Constant-pH MD Simulations of Dmpa/Dmpc Lipid Bilayers. J. Chem. Theory Comput 2015, 11, 5973–5979. [DOI] [PubMed] [Google Scholar]
- (95).Vila-Viçosa D; Teixeira VH; Baptista AM; Machuqueiro M, Constant-pH MD Simulations of an Oleic Acid Bilayer. J. Chem. Theory Comput 2015, 11, 2367–2376. [DOI] [PubMed] [Google Scholar]
- (96).Lamoureux G; Harder E; Vorobyov IV; Roux B; MacKerell AD, A Polarizable Model of Water for Molecular Dynamics Simulations of Biomolecules. Chem. Phys. Lett 2006, 418, 245–249. [Google Scholar]
- (97).Brooks BR; Brooks CL; Mackerell AD; Nilsson L; Petrella RJ; Roux B; Won Y; Archontis G; Bartels C; Boresch S, et al. , CHARMM: The Biomolecular Simulation Program. J. Comput. Chem 2009, 30, 1545–1614. [DOI] [PMC free article] [PubMed] [Google Scholar]
- (98).Vorobyov IV; Anisimov VM; MacKerell AD Jr., Polarizable Empirical Force Field for Alkanes Based on the Classical Drude Oscillator Model. J. Phys. Chem. B 2005, 109, 18988–18999. [DOI] [PubMed] [Google Scholar]
- (99).Small DM, Handbook of Lipid Research Plenum Press: New York, 1986; Vol. 4. [Google Scholar]
- (100).Lague P; Pastor RW; Brooks BR, Pressure-Based Long-Range Correction for Lennard-Jones Interactions in Molecular Dynamics Simulations: Application to Alkanes and Interfaces. J. Phys. Chem. B 2004, 108, 363–368. [Google Scholar]
- (101).Wu X; Brooks BR, Using the Isotropic Periodic Sum Method to Calculate Long-Range Interactions of Heterogenious Systems. J. Chem. Phys 2008, 129, 154115–154115. [DOI] [PMC free article] [PubMed] [Google Scholar]
- (102).Venable RM; Chen LE; Pastor RW, Comparison of the Extended Isotropic Periodic Sum and Particle Mesh Ewald Methods for Simulations of Lipid Bilayers and Monolayers. J. Phys. Chem. B 2009, 113, 5855–5862. [DOI] [PMC free article] [PubMed] [Google Scholar]
- (103).Essmann U; Perera L; Berkowitz ML; Darden T; Lee H; Pedersen LG, A Smooth Particle Mesh Ewald Method J. Chem. Phys 1995, 103, 8577–8593. [Google Scholar]
- (104).Wennberg CL; Murtola T; Pall S; Abraham MJ; Hess B; Lindahl E, Direct-Space Corrections Enable Fast and Accurate Lorentz-Berthelot Combination Rule Lennard-Jones Lattice Summation. J. Chem. Theory Comput 2015, 11, 5737–5746. [DOI] [PubMed] [Google Scholar]
- (105).Leonard AN; Simmonett AC; Pickard FC; Huang J; Venable RM; Klauda JB; Brooks BR; Pastor RW, Comparison of Additive and Polarizable Models with Explicit Treatment of Long-Range Lennard-Jones Interactions Using Alkane Simulations. J. Chem. Theory Comput 2018, 14, 948–958. [DOI] [PMC free article] [PubMed] [Google Scholar]
- (106).Fischer NM; van Maaren PJ; Ditz JC; Yildirim A; van der Spoel D, Properties of Organic Liquids When Simulated with Long-Range Lennard-Jones Interactions. J. Chem. Theory Comput 2015, 11, 2938–2944. [DOI] [PubMed] [Google Scholar]
- (107).Jakobsen S; Bereau T; Meuwly M, Multipolar Force Fields and Their Effects on Solvent Dynamics around Simple Solutes. J. Phys. Chem. B 2015, 119, 3034–3045. [DOI] [PubMed] [Google Scholar]
- (108).Javanainen M; Vattulainen I; Monticelli L, On Atomistic Models for Molecular Oxygen. J. Phys. Chem. B 2017, 121, 518–528. [DOI] [PubMed] [Google Scholar]
- (109).Torrie GM; Valleau JP, Non-Physical Sampling Distributions in Monte Carlo Free Energy Estimation - Umbrella Sampling J. Comput. Phys 1977, 23, 187–199. [Google Scholar]
- (110).Ferrenberg AM; Swendsen RH, New Monte Carlo Technique for Studying Phase Transitions. Phys. Rev. Lett 1988, 61, 2635–2638. [DOI] [PubMed] [Google Scholar]
- (111).Grossfield A. WHAM: An Implementation of the Weighted Histogram Analysis Method. http://membrane.urmc.rochester.edu/content/wham.
- (112).Chodera JD; Mobley DL; Shirts MR; Dixon RW; Branson K; Pande VS, Alchemical Free Energy Methods for Drug Discovery: Progress and Challenges. Curr. Opin. Struct. Biol 2011, 21, 150–160. [DOI] [PMC free article] [PubMed] [Google Scholar]
- (113).Hansen N; van Gunsteren WF, Practical Aspects of Free-Energy Calculations: A Review. J. Chem. Theory Comput 2014, 10, 2632–2647. [DOI] [PubMed] [Google Scholar]
- (114).Bannan CC; Calabró G; Kyu DY; Mobley DL, Calculating Partition Coefficients of Small Molecules in Octanol/Water and Cyclohexane/Water. J. Chem. Theory Comput 2016, 12, 4015–4024. [DOI] [PMC free article] [PubMed] [Google Scholar]
- (115).Lee J; Miller BT; Brooks BR, Computational Scheme for pH‐Dependent Binding Free Energy Calculation with Explicit Solvent. Protein Sci 2016, 25, 231–243. [DOI] [PMC free article] [PubMed] [Google Scholar]
- (116).Van Holde KE, Physical Biochemistry, Second Edition. Prentiss Hall: Englewood Cliffs, NJ, 1885. [Google Scholar]
- (117).Cantor RR; Shimmmel PR, Biophysical Chemistry W. H. Freeman and company: San Francisco, 1980. [Google Scholar]
- (118).Venable RM; Pastor RW, Frictional Models for Stochastic Simulations of Proteins. Biopolymers 1988, 27, 1001–1014. [DOI] [PubMed] [Google Scholar]
- (119).Berne BJ; Pecora R, Dynamic Light Scattering John Wiley & Sons: New York, 1976. [Google Scholar]
- (120).Hu CM; Zwanzig R, Rotational Friction Coefficients for Spheroids with Slipping Boundary Conditions J. Chem. Phys 1974, 60, 4354–4357. [Google Scholar]
- (121).Rahman A, Correlations in Motion of Atoms in Liquid Argon Phys. Rev 1964, 136, A405–411. [Google Scholar]
- (122).Zwanzig R; Bixon M, Hydrodynamic Theory of the Velocity Correlation Function Phys. Rev. A 1970, 2, 2005–12. [Google Scholar]
- (123).Pollack GL; Kennan RP; Himm JF; Stump DR, Diffusion on Xenon in Liquid Alkanes: Temperature Dependence Measurements with a New Method. Stokes-Einstein and Hard Sphere Theories J. Chem. Phys 1990, 92, 625–630. [Google Scholar]
- (124).Kowert BA; Dang NC; Reed JP; Sobush KT; Seele LG, Diffusion of Dioxygen in Alkanes and Cycloalkanes. J. Phys. Chem. A 2000, 104, 8823–8828. [Google Scholar]
- (125).Zhang YH; Venable RM; Pastor RW, Molecular Dynamics Simulations of Neat Alkanes: The Viscosity Dependence of Rotational Relaxation. J. Phys. Chem 1996, 100, 2652–2660. [Google Scholar]
- (126).Velsko SP; Fleming GR, Photochemical Isomerization in Solution - Photophysics of Diphenyl Butadiene J. Chem. Phys 1982, 76, 3553–3562. [Google Scholar]
- (127).Yeh IC; Hummer G, System-Size Dependence of Diffusion Coefficients and Viscosities from Molecular Dynamics Simulations with Periodic Boundary Conditions. J. Phys. Chem. B 2004, 108, 15873–15879. [Google Scholar]
- (128).Lide DR, Crc Handbook 81 ed.; CRC Press: Boca Raton, FL, 2000. [Google Scholar]
- (129).Dolan EA; Venable RM; Pastor RW; Brooks BR, Simulations of Membranes and Other Interfacial Systems Using P2(1) and Pc Periodic Boundary Conditions. Biophys. J 2002, 82, 2317–2325. [DOI] [PMC free article] [PubMed] [Google Scholar]
- (130).Moultos OA; Zhang Y; Tsimpanogiannis IN; Economou IG; Maginn EJ, System-Size Corrections for Self-Diffusion Coefficients Calculated from Molecular Dynamics Simulations: The Case of CO2, n-Alkanes, and Poly(Ethylene Glycol) Dimethyl Ethers. J. Chem. Phys 2016, 145, 074109. [DOI] [PubMed] [Google Scholar]
- (131).Feller SE; Pastor RW; Rojnuckarin A; Bogusz S; Brooks BR, Effect of Electrostatic Force Truncation on Interfacial and Transport Properties of Water. J. Phys. Chem 1996, 100, 17011–17020. [Google Scholar]
- (132).Pastor RW; Karplus M, Parametrization of the Friction Constant for Stochastic Simulations of Polymers. J. Phys. Chem 1988, 92, 2636–2641. [Google Scholar]
- (133).Hubbard JB; Douglas JF, Hydrodynamic Friction of Arbitrarily Shaped Brownian Particles Phys. Rev. E 1993, 47, R2983–R2986. [DOI] [PubMed] [Google Scholar]
- (134).Sachs JN; Crozier PS; Woolf TB, Atomistic Simulations of Biologically Realistic Transmembrane Potential Gradients. J. Chem. Phys 2004, 121, 10847–10851. [DOI] [PubMed] [Google Scholar]
- (135).Gurtovenko AA; Vattulainen I, Pore Formation Coupled to Ion Transport through Lipid Membranes as Induced by Transmembrane Ionic Charge Imbalance: Atomistic Molecular Dynamics Study. J. Am. Chem. Soc 2005, 127, 17570–17571. [DOI] [PubMed] [Google Scholar]
- (136).Lin J; Alexander-Katz A, Probing Lipid Bilayers under Ionic Imbalance. Biophys. J 2016, 111, 2460–2469. [DOI] [PMC free article] [PubMed] [Google Scholar]
- (137).Salih R; Matthai CC, Computer Simulations of the Diffusion of Na+ and Cl- Ions across Popc Lipid Bilayer Membranes. J. Chem. Phys 2017, 146. [DOI] [PubMed] [Google Scholar]
- (138).de Groot BL; Tieleman DP; Pohl P; Grubmüller H, Water Permeation through Gramicidin A: Desformylation and the Double Helix: A Molecular Dynamics Study. Biophys. J 2002, 82, 2934–2942. [DOI] [PMC free article] [PubMed] [Google Scholar]
- (139).Zhu FQ; Tajkhorshid E; Schulten K, Theory and Simulation of Water Permeation in Aquaporin-1. Biophys. J 2004, 86, 50–57. [DOI] [PMC free article] [PubMed] [Google Scholar]
- (140).Yang LW; Kindt JT, Simulation Study of the Permeability of a Model Lipid Membrane at the Fluid Solid Phase Transition. Langmuir 2015, 31, 2187–2195. [DOI] [PubMed] [Google Scholar]
- (141).Hub JS; de Groot BL, Does CO2 Permeate through Aquaporin-1? Biophys. J 2006, 91, 842–848. [DOI] [PMC free article] [PubMed] [Google Scholar]
- (142).Hub JS; Winkler FK; Merrick M; de Groot BL, Potentials of Mean Force and Permeabilities for Carbon Dioxide, Ammonia, and Water Flux across a Rhesus Protein Channel and Lipid Membranes. J. Am. Chem. Soc 2010, 132, 13251–13263. [DOI] [PubMed] [Google Scholar]
- (143).Chandler D, Statistical Mechanics of Isomerication Dynamics in Liquids and Transition State Approximation. J. Chem. Phys 1978, 68, 2959–2970. [Google Scholar]
- (144).Loncharich RJ; Brooks BR; Pastor RW, Langevin Dynamics of Peptides - the Frictional Dependence of Isomerization Rates of N-Acetylalanyl-N’-Methylamide. Biopolymers 1992, 32, 523–535. [DOI] [PubMed] [Google Scholar]
- (145).Zhang YH; Pastor RW, A Comparision of Methods for Computing Transition Rates from Molecular-Dynamics Simulation. Mol. Simul 1994, 13, 25–38. [Google Scholar]
- (146).Shaw DE; Deneroff MM; Dror RO; Kuskin JS; Larson RH; Salmon JK; Young C; Batson B; Bowers KJ; Chao JC, et al. , Anton, a Special-Purpose Machine for Molecular Dynamics Simulation. Comm. of the ACM 2008, 51, 91–97. [Google Scholar]
- (147).Shaw DE; Grossman JP; Bank JA; Batson B; Butts JA; Chao JC; Deneroff MM; Dror RO; Even A; Fenton CH, et al. , Anton 2: Raising the Bar for Performance and Programmability in a Special-Purpose Molecular Dynamics Supercomputer. In Sc14: International Conference for High Performance Computing, Networking, Storage and Analysis, 2014; pp 41–53. [Google Scholar]
- (148).Chandrasekhar S, Stochastic Problems in Physics and Astronomy. Rev. Mod. Phys 1943, 15, 0001–0089. [Google Scholar]
- (149).Zwanzig R, Time-Correlation Functions and Transport Coefficients in Statistical Mechanics. Annu. Rev. Phys. Chem 1965, 16, 67–&. [Google Scholar]
- (150).Pastor RW; Karplus M, Inertial Effects in Butane Stochastic Dynamics. J. Chem. Phys 1989, 91, 211–218. [Google Scholar]
- (151).Gordon RG, On the Rotational Diffusion of Molecules. J. Chem. Phys 1966, 44, 1830–1836. [Google Scholar]
- (152).Chipot C; Comer J, Subdiffusion in Membrane Permeation of Small Molecules. Sci. Rep 2016, 6, 35913. [DOI] [PMC free article] [PubMed] [Google Scholar]
- (153).Saxton MJ, Single-Particle Tracking: The Distribution of Diffusion Coefficients. Biophys. J 1997, 72, 1744–1753. [DOI] [PMC free article] [PubMed] [Google Scholar]
- (154).Metzler R; Klafter J, The Random Walk’s Guide to Anomalous Diffusion: A Fractional Dynamics Approach. Phys, Rep 2000, 339, 1–77. [Google Scholar]
- (155).Metzler R; Jeon JH; Cherstvy AG; Barkai E, Anomalous Diffusion Models and Their Properties: Non-Stationarity, Non-Ergodicity, and Ageing at the Centenary of Single Particle Tracking. Phys. Chem. Chem. Phys 2014, 16, 24128–24164. [DOI] [PubMed] [Google Scholar]
- (156).Hofling F; Franosch T, Anomalous Transport in the Crowded World of Biological Cells. Rep. Prog. Phys 2013, 76. [DOI] [PubMed] [Google Scholar]
- (157).Darve E; Solomon J; Kia A, Computing Generalized Langevin Equations and Generalized Fokker-Planck Equations. Proc. Natl. Acad. Sci. U. S. A 2009, 106, 10884–10889. [DOI] [PMC free article] [PubMed] [Google Scholar]
- (158).Comer J; Schulten K; Chipot C, Permeability of a Fluid Lipid Bilayer to Short-Chain Alcohols from First Principles. J. Chem. Theory Comput 2017, 13, 2523–2532. [DOI] [PubMed] [Google Scholar]
- (159).Sodt AJ; Sandar ML; Gawrisch K; Pastor RW; Lyman E, The Molecular Structure of the Liquid-Ordered Phase of Lipid Bilayers. J. Am. Chem. Soc 2014, 136, 725–732. [DOI] [PMC free article] [PubMed] [Google Scholar]
- (160).Marquardt D; Kucerka N; Wassall SR; Harroun TA; Katsaras J, Cholesterol’s Location in Lipid Bilayers. Chem. Phys. Lipids 2016, 199, 17–25. [DOI] [PubMed] [Google Scholar]
- (161).Marquardt D; Heberle FA; Greathouse DV; Koeppe RE; Standaert RF; Van Oosten BJ; Harroun TA; Kinnun JJ; Williams JA; Wassall SR, et al. , Lipid Bilayer Thickness Determines Cholesterol’s Location in Model Membranes. Soft Matter 2016, 12, 9417–9428. [DOI] [PubMed] [Google Scholar]
- (162).Jo S; Rui HA; Lim JB; Klauda JB; Im W, Cholesterol Flip-Flop: Insights from Free Energy Simulation Studies. J. Phys. Chem. B 2010, 114, 13342–13348. [DOI] [PubMed] [Google Scholar]
- (163).Parisio G; Stocchero M; Ferrarini A, Passive Membrane Permeability: Beyond the Standard Solubility-Diffusion Model. J. Chem. Theory Comput 2013, 9, 5236–5246. [DOI] [PubMed] [Google Scholar]
- (164).Bonhenry D; Dehez F; Tarek M, Effects of Hydration on the Protonation State of a Lysine Analog Crossing a Phospholipid Bilayer - Insights from Molecular Dynamics and Free-Energy Calculations. Phys. Chem. Chem. Phys 2018, 20, 9101–9107. [DOI] [PubMed] [Google Scholar]
- (165).Sun R; Dama JF; Tan JS; Rose JP; Voth GA, Transition-Tempered Metadynamics Is a Promising Tool for Studying the Permeation of Drug-Like Molecules through Membranes. J. Chem. Theory Comput 2016, 12, 5157–5169. [DOI] [PubMed] [Google Scholar]
- (166).Sun R; Han Y; Swanson JMJ; Tan JS; Rose JP; Voth GA, Molecular Transport through Membranes: Accurate Permeability Coefficients from Multidimensional Potentials of Mean Force and Local Diffusion Constants. J. Chem. Phys 2018, 149, 072310. [DOI] [PMC free article] [PubMed] [Google Scholar]
- (167).Vorobyov I; Olson TE; Kim JH; Koeppe RE 2nd; Andersen OS; Allen TW, Ion-Induced Defect Permeation of Lipid Membranes. Biophys. J 2014, 106, 586–597. [DOI] [PMC free article] [PubMed] [Google Scholar]
- (168).Dorairaj S; Allen TW, On the Thermodynamic Stability of a Charged Arginine Side Chain in a Transmembrane Helix. Proceedings of the National Academy of Sciences 2007, 104, 4943–4948. [DOI] [PMC free article] [PubMed] [Google Scholar]
- (169).Gurtovenko AA; Anwar J; Vattulainen I, Defect-Mediated Trafficking across Cell Membranes: Insights from in Silico Modeling. Chem. Rev 2010, 110, 6077–6103. [DOI] [PubMed] [Google Scholar]
- (170).Mori T; Miyashita N; Im W; Feig M; Sugita Y, Molecular Dynamics Simulations of Biological Membranes and Membrane Proteins Using Enhanced Conformational Sampling Algorithms. BBA-Biomembranes 2016, 1858, 1635–1651. [DOI] [PMC free article] [PubMed] [Google Scholar]
- (171).Sugita Y; Okamoto Y, Replica-Exchange Molecular Dynamics Method for Protein Folding. Chem. Phys. Lett 1999, 314, 141–151. [Google Scholar]
- (172).Woods CJ; Essex JW; King MA, The Development of Replica-Exchange-Based Free-Energy Methods. J. Phys. Chem. B 2003, 107, 13703–13710. [Google Scholar]
- (173).Mori T; Jung J; Sugita Y, Surface-Tension Replica-Exchange Molecular Dynamics Method for Enhanced Sampling of Biological Membrane Systems. J. Chem. Theory Comput 2013, 9, 5629–5640. [DOI] [PubMed] [Google Scholar]
- (174).Sugita Y; Kitao A; Okamoto Y, Multidimensional Replica-Exchange Method for Free-Energy Calculations. J. Chem. Phys 2000, 113, 6042–6051. [Google Scholar]
- (175).Nymeyer H; Woolf TB; Garcia AE, Folding Is Not Required for Bilayer Insertion: Replica Exchange Simulations of an Alpha-Helical Peptide with an Explicit Lipid Bilayer. Proteins 2005, 59, 783–790. [DOI] [PubMed] [Google Scholar]
- (176).Ngo ST; Hung HM; Tran KN; Nguyen MT, Replica Exchange Molecular Dynamics Study of the Amyloid Beta (11–40) Trimer Penetrating a Membrane. RSC Advances 2017, 7, 7346–7357. [Google Scholar]
- (177).Huang K; García AE, Acceleration of Lateral Equilibration in Mixed Lipid Bilayers Using Replica Exchange with Solute Tempering. J. Chem. Theory Comput 2014, 10, 4264–4272. [DOI] [PMC free article] [PubMed] [Google Scholar]
- (178).Lee CT; Comer J; Herndon C; Leung N; Pavlova A; Swift RV; Tung C; Rowley CN; Amaro RE; Chipot C, et al. , Simulation-Based Approaches for Determining Membrane Permeability of Small Compounds. J. Chem. Inf. Model 2016, 56, 721–733. [DOI] [PMC free article] [PubMed] [Google Scholar]
- (179).Laio A; Parrinello M, Escaping Free-Energy Minima. Proc. Natl. Acad. Sci. U. S. A 2002, 99, 12562–12566. [DOI] [PMC free article] [PubMed] [Google Scholar]
- (180).Barducci A; Bussi G; Parrinello M, Well-Tempered Metadynamics: A Smoothly Converging and Tunable Free-Energy Method. Phys. Rev. Lett 2008, 100, 020603. [DOI] [PubMed] [Google Scholar]
- (181).Faradjian AK; Elber R, Computing Time Scales from Reaction Coordinates by Milestoning. J. Chem. Phys 2004, 120, 10880–10889. [DOI] [PubMed] [Google Scholar]
- (182).Májek P; Elber R, Milestoning without a Reaction Coordinate. J. Chem. Theory Comput 2010, 6, 1805–1817. [DOI] [PMC free article] [PubMed] [Google Scholar]
- (183).Kirmizialtin S; Elber R, Revisiting and Computing Reaction Coordinates with Directional Milestoning. J. Phys. Chem. A 2011, 115, 6137–6148. [DOI] [PMC free article] [PubMed] [Google Scholar]
- (184).Via MA; Klug J; Wilke N; Mayorga LS; Del Popolo MG, The Interfacial Electrostatic Potential Modulates the Insertion of Cell-Penetrating Peptides into Lipid Bilayers. Phys. Chem. Chem. Phys 2018, 20, 5180–5189. [DOI] [PubMed] [Google Scholar]
- (185).Cardenas AE; Elber R, Computational Study of Peptide Permeation through Membrane: Searching for Hidden Slow Variables. Mol. Phys 2013, 111, 3565–3578. [DOI] [PMC free article] [PubMed] [Google Scholar]
- (186).Cardenas AE; Elber R, Modeling Kinetics and Equilibrium of Membranes with Fields: Milestoning Analysis and Implication to Permeation. J. Chem. Phys 2014, 141, 054101. [DOI] [PMC free article] [PubMed] [Google Scholar]
- (187).Vega C; Abascal JLF; Conde MM; Aragones JL, What Ice Can Teach Us About Water Interactions: A Critical Comparison of the Performance of Different Water Models. Faraday Discuss 2009, 141, 251–276. [DOI] [PubMed] [Google Scholar]
- (188).Perrin BS; Pastor RW, Simulations of Membrane-Disrupting Peptides I: Alamethicin Pore Stability and Spontaneous Insertion. Biophys. J 2016, 111, 1248–1257. [DOI] [PMC free article] [PubMed] [Google Scholar]
- (189).Perrin BS; Fu RQ; Cotten ML; Pastor RW, Simulations of Membrane-Disrupting Peptides II: Amp Piscidin 1 Favors Surface Defects over Pores. Biophys. J 2016, 111, 1258–1266. [DOI] [PMC free article] [PubMed] [Google Scholar]
- (190).Wang YK; Chen CH; Hu D; Ulmschneider MB; Ulmschneider JP, Spontaneous Formation of Structurally Diverse Membrane Channel Architectures from a Single Antimicrobial Peptide. Nat. Commun 2016, 7. [DOI] [PMC free article] [PubMed] [Google Scholar]
- (191).Ulmschneider JP, Charged Antimicrobial Peptides Can Translocate across Membranes without Forming Channel-Like Pores. Biophys. J 2017, 113, 73–81. [DOI] [PMC free article] [PubMed] [Google Scholar]
- (192).Ulmschneider JP; Ulmschneider MB, Molecular Dynamics Simulations Are Redefining Our View of Peptides Interacting with Biological Membranes. Acc. Chem. Res 2018, 51, 1106–1116. [DOI] [PubMed] [Google Scholar]
- (193).Kubo R, The Fluctuation-Dissipation Theorem. Rep. Prog. Phys 1966, 29, 255. [Google Scholar]
- (194).Mamonov AB; Kurnikova MG; Coalson RD, Diffusion Constant of K+ inside Gramicidin A: A Comparative Study of Four Computational Methods. Biophys. Chem 2006, 124, 268–278. [DOI] [PMC free article] [PubMed] [Google Scholar]
- (195).Woolf TB; Roux B, Conformational Flexibility of O-Phosphorylcholine and O-Phosphorylethanolamine - a Molecular-Dynamics Study of Solvation Effects. J. Am. Chem. Soc 1994, 116, 5916–5926. [Google Scholar]
- (196).Woolf TB; Roux B, Molecular-Dynamics Simulation of the Gramicidin Channel in a Phospholipid-Bilayer. Proc. Natl. Acad. Sci. U. S. A 1994, 91, 11631–11635. [DOI] [PMC free article] [PubMed] [Google Scholar]
- (197).Schumaker MF; Pomes R; Roux B, A Combined Molecular Dynamics and Diffusion Model of Single Proton Conduction through Gramicidin. Biophys. J 2000, 79, 2840–2857. [DOI] [PMC free article] [PubMed] [Google Scholar]
- (198).Hummer G, Position-Dependent Diffusion Coefficients and Free Energies from Bayesian Analysis of Equilibrium and Replica Molecular Dynamics Simulations. New J. Phys 2005, 7. [Google Scholar]
- (199).Gaalswyk K; Awoonor-Williams E; Rowley CN, Generalized Langevin Methods for Calculating Transmembrane Diffusivity. J. Chem. Theory Comput 2016, 12, 5609–5619. [DOI] [PubMed] [Google Scholar]
- (200).Im W; Roux B, Ions and Counterions in a Biological Channel: A Molecular Dynamics Simulation of Ompf Porin from Escherichia Coli in an Explicit Membrane with 1M KCl Aqueous Salt Solution. J. Mol. Biol 2002, 319, 1177–1197. [DOI] [PubMed] [Google Scholar]
- (201).Rui HA; Lee KI; Pastor RW; Im W, Molecular Dynamics Studies of Ion Permeation in VDAC. Biophys. J 2011, 100, 602–610. [DOI] [PMC free article] [PubMed] [Google Scholar]
- (202).Carpenter TS; Kirshner DA; Lau EY; Wong SE; Nilmeier JP; Lightstone FC, A Method to Predict Blood-Brain Barrier Permeability of Drug-Like Compounds Using Molecular Dynamics Simulations. Biophys. J 2014, 107, 630–641. [DOI] [PMC free article] [PubMed] [Google Scholar]
- (203).Comer J; Chipot C; González-Nilo FD, Calculating Position-Dependent Diffusivity in Biased Molecular Dynamics Simulations. J. Chem. Theory Comput 2013, 9, 876–882. [DOI] [PubMed] [Google Scholar]
- (204).Riistama S; Puustinen A; GarciaHorsman A; Iwata S; Michel H; Wikstrom M, Channelling of Dioxygen into the Respiratory Enzyme. BBB-Bioenergetics 1996, 1275, 1–4. [DOI] [PubMed] [Google Scholar]
- (205).Wikstrom M; Sharma V; Kaila VRI; Hosler JP; Hummer G, New Perspectives on Proton Pumping in Cellular Respiration. Chem. Rev 2015, 115, 2196–2221. [DOI] [PubMed] [Google Scholar]
- (206).Brandt EG; Braun AR; Sachs JN; Nagle JF; Edholm O, Interpretation of Fluctuation Spectra in Lipid Bilayer Simulations. Biophys. J 2011, 100, 2104–2111. [DOI] [PMC free article] [PubMed] [Google Scholar]
- (207).Braun AR; Brandt EG; Edholm O; Nagle JF; Sachs JN, Determination of Electron Density Profiles and Area from Simulations of Undulating Membranes. Biophys. J 2011, 100, 2112–2120. [DOI] [PMC free article] [PubMed] [Google Scholar]
- (208).Garwood F, Fiducial Limits for the Poisson Distribution. Biometrika 1936, 28, 437–442. [Google Scholar]
- (209).Ramadurai S; Holt A; Krasnikov V; van den Bogaart G; Killian JA; Poolman B, Lateral Diffusion of Membrane Proteins. J. Am. Chem. Soc 2009, 131, 12650–12656. [DOI] [PubMed] [Google Scholar]
- (210).Saffman PG; Delbruck M, Brownian Motion in Biological Membranes. Proc. Natl. Acad. Sci. U. S. A 1975, 72, 3111–3113. [DOI] [PMC free article] [PubMed] [Google Scholar]
- (211).Camley BA; Lerner MG; Pastor RW; Brown FLH, Strong Influence of Periodic Boundary Conditions on Lateral Diffusion in Lipid Bilayer Membranes. J. Chem. Phys 2015, 143, 243113. [DOI] [PMC free article] [PubMed] [Google Scholar]
- (212).Venable RM; Ingólfsson HI; Lerner MG; Perrin J, Bradley Scott; Camley BA; Marrink SJ; Brown FLH; Pastor RW, Lipid and Peptide Diffusion in Bilayers: The Saffman-Delbrück Model and Periodic Boundary Conditions. J. Phys. Chem. B 2017, 121, 3343–3457. [DOI] [PMC free article] [PubMed] [Google Scholar]
- (213).Zgorski A; Lyman E, Toward Hydrodynamics with Solvent Free Lipid Models: STRD Martini. Biophys. J 2016, 111, 2689–2697. [DOI] [PMC free article] [PubMed] [Google Scholar]
- (214).Vogele M; Hummer G, Divergent Diffusion Coefficients in Simulations of Fluids and Lipid Membranes. J. Phys. Chem. B 2016, 120, 8722–8732. [DOI] [PubMed] [Google Scholar]
- (215).Vogele M; Kofinger J; Hummer G, Hydrodynamics of Diffusion in Lipid Membrane Simulations. Phys. Rev. Lett 2018, 120, 268104. [DOI] [PubMed] [Google Scholar]
- (216).Hansen N; Ostermeier A, Completely Derandomized Self-Adaptation in Evolution Strategies. Evol. Comput 2001, 9, 159–195. [DOI] [PubMed] [Google Scholar]
- (217).Wilcoxon F, Individual Comparisons by Ranking Methods Biometrics Bulletin 1945, 1, 80–83. [Google Scholar]
- (218).Blok MC; Vanderneutkok ECM; Vandeenen LLM; Degier J, Effect of Chain-Length and Lipid Phase-Transitions on Selective Permeability Properties of Liposomes. Biochim. Biophys. Acta 1975, 406, 187–196. [DOI] [PubMed] [Google Scholar]
- (219).Jansen M; Blume A, A Comparative Study of Diffusive and Osomotic Water Permeation across Bilayers Composed of Phospholipids and Different Head Groups and Fatty Acyl Chains Biophys. J 1995, 68, 997–1008. [DOI] [PMC free article] [PubMed] [Google Scholar]
- (220).Marrink SJ; Jahnig F; Berendsen HJC, Proton Transport across Transient Single-File Water Pores in a Lipid Membrane Studied by Molecular Dynamics Simulations. Biophys. J 1996, 71, 632–647. [DOI] [PMC free article] [PubMed] [Google Scholar]
- (221).Venable RM; Pastor RW, Molecular Dynamics Simulations of Water Wires in a Lipid Bilayer and Water/Octane Model Systems. J. Chem. Phys 2002, 116, 2663–2664. [Google Scholar]
- (222).Guler SD; Ghosh DD; Pan JJ; Mathai JC; Zeidel ML; Nagle JF; Tristram-Nagle S, Effects of Ether Vs. Ester Linkage on Lipid Bilayer Structure and Water Permeability. Chem. Phys. Lipids 2009, 160, 33–44. [DOI] [PMC free article] [PubMed] [Google Scholar]
- (223).Issack BB; Peslherbe GH, Effects of Cholesterol on the Thermodynamics and Kinetics of Passive Transport of Water through Lipid Membranes. J. Phys. Chem. B 2015, 119, 9391–9400. [DOI] [PubMed] [Google Scholar]
- (224).Widomska J; Raguz M; Subczynski WK, Oxygen Permeability of the Lipid Bilayer Membrane Made of Calf Lens Lipids. BBA-Biomembranes 2007, 1768, 2635–2645. [DOI] [PMC free article] [PubMed] [Google Scholar]
- (225).Möller MN; Lancaster JR; Denicola A, Chapter 2 the Interaction of Reactive Oxygen and Nitrogen Species with Membranes. In Curr. Top. Membr, Matalon S, Ed. Academic Press: 2008; Vol. 61, pp 23–42. [Google Scholar]
- (226).Subczynski WK; Hyde JS; Kusumi A, Oxygen Permeability of Phosphatidylcholine Cholesterol Membranes Proc. Natl. Acad. Sci. U. S. A 1989, 86, 4474–4478. [DOI] [PMC free article] [PubMed] [Google Scholar]
- (227).Dzikovski BG; Livshits VA; Marsh D, Oxygen Permeation Profile in Lipid Membranes: Comparison with Transmembrane Polarity Profile. Biophys. J 2003, 85, 1005–1012. [DOI] [PMC free article] [PubMed] [Google Scholar]
- (228).Dotson RJ; Smith CR; Bueche K; Angles G; Pias SC, Influence of Cholesterol on the Oxygen Permeability of Membranes: Insight from Atomistic Simulations. Biophys. J 2017, 112, 2336–2347. [DOI] [PMC free article] [PubMed] [Google Scholar]
- (229).Junmei W; M., W. R.; W., C. J.; A., K. P.; A., C. D., Development and Testing of a General Amber Force Field. J. Comput. Chem 2004, 25, 1157–1174. [DOI] [PubMed] [Google Scholar]
- (230).Angles G; Dotson R; Bueche K; Pias SC, Predicted Decrease in Membrane Oxygen Permeability with Addition of Cholesterol. In Oxygen Transport to Tissue Xxxix, Halpern HJ; LaManna JC; Harrison DK; Epel B, Eds. 2017; Vol. 977, pp 9–14. [DOI] [PMC free article] [PubMed] [Google Scholar]
- (231).Marrink SJ; Berendsen HJC, Permeation Process of Small Molecules across Lipid Membranes Studied by Molecular Dynamics Simulations. J. Phys. Chem 1996, 100, 16729–16738. [Google Scholar]
- (232).Fettiplace R; Haydon DA, Water Permeability of Lipid-Membranes Physiol. Rev 1980, 60, 510–550. [DOI] [PubMed] [Google Scholar]
- (233).Garrick RA; Ryan US; Bower V; Cua WO; Chinard FP, The Diffusional Transport of Water and Small Solutes in Isolated Endothelial Cells and Erythrocytes Biochim. Biophys. Acta 1993, 1148, 108–116. [DOI] [PubMed] [Google Scholar]
- (234).Krylov AV; Pohl P; Zeidel ML; Hill WG, Water Permeability of Asymmetric Planar Lipid Bilayers: Leaflets of Different Composition Offer Independent and Additive Resistances to Permeation. J. Gen. Physiol 2001, 118, 333–339. [DOI] [PMC free article] [PubMed] [Google Scholar]
- (235).Kučerka N; Katsaras J; Nagle JF, Comparing Membrane Simulations to Scattering Experiments: Introducing the SIMtoEXP Software. J. Membr. Biol 2010, 235, 43–50. [DOI] [PMC free article] [PubMed] [Google Scholar]
- (236).Bermudez-Salguero C; Gracia-Fadrique J, Gibbs Excess and the Calculation of the Absolute Surface Composition of Liquid Binary Mixtures. J. Phys. Chem. B 2015, 119, 5598–5608. [DOI] [PubMed] [Google Scholar]
- (237).Radke CJ, Gibbs Adsorption Equation for Planar Fluid-Fluid Interfaces: Invariant Formalism. Adv. Colloid Interface Sci 2015, 222, 600–614. [DOI] [PubMed] [Google Scholar]
- (238).Bemporad D; Essex JW; Luttmann C, Permeation of Small Molecules through a Lipid Bilayer: A Computer Simulation Study. J. Phys. Chem. B 2004, 108, 4875–4884. [Google Scholar]
- (239).Saito H; Shinoda W, Cholesterol Effect on Water Permeability through Dppc and Psm Lipid Bilayers: A Molecular Dynamics Study. J. Phys. Chem. B 2011, 115, 15241–15250. [DOI] [PubMed] [Google Scholar]
- (240).Shinoda W, Permeability across Lipid Membranes. BBA-Biomembranes 2016, 1858, 2254–2265. [DOI] [PubMed] [Google Scholar]
- (241).Di Meo F; Fabre G; Berka K; Ossman T; Chantemargue B; Paloncýová M; Marquet P; Otyepka M; Trouillas P, In Silico Pharmacology: Drug Membrane Partitioning and Crossing. Pharmacol. Res 2016, 111, 471–486. [DOI] [PubMed] [Google Scholar]
- (242).Neale C; Pomès R, Sampling Errors in Free Energy Simulations of Small Molecules in Lipid Bilayers. BBA-Biomembranes 2016, 1858, 2539–2548. [DOI] [PubMed] [Google Scholar]
- (243).Dama JF; Rotskoff G; Parrinello M; Voth GA, Transition-Tempered Metadynamics: Robust, Convergent Metadynamics via On-the-Fly Transition Barrier Estimation. J. Chem. Theory Comput 2014, 10, 3626–3633. [DOI] [PubMed] [Google Scholar]
- (244).Pokhrel N; Maibaum L, Free Energy Calculations of Membrane Permeation: Challenges Due to Strong Headgroup–Solute Interactions. J. Chem. Theory Comput 2018, 14, 1762–1771. [DOI] [PubMed] [Google Scholar]
- (245).Coimbra JTS; Fernandes PA; Ramos MJ, Revisiting Partition in Hydrated Bilayer Systems. J. Chem. Theory Comput 2017, 13, 2290–2299. [DOI] [PubMed] [Google Scholar]
- (246).Nitschke N; Atkovska K; Hub JS, Accelerating Potential of Mean Force Calculations for Lipid Membrane Permeation: System Size, Reaction Coordinate, Solute-Solute Distance, and Cutoffs. J. Chem. Phys 2016, 145. [DOI] [PubMed] [Google Scholar]
- (247).Yang LW; Kindt JT, Line Tension Assists Membrane Permeation at the Transition Temperature in Mixed-Phase Lipid Bilayers. J. Phys. Chem. B 2016, 120, 11740–11750. [DOI] [PubMed] [Google Scholar]
- (248).Cordeiro RM, Molecular Structure and Permeability at the Interface between Phase-Separated Membrane Domains. J. Phys. Chem. B 2018, 122, 6954–6965. [DOI] [PubMed] [Google Scholar]
- (249).Zhang H-Y; Xu Q; Wang Y-K; Zhao T-Z; Hu D; Wei D-Q, Passive Transmembrane Permeation Mechanisms of Monovalent Ions Explored by Molecular Dynamics Simulations. J. Chem. Theory Comput 2016, 12, 4959–4969. [DOI] [PubMed] [Google Scholar]
- (250).Papahadjopoulos D; Nir S; Ohki S, Permeability Properties of Phospholipid Membranes - Effect of Cholesterol and Temperature Biochim. Biophys. Acta 1972, 266, 561–583. [DOI] [PubMed] [Google Scholar]
- (251).Paula S; Volkov AG; VanHoek AN; Haines TH; Deamer DW, Permeation of Protons, Potassium Ions, and Small Polar Molecules through Phospholipid Bilayers as a Function of Membrane Thickness. Biophys. J 1996, 70, 339–348. [DOI] [PMC free article] [PubMed] [Google Scholar]
- (252).Paula S; Volkov AG; Deamer DW, Permeation of Halide Anions through Phospholipid Bilayers Occurs by the Solubility-Diffusion Mechanism. Biophys. J 1998, 74, 319–327. [DOI] [PMC free article] [PubMed] [Google Scholar]
- (253).De Vos O; Van Hecke T; Ghysels A, Effect of Chain Unsaturation and Temperature on Oxygen Diffusion through Lipid Membranes from Simulations. In Oxygen Transport to Tissue XL, Thews O; LaManna JC; Harrison DK, Eds. 2018; Vol. 1072, pp 399–404. [DOI] [PubMed] [Google Scholar]
- (254).Su J; Zhao Y; Fang C; Shi Y, Asymmetric Osmotic Water Permeation through a Vesicle Membrane. J. Chem. Phys 2017, 146, 204902. [DOI] [PMC free article] [PubMed] [Google Scholar]
- (255).Ghaemi Z; Alberga D; Carloni P; Laio A; Lattanzi G, Permeability Coefficients of Lipophilic Compounds Estimated by Computer Simulations. J. Chem. Theory Comput 2016, 12, 4093–4099. [DOI] [PubMed] [Google Scholar]
- (256).Wang LP; Martinez TJ; Pande VS, Building Force Fields: An Automatic, Systematic, and Reproducible Approach. J. Phys. Chem. Lett 2014, 5, 1885–1891. [DOI] [PMC free article] [PubMed] [Google Scholar]
- (257).Zhu Q; Lu Y; He X; Liu T; Chen H; Wang F; Zheng D; Dong H; Ma J, Entropy and Polarity Control the Partition and Transportation of Drug-Like Molecules in Biological Membrane. Sci. Rep 2017, 7, 17749. [DOI] [PMC free article] [PubMed] [Google Scholar]
- (258).Ma J; Domicevica L; Schnell JR; Biggin PC, Position and Orientational Preferences of Drug-Like Compounds in Lipid Membranes: A Computational and Nmr Approach. Phys. Chem. Chem. Phys 2015, 17, 19766–19776. [DOI] [PubMed] [Google Scholar]
- (259).Wood I; Pickholz M, Naratriptan Aggregation in Lipid Bilayers: Perspectives from Molecular Dynamics Simulations. J. Mol. Model 2016, 22, 221. [DOI] [PubMed] [Google Scholar]
- (260).Pande VS; Beauchamp K; Bowman GR, Everything You Wanted to Know About Markov State Models but Were Afraid to Ask. Methods 2010, 52, 99–105. [DOI] [PMC free article] [PubMed] [Google Scholar]
- (261).Menichetti R; Kanekal KH; Kremer K; Bereau T, In Silico Screening of Drug-Membrane Thermodynamics Reveals Linear Relations between Bulk Partitioning and the Potential of Mean Force. J. Chem. Phys 2017, 147, 125101. [DOI] [PubMed] [Google Scholar]
- (262).Loureiro DRP; Soares JX; Lopes D; Macedo T; Yordanova D; Jakobtorweihen S; Nunes C; Reis S; Pinto MMM; Afonso CMM, Accessing Lipophilicity of Drugs with Biomimetic Models: A Comparative Study Using Liposomes and Micelles. Eur. J. Pharm. Sci 2018, 115, 369–380. [DOI] [PubMed] [Google Scholar]
- (263).Klamt A; Huniar U; Spycher S; Keldenich J, Cosmomic: A Mechanistic Approach to the Calculation of Membrane−Water Partition Coefficients and Internal Distributions within Membranes and Micelles. J. Phys. Chem. B 2008, 112, 12148–12157. [DOI] [PubMed] [Google Scholar]
- (264).Rocco P; Cilurzo F; Minghetti P; Vistoli G; Pedretti A, Molecular Dynamics as a Tool for in Silico Screening of Skin Permeability. Eur. J. Pharm. Sci 2017, 106, 328–335. [DOI] [PubMed] [Google Scholar]
- (265).Fu H; Comer J; Cai W; Chipot C, Sonoporation at Small and Large Length Scales: Effect of Cavitation Bubble Collapse on Membranes. J. Phys. Chem. Lett 2015, 6, 413–418. [DOI] [PubMed] [Google Scholar]
- (266).Yusupov M; Van der Paal J; Neyts EC; Bogaerts A, Synergistic Effect of Electric Field and Lipid Oxidation on the Permeability of Cell Membranes. Biochim. Biophys. Acta 2017, 1861, 839–847. [DOI] [PubMed] [Google Scholar]
- (267).Gupta R; Rai B, Electroporation of Skin Stratum Corneum Lipid Bilayer and Molecular Mechanism of Drug Transport: A Molecular Dynamics Study. Langmuir 2018, 34, 5860–5870. [DOI] [PubMed] [Google Scholar]
- (268).Ghosh P; Han G; De M; Kim CK; Rotello VM, Gold Nanoparticles in Delivery Applications. Adv. Drug Delivery Rev 2008, 60, 1307–1315. [DOI] [PubMed] [Google Scholar]
- (269).Oroskar P; Jameson CJ; Murad S, Molecular Dynamics Simulations Reveal How Characteristics of Surface and Permeant Affect Permeation Events at the Surface of Soft Matter. Mol. Simul 2017, 43, 439–466. [Google Scholar]
- (270).Oroskar PA; Jameson CJ; Murad S, Surface-Functionalized Nanoparticle Permeation Triggers Lipid Displacement and Water and Ion Leakage. Langmuir 2015, 31, 1074–1085. [DOI] [PubMed] [Google Scholar]
- (271).Oroskar PA; Jameson CJ; Murad S, Simulated Permeation and Characterization of Pegylated Gold Nanoparticles in a Lipid Bilayer System. Langmuir 2016, 32, 7541–7555. [DOI] [PubMed] [Google Scholar]
- (272).Gupta R; Rai B, Penetration of Gold Nanoparticles through Human Skin: Unraveling Its Mechanisms at the Molecular Scale. J. Phys. Chem. B 2016, 120, 7133–7142. [DOI] [PubMed] [Google Scholar]
- (273).Gupta R; Rai B, Effect of Size and Surface Charge of Gold Nanoparticles on Their Skin Permeability: A Molecular Dynamics Study. Sci. Rep 2017, 7, 45292. [DOI] [PMC free article] [PubMed] [Google Scholar]
- (274).Gupta R; Kashyap N; Rai B, Transdermal Cellular Membrane Penetration of Proteins with Gold Nanoparticles: A Molecular Dynamics Study. Phys. Chem. Chem. Phys 2017, 19, 7537–7545. [DOI] [PubMed] [Google Scholar]
- (275).Teixeira RS; Cova TFGG; Silva SMC; Oliveira R; do Vale MLC; Marques EF; Pais AACC; Veiga FJB, Novel Serine-Based Gemini Surfactants as Chemical Permeation Enhancers of Local Anesthetics: A Comprehensive Study on Structure–Activity Relationships, Molecular Dynamics and Dermal Delivery. Eur. J. Pharm. Biopharm 2015, 93, 205–213. [DOI] [PubMed] [Google Scholar]
- (276).Werner M; Sommer J-U, Translocation and Induced Permeability of Random Amphiphilic Copolymers Interacting with Lipid Bilayer Membranes. Biomacromolecules 2015, 16, 125–135. [DOI] [PubMed] [Google Scholar]
- (277).Gupta R; Rai B, In-Silico Design of Nanoparticles for Transdermal Drug Delivery Application. Nanoscale 2018, 10, 4940–4951. [DOI] [PubMed] [Google Scholar]
- (278).Gupta R; Rai B, Molecular Dynamics Simulation Study of Translocation of Fullerene C60 through Skin Bilayer: Effect of Concentration on Barrier Properties. Nanoscale 2017, 9, 4114–4127. [DOI] [PubMed] [Google Scholar]
- (279).Ly HV; Longo ML, The Influence of Short-Chain Alcohols on Interfacial Tension, Mechanical Properties, Area/Molecule, and Permeability of Fluid Lipid Bilayers. Biophys. J 2004, 87, 1013–1033. [DOI] [PMC free article] [PubMed] [Google Scholar]
- (280).Lee BL; Kuczera K; Middaugh CR; Jas GS, Permeation of the Three Aromatic Dipeptides through Lipid Bilayers: Experimental and Computational Study. J. Chem. Phys 2016, 144, 245103. [DOI] [PubMed] [Google Scholar]
- (281).Manallack DT; Prankerd RJ; Nassta GC; Ursu O; Oprea TI; Chalmers DK, A Chemogenomic Analysis of Ionization Constants—Implications for Drug Discovery. ChemMedChem 2013, 8, 242–255. [DOI] [PMC free article] [PubMed] [Google Scholar]
- (282).Oruc T; Kucuk SE; Sezer D, Lipid Bilayer Permeation of Aliphatic Amine and Carboxylic Acid Drugs: Rates of Insertion, Translocation and Dissociation from MD Simulations. Phys. Chem. Chem. Phys 2016, 18, 24511–24525. [DOI] [PubMed] [Google Scholar]
- (283).Ribeiro RP; Coimbra JTS; Ramos MJ; Fernandes PA, Diffusion of the Small, Very Polar, Drug Piracetam through a Lipid Bilayer: An MD Simulation Study. Theor. Chem. Acc 2017, 136.
- (284).Chen L; Chen J; Zhou G; Wang Y; Xu C; Wang X, Molecular Dynamics Simulations of the Permeation of Bisphenol A and Pore Formation in a Lipid Membrane. Sci. Rep 2016, 6, 33399. [DOI] [PMC free article] [PubMed] [Google Scholar]
- (285).Kumari P; Kaur S; Sharma S; Kashyap HK, Impact of Amphiphilic Molecules on the Structure and Stability of Homogeneous Sphingomyelin Bilayer: Insights from Atomistic Simulations. J. Chem. Phys 2018, 148. [DOI] [PubMed] [Google Scholar]
- (286).Feigenson GW, Phase Boundaries and Biological Membranes. Annu. Rev. Biophys. Biomol. Struct 2007, 36, 63–77. [DOI] [PMC free article] [PubMed] [Google Scholar]
- (287).Sodt AJ; Pastor RW; Lyman E, Hexagonal Substructure and Hydrogen Bonding in Liquid-Ordered Phases Containing Palmitoyl Sphingomyelin. Biophys. J 2015, 109, 948–955. [DOI] [PMC free article] [PubMed] [Google Scholar]
- (288).Levental I; Grzybek M; Simons K, Raft Domains of Variable Properties and Compositions in Plasma Membrane Vesicles. Proceedings of the National Academy of Sciences 2011, 108, 11411–11416. [DOI] [PMC free article] [PubMed] [Google Scholar]
- (289).Bohling A; Bielfeldt S; Himmelmann A; Keskin M; Wilhelm KP, Comparison of the Stratum Corneum Thickness Measured in Vivo with Confocal Raman Spectroscopy and Confocal Reflectance Microscopy. Skin Research and Technology 2014, 20, 50–57. [DOI] [PubMed] [Google Scholar]
- (290).Menon GK; Cleary GW; Lane ME, The Structure and Function of the Stratum Corneum. Int. J. Pharm 2012, 435, 3–9. [DOI] [PubMed] [Google Scholar]
- (291).Mojumdar EH; Gooris GS; Groen D; Barlow DJ; Lawrence MJ; Demé B; Bouwstra JA, Stratum Corneum Lipid Matrix: Location of Acyl Ceramide and Cholesterol in the Unit Cell of the Long Periodicity Phase. BBA-Biomembranes 2016, 1858, 1926–1934. [DOI] [PubMed] [Google Scholar]
- (292).Venable RM; Brooks BR; Pastor RW, Molecular Dynamics Simulations of Gel (L-Beta I) Phase Lipid Bilayers in Constant Pressure and Constant Surface Area Ensembles. J. Chem. Phys 2000, 112, 4822–4832. [Google Scholar]
- (293).Paloncýová M; Vávrová K; Sovová Ž; DeVane R; Otyepka M; Berka K, Structural Changes in Ceramide Bilayers Rationalize Increased Permeation through Stratum Corneum Models with Shorter Acyl Tails. J. Phys. Chem. B 2015, 119, 9811–9819. [DOI] [PubMed] [Google Scholar]
- (294).Wan G; Dai X; Yin Q; Shi X; Qiao Y, Interaction of Menthol with Mixed-Lipid Bilayer of Stratum Corneum: A Coarse-Grained Simulation Study. J. Mol. Graphics Modell 2015, 60, 98–107. [DOI] [PubMed] [Google Scholar]
- (295).Wang H; Meng F, The Permeability Enhancing Mechanism of Menthol on Skin Lipids: A Molecular Dynamics Simulation Study. J. Mol. Model 2017, 23, 279. [DOI] [PubMed] [Google Scholar]
- (296).Dai X; Yin Q; Wan G; Wang R; Shi X; Qiao Y, Effects of Concentrations on the Transdermal Permeation Enhancing Mechanisms of Borneol: A Coarse-Grained Molecular Dynamics Simulation on Mixed-Bilayer Membranes. Int. J. Mol. Sci 2016, 17, 1349. [DOI] [PMC free article] [PubMed] [Google Scholar]
- (297).Wimley WC; Hristova K, Antimicrobial Peptides: Successes, Challenges and Unanswered Questions. J. Membr. Biol 2011, 239, 27–34. [DOI] [PMC free article] [PubMed] [Google Scholar]
- (298).Del Regno A; Notman R, Permeation Pathways through Lateral Domains in Model Membranes of Skin Lipids. Phys. Chem. Chem. Phys 2018, 20, 2162–2174. [DOI] [PubMed] [Google Scholar]
- (299).Gupta R; Sridhar DB; Rai B, Molecular Dynamics Simulation Study of Permeation of Molecules through Skin Lipid Bilayer. J. Phys. Chem. B 2016, 120, 8987–8996. [DOI] [PubMed] [Google Scholar]
- (300).Gupta R; Dwadasi BS; Rai B, Molecular Dynamics Simulation of Skin Lipids: Effect of Ceramide Chain Lengths on Bilayer Properties. J. Phys. Chem. B 2016, 120, 12536–12546. [DOI] [PubMed] [Google Scholar]
- (301).Gajula K; Gupta R; Sridhar DB; Rai B, In-Silico Skin Model: A Multiscale Simulation Study of Drug Transport. J. Chem. Inf. Model 2017, 57, 2027–2034. [DOI] [PubMed] [Google Scholar]
- (302).Van der Paal J; Verheyen C; Neyts EC; Bogaerts A, Hampering Effect of Cholesterol on the Permeation of Reactive Oxygen Species through Phospholipids Bilayer: Possible Explanation for Plasma Cancer Selectivity. Sci. Rep 2017, 7, 39526. [DOI] [PMC free article] [PubMed] [Google Scholar]
- (303).Plesnar E; Szczelina R; Subczynski WK; Pasenkiewicz-Gierula M, Is the Cholesterol Bilayer Domain a Barrier to Oxygen Transport into the Eye Lens? BBA-Biomembranes 2018, 1860, 434–441. [DOI] [PMC free article] [PubMed] [Google Scholar]
- (304).Dotson RJ; Pias SC, Reduced Oxygen Permeability Upon Protein Incorporation within Phospholipid Bilayers. In Oxygen Transport to Tissue XL, Thews O; LaManna JC; Harrison DK, Eds. 2018; Vol. 1072, pp 405–411. [DOI] [PMC free article] [PubMed] [Google Scholar]
- (305).Palaiokostas M; Ding W; Shahane G; Orsi M, Effects of Lipid Composition on Membrane Permeation. Soft Matter 2018, 14, 8496–8508. [DOI] [PubMed] [Google Scholar]
- (306).Gawrisch K; Parsegian VA; Hajduk DA; Tate MW; Gruner SM; Fuller NL; Rand RP, Energetics of a Hexagonal Lamellar Hexagonal-Phase Transition Sequence in Dioleoylphosphatidylethanolamine Membranes. Biochemistry 1992, 31, 2856–2864. [DOI] [PubMed] [Google Scholar]
- (307).Chen Z; Rand RP, The Influence of Cholesterol on Phospholipid Membrane Curvature and Bending Elasticity. Biophys. J 1997, 73, 267–276. [DOI] [PMC free article] [PubMed] [Google Scholar]
- (308).Zimmerberg J; Kozlov MM, How Proteins Produce Cellular Membrane Curvature. Nat. Rev. Mol. Cell Biol 2006, 7, 9–19. [DOI] [PubMed] [Google Scholar]
- (309).Sodt AJ; Beaven AH; Andersen OS; Im W; Pastor RW, Gramicidin a Channel Formation Induces Local Lipid Redistribution II: A 3D Continuum Elastic Model. Biophys. J 2017, 112, 1198–1213. [DOI] [PMC free article] [PubMed] [Google Scholar]
- (310).Sodt AJ; Venable RM; Lyman E; Pastor RW, Nonadditive Compositional Curvature Energetics of Lipid Bilayers. Phys. Rev. Lett 2016, 117. [DOI] [PMC free article] [PubMed] [Google Scholar]
- (311).DeMarco KR; Bekker S; Clancy CE; Noskov SY; Vorobyov I, Digging into Lipid Membrane Permeation for Cardiac Ion Channel Blocker D-Sotalol with All-Atom Simulations. Front. Pharmacol 2018, 9. [DOI] [PMC free article] [PubMed] [Google Scholar]
- (312).Nitsche JM; Kasting GB, A Universal Correlation Predicts Permeability Coefficients of Fluid- and Gel-Phase Phospholipid and Phospholipid-Cholesterol Bilayers for Arbitrary Solutes. J. Pharm. Sci 2016, 105, 1762–1771. [DOI] [PubMed] [Google Scholar]
- (313).Hartkamp R; Moore TC; Iacovella CR; Thompson MA; Bulsara PA; Moore DJ; McCabe C, Composition Dependence of Water Permeation across Multicomponent Gel-Phase Bilayers. J. Phys. Chem. B 2018, 122, 3113–3123. [DOI] [PMC free article] [PubMed] [Google Scholar]
- (314).Carpenter TS; Parkin J; Khalid S, The Free Energy of Small Solute Permeation through the Escherichia Coli Outer Membrane Has a Distinctly Asymmetric Profile. J. Phys. Chem. Lett 2016, 7, 3446–3451. [DOI] [PubMed] [Google Scholar]
- (315).Lim GS; Jaenicke S; Klahn M, How the Spontaneous Insertion of Amphiphilic Imidazolium-Based Cations Changes Biological Membranes: A Molecular Simulation Study. Phys. Chem. Chem. Phys 2015, 17, 29171–29183. [DOI] [PubMed] [Google Scholar]
- (316).Zhou J; Smith MD; Cooper SJ; Cheng X; Smith JC; Parks JM, Modeling of the Passive Permeation of Mercury and Methylmercury Complexes through a Bacterial Cytoplasmic Membrane. Environ. Sci. Technol 2017, 51, 10595–10604. [DOI] [PubMed] [Google Scholar]
- (317).Vermaas JV; Beckham GT; Crowley MF, Membrane Permeability of Fatty Acyl Compounds Studied Via Molecular Simulation. J. Phys. Chem. B 2017, 121, 11311–11324. [DOI] [PubMed] [Google Scholar]
- (318).Vermaas JV; Bentley GJ; Beckham GT; Crowley MF, Membrane Permeability of Terpenoids Explored with Molecular Simulation. J. Phys. Chem. B 2018, 122, 10349–10361. [DOI] [PubMed] [Google Scholar]
- (319).Bennion BJ; Be NA; McNerney MW; Lao V; Carlson EM; Valdez CA; Malfatti MA; Enright HA; Nguyen TH; Lightstone FC, et al. , Predicting a Drug’s Membrane Permeability: A Computational Model Validated with in Vitro Permeability Assay Data. J. Phys. Chem. B 2017, 121, 5228–5237. [DOI] [PubMed] [Google Scholar]
- (320).Su C-F; Merlitz H; Rabbel H; Sommer J-U, Nanoparticles of Various Degrees of Hydrophobicity Interacting with Lipid Membranes. J. Phys. Chem. Lett 2017, 8, 4069–4076. [DOI] [PubMed] [Google Scholar]