

ABSTRACT
Background: Spinal muscular atrophy type 1 (SMA1) is a devastating genetic disease for which gene-replacement therapy may bring substantial survival and quality of life benefits.
Objective: This study investigated the cost-effectiveness of onasemnogene abeparvovec (AVXS-101) gene-replacement therapy for SMA1.
Study design: A Markov model was used to estimate the incremental cost-effectiveness ratio (ICER), expressed as cost/quality-adjusted life year ($/QALY), of AVXS-101 versus nusinersen over a lifetime. Survival, healthcare costs and QALYs were estimated using natural history data for SMA patients who achieved motor milestones (sitting/walking). Health utility weights were obtained from the CHERISH trial.
Setting: USA; commercial payer perspective
Participants: SMA1 infants
Interventions: AVXS-101 was compared to nusinersen.
Main outcome measure: The primary outcome was the ICER.
Results: Expected survival (undiscounted) over a lifetime predicted by the model was 37.20 life years for AVXS-101 and 9.68 for nusinersen (discounted QALYs, 15.65 and 5.29, respectively). Using a potential AVXS-101 price range ($2.5-5.0M/treatment), the average lifetime cost/patient was $4.2–6.6M for AVXS-101 and $6.3M for nusinersen. The ICER range was (-$203,072) to $31,379 per QALY gained for AVXS-101 versus nusinersen, indicating that AVXS-101 was cost-effective with prices of ≤$5M.
Conclusion: Single-dose AVXS-101 was cost-effective compared to chronic nusinersen for SMA1 patients.
KEYWORDS: AVXS-101, cost-effectiveness, gene-replacement therapy, nusinersen, onasemnogene abeparvovec, spinal muscular atrophy type 1
Introduction
Spinal muscular atrophy (SMA) is an inherited neuromuscular disease with severity ranging from progressive infantile paralysis and premature death (SMA types 0 and 1 [SMA0 and SMA1, respectively]) to limited motor neuron loss and normal life expectancy (SMA type 4 [SMA4]) (Table 1) [1,2]. It is the second most common fatal autosomal recessive disorder after cystic fibrosis, with a prevalence of approximately 1–2 per 100,000 persons and incidence around 8 per 100,000 live births [2].
Table 1.
Clinical classification of spinal muscular atrophy.*.
| SMA type | Age of onset | Highest achieved motor function | Natural age of death |
|---|---|---|---|
| 0 | Prenatal/Fetal | None | <6 months |
| 1 | <6 months | Sit with support only | <2 years |
| 2 | 6–18 months | Sit independently | >2 years |
| 3 | >18 months | Stand and walk independently | Adulthood |
| 4 | Adult (2nd or 3rd decade) | Walk independently, adult onset of symptoms | Adult |
*Adapted Verhaart et al. [2]
Infants with SMA1 often have onset of clinical signs during the first few months (usually within 4 to 5 months) of life, and fail to reach basic developmental motor milestones, such as the ability to sit without assistance. These infants experience rapid, significant and progressive muscle deterioration, leading to the inability to breathe or swallow, and these complications are the major cause of morbidity and mortality in SMA [1,3,4]. Survival is extremely poor; the median age of death or permanent ventilation is 10.5 months, and 92% will expire or rely on permanent ventilation by the age of 20 months [5].
Most forms of SMA are caused by the loss or mutation of the primary survival motor neuron (SMN1) gene, resulting in SMN protein deficiency [1]. Variability in the severity of disease is highly correlated with the copy number of the secondary SMN gene (SMN2). Although SMN2 cannot completely compensate for the loss of the SMN1 gene, patients with milder forms of SMA generally have higher SMN2 copy numbers [6,7]. Patients with fewer than three copies of SMN2 most commonly present as SMA1 (also named Werdnig-Hoffmann disease), which accounts for around 60% of all SMA cases [8,9].
In the USA (U.S.), SMA therapies were strictly supportive/palliative and did not preserve motor neurons or improve weak musculature until 2016 when nusinersen was approved by the U.S. Food and Drug Administration (FDA). Nusinersen is a SMN2-directed antisense oligonucleotide (ASO) drug designed to increase the production of functional SMN protein from the SMN2 gene. Nusinersen is administered as an intrathecal injection, with patients receiving four loading doses within 64 days followed by maintenance doses every four months. In a phase III randomized, double-blind, sham-procedure controlled trial (ENDEAR, NCT02193074), 39% of the infants in the nusinersen group had either died or received permanent assisted ventilation at the cut-off date for the final analysis compared to 68% in the control group [10]. In the treated group, 8% could sit and 1% could stand, while no infants achieved these milestones in the control group. In addition to nusinersen treatment, the standard of care in the U.S. also includes non-disease modifying SMA supportive care focused on improving quality of life. Care is multi-disciplinary and includes specialists, services, and resources to aid with respiratory function, nutritional function (including support for patients unable to feed orally), and orthotic support to treat joint contractures or scoliosis [11,12].
Gene-replacement therapy is a promising alternative to chronic, lifelong treatment with nusinersen. Onasemnogene abeparvovec (AVXS-101), developed by AveXis, Inc., uses a non-replicating, self-complementary, adeno-associated virus serotype 9 (scAAV9) capsid to deliver a functional copy of a human SMN gene to the patient’s own cells to replace the missing or defective SMN1 gene [13]. SMA is considered a strong candidate for a successful gene therapy because it is caused by a defect in a single gene. The AAV9 vector technology has demonstrated sustained efficacy and favorable safety profile with up to 10 years of experience in clinical and preclinical models of a variety of neurological and hematological diseases [14]. Due to the mechanism of action, it can cross the blood-brain barrier, allowing for intravenous dosing and effective targeting of both central and systemic features. In addition, AVXS-101 uses self-complementary DNA technology, which enables the vector, delivered as double-stranded DNA, to rapidly form a functional episome, resulting in rapid onset of effect [13]. In a phase 1 dose escalation trial, 15 infants with SMA1 (two copies of SMN2) received a single intravenous infusion (START, CL-101, NCT02122952) [13]. At 24 months follow-up, 100% of patients were alive and free of permanent ventilation, and of the 12 patients in the therapeutic dose cohort, 11 (92%) could sit unassisted for >5 seconds, 2 (17%) could stand unassisted and 2 (17%) could walk unassisted [15]. Patients also demonstrated other clinical features, such as improved respiratory and bulbar function (including the ability to feed independently). These clinical findings indicate that respiratory status is preserved once gene transfer occurs [16]. Respiratory insufficiency related to thoracic muscle weakness and aspiration of food due to poor bulbar functioning are the primary cause of mortality in patients with SMA1, so these improvements are expected to correlate with improved survival. The long-term durability of AVXS-101 treatment effect was illustrated by the continued improvement or maintenance of highest acquired developmental motor milestones in patients receiving the therapeutic dose with 37 to 49.7 months of follow-up as of 31 December 2018. AVXS-101 requires one-time intravenous administration in an outpatient setting. The FDA has granted AVXS-101 Breakthrough Therapy Designation and Fast Track Designation for the treatment of SMA1 [17].
The objectives of this study were to evaluate the cost-effectiveness of AVXS-101 in patients with SMA1 in the U.S. and compare it with that of nusinersen, from a commercial payer perspective. Analysis of the cost-effectiveness over a lifetime suggest that single-dose AVXS-101 is cost-effective compared to chronic nusinersen for the treatment of SMA1 patients.
Materials and methods
Model framework
This study used a cost-utility analysis to compare the relative costs and effects of AVXS-101 (Zolgensma©, AveXis, Inc.) compared to nusinersen for the treatment of SMA1 from the perspective of a commercial insurer in the U.S. Table 2 shows all of the assumptions and justifications used to create the model. The model simulates the experience of infants with genetically confirmed SMA1 and two copies of SMN2, diagnosed before the age of six months, and treated with either the proposed therapeutic dose of AVXS-101 or nusinersen, in addition to SMA-related supportive care. The model uses a life-time time horizon to capture the full set of costs and consequences. The modelled cohort was followed from initiation of treatment until death. Outcomes modelled were average total life-time costs per patient, life-years (LY), and quality-adjusted life-years (QALYs) accrued over the duration of the model. The primary analysis uses a 3% discount rate for both costs and benefits.
Table 2.
Key assumptions used in the model.
| Assumption | Rationale |
|---|---|
| AVXS-101: Lifetime duration of effect |
|
| Nusinersen: duration of effect continues while patients continue treatment. The model base case assumes that patients in the US will not discontinue nusinersen treatment. |
|
| Survival: treated children who achieve motor milestones assumed to have improved survival beyond trial follow-up periods. |
|
| That motor milestone development can be predicted based on CHOP INTEND scores. |
|
| That motor milestone development can be predicted based on CHOP INTEND scores and responding children will continue to achieve milestones at same rate as during trial period. |
|
SMA1, spinal muscular atrophy type 1; HEOR KOLs, health economics and outcomes research key opinion leaders; CHOP INTEND, Children's Hospital of Philadelphia Infant Test of Neuromuscular Disorders.
The SMA1 model framework was conceptualized with clinical experts, drawing on frameworks developed for nusinersen and models for similar rare genetic disorders, such as Duchenne’s muscular dystrophy [18,19]. Because the patient experience could be captured in a reasonable number of health states, a Markov model was used. The model was developed using Excel 2016 software (Microsoft Corp., Redmond, WA, USA).
Prior to the development of disease-modifying therapies for SMA1, patients would never achieve motor milestones, such as sitting independently, and would experience progressive deterioration and mortality without permanent assisted ventilation. With the development of disease-modifying therapies, children with SMA now have the potential to attain motor milestones, such as sitting or walking, which correlate with improved functionality and survival. These milestones have also been observed to correlate with substantial improvements in quality of life [20,21]. The structure of the cost-effectiveness model is based on a set of trajectories between 5 functional health states and death (Figure 1).
Figure 1.
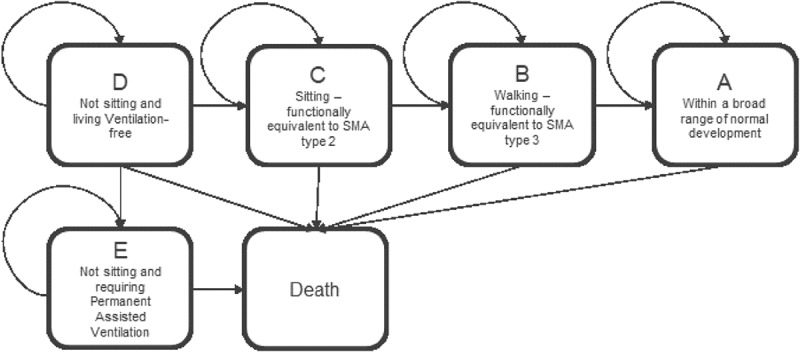
Model health states for SMA1. Five functional health states (A-E) and death are shown for SMA1.
Patients enter the model as infants in health state D (not sitting and living ventilation-free). Patients in the D state may transition to the permanent assisted ventilation state E, based on time-dependent probabilities derived from clinical trials (Figure 1). Patients who survive may exhibit improvement, and patients who achieve motor milestones, traditionally associated with less severe SMA disease (sitting [state C] and walking [state B]), transition into higher health states. The model has a cycle length of six months for the first three years, and then 12 months for all cycles thereafter.
Model inputs
The model uses both observed clinical data and long-term extrapolations using published methods. For the clinical trial phase, the model uses two recently published clinical trials: START/AVXS-101-CL-101 (AVXS-101) and ENDEAR (nusinersen). ENDEAR was selected because (1) the patient population was relatively similar to CL-101 (i.e., symptomatic SMA1 patients); (2) it was the most recently published study of nusinersen; (3) it had the most recently available results of a Phase 3 clinical trial; and (4) it had the most amount of overlapping outcomes with the CL-101 trial. In addition to these points, peer-reviewed published clinical evidence is only available from the ENDEAR trial for nusinersen [10] and the AVXS-101 CL-101 phase I trial [13,15]. Based on the eligibility criteria, the population of these trials include only symptomatic SMA1 patients with 2 copies of SMN2 [10,13,15]. Additionally, enrolled patients were required to have the onset of symptoms at age ≤ 6 months and are symptomatic at baseline [10,13,15]. Therefore, any meaningful comparative effectiveness and economic analyses can only be assessed in symptomatic SMA1 patients. Cost and effect outcomes were discounted at 3% annually in the base-case. The impacts of differential discounting were also evaluated.
In the AVXS-101-CL-101 trial, all patients survived and were event-free at 24 months of follow-up [15]. In the absence of a survival curve, a multi-state ‘cure’ model was developed [22,23]. Patients who achieve motor milestones enter higher health states with different survival curves (Table 3). Patients who achieve sitting were assumed to have survival that aligned with SMA2 patients who sit but never walk [24]. Patients who achieve walking were assumed to have survival that aligned with SMA3 patients with a normal life expectancy [24]. Survival for patients who do not achieve motor milestones was derived from the clinical trials and extrapolated beyond the trial period using a natural history curve [25].
Table 3.
Survival sources used to define SMA1 functional health states.
| Transition | AVXS-101 | Nusinersen |
|---|---|---|
| D to Death | Ages 0–30 months: AVXS-101-CL-101 [13,16] 30+ months: Projected overall survival using natural history curve [25] |
Ages 0–18 months: ENDEAR* [10] 18+ months: Projected overall survival using natural history curve [25] |
| D to E | Ages 0–30 months: AVXS-101-CL-101 [13,16] 30+ months: Projected ventilation-free survival using natural history curve [25] |
Ages 0–18 months: ENDEAR [10] 18+ months: Projected ventilation-free survival using natural history curve [25] |
| D to C C to B |
Ages 0–30 months: AVXS-101-CL-101 [13]; data on file 30+ months: Logarithmic curve fitted to AVXS-101-CL-101 CHOP INTEND mean scores and projected over 30 months to predict patients expected to achieve scores associated with sitting or walking |
Ages 0–18 months: ENDEAR [10] 18+ months: Logarithmic curve fitted to ENDEAR CHOP INTEND mean scores and projected over 42 months to predict patients expected to achieve scores associated with sitting or walking |
| E to death | Based on a retrospective chart review of tracheotomy and noninvasive ventilation [46] for 7 years Projected using parametric estimation. Survival limited to 22 years of age – maximum recorded life expectancy. |
|
| C to death | Parametric curve fitted to SMA2 longitudinal survival study [24] | |
| B to death A to death |
U.S. mortality tables | |
*Based on 13-month trial follow-up and mean age at first treatment of 181 days or 5.9 months.
For all survival data, parametric survival curves were fitted to the empirical data to extrapolate survival and calculate transition probabilities using published methods [26]. All reconstructions of individual patient data and fitting of parametric curves were conducted using the R software package ‘flexsurv’ procedure [27–29]. Parametric curves fitted to the survival data included exponential, log-normal, log-logistic, Weibull, generalized-gamma, and Gompertz curves. All curves were accelerated failure time curves. Survival curves are projected over a 100-year time horizon to ensure all potential benefits and costs were captured. To avoid long curve tails leading to clinically implausible results, curves were terminated based on limits informed by expert opinion of observed life expectancy.
The probability of transitioning to death during each model cycle was calculated from the survival function using the following formula from Briggs [30]:
Where S(t) means survival at time t, u means cycle length, and TP(tu) means the discrete transition probability between time points t-u and t.
Transition to higher health states
To calculate the probability that a patient will transition to a higher health state, we used the proportion of patients observed to attain the motor milestones of unassisted sitting and independent walking during the clinical trials at each cycle, out of a denominator of patients who were still alive and event-free at each cycle.
Because the ENDEAR trial was terminated early (due to clear efficacy benefits of nusinersen compared to the sham control), it was considered that some nusinersen patients may still be expected to reach motor milestones beyond the observed 13 month trial period. To project motor milestone achievement beyond the trial periods for both nusinersen and AVXS-101 arms, we used mean scores on the Children’s Hospital of Philadelphia Infant Test of Neuromuscular Disorders (CHOP INTEND) [31] scale of motor function (ranging from 0 to 64, with higher scores indicating better function) reported in both of the ENDEAR and AVXS-101-CL-101 clinical trials. Mean scores were projected into the future using fitted logarithmic curves, which reflected rapid initial increases before a flattening of mean scores.
To estimate the proportion of patients who were expected to achieve sitting or walking in each cycle, threshold scores for sitting and walking were required. However, as the CHOP INTEND was validated for a patient population that does not typically reach these milestones, there is no agreed score for ‘sitting’ or ‘walking’. Following a literature search that also yielded no validated thresholds, we calculated thresholds calibrated to each trial population. Each trial group was calibrated separately as there are no head-to-head studies comparing both treatments.
The sitting threshold for each trial population was calculated by using the last observed mean score and the proportion of patients who were observed to be sitting at that point in time. The required thresholds were estimated using the inverse cumulative density function (i.e., assuming a normal distribution around the mean). For 92% of AVXS-101 patients to be sitting independently at the last study visit, the required threshold would be a score of 45.5. Using these projected curves, the proportion of patients expected to have a score above a calculated ‘sitting threshold’ (but below the ‘walking threshold’) or above ‘walking threshold’ were calculated for each treatment group (Table 4).
Table 4.
Health State Distribution at Each Cycle.*
| Cycle | Age at end of cycle (mo.) | CL-101 (AVXS-101)† |
ENDEAR (Nusinersen) |
||||||||
|---|---|---|---|---|---|---|---|---|---|---|---|
| Not sitting | Sitting but not walking | Walking | Permanent ventilation | Dead | Not sitting | Sitting but not walking | Walking | Permanent ventilation | Dead | ||
| 1 | 6 | 100% | 0% | 0% | 0% | 0% | 98% | 0% | 0% | 0% | 2% |
| 2 | 12 | 100% | 0% | 0% | 0% | 0% | 69% | 0% | 0% | 14% | 17% |
| 3 | 18 | 75% | 25% | 0% | 0% | 0% | 48% | 8% | 0% | 26% | 18% |
| 4 | 24 | 50% | 42% | 8% | 0% | 0% | 36% | 9% | 0% | 27% | 28% |
| 5 | 30 | 17% | 67% | 17% | 0% | 0% | 16% | 9% | 0% | 31% | 43% |
| 6 | 36 | 6% | 73% | 17% | 1% | 3% | 10% | 10% | 0% | 32% | 49% |
| 7 | 48 | 2% | 73% | 17% | 2% | 8% | 5% | 10% | 0% | 32% | 53% |
| 8 | 60 | 1% | 72% | 17% | 2% | 9% | 0% | 10% | 0% | 30% | 60% |
*Milestones are assumed to occur at the end of the cycle and are accounted for in the next full cycle.
†Cohort 2 (n = 12) who received the proposed therapeutic dose of AVXS-101
Of the 12 AVXS-101 patients in the therapeutic dose group, 2 were walking and 9 were sitting by 24-month follow-up. While it is difficult to generalize these results to a larger treatment group, clinical experts advised that it would be likely that a higher proportion of patients would achieve walking, and that all treated patients should achieve sitting if treatment is administered as soon as possible after diagnosis. However, for the purposes of this model, we assumed that the 9 patients who had sat but not walked during the 24 month follow-up period were not likely to achieve walking in later cycles, so no additional walking patients were projected, and only a small fraction of additional non-sitting patients were projected to sit. In contrast, the ENDEAR trial follow-up period was much shorter (13 months), and patients exiting the trial were an average age of 18 months and might reasonably be expected to continue to gain motor function, so this was projected using the method described above.
Transition probabilities between health states were based on proportion of patients estimated to be walking or sitting. The probability of transitioning to a higher functional health state (D state to C state or C state to B state) was calculated using the number of patients who newly achieved motor milestones before the start of each cycle as the numerator and the number of patients in the outgoing state in the previous cycle as the denominator.
Measurement of health utility
Utility values used in the model were based on the CHERISH clinical trial of nusinersen in later-onset SMA (NCT02292537) mapped to the EQ-5D youth version using a published algorithm [21]. While this population is not identical, scores from clinical trials collected directly from patients or caregivers are generally preferred as the base case for analyses. Two other studies were identified by Thompson et al [21]. that have utility values for children with SMA: a European cross-sectional study [21] and a case vignette study assessing physician-rated quality of life (QoL) [20]. Across the three studies, utility weights varied considerably, and no study appeared to capture the burden of illness across all of the health states of interest. Utility scores from the CHERISH trial showed little differentiation between lower and higher motor function health states, while physicians in the case vignette study seemed to greatly devalue time spent in the lower health states, with negative values (‘life worse than death’) for health states consistent with SMA1 and 2 [21] (Table 5). In consideration of these sources, we have used CHERISH utilities for the base case values and used the other sources in a scenario analysis.
Table 5.
Utility scores used for SMA1 patients.
| Health state | CHERISH | Case vignette | European study (UK) |
|---|---|---|---|
| Method | PedsQL data collected in late onset (type 2) SMA trial mapped onto EQ-5D-Y using a published algorithm by Khan et al. [47] | Detailed case histories matching SMA health states assessed by 5 clinical experts using EQ-5D-Y by Lloyd et al. [20] | European burden of illness study: Cross-sectional study of individuals with SMA in select European countries collected parent-proxy-assessed QoL using EQ-5D by Thompson et al. [21] |
| E (permanent ventilation) | 0.730 | −0.33 | 0.19 |
| D (aligns with SMA1) | 0.756 | −0.12 | 0.19 |
| C (aligns with SMA2) | 0.764 | −0.04 | 0.10 |
| B (aligns with SMA3) | 0.878 | 0.71 | 0.54 |
| A (within a broad spectrum of normal development) | 0.878 | 0.72 | 0.54 |
Measurement of costs
Patients with SMA1 incur substantial resource use and medical costs, including medications, drug administration services, inpatient stays, outpatient visits for various services, physician visits, surgeries, and durable medical equipment. Direct medical costs were estimated using an analysis of medical and pharmacy claims for SMA patients enrolled in U.S. commercial health plans and classified into infantile onset, childhood onset and late-onset based on age at the first claim [32]. Mean monthly costs were reported for each patient group for inpatient hospitalization costs, outpatient services costs and emergency department costs. Because no long-term data exists for SMA-care related costs for treated SMA1 patients who are able to sit or walk, childhood onset data was used as a proxy for the sitting health state, and late-onset data was used for the walking health state.
Treatment costs used in the model are shown in Table 6. To estimate the cost of treatment with nusinersen and AVXS-101, we took into account differences in route of administration, frequency, and monitoring. Costs for intrathecal administration of nusinersen included intrathecal imaging guided placement where appropriate, anesthesia for young patients who cannot lie still and acute costs of treating anesthesia-related complications. The cost of nusinersen was based on a reimbursement guide published by the manufacturer [33]. Hospital charges were converted to estimated actual costs using a ratio of 1:3 derived from the Healthcare Cost and Utilization Project (HCUP) database for SMA-related costs. Because intrathecal administration is challenging and not always successful, a 5% re-administration factor was applied to account for occasions where repeated attempts of intrathecal administration were required; the rate was based on clinical expertise. It was also assumed that treatment with nusinersen would be continued for the lifespan of the patient. For AVXS-101 administration, costs included one-time intravenous infusion in an outpatient setting.
Table 6.
Treatment costs used in the model.
| Cost category | Value | Source |
|---|---|---|
| AVXS-101 costs | ||
| AVXS-101, intravenous infusion, 2.0 × 10¹⁴ vg per kg | Hypothetical price range: $3M-$6M per single dose | |
| Intravenous infusion (up to 1 hour) | $74.16 | CPT 96,365, CMS Physician Fee Schedule 2018 |
| Intravenous infusion (additional hours) | $22.32 | CPT 96,366, CMS Physician Fee Schedule 2018 |
| Anti-AAV9 diagnostic test | $15.89 | CPT 96,603 |
| Prednisolone | $25.00 | AnalySourceRx |
| Laboratory monitoring | $10.00 | CPT 80,069, CMS Physician fee schedule, 2018 |
| Nusinersen costs | ||
| Nusinersen, injection for intrathecal use, 12 mg (5 mL) per administration Hospital Mark-up |
$125,000 per dose 60% per dose |
J2326 AnalySourceRx Expert advice |
| Physician/Specialist visit | $52.20 | CPT 99,213, CMS Physician Fee Schedule 2018 |
| Intrathecal injection (lumbar puncture administration into central nervous system) | $82.44 | CPT 96,450, CMS Physician Fee Schedule 2018 |
| Intrathecal injection (drain cerebrospinal fluid) | $86.76 | CPT 62,272, CMS Physician Fee Schedule 2018 |
| Anesthesia | $133.13 per administration where anesthesia is required | HCPCS 00635 |
| Imaging (ultrasound or fluoroscopy) | $78.66 per administration where imaging is required | CPT 77,003, 76,942, CMS Physician Fee Schedule 2018 |
| Treatment observation (outpatient) | $135.72 | CPT 99,224, CMS Physician Fee Schedule 2018 |
| Inpatient setting: per diem | $3,948 (charges) | https://www.nationwidechildrens.org/price-information-list |
| Inpatient setting: anesthesia | $1,750 (charges) | https://www.nationwidechildrens.org/price-information-list |
| Monitor for thrombocytopenia (coagulation lab testing) | $5.53 | 85,049, CMS laboratory fee schedule, 2018 |
| Monitor for renal toxicity (quant. urine protein testing) | $10.72 | 80,069, CMS laboratory fee schedule, 2018 |
CPT, current procedural terminology; CMS, Centers for Medicare & Medicaid Services; AAV9, adeno-associated virus 9; HCPCS, healthcare common procedure coding system
Purchase and maintenance of durable medical equipment was based on a micro-costing with clinical expert opinion, and unit costs were based on an online search of medical equipment suppliers. Insurer contributions were calculated based on a hypothetical policy with a deductible of $1,000 and an insurer share after deductible of 90%. A full list of annualized costs by health state and category used in the model is shown in Table 7.
Table 7.
Annualized costs by health state and category used in the model.
| Cost category | Source | Annualized cost by health state |
||||
|---|---|---|---|---|---|---|
| E state* | D state* | C state† | B state‡ | A state§ | ||
| Direct medical costs | Total (Shieh et al. [32]) | $306,917 | $306,917 | $76,997 | $30,952 | $8,904 |
| Inpatient hospitalization | Shieh, et al. [32] | $262,356 | $262,356 | $40,812 | $13,392 | $2,220 |
| Outpatient services | Shieh, et al. [32] | $40,092 | $40,092 | $31,572 | $11,808 | $4,176 |
| Emergency | Shieh, et al. [32] | $3,756 | $3,756 | $3,900 | $4,788 | $2,508 |
| Other Rx | Shieh, et al. [32] | $713 | $713 | $713 | $964 | |
| Durable medical equipment (insurer-reimbursed amounts only) | Resource use: Expert opinion Unit costs: online stockists |
$8,221 | $6,985 | $2,336 | $25 | |
| Nusinersen product cost | AnalysourceRx | $750,000 for the first year $375,000 for subsequent years |
||||
| Nusinersen administration cost (includes anesthesia, imaging and hospital admission for a proportion of patients) | Micro-costed. Frequency/utilization based on expert opinion | 0–4 years: $6,402 5–10 years: $6,378 11+ years: $4,892 |
0–4 years: $5,644 5–10 years: $4,425 11+ years: $4,111 |
0–4 years: $5,100 5–10 years: $4,425 11+ years: $4,111 |
0–4 years: $5,100 5–10 years: $4,425 11+ years: $1,585 |
0–4 years: $5,087 5–10 years: $4,405 11+ years: $746 |
| Hospital mark-up component (annual) | Based on expert clinical opinion | +60% of drug price per dose for any patient treated in the hospital in-patient setting | ||||
| Hospital stay for anesthesia-related complications | Graham et al. [48] | For patients aged 0–4 years receiving anesthesia only 4% of anesthesia administrations expected to require hospitalization [48] Expected number of days in hospital: 3 days Expected cost per stay: $10,000 (based on the cost of a 15-day stay of $50,000 [49] |
||||
*Using infantile-onset as a proxy. †Using childhood onset as a proxy (SMA2). ‡Using late-onset as a proxy (SMA3). §Using healthy children as a proxy.
Model validation
Face validation of the appropriateness of the conceptual model (modeling technique, structure, health states, model input data, and model outcomes) was judged by clinical experts. The validity of the computerized models was assessed through derivation of Markov traces and by comparing modelled mortality and disease progression probabilities with the populated data. Extreme value and unit testing comprised setting model transition probabilities to 0 and 1, respectively and turning off specific costs and utility components as well as mortality. Sensitivity analyses were conducted using both deterministic and probabilistic methods.
Results
The path of patients through the health states in the model is shown in Figure 2.
Figure 2.
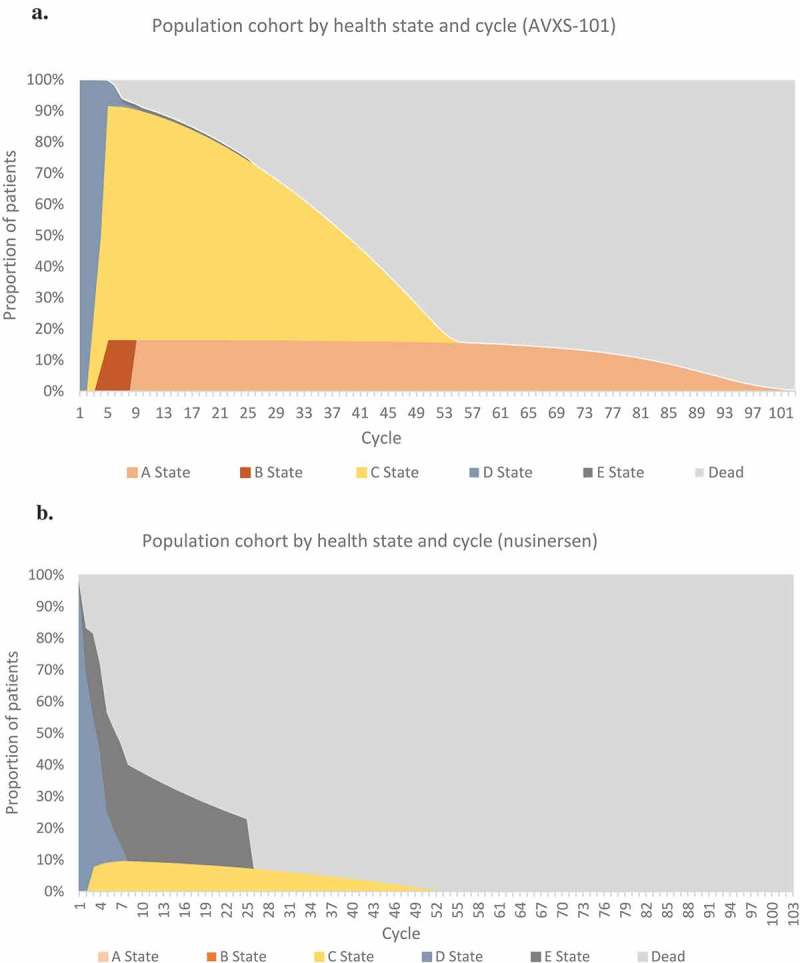
Patient movement over time through health states. Proportion of patients treated with (A) AVXS-101 or (B) nusinersen over time is shown by health states and cycle.
The base case results are presented in Table 8. In the AVXS-101 arm, starting the simulation at birth, 50% of patients survived until age 35 years, and the number of undiscounted life years was calculated to be 37.20 years. In the nusinersen arm, 50% of patients survived until age 3 years, and the estimated number of undiscounted life years was 9.68 years. AVXS-101 had higher QALYs than nusinersen (15.65 compared to 5.29, respectively; Table 8).
Table 8.
Base cost-effectiveness analysis of AVXS-101 compared to nusinersen treatment.
| Cost-effectiveness results | AVXS-101 |
Nusinersen | |||
|---|---|---|---|---|---|
| $2.5M | $3M | $4M | $5M | ||
| Treatment cost | $2,427,328 | $2,912,764 | $3,883,638 | $4,854,512 | $4,478,699 |
| SMA medical costs | $1,705,259 | $1,766,367 | |||
| DME costs | $81,793 | $71,646 | |||
| Total average cost per patient | $4,214,379 | $4,699,816 | $5,670,690 | $6,641,564 | $6,316,711 |
| Patient life years (undiscounted) | 37.20 | 9.68 | |||
| Patient life years (discounted) | 19.81 | 7.11 | |||
| Patient QALYs (discounted | 15.65 | 5.29 | |||
| ICER (Diff C/Diff E) against nusinersen ($/QALY) |
-$203,072 | -$156,182 | -$62,402 | $31,379 93.7% below $500K/QALY |
- |
| Dominant | |||||
SMA, spinal muscular atrophy; DME, durable medical equipment; QALYs, quality adjusted life years; ICER, incremental cost-effectiveness ratio
The estimated mean lifetime cost per patient ranged from $4.2M to $6.6M for AVXS-101 (based on hypothetical costs ranging from $2.5M to $5M) and $6.3M for nusinersen (Table 8). These costs were primarily driven by therapy treatment costs (proportion of total costs ranging from 57% to 73% for AVXS-101 and 70.9% for nusinersen). When the price of AVXS-101 was set to $4M or less, AVXS-101 was less costly and more effective compared to nusinersen as shown by the negative incremental cost-effectiveness ratio (ICER) values comparing AVXS-101 to nusinersen (Table 8). At a price of $5M for AVXS-101, the ICER for AVXS-101 compared to nusinersen was $31,379 per QALY (i.e., the total cost of AVXS-101 was greater and effectiveness higher than nusinersen). Using the price range from $2.5M to $5M, AVXS-101 was cost-effective when the willingness to pay threshold is $150,000 or $500,000 per QALY, regardless of the AVXS-101 cost. A recent study by Garrison and colleagues [34] supports the use of $500,000 per QALY for ultra-rare disorders that would include SMA1.
Model validation
Markov traces for each arm showed that the simulated cohorts transitioned across model health states in agreement with the input data. Specifically, the modelled nusinersen population predicts 44% of patients transition to death or permanent ventilation, which aligns with the reported 39% when patient censoring is taken into account.
Results from the deterministic sensitivity analyses where key model parameters were altered one-way by ±20% showed that the ICER was most sensitive to the cost of each treatment, the CHOP INTEND threshold used to project new sitters for nusinersen, the limit on survival in the permanent ventilation state and the cost of administering nusinersen in the hospital, including the hospital mark-up (Figure 3). Results from the probabilistic sensitivity analysis did not find the results to change dramatically because the model is heavily influenced by the high treatment costs (Figure 4).
Figure 3.
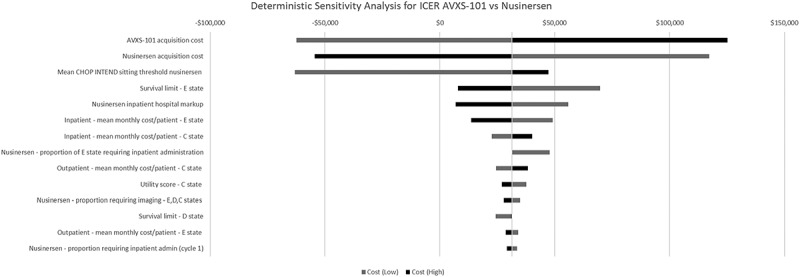
Tornado diagram showing deterministic sensitivity analysis for the top 14 parameters for incremental cost-effectiveness ratio (ICER) of AVXS-101 vs nusinersen. * Parameters with >2% variation are not presented.
Figure 4.
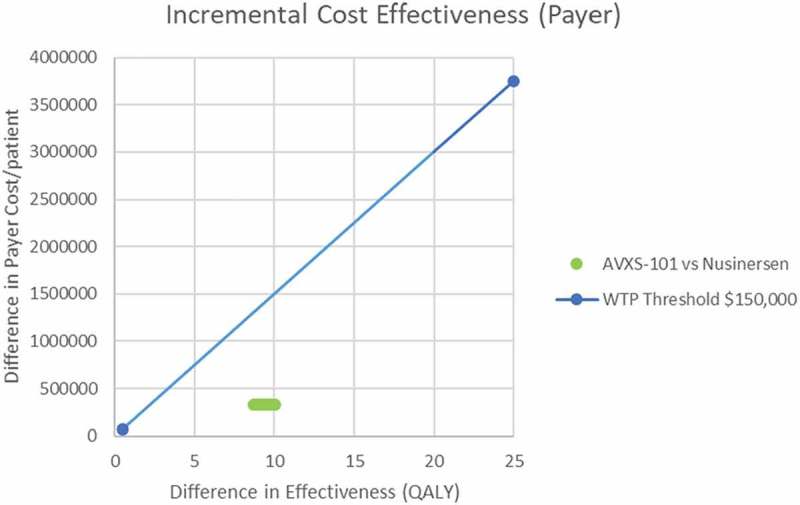
Probabilistic sensitivity analysis for model parameters relating to cost and utilities using 1,000 simulation runs.
Scenario analyses
We considered alternative utility data sources and whether these affect the model results. When the price for AVXS-101 is $5M, the ICER was $31,379 for the base case (CHERISH; Table 8), $80,917 using Lloyd utilities, and $107,178 using the European Study utilities, with the QALY gained by AVXS-101 over nusinersen being 10.35, 4.01 and 3.03 for CHERISH, Lloyd and European Study utilities, respectively. This suggests that utility weights have a substantial impact on the QALYs gained, but minimal impact on the ICER because of the high costs of each therapy.
Given that a key driver of the ICER was the cost of hospital administration of nusinersen, we also looked at a scenario where all nusinersen patients received treatment as outpatients. At an indicative price of $5M for AVXS-101, the ICER for this scenario was $156,169 (compared to $31,379 base case shown in Table 8).
The base case of this model assumes a permanent effect of AVXS-101 for SMA1 patients who receive the modified gene as infants; however, long-term follow-up is required to demonstrate this effect. To investigate the impact of uncertainty around the duration of effect, we ran scenarios where patients treated with AVXS-101 experienced a treatment waning and subsequent loss of milestones at 10 and 25 years (Table 9). This has a substantial impact on the survival outcomes (discounted QALYs of 7.80 and 12.95, respectively) and a corresponding reduction in lifetime medical costs. At a price of $5M for AVXS-101, the estimated lifetime payer cost would be $6.2M assuming a 10-year duration of effect and $6.6M assuming a 25-year duration of effect. Given that the estimated cost of lifetime nusinersen treatment is $6.3M, AVXS-101 dominates nusinersen assuming a 10-year duration of effect and generates an ICER of $30,926 assuming a 25-year duration of effect (Table 9).
Table 9.
Impact of limited duration of effect of AVXS-101, assuming a price of $5M for AVXS-101.
| Patient Life Years (discounted) | QALYs (discounted) | Payer Cost | ICER: AVXS-101 vs Nusinersen | |
|---|---|---|---|---|
| Base case | 19.81 | 15.65 | $6.64M | $31,379 |
| 10-year duration of effect | 10.03 | 7.80 | $6.21M | AVXS-101 dominant |
| 25 year duration of effect | 16.56 | 12.95 | $6.55M | $30,926 |
Clinical experts considered that using SMA2 patients as a proxy measure for sitting SMA1 patients may underestimate the survival benefit of infants who receive gene-replacement therapy. We ran a scenario where we assumed that treated patients who sit have normal mortality trajectory, to explore the expected upper limit of survival for these patients. In this scenario, the ICER increased to $57,261 as sitting patients incurred costs of care for longer durations, while the total QALY gain by AVXS-101 over nusinersen increased to 16.19 (Table 10).
Table 10.
Impact of improved survival scenario and differential discounting of benefits, assuming a price of $5M for AVXS-101.
| Discount applied to benefits | 0% discount applied to benefits | 1.5% discount applied to benefits | 3% discount applied to benefits | |||||||
|---|---|---|---|---|---|---|---|---|---|---|
| Scenario | Treatment | Life years | QALYs | ICER* | Life years | QALYs | ICER* | Life years | QALYs | ICER* |
| Base case | AVXS-101 | 37.20 | 29.86 | $14,347 | 26.18 | 20.81 | $22,111 | 19.81 | 15.65 | $31,379 |
| Nusinersen | 9.68 | 7.21 | 8.21 | 6.11 | 7.11 | 5.29 | ||||
| Optimistic survival scenario (gene therapy) | AVXS-101 | 71.87 | 56.35 | $18,864 | 41.73 | 32.69 | $34,873 | 27.45 | 21.48 | $57,261 |
| Nusinersen | 9.68 | 7.21 | 8.21 | 6.11 | 7.11 | 5.29 | ||||
*Assuming costs are discounted at a constant 3% rate.
QALYs, quality adjusted life years; ICER, incremental cost-effectiveness ratio
To explore the impact that the timing of benefits has on the results, we ran the model using different levels of discount rates on base case and scenario survival outcomes (from 0% to 3%) while using a constant 3% discount rate for costs (Table 10). Although 3% represents the standard rate used in U.S. analyses by the Institute for Clinical and Economic Review, there are ethical arguments that human life gains should not be assumed to lose value in the future in the same way that costs do [35]. This is particularly relevant for AVXS-101 in SMA, where survival gains for the highest functioning health states are expected for decades after treatment. When the discount rate for benefits is set to zero, the QALYs result for AVXS-101 is 29.86 and for nusinersen is 7.21. In the optimistic scenario, the undiscounted quality-adjusted survival may be as high as 56.35 years. The cost per QALY gain for AVXS-101 vs nusinersen is $14,347 (base case) and $18,864 (optimistic scenario) when benefits are undiscounted.
Discussion
For infants diagnosed with the most severe phenotype, SMA1, this model indicates that AVXS-101 can deliver substantial survival benefit with expected lifetime costs that are less or similar to chronic nusinersen treatment, making it a cost-effective treatment for SMA1. In the case of AVXS-101, cost offsets include reducing the supportive care costs of severe disease as well as the ongoing savings from replacing nusinersen treatment. That said, it is not unexpected that highly technical one-time treatments for rare and devastating conditions will be expensive, leading to affordability challenges [36,37].
Treating infants with AVXS-101 may result in quality-adjusted survival of up to 56.35 QALYs in the most optimistic scenario. In this analysis, we examined the impact of different discount rates for benefits. The impact of using a 3% discount rate (standard in the U.S. for costs and benefits) would be to reduce the reported benefit to 21.48 QALYs. Researchers have noted that adhering transitional approaches that discount costs and benefits equally are potentially undervaluing the long-term benefits of treatments and, when combined with traditional cost-effectiveness thresholds, having the impact of limiting access to equitable healthcare for patients [35,38]. We consider that AVXS-101 gene therapy is an example of where decision makers should take into account undiscounted life year and QALY gain to reflect the long-term benefit to patients and their families.
This model examines the costs and benefits from a commercial payer perspective; however, we acknowledge the societal benefits of a treatment that reduces disability and allows patients who would have prematurely died during childhood to survive until adulthood. Additional studies should also consider the impact on caregivers and families of patients given that caregiver burden without treatment is significant as demonstrated by reduced quality of life compared to the general population [39].
Due to the clinical action of both interventions, treatment benefits are time-sensitive. Patients in these clinical trials (CL-101 and ENDEAR) commenced treatment after diagnosis but before substantial functional decline. Additional research has examined the impact of nusinersen in a presymptomatic population, where preliminary results show 100% of patients achieved independent sitting and 88% of patients achieved walking either with assistance or independently [40]. Although coverage of newborn screening programs is currently limited in the U.S., with the availability of treatments, we expect that newborn screening will become more common. There are ongoing trials for both treatments to evaluate efficacy in patients who are treated when SMA is genetically confirmed but before clinical deterioration is observed (AVXS-101, NCT03505099 and nusinersen, NCT02386553).
The primary limitation of this model is the preliminary nature of the AVXS-101 data. The small sample size, 24-month follow-up period, and lack of control group are typical of trials in populations with rare pediatric diseases. The model relies heavily on extrapolations of survival and sustained benefits of both AVXS-101 and nusinersen. Rare adverse events are unlikely to have been captured and should be the focus of post-market surveillance monitoring. This model also assumes that the populations of each clinical trial are comparable.
Although there are some differences in trial designs between the ENDEAR (sham-controlled) and CL-101 (single-arm, open-label) clinical trials, the patient population of these two clinical trials were relatively similar. There were also some differences in baseline characteristics of ENDEAR and CL-101 patient populations; however, the CHOP-INTEND scores at baseline were mostly comparable (26.63 ± 8.13 vs 28, range 12–50 for the ENDEAR and CL-101 studies, respectively). Given the close comparability of baseline function (CHOP INTEND scores, ventilator and mechanical nutrition support) between the ENDEAR and the CL-101 cohorts, it could thus be argued that while older at treatment initiation (5.4, range, 1.7–8.0 and 3.4, range, 0.9–7.9 months, respectively), the ENDEAR cohort patients may have an overall less rapidly degenerative underlying course of disease.
Although CS3A (EMBRACE) data were not incorporated in the present study, data published in the FDA Medical Review [41] is comparable with the ENDEAR study in terms of motor milestone achievements. This aligns with the natural history study published by De Sanctis et al. [4] in which SMA1 patients universally fail to achieve major motor milestones; therefore, the endpoints are hard, formal endpoints not susceptible to bias.
Another limitation of this model is that it is only generalizable to the subgroup of SMA1 patients with two copies of the SMN2 gene, due to the restricted nature of the clinical trials. However, these patients make up ~80% of all patients with SMA1 [42,43]. SMA1 patients with three copies of SMN2 may have less severe disease although they still experience significant morbidity and mortality, and patients with only one copy of SMN2 are likely to have experienced irreversible motor neuron death before birth [42]. Also, this model does not consider the impact of AVXS-101 gene-replacement therapy on patients with the less severe but still devastating SMA2 and 3. The potential benefit for these patients is still under clinical trial investigation. Once these data are available, a similar analysis should examine the impact of AVXS-101 in these populations.
One other limitation of the present study is that the CHOP INTEND scale has not been validated for projecting motor milestones. We explored the impacts of these projections in a scenario where patients remained in the health states they entered during the trial, with no extrapolation. The ICER for this scenario was $46,947 (compared to $31,379 base case at a price of $5M for AVXS-101).
The availability of natural history data capturing permanent ventilation for the modelled patient population, used to extrapolate overall and ventilation-free survival for patients in both arms who do not sit independently (D state) was another limitation of the present study. The selected data source, from the recent NeuroNext natural history study, is the only study that has presented both overall survival and ventilation-free survival results stratified by copy number. However, this study only recorded time to intubation and not time to non-invasive ventilation [25]. Other alternative data sources identified were based on the Pediatric Network of Clinical Research (PNCR) for SMA natural history studies; one published study included permanent non-invasive ventilation while the other did not detail whether ventilation use was permanent. Neither PNCR study reported results stratified by copy number. We ran a scenario analysis using the PNCR data to extrapolate D state survival and found that the ICER marginally improved for AVXS-101 compared to nusinersen.
This model allows health payers in the U.S. to consider the long-term value of AVXS-101 therapy. Gene therapies with high price tags bring challenges for payers in allocating resources; however, in this case, the severity of the disease and the possible benefits to the patients make this treatment highly advantageous. While U.S. insurers have traditionally been more concerned with short-term budget impact, partially motivated by member turn-over and high cost of one-time therapies, recent research has shown that families with a rare disease dependent stay with the plan longer [44]. Further, innovative portability mechanisms [45] may help alleviate the member turn-over issue for insurers. While the model does not consider risk-sharing schemes and multi-period payments for one-time therapies, if implemented, can further improve both the cost-effectiveness and budget impact of gene therapies.
In summary, AVXS-101 is a potential lifeline for newborns and infants who might otherwise lead short and disease-burdened lives. It is the first gene-replacement therapy with the potential to restore normal motor and respiratory function and represents a step-change in the management of SMA1.
Funding Statement
This work was supported by AveXis, Inc., a Novartis company.
Acknowledgments
The authors would like to thank Dr. Michael Drummond of University of York, Dr. Peter Neumann of Tufts University School of Medicine and Dr. Sean Sullivan of University of Washington for their review of the model framework, data inputs, and the manuscript.
Disclosure statement
Ramesh Arjunji, Douglas M. Sproule, Douglas E. Feltner, and Omar Dabbous are employees of Avexis, Inc., a Novartis company, and may own AveXis/Novartis stock or other equities. Benit Maru is an employee of SSI Strategy, who are contracted to support AveXis, Inc. Rebecca Dean, Ivar Jensen, Phil Cyr, and Beckley Miller are employees of Precision Xtract, which has received consultancy fees from AveXis, Inc.
References
- [1].Farrar MA, Park SB, Vucic S, et al. Emerging therapies and challenges in spinal muscular atrophy. Ann Neurol. 2017;81(3):355–14. Epub 2017/02/17 PubMed PMID: 28026041; PubMed Central PMCID: PMCPMC5396275. [DOI] [PMC free article] [PubMed] [Google Scholar]
- [2].Verhaart IEC, Robertson A, Wilson IJ, et al. Prevalence, incidence and carrier frequency of 5q-linked spinal muscular atrophy - a literature review. Orphanet J Rare Dis. 2017;12(1):124 Epub 2017/07/06 PubMed PMID: 28676062; PubMed Central PMCID: PMCPMC5496354. [DOI] [PMC free article] [PubMed] [Google Scholar]
- [3].De Sanctis R, Pane M, Coratti G, et al. Clinical phenotypes and trajectories of disease progression in type 1 spinal muscular atrophy. Neuromuscul Disord. 2018;28(1):24–28. Epub 2017/ 10/10 PubMed PMID: 29174525. [DOI] [PubMed] [Google Scholar]
- [4].De Sanctis R, Coratti G, Pasternak A, et al. Developmental milestones in type I spinal muscular atrophy. Neuromuscul Disord. 2016;26(11):754–759. Epub 2016/10/05 PubMed PMID: 27769560; PubMed Central PMCID: PMCPMC5091285. [DOI] [PMC free article] [PubMed] [Google Scholar]
- [5].Finkel RS, McDermott MP, Kaufmann P, et al. Observational study of spinal muscular atrophy type I and implications for clinical trials. Neurology. 2014;83(9):810–817. Epub 2014/07/30 PubMed PMID: 25080519; PubMed Central PMCID: PMCPMC4155049. [DOI] [PMC free article] [PubMed] [Google Scholar]
- [6].Lefebvre S, Bürglen L, Frézal J, et al. The role of the SMN gene in proximal spinal muscular atrophy. Hum Mol Genet. 1998;7(10): 1531–1536. PubMed PMID: 9735373. [DOI] [PubMed] [Google Scholar]
- [7].Arnold WD, Kassar D, Kissel JT.. Spinal muscular atrophy: diagnosis and management in a new therapeutic era. Muscle Nerve. 2015;51(2):157–167. Epub 2014/ 12/16 PubMed PMID: 25346245; PubMed Central PMCID: PMCPMC4293319. [DOI] [PMC free article] [PubMed] [Google Scholar]
- [8].Lally C, Jones C, Farwell W, et al. Indirect estimation of the prevalence of spinal muscular atrophy Type I, II, and III in the USA. Orphanet J Rare Dis. 2017;12(1):175 Epub 2017/11/28. doi: . PubMed PMID: 29183396; PubMed Central PMCID: PMCPMC5704427. [DOI] [PMC free article] [PubMed] [Google Scholar]
- [9].Ogino S, Wilson RB. Spinal muscular atrophy: molecular genetics and diagnostics. PubMed PMID: 14711346Expert Rev Mol Diagn. 2004;41:15–29. [DOI] [PubMed] [Google Scholar]
- [10].Finkel RS, Mercuri E, Darras BT, et al. Nusinersen versus Sham Control in Infantile-Onset Spinal Muscular Atrophy. N Engl J Med. 2017;377(18):1723–1732. Epub 2017/11/02 PubMed PMID: 29091570. [DOI] [PubMed] [Google Scholar]
- [11].Mercuri E, Finkel RS, Muntoni F, et al. Diagnosis and management of spinal muscular atrophy: part 1: recommendations for diagnosis, rehabilitation, orthopedic and nutritional care. Neuromuscul Disord. 2018;28(2):103–115. Epub 2017/11/23 PubMed PMID: 29290580. [DOI] [PubMed] [Google Scholar]
- [12].Finkel RS, Mercuri E, Meyer OH, et al. Diagnosis and management of spinal muscular atrophy: part 2: pulmonary and acute care; medications, supplements and immunizations; other organ systems; and ethics. Neuromuscul Disord. 2018;28(3):197–207. Epub 2017/11/23 PubMed PMID: 29305137. [DOI] [PubMed] [Google Scholar]
- [13].Mendell JR, Al-Zaidy S, Shell R, et al. Single-Dose Gene-Replacement Therapy for Spinal Muscular Atrophy. N Engl J Med. 2017;377(18):1713–1722. PubMed PMID: 29091557. [DOI] [PubMed] [Google Scholar]
- [14].Buchlis G, Podsakoff GM, Radu A, et al. Factor IX expression in skeletal muscle of a severe hemophilia B patient 10 years after AAV-mediated gene transfer. Blood. 2012;119(13):3038–3041. Epub 2012/01/23 PubMed PMID: 22271447; PubMed Central PMCID: PMCPMC3321866. [DOI] [PMC free article] [PubMed] [Google Scholar]
- [15].Mendell JR, Al-Zaidy S, Shell R, et al. AVXS-101 Phase 1 gene replacement therapy clinical trial in SMA type 1: continued event-free survival and achievement of developmental milestones. 22nd Annual SMA Researcher Meeting; June14-16, 2018; Dallas, TX2018. [Google Scholar]
- [16].Shell R, Kotha K, Al-Zaidy S. AVXS-101 Phase 1 gene replacement therapy clinical trial in SMA type 1: continued independence from nutritional and ventilatory support in patients dosed early in disease progression after 24 months post-dosing. American Academy of Neurology Annual Meeting; Los Angeles, CA2018. [Google Scholar]
- [17].Avexis The first SMA Gene Therapy in Human Trials 2018 [cited August8, 2018]. Available from: https://www.avexis.com/research-and-development.
- [18].Zuluaga-Sanchez S, Knight C, Thompson R, et al. Adequately reflecting the clinical benefits in rare disease economic modelling using SMA type 1 (Infantile Onset) as a case study. ISPOR 20th Annual European Congress; 4-8November2017; Glasgow, Scotland. [Google Scholar]
- [19].Landfeldt E, Alfredsson L, Straub V, et al. Economic evaluation in duchenne muscular dystrophy: model frameworks for cost-effectiveness analysis. PubMed PMID: 27798808; PubMed Central PMCID: PMCPMC5253157Pharmacoeconomics. 2017;352:249–258. [DOI] [PMC free article] [PubMed] [Google Scholar]
- [20].Lloyd AJ, Gallop K, Thompson R, et al. Estimation of the health-related quality of life benefits of treatment for Spinal Muscular Atrophy (SMA). ISPOR 20TH Annual European Congress4–8November2017; Glasgow, Scotland. [Google Scholar]
- [21].Thompson R, Vaidya S, Teynor M. The utility of different approaches to developing health utilities data in childhood rare diseases – A case study in spinal muscular atrophy (SMA). ISPOR 20TH Annual European Congress4–8November2017; Glasgow, Scotland. [Google Scholar]
- [22].Othus M, Bansal A, Koepl L, et al. Accounting for Cured Patients in Cost-Effectiveness Analysis. Value Health. 2017;20(4):705–709. Epub 2016/ 06/09 PubMed PMID: 28408015. [DOI] [PubMed] [Google Scholar]
- [23].Crowther MJ, Lambert PC. Parametric multistate survival models: flexible modelling allowing transition-specific distributions with application to estimating clinically useful measures of effect differences. Stat Med. 2017;36(29):4719–4742. Epub 2017/ 09/05 PubMed PMID: 28872690. [DOI] [PubMed] [Google Scholar]
- [24].Zerres K, Rudnik-Schöneborn S, Forrest E, et al. A collaborative study on the natural history of childhood and juvenile onset proximal spinal muscular atrophy (type II and III SMA): 569 patients. J Neurol Sci. 1997;146(1): 67–72. PubMed PMID: 9077498. [DOI] [PubMed] [Google Scholar]
- [25].Kolb SJ, Coffey CS, Yankey JW, et al. Natural history of infantile-onset spinal muscular atrophy. Ann Neurol. 2017;82(6):883–891. Epub 2017/12/08 PubMed PMID: 29149772; PubMed Central PMCID: PMCPMC5776712. [DOI] [PMC free article] [PubMed] [Google Scholar]
- [26].Diaby V, Adunlin G, Montero AJ. Survival modeling for the estimation of transition probabilities in model-based economic evaluations in the absence of individual patient data: a tutorial. PubMed PMID: 24338265Pharmacoeconomics. 2014;322:101–108. [DOI] [PubMed] [Google Scholar]
- [27].Hoyle MW, Henley W. Improved curve fits to summary survival data: application to economic evaluation of health technologies. BMC Med Res Methodol Epub 2011/ 10/10 2011;11:139 PubMed PMID: 21985358; PubMed Central PMCID: PMCPMC3198983. [DOI] [PMC free article] [PubMed] [Google Scholar]
- [28].Tierney JF, Stewart LA, Ghersi D, et al. Practical methods for incorporating summary time-to-event data into meta-analysis. Trials Epub 2007/06/07 PubMed PMID: 17555582; PubMed Central PMCID: PMCPMC1920534 2007;8:16. . [DOI] [PMC free article] [PubMed] [Google Scholar]
- [29].Jackson C. flexsurv: A Platform for Parametric Survival Modeling in R. J Statist Software. 2016;70(8):1–33. [DOI] [PMC free article] [PubMed] [Google Scholar]
- [30].Briggs AH, Claxton K, Sculpher MJ. Decision modelling for health economic evaluation. Oxford: Oxford University Press; 2006. [Google Scholar]
- [31].Glanzman AM, McDermott MP, Montes J, et al. Validation of the Children‘s Hospital of Philadelphia Infant Test of Neuromuscular Disorders (CHOP INTEND). Pediatr Phys Ther. 2011;23(4):322–326. PubMed PMID: 22090068. [DOI] [PubMed] [Google Scholar]
- [32].Shieh PB, Gu T, Chen E, et al. Treatment patterns and cost of care among patients with Spinal Muscular Atrophy. Cure SMA Annual Meeting; June 29-July 1, 2017; Orlando, FL2017. [Google Scholar]
- [33].Biogen A guide to Spinraza reimbursement: important information to help navigate the access and reimbursement process. 2016. Available from: https://www.spinraza-hcp.com/content/dam/commercial/specialty/spinraza/hcp/en_us/pdf/SPZ-US-0134_Reimbursement-Guide.pdf. [Google Scholar]
- [34].Garrison LP, Jackson T, Paul D, et al. Value-Based Pricing for Emerging Gene Therapies: the Economic Case for a Higher Cost-Effectiveness Threshold. J Manag Care Spec Pharm. 2019:1-7. doi: 10.18553/jmcp.2019.18378. [DOI] [PMC free article] [PubMed] [Google Scholar]
- [35].Postma MJ, Parouty M, Westra TA. Accumulating evidence for the case of differential discounting. PubMed PMID: 23272787Expert Rev Clin Pharmacol. 2013;61:1–3. [DOI] [PubMed] [Google Scholar]
- [36].Dreitlin B, Towse A, Watkins JB, et al. Developing and paying for gene therapies - can we resolve the conflicts?. Value Outcomes Spotlight. 2018Jan/Feb;31–34. [Google Scholar]
- [37].Hampson G, Towse A, Pearson SD, et al. Gene therapy: evidence, value and affordability in the US health care system. J Comp Eff Res. 2018;7(1):15–28. [DOI] [PubMed] [Google Scholar]
- [38].Ralston S, Floyd D, Ratcliffe M. Differential discounting: capturing the value of living longer and better. Value Health. 2013;16(7):A467. [Google Scholar]
- [39].Lopez-Bastida J, Pena-Longobardo LM, Aranda-Reneo I, et al. Social/economic costs and health-related quality of life in patients with spinal muscular atrophy (SMA) in Spain. Orphanet J Rare Dis. 2017;12(1):141 Epub 2017/08/20 PubMed PMID: 28821278; PubMed Central PMCID: PMCPMC5563035. [DOI] [PMC free article] [PubMed] [Google Scholar]
- [40].New SPINRAZA® (nusinersen) data presented at annual congress of the world muscle society demonstrate benefits in treating presymptomatic infants with spinal muscular atrophy. Available from: http://investors.biogen.com/news-releases/news-release-details/new-spinrazar-nusinersen-data-presented-annual-congress-world.
- [41].FDA CENTER FOR DRUG EVALUATION AND RESEARCH APPLICATION NUMBER:209531Orig1s000 MEDICAL REVIEW(S). [cited 2019 March25]. Available from: https://www.accessdata.fda.gov/drugsatfda_docs/nda/2016/209531orig1s000medr.pdf
- [42].Darras B, Royden Jones H, Ryan M, et al. Neuromuscular Disorders of Infancy, Childhood and Adolescence: A clinician‘s approach. 2nd ed. London, UK: Elsevier; 2015. [Google Scholar]
- [43].Fang P, Li L, Zeng J, et al. Molecular characterization and copy number of SMN1, SMN2 and NAIP in Chinese patients with spinal muscular atrophy and unrelated healthy controls. BMC Musculoskelet Disord. 2015;16:11 Epub 2015/02/07 PubMed PMID: 25888055; PubMed Central PMCID: PMCPMC4328246. [DOI] [PMC free article] [PubMed] [Google Scholar]
- [44].Kuester MK, Jackson EA, Runyan BM, et al. The Effect of a Pediatric Rare Disease on Subscriber Retention Rates for Commercial Health Insurers in the USA. J Manag Care Spec Pharm. 2019;25(2):186–195. Epub 2018/ 09/27 PubMed PMID: 30256693. [DOI] [PMC free article] [PubMed] [Google Scholar]
- [45].Usdin S. Biocentury. Focusing on Cures. Available from: https://www.biocentury.com/printpdf/300659.
- [46].Gregoretti C, Ottonello G, Chiarini Testa MB, et al. Survival of patients with spinal muscular atrophy type 1. Pediatrics. 2013;131(5):e1509–14. Epub 2013/04/24. doi: . PubMed PMID: 23610208. [DOI] [PubMed] [Google Scholar]
- [47].Khan KA, Petrou S, Rivero-Arias O, et al. Mapping EQ-5D utility scores from the PedsQL generic core scales. Pharmacoeconomics. 2014;32(7):693–706. Epub 2014/04/10 PubMed PMID: 24715604. [DOI] [PubMed] [Google Scholar]
- [48].Graham RJ, Athiraman U, Laubach AE, et al. Anesthesia and perioperative medical management of children with spinal muscular atrophy. Paediatr Anaesth. 2009;19(11):1054–1063. Epub 2009/06/25 PubMed PMID: 19558636. [DOI] [PubMed] [Google Scholar]
- [49].Cardenas J, Menier M, Heitzer MD, et al. High Healthcare Resource Use in Hospitalized Patients with a Diagnosis of Spinal Muscular Atrophy Type 1 (SMA1): retrospective Analysis of the Kids‘ Inpatient Database (KID). Pharmacoecon Open. 2018. Epub 2018/ 09/06 DOI: 10.1007/s41669-018-0093-0 PubMed PMID: 30182345. [DOI] [PMC free article] [PubMed] [Google Scholar]